UNITED STATES
SECURITIES AND EXCHANGE COMMISSION
Washington, D.C. 20549
FormN-CSR
CERTIFIED SHAREHOLDER REPORT OF REGISTERED
MANAGEMENT INVESTMENT COMPANIES
Investment Company Act File Number:811-04409
Eaton Vance Municipals Trust
(Exact Name of Registrant as Specified in Charter)
Two International Place, Boston, Massachusetts 02110
(Address of Principal Executive Offices)
Maureen A. Gemma
Two International Place, Boston, Massachusetts 02110
(Name and Address of Agent for Services)
(617)482-8260
(Registrant’s Telephone Number)
July 31
Date of Fiscal Year End
July 31, 2019
Date of Reporting Period
Item 1. Reports to Stockholders

Eaton Vance
Municipals Trust
Annual Report
July 31, 2019
Arizona • Connecticut • Minnesota • New Jersey • Pennsylvania
Important Note. Beginning on January 1, 2021, as permitted by regulations adopted by the Securities and Exchange Commission, paper copies of each Fund’s annual and semi-annual shareholder reports will no longer be sent by mail unless you specifically request paper copies of the reports. Instead, the reports will be made available on the Funds’ website (eatonvance.com/funddocuments), and you will be notified by mail each time a report is posted and provided with a website address to access the report.
If you already elected to receive shareholder reports electronically, you will not be affected by this change and you need not take any action. If you are a direct investor, you may elect to receive shareholder reports and other communications from the Funds electronically by signing up for e-Delivery at eatonvance.com/edelivery. If you own your shares through a financial intermediary (such as a broker-dealer or bank), you must contact your financial intermediary to sign up.
You may elect to receive all future Fund shareholder reports in paper free of charge. If you are a direct investor, you can inform the Funds that you wish to continue receiving paper copies of your shareholder reports by calling 1-800-262-1122. If you own these shares through a financial intermediary, you must contact your financial intermediary or follow instructions included with this disclosure, if applicable, to elect to continue to receive paper copies of your shareholder reports. Your election to receive reports in paper will apply to all Eaton Vance funds held directly or to all funds held through your financial intermediary, as applicable.

Commodity Futures Trading Commission Registration. Effective December 31, 2012, the Commodity Futures Trading Commission (“CFTC”) adopted certain regulatory changes that subject registered investment companies and advisers to regulation by the CFTC if a fund invests more than a prescribed level of its assets in certain CFTC-regulated instruments (including futures, certain options and swap agreements) or markets itself as providing investment exposure to such instruments. Each Fund has claimed an exclusion from the definition of the term “commodity pool operator” under the Commodity Exchange Act. Accordingly, neither the Funds nor the adviser with respect to the operation of the Funds is subject to CFTC regulation. Because of its management of other strategies, each Fund’s adviser is registered with the CFTC as a commodity pool operator and a commodity trading advisor.
Fund shares are not insured by the FDIC and are not deposits or other obligations of, or guaranteed by, any depository institution. Shares are subject to investment risks, including possible loss of principal invested.
This report must be preceded or accompanied by a current summary prospectus or prospectus. Before investing, investors should consider carefully the investment objective, risks, and charges and expenses of a mutual fund. This and other important information is contained in the summary prospectus and prospectus, which can be obtained from a financial intermediary. Prospective investors should read the prospectus carefully before investing. For further information, please call1-800-262-1122.
Annual ReportJuly 31, 2019
Eaton Vance
Municipal Income Funds
Table of Contents
| | | | |
Management’s Discussion of Fund Performance | | | 2 | |
| |
Performance and Fund Profile | | | | |
| |
| | | | |
Arizona Municipal Income Fund | | | 4 | |
Connecticut Municipal Income Fund | | | 6 | |
Minnesota Municipal Income Fund | | | 8 | |
New Jersey Municipal Income Fund | | | 10 | |
Pennsylvania Municipal Income Fund | | | 12 | |
| |
| | | | |
| |
Endnotes and Additional Disclosures | | | 14 | |
| |
Fund Expenses | | | 15 | |
| |
Financial Statements | | | 18 | |
| |
Report of Independent Registered Public Accounting Firm | | | 70 | |
| |
Federal Tax Information | | | 71 | |
| |
Board of Trustees’ Contract Approval | | | 72 | |
| |
Management and Organization | | | 76 | |
| |
Important Notices | | | 79 | |
Eaton Vance
Municipal Income Funds
July 31, 2019
Management’s Discussion of Fund Performance1
Economic and Market Conditions
The12-month period that began on August 1, 2018 witnessed a dramatic turnaround in fixed income markets. The rising-rate environment at the beginning of the period gave way to a falling-rate environment that began in December 2018 and accelerated as the fiscal year wore on — culminating with the U.S. Federal Reserve Board (the Fed) announcing its first rate cut in 11 years on July 31, 2019, the final day of the period.
Viewed as a whole, the period was marked by strong performance in the municipal bond market, with the Bloomberg Barclays Municipal Bond Index (the Index),2 a broad measure of the asset class, returning 7.31%. The municipal bond yield curve9 experienced aso-called “bull market flattening” with rates declining across the curve but more so toward the long end of the curve. As investors searched for yield in an ongoinglow-rate environment, lower-rated7 bonds in general outperformed higher-rated bonds, and longer-duration10 issues outperformed shorter-duration issues.
As the fiscal year began in August 2018, the market was still in a rising-rate environment, driven by optimism about U.S. economic growth, increasing inflation and wage growth, and a potential detente between the U.S. and North Korea. In September, the Fed hiked rates for the third time in 2018, and Treasury and municipal rates rose across the curve.
But as 2018 came to a close, investors became increasingly concerned about a trade war with China, a looming government shutdown, and dovish comments by the Fed that led investors to fear weakness in the U.S. economy. In response, the futures market began to project the possibility of no further rate hikes in 2019 — a significant reversal of investor expectations just a few months earlier. The result was a “flight to quality” by bond investors, pushing longer-term bond prices up and rates down in the final month of 2018.
The first two months of the new year were a relatively quiet period for bonds. But downward pressure on rates and upward pressure on prices resumed in March and continued though the end of the period — propelled by lower-than-desired inflation, Brexit concerns, low European interest rates, and anon-again,off-again U.S.-China trade war that fueled concerns about global growth. In response, the Fed began to telegraph the potential for the rate cut that actually occurred atperiod-end.
In the municipals market, technical factors amplified the price rally. Tax law changes passed in 2017 resulted in a combination of lower supply of new municipals and increased demand from high-income investors inhigh-tax states — who had seen their tax bills rise under the new law. As a result, municipals in general outperformed Treasurys for the period as a whole.
Fund Performance
For the fiscal year ended July 31, 2019, the New Jersey Fund’s Class A shares at net asset value (NAV) outperformed the 7.31% return of the Funds’ primary benchmark, the Index, while the Arizona, Connecticut, Minnesota and Pennsylvania Funds’ Class A shares at NAV underperformed the Index.
Generally speaking, the Funds’ overall strategy is to invest primarily in municipal bonds with maturities of 10 years or more, in order to capture their historically higher yields and greater income streams than shorter-maturity municipal issues.
State-specific Results
Eaton Vance Arizona Municipal Income Fund Class A shares at NAV returned 6.12%, underperforming the 7.31% return of the Index. Detractors from performance versus the Index included an underweight, relative to the Index, inzero-coupon bonds, which were the best-performing coupon structure in the Index during the period; security selection inBBB-rated bonds; and the Fund’s hedging strategy. By using Treasury futures, management hedges to various degrees against the greater potential risk of volatility caused by investing in bonds at the long end of the yield curve. As a risk management tactic within the Fund’s overall strategy, interest rate hedging is intended to moderate performance on both the upside and the downside of the market. So in a period when municipal and Treasury bonds generally rose in price, the Fund’s Treasury futures hedge mitigated a portion of that increase, and was thus a detractor from relative performance versus the unhedged Index.
In contrast, contributors to performance versus the Index included security selection in the industrial development revenue sector; an overweight in bonds with12-22 years remaining to maturity, during a period when longer-maturity issues outperformed shorter-maturity issues; and security selection in the water and sewer sector.
See Endnotes and Additional Disclosures in this report.
Past performance is no guarantee of future results. Returns are historical and are calculated by determining the percentage change in net asset value (NAV) or offering price (as applicable) with all distributions reinvested. Investment return and principal value will fluctuate so that shares, when redeemed, may be worth more or less than their original cost. Performance less than or equal to one year is cumulative. Performance is for the stated time period only; due to market volatility, the Fund’s current performance may be lower or higher than quoted. Returns are before taxes unless otherwise noted. For performance as of the most recentmonth-end, please refer to eatonvance.com.
Eaton Vance
Municipal Income Funds
July 31, 2019
Management’s Discussion of Fund Performance — continued
Eaton Vance Connecticut Municipal Income Fund Class A shares at NAV returned 5.78%, underperforming the 7.31% return of the Index. Detractors from performance versus the Index included an overweight in prerefunded, or escrowed, bonds; an underweight inzero-coupon bonds; and security selection in state and local general obligation bonds. Key contributors to performance versus the Index included an overweight in the health care sector, an overweight in 4.00% coupon bonds, and security selection in the education sector.
Eaton Vance Minnesota Municipal Income Fund Class A shares at NAV returned 6.42%, underperforming the 7.31% return of the Index. Security selection in the health care sector, an underweight in bonds with 17 or more years remaining to maturity, and security selection in 4.00% coupon bonds all detracted from Fund performance relative to the Index. Contributors to results versus the Index included an overweight inzero-coupon bonds, security selection in the education sector, and security selection inAAA-rated bonds.
Eaton Vance New Jersey Municipal Income Fund Class A shares at NAV returned 7.69%, outperforming the 7.31% return of the Index. Contributors to performance versus the Index included an overweight in the health care sector, an overweight inzero-coupon bonds, and security selection in 4.00% coupon bonds. In contrast, an overweight in prerefunded bonds, security selection in the electric utilities sector, and security selection inzero-coupon bonds all detracted from results versus the Index.
Eaton Vance Pennsylvania Municipal Income Fund Class A shares at NAV returned 5.58%, underperforming the 7.31% return of the Index. An overweight in prerefunded bonds, an underweight in bonds with 22 or more years remaining to maturity, and security selection in the health care sector all detracted from Fund performance versus the Index. In contrast, contributors to Fund performance relative to the Index included an overweight inzero-coupon bonds; security selection and an overweight in the leasing sector, which was the best-performing sector in the Index during the period; and an underweight inAAA-rated bonds.
See Endnotes and Additional Disclosures in this report.
Past performance is no guarantee of future results. Returns are historical and are calculated by determining the percentage change in net asset value (NAV) or offering price (as applicable) with all distributions reinvested. Investment return and principal value will fluctuate so that shares, when redeemed, may be worth more or less than their original cost. Performance less than or equal to one year is cumulative. Performance is for the stated time period only; due to market volatility, the Fund’s current performance may be lower or higher than quoted. Returns are before taxes unless otherwise noted. For performance as of the most recentmonth-end, please refer to eatonvance.com.
Eaton Vance
Arizona Municipal Income Fund
July 31, 2019
Performance2,3
Portfolio Manager Craig R. Brandon, CFA
| | | | | | | | | | | | | | | | | | | | |
| % Average Annual Total Returns | | Class
Inception Date | | | Performance
Inception Date | | | One Year | | | Five Years | | | Ten Years | |
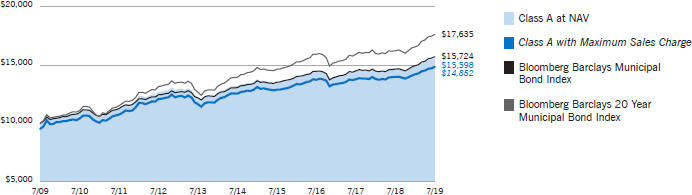
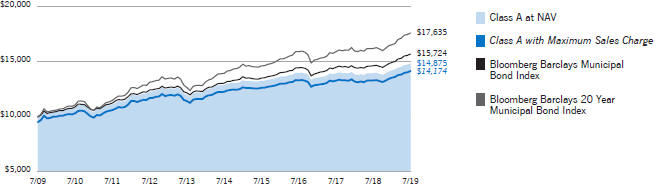
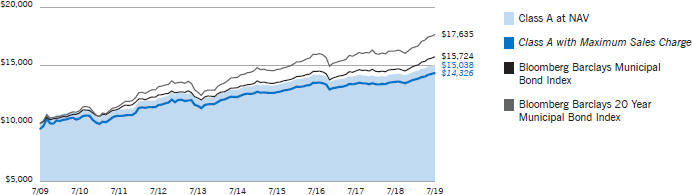
Class A at NAV | | | 12/13/1993 | | | | 07/25/1991 | | | | 6.12 | % | | | 3.42 | % | | | 4.54 | % |
Class A with 4.75% Maximum Sales Charge | | | — | | | | — | | | | 1.09 | | | | 2.43 | | | | 4.03 | |
Class C at NAV | | | 12/16/2005 | | | | 07/25/1991 | | | | 5.28 | | | | 2.65 | | | | 3.76 | |
Class C with 1% Maximum Sales Charge | | | — | | | | — | | | | 4.28 | | | | 2.65 | | | | 3.76 | |
Class I at NAV | | | 08/03/2010 | | | | 07/25/1991 | | | | 6.33 | | | | 3.65 | | | | 4.74 | |
Bloomberg Barclays Municipal Bond Index | | | — | | | | — | | | | 7.31 | % | | | 3.77 | % | | | 4.63 | % |
Bloomberg Barclays 20 Year Municipal Bond Index | | | — | | | | — | | | | 8.67 | | | | 4.78 | | | | 5.83 | |
| | | | | |
| | | | | | | | | | | | | | | | | | | | |
| % Total Annual Operating Expense Ratios4 | | | | | | | | Class A | | | Class C | | | Class I | |
| | | | | | | | | | | 0.71 | % | | | 1.46 | % | | | 0.51 | % |
| | | | | |
| | | | | | | | | | | | | | | | | | | | |
| % Distribution Rates/Yields5 | | | | | | | | Class A | | | Class C | | | Class I | |
Distribution Rate | | | | | | | | | | | 2.55 | % | | | 1.78 | % | | | 2.75 | % |
Taxable-Equivalent Distribution Rate | | | | | | | | | | | 4.67 | | | | 3.26 | | | | 5.03 | |
SEC30-day Yield | | | | | | | | | | | 1.31 | | | | 0.63 | | | | 1.58 | |
Taxable-Equivalent SEC30-day Yield | | | | | | | | | | | 2.32 | | | | 1.12 | | | | 2.79 | |
Growth of $10,000
This graph shows the change in value of a hypothetical investment of $10,000 in Class A of the Fund for the period indicated. For comparison, the same investment is shown in the indicated index.
| | | | | | | | | | | | | | | | |
| Growth of Investment3 | | Amount Invested | | | Period Beginning | | | At NAV | | | With Maximum Sales Charge | |
Class C | | $ | 10,000 | | | | 07/31/2009 | | | $ | 14,465 | | | | N.A. | |
Class I | | $ | 250,000 | | | | 07/31/2009 | | | $ | 397,198 | | | | N.A. | |
See Endnotes and Additional Disclosures in this report.
Past performance is no guarantee of future results. Returns are historical and are calculated by determining the percentage change in net asset value (NAV) or offering price (as applicable) with all distributions reinvested. Investment return and principal value will fluctuate so that shares, when redeemed, may be worth more or less than their original cost. Performance less than or equal to one year is cumulative. Performance is for the stated time period only; due to market volatility, the Fund’s current performance may be lower or higher than quoted. Returns are before taxes unless otherwise noted. For performance as of the most recentmonth-end, please refer to eatonvance.com.
Eaton Vance
Arizona Municipal Income Fund
July 31, 2019
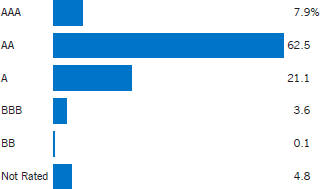
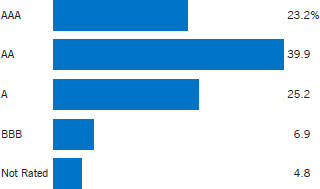
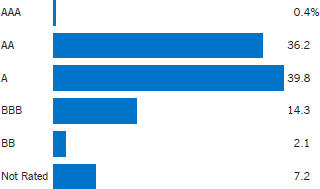
Fund Profile
Credit Quality (% of total investments)7
See Endnotes and Additional Disclosures in this report.
Eaton Vance
Connecticut Municipal Income Fund
July 31, 2019
Performance2,3
Portfolio ManagerCynthia J. Clemson
| | | | | | | | | | | | | | | | | | | | |
| % Average Annual Total Returns | | Class
Inception Date | | | Performance
Inception Date | | | One Year | | | Five Years | | | Ten Years | |
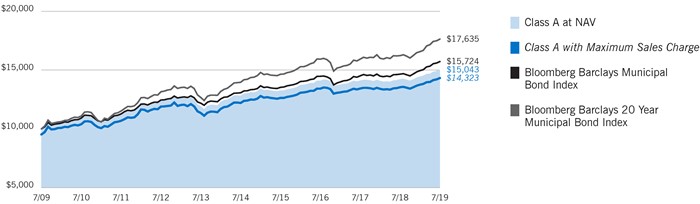
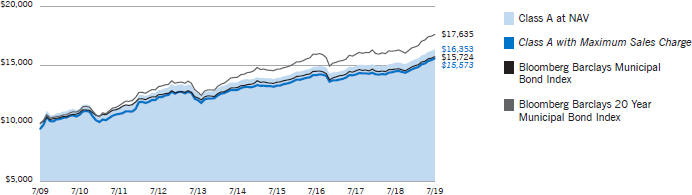
Class A at NAV | | | 04/19/1994 | | | | 05/01/1992 | | | | 5.78 | % | | | 3.26 | % | | | 4.17 | % |
Class A with 4.75% Maximum Sales Charge | | | — | | | | — | | | | 0.73 | | | | 2.26 | | | | 3.66 | |
Class C at NAV | | | 02/09/2006 | | | | 05/01/1992 | | | | 5.01 | | | | 2.49 | | | | 3.39 | |
Class C with 1% Maximum Sales Charge | | | — | | | | — | | | | 4.01 | | | | 2.49 | | | | 3.39 | |
Class I at NAV | | | 03/03/2008 | | | | 05/01/1992 | | | | 6.00 | | | | 3.46 | | | | 4.37 | |
Bloomberg Barclays Municipal Bond Index | | | — | | | | — | | | | 7.31 | % | | | 3.77 | % | | | 4.63 | % |
Bloomberg Barclays 20 Year Municipal Bond Index | | | — | | | | — | | | | 8.67 | | | | 4.78 | | | | 5.83 | |
| | | | | |
| | | | | | | | | | | | | | | | | | | | |
| % Total Annual Operating Expense Ratios4 | | | | | | | | Class A | | | Class C | | | Class I | |
| | | | | | | | | | | 0.73 | % | | | 1.48 | % | | | 0.53 | % |
| | | | | |
| | | | | | | | | | | | | | | | | | | | |
| % Distribution Rates/Yields5 | | | | | | | | Class A | | | Class C | | | Class I | |
Distribution Rate | | | | | | | | | | | 2.81 | % | | | 2.04 | % | | | 3.01 | % |
Taxable-Equivalent Distribution Rate | | | | | | | | | | | 5.38 | | | | 3.91 | | | | 5.77 | |
SEC30-day Yield | | | | | | | | | | | 1.28 | | | | 0.60 | | | | 1.54 | |
Taxable-Equivalent SEC30-day Yield | | | | | | | | | | | 2.32 | | | | 1.08 | | | | 2.79 | |
Growth of $10,000
This graph shows the change in value of a hypothetical investment of $10,000 in Class A of the Fund for the period indicated. For comparison, the same investment is shown in the indicated index.
| | | | | | | | | | | | | | | | |
| Growth of Investment | | Amount Invested | | | Period Beginning | | | At NAV | | | With Maximum Sales Charge | |
Class C | | $ | 10,000 | | | | 07/31/2009 | | | $ | 13,964 | | | | N.A. | |
Class I | | $ | 250,000 | | | | 07/31/2009 | | | $ | 383,663 | | | | N.A. | |
See Endnotes and Additional Disclosures in this report.
Past performance is no guarantee of future results. Returns are historical and are calculated by determining the percentage change in net asset value (NAV) or offering price (as applicable) with all distributions reinvested. Investment return and principal value will fluctuate so that shares, when redeemed, may be worth more or less than their original cost. Performance less than or equal to one year is cumulative. Performance is for the stated time period only; due to market volatility, the Fund’s current performance may be lower or higher than quoted. Returns are before taxes unless otherwise noted. For performance as of the most recentmonth-end, please refer to eatonvance.com.
Eaton Vance
Connecticut Municipal Income Fund
July 31, 2019
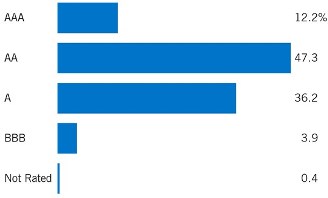
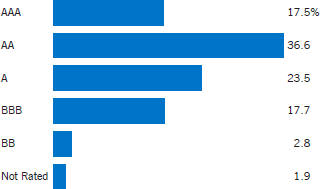
Fund Profile
Credit Quality (% of total investments)7
See Endnotes and Additional Disclosures in this report.
Eaton Vance
Minnesota Municipal Income Fund
July 31, 2019
Performance2,3
Portfolio ManagerCraig R. Brandon, CFA
| | | | | | | | | | | | | | | | | | | | |
| % Average Annual Total Returns | | Class
Inception Date | | | Performance
Inception Date | | | One Year | | | Five Years | | | Ten Years | |
Class A at NAV | | | 12/09/1993 | | | | 07/29/1991 | | | | 6.42 | % | | | 2.90 | % | | | 4.05 | % |
Class A with 4.75% Maximum Sales Charge | | | — | | | | — | | | | 1.38 | | | | 1.90 | | | | 3.55 | |
Class C at NAV | | | 12/21/2005 | | | | 07/29/1991 | | | | 5.56 | | | | 2.13 | | | | 3.27 | |
Class C with 1% Maximum Sales Charge | | | — | | | | — | | | | 4.56 | | | | 2.13 | | | | 3.27 | |
Class I at NAV | | | 08/03/2010 | | | | 07/29/1991 | | | | 6.64 | | | | 3.11 | | | | 4.23 | |
Bloomberg Barclays Municipal Bond Index | | | — | | | | — | | | | 7.31 | % | | | 3.77 | % | | | 4.63 | % |
Bloomberg Barclays 20 Year Municipal Bond Index | | | — | | | | — | | | | 8.67 | | | | 4.78 | | | | 5.83 | |
| | | | | |
| | | | | | | | | | | | | | | | | | | | |
| % Total Annual Operating Expense Ratios4 | | | | | | | | Class A | | | Class C | | | Class I | |
| | | | | | | | | | | 0.69 | % | | | 1.44 | % | | | 0.49 | % |
| | | | | |
| | | | | | | | | | | | | | | | | | | | |
| % Distribution Rates/Yields5 | | | | | | | | Class A | | | Class C | | | Class I | |
Distribution Rate | | | | | | | | | | | 2.12 | % | | | 1.36 | % | | | 2.33 | % |
Taxable-Equivalent Distribution Rate | | | | | | | | | | | 4.30 | | | | 2.76 | | | | 4.72 | |
SEC30-day Yield | | | | | | | | | | | 1.12 | | | | 0.44 | | | | 1.38 | |
Taxable-Equivalent SEC30-day Yield | | | | | | | | | | | 2.10 | | | | 0.83 | | | | 2.58 | |
Growth of $10,000
This graph shows the change in value of a hypothetical investment of $10,000 in Class A of the Fund for the period indicated. For comparison, the same investment is shown in the indicated index.
| | | | | | | | | | | | | | | | |
| Growth of Investment3 | | Amount Invested | | | Period Beginning | | | At NAV | | | With Maximum Sales Charge | |
Class C | | $ | 10,000 | | | | 07/31/2009 | | | $ | 13,801 | | | | N.A. | |
Class I | | $ | 250,000 | | | | 07/31/2009 | | | $ | 378,478 | | | | N.A. | |
See Endnotes and Additional Disclosures in this report.
Past performance is no guarantee of future results. Returns are historical and are calculated by determining the percentage change in net asset value (NAV) or offering price (as applicable) with all distributions reinvested. Investment return and principal value will fluctuate so that shares, when redeemed, may be worth more or less than their original cost. Performance less than or equal to one year is cumulative. Performance is for the stated time period only; due to market volatility, the Fund’s current performance may be lower or higher than quoted. Returns are before taxes unless otherwise noted. For performance as of the most recentmonth-end, please refer to eatonvance.com.
Eaton Vance
Minnesota Municipal Income Fund
July 31, 2019
Fund Profile
Credit Quality (% of total investments)7
See Endnotes and Additional Disclosures in this report.
Eaton Vance
New Jersey Municipal Income Fund
July 31, 2019
Performance2,3
Portfolio ManagerAdam A. Weigold, CFA
| | | | | | | | | | | | | | | | | | | | |
| % Average Annual Total Returns | | Class
Inception Date | | | Performance
Inception Date | | | One Year | | | Five Years | | | Ten Years | |
Class A at NAV | | | 04/13/1994 | | | | 01/08/1991 | | | | 7.69 | % | | | 3.89 | % | | | 5.04 | % |
Class A with 4.75% Maximum Sales Charge | | | — | | | | — | | | | 2.61 | | | | 2.89 | | | | 4.53 | |
Class C at NAV | | | 12/14/2005 | | | | 01/08/1991 | | | | 6.92 | | | | 3.12 | | | | 4.25 | |
Class C with 1% Maximum Sales Charge | | | — | | | | — | | | | 5.92 | | | | 3.12 | | | | 4.25 | |
Class I at NAV | | | 03/03/2008 | | | | 01/08/1991 | | | | 7.91 | | | | 4.09 | | | | 5.25 | |
Bloomberg Barclays Municipal Bond Index | | | — | | | | — | | | | 7.31 | % | | | 3.77 | % | | | 4.63 | % |
Bloomberg Barclays 20 Year Municipal Bond Index | | | — | | | | — | | | | 8.67 | | | | 4.78 | | | | 5.83 | |
| | | | | |
| | | | | | | | | | | | | | | | | | | | |
| % Total Annual Operating Expense Ratios4 | | | | | | | | Class A | | | Class C | | | Class I | |
| | | | | | | | | | | 0.73 | % | | | 1.48 | % | | | 0.53 | % |
| | | | | |
| | | | | | | | | | | | | | | | | | | | |
| % Distribution Rates/Yields5 | | | | | | | | Class A | | | Class C | | | Class I | |
Distribution Rate | | | | | | | | | | | 2.73 | % | | | 1.96 | % | | | 2.93 | % |
Taxable-Equivalent Distribution Rate | | | | | | | | | | | 5.43 | | | | 3.90 | | | | 5.83 | |
SEC30-day Yield | | | | | | | | | | | 1.57 | | | | 0.90 | | | | 1.85 | |
Taxable-Equivalent SEC30-day Yield | | | | | | | | | | | 2.92 | | | | 1.67 | | | | 3.43 | |
Growth of $10,000
This graph shows the change in value of a hypothetical investment of $10,000 in Class A of the Fund for the period indicated. For comparison, the same investment is shown in the indicated index.
| | | | | | | | | | | | | | | | |
| Growth of Investment | | Amount Invested | | | Period Beginning | | | At NAV | | | With Maximum Sales Charge | |
Class C | | $ | 10,000 | | | | 07/31/2009 | | | $ | 15,170 | | | | N.A. | |
Class I | | $ | 250,000 | | | | 07/31/2009 | | | $ | 416,964 | | | | N.A. | |
See Endnotes and Additional Disclosures in this report.
Past performance is no guarantee of future results. Returns are historical and are calculated by determining the percentage change in net asset value (NAV) or offering price (as applicable) with all distributions reinvested. Investment return and principal value will fluctuate so that shares, when redeemed, may be worth more or less than their original cost. Performance less than or equal to one year is cumulative. Performance is for the stated time period only; due to market volatility, the Fund’s current performance may be lower or higher than quoted. Returns are before taxes unless otherwise noted. For performance as of the most recentmonth-end, please refer to eatonvance.com.
Eaton Vance
New Jersey Municipal Income Fund
July 31, 2019
Fund Profile
Credit Quality (% of total investments)7
See Endnotes and Additional Disclosures in this report.
Eaton Vance
Pennsylvania Municipal Income Fund
July 31, 2019
Performance2,3
Portfolio ManagerAdam A. Weigold, CFA
| | | | | | | | | | | | | | | | | | | | |
| % Average Annual Total Returns | | Class
Inception Date | | | Performance
Inception Date | | | One Year | | | Five Years | | | Ten Years | |
Class A at NAV | | | 06/01/1994 | | | | 01/08/1991 | | | | 5.58 | % | | | 3.14 | % | | | 4.16 | % |
Class A with 4.75% Maximum Sales Charge | | | — | | | | — | | | | 0.61 | | | | 2.14 | | | | 3.66 | |
Class C at NAV | | | 01/13/2006 | | | | 01/08/1991 | | | | 4.84 | | | | 2.38 | | | | 3.39 | |
Class C with 1% Maximum Sales Charge | | | — | | | | — | | | | 3.84 | | | | 2.38 | | | | 3.39 | |
Class I at NAV | | | 03/03/2008 | | | | 01/08/1991 | | | | 5.90 | | | | 3.35 | | | | 4.38 | |
Bloomberg Barclays Municipal Bond Index | | | — | | | | — | | | | 7.31 | % | | | 3.77 | % | | | 4.63 | % |
Bloomberg Barclays 20 Year Municipal Bond Index | | | — | | | | — | | | | 8.67 | | | | 4.78 | | | | 5.83 | |
| | | | | |
| | | | | | | | | | | | | | | | | | | | |
| % Total Annual Operating Expense Ratios4 | | | | | | | | Class A | | | Class C | | | Class I | |
| | | | | | | | | | | 0.80 | % | | | 1.55 | % | | | 0.60 | % |
| | | | | |
| | | | | | | | | | | | | | | | | | | | |
| % Distribution Rates/Yields5 | | | | | | | | Class A | | | Class C | | | Class I | |
Distribution Rate | | | | | | | | | | | 3.42 | % | | | 2.66 | % | | | 3.62 | % |
Taxable-Equivalent Distribution Rate | | | | | | | | | | | 6.09 | | | | 4.74 | | | | 6.45 | |
SEC30-day Yield | | | | | | | | | | | 1.35 | | | | 0.66 | | | | 1.61 | |
Taxable-Equivalent SEC30-day Yield | | | | | | | | | | | 2.35 | | | | 1.16 | | | | 2.81 | |
| | | | | |
| | | | | | | | | | | | | | | | | | | | |
| % Total Leverage6 | | | | | | | | | | | | | | | |
Residual Interest Bond (RIB) Financing | | | | | | | | | | | | | | | | | | | 2.62 | % |
Growth of $10,000
This graph shows the change in value of a hypothetical investment of $10,000 in Class A of the Fund for the period indicated. For comparison, the same investment is shown in the indicated index.
| | | | | | | | | | | | | | | | |
| Growth of Investment | | Amount Invested | | | Period Beginning | | | At NAV | | | With Maximum Sales Charge | |
Class C | | $ | 10,000 | | | | 07/31/2009 | | | $ | 13,958 | | | | N.A. | |
Class I | | $ | 250,000 | | | | 07/31/2009 | | | $ | 383,913 | | | | N.A. | |
See Endnotes and Additional Disclosures in this report.
Past performance is no guarantee of future results. Returns are historical and are calculated by determining the percentage change in net asset value (NAV) or offering price (as applicable) with all distributions reinvested. Investment return and principal value will fluctuate so that shares, when redeemed, may be worth more or less than their original cost. Performance less than or equal to one year is cumulative. Performance is for the stated time period only; due to market volatility, the Fund’s current performance may be lower or higher than quoted. Returns are before taxes unless otherwise noted. For performance as of the most recentmonth-end, please refer to eatonvance.com.
Eaton Vance
Pennsylvania Municipal Income Fund
July 31, 2019
Fund Profile
Credit Quality (% of total investments)7,8
See Endnotes and Additional Disclosures in this report.
Eaton Vance
Municipal Income Funds
July 31, 2019
Endnotes and Additional Disclosures
| 1 | The views expressed in this report are those of the portfolio manager(s) and are current only through the date stated at the top of this page. These views are subject to change at any time based upon market or other conditions, and Eaton Vance and the Fund(s) disclaim any responsibility to update such views. These views may not be relied upon as investment advice and, because investment decisions are based on many factors, may not be relied upon as an indication of trading intent on behalf of any Eaton Vance fund. This commentary may contain statements that are not historical facts, referred to as “forward looking statements.” The Fund’s actual future results may differ significantly from those stated in any forward looking statement, depending on factors such as changes in securities or financial markets or general economic conditions, the volume of sales and purchases of Fund shares, the continuation of investment advisory, administrative and service contracts, and other risks discussed from time to time in the Fund’s filings with the Securities and Exchange Commission. |
| 2 | Bloomberg Barclays Municipal Bond Index is an unmanaged index of municipal bonds traded in the U.S. Bloomberg Barclays 20 Year Municipal Bond Index is an unmanaged index of municipal bonds traded in the U.S. with maturities ranging from17-22 years. Unless otherwise stated, index returns do not reflect the effect of any applicable sales charges, commissions, expenses, taxes or leverage, as applicable. It is not possible to invest directly in an index. |
| 3 | Total Returns at NAV do not include applicable sales charges. If sales charges were deducted, the returns would be lower. Total Returns shown with maximum sales charge reflect the stated maximum sales charge. Unless otherwise stated, performance does not reflect the deduction of taxes on Fund distributions or redemptions of Fund shares. |
| | Performance prior to the inception date of a class may be linked to the performance of an older class of the Fund. This linked performance is adjusted for any applicable sales charge, but is not adjusted for class expense differences. If adjusted for such differences, the performance would be different. The performance of Class I for the Eaton Vance Arizona Municipal Income Fund and Eaton Vance Minnesota Municipal Income Fund is linked to Class A. Performance since inception for an index, if presented, is the performance since the Fund’s or oldest share class’ inception, as applicable. Performance presented in the Financial Highlights included in the financial statements is not linked. |
| 4 | Source: Fund prospectus. The expense ratios for the current reporting period can be found in the Financial Highlights section of this report. |
| 5 | The Distribution Rate is based on the Fund’s last regular distribution per share in the period (annualized) divided by the Fund’s NAV at the end of the period. The Fund’s distributions may be comprised of amounts characterized for federal income tax purposes astax-exempt income, qualified andnon-qualified ordinary dividends, capital gains and nondividend distributions, also known as return of capital. The Fund will determine the federal income tax character of distributions paid to a shareholder after the end of the calendar year. This is reported on the IRS form1099-DIV and provided to the shareholder shortly after eachyear-end. |
| | The Fund’s distributions are determined by the investment adviser based on its current assessment of the Fund’s long-term return potential. As portfolio and market conditions change, the rate of distributions paid by the Fund could change. Taxable-equivalent performance is based on the highest combined federal and state income tax rates, where applicable. Lower tax rates would result in lowertax-equivalent performance. Actual tax rates will vary depending on your income, exemptions and deductions. Rates do not include local taxes. The SEC Yield is a standardized measure based on the estimated yield to maturity of a fund’s investments over a30-day period and is based on the maximum offer price at the date specified. The SEC Yield is not based on the distributions made by the Fund, which may differ. |
| 6 | Fund employs RIB financing. The leverage created by RIB investments provides an opportunity for increased income but, at the same time, creates special risks (including the likelihood of greater volatility of NAV). The cost of leverage rises and falls with changes in short-term interest rates. See “Floating Rate Notes Issued in Conjunction with Securities Held” in the notes to the financial statements for more information about RIB financing. RIB leverage represents the amount of Floating Rate Notes outstanding at period end as a percentage of Fund net assets plus Floating Rate Notes. |
| 7 | Ratings are based on Moody’s Investors Service, Inc. (“Moody’s”), S&P Global Ratings (“S&P”) or Fitch Ratings (“Fitch”), as applicable. If securities are rated differently by the ratings agencies, the highest rating is applied. Ratings, which are subject to change, apply to the creditworthiness of the issuers of the underlying securities and not to the Fund or its shares. Credit ratings measure the quality of a bond based on the issuer’s creditworthiness, with ratings ranging from AAA, being the highest, to D, being the lowest based on S&P’s measures. Ratings of BBB or higher by S&P or Fitch (Baa or higher by Moody’s) are considered to be investment-grade quality. Credit ratings are based largely on the ratings agency’s analysis at the time of rating. The rating assigned to any particular security is not necessarily a reflection of the issuer’s current financial condition and does not necessarily reflect its assessment of the volatility of a security’s market value or of the liquidity of an investment in the security. Holdings designated as “Not Rated” (if any) are not rated by the national ratings agencies stated above. |
| 8 | The chart includes the municipal bonds held by a trust that issues residual interest bonds, consistent with the Portfolio of Investments. |
| 9 | Yield curve is a graphical representation of the yields offered by bonds of various maturities. The yield curve flattens when long-term rates fall and/or short-term rates increase, and the yield curve steepens when long-term rates increase and/or short-term rates fall. |
| 10 | Duration is a measure of the expected change in price of a bond — in percentage terms — given a one percent change in interest rates, all else being constant. Securities with lower durations tend to be less sensitive to interest rate changes. |
| | Fund profiles subject to change due to active management. |
Eaton Vance
Municipal Income Funds
July 31, 2019
Fund Expenses
Example: As a Fund shareholder, you incur two types of costs: (1) transaction costs, including sales charges (loads) on purchases and redemption fees (if applicable); and (2) ongoing costs, including management fees; distribution and/or service fees; and other Fund expenses. This Example is intended to help you understand your ongoing costs (in dollars) of Fund investing and to compare these costs with the ongoing costs of investing in other mutual funds. The Example is based on an investment of $1,000 invested at the beginning of the period and held for the entire period (February 1, 2019 – July 31, 2019).
Actual Expenses: The first section of each table below provides information about actual account values and actual expenses. You may use the information in this section, together with the amount you invested, to estimate the expenses that you paid over the period. Simply divide your account value by $1,000 (for example, an $8,600 account value divided by $1,000 = 8.6), then multiply the result by the number in the first section under the heading entitled “Expenses Paid During Period” to estimate the expenses you paid on your account during this period.
Hypothetical Example for Comparison Purposes: The second section of each table below provides information about hypothetical account values and hypothetical expenses based on the actual Fund expense ratio and an assumed rate of return of 5% per year (before expenses), which is not the actual Fund return. The hypothetical account values and expenses may not be used to estimate the actual ending account balance or expenses you paid for the period. You may use this information to compare the ongoing costs of investing in your Fund and other funds. To do so, compare this 5% hypothetical example with the 5% hypothetical examples that appear in the shareholder reports of the other funds.
Please note that the expenses shown in each table are meant to highlight your ongoing costs only and do not reflect any transactional costs, such as sales charges (loads) or redemption fees (if applicable). Therefore, the second section of each table is useful in comparing ongoing costs only, and will not help you determine the relative total costs of owning different funds. In addition, if these transactional costs were included, your costs would be higher.
Eaton Vance Arizona Municipal Income Fund
| | | | | | | | | | | | | | | | |
| | | Beginning
Account Value
(2/1/19) | | | Ending
Account Value
(7/31/19) | | | Expenses Paid
During Period*
(2/1/19 – 7/31/19) | | | Annualized
Expense
Ratio | |
|
Actual | |
Class A | | $ | 1,000.00 | | | $ | 1,045.40 | | | $ | 3.45 | | | | 0.68 | % |
Class C | | $ | 1,000.00 | | | $ | 1,042.20 | | | $ | 7.24 | | | | 1.43 | % |
Class I | | $ | 1,000.00 | | | $ | 1,046.40 | | | $ | 2.38 | | | | 0.47 | % |
| |
Hypothetical | |
(5% return per year before expenses) | |
Class A | | $ | 1,000.00 | | | $ | 1,021.40 | | | $ | 3.41 | | | | 0.68 | % |
Class C | | $ | 1,000.00 | | | $ | 1,017.70 | | | $ | 7.15 | | | | 1.43 | % |
Class I | | $ | 1,000.00 | | | $ | 1,022.50 | | | $ | 2.36 | | | | 0.47 | % |
| * | Expenses are equal to the Fund’s annualized expense ratio for the indicated Class, multiplied by the average account value over the period, multiplied by 181/365 (to reflect theone-half year period). The Example assumes that the $1,000 was invested at the net asset value per share determined at the close of business on January 31, 2019. |
Eaton Vance
Municipal Income Funds
July 31, 2019
Fund Expenses — continued
Eaton Vance Connecticut Municipal Income Fund
| | | | | | | | | | | | | | | | |
| | | Beginning
Account Value
(2/1/19) | | | Ending
Account Value
(7/31/19) | | | Expenses Paid
During Period*
(2/1/19 – 7/31/19) | | | Annualized
Expense
Ratio | |
|
Actual | |
Class A | | $ | 1,000.00 | | | $ | 1,041.00 | | | $ | 3.69 | | | | 0.73 | % |
Class C | | $ | 1,000.00 | | | $ | 1,037.30 | | | $ | 7.43 | | | | 1.47 | % |
Class I | | $ | 1,000.00 | | | $ | 1,042.10 | | | $ | 2.68 | | | | 0.53 | % |
| |
Hypothetical | |
(5% return per year before expenses) | |
Class A | | $ | 1,000.00 | | | $ | 1,021.20 | | | $ | 3.66 | | | | 0.73 | % |
Class C | | $ | 1,000.00 | | | $ | 1,017.50 | | | $ | 7.35 | | | | 1.47 | % |
Class I | | $ | 1,000.00 | | | $ | 1,022.20 | | | $ | 2.66 | | | | 0.53 | % |
| * | Expenses are equal to the Fund’s annualized expense ratio for the indicated Class, multiplied by the average account value over the period, multiplied by 181/365 (to reflect theone-half year period). The Example assumes that the $1,000 was invested at the net asset value per share determined at the close of business on January 31, 2019. |
Eaton Vance Minnesota Municipal Income Fund
| | | | | | | | | | | | | | | | |
| | | Beginning
Account Value
(2/1/19) | | | Ending
Account Value
(7/31/19) | | | Expenses Paid
During Period*
(2/1/19 – 7/31/19) | | | Annualized
Expense
Ratio | |
|
Actual | |
Class A | | $ | 1,000.00 | | | $ | 1,045.10 | | | $ | 3.55 | | | | 0.70 | % |
Class C | | $ | 1,000.00 | | | $ | 1,039.80 | | | $ | 7.33 | | | | 1.45 | % |
Class I | | $ | 1,000.00 | | | $ | 1,045.00 | | | $ | 2.54 | | | | 0.50 | % |
| |
Hypothetical | |
(5% return per year before expenses) | |
Class A | | $ | 1,000.00 | | | $ | 1,021.30 | | | $ | 3.51 | | | | 0.70 | % |
Class C | | $ | 1,000.00 | | | $ | 1,017.60 | | | $ | 7.25 | | | | 1.45 | % |
Class I | | $ | 1,000.00 | | | $ | 1,022.30 | | | $ | 2.51 | | | | 0.50 | % |
| * | Expenses are equal to the Fund’s annualized expense ratio for the indicated Class, multiplied by the average account value over the period, multiplied by 181/365 (to reflect theone-half year period). The Example assumes that the $1,000 was invested at the net asset value per share determined at the close of business on January 31, 2019. |
Eaton Vance
Municipal Income Funds
July 31, 2019
Fund Expenses — continued
Eaton Vance New Jersey Municipal Income Fund
| | | | | | | | | | | | | | | | |
| | | Beginning
Account Value
(2/1/19) | | | Ending
Account Value
(7/31/19) | | | Expenses Paid
During Period*
(2/1/19 – 7/31/19) | | | Annualized
Expense
Ratio | |
|
Actual | |
Class A | | $ | 1,000.00 | | | $ | 1,056.00 | | | $ | 3.62 | | | | 0.71 | % |
Class C | | $ | 1,000.00 | | | $ | 1,051.40 | | | $ | 7.43 | | | | 1.46 | % |
Class I | | $ | 1,000.00 | | | $ | 1,055.90 | | | $ | 2.60 | | | | 0.51 | % |
| |
Hypothetical | |
(5% return per year before expenses) | |
Class A | | $ | 1,000.00 | | | $ | 1,021.30 | | | $ | 3.56 | | | | 0.71 | % |
Class C | | $ | 1,000.00 | | | $ | 1,017.60 | | | $ | 7.30 | | | | 1.46 | % |
Class I | | $ | 1,000.00 | | | $ | 1,022.30 | | | $ | 2.56 | | | | 0.51 | % |
| * | Expenses are equal to the Fund’s annualized expense ratio for the indicated Class, multiplied by the average account value over the period, multiplied by 181/365 (to reflect theone-half year period). The Example assumes that the $1,000 was invested at the net asset value per share determined at the close of business on January 31, 2019. |
Eaton Vance Pennsylvania Municipal Income Fund
| | | | | | | | | | | | | | | | |
| | | Beginning
Account Value
(2/1/19) | | | Ending
Account Value
(7/31/19) | | | Expenses Paid
During Period*
(2/1/19 – 7/31/19) | | | Annualized
Expense
Ratio | |
|
Actual | |
Class A | | $ | 1,000.00 | | | $ | 1,039.40 | | | $ | 4.05 | | | | 0.80 | % |
Class C | | $ | 1,000.00 | | | $ | 1,036.00 | | | $ | 7.82 | | | | 1.55 | % |
Class I | | $ | 1,000.00 | | | $ | 1,041.60 | | | $ | 3.04 | | | | 0.60 | % |
| |
Hypothetical | |
(5% return per year before expenses) | |
Class A | | $ | 1,000.00 | | | $ | 1,020.80 | | | $ | 4.01 | | | | 0.80 | % |
Class C | | $ | 1,000.00 | | | $ | 1,017.10 | | | $ | 7.75 | | | | 1.55 | % |
Class I | | $ | 1,000.00 | | | $ | 1,021.80 | | | $ | 3.01 | | | | 0.60 | % |
| * | Expenses are equal to the Fund’s annualized expense ratio for the indicated Class, multiplied by the average account value over the period, multiplied by 181/365 (to reflect theone-half year period). The Example assumes that the $1,000 was invested at the net asset value per share determined at the close of business on January 31, 2019. |
Eaton Vance
Arizona Municipal Income Fund
July 31, 2019
Portfolio of Investments
| | | | | | | | |
| Tax-Exempt Investments — 97.3% | |
| Security | | Principal
Amount
(000’s omitted) | | | Value | |
|
| Education — 17.4% | |
| | |
Arizona Industrial Development Authority, (Doral Academy of Nevada), 5.00%, 7/15/39(1) | | $ | 55 | | | $ | 60,045 | |
| | |
Arizona State University, 5.00%, 7/1/36 | | | 1,150 | | | | 1,340,819 | |
| | |
Arizona State University, 5.00%, 7/1/37 | | | 170 | | | | 185,667 | |
| | |
Arizona State University, Prerefunded to 7/1/22, 5.00%, 7/1/37 | | | 830 | | | | 922,064 | |
| | |
Arizona State University, Green Bonds, 5.00%, 7/1/40 | | | 1,000 | | | | 1,246,950 | |
| | |
Glendale Industrial Development Authority, (Midwestern University), 5.00%, 5/15/25 | | | 1,500 | | | | 1,643,130 | |
| | |
Northern Arizona University, 5.00%, 6/1/38 | | | 1,000 | | | | 1,163,750 | |
| | |
Pima County Community College District, 5.00%, 7/1/33 | | | 300 | | | | 371,508 | |
| | |
Pima County Community College District, 5.00%, 7/1/35 | | | 720 | | | | 884,693 | |
| | |
University of Arizona, 5.00%, 6/1/38 | | | 1,500 | | | | 1,777,815 | |
| | |
University of Arizona, 5.00%, 6/1/42 | | | 500 | | | | 617,765 | |
| |
| | | | $ | 10,214,206 | |
|
| Electric Utilities — 9.0% | |
| | |
Mesa, Utility Systems Revenue, 4.00%, 7/1/31 | | $ | 1,160 | | | $ | 1,313,758 | |
| | |
Pima County Industrial Development Authority, (Tucson Electric Power Co.), 5.25%, 10/1/40 | | | 1,500 | | | | 1,555,590 | |
| | |
Pinal County Electrical District No. 3, 5.00%, 7/1/33 | | | 1,000 | | | | 1,188,600 | |
| | |
Salt River Project Agricultural Improvement and Power District, 5.00%, 1/1/35 | | | 1,000 | | | | 1,240,040 | |
| |
| | | | $ | 5,297,988 | |
|
| Escrowed / Prerefunded — 1.4% | |
| | |
Guam, Limited Obligation Bonds, Prerefunded to 12/1/19, 5.625%, 12/1/29 | | $ | 270 | | | $ | 274,107 | |
| | |
Guam, Limited Obligation Bonds, Prerefunded to 12/1/19, 5.75%, 12/1/34 | | | 295 | | | | 299,608 | |
| | |
Kyrene Elementary School District No. 28, Maricopa County, Prerefunded to 7/1/23, 5.50%, 7/1/30 | | | 200 | | | | 233,786 | |
| |
| | | | $ | 807,501 | |
|
| General Obligations — 8.0% | |
| | |
Chandler Unified School District No. 80, 4.00%, 7/1/33 | | $ | 225 | | | $ | 252,234 | |
| | |
Peoria Unified School District No. 11, 4.00%, 7/1/31 | | | 350 | | | | 403,435 | |
| | |
Scottsdale Unified School District No. 48, 5.00%, 7/1/31 | | | 750 | | | | 928,657 | |
| | |
Tempe, 5.00%, 7/1/30 | | | 1,000 | | | | 1,278,950 | |
| | |
Tempe, 5.375%, 7/1/21 | | | 1,330 | | | | 1,424,989 | |
| | |
Western Maricopa Education Center District No. 402, 4.50%, 7/1/34 | | | 350 | | | | 388,948 | |
| |
| | | | $ | 4,677,213 | |
| | | | | | | | |
| Security | | Principal
Amount
(000’s omitted) | | | Value | |
|
| Hospital — 12.4% | |
| | |
Arizona Health Facilities Authority, (Banner Health), (LOC: MUFG Union Bank, N.A.), 1.46%, 1/1/46(2) | | $ | 2,000 | | | $ | 2,000,000 | |
| | |
Arizona Health Facilities Authority, (Scottsdale Lincoln Hospitals), 5.00%, 12/1/39 | | | 1,665 | | | | 1,884,647 | |
| | |
Maricopa County Industrial Development Authority, (Banner Health), 5.00%, 1/1/38 | | | 1,000 | | | | 1,182,230 | |
| | |
Maricopa County Industrial Development Authority, (HonorHealth), 5.00%, 9/1/32 | | | 400 | | | | 485,736 | |
| | |
Yavapai County Industrial Development Authority, (Yavapai Regional Medical Center), 5.25%, 8/1/33 | | | 500 | | | | 567,010 | |
| | |
Yuma Industrial Development Authority, (Yuma Regional Medical Center), 5.00%, 8/1/32 | | | 985 | | | | 1,125,392 | |
| |
| | | | $ | 7,245,015 | |
|
| Housing — 1.0% | |
| | |
Phoenix Industrial Development Authority, (Downtown Phoenix Student Housing, LLC - Arizona State University), 5.00%, 7/1/37 | | $ | 500 | | | $ | 579,785 | |
| |
| | | | $ | 579,785 | |
|
| Industrial Development Revenue — 1.9% | |
| | |
Maricopa County Pollution Control Corp., (El Paso Electric Co.), 3.60%, 2/1/40 | | $ | 250 | | | $ | 252,685 | |
| | |
Maricopa County Pollution Control Corp., (El Paso Electric Co.), 4.50%, 8/1/42 | | | 850 | | | | 881,586 | |
| |
| | | | $ | 1,134,271 | |
|
| Insured – Electric Utilities — 2.6% | |
| | |
Mesa, Utility Systems Revenue, (NPFG), 5.00%, 7/1/23 | | $ | 430 | | | $ | 493,911 | |
| | |
Mesa, Utility Systems Revenue, (NPFG), Escrowed to Maturity, 5.00%, 7/1/23 | | | 120 | | | | 137,730 | |
| | |
Mesa, Utility Systems Revenue, (NPFG), Escrowed to Maturity, 5.00%, 7/1/23 | | | 450 | | | | 516,487 | |
| | |
Puerto Rico Electric Power Authority, (NPFG), 5.25%, 7/1/29 | | | 320 | | | | 341,898 | |
| |
| | | | $ | 1,490,026 | |
|
| Insured – General Obligations — 9.9% | |
| | |
Apache Junction Unified School District No. 43, (AGM), 5.00%, 7/1/24 | | $ | 1,200 | | | $ | 1,411,500 | |
| | |
Maricopa County Elementary School District No. 3, (AGM), 5.00%, 7/1/25 | | | 2,670 | | | | 3,236,440 | |
| | |
Sun City Fire District, (AGM), 4.00%, 1/1/37 | | | 1,000 | | | | 1,121,960 | |
| |
| | | | $ | 5,769,900 | |
| | | | |
| | 18 | | See Notes to Financial Statements. |
Eaton Vance
Arizona Municipal Income Fund
July 31, 2019
Portfolio of Investments — continued
| | | | | | | | |
| Security | | Principal
Amount
(000’s omitted) | | | Value | |
|
| Insured – Lease Revenue / Certificates of Participation — 4.1% | |
| | |
Phoenix Civic Improvement Corp., (Civic Plaza), (NPFG), 5.50%, 7/1/41 | | $ | 1,635 | | | $ | 2,406,916 | |
| |
| | | | $ | 2,406,916 | |
|
| Insured – Special Tax Revenue — 2.5% | |
| | |
Glendale, Transportation Excise Tax Revenue, (AGM), 5.00%, 7/1/30 | | $ | 1,250 | | | $ | 1,476,075 | |
| |
| | | | $ | 1,476,075 | |
|
| Other Revenue — 2.3% | |
| | |
Salt Verde Financial Corp., Senior Gas Revenue, 5.00%, 12/1/37 | | $ | 1,000 | | | $ | 1,322,590 | |
| |
| | | | $ | 1,322,590 | |
|
| Senior Living / Life Care — 1.4% | |
| | |
Glendale Industrial Development Authority, (Terraces of Phoenix), 4.00%, 7/1/28 | | $ | 225 | | | $ | 232,632 | |
| | |
Tempe Industrial Development Authority, (Friendship Village of Tempe), 6.00%, 12/1/32 | | | 230 | | | | 243,278 | |
| | |
Tempe Industrial Development Authority, (Mirabella at ASU), 6.00%, 10/1/37(1) | | | 300 | | | | 343,668 | |
| |
| | | | $ | 819,578 | |
|
| Special Tax Revenue — 8.0% | |
| | |
Arizona Sports and Tourism Authority, (Multipurpose Stadium Facility), 5.00%, 7/1/29 | | $ | 1,000 | | | $ | 1,076,770 | |
| | |
Mesa, Excise Tax Revenue, 5.00%, 7/1/32 | | | 1,000 | | | | 1,102,070 | |
| | |
Queen Creek, Excise Tax and State Shared Revenue, 5.00%, 8/1/30 | | | 1,165 | | | | 1,414,764 | |
| | |
Tempe, Transit Excise Tax Revenue, 5.00%, 7/1/37 | | | 625 | | | | 685,219 | |
| | |
Tempe, Transit Excise Tax Revenue, Prerefunded to 7/1/22, 5.00%, 7/1/37 | | | 375 | | | | 416,025 | |
| |
| | | | $ | 4,694,848 | |
|
| Transportation — 5.8% | |
| | |
Arizona Transportation Board, Highway Revenue, 5.00%, 7/1/33 | | $ | 1,000 | | | $ | 1,155,990 | |
| | |
Phoenix Civic Improvement Corp., Airport Revenue, (AMT), 5.00%, 7/1/31 | | | 2,000 | | | | 2,255,440 | |
| |
| | | | $ | 3,411,430 | |
|
| Water and Sewer — 9.6% | |
| | |
Central Arizona Water Conservation District, 5.00%, 1/1/35 | | $ | 1,500 | | | $ | 1,772,625 | |
| | |
Gilbert Water Resources Municipal Property Corp., 4.00%, 7/1/36 | | | 750 | | | | 830,565 | |
| | | | | | | | |
| Security | | Principal
Amount
(000’s omitted) | | | Value | |
|
| Water and Sewer (continued) | |
| | |
Phoenix Civic Improvement Corp., Water System Revenue, 5.00%, 7/1/39 | | $ | 1,500 | | | $ | 1,718,895 | |
| | |
Tucson, Water System Revenue, 5.00%, 7/1/32 | | | 545 | | | | 672,399 | |
| | |
Tucson, Water System Revenue, 5.00%, 7/1/35 | | | 530 | | | | 647,384 | |
| |
| | | | $ | 5,641,868 | |
| |
TotalTax-Exempt Investments — 97.3%
(identified cost $52,382,886) | | | $ | 56,989,210 | |
| |
Other Assets, Less Liabilities — 2.7% | | | $ | 1,605,042 | |
| |
Net Assets — 100.0% | | | $ | 58,594,252 | |
The percentage shown for each investment category in the Portfolio of Investments is based on net assets.
The Fund invests primarily in debt securities issued by Arizona municipalities. The ability of the issuers of the debt securities to meet their obligations may be affected by economic developments in a specific industry or municipality. In order to reduce the risk associated with such economic developments, at July 31, 2019, 19.6% of total investments are backed by bond insurance of various financial institutions and financial guaranty assurance agencies. The aggregate percentage insured by an individual financial institution or financial guaranty assurance agency ranged from 6.8% to 12.7% of total investments.
| (1) | Security exempt from registration pursuant to Rule 144A under the Securities Act of 1933, as amended. These securities may be sold in certain transactions in reliance on an exemption from registration (normally to qualified institutional buyers). At July 31, 2019, the aggregate value of these securities is $403,713 or 0.7% of the Fund’s net assets. |
| (2) | Variable rate demand obligation that may be tendered at par on any day for payment the same or next business day. The stated interest rate, which generally resets daily, is determined by the remarketing agent and represents the rate in effect at July 31, 2019. |
| | | | |
| | 19 | | See Notes to Financial Statements. |
Eaton Vance
Arizona Municipal Income Fund
July 31, 2019
Portfolio of Investments — continued
| | | | | | | | | | | | | | | | |
| Futures Contracts | |
| Description | | Number of
Contracts | | | Position | | Expiration
Date | | Notional
Amount | | | Value/Unrealized
Depreciation | |
|
Interest Rate Futures | |
| | | | | |
| U.S. Long Treasury Bond | | | 20 | | | Short | | 9/19/19 | | $ | (3,111,875 | ) | | $ | (92,784 | ) |
| |
| | | | $ | (92,784 | ) |
Abbreviations:
| | | | |
| | |
| AGM | | – | | Assured Guaranty Municipal Corp. |
| | |
| AMT | | – | | Interest earned from these securities may be considered a tax preference item for purposes of the Federal Alternative Minimum Tax. |
| | |
| LOC | | – | | Letter of Credit |
| | |
| NPFG | | – | | National Public Finance Guarantee Corp. |
| | | | |
| | 20 | | See Notes to Financial Statements. |
Eaton Vance
Connecticut Municipal Income Fund
July 31, 2019
Portfolio of Investments
| | | | | | | | |
| Tax-Exempt Investments — 97.6% | |
| Security | | Principal
Amount
(000’s omitted) | | | Value | |
|
| Bond Bank — 1.6% | |
| | |
Connecticut, (Revolving Fund), Green Bonds, 5.00%, 5/1/34 | | $ | 1,000 | | | $ | 1,223,550 | |
| |
| | | | $ | 1,223,550 | |
|
| Education — 18.6% | |
| | |
Connecticut Health and Educational Facilities Authority, (Brunswick School), 5.00%, 7/1/31 | | $ | 500 | | | $ | 544,590 | |
| | |
Connecticut Health and Educational Facilities Authority, (Brunswick School), 5.00%, 7/1/32 | | | 1,125 | | | | 1,223,539 | |
| | |
Connecticut Health and Educational Facilities Authority, (Connecticut College), 5.00%, 7/1/30 | | | 1,255 | | | | 1,369,544 | |
| | |
Connecticut Health and Educational Facilities Authority, (Fairfield University), 4.00%, 7/1/47 | | | 2,000 | | | | 2,152,560 | |
| | |
Connecticut Health and Educational Facilities Authority, (Quinnipiac University), 5.00%, 7/1/34 | | | 1,475 | | | | 1,726,768 | |
| | |
Connecticut Health and Educational Facilities Authority, (Sacred Heart University), 5.00%, 7/1/37 | | | 450 | | | | 533,839 | |
| | |
Connecticut Health and Educational Facilities Authority, (The Taft School), 4.00%, 7/1/28 | | | 135 | | | | 159,925 | |
| | |
Connecticut Health and Educational Facilities Authority, (The Taft School), 4.00%, 7/1/29 | | | 100 | | | | 117,112 | |
| | |
Connecticut Health and Educational Facilities Authority, (The Taft School), 4.00%, 7/1/30 | | | 125 | | | | 144,593 | |
| | |
Connecticut Health and Educational Facilities Authority, (The Taft School), 4.00%, 7/1/33 | | | 430 | | | | 489,009 | |
| | |
Connecticut Health and Educational Facilities Authority, (The Taft School), 4.00%, 7/1/34 | | | 1,085 | | | | 1,228,762 | |
| | |
Connecticut Health and Educational Facilities Authority, (The Taft School), 4.00%, 7/1/36 | | | 430 | | | | 483,449 | |
| | |
Connecticut Health and Educational Facilities Authority, (University of New Haven), 5.00%, 7/1/34 | | | 810 | | | | 959,947 | |
| | |
Connecticut Health and Educational Facilities Authority, (University of New Haven), 5.00%, 7/1/35 | | | 850 | | | | 1,003,629 | |
| | |
Connecticut Health and Educational Facilities Authority, (Yale University), 5.00%, 7/1/27 | | | 1,000 | | | | 1,274,850 | |
| | |
University of Connecticut, 5.00%, 11/15/29 | | | 1,000 | | | | 1,108,800 | |
| |
| | | | $ | 14,520,916 | |
|
| Escrowed / Prerefunded — 7.7% | |
| | |
Connecticut Health and Educational Facilities Authority, (Fairfield University), Prerefunded to 7/1/20, 5.00%, 7/1/40 | | $ | 1,500 | | | $ | 1,553,595 | |
| | |
Connecticut Health and Educational Facilities Authority, (Middlesex Hospital), Prerefunded to 7/1/21, 5.00%, 7/1/24 | | | 1,000 | | | | 1,073,450 | |
| | |
Connecticut Health and Educational Facilities Authority, (Wesleyan University), Prerefunded to 7/1/20, 5.00%, 7/1/39 | | | 2,000 | | | | 2,071,460 | |
| | | | | | | | |
| Security | | Principal
Amount
(000’s omitted) | | | Value | |
|
| Escrowed / Prerefunded (continued) | |
| | |
Connecticut Health and Educational Facilities Authority,(Yale-New Haven Hospital), Prerefunded to 7/1/20, 5.75%, 7/1/34 | | $ | 1,000 | | | $ | 1,041,590 | |
| | |
Guam, Limited Obligation Bonds, Prerefunded to 12/1/19, 5.625%, 12/1/29 | | | 135 | | | | 137,053 | |
| | |
Guam, Limited Obligation Bonds, Prerefunded to 12/1/19, 5.75%, 12/1/34 | | | 150 | | | | 152,343 | |
| |
| | | | $ | 6,029,491 | |
|
| General Obligations — 19.0% | |
| | |
Colchester, 4.00%, 10/15/28 | | $ | 440 | | | $ | 497,323 | |
| | |
Connecticut, 5.00%, 4/15/30 | | | 1,150 | | | | 1,452,151 | |
| | |
Connecticut, 5.00%, 4/15/39 | | | 100 | | | | 120,562 | |
| | |
East Lyme, 4.00%, 7/15/22 | | | 350 | | | | 359,044 | |
| | |
East Lyme, 4.00%, 7/15/23 | | | 525 | | | | 538,582 | |
| | |
Enfield, 4.00%, 8/1/29 | | | 500 | | | | 592,610 | |
| | |
Fairfield, 5.00%, 1/1/23 | | | 1,000 | | | | 1,136,430 | |
| | |
Greenwich, 4.00%, 7/15/29 | | | 450 | | | | 504,491 | |
| | |
Greenwich, 4.00%, 7/15/30 | | | 250 | | | | 278,215 | |
| | |
Greenwich, 4.00%, 7/15/32 | | | 400 | | | | 441,168 | |
| | |
North Haven, 5.00%, 7/15/23 | | | 1,475 | | | | 1,698,802 | |
| | |
North Haven, 5.00%, 7/15/25 | | | 1,490 | | | | 1,804,032 | |
| | |
Norwalk, 4.00%, 7/1/26 | | | 1,975 | | | | 2,080,603 | |
| | |
Redding, 5.625%, 10/15/19 | | | 650 | | | | 656,182 | |
| | |
Rocky Hill, 4.00%, 1/15/33 | | | 1,000 | | | | 1,159,090 | |
| | |
Stamford, 4.00%, 7/1/25 | | | 370 | | | | 389,199 | |
| | |
Stamford, 4.00%, 6/1/33(1) | | | 1,000 | | | | 1,149,550 | |
| |
| | | | $ | 14,858,034 | |
|
| Hospital — 10.0% | |
| | |
Connecticut Health and Educational Facilities Authority, (Ascension Health), 5.00%, 11/15/40 | | $ | 1,000 | | | $ | 1,010,160 | |
| | |
Connecticut Health and Educational Facilities Authority, (Stamford Hospital), 4.00%, 7/1/46 | | | 1,000 | | | | 1,046,820 | |
| | |
Connecticut Health and Educational Facilities Authority, (Trinity Health Corp.), 5.00%, 12/1/33 | | | 2,015 | | | | 2,401,739 | |
| | |
Connecticut Health and Educational Facilities Authority, (Western Connecticut Health Network), 5.00%, 7/1/29 | | | 1,000 | | | | 1,057,450 | |
| | |
Connecticut Health and Educational Facilities Authority,(Yale-New Haven Health), 5.00%, 7/1/31 | | | 500 | | | | 578,440 | |
| | |
Connecticut Health and Educational Facilities Authority,(Yale-New Haven Health), 5.00%, 7/1/34 | | | 1,520 | | | | 1,735,141 | |
| |
| | | | $ | 7,829,750 | |
| | | | |
| | 21 | | See Notes to Financial Statements. |
Eaton Vance
Connecticut Municipal Income Fund
July 31, 2019
Portfolio of Investments — continued
| | | | | | | | |
| Security | | Principal
Amount
(000’s omitted) | | | Value | |
|
| Housing — 1.1% | |
| | |
Connecticut Housing Finance Authority, 4.00%, 11/15/38 | | $ | 750 | | | $ | 814,717 | |
| |
| | | | $ | 814,717 | |
|
| Industrial Development Revenue — 1.4% | |
| | |
Eastern Connecticut Resource Recovery Authority, (Wheelabrator Lisbon), (AMT), 5.50%, 1/1/20 | | $ | 1,070 | | | $ | 1,087,452 | |
| |
| | | | $ | 1,087,452 | |
|
| Insured – Education — 9.5% | |
| | |
Connecticut Health and Educational Facilities Authority, (Loomis Chaffee School), (AMBAC), 5.25%, 7/1/30 | | $ | 1,950 | | | $ | 2,596,659 | |
| | |
Connecticut Health and Educational Facilities Authority, (Loomis Chaffee School), (AMBAC), 5.25%, 7/1/31 | | | 2,050 | | | | 2,750,096 | |
| | |
Connecticut Health and Educational Facilities Authority, (Trinity College), (NPFG), 5.50%, 7/1/21 | | | 1,960 | | | | 2,080,089 | |
| |
| | | | $ | 7,426,844 | |
|
| Insured – General Obligations — 7.5% | |
| | |
Bridgeport, (AGM), 4.00%, 8/15/21 | | $ | 1,075 | | | $ | 1,130,018 | |
| | |
Bridgeport, (AGM), 5.00%, 8/15/32 | | | 1,120 | | | | 1,311,330 | |
| | |
Connecticut, (AMBAC), 5.25%, 6/1/20 | | | 1,000 | | | | 1,033,520 | |
| | |
Hartford, (AGC), 5.00%, 8/15/28 | | | 500 | | | | 500,705 | |
| | |
Hartford, (AGC), Prerefunded to 8/15/19, 5.00%, 8/15/28 | | | 500 | | | | 500,695 | |
| | |
Hartford, (AGM), 5.00%, 4/1/31 | | | 240 | | | | 259,423 | |
| | |
New Haven, (AGM), 5.00%, 8/1/25 | | | 1,000 | | | | 1,150,660 | |
| |
| | | | $ | 5,886,351 | |
|
| Insured – Transportation — 2.3% | |
| | |
Puerto Rico Highway and Transportation Authority, (AGC), 5.25%, 7/1/41 | | $ | 1,600 | | | $ | 1,750,848 | |
| |
| | | | $ | 1,750,848 | |
|
| Insured – Water and Sewer — 5.2% | |
| | |
South Central Connecticut Regional Water Authority, (NPFG), 5.25%, 8/1/24 | | $ | 3,420 | | | $ | 4,091,790 | |
| |
| | | | $ | 4,091,790 | |
|
| Senior Living / Life Care — 1.5% | |
| | |
Connecticut Health and Educational Facilities Authority, (Covenant Home, Inc.), 5.00%, 12/1/34 | | $ | 1,000 | | | $ | 1,168,050 | |
| |
| | | | $ | 1,168,050 | |
| | | | | | | | |
| Security | | Principal
Amount
(000’s omitted) | | | Value | |
|
| Special Tax Revenue — 2.8% | |
| | |
Connecticut, Special Tax Obligation, (Transportation Infrastructure), 5.00%, 1/1/29 | | $ | 2,000 | | | $ | 2,218,520 | |
| |
| | | | $ | 2,218,520 | |
|
| Student Loan — 1.0% | |
| | |
Connecticut Higher Education Supplemental Loan Authority, (AMT), 4.00%, 11/15/30 | | $ | 555 | | | $ | 581,873 | |
| | |
Connecticut Higher Education Supplemental Loan Authority, (AMT), 4.125%, 11/15/33 | | | 210 | | | | 224,442 | |
| |
| | | | $ | 806,315 | |
|
| Transportation — 1.4% | |
| | |
Connecticut Airport Authority, (Ground Transportation Center), (AMT), 4.00%, 7/1/49 | | $ | 1,000 | | | $ | 1,073,900 | |
| |
| | | | $ | 1,073,900 | |
|
| Water and Sewer — 7.0% | |
| | |
Greater New Haven Water Pollution Control Authority, 5.00%, 8/15/32 | | $ | 1,000 | | | $ | 1,151,770 | |
| | |
Hartford County Metropolitan District, (Clean Water), 5.00%, 4/1/36 | | | 1,500 | | | | 1,622,700 | |
| | |
South Central Connecticut Regional Water Authority, 4.00%, 8/1/34 | | | 450 | | | | 518,472 | |
| | |
South Central Connecticut Regional Water Authority, 5.00%, 8/1/32 | | | 355 | | | | 453,303 | |
| | |
Stamford, (Water Pollution Control System), 4.00%, 4/1/44 | | | 1,000 | | | | 1,106,960 | |
| | |
Stamford, (Water Pollution Control System), 5.00%, 9/15/29 | | | 200 | | | | 240,760 | |
| | |
Stamford, (Water Pollution Control System), 5.00%, 9/15/30 | | | 125 | | | | 149,829 | |
| | |
Stamford, (Water Pollution Control System), 5.00%, 4/1/33 | | | 100 | | | | 127,366 | |
| | |
Stamford, (Water Pollution Control System), 5.00%, 4/1/34 | | | 100 | | | | 126,945 | |
| |
| | | | $ | 5,498,105 | |
| |
TotalTax-Exempt Investments — 97.6%
(identified cost $71,228,992) | | | $ | 76,284,633 | |
| |
Other Assets, Less Liabilities — 2.4% | | | $ | 1,853,536 | |
| |
Net Assets — 100.0% | | | $ | 78,138,169 | |
The percentage shown for each investment category in the Portfolio of Investments is based on net assets.
| | | | |
| | 22 | | See Notes to Financial Statements. |
Eaton Vance
Connecticut Municipal Income Fund
July 31, 2019
Portfolio of Investments — continued
The Fund invests primarily in debt securities issued by Connecticut municipalities. The ability of the issuers of the debt securities to meet their obligations may be affected by economic developments in a specific industry or municipality. In order to reduce the risk associated with such economic developments, at July 31, 2019, 25.1% of total investments are backed by bond insurance of various financial institutions and financial guaranty assurance agencies. The aggregate percentage insured by an individual financial institution or financial guaranty assurance agency ranged from 3.6% to 8.4% of total investments.
| (1) | When-issued security. |
Abbreviations:
| | | | |
| | |
| AGC | | – | | Assured Guaranty Corp. |
| | |
| AGM | | – | | Assured Guaranty Municipal Corp. |
| | |
| AMBAC | | – | | AMBAC Financial Group, Inc. |
| | |
| AMT | | – | | Interest earned from these securities may be considered a tax preference item for purposes of the Federal Alternative Minimum Tax. |
| | |
| NPFG | | – | | National Public Finance Guarantee Corp. |
| | | | |
| | 23 | | See Notes to Financial Statements. |
Eaton Vance
Minnesota Municipal Income Fund
July 31, 2019
Portfolio of Investments
| | | | | | | | |
| Tax-Exempt Investments — 100.4% | |
| Security | | Principal
Amount
(000’s omitted) | | | Value | |
|
| Bond Bank — 1.6% | |
| | |
Minnesota Public Facilities Authority, (Revolving Fund), 5.00%, 3/1/29 | | $ | 1,000 | | | $ | 1,219,510 | |
| | |
Minnesota Public Facilities Authority, (Revolving Fund), 5.00%, 3/1/30 | | | 1,000 | | | | 1,214,010 | |
| |
| | | | $ | 2,433,520 | |
|
| Education — 16.9% | |
| | |
Minnesota Higher Education Facilities Authority, (Carleton College), 5.00%, 3/1/29 | | $ | 2,250 | | | $ | 2,800,215 | |
| | |
Minnesota Higher Education Facilities Authority, (Carleton College), 5.00%, 3/1/31 | | | 1,000 | | | | 1,228,720 | |
| | |
Minnesota Higher Education Facilities Authority, (Carleton College), 5.00%, 3/1/34 | | | 500 | | | | 606,370 | |
| | |
Minnesota Higher Education Facilities Authority, (College of Saint Benedict), 4.00%, 3/1/36 | | | 400 | | | | 430,848 | |
| | |
Minnesota Higher Education Facilities Authority, (College of Saint Benedict), 5.00%, 3/1/37 | | | 1,500 | | | | 1,705,380 | |
| | |
Minnesota Higher Education Facilities Authority, (Gustavus Adolphus College), 5.00%, 10/1/35 | | | 565 | | | | 668,892 | |
| | |
Minnesota Higher Education Facilities Authority, (Macalester College), 5.00%, 3/1/27 | | | 500 | | | | 591,835 | |
| | |
Minnesota Higher Education Facilities Authority, (Macalester College), 5.00%, 3/1/28 | | | 1,010 | | | | 1,191,951 | |
| | |
Minnesota Higher Education Facilities Authority, (St. Catherine University), 5.00%, 10/1/26 | | | 450 | | | | 537,178 | |
| | |
Minnesota Higher Education Facilities Authority, (St. Catherine University), 5.00%, 10/1/32 | | | 500 | | | | 596,965 | |
| | |
Minnesota Higher Education Facilities Authority, (St. Olaf College), 4.00%, 10/1/35 | | | 500 | | | | 556,675 | |
| | |
Minnesota Higher Education Facilities Authority, (St. Olaf College), 5.00%, 12/1/29 | | | 1,815 | | | | 2,164,424 | |
| | |
Minnesota Higher Education Facilities Authority, (University of St. Thomas), 4.00%, 10/1/32 | | | 910 | | | | 1,056,028 | |
| | |
Minnesota Higher Education Facilities Authority, (University of St. Thomas), 4.00%, 10/1/36 | | | 500 | | | | 554,200 | |
| | |
Minnesota Higher Education Facilities Authority, (University of St. Thomas), 4.00%, 10/1/37 | | | 500 | | | | 552,285 | |
| | |
Minnesota Higher Education Facilities Authority, (University of St. Thomas), 5.00%, 10/1/30 | | | 650 | | | | 800,728 | |
| | |
Minnesota Higher Education Facilities Authority, (University of St. Thomas), 5.00%, 10/1/34 | | | 250 | | | | 312,483 | |
| | |
Minnesota Higher Education Facilities Authority, (University of St. Thomas), 5.00%, 4/1/35 | | | 750 | | | | 880,912 | |
| | |
Minnesota State Colleges and Universities, 5.00%, 10/1/26(1) | | | 1,535 | | | | 1,905,534 | |
| | |
Minnesota State Colleges and Universities, 5.00%, 10/1/28 | | | 1,375 | | | | 1,479,789 | |
| | |
Minnesota State Colleges and Universities, 5.00%, 10/1/30 | | | 1,455 | | | | 1,564,591 | |
| | | | | | | | |
| Security | | Principal
Amount
(000’s omitted) | | | Value | |
|
| Education (continued) | |
| | |
University of Minnesota, 5.00%, 4/1/27 | | $ | 500 | | | $ | 614,800 | |
| | |
University of Minnesota, 5.00%, 8/1/27 | | | 625 | | | | 753,150 | |
| | |
University of Minnesota, 5.00%, 4/1/41 | | | 2,000 | | | | 2,356,040 | |
| |
| | | | $ | 25,909,993 | |
|
| Electric Utilities — 8.5% | |
| | |
Central Minnesota Municipal Power Agency, 5.00%, 1/1/32 | | $ | 2,100 | | | $ | 2,272,536 | |
| | |
Chaska, Electric System Revenue, 5.00%, 10/1/30 | | | 550 | | | | 650,210 | |
| | |
Hutchinson, Public Utility Revenue, 5.00%, 12/1/26 | | | 350 | | | | 390,386 | |
| | |
Minnesota Municipal Power Agency, 5.00%, 10/1/33 | | | 250 | | | | 289,248 | |
| | |
Minnesota Municipal Power Agency, 5.00%, 10/1/34 | | | 250 | | | | 288,915 | |
| | |
Minnesota Municipal Power Agency, 5.00%, 10/1/35 | | | 200 | | | | 230,928 | |
| | |
Northern Municipal Power Agency, 5.00%, 1/1/30 | | | 460 | | | | 557,143 | |
| | |
Northern Municipal Power Agency, 5.00%, 1/1/31 | | | 670 | | | | 788,697 | |
| | |
Northern Municipal Power Agency, 5.00%, 1/1/41 | | | 240 | | | | 279,403 | |
| | |
Rochester, Electric Utility Revenue, 5.00%, 12/1/29 | | | 700 | | | | 861,742 | |
| | |
Rochester, Electric Utility Revenue, 5.00%, 12/1/30 | | | 700 | | | | 855,764 | |
| | |
Rochester, Electric Utility Revenue, 5.00%, 12/1/42 | | | 820 | | | | 966,165 | |
| | |
St. Paul Port Authority, District Energy Revenue, 4.00%, 10/1/42 | | | 1,250 | | | | 1,360,125 | |
| | |
St. Paul Port Authority, District Energy Revenue, (AMT), 4.00%, 10/1/40 | | | 1,000 | | | | 1,073,490 | |
| | |
Western Minnesota Municipal Power Agency, 5.00%, 1/1/34 | | | 1,000 | | | | 1,135,360 | |
| | |
Western Minnesota Municipal Power Agency, 5.00%, 1/1/36 | | | 900 | | | | 1,060,137 | |
| |
| | | | $ | 13,060,249 | |
|
| Escrowed / Prerefunded — 2.9% | |
| | |
Guam, Limited Obligation Bonds, Prerefunded to 12/1/19, 5.625%, 12/1/29 | | $ | 270 | | | $ | 274,107 | |
| | |
Guam, Limited Obligation Bonds, Prerefunded to 12/1/19, 5.75%, 12/1/34 | | | 295 | | | | 299,608 | |
| | |
Minnesota Higher Education Facilities Authority, (Gustavus Adolphus College), Prerefunded to 10/1/19, 5.00%, 10/1/31 | | | 1,000 | | | | 1,006,300 | |
| | |
Minnesota Higher Education Facilities Authority, (St. Catherine University), Prerefunded to 10/1/22, 5.00%, 10/1/26 | | | 280 | | | | 312,191 | |
| | |
Minnesota Higher Education Facilities Authority, (St. Catherine University), Prerefunded to 10/1/22, 5.00%, 10/1/27 | | | 310 | | | | 345,641 | |
| | |
Minnesota Higher Education Facilities Authority, (St. Catherine University), Prerefunded to 10/1/22, 5.00%, 10/1/32 | | | 560 | | | | 624,383 | |
| | |
Minnesota Higher Education Facilities Authority, (University of St. Thomas), Prerefunded to 10/1/19, 5.00%, 10/1/39 | | | 1,000 | | | | 1,006,300 | |
| | |
University of Minnesota, Prerefunded to 12/1/20, 5.00%, 12/1/36 | | | 500 | | | | 525,610 | |
| |
| | | | $ | 4,394,140 | |
| | | | |
| | 24 | | See Notes to Financial Statements. |
Eaton Vance
Minnesota Municipal Income Fund
July 31, 2019
Portfolio of Investments — continued
| | | | | | | | |
| Security | | Principal
Amount
(000’s omitted) | | | Value | |
|
| General Obligations — 36.8% | |
| | |
Andover, 4.00%, 2/1/30(1) | | $ | 795 | | | $ | 935,882 | |
| | |
Anoka-Hennepin Independent School District No. 11, 5.00%, 2/1/27 | | | 1,000 | | | | 1,253,000 | |
| | |
Anoka-Hennepin Independent School District No. 11, 5.00%, 2/1/28 | | | 1,040 | | | | 1,295,403 | |
| | |
Buffalo-Hanover-Montrose Independent School District No. 877, 4.00%, 2/1/24 | | | 2,000 | | | | 2,141,720 | |
| | |
Centennial Independent School District No. 12, Circle Pines, 0.00%, 2/1/28 | | | 1,000 | | | | 806,540 | |
| | |
Centennial Independent School District No. 12, Circle Pines, 0.00%, 2/1/35 | | | 350 | | | | 201,898 | |
| | |
Chaska Independent School District No. 112, 4.00%, 2/1/23 | | | 2,000 | | | | 2,140,340 | |
| | |
Cloquet Independent School District No. 94, 5.00%, 2/1/30 | | | 2,000 | | | | 2,375,560 | |
| | |
Duluth, 5.00%, 2/1/31 | | | 1,000 | | | | 1,199,040 | |
| | |
Duluth, 5.00%, 2/1/34 | | | 1,000 | | | | 1,187,250 | |
| | |
Eden Prairie Independent School District No. 272, 5.00%, 2/1/30 | | | 1,000 | | | | 1,257,650 | |
| | |
Edina Independent School District No. 273, 5.00%, 2/1/28 | | | 1,625 | | | | 2,041,081 | |
| | |
Elk River Area Independent School District No. 728, 4.00%, 2/1/32 | | | 2,000 | | | | 2,170,840 | |
| | |
Hennepin County, 5.00%, 12/1/35 | | | 2,000 | | | | 2,432,500 | |
| | |
Hennepin County Regional Railroad Authority, 4.00%, 12/1/29 | | | 1,500 | | | | 1,511,970 | |
| | |
Hennepin County Regional Railroad Authority, 5.00%, 12/1/32 | | | 675 | | | | 862,144 | |
| | |
Hopkins Independent School District No. 270, 4.00%, 2/1/25 | | | 1,250 | | | | 1,367,475 | |
| | |
Mahtomedi Independent School District No. 832, 5.00%, 2/1/31 | | | 1,000 | | | | 1,188,360 | |
| | |
Minneapolis Special School District No. 1, 5.00%, 2/1/32 | | | 1,500 | | | | 1,876,080 | |
| | |
Minneapolis-St. Paul Metropolitan Council, 4.00%, 3/1/30 | | | 1,000 | | | | 1,186,010 | |
| | |
Minneapolis-St. Paul Metropolitan Council, 5.00%, 3/1/28 | | | 2,500 | | | | 3,143,900 | |
| | |
Minnesota, 5.00%, 8/1/32 | | | 2,000 | | | | 2,381,140 | |
| | |
Minnesota, 5.00%, 8/1/34 | | | 500 | | | | 629,580 | |
| | |
Minnesota, 5.00%, 10/1/34 | | | 1,000 | | | | 1,237,050 | |
| | |
Minnesota, Prerefunded to 10/1/21, 5.00%, 10/1/27 | | | 30 | | | | 32,448 | |
| | |
Ramsey County, 4.00%, 2/1/24 | | | 500 | | | | 521,210 | |
| | |
Rosemount-Apple Valley-Eagan Independent School District No. 196, 4.00%, 2/1/28 | | | 2,000 | | | | 2,305,540 | |
| | |
Rosemount-Apple Valley-Eagan Independent School District No. 196, 5.00%, 2/1/27 | | | 1,000 | | | | 1,224,270 | |
| | |
Russell-Tyler-Ruthton Independent School District No. 2902, 5.00%, 2/1/27(1) | | | 1,400 | | | | 1,741,096 | |
| | |
Sartell-St. Stephen Independent School District No. 748, 0.00%, 2/1/32 | | | 1,350 | | | | 959,620 | |
| | |
Sartell-St. Stephen Independent School District No. 748, 0.00%, 2/1/37 | | | 1,500 | | | | 869,520 | |
| | |
Scott County, 4.00%, 12/1/34 | | | 2,000 | | | | 2,323,140 | |
| | |
Spring Lake Park Independent School District No. 16, 4.00%, 2/1/29 | | | 1,075 | | | | 1,225,124 | |
| | | | | | | | |
| Security | | Principal
Amount
(000’s omitted) | | | Value | |
|
| General Obligations (continued) | |
| | |
St. Louis Park Independent School District No. 283, 4.00%, 2/1/31 | | $ | 2,000 | | | $ | 2,283,780 | |
| | |
St. Louis Park Independent School District No. 283, 5.00%, 2/1/29 | | | 845 | | | | 1,071,705 | |
| | |
St. Louis Park, 4.00%, 2/1/28 | | | 1,000 | | | | 1,178,860 | |
| | |
St. Paul, 5.00%, 12/1/27 | | | 750 | | | | 939,082 | |
| | |
St. Paul Independent School District No. 625, 4.00%, 2/1/25 | | | 1,000 | | | | 1,039,690 | |
| | |
Waseca Independent School District No. 829, 4.00%, 2/1/28 | | | 1,575 | | | | 1,805,123 | |
| |
| | | | $ | 56,342,621 | |
|
| Hospital — 13.5% | |
| | |
Duluth Economic Development Authority, (Essentia Health Obligated Group), 5.00%, 2/15/37 | | $ | 1,000 | | | $ | 1,185,050 | |
| | |
Kanabec County, (FirstLight Health System), 2.75%, 12/1/19 | | | 750 | | | | 750,398 | |
| | |
Maple Grove, (Maple Grove Hospital Corp.), 5.00%, 5/1/30 | | | 850 | | | | 1,025,363 | |
| | |
Maple Grove, (Maple Grove Hospital Corp.), 5.00%, 5/1/31 | | | 500 | | | | 598,910 | |
| | |
Maple Grove, (Maple Grove Hospital Corp.), 5.00%, 5/1/32 | | | 500 | | | | 595,795 | |
| | |
Minneapolis and St. Paul Housing and Redevelopment Authority, (Allina Health System), 5.00%, 11/15/29 | | | 915 | | | | 1,127,747 | |
| | |
Minneapolis and St. Paul Housing and Redevelopment Authority, (Children’s Health Care), 5.25%, 8/15/35 | | | 1,000 | | | | 1,039,140 | |
| | |
Minneapolis, (Fairview Health Services), 5.00%, 11/15/44 | | | 2,000 | | | | 2,262,920 | |
| | |
Rochester, (Mayo Clinic), 5.00%, 11/15/38 | | | 1,000 | | | | 1,025,080 | |
| | |
Rochester, (Olmsted Medical Center), 5.875%, 7/1/30 | | | 1,500 | | | | 1,558,485 | |
| | |
St. Cloud, (CentraCare Health System), 5.00%, 5/1/46 | | | 2,650 | | | | 3,066,924 | |
| | |
St. Cloud, (CentraCare Health System), 5.125%, 5/1/30 | | | 65 | | | | 66,812 | |
| | |
St. Paul Housing and Redevelopment Authority, (Allina Health System), 5.25%, 11/15/29 | | | 490 | | | | 495,895 | |
| | |
St. Paul Housing and Redevelopment Authority, (Fairview Health Services), 5.00%, 11/15/31 | | | 1,000 | | | | 1,225,120 | |
| | |
St. Paul Housing and Redevelopment Authority, (Fairview Health Services), 5.00%, 11/15/34 | | | 500 | | | | 606,210 | |
| | |
St. Paul Housing and Redevelopment Authority, (HealthPartners Obligated Group), 5.00%, 7/1/29 | | | 500 | | | | 586,200 | |
| | |
St. Paul Housing and Redevelopment Authority, (HealthPartners Obligated Group), 5.00%, 7/1/30 | | | 1,000 | | | | 1,164,370 | |
| | |
St. Paul Housing and Redevelopment Authority, (HealthPartners Obligated Group), 5.00%, 7/1/32 | | | 1,995 | | | | 2,290,579 | |
| |
| | | | $ | 20,670,998 | |
|
| Housing — 0.5% | |
| | |
Minnesota Housing Finance Agency, (FHLMC), (FNMA), (GNMA), 3.15%, 1/1/37 | | $ | 835 | | | $ | 851,959 | |
| |
| | | | $ | 851,959 | |
| | | | |
| | 25 | | See Notes to Financial Statements. |
Eaton Vance
Minnesota Municipal Income Fund
July 31, 2019
Portfolio of Investments — continued
| | | | | | | | |
| Security | | Principal
Amount
(000’s omitted) | | | Value | |
|
| Insured – Electric Utilities — 6.4% | |
| | |
Puerto Rico Electric Power Authority, (NPFG), 5.25%, 7/1/32 | | $ | 1,150 | | | $ | 1,222,623 | |
| | |
Puerto Rico Electric Power Authority, (NPFG), 5.25%, 7/1/35 | | | 305 | | | | 322,046 | |
| | |
Southern Minnesota Municipal Power Agency, (NPFG), 0.00%, 1/1/25 | | | 9,000 | | | | 8,265,240 | |
| |
| | | | $ | 9,809,909 | |
|
| Insured – Hospital — 4.2% | |
| | |
Minneapolis and St. Paul Housing and Redevelopment Authority, (Children’s Hospitals and Clinics), (AGM), 5.00%, 8/15/34 | | $ | 750 | | | $ | 775,778 | |
| | |
Minneapolis and St. Paul Housing and Redevelopment Authority, (Children’s Hospitals and Clinics), (AGM), (SPA: U.S. Bank, N.A.), 0.77%, 8/15/25(2) | | | 1,975 | | | | 1,975,000 | |
| | |
Minneapolis and St. Paul Housing and Redevelopment Authority, (Children’s Hospitals and Clinics), (AGM), (SPA: U.S. Bank, N.A.), 0.77%, 8/15/37(2) | | | 3,635 | | | | 3,635,000 | |
| |
| | | | $ | 6,385,778 | |
|
| Lease Revenue / Certificates of Participation — 1.7% | |
| | |
Anoka-Hennepin Independent School District No. 11, 5.00%, 2/1/34 | | $ | 1,000 | | | $ | 1,140,400 | |
| | |
Minnesota, 5.00%, 6/1/29 | | | 1,335 | | | | 1,518,616 | |
| |
| | | | $ | 2,659,016 | |
|
| Other Revenue — 1.9% | |
| | |
Center City, (Hazelden Betty Ford Foundation), 4.00%, 11/1/28 | | $ | 825 | | | $ | 902,542 | |
| | |
Center City, (Hazelden Betty Ford Foundation), 4.00%, 11/1/34(1) | | | 500 | | | | 559,240 | |
| | |
Center City, (Hazelden Betty Ford Foundation), 5.00%, 11/1/27 | | | 400 | | | | 459,512 | |
| | |
Center City, (Hazelden Betty Ford Foundation), 5.00%, 11/1/29 | | | 300 | | | | 341,505 | |
| | |
Minneapolis, (YMCA of the Greater Twin Cities), 4.00%, 6/1/29 | | | 260 | | | | 287,323 | |
| | |
Minneapolis, (YMCA of the Greater Twin Cities), 4.00%, 6/1/30 | | | 250 | | | | 274,760 | |
| | |
Minneapolis, (YMCA of the Greater Twin Cities), 4.00%, 6/1/31 | | | 100 | | | | 109,332 | |
| |
| | | | $ | 2,934,214 | |
|
| Senior Living / Life Care — 3.3% | |
| | |
Apple Valley, (PHS Apple Valley Senior Housing, Inc.), 5.00%, 9/1/43 | | $ | 1,000 | | | $ | 1,077,890 | |
| | |
North Oaks, (Waverly Gardens), 4.00%, 10/1/25 | | | 1,600 | | | | 1,734,368 | |
| | |
North Oaks, (Waverly Gardens), 4.00%, 10/1/26 | | | 1,680 | | | | 1,823,186 | |
| | |
Wayzata, (Folkestone Senior Living Community), 4.00%, 8/1/44(1) | | | 435 | | | | 441,908 | |
| |
| | | | $ | 5,077,352 | |
| | | | | | | | |
| Security | | Principal
Amount
(000’s omitted) | | | Value | |
|
| Transportation — 2.2% | |
| | |
Minneapolis-St. Paul Metropolitan Airports Commission, 5.00%, 1/1/27 | | $ | 1,000 | | | $ | 1,250,000 | |
| | |
Minneapolis-St. Paul Metropolitan Airports Commission, Series 2010A, 5.00%, 1/1/35 | | | 1,000 | | | | 1,015,380 | |
| | |
Minneapolis-St. Paul Metropolitan Airports Commission, Series 2014A, 5.00%, 1/1/35 | | | 1,000 | | | | 1,137,350 | |
| |
| | | | $ | 3,402,730 | |
| |
TotalTax-Exempt Investments — 100.4%
(identified cost $146,149,117) | | | $ | 153,932,479 | |
| |
Other Assets, Less Liabilities — (0.4)% | | | $ | (683,923 | ) |
| |
Net Assets — 100.0% | | | $ | 153,248,556 | |
The percentage shown for each investment category in the Portfolio of Investments is based on net assets.
The Fund invests primarily in debt securities issued by Minnesota municipalities. The ability of the issuers of the debt securities to meet their obligations may be affected by economic developments in a specific industry or municipality. In order to reduce the risk associated with such economic developments, at July 31, 2019, 10.5% of total investments are backed by bond insurance of various financial institutions and financial guaranty assurance agencies. The aggregate percentage insured by an individual financial institution or financial guaranty assurance agency ranged from 4.1% to 6.4% of total investments.
| (1) | When-issued security. |
| (2) | Variable rate demand obligation that may be tendered at par on any day for payment the same or next business day. The stated interest rate, which generally resets daily, is determined by the remarketing agent and represents the rate in effect at July 31, 2019. |
Abbreviations:
| | | | |
| | |
| AGM | | – | | Assured Guaranty Municipal Corp. |
| | |
| AMT | | – | | Interest earned from these securities may be considered a tax preference item for purposes of the Federal Alternative Minimum Tax. |
| | |
| FHLMC | | – | | Federal Home Loan Mortgage Corp. |
| | |
| FNMA | | – | | Federal National Mortgage Association |
| | |
| GNMA | | – | | Government National Mortgage Association |
| | |
| NPFG | | – | | National Public Finance Guarantee Corp. |
| | |
| SPA | | – | | Standby Bond Purchase Agreement |
| | | | |
| | 26 | | See Notes to Financial Statements. |
Eaton Vance
New Jersey Municipal Income Fund
July 31, 2019
Portfolio of Investments
| | | | | | | | |
| Tax-Exempt Municipal Securities — 97.6% | |
| Security | | Principal
Amount
(000’s omitted) | | | Value | |
|
| Bond Bank — 0.6% | |
| | |
New Jersey Infrastructure Bank, Green Bonds, 4.00%, 9/1/29 | | $ | 410 | | | $ | 506,932 | |
| | |
New Jersey Infrastructure Bank, Green Bonds, 4.00%, 9/1/30 | | | 420 | | | | 523,404 | |
| |
| | | | $ | 1,030,336 | |
|
| Education — 6.0% | |
| | |
New Jersey Educational Facilities Authority, (Montclair State University), 5.00%, 7/1/30 | | $ | 1,765 | | | $ | 2,030,756 | |
| | |
New Jersey Educational Facilities Authority, (Princeton University), 4.00%, 7/1/37 | | | 1,095 | | | | 1,264,013 | |
| | |
New Jersey Educational Facilities Authority, (Princeton University), 4.00%, 7/1/40 | | | 640 | | | | 733,146 | |
| | |
New Jersey Educational Facilities Authority, (Princeton University), 5.00%, 7/1/26 | | | 2,200 | | | | 2,602,710 | |
| | |
New Jersey Educational Facilities Authority, (Princeton University), 5.00%, 7/1/36 | | | 805 | | | | 996,896 | |
| | |
New Jersey Educational Facilities Authority, (Princeton University), 5.00%, 7/1/42 | | | 1,000 | | | | 1,221,020 | |
| | |
New Jersey Institute of Technology, 5.00%, 7/1/32 | | | 980 | | | | 1,070,317 | |
| |
| | | | $ | 9,918,858 | |
|
| Escrowed / Prerefunded — 2.6% | |
| | |
New Jersey Economic Development Authority, (The Seeing Eye, Inc.), Prerefunded to 6/1/22, 5.00%, 6/1/32 | | $ | 2,250 | | | $ | 2,489,197 | |
| | |
New Jersey Institute of Technology, Prerefunded to 7/1/22, 5.00%, 7/1/32 | | | 430 | | | | 478,349 | |
| | |
New Jersey Turnpike Authority, Prerefunded to 7/1/22, 5.00%, 1/1/30 | | | 1,215 | | | | 1,351,615 | |
| |
| | | | $ | 4,319,161 | |
|
| General Obligations — 15.3% | |
| | |
Bergen County, 3.00%, 7/15/29 | | $ | 3,560 | | | $ | 3,865,056 | |
| | |
Burlington County Bridge Commission, 5.00%, 8/1/27 | | | 400 | | | | 508,400 | |
| | |
Burlington County Bridge Commission, 5.00%, 8/1/30 | | | 500 | | | | 638,880 | |
| | |
Burlington County Bridge Commission, 5.00%, 8/1/31 | | | 410 | | | | 520,524 | |
| | |
Burlington County Bridge Commission, 5.00%, 8/1/32 | | | 250 | | | | 316,900 | |
| | |
Burlington County Bridge Commission, 5.00%, 10/1/36 | | | 1,000 | | | | 1,246,030 | |
| | |
East Brunswick Board of Education, 4.00%, 8/1/34 | | | 1,200 | | | | 1,408,344 | |
| | |
Gloucester County Improvement Authority, 4.00%, 4/1/35 | | | 3,320 | | | | 3,714,283 | |
| | |
Jersey City, 5.00%, 11/1/33 | | | 800 | | | | 970,312 | |
| | |
Monmouth County Improvement Authority, 4.00%, 8/1/30(1) | | | 750 | | | | 909,142 | |
| | |
Monmouth County Improvement Authority, 4.00%, 8/1/31(1) | | | 750 | | | | 897,292 | |
| | |
Monmouth County Improvement Authority, 4.00%, 8/1/32(1) | | | 400 | | | | 474,116 | |
| | |
Monmouth County Improvement Authority, 4.00%, 8/1/33(1) | | | 500 | | | | 587,525 | |
| | | | | | | | |
| Security | | Principal
Amount
(000’s omitted) | | | Value | |
|
| General Obligations (continued) | |
| | |
Monmouth County Improvement Authority, 4.00%, 8/1/34(1) | | $ | 650 | | | $ | 757,029 | |
| | |
Monmouth County Improvement Authority, 4.00%, 8/1/35(1) | | | 525 | | | | 606,349 | |
| | |
Monmouth County Improvement Authority, 4.00%, 8/1/36(1) | | | 500 | | | | 575,780 | |
| | |
Monmouth County Improvement Authority, 4.00%, 8/1/37(1) | | | 275 | | | | 315,584 | |
| | |
Monmouth County Improvement Authority, 4.00%, 8/1/38(1) | | | 250 | | | | 285,733 | |
| | |
Monmouth County Improvement Authority, 4.00%, 8/1/39(1) | | | 200 | | | | 227,890 | |
| | |
Morris County Improvement Authority, (Lincoln Park), 4.00%, 3/15/27 | | | 700 | | | | 816,676 | |
| | |
New Jersey, 4.00%, 6/1/30 | | | 3,000 | | | | 3,258,540 | |
| | |
Ocean County, 4.00%, 9/1/29 | | | 480 | | | | 571,066 | |
| | |
Ocean County, 5.00%, 9/1/27 | | | 1,305 | | | | 1,676,560 | |
| |
| | | | $ | 25,148,011 | |
|
| Hospital — 12.9% | |
| | |
Camden County Improvement Authority, (Cooper Health System), 5.00%, 2/15/35 | | $ | 750 | | | $ | 826,688 | |
| | |
Camden County Improvement Authority, (Cooper Health System), 5.75%, 2/15/42 | | | 1,100 | | | | 1,226,929 | |
| | |
New Jersey Health Care Facilities Financing Authority, (AHS Hospital Corp.), 4.00%, 7/1/41 | | | 1,500 | | | | 1,617,990 | |
| | |
New Jersey Health Care Facilities Financing Authority, (AHS Hospital Corp.), 5.00%, 7/1/27 | | | 175 | | | | 175,590 | |
| | |
New Jersey Health Care Facilities Financing Authority, (Inspira Health Obligated Group), 4.00%, 7/1/47 | | | 420 | | | | 452,962 | |
| | |
New Jersey Health Care Facilities Financing Authority, (Inspira Health Obligated Group), 5.00%, 7/1/36 | | | 215 | | | | 254,732 | |
| | |
New Jersey Health Care Facilities Financing Authority, (Princeton HealthCare System), 5.00%, 7/1/32 | | | 1,415 | | | | 1,698,396 | |
| | |
New Jersey Health Care Facilities Financing Authority, (Princeton HealthCare System), 5.00%, 7/1/39 | | | 2,750 | | | | 3,267,110 | |
| | |
New Jersey Health Care Facilities Financing Authority, (Robert Wood Johnson University Hospital), 5.00%, 7/1/32 | | | 400 | | | | 461,656 | |
| | |
New Jersey Health Care Facilities Financing Authority, (Robert Wood Johnson University Hospital), 5.00%, 7/1/33 | | | 1,155 | | | | 1,331,634 | |
| | |
New Jersey Health Care Facilities Financing Authority, (RWJ Barnabas Health Obligated Group), 5.00%, 7/1/31 | | | 2,575 | | | | 3,115,492 | |
| | |
New Jersey Health Care Facilities Financing Authority, (RWJ Barnabas Health Obligated Group), 5.00%, 7/1/33 | | | 300 | | | | 360,864 | |
| | |
New Jersey Health Care Facilities Financing Authority, (St. Joseph’s Healthcare System Obligated Group), 3.00%, 7/1/32 | | | 250 | | | | 248,528 | |
| | |
New Jersey Health Care Facilities Financing Authority, (St. Joseph’s Healthcare System Obligated Group), 4.00%, 7/1/34 | | | 1,135 | | | | 1,230,907 | |
| | |
New Jersey Health Care Facilities Financing Authority, (St. Joseph’s Healthcare System Obligated Group), 4.00%, 7/1/48 | | | 3,000 | | | | 3,173,310 | |
| | | | |
| | 27 | | See Notes to Financial Statements. |
Eaton Vance
New Jersey Municipal Income Fund
July 31, 2019
Portfolio of Investments — continued
| | | | | | | | |
| Security | | Principal
Amount
(000’s omitted) | | | Value | |
|
| Hospital (continued) | |
| | |
New Jersey Health Care Facilities Financing Authority, (Trinitas Regional Medical Center Obligated Group), 5.00%, 7/1/28 | | $ | 1,000 | | | $ | 1,184,760 | |
| | |
New Jersey Health Care Facilities Financing Authority, (Trinitas Regional Medical Center Obligated Group), 5.00%, 7/1/29 | | | 500 | | | | 590,610 | |
| |
| | | | $ | 21,218,158 | |
|
| Housing — 1.9% | |
| | |
New Jersey Housing and Mortgage Finance Agency, SFMR, (AMT), 3.80%, 10/1/32 | | $ | 3,000 | | | $ | 3,179,970 | |
| |
| | | | $ | 3,179,970 | |
|
| Industrial Development Revenue — 6.3% | |
| | |
New Jersey Economic Development Authority, (Continental Airlines), (AMT), 5.50%, 6/1/33 | | $ | 1,875 | | | $ | 2,096,269 | |
| | |
New Jersey Economic Development Authority, (Continental Airlines), Series 2000A, (AMT), 5.625%, 11/15/30 | | | 255 | | | | 293,696 | |
| | |
New Jersey Economic Development Authority, (Continental Airlines), Series 2000B, (AMT), 5.625%, 11/15/30 | | | 430 | | | | 495,252 | |
| | |
New Jersey Economic Development Authority, (New Jersey-American Water Co., Inc.), (AMT), 5.70%, 10/1/39 | | | 4,370 | | | | 4,398,886 | |
| | |
New Jersey Economic Development Authority, (New Jersey Natural Gas Co.), 3.375%, 4/1/38 | | | 3,000 | | | | 3,081,390 | |
| |
| | | | $ | 10,365,493 | |
|
| Insured – Electric Utilities — 2.5% | |
| | |
Puerto Rico Electric Power Authority, (NPFG), 5.25%, 7/1/34 | | $ | 3,935 | | | $ | 4,165,591 | |
| |
| | | | $ | 4,165,591 | |
|
| Insured – Escrowed / Prerefunded — 0.3% | |
| | |
New Jersey Economic Development Authority, (Motor Vehicle Surcharges), (NPFG), Escrowed to Maturity, 5.25%, 7/1/26 | | $ | 380 | | | $ | 477,508 | |
| |
| | | | $ | 477,508 | |
|
| Insured – General Obligations — 6.6% | |
| | |
Atlantic City, (AGM), 4.00%, 3/1/42 | | $ | 250 | | | $ | 269,258 | |
| | |
Atlantic City, (AGM), 5.00%, 3/1/37 | | | 1,500 | | | | 1,754,805 | |
| | |
Bayonne, (AGM), 5.00%, 8/1/25 | | | 615 | | | | 736,014 | |
| | |
Bayonne, (AGM), 5.00%, 8/1/26 | | | 865 | | | | 1,029,635 | |
| | |
East Orange, (AGM), 5.00%, 10/15/29 | | | 130 | | | | 168,758 | |
| | |
East Orange, (AGM), 5.00%, 10/15/30 | | | 175 | | | | 224,329 | |
| | |
East Orange, (AGM), 5.00%, 10/15/31 | | | 400 | | | | 508,152 | |
| | |
Irvington Township, (AGM), 0.00%, 7/15/23 | | | 4,045 | | | | 3,767,028 | |
| | |
Lakewood Township, (BAM), 4.00%, 11/1/26 | | | 250 | | | | 288,652 | |
| | | | | | | | |
| Security | | Principal
Amount
(000’s omitted) | | | Value | |
|
| Insured – General Obligations (continued) | |
| | |
Lakewood Township, (BAM), 4.00%, 11/1/27 | | $ | 120 | | | $ | 139,363 | |
| | |
Paterson, (BAM), 5.00%, 1/15/26 | | | 1,305 | | | | 1,435,487 | |
| | |
Trenton, (BAM), 5.00%, 12/1/26 | | | 500 | | | | 593,425 | |
| |
| | | | $ | 10,914,906 | |
|
| Insured – Special Tax Revenue — 9.7% | |
| | |
Garden State Preservation Trust, (AGM), 0.00%, 11/1/24 | | $ | 6,000 | | | $ | 5,510,820 | |
| | |
New Jersey Economic Development Authority, (Motor Vehicle Surcharges), (NPFG), 5.25%, 7/1/26 | | | 1,620 | | | | 1,940,258 | |
| | |
New Jersey Economic Development Authority, (Motor Vehicle Surcharges), (XLCA), 0.00%, 7/1/26 | | | 6,500 | | | | 5,479,110 | |
| | |
New Jersey Economic Development Authority, (Motor Vehicle Surcharges), (XLCA), 0.00%, 7/1/27 | | | 3,590 | | | | 2,926,352 | |
| |
| | | | $ | 15,856,540 | |
|
| Insured – Transportation — 1.9% | |
| | |
New Jersey Economic Development Authority, (The Goethals Bridge Replacement), (AGM), (AMT), 5.00%, 1/1/31 | | $ | 2,015 | | | $ | 2,252,649 | |
| | |
South Jersey Transportation Authority, (AGC), 5.50%, 11/1/33 | | | 850 | | | | 858,628 | |
| |
| | | | $ | 3,111,277 | |
|
| Other Revenue — 3.9% | |
| | |
Mercer County Improvement Authority, 4.00%, 4/1/32(1) | | $ | 2,000 | | | $ | 2,345,520 | |
| | |
Mercer County Improvement Authority, 4.00%, 3/15/40 | | | 1,365 | | | | 1,551,350 | |
| | |
Mercer County Improvement Authority, 5.00%, 4/1/34(1) | | | 1,000 | | | | 1,276,540 | |
| | |
New Jersey Economic Development Authority, (The Seeing Eye, Inc.), 5.00%, 6/1/32 | | | 1,000 | | | | 1,218,740 | |
| |
| | | | $ | 6,392,150 | |
|
| Senior Living / Life Care — 2.4% | |
| | |
New Jersey Economic Development Authority, (United Methodist Homes of New Jersey), 5.00%, 7/1/29 | | $ | 1,250 | | | $ | 1,356,850 | |
| | |
New Jersey Economic Development Authority, (United Methodist Homes of New Jersey), 5.00%, 7/1/34 | | | 2,450 | | | | 2,567,722 | |
| |
| | | | $ | 3,924,572 | |
|
| Student Loan — 5.3% | |
| | |
New Jersey Higher Education Student Assistance Authority, (AMT), 3.25%, 12/1/29 | | $ | 2,000 | | | $ | 2,097,880 | |
| | |
New Jersey Higher Education Student Assistance Authority, (AMT), 3.35%, 12/1/29 | | | 2,675 | | | | 2,793,235 | |
| | |
New Jersey Higher Education Student Assistance Authority, (AMT), 3.47%, (3 mo. USD LIBOR + 0.95%), 6/1/36(2) | | | 2,690 | | | | 2,696,268 | |
| | | | |
| | 28 | | See Notes to Financial Statements. |
Eaton Vance
New Jersey Municipal Income Fund
July 31, 2019
Portfolio of Investments — continued
| | | | | | | | |
| Security | | Principal
Amount
(000’s omitted) | | | Value | |
|
| Student Loan (continued) | |
| | |
New Jersey Higher Education Student Assistance Authority, (AMT), 4.00%, 12/1/34 | | $ | 950 | | | $ | 1,034,322 | |
| |
| | | | $ | 8,621,705 | |
|
| Transportation — 19.4% | |
| | |
Delaware River Port Authority of Pennsylvania and New Jersey, 5.00%, 1/1/28 | | $ | 2,000 | | | $ | 2,299,960 | |
| | |
Delaware River Port Authority of Pennsylvania and New Jersey, 5.00%, 1/1/33 | | | 1,000 | | | | 1,258,440 | |
| | |
Delaware River Port Authority of Pennsylvania and New Jersey, 5.00%, 1/1/35 | | | 2,270 | | | | 2,827,557 | |
| | |
Delaware River Port Authority of Pennsylvania and New Jersey, 5.00%, 1/1/36 | | | 1,250 | | | | 1,552,450 | |
| | |
New Jersey Economic Development Authority, (Port Newark Container Terminal, LLC), (AMT), 5.00%, 10/1/37 | | | 1,500 | | | | 1,707,435 | |
| | |
New Jersey Economic Development Authority, (The Goethals Bridge Replacement), (AMT), 5.375%, 1/1/43 | | | 275 | | | | 307,720 | |
| | |
New Jersey Transportation Trust Fund Authority, 5.00%, 6/15/38 | | | 3,220 | | | | 3,714,431 | |
| | |
New Jersey Turnpike Authority, 4.00%, 1/1/43 | | | 865 | | | | 951,085 | |
| | |
New Jersey Turnpike Authority, 4.00%, 1/1/48 | | | 3,040 | | | | 3,353,272 | |
| | |
New Jersey Turnpike Authority, 5.00%, 1/1/45 | | | 2,780 | | | | 3,167,226 | |
| | |
Newark Housing Authority, (Newark Marine Terminal), 4.00%, 1/1/37 | | | 1,500 | | | | 1,668,030 | |
| | |
Port Authority of New York and New Jersey, (AMT), 5.00%, 10/15/34 | | | 4,185 | | | | 4,911,474 | |
| | |
Port Authority of New York and New Jersey, (AMT), 5.00%, 10/15/35 | | | 2,530 | | | | 3,019,884 | |
| | |
South Jersey Transportation Authority, 5.00%, 11/1/31 | | | 1,000 | | | | 1,134,740 | |
| |
| | | | $ | 31,873,704 | |
| |
TotalTax-Exempt Municipal Securities — 97.6%
(identified cost $148,594,802) | | | $ | 160,517,940 | |
|
| Taxable Municipal Securities — 3.4% | |
| Security | | Principal
Amount
(000’s omitted) | | | Value | |
|
| General Obligations — 0.4% | |
| | |
Atlantic City, 7.50%, 3/1/40 | | $ | 445 | | | $ | 631,918 | |
| |
| | | | $ | 631,918 | |
| | | | | | | | |
| Security | | Principal
Amount
(000’s omitted) | | | Value | |
|
| Transportation — 3.0% | |
| | |
New Jersey Transportation Trust Fund Authority, 5.754%, 12/15/28(3) | | $ | 4,250 | | | $ | 4,898,338 | |
| |
| | | | $ | 4,898,338 | |
| |
Total Taxable Municipal Securities — 3.4%
(identified cost $5,086,065) | | | $ | 5,530,256 | |
|
| Trust Units — 0.1% | |
| Security | | Notional
Amount
(000’s omitted) | | | Value | |
|
| Insured – Special Tax Revenue — 0.1% | |
| | |
COFINA Series 2007A Senior Bonds Due 2045 National Custodial Trust(non-taxable), 8/1/45(4) | | $ | 332 | | | $ | 241,821 | |
| | |
COFINA Series 2007A Senior Bonds Due 2045 National Custodial Trust (taxable), 8/1/45(4) | | | 109 | | | | 15,050 | |
| |
Total Trust Units — 0.1%
(identified cost $256,420) | | | $ | 256,871 | |
| |
Total Investments — 101.1%
(identified cost $153,937,287) | | | $ | 166,305,067 | |
| |
Other Assets, Less Liabilities — (1.1)% | | | $ | (1,798,376 | ) |
| |
Net Assets — 100.0% | | | $ | 164,506,691 | |
The percentage shown for each investment category in the Portfolio of Investments is based on net assets.
The Fund invests primarily in debt securities issued by New Jersey municipalities. The ability of the issuers of the debt securities to meet their obligations may be affected by economic developments in a specific industry or municipality. In order to reduce the risk associated with such economic developments, at July 31, 2019, 20.9% of total investments are backed by bond insurance of various financial institutions and financial guaranty assurance agencies. The aggregate percentage insured by an individual financial institution or financial guaranty assurance agency ranged from 0.5% to 9.8% of total investments.
| (1) | When-issued security. |
| (2) | Floating rate security. The stated interest rate represents the rate in effect at July 31, 2019. |
| (3) | Build America Bond. Represents taxable municipal obligation issued pursuant to the American Recovery and Reinvestment Act of 2009 or other legislation providing for the issuance of taxable municipal debt on which the issuer receives federal support. |
| | | | |
| | 29 | | See Notes to Financial Statements. |
Eaton Vance
New Jersey Municipal Income Fund
July 31, 2019
Portfolio of Investments — continued
| (4) | Security was received in connection with the restructuring of an insuredzero-coupon bond issued by the Puerto Rico Sales Tax Financing Corporation (“COFINA”) (the “Original Bond”). The notional amount of the combined taxable andtax-exempt trust units reflects the accreted amount of the Original Bond from original issuance through the restructuring date. Each trust certificate represents an ownership interest in various coupon paying andzero-coupon COFINA bonds and potential insurance payments pursuant to an insurance policy with National Public Finance Guarantee Corporation. The trust units have no stated coupon interest rate but accrete income to maturity at the annual rate of approximately 5.04%, the same rate as the Original Bond. |
Abbreviations:
| | | | |
| | |
| AGC | | – | | Assured Guaranty Corp. |
| | |
| AGM | | – | | Assured Guaranty Municipal Corp. |
| | |
| AMT | | – | | Interest earned from these securities may be considered a tax preference item for purposes of the Federal Alternative Minimum Tax. |
| | |
| BAM | | – | | Build America Mutual Assurance Co. |
| | |
| LIBOR | | – | | London Interbank Offered Rate |
| | |
| NPFG | | – | | National Public Finance Guarantee Corp. |
| | |
| SFMR | | – | | Single Family Mortgage Revenue |
| | |
| XLCA | | – | | XL Capital Assurance, Inc. |
|
Currency Abbreviations: |
| | |
| USD | | – | | United States Dollar |
| | | | |
| | 30 | | See Notes to Financial Statements. |
Eaton Vance
Pennsylvania Municipal Income Fund
July 31, 2019
Portfolio of Investments
| | | | | | | | |
| Tax-Exempt Municipal Securities — 99.7% | |
| Security | | Principal
Amount
(000’s omitted) | | | Value | |
|
| Cogeneration — 0.2% | |
| | |
Northampton County Industrial Development Authority, (Northampton Generating), (AMT), 5.00%, 12/31/23(1) | | $ | 1,323 | | | $ | 397,030 | |
| |
| | | | $ | 397,030 | |
|
| Education — 12.6% | |
| | |
Allegheny County Higher Education Building Authority, (Carnegie Mellon University), 5.00%, 8/1/27 | | $ | 1,665 | | | $ | 2,121,993 | |
| | |
Bucks County Industrial Development Authority, (George School), 5.00%, 9/15/34 | | | 1,000 | | | | 1,004,220 | |
| | |
Cumberland County Municipal Authority, (Dickinson College), 5.00%, 5/1/30 | | | 775 | | | | 928,070 | |
| | |
Cumberland County Municipal Authority, (Dickinson College), 5.00%, 5/1/31 | | | 1,145 | | | | 1,360,168 | |
| | |
Cumberland County Municipal Authority, (Dickinson College), 5.00%, 11/1/37 | | | 1,000 | | | | 1,100,220 | |
| | |
Delaware County Authority, (Haverford College), 5.00%, 10/1/42 | | | 1,470 | | | | 1,738,819 | |
| | |
Delaware County Authority, (Villanova University), 5.00%, 8/1/40 | | | 1,120 | | | | 1,301,104 | |
| | |
Northeastern Pennsylvania Hospital and Education Authority, (Wilkes University), 5.00%, 3/1/24 | | | 1,055 | | | | 1,172,949 | |
| | |
Northeastern Pennsylvania Hospital and Education Authority, (Wilkes University), 5.00%, 3/1/25 | | | 510 | | | | 575,979 | |
| | |
Pennsylvania Higher Educational Facilities Authority, (Drexel University), 4.00%, 5/1/36 | | | 4,000 | | | | 4,272,240 | |
| | |
Pennsylvania State University, 5.00%, 9/1/34 | | | 1,585 | | | | 1,915,742 | |
| | |
Philadelphia Industrial Development Authority, (La Salle University), 5.00%, 5/1/29 | | | 795 | | | | 937,734 | |
| | |
State Public School Building Authority, (Northampton County Area Community College), 5.50%, 3/1/31 | | | 2,645 | | | | 2,802,986 | |
| | |
Union County Higher Educational Facilities Financing Authority, (Bucknell University), 5.00%, 4/1/37 | | | 2,000 | | | | 2,171,800 | |
| |
| | | | $ | 23,404,024 | |
|
| Escrowed / Prerefunded — 10.4% | |
| | |
Chester County Health and Education Facilities Authority, (Jefferson Health System), Prerefunded to 5/15/20, 5.00%, 5/15/40 | | $ | 2,170 | | | $ | 2,235,339 | |
| | |
Delaware County Regional Water Quality Control Authority, Prerefunded to 5/1/23, 5.00%, 5/1/33 | | | 1,750 | | | | 1,997,765 | |
| | |
Delaware River Port Authority of Pennsylvania and New Jersey, Prerefunded to 1/1/20, 5.00%, 1/1/35 | | | 775 | | | | 787,663 | |
| | |
Delaware River Port Authority of Pennsylvania and New Jersey, Prerefunded to 1/1/20, 5.00%, 1/1/40 | | | 415 | | | | 421,781 | |
| | | | | | | | |
| Security | | Principal
Amount
(000’s omitted) | | | Value | |
|
| Escrowed / Prerefunded (continued) | |
| | |
Franklin County Industrial Development Authority, (The Chambersburg Hospital), Prerefunded to 7/1/20, 5.375%, 7/1/42 | | $ | 1,000 | | | $ | 1,038,200 | |
| | |
Pennsylvania Turnpike Commission, Prerefunded to 12/1/20, 5.45%, 12/1/35 | | | 4,220 | | | | 4,461,173 | |
| | |
South Fork Municipal Authority, (Conemaugh Health System), Prerefunded to 7/1/20, 5.50%, 7/1/29 | | | 1,500 | | | | 1,558,290 | |
| | |
Southeastern Pennsylvania Transportation Authority, Federal Grant Receipts, Prerefunded to 6/1/21, 5.00%, 6/1/28 | | | 600 | | | | 642,168 | |
| | |
Washington County Industrial Development Authority, (Washington and Jefferson College), Prerefunded to 5/1/20, 5.25%, 11/1/30 | | | 2,300 | | | | 2,371,852 | |
| | |
Westmoreland County Municipal Authority, Prerefunded to 8/15/23, 5.00%, 8/15/32 | | | 2,345 | | | | 2,701,065 | |
| | |
Wilkes-Barre Finance Authority, (University of Scranton), Prerefunded to 11/1/20, 5.00%, 11/1/35 | | | 1,000 | | | | 1,047,390 | |
| |
| | | | $ | 19,262,686 | |
|
| General Obligations — 7.3% | |
| | |
Allegheny County, 5.00%, 11/1/43 | | $ | 1,000 | | | $ | 1,210,050 | |
| | |
Boyertown Area School District, 5.00%, 10/1/38 | | | 1,000 | | | | 1,126,770 | |
| | |
Chartiers Valley School District, 5.00%, 10/15/35 | | | 1,000 | | | | 1,159,270 | |
| | |
Delaware Valley Regional Finance Authority, 5.75%, 7/1/32 | | | 4,500 | | | | 6,222,690 | |
| | |
Hatboro-Horsham School District, 5.00%, 9/15/27 | | | 1,100 | | | | 1,244,111 | |
| | |
Marple Newtown School District, 4.00%, 6/1/33 | | | 500 | | | | 579,855 | |
| | |
Marple Newtown School District, 4.00%, 6/1/34 | | | 350 | | | | 405,101 | |
| | |
Owen J. Roberts School District, 5.00%, 5/15/28 | | | 535 | | | | 606,904 | |
| | |
Seneca Valley School District, 5.00%, 4/1/31 | | | 750 | | | | 939,637 | |
| |
| | | | $ | 13,494,388 | |
|
| Hospital — 11.8% | |
| | |
Allegheny County Hospital Development Authority, (University of Pittsburgh Medical Center), 5.50%, 8/15/34 | | $ | 3,000 | | | $ | 3,004,770 | |
| | |
Allegheny County Hospital Development Authority, (UPMC Health System), 5.00%, 7/15/33 | | | 1,000 | | | | 1,255,050 | |
| | |
Centre County Hospital Authority, (Mount Nittany Medical Center), 5.00%, 11/15/30 | | | 505 | | | | 596,733 | |
| | |
Chester County Health and Education Facilities Authority, (Jefferson Health System), Prerefunded to 5/15/20, 5.00%, 5/15/40 | | | 770 | | | | 793,493 | |
| | |
Chester County Health and Education Facilities Authority, (Main Line Health System), 5.00%, 10/1/31 | | | 1,350 | | | | 1,665,373 | |
| | |
Indiana County Hospital Authority, (Indiana Regional Medical Center), 6.00%, 6/1/39 | | | 1,345 | | | | 1,477,442 | |
| | |
Lancaster County Hospital Authority, (University of Pennsylvania Health System), 5.00%, 8/15/36 | | | 650 | | | | 769,633 | |
| | | | |
| | 31 | | See Notes to Financial Statements. |
Eaton Vance
Pennsylvania Municipal Income Fund
July 31, 2019
Portfolio of Investments — continued
| | | | | | | | |
| Security | | Principal
Amount
(000’s omitted) | | | Value | |
|
| Hospital (continued) | |
| | |
Lehigh County General Purpose Authority, (Lehigh Valley Health Network), 4.00%, 7/1/33 | | $ | 2,700 | | | $ | 2,829,465 | |
| | |
Lehigh County General Purpose Authority, (Lehigh Valley Health Network), 4.00%, 7/1/35 | | | 950 | | | | 1,010,468 | |
| | |
Montgomery County Higher Education and Health Authority, (Thomas Jefferson University Obligated Group), 4.00%, 9/1/34 | | | 1,000 | | | | 1,115,650 | |
| | |
Pennsylvania Higher Educational Facilities Authority, (University of Pennsylvania Health System), 4.00%, 8/15/42 | | | 150 | | | | 163,179 | |
| | |
Pennsylvania Higher Educational Facilities Authority, (University of Pennsylvania Health System), 5.00%, 8/15/37 | | | 2,600 | | | | 3,117,322 | |
| | |
Pennsylvania Higher Educational Facilities Authority, (UPMC Health System), 5.00%, 5/15/31 | | | 2,550 | | | | 2,621,068 | |
| | |
Philadelphia Hospitals and Higher Education Facilities Authority, (Children’s Hospital of Philadelphia), 5.00%, 7/1/28 | | | 190 | | | | 203,104 | |
| | |
Southcentral Pennsylvania General Authority, (WellSpan Health Obligated Group), 5.00%, 6/1/36 | | | 1,000 | | | | 1,235,720 | |
| |
| | | | $ | 21,858,470 | |
|
| Housing — 0.4% | |
| | |
Pennsylvania Higher Educational Facilities Authority, (University Properties, Inc.), 5.00%, 7/1/35 | | $ | 750 | | | $ | 845,010 | |
| |
| | | | $ | 845,010 | |
|
| Industrial Development Revenue — 1.5% | |
| | |
Luzerne County Industrial Development Authority, (Pennsylvania-American Water Co.), 5.50%, 12/1/39 | | $ | 1,200 | | | $ | 1,216,128 | |
| | |
Pennsylvania Economic Development Financing Authority, (Waste Management, Inc.), 2.15%, 11/1/21 | | | 1,500 | | | | 1,519,395 | |
| |
| | | | $ | 2,735,523 | |
|
| Insured – Electric Utilities — 1.0% | |
| | |
Puerto Rico Electric Power Authority, (NPFG), 5.25%, 7/1/34 | | $ | 1,475 | | | $ | 1,561,435 | |
| | |
Puerto Rico Electric Power Authority, (NPFG), 5.25%, 7/1/35 | | | 340 | | | | 359,003 | |
| |
| | | | $ | 1,920,438 | |
|
| Insured – Escrowed / Prerefunded — 11.7% | |
| | |
Erie School District, (NPFG), Escrowed to Maturity, 0.00%, 5/1/20 | | $ | 2,625 | | | $ | 2,600,483 | |
| | |
Erie School District, (NPFG), Escrowed to Maturity, 0.00%, 5/1/21 | | | 2,625 | | | | 2,565,780 | |
| | |
Erie School District, (NPFG), Escrowed to Maturity, 0.00%, 5/1/22 | | | 3,625 | | | | 3,494,391 | |
| | |
McKeesport Area School District, (AMBAC), Escrowed to Maturity, 0.00%, 10/1/25 | | | 2,320 | | | | 2,109,390 | |
| | | | | | | | |
| Security | | Principal
Amount
(000’s omitted) | | | Value | |
|
| Insured – Escrowed / Prerefunded (continued) | |
| | |
Westmoreland County Municipal Authority, Series A, (FGIC), Escrowed to Maturity, 0.00%, 8/15/20 | | $ | 5,780 | | | $ | 5,704,109 | |
| | |
Westmoreland County Municipal Authority, Series C, (FGIC), Escrowed to Maturity, 0.00%, 8/15/20 | | | 5,400 | | | | 5,329,098 | |
| |
| | | | $ | 21,803,251 | |
|
| Insured – General Obligations — 15.4% | |
| | |
Allentown City School District, (BAM), 5.00%, 6/1/31 | | $ | 500 | | | $ | 588,510 | |
| | |
Allentown City School District, (BAM), 5.00%, 6/1/32 | | | 1,000 | | | | 1,173,110 | |
| | |
Allentown City School District, (BAM), 5.00%, 6/1/33 | | | 1,000 | | | | 1,170,040 | |
| | |
Bethlehem Area School District, (BAM), 5.00%, 8/1/32 | | | 1,500 | | | | 1,763,370 | |
| | |
Cambria County, (BAM), 5.00%, 8/1/30 | | | 3,320 | | | | 3,799,375 | |
| | |
Coatesville Area School District, (AGM), 5.00%, 8/1/25 | | | 300 | | | | 355,632 | |
| | |
Elizabeth Forward School District, (NPFG), 0.00%, 9/1/21 | | | 2,170 | | | | 2,091,902 | |
| | |
Elizabeth Forward School District, (NPFG), 0.00%, 9/1/22 | | | 2,170 | | | | 2,052,538 | |
| | |
Elizabeth Forward School District, (NPFG), 0.00%, 9/1/23 | | | 2,170 | | | | 2,011,091 | |
| | |
Erie School District, (AGM), 4.00%, 4/1/33 | | | 1,000 | | | | 1,124,540 | |
| | |
Hazelton School District, (NPFG), 0.00%, 3/1/21 | | | 4,000 | | | | 3,884,960 | |
| | |
Hopewell School District, (AGM), 0.00%, 9/1/22 | | | 1,000 | | | | 949,050 | |
| | |
Hopewell School District, (AGM), 0.00%, 9/1/26 | | | 1,000 | | | | 866,790 | |
| | |
Lake-Lehman School District, (NPFG), 0.00%, 4/1/26 | | | 1,315 | | | | 1,154,267 | |
| | |
Luzerne County, (AGM), 5.00%, 11/15/29 | | | 1,000 | | | | 1,176,510 | |
| | |
McKeesport Area School District, (AGM), 5.00%, 3/1/38 | | | 60 | | | | 65,692 | |
| | |
McKeesport Area School District, (AMBAC), 0.00%, 10/1/25 | | | 1,100 | | | | 967,395 | |
| | |
Montour School District, (AGM), 5.00%, 4/1/32 | | | 1,000 | | | | 1,164,760 | |
| | |
Montour School District, (AGM), 5.00%, 4/1/33 | | | 1,960 | | | | 2,276,089 | |
| |
| | | | $ | 28,635,621 | |
|
| Insured – Hospital — 1.3% | |
| | |
Allegheny County Hospital Development Authority, (UPMC Health System), (NPFG), 6.00%, 7/1/24 | | $ | 2,000 | | | $ | 2,434,640 | |
| |
| | | | $ | 2,434,640 | |
|
| Insured – Lease Revenue / Certificates of Participation — 6.6% | |
| | |
State Public School Building Authority, (Philadelphia School District), (AGM), 5.50%, 6/1/28(2) | | $ | 6,250 | | | $ | 8,059,813 | |
| | |
State Public School Building Authority, (Philadelphia School District), (AGM), 5.50%, 6/1/28 | | | 3,250 | | | | 4,191,102 | |
| |
| | | | $ | 12,250,915 | |
|
| Insured – Special Tax Revenue — 1.1% | |
| | |
Puerto Rico Infrastructure Financing Authority, (BHAC), (FGIC), 5.50%, 7/1/20 | | $ | 2,000 | | | $ | 2,058,420 | |
| |
| | | | $ | 2,058,420 | |
| | | | |
| | 32 | | See Notes to Financial Statements. |
Eaton Vance
Pennsylvania Municipal Income Fund
July 31, 2019
Portfolio of Investments — continued
| | | | | | | | |
| Security | | Principal
Amount
(000’s omitted) | | | Value | |
|
| Insured – Transportation — 2.3% | |
| | |
Pennsylvania Turnpike Commission, (AGM), 6.375%, 12/1/38 | | $ | 2,000 | | | $ | 2,604,740 | |
| | |
Puerto Rico Highway and Transportation Authority, (AGC), 5.50%, 7/1/31 | | | 1,500 | | | | 1,698,555 | |
| |
| | | | $ | 4,303,295 | |
|
| Insured – Water and Sewer — 3.0% | |
| | |
Allegheny County Sanitary Authority, (BAM), 5.00%, 12/1/28 | | $ | 1,000 | | | $ | 1,137,850 | |
| | |
Pittsburgh Water and Sewer Authority, (AGM), 4.00%, 9/1/34 | | | 2,000 | | | | 2,271,020 | |
| | |
Westmoreland County Municipal Authority, (FGIC), 0.00%, 8/15/19 | | | 2,235 | | | | 2,233,704 | |
| |
| | | | $ | 5,642,574 | |
|
| Lease Revenue / Certificates of Participation — 2.0% | |
| | |
Bucks County Community College Authority, 5.00%, 6/15/38 | | $ | 605 | | | $ | 743,067 | |
| | |
Commonwealth Financing Authority, Tobacco Master Settlement Payment Revenue, 5.00%, 6/1/34 | | | 2,405 | | | | 2,910,627 | |
| |
| | | | $ | 3,653,694 | |
|
| Other Revenue — 0.6% | |
| | |
Allentown Neighborhood Improvement Zone Development Authority, (City Center Project), 5.00%, 5/1/42(3) | | $ | 1,000 | | | $ | 1,108,950 | |
| |
| | | | $ | 1,108,950 | |
|
| Senior Living / Life Care — 3.3% | |
| | |
Cumberland County Municipal Authority, (Diakon Lutheran Social Ministries), 5.00%, 1/1/31 | | $ | 500 | | | $ | 594,615 | |
| | |
Cumberland County Municipal Authority, (Diakon Lutheran Social Ministries), 5.00%, 1/1/39 | | | 2,000 | | | | 2,299,560 | |
| | |
Franklin County Industrial Development Authority, (Menno-Haven, Inc.), 5.00%, 12/1/33 | | | 455 | | | | 508,827 | |
| | |
Lancaster County Hospital Authority, (Brethren Village), 5.125%, 7/1/37 | | | 1,265 | | | | 1,366,921 | |
| | |
Lancaster Industrial Development Authority, (Garden Spot Village), 5.375%, 5/1/28 | | | 300 | | | | 328,128 | |
| | |
Montgomery County Industrial Development Authority, (Whitemarsh Continuing Care Retirement Community), 5.00%, 1/1/33 | | | 1,000 | | | | 1,062,920 | |
| |
| | | | $ | 6,160,971 | |
|
| Special Tax Revenue — 0.4% | |
| | |
Puerto Rico Sales Tax Financing Corp., 0.00%, 7/1/24 | | $ | 18 | | | $ | 15,440 | |
| | |
Puerto Rico Sales Tax Financing Corp., 0.00%, 7/1/27 | | | 34 | | | | 26,146 | |
| | |
Puerto Rico Sales Tax Financing Corp., 0.00%, 7/1/29 | | | 34 | | | | 23,943 | |
| | |
Puerto Rico Sales Tax Financing Corp., 0.00%, 7/1/31 | | | 43 | | | | 27,091 | |
| | |
Puerto Rico Sales Tax Financing Corp., 0.00%, 7/1/33 | | | 49 | | | | 27,547 | |
| | | | | | | | |
| Security | | Principal
Amount
(000’s omitted) | | | Value | |
|
| Special Tax Revenue (continued) | |
| | |
Puerto Rico Sales Tax Financing Corp., 0.00%, 7/1/46 | | $ | 463 | | | $ | 106,953 | |
| | |
Puerto Rico Sales Tax Financing Corp., 0.00%, 7/1/51 | | | 377 | | | | 64,263 | |
| | |
Puerto Rico Sales Tax Financing Corp., 4.50%, 7/1/34 | | | 36 | | | | 37,236 | |
| | |
Puerto Rico Sales Tax Financing Corp., 4.55%, 7/1/40 | | | 18 | | | | 18,056 | |
| | |
Puerto Rico Sales Tax Financing Corp., 4.75%, 7/1/53 | | | 132 | | | | 129,400 | |
| | |
Puerto Rico Sales Tax Financing Corp., 5.00%, 7/1/58 | | | 334 | | | | 334,818 | |
| |
| | | | $ | 810,893 | |
|
| Transportation — 4.2% | |
| | |
Delaware River Joint Toll Bridge Commission of Pennsylvania and New Jersey, 5.00%, 7/1/32 | | $ | 1,500 | | | $ | 1,844,430 | |
| | |
Pennsylvania Economic Development Financing Authority, (Amtrak), (AMT), 5.00%, 11/1/41 | | | 1,960 | | | | 2,114,742 | |
| | |
Pennsylvania Turnpike Commission, 5.00%, 12/1/37 | | | 1,500 | | | | 1,807,980 | |
| | |
Philadelphia, Airport Revenue, (AMT), 5.00%, 6/15/27 | | | 815 | | | | 865,400 | |
| | |
Philadelphia, Airport Revenue, (AMT), 5.00%, 7/1/37 | | | 1,000 | | | | 1,180,780 | |
| |
| | | | $ | 7,813,332 | |
|
| Water and Sewer — 2.6% | |
| | |
Chester Water Authority, 5.00%, 12/1/35 | | $ | 795 | | | $ | 926,223 | |
| | |
Pennsylvania Economic Development Financing Authority, (Pennsylvania-American Water Co.), 3.00%, 4/1/39 | | | 2,500 | | | | 2,531,100 | |
| | |
Philadelphia, Water and Wastewater Revenue, 5.00%, 1/1/36 | | | 1,250 | | | | 1,303,300 | |
| |
| | | | $ | 4,760,623 | |
| |
TotalTax-Exempt Municipal Securities — 99.7%
(identified cost $172,657,654) | | | $ | 185,354,748 | |
|
| Taxable Municipal Securities — 0.2% | |
| Security | | Principal
Amount
(000’s omitted) | | | Value | |
|
| Cogeneration — 0.1% | |
| | |
Northampton County Industrial Development Authority, (Northampton Generating), 5.00%, 12/31/23(1) | | $ | 320 | | | $ | 95,999 | |
| |
| | | | $ | 95,999 | |
|
| Special Tax Revenue — 0.1% | |
| | |
Puerto Rico Sales Tax Financing Corp., 4.55%, 7/1/40 | | $ | 183 | | | $ | 176,141 | |
| | |
Puerto Rico Sales Tax Financing Corp., 4.75%, 7/1/53 | | | 5 | | | | 4,707 | |
| | |
Puerto Rico Sales Tax Financing Corp., 5.00%, 7/1/58 | | | 73 | | | | 70,171 | |
| |
| | | | $ | 251,019 | |
| |
Total Taxable Municipal Securities — 0.2%
(identified cost $537,744) | | | $ | 347,018 | |
| | | | |
| | 33 | | See Notes to Financial Statements. |
Eaton Vance
Pennsylvania Municipal Income Fund
July 31, 2019
Portfolio of Investments — continued
| | | | | | | | |
| Trust Units — 0.1% | |
| Security | | Notional
Amount
(000’s omitted) | | | Value | |
|
| Insured – Special Tax Revenue — 0.1% | |
| | |
COFINA Series 2007A Senior Bonds Due 2045 National Custodial Trust(non-taxable), 8/1/45(4) | | $ | 300 | | | $ | 218,372 | |
| | |
COFINA Series 2007A Senior Bonds Due 2045 National Custodial Trust (taxable), 8/1/45(4) | | | 99 | | | | 13,591 | |
| |
Total Trust Units — 0.1%
(identified cost $231,555) | | | $ | 231,963 | |
| |
Total Investments — 100.0%
(identified cost $173,426,953) | | | $ | 185,933,729 | |
| |
Other Assets, Less Liabilities — 0.0%(5) | | | $ | 19,586 | |
| |
Net Assets — 100.0% | | | $ | 185,953,315 | |
The percentage shown for each investment category in the Portfolio of Investments is based on net assets.
The Fund invests primarily in debt securities issued by Pennsylvania municipalities. The ability of the issuers of the debt securities to meet their obligations may be affected by economic developments in a specific industry or municipality. In order to reduce the risk associated with such economic developments, at July 31, 2019, 42.6% of total investments are backed by bond insurance of various financial institutions and financial guaranty assurance agencies. The aggregate percentage insured by an individual financial institution or financial guaranty assurance agency ranged from 0.9% to 13.5% of total investments.
| (1) | Represents apayment-in-kind security which may pay interest in additional principal at the issuer’s discretion. |
| (2) | Security represents the municipal bond held by a trust that issues residual interest bonds (see Note 1H). |
| (3) | Security exempt from registration pursuant to Rule 144A under the Securities Act of 1933, as amended. These securities may be sold in certain transactions in reliance on an exemption from registration (normally to qualified institutional buyers). At July 31, 2019, the aggregate value of these securities is $1,108,950 or 0.6% of the Fund’s net assets. |
| (4) | Security was received in connection with the restructuring of an insuredzero-coupon bond issued by the Puerto Rico Sales Tax Financing Corporation (“COFINA”) (the “Original Bond”). The notional amount of the combined taxable andtax-exempt trust units reflects the accreted amount of the Original Bond from original issuance through the restructuring date. Each trust certificate represents an ownership interest in various coupon paying andzero-coupon COFINA bonds and potential insurance payments pursuant to an insurance policy with National Public Finance Guarantee Corporation. The trust units have no stated coupon interest rate but accrete income to maturity at the annual rate of approximately 5.04%, the same rate as the Original Bond. |
| (5) | Amount is less than 0.05%. |
Abbreviations:
| | | | |
| | |
| AGC | | – | | Assured Guaranty Corp. |
| | |
| AGM | | – | | Assured Guaranty Municipal Corp. |
| | |
| AMBAC | | – | | AMBAC Financial Group, Inc. |
| | |
| AMT | | – | | Interest earned from these securities may be considered a tax preference item for purposes of the Federal Alternative Minimum Tax. |
| | |
| BAM | | – | | Build America Mutual Assurance Co. |
| | |
| BHAC | | – | | Berkshire Hathaway Assurance Corp. |
| | |
| FGIC | | – | | Financial Guaranty Insurance Company |
| | |
| NPFG | | – | | National Public Finance Guarantee Corp. |
| | | | |
| | 34 | | See Notes to Financial Statements. |
Eaton Vance
Municipal Income Funds
July 31, 2019
Statements of Assets and Liabilities
| | | | | | | | | | | | |
| | | July 31, 2019 | |
| Assets | | Arizona Fund | | | Connecticut Fund | | | Minnesota Fund | |
| | | |
Investments — | | | | | | | | | | | | |
| | | |
Identified cost | | $ | 52,382,886 | | | $ | 71,228,992 | | | $ | 146,149,117 | |
| | | |
Unrealized appreciation | | | 4,606,324 | | | | 5,055,641 | | | | 7,783,362 | |
| | | |
Investments, at value | | $ | 56,989,210 | | | $ | 76,284,633 | | | $ | 153,932,479 | |
| | | |
Cash | | $ | 1,417,415 | | | $ | 2,613,388 | | | $ | 3,739,924 | |
| | | |
Deposits for derivatives collateral — financial futures contracts | | | 48,108 | | | | — | | | | — | |
| | | |
Interest receivable | | | 339,288 | | | | 534,660 | | | | 1,694,584 | |
| | | |
Receivable for investments sold | | | — | | | | — | | | | 375,000 | |
| | | |
Receivable for Fund shares sold | | | 54,917 | | | | 95,220 | | | | 95,468 | |
| | | |
Total assets | | $ | 58,848,938 | | | $ | 79,527,901 | | | $ | 159,837,455 | |
| |
| Liabilities | | | | |
| | | |
Payable for when-issued securities | | $ | — | | | $ | 1,149,200 | | | $ | 5,546,910 | |
| | | |
Payable for variation margin on open financial futures contracts | | | 19,354 | | | | — | | | | — | |
| | | |
Payable for Fund shares redeemed | | | 130,816 | | | | 105,197 | | | | 816,972 | |
| | | |
Distributions payable | | | 19,117 | | | | 32,277 | | | | 78,704 | |
| | | |
Payable to affiliates: | | | | | | | | | | | | |
| | | |
Investment adviser fee | | | 13,024 | | | | 19,644 | | | | 43,136 | |
| | | |
Distribution and service fees | | | 9,358 | | | | 12,617 | | | | 15,088 | |
| | | |
Accrued expenses | | | 63,017 | | | | 70,797 | | | | 88,089 | |
| | | |
Total liabilities | | $ | 254,686 | | | $ | 1,389,732 | | | $ | 6,588,899 | |
| | | |
Net Assets | | $ | 58,594,252 | | | $ | 78,138,169 | | | $ | 153,248,556 | |
| |
| Sources of Net Assets | | | | |
| | | |
Paid-in capital | | $ | 53,920,354 | | | $ | 73,969,743 | | | $ | 146,010,111 | |
| | | |
Distributable earnings | | | 4,673,898 | | | | 4,168,426 | | | | 7,238,445 | |
| | | |
Net Assets | | $ | 58,594,252 | | | $ | 78,138,169 | | | $ | 153,248,556 | |
| |
| Class A Shares | | | | |
| | | |
Net Assets | | $ | 34,703,877 | | | $ | 52,275,476 | | | $ | 57,812,230 | |
| | | |
Shares Outstanding | | | 3,559,663 | | | | 5,111,907 | | | | 6,016,546 | |
| | | |
Net Asset Value and Redemption Price Per Share | | | | | | | | | | | | |
| | | |
(net assets ÷ shares of beneficial interest outstanding) | | $ | 9.75 | | | $ | 10.23 | | | $ | 9.61 | |
| | | |
Maximum Offering Price Per Share | | | | | | | | | | | | |
| | | |
(100 ÷ 95.25 of net asset value per share) | | $ | 10.24 | | | $ | 10.74 | | | $ | 10.09 | |
| |
| Class C Shares | | | | |
| | | |
Net Assets | | $ | 4,278,623 | | | $ | 4,781,881 | | | $ | 6,595,441 | |
| | | |
Shares Outstanding | | | 394,616 | | | | 469,309 | | | | 638,195 | |
| | | |
Net Asset Value and Offering Price Per Share* | | | | | | | | | | | | |
| | | |
(net assets ÷ shares of beneficial interest outstanding) | | $ | 10.84 | | | $ | 10.19 | | | $ | 10.33 | |
| |
| Class I Shares | | | | |
| | | |
Net Assets | | $ | 19,611,752 | | | $ | 21,080,812 | | | $ | 88,840,885 | |
| | | |
Shares Outstanding | | | 2,011,696 | | | | 2,060,851 | | | | 9,245,044 | |
| | | |
Net Asset Value, Offering Price and Redemption Price Per Share | | | | | | | | | | | | |
| | | |
(net assets ÷ shares of beneficial interest outstanding) | | $ | 9.75 | | | $ | 10.23 | | | $ | 9.61 | |
On sales of $50,000 or more, the offering price of Class A shares is reduced.
| * | Redemption price per share is equal to the net asset value less any applicable contingent deferred sales charge. |
| | | | |
| | 35 | | See Notes to Financial Statements. |
Eaton Vance
Municipal Income Funds
July 31, 2019
Statements of Assets and Liabilities — continued
| | | | | | | | |
| | | July 31, 2019 | |
| Assets | | New Jersey Fund | | | Pennsylvania Fund | |
| | |
Investments — | | | | | | | | |
| | |
Identified cost | | $ | 153,937,287 | | | $ | 173,426,953 | |
| | |
Unrealized appreciation | | | 12,367,780 | | | | 12,506,776 | |
| | |
Investments, at value | | $ | 166,305,067 | | | $ | 185,933,729 | |
| | |
Cash | | $ | 6,633,683 | | | $ | 3,994,115 | |
| | |
Interest receivable | | | 1,046,492 | | | | 1,473,329 | |
| | |
Receivable for Fund shares sold | | | 132,196 | | | | 128,696 | |
| | |
Total assets | | $ | 174,117,438 | | | $ | 191,529,869 | |
| |
| Liabilities | | | | |
| | |
Payable for floating rate notes issued | | $ | — | | | $ | 4,999,975 | |
| | |
Payable for when-issued securities | | | 9,197,846 | | | | — | |
| | |
Payable for Fund shares redeemed | | | 171,791 | | | | 224,358 | |
| | |
Distributions payable | | | 59,080 | | | | 125,765 | |
| | |
Payable to affiliates: | | | | | | | | |
| | |
Investment adviser fee | | | 48,850 | | | | 58,916 | |
| | |
Distribution and service fees | | | 27,435 | | | | 31,363 | |
| | |
Interest expense and fees payable | | | — | | | | 21,512 | |
| | |
Accrued expenses | | | 105,745 | | | | 114,665 | |
| | |
Total liabilities | | $ | 9,610,747 | | | $ | 5,576,554 | |
| | |
Net Assets | | $ | 164,506,691 | | | $ | 185,953,315 | |
| |
| Sources of Net Assets | | | | |
| | |
Paid-in capital | | $ | 155,258,053 | | | $ | 186,114,321 | |
| | |
Distributable earnings (accumulated loss) | | | 9,248,638 | | | | (161,006 | ) |
| | |
Net Assets | | $ | 164,506,691 | | | $ | 185,953,315 | |
| |
| Class A Shares | | | | |
| | |
Net Assets | | $ | 101,282,969 | | | $ | 119,324,463 | |
| | |
Shares Outstanding | | | 10,687,228 | | | | 13,788,472 | |
| | |
Net Asset Value and Redemption Price Per Share | | | | | | | | |
| | |
(net assets ÷ shares of beneficial interest outstanding) | | $ | 9.48 | | | $ | 8.65 | |
| | |
Maximum Offering Price Per Share | | | | | | | | |
| | |
(100 ÷ 95.25 of net asset value per share) | | $ | 9.95 | | | $ | 9.08 | |
| |
| Class C Shares | | | | |
| | |
Net Assets | | $ | 12,202,350 | | | $ | 13,087,846 | |
| | |
Shares Outstanding | | | 1,233,945 | | | | 1,460,467 | |
| | |
Net Asset Value and Offering Price Per Share* | | | | | | | | |
| | |
(net assets ÷ shares of beneficial interest outstanding) | | $ | 9.89 | | | $ | 8.96 | |
| |
| Class I Shares | | | | |
| | |
Net Assets | | $ | 51,021,372 | | | $ | 53,541,006 | |
| | |
Shares Outstanding | | | 5,381,542 | | | | 6,162,934 | |
| | |
Net Asset Value, Offering Price and Redemption Price Per Share | | | | | | | | |
| | |
(net assets ÷ shares of beneficial interest outstanding) | | $ | 9.48 | | | $ | 8.69 | |
On sales of $50,000 or more, the offering price of Class A shares is reduced.
| * | Redemption price per share is equal to the net asset value less any applicable contingent deferred sales charge. |
| | | | |
| | 36 | | See Notes to Financial Statements. |
Eaton Vance
Municipal Income Funds
July 31, 2019
Statements of Operations
| | | | | | | | | | | | |
| | | Year Ended July 31, 2019 | |
| Investment Income | | Arizona Fund | | | Connecticut Fund | | | Minnesota Fund | |
| | | |
Interest | | $ | 1,827,141 | | | $ | 2,716,973 | | | $ | 4,308,584 | |
| | | |
Total investment income | | $ | 1,827,141 | | | $ | 2,716,973 | | | $ | 4,308,584 | |
| | | |
| Expenses | | | | | | | | | | | | |
| | | |
Investment adviser fee | | $ | 134,366 | | | $ | 219,792 | | | $ | 467,164 | |
| | | |
Distribution and service fees | | | | | | | | | | | | |
| | | |
Class A | | | 66,829 | | | | 104,692 | | | | 109,837 | |
| | | |
Class C | | | 43,372 | | | | 39,006 | | | | 72,987 | |
| | | |
Trustees’ fees and expenses | | | 3,344 | | | | 4,397 | | | | 7,816 | |
| | | |
Custodian fee | | | 28,609 | | | | 32,936 | | | | 45,963 | |
| | | |
Transfer and dividend disbursing agent fees | | | 17,624 | | | | 37,110 | | | | 62,741 | |
| | | |
Legal and accounting services | | | 46,630 | | | | 61,647 | | | | 53,460 | |
| | | |
Printing and postage | | | 7,743 | | | | 10,079 | | | | 14,411 | |
| | | |
Registration fees | | | 9,838 | | | | 1,102 | | | | 9,675 | |
| | | |
Miscellaneous | | | 17,550 | | | | 20,879 | | | | 38,615 | |
| | | |
Total expenses | | $ | 375,905 | | | $ | 531,640 | | | $ | 882,669 | |
| | | |
Net investment income | | $ | 1,451,236 | | | $ | 2,185,333 | | | $ | 3,425,915 | |
| | | |
| Realized and Unrealized Gain (Loss) | | | | | | | | | | | | |
| | | |
Net realized gain (loss) — | | | | | | | | | | | | |
| | | |
Investment transactions | | $ | 83,222 | | | $ | 23,454 | | | $ | (548,433 | ) |
| | | |
Financial futures contracts | | | (228,471 | ) | | | (48,818 | ) | | | — | |
| | | |
Net realized loss | | $ | (145,249 | ) | | $ | (25,364 | ) | | $ | (548,433 | ) |
| | | |
Change in unrealized appreciation (depreciation) — | | | | | | | | | | | | |
| | | |
Investments | | $ | 1,968,898 | | | $ | 1,997,434 | | | $ | 5,787,813 | |
| | | |
Financial futures contracts | | | (76,971 | ) | | | 7,116 | | | | — | |
| | | |
Net change in unrealized appreciation (depreciation) | | $ | 1,891,927 | | | $ | 2,004,550 | | | $ | 5,787,813 | |
| | | |
Net realized and unrealized gain | | $ | 1,746,678 | | | $ | 1,979,186 | | | $ | 5,239,380 | |
| | | |
Net increase in net assets from operations | | $ | 3,197,914 | | | $ | 4,164,519 | | | $ | 8,665,295 | |
| | | | |
| | 37 | | See Notes to Financial Statements. |
Eaton Vance
Municipal Income Funds
July 31, 2019
Statements of Operations — continued
| | | | | | | | |
| | | Year Ended July 31, 2019 | |
| Investment Income | | New Jersey Fund | | | Pennsylvania Fund | |
| | |
Interest | | $ | 5,930,146 | | | $ | 7,987,832 | |
| | |
Total investment income | | $ | 5,930,146 | | | $ | 7,987,832 | |
| | |
| Expenses | | | | | | | | |
| | |
Investment adviser fee | | $ | 555,793 | | | $ | 685,563 | |
| | |
Distribution and service fees | | | | | | | | |
| | |
Class A | | | 193,942 | | | | 225,611 | |
| | |
Class C | | | 139,777 | | | | 174,814 | |
| | |
Trustees’ fees and expenses | | | 8,854 | | | | 9,686 | |
| | |
Custodian fee | | | 50,473 | | | | 56,058 | |
| | |
Transfer and dividend disbursing agent fees | | | 71,834 | | | | 88,905 | |
| | |
Legal and accounting services | | | 64,677 | | | | 73,890 | |
| | |
Printing and postage | | | 18,057 | | | | 18,787 | |
| | |
Registration fees | | | 2,664 | | | | 2,053 | |
| | |
Interest expense and fees | | | — | | | | 121,133 | |
| | |
Miscellaneous | | | 27,526 | | | | 44,386 | |
| | |
Total expenses | | $ | 1,133,597 | | | $ | 1,500,886 | |
| | |
Net investment income | | $ | 4,796,549 | | | $ | 6,486,946 | |
| | |
| Realized and Unrealized Gain (Loss) | | | | | | | | |
| | |
Net realized gain (loss) — | | | | | | | | |
| | |
Investment transactions | | $ | 770,425 | | | $ | (1,031,627 | ) |
| | |
Net realized gain (loss) | | $ | 770,425 | | | $ | (1,031,627 | ) |
| | |
Change in unrealized appreciation (depreciation) — | | | | | | | | |
| | |
Investments | | $ | 6,091,450 | | | $ | 4,328,226 | |
| | |
Net change in unrealized appreciation (depreciation) | | $ | 6,091,450 | | | $ | 4,328,226 | |
| | |
Net realized and unrealized gain | | $ | 6,861,875 | | | $ | 3,296,599 | |
| | |
Net increase in net assets from operations | | $ | 11,658,424 | | | $ | 9,783,545 | |
| | | | |
| | 38 | | See Notes to Financial Statements. |
Eaton Vance
Municipal Income Funds
July 31, 2019
Statements of Changes in Net Assets
| | | | | | | | | | | | |
| | | Year Ended July 31, 2019 | |
| Increase (Decrease) in Net Assets | | Arizona Fund | | | Connecticut Fund | | | Minnesota Fund | |
| | | |
From operations — | | | | | | | | | | | | |
| | | |
Net investment income | | $ | 1,451,236 | | | $ | 2,185,333 | | | $ | 3,425,915 | |
| | | |
Net realized loss | | | (145,249 | ) | | | (25,364 | ) | | | (548,433 | ) |
| | | |
Net change in unrealized appreciation (depreciation) | | | 1,891,927 | | | | 2,004,550 | | | | 5,787,813 | |
| | | |
Net increase in net assets from operations | | $ | 3,197,914 | | | $ | 4,164,519 | | | $ | 8,665,295 | |
| | | |
Distributions to shareholders(1) — | | | | | | | | | | | | |
| | | |
Class A | | $ | (907,785 | ) | | $ | (1,547,637 | ) | | $ | (1,323,912 | ) |
| | | |
Class C | | | (89,877 | ) | | | (90,318 | ) | | | (129,275 | ) |
| | | |
Class I | | | (448,193 | ) | | | (539,292 | ) | | | (1,979,461 | ) |
| | | |
Total distributions to shareholders | | $ | (1,445,855 | ) | | $ | (2,177,247 | ) | | $ | (3,432,648 | ) |
| | | |
Transactions in shares of beneficial interest — | | | | | | | | | | | | |
| | | |
Proceeds from sale of shares | | | | | | | | | | | | |
| | | |
Class A | | $ | 4,054,232 | | | $ | 2,972,737 | | | $ | 9,543,073 | |
| | | |
Class C | | | 1,221,295 | | | | 1,528,112 | | | | 1,339,027 | |
| | | |
Class I | | | 9,733,737 | | | | 10,812,302 | | | | 46,325,094 | |
| | | |
Net asset value of shares issued to shareholders in payment of distributions declared | | | | | | | | | | | | |
| | | |
Class A | | | 803,656 | | | | 1,271,823 | | | | 1,206,122 | |
| | | |
Class C | | | 81,617 | | | | 65,486 | | | | 121,328 | |
| | | |
Class I | | | 360,688 | | | | 440,571 | | | | 1,229,852 | |
| | | |
Cost of shares redeemed | | | | | | | | | | | | |
| | | |
Class A | | | (5,611,258 | ) | | | (8,744,300 | ) | | | (13,685,326 | ) |
| | | |
Class C | | | (1,499,814 | ) | | | (970,621 | ) | | | (2,664,399 | ) |
| | | |
Class I | | | (4,323,582 | ) | | | (4,554,944 | ) | | | (35,431,198 | ) |
| | | |
Net asset value of shares converted | | | | | | | | | | | | |
| | | |
Class A | | | 681,734 | | | | 525,396 | | | | 1,931,924 | |
| | | |
Class C | | | (681,734 | ) | | | (525,396 | ) | | | (1,931,924 | ) |
| | | |
Net increase in net assets from Fund share transactions | | $ | 4,820,571 | | | $ | 2,821,166 | | | $ | 7,983,573 | |
| | | |
Net increase in net assets | | $ | 6,572,630 | | | $ | 4,808,438 | | | $ | 13,216,220 | |
| | | |
| Net Assets | | | | | | | | | | | | |
| | | |
At beginning of year | | $ | 52,021,622 | | | $ | 73,329,731 | | | $ | 140,032,336 | |
| | | |
At end of year | | $ | 58,594,252 | | | $ | 78,138,169 | | | $ | 153,248,556 | |
| (1) | The current year presentation of distributions conforms with the Disclosure Update and Simplification Rule issued by the Securities and Exchange Commission, effective November 5, 2018. |
| | | | |
| | 39 | | See Notes to Financial Statements. |
Eaton Vance
Municipal Income Funds
July 31, 2019
Statements of Changes in Net Assets — continued
| | | | | | | | |
| | | Year Ended July 31, 2019 | |
| Increase (Decrease) in Net Assets | | New Jersey Fund | | | Pennsylvania Fund | |
| | |
From operations — | | | | | | | | |
| | |
Net investment income | | $ | 4,796,549 | | | $ | 6,486,946 | |
| | |
Net realized gain (loss) | | | 770,425 | | | | (1,031,627 | ) |
| | |
Net change in unrealized appreciation (depreciation) | | | 6,091,450 | | | | 4,328,226 | |
| | |
Net increase in net assets from operations | | $ | 11,658,424 | | | $ | 9,783,545 | |
| | |
Distributions to shareholders(1) — | | | | | | | | |
| | |
Class A | | $ | (3,017,845 | ) | | $ | (4,156,808 | ) |
| | |
Class C | | | (349,912 | ) | | | (544,925 | ) |
| | |
Class I | | | (1,389,150 | ) | | | (1,842,914 | ) |
| | |
Total distributions to shareholders | | $ | (4,756,907 | ) | | $ | (6,544,647 | ) |
| | |
Transactions in shares of beneficial interest — | | | | | | | | |
| | |
Proceeds from sale of shares | | | | | | | | |
| | |
Class A | | $ | 6,169,179 | | | $ | 9,616,519 | |
| | |
Class C | | | 3,054,807 | | | | 1,357,859 | |
| | |
Class I | | | 30,859,873 | | | | 22,729,769 | |
| | |
Net asset value of shares issued to shareholders in payment of distributions declared | | | | | | | | |
| | |
Class A | | | 2,454,247 | | | | 3,664,398 | |
| | |
Class C | | | 299,220 | | | | 498,055 | |
| | |
Class I | | | 1,231,041 | | | | 806,641 | |
| | |
Cost of shares redeemed | | | | | | | | |
| | |
Class A | | | (14,754,860 | ) | | | (16,032,192 | ) |
| | |
Class C | | | (4,188,436 | ) | | | (4,532,346 | ) |
| | |
Class I | | | (15,510,554 | ) | | | (17,288,376 | ) |
| | |
Net asset value of shares converted | | | | | | | | |
| | |
Class A | | | 4,995,205 | | �� | | 7,448,310 | |
| | |
Class C | | | (4,995,205 | ) | | | (7,448,310 | ) |
| | |
Net increase in net assets from Fund share transactions | | $ | 9,614,517 | | | $ | 820,327 | |
| | |
Net increase in net assets | | $ | 16,516,034 | | | $ | 4,059,225 | |
| | |
| Net Assets | | | | | | | | |
| | |
At beginning of year | | $ | 147,990,657 | | | $ | 181,894,090 | |
| | |
At end of year | | $ | 164,506,691 | | | $ | 185,953,315 | |
| (1) | The current year presentation of distributions conforms with the Disclosure Update and Simplification Rule issued by the Securities and Exchange Commission, effective November 5, 2018. |
| | | | |
| | 40 | | See Notes to Financial Statements. |
Eaton Vance
Municipal Income Funds
July 31, 2019
Statements of Changes in Net Assets — continued
| | | | | | | | | | | | |
| | | Year Ended July 31, 2018 | |
| Increase (Decrease) in Net Assets | | Arizona Fund | | | Connecticut Fund | | | Minnesota Fund | |
| | | |
From operations — | | | | | | | | | | | | |
| | | |
Net investment income | | $ | 1,665,311 | | | $ | 2,469,682 | | | $ | 3,863,466 | |
| | | |
Net realized gain | | | 1,016,261 | | | | 537,029 | | | | 13,709 | |
| | | |
Net change in unrealized appreciation (depreciation) | | | (1,873,751 | ) | | | (2,411,565 | ) | | | (3,670,645 | ) |
| | | |
Net increase in net assets from operations | | $ | 807,821 | | | $ | 595,146 | | | $ | 206,530 | |
| | | |
Distributions to shareholders — | | | | | | | | | | | | |
| | | |
From net investment income | | | | | | | | | | | | |
| | | |
Class A | | $ | (1,111,031 | ) | | $ | (1,817,459 | ) | | $ | (1,516,851 | ) |
| | | |
Class B | | | (2,240 | ) | | | (7,106 | ) | | | (302 | ) |
| | | |
Class C | | | (128,976 | ) | | | (127,819 | ) | | | (198,516 | ) |
| | | |
Class I | | | (474,900 | ) | | | (502,942 | ) | | | (2,202,579 | ) |
| | | |
Total distributions to shareholders | | $ | (1,717,147 | ) | | $ | (2,455,326 | ) | | $ | (3,918,248 | ) |
| | | |
Transactions in shares of beneficial interest — | | | | | | | | | | | | |
| | | |
Proceeds from sale of shares | | | | | | | | | | | | |
| | | |
Class A | | $ | 2,357,932 | | | $ | 2,885,116 | | | $ | 5,869,861 | |
| | | |
Class B | | | — | | | | 2,905 | | | | — | |
| | | |
Class C | | | 718,197 | | | | 198,245 | | | | 1,331,136 | |
| | | |
Class I | | | 4,675,712 | | | | 4,790,993 | | | | 27,056,131 | |
| | | |
Net asset value of shares issued to shareholders in payment of distributions declared | | | | | | | | | | | | |
| | | |
Class A | | | 992,340 | | | | 1,520,514 | | | | 1,404,749 | |
| | | |
Class B | | | 1,737 | | | | 2,877 | | | | 287 | |
| | | |
Class C | | | 113,099 | | | | 97,797 | | | | 184,648 | |
| | | |
Class I | | | 318,084 | | | | 331,246 | | | | 1,273,676 | |
| | | |
Cost of shares redeemed | | | | | | | | | | | | |
| | | |
Class A | | | (9,962,209 | ) | | | (7,912,013 | ) | | | (11,442,512 | ) |
| | | |
Class B | | | (13,210 | ) | | | (99,586 | ) | | | (403 | ) |
| | | |
Class C | | | (1,739,039 | ) | | | (1,426,567 | ) | | | (3,433,560 | ) |
| | | |
Class I | | | (8,452,947 | ) | | | (7,131,162 | ) | | | (27,648,263 | ) |
| | | |
Net asset value of shares converted | | | | | | | | | | | | |
| | | |
Class A | | | 111,980 | | | | 58,092 | | | | 43,829 | |
| | | |
Class B | | | (111,980 | ) | | | (58,092 | ) | | | (43,829 | ) |
| | | |
Net asset value of shares merged(1) | | | | | | | | | | | | |
| | | |
Class A | | | 106,634 | | | | 298,331 | | | | 6,434 | |
| | | |
Class B | | | (106,634 | ) | | | (298,331 | ) | | | (6,434 | ) |
| | | |
Net decrease in net assets from Fund share transactions | | $ | (10,990,304 | ) | | $ | (6,739,635 | ) | | $ | (5,404,250 | ) |
| | | |
Net decrease in net assets | | $ | (11,899,630 | ) | | $ | (8,599,815 | ) | | $ | (9,115,968 | ) |
| | | |
| Net Assets | | | | | | | | | | | | |
| | | |
At beginning of year | | $ | 63,921,252 | | | $ | 81,929,546 | | | $ | 149,148,304 | |
| | | |
At end of year(2) | | $ | 52,021,622 | | | $ | 73,329,731 | | | $ | 140,032,336 | |
| (1) | At the close of business on April 5, 2018, Class B shares were merged into Class A shares. |
| (2) | Includes accumulated undistributed (distributions in excess of) net investment income of $244,256, $(35,395) and $44,831, respectively, at July 31, 2018. The requirement to disclose the corresponding amounts as of July 31, 2019 was eliminated. |
| | | | |
| | 41 | | See Notes to Financial Statements. |
Eaton Vance
Municipal Income Funds
July 31, 2019
Statements of Changes in Net Assets — continued
| | | | | | | | |
| | | Year Ended July 31, 2018 | |
| Increase (Decrease) in Net Assets | | New Jersey Fund | | | Pennsylvania Fund | |
| | |
From operations — | | | | | | | | |
| | |
Net investment income | | $ | 5,223,276 | | | $ | 7,382,406 | |
| | |
Net realized gain | | | 1,232,251 | | | | 518,984 | |
| | |
Net change in unrealized appreciation (depreciation) | | | (3,848,754 | ) | | | (5,891,183 | ) |
| | |
Net increase in net assets from operations | | $ | 2,606,773 | | | $ | 2,010,207 | |
| | |
Distributions to shareholders — | | | | | | | | |
| | |
From net investment income | | | | | | | | |
| | |
Class A | | $ | (3,554,266 | ) | | $ | (4,520,698 | ) |
| | |
Class B | | | — | | | | (12,912 | ) |
| | |
Class C | | | (533,723 | ) | | | (794,768 | ) |
| | |
Class I | | | (1,211,654 | ) | | | (1,935,642 | ) |
| | |
Total distributions to shareholders | | $ | (5,299,643 | ) | | $ | (7,264,020 | ) |
| | |
Transactions in shares of beneficial interest — | | | | | | | | |
| | |
Proceeds from sale of shares | | | | | | | | |
| | |
Class A | | $ | 5,620,283 | | | $ | 4,328,909 | |
| | |
Class C | | | 1,627,297 | | | | 679,608 | |
| | |
Class I | | | 21,075,842 | | | | 9,205,147 | |
| | |
Net asset value of shares issued to shareholders in payment of distributions declared | | | | | | | | |
| | |
Class A | | | 2,877,424 | | | | 3,972,725 | |
| | |
Class B | | | — | | | | 12,697 | |
| | |
Class C | | | 449,499 | | | | 732,412 | |
| | |
Class I | | | 1,007,381 | | | | 793,843 | |
| | |
Cost of shares redeemed | | | | | | | | |
| | |
Class A | | | (12,674,961 | ) | | | (19,060,766 | ) |
| | |
Class B | | | — | | | | (39,726 | ) |
| | |
Class C | | | (5,370,881 | ) | | | (7,358,261 | ) |
| | |
Class I | | | (20,942,941 | ) | | | (13,359,604 | ) |
| | |
Net asset value of shares converted | | | | | | | | |
| | |
Class A | | | — | | | | 512,989 | |
| | |
Class B | | | — | | | | (512,989 | ) |
| | |
Net asset value of shares merged(1) | | | | | | | | |
| | |
Class A | | | — | | | | 400,566 | |
| | |
Class B | | | — | | | | (400,566 | ) |
| | |
Net decrease in net assets from Fund share transactions | | $ | (6,331,057 | ) | | $ | (20,093,016 | ) |
| | |
Net decrease in net assets | | $ | (9,023,927 | ) | | $ | (25,346,829 | ) |
| | |
| Net Assets | | | | | | | | |
| | |
At beginning of year | | $ | 157,014,584 | | | $ | 207,240,919 | |
| | |
At end of year(2) | | $ | 147,990,657 | | | $ | 181,894,090 | |
| (1) | At the close of business on April 5, 2018, Class B shares of Pennsylvania Fund were merged into Class A shares. |
| (2) | Includes accumulated undistributed net investment income of $1,239,482 and $131,751, respectively, at July 31, 2018. The requirement to disclose the corresponding amounts as of July 31, 2019 was eliminated. |
| | | | |
| | 42 | | See Notes to Financial Statements. |
Eaton Vance
Municipal Income Funds
July 31, 2019
Financial Highlights
| | | | | | | | | | | | | | | | | | | | |
| | | Arizona Fund — Class A | |
| |
| | | Year Ended July 31, | |
| | | 2019 | | | 2018 | | | 2017 | | | 2016 | | | 2015 | |
| | | | | |
Net asset value — Beginning of year | | $ | 9.440 | | | $ | 9.580 | | | $ | 9.840 | | | $ | 9.540 | | | $ | 9.650 | |
| | | | | |
| Income (Loss) From Operations | | | | | | | | | | | | | | | | | | | | |
| | | | | |
Net investment income(1) | | $ | 0.258 | | | $ | 0.276 | | | $ | 0.292 | | | $ | 0.321 | | | $ | 0.346 | |
| | | | | |
Net realized and unrealized gain (loss) | | | 0.310 | | | | (0.132 | ) | | | (0.262 | ) | | | 0.298 | | | | (0.088 | ) |
| | | | | |
Total income from operations | | $ | 0.568 | | | $ | 0.144 | | | $ | 0.030 | | | $ | 0.619 | | | $ | 0.258 | |
| | | | | |
| Less Distributions | | | | | | | | | | | | | | | | | | | | |
| | | | | |
From net investment income | | $ | (0.258 | ) | | $ | (0.284 | ) | | $ | (0.290 | ) | | $ | (0.319 | ) | | $ | (0.368 | ) |
| | | | | |
Total distributions | | $ | (0.258 | ) | | $ | (0.284 | ) | | $ | (0.290 | ) | | $ | (0.319 | ) | | $ | (0.368 | ) |
| | | | | |
Net asset value — End of year | | $ | 9.750 | | | $ | 9.440 | | | $ | 9.580 | | | $ | 9.840 | | | $ | 9.540 | |
| | | | | |
Total Return(2) | | | 6.12 | % | | | 1.53 | % | | | 0.35 | % | | | 6.60 | % | | | 2.67 | % |
| | | | | |
| Ratios/Supplemental Data | | | | | | | | | | | | | | | | | | | | |
| | | | | |
Net assets, end of year (000’s omitted) | | $ | 34,704 | | | $ | 33,704 | | | $ | 40,674 | | | $ | 47,956 | | | $ | 47,736 | |
| | | | | |
Ratios (as a percentage of average daily net assets): | | | | | | | | | | | | | | | | | | | | |
| | | | | |
Expenses(3) | | | 0.70 | % | | | 0.71 | % | | | 0.71 | % | | | 0.69 | % | | | 0.72 | % |
| | | | | |
Net investment income | | | 2.73 | % | | | 2.90 | % | | | 3.05 | % | | | 3.32 | % | | | 3.56 | % |
| | | | | |
Portfolio Turnover | | | 6 | % | | | 8 | % | | | 22 | % | | | 14 | % | | | 8 | % |
| (1) | Computed using average shares outstanding. |
| (2) | Returns are historical and are calculated by determining the percentage change in net asset value with all distributions reinvested and do not reflect the effect of sales charges. |
| (3) | Excludes the effect of custody fee credits, if any, of less than 0.005%. Effective September 1, 2015, custody fee credits, which were earned on cash deposit balances, were discontinued by the custodian. |
| | | | |
| | 43 | | See Notes to Financial Statements. |
Eaton Vance
Municipal Income Funds
July 31, 2019
Financial Highlights — continued
| | | | | | | | | | | | | | | | | | | | |
| | | Arizona Fund — Class C | |
| |
| | | Year Ended July 31, | |
| | | 2019 | | | 2018 | | | 2017 | | | 2016 | | | 2015 | |
| | | | | |
Net asset value — Beginning of year | | $ | 10.500 | | | $ | 10.650 | | | $ | 10.940 | | | $ | 10.610 | | | $ | 10.730 | |
| | | | | |
| Income (Loss) From Operations | | | | | | | | | | | | | | | | | | | | |
| | | | | |
Net investment income(1) | | $ | 0.208 | | | $ | 0.227 | | | $ | 0.245 | | | $ | 0.275 | | | $ | 0.305 | |
| | | | | |
Net realized and unrealized gain (loss) | | | 0.339 | | | | (0.140 | ) | | | (0.293 | ) | | | 0.329 | | | | (0.097 | ) |
| | | | | |
Total income (loss) from operations | | $ | 0.547 | | | $ | 0.087 | | | $ | (0.048 | ) | | $ | 0.604 | | | $ | 0.208 | |
| | | | | |
| Less Distributions | | | | | | | | | | | | | | | | | | | | |
| | | | | |
From net investment income | | $ | (0.207 | ) | | $ | (0.237 | ) | | $ | (0.242 | ) | | $ | (0.274 | ) | | $ | (0.328 | ) |
| | | | | |
Total distributions | | $ | (0.207 | ) | | $ | (0.237 | ) | | $ | (0.242 | ) | | $ | (0.274 | ) | | $ | (0.328 | ) |
| | | | | |
Net asset value — End of year | | $ | 10.840 | | | $ | 10.500 | | | $ | 10.650 | | | $ | 10.940 | | | $ | 10.610 | |
| | | | | |
Total Return(2) | | | 5.28 | % | | | 0.83 | % | | | (0.41 | )% | | | 5.77 | % | | | 1.93 | % |
| | | | | |
| Ratios/Supplemental Data | | | | | | | | | | | | | | | | | | | | |
| | | | | |
Net assets, end of year (000’s omitted) | | $ | 4,279 | | | $ | 5,025 | | | $ | 6,025 | | | $ | 6,592 | | | $ | 5,690 | |
| | | | | |
Ratios (as a percentage of average daily net assets): | | | | | | | | | | | | | | | | | | | | |
| | | | | |
Expenses(3) | | | 1.45 | % | | | 1.46 | % | | | 1.46 | % | | | 1.44 | % | | | 1.47 | % |
| | | | | |
Net investment income | | | 1.98 | % | | | 2.15 | % | | | 2.30 | % | | | 2.56 | % | | | 2.83 | % |
| | | | | |
Portfolio Turnover | | | 6 | % | | | 8 | % | | | 22 | % | | | 14 | % | | | 8 | % |
| (1) | Computed using average shares outstanding. |
| (2) | Returns are historical and are calculated by determining the percentage change in net asset value with all distributions reinvested and do not reflect the effect of sales charges. |
| (3) | Excludes the effect of custody fee credits, if any, of less than 0.005%. Effective September 1, 2015, custody fee credits, which were earned on cash deposit balances, were discontinued by the custodian. |
| | | | |
| | 44 | | See Notes to Financial Statements. |
Eaton Vance
Municipal Income Funds
July 31, 2019
Financial Highlights — continued
| | | | | | | | | | | | | | | | | | | | |
| | | Arizona Fund — Class I | |
| |
| | | Year Ended July 31, | |
| | | 2019 | | | 2018 | | | 2017 | | | 2016 | | | 2015 | |
| | | | | |
Net asset value — Beginning of year | | $ | 9.440 | | | $ | 9.580 | | | $ | 9.830 | | | $ | 9.540 | | | $ | 9.640 | |
| | | | | |
| Income (Loss) From Operations | | | | | | | | | | | | | | | | | | | | |
| | | | | |
Net investment income(1) | | $ | 0.276 | | | $ | 0.295 | | | $ | 0.310 | | | $ | 0.339 | | | $ | 0.368 | |
| | | | | |
Net realized and unrealized gain (loss) | | | 0.310 | | | | (0.132 | ) | | | (0.251 | ) | | | 0.289 | | | | (0.081 | ) |
| | | | | |
Total income from operations | | $ | 0.586 | | | $ | 0.163 | | | $ | 0.059 | | | $ | 0.628 | | | $ | 0.287 | |
| | | | | |
| Less Distributions | | | | | | | | | | | | | | | | | | | | |
| | | | | |
From net investment income | | $ | (0.276 | ) | | $ | (0.303 | ) | | $ | (0.309 | ) | | $ | (0.338 | ) | | $ | (0.387 | ) |
| | | | | |
Total distributions | | $ | (0.276 | ) | | $ | (0.303 | ) | | $ | (0.309 | ) | | $ | (0.338 | ) | | $ | (0.387 | ) |
| | | | | |
Net asset value — End of year | | $ | 9.750 | | | $ | 9.440 | | | $ | 9.580 | | | $ | 9.830 | | | $ | 9.540 | |
| | | | | |
Total Return(2) | | | 6.33 | % | | | 1.74 | % | | | 0.65 | % | | | 6.70 | % | | | 2.98 | % |
| | | | | |
| Ratios/Supplemental Data | | | | | | | | | | | | | | | | | | | | |
| | | | | |
Net assets, end of year (000’s omitted) | | $ | 19,612 | | | $ | 13,292 | | | $ | 16,990 | | | $ | 12,390 | | | $ | 9,759 | |
| | | | | |
Ratios (as a percentage of average daily net assets): | | | | | | | | | | | | | | | | | | | | |
| | | | | |
Expenses(3) | | | 0.49 | % | | | 0.51 | % | | | 0.51 | % | | | 0.49 | % | | | 0.52 | % |
| | | | | |
Net investment income | | | 2.91 | % | | | 3.10 | % | | | 3.24 | % | | | 3.50 | % | | | 3.79 | % |
| | | | | |
Portfolio Turnover | | | 6 | % | | | 8 | % | | | 22 | % | | | 14 | % | | | 8 | % |
| (1) | Computed using average shares outstanding. |
| (2) | Returns are historical and are calculated by determining the percentage change in net asset value with all distributions reinvested. |
| (3) | Excludes the effect of custody fee credits, if any, of less than 0.005%. Effective September 1, 2015, custody fee credits, which were earned on cash deposit balances, were discontinued by the custodian. |
| | | | |
| | 45 | | See Notes to Financial Statements. |
Eaton Vance
Municipal Income Funds
July 31, 2019
Financial Highlights — continued
| | | | | | | | | | | | | | | | | | | | |
| | | Connecticut Fund — Class A | |
| |
| | | Year Ended July 31, | |
| | | 2019 | | | 2018 | | | 2017 | | | 2016 | | | 2015 | |
| | | | | |
Net asset value — Beginning of year | | $ | 9.960 | | | $ | 10.200 | | | $ | 10.520 | | | $ | 10.240 | | | $ | 10.240 | |
| | | | | |
| Income (Loss) From Operations | | | | | | | | | | | | | | | | | | | | |
| | | | | |
Net investment income(1) | | $ | 0.296 | | | $ | 0.324 | | | $ | 0.328 | | | $ | 0.351 | | | $ | 0.364 | |
| | | | | |
Net realized and unrealized gain (loss) | | | 0.269 | | | | (0.243 | ) | | | (0.323 | ) | | | 0.276 | | | | (0.004 | ) |
| | | | | |
Total income from operations | | $ | 0.565 | | | $ | 0.081 | | | $ | 0.005 | | | $ | 0.627 | | | $ | 0.360 | |
| | | | | |
| Less Distributions | | | | | | | | | | | | | | | | | | | | |
| | | | | |
From net investment income | | $ | (0.295 | ) | | $ | (0.321 | ) | | $ | (0.325 | ) | | $ | (0.347 | ) | | $ | (0.360 | ) |
| | | | | |
Total distributions | | $ | (0.295 | ) | | $ | (0.321 | ) | | $ | (0.325 | ) | | $ | (0.347 | ) | | $ | (0.360 | ) |
| | | | | |
Net asset value — End of year | | $ | 10.230 | | | $ | 9.960 | | | $ | 10.200 | | | $ | 10.520 | | | $ | 10.240 | |
| | | | | |
Total Return(2) | | | 5.78 | % | | | 0.82 | % | | | 0.08 | % | | | 6.22 | % | | | 3.53 | % |
| | | | | |
| Ratios/Supplemental Data | | | | | | | | | | | | | | | | | | | | |
| | | | | |
Net assets, end of year (000’s omitted) | | $ | 52,275 | | | $ | 54,900 | | | $ | 59,405 | | | $ | 68,795 | | | $ | 72,210 | |
| | | | | |
Ratios (as a percentage of average daily net assets): | | | | | | | | | | | | | | | | | | | | |
| | | | | |
Expenses excluding interest and fees(3) | | | 0.73 | % | | | 0.73 | % | | | 0.70 | % | | | 0.72 | % | | | 0.72 | % |
| | | | | |
Interest and fee expense(4) | | | — | | | | — | | | | — | | | | — | | | | 0.03 | % |
| | | | | |
Total expenses(3) | | | 0.73 | % | | | 0.73 | % | | | 0.70 | % | | | 0.72 | % | | | 0.75 | % |
| | | | | |
Net investment income | | | 2.97 | % | | | 3.22 | % | | | 3.20 | % | | | 3.38 | % | | | 3.52 | % |
| | | | | |
Portfolio Turnover | | | 16 | % | | | 10 | % | | | 11 | % | | | 7 | % | | | 2 | % |
| (1) | Computed using average shares outstanding. |
| (2) | Returns are historical and are calculated by determining the percentage change in net asset value with all distributions reinvested and do not reflect the effect of sales charges. |
| (3) | Excludes the effect of custody fee credits, if any, of less than 0.005%. Effective September 1, 2015, custody fee credits, which were earned on cash deposit balances, were discontinued by the custodian. |
| (4) | Interest and fee expense relates to the liability for floating rate notes issued in conjunction with residual interest bond transactions (see Note 1H). |
| | | | |
| | 46 | | See Notes to Financial Statements. |
Eaton Vance
Municipal Income Funds
July 31, 2019
Financial Highlights — continued
| | | | | | | | | | | | | | | | | | | | |
| | | Connecticut Fund — Class C | |
| |
| | | Year Ended July 31, | |
| | | 2019 | | | 2018 | | | 2017 | | | 2016 | | | 2015 | |
| | | | | |
Net asset value — Beginning of year | | $ | 9.920 | | | $ | 10.160 | | | $ | 10.490 | | | $ | 10.200 | | | $ | 10.200 | |
| | | | | |
| Income (Loss) From Operations | | | | | | | | | | | | | | | | | | | | |
| | | | | |
Net investment income(1) | | $ | 0.220 | | | $ | 0.247 | | | $ | 0.250 | | | $ | 0.271 | | | $ | 0.285 | |
| | | | | |
Net realized and unrealized gain (loss) | | | 0.269 | | | | (0.242 | ) | | | (0.333 | ) | | | 0.287 | | | | (0.003 | ) |
| | | | | |
Total income (loss) from operations | | $ | 0.489 | | | $ | 0.005 | | | $ | (0.083 | ) | | $ | 0.558 | | | $ | 0.282 | |
| | | | | |
| Less Distributions | | | | | | | | | | | | | | | | | | | | |
| | | | | |
From net investment income | | $ | (0.219 | ) | | $ | (0.245 | ) | | $ | (0.247 | ) | | $ | (0.268 | ) | | $ | (0.282 | ) |
| | | | | |
Total distributions | | $ | (0.219 | ) | | $ | (0.245 | ) | | $ | (0.247 | ) | | $ | (0.268 | ) | | $ | (0.282 | ) |
| | | | | |
Net asset value — End of year | | $ | 10.190 | | | $ | 9.920 | | | $ | 10.160 | | | $ | 10.490 | | | $ | 10.200 | |
| | | | | |
Total Return(2) | | | 5.01 | % | | | 0.06 | % | | | (0.77 | )% | | | 5.54 | % | | | 2.76 | % |
| | | | | |
| Ratios/Supplemental Data | | | | | | | | | | | | | | | | | | | | |
| | | | | |
Net assets, end of year (000’s omitted) | | $ | 4,782 | | | $ | 4,588 | | | $ | 5,847 | | | $ | 7,020 | | | $ | 6,739 | |
| | | | | |
Ratios (as a percentage of average daily net assets): | | | | | | | | | | | | | | | | | | | | |
| | | | | |
Expenses excluding interest and fees(3) | | | 1.47 | % | | | 1.48 | % | | | 1.45 | % | | | 1.47 | % | | | 1.47 | % |
| | | | | |
Interest and fee expense(4) | | | — | | | | — | | | | — | | | | — | | | | 0.03 | % |
| | | | | |
Total expenses(3) | | | 1.47 | % | | | 1.48 | % | | | 1.45 | % | | | 1.47 | % | | | 1.50 | % |
| | | | | |
Net investment income | | | 2.21 | % | | | 2.47 | % | | | 2.45 | % | | | 2.62 | % | | | 2.77 | % |
| | | | | |
Portfolio Turnover | | | 16 | % | | | 10 | % | | | 11 | % | | | 7 | % | | | 2 | % |
| (1) | Computed using average shares outstanding. |
| (2) | Returns are historical and are calculated by determining the percentage change in net asset value with all distributions reinvested and do not reflect the effect of sales charges. |
| (3) | Excludes the effect of custody fee credits, if any, of less than 0.005%. Effective September 1, 2015, custody fee credits, which were earned on cash deposit balances, were discontinued by the custodian. |
| (4) | Interest and fee expense relates to the liability for floating rate notes issued in conjunction with residual interest bond transactions (see Note 1H). |
| | | | |
| | 47 | | See Notes to Financial Statements. |
Eaton Vance
Municipal Income Funds
July 31, 2019
Financial Highlights — continued
| | | | | | | | | | | | | | | | | | | | |
| | | Connecticut Fund — Class I | |
| |
| | | Year Ended July 31, | |
| | | 2019 | | | 2018 | | | 2017 | | | 2016 | | | 2015 | |
| | | | | |
Net asset value — Beginning of year | | $ | 9.960 | | | $ | 10.200 | | | $ | 10.520 | | | $ | 10.240 | | | $ | 10.240 | |
| | | | | |
| Income (Loss) From Operations | | | | | | | | | | | | | | | | | | | | |
| | | | | |
Net investment income(1) | | $ | 0.316 | | | $ | 0.344 | | | $ | 0.348 | | | $ | 0.371 | | | $ | 0.385 | |
| | | | | |
Net realized and unrealized gain (loss) | | | 0.269 | | | | (0.242 | ) | | | (0.322 | ) | | | 0.276 | | | | (0.004 | ) |
| | | | | |
Total income from operations | | $ | 0.585 | | | $ | 0.102 | | | $ | 0.026 | | | $ | 0.647 | | | $ | 0.381 | |
| | | | | |
| Less Distributions | | | | | | | | | | | | | | | | | | | | |
| | | | | |
From net investment income | | $ | (0.315 | ) | | $ | (0.342 | ) | | $ | (0.346 | ) | | $ | (0.367 | ) | | $ | (0.381 | ) |
| | | | | |
Total distributions | | $ | (0.315 | ) | | $ | (0.342 | ) | | $ | (0.346 | ) | | $ | (0.367 | ) | | $ | (0.381 | ) |
| | | | | |
Net asset value — End of year | | $ | 10.230 | | | $ | 9.960 | | | $ | 10.200 | | | $ | 10.520 | | | $ | 10.240 | |
| | | | | |
Total Return(2) | | | 6.00 | % | | | 1.03 | % | | | 0.28 | % | | | 6.43 | % | | | 3.74 | % |
| | | | | |
| Ratios/Supplemental Data | | | | | | | | | | | | | | | | | | | | |
| | | | | |
Net assets, end of year (000’s omitted) | | $ | 21,081 | | | $ | 13,842 | | | $ | 16,216 | | | $ | 12,826 | | | $ | 9,330 | |
| | | | | |
Ratios (as a percentage of average daily net assets): | | | | | | | | | | | | | | | | | | | | |
| | | | | |
Expenses excluding interest and fees(3) | | | 0.53 | % | | | 0.53 | % | | | 0.50 | % | | | 0.52 | % | | | 0.52 | % |
| | | | | |
Interest and fee expense(4) | | | — | | | | — | | | | — | | | | — | | | | 0.03 | % |
| | | | | |
Total expenses(3) | | | 0.53 | % | | | 0.53 | % | | | 0.50 | % | | | 0.52 | % | | | 0.55 | % |
| | | | | |
Net investment income | | | 3.16 | % | | | 3.42 | % | | | 3.40 | % | | | 3.57 | % | | | 3.71 | % |
| | | | | |
Portfolio Turnover | | | 16 | % | | | 10 | % | | | 11 | % | | | 7 | % | | | 2 | % |
| (1) | Computed using average shares outstanding. |
| (2) | Returns are historical and are calculated by determining the percentage change in net asset value with all distributions reinvested. |
| (3) | Excludes the effect of custody fee credits, if any, of less than 0.005%. Effective September 1, 2015, custody fee credits, which were earned on cash deposit balances, were discontinued by the custodian. |
| (4) | Interest and fee expense relates to the liability for floating rate notes issued in conjunction with residual interest bond transactions (see Note 1H). |
| | | | |
| | 48 | | See Notes to Financial Statements. |
Eaton Vance
Municipal Income Funds
July 31, 2019
Financial Highlights — continued
| | | | | | | | | | | | | | | | | | | | |
| | | Minnesota Fund — Class A | |
| |
| | | Year Ended July 31, | |
| | | 2019 | | | 2018 | | | 2017 | | | 2016 | | | 2015 | |
| | | | | |
Net asset value — Beginning of year | | $ | 9.250 | | | $ | 9.480 | | | $ | 9.770 | | | $ | 9.550 | | | $ | 9.580 | |
| | | | | |
| Income (Loss) From Operations | | | | | | | | | | | | | | | | | | | | |
| | | | | |
Net investment income(1) | | $ | 0.224 | | | $ | 0.241 | | | $ | 0.263 | | | $ | 0.288 | | | $ | 0.312 | |
| | | | | |
Net realized and unrealized gain (loss) | | | 0.361 | | | | (0.227 | ) | | | (0.289 | ) | | | 0.222 | | | | (0.033 | ) |
| | | | | |
Total income (loss) from operations | | $ | 0.585 | | | $ | 0.014 | | | $ | (0.026 | ) | | $ | 0.510 | | | $ | 0.279 | |
| | | | | |
| Less Distributions | | | | | | | | | | | | | | | | | | | | |
| | | | | |
From net investment income | | $ | (0.225 | ) | | $ | (0.244 | ) | | $ | (0.264 | ) | | $ | (0.290 | ) | | $ | (0.309 | ) |
| | | | | |
Total distributions | | $ | (0.225 | ) | | $ | (0.244 | ) | | $ | (0.264 | ) | | $ | (0.290 | ) | | $ | (0.309 | ) |
| | | | | |
Net asset value — End of year | | $ | 9.610 | | | $ | 9.250 | | | $ | 9.480 | | | $ | 9.770 | | | $ | 9.550 | |
| | | | | |
Total Return(2) | | | 6.42 | % | | | 0.15 | % | | | (0.22 | )% | | | 5.42 | % | | | 2.94 | % |
| | | | | |
| Ratios/Supplemental Data | | | | | | | | | | | | | | | | | | | | |
| | | | | |
Net assets, end of year (000’s omitted) | | $ | 57,812 | | | $ | 56,760 | | | $ | 62,310 | | | $ | 74,061 | | | $ | 71,598 | |
| | | | | |
Ratios (as a percentage of average daily net assets): | | | | | | | | | | | | | | | | | | | | |
| | | | | |
Expenses(3) | | | 0.70 | % | | | 0.69 | % | | | 0.70 | % | | | 0.69 | % | | | 0.71 | % |
| | | | | |
Net investment income | | | 2.41 | % | | | 2.57 | % | | | 2.77 | % | | | 2.98 | % | | | 3.24 | % |
| | | | | |
Portfolio Turnover | | | 21 | % | | | 20 | % | | | 23 | % | | | 12 | % | | | 2 | % |
| (1) | Computed using average shares outstanding. |
| (2) | Returns are historical and are calculated by determining the percentage change in net asset value with all distributions reinvested and do not reflect the effect of sales charges. |
| (3) | Excludes the effect of custody fee credits, if any, of less than 0.005%. Effective September 1, 2015, custody fee credits, which were earned on cash deposit balances, were discontinued by the custodian. |
| | | | |
| | 49 | | See Notes to Financial Statements. |
Eaton Vance
Municipal Income Funds
July 31, 2019
Financial Highlights — continued
| | | | | | | | | | | | | | | | | | | | |
| | | Minnesota Fund — Class C | |
| |
| | | Year Ended July 31, | |
| | | 2019 | | | 2018 | | | 2017 | | | 2016 | | | 2015 | |
| | | | | |
Net asset value — Beginning of year | | $ | 9.950 | | | $ | 10.200 | | | $ | 10.500 | | | $ | 10.270 | | | $ | 10.300 | |
| | | | | |
| Income (Loss) From Operations | | | | | | | | | | | | | | | | | | | | |
| | | | | |
Net investment income(1) | | $ | 0.168 | | | $ | 0.184 | | | $ | 0.206 | | | $ | 0.231 | | | $ | 0.257 | |
| | | | | |
Net realized and unrealized gain (loss) | | | 0.379 | | | | (0.247 | ) | | | (0.298 | ) | | | 0.233 | | | | (0.032 | ) |
| | | | | |
Total income (loss) from operations | | $ | 0.547 | | | $ | (0.063 | ) | | $ | (0.092 | ) | | $ | 0.464 | | | $ | 0.225 | |
| | | | | |
| Less Distributions | | | | | | | | | | | | | | | | | | | | |
| | | | | |
From net investment income | | $ | (0.167 | ) | | $ | (0.187 | ) | | $ | (0.208 | ) | | $ | (0.234 | ) | | $ | (0.255 | ) |
| | | | | |
Total distributions | | $ | (0.167 | ) | | $ | (0.187 | ) | | $ | (0.208 | ) | | $ | (0.234 | ) | | $ | (0.255 | ) |
| | | | | |
Net asset value — End of year | | $ | 10.330 | | | $ | 9.950 | | | $ | 10.200 | | | $ | 10.500 | | | $ | 10.270 | |
| | | | | |
Total Return(2) | | | 5.56 | % | | | (0.62 | )% | | | (0.85 | )% | | | 4.57 | % | | | 2.19 | % |
| | | | | |
| Ratios/Supplemental Data | | | | | | | | | | | | | | | | | | | | |
| | | | | |
Net assets, end of year (000’s omitted) | | $ | 6,595 | | | $ | 9,484 | | | $ | 11,668 | | | $ | 12,990 | | | $ | 11,636 | |
| | | | | |
Ratios (as a percentage of average daily net assets): | | | | | | | | | | | | | | | | | | | | |
| | | | | |
Expenses(3) | | | 1.46 | % | | | 1.44 | % | | | 1.45 | % | | | 1.44 | % | | | 1.46 | % |
| | | | | |
Net investment income | | | 1.68 | % | | | 1.82 | % | | | 2.02 | % | | | 2.23 | % | | | 2.48 | % |
| | | | | |
Portfolio Turnover | | | 21 | % | | | 20 | % | | | 23 | % | | | 12 | % | | | 2 | % |
| (1) | Computed using average shares outstanding. |
| (2) | Returns are historical and are calculated by determining the percentage change in net asset value with all distributions reinvested and do not reflect the effect of sales charges. |
| (3) | Excludes the effect of custody fee credits, if any, of less than 0.005%. Effective September 1, 2015, custody fee credits, which were earned on cash deposit balances, were discontinued by the custodian. |
| | | | |
| | 50 | | See Notes to Financial Statements. |
Eaton Vance
Municipal Income Funds
July 31, 2019
Financial Highlights — continued
| | | | | | | | | | | | | | | | | | | | |
| | | Minnesota Fund — Class I | |
| |
| | | Year Ended July 31, | |
| | | 2019 | | | 2018 | | | 2017 | | | 2016 | | | 2015 | |
| | | | | |
Net asset value — Beginning of year | | $ | 9.250 | | | $ | 9.480 | | | $ | 9.770 | | | $ | 9.550 | | | $ | 9.580 | |
| | | | | |
| Income (Loss) From Operations | | | | | | | | | | | | | | | | | | | | |
| | | | | |
Net investment income(1) | | $ | 0.242 | | | $ | 0.260 | | | $ | 0.280 | | | $ | 0.304 | | | $ | 0.330 | |
| | | | | |
Net realized and unrealized gain (loss) | | | 0.361 | | | | (0.227 | ) | | | (0.287 | ) | | | 0.225 | | | | (0.031 | ) |
| | | | | |
Total income (loss) from operations | | $ | 0.603 | | | $ | 0.033 | | | $ | (0.007 | ) | | $ | 0.529 | | | $ | 0.299 | |
| | | | | |
| Less Distributions | | | | | | | | | | | | | | | | | | | | |
| | | | | |
From net investment income | | $ | (0.243 | ) | | $ | (0.263 | ) | | $ | (0.283 | ) | | $ | (0.309 | ) | | $ | (0.329 | ) |
| | | | | |
Total distributions | | $ | (0.243 | ) | | $ | (0.263 | ) | | $ | (0.283 | ) | | $ | (0.309 | ) | | $ | (0.329 | ) |
| | | | | |
Net asset value — End of year | | $ | 9.610 | | | $ | 9.250 | | | $ | 9.480 | | | $ | 9.770 | | | $ | 9.550 | |
| | | | | |
Total Return(2) | | | 6.64 | % | | | 0.36 | % | | | (0.02 | )% | | | 5.63 | % | | | 3.15 | % |
| | | | | |
| Ratios/Supplemental Data | | | | | | | | | | | | | | | | | | | | |
| | | | | |
Net assets, end of year (000’s omitted) | | $ | 88,841 | | | $ | 73,789 | | | $ | 75,120 | | | $ | 59,486 | | | $ | 37,542 | |
| | | | | |
Ratios (as a percentage of average daily net assets): | | | | | | | | | | | | | | | | | | | | |
| | | | | |
Expenses(3) | | | 0.50 | % | | | 0.49 | % | | | 0.50 | % | | | 0.49 | % | | | 0.51 | % |
| | | | | |
Net investment income | | | 2.59 | % | | | 2.77 | % | | | 2.96 | % | | | 3.15 | % | | | 3.43 | % |
| | | | | |
Portfolio Turnover | | | 21 | % | | | 20 | % | | | 23 | % | | | 12 | % | | | 2 | % |
| (1) | Computed using average shares outstanding. |
| (2) | Returns are historical and are calculated by determining the percentage change in net asset value with all distributions reinvested. |
| (3) | Excludes the effect of custody fee credits, if any, of less than 0.005%. Effective September 1, 2015, custody fee credits, which were earned on cash deposit balances, were discontinued by the custodian. |
| | | | |
| | 51 | | See Notes to Financial Statements. |
Eaton Vance
Municipal Income Funds
July 31, 2019
Financial Highlights — continued
| | | | | | | | | | | | | | | | | | | | |
| | | New Jersey Fund — Class A | |
| |
| | | Year Ended July 31, | |
| | | 2019 | | | 2018 | | | 2017 | | | 2016 | | | 2015 | |
| | | | | |
Net asset value — Beginning of year | | $ | 9.080 | | | $ | 9.230 | | | $ | 9.520 | | | $ | 9.240 | | | $ | 9.310 | |
| | | | | |
| Income (Loss) From Operations | | | | | | | | | | | | | | | | | | | | |
| | | | | |
Net investment income(1) | | $ | 0.287 | | | $ | 0.317 | | | $ | 0.326 | | | $ | 0.339 | | | $ | 0.337 | |
| | | | | |
Net realized and unrealized gain (loss) | | | 0.398 | | | | (0.146 | ) | | | (0.293 | ) | | | 0.277 | | | | (0.072 | ) |
| | | | | |
Total income from operations | | $ | 0.685 | | | $ | 0.171 | | | $ | 0.033 | | | $ | 0.616 | | | $ | 0.265 | |
| | | | | |
| Less Distributions | | | | | | | | | | | | | | | | | | | | |
| | | | | |
From net investment income | | $ | (0.285 | ) | | $ | (0.321 | ) | | $ | (0.323 | ) | | $ | (0.336 | ) | | $ | (0.335 | ) |
| | | | | |
Total distributions | | $ | (0.285 | ) | | $ | (0.321 | ) | | $ | (0.323 | ) | | $ | (0.336 | ) | | $ | (0.335 | ) |
| | | | | |
Net asset value — End of year | | $ | 9.480 | | | $ | 9.080 | | | $ | 9.230 | | | $ | 9.520 | | | $ | 9.240 | |
| | | | | |
Total Return(2) | | | 7.69 | % | | | 1.89 | % | | | 0.41 | % | | | 6.78 | % | | | 2.86 | % |
| | | | | |
| Ratios/Supplemental Data | | | | | | | | | | | | | | | | | | | | |
| | | | | |
Net assets, end of year (000’s omitted) | | $ | 101,283 | | | $ | 98,224 | | | $ | 104,121 | | | $ | 117,155 | | | $ | 120,659 | |
| | | | | |
Ratios (as a percentage of average daily net assets): | | | | | | | | | | | | | | | | | | | | |
| | | | | |
Expenses excluding interest and fees(3) | | | 0.72 | % | | | 0.73 | % | | | 0.72 | % | | | 0.72 | % | | | 0.73 | % |
| | | | | |
Interest and fee expense(4) | | | — | | | | — | | | | 0.01 | % | | | 0.03 | % | | | 0.02 | % |
| | | | | |
Total expenses(3) | | | 0.72 | % | | | 0.73 | % | | | 0.73 | % | | | 0.75 | % | | | 0.75 | % |
| | | | | |
Net investment income | | | 3.14 | % | | | 3.47 | % | | | 3.53 | % | | | 3.62 | % | | | 3.60 | % |
| | | | | |
Portfolio Turnover | | | 39 | % | | | 13 | % | | | 14 | % | | | 17 | % | | | 8 | % |
| (1) | Computed using average shares outstanding. |
| (2) | Returns are historical and are calculated by determining the percentage change in net asset value with all distributions reinvested and do not reflect the effect of sales charges. |
| (3) | Excludes the effect of custody fee credits, if any, of less than 0.005%. Effective September 1, 2015, custody fee credits, which were earned on cash deposit balances, were discontinued by the custodian. |
| (4) | Interest and fee expense relates to the liability for floating rate notes issued in conjunction with residual interest bond transactions (see Note 1H). |
| | | | |
| | 52 | | See Notes to Financial Statements. |
Eaton Vance
Municipal Income Funds
July 31, 2019
Financial Highlights — continued
| | | | | | | | | | | | | | | | | | | | |
| | | New Jersey Fund — Class C | |
| |
| | | Year Ended July 31, | |
| | | 2019 | | | 2018 | | | 2017 | | | 2016 | | | 2015 | |
| | | | | |
Net asset value — Beginning of year | | $ | 9.470 | | | $ | 9.630 | | | $ | 9.930 | | | $ | 9.640 | | | $ | 9.710 | |
| | | | | |
| Income (Loss) From Operations | | | | | | | | | | | | | | | | | | | | |
| | | | | |
Net investment income(1) | | $ | 0.229 | | | $ | 0.259 | | | $ | 0.267 | | | $ | 0.280 | | | $ | 0.278 | |
| | | | | |
Net realized and unrealized gain (loss) | | | 0.416 | | | | (0.155 | ) | | | (0.302 | ) | | | 0.288 | | | | (0.072 | ) |
| | | | | |
Total income (loss) from operations | | $ | 0.645 | | | $ | 0.104 | | | $ | (0.035 | ) | | $ | 0.568 | | | $ | 0.206 | |
| | | | | |
| Less Distributions | | | | | | | | | | | | | | | | | | | | |
| | | | | |
From net investment income | | $ | (0.225 | ) | | $ | (0.264 | ) | | $ | (0.265 | ) | | $ | (0.278 | ) | | $ | (0.276 | ) |
| | | | | |
Total distributions | | $ | (0.225 | ) | | $ | (0.264 | ) | | $ | (0.265 | ) | | $ | (0.278 | ) | | $ | (0.276 | ) |
| | | | | |
Net asset value — End of year | | $ | 9.890 | | | $ | 9.470 | | | $ | 9.630 | | | $ | 9.930 | | | $ | 9.640 | |
| | | | | |
Total Return(2) | | | 6.92 | % | | | 1.10 | % | | | (0.32 | )% | | | 5.97 | % | | | 2.13 | % |
| | | | | |
| Ratios/Supplemental Data | | | | | | | | | | | | | | | | | | | | |
| | | | | |
Net assets, end of year (000’s omitted) | | $ | 12,202 | | | $ | 17,481 | | | $ | 21,115 | | | $ | 24,731 | | | $ | 23,141 | |
| | | | | |
Ratios (as a percentage of average daily net assets): | | | | | | | | | | | | | | | | | | | | |
| | | | | |
Expenses excluding interest and fees(3) | | | 1.47 | % | | | 1.48 | % | | | 1.47 | % | | | 1.47 | % | | | 1.48 | % |
| | | | | |
Interest and fee expense(4) | | | — | | | | — | | | | 0.01 | % | | | 0.03 | % | | | 0.02 | % |
| | | | | |
Total expenses(3) | | | 1.47 | % | | | 1.48 | % | | | 1.48 | % | | | 1.50 | % | | | 1.50 | % |
| | | | | |
Net investment income | | | 2.41 | % | | | 2.72 | % | | | 2.78 | % | | | 2.86 | % | | | 2.85 | % |
| | | | | |
Portfolio Turnover | | | 39 | % | | | 13 | % | | | 14 | % | | | 17 | % | | | 8 | % |
| (1) | Computed using average shares outstanding. |
| (2) | Returns are historical and are calculated by determining the percentage change in net asset value with all distributions reinvested and do not reflect the effect of sales charges. |
| (3) | Excludes the effect of custody fee credits, if any, of less than 0.005%. Effective September 1, 2015, custody fee credits, which were earned on cash deposit balances, were discontinued by the custodian. |
| (4) | Interest and fee expense relates to the liability for floating rate notes issued in conjunction with residual interest bond transactions (see Note 1H). |
| | | | |
| | 53 | | See Notes to Financial Statements. |
Eaton Vance
Municipal Income Funds
July 31, 2019
Financial Highlights — continued
| | | | | | | | | | | | | | | | | | | | |
| | | New Jersey Fund — Class I | |
| |
| | | Year Ended July 31, | |
| | | 2019 | | | 2018 | | | 2017 | | | 2016 | | | 2015 | |
| | | | | |
Net asset value — Beginning of year | | $ | 9.080 | | | $ | 9.230 | | | $ | 9.520 | | | $ | 9.240 | | | $ | 9.310 | |
| | | | | |
| Income (Loss) From Operations | | | | | | | | | | | | | | | | | | | | |
| | | | | |
Net investment income(1) | | $ | 0.303 | | | $ | 0.335 | | | $ | 0.345 | | | $ | 0.357 | | | $ | 0.355 | |
| | | | | |
Net realized and unrealized gain (loss) | | | 0.400 | | | | (0.146 | ) | | | (0.293 | ) | | | 0.278 | | | | (0.071 | ) |
| | | | | |
Total income from operations | | $ | 0.703 | | | $ | 0.189 | | | $ | 0.052 | | | $ | 0.635 | | | $ | 0.284 | |
| | | | | |
| Less Distributions | | | | | | | | | | | | | | | | | | | | |
| | | | | |
From net investment income | | $ | (0.303 | ) | | $ | (0.339 | ) | | $ | (0.342 | ) | | $ | (0.355 | ) | | $ | (0.354 | ) |
| | | | | |
Total distributions | | $ | (0.303 | ) | | $ | (0.339 | ) | | $ | (0.342 | ) | | $ | (0.355 | ) | | $ | (0.354 | ) |
| | | | | |
Net asset value — End of year | | $ | 9.480 | | | $ | 9.080 | | | $ | 9.230 | | | $ | 9.520 | | | $ | 9.240 | |
| | | | | |
Total Return(2) | | | 7.91 | % | | | 2.09 | % | | | 0.61 | % | | | 7.00 | % | | | 3.07 | % |
| | | | | |
| Ratios/Supplemental Data | | | | | | | | | | | | | | | | | | | | |
| | | | | |
Net assets, end of year (000’s omitted) | | $ | 51,021 | | | $ | 32,285 | | | $ | 31,778 | | | $ | 28,693 | | | $ | 24,873 | |
| | | | | |
Ratios (as a percentage of average daily net assets): | | | | | | | | | | | | | | | | | | | | |
| | | | | |
Expenses excluding interest and fees(3) | | | 0.52 | % | | | 0.53 | % | | | 0.52 | % | | | 0.52 | % | | | 0.53 | % |
| | | | | |
Interest and fee expense(4) | | | — | | | | — | | | | 0.01 | % | | | 0.03 | % | | | 0.02 | % |
| | | | | |
Total expenses(3) | | | 0.52 | % | | | 0.53 | % | | | 0.53 | % | | | 0.55 | % | | | 0.55 | % |
| | | | | |
Net investment income | | | 3.30 | % | | | 3.66 | % | | | 3.74 | % | | | 3.80 | % | | | 3.80 | % |
| | | | | |
Portfolio Turnover | | | 39 | % | | | 13 | % | | | 14 | % | | | 17 | % | | | 8 | % |
| (1) | Computed using average shares outstanding. |
| (2) | Returns are historical and are calculated by determining the percentage change in net asset value with all distributions reinvested. |
| (3) | Excludes the effect of custody fee credits, if any, of less than 0.005%. Effective September 1, 2015, custody fee credits, which were earned on cash deposit balances, were discontinued by the custodian. |
| (4) | Interest and fee expense relates to the liability for floating rate notes issued in conjunction with residual interest bond transactions (see Note 1H). |
| | | | |
| | 54 | | See Notes to Financial Statements. |
Eaton Vance
Municipal Income Funds
July 31, 2019
Financial Highlights — continued
| | | | | | | | | | | | | | | | | | | | |
| | | Pennsylvania Fund — Class A | |
| |
| | | Year Ended July 31, | |
| | | 2019 | | | 2018 | | | 2017 | | | 2016 | | | 2015 | |
| | | | | |
Net asset value — Beginning of year | | $ | 8.500 | | | $ | 8.730 | | | $ | 9.110 | | | $ | 8.900 | | | $ | 8.950 | |
| | | | | |
| Income (Loss) From Operations | | | | | | | | | | | | | | | | | | | | |
| | | | | |
Net investment income(1) | | $ | 0.310 | | | $ | 0.334 | | | $ | 0.323 | | | $ | 0.345 | | | $ | 0.355 | |
| | | | | |
Net realized and unrealized gain (loss) | | | 0.153 | | | | (0.236 | ) | | | (0.379 | ) | | | 0.207 | | | | (0.053 | ) |
| | | | | |
Total income (loss) from operations | | $ | 0.463 | | | $ | 0.098 | | | $ | (0.056 | ) | | $ | 0.552 | | | $ | 0.302 | |
| | | | | |
| Less Distributions | | | | | | | | | | | | | | | | | | | | |
| | | | | |
From net investment income | | $ | (0.313 | ) | | $ | (0.328 | ) | | $ | (0.324 | ) | | $ | (0.342 | ) | | $ | (0.352 | ) |
| | | | | |
Total distributions | | $ | (0.313 | ) | | $ | (0.328 | ) | | $ | (0.324 | ) | | $ | (0.342 | ) | | $ | (0.352 | ) |
| | | | | |
Net asset value — End of year | | $ | 8.650 | | | $ | 8.500 | | | $ | 8.730 | | | $ | 9.110 | | | $ | 8.900 | |
| | | | | |
Total Return(2) | | | 5.58 | % | | | 1.16 | % | | | (0.58 | )% | | | 6.32 | % | | | 3.41 | % |
| | | | | |
| Ratios/Supplemental Data | | | | | | | | | | | | | | | | | | | | |
| | | | | |
Net assets, end of year (000’s omitted) | | $ | 119,324 | | | $ | 112,508 | | | $ | 125,579 | | | $ | 147,706 | | | $ | 140,411 | |
| | | | | |
Ratios (as a percentage of average daily net assets): | | | | | | | | | | | | | | | | | | | | |
| | | | | |
Expenses excluding interest and fees(3) | | | 0.75 | % | | | 0.75 | % | | | 0.73 | % | | | 0.73 | % | | | 0.75 | % |
| | | | | |
Interest and fee expense(4) | | | 0.07 | % | | | 0.05 | % | | | 0.04 | % | | | 0.04 | % | | | 0.03 | % |
| | | | | |
Total expenses(3) | | | 0.82 | % | | | 0.80 | % | | | 0.77 | % | | | 0.77 | % | | | 0.78 | % |
| | | | | |
Net investment income | | | 3.65 | % | | | 3.89 | % | | | 3.67 | % | | | 3.84 | % | | | 3.95 | % |
| | | | | |
Portfolio Turnover | | | 18 | % | | | 9 | % | | | 4 | % | | | 8 | % | | | 5 | % |
| (1) | Computed using average shares outstanding. |
| (2) | Returns are historical and are calculated by determining the percentage change in net asset value with all distributions reinvested and do not reflect the effect of sales charges. |
| (3) | Excludes the effect of custody fee credits, if any, of less than 0.005%. Effective September 1, 2015, custody fee credits, which were earned on cash deposit balances, were discontinued by the custodian. |
| (4) | Interest and fee expense relates to the liability for floating rate notes issued in conjunction with residual interest bond transactions (see Note 1H). |
| | | | |
| | 55 | | See Notes to Financial Statements. |
Eaton Vance
Municipal Income Funds
July 31, 2019
Financial Highlights — continued
| | | | | | | | | | | | | | | | | | | | |
| | | Pennsylvania Fund — Class C | |
| |
| | | Year Ended July 31, | |
| | | 2019 | | | 2018 | | | 2017 | | | 2016 | | | 2015 | |
| | | | | |
Net asset value — Beginning of year | | $ | 8.800 | | | $ | 9.040 | | | $ | 9.430 | | | $ | 9.220 | | | $ | 9.270 | |
| | | | | |
| Income (Loss) From Operations | | | | | | | | | | | | | | | | | | | | |
| | | | | |
Net investment income(1) | | $ | 0.257 | | | $ | 0.279 | | | $ | 0.266 | | | $ | 0.287 | | | $ | 0.298 | |
| | | | | |
Net realized and unrealized gain (loss) | | | 0.161 | | | | (0.246 | ) | | | (0.389 | ) | | | 0.208 | | | | (0.053 | ) |
| | | | | |
Total income (loss) from operations | | $ | 0.418 | | | $ | 0.033 | | | $ | (0.123 | ) | | $ | 0.495 | | | $ | 0.245 | |
| | | | | |
| Less Distributions | | | | | | | | | | | | | | | | | | | | |
| | | | | |
From net investment income | | $ | (0.258 | ) | | $ | (0.273 | ) | | $ | (0.267 | ) | | $ | (0.285 | ) | | $ | (0.295 | ) |
| | | | | |
Total distributions | | $ | (0.258 | ) | | $ | (0.273 | ) | | $ | (0.267 | ) | | $ | (0.285 | ) | | $ | (0.295 | ) |
| | | | | |
Net asset value — End of year | | $ | 8.960 | | | $ | 8.800 | | | $ | 9.040 | | | $ | 9.430 | | | $ | 9.220 | |
| | | | | |
Total Return(2) | | | 4.84 | % | | | 0.39 | % | | | (1.28 | )% | | | 5.44 | % | | | 2.66 | % |
| | | | | |
| Ratios/Supplemental Data | | | | | | | | | | | | | | | | | | | | |
| | | | | |
Net assets, end of year (000’s omitted) | | $ | 13,088 | | | $ | 22,991 | | | $ | 29,651 | | | $ | 38,004 | | | $ | 32,695 | |
| | | | | |
Ratios (as a percentage of average daily net assets): | | | | | | | | | | | | | | | | | | | | |
| | | | | |
Expenses excluding interest and fees(3) | | | 1.50 | % | | | 1.50 | % | | | 1.48 | % | | | 1.48 | % | | | 1.50 | % |
| | | | | |
Interest and fee expense(4) | | | 0.07 | % | | | 0.05 | % | | | 0.04 | % | | | 0.04 | % | | | 0.03 | % |
| | | | | |
Total expenses(3) | | | 1.57 | % | | | 1.55 | % | | | 1.52 | % | | | 1.52 | % | | | 1.53 | % |
| | | | | |
Net investment income | | | 2.93 | % | | | 3.13 | % | | | 2.92 | % | | | 3.08 | % | | | 3.20 | % |
| | | | | |
Portfolio Turnover | | | 18 | % | | | 9 | % | | | 4 | % | | | 8 | % | | | 5 | % |
| (1) | Computed using average shares outstanding. |
| (2) | Returns are historical and are calculated by determining the percentage change in net asset value with all distributions reinvested and do not reflect the effect of sales charges. |
| (3) | Excludes the effect of custody fee credits, if any, of less than 0.005%. Effective September 1, 2015, custody fee credits, which were earned on cash deposit balances, were discontinued by the custodian. |
| (4) | Interest and fee expense relates to the liability for floating rate notes issued in conjunction with residual interest bond transactions (see Note 1H). |
| | | | |
| | 56 | | See Notes to Financial Statements. |
Eaton Vance
Municipal Income Funds
July 31, 2019
Financial Highlights — continued
| | | | | | | | | | | | | | | | | | | | |
| | | Pennsylvania Fund — Class I | |
| |
| | | Year Ended July 31, | |
| | | 2019 | | | 2018 | | | 2017 | | | 2016 | | | 2015 | |
| | | | | |
Net asset value — Beginning of year | | $ | 8.530 | | | $ | 8.760 | | | $ | 9.140 | | | $ | 8.940 | | | $ | 8.990 | |
| | | | | |
| Income (Loss) From Operations | | | | | | | | | | | | | | | | | | | | |
| | | | | |
Net investment income(1) | | $ | 0.328 | | | $ | 0.352 | | | $ | 0.342 | | | $ | 0.365 | | | $ | 0.375 | |
| | | | | |
Net realized and unrealized gain (loss) | | | 0.163 | | | | (0.235 | ) | | | (0.380 | ) | | | 0.197 | | | | (0.053 | ) |
| | | | | |
Total income (loss) from operations | | $ | 0.491 | | | $ | 0.117 | | | $ | (0.038 | ) | | $ | 0.562 | | | $ | 0.322 | |
| | | | | |
| Less Distributions | | | | | | | | | | | | | | | | | | | | |
| | | | | |
From net investment income | | $ | (0.331 | ) | | $ | (0.347 | ) | | $ | (0.342 | ) | | $ | (0.362 | ) | | $ | (0.372 | ) |
| | | | | |
Total distributions | | $ | (0.331 | ) | | $ | (0.347 | ) | | $ | (0.342 | ) | | $ | (0.362 | ) | | $ | (0.372 | ) |
| | | | | |
Net asset value — End of year | | $ | 8.690 | | | $ | 8.530 | | | $ | 8.760 | | | $ | 9.140 | | | $ | 8.940 | |
| | | | | |
Total Return(2) | | | 5.90 | % | | | 1.37 | % | | | (0.36 | )% | | | 6.40 | % | | | 3.62 | % |
| | | | | |
| Ratios/Supplemental Data | | | | | | | | | | | | | | | | | | | | |
| | | | | |
Net assets, end of year (000’s omitted) | | $ | 53,541 | | | $ | 46,396 | | | $ | 51,055 | | | $ | 53,322 | | | $ | 49,036 | |
| | | | | |
Ratios (as a percentage of average daily net assets): | | | | | | | | | | | | | | | | | | | | |
| | | | | |
Expenses excluding interest and fees(3) | | | 0.54 | % | | | 0.55 | % | | | 0.53 | % | | | 0.53 | % | | | 0.55 | % |
| | | | | |
Interest and fee expense(4) | | | 0.07 | % | | | 0.05 | % | | | 0.04 | % | | | 0.04 | % | | | 0.03 | % |
| | | | | |
Total expenses(3) | | | 0.61 | % | | | 0.60 | % | | | 0.57 | % | | | 0.57 | % | | | 0.58 | % |
| | | | | |
Net investment income | | | 3.84 | % | | | 4.09 | % | | | 3.88 | % | | | 4.03 | % | | | 4.15 | % |
| | | | | |
Portfolio Turnover | | | 18 | % | | | 9 | % | | | 4 | % | | | 8 | % | | | 5 | % |
| (1) | Computed using average shares outstanding. |
| (2) | Returns are historical and are calculated by determining the percentage change in net asset value with all distributions reinvested. |
| (3) | Excludes the effect of custody fee credits, if any, of less than 0.005%. Effective September 1, 2015, custody fee credits, which were earned on cash deposit balances, were discontinued by the custodian. |
| (4) | Interest and fee expense relates to the liability for floating rate notes issued in conjunction with residual interest bond transactions (see Note 1H). |
| | | | |
| | 57 | | See Notes to Financial Statements. |
Eaton Vance
Municipal Income Funds
July 31, 2019
Notes to Financial Statements
1 Significant Accounting Policies
Eaton Vance Municipals Trust (the Trust) is a Massachusetts business trust registered under the Investment Company Act of 1940, as amended (the 1940 Act), as anopen-end management investment company. The Trust presently consists of eighteen funds, five of which, eachnon-diversified, are included in these financial statements. They include Eaton Vance Arizona Municipal Income Fund (Arizona Fund), Eaton Vance Connecticut Municipal Income Fund (Connecticut Fund), Eaton Vance Minnesota Municipal Income Fund (Minnesota Fund), Eaton Vance New Jersey Municipal Income Fund (New Jersey Fund) and Eaton Vance Pennsylvania Municipal Income Fund (Pennsylvania Fund), (each individually referred to as the Fund, and collectively, the Funds). The Funds’ investment objective is to provide current income exempt from regular federal income tax and from particular state or local income or other taxes. The Funds offer three classes of shares. Class A shares are generally sold subject to a sales charge imposed at time of purchase. Class C shares are sold at net asset value and are generally subject to a contingent deferred sales charge (see Note 5). Effective January 25, 2019, Class C shares generally automatically convert to Class A shares ten years after their purchase as described in the Funds’ prospectus. Class I shares are sold at net asset value and are not subject to a sales charge. Each class represents apro-rata interest in the Fund, but votes separately on class-specific matters and (as noted below) is subject to different expenses. Realized and unrealized gains and losses are allocated daily to each class of shares based on the relative net assets of each class to the total net assets of the Fund. Net investment income, other than class-specific expenses, is allocated daily to each class of shares based upon the ratio of the value of each class’s paid shares to the total value of all paid shares. Each class of shares differs in its distribution plan and certain other class-specific expenses.
The following is a summary of significant accounting policies of the Funds. The policies are in conformity with accounting principles generally accepted in the United States of America (U.S. GAAP). Each Fund is an investment company and follows accounting and reporting guidance in the Financial Accounting Standards Board (FASB) Accounting Standards Codification Topic 946.
A Investment Valuation — The following methodologies are used to determine the market value or fair value of investments.
Debt Obligations. Debt obligations are generally valued on the basis of valuations provided by third party pricing services, as derived from such services’ pricing models. Inputs to the models may include, but are not limited to, reported trades, executable bid and ask prices, broker/dealer quotations, prices or yields of securities with similar characteristics, interest rates, anticipated prepayments, benchmark curves or information pertaining to the issuer, as well as industry and economic events. The pricing services may use a matrix approach, which considers information regarding securities with similar characteristics to determine the valuation for a security. Short-term debt obligations purchased with a remaining maturity of sixty days or less for which a valuation from a third party pricing service is not readily available may be valued at amortized cost, which approximates fair value.
Derivatives. Financial futures contracts are valued at the closing settlement price established by the board of trade or exchange on which they are traded.
Fair Valuation. Investments for which valuations or market quotations are not readily available or are deemed unreliable are valued at fair value using methods determined in good faith by or at the direction of the Trustees of a Fund in a manner that most fairly reflects the security’s “fair value”, which is the amount that a Fund might reasonably expect to receive for the security upon its current sale in the ordinary course. Each such determination is based on a consideration of relevant factors, which are likely to vary from one pricing context to another. These factors may include, but are not limited to, the type of security, the existence of any contractual restrictions on the security’s disposition, the price and extent of public trading in similar securities of the issuer or of comparable entities, quotations or relevant information obtained from broker/dealers or other market participants, information obtained from the issuer, analysts, and/or the appropriate stock exchange (for exchange-traded securities), an analysis of the entity’s financial statements, and an evaluation of the forces that influence the issuer and the market(s) in which the security is purchased and sold.
B Investment Transactions and Related Income — Investment transactions for financial statement purposes are accounted for on a trade date basis. Realized gains and losses on investments sold are determined on the basis of identified cost. Interest income is recorded on the basis of interest accrued, adjusted for amortization of premium or accretion of discount.
C Federal Taxes — Each Fund’s policy is to comply with the provisions of the Internal Revenue Code applicable to regulated investment companies and to distribute to shareholders each year substantially all of its taxable, if any, andtax-exempt net investment income, and all or substantially all of its net realized capital gains. Accordingly, no provision for federal income or excise tax is necessary. Each Fund intends to satisfy conditions which will enable it to designate distributions from the interest income generated by its investments innon-taxable municipal securities, which are exempt from regular federal income tax when received by each Fund, as exempt-interest dividends. The portion of such interest, if any, earned on private activity bonds issued after August 7, 1986, may be considered a tax preference item to shareholders.
As of July 31, 2019, the Funds had no uncertain tax positions that would require financial statement recognition,de-recognition, or disclosure. Each Fund files a U.S. federal income tax return annually after its fiscalyear-end, which is subject to examination by the Internal Revenue Service for a period of three years from the date of filing.
D Expenses — The majority of expenses of the Trust are directly identifiable to an individual fund. Expenses which are not readily identifiable to a specific fund are allocated taking into consideration, among other things, the nature and type of expense and the relative size of the funds.
E Legal Fees — Legal fees and other related expenses incurred as part of negotiations of the terms and requirement of capital infusions, or that are expected to result in the restructuring of, or a plan of reorganization for, an investment are recorded as realized losses. Ongoing expenditures to protect or enhance an investment are treated as operating expenses.
Eaton Vance
Municipal Income Funds
July 31, 2019
Notes to Financial Statements — continued
F Use of Estimates — The preparation of the financial statements in conformity with U.S. GAAP requires management to make estimates and assumptions that affect the reported amounts of assets and liabilities at the date of the financial statements and the reported amounts of income and expense during the reporting period. Actual results could differ from those estimates.
G Indemnifications — Under the Trust’s organizational documents, its officers and Trustees may be indemnified against certain liabilities and expenses arising out of the performance of their duties to the Funds. Under Massachusetts law, if certain conditions prevail, shareholders of a Massachusetts business trust (such as the Trust) could be deemed to have personal liability for the obligations of the Trust. However, the Trust’s Declaration of Trust contains an express disclaimer of liability on the part of Fund shareholders and theBy-laws provide that the Trust shall assume, upon request by the shareholder, the defense on behalf of any Fund shareholders. Moreover, theBy-laws also provide for indemnification out of Fund property of any shareholder held personally liable solely by reason of being or having been a shareholder for all loss or expense arising from such liability. Additionally, in the normal course of business, each Fund enters into agreements with service providers that may contain indemnification clauses. Each Fund’s maximum exposure under these arrangements is unknown as this would involve future claims that may be made against each Fund that have not yet occurred.
H Floating Rate Notes Issued in Conjunction with Securities Held — The Funds may invest in residual interest bonds, also referred to as inverse floating rate securities, whereby a Fund may sell a variable or fixed rate bond for cash to a Special-Purpose Vehicle (the SPV), (which is generally organized as a trust), while at the same time, buying a residual interest in the assets and cash flows of the SPV. The bond is deposited into the SPV with the same CUSIP number as the bond sold to the SPV by the Fund, and which may have been, but is not required to be, the bond purchased from the Fund (the Bond). The SPV also issues floating rate notes (Floating Rate Notes) which are sold to third-parties. The residual interest bond held by a Fund gives the Fund the right (1) to cause the holders of the Floating Rate Notes to generally tender their notes at par, and (2) to have the Bond held by the SPV transferred to the Fund, thereby terminating the SPV. Should the Fund exercise such right, it would generally pay the SPV the par amount due on the Floating Rate Notes and exchange the residual interest bond for the underlying Bond. Pursuant to generally accepted accounting principles for transfers and servicing of financial assets and extinguishment of liabilities, the Funds account for the transaction described above as a secured borrowing by including the Bond in their Portfolio of Investments and the Floating Rate Notes as a liability under the caption “Payable for floating rate notes issued” in their Statement of Assets and Liabilities. The Floating Rate Notes have interest rates that generally reset weekly and their holders have the option to tender their notes to the SPV for redemption at par at each reset date. Accordingly, the fair value of the payable for floating rate notes issued approximates its carrying value. If measured at fair value, the payable for floating rate notes would have been considered as Level 2 in the fair value hierarchy (see Note 10) at July 31, 2019. Interest expense related to a Fund’s liability with respect to Floating Rate Notes is recorded as incurred. The SPV may be terminated by the Fund, as noted above, or by the occurrence of certain termination events as defined in the trust agreement, such as a downgrade in the credit quality of the underlying Bond, bankruptcy of or payment failure by the issuer of the underlying Bond, the inability to remarket Floating Rate Notes that have been tendered due to insufficient buyers in the market, or the failure by the SPV to obtain renewal of the liquidity agreement under which liquidity support is provided for the Floating Rate Notes up to one year. At July 31, 2019, the amounts of the Funds’ Floating Rate Notes and related interest rates and collateral were as follows:
| | | | |
| | | Pennsylvania
Fund | |
| |
Floating Rate Notes Outstanding | | $ | 4,999,975 | |
| |
Interest Rate or Range of Interest Rates (%) | | | 1.55 | |
| |
Collateral for Floating Rate Notes Outstanding | | $ | 8,059,813 | |
For the year ended July 31, 2019, the Funds’ average settled Floating Rate Notes outstanding and the average interest rate including fees were as follows:
| | | | |
| | | Pennsylvania
Fund | |
| |
Average Floating Rate Notes Outstanding | | $ | 5,000,000 | |
| |
Average Interest Rate | | | 2.42 | % |
In certain circumstances, the Funds may enter into shortfall and forbearance agreements with brokers by which a Fund agrees to reimburse the broker for the difference between the liquidation value of the Bond held by the SPV and the liquidation value of the Floating Rate Notes, as well as any shortfalls in interest cash flows. The Funds had no shortfalls as of July 31, 2019.
The Funds may also purchase residual interest bonds in a secondary market transaction without first owning the underlying bond. Such transactions are not required to be treated as secured borrowings. Shortfall agreements, if any, related to residual interest bonds purchased in a secondary market transaction are disclosed in the Portfolio of Investments.
Eaton Vance
Municipal Income Funds
July 31, 2019
Notes to Financial Statements — continued
The Funds’ investment policies and restrictions expressly permit investments in residual interest bonds. Such bonds typically offer the potential for yields exceeding the yields available on fixed rate bonds with comparable credit quality and maturity. These securities tend to underperform the market for fixed rate bonds in a rising long-term interest rate environment, but tend to outperform the market for fixed rate bonds when long-term interest rates decline. The value and income of residual interest bonds are generally more volatile than that of a fixed rate bond. The Funds’ investment policies do not allow the Funds to borrow money except as permitted by the 1940 Act. Management believes that the Funds’ restrictions on borrowing money and issuing senior securities (other than as specifically permitted) do not apply to Floating Rate Notes issued by the SPV and included as a liability in the Funds’ Statement of Assets and Liabilities. As secured indebtedness issued by an SPV, Floating Rate Notes are distinct from the borrowings and senior securities to which the Funds’ restrictions apply. Residual interest bonds held by the Funds are securities exempt from registration under Rule 144A of the Securities Act of 1933.
I Financial Futures Contracts — Upon entering into a financial futures contract, a Fund is required to deposit with the broker, either in cash or securities, an amount equal to a certain percentage of the contract amount (initial margin). Subsequent payments, known as variation margin, are made or received by the Fund each business day, depending on the daily fluctuations in the value of the underlying security, and are recorded as unrealized gains or losses by the Fund. Gains (losses) are realized upon the expiration or closing of the financial futures contracts. Should market conditions change unexpectedly, the Fund may not achieve the anticipated benefits of the financial futures contracts and may realize a loss. Futures contracts have minimal counterparty risk as they are exchange traded and the clearinghouse for the exchange is substituted as the counterparty, guaranteeing counterparty performance.
J When-Issued Securities and Delayed Delivery Transactions — The Funds may purchase or sell securities on a delayed delivery or when-issued basis. Payment and delivery may take place after the customary settlement period for that security. At the time the transaction is negotiated, the price of the security that will be delivered is fixed. The Funds maintain cash and/or security positions for these commitments such that sufficient liquid assets will be available to make payments upon settlement. Securities purchased on a delayed delivery or when-issued basis aremarked-to-market daily and begin earning interest on settlement date. Losses may arise due to changes in the market value of the underlying securities or if the counterparty does not perform under the contract.
2 Distributions to Shareholders and Income Tax Information
The net investment income of each Fund is determined daily and substantially all of the net investment income so determined is declared as a dividend to shareholders of record at the time of declaration. Distributions are declared separately for each class of shares. Distributions are paid monthly. Distributions of realized capital gains (reduced by available capital loss carryforwards from prior years) are made at least annually. Shareholders may reinvest income and capital gain distributions in additional shares of the same class of a Fund at the net asset value as of the reinvestment date or, at the election of the shareholder, receive distributions in cash. Distributions to shareholders are determined in accordance with income tax regulations, which may differ from U.S. GAAP. As required by U.S. GAAP, only distributions in excess of tax basis earnings and profits are reported in the financial statements as a return of capital. Permanent differences between book and tax accounting relating to distributions are reclassified topaid-in capital. For tax purposes, distributions from short-term capital gains are considered to be from ordinary income.
The tax character of distributions declared for the years ended July 31, 2019 and July 31, 2018 was as follows:
| | | | | | | | | | | | | | | | | | | | |
| | | Year Ended July 31, 2019 | |
| | | Arizona Fund | | | Connecticut
Fund | | | Minnesota Fund | | | New Jersey
Fund | | | Pennsylvania
Fund | |
| | | | | |
Tax-exempt income | | $ | 1,445,855 | | | $ | 2,138,725 | | | $ | 3,432,648 | | | $ | 4,553,353 | | | $ | 6,521,683 | |
| | | | | |
Ordinary income | | $ | — | | | $ | 38,522 | | | $ | — | | | $ | 203,554 | | | $ | 22,964 | |
| |
| | | Year Ended July 31, 2018 | |
| | | Arizona Fund | | | Connecticut Fund | | | Minnesota Fund | | | New Jersey Fund | | | Pennsylvania Fund | |
|
Distributions declared from: | |
| | | | | |
Tax-exempt income | | $ | 1,678,960 | | | $ | 2,446,665 | | | $ | 3,872,294 | | | $ | 5,096,275 | | | $ | 7,149,164 | |
| | | | | |
Ordinary income | | $ | 38,187 | | | $ | 8,661 | | | $ | 45,954 | | | $ | 203,368 | | | $ | 114,856 | |
Eaton Vance
Municipal Income Funds
July 31, 2019
Notes to Financial Statements — continued
During the year ended July 31, 2019, the following amounts were reclassified due to expired capital loss carryforwards.
| | | | | | | | | | | | | | | | | | | | |
| | | Arizona
Fund | | | Connecticut
Fund | | | Minnesota
Fund | | | New Jersey
Fund | | | Pennsylvania
Fund | |
| | | | | |
Change in: | | | | | | | | | | | | | | | | | | | | |
| | | | | |
Paid-in capital | | $ | — | | | $ | (685,091 | ) | | $ | (723,202 | ) | | $ | (3,741,998 | ) | | $ | (10,492,996 | ) |
| | | | | |
Distributable earnings (accumulated loss) | | $ | — | | | $ | 685,091 | | | $ | 723,202 | | | $ | 3,741,998 | | | $ | 10,492,996 | |
These reclassifications had no effect on the net assets or net asset value per share of the Funds.
As of July 31, 2019, the components of distributable earnings (accumulated loss) on a tax basis were as follows:
| | | | | | | | | | | | | | | | | | | | |
| | | Arizona Fund | | | Connecticut
Fund | | | Minnesota
Fund | | | New Jersey
Fund | | | Pennsylvania
Fund | |
| | | | | |
Undistributedtax-exempt income | | $ | 260,805 | | | $ | 38,690 | | | $ | 123,533 | | | $ | 1,298,563 | | | $ | 193,237 | |
| | | | | |
Deferred capital losses | | $ | (216,806 | ) | | $ | (993,863 | ) | | $ | (682,598 | ) | | $ | (4,517,304 | ) | | $ | (13,261,062 | ) |
| | | | | |
Net unrealized appreciation | | $ | 4,649,016 | | | $ | 5,155,876 | | | $ | 7,876,214 | | | $ | 12,526,459 | | | $ | 13,032,584 | |
| | | | | |
Distributions payable | | $ | (19,117 | ) | | $ | (32,277 | ) | | $ | (78,704 | ) | | $ | (59,080 | ) | | $ | (125,765 | ) |
At July 31, 2019, the following Funds, for federal income tax purposes, had deferred capital losses which would reduce the respective Fund’s taxable income arising from future net realized gains on investment transactions, if any, to the extent permitted by the Internal Revenue Code, and thus would reduce the amount of distributions to shareholders, which would otherwise be necessary to relieve the Funds of any liability for federal income or excise tax. The deferred capital losses are treated as arising on the first day of a Fund’s next taxable year, retaining the same short-term or long-term character as when originally deferred. The amounts of the deferred capital losses are as follows:
| | | | | | | | | | | | | | | | | | | | |
| | | Arizona
Fund | | | Connecticut
Fund | | | Minnesota
Fund | | | New Jersey
Fund | | | Pennsylvania
Fund | |
| | | | | |
Deferred capital losses: | | | | | | | | | | | | | | | | | | | | |
| | | | | |
Short-term | | $ | 121,467 | | | $ | 993,863 | | | $ | 279,160 | | | $ | 3,862,056 | | | $ | 5,404,247 | |
| | | | | |
Long-term | | $ | 95,339 | | | $ | — | | | $ | 403,438 | | | $ | 655,248 | | | $ | 7,856,815 | |
The cost and unrealized appreciation (depreciation) of investments, including open derivative contracts, of each Fund at July 31, 2019, as determined on a federal income tax basis, were as follows:
| | | | | | | | | | | | | | | | | | | | |
| | | Arizona
Fund | | | Connecticut
Fund | | | Minnesota
Fund | | | New Jersey
Fund | | | Pennsylvania
Fund | |
| | | | | |
Aggregate cost | | $ | 52,340,194 | | | $ | 71,128,757 | | | $ | 146,056,265 | | | $ | 153,778,608 | | | $ | 167,901,170 | |
| | | | | |
Gross unrealized appreciation | | $ | 4,649,016 | | | $ | 5,159,576 | | | $ | 7,876,488 | | | $ | 12,526,459 | | | $ | 14,076,155 | |
| | | | | |
Gross unrealized depreciation | | | — | | | | (3,700 | ) | | | (274 | ) | | | — | | | | (1,043,571 | ) |
| | | | | |
Net unrealized appreciation | | $ | 4,649,016 | | | $ | 5,155,876 | | | $ | 7,876,214 | | | $ | 12,526,459 | | | $ | 13,032,584 | |
Eaton Vance
Municipal Income Funds
July 31, 2019
Notes to Financial Statements — continued
3 Investment Adviser Fee and Other Transactions with Affiliates
The investment adviser fee is earned by Boston Management and Research (BMR), a subsidiary of Eaton Vance Management (EVM), as compensation for management and investment advisory services rendered to each Fund. The fee is based upon a percentage of average daily net assets plus a percentage of gross income (i.e., income other than gains from the sale of securities) as presented in the following table and is payable monthly.
| | | | | | | | |
| Daily Net Assets | | Annual Asset
Rate | | | Daily Income
Rate | |
| | |
Up to $20 million | | | 0.10 | % | | | 1.00 | % |
| | |
$20 million up to $40 million | | | 0.20 | | | | 2.00 | |
| | |
$40 million up to $500 million | | | 0.30 | | | | 3.00 | |
On average daily net assets of $500 million or more, the rates are reduced.
For the year ended July 31, 2019, investment adviser fees incurred by the Funds and the effective annual rates, as a percentage of average daily net assets, were as follows:
| | | | | | | | | | | | | | | | | | | | |
| | | Arizona
Fund | | | Connecticut
Fund | | | Minnesota
Fund | | | New Jersey
Fund | | | Pennsylvania
Fund | |
| | | | | |
Investment Adviser Fee | | $ | 134,366 | | | $ | 219,792 | | | $ | 467,164 | | | $ | 555,793 | | | $ | 685,563 | |
| | | | | |
Effective Annual Rate | | | 0.25 | % | | | 0.30 | % | | | 0.34 | % | | | 0.36 | % | | | 0.38 | % |
EVM serves as the administrator of each Fund, but receives no compensation. EVM providessub-transfer agency and related services to the Funds pursuant to aSub-Transfer Agency Support Services Agreement. Eaton Vance Distributors, Inc. (EVD), an affiliate of EVM and the Funds’ principal underwriter, received a portion of the sales charge on sales of Class A shares of the Funds. EVD also received distribution and service fees from Class A and Class C shares (see Note 4) and contingent deferred sales charges (see Note 5).Sub-transfer agent fees earned by EVM, which are included in transfer and dividend disbursing agent fees on the Statements of Operations, and Class A sales charges that the Funds were informed were received by EVD for the year ended July 31, 2019 were as follows:
| | | | | | | | | | | | | | | | | | | | |
| | | Arizona
Fund | | | Connecticut
Fund | | | Minnesota
Fund | | | New Jersey
Fund | | | Pennsylvania
Fund | |
| | | | | |
EVM’sSub-Transfer Agent Fees | | $ | 3,443 | | | $ | 10,994 | | | $ | 15,739 | | | $ | 15,993 | | | $ | 21,586 | |
| | | | | |
EVD’s Class A Sales Charges | | $ | 6,616 | | | $ | 8,315 | | | $ | 5,754 | | | $ | 13,514 | | | $ | 11,535 | |
Trustees and officers of the Funds who are members of EVM’s or BMR’s organizations receive remuneration for their services to the Funds out of the investment adviser fee. Trustees of the Funds who are not affiliated with the investment adviser may elect to defer receipt of all or a percentage of their annual fees in accordance with the terms of the Trustees Deferred Compensation Plan. For the year ended July 31, 2019, no significant amounts have been deferred. Certain officers and Trustees of the Funds are officers of the above organizations.
4 Distribution Plans
Each Fund has in effect a distribution plan for Class A shares (Class A Plan) pursuant to Rule12b-1 under the 1940 Act. The Class A Plan provides that each Fund will pay EVD a distribution and service fee not exceeding 0.25% per annum of its average daily net assets attributable to Class A shares for distribution services and facilities provided to each Fund by EVD, as well as for personal services and/or the maintenance of shareholder accounts. The Trustees approved distribution and service fee payments equal to 0.20% per annum of each Fund’s average daily net assets attributable to Class A shares. Distribution and service fees paid or accrued to EVD for the year ended July 31, 2019 for Class A shares amounted to the following:
| | | | | | | | | | | | | | | | | | | | |
| | | Arizona
Fund | | | Connecticut
Fund | | | Minnesota
Fund | | | New Jersey
Fund | | | Pennsylvania
Fund | |
| | | | | |
Class A Distribution and Service Fees | | $ | 66,829 | | | $ | 104,692 | | | $ | 109,837 | | | $ | 193,942 | | | $ | 225,611 | |
Eaton Vance
Municipal Income Funds
July 31, 2019
Notes to Financial Statements — continued
Each Fund also has in effect a distribution plan for Class C shares (Class C Plan) pursuant to Rule12b-1 under the 1940 Act. Pursuant to the Class C Plan, each Fund pays EVD amounts equal to 0.75% per annum of its average daily net assets attributable to Class C shares for providing ongoing distribution services and facilities to the respective Funds. For the year ended July 31, 2019, the Funds paid or accrued to EVD the following distribution fees:
| | | | | | | | | | | | | | | | | | | | |
| | | Arizona
Fund | | | Connecticut
Fund | | | Minnesota
Fund | | | New Jersey
Fund | | | Pennsylvania
Fund | |
| | | | | |
Class C Distribution Fees | | $ | 34,241 | | | $ | 30,794 | | | $ | 57,621 | | | $ | 110,350 | | | $ | 138,011 | |
The Class C Plan also authorizes each Fund to make payments of service fees to EVD, financial intermediaries and other persons in amounts not exceeding 0.25% per annum of the average daily net assets attributable to Class C shares. The Trustees approved service fee payments equal to 0.20% per annum of each Fund’s average daily net assets attributable to Class C shares. Service fees paid or accrued are for personal services and/or the maintenance of shareholder accounts. They are separate and distinct from the Class C sales commissions and distribution fees payable to EVD. Service fees paid or accrued for the year ended July 31, 2019 amounted to the following:
| | | | | | | | | | | | | | | | | | | | |
| | | Arizona
Fund | | | Connecticut
Fund | | | Minnesota
Fund | | | New Jersey
Fund | | | Pennsylvania
Fund | |
| | | | | |
Class C Service Fees | | $ | 9,131 | | | $ | 8,212 | | | $ | 15,366 | | | $ | 29,427 | | | $ | 36,803 | |
Distribution and service fees are subject to the limitations contained in the Financial Industry Regulatory Authority Rule 2341(d).
5 Contingent Deferred Sales Charges
A contingent deferred sales charge (CDSC) of 1% generally is imposed on redemptions of Class C shares made within one year of purchase. Class A shares may be subject to a 1% CDSC if redeemed within eighteen months of purchase (depending on the circumstances of purchase). Generally, the CDSC is based upon the lower of the net asset value at date of redemption or date of purchase. No charge is levied on shares acquired by reinvestment of dividends or capital gain distributions. For the year ended July 31, 2019, the Funds were informed that EVD received approximately the following amounts of CDSCs paid by Class A and Class C shareholders:
| | | | | | | | | | | | | | | | | | | | |
| | | Arizona
Fund | | | Connecticut
Fund | | | Minnesota
Fund | | | New Jersey
Fund | | | Pennsylvania
Fund | |
| | | | | |
Class A | | $ | — | | | $ | — | | | $ | — | | | $ | 10,000 | | | $ | — | |
| | | | | |
Class C | | $ | 100 | | | $ | 200 | | | $ | 600 | | | $ | 3,000 | | | $ | — | |
6 Purchases and Sales of Investments
Purchases and sales of investments, other than short-term obligations, for the year ended July 31, 2019 were as follows:
| | | | | | | | | | | | | | | | | | | | |
| | | Arizona
Fund | | | Connecticut
Fund | | | Minnesota
Fund | | | New Jersey
Fund | | | Pennsylvania
Fund | |
| | | | | |
Purchases | | $ | 8,363,451 | | | $ | 18,178,157 | | | $ | 41,510,578 | | | $ | 73,774,388 | | | $ | 32,873,017 | |
| | | | | |
Sales | | $ | 3,249,471 | | | $ | 11,590,055 | | | $ | 29,354,849 | | | $ | 59,012,284 | | | $ | 37,592,760 | |
Eaton Vance
Municipal Income Funds
July 31, 2019
Notes to Financial Statements — continued
7 Shares of Beneficial Interest
Each Fund’s Declaration of Trust permits the Trustees to issue an unlimited number of full and fractional shares of beneficial interest (without par value). Such shares may be issued in a number of different series (such as the Funds) and classes. Transactions in Fund shares were as follows:
| | | | | | | | | | | | | | | | |
Arizona Fund | | | | | | | | | | | | |
| | | Year Ended July 31, 2019 | |
| | | Class A | | | Class B | | | Class C | | | Class I | |
| | | | |
Sales | | | 428,058 | | | | — | | | | 115,415 | | | | 1,021,968 | |
| | | | |
Issued to shareholders electing to receive payments of distributions in Fund shares | | | 84,623 | | | | — | | | | 7,738 | | | | 37,917 | |
| | | | |
Redemptions | | | (594,126 | ) | | | — | | | | (142,248 | ) | | | (455,733 | ) |
| | | | |
Converted from Class C shares | | | 72,111 | | | | — | | | | — | | | | — | |
| | | | |
Converted to Class A shares | | | — | | | | — | | | | (64,823 | ) | | | — | |
| | | | |
Net increase (decrease) | | | (9,334 | ) | | | — | | | | (83,918 | ) | | | 604,152 | |
| |
| | | Year Ended July 31, 2018 | |
| | | Class A | | | Class B(1) | | | Class C | | | Class I | |
| | | | |
Sales | | | 249,531 | | | | — | | | | 67,846 | | | | 491,756 | |
| | | | |
Issued to shareholders electing to receive payments of distributions in Fund shares | | | 104,635 | | | | 164 | | | | 10,726 | | | | 33,576 | |
| | | | |
Redemptions | | | (1,053,523 | ) | | | (1,235 | ) | | | (165,480 | ) | | | (891,157 | ) |
| | | | |
Converted from Class B shares | | | 11,735 | | | | — | | | | — | | | | — | |
| | | | |
Converted to Class A shares | | | — | | | | (10,558 | ) | | | — | | | | — | |
| | | | |
Merger from Class B shares | | | 11,342 | | | | — | | | | — | | | | — | |
| | | | |
Merger to Class A shares | | | — | | | | (10,205 | ) | | | — | | | | — | |
| | | | |
Net decrease | | | (676,280 | ) | | | (21,834 | ) | | | (86,908 | ) | | | (365,825 | ) |
| (1) | At the close of business on April 5, 2018, Class B shares of Arizona Fund were merged into Class A shares. |
| | | | | | | | | | | | | | | | |
Connecticut Fund | | | | | | | | | | | | |
| | | Year Ended July 31, 2019 | |
| | | Class A | | | Class B | | | Class C | | | Class I | |
| | | | |
Sales | | | 296,830 | | | | — | | | | 151,480 | | | | 1,085,269 | |
| | | | |
Issued to shareholders electing to receive payments of distributions in Fund shares | | | 127,199 | | | | — | | | | 6,578 | | | | 43,938 | |
| | | | |
Redemptions | | | (878,661 | ) | | | — | | | | (98,151 | ) | | | (458,144 | ) |
| | | | |
Converted from Class C shares | | | 52,842 | | | | — | | | | — | | | | — | |
| | | | |
Converted to Class A shares | | | — | | | | — | | | | (52,997 | ) | | | — | |
| | | | |
Net increase (decrease) | | | (401,790 | ) | | | — | | | | 6,910 | | | | 671,063 | |
Eaton Vance
Municipal Income Funds
July 31, 2019
Notes to Financial Statements — continued
| | | | | | | | | | | | | | | | |
| | | Year Ended July 31, 2018 | |
| | | Class A | | | Class B(1) | | | Class C | | | Class I | |
| | | | |
Sales | | | 287,983 | | | | 289 | | | | 19,718 | | | | 477,978 | |
| | | | |
Issued to shareholders electing to receive payments of distributions in Fund shares | | | 151,595 | | | | 287 | | | | 9,783 | | | | 33,029 | |
| | | | |
Redemptions | | | (787,576 | ) | | | (10,063 | ) | | | (142,526 | ) | | | (711,103 | ) |
| | | | |
Converted from Class B shares | | | 5,767 | | | | — | | | | — | | | | — | |
| | | | |
Converted to Class A shares | | | — | | | | (5,792 | ) | | | — | | | | — | |
| | | | |
Merger from Class B shares | | | 30,050 | | | | — | | | | — | | | | — | |
| | | | |
Merger to Class A shares | | | — | | | | (30,191 | ) | | | — | | | | — | |
| | | | |
Net decrease | | | (312,181 | ) | | | (45,470 | ) | | | (113,025 | ) | | | (200,096 | ) |
| (1) | At the close of business on April 5, 2018, Class B shares of Connecticut Fund were merged into Class A shares. |
| | | | | | | | | | | | | | | | |
Minnesota Fund | | | | | | | | | | | | |
| | | Year Ended July 31, 2019 | |
| | | Class A | | | Class B | | | Class C | | | Class I | |
| | | | |
Sales | | | 1,022,303 | | | | — | | | | 132,503 | | | | 4,955,232 | |
| | | | |
Issued to shareholders electing to receive payments of distributions in Fund shares | | | 129,262 | | | | — | | | | 12,126 | | | | 131,702 | |
| | | | |
Redemptions | | | (1,479,187 | ) | | | — | | | | (266,971 | ) | | | (3,819,184 | ) |
| | | | |
Converted from Class C shares | | | 207,494 | | | | — | | | | — | | | | — | |
| | | | |
Converted to Class A shares | | | — | | | | — | | | | (192,932 | ) | | | — | |
| | | | |
Net increase (decrease) | | | (120,128 | ) | | | — | | | | (315,274 | ) | | | 1,267,750 | |
| |
| | | Year Ended July 31, 2018 | |
| | | Class A | | | Class B(1) | | | Class C | | | Class I | |
| | | | |
Sales | | | 629,371 | | | | — | | | | 132,593 | | | | 2,885,704 | |
| | | | |
Issued to shareholders electing to receive payments of distributions in Fund shares | | | 150,407 | | | | 28 | | | | 18,382 | | | | 136,471 | |
| | | | |
Redemptions | | | (1,218,930 | ) | | | (42 | ) | | | (341,659 | ) | | | (2,965,746 | ) |
| | | | |
Converted from Class B shares | | | 4,633 | | | | — | | | | — | | | | — | |
| | | | |
Converted to Class A shares | | | — | | | | (4,305 | ) | | | — | | | | — | |
| | | | |
Merger from Class B shares | | | 696 | | | | — | | | | — | | | | — | |
| | | | |
Merger to Class A shares | | | — | | | | (647 | ) | | | — | | | | — | |
| | | | |
Net increase (decrease) | | | (433,823 | ) | | | (4,966 | ) | | | (190,684 | ) | | | 56,429 | |
| (1) | At the close of business on April 5, 2018, Class B shares of Minnesota Fund were merged into Class A shares. |
Eaton Vance
Municipal Income Funds
July 31, 2019
Notes to Financial Statements — continued
| | | | | | | | | | | | | | | | |
New Jersey Fund | | | | | | | | | | | | |
| | | Year Ended July 31, 2019 | |
| | | Class A | | | Class B | | | Class C | | | Class I | |
| | | | |
Sales | | | 666,706 | | | | — | | | | 320,406 | | | | 3,400,424 | |
| | | | |
Issued to shareholders electing to receive payments of distributions in Fund shares | | | 267,697 | | | | — | | | | 31,360 | | | | 133,924 | |
| | | | |
Redemptions | | | (1,615,835 | ) | | | — | | | | (438,139 | ) | | | (1,708,162 | ) |
| | | | |
Converted from Class C shares | | | 548,184 | | | | — | | | | — | | | | — | |
| | | | |
Converted to Class A shares | | | — | | | | — | | | | (525,165 | ) | | | — | |
| | | | |
Net increase (decrease) | | | (133,248 | ) | | | — | | | | (611,538 | ) | | | 1,826,186 | |
| |
| | | Year Ended July 31, 2018 | |
| | | Class A | | | Class B | | | Class C | | | Class I | |
| | | | |
Sales | | | 613,867 | | | | — | | | | 170,804 | | | | 2,302,065 | |
| | | | |
Issued to shareholders electing to receive payments of distributions in Fund shares | | | 315,489 | | | | — | | | | 47,221 | | | | 110,440 | |
| | | | |
Redemptions | | | (1,388,011 | ) | | | — | | | | (564,547 | ) | | | (2,298,670 | ) |
| | | | |
Net increase (decrease) | | | (458,655 | ) | | | — | | | | (346,522 | ) | | | 113,835 | |
| | | | |
Pennsylvania Fund | | | | | | | | | | | | |
| | | Year Ended July 31, 2019 | |
| | | Class A | | | Class B | | | Class C | | | Class I | |
| | | | |
Sales | | | 1,131,519 | | | | — | | | | 154,205 | | | | 2,670,861 | |
| | | | |
Issued to shareholders electing to receive payments of distributions in Fund shares | | | 431,069 | | | | — | | | | 56,708 | | | | 94,458 | |
| | | | |
Redemptions | | | (1,891,199 | ) | | | — | | | | (515,244 | ) | | | (2,041,143 | ) |
| | | | |
Converted from Class C shares | | | 877,891 | | | | — | | | | — | | | | — | |
| | | | |
Converted to Class A shares | | | — | | | | — | | | | (847,823 | ) | | | — | |
| | | | |
Net increase (decrease) | | | 549,280 | | | | — | | | | (1,152,154 | ) | | | 724,176 | |
| |
| | | Year Ended July 31, 2018 | |
| | | Class A | | | Class B(1) | | | Class C | | | Class I | |
| | | | |
Sales | | | 503,731 | | | | — | | | | 76,511 | | | | 1,067,282 | |
| | | | |
Issued to shareholders electing to receive payments of distributions in Fund shares | | | 463,417 | | | | 1,421 | | | | 82,469 | | | | 92,235 | |
| | | | |
Redemptions | | | (2,218,776 | ) | | | (4,473 | ) | | | (826,248 | ) | | | (1,546,682 | ) |
| | | | |
Converted from Class B shares | | | 59,168 | | | | — | | | | — | | | | — | |
| | | | |
Converted to Class A shares | | | — | | | | (57,165 | ) | | | — | | | | — | |
| | | | |
Merger from Class B shares | | | 47,172 | | | | — | | | | — | | | | — | |
| | | | |
Merger to Class A shares | | | — | | | | (45,574 | ) | | | — | | | | — | |
| | | | |
Net decrease | | | (1,145,288 | ) | | | (105,791 | ) | | | (667,268 | ) | | | (387,165 | ) |
| (1) | At the close of business on April 5, 2018, Class B shares of Pennsylvania Fund were merged into Class A shares. |
Eaton Vance
Municipal Income Funds
July 31, 2019
Notes to Financial Statements — continued
8 Line of Credit
The Funds participate with other portfolios and funds managed by EVM and its affiliates in a $625 million unsecured line of credit agreement with a group of banks, which is in effect through October 29, 2019. Borrowings are made by the Funds solely to facilitate the handling of unusual and/or unanticipated short-term cash requirements. Interest is charged to each Fund based on its borrowings at an amount above either the Eurodollar rate or Federal Funds rate. In addition, a fee computed at an annual rate of 0.15% on the daily unused portion of the line of credit is allocated among the participating portfolios and funds at the end of each quarter. Because the line of credit is not available exclusively to the Funds, a Fund may be unable to borrow some or all of its requested amounts at any particular time. The Funds did not have any significant borrowings or allocated fees during the year ended July 31, 2019.
9 Financial Instruments
The Funds may trade in financial instruments withoff-balance sheet risk in the normal course of their investing activities. These financial instruments may include financial futures contracts and may involve, to a varying degree, elements of risk in excess of the amounts recognized for financial statement purposes. The notional or contractual amounts of these instruments represent the investment a Fund has in particular classes of financial instruments and do not necessarily represent the amounts potentially subject to risk. The measurement of the risks associated with these instruments is meaningful only when all related and offsetting transactions are considered. A summary of obligations under these financial instruments at July 31, 2019 is included in the Portfolio of Investments. At July 31, 2019, the Funds had sufficient cash and/or securities to cover commitments under these contracts.
Each Fund is subject to interest rate risk in the normal course of pursuing its investment objective. Because the Funds hold fixed-rate bonds, the value of these bonds may decrease if interest rates rise. The Funds enter into U.S. Treasury futures contracts to hedge against changes in interest rates.
The fair values of open derivative instruments (not considered to be hedging instruments for accounting disclosure purposes) and whose primary underlying risk exposure is interest rate risk at July 31, 2019 were as follows:
| | | | |
| | | Arizona
Fund | |
| |
Liability Derivative: | | | | |
| |
Futures Contracts | | $ | (92,784 | )(1) |
| |
Total | | $ | (92,784 | ) |
| (1) | Only the current day’s variation margin on open futures contracts is reported within the Statement of Assets and Liabilities as Receivable or Payable for variation margin on open financial futures contracts, as applicable. |
The effect of derivative instruments (not considered to be hedging instruments for accounting disclosure purposes) on the Statement of Operations and whose primary underlying risk exposure is interest rate risk for the year ended July 31, 2019 was as follows:
| | | | | | | | |
| | | Arizona
Fund | | | Connecticut
Fund | |
| | |
Realized Gain (Loss) on Derivatives Recognized in Income | | $ | (228,471 | )(1) | | $ | (48,818 | )(1) |
| | |
Change in Unrealized Appreciation (Depreciation) on Derivatives Recognized in Income | | $ | (76,971 | )(2) | | $ | 7,116 | (2) |
| (1) | Statement of Operations location: Net realized gain (loss) – Financial futures contracts. |
| (2) | Statement of Operations location: Change in unrealized appreciation (depreciation) – Financial futures contracts. |
The average notional cost of futures contracts outstanding during the year ended July 31, 2019, which is indicative of the volume of this derivative type, was approximately as follows:
| | | | | | | | |
| | | Arizona
Fund | | | Connecticut
Fund | |
| | |
Average Notional Cost: | | | | | | | | |
| | |
Futures Contracts — Short | | $ | 2,896,000 | | | $ | 590,000 | |
Eaton Vance
Municipal Income Funds
July 31, 2019
Notes to Financial Statements — continued
10 Fair Value Measurements
Under generally accepted accounting principles for fair value measurements, a three-tier hierarchy to prioritize the assumptions, referred to as inputs, is used in valuation techniques to measure fair value. The three-tier hierarchy of inputs is summarized in the three broad levels listed below.
| • | | Level 1 – quoted prices in active markets for identical investments |
| • | | Level 2 – other significant observable inputs (including quoted prices for similar investments, interest rates, prepayment speeds, credit risk, etc.) |
| • | | Level 3 – significant unobservable inputs (including a fund’s own assumptions in determining the fair value of investments) |
In cases where the inputs used to measure fair value fall in different levels of the fair value hierarchy, the level disclosed is determined based on the lowest level input that is significant to the fair value measurement in its entirety. The inputs or methodology used for valuing securities are not necessarily an indication of the risk associated with investing in those securities.
At July 31, 2019, the hierarchy of inputs used in valuing the Funds’ investments and open derivative instruments, which are carried at value, were as follows:
| | | | | | | | | | | | | | | | |
Arizona Fund | |
| Asset Description | | Level 1 | | | Level 2 | | | Level 3 | | | Total | |
| | | | |
Tax-Exempt Investments | | $ | — | | | $ | 56,989,210 | | | $ | — | | | $ | 56,989,210 | |
| | | | |
Total Investments | | $ | — | | | $ | 56,989,210 | | | $ | — | | | $ | 56,989,210 | |
| | | | |
Liability Description | | | | | | | | | | | | | | | | |
| | | | |
Futures Contracts | | $ | (92,784 | ) | | $ | — | | | $ | — | | | $ | (92,784 | ) |
| | | | |
Total | | $ | (92,784 | ) | | $ | — | | | $ | — | | | $ | (92,784 | ) |
|
Connecticut Fund | |
| Asset Description | | Level 1 | | | Level 2 | | | Level 3 | | | Total | |
| | | | |
Tax-Exempt Investments | | $ | — | | | $ | 76,284,633 | | | $ | — | | | $ | 76,284,633 | |
| | | | |
Total Investments | | $ | — | | | $ | 76,284,633 | | | $ | — | | | $ | 76,284,633 | |
|
Minnesota Fund | |
| Asset Description | | Level 1 | | | Level 2 | | | Level 3 | | | Total | |
| | | | |
Tax-Exempt Investments | | $ | — | | | $ | 153,932,479 | | | $ | — | | | $ | 153,932,479 | |
| | | | |
Total Investments | | $ | — | | | $ | 153,932,479 | | | $ | — | | | $ | 153,932,479 | |
|
New Jersey Fund | |
| Asset Description | | Level 1 | | | Level 2 | | | Level 3 | | | Total | |
| | | | |
Tax-Exempt Municipal Securities | | $ | — | | | $ | 160,517,940 | | | $ | — | | | $ | 160,517,940 | |
| | | | |
Taxable Municipal Securities | | | — | | | | 5,530,256 | | | | — | | | | 5,530,256 | |
| | | | |
Trust Units | | | — | | | | 256,871 | | | | — | | | | 256,871 | |
| | | | |
Total Investments | | $ | — | | | $ | 166,305,067 | | | $ | — | | | $ | 166,305,067 | |
Eaton Vance
Municipal Income Funds
July 31, 2019
Notes to Financial Statements — continued
| | | | | | | | | | | | | | | | |
Pennsylvania Fund | | | | | | | | | | | | |
| Asset Description | | Level 1 | | | Level 2 | | | Level 3 | | | Total | |
| | | | |
Tax-Exempt Municipal Securities | | $ | — | | | $ | 185,354,748 | | | $ | — | | | $ | 185,354,748 | |
| | | | |
Taxable Municipal Securities | | | — | | | | 347,018 | | | | — | | | | 347,018 | |
| | | | |
Trust Units | | | — | | | | 231,963 | | | | — | | | | 231,963 | |
| | | | |
Total Investments | | $ | — | | | $ | 185,933,729 | | | $ | — | | | $ | 185,933,729 | |
Eaton Vance
Municipal Income Funds
July 31, 2019
Report of Independent Registered Public Accounting Firm
To the Trustees of Eaton Vance Municipals Trust and Shareholders of Eaton Vance Arizona Municipal Income Fund, Eaton Vance Connecticut Municipal Income Fund, Eaton Vance Minnesota Municipal Income Fund, Eaton Vance New Jersey Municipal Income Fund and Eaton Vance Pennsylvania Municipal Income Fund:
Opinion on the Financial Statements and Financial Highlights
We have audited the accompanying statements of assets and liabilities of Eaton Vance Arizona Municipal Income Fund, Eaton Vance Connecticut Municipal Income Fund, Eaton Vance Minnesota Municipal Income Fund, Eaton Vance New Jersey Municipal Income Fund and Eaton Vance Pennsylvania Municipal Income Fund (collectively, the “Funds”) (certain of the funds constituting Eaton Vance Municipals Trust), including the portfolios of investments, as of July 31, 2019, the related statements of operations for the year then ended, the statements of changes in net assets for each of the two years in the period then ended, the financial highlights for each of the five years in the period then ended, and the related notes. In our opinion, the financial statements and financial highlights present fairly, in all material respects, the financial position of each of the Funds as of July 31, 2019, and the results of their operations for the year then ended, the changes in their net assets for each of the two years in the period then ended, and the financial highlights for each of the five years in the period then ended in conformity with accounting principles generally accepted in the United States of America.
Basis for Opinion
These financial statements and financial highlights are the responsibility of the Funds’ management. Our responsibility is to express an opinion on the Funds’ financial statements and financial highlights based on our audits. We are a public accounting firm registered with the Public Company Accounting Oversight Board (United States) (PCAOB) and are required to be independent with respect to the Funds in accordance with the U.S. federal securities laws and the applicable rules and regulations of the Securities and Exchange Commission and the PCAOB.
We conducted our audits in accordance with the standards of the PCAOB. Those standards require that we plan and perform the audit to obtain reasonable assurance about whether the financial statements and financial highlights are free of material misstatement, whether due to error or fraud. The Funds are not required to have, nor were we engaged to perform, an audit of their internal control over financial reporting. As part of our audits we are required to obtain an understanding of internal control over financial reporting but not for the purpose of expressing an opinion on the effectiveness of the Funds’ internal control over financial reporting. Accordingly, we express no such opinion.
Our audits included performing procedures to assess the risks of material misstatement of the financial statements and financial highlights, whether due to error or fraud, and performing procedures that respond to those risks. Such procedures included examining, on a test basis, evidence regarding the amounts and disclosures in the financial statements and financial highlights. Our audits also included evaluating the accounting principles used and significant estimates made by management, as well as evaluating the overall presentation of the financial statements and financial highlights. Our procedures included confirmation of securities owned as of July 31, 2019, by correspondence with the custodian and brokers; when replies were not received from brokers, we performed other auditing procedures. We believe that our audits provide a reasonable basis for our opinion.
/s/ Deloitte & Touche LLP
Boston, Massachusetts
September 19, 2019
We have served as the auditor of one or more Eaton Vance investment companies since 1959.
Eaton Vance
Municipal Income Funds
July 31, 2019
Federal Tax Information (Unaudited)
The Form1099-DIV you receive in February 2020 will show the tax status of all distributions paid to your account in calendar year 2019. Shareholders are advised to consult their own tax adviser with respect to the tax consequences of their investment in the Funds. As required by the Internal Revenue Code and/or regulations, shareholders must be notified regarding exempt-interest dividends.
Exempt-Interest Dividends. For the fiscal year ended July 31, 2019, the Funds designate the following percentages of distributions from net investment income as exempt-interest dividends:
| | | | |
| |
Arizona Municipal Income Fund | | | 100.00 | % |
| |
Connecticut Municipal Income Fund | | | 98.23 | % |
| |
Minnesota Municipal Income Fund | | | 100.00 | % |
| |
New Jersey Municipal Income Fund | | | 95.72 | % |
| |
Pennsylvania Municipal Income Fund | | | 99.65 | % |
Eaton Vance
Municipal Income Funds
July 31, 2019
Board of Trustees’ Contract Approval
Overview of the Contract Review Process
The Investment Company Act of 1940, as amended (the “1940 Act”), provides, in substance, that the investment advisory agreement between a fund and its investment adviser will continue in effect fromyear-to-year only if its continuation is approved on an annual basis by a vote of the fund’s board of trustees, including a majority of the trustees who are not “interested persons” of the fund (“independent trustees”), cast in person at a meeting called for the purpose of considering such approval.
At a meeting held on April 24, 2019, the Boards of Trustees/Directors (collectively, the “Board”) of the registered investment companies advised by Eaton Vance Management or its affiliate, Boston Management and Research (the “Eaton Vance Funds”), including a majority of the independent trustees (the “Independent Trustees”), voted to approve the continuation of existing investment advisory andsub-advisory agreements for each of the Eaton Vance Funds for an additionalone-year period. In voting its approval, the Board relied upon the affirmative recommendation of its Contract Review Committee, which is a committee exclusively comprised of Independent Trustees. Prior to making its recommendation, the Contract Review Committee reviewed information furnished by the adviser andsub-adviser (where applicable) to each of the Eaton Vance Funds (including information specifically requested by the Board) for a series of meetings held between February and April 2019. Members of the Contract Review Committee also considered information received at prior meetings of the Board and its committees, to the extent such information was relevant to the Contract Review Committee’s annual evaluation of the investment advisory andsub-advisory agreements.
Among other things, the information the Board considered included the following (for funds that invest through one or more underlying portfolios, references to “each fund” in this section may include information that was considered at the portfolio-level):
Information about Fees, Performance and Expenses
| | • | | A report from an independent data provider comparing advisory and related fees paid by each fund to such fees paid by comparable funds, as identified by the independent data provider (“comparable funds”); |
| | • | | A report from an independent data provider comparing each fund’s total expense ratio (and its components) to those of comparable funds; |
| | • | | A report from an independent data provider comparing the investment performance of each fund (including, where relevant, yield data, Sharpe ratios and information ratios) to the investment performance of comparable funds over various time periods; |
| | • | | Data regarding investment performance relative to benchmark indices and, in certain instances, to customized groups of peer funds and blended indices identified by the adviser in consultation with the Portfolio Management Committee of the Board; |
| | • | | Comparative information concerning the fees charged and services provided by the adviser andsub-adviser (where applicable) to each fund in managing other accounts (including mutual funds, other collective investment funds and institutional accounts) using investment strategies and techniques similar to those used in managing such fund(s), if any; |
| | • | | Profitability analyses with respect to the adviser andsub-adviser (where applicable) to each of the funds; |
Information about Portfolio Management and Trading
| | • | | Descriptions of the investment management services provided to each fund, as well as each of the funds’ investment strategies and policies; |
| | • | | The procedures and processes used to determine the fair value of fund assets, when necessary, and actions taken to monitor and test the effectiveness of such procedures and processes; |
| | • | | Information about the policies and practices of each fund’s adviser andsub-adviser (where applicable and in the context of asub-adviser with trading responsibilities) with respect to trading, including their processes for seeking best execution of portfolio transactions; |
| | • | | Information about the allocation of brokerage transactions and the benefits, if any, received by the adviser andsub-adviser (where applicable and in the context of asub-adviser with trading responsibilities) to each fund as a result of brokerage allocation, including information concerning the acquisition of research through client commission arrangements and policies with respect to “soft dollars”; |
| | • | | Data relating to the portfolio turnover rate of each fund; |
Information about each Adviser andSub-adviser
| | • | | Reports detailing the financial results and condition of the adviser andsub-adviser (where applicable) to each fund; |
| | • | | Information regarding the individual investment professionals whose responsibilities include portfolio management and investment research for the funds, and, for portfolio managers and certain other investment professionals, information relating to their responsibilities with respect to managing other mutual funds and investment accounts, if applicable; |
| | • | | The Code of Ethics of the adviser and its affiliates and thesub-adviser (where applicable) of each fund, together with information relating to compliance with, and the administration of, such codes; |
| | • | | Policies and procedures relating to proxy voting and the handling of corporate actions and class actions; |
| | • | | Information concerning the resources devoted to compliance efforts undertaken by the adviser and its affiliates and thesub-adviser (where applicable) of each fund, if any, including descriptions of their various compliance programs and their record of compliance; |
| | • | | Information concerning the business continuity and disaster recovery plans of the adviser and its affiliates and thesub-adviser (where applicable) of each fund, if any; |
Eaton Vance
Municipal Income Funds
July 31, 2019
Board of Trustees’ Contract Approval — continued
| | • | | A description of Eaton Vance Management’s and Boston Management and Research’s oversight ofsub-advisers, including with respect to regulatory and compliance issues, investment management and other matters; |
Other Relevant Information
| | • | | Information concerning the nature, cost and character of the administrative and othernon-investment advisory services provided by Eaton Vance Management and its affiliates; |
| | • | | Information concerning management of the relationship with the custodian, subcustodians and fund accountants by the adviser or administrator to each of the funds; and |
| | • | | The terms of each investment advisory agreement. |
During the various meetings of the Board and its committees throughout the twelve months ended April 2019, the Trustees received information from portfolio managers and other investment professionals of the advisers andsub-advisers (where applicable) of the funds regarding investment and performance matters, and considered various investment and trading strategies used in pursuing the funds’ investment objectives. The Trustees also received information regarding risk management techniques employed in connection with the management of the funds. The Board and its Committees evaluated issues pertaining to industry and regulatory developments, compliance procedures, fund governance and other issues with respect to the funds, and received and participated in reports and presentations provided by Eaton Vance Management, Boston Management and Research and fundsub-advisers (as applicable), with respect to such matters. In addition to the formal meetings of the Board and its committees, the Independent Trustees held regular teleconferences to discuss, among other topics, matters relating to the continuation of investment advisory andsub-advisory agreements.
The Contract Review Committee was advised throughout the contract review process by Goodwin Procter LLP, independent legal counsel for the Independent Trustees. The members of the Contract Review Committee, with the advice of such counsel, exercised their own business judgment in determining the material factors to be considered in evaluating each investment advisory andsub-advisory agreement and the weight to be given to each such factor. The conclusions reached with respect to each investment advisory andsub-advisory agreement were based on a comprehensive evaluation of all the information provided and not any single factor. Moreover, each member of the Contract Review Committee may have placed varying emphasis on particular factors in reaching conclusions with respect to each investment advisory andsub-advisory agreement. In evaluating each investment advisory andsub-advisory agreement, including the fee structures and other terms contained in such agreements, the members of the Contract Review Committee were also informed by multiple years of analysis and discussion with the adviser andsub-adviser (where applicable) to each of the Eaton Vance Funds.
Results of the Process
Based on its consideration of the foregoing, and such other information as it deemed relevant, including the factors and conclusions described below, the Contract Review Committee concluded that the continuation of the investment advisory agreements between each of the following funds:
| | • | | Eaton Vance Arizona Municipal Income Fund |
| | • | | Eaton Vance Connecticut Municipal Income Fund |
| | • | | Eaton Vance Minnesota Municipal Income Fund |
| | • | | Eaton Vance New Jersey Municipal Income Fund |
| | • | | Eaton Vance Pennsylvania Municipal Income Fund |
(the “Funds”) and Boston Management and Research (the “Adviser”), including their respective fee structures, are in the interests of shareholders and, therefore, recommended to the Board approval of each agreement. Based on the recommendation of the Contract Review Committee, the Board, including a majority of the Independent Trustees, voted to approve continuation of the investment advisory agreement for each Fund.
Nature, Extent and Quality of Services
In considering whether to approve the investment advisory agreements for the Funds, the Board evaluated the nature, extent and quality of services provided to the Funds by the Adviser.
The Board considered the Adviser’s management capabilities and investment processes in light of the types of investments held by each Fund, including the education, experience and number of investment professionals and other personnel who provide portfolio management, investment research, and similar services to the Funds. In particular, the Board considered, where relevant, the abilities and experience of the Adviser’s investment professionals in analyzing factors such as credit risk, tax efficiency, and special considerations relevant to investing in municipal bonds. The Board considered the Adviser’s municipal bond team, which includes investment professionals and credit specialists who provide services to the Funds. The Board also took into account the resources dedicated to portfolio management and other services, the compensation methods of the Adviser and other factors, including the reputation and resources of the Adviser to recruit and retain highly qualified research, advisory and supervisory investment professionals. In addition, the Board considered the time and attention devoted to the Eaton Vance Funds, including each Fund, by senior management, as well as the infrastructure, operational capabilities and support staff in place to assist in the portfolio management and operations of the Funds, including the provision of administrative services. The Board also considered the business-related and other risks to which the Adviser or its affiliates may be subject in managing the Funds.
Eaton Vance
Municipal Income Funds
July 31, 2019
Board of Trustees’ Contract Approval — continued
The Board considered the compliance programs of the Adviser and relevant affiliates thereof. The Board considered compliance and reporting matters regarding, among other things, personal trading by investment professionals, disclosure of portfolio holdings, late trading, frequent trading, portfolio valuation, business continuity and the allocation of investment opportunities. The Board also considered the responses of the Adviser and its affiliates to requests in recent years from regulatory authorities, such as the Securities and Exchange Commission and the Financial Industry Regulatory Authority.
The Board considered shareholder and other administrative services provided or managed by Eaton Vance Management and its affiliates, including transfer agency and accounting services. The Board evaluated the benefits to shareholders of investing in a fund that is a part of a large fund complex offering exposure to a variety of asset classes and investment disciplines, as well as the ability, in many cases, to exchange an investment among different funds without incurring additional sales charges.
After consideration of the foregoing factors, among others, the Board concluded that the nature, extent and quality of services provided by the Adviser, taken as a whole, are appropriate and consistent with the terms of the investment advisory agreements.
Fund Performance
The Board compared each Fund’s investment performance to that of comparable funds and appropriate benchmark indices, and, where relevant, a customized peer group of similarly managed funds, and assessed each Fund’s performance on the basis of total return and current income return. The Board’s review included comparative performance data with respect to each Fund for theone-, three-, five- andten-year periods ended September 30, 2018.
In this regard, the Board noted each Fund’s performance relative to its peer group, custom peer group, if applicable, and primary and secondary benchmark indexes for the three-year period, as follows:
| | | | | | | | |
| Fund | | Performance Relative to: |
| | Median of
Peers | | Median of
Custom Peers | | Primary
Index | | Secondary
Index |
| | | | |
Eaton Vance Arizona Municipal Income Fund | | Higher | | Higher | | Higher | | Lower |
| | | | |
Eaton Vance Connecticut Municipal Income Fund | | Higher | | Higher | | Lower | | Lower |
| | | | |
Eaton Vance Minnesota Municipal Income Fund | | Lower | | n/a | | Lower | | Lower |
| | | | |
Eaton Vance New Jersey Municipal Income Fund | | Consistent with | | n/a | | Higher | | Lower |
| | | | |
Eaton Vance Pennsylvania Municipal Income Fund | | Lower | | n/a | | Lower | | Lower |
The Board considered, among other things, the Adviser’s efforts to generate competitive levels of tax exempt current income over time through investments that, relative to its comparable funds, focus on higher quality municipal bonds with longer maturities. On the basis of the foregoing, the performance of the Eaton Vance Pennsylvania Municipal Income Fund and the Eaton Vance Minnesota Municipal Income Fund over other periods and other relevant information provided by the Adviser in response to inquiries from the Contract Review Committee, the Board concluded that the performance of each Fund was satisfactory. With respect to all other Funds, the Board concluded that the performance of each Fund was satisfactory.
Eaton Vance
Municipal Income Funds
July 31, 2019
Board of Trustees’ Contract Approval — continued
Management Fees and Expenses
The Board considered contractual fee rates payable by each Fund for advisory and administrative services (referred to collectively as “management fees”). As part of its review, the Board considered each Fund’s management fees and total expense ratio for theone-year period ended September 30, 2018, as compared to those of comparable funds, before and after giving effect to any undertaking to waive fees or reimburse expenses. The Board also considered factors that had an impact on each Fund’s total expense ratio relative to comparable funds.
After considering the foregoing information, and in light of the nature, extent and quality of the services provided by the Adviser, the Board concluded that the management fees charged for advisory and related services are reasonable.
Profitability and“Fall-Out” Benefits
The Board considered the level of profits realized by the Adviser and relevant affiliates thereof in providing investment advisory and administrative services to each Fund and to all Eaton Vance Funds as a group. The Board considered the level of profits realized without regard to marketing support or other payments by the Adviser and its affiliates to third parties in respect of distribution services.
The Board concluded that, in light of the foregoing factors and the nature, extent and quality of the services rendered, the profits realized by the Adviser and its affiliates are deemed not to be excessive.
The Board also considered direct or indirectfall-out benefits received by the Adviser and its affiliates in connection with their respective relationships with the Funds, including the benefits of research services that may be available to the Adviser as a result of securities transactions effected for the Funds and other investment advisory clients.
Economies of Scale
In reviewing management fees and profitability, the Board also considered the extent to which the Adviser and its affiliates, on the one hand, and each Fund, on the other hand, can expect to realize benefits from economies of scale as the assets of each Fund increase. The Board acknowledged the difficulty in accurately measuring the benefits resulting from economies of scale, if any, with respect to the management of any specific fund or group of funds. The Board reviewed data summarizing the increases and decreases in the assets of each Fund and of all Eaton Vance Funds as a group over various time periods, and evaluated the extent to which the total expense ratio of each Fund and the profitability of the Adviser and its affiliates may have been affected by such increases or decreases. Based upon the foregoing, the Board concluded that each Fund currently shares in the benefits from economies of scale, if any, when they are realized by the Adviser. The Board also concluded that the structure of each advisory fee, which includes breakpoints at several asset levels, will allow each Fund to continue to benefit from any economies of scale in the future.
Eaton Vance
Municipal Income Funds
July 31, 2019
Management and Organization
Fund Management. The Trustees of Eaton Vance Municipals Trust (the Trust) are responsible for the overall management and supervision of the Trust’s affairs. The Trustees and officers of the Trust are listed below. Except as indicated, each individual has held the office shown or other offices in the same company for the last five years. Trustees and officers of the Trust hold indefinite terms of office. The “Noninterested Trustees” consist of those Trustees who are not “interested persons” of the Trust, as that term is defined under the 1940 Act. The business address of each Trustee and officer is Two International Place, Boston, Massachusetts 02110. As used below, “EVC” refers to Eaton Vance Corp., “EV” refers to Eaton Vance, Inc., “EVM” refers to Eaton Vance Management, “BMR” refers to Boston Management and Research and “EVD” refers to Eaton Vance Distributors, Inc. EVC and EV are the corporate parent and trustee, respectively, of EVM and BMR. EVD is the Funds’ principal underwriter and a wholly-owned subsidiary of EVC. Each officer affiliated with Eaton Vance may hold a position with other Eaton Vance affiliates that is comparable to his or her position with EVM listed below. Each Trustee oversees 165 portfolios in the Eaton Vance Complex (including all master and feeder funds in a master feeder structure). Each officer serves as an officer of certain other Eaton Vance funds. Each Trustee and officer serve until his or her successor is elected.
| | | | | | |
| Name and Year of Birth | | Trust
Position(s) | | Trustee Since(1) | | Principal Occupation(s) and Other Directorships During Past Five Years and Other Relevant Experience |
| | | |
| Interested Trustee | | | | | | |
| | | |
Thomas E. Faust Jr. 1958 | | Trustee | | 2007 | | Chairman, Chief Executive Officer and President of EVC, Director and President of EV, Chief Executive Officer and President of EVM and BMR, and Director of EVD. Trustee and/or officer of 165 registered investment companies. Mr. Faust is an interested person because of his positions with EVM, BMR, EVD, EVC and EV, which are affiliates of the Trust. Other Directorships in the Last Five Years.(2) Director of EVC and Hexavest Inc. (investment management firm). |
| | |
| Noninterested Trustees | | | | |
| | | |
Mark R. Fetting 1954 | | Trustee | | 2016 | | Private investor. Formerly held various positions at Legg Mason, Inc. (investment management firm) (2000-2012), including President, Chief Executive Officer, Director and Chairman (2008-2012), Senior Executive Vice President (2004-2008) and Executive Vice President (2001-2004). Formerly, President of Legg Mason family of funds (2001-2008). Formerly, Division President and Senior Officer of Prudential Financial Group, Inc. and related companies (investment management firm)(1991-2000). Other Directorships in the Last Five Years. None. |
| | | |
Cynthia E. Frost 1961 | | Trustee | | 2014 | | Private investor. Formerly, Chief Investment Officer of Brown University (university endowment) (2000-2012). Formerly, Portfolio Strategist for Duke Management Company (university endowment manager) (1995-2000). Formerly, Managing Director, Cambridge Associates (investment consulting company) (1989-1995). Formerly, Consultant, Bain and Company (management consulting firm)
(1987-1989). Formerly, Senior Equity Analyst, BA Investment Management Company (1983-1985). Other Directorships in the Last Five Years.None. |
| | | |
George J. Gorman 1952 | | Trustee | | 2014 | | Principal at George J. Gorman LLC (consulting firm). Formerly, Senior Partner at Ernst & Young LLP (a registered public accounting firm) (1974-2009). Other Directorships in the Last Five Years.Formerly, Trustee of the BofA Funds Series Trust (11 funds) (2011-2014) and of the Ashmore Funds (9 funds)
(2010-2014). |
| | | |
Valerie A. Mosley 1960 | | Trustee | | 2014 | | Chairwoman and Chief Executive Officer of Valmo Ventures (a consulting and investment firm). Former Partner and Senior Vice President, Portfolio Manager and Investment Strategist at Wellington Management Company, LLP (investment management firm) (1992-2012). Former Chief Investment Officer, PG Corbin Asset Management (1990-1992). Formerly worked in institutional corporate bond sales at Kidder Peabody (1986-1990). Other Directorships in the Last Five Years.(2) Director of Envestnet, Inc. (provider of intelligent systems for wealth management and financial wellness) (since 2018). Director of Dynex Capital, Inc. (mortgage REIT) (since 2013). |
| | | |
William H. Park 1947 | | Chairperson of the Board and Trustee | | 2016
(Chairperson)
and 2003
(Trustee) | | Private investor. Formerly, Consultant (management and transactional) (2012-2014). Formerly, Chief Financial Officer, Aveon Group L.P. (investment management firm) (2010-2011). Formerly, Vice Chairman, Commercial Industrial Finance Corp. (specialty finance company) (2006-2010). Formerly, President and Chief Executive Officer, Prizm Capital Management, LLC (investment management firm) (2002-2005). Formerly, Executive Vice President and Chief Financial Officer, United Asset Management Corporation (investment management firm)
(1982-2001). Formerly, Senior Manager, Price Waterhouse (now PricewaterhouseCoopers) (a registered public accounting firm) (1972-1981). Other Directorships in the Last Five Years.(2)None. |
Eaton Vance
Municipal Income Funds
July 31, 2019
Management and Organization — continued
| | | | | | |
| Name and Year of Birth | | Trust
Position(s) | | Trustee Since(1) | | Principal Occupation(s) and Other Directorships During Past Five Years and Other Relevant Experience |
| | |
| Noninterested Trustees (continued) | | | | |
| | | |
Helen Frame Peters 1948 | | Trustee | | 2008 | | Professor of Finance, Carroll School of Management, Boston College. Formerly, Dean, Carroll School of Management, Boston College (2000-2002). Formerly, Chief Investment Officer, Fixed Income, Scudder Kemper Investments (investment management firm) (1998-1999). Formerly, Chief Investment Officer, Equity and Fixed Income, Colonial Management Associates (investment management firm)(1991-1998). Other Directorships in the Last Five Years.(2) None. |
| | | |
Keith Quinton(3) 1958 | | Trustee | | 2018 | | Independent Investment Committee Member at New Hampshire Retirement System (since 2017). Advisory Committee member at Northfield Information Services, Inc. (risk management analytics provider) (since 2016). Formerly, Portfolio Manager and Senior Quantitative Analyst at Fidelity Investments (investment management firm)(2001-2014). Other Directorships in the Last Five Years. Director of New Hampshire Municipal Bond Bank (since 2016). |
| | | |
Marcus L. Smith(3) 1966 | | Trustee | | 2018 | | Member of Posse Boston Advisory Board (foundation) (since 2015). Trustee at University of Mount Union (since 2008). Formerly, Portfolio Manager at MFS Investment Management (investment management firm) (1994-2017). Other Directorships in the Last Five Years. Director of MSCI Inc. (global provider of investment decision support tools) (since 2017). Formerly, Director of DCT Industrial Trust Inc. (logistics real estate company) (2017-2018). |
| | | |
Susan J. Sutherland 1957 | | Trustee | | 2015 | | Private investor. Formerly, Associate, Counsel and Partner at Skadden, Arps, Slate, Meagher & Flom LLP (law firm) (1982-2013). Other Directorships in the Last Five Years. Formerly, Director of Montpelier Re Holdings Ltd. (global provider of customized insurance and reinsurance products) (2013-2015). |
| | | |
Scott E. Wennerholm 1959 | | Trustee | | 2016 | | Formerly, Trustee at Wheelock College (postsecondary institution) (2012-2018). Formerly, Consultant at GF Parish Group (executive recruiting firm) (2016-2017). Formerly, Chief Operating Officer and Executive Vice President at BNY Mellon Asset Management (investment management firm) (2005-2011). Formerly, Chief Operating Officer and Chief Financial Officer at Natixis Global Asset Management (investment management firm) (1997-2004). Formerly, Vice President at Fidelity Investments Institutional Services (investment management firm) (1994-1997). Other Directorships in the Last Five Years. None. |
| | | | | | |
| Name and Year of Birth | | Trust Position(s) | | Officer
Since(4) | | Principal Occupation(s) During Past Five Years |
| |
| Principal Officers who are not Trustees | | |
| | | |
Payson F. Swaffield 1956 | | President | | 2003 | | Vice President and Chief Income Investment Officer of EVM and BMR. Also Vice President of Calvert Research and Management (“CRM”) since 2016. |
| | | |
Maureen A. Gemma 1960 | | Vice President, Secretary and Chief Legal Officer | | 2005 | | Vice President of EVM and BMR. Also Vice President of CRM since 2016. |
| | | |
James F. Kirchner 1967 | | Treasurer | | 2007 | | Vice President of EVM and BMR. Also Vice President of CRM since 2016. |
| | | |
Richard F. Froio 1968 | | Chief Compliance Officer | | 2017 | | Vice President of EVM and BMR since 2017. Formerly Deputy Chief Compliance Officer (Adviser/Funds) and Chief Compliance Officer (Distribution) at PIMCO(2012-2017) and Managing Director at BlackRock/Barclays Global Investors(2009-2012). |
| (1) | Year first appointed to serve as Trustee for a fund in the Eaton Vance family of funds. Each Trustee has served continuously since appointment unless indicated otherwise. |
Eaton Vance
Municipal Income Funds
July 31, 2019
Management and Organization — continued
| (2) | During their respective tenures, the Trustees (except for Mmes. Frost and Sutherland and Messrs. Fetting, Gorman, Quinton, Smith and Wennerholm) also served as Board members of one or more of the following funds (which operated in the years noted): eUnitsTM 2 Year U.S. Market Participation Trust: Upside to Cap / Buffered Downside (launched in 2012 and terminated in 2014); and eUnitsTM 2 Year U.S. Market Participation Trust II: Upside to Cap / Buffered Downside (launched in 2012 and terminated in 2014). However, Ms. Mosley did not serve as a Board member of eUnitsTM 2 Year U.S. Market Participation Trust: Upside to Cap / Buffered Downside (launched in 2012 and terminated in 2014). |
| (3) | Messrs. Quinton and Smith began serving as Trustees effective October 1, 2018. |
| (4) | Year first elected to serve as officer of a fund in the Eaton Vance family of funds when the officer has served continuously. Otherwise, year of most recent election as an officer of a fund in the Eaton Vance family of funds. Titles may have changed since initial election. |
The SAI for the Funds includes additional information about the Trustees and officers of the Funds and can be obtained without charge on Eaton Vance’s website at www.eatonvance.com or by calling1-800-262-1122.
Eaton Vance Funds
IMPORTANT NOTICES
Privacy. The Eaton Vance organization is committed to ensuring your financial privacy. Each of the financial institutions identified below has in effect the following policy (“Privacy Policy”) with respect to nonpublic personal information about its customers:
| • | | Only such information received from you, through application forms or otherwise, and information about your Eaton Vance fund transactions will be collected. This may include information such as name, address, social security number, tax status, account balances and transactions. |
| • | | None of such information about you (or former customers) will be disclosed to anyone, except as permitted by law (which includes disclosure to employees necessary to service your account). In the normal course of servicing a customer’s account, Eaton Vance may share information with unaffiliated third parties that perform various required services such as transfer agents, custodians and broker-dealers. |
| • | | Policies and procedures (including physical, electronic and procedural safeguards) are in place that are designed to protect the confidentiality of such information. |
| • | | We reserve the right to change our Privacy Policy at any time upon proper notification to you. Customers may want to review our Privacy Policy periodically for changes by accessing the link on our homepage: www.eatonvance.com. |
Our pledge of privacy applies to the following entities within the Eaton Vance organization: the Eaton Vance Family of Funds, Eaton Vance Management,
Eaton Vance Investment Counsel, Eaton Vance Distributors, Inc., Eaton Vance Trust Company, Eaton Vance Management (International) Limited, Eaton Vance Advisers International Ltd., Eaton Vance Management’s Real Estate Investment Group and Boston Management and Research. In addition, our Privacy Policy applies only to those Eaton Vance customers who are individuals and who have a direct relationship with us. If a customer’s account (i.e., fund shares) is held in the name of a third-party financial advisor/broker-dealer, it is likely that only such advisor’s privacy policies apply to the customer. This notice supersedes all previously issued privacy disclosures. For more information about Eaton Vance’s Privacy Policy, please call1-800-262-1122.
Delivery of Shareholder Documents. The Securities and Exchange Commission (SEC) permits funds to deliver only one copy of shareholder documents, including prospectuses, proxy statements and shareholder reports, to fund investors with multiple accounts at the same residential or post office box address. This practice is often called “householding” and it helps eliminate duplicate mailings to shareholders.Eaton Vance, or your financial intermediary, may household the mailing of your documents indefinitely unless you instruct Eaton Vance, or your financial intermediary, otherwise.If you would prefer that your Eaton Vance documents not be householded, please contact Eaton Vance at1-800-262-1122, or contact your financial intermediary. Your instructions that householding not apply to delivery of your Eaton Vance documents will typically be effective within 30 days of receipt by Eaton Vance or your financial intermediary.
Portfolio Holdings. Each Eaton Vance Fund and its underlying Portfolio(s) (if applicable) files a schedule of portfolio holdings on Part F to FormN-PORT with the SEC for the first and third quarters of each fiscal year. The FormN-PORT will be available on the Eaton Vance website at www.eatonvance.com, by calling Eaton Vance at1-800-262-1122 or in the EDGAR database on the SEC’s website at www.sec.gov.
Proxy Voting. From time to time, funds are required to vote proxies related to the securities held by the funds. The Eaton Vance Funds or their underlying Portfolios (if applicable) vote proxies according to a set of policies and procedures approved by the Funds’ and Portfolios’ Boards. You may obtain a description of these policies and procedures and information on how the Funds or Portfolios voted proxies relating to portfolio securities during the most recent12-month period ended June 30, without charge, upon request, by calling1-800-262-1122 and by accessing the SEC’s website at www.sec.gov.
This Page Intentionally Left Blank
Investment Adviser
Boston Management and Research
Two International Place
Boston, MA 02110
Administrator
Eaton Vance Management
Two International Place
Boston, MA 02110
Principal Underwriter*
Eaton Vance Distributors, Inc.
Two International Place
Boston, MA 02110
(617)482-8260
Custodian
State Street Bank and Trust Company
State Street Financial Center, One Lincoln Street
Boston, MA 02111
Transfer Agent
BNY Mellon Investment Servicing (US) Inc.
Attn: Eaton Vance Funds
P.O. Box 9653
Providence, RI 02940-9653
(800)262-1122
Independent Registered Public Accounting Firm
Deloitte & Touche LLP
200 Berkeley Street
Boston, MA 02116-5022
Fund Offices
Two International Place
Boston, MA 02110
| * | FINRA BrokerCheck. Investors may check the background of their Investment Professional by contacting the Financial Industry Regulatory Authority (FINRA). FINRA BrokerCheck is a free tool to help investors check the professional background of current and former FINRA-registered securities firms and brokers. FINRA BrokerCheck is available by calling1-800-289-9999 and at www.FINRA.org. The FINRA BrokerCheck brochure describing this program is available to investors at www.FINRA.org. |

313 7.31.19

Eaton Vance
Municipal Opportunities Fund
Annual Report
July 31, 2019
Important Note. Beginning on January 1, 2021, as permitted by regulations adopted by the Securities and Exchange Commission, paper copies of the Fund’s annual and semi-annual shareholder reports will no longer be sent by mail unless you specifically request paper copies of the reports. Instead, the reports will be made available on the Fund’s website (eatonvance.com/funddocuments), and you will be notified by mail each time a report is posted and provided with a website address to access the report.
If you already elected to receive shareholder reports electronically, you will not be affected by this change and you need not take any action. If you are a direct investor, you may elect to receive shareholder reports and other communications from the Fund electronically by signing up fore-Delivery at eatonvance.com/edelivery. If you own your shares through a financial intermediary (such as a broker-dealer or bank), you must contact your financial intermediary to sign up.
You may elect to receive all future Fund shareholder reports in paper free of charge. If you are a direct investor, you can inform the Fund that you wish to continue receiving paper copies of your shareholder reports by calling1-800-262-1122. If you own these shares through a financial intermediary, you must contact your financial intermediary or follow instructions included with this disclosure, if applicable, to elect to continue to receive paper copies of your shareholder reports. Your election to receive reports in paper will apply to all Eaton Vance funds held directly or to all funds held through your financial intermediary, as applicable.

Commodity Futures Trading Commission Registration. Effective December 31, 2012, the Commodity Futures Trading Commission (“CFTC”) adopted certain regulatory changes that subject registered investment companies and advisers to regulation by the CFTC if a fund invests more than a prescribed level of its assets in certain CFTC-regulated instruments (including futures, certain options and swap agreements) or markets itself as providing investment exposure to such instruments. The Fund has claimed an exclusion from the definition of the term “commodity pool operator” under the Commodity Exchange Act. Accordingly, neither the Fund nor the adviser with respect to the operation of the Fund is subject to CFTC regulation. Because of its management of other strategies, the Fund’s adviser is registered with the CFTC as a commodity pool operator and a commodity trading advisor.
Fund shares are not insured by the FDIC and are not deposits or other obligations of, or guaranteed by, any depository institution. Shares are subject to investment risks, including possible loss of principal invested.
This report must be preceded or accompanied by a current summary prospectus or prospectus. Before investing, investors should consider carefully the investment objective, risks, and charges and expenses of a mutual fund. This and other important information is contained in the summary prospectus and prospectus, which can be obtained from a financial intermediary. Prospective investors should read the prospectus carefully before investing. For further information, please call1-800-262-1122.
Annual Report July 31, 2019
Eaton Vance
Municipal Opportunities Fund
Table of Contents
| | | | |
Management’s Discussion of Fund Performance | | | 2 | |
| |
Performance | | | 3 | |
| |
Fund Profile | | | 4 | |
| |
Endnotes and Additional Disclosures | | | 5 | |
| |
Fund Expenses | | | 6 | |
| |
Financial Statements | | | 7 | |
| |
Report of Independent Registered Public Accounting Firm | | | 35 | |
| |
Federal Tax Information | | | 36 | |
| |
Board of Trustees’ Contract Approval | | | 37 | |
| |
Management and Organization | | | 40 | |
| |
Important Notices | | | 42 | |
Eaton Vance
Municipal Opportunities Fund
July 31, 2019
Management’s Discussion of Fund Performance1
Economic and Market Conditions
The12-month period that began on August 1, 2018 witnessed a dramatic turnaround in fixed income markets. The rising-rate environment at the beginning of the period gave way to a falling-rate environment that began in December 2018 and accelerated as the fiscal year wore on — culminating with the U.S. Federal Reserve Board (the Fed) announcing its first rate cut in 11 years on July 31, 2019, the final day of the period.
Viewed as a whole, the period was marked by strong performance in the municipal bond market, with the Bloomberg Barclays Municipal Bond Index (the Index),2 a broad measure of the asset class, returning 7.31%. The municipal bond yield curve7 experienced a so-called “bull market flattening” with rates declining across the curve but more so toward the long end of the curve. As investors searched for yield in an ongoinglow-rate environment, lower-rated6 bonds in general outperformed higher-rated bonds, and longer-duration8 issues outperformed shorter-duration issues.
As the fiscal year began in August 2018, the market was still in a rising-rate environment, driven by optimism about U.S. economic growth, increasing inflation and wage growth, and a potential detente between the U.S. and North Korea. In September, the Fed hiked rates for the third time in 2018, and Treasury and municipal rates rose across the curve.
But as 2018 came to a close, investors became increasingly concerned about a trade war with China, a looming government shutdown, and dovish comments by the Fed that led investors to fear weakness in the U.S. economy. In response, the futures market began to project the possibility of no further rate hikes in 2019 — a significant reversal of investor expectations just a few months earlier. The result was a “flight to quality” by bond investors, pushing longer-term bond prices up and rates down in the final month of 2018.
The first two months of the new year were a relatively quiet period for bonds. But downward pressure on rates and upward pressure on prices resumed in March and continued though the end of the period — propelled by lower-than-desired inflation, Brexit concerns, low European interest rates, and anon-again,off-again U.S.-China trade war that fueled concerns about global growth. In response, the Fed began to telegraph the potential for the rate cut that actually occurred atperiod-end.
In the municipals market, technical factors amplified the price rally. Tax law changes passed in 2017 resulted in a combination of lower supply of new municipals and increased demand from high-income investors inhigh-tax states — who had seen their tax bills rise under the new law. As a result, municipals in general outperformed Treasurys for the period as a whole.
Fund Performance
For the fiscal year ended July 31, 2019, Eaton Vance Municipal Opportunities Fund (the Fund) Class A shares at net asset value (NAV) returned 6.02%, underperforming the 7.31% return of the Fund’s benchmark, the Index.
In seeking to achieve its primary objective of maximizing after-tax total return, the Fund employs a flexible investment strategy that allows it to seek opportunities virtually anywhere on the yield curve and anywhere on the credit curve, across different sectors and different state issuers. Management has the ability to be opportunistic in pursuing the Fund’s after-tax total return objective, trading holdings whenever opportunities arise, with the ability to invest up to 20% of net assets in debt obligations other thantax-exempt municipal bonds, including (but not limited to) taxable municipal obligations, U.S. Treasury securities and obligations of the U.S. Government, its agencies and instrumentalities. Up to 50% of the Fund’s net assets may be invested in below-investment-grade securities. The Fund may also hedge interest rate risk and hold leveraged investments.
For the12-month period, the primary detractors from performance versus the Index included an underweight, relative to the Index, in zero-coupon bonds, which were thebest-performing coupon structure in the Index during the period; an underweight in bonds with 17 or more years remaining to maturity, during a period when longer-maturity bonds in general outperformed shorter-maturity bonds; and holdings in floating-rate securities, which were not represented in the Index.
In contrast, contributors to performance versus the Index included security selection and an overweight in Illinois bonds; an overweight in the health care sector, which was thesecond-best-performing sector in the Index during the period; and security selection and an overweight in BBB-rated bonds.
See Endnotes and Additional Disclosures in this report.
Past performance is no guarantee of future results. Returns are historical and are calculated by determining the percentage change in net asset value (NAV) or offering price (as applicable) with all distributions reinvested. Investment return and principal value will fluctuate so that shares, when redeemed, may be worth more or less than their original cost. Performance less than or equal to one year is cumulative. Performance is for the stated time period only; due to market volatility, the Fund’s current performance may be lower or higher than quoted. Returns are before taxes unless otherwise noted. For performance as of the most recent month-end, please refer to eatonvance.com.
Eaton Vance
Municipal Opportunities Fund
July 31, 2019
Performance2,3
Portfolio ManagerAdam A. Weigold, CFA
| | | | | | | | | | | | | | | | | | | | |
% Average Annual Total Returns | | Class
Inception Date | | | Performance
Inception Date | | | One Year | | | Five Years | | | Since
Inception | |
Class A at NAV | | | 05/31/2011 | | | | 05/31/2011 | | | | 6.02 | % | | | 4.10 | % | | | 5.13 | % |
Class A with 4.75% Maximum Sales Charge | | | — | | | | — | | | | 1.00 | | | | 3.09 | | | | 4.51 | |
Class C at NAV | | | 08/18/2014 | | | | 05/31/2011 | | | | 5.23 | | | | 3.28 | | | | 4.63 | |
Class C with 1% Maximum Sales Charge | | | — | | | | — | | | | 4.23 | | | | 3.28 | | | | 4.63 | |
Class I at NAV | | | 05/31/2011 | | | | 05/31/2011 | | | | 6.19 | | | | 4.36 | | | | 5.41 | |
Bloomberg Barclays Municipal Bond Index | | | — | | | | — | | | | 7.31 | % | | | 3.77 | % | | | 4.33 | % |
| | | | | |
| | | | | | | | | | | | | | | | | | | | |
| % Total Annual Operating Expense Ratios4 | | | | | | | | Class A | | | Class C | | | Class I | |
| | | | | | | | | | | 0.95 | % | | | 1.71 | % | | | 0.70 | % |
| | | | | |
| | | | | | | | | | | | | | | | | | | | |
| % Distribution Rates/Yields5 | | | | | | | | Class A | | | Class C | | | Class I | |
Distribution Rate | | | | | | | | | | | 2.02 | % | | | 1.27 | % | | | 2.27 | % |
Taxable-Equivalent Distribution Rate | | | | | | | | | | | 3.41 | | | | 2.15 | | | | 3.83 | |
SEC30-day Yield | | | | | | | | | | | 1.40 | | | | 0.73 | | | | 1.72 | |
Taxable-Equivalent SEC30-day Yield | | | | | | | | | | | 2.36 | | | | 1.23 | | | | 2.90 | |
Growth of $10,000
This graph shows the change in value of a hypothetical investment of $10,000 in Class A of the Fund for the period indicated. For comparison, the same investment is shown in the indicated index.
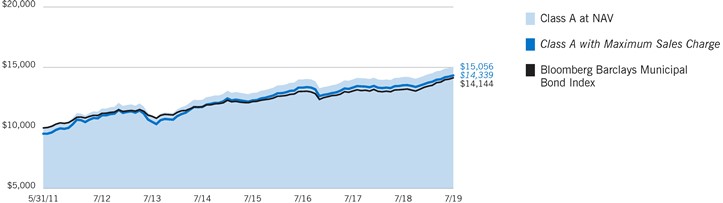
| | | | | | | | | | | | | | | | |
| Growth of Investment3 | | Amount Invested | | | Period Beginning | | | At NAV | | | With Maximum Sales Charge | |
Class C | | $ | 10,000 | | | | 05/31/2011 | | | $ | 14,474 | | | | N.A. | |
Class I | | $ | 250,000 | | | | 05/31/2011 | | | $ | 384,501 | | | | N.A. | |
See Endnotes and Additional Disclosures in this report.
Past performance is no guarantee of future results. Returns are historical and are calculated by determining the percentage change in net asset value (NAV) or offering price (as applicable) with all distributions reinvested. Investment return and principal value will fluctuate so that shares, when redeemed, may be worth more or less than their original cost. Performance less than or equal to one year is cumulative. Performance is for the stated time period only; due to market volatility, the Fund’s current performance may be lower or higher than quoted. Returns are before taxes unless otherwise noted. For performance as of the most recent month-end, please refer to eatonvance.com.
Eaton Vance
Municipal Opportunities Fund
July 31, 2019
Fund Profile
Credit Quality (% of total investments)6
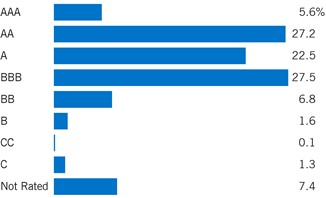
See Endnotes and Additional Disclosures in this report.
Eaton Vance
Municipal Opportunities Fund
July 31, 2019
Endnotes and Additional Disclosures
| 1 | The views expressed in this report are those of the portfolio manager(s) and are current only through the date stated at the top of this page. These views are subject to change at any time based upon market or other conditions, and Eaton Vance and the Fund(s) disclaim any responsibility to update such views. These views may not be relied upon as investment advice and, because investment decisions are based on many factors, may not be relied upon as an indication of trading intent on behalf of any Eaton Vance fund. This commentary may contain statements that are not historical facts, referred to as “forward looking statements.” The Fund’s actual future results may differ significantly from those stated in any forward looking statement, depending on factors such as changes in securities or financial markets or general economic conditions, the volume of sales and purchases of Fund shares, the continuation of investment advisory, administrative and service contracts, and other risks discussed from time to time in the Fund’s filings with the Securities and Exchange Commission. |
| 2 | Bloomberg Barclays Municipal Bond Index is an unmanaged index of municipal bonds traded in the U.S. Unless otherwise stated, index returns do not reflect the effect of any applicable sales charges, commissions, expenses, taxes or leverage, as applicable. It is not possible to invest directly in an index. |
| 3 | Total Returns at NAV do not include applicable sales charges. If sales charges were deducted, the returns would be lower. Total Returns shown with maximum sales charge reflect the stated maximum sales charge. Unless otherwise stated, performance does not reflect the deduction of taxes on Fund distributions or redemptions of Fund shares. |
| | Performance prior to the inception date of a class may be linked to the performance of an older class of the Fund. This linked performance is adjusted for any applicable sales charge, but is not adjusted for class expense differences. If adjusted for such differences, the performance would be different. The performance of Class C is linked to Class A. Performance since inception for an index, if presented, is the performance since the Fund’s or oldest share class’ inception, as applicable. Performance presented in the Financial Highlights included in the financial statements is not linked. |
| 4 | Source: Fund prospectus. The expense ratios for the current reporting period can be found in the Financial Highlights section of this report. |
| 5 | The Distribution Rate is based on the Fund’s last regular distribution per share in the period (annualized) divided by the Fund’s NAV at the end of the period. The Fund’s distributions may be comprised of amounts characterized for federal income tax purposes astax-exempt income, qualified andnon-qualified ordinary dividends, capital gains and nondividend distributions, also known as return of capital. The Fund will determine the federal income tax character of distributions paid to a shareholder after the end of the calendar year. This is reported on the IRS form 1099- DIV and provided to the shareholder shortly after each year-end. The Fund’s distributions are determined by the investment adviser based on its current assessment of the Fund’s long-term return potential. As portfolio and market conditions change, the rate of distributions paid by the Fund could change. Taxable-equivalent performance is based on the highest combined federal and state income tax rates, where applicable. Lower tax rates would result in lowertax-equivalent performance. Actual tax rates will vary depending on your income, exemptions and deductions. Rates do not include local taxes. The SEC Yield is a standardized measure based on the estimated yield to maturity of a fund’s investments over a30-day period and is based on the maximum offer price at the date specified. The SEC Yield is not based on the distributions made by the Fund, which may differ. |
| 6 | Ratings are based on Moody’s Investors Service, Inc. (“Moody’s”), S&P Global Ratings (“S&P”) or Fitch Ratings (“Fitch”), as applicable. If securities are rated differently by the ratings agencies, the highest rating is applied. Ratings, which are subject to change, apply to the creditworthiness of the issuers of the underlying securities and not to the Fund or its shares. Credit ratings measure the quality of a bond based on the issuer’s creditworthiness, with ratings ranging from AAA, being the highest, to D, being the lowest based on S&P’s measures. Ratings of BBB or higher by S&P or Fitch (Baa or higher by Moody’s) are considered to be investment-grade quality. Credit ratings are based largely on the ratings agency’s analysis at the time of rating. The rating assigned to any particular security is not necessarily a reflection of the issuer’s current financial condition and does not necessarily reflect its assessment of the volatility of a security’s market value or of the liquidity of an investment in the security. Holdings designated as “Not Rated” (if any) are not rated by the national ratings agencies stated above. |
| 7 | Yield curve is a graphical representation of the yields offered by bonds of various maturities. The yield curve flattens when long-term rates fall and/orshort-term rates increase, and the yield curve steepens when long-term rates increase and/orshort-term rates fall. |
| 8 | Duration is a measure of the expected change in price of a bond — in percentage terms — given a one percent change in interest rates, all else being constant. Securities with lower durations tend to be less sensitive to interest rate changes. |
| | Fund profile subject to change due to active management. |
Eaton Vance
Municipal Opportunities Fund
July 31, 2019
Fund Expenses
Example: As a Fund shareholder, you incur two types of costs: (1) transaction costs, including sales charges (loads) on purchases and redemption fees (if applicable); and (2) ongoing costs, including management fees; distribution and/or service fees; and other Fund expenses. This Example is intended to help you understand your ongoing costs (in dollars) of Fund investing and to compare these costs with the ongoing costs of investing in other mutual funds. The Example is based on an investment of $1,000 invested at the beginning of the period and held for the entire period (February 1, 2019 – July 31, 2019).
Actual Expenses: The first section of the table below provides information about actual account values and actual expenses. You may use the information in this section, together with the amount you invested, to estimate the expenses that you paid over the period. Simply divide your account value by $1,000 (for example, an $8,600 account value divided by $1,000 = 8.6), then multiply the result by the number in the first section under the heading entitled “Expenses Paid During Period” to estimate the expenses you paid on your account during this period.
Hypothetical Example for Comparison Purposes: The second section of the table below provides information about hypothetical account values and hypothetical expenses based on the actual Fund expense ratio and an assumed rate of return of 5% per year (before expenses), which is not the actual Fund return. The hypothetical account values and expenses may not be used to estimate the actual ending account balance or expenses you paid for the period. You may use this information to compare the ongoing costs of investing in your Fund and other funds. To do so, compare this 5% hypothetical example with the 5% hypothetical examples that appear in the shareholder reports of the other funds.
Please note that the expenses shown in the table are meant to highlight your ongoing costs only and do not reflect any transactional costs, such as sales charges (loads) or redemption fees (if applicable). Therefore, the second section of the table is useful in comparing ongoing costs only, and will not help you determine the relative total costs of owning different funds. In addition, if these transactional costs were included, your costs would be higher.
| | | | | | | | | | | | | | | | |
| | | Beginning
Account Value
(2/1/19) | | | Ending
Account Value
(7/31/19) | | | Expenses Paid
During Period*
(2/1/19 – 7/31/19) | | | Annualized
Expense
Ratio | |
| | | | |
| | | | | | | | | | | | | | | | |
Actual | | | | | | | | | | | | | | | | |
Class A | | $ | 1,000.00 | | | $ | 1,043.30 | | | $ | 4.71 | | | | 0.93 | % |
Class C | | $ | 1,000.00 | | | $ | 1,039.50 | | | $ | 8.50 | | | | 1.68 | % |
Class I | | $ | 1,000.00 | | | $ | 1,043.70 | | | $ | 3.45 | | | | 0.68 | % |
| | | | | | | | | | | | | | | | | |
| | | | |
| | | | | | | | | | | | | | | | |
Hypothetical | | | | | | | | | | | | | | | | |
(5% return per year before expenses) | | | | | | | | | | | | | | | | |
Class A | | $ | 1,000.00 | | | $ | 1,020.20 | | | $ | 4.66 | | | | 0.93 | % |
Class C | | $ | 1,000.00 | | | $ | 1,016.50 | | | $ | 8.40 | | | | 1.68 | % |
Class I | | $ | 1,000.00 | | | $ | 1,021.40 | | | $ | 3.41 | | | | 0.68 | % |
| * | Expenses are equal to the Fund’s annualized expense ratio for the indicated Class, multiplied by the average account value over the period, multiplied by 181/365 (to reflect theone-half year period). The Example assumes that the $1,000 was invested at the net asset value per share determined at the close of business on January 31, 2019. |
Eaton Vance
Municipal Opportunities Fund
July 31, 2019
Portfolio of Investments
| | | | | | | | |
| Tax-Exempt Municipal Securities — 94.0% | |
| | |
| | | | | | | | |
| Security | | Principal
Amount
(000’s omitted) | | | Value | |
|
| Bond Bank — 0.4% | |
| | |
Ohio Water Development Authority, Water Pollution Control Loan Fund, 1.62%, (SIFMA + 0.22%), 12/1/20(1) | | $ | 5,000 | | | $ | 5,000,150 | |
| | | | | | | | | |
| |
| | | | $ | 5,000,150 | |
|
| Education — 5.1% | |
| | |
Arizona Industrial Development Authority, (Doral Academy of Nevada), 3.55%, 7/15/29(2) | | $ | 1,360 | | | $ | 1,395,102 | |
| | |
Arizona State University, 5.00%, 7/1/33 | | | 500 | | | | 575,445 | |
| | |
Arizona State University, 5.00%, 7/1/34 | | | 580 | | | | 665,904 | |
| | |
Build NYC Resource Corp., NY, (Ethical Culture Fieldston School), 5.00%, 6/1/24 | | | 600 | | | | 696,744 | |
| | |
California Infrastructure and Economic Development Bank, (The Colburn School), 2.40%, (SIFMA + 1.00%), 6/1/20 (Put Date), 8/1/37(1) | | | 3,000 | | | | 3,007,020 | |
| | |
California Municipal Finance Authority, (California Lutheran University), 5.00%, 10/1/31 | | | 600 | | | | 741,114 | |
| | |
California Municipal Finance Authority, (California Lutheran University), 5.00%, 10/1/35 | | | 1,125 | | | | 1,365,739 | |
| | |
California Municipal Finance Authority, (California Lutheran University), 5.00%, 10/1/37 | | | 1,400 | | | | 1,683,570 | |
| | |
California School Finance Authority, (KIPP SoCal Public Schools), 5.00%, 7/1/39(2) | | | 1,000 | | | | 1,200,110 | |
| | |
California School Finance Authority, (KIPP SoCal Public Schools), 5.00%, 7/1/49(2) | | | 1,000 | | | | 1,180,070 | |
| | |
Capital Trust Agency, FL, (Florida Charter Educational Foundation, Inc.), 4.50%, 6/15/28(2) | | | 590 | | | | 626,456 | |
| | |
Delaware County Authority, PA, (Villanova University), 5.00%, 8/1/22 | | | 600 | | | | 667,614 | |
| | |
District of Columbia, (District of Columbia International School), 5.00%, 7/1/39 | | | 680 | | | | 811,505 | |
| | |
District of Columbia, (Rocketship DC Obligated Group), 5.00%, 6/1/39(2) | | | 1,425 | | | | 1,533,784 | |
| | |
Florida Higher Educational Facilities Financing Authority, (Jacksonville University), 4.50%, 6/1/33(2) | | | 2,535 | | | | 2,736,025 | |
| | |
Florida Higher Educational Facilities Financing Authority, (Ringling College of Art and Design), 5.00%, 3/1/32 | | | 315 | | | | 384,464 | |
| | |
Florida Higher Educational Facilities Financing Authority, (Ringling College of Art and Design), 5.00%, 3/1/33 | | | 355 | | | | 431,041 | |
| | |
Florida Higher Educational Facilities Financing Authority, (Ringling College of Art and Design), 5.00%, 3/1/34 | | | 350 | | | | 423,290 | |
| | |
Massachusetts Development Finance Agency, (Dexter Southfield), 5.00%, 5/1/29 | | | 465 | | | | 540,921 | |
| | |
Massachusetts Development Finance Agency, (Dexter Southfield), 5.00%, 5/1/31 | | | 500 | | | | 577,295 | |
| | |
Massachusetts Development Finance Agency, (Dexter Southfield), 5.00%, 5/1/32 | | | 1,695 | | | | 1,951,148 | |
| | | | | | | | |
| Security | | Principal
Amount
(000’s omitted) | | | Value | |
|
| Education (continued) | |
| | |
Massachusetts Development Finance Agency, (Suffolk University), 5.00%, 7/1/28 | | $ | 525 | | | $ | 653,803 | |
| | |
Massachusetts Development Finance Agency, (Suffolk University), 5.00%, 7/1/29 | | | 500 | | | | 627,450 | |
| | |
Massachusetts Development Finance Agency, (Suffolk University), 5.00%, 7/1/30 | | | 715 | | | | 891,319 | |
| | |
Monroe County Industrial Development Corp., NY, (Nazareth College of Rochester), 5.00%, 10/1/26 | | | 980 | | | | 1,175,628 | |
| | |
Monroe County Industrial Development Corp., NY, (Nazareth College of Rochester), 5.00%, 10/1/27 | | | 1,035 | | | | 1,259,585 | |
| | |
Monroe County Industrial Development Corp., NY, (St. John Fisher College), 5.00%, 6/1/21 | | | 1,000 | | | | 1,068,020 | |
| | |
Monroe County Industrial Development Corp., NY, (University of Rochester), Series 2017C, 5.00%, 7/1/29 | | | 650 | | | | 825,071 | |
| | |
Monroe County Industrial Development Corp., NY, (University of Rochester), Series 2017D, 5.00%, 7/1/29 | | | 750 | | | | 952,005 | |
| | |
New Hampshire Health and Education Facilities Authority, (University System of New Hampshire), (SPA: State Street Bank and Trust Co.), 1.50%, 7/1/35(3) | | | 4,270 | | | | 4,270,000 | |
| | |
New Hampshire Health and Education Facilities Authority, (University System of New Hampshire), (SPA: Wells Fargo Bank, N.A.), 1.50%, 7/1/33(3) | | | 2,400 | | | | 2,400,000 | |
| | |
New Jersey Educational Facilities Authority, (Ramapo College), 5.00%, 7/1/26 | | | 2,460 | | | | 2,927,794 | |
| | |
New York Dormitory Authority, (Oneida-Herkimer-Madison BOCES), 5.00%, 8/15/22 | | | 510 | | | | 569,328 | |
| | |
New York Dormitory Authority, (Oneida-Herkimer-Madison BOCES), 5.00%, 8/15/23 | | | 275 | | | | 316,621 | |
| | |
New York Dormitory Authority, (Oneida-Herkimer-Madison BOCES), 5.00%, 8/15/24 | | | 300 | | | | 355,833 | |
| | |
New York Dormitory Authority, (Pratt Institute), 5.00%, 7/1/25 | | | 500 | | | | 584,790 | |
| | |
New York Dormitory Authority, (Pratt Institute), 5.00%, 7/1/26 | | | 545 | | | | 634,849 | |
| | |
New York Dormitory Authority, (School Districts Bond Financing Program), 5.00%, 10/1/27 | | | 5,000 | | | | 6,391,000 | |
| | |
Oregon Facilities Authority, (Linfield College), 5.00%, 10/1/25 | | | 1,000 | | | | 1,182,370 | |
| | |
Philadelphia Industrial Development Authority, PA, (La Salle University), 5.00%, 5/1/25 | | | 910 | | | | 1,045,590 | |
| | |
Philadelphia Industrial Development Authority, PA, (La Salle University), 5.00%, 5/1/26 | | | 1,850 | | | | 2,160,115 | |
| | |
Philadelphia Industrial Development Authority, PA, (La Salle University), 5.00%, 5/1/29 | | | 1,000 | | | | 1,179,540 | |
| | |
Pinellas County Educational Facilities Authority, FL, (Pinellas Academy of Math and Science), 4.125%, 12/15/28(2) | | | 595 | | | | 639,744 | |
| | |
Pinellas County Educational Facilities Authority, FL, (Pinellas Academy of Math and Science), 5.00%, 12/15/38(2) | | | 2,690 | | | | 3,000,749 | |
| | | | |
| | 7 | | See Notes to Financial Statements. |
Eaton Vance
Municipal Opportunities Fund
July 31, 2019
Portfolio of Investments — continued
| | | | | | | | |
| Security | | Principal
Amount
(000’s omitted) | | | Value | |
|
| Education (continued) | |
| | |
Public Finance Authority, WI, (North Carolina Leadership Academy), 5.00%, 6/15/39(2) | | $ | 205 | | | $ | 217,134 | |
| | |
Public Finance Authority, WI, (North Carolina Leadership Academy), 5.00%, 6/15/49(2) | | | 260 | | | | 273,239 | |
| | |
Romeoville, IL, (Lewis University), 5.00%, 10/1/24 | | | 500 | | | | 565,325 | |
| | |
Romeoville, IL, (Lewis University), 5.00%, 10/1/26 | | | 500 | | | | 568,010 | |
| | |
University of Arkansas, 5.00%, 11/1/24 | | | 475 | | | | 563,131 | |
| | |
University of Arkansas, 5.00%, 11/1/25 | | | 500 | | | | 606,245 | |
| | |
University of Idaho, 5.00%, 4/1/24 | | | 500 | | | | 584,195 | |
| | |
University of North Carolina at Charlotte, 4.00%, 4/1/37 | | | 625 | | | | 673,594 | |
| | |
University of North Carolina at Greensboro, 5.00%, 4/1/27 | | | 400 | | | | 504,244 | |
| | |
West Virginia University, 1.93%, (SIFMA + 0.53%), 10/1/19 (Put Date), 10/1/41(1) | | | 3,500 | | | | 3,500,315 | |
| | | | | | | | | |
| |
| | | | $ | 66,360,997 | |
|
| Electric Utilities — 4.1% | |
| | |
Arkansas River Power Authority, CO, 5.00%, 10/1/27 | | $ | 2,255 | | | $ | 2,715,065 | |
| | |
Arkansas River Power Authority, CO, 5.00%, 10/1/28 | | | 1,110 | | | | 1,350,182 | |
| | |
Arkansas River Power Authority, CO, 5.00%, 10/1/29 | | | 2,000 | | | | 2,418,340 | |
| | |
Hawaii Department of Budget and Finance, (Hawaiian Electric Co.), 3.20%, 7/1/39 | | | 3,255 | | | | 3,288,103 | |
| | |
Long Island Power Authority, NY, Electric System Revenue, 2.432%, (70% of 1 mo. USD LIBOR + 0.75%), 10/1/23 (Put Date), 5/1/33(1) | | | 16,000 | | | | 16,072,160 | |
| | |
Long Island Power Authority, NY, Electric System Revenue, 5.00%, 9/1/29 | | | 500 | | | | 629,315 | |
| | |
Missouri Joint Municipal Electric Utility Commission, (Prairie State Energy Campus), 5.00%, 1/1/28 | | | 1,515 | | | | 1,905,764 | |
| | |
Montgomery County Industrial Development Authority, PA, (Exelon Generation Co., LLC), 2.55% to 6/1/20 (Put Date), 6/1/29 | | | 1,750 | | | | 1,757,857 | |
| | |
Montgomery County Industrial Development Authority, PA, (Exelon Generation Co., LLC), (AMT), 2.70% to 4/1/20 (Put Date), 10/1/34 | | | 1,500 | | | | 1,505,400 | |
| | |
Nebraska Public Power District, 5.00%, 1/1/24 | | | 750 | | | | 871,373 | |
| | |
Omaha Public Power District, NE, 4.00%, 2/1/33 | | | 11,010 | | | | 11,593,090 | |
| | |
Omaha Public Power District, NE, 5.00%, 2/1/25 | | | 550 | | | | 656,491 | |
| | |
Public Power Generation Agency, NE, (Whelan Energy Center Unit 2), 5.00%, 1/1/25 | | | 2,525 | | | | 2,981,520 | |
| | |
Unified Government of Wyandotte County/Kansas City, KS, Utility System Revenue, 5.00%, 9/1/26 | | | 1,165 | | | | 1,386,979 | |
| | |
Unified Government of Wyandotte County/Kansas City, KS, Utility System Revenue, 5.00%, 9/1/27 | | | 1,000 | | | | 1,186,060 | |
| | |
Vermont Public Power Supply Authority, (Swanton Peaking Facility), 5.00%, 7/1/25 | | | 520 | | | | 600,631 | |
| | |
Vermont Public Power Supply Authority, (Swanton Peaking Facility), 5.00%, 7/1/26 | | | 675 | | | | 791,816 | |
| | | | | | | | |
| Security | | Principal
Amount
(000’s omitted) | | | Value | |
|
| Electric Utilities (continued) | |
| | |
Vermont Public Power Supply Authority, (Swanton Peaking Facility), 5.00%, 7/1/27 | | $ | 660 | | | $ | 784,047 | |
| | |
Vermont Public Power Supply Authority, (Swanton Peaking Facility), 5.00%, 7/1/28 | | | 500 | | | | 589,240 | |
| | |
Vernon, CA, Electric System Revenue, 5.125%, 8/1/21 | | | 65 | | | | 65,233 | |
| | | | | | | | | |
| |
| | | | $ | 53,148,666 | |
|
| Escrowed / Prerefunded — 0.3% | |
| | |
Martin County Health Facilities Authority, FL, (Martin Memorial Medical Center), Escrowed to Maturity, 5.00%, 11/15/24 | | $ | 1,000 | | | $ | 1,188,970 | |
| | |
Martin County Health Facilities Authority, FL, (Martin Memorial Medical Center), Prerefunded to 11/15/24, 5.00%, 11/15/28 | | | 1,830 | | | | 2,175,815 | |
| | |
Norfolk Economic Development Authority, VA, (Bon Secours Health System, Inc.), Prerefunded to 11/1/22, 5.00%, 11/1/28 | | | 225 | | | | 251,154 | |
| | |
Oklahoma Development Finance Authority, (St. John Health System), Prerefunded to 2/15/22, 5.00%, 2/15/26 | | | 500 | | | | 547,715 | |
| | | | | | | | | |
| |
| | | | $ | 4,163,654 | |
|
| General Obligations — 13.6% | |
| | |
Ann Arbor Public Schools, MI, 5.00%, 5/1/23 | | $ | 10 | | | $ | 11,429 | |
| | |
Ann Arbor Public Schools, MI, 5.00%, 5/1/27 | | | 1,000 | | | | 1,194,860 | |
| | |
Beaverton School District No. 48J, Washington and Multnomah Counties, OR, 5.00%, 6/15/25 | | | 1,865 | | | | 2,259,317 | |
| | |
Beaverton School District No. 48J, Washington and Multnomah Counties, OR, 5.00%, 6/15/26 | | | 2,000 | | | | 2,478,380 | |
| | |
Bergen County, NJ, 3.00%, 7/15/30 | | | 3,390 | | | | 3,635,707 | |
| | |
Burlington, VT, 5.00%, 11/1/21 | | | 600 | | | | 647,166 | |
| | |
Burlington, VT, 5.00%, 11/1/22 | | | 500 | | | | 556,135 | |
| | |
Burlington, VT, 5.00%, 11/1/24 | | | 400 | | | | 470,216 | |
| | |
Burlington, VT, 5.00%, 11/1/25 | | | 500 | | | | 601,275 | |
| | |
California, 1.83%, (SIFMA + 0.43%), 12/1/23 (Put Date), 12/1/29(1) | | | 12,000 | | | | 12,059,760 | |
| | |
Chelsea School District, MI, 4.00%, 5/1/24 | | | 765 | | | | 860,832 | |
| | |
Chelsea School District, MI, 4.00%, 5/1/25 | | | 765 | | | | 876,124 | |
| | |
Chicago, IL, 5.00%, 12/1/22 | | | 2,230 | | | | 2,319,445 | |
| | |
Chicago, IL, 5.00%, 1/1/28 | | | 3,000 | | | | 3,450,120 | |
| | |
Chicago, IL, 5.625%, 1/1/30 | | | 6,000 | | | | 7,069,320 | |
| | |
Chicago, IL, 6.00%, 1/1/38 | | | 4,000 | | | | 4,688,360 | |
| | |
Chicago Board of Education, IL, 5.00%, 12/1/25 | | | 6,195 | | | | 6,978,977 | |
| | |
Chicago Board of Education, IL, 5.00%, 12/1/26 | | | 2,905 | | | | 3,307,372 | |
| | |
Chicago Park District, IL, 5.00%, 1/1/24 | | | 500 | | | | 564,235 | |
| | |
Clackamas Community College District, OR, 0.00%, 6/15/21 | | | 385 | | | | 376,364 | |
| | |
Connecticut, 5.00%, 4/15/34 | | | 1,000 | | | | 1,230,410 | |
| | | | |
| | 8 | | See Notes to Financial Statements. |
Eaton Vance
Municipal Opportunities Fund
July 31, 2019
Portfolio of Investments — continued
| | | | | | | | |
| Security | | Principal
Amount
(000’s omitted) | | | Value | |
|
| General Obligations (continued) | |
| | |
Dallas, TX, 5.00%, 2/15/25 | | $ | 1,000 | | | $ | 1,194,740 | |
| | |
Delaware Valley Regional Finance Authority, PA, 2.37%, (67% of 1 mo. USD LIBOR + 0.76%), 9/1/24 (Put Date), 9/1/48(1) | | | 8,000 | | | | 8,008,240 | |
| | |
Elmira, NY, 3.00%, 5/22/20(2) | | | 1,000 | | | | 1,007,640 | |
| | |
Fern Ridge School District 28J, Lane and Douglas Counties, OR, 4.00%, 6/15/22 | | | 875 | | | | 946,181 | |
| | |
Fern Ridge School District 28J, Lane and Douglas Counties, OR, 4.00%, 6/15/23 | | | 960 | | | | 1,062,173 | |
| | |
Georgia, 5.00%, 2/1/31 | | | 9,205 | | | | 11,374,066 | |
| | |
Harper Creek Community Schools, MI, 4.00%, 5/1/25 | | | 1,070 | | | | 1,217,810 | |
| | |
Harper Creek Community Schools, MI, 4.00%, 5/1/26 | | | 1,045 | | | | 1,203,861 | |
| | |
Haslett Public Schools, MI, 4.00%, 5/1/25 | | | 1,780 | | | | 2,027,990 | |
| | |
Illinois, 5.00%, 8/1/20 | | | 3,000 | | | | 3,091,440 | |
| | |
Illinois, 5.00%, 11/1/21 | | | 5,000 | | | | 5,297,050 | |
| | |
Illinois, 5.00%, 10/1/22 | | | 2,000 | | | | 2,161,520 | |
| | |
Illinois, 5.00%, 2/1/24 | | | 5,000 | | | | 5,491,800 | |
| | |
Illinois, 5.00%, 2/1/25 | | | 10,000 | | | | 11,159,400 | |
| | |
Illinois, 5.00%, 2/1/27 | | | 5,000 | | | | 5,714,050 | |
| | |
Illinois, 5.00%, 2/1/28 | | | 10,000 | | | | 11,383,100 | |
| | |
Illinois, 5.00%, 11/1/28 | | | 10,000 | | | | 11,304,100 | |
| | |
Kane, Cook and DuPage Counties School District No. 46, IL, 5.00%, 1/1/26 | | | 900 | | | | 1,023,075 | |
| | |
Kane, Cook and DuPage Counties School District No. 46, IL, 5.00%, 1/1/29 | | | 2,000 | | | | 2,261,980 | |
| | |
Katy Independent School District, TX, (PSF Guaranteed), 4.00%, 2/15/33 | | | 5,995 | | | | 6,869,191 | |
| | |
Manchester Community Schools, MI, 5.00%, 5/1/24 | | | 1,300 | | | | 1,517,971 | |
| | |
Manchester Community Schools, MI, 5.00%, 5/1/25 | | | 750 | | | | 896,603 | |
| | |
Massachusetts, 2.278%, (67% of 3 mo. USD LIBOR + 0.55%), 11/1/25(1) | | | 4,630 | | | | 4,637,593 | |
| | |
Mattawan Consolidated School, Van Buren and Kalamazoo Counties, MI, 5.00%, 5/1/26 | | | 750 | | | | 892,950 | |
| | |
Mattawan Consolidated School, Van Buren and Kalamazoo Counties, MI, 5.00%, 5/1/27 | | | 1,000 | | | | 1,184,550 | |
| | |
Mattawan Consolidated School, Van Buren and Kalamazoo Counties, MI, 5.00%, 5/1/28 | | | 500 | | | | 588,630 | |
| | |
New York, NY, 5.00%, 8/1/25 | | | 1,000 | | | | 1,148,720 | |
| | |
New York, NY, 5.00%, 8/1/29 | | | 450 | | | | 514,265 | |
| | |
Norfolk, VA, 5.00%, 9/1/33 | | | 1,850 | | | | 2,166,831 | |
| | |
Ottawa County, MI, 5.00%, 11/1/22 | | | 500 | | | | 563,095 | |
| | |
Ottawa County, MI, 5.00%, 11/1/24 | | | 250 | | | | 299,188 | |
| | |
Ottawa County, MI, 5.00%, 11/1/25 | | | 300 | | | | 367,767 | |
| | |
Saugatuck Public Schools, MI, 4.00%, 5/1/25 | | | 1,085 | | | | 1,245,851 | |
| | |
Sedgwick County Unified School District No. 265, KS, 5.00%, 10/1/26 | | | 1,000 | | | | 1,237,230 | |
| | | | | | | | |
| Security | | Principal
Amount
(000’s omitted) | | | Value | |
|
| General Obligations (continued) | |
| | |
Sherwood School District No. 88J, Washington, Clackamas and Yamhill Counties, OR, 5.00%, 6/15/24 | | $ | 2,000 | | | $ | 2,360,920 | |
| | |
St. Joseph Public Schools, MI, 5.00%, 5/1/28 | | | 1,880 | | | | 2,233,778 | |
| | |
St. Joseph Public Schools, MI, 5.00%, 5/1/29 | | | 1,650 | | | | 1,946,917 | |
| | |
Texas, (Texas Transportation Commission), 5.00%, 10/1/24 | | | 1,000 | | | | 1,190,730 | |
| | |
Thornapple Kellogg School, MI, 5.00%, 5/1/24 | | | 400 | | | | 466,668 | |
| | |
Upper Merion Area School District, PA, 5.00%, 1/15/29 | | | 500 | | | | 589,410 | |
| | |
Upper Merion Area School District, PA, 5.00%, 1/15/30 | | | 300 | | | | 352,665 | |
| | |
Walled Lake Consolidated School District, MI, 4.00%, 5/1/24 | | | 740 | | | | 831,605 | |
| | |
Will and Cook Counties Community High School District No. 210, IL, 0.00%, 1/1/27 | | | 65 | | | | 51,280 | |
| | |
Will and Cook Counties Community High School District No. 210, IL, 5.00%, 1/1/29 | | | 1,185 | | | | 1,252,557 | |
| | | | | | | | | |
| |
| | | | $ | 177,972,985 | |
|
| Hospital — 18.5% | |
| | |
Astoria Hospital Facilities Authority, OR, (Columbia Memorial Hospital), 5.00%, 8/1/41 | | $ | 940 | | | $ | 1,064,917 | |
| | |
Augusta Development Authority, GA, (AU Health System, Inc.), 5.00%, 7/1/26 | | | 2,525 | | | | 2,990,963 | |
| | |
Augusta Development Authority, GA, (AU Health System, Inc.), 5.00%, 7/1/27 | | | 2,635 | | | | 3,168,271 | |
| | |
Baxter County, AR, (Baxter Regional Medical Center), 5.00%, 9/1/19 | | | 620 | | | | 621,432 | |
| | |
Baxter County, AR, (Baxter Regional Medical Center), 5.00%, 9/1/21 | | | 1,140 | | | | 1,205,037 | |
| | |
Baxter County, AR, (Baxter Regional Medical Center), 5.00%, 9/1/23 | | | 930 | | | | 1,030,598 | |
| | |
Baxter County, AR, (Baxter Regional Medical Center), 5.00%, 9/1/25 | | | 1,125 | | | | 1,295,179 | |
| | |
Baxter County, AR, (Baxter Regional Medical Center), Series A, 5.00%, 9/1/20 | | | 780 | | | | 803,431 | |
| | |
Baxter County, AR, (Baxter Regional Medical Center), Series A, 5.00%, 9/1/22 | | | 1,660 | | | | 1,797,963 | |
| | |
Baxter County, AR, (Baxter Regional Medical Center), Series A, 5.00%, 9/1/24 | | | 1,350 | | | | 1,527,579 | |
| | |
Baxter County, AR, (Baxter Regional Medical Center), Series A, 5.00%, 9/1/26 | | | 1,000 | | | | 1,168,400 | |
| | |
Baxter County, AR, (Baxter Regional Medical Center), Series B, 5.00%, 9/1/20 | | | 240 | | | | 247,210 | |
| | |
Baxter County, AR, (Baxter Regional Medical Center), Series B, 5.00%, 9/1/22 | | | 265 | | | | 287,024 | |
| | |
Baxter County, AR, (Baxter Regional Medical Center), Series B, 5.00%, 9/1/24 | | | 290 | | | | 328,147 | |
| | |
Baxter County, AR, (Baxter Regional Medical Center), Series B, 5.00%, 9/1/26 | | | 320 | | | | 373,888 | |
| | | | |
| | 9 | | See Notes to Financial Statements. |
Eaton Vance
Municipal Opportunities Fund
July 31, 2019
Portfolio of Investments — continued
| | | | | | | | |
| Security | | Principal
Amount
(000’s omitted) | | | Value | |
|
| Hospital (continued) | |
| | |
Boone County, MO, (Boone Hospital Center), 5.00%, 8/1/29 | | $ | 1,410 | | | $ | 1,574,491 | |
| | |
Boone County, MO, (Boone Hospital Center), 5.00%, 8/1/31 | | | 3,215 | | | | 3,550,035 | |
| | |
Brookhaven Development Authority, GA, (Children’s Healthcare of Atlanta), 3.00%, 7/1/46(4) | | | 3,250 | | | | 3,209,472 | |
| | |
Calhoun County Hospital Finance Authority, MI, (Oaklawn Hospital), 5.00%, 2/15/28 | | | 1,740 | | | | 1,997,955 | |
| | |
Calhoun County Hospital Finance Authority, MI, (Oaklawn Hospital), 5.00%, 2/15/32 | | | 2,110 | | | | 2,369,066 | |
| | |
California Municipal Finance Authority, (NorthBay Healthcare Group), 5.00%, 11/1/23 | | | 100 | | | | 113,563 | |
| | |
California Municipal Finance Authority, (NorthBay Healthcare Group), 5.00%, 11/1/27 | | | 360 | | | | 410,864 | |
| | |
California Municipal Finance Authority, (NorthBay Healthcare Group), 5.00%, 11/1/28 | | | 300 | | | | 341,268 | |
| | |
California Municipal Finance Authority, (NorthBay Healthcare Group), 5.00%, 11/1/29 | | | 110 | | | | 124,693 | |
| | |
California Municipal Finance Authority, (NorthBay Healthcare Group), 5.00%, 11/1/30 | | | 150 | | | | 169,157 | |
| | |
California Municipal Finance Authority, (NorthBay Healthcare Group), 5.00%, 11/1/35 | | | 250 | | | | 276,660 | |
| | |
California Municipal Finance Authority, (NorthBay Healthcare Group), Series 2015, 5.00%, 11/1/25 | | | 200 | | | | 231,232 | |
| | |
California Statewide Communities Development Authority, (Cottage Health System Obligated Group), 5.00%, 11/1/26 | | | 425 | | | | 499,044 | |
| | |
California Statewide Communities Development Authority, (Loma Linda University Medical Center), 5.25%, 12/1/29 | | | 1,500 | | | | 1,719,825 | |
| | |
Connecticut Health and Educational Facilities Authority, (Hartford HealthCare Corp.), 2.584%, (68% of 1 mo. USD LIBOR + 0.95%), 7/1/20 (Put Date), 7/1/49(1) | | | 13,665 | | | | 13,686,864 | |
| | |
Crawford County Hospital Authority, PA, (Meadville Medical Center), 6.00%, 6/1/36 | | | 1,910 | | | | 2,208,304 | |
| | |
Decatur Hospital Authority, TX, (Wise Regional Health System), 4.00%, 9/1/20 | | | 225 | | | | 229,952 | |
| | |
Decatur Hospital Authority, TX, (Wise Regional Health System), 5.00%, 9/1/21 | | | 330 | | | | 350,008 | |
| | |
Decatur Hospital Authority, TX, (Wise Regional Health System), 5.00%, 9/1/22 | | | 150 | | | | 163,355 | |
| | |
Decatur Hospital Authority, TX, (Wise Regional Health System), 5.00%, 9/1/23 | | | 200 | | | | 223,124 | |
| | |
Delaware Health Facilities Authority, (Beebe Medical Center), 5.00%, 6/1/30 | | | 600 | | | | 728,700 | |
| | |
Delaware Health Facilities Authority, (Beebe Medical Center), 5.00%, 6/1/31 | | | 1,200 | | | | 1,443,300 | |
| | |
Deschutes County Hospital Facilities Authority, OR, (St. Charles Health System), 4.00%, 1/1/33 | | | 500 | | | | 541,480 | |
| | |
Fredericksburg Economic Development Authority, VA, (Mary Washington Healthcare), 5.00%, 6/15/24 | | | 1,000 | | | | 1,168,580 | |
| | | | | | | | |
| Security | | Principal
Amount
(000’s omitted) | | | Value | |
|
| Hospital (continued) | |
| | |
Halifax Hospital Medical Center, FL, 5.00%, 6/1/27 | | $ | 2,890 | | | $ | 3,419,939 | |
| | |
Halifax Hospital Medical Center, FL, 5.00%, 6/1/29 | | | 1,830 | | | | 2,143,570 | |
| | |
Illinois Finance Authority, (Presence Health Network), 3.75%, 2/15/34 | | | 3,145 | | | | 3,345,997 | |
| | |
Illinois Finance Authority, (Presence Health Network), 5.00%, 2/15/28 | | | 8,000 | | | | 9,921,280 | |
| | |
Illinois Finance Authority, (Silver Cross Hospital and Medical Centers), 5.00%, 8/15/23 | | | 1,000 | | | | 1,122,320 | |
| | |
Illinois Finance Authority, (Silver Cross Hospital and Medical Centers), 5.00%, 8/15/28 | | | 1,670 | | | | 1,937,951 | |
| | |
Indiana County Hospital Authority, PA, (Indiana Regional Medical Center), 5.125%, 6/1/26 | | | 475 | | | | 514,658 | |
| | |
Indiana County Hospital Authority, PA, (Indiana Regional Medical Center), 5.25%, 6/1/27 | | | 415 | | | | 450,673 | |
| | |
Indiana County Hospital Authority, PA, (Indiana Regional Medical Center), 5.375%, 6/1/28 | | | 455 | | | | 494,685 | |
| | |
Indiana Finance Authority, (Parkview Health), 5.00%, 11/1/26 | | | 1,200 | | | | 1,478,904 | |
| | |
Jefferson County Civic Facility Development Corp., NY, (Samaritan Medical Center), 4.00%, 11/1/29 | | | 505 | | | | 553,480 | |
| | |
Jefferson County Civic Facility Development Corp., NY, (Samaritan Medical Center), 4.00%, 11/1/30 | | | 1,605 | | | | 1,749,033 | |
| | |
Jefferson County Civic Facility Development Corp., NY, (Samaritan Medical Center), 5.00%, 11/1/26 | | | 1,375 | | | | 1,615,322 | |
| | |
Jefferson County Civic Facility Development Corp., NY, (Samaritan Medical Center), 5.00%, 11/1/27 | | | 1,440 | | | | 1,714,003 | |
| | |
Klamath Falls Intercommunity Hospital Authority, OR, (Sky Lakes Medical Center), 4.00%, 9/1/24 | | | 475 | | | | 529,535 | |
| | |
Klamath Falls Intercommunity Hospital Authority, OR, (Sky Lakes Medical Center), 4.00%, 9/1/25 | | | 550 | | | | 622,165 | |
| | |
Klamath Falls Intercommunity Hospital Authority, OR, (Sky Lakes Medical Center), 5.00%, 9/1/28 | | | 795 | | | | 957,848 | |
| | |
Klamath Falls Intercommunity Hospital Authority, OR, (Sky Lakes Medical Center), 5.00%, 9/1/31 | | | 600 | | | | 711,180 | |
| | |
Lexington County Health Services District, Inc., SC, 5.00%, 11/1/27 | | | 200 | | | | 250,260 | |
| | |
Maryland Health and Higher Educational Facilities Authority, (Meritus Medical Center), 5.00%, 7/1/23 | | | 1,000 | | | | 1,132,600 | |
| | |
Maryland Health and Higher Educational Facilities Authority, (Meritus Medical Center), 5.00%, 7/1/24 | | | 1,775 | | | | 2,061,183 | |
| | |
Maryland Health and Higher Educational Facilities Authority, (Meritus Medical Center), 5.00%, 7/1/28 | | | 1,300 | | | | 1,518,582 | |
| | |
Massachusetts Development Finance Agency, (Atrius Health), 4.00%, 6/1/49 | | | 850 | | | | 903,601 | |
| | |
Massachusetts Development Finance Agency, (Atrius Health), 5.00%, 6/1/39 | | | 710 | | | | 845,823 | |
| | |
Massachusetts Development Finance Agency, (Lawrence General Hospital), 5.00%, 7/1/32 | | | 500 | | | | 567,130 | |
| | | | |
| | 10 | | See Notes to Financial Statements. |
Eaton Vance
Municipal Opportunities Fund
July 31, 2019
Portfolio of Investments — continued
| | | | | | | | |
| Security | | Principal
Amount
(000’s omitted) | | | Value | |
|
| Hospital (continued) | |
| | |
Massachusetts Development Finance Agency, (Milford Regional Medical Center), 5.00%, 7/15/27 | | $ | 125 | | | $ | 135,503 | |
| | |
Massachusetts Development Finance Agency, (South Shore Hospital), 5.00%, 7/1/25 | | | 500 | | | | 593,530 | |
| | |
Massachusetts Development Finance Agency, (South Shore Hospital), 5.00%, 7/1/27 | | | 1,100 | | | | 1,321,562 | |
| | |
Massachusetts Development Finance Agency, (UMass Memorial Health Care Obligated Group), 5.00%, 7/1/22 | | | 2,835 | | | | 3,023,046 | |
| | |
Massachusetts Development Finance Agency, (UMass Memorial Health Care Obligated Group), 5.00%, 7/1/26 | | | 1,150 | | | | 1,385,186 | |
| | |
Massachusetts Development Finance Agency, (UMass Memorial Health Care Obligated Group), 5.00%, 7/1/28 | | | 2,000 | | | | 2,438,200 | |
| | |
Massachusetts Development Finance Agency, (UMass Memorial Health Care Obligated Group), 5.00%, 7/1/29 | | | 2,700 | | | | 3,269,538 | |
| | |
Massachusetts Development Finance Agency, (UMass Memorial Health Care Obligated Group), Series I 2016, 5.00%, 7/1/27 | | | 1,150 | | | | 1,382,461 | |
| | |
Massachusetts Development Finance Agency, (UMass Memorial Health Care Obligated Group), Series L 2017, 5.00%, 7/1/27 | | | 1,460 | | | | 1,787,536 | |
| | |
Massachusetts Development Finance Agency, (Wellforce), 5.00%, 7/1/27 | | | 1,430 | | | | 1,748,461 | |
| | |
Massachusetts Development Finance Agency, (Wellforce), 5.00%, 7/1/28 | | | 1,250 | | | | 1,552,062 | |
| | |
Massachusetts Health and Educational Facilities Authority, (Baystate Medical Center, Inc.), (LOC: Barclays Bank PLC), 1.47%, 7/1/39(3) | | | 6,645 | | | | 6,645,000 | |
| | |
Massachusetts Health and Educational Facilities Authority, (Lowell General Hospital), 4.75%, 7/1/25 | | | 285 | | | | 293,730 | |
| | |
Michigan Finance Authority, (McLaren Health Care), 2.291%, (68% of 1 mo. USD LIBOR + 0.75%), 10/15/20 (Put Date), 10/15/38(1) | | | 6,250 | | | | 6,269,375 | |
| | |
Michigan Finance Authority, (Oakwood Obligated Group), 5.00%, 11/1/27 | | | 1,400 | | | | 1,555,764 | |
| | |
Missouri Health and Educational Facilities Authority, (SSM Health Care), 5.00%, 6/1/26 | | | 1,000 | | | | 1,162,500 | |
| | |
Montana Facility Finance Authority, (Billings Clinic Obligated Group), 1.95%, (SIFMA + 0.55%), 8/15/23 (Put Date), 8/15/37(1) | | | 9,715 | | | | 9,706,062 | |
| | |
Montgomery County Higher Education and Health Authority, PA, (Holy Redeemer Health System), 5.00%, 10/1/27 | | | 1,000 | | | | 1,123,250 | |
| | |
Nassau County Local Economic Assistance Corp., NY, (Catholic Health Services of Long Island), 5.00%, 7/1/29 | | | 1,000 | | | | 1,138,540 | |
| | |
New Hampshire Health and Education Facilities Authority, (Concord Hospital), 5.00%, 10/1/32 | | | 500 | | | | 602,145 | |
| | |
New Hampshire Health and Education Facilities Authority, (Concord Hospital), 5.00%, 10/1/33 | | | 1,000 | | | | 1,200,540 | |
| | |
New Hampshire Health and Education Facilities Authority, (Concord Hospital), 5.00%, 10/1/34 | | | 1,070 | | | | 1,279,763 | |
| | | | | | | | |
| Security | | Principal
Amount
(000’s omitted) | | | Value | |
|
| Hospital (continued) | |
| | |
New Hampshire Health and Education Facilities Authority, (Concord Hospital), 5.00%, 10/1/35 | | $ | 1,550 | | | $ | 1,847,631 | |
| | |
New Jersey Health Care Facilities Financing Authority, (Barnabas Health), 5.00%, 7/1/23 | | | 605 | | | | 670,782 | |
| | |
New Jersey Health Care Facilities Financing Authority, (Hunterdon Medical Center Obligated Group), 5.00%, 7/1/30 | | | 500 | | | | 566,965 | |
| | |
New Jersey Health Care Facilities Financing Authority, (Inspira Health Obligated Group), 5.00%, 7/1/29 | | | 2,600 | | | | 3,134,144 | |
| | |
New Jersey Health Care Facilities Financing Authority, (Princeton HealthCare System), 5.00%, 7/1/24 | | | 1,000 | | | | 1,176,250 | |
| | |
New Jersey Health Care Facilities Financing Authority, (Princeton HealthCare System), 5.00%, 7/1/28 | | | 1,080 | | | | 1,319,944 | |
| | |
New Jersey Health Care Facilities Financing Authority, (St. Joseph’s Healthcare System Obligated Group), 4.00%, 7/1/48 | | | 20,000 | | | | 21,155,400 | |
| | |
New Jersey Health Care Facilities Financing Authority, (St. Joseph’s Healthcare System Obligated Group), 5.00%, 7/1/30 | | | 30 | | | | 35,034 | |
| | |
New Jersey Health Care Facilities Financing Authority, (Trinitas Regional Medical Center Obligated Group), 5.00%, 7/1/27 | | | 1,000 | | | | 1,190,710 | |
| | |
New Jersey Health Care Facilities Financing Authority, (Trinitas Regional Medical Center Obligated Group), 5.00%, 7/1/29 | | | 500 | | | | 590,610 | |
| | |
New Jersey Health Care Facilities Financing Authority, (Virtua Health), 5.00%, 7/1/27 | | | 500 | | | | 573,785 | |
| | |
New York Dormitory Authority, (Catholic Health System Obligated Group), 5.00%, 7/1/34 | | | 550 | | | | 676,907 | |
| | |
New York Dormitory Authority, (Catholic Health System Obligated Group), 5.00%, 7/1/35 | | | 625 | | | | 764,862 | |
| | |
New York Dormitory Authority, (Catholic Health System Obligated Group), 5.00%, 7/1/36 | | | 550 | | | | 672,782 | |
| | |
New York Dormitory Authority, (Memorial Sloan Kettering Cancer Center), 5.00%, 7/1/29 | | | 750 | | | | 946,237 | |
| | |
New York Dormitory Authority, (NYU Hospitals Center), 5.00%, 7/1/22 | | | 440 | | | | 488,378 | |
| | |
New York Dormitory Authority, (NYU Hospitals Center), 5.00%, 7/1/23 | | | 600 | | | | 686,448 | |
| | |
New York Dormitory Authority, (NYU Hospitals Center), 5.00%, 7/1/25 | | | 2,000 | | | | 2,412,900 | |
| | |
New York Dormitory Authority, (Orange Regional Medical Center), 5.00%, 12/1/22(2) | | | 700 | | | | 772,583 | |
| | |
New York Dormitory Authority, (Orange Regional Medical Center), 5.00%, 12/1/25(2) | | | 1,000 | | | | 1,171,600 | |
| | |
New York Dormitory Authority, (Orange Regional Medical Center), 5.00%, 12/1/27(2) | | | 500 | | | | 581,470 | |
| | |
New York Dormitory Authority, (Orange Regional Medical Center), 5.00%, 12/1/28(2) | | | 600 | | | | 695,526 | |
| | | | |
| | 11 | | See Notes to Financial Statements. |
Eaton Vance
Municipal Opportunities Fund
July 31, 2019
Portfolio of Investments — continued
| | | | | | | | |
| Security | | Principal
Amount
(000’s omitted) | | | Value | |
|
| Hospital (continued) | |
| | |
New York Dormitory Authority, (Orange Regional Medical Center), 5.00%, 12/1/29(2) | | $ | 450 | | | $ | 519,345 | |
| | |
New York Dormitory Authority, (Orange Regional Medical Center), 5.00%, 12/1/30(2) | | | 1,000 | | | | 1,148,760 | |
| | |
New York Dormitory Authority, (Orange Regional Medical Center), 5.00%, 12/1/31(2) | | | 1,100 | | | | 1,258,851 | |
| | |
New York Dormitory Authority, (Orange Regional Medical Center), 5.00%, 12/1/32(2) | | | 1,100 | | | | 1,255,749 | |
| | |
New York Dormitory Authority, (Orange Regional Medical Center), 5.00%, 12/1/33(2) | | | 1,100 | | | | 1,252,702 | |
| | |
New York Dormitory Authority, (Orange Regional Medical Center), 5.00%, 12/1/34(2) | | | 1,200 | | | | 1,361,424 | |
| | |
New York Dormitory Authority, (Orange Regional Medical Center), 5.00%, 12/1/35(2) | | | 1,000 | | | | 1,131,720 | |
| | |
New York Dormitory Authority, (Orange Regional Medical Center), Series 2015, 5.00%, 12/1/26(2) | | | 300 | | | | 350,058 | |
| | |
New York Dormitory Authority, (Orange Regional Medical Center), Series 2017, 5.00%, 12/1/26(2) | | | 1,500 | | | | 1,804,545 | |
| | |
Northampton County General Purpose Authority, PA, (St. Luke’s University Health Network), 2.722%, (70% of 1 mo. USD LIBOR + 1.04%), 8/15/24 (Put Date), 8/15/48(1) | | | 1,000 | | | | 1,005,550 | |
| | |
Ohio, (University Hospitals Health System, Inc.), 5.00%, 1/15/27 | | | 850 | | | | 1,017,501 | |
| | |
Oklahoma Development Finance Authority, (OU Medicine), 5.00%, 8/15/33 | | | 3,165 | | | | 3,785,846 | |
| | |
Oregon Facilities Authority, (PeaceHealth), 5.00%, 11/15/29 | | | 500 | | | | 577,575 | |
| | |
Oroville, CA, (Oroville Hospital), 5.00%, 4/1/31 | | | 1,705 | | | | 2,034,883 | |
| | |
Oroville, CA, (Oroville Hospital), 5.25%, 4/1/34 | | | 2,000 | | | | 2,419,820 | |
| | |
Palm Beach County Health Facilities Authority, FL, (BRRH Corp. Obligated Group), 5.00%, 12/1/25 | | | 500 | | | | 590,765 | |
| | |
Phoenix Industrial Development Authority, AZ, (Mayo Clinic), (SPA: Wells Fargo Bank, N.A.), 1.47%, 11/15/52(3) | | | 4,245 | | | | 4,245,000 | |
| | |
Rhode Island Health and Educational Building Corp., (Care New England Health System), 5.00%, 9/1/31 | | | 4,000 | | | | 4,563,480 | |
| | |
Southcentral Pennsylvania General Authority, (Hanover Hospital, Inc.), 5.00%, 12/1/25 | | | 1,530 | | | | 1,842,120 | |
| | |
Southcentral Pennsylvania General Authority, (Hanover Hospital, Inc.), 5.00%, 12/1/26 | | | 1,410 | | | | 1,684,626 | |
| | |
Southcentral Pennsylvania General Authority, (Hanover Hospital, Inc.), 5.00%, 12/1/28 | | | 1,550 | | | | 1,832,720 | |
| | |
St. Cloud, MN, (CentraCare Health System), 5.00%, 5/1/27 | | | 1,000 | | | | 1,213,940 | |
| | |
Tallahassee, FL, (Tallahassee Memorial HealthCare, Inc.), 5.00%, 12/1/22 | | | 475 | | | | 526,861 | |
| | |
Tallahassee, FL, (Tallahassee Memorial HealthCare, Inc.), 5.00%, 12/1/23 | | | 400 | | | | 455,056 | |
| | |
Tallahassee, FL, (Tallahassee Memorial HealthCare, Inc.), 5.00%, 12/1/24 | | | 500 | | | | 581,700 | |
| | | | | | | | |
| Security | | Principal
Amount
(000’s omitted) | | | Value | |
|
| Hospital (continued) | |
| | |
Tallahassee, FL, (Tallahassee Memorial HealthCare, Inc.), 5.00%, 12/1/25 | | $ | 500 | | | $ | 592,400 | |
| | |
Tallahassee, FL, (Tallahassee Memorial HealthCare, Inc.), 5.00%, 12/1/26 | | | 500 | | | | 590,155 | |
| | |
Tallahassee, FL, (Tallahassee Memorial HealthCare, Inc.), 5.00%, 12/1/27 | | | 500 | | | | 587,695 | |
| | |
Ward County, ND, (Trinity Obligated Group), 5.00%, 6/1/29 | | | 1,300 | | | | 1,547,351 | |
| | |
Ward County, ND, (Trinity Obligated Group), 5.00%, 6/1/30 | | | 1,815 | | | | 2,147,581 | |
| | |
Ward County, ND, (Trinity Obligated Group), 5.00%, 6/1/31 | | | 1,885 | | | | 2,213,084 | |
| | |
Ward County, ND, (Trinity Obligated Group), 5.00%, 6/1/34 | | | 3,000 | | | | 3,472,560 | |
| | |
Washington Health Care Facilities Authority, (Overlake Hospital Medical Center), 5.00%, 7/1/30 | | | 1,600 | | | | 1,980,400 | |
| | |
Washington Health Care Facilities Authority, (PeaceHealth), 5.00%, 11/15/26 | | | 1,000 | | | | 1,161,320 | |
| | |
Wisconsin Health and Educational Facilities Authority, (Ascension Senior Credit Group), 5.00%, 11/15/27 | | | 1,000 | | | | 1,220,620 | |
| | |
Yavapai County Industrial Development Authority, AZ, (Yavapai Regional Medical Center), 5.25%, 8/1/33 | | | 250 | | | | 283,505 | |
| | | | | | | | | |
| |
| | | | $ | 241,804,723 | |
|
| Housing — 2.0% | |
| | |
California Municipal Finance Authority,(CHF-Riverside II, LLC), 5.00%, 5/15/32 | | $ | 415 | | | $ | 519,306 | |
| | |
California Municipal Finance Authority,(CHF-Riverside II, LLC), 5.00%, 5/15/33 | | | 1,450 | | | | 1,803,191 | |
| | |
California Municipal Finance Authority,(CHF-Riverside II, LLC), 5.00%, 5/15/34 | | | 2,335 | | | | 2,888,512 | |
| | |
California Municipal Finance Authority,(CHF-Riverside II, LLC), 5.00%, 5/15/37 | | | 2,755 | | | | 3,363,827 | |
| | |
California Municipal Finance Authority,(CHF-Riverside II, LLC), 5.00%, 5/15/38 | | | 500 | | | | 608,410 | |
| | |
East Hempfield Township Industrial Development Authority, PA, (Student Services, Inc.), 5.00%, 7/1/29 | | | 500 | | | | 547,755 | |
| | |
Independent Cities Finance Authority, CA, (Union City Tropics), 4.00%, 5/15/32 | | | 1,060 | | | | 1,181,646 | |
| | |
Independent Cities Finance Authority, CA, (Union City Tropics), 4.00%, 5/15/33 | | | 1,100 | | | | 1,219,229 | |
| | |
New Hope Cultural Education Facilities Finance Corp., TX,(CHF-Collegiate Housing Galveston I, LLC), 5.00%, 4/1/23 | | | 910 | | | | 969,414 | |
| | |
New Hope Cultural Education Facilities Finance Corp., TX,(CHF-Collegiate Housing Island Campus, LLC - Texas A&M University-Corpus Christi), 5.00%, 4/1/24 | | | 1,385 | | | | 1,477,310 | |
| | |
New Hope Cultural Education Facilities Finance Corp., TX,(CHF-Collegiate Housing Island Campus, LLC - Texas A&M University-Corpus Christi), 5.00%, 4/1/25 | | | 1,505 | | | | 1,620,012 | |
| | | | |
| | 12 | | See Notes to Financial Statements. |
Eaton Vance
Municipal Opportunities Fund
July 31, 2019
Portfolio of Investments — continued
| | | | | | | | |
| Security | | Principal
Amount
(000’s omitted) | | | Value | |
|
| Housing (continued) | |
| | |
New Hope Cultural Education Facilities Finance Corp., TX,(CHF-Collegiate Housing Island Campus, LLC - Texas A&M University-Corpus Christi), 5.00%, 4/1/26 | | $ | 1,000 | | | $ | 1,084,090 | |
| | |
New Hope Cultural Education Facilities Finance Corp., TX,(CHF-Collegiate Housing Island Campus, LLC - Texas A&M University-Corpus Christi), 5.00%, 4/1/27 | | | 760 | | | | 826,956 | |
| | |
New Hope Cultural Education Facilities Finance Corp., TX,(CHF-Collegiate Housing Island Campus, LLC - Texas A&M University-Corpus Christi), 5.00%, 4/1/28 | | | 570 | | | | 615,868 | |
| | |
New Hope Cultural Education Facilities Finance Corp., TX,(CHF-Collegiate Housing Island Campus, LLC - Texas A&M University-Corpus Christi), 5.00%, 4/1/29 | | | 570 | | | | 613,120 | |
| | |
New Hope Cultural Education Facilities Finance Corp., TX,(CHF-Collegiate Housing Stephenville III, LLC - Tarleton State University), 5.00%, 4/1/23 | | | 400 | | | | 435,668 | |
| | |
New Hope Cultural Education Facilities Finance Corp., TX,(CHF-Collegiate Housing Stephenville III, LLC - Tarleton State University), 5.00%, 4/1/25 | | | 715 | | | | 803,603 | |
| | |
North Dakota Housing Finance Agency, 1.80%, (SIFMA + 0.40%), 2/1/22 (Put Date), 1/1/43(1) | | | 5,000 | | | | 5,000,000 | |
| | | | | | | | | |
| |
| | | | $ | 25,577,917 | |
|
| Industrial Development Revenue — 4.8% | |
| | |
Florida Development Finance Corp., (Waste Pro USA, Inc.), (AMT), 5.00%, 5/1/29(2) | | $ | 2,155 | | | $ | 2,357,915 | |
| | |
Florida Development Finance Corp., (Waste Pro USA, Inc.), (AMT), 5.00% to 8/1/22 (Put Date), 8/1/29(2) | | | 2,250 | | | | 2,388,037 | |
| | |
Maine Finance Authority, (Casella Waste Systems, Inc.), (AMT), 4.375% to 8/1/25 (Put Date), 8/1/35(2) | | | 875 | | | | 942,078 | |
| | |
Maine Finance Authority, (Casella Waste Systems, Inc.), (AMT), 5.125% to 8/1/25 (Put Date), 8/1/35(2) | | | 940 | | | | 1,053,270 | |
| | |
Matagorda County Navigation District No. 1, TX, (Central Power and Light Co.), 2.60%, 11/1/29 | | | 2,000 | | | | 2,036,100 | |
| | |
Michigan Strategic Fund, (Waste Management, Inc.), (AMT), 2.85% to 8/2/21 (Put Date), 8/1/27 | | | 4,000 | | | | 4,101,600 | |
| | |
National Finance Authority, NH, (Waste Management, Inc.), (AMT), 2.15%, (SIFMA + 0.75%), 10/1/21 (Put Date), 10/1/33(1) | | | 2,500 | | | | 2,495,275 | |
| | |
New Hampshire Business Finance Authority, (United Illuminating Co.), 2.80% to 10/2/23 (Put Date), 10/1/33 | | | 1,500 | | | | 1,561,650 | |
| | |
New Jersey Economic Development Authority, (Continental Airlines), Series 2000B, (AMT), 5.625%, 11/15/30 | | | 215 | | | | 247,626 | |
| | |
New Jersey Economic Development Authority, (New Jersey Natural Gas Co.), (AMT), 2.45% to 4/1/26 (Put Date), 4/1/59 | | | 2,500 | | | | 2,575,200 | |
| | |
New York State Environmental Facilities Corp., (Casella Waste Systems, Inc.), (AMT), 3.75% to 12/2/19 (Put Date), 12/1/44(2) | | | 7,775 | | | | 7,820,484 | |
| | | | | | | | |
| Security | | Principal
Amount
(000’s omitted) | | | Value | |
|
| Industrial Development Revenue (continued) | |
| | |
Niagara Area Development Corp., NY, (Covanta), 3.50%, 11/1/24(2) | | $ | 1,820 | | | $ | 1,883,300 | |
| | |
Ohio Air Quality Development Authority, (AMG Vanadium), (AMT), 5.00%, 7/1/49(2) | | | 8,000 | | | | 8,606,080 | |
| | |
Ohio Air Quality Development Authority, (Ohio Valley Electric Corp.), 5.625%, 10/1/19 | | | 9,535 | | | | 9,571,233 | |
| | |
Public Finance Authority, WI, (Celanese Corp.), (AMT), 5.00%, 12/1/25 | | | 1,000 | | | | 1,148,030 | |
| | |
Richland County, SC, (International Paper Co.), (AMT), 3.875%, 4/1/23 | | | 1,165 | | | | 1,241,168 | |
| | |
Rockdale County Development Authority, GA, (Pratt Paper, LLC), (AMT), 4.00%, 1/1/38(2) | | | 7,065 | | | | 7,409,701 | |
| | |
Tuscaloosa County Industrial Development Authority, AL, (Hunt Refining Co.), 4.50%, 5/1/32(2) | | | 4,595 | | | | 4,987,321 | |
| | | | | | | | | |
| |
| | | | $ | 62,426,068 | |
|
| Insured – Education — 0.0%(5) | |
| | |
University of Puerto Rico, (NPFG), 5.00%, 6/1/25 | | $ | 120 | | | $ | 121,307 | |
| | | | | | | | | |
| |
| | | | $ | 121,307 | |
|
| Insured – Electric Utilities — 0.8% | |
| | |
Paducah Electric Plant Board, KY, (AGM), 5.00%, 10/1/29 | | $ | 1,500 | | | $ | 1,801,590 | |
| | |
Puerto Rico Electric Power Authority, (AGC), 5.00%, 7/1/26 | | | 280 | | | | 287,717 | |
| | |
Puerto Rico Electric Power Authority, (NPFG), 5.25%, 7/1/22 | | | 3,500 | | | | 3,641,575 | |
| | |
Puerto Rico Electric Power Authority, (NPFG), 5.25%, 7/1/23 | | | 195 | | | | 204,680 | |
| | |
Puerto Rico Electric Power Authority, (NPFG), 5.25%, 7/1/25 | | | 170 | | | | 180,482 | |
| | |
Puerto Rico Electric Power Authority, (NPFG), 5.25%, 7/1/26 | | | 135 | | | | 143,844 | |
| | |
Puerto Rico Electric Power Authority, (NPFG), 5.25%, 7/1/29 | | | 685 | | | | 731,874 | |
| | |
Puerto Rico Electric Power Authority, (NPFG), 5.25%, 7/1/30 | | | 530 | | | | 565,250 | |
| | |
Puerto Rico Electric Power Authority, (NPFG), 5.25%, 7/1/34 | | | 125 | | | | 132,325 | |
| | |
Puerto Rico Electric Power Authority, (NPFG), Series PP, 5.00%, 7/1/25 | | | 1,165 | | | | 1,177,687 | |
| | |
Puerto Rico Electric Power Authority, (NPFG), Series SS, 5.00%, 7/1/25 | | | 1,820 | | | | 1,839,820 | |
| | | | | | | | | |
| |
| | | | $ | 10,706,844 | |
|
| Insured – Escrowed / Prerefunded — 0.0%(5) | |
| | |
Cambria County, PA, (BAM), Escrowed to Maturity, 5.00%, 8/1/23 | | $ | 240 | | | $ | 276,098 | |
| | | | | | | | | |
| |
| | | | $ | 276,098 | |
|
| Insured – General Obligations — 2.5% | |
| | |
Allegheny Valley School District, PA, (BAM), 5.00%, 11/1/22 | | $ | 350 | | | $ | 390,121 | |
| | |
Atlantic City, NJ, (BAM), 5.00%, 3/1/23 | | | 500 | | | | 559,425 | |
| | |
Atlantic City, NJ, (BAM), 5.00%, 3/1/24 | | | 300 | | | | 344,913 | |
| | | | |
| | 13 | | See Notes to Financial Statements. |
Eaton Vance
Municipal Opportunities Fund
July 31, 2019
Portfolio of Investments — continued
| | | | | | | | |
| Security | | Principal
Amount
(000’s omitted) | | | Value | |
|
| Insured – General Obligations (continued) | |
| | |
Bayonne, NJ, (AGM), 5.00%, 8/1/23 | | $ | 300 | | | $ | 342,093 | |
| | |
Bayonne, NJ, (AGM), 5.00%, 8/1/24 | | | 300 | | | | 351,168 | |
| | |
Bayonne, NJ, (AGM), 5.00%, 8/1/25 | | | 885 | | | | 1,059,141 | |
| | |
Bayonne, NJ, (AGM), 5.00%, 8/1/26 | | | 915 | | | | 1,089,152 | |
| | |
Bellaire Public School District, MI, (AGM), 4.00%, 5/1/23 | | | 675 | | | | 739,982 | |
| | |
Bellaire Public School District, MI, (AGM), 4.00%, 5/1/24 | | | 685 | | | | 767,447 | |
| | |
Bellaire Public School District, MI, (AGM), 4.00%, 5/1/25 | | | 685 | | | | 780,434 | |
| | |
Bolingbrook, IL, (AGM), 5.00%, 1/1/24 | | | 1,000 | | | | 1,141,010 | |
| | |
Bolingbrook, IL, (AGM), 5.00%, 1/1/25 | | | 1,000 | | | | 1,166,630 | |
| | |
Cambria County, PA, (BAM), 5.00%, 8/1/23 | | | 1,260 | | | | 1,426,282 | |
| | |
Chicago Board of Education, IL, (AGM), 5.00%, 12/1/25 | | | 1,000 | | | | 1,167,260 | |
| | |
Chicago Board of Education, IL, (NPFG), 0.00%, 12/1/20 | | | 2,175 | | | | 2,108,902 | |
| | |
Chicago Board of Education, IL, (NPFG), 0.00%, 12/1/22 | | | 4,300 | | | | 3,969,115 | |
| | |
Chicago Board of Education, IL, (NPFG), 0.00%, 12/1/28 | | | 1,500 | | | | 1,142,895 | |
| | |
Detroit, MI, (AMBAC), 4.00%, 4/1/20 | | | 43 | | | | 42,794 | |
| | |
Detroit, MI, (AMBAC), 5.00%, 4/1/21 | | | 13 | | | | 13,173 | |
| | |
Detroit, MI, (AMBAC), 5.00%, 4/1/22 | | | 66 | | | | 65,837 | |
| | |
Detroit, MI, (AMBAC), 5.00%, 4/1/24 | | | 329 | | | | 328,466 | |
| | |
Luzerne County, PA, (AGM), 5.00%, 11/15/24 | | | 2,480 | | | | 2,885,133 | |
| | |
McCook, IL, (AGM), 4.00%, 12/1/24 | | | 200 | | | | 221,262 | |
| | |
McCook, IL, (AGM), 4.00%, 12/1/25 | | | 275 | | | | 307,918 | |
| | |
McCook, IL, (AGM), 4.00%, 12/1/26 | | | 260 | | | | 294,200 | |
| | |
McCook, IL, (AGM), 4.00%, 12/1/27 | | | 300 | | | | 342,540 | |
| | |
McCook, IL, (AGM), 4.00%, 12/1/28 | | | 300 | | | | 344,625 | |
| | |
McHenry County Community Unit School District No. 12, IL, (AGM), 5.00%, 1/1/25 | | | 890 | | | | 1,003,475 | |
| | |
McHenry County Community Unit School District No. 12, IL, (AGM), 5.00%, 1/1/26 | | | 925 | | | | 1,037,277 | |
| | |
Monroe County Industrial Development Corp., NY, (Monroe Community College Association, Inc.), (AGM), 5.00%, 1/15/25 | | | 750 | | | | 864,323 | |
| | |
Proviso Township High School District No. 209, IL, (AGM), 5.00%, 12/1/28 | | | 1,000 | | | | 1,248,820 | |
| | |
Puerto Rico, (AGC), 5.00%, 7/1/34 | | | 310 | | | | 316,510 | |
| | |
Puerto Rico, (AGM), 5.00%, 7/1/35 | | | 1,055 | | | | 1,099,932 | |
| | |
Puerto Rico, (NPFG), 5.25%, 7/1/22 | | | 530 | | | | 534,993 | |
| | |
Puerto Rico Public Buildings Authority, (AMBAC), 5.45%, 7/1/30 | | | 930 | | | | 945,847 | |
| | |
Rockland County, NY, (AGM), 5.00%, 3/1/24 | | | 350 | | | | 409,661 | |
| | |
South Haven Public Schools, MI, (BAM), 4.00%, 5/1/27 | | | 785 | | | | 905,709 | |
| | |
Will and Cook Counties Community High School District No. 210, IL, (AGM), 0.00%, 1/1/28 | | | 500 | | | | 394,150 | |
| | | | | | | | | |
| |
| | | | $ | 32,152,615 | |
| | | | | | | | |
| Security | | Principal
Amount
(000’s omitted) | | | Value | |
|
| Insured – Housing — 0.1% | |
| | |
Maryland Economic Development Corp., (University of Maryland, College Park), (AGM), 4.00%, 6/1/21 | | $ | 400 | | | $ | 419,988 | |
| | |
New Hope Cultural Education Facilities Finance Corp., TX,(CHF-Collegiate Housing College Station I, LLC), (AGM), 4.00%, 4/1/22 | | | 445 | | | | 471,442 | |
| | |
New Hope Cultural Education Facilities Finance Corp., TX,(CHF-Collegiate Housing College Station I, LLC), (AGM), 4.00%, 4/1/24 | | | 400 | | | | 440,140 | |
| | | | | | | | | |
| |
| | | | $ | 1,331,570 | |
|
| Insured – Lease Revenue / Certificates of Participation — 0.4% | |
| | |
Georgia Local Government 1998A Grantor Trust, Certificates of Participation, (NPFG), 4.75%, 6/1/28 | | $ | 800 | | | $ | 906,608 | |
| | |
Kentucky Asset/Liability Commission, (NPFG), 2.248%, (67% of 3 mo. USD LIBOR + 0.52%), 11/1/21(1) | | | 5,000 | | | | 4,983,500 | |
| | | | | | | | | |
| |
| | | | $ | 5,890,108 | |
|
| Insured – Other Revenue — 0.1% | |
| | |
Albany Parking Authority, NY, (AGM), 5.00%, 7/15/24 | | $ | 300 | | | $ | 349,341 | |
| | |
Albany Parking Authority, NY, (AGM), 5.00%, 7/15/25 | | | 315 | | | | 373,451 | |
| | |
Puerto Rico Public Buildings Authority, (AGC), 5.00%, 7/1/36 | | | 120 | | | | 122,327 | |
| | | | | | | | | |
| |
| | | | $ | 845,119 | |
|
| Insured – Special Tax Revenue — 0.6% | |
| | |
Illinois Sports Facilities Authority, (AGM), 5.00%, 6/15/27 | | $ | 2,325 | | | $ | 2,618,671 | |
| | |
Illinois Sports Facilities Authority, (AMBAC), 0.00%, 6/15/22 | | | 500 | | | | 464,390 | |
| | |
Puerto Rico Convention Center District Authority, (AMBAC), 5.00%, 7/1/31 | | | 3,325 | | | | 3,357,585 | |
| | |
Puerto Rico Infrastructure Financing Authority, (AMBAC), 0.00%, 7/1/43 | | | 955 | | | | 263,943 | |
| | |
Puerto Rico Infrastructure Financing Authority, (AMBAC), 5.50%, 7/1/24 | | | 305 | | | | 329,781 | |
| | |
Puerto Rico Infrastructure Financing Authority, (AMBAC), 5.50%, 7/1/26 | | | 1,120 | | | | 1,228,282 | |
| | | | | | | | | |
| |
| | | | $ | 8,262,652 | |
|
| Insured – Transportation — 2.4% | |
| | |
Cleveland, OH, Airport System Revenue, (AGM), 5.00%, 1/1/25 | | $ | 1,225 | | | $ | 1,451,380 | |
| | |
Metropolitan Transportation Authority, NY, (AGM), 2.338%, (69% of 1 mo. USD LIBOR + 0.68%), 4/6/21 (Put Date), 11/1/32(1) | | | 5,000 | | | | 5,028,500 | |
| | |
New Jersey Economic Development Authority, (The Goethals Bridge Replacement), (AGM), (AMT), 5.00%, 1/1/31 | | | 185 | | | | 206,819 | |
| | | | |
| | 14 | | See Notes to Financial Statements. |
Eaton Vance
Municipal Opportunities Fund
July 31, 2019
Portfolio of Investments — continued
| | | | | | | | |
| Security | | Principal
Amount
(000’s omitted) | | | Value | |
|
| Insured – Transportation (continued) | |
| | |
New Jersey Transportation Trust Fund Authority, (Transportation System), (AMBAC), 0.00%, 12/15/24 | | $ | 3,460 | | | $ | 3,111,613 | |
| | |
New Jersey Transportation Trust Fund Authority, (Transportation System), (AMBAC), 0.00%, 12/15/28 | | | 1,185 | | | | 926,931 | |
| | |
New York Transportation Development Corp., (LaGuardia Airport Terminal B Redevelopment), (AGM), (AMT), 4.00%, 7/1/32 | | | 2,000 | | | | 2,150,800 | |
| | |
Ohio, (Portsmouth Gateway Group, LLC), (AGM), (AMT), 5.00%, 12/31/26 | | | 1,000 | | | | 1,169,280 | |
| | |
Puerto Rico Highway and Transportation Authority, (AGC), 5.25%, 7/1/36 | | | 795 | | | | 879,262 | |
| | |
Puerto Rico Highway and Transportation Authority, (AGM), 5.00%, 7/1/32 | | | 1,675 | | | | 1,712,888 | |
| | |
Puerto Rico Highway and Transportation Authority, (AGM), 5.25%, 7/1/36 | | | 535 | | | | 591,764 | |
| | |
Puerto Rico Highway and Transportation Authority, (AGM), 5.50%, 7/1/31 | | | 100 | | | | 113,237 | |
| | |
Puerto Rico Highway and Transportation Authority, (AMBAC), 5.25%, 7/1/30 | | | 3,650 | | | | 3,975,069 | |
| | |
Puerto Rico Highway and Transportation Authority, (AMBAC), 5.25%, 7/1/31 | | | 2,710 | | | | 2,952,084 | |
| | |
Puerto Rico Highway and Transportation Authority, (AMBAC), 5.25%, 7/1/38 | | | 2,475 | | | | 2,663,669 | |
| | |
Puerto Rico Highway and Transportation Authority, (AMBAC), 5.50%, 7/1/29 | | | 1,320 | | | | 1,463,471 | |
| | |
Puerto Rico Highway and Transportation Authority, (NPFG), 5.25%, 7/1/23 | | | 380 | | | | 398,863 | |
| | |
Puerto Rico Highway and Transportation Authority, (NPFG), 5.25%, 7/1/32 | | | 100 | | | | 106,315 | |
| | |
Puerto Rico Highway and Transportation Authority, (NPFG), 5.25%, 7/1/33 | | | 200 | | | | 212,250 | |
| | |
Puerto Rico Highway and Transportation Authority, (NPFG), 5.25%, 7/1/35 | | | 2,320 | | | | 2,441,777 | |
| | | | | | | | | |
| |
| | | | $ | 31,555,972 | |
|
| Insured – Water and Sewer — 0.4% | |
| | |
Detroit, MI, Sewage Disposal System, (AGM), 5.00%, 7/1/39 | | $ | 175 | | | $ | 189,646 | |
| | |
Michigan Finance Authority, (Detroit Water and Sewerage Department), (AGM), 5.00%, 7/1/26 | | | 4,000 | | | | 4,686,320 | |
| | |
Puerto Rico Aqueduct and Sewer Authority, (AGC), 5.00%, 7/1/28 | | | 100 | | | | 102,732 | |
| | | | | | | | | |
| |
| | | | $ | 4,978,698 | |
|
| Lease Revenue / Certificates of Participation — 1.5% | |
| | |
Commonwealth Financing Authority, PA, Tobacco Master Settlement Payment Revenue, 5.00%, 6/1/28 | | $ | 3,000 | | | $ | 3,744,660 | |
| | |
Commonwealth Financing Authority, PA, Tobacco Master Settlement Payment Revenue, 5.00%, 6/1/29 | | | 2,000 | | | | 2,482,200 | |
| | | | | | | | |
| Security | | Principal
Amount
(000’s omitted) | | | Value | |
|
| Lease Revenue / Certificates of Participation (continued) | |
| | |
Commonwealth Financing Authority, PA, Tobacco Master Settlement Payment Revenue, 5.00%, 6/1/30 | | $ | 3,000 | | | $ | 3,698,400 | |
| | |
Michigan Strategic Fund, (Facility for Rare Isotope Beams), 5.00%, 3/1/27 | | | 1,000 | | | | 1,160,270 | |
| | |
New Jersey Economic Development Authority, (School Facilities Construction), 3.00%, (SIFMA + 1.60%), 3/1/28(1) | | | 7,575 | | | | 7,634,918 | |
| | |
Sunset Hills, MO, Certificates of Participation, 4.00%, 4/1/26 | | | 500 | | | | 554,285 | |
| | |
Sunset Hills, MO, Certificates of Participation, 4.00%, 4/1/27 | | | 500 | | | | 551,785 | |
| | | | | | | | | |
| |
| | | | $ | 19,826,518 | |
|
| Other Revenue — 6.9% | |
| | |
Allentown Neighborhood Improvement Zone Development Authority, PA, (City Center Project), Series 2017, 5.00%, 5/1/42(2) | | $ | 7,000 | | | $ | 7,711,760 | |
| | |
Allentown Neighborhood Improvement Zone Development Authority, PA, (City Center Project), Series 2018, 5.00%, 5/1/42(2) | | | 4,500 | | | | 4,990,275 | |
| | |
Brooklyn Arena Local Development Corp., NY, (Barclays Center), 5.00%, 7/15/25 | | | 4,950 | | | | 5,847,039 | |
| | |
California Infrastructure and Economic Development Bank, (Academy of Motion Picture Arts and Sciences Obligated Group), 5.00%, 11/1/26 | | | 1,000 | | | | 1,163,760 | |
| | |
California Infrastructure and Economic Development Bank, (Academy of Motion Picture Arts and Sciences Obligated Group), 5.00%, 11/1/27 | | | 1,010 | | | | 1,173,115 | |
| | |
Cleveland-Cuyahoga County Port Authority, OH, (Playhouse Square Foundation), 5.00%, 12/1/28 | | | 1,450 | | | | 1,615,952 | |
| | |
District of Columbia, (Association of American Medical Colleges), 5.00%, 10/1/30 | | | 570 | | | | 639,797 | |
| | |
Kalispel Tribe of Indians, WA, Series A, 5.00%, 1/1/32(2) | | | 1,465 | | | | 1,634,090 | |
| | |
Kalispel Tribe of Indians, WA, Series B, 5.00%, 1/1/32(2) | | | 1,000 | | | | 1,115,420 | |
| | |
Kansas City Land Clearance for Redevelopment Authority, MO, (Convention Center Hotel), 5.00%, 2/1/40(2) | | | 4,550 | | | | 4,957,134 | |
| | |
Main Street Natural Gas, Inc., GA, 2.36%, (67% of 1 mo. USD LIBOR + 0.75%), 9/1/23 (Put Date), 4/1/48(1) | | | 5,500 | | | | 5,492,795 | |
| | |
Metropolitan Transportation Authority, NY, Dedicated Tax Fund Revenue, 1.85%, (SIFMA + 0.45%), 6/1/22 (Put Date), 11/1/26(1) | | | 9,705 | | | | 9,690,831 | |
| | |
Morongo Band of Mission Indians, CA, 5.00%, 10/1/42(2) | | | 1,775 | | | | 1,995,437 | |
| | |
New Jersey Economic Development Authority, (The Seeing Eye, Inc.), 5.00%, 3/1/25 | | | 3,500 | | | | 4,157,265 | |
| | |
Patriots Energy Group Financing Agency, SC, Gas Supply Revenue, (Liq: Royal Bank of Canada), 2.47%, (67% of 1 mo. USD LIBOR + 0.86%), 2/1/24 (Put Date), 10/1/48(1) | | | 7,500 | | | | 7,483,650 | |
| | |
Salt Verde Financial Corp., AZ, Senior Gas Revenue, 5.25%, 12/1/27 | | | 5,200 | | | | 6,453,408 | |
| | | | |
| | 15 | | See Notes to Financial Statements. |
Eaton Vance
Municipal Opportunities Fund
July 31, 2019
Portfolio of Investments — continued
| | | | | | | | |
| Security | | Principal
Amount
(000’s omitted) | | | Value | |
|
| Other Revenue (continued) | |
| | |
Southeast Alabama Gas Supply District, (Project No. 2), 2.46%, (67% of 1 mo. USD LIBOR + 0.85%), 6/1/24 (Put Date),
6/1/49(1) | | $ | 3,000 | | | $ | 2,969,160 | |
| | |
Texas Municipal Gas Acquisition and Supply Corp. I, Gas Supply Revenue, 2.315%, (67% of 3 mo. USD LIBOR + 0.70%), 12/15/26(1) | | | 5,525 | | | | 5,526,050 | |
| | |
Texas Municipal Gas Acquisition and Supply Corp. III, Gas Supply Revenue, 5.00%, 12/15/30 | | | 100 | | | | 109,468 | |
| | |
Washington Health Care Facilities Authority, (Fred Hutchinson Cancer Research Center), 2.45%, (SIFMA + 1.05%), 7/3/23 (Put Date), 1/1/42(1) | | | 11,000 | | | | 11,162,800 | |
| | |
Washington Health Care Facilities Authority, (Fred Hutchinson Cancer Research Center), 2.618%, (67% of 1 mo. USD LIBOR + 1.10%), 7/1/22 (Put Date),
1/1/42(1) | | | 1,000 | | | | 1,012,190 | |
| | |
Will and Kankakee Counties Community Unit School District No.255-U, IL, 5.00%, 6/1/26 | | | 635 | | | | 728,790 | |
| | |
Will and Kankakee Counties Community Unit School District No.255-U, IL, 5.00%, 6/1/28 | | | 1,370 | | | | 1,558,772 | |
| | |
Will and Kankakee Counties Community Unit School District No.255-U, IL, 5.00%, 6/1/29 | | | 700 | | | | 793,695 | |
| | | | | | | | | |
| |
| | | | $ | 89,982,653 | |
|
| Senior Living / Life Care — 7.2% | |
| | |
Alexandria Industrial Development Authority, VA, (Goodwin House, Inc.), 5.00%, 10/1/21 | | $ | 500 | | | $ | 534,010 | |
| | |
Alexandria Industrial Development Authority, VA, (Goodwin House, Inc.), 5.00%, 10/1/22 | | | 605 | | | | 663,758 | |
| | |
Alexandria Industrial Development Authority, VA, (Goodwin House, Inc.), 5.00%, 10/1/23 | | | 350 | | | | 393,607 | |
| | |
Alexandria Industrial Development Authority, VA, (Goodwin House, Inc.), 5.00%, 10/1/24 | | | 310 | | | | 356,038 | |
| | |
Alexandria Industrial Development Authority, VA, (Goodwin House, Inc.), 5.00%, 10/1/25 | | | 445 | | | | 521,064 | |
| | |
Berks County Industrial Development Authority, PA, (Highlands at Wyomissing), 5.00%, 5/15/33 | | | 500 | | | | 567,635 | |
| | |
Buffalo and Erie County Industrial Land Development Corp., NY, (Orchard Park CCRC, Inc.), 5.00%, 11/15/26 | | | 1,730 | | | | 1,955,367 | |
| | |
Buffalo and Erie County Industrial Land Development Corp., NY, (Orchard Park CCRC, Inc.), 5.00%, 11/15/27 | | | 1,320 | | | | 1,483,033 | |
| | |
Centerville, OH, (Graceworks Lutheran Services), 5.00%, 11/1/23 | | | 450 | | | | 485,433 | |
| | |
Centerville, OH, (Graceworks Lutheran Services), 5.00%, 11/1/24 | | | 705 | | | | 770,445 | |
| | |
Centerville, OH, (Graceworks Lutheran Services), 5.00%, 11/1/26 | | | 770 | | | | 861,091 | |
| | |
Centerville, OH, (Graceworks Lutheran Services), 5.00%, 11/1/27 | | | 425 | | | | 480,378 | |
| | | | | | | | |
| Security | | Principal
Amount
(000’s omitted) | | | Value | |
|
| Senior Living / Life Care (continued) | |
| | |
Clackamas County Hospital Facility Authority, OR, (Mary’s Woods at Marylhurst), 2.80%, 5/15/24 | | $ | 1,150 | | | $ | 1,150,701 | |
| | |
Colorado Health Facilities Authority, (Frasier Meadows Retirement Community), 3.125%, 5/15/27 | | | 650 | | | | 652,418 | |
| | |
Colorado Health Facilities Authority, (Frasier Meadows Retirement Community), 5.00%, 5/15/24 | | | 525 | | | | 588,877 | |
| | |
Colorado Health Facilities Authority, (Frasier Meadows Retirement Community), 5.00%, 5/15/25 | | | 300 | | | | 341,718 | |
| | |
Colorado Health Facilities Authority, (Frasier Meadows Retirement Community), 5.00%, 5/15/26 | | | 350 | | | | 403,820 | |
| | |
Colorado Health Facilities Authority, (Frasier Meadows Retirement Community), 5.00%, 5/15/27 | | | 400 | | | | 467,564 | |
| | |
District of Columbia, (Ingleside at Rock Creek), 4.125%, 7/1/27 | | | 1,000 | | | | 1,046,040 | |
| | |
Glendale Industrial Development Authority, AZ, (Terraces of Phoenix), 4.00%, 7/1/28 | | | 225 | | | | 232,632 | |
| | |
Hanover County Economic Development Authority, VA, (Covenant Woods), 5.00%, 7/1/38 | | | 125 | | | | 136,199 | |
| | |
Hanover County Economic Development Authority, VA, (Covenant Woods), 5.00%, 7/1/48 | | | 465 | | | | 502,251 | |
| | |
Hanover County Economic Development Authority, VA, (Covenant Woods), 5.00%, 7/1/51 | | | 1,000 | | | | 1,078,700 | |
| | |
Howard County, MD, (Vantage House), 5.00%, 4/1/21 | | | 329 | | | | 338,531 | |
| | |
Howard County, MD, (Vantage House), 5.00%, 4/1/26 | | | 1,570 | | | | 1,701,095 | |
| | |
Howard County, MD, (Vantage House), 5.00%, 4/1/36 | | | 1,715 | | | | 1,864,891 | |
| | |
Illinois Finance Authority, (Lifespace Communities, Inc.), 5.00%, 5/15/27 | | | 370 | | | | 418,884 | |
| | |
Illinois Finance Authority, (Plymouth Place, Inc.), 5.00%, 5/15/25 | | | 1,605 | | | | 1,767,105 | |
| | |
Lancaster County Hospital Authority, PA, (Brethren Village), 5.00%, 7/1/23 | | | 700 | | | | 754,271 | |
| | |
Lancaster County Hospital Authority, PA, (Brethren Village), 5.00%, 7/1/24 | | | 915 | | | | 994,083 | |
| | |
Lancaster County Hospital Authority, PA, (Brethren Village), 5.00%, 7/1/25 | | | 650 | | | | 714,038 | |
| | |
Lee County Industrial Development Authority, FL, (Shell Point), 5.50%, 11/15/21 | | | 95 | | | | 100,292 | |
| | |
Massachusetts Development Finance Agency, (Linden Ponds, Inc.), 5.00%, 11/15/28(2) | | | 1,200 | | | | 1,354,488 | |
| | |
Missouri Health and Educational Facilities Authority, (Lutheran Senior Services), 2.875% to 2/1/22 (Put Date), 2/1/34 | | | 1,000 | | | | 1,006,450 | |
| | |
Missouri Health and Educational Facilities Authority, (Lutheran Senior Services), 5.00%, 2/1/46 | | | 1,440 | | | | 1,590,984 | |
| | |
Montgomery County Industrial Development Authority, PA, (Waverly Heights, Ltd.), 4.00%, 12/1/30 | | | 200 | | | | 223,568 | |
| | |
Montgomery County Industrial Development Authority, PA, (Waverly Heights, Ltd.), 4.00%, 12/1/31 | | | 150 | | | | 166,979 | |
| | | | |
| | 16 | | See Notes to Financial Statements. |
Eaton Vance
Municipal Opportunities Fund
July 31, 2019
Portfolio of Investments — continued
| | | | | | | | |
| Security | | Principal
Amount
(000’s omitted) | | | Value | |
|
| Senior Living / Life Care (continued) | |
| | |
Montgomery County Industrial Development Authority, PA, (Waverly Heights, Ltd.), 4.00%, 12/1/32 | | $ | 200 | | | $ | 221,536 | |
| | |
Montgomery County Industrial Development Authority, PA, (Waverly Heights, Ltd.), 4.00%, 12/1/33 | | | 100 | | | | 110,410 | |
| | |
Montgomery County Industrial Development Authority, PA, (Waverly Heights, Ltd.), 4.00%, 12/1/34 | | | 200 | | | | 219,658 | |
| | |
Montgomery County Industrial Development Authority, PA, (Waverly Heights, Ltd.), 4.00%, 12/1/35 | | | 350 | | | | 382,501 | |
| | |
Montgomery County Industrial Development Authority, PA, (Waverly Heights, Ltd.), 4.00%, 12/1/36 | | | 350 | | | | 381,486 | |
| | |
Montgomery County Industrial Development Authority, PA, (Waverly Heights, Ltd.), 4.00%, 12/1/37 | | | 300 | | | | 326,124 | |
| | |
Montgomery County Industrial Development Authority, PA, (Waverly Heights, Ltd.), 4.00%, 12/1/38 | | | 300 | | | | 325,374 | |
| | |
Montgomery County Industrial Development Authority, PA, (Whitemarsh Continuing Care Retirement Community), 4.00%, 1/1/23 | | | 2,000 | | | | 2,044,380 | |
| | |
Montgomery County Industrial Development Authority, PA, (Whitemarsh Continuing Care Retirement Community), 5.00%, 1/1/33 | | | 1,890 | | | | 2,008,919 | |
| | |
Multnomah County Hospital Facilities Authority, OR, (Mirabella at South Waterfront), 5.00%, 10/1/19 | | | 145 | | | | 145,697 | |
| | |
New Hope Cultural Education Facilities Finance Corp., TX, (Longhorn Village), 5.00%, 1/1/25 | | | 1,000 | | | | 1,107,130 | |
| | |
New Hope Cultural Education Facilities Finance Corp., TX, (Longhorn Village), 5.00%, 1/1/26 | | | 1,040 | | | | 1,157,790 | |
| | |
New Hope Cultural Education Facilities Finance Corp., TX, (Longhorn Village), 5.00%, 1/1/27 | | | 1,095 | | | | 1,217,563 | |
| | |
New Hope Cultural Education Facilities Finance Corp., TX, (Longhorn Village), 5.00%, 1/1/29 | | | 1,205 | | | | 1,332,947 | |
| | |
New Hope Cultural Education Facilities Finance Corp., TX, (Longhorn Village), 5.00%, 1/1/30 | | | 630 | | | | 693,573 | |
| | |
New Mexico Hospital Equipment Loan Council, (Haverland Carter Lifestyle Group), 5.00%, 7/1/30 | | | 430 | | | | 498,374 | |
| | |
New Mexico Hospital Equipment Loan Council, (Haverland Carter Lifestyle Group), 5.00%, 7/1/31 | | | 670 | | | | 774,406 | |
| | |
New Mexico Hospital Equipment Loan Council, (Haverland Carter Lifestyle Group), 5.00%, 7/1/32 | | | 295 | | | | 340,088 | |
| | |
New Mexico Hospital Equipment Loan Council, (Haverland Carter Lifestyle Group), 5.00%, 7/1/33 | | | 185 | | | | 212,722 | |
| | |
New Mexico Hospital Equipment Loan Council, (Haverland Carter Lifestyle Group), 5.00%, 7/1/34 | | | 195 | | | | 223,493 | |
| | |
New Mexico Hospital Equipment Loan Council, (Haverland Carter Lifestyle Group), 5.00%, 7/1/39 | | | 625 | | | | 709,444 | |
| | |
New Mexico Hospital Equipment Loan Council, (Haverland Carter Lifestyle Group), 5.00%, 7/1/49 | | | 4,500 | | | | 5,041,980 | |
| | |
Norfolk Redevelopment and Housing Authority, VA, (Fort Norfolk Retirement Community, Inc. - Harbor’s Edge), 4.00%, 1/1/29 | | | 1,335 | | | | 1,412,029 | |
| | | | | | | | |
| Security | | Principal
Amount
(000’s omitted) | | | Value | |
|
| Senior Living / Life Care (continued) | |
| | |
Palm Beach County Health Facilities Authority, FL, (Lifespace Communities, Inc.), 5.00%, 5/15/28 | | $ | 255 | | | $ | 287,717 | |
| | |
Palm Beach County Health Facilities Authority, FL, (Lifespace Communities, Inc.), 5.00%, 5/15/30 | | | 1,300 | | | | 1,452,932 | |
| | |
Palm Beach County Health Facilities Authority, FL, (Lifespace Communities, Inc.), 5.00%, 5/15/31 | | | 775 | | | | 891,692 | |
| | |
Palm Beach County Health Facilities Authority, FL, (Lifespace Communities, Inc.), 5.00%, 5/15/32 | | | 650 | | | | 743,087 | |
| | |
Polk County Industrial Development Authority, FL, (Carpenter’s Home Estates, Inc.), 5.00%, 1/1/39 | | | 400 | | | | 448,616 | |
| | |
Rockville, MD, (Ingleside at King Farm), 3.00%, 11/1/25 | | | 1,750 | | | | 1,756,912 | |
| | |
Rockville, MD, (Ingleside at King Farm), 3.50%, 11/1/26 | | | 1,325 | | | | 1,332,062 | |
| | |
Salem Hospital Facility Authority, OR, (Capital Manor), 5.00%, 5/15/27 | | | 250 | | | | 301,905 | |
| | |
Salem Hospital Facility Authority, OR, (Capital Manor), 5.00%, 5/15/28 | | | 270 | | | | 324,594 | |
| | |
South Carolina Jobs-Economic Development Authority, (South Carolina Episcopal Home at Still Hopes), 5.00%, 4/1/28 | | | 1,675 | | | | 1,864,241 | |
| | |
South Carolina Jobs-Economic Development Authority, (South Carolina Episcopal Home at Still Hopes), 5.00%, 4/1/29 | | | 1,000 | | | | 1,109,720 | |
| | |
South Carolina Jobs-Economic Development Authority, (South Carolina Episcopal Home at Still Hopes), 5.00%, 4/1/38 | | | 2,000 | | | | 2,177,440 | |
| | |
St. Louis County Industrial Development Authority, MO, (Friendship Village St. Louis Obligated Group), 5.00%, 9/1/27 | | | 1,930 | | | | 2,231,273 | |
| | |
St. Louis County Industrial Development Authority, MO, (St. Andrew’s Resources for Seniors Obligated Group), 5.00%, 12/1/25 | | | 1,305 | | | | 1,393,270 | |
| | |
Tarrant County Cultural Education Facilities Finance Corp., TX, (Buckner Senior Living - Ventana), 3.875%, 11/15/22 | | | 2,500 | | | | 2,501,325 | |
| | |
Tempe Industrial Development Authority, AZ, (Mirabella at ASU), 5.35%, 10/1/25(2) | | | 3,000 | | | | 3,136,890 | |
| | |
Tulsa County Industrial Authority, OK, (Montereau, Inc.), 5.00%, 11/15/28 | | | 540 | | | | 625,239 | |
| | |
Tulsa County Industrial Authority, OK, (Montereau, Inc.), 5.00%, 11/15/29 | | | 400 | | | | 461,368 | |
| | |
Vermont Economic Development Authority, (Wake Robin Corp.), 5.00%, 5/1/23 | | | 1,690 | | | | 1,813,218 | |
| | |
Vermont Economic Development Authority, (Wake Robin Corp.), 5.00%, 5/1/25 | | | 745 | | | | 817,727 | |
| | |
Vermont Economic Development Authority, (Wake Robin Corp.), 5.00%, 5/1/26 | | | 585 | | | | 647,297 | |
| | |
Vermont Economic Development Authority, (Wake Robin Corp.), 5.00%, 5/1/27 | | | 500 | | | | 556,580 | |
| | |
Washington Housing Finance Commission, (Bayview Manor Homes), 4.00%, 7/1/26(2) | | | 1,275 | | | | 1,329,251 | |
| | | | |
| | 17 | | See Notes to Financial Statements. |
Eaton Vance
Municipal Opportunities Fund
July 31, 2019
Portfolio of Investments — continued
| | | | | | | | |
| Security | | Principal
Amount
(000’s omitted) | | | Value | |
|
| Senior Living / Life Care (continued) | |
| | |
Washington Housing Finance Commission, (Bayview Manor Homes), 5.00%, 7/1/31(2) | | $ | 750 | | | $ | 820,867 | |
| | |
Washington Housing Finance Commission, (Judson Park), 4.00%, 7/1/28(2) | | | 250 | | | | 263,558 | |
| | |
Wayzata, MN, (Folkestone Senior Living Community), 3.25%, 8/1/29(4) | | | 500 | | | | 504,685 | |
| | |
Wayzata, MN, (Folkestone Senior Living Community), 3.375%, 8/1/30(4) | | | 425 | | | | 429,365 | |
| | |
Wayzata, MN, (Folkestone Senior Living Community), 3.75%, 8/1/36(4) | | | 250 | | | | 252,765 | |
| | |
Wayzata, MN, (Folkestone Senior Living Community), 3.75%, 8/1/37(4) | | | 500 | | | | 504,295 | |
| | |
Wayzata, MN, (Folkestone Senior Living Community), 4.00%, 8/1/38(4) | | | 175 | | | | 178,752 | |
| | |
Wayzata, MN, (Folkestone Senior Living Community), 4.00%, 8/1/39(4) | | | 125 | | | | 127,370 | |
| | |
Wayzata, MN, (Folkestone Senior Living Community), 5.00%, 8/1/31(4) | | | 350 | | | | 389,680 | |
| | |
Wayzata, MN, (Folkestone Senior Living Community), 5.00%, 8/1/32(4) | | | 250 | | | | 277,600 | |
| | |
Wayzata, MN, (Folkestone Senior Living Community), 5.00%, 8/1/33(4) | | | 350 | | | | 387,776 | |
| | |
Wayzata, MN, (Folkestone Senior Living Community), 5.00%, 8/1/34(4) | | | 100 | | | | 110,547 | |
| | |
Wayzata, MN, (Folkestone Senior Living Community), 5.00%, 8/1/35(4) | | | 100 | | | | 110,301 | |
| | |
Westchester County Local Development Corp., NY, (Kendal on Hudson), 4.00%, 1/1/23 | | | 3,545 | | | | 3,780,175 | |
| | |
Westchester County Local Development Corp., NY, (Kendal on Hudson), 5.00%, 1/1/28 | | | 2,850 | | | | 3,076,147 | |
| | |
Wisconsin Health and Educational Facilities Authority, (Saint John’s Communities, Inc.), 4.00%, 9/15/25 | | | 500 | | | | 525,765 | |
| | |
Wisconsin Health and Educational Facilities Authority, (Saint John’s Communities, Inc.), 4.00%, 9/15/26 | | | 685 | | | | 717,846 | |
| | |
Wisconsin Health and Educational Facilities Authority, (Saint John’s Communities, Inc.), 4.00%, 9/15/27 | | | 1,015 | | | | 1,059,640 | |
| | |
Wisconsin Health and Educational Facilities Authority, (Saint John’s Communities, Inc.), 5.00%, 9/15/29 | | | 1,365 | | | | 1,470,009 | |
| | |
Wisconsin Health and Educational Facilities Authority, (Saint John’s Communities, Inc.), 5.00%, 9/15/30 | | | 500 | | | | 537,060 | |
| | | | | | | | | |
| |
| | | | $ | 93,284,621 | |
|
| Special Tax Revenue — 3.7% | |
| | |
Atlanta, GA, (Atlantic Station), Tax Allocation Increments, 5.00%, 12/1/24 | | $ | 1,000 | | | $ | 1,173,410 | |
| | |
Atlanta Development Authority, GA, (New Downtown Atlanta Stadium), 5.00%, 7/1/24 | | | 1,500 | | | | 1,765,155 | |
| | |
Detroit Downtown Development Authority, MI, 0.00%, 7/1/20 | | | 50 | | | | 48,244 | |
| | | | | | | | |
| Security | | Principal
Amount
(000’s omitted) | | | Value | |
|
| Special Tax Revenue (continued) | |
| | |
Detroit Downtown Development Authority, MI, 0.00%, 7/1/21 | | $ | 75 | | | $ | 69,382 | |
| | |
Illinois, Sales Tax Revenue, 4.00%, 6/15/27 | | | 1,065 | | | | 1,148,485 | |
| | |
Illinois, Sales Tax Revenue, 4.00%, 6/15/28 | | | 2,170 | | | | 2,323,679 | |
| | |
Illinois, Sales Tax Revenue, 4.00%, 6/15/29 | | | 8,280 | | | | 8,813,812 | |
| | |
Jurupa Public Financing Authority, CA, 5.00%, 9/1/25 | | | 735 | | | | 877,641 | |
| | |
Marquette Brownfield Redevelopment Authority, MI, 5.00%, 5/1/31 | | | 1,655 | | | | 1,969,467 | |
| | |
Michigan Finance Authority, Detroit Financial Recovery Income Tax Revenue, 4.50%, 10/1/29 | | | 2,145 | | | | 2,329,234 | |
| | |
New York City Transitional Finance Authority, NY, Future Tax Revenue, (SPA: JPMorgan Chase Bank, N.A.), 1.48%, 8/1/42(3) | | | 15,000 | | | | 15,000,000 | |
| | |
New York City Transitional Finance Authority, NY, Future Tax Revenue, (SPA: U.S. Bank, N.A.), 1.49%, 8/1/42(3) | | | 1,825 | | | | 1,825,000 | |
| | |
New York Dormitory Authority, Personal Income Tax Revenue, 5.00%, 2/15/27 | | | 4,000 | | | | 4,973,000 | |
| | |
South Village Community Development District, FL, 2.00%, 5/1/20 | | | 305 | | | | 306,196 | |
| | |
South Village Community Development District, FL, 2.00%, 5/1/21 | | | 100 | | | | 100,934 | |
| | |
South Village Community Development District, FL, 2.125%, 5/1/22 | | | 100 | | | | 101,487 | |
| | |
South Village Community Development District, FL, 2.375%, 5/1/23 | | | 100 | | | | 102,418 | |
| | |
South Village Community Development District, FL, 2.50%, 5/1/24 | | | 100 | | | | 103,068 | |
| | |
South Village Community Development District, FL, 2.75%, 5/1/25 | | | 100 | | | | 104,365 | |
| | |
South Village Community Development District, FL, 3.25%, 5/1/27 | | | 100 | | | | 106,694 | |
| | |
South Village Community Development District, FL, 4.35%, 5/1/26 | | | 470 | | | | 479,832 | |
| | |
Winter Garden Village at Fowler Groves Community Development District, FL, 3.75%, 5/1/31 | | | 4,000 | | | | 4,045,080 | |
| | | | | | | | | |
| |
| | | | $ | 47,766,583 | |
|
| Student Loan — 1.0% | |
| | |
Connecticut Higher Education Supplemental Loan Authority, (AMT), 5.00%, 11/15/24 | | $ | 600 | | | $ | 690,162 | |
| | |
Massachusetts Educational Financing Authority, (AMT), 5.00%, 7/1/22 | | | 1,000 | | | | 1,104,180 | |
| | |
Massachusetts Educational Financing Authority, (AMT), 5.00%, 1/1/23 | | | 500 | | | | 558,905 | |
| | |
New Jersey Higher Education Student Assistance Authority, (AMT), 3.35%, 12/1/29 | | | 10,000 | | | | 10,442,000 | |
| | | | | | | | | |
| |
| | | | $ | 12,795,247 | |
| | | | |
| | 18 | | See Notes to Financial Statements. |
Eaton Vance
Municipal Opportunities Fund
July 31, 2019
Portfolio of Investments — continued
| | | | | | | | |
| Security | | Principal
Amount
(000’s omitted) | | | Value | |
|
| Transportation — 13.2% | |
| | |
Austin, TX, Airport System Revenue, (AMT), 5.00%, 11/15/32(4) | | $ | 1,690 | | | $ | 2,120,122 | |
| | |
Austin, TX, Airport System Revenue, (AMT), 5.00%, 11/15/33(4) | | | 1,720 | | | | 2,149,364 | |
| | |
California Municipal Finance Authority, (LINXS Automated People Mover), (AMT), 5.00%, 12/31/34 | | | 1,700 | | | | 2,040,680 | |
| | |
California Municipal Finance Authority, (LINXS Automated People Mover), (AMT), 5.00%, 12/31/35 | | | 3,300 | | | | 3,947,361 | |
| | |
California Municipal Finance Authority, (LINXS Automated People Mover), (AMT), 5.00%, 12/31/36 | | | 3,910 | | | | 4,660,603 | |
| | |
California Municipal Finance Authority, (LINXS Automated People Mover), (AMT), 5.00%, 12/31/37 | | | 1,715 | | | | 2,037,317 | |
| | |
Central Texas Regional Mobility Authority, 5.00%, 1/1/25 | | | 350 | | | | 409,703 | |
| | |
Central Texas Regional Mobility Authority, 5.00%, 1/1/26 | | | 500 | | | | 591,670 | |
| | |
Central Texas Regional Mobility Authority, 5.00%, 1/1/27 | | | 550 | | | | 647,856 | |
| | |
Central Texas Regional Mobility Authority, 5.00%, 1/1/28 | | | 750 | | | | 880,508 | |
| | |
Central Texas Regional Mobility Authority, 5.00%, 1/1/29 | | | 600 | | | | 703,122 | |
| | |
Chicago, IL, (Midway International Airport), (AMT), 5.00%, 1/1/25 | | | 7,255 | | | | 8,508,954 | |
| | |
Chicago, IL, (Midway International Airport), (AMT), 5.00%, 1/1/27 | | | 1,000 | | | | 1,141,470 | |
| | |
Chicago, IL, (O’Hare International Airport), (AMT), 5.00%, 1/1/21 | | | 3,000 | | | | 3,153,660 | |
| | |
Chicago, IL, (O’Hare International Airport), (AMT), 5.00%, 1/1/27 | | | 5,000 | | | | 5,812,400 | |
| | |
Colorado Bridge Enterprise, (Central 70 Project), (AMT), 4.00%, 12/31/26 | | | 3,950 | | | | 4,484,948 | |
| | |
Colorado Bridge Enterprise, (Central 70 Project), (AMT), 4.00%, 6/30/27 | | | 4,475 | | | | 5,105,885 | |
| | |
Colorado Bridge Enterprise, (Central 70 Project), (AMT), 4.00%, 12/31/27 | | | 2,425 | | | | 2,781,208 | |
| | |
Dallas and Fort Worth, TX, (Dallas/Fort Worth International Airport), 5.00%, 11/1/24 | | | 500 | | | | 581,425 | |
| | |
Denver City and County, CO, Airport System Revenue, 2.542%, (70% of 1 mo. USD LIBOR + 0.86%), 11/15/19 (Put Date), 11/15/31(1) | | | 2,040 | | | | 2,041,000 | |
| | |
Denver City and County, CO, Airport System Revenue, (AMT), 5.00%, 11/15/30 | | | 6,955 | | | | 8,494,281 | |
| | |
E-470 Public Highway Authority, CO, 2.568%, (67% of 1 mo. USD LIBOR + 1.05%), 9/1/21 (Put Date), 9/1/39(1) | | | 1,000 | | | | 1,009,580 | |
| | |
Greater Orlando Aviation Authority, FL, (AMT), 5.00%, 10/1/21 | | | 250 | | | | 269,778 | |
| | |
Illinois Toll Highway Authority, 5.00%, 1/1/27 | | | 1,250 | | | | 1,437,762 | |
| | |
Kansas City Industrial Development Authority, MO, (Kansas City International Airport Terminal Modernization), (AMT), 5.00%, 3/1/30 | | | 1,000 | | | | 1,253,960 | |
| | |
Kansas City Industrial Development Authority, MO, (Kansas City International Airport Terminal Modernization), (AMT), 5.00%, 3/1/32 | | | 1,000 | | | | 1,236,920 | |
| | | | | | | | |
| Security | | Principal
Amount
(000’s omitted) | | | Value | |
|
| Transportation (continued) | |
| | |
Kansas City Industrial Development Authority, MO, (Kansas City International Airport Terminal Modernization), (AMT), 5.00%, 3/1/33 | | $ | 2,000 | | | $ | 2,462,920 | |
| | |
Kansas City Industrial Development Authority, MO, (Kansas City International Airport Terminal Modernization), (AMT), 5.00%, 3/1/34 | | | 1,800 | | | | 2,207,844 | |
| | |
Los Angeles Department of Airports, CA, (Los Angeles International Airport), (AMT), 5.00%, 5/15/25 | | | 3,105 | | | | 3,732,520 | |
| | |
Los Angeles Department of Airports, CA, (Los Angeles International Airport), (AMT), 5.00%, 5/15/27 | | | 2,700 | | | | 3,206,925 | |
| | |
Los Angeles Department of Airports, CA, (Los Angeles International Airport), (AMT), 5.00%, 5/15/34 | | | 1,710 | | | | 2,092,561 | |
| | |
Los Angeles Department of Airports, CA, (Los Angeles International Airport), (AMT), 5.00%, 5/15/36 | | | 2,515 | | | | 3,055,876 | |
| | |
Los Angeles Harbor Department, CA, (AMT), 5.00%, 8/1/26 | | | 1,230 | | | | 1,445,631 | |
| | |
Maryland Economic Development Corp., (Seagirt Marine Terminal), (AMT), 5.00%, 6/1/44 | | | 500 | | | | 592,295 | |
| | |
Maryland Economic Development Corp., (Seagirt Marine Terminal), (AMT), 5.00%, 6/1/49 | | | 750 | | | | 883,485 | |
| | |
Memphis-Shelby County Airport Authority, TN, (AMT), 5.00%, 7/1/27 | | | 1,330 | | | | 1,638,241 | |
| | |
Memphis-Shelby County Airport Authority, TN, (AMT), 5.00%, 7/1/29 | | | 1,470 | | | | 1,827,916 | |
| | |
Metropolitan Transportation Authority, NY, Green Bonds, 5.00%, 11/15/26 | | | 5,000 | | | | 6,182,350 | |
| | |
Metropolitan Washington Airports Authority, D.C., (AMT), 5.00%, 10/1/23 | | | 810 | | | | 929,839 | |
| | |
Miami-Dade County, FL, Aviation Revenue, 5.00%, 10/1/25 | | | 1,000 | | | | 1,185,770 | |
| | |
New Jersey Transportation Trust Fund Authority, (Transportation Program), 2.60%, (SIFMA + 1.20%), 12/15/21 (Put Date), 6/15/34(1) | | | 2,750 | | | | 2,768,810 | |
| | |
New Jersey Turnpike Authority, 5.00%, 1/1/32 | | | 4,520 | | | | 5,222,589 | |
| | |
New Orleans Aviation Board, LA, (AMT), 5.00%, 1/1/24 | | | 1,600 | | | | 1,824,144 | |
| | |
New Orleans Aviation Board, LA, (AMT), 5.00%, 1/1/25 | | | 1,600 | | | | 1,864,816 | |
| | |
New Orleans Aviation Board, LA, (AMT), 5.00%, 1/1/27 | | | 1,000 | | | | 1,158,570 | |
| | |
New York Transportation Development Corp., (Delta Airlines, Inc. - LaGuardia Airport Terminals C&D Redevelopment), (AMT), 5.00%, 1/1/28 | | | 10,000 | | | | 12,219,500 | |
| | |
New York Transportation Development Corp., (Terminal One Group Association, L.P.), (AMT), 5.00%, 1/1/22 | | | 5,520 | | | | 5,953,817 | |
| | |
North Texas Tollway Authority, 5.00%, 1/1/30 | | | 1,000 | | | | 1,191,730 | |
| | |
Pennsylvania Turnpike Commission, 2.10%, (SIFMA + 0.70%), 12/1/23(1) | | | 2,500 | | | | 2,515,900 | |
| | |
Pennsylvania Turnpike Commission, 2.28%, (SIFMA + 0.88%), 12/1/20(1) | | | 1,000 | | | | 1,004,190 | |
| | |
Pennsylvania Turnpike Commission, 5.00%, 12/1/37 | | | 6,000 | | | | 7,231,920 | |
| | |
Phoenix Civic Improvement Corp., AZ, Airport Revenue, (AMT), 5.00%, 7/1/30 | | | 2,140 | | | | 2,608,489 | |
| | | | |
| | 19 | | See Notes to Financial Statements. |
Eaton Vance
Municipal Opportunities Fund
July 31, 2019
Portfolio of Investments — continued
| | | | | | | | |
| Security | | Principal
Amount
(000’s omitted) | | | Value | |
|
| Transportation (continued) | |
| | |
Port of Oakland, CA, (AMT), 5.00%, 11/1/24 | | $ | 2,300 | | | $ | 2,721,613 | |
| | |
Port of Portland, OR, (Portland International Airport), (AMT), 5.00%, 7/1/32 | | | 1,500 | | | | 1,879,020 | |
| | |
Port of Portland, OR, (Portland International Airport), (AMT), 5.00%, 7/1/33 | | | 1,405 | | | | 1,752,372 | |
| | |
Port of Portland, OR, (Portland International Airport), (AMT), 5.00%, 7/1/34 | | | 1,510 | | | | 1,874,997 | |
| | |
Public Finance Authority, WI, (Denver International Airport Great Hall), (AMT), 5.00%, 9/30/24 | | | 835 | | | | 954,747 | |
| | |
Public Finance Authority, WI, (Denver International Airport Great Hall), (AMT), 5.00%, 9/30/25 | | | 700 | | | | 815,717 | |
| | |
Public Finance Authority, WI, (Denver International Airport Great Hall), (AMT), 5.00%, 9/30/26 | | | 1,000 | | | | 1,184,190 | |
| | |
Public Finance Authority, WI, (Denver International Airport Great Hall), (AMT), 5.00%, 9/30/27 | | | 700 | | | | 840,973 | |
| | |
San Jose, CA, Airport Revenue, (AMT), 5.00%, 3/1/27 | | | 1,500 | | | | 1,862,040 | |
| | |
South Jersey Transportation Authority, NJ, 5.00%, 11/1/26 | | | 500 | | | | 577,550 | |
| | |
South Jersey Transportation Authority, NJ, 5.00%, 11/1/27 | | | 500 | | | | 575,740 | |
| | |
South Jersey Transportation Authority, NJ, 5.00%, 11/1/28 | | | 750 | | | | 861,188 | |
| | |
South Jersey Transportation Authority, NJ, 5.00%, 11/1/29 | | | 1,450 | | | | 1,658,336 | |
| | |
Texas Transportation Commission, (Central Texas Turnpike System), 5.00%, 8/15/23 | | | 500 | | | | 569,100 | |
| | |
Triborough Bridge and Tunnel Authority, NY, 2.31%, (67% of 1 mo. USD LIBOR + 0.70%), 2/1/21 (Put Date), 1/1/32(1) | | | 9,820 | | | | 9,898,756 | |
| | | | | | | | | |
| |
| | | | $ | 172,536,524 | |
|
| Water and Sewer — 4.4% | |
| | |
California Department of Water Resources, (Central Valley Project), 1.77%, (SIFMA + 0.37%), 12/1/22 (Put Date), 12/1/35(1) | | $ | 8,000 | | | $ | 8,025,520 | |
| | |
Cape Fear Public Utility Authority, NC, 4.00%, 8/1/32 | | | 445 | | | | 504,723 | |
| | |
Charleston, SC, Waterworks and Sewer System Revenue, 1.953%, (70% of 1 mo. USD LIBOR + 0.37%), 1/1/22 (Put Date), 1/1/35(1) | | | 5,000 | | | | 5,007,050 | |
| | |
Coldwater Local Development Finance Authority, MI, Series A, (AMT), 5.00%, 12/1/27 | | | 390 | | | | 449,023 | |
| | |
Coldwater Local Development Finance Authority, MI, Series B, (AMT), 5.00%, 12/1/27 | | | 505 | | | | 581,427 | |
| | |
Detroit, MI, Sewage Disposal System, 5.00%, 7/1/32 | | | 125 | | | | 135,690 | |
| | |
Detroit, MI, Water Supply System, 5.25%, 7/1/41 | | | 295 | | | | 313,674 | |
| | |
Michigan Finance Authority, (Detroit Water and Sewerage Department), (AMT), 5.00%, 7/1/44 | | | 1,000 | | | | 1,074,310 | |
| | |
New York City Municipal Water Finance Authority, NY, (Water and Sewer System), (LOC: Citibank, N.A.), 1.49%, 6/15/35(3) | | | 2,250 | | | | 2,250,000 | |
| | | | | | | | |
| Security | | Principal
Amount
(000’s omitted) | | | Value | |
|
| Water and Sewer (continued) | |
| | |
New York City Municipal Water Finance Authority, NY, (Water and Sewer System), Fiscal 2014 Series AA - 1, (SPA: JPMorgan Chase Bank, N.A.), 1.48%, 6/15/50(3) | | $ | 17,020 | | | $ | 17,020,000 | |
| | |
New York City Municipal Water Finance Authority, NY, (Water and Sewer System), Fiscal 2014 Series AA - 2, (SPA: JPMorgan Chase Bank, N.A.), 1.48%, 6/15/50(3) | | | 8,400 | | | | 8,400,000 | |
| | |
New York City Municipal Water Finance Authority, NY, (Water and Sewer System), (SPA: PNC Bank, N.A.), 1.51%, 6/15/46(3) | | | 8,225 | | | | 8,225,000 | |
| | |
Riverside, CA, Water System Revenue, 2.03%, (SIFMA + 0.63%), 1/15/20 (Put Date), 10/1/35(1) | | | 2,190 | | | | 2,191,730 | |
| | |
San Francisco City and County Public Utilities Commission, CA, Green Bonds, 5.00%, 11/1/37 | | | 2,575 | | | | 3,013,239 | |
| | | | | | | | | |
| | |
| | | | | | | $ | 57,191,386 | |
| |
TotalTax-Exempt Municipal Securities — 94.0%
(identified cost $1,173,593,201) | | | $ | 1,225,959,675 | |
|
| Tax-Exempt Mortgage-Backed Securities — 0.0%(5) | |
| | |
| | | | | | | | |
| Security | | Principal
Amount
(000’s omitted) | | | Value | |
|
| Housing — 0.0%(5) | |
| | |
FRETE 2017-ML01 Trust, Class A, (Freddie Mac guaranteed), 2.761%, (1 mo. USD LIBOR + 0.50%), 1/25/33(1)(2) | | $ | 482 | | | $ | 482,127 | |
| | | | | | | | | |
| |
TotalTax-Exempt Mortgage-Backed Securities — 0.0%(5)
(identified cost $481,766) | | | $ | 482,127 | |
|
| Taxable Municipal Securities — 3.8% | |
| | |
| | | | | | | | |
| Security | | Principal
Amount
(000’s omitted) | | | Value | |
|
| Electric Utilities — 0.2% | |
| | |
Vernon, CA, Electric System Revenue, 4.05%, 8/1/23 | | $ | 2,000 | | | $ | 2,117,560 | |
| | | | | | | | | |
| | |
| | | | | | | $ | 2,117,560 | |
|
| General Obligations — 1.1% | |
| | |
Atlantic City, NJ, 7.00%, 3/1/28 | | $ | 3,115 | | | $ | 3,654,394 | |
| | |
Chicago, IL, 7.375%, 1/1/33 | | | 3,250 | | | | 3,855,085 | |
| | |
Chicago, IL, 7.75%, 1/1/42 | | | 3,236 | | | | 3,652,376 | |
| | |
Chicago, IL, 7.781%, 1/1/35 | | | 2,600 | | | | 3,171,272 | |
| | | | | | | | | |
| | |
| | | | | | | $ | 14,333,127 | |
| | | | |
| | 20 | | See Notes to Financial Statements. |
Eaton Vance
Municipal Opportunities Fund
July 31, 2019
Portfolio of Investments — continued
| | | | | | | | |
| Security | | Principal
Amount
(000’s omitted) | | | Value | |
|
| Hospital — 0.6% | |
| | |
California Statewide Communities Development Authority, (Loma Linda University Medical Center),
6.00%, 12/1/24 | | $ | 7,250 | | | $ | 7,837,468 | |
| | | | | | | | | |
| |
| | | | $ | 7,837,468 | |
|
| Insured – General Obligations — 0.7% | |
| | |
Detroit, MI, (AMBAC), 4.96%, 4/1/20 | | $ | 1,016 | | | $ | 1,016,469 | |
| | |
Detroit, MI, (AMBAC), 5.15%, 4/1/25 | | | 7,923 | | | | 7,922,487 | |
| | | | | | | | | |
| |
| | | | $ | 8,938,956 | |
|
| Insured – Hospital — 0.1% | |
| | |
Oklahoma Development Finance Authority, (OU Medicine), (AGM), 4.65%, 8/15/30 | | $ | 1,500 | | | $ | 1,739,055 | |
| | | | | | | | | |
| |
| | | | $ | 1,739,055 | |
|
| Insured – Special Tax Revenue — 0.3% | |
| | |
Successor Agency to Pittsburg Redevelopment Agency, CA, (AGM), 2.869%, 8/1/20 | | $ | 905 | | | $ | 909,281 | |
| | |
Successor Agency to Pittsburg Redevelopment Agency, CA, (AGM), 3.684%, 8/1/24 | | | 1,030 | | | | 1,085,352 | |
| | |
Successor Agency to San Bernardino County Redevelopment Agency, CA, (AGM), 3.25%, 9/1/22 | | | 350 | | | | 356,080 | |
| | |
Successor Agency to San Bernardino County Redevelopment Agency, CA, (AGM), 3.50%, 9/1/23 | | | 510 | | | | 525,932 | |
| | |
Successor Agency to San Bernardino County Redevelopment Agency, CA, (AGM), 3.75%, 9/1/25 | | | 500 | | | | 522,835 | |
| | |
Successor Agency to San Bernardino County Redevelopment Agency, CA, (AGM), 4.00%, 9/1/26 | | | 500 | | | | 526,165 | |
| | | | | | | | | |
| |
| | | | $ | 3,925,645 | |
|
| Senior Living / Life Care — 0.7% | |
| | |
Berks County Industrial Development Authority, PA, (Highlands at Wyomissing), 3.95%, 5/15/24 | | $ | 1,450 | | | $ | 1,487,656 | |
| | |
St. Johns County Industrial Development Authority, FL, (Westminster St. Augustine), 5.50% to 8/1/24 (Put Date), 8/1/44 | | | 7,000 | | | | 7,009,310 | |
| | | | | | | | | |
| |
| | | | $ | 8,496,966 | |
|
| Special Tax Revenue — 0.1% | |
| | |
New Jersey Economic Development Authority, (Motor Vehicle Surcharges), 3.65%, 7/1/21 | | $ | 500 | | | $ | 507,855 | |
| | |
New Jersey Economic Development Authority, (Motor Vehicle Surcharges), 3.80%, 7/1/22 | | | 1,000 | | | | 1,026,140 | |
| | | | | | | | | |
| |
| | | | $ | 1,533,995 | |
| |
Total Taxable Municipal Securities — 3.8%
(identified cost $45,693,292) | | | $ | 48,922,772 | |
| | | | | | | | |
| Corporate Bonds & Notes — 1.5% | |
| | |
| | | | | | | | |
| Security | | Principal
Amount
(000’s omitted) | | | Value | |
|
| Hospital — 1.5% | |
| | |
Care New England Health System, 5.50%, 9/1/26 | | $ | 11,000 | | | $ | 12,065,653 | |
| | |
Harnett Health System, Inc., 6.50% to 4/1/20 (Put Date), 4/1/32 | | | 3,865 | | | | 3,905,517 | |
| | |
St. Joseph’s Hospital & Medical Center, 3.926%, 7/1/22 | | | 3,175 | | | | 3,243,545 | |
| | | | | | | | | |
| | |
Total Corporate Bonds & Notes — 1.5%
(identified cost $17,831,754) | | | | | | $ | 19,214,715 | |
| |
Total Investments — 99.3%
(identified cost $1,237,600,013) | | | $ | 1,294,579,289 | |
| |
Other Assets, Less Liabilities — 0.7% | | | $ | 9,153,948 | |
| |
Net Assets — 100.0% | | | $ | 1,303,733,237 | |
The percentage shown for each investment category in the Portfolio of Investments is based on net assets.
At July 31, 2019, the concentration of the Fund’s investments in the various states and territories, determined as a percentage of net assets, is as follows:
| | | | |
| |
| New York | | | 15.2% | |
| |
| Illinois | | | 13.3% | |
| |
| Others, representing less than 10% individually | | | 70.8% | |
The Fund invests primarily in debt securities issued by municipalities. The ability of the issuers of the debt securities to meet their obligations may be affected by economic developments in a specific industry or municipality. In order to reduce the risk associated with such economic developments, at July 31, 2019, 8.6% of total investments are backed by bond insurance of various financial institutions and financial guaranty assurance agencies. The aggregate percentage insured by an individual financial institution or financial guaranty assurance agency ranged from 0.1% to 3.7% of total investments.
| (1) | Floating rate security. The stated interest rate represents the rate in effect at July 31, 2019. |
| (2) | Security exempt from registration pursuant to Rule 144A under the Securities Act of 1933, as amended. These securities may be sold in certain transactions in reliance on an exemption from registration (normally to qualified institutional buyers). At July 31, 2019, the aggregate value of these securities is $94,353,869 or 7.2% of the Fund’s net assets. |
| (3) | Variable rate demand obligation that may be tendered at par on any day for payment the same or next business day. The stated interest rate, which generally resets daily, is determined by the remarketing agent and represents the rate in effect at July 31, 2019. |
| (4) | When-issued security. |
| (5) | Amount is less than 0.05%. |
| | | | |
| | 21 | | See Notes to Financial Statements. |
Eaton Vance
Municipal Opportunities Fund
July 31, 2019
Portfolio of Investments — continued
| | | | | | | | | | | | | | | | |
| Futures Contracts | |
| Description | | Number of
Contracts | | | Position | | Expiration
Date | | | Notional
Amount | | Value/Unrealized
Depreciation | |
|
Interest Rate Futures | |
| | | | | |
| U.S. Long Treasury Bond | | | 150 | | | Short | | | 9/19/19 | | | $(23,339,063) | | $ | (695,880 | ) |
| |
| | | $ | (695,880 | ) |
Abbreviations:
| | | | |
| | |
| AGC | | – | | Assured Guaranty Corp. |
| | |
| AGM | | – | | Assured Guaranty Municipal Corp. |
| | |
| AMBAC | | – | | AMBAC Financial Group, Inc. |
| | |
| AMT | | – | | Interest earned from these securities may be considered a tax preference item for purposes of the Federal Alternative Minimum Tax. |
| | |
| BAM | | – | | Build America Mutual Assurance Co. |
| | |
| LIBOR | | – | | London Interbank Offered Rate |
| | |
| Liq | | – | | Liquidity Provider |
| | |
| LOC | | – | | Letter of Credit |
| | |
| NPFG | | – | | National Public Finance Guarantee Corp. |
| | |
| PSF | | – | | Permanent School Fund |
| | |
| SIFMA | | – | | Securities Industry and Financial Markets Association Municipal Swap Index |
| | |
| SPA | | – | | Standby Bond Purchase Agreement |
Currency Abbreviations:
| | | | |
| | |
| USD | | – | | United States Dollar |
| | | | |
| | 22 | | See Notes to Financial Statements. |
Eaton Vance
Municipal Opportunities Fund
July 31, 2019
Statement of Assets and Liabilities
| | | | |
| Assets | | July 31, 2019 | |
| |
Investments, at value (identified cost, $1,237,600,013) | | $ | 1,294,579,289 | |
| |
Cash | | | 8,063,224 | |
| |
Deposits for derivatives collateral — financial futures contracts | | | 361,161 | |
| |
Interest receivable | | | 10,042,174 | |
| |
Receivable for investments sold | | | 1,655,000 | |
| |
Receivable for Fund shares sold | | | 3,360,105 | |
| |
Total assets | | $ | 1,318,060,953 | |
| |
| Liabilities | | | | |
| |
Payable for when-issued securities | | $ | 10,645,551 | |
| |
Payable for variation margin on open financial futures contracts | | | 145,315 | |
| |
Payable for Fund shares redeemed | | | 2,166,564 | |
| |
Distributions payable | | | 365,712 | |
| |
Payable to affiliates: | | | | |
| |
Investment adviser and administration fee | | | 629,575 | |
| |
Distribution and service fees | | | 67,447 | |
| |
Accrued expenses | | | 307,552 | |
| |
Total liabilities | | $ | 14,327,716 | |
| |
Net Assets | | $ | 1,303,733,237 | |
| |
| Sources of Net Assets | | | | |
| |
Paid-in capital | | $ | 1,255,413,047 | |
| |
Distributable earnings | | | 48,320,190 | |
| |
Net Assets | | $ | 1,303,733,237 | |
| |
| Class A Shares | | | | |
| |
Net Assets | | $ | 127,094,243 | |
| |
Shares Outstanding | | | 10,328,565 | |
| |
Net Asset Value and Redemption Price Per Share | | | | |
| |
(net assets ÷ shares of beneficial interest outstanding) | | $ | 12.31 | |
| |
Maximum Offering Price Per Share | | | | |
| |
(100 ÷ 95.25 of net asset value per share) | | $ | 12.92 | |
| |
| Class C Shares | | | | |
| |
Net Assets | | $ | 47,616,548 | |
| |
Shares Outstanding | | | 3,871,064 | |
| |
Net Asset Value and Offering Price Per Share* | | | | |
| |
(net assets ÷ shares of beneficial interest outstanding) | | $ | 12.30 | |
| |
| Class I Shares | | | | |
| |
Net Assets | | $ | 1,129,022,446 | |
| |
Shares Outstanding | | | 91,620,814 | |
| |
Net Asset Value, Offering Price and Redemption Price Per Share | | | | |
| |
(net assets ÷ shares of beneficial interest outstanding) | | $ | 12.32 | |
On sales of $50,000 or more, the offering price of Class A shares is reduced.
| * | Redemption price per share is equal to the net asset value less any applicable contingent deferred sales charge. |
| | | | |
| | 23 | | See Notes to Financial Statements. |
Eaton Vance
Municipal Opportunities Fund
July 31, 2019
Statement of Operations
| | | | |
| Investment Income | | Year Ended
July 31, 2019 | |
| |
Interest | | $ | 35,205,189 | |
| |
Dividends | | | 468,125 | |
| |
Total investment income | | $ | 35,673,314 | |
| |
| Expenses | | | | |
| |
Investment adviser and administration fee | | $ | 6,419,463 | |
| |
Distribution and service fees | | | | |
| |
Class A | | | 300,827 | |
| |
Class C | | | 483,626 | |
| |
Trustees’ fees and expenses | | | 60,595 | |
| |
Custodian fee | | | 246,916 | |
| |
Transfer and dividend disbursing agent fees | | | 363,202 | |
| |
Legal and accounting services | | | 73,180 | |
| |
Printing and postage | | | 79,890 | |
| |
Registration fees | | | 126,845 | |
| |
Miscellaneous | | | 170,071 | |
| |
Total expenses | | $ | 8,324,615 | |
| |
Net investment income | | $ | 27,348,699 | |
| |
| Realized and Unrealized Gain (Loss) | | | | |
| |
Net realized gain (loss) — | | | | |
| |
Investment transactions | | $ | 666,222 | |
| |
Financial futures contracts | | | (1,713,531 | ) |
| |
Net realized loss | | $ | (1,047,309 | ) |
| |
Change in unrealized appreciation (depreciation) — | | | | |
| |
Investments | | $ | 42,526,361 | |
| |
Financial futures contracts | | | (577,279 | ) |
| |
Net change in unrealized appreciation (depreciation) | | $ | 41,949,082 | |
| |
Net realized and unrealized gain | | $ | 40,901,773 | |
| |
Net increase in net assets from operations | | $ | 68,250,472 | |
| | | | |
| | 24 | | See Notes to Financial Statements. |
Eaton Vance
Municipal Opportunities Fund
July 31, 2019
Statements of Changes in Net Assets
| | | | | | | | |
| | | Year Ended July 31, | |
| Increase (Decrease) in Net Assets | | 2019 | | | 2018 | |
| | |
From operations — | | | | | | | | |
| | |
Net investment income | | $ | 27,348,699 | | | $ | 21,340,347 | |
| | |
Net realized gain (loss) | | | (1,047,309 | ) | | | 35,747 | |
| | |
Net change in unrealized appreciation (depreciation) | | | 41,949,082 | | | | (7,698,659 | ) |
| | |
Net increase in net assets from operations | | $ | 68,250,472 | | | $ | 13,677,435 | |
| | |
Distributions to shareholders(1) — | | | | | | | | |
| | |
Class A | | $ | (2,758,523 | ) | | $ | (2,422,278 | ) |
| | |
Class C | | | (746,583 | ) | | | (711,094 | ) |
| | |
Class I | | | (23,555,841 | ) | | | (17,950,503 | ) |
| | |
Total distributions to shareholders | | $ | (27,060,947 | ) | | $ | (21,083,875 | ) |
| | |
Transactions in shares of beneficial interest — | | | | | | | | |
| | |
Proceeds from sale of shares | | | | | | | | |
| | |
Class A | | $ | 43,521,214 | | | $ | 42,770,177 | |
| | |
Class C | | | 10,095,054 | | | | 11,982,388 | |
| | |
Class I | | | 488,983,370 | | | | 399,788,818 | |
| | |
Net asset value of shares issued to shareholders in payment of distributions declared | | | | | | | | |
| | |
Class A | | | 2,563,754 | | | | 2,255,276 | |
| | |
Class C | | | 595,761 | | | | 577,126 | |
| | |
Class I | | | 19,568,953 | | | | 14,974,539 | |
| | |
Cost of shares redeemed | | | | | | | | |
| | |
Class A | | | (41,362,115 | ) | | | (39,876,785 | ) |
| | |
Class C | | | (15,259,847 | ) | | | (14,556,745 | ) |
| | |
Class I | | | (255,364,847 | ) | | | (198,297,827 | ) |
| | |
Net asset value of shares converted | | | | | | | | |
| | |
Class A | | | 1,037,027 | | | | — | |
| | |
Class C | | | (1,037,027 | ) | | | — | |
| | |
Net increase in net assets from Fund share transactions | | $ | 253,341,297 | | | $ | 219,616,967 | |
| | |
Net increase in net assets | | $ | 294,530,822 | | | $ | 212,210,527 | |
| | |
| Net Assets | | | | | | | | |
| | |
At beginning of year | | $ | 1,009,202,415 | | | $ | 796,991,888 | |
| | |
At end of year | | $ | 1,303,733,237 | | | $ | 1,009,202,415 | (2) |
| (1) | For the year ended July 31, 2018, the source of distributions was from net investment income. The current year presentation of distributions conforms with the Disclosure Update and Simplification Rule issued by the Securities and Exchange Commission, effective November 5, 2018. |
| (2) | Includes accumulated distributions in excess of net investment income of $(5,270) at July 31, 2018. The requirement to disclose the corresponding amount as of July 31, 2019 was eliminated. |
| | | | |
| | 25 | | See Notes to Financial Statements. |
Eaton Vance
Municipal Opportunities Fund
July 31, 2019
Financial Highlights
| | | | | | | | | | | | | | | | | | | | |
| | | Class A | |
| |
| | | Year Ended July 31, | |
| | | 2019 | | | 2018 | | | 2017 | | | 2016 | | | 2015 | |
| | | | | |
Net asset value — Beginning of year | | $ | 11.880 | | | $ | 11.960 | | | $ | 12.250 | | | $ | 11.490 | | | $ | 11.180 | |
| | | | | |
| Income (Loss) From Operations | | | | | | | | | | | | | | | | | | | | |
| | | | | |
Net investment income | | $ | 0.277 | (1) | | $ | 0.251 | (1) | | $ | 0.236 | | | $ | 0.218 | | | $ | 0.202 | |
| | | | | |
Net realized and unrealized gain (loss) | | | 0.427 | | | | (0.084 | ) | | | (0.239 | ) | | | 0.760 | | | | 0.319 | |
| | | | | |
Total income (loss) from operations | | $ | 0.704 | | | $ | 0.167 | | | $ | (0.003 | ) | | $ | 0.978 | | | $ | 0.521 | |
| | | | | |
| Less Distributions | | | | | | | | | | | | | | | | | | | | |
| | | | | |
From net investment income | | $ | (0.274 | ) | | $ | (0.247 | ) | | $ | (0.236 | ) | | $ | (0.218 | ) | | $ | (0.202 | ) |
| | | | | |
From net realized gain | | | — | | | | — | | | | (0.051 | ) | | | — | | | | (0.009 | ) |
| | | | | |
Total distributions | | $ | (0.274 | ) | | $ | (0.247 | ) | | $ | (0.287 | ) | | $ | (0.218 | ) | | $ | (0.211 | ) |
| | | | | |
Net asset value — End of year | | $ | 12.310 | | | $ | 11.880 | | | $ | 11.960 | | | $ | 12.250 | | | $ | 11.490 | |
| | | | | |
Total Return(2) | | | 6.02 | % | | | 1.41 | % | | | 0.04 | % | | | 8.59 | % | | | 4.68 | %(3) |
| | | | | |
| Ratios/Supplemental Data | | | | | | | | | | | | | | | | | | | | |
| | | | | |
Net assets, end of year (000’s omitted) | | $ | 127,094 | | | $ | 116,961 | | | $ | 112,632 | | | $ | 154,283 | | | $ | 87,416 | |
| | | | | |
Ratios (as a percentage of average daily net assets): | | | | | | | | | | | | | | | | | | | | |
| | | | | |
Expenses(4) | | | 0.94 | % | | | 0.93 | % | | | 0.96 | % | | | 0.97 | % | | | 1.00 | %(3) |
| | | | | |
Net investment income | | | 2.32 | % | | | 2.11 | % | | | 2.02 | % | | | 1.85 | % | | | 1.72 | % |
| | | | | |
Portfolio Turnover | | | 34 | % | | | 30 | % | | | 53 | % | | | 58 | % | | | 79 | % |
| (1) | Computed using average shares outstanding. |
| (2) | Returns are historical and are calculated by determining the percentage change in net asset value with all distributions reinvested and do not reflect the effect of sales charges. |
| (3) | The investment adviser and administrator reimbursed certain operating expenses (equal to 0.06% of average daily net assets for the year ended July 31, 2015). Absent this reimbursement, total return would be lower. |
| (4) | Excludes the effect of custody fee credits, if any, of less than 0.005%. Effective September 1, 2015, custody fee credits, which were earned on cash deposit balances, were discontinued by the custodian. |
| | | | |
| | 26 | | See Notes to Financial Statements. |
Eaton Vance
Municipal Opportunities Fund
July 31, 2019
Financial Highlights — continued
| | | | | | | | | | | | | | | | | | | | |
| | | Class C | |
| | |
| | | Year Ended July 31, | | | Period Ended
July 31, 2015(1) | |
| | | 2019 | | | 2018 | | | 2017 | | | 2016 | |
| | | | | |
Net asset value — Beginning of period | | $ | 11.870 | | | $ | 11.960 | | | $ | 12.250 | | | $ | 11.480 | | | $ | 11.270 | |
| | | | | |
| Income (Loss) From Operations | | | | | | | | | | | | | | | | | | | | |
| | | | | |
Net investment income | | $ | 0.188 | (2) | | $ | 0.161 | (2) | | $ | 0.146 | | | $ | 0.129 | | | $ | 0.103 | |
| | | | | |
Net realized and unrealized gain (loss) | | | 0.426 | | | | (0.093 | ) | | | (0.239 | ) | | | 0.770 | | | | 0.219 | |
| | | | | |
Total income (loss) from operations | | $ | 0.614 | | | $ | 0.068 | | | $ | (0.093 | ) | | $ | 0.899 | | | $ | 0.322 | |
| | | | | |
| Less Distributions | | | | | | | | | | | | | | | | | | | | |
| | | | | |
From net investment income | | $ | (0.184 | ) | | $ | (0.158 | ) | | $ | (0.146 | ) | | $ | (0.129 | ) | | $ | (0.103 | ) |
| | | | | |
From net realized gain | | | — | | | | — | | | | (0.051 | ) | | | — | | | | (0.009 | ) |
| | | | | |
Total distributions | | $ | (0.184 | ) | | $ | (0.158 | ) | | $ | (0.197 | ) | | $ | (0.129 | ) | | $ | (0.112 | ) |
| | | | | |
Net asset value — End of period | | $ | 12.300 | | | $ | 11.870 | | | $ | 11.960 | | | $ | 12.250 | | | $ | 11.480 | |
| | | | | |
Total Return(3) | | | 5.23 | % | | | 0.57 | % | | | (0.71 | )% | | | 7.87 | % | | | 2.86 | %(4)(5) |
| | | | | |
| Ratios/Supplemental Data | | | | | | | | | | | | | | | | | | | | |
| | | | | |
Net assets, end of period (000’s omitted) | | $ | 47,617 | | | $ | 51,587 | | | $ | 54,001 | | | $ | 47,302 | | | $ | 21,534 | |
| | | | | |
Ratios (as a percentage of average daily net assets): | | | | | | | | | | | | | | | | | | | | |
| | | | | |
Expenses(6) | | | 1.69 | % | | | 1.69 | % | | | 1.71 | % | | | 1.72 | % | | | 1.75 | %(5)(7) |
| | | | | |
Net investment income | | | 1.57 | % | | | 1.35 | % | | | 1.27 | % | | | 1.09 | % | | | 0.91 | %(7) |
| | | | | |
Portfolio Turnover | | | 34 | % | | | 30 | % | | | 53 | % | | | 58 | % | | | 79 | %(8) |
| (1) | For the period from the commencement of operations, August 18, 2014, to July 31, 2015. |
| (2) | Computed using average shares outstanding. |
| (3) | Returns are historical and are calculated by determining the percentage change in net asset value with all distributions reinvested and do not reflect the effect of sales charges. |
| (5) | The investment adviser and administrator reimbursed certain operating expenses (equal to 0.06% of average daily net assets for the period ended July 31, 2015). Absent this reimbursement, total return would be lower. |
| (6) | Excludes the effect of custody fee credits, if any, of less than 0.005%. Effective September 1, 2015, custody fee credits, which were earned on cash deposit balances, were discontinued by the custodian. |
| (8) | For the year ended July 31, 2015. |
| | | | |
| | 27 | | See Notes to Financial Statements. |
Eaton Vance
Municipal Opportunities Fund
July 31, 2019
Financial Highlights — continued
| | | | | | | | | | | | | | | | | | | | |
| | | Class I | |
| |
| | | Year Ended July 31, | |
| | | 2019 | | | 2018 | | | 2017 | | | 2016 | | | 2015 | |
| | | | | |
Net asset value — Beginning of year | | $ | 11.900 | | | $ | 11.980 | | | $ | 12.270 | | | $ | 11.500 | | | $ | 11.190 | |
| | | | | |
| Income (Loss) From Operations | | | | | | | | | | | | | | | | | | | | |
| | | | | |
Net investment income | | $ | 0.306 | (1) | | $ | 0.282 | (1) | | $ | 0.265 | | | $ | 0.248 | | | $ | 0.232 | |
| | | | | |
Net realized and unrealized gain (loss) | | | 0.418 | | | | (0.085 | ) | | | (0.239 | ) | | | 0.770 | | | | 0.319 | |
| | | | | |
Total income from operations | | $ | 0.724 | | | $ | 0.197 | | | $ | 0.026 | | | $ | 1.018 | | | $ | 0.551 | |
| | | | | |
| Less Distributions | | | | | | | | | | | | | | | | | | | | |
| | | | | |
From net investment income | | $ | (0.304 | ) | | $ | (0.277 | ) | | $ | (0.265 | ) | | $ | (0.248 | ) | | $ | (0.232 | ) |
| | | | | |
From net realized gain | | | — | | | | — | | | | (0.051 | ) | | | — | | | | (0.009 | ) |
| | | | | |
Total distributions | | $ | (0.304 | ) | | $ | (0.277 | ) | | $ | (0.316 | ) | | $ | (0.248 | ) | | $ | (0.241 | ) |
| | | | | |
Net asset value — End of year | | $ | 12.320 | | | $ | 11.900 | | | $ | 11.980 | | | $ | 12.270 | | | $ | 11.500 | |
| | | | | |
Total Return(2) | | | 6.19 | % | | | 1.67 | % | | | 0.29 | % | | | 8.95 | % | | | 4.94 | %(3) |
| | | | | |
| Ratios/Supplemental Data | | | | | | | | | | | | | | | | | | | | |
| | | | | |
Net assets, end of year (000’s omitted) | | $ | 1,129,022 | | | $ | 840,654 | | | $ | 630,358 | | | $ | 501,541 | | | $ | 211,151 | |
| | | | | |
Ratios (as a percentage of average daily net assets): | | | | | | | | | | | | | | | | | | | | |
| | | | | |
Expenses(4) | | | 0.69 | % | | | 0.68 | % | | | 0.71 | % | | | 0.72 | % | | | 0.75 | %(3) |
| | | | | |
Net investment income | | | 2.56 | % | | | 2.37 | % | | | 2.27 | % | | | 2.09 | % | | | 1.98 | % |
| | | | | |
Portfolio Turnover | | | 34 | % | | | 30 | % | | | 53 | % | | | 58 | % | | | 79 | % |
| (1) | Computed using average shares outstanding. |
| (2) | Returns are historical and are calculated by determining the percentage change in net asset value with all distributions reinvested. |
| (3) | The investment adviser and administrator reimbursed certain operating expenses (equal to 0.06% of average daily net assets for the year ended July 31, 2015). Absent this reimbursement, total return would be lower. |
| (4) | Excludes the effect of custody fee credits, if any, of less than 0.005%. Effective September 1, 2015, custody fee credits, which were earned on cash deposit balances, were discontinued by the custodian. |
| | | | |
| | 28 | | See Notes to Financial Statements. |
Eaton Vance
Municipal Opportunities Fund
July 31, 2019
Notes to Financial Statements
1 Significant Accounting Policies
Eaton Vance Municipal Opportunities Fund (the Fund) is a diversified series of Eaton Vance Municipals Trust (the Trust). The Trust is a Massachusetts business trust registered under the Investment Company Act of 1940, as amended (the 1940 Act), as anopen-end management investment company. The Fund seeks to maximizeafter-tax total return. The Fund offers three classes of shares. Class A shares are generally sold subject to a sales charge imposed at time of purchase. Class C shares are sold at net asset value and are generally subject to a contingent deferred sales charge (see Note 5). Effective January 25, 2019, Class C shares generally automatically convert to Class A shares ten years after their purchase as described in the Fund’s prospectus. Class I shares are sold at net asset value and are not subject to a sales charge. Each class represents apro-rata interest in the Fund, but votes separately on class-specific matters and (as noted below) is subject to different expenses. Realized and unrealized gains and losses are allocated daily to each class of shares based on the relative net assets of each class to the total net assets of the Fund. Net investment income, other than class-specific expenses, is allocated daily to each class of shares based upon the ratio of the value of each class’s paid shares to the total value of all paid shares. Each class of shares differs in its distribution plan and certain other class-specific expenses.
The following is a summary of significant accounting policies of the Fund. The policies are in conformity with accounting principles generally accepted in the United States of America (U.S. GAAP). The Fund is an investment company and follows accounting and reporting guidance in the Financial Accounting Standards Board (FASB) Accounting Standards Codification Topic 946.
A Investment Valuation — The following methodologies are used to determine the market value or fair value of investments.
Debt Obligations. Debt obligations are generally valued on the basis of valuations provided by third party pricing services, as derived from such services’ pricing models. Inputs to the models may include, but are not limited to, reported trades, executable bid and ask prices, broker/dealer quotations, prices or yields of securities with similar characteristics, interest rates, anticipated prepayments, benchmark curves or information pertaining to the issuer, as well as industry and economic events. The pricing services may use a matrix approach, which considers information regarding securities with similar characteristics to determine the valuation for a security. Short-term debt obligations purchased with a remaining maturity of sixty days or less for which a valuation from a third party pricing service is not readily available may be valued at amortized cost, which approximates fair value.
Equity Securities.Equity securities listed on a U.S. securities exchange generally are valued at the last sale or closing price on the day of valuation or, if no sales took place on such date, at the mean between the closing bid and ask prices on the exchange where such securities are principally traded. Equity securities listed on the NASDAQ Global or Global Select Market generally are valued at the NASDAQ official closing price. Unlisted or listed securities for which closing sales prices or closing quotations are not available are valued at the mean between the latest available bid and ask prices.
Derivatives. Financial futures contracts are valued at the closing settlement price established by the board of trade or exchange on which they are traded.
Fair Valuation. Investments for which valuations or market quotations are not readily available or are deemed unreliable are valued at fair value using methods determined in good faith by or at the direction of the Trustees of the Fund in a manner that most fairly reflects the security’s “fair value”, which is the amount that the Fund might reasonably expect to receive for the security upon its current sale in the ordinary course. Each such determination is based on a consideration of relevant factors, which are likely to vary from one pricing context to another. These factors may include, but are not limited to, the type of security, the existence of any contractual restrictions on the security’s disposition, the price and extent of public trading in similar securities of the issuer or of comparable companies or entities, quotations or relevant information obtained from broker/dealers or other market participants, information obtained from the issuer, analysts, and/or the appropriate stock exchange (for exchange-traded securities), an analysis of the company’s or entity’s financial statements, and an evaluation of the forces that influence the issuer and the market(s) in which the security is purchased and sold.
B Investment Transactions and Related Income — Investment transactions for financial statement purposes are accounted for on a trade date basis. Realized gains and losses on investments sold are determined on the basis of identified cost. Interest income is recorded on the basis of interest accrued, adjusted for amortization of premium or accretion of discount. Distributions from investment companies are recorded as dividend income, capital gains or return of capital based on the nature of the distribution.
C Federal Taxes — The Fund’s policy is to comply with the provisions of the Internal Revenue Code applicable to regulated investment companies and to distribute to shareholders each year substantially all of its taxable, if any, andtax-exempt net investment income, and all or substantially all of its net realized capital gains. Accordingly, no provision for federal income or excise tax is necessary. The Fund intends to satisfy conditions which will enable it to designate distributions from the interest and dividend income generated by its investments innon-taxable municipal securities, which are exempt from regular federal income tax when received by the Fund, as exempt-interest dividends. The portion of such interest, if any, earned on private activity bonds issued after August 7, 1986, may be considered a tax preference item to shareholders.
As of July 31, 2019, the Fund had no uncertain tax positions that would require financial statement recognition,de-recognition, or disclosure. The Fund files a U.S. federal income tax return annually after its fiscalyear-end, which is subject to examination by the Internal Revenue Service for a period of three years from the date of filing.
D Expenses — The majority of expenses of the Trust are directly identifiable to an individual fund. Expenses which are not readily identifiable to a specific fund are allocated taking into consideration, among other things, the nature and type of expense and the relative size of the funds.
Eaton Vance
Municipal Opportunities Fund
July 31, 2019
Notes to Financial Statements — continued
E Legal Fees — Legal fees and other related expenses incurred as part of negotiations of the terms and requirement of capital infusions, or that are expected to result in the restructuring of, or a plan of reorganization for, an investment are recorded as realized losses. Ongoing expenditures to protect or enhance an investment are treated as operating expenses.
F Use of Estimates — The preparation of the financial statements in conformity with U.S. GAAP requires management to make estimates and assumptions that affect the reported amounts of assets and liabilities at the date of the financial statements and the reported amounts of income and expense during the reporting period. Actual results could differ from those estimates.
G Indemnifications — Under the Trust’s organizational documents, its officers and Trustees may be indemnified against certain liabilities and expenses arising out of the performance of their duties to the Fund. Under Massachusetts law, if certain conditions prevail, shareholders of a Massachusetts business trust (such as the Trust) could be deemed to have personal liability for the obligations of the Trust. However, the Trust’s Declaration of Trust contains an express disclaimer of liability on the part of Fund shareholders and theBy-laws provide that the Trust shall assume, upon request by the shareholder, the defense on behalf of any Fund shareholders. Moreover, theBy-laws also provide for indemnification out of Fund property of any shareholder held personally liable solely by reason of being or having been a shareholder for all loss or expense arising from such liability. Additionally, in the normal course of business, the Fund enters into agreements with service providers that may contain indemnification clauses. The Fund’s maximum exposure under these arrangements is unknown as this would involve future claims that may be made against the Fund that have not yet occurred.
H Financial Futures Contracts — Upon entering into a financial futures contract, the Fund is required to deposit with the broker, either in cash or securities, an amount equal to a certain percentage of the contract amount (initial margin). Subsequent payments, known as variation margin, are made or received by the Fund each business day, depending on the daily fluctuations in the value of the underlying security, and are recorded as unrealized gains or losses by the Fund. Gains (losses) are realized upon the expiration or closing of the financial futures contracts. Should market conditions change unexpectedly, the Fund may not achieve the anticipated benefits of the financial futures contracts and may realize a loss. Futures contracts have minimal counterparty risk as they are exchange traded and the clearinghouse for the exchange is substituted as the counterparty, guaranteeing counterparty performance.
I When-Issued Securities and Delayed Delivery Transactions — The Fund may purchase or sell securities on a delayed delivery or when-issued basis. Payment and delivery may take place after the customary settlement period for that security. At the time the transaction is negotiated, the price of the security that will be delivered is fixed. The Fund maintains cash and/or security positions for these commitments such that sufficient liquid assets will be available to make payments upon settlement. Securities purchased on a delayed delivery or when-issued basis aremarked-to-market daily and begin earning interest on settlement date. Losses may arise due to changes in the market value of the underlying securities or if the counterparty does not perform under the contract.
2 Distributions to Shareholders and Income Tax Information
The net investment income of the Fund is determined daily and substantially all of the net investment income so determined is declared as a dividend to shareholders of record at the time of declaration. Distributions are declared separately for each class of shares. Distributions are paid monthly. Distributions of realized capital gains are made at least annually. Shareholders may reinvest income and capital gain distributions in additional shares of the same class of the Fund at the net asset value as of the reinvestment date or, at the election of the shareholder, receive distributions in cash. Distributions to shareholders are determined in accordance with income tax regulations, which may differ from U.S. GAAP. As required by U.S. GAAP, only distributions in excess of tax basis earnings and profits are reported in the financial statements as a return of capital. Permanent differences between book and tax accounting relating to distributions are reclassified topaid-in capital. For tax purposes, distributions from short-term capital gains are considered to be from ordinary income.
The tax character of distributions declared for the years ended July 31, 2019 and July 31, 2018 was as follows:
| | | | | | | | |
| | | Year Ended July 31, | |
| | | 2019 | | | 2018 | |
| | |
Tax-exempt income | | $ | 23,980,952 | | | $ | 18,049,033 | |
| | |
Ordinary income | | $ | 3,079,995 | | | $ | 3,034,842 | |
Eaton Vance
Municipal Opportunities Fund
July 31, 2019
Notes to Financial Statements — continued
As of July 31, 2019, the components of distributable earnings (accumulated loss) on a tax basis were as follows:
| | | | |
| | |
Undistributedtax-exempt income | | $ | 360,441 | |
| |
Deferred capital losses | | $ | (9,620,772 | ) |
| |
Net unrealized appreciation | | $ | 57,946,233 | |
| |
Distributions payable | | $ | (365,712 | ) |
At July 31, 2019, the Fund, for federal income tax purposes, had deferred capital losses of $9,620,772 which would reduce its taxable income arising from future net realized gains on investment transactions, if any, to the extent permitted by the Internal Revenue Code, and thus would reduce the amount of distributions to shareholders, which would otherwise be necessary to relieve the Fund of any liability for federal income or excise tax. The deferred capital losses are treated as arising on the first day of the Fund’s next taxable year and retain the same short-term or long-term character as when originally deferred. Of the deferred capital losses at July 31, 2019, $8,929,338 are short-term and $691,434 are long-term.
The cost and unrealized appreciation (depreciation) of investments, including open derivative contracts, of the Fund at July 31, 2019, as determined on a federal income tax basis, were as follows:
| | | | |
| |
Aggregate cost | | $ | 1,236,633,056 | |
| |
Gross unrealized appreciation | | $ | 58,347,641 | |
| |
Gross unrealized depreciation | | | (401,408 | ) |
| |
Net unrealized appreciation | | $ | 57,946,233 | |
3 Investment Adviser and Administration Fee and Other Transactions with Affiliates
The investment adviser and administration fee is earned by Eaton Vance Management (EVM) as compensation for investment advisory and administrative services rendered to the Fund. The fee is computed at an annual rate of 0.60% of the Fund’s average daily net assets up to $500 million, 0.575% from $500 million up to $1 billion, 0.55% from $1 billion up to $2.5 billion and at reduced rates on daily net assets of $2.5 billion or more, and is payable monthly. For the year ended July 31, 2019, the investment adviser and administration fee amounted to $6,419,463 or 0.58% of the Fund’s average daily net assets. EVM providessub-transfer agency and related services to the Fund pursuant to aSub-Transfer Agency Support Services Agreement. For the year ended July 31, 2019, EVM earned $7,768 from the Fund pursuant to such agreement, which is included in transfer and dividend disbursing agent fees on the Statement of Operations. The Fund was informed that Eaton Vance Distributors, Inc. (EVD), an affiliate of EVM and the Fund’s principal underwriter, received $21,014 as its portion of the sales charge on sales of Class A shares for the year ended July 31, 2019. EVD also received distribution and service fees from Class A and Class C shares (see Note 4) and contingent deferred sales charges (see Note 5).
Trustees and officers of the Fund who are members of EVM’s organization receive remuneration for their services to the Fund out of the investment adviser and administration fee. Trustees of the Fund who are not affiliated with EVM may elect to defer receipt of all or a percentage of their annual fees in accordance with the terms of the Trustees Deferred Compensation Plan. For the year ended July 31, 2019, no significant amounts have been deferred. Certain officers and Trustees of the Fund are officers of EVM.
4 Distribution Plans
The Fund has in effect a distribution plan for Class A shares (Class A Plan) pursuant to Rule12b-1 under the 1940 Act. Pursuant to the Class A Plan, the Fund pays EVD a distribution and service fee of 0.25% per annum of its average daily net assets attributable to Class A shares for distribution services and facilities provided to the Fund by EVD, as well as for personal services and/or the maintenance of shareholder accounts. Distribution and service fees paid or accrued to EVD for the year ended July 31, 2019 amounted to $300,827 for Class A shares. The Fund also has in effect a distribution plan for Class C shares (Class C Plan) pursuant to Rule12b-1 under the 1940 Act. Pursuant to the Class C Plan, the Fund pays EVD amounts equal to 0.75% per annum of its average daily net assets attributable to Class C shares for providing ongoing distribution services and facilities to the Fund. For the year ended July 31, 2019, the Fund paid or accrued to EVD $362,720 for Class C shares.
Pursuant to the Class C Plan, the Fund also makes payments of service fees to EVD, financial intermediaries and other persons in amounts equal to 0.25% per annum of its average daily net assets attributable to Class C shares. Service fees paid or accrued are for personal services and/or the maintenance of shareholder accounts. They are separate and distinct from the sales commissions and distribution fees payable to EVD. Service fees paid or accrued for the year ended July 31, 2019 amounted to $120,906 for Class C shares.
Distribution and service fees are subject to the limitations contained in the Financial Industry Regulatory Authority Rule 2341(d).
Eaton Vance
Municipal Opportunities Fund
July 31, 2019
Notes to Financial Statements — continued
5 Contingent Deferred Sales Charges
A contingent deferred sales charge (CDSC) of 1% generally is imposed on redemptions of Class C shares made within one year of purchase. Class A shares may be subject to a 1% CDSC if redeemed within 18 months of purchase (depending on the circumstances of purchase). Generally, the CDSC is based upon the lower of the net asset value at date of redemption or date of purchase. No charge is levied on shares acquired by reinvestment of dividends or capital gain distributions. For the year ended July 31, 2019, the Fund was informed that EVD received approximately $2,000 of CDSCs paid by Class C shareholders and no CDSCs paid by Class A shareholders.
6 Purchases and Sales of Investments
Purchases and sales of investments, other than short-term obligations, aggregated $624,780,321 and $367,996,741, respectively, for the year ended July 31, 2019.
7 Shares of Beneficial Interest
The Fund’s Declaration of Trust permits the Trustees to issue an unlimited number of full and fractional shares of beneficial interest (without par value). Such shares may be issued in a number of different series (such as the Fund) and classes. Transactions in Fund shares were as follows:
| | | | | | | | |
| | | Year Ended July 31, | |
| Class A | | 2019 | | | 2018 | |
| | |
Sales | | | 3,642,878 | | | | 3,592,634 | |
| | |
Issued to shareholders electing to receive payments of distributions in Fund shares | | | 214,057 | | | | 189,820 | |
| | |
Redemptions | | | (3,462,817 | ) | | | (3,349,278 | ) |
| | |
Converted from Class C shares | | | 86,801 | | | | — | |
| | |
Net increase | | | 480,919 | | | | 433,176 | |
| |
| | | Year Ended July 31, | |
| Class C | | 2019 | | | 2018 | |
| | |
Sales | | | 843,293 | | | | 1,004,685 | |
| | |
Issued to shareholders electing to receive payments of distributions in Fund shares | | | 49,816 | | | | 48,615 | |
| | |
Redemptions | | | (1,280,081 | ) | | | (1,223,805 | ) |
| | |
Converted to Class A shares | | | (86,791 | ) | | | — | |
| | |
Net decrease | | | (473,763 | ) | | | (170,505 | ) |
| |
| | | Year Ended July 31, | |
| Class I | | 2019 | | | 2018 | |
| | |
Sales | | | 40,747,269 | | | | 33,485,781 | |
| | |
Issued to shareholders electing to receive payments of distributions in Fund shares | | | 1,629,198 | | | | 1,258,828 | |
| | |
Redemptions | | | (21,425,572 | ) | | | (16,683,300 | ) |
| | |
Net increase | | | 20,950,895 | | | | 18,061,309 | |
8 Line of Credit
The Fund participates with other portfolios and funds managed by EVM and its affiliates in a $625 million unsecured line of credit agreement with a group of banks, which is in effect through October 29, 2019. Borrowings are made by the Fund solely to facilitate the handling of unusual and/or unanticipated short-term cash requirements. Interest is charged to the Fund based on its borrowings at an amount above either the Eurodollar rate or Federal Funds rate. In addition, a fee computed at an annual rate of 0.15% on the daily unused portion of the line of credit is allocated among the participating portfolios and
Eaton Vance
Municipal Opportunities Fund
July 31, 2019
Notes to Financial Statements — continued
funds at the end of each quarter. Because the line of credit is not available exclusively to the Fund, it may be unable to borrow some or all of its requested amounts at any particular time. The Fund did not have any significant borrowings or allocated fees during the year ended July 31, 2019.
9 Financial Instruments
The Fund may trade in financial instruments withoff-balance sheet risk in the normal course of its investing activities. These financial instruments may include financial futures contracts and may involve, to a varying degree, elements of risk in excess of the amounts recognized for financial statement purposes. The notional or contractual amounts of these instruments represent the investment the Fund has in particular classes of financial instruments and do not necessarily represent the amounts potentially subject to risk. The measurement of the risks associated with these instruments is meaningful only when all related and offsetting transactions are considered. A summary of obligations under these financial instruments at July 31, 2019 is included in the Portfolio of Investments. At July 31, 2019, the Fund had sufficient cash and/or securities to cover commitments under these contracts.
The Fund is subject to interest rate risk in the normal course of pursuing its investment objective. Because the Fund holds fixed-rate bonds, the value of these bonds may decrease if interest rates rise. The Fund enters into U.S. Treasury futures contracts to hedge against changes in interest rates.
The fair value of open derivative instruments (not considered to be hedging instruments for accounting disclosure purposes) and whose primary underlying risk exposure is interest rate risk at July 31, 2019 was as follows:
| | | | | | | | |
| | | Fair Value | |
| Derivative | | Asset Derivative | | | Liability Derivative | |
| | |
Futures Contracts | | $ | — | | | $ | (695,880 | )(1) |
| (1) | Only the current day’s variation margin on open futures contracts is reported within the Statement of Assets and Liabilities as Receivable or Payable for variation margin on open financial futures contracts, as applicable. |
The effect of derivative instruments (not considered to be hedging instruments for accounting disclosure purposes) on the Statement of Operations and whose primary underlying risk exposure is interest rate risk for the year ended July 31, 2019 was as follows:
| | | | | | | | |
| Derivative | | Realized Gain (Loss) on Derivatives Recognized in Income(1) | | | Change in Unrealized Appreciation (Depreciation) on Derivatives Recognized in Income(2) | |
| | |
Futures Contracts | | $ | (1,713,531 | ) | | $ | (577,279 | ) |
| (1) | Statement of Operations location: Net realized gain (loss) – Financial futures contracts. |
| (2) | Statement of Operations location: Change in unrealized appreciation (depreciation) – Financial futures contracts. |
The average notional cost of futures contracts (short) outstanding during the year ended July 31, 2019, which is indicative of the volume of this derivative type, was approximately $21,717,000.
10 Fair Value Measurements
Under generally accepted accounting principles for fair value measurements, a three-tier hierarchy to prioritize the assumptions, referred to as inputs, is used in valuation techniques to measure fair value. The three-tier hierarchy of inputs is summarized in the three broad levels listed below.
| • | | Level 1 – quoted prices in active markets for identical investments |
| • | | Level 2 – other significant observable inputs (including quoted prices for similar investments, interest rates, prepayment speeds, credit risk, etc.) |
| • | | Level 3 – significant unobservable inputs (including a fund’s own assumptions in determining the fair value of investments) |
In cases where the inputs used to measure fair value fall in different levels of the fair value hierarchy, the level disclosed is determined based on the lowest level input that is significant to the fair value measurement in its entirety. The inputs or methodology used for valuing securities are not necessarily an indication of the risk associated with investing in those securities.
Eaton Vance
Municipal Opportunities Fund
July 31, 2019
Notes to Financial Statements — continued
At July 31, 2019, the hierarchy of inputs used in valuing the Fund’s investments and open derivative instruments, which are carried at value, were as follows:
| | | | | | | | | | | | | | | | |
| Asset Description | | Level 1 | | | Level 2 | | | Level 3 | | | Total | |
| | | | |
Tax-Exempt Municipal Securities | | $ | — | | | $ | 1,225,959,675 | | | $ | — | | | $ | 1,225,959,675 | |
| | | | |
Tax-Exempt Mortgage-Backed Securities | | | — | | | | 482,127 | | | | — | | | | 482,127 | |
| | | | |
Taxable Municipal Securities | | | — | | | | 48,922,772 | | | | — | | | | 48,922,772 | |
| | | | |
Corporate Bonds & Notes | | | — | | | | 19,214,715 | | | | — | | | | 19,214,715 | |
| | | | |
Total Investments | | $ | — | | | $ | 1,294,579,289 | | | $ | — | | | $ | 1,294,579,289 | |
| | | | |
Liability Description | | | | | | | | | | | | | | | | |
| | | | |
Futures Contracts | | $ | (695,880 | ) | | $ | — | | | $ | — | | | $ | (695,880 | ) |
| | | | |
Total | | $ | (695,880 | ) | | $ | — | | | $ | — | | | $ | (695,880 | ) |
Eaton Vance
Municipal Opportunities Fund
July 31, 2019
Report of Independent Registered Public Accounting Firm
To the Trustees of Eaton Vance Municipals Trust and Shareholders of Eaton Vance Municipal Opportunities Fund:
Opinion on the Financial Statements and Financial Highlights
We have audited the accompanying statement of assets and liabilities of Eaton Vance Municipal Opportunities Fund (the “Fund”) (one of the funds constituting Eaton Vance Municipals Trust), including the portfolio of investments, as of July 31, 2019, the related statement of operations for the year then ended, the statements of changes in net assets for each of the two years in the period then ended, the financial highlights for each of the five years in the period then ended, and the related notes. In our opinion, the financial statements and financial highlights present fairly, in all material respects, the financial position of the Fund as of July 31, 2019, and the results of its operations for the year then ended, the changes in its net assets for each of the two years in the period then ended, and the financial highlights for each of the five years in the period then ended in conformity with accounting principles generally accepted in the United States of America.
Basis for Opinion
These financial statements and financial highlights are the responsibility of the Fund’s management. Our responsibility is to express an opinion on the Fund’s financial statements and financial highlights based on our audits. We are a public accounting firm registered with the Public Company Accounting Oversight Board (United States) (PCAOB) and are required to be independent with respect to the Fund in accordance with the U.S. federal securities laws and the applicable rules and regulations of the Securities and Exchange Commission and the PCAOB.
We conducted our audits in accordance with the standards of the PCAOB. Those standards require that we plan and perform the audit to obtain reasonable assurance about whether the financial statements and financial highlights are free of material misstatement, whether due to error or fraud. The Fund is not required to have, nor were we engaged to perform, an audit of its internal control over financial reporting. As part of our audits we are required to obtain an understanding of internal control over financial reporting but not for the purpose of expressing an opinion on the effectiveness of the Fund’s internal control over financial reporting. Accordingly, we express no such opinion.
Our audits included performing procedures to assess the risks of material misstatement of the financial statements and financial highlights, whether due to error or fraud, and performing procedures that respond to those risks. Such procedures included examining, on a test basis, evidence regarding the amounts and disclosures in the financial statements and financial highlights. Our audits also included evaluating the accounting principles used and significant estimates made by management, as well as evaluating the overall presentation of the financial statements and financial highlights. Our procedures included confirmation of securities owned as of July 31, 2019, by correspondence with the custodian and brokers; when replies were not received from brokers, we performed other auditing procedures. We believe that our audits provide a reasonable basis for our opinion.
/s/ Deloitte & Touche LLP
Boston, Massachusetts
September 19, 2019
We have served as the auditor of one or more Eaton Vance investment companies since 1959.
Eaton Vance
Municipal Opportunities Fund
July 31, 2019
Federal Tax Information (Unaudited)
The Form1099-DIV you receive in February 2020 will show the tax status of all distributions paid to your account in calendar year 2019. Shareholders are advised to consult their own tax adviser with respect to the tax consequences of their investment in the Fund. As required by the Internal Revenue Code and/or regulations, shareholders must be notified regarding the status of exempt-interest dividends.
Exempt-Interest Dividends. For the fiscal year ended July 31, 2019, the Fund designates 88.62% of distributions from net investment income as an exempt-interest dividend.
Eaton Vance
Municipal Opportunities Fund
July 31, 2019
Board of Trustees’ Contract Approval
Overview of the Contract Review Process
The Investment Company Act of 1940, as amended (the “1940 Act”), provides, in substance, that the investment advisory agreement between a fund and its investment adviser will continue in effect fromyear-to-year only if its continuation is approved on an annual basis by a vote of the fund’s board of trustees, including a majority of the trustees who are not “interested persons” of the fund (“independent trustees”), cast in person at a meeting called for the purpose of considering such approval.
At a meeting held on April 24, 2019, the Boards of Trustees/Directors (collectively, the “Board”) of the registered investment companies advised by Eaton Vance Management or its affiliate, Boston Management and Research (the “Eaton Vance Funds”), including a majority of the independent trustees (the “Independent Trustees”), voted to approve the continuation of existing investment advisory andsub-advisory agreements for each of the Eaton Vance Funds for an additionalone-year period. In voting its approval, the Board relied upon the affirmative recommendation of its Contract Review Committee, which is a committee exclusively comprised of Independent Trustees. Prior to making its recommendation, the Contract Review Committee reviewed information furnished by the adviser andsub-adviser (where applicable) to each of the Eaton Vance Funds (including information specifically requested by the Board) for a series of meetings held between February and April 2019. Members of the Contract Review Committee also considered information received at prior meetings of the Board and its committees, to the extent such information was relevant to the Contract Review Committee’s annual evaluation of the investment advisory andsub-advisory agreements.
Among other things, the information the Board considered included the following (for funds that invest through one or more underlying portfolios, references to “each fund” in this section may include information that was considered at the portfolio-level):
Information about Fees, Performance and Expenses
| | • | | A report from an independent data provider comparing advisory and related fees paid by each fund to such fees paid by comparable funds, as identified by the independent data provider (“comparable funds”); |
| | • | | A report from an independent data provider comparing each fund’s total expense ratio (and its components) to those of comparable funds; |
| | • | | A report from an independent data provider comparing the investment performance of each fund (including, where relevant, yield data, Sharpe ratios and information ratios) to the investment performance of comparable funds over various time periods; |
| | • | | Data regarding investment performance relative to benchmark indices and, in certain instances, to customized groups of peer funds and blended indices identified by the adviser in consultation with the Portfolio Management Committee of the Board; |
| | • | | Comparative information concerning the fees charged and services provided by the adviser andsub-adviser (where applicable) to each fund in managing other accounts (including mutual funds, other collective investment funds and institutional accounts) using investment strategies and techniques similar to those used in managing such fund(s), if any; |
| | • | | Profitability analyses with respect to the adviser andsub-adviser (where applicable) to each of the funds; |
Information about Portfolio Management and Trading
| | • | | Descriptions of the investment management services provided to each fund, as well as each of the funds’ investment strategies and policies; |
| | • | | The procedures and processes used to determine the fair value of fund assets, when necessary, and actions taken to monitor and test the effectiveness of such procedures and processes; |
| | • | | Information about the policies and practices of each fund’s adviser andsub-adviser (where applicable and in the context of asub-adviser with trading responsibilities) with respect to trading, including their processes for seeking best execution of portfolio transactions; |
| | • | | Information about the allocation of brokerage transactions and the benefits, if any, received by the adviser andsub-adviser (where applicable and in the context of asub-adviser with trading responsibilities) to each fund as a result of brokerage allocation, including information concerning the acquisition of research through client commission arrangements and policies with respect to “soft dollars”; |
| | • | | Data relating to the portfolio turnover rate of each fund; |
Information about each Adviser andSub-adviser
| | • | | Reports detailing the financial results and condition of the adviser andsub-adviser (where applicable) to each fund; |
| | • | | Information regarding the individual investment professionals whose responsibilities include portfolio management and investment research for the funds, and, for portfolio managers and certain other investment professionals, information relating to their responsibilities with respect to managing other mutual funds and investment accounts, if applicable; |
| | • | | The Code of Ethics of the adviser and its affiliates and thesub-adviser (where applicable) of each fund, together with information relating to compliance with, and the administration of, such codes; |
| | • | | Policies and procedures relating to proxy voting and the handling of corporate actions and class actions; |
| | • | | Information concerning the resources devoted to compliance efforts undertaken by the adviser and its affiliates and thesub-adviser (where applicable) of each fund, if any, including descriptions of their various compliance programs and their record of compliance; |
| | • | | Information concerning the business continuity and disaster recovery plans of the adviser and its affiliates and thesub-adviser (where applicable) of each fund, if any; |
Eaton Vance
Municipal Opportunities Fund
July 31, 2019
Board of Trustees’ Contract Approval — continued
| | • | | A description of Eaton Vance Management’s and Boston Management and Research’s oversight ofsub-advisers, including with respect to regulatory and compliance issues, investment management and other matters; |
Other Relevant Information
| | • | | Information concerning the nature, cost and character of the administrative and othernon-investment advisory services provided by Eaton Vance Management and its affiliates; |
| | • | | Information concerning management of the relationship with the custodian, subcustodians and fund accountants by the adviser or administrator to each of the funds; and |
| �� | • | | The terms of each investment advisory agreement. |
During the various meetings of the Board and its committees throughout the twelve months ended April 2019, the Trustees received information from portfolio managers and other investment professionals of the advisers andsub-advisers (where applicable) of the funds regarding investment and performance matters, and considered various investment and trading strategies used in pursuing the funds’ investment objectives. The Trustees also received information regarding risk management techniques employed in connection with the management of the funds. The Board and its Committees evaluated issues pertaining to industry and regulatory developments, compliance procedures, fund governance and other issues with respect to the funds, and received and participated in reports and presentations provided by Eaton Vance Management, Boston Management and Research and fundsub-advisers (as applicable), with respect to such matters. In addition to the formal meetings of the Board and its committees, the Independent Trustees held regular teleconferences to discuss, among other topics, matters relating to the continuation of investment advisory andsub-advisory agreements.
The Contract Review Committee was advised throughout the contract review process by Goodwin Procter LLP, independent legal counsel for the Independent Trustees. The members of the Contract Review Committee, with the advice of such counsel, exercised their own business judgment in determining the material factors to be considered in evaluating each investment advisory andsub-advisory agreement and the weight to be given to each such factor. The conclusions reached with respect to each investment advisory andsub-advisory agreement were based on a comprehensive evaluation of all the information provided and not any single factor. Moreover, each member of the Contract Review Committee may have placed varying emphasis on particular factors in reaching conclusions with respect to each investment advisory andsub-advisory agreement. In evaluating each investment advisory andsub-advisory agreement, including the fee structures and other terms contained in such agreements, the members of the Contract Review Committee were also informed by multiple years of analysis and discussion with the adviser andsub-adviser (where applicable) to each of the Eaton Vance Funds.
Results of the Process
Based on its consideration of the foregoing, and such other information as it deemed relevant, including the factors and conclusions described below, the Contract Review Committee concluded that the continuation of the investment advisory and administrative agreement between Eaton Vance Municipal Opportunities Fund (the “Fund”) and Eaton Vance Management (the “Adviser”), including its fee structure, is in the interests of shareholders and, therefore, recommended to the Board approval of the agreement. Based on the recommendation of the Contract Review Committee, the Board, including a majority of the Independent Trustees, voted to approve continuation of the investment advisory and administrative agreement for the Fund.
Nature, Extent and Quality of Services
In considering whether to approve the investment advisory and administrative agreement for the Fund, the Board evaluated the nature, extent and quality of services provided to the Fund by the Adviser.
The Board considered the Adviser’s management capabilities and investment processes in light of the types of investments held by the Fund, including the education, experience and number of investment professionals and other personnel who provide portfolio management, investment research, and similar services to the Fund. In particular, the Board considered, where relevant, the abilities and experience of the Adviser’s investment professionals in analyzing factors relevant to investing in municipal bonds, Treasury securities and other securities backed by the U.S. government or its agencies. The Board considered the Adviser’s municipal bond team, which includes investment professionals and credit specialists who provide services to the Fund. The Board also took into account the resources dedicated to portfolio management and other services, the compensation methods of the Adviser and other factors, including the reputation and resources of the Adviser to recruit and retain highly qualified research, advisory and supervisory investment professionals. In addition, the Board considered the time and attention devoted to the Eaton Vance Funds, including the Fund, by senior management, as well as the infrastructure, operational capabilities and support staff in place to assist in the portfolio management and operations of the Fund, including the provision of administrative services. The Board also considered the business-related and other risks to which the Adviser or its affiliates may be subject in managing the Fund.
The Board considered the compliance programs of the Adviser and relevant affiliates thereof. The Board considered compliance and reporting matters regarding, among other things, personal trading by investment professionals, disclosure of portfolio holdings, late trading, frequent trading, portfolio valuation, business continuity and the allocation of investment opportunities. The Board also considered the responses of the Adviser and its affiliates to requests in recent years from regulatory authorities, such as the Securities and Exchange Commission and the Financial Industry Regulatory Authority.
Eaton Vance
Municipal Opportunities Fund
July 31, 2019
Board of Trustees’ Contract Approval — continued
The Board considered shareholder and other administrative services provided or managed by Eaton Vance Management and its affiliates, including transfer agency and accounting services. The Board evaluated the benefits to shareholders of investing in a fund that is a part of a large fund complex offering exposure to a variety of asset classes and investment disciplines, as well as the ability, in many cases, to exchange an investment among different funds without incurring additional sales charges.
After consideration of the foregoing factors, among others, the Board concluded that the nature, extent and quality of services provided by the Adviser, taken as a whole, are appropriate and consistent with the terms of the investment advisory and administrative agreement.
Fund Performance
The Board compared the Fund’s investment performance to that of comparable funds and appropriate benchmark indices. The Board’s review included comparative performance data with respect to the Fund for theone-, three- and five-year periods ended September 30, 2018. In this regard, the Board noted that the performance of the Fund was higher than the median performance of the Fund’s peer group for the three-year period. The Board also noted that the performance of the Fund was higher than its benchmark index for the three-year period. The Board concluded that the performance of the Fund was satisfactory.
Management Fees and Expenses
The Board considered contractual fee rates payable by the Fund for advisory and administrative services (referred to collectively as “management fees”). As part of its review, the Board considered the Fund’s management fees and total expense ratio for theone-year period ended September 30, 2018, as compared to those of comparable funds, before and after giving effect to any undertaking to waive fees or reimburse expenses. The Board also considered certain Fund specific factors that had an impact on the Fund’s total expense ratio relative to comparable funds, as identified by management in response to inquiries from the Contract Review Committee.
After considering the foregoing information, and in light of the nature, extent and quality of the services provided by the Adviser, the Board concluded that the management fees charged for advisoryand related services are reasonable.
Profitability and“Fall-Out” Benefits
The Board considered the level of profits realized by the Adviser and relevant affiliates thereof in providing investment advisory and administrative services to the Fund and to all Eaton Vance Funds as a group. The Board considered the level of profits realized without regard to marketing support or other payments by the Adviser and its affiliates to third parties in respect of distribution services.
The Board concluded that, in light of the foregoing factors and the nature, extent and quality of the services rendered, the profits realized by the Adviser and its affiliates are deemed not to be excessive.
The Board also considered direct or indirectfall-out benefits received by the Adviser and its affiliates in connection with their respective relationships with the Fund, including the benefits of research services that may be available to the Adviser as a result of securities transactions effected for the Fund and other investment advisory clients.
Economies of Scale
In reviewing management fees and profitability, the Board also considered the extent to which the Adviser and its affiliates, on the one hand, and the Fund, on the other hand, can expect to realize benefits from economies of scale as the assets of the Fund increase. The Board acknowledged the difficulty in accurately measuring the benefits resulting from economies of scale, if any, with respect to the management of any specific fund or group of funds. The Board reviewed data summarizing the increases and decreases in the assets of the Fund and of all Eaton Vance Funds as a group over various time periods, and evaluated the extent to which the total expense ratio of the Fund and the profitability of the Adviser and its affiliates may have been affected by such increases or decreases. Based upon the foregoing, the Board concluded that the Fund currently shares in the benefits from economies of scale, if any, when they are realized by the Adviser. The Board also concluded that the structure of the advisory fee, which includes breakpoints at several asset levels, will allow the Fund to continue to benefit from any economies of scale in the future.
Eaton Vance
Municipal Opportunities Fund
July 31, 2019
Management and Organization
Fund Management. The Trustees of Eaton Vance Municipals Trust (the Trust) are responsible for the overall management and supervision of the Trust’s affairs. The Trustees and officers of the Trust are listed below. Except as indicated, each individual has held the office shown or other offices in the same company for the last five years. Trustees and officers of the Trust hold indefinite terms of office. The “Noninterested Trustees” consist of those Trustees who are not “interested persons” of the Trust, as that term is defined under the 1940 Act. The business address of each Trustee and officer is Two International Place, Boston, Massachusetts 02110. As used below, “EVC” refers to Eaton Vance Corp., “EV” refers to Eaton Vance, Inc., “EVM” refers to Eaton Vance Management, “BMR” refers to Boston Management and Research and “EVD” refers to Eaton Vance Distributors, Inc. EVC and EV are the corporate parent and trustee, respectively, of EVM and BMR. EVD is the Fund’s principal underwriter and a wholly-owned subsidiary of EVC. Each officer affiliated with Eaton Vance may hold a position with other Eaton Vance affiliates that is comparable to his or her position with EVM listed below. Each Trustee oversees 165 portfolios in the Eaton Vance Complex (including all master and feeder funds in a master feeder structure). Each officer serves as an officer of certain other Eaton Vance funds. Each Trustee and officer serve until his or her successor is elected.
| | | | | | |
| Name and Year of Birth | | Trust
Position(s) | | Trustee Since(1) | | Principal Occupation(s) and Other Directorships During Past Five Years and Other Relevant Experience |
| | | |
| Interested Trustee | | | | | | |
| | | |
Thomas E. Faust Jr. 1958 | | Trustee | | 2007 | | Chairman, Chief Executive Officer and President of EVC, Director and President of EV, Chief Executive Officer and President of EVM and BMR, and Director of EVD. Trustee and/or officer of 165 registered investment companies. Mr. Faust is an interested person because of his positions with EVM, BMR, EVD, EVC and EV, which are affiliates of the Trust. Other Directorships in the Last Five Years.(2)Director of EVC and Hexavest Inc. (investment management firm). |
| | |
| Noninterested Trustees | | | | |
| | | |
Mark R. Fetting 1954 | | Trustee | | 2016 | | Private investor. Formerly held various positions at Legg Mason, Inc. (investment management firm) (2000-2012), including President, Chief Executive Officer, Director and Chairman (2008-2012), Senior Executive Vice President (2004-2008) and Executive Vice President (2001-2004). Formerly, President of Legg Mason family of funds (2001-2008). Formerly, Division President and Senior Officer of Prudential Financial Group, Inc. and related companies (investment management firm)(1991-2000). Other Directorships in the Last Five Years. None. |
| | | |
Cynthia E. Frost 1961 | | Trustee | | 2014 | | Private investor. Formerly, Chief Investment Officer of Brown University (university endowment) (2000-2012). Formerly, Portfolio Strategist for Duke Management Company (university endowment manager) (1995-2000). Formerly, Managing Director, Cambridge Associates (investment consulting company) (1989-1995). Formerly, Consultant, Bain and Company (management consulting firm) (1987-1989). Formerly, Senior Equity Analyst, BA Investment Management Company (1983-1985). Other Directorships in the Last Five Years.None. |
| | | |
George J. Gorman 1952 | | Trustee | | 2014 | | Principal at George J. Gorman LLC (consulting firm). Formerly, Senior Partner at Ernst & Young LLP (a registered public accounting firm) (1974-2009). Other Directorships in the Last Five Years.Formerly, Trustee of the BofA Funds Series Trust (11 funds) (2011-2014) and of the Ashmore Funds (9 funds) (2010-2014). |
| | | |
Valerie A. Mosley 1960 | | Trustee | | 2014 | | Chairwoman and Chief Executive Officer of Valmo Ventures (a consulting and investment firm). Former Partner and Senior Vice President, Portfolio Manager and Investment Strategist at Wellington Management Company, LLP (investment management firm) (1992-2012). Former Chief Investment Officer, PG Corbin Asset Management (1990-1992). Formerly worked in institutional corporate bond sales at Kidder Peabody (1986-1990). Other Directorships in the Last Five Years.(2)Director of Envestnet, Inc. (provider of intelligent systems for wealth management and financial wellness) (since 2018). Director of Dynex Capital, Inc. (mortgage REIT) (since 2013). |
| | | |
William H. Park 1947 | | Chairperson of the Board and Trustee | | 2016
(Chairperson)
and 2003
(Trustee) | | Private investor. Formerly, Consultant (management and transactional) (2012-2014). Formerly, Chief Financial Officer, Aveon Group L.P. (investment management firm) (2010-2011). Formerly, Vice Chairman, Commercial Industrial Finance Corp. (specialty finance company) (2006-2010). Formerly, President and Chief Executive Officer, Prizm Capital Management, LLC (investment management firm) (2002-2005). Formerly, Executive Vice President and Chief Financial Officer, United Asset Management Corporation (investment management firm) (1982-2001). Formerly, Senior Manager, Price Waterhouse (now PricewaterhouseCoopers) (a registered public accounting firm) (1972-1981). Other Directorships in the Last Five Years.(2)None. |
Eaton Vance
Municipal Opportunities Fund
July 31, 2019
Management and Organization — continued
| | | | | | |
| Name and Year of Birth | | Trust
Position(s) | | Trustee Since(1) | | Principal Occupation(s) and Other Directorships During Past Five Years and Other Relevant Experience |
| | |
| Noninterested Trustees (continued) | | | | |
| | | |
Helen Frame Peters 1948 | | Trustee | | 2008 | | Professor of Finance, Carroll School of Management, Boston College. Formerly, Dean, Carroll School of Management, Boston College (2000-2002). Formerly, Chief Investment Officer, Fixed Income, Scudder Kemper Investments (investment management firm) (1998-1999). Formerly, Chief Investment Officer, Equity and Fixed Income, Colonial Management Associates (investment management firm) (1991-1998). Other Directorships in the Last Five Years.(2) None. |
| | | |
Keith Quinton(3) 1958 | | Trustee | | 2018 | | Independent Investment Committee Member at New Hampshire Retirement System (since 2017). Advisory Committee member at Northfield Information Services, Inc. (risk management analytics provider) (since 2016). Formerly, Portfolio Manager and Senior Quantitative Analyst at Fidelity Investments (investment management firm) (2001-2014). Other Directorships in the Last Five Years. Director of New Hampshire Municipal Bond Bank (since 2016). |
| | | |
Marcus L. Smith(3) 1966 | | Trustee | | 2018 | | Member of Posse Boston Advisory Board (foundation) (since 2015). Trustee at University of Mount Union (since 2008). Formerly, Portfolio Manager at MFS Investment Management (investment management firm) (1994-2017). Other Directorships in the Last Five Years. Director of MSCI Inc. (global provider of investment decision support tools) (since 2017). Formerly, Director of DCT Industrial Trust Inc. (logistics real estate company) (2017-2018). |
| | | |
Susan J. Sutherland 1957 | | Trustee | | 2015 | | Private investor. Formerly, Associate, Counsel and Partner at Skadden, Arps, Slate, Meagher & Flom LLP (law firm) (1982-2013). Other Directorships in the Last Five Years. Formerly, Director of Montpelier Re Holdings Ltd. (global provider of customized insurance and reinsurance products) (2013-2015). |
| | | |
Scott E. Wennerholm 1959 | | Trustee | | 2016 | | Formerly, Trustee at Wheelock College (postsecondary institution) (2012-2018). Formerly, Consultant at GF Parish Group (executive recruiting firm) (2016-2017). Formerly, Chief Operating Officer and Executive Vice President at BNY Mellon Asset Management (investment management firm) (2005-2011). Formerly, Chief Operating Officer and Chief Financial Officer at Natixis Global Asset Management (investment management firm) (1997-2004). Formerly, Vice President at Fidelity Investments Institutional Services (investment management firm) (1994-1997). Other Directorships in the Last Five Years. None. |
| | | | | | |
| Name and Year of Birth | | Trust Position(s) | | Officer
Since(4) | | Principal Occupation(s) During Past Five Years |
| |
| Principal Officers who are not Trustees | | |
| | | |
Payson F. Swaffield 1956 | | President | | 2003 | | Vice President and Chief Income Investment Officer of EVM and BMR. Also Vice President of Calvert Research and Management (“CRM”) since 2016. |
| | | |
Maureen A. Gemma 1960 | | Vice President, Secretary and Chief Legal Officer | | 2005 | | Vice President of EVM and BMR. Also Vice President of CRM since 2016. |
| | | |
James F. Kirchner 1967 | | Treasurer | | 2007 | | Vice President of EVM and BMR. Also Vice President of CRM since 2016. |
| | | |
Richard F. Froio 1968 | | Chief Compliance Officer | | 2017 | | Vice President of EVM and BMR since 2017. Formerly Deputy Chief Compliance Officer (Adviser/Funds) and Chief Compliance Officer (Distribution) at PIMCO (2012-2017) and Managing Director at BlackRock/Barclays Global Investors (2009-2012). |
| (1) | Year first appointed to serve as Trustee for a fund in the Eaton Vance family of funds. Each Trustee has served continuously since appointment unless indicated otherwise. |
| (2) | During their respective tenures, the Trustees (except for Mmes. Frost and Sutherland and Messrs. Fetting, Gorman, Quinton, Smith and Wennerholm) also served as Board members of one or more of the following funds (which operated in the years noted): eUnitsTM 2 Year U.S. Market Participation Trust: Upside to Cap / Buffered Downside (launched in 2012 and terminated in 2014); and eUnitsTM 2 Year U.S. Market Participation Trust II: Upside to Cap / Buffered Downside (launched in 2012 and terminated in 2014). However, Ms. Mosley did not serve as a Board member of eUnitsTM 2 Year U.S. Market Participation Trust: Upside to Cap / Buffered Downside (launched in 2012 and terminated in 2014). |
| (3) | Messrs. Quinton and Smith began serving as Trustees effective October 1, 2018. |
| (4) | Year first elected to serve as officer of a fund in the Eaton Vance family of funds when the officer has served continuously. Otherwise, year of most recent election as an officer of a fund in the Eaton Vance family of funds. Titles may have changed since initial election. |
The SAI for the Fund includes additional information about the Trustees and officers of the Fund and can be obtained without charge on Eaton Vance’s website at www.eatonvance.com or by calling1-800-262-1122.
Eaton Vance Funds
IMPORTANT NOTICES
Privacy. The Eaton Vance organization is committed to ensuring your financial privacy. Each of the financial institutions identified below has in effect the following policy (“Privacy Policy”) with respect to nonpublic personal information about its customers:
| • | | Only such information received from you, through application forms or otherwise, and information about your Eaton Vance fund transactions will be collected. This may include information such as name, address, social security number, tax status, account balances and transactions. |
| • | | None of such information about you (or former customers) will be disclosed to anyone, except as permitted by law (which includes disclosure to employees necessary to service your account). In the normal course of servicing a customer’s account, Eaton Vance may share information with unaffiliated third parties that perform various required services such as transfer agents, custodians and broker-dealers. |
| • | | Policies and procedures (including physical, electronic and procedural safeguards) are in place that are designed to protect the confidentiality of such information. |
| • | | We reserve the right to change our Privacy Policy at any time upon proper notification to you. Customers may want to review our Privacy Policy periodically for changes by accessing the link on our homepage: www.eatonvance.com. |
Our pledge of privacy applies to the following entities within the Eaton Vance organization: the Eaton Vance Family of Funds, Eaton Vance Management, Eaton Vance Investment Counsel, Eaton Vance Distributors, Inc., Eaton Vance Trust Company, Eaton Vance Management (International) Limited, Eaton Vance Advisers International Ltd., Eaton Vance Management’s Real Estate Investment Group and Boston Management and Research. In addition, our Privacy Policy applies only to those Eaton Vance customers who are individuals and who have a direct relationship with us. If a customer’s account (i.e., fund shares) is held in the name of a third-party financial advisor/broker-dealer, it is likely that only such advisor’s privacy policies apply to the customer. This notice supersedes all previously issued privacy disclosures. For more information about Eaton Vance’s Privacy Policy, please call1-800-262-1122.
Delivery of Shareholder Documents. The Securities and Exchange Commission (SEC) permits funds to deliver only one copy of shareholder documents, including prospectuses, proxy statements and shareholder reports, to fund investors with multiple accounts at the same residential or post office box address. This practice is often called “householding” and it helps eliminate duplicate mailings to shareholders.Eaton Vance, or your financial intermediary, may household the mailing of your documents indefinitely unless you instruct Eaton Vance, or your financial intermediary, otherwise.If you would prefer that your Eaton Vance documents not be householded, please contact Eaton Vance at1-800-262-1122, or contact your financial intermediary. Your instructions that householding not apply to delivery of your Eaton Vance documents will typically be effective within 30 days of receipt by Eaton Vance or your financial intermediary.
Portfolio Holdings. Each Eaton Vance Fund and its underlying Portfolio(s) (if applicable) files a schedule of portfolio holdings on Part F toForm N-PORT with the SEC for the first and third quarters of each fiscal year. The FormN-PORT will be available on the Eaton Vance website at www.eatonvance.com, by calling Eaton Vance at1-800-262-1122 or in the EDGAR database on the SEC’s website at www.sec.gov.
Proxy Voting. From time to time, funds are required to vote proxies related to the securities held by the funds. The Eaton Vance Funds or their underlying Portfolios (if applicable) vote proxies according to a set of policies and procedures approved by the Funds’ and Portfolios’ Boards. You may obtain a description of these policies and procedures and information on how the Funds or Portfolios voted proxies relating to portfolio securities during the most recent12-month period ended June 30, without charge, upon request, by calling1-800-262-1122 and by accessing the SEC’s website at www.sec.gov.
This Page Intentionally Left Blank
This Page Intentionally Left Blank
Investment Adviser and Administrator
Eaton Vance Management
Two International Place
Boston, MA 02110
Principal Underwriter*
Eaton Vance Distributors, Inc.
Two International Place
Boston, MA 02110
(617)482-8260
Custodian
State Street Bank and Trust Company
State Street Financial Center, One Lincoln Street
Boston, MA 02111
Transfer Agent
BNY Mellon Investment Servicing (US) Inc.
Attn: Eaton Vance Funds
P.O. Box 9653
Providence, RI 02940-9653
(800)262-1122
Independent Registered Public Accounting Firm
Deloitte & Touche LLP
200 Berkeley Street
Boston, MA 02116-5022
Fund Offices
Two International Place
Boston, MA 02110
| * | FINRA BrokerCheck. Investors may check the background of their Investment Professional by contacting the Financial Industry Regulatory Authority (FINRA). FINRA BrokerCheck is a free tool to help investors check the professional background of current and former FINRA-registered securities firms and brokers. FINRA BrokerCheck is available by calling1-800-289-9999 and at www.FINRA.org. The FINRA BrokerCheck brochure describing this program is available to investors at www.FINRA.org. |

5279 7.31.19
Item 2. Code of Ethics
The registrant has adopted a code of ethics applicable to its Principal Executive Officer, Principal Financial Officer and Principal Accounting Officer. The registrant undertakes to provide a copy of such code of ethics to any person upon request, without charge, by calling1-800-262-1122. The registrant has not amended the code of ethics as described in FormN-CSR during the period covered by this report. The registrant has not granted any waiver, including an implicit waiver, from a provision of the code of ethics as described in FormN-CSR during the period covered by this report.
Item 3. Audit Committee Financial Expert
The registrant’s Board has designated George J. Gorman and William H. Park, each an independent trustee, as audit committee financial experts. Mr. Gorman is a certified public accountant who is the Principal at George J. Gorman LLC (a consulting firm). Previously, Mr. Gorman served in various capacities at Ernst & Young LLP (a registered public accounting firm), including as Senior Partner. Mr. Gorman also has experience serving as an independent trustee and audit committee financial expert of other mutual fund complexes. Mr. Park is a certified public accountant who is a private investor. Previously, he served as a consultant, as the Chief Financial Officer of Aveon Group, L.P. (an investment management firm), as the Vice Chairman of Commercial Industrial Finance Corp. (specialty finance company), as President and Chief Executive Officer of Prizm Capital Management, LLC (investment management firm), as Executive Vice President and Chief Financial Officer of United Asset Management Corporation (an institutional investment management firm) and as a Senior Manager at Price Waterhouse (now PricewaterhouseCoopers) (a registered public accounting firm).
Item 4. Principal Accountant Fees and Services
Eaton Vance Arizona Municipal Income Fund, Eaton Vance Connecticut Municipal Income Fund, Eaton Vance Minnesota Municipal Income Fund, Eaton Vance Municipal Opportunities Fund, Eaton Vance New Jersey Municipal Income Fund and Eaton Vance Pennsylvania Municipal Income Fund (the “Fund(s)”) are series of Eaton Vance Municipals Trust (the “Trust”), a Massachusetts business trust, which, including the Funds, contains a total of 18 series (the “Series”). The Trust is registered under the Investment Company Act of 1940 as anopen-end management investment company. This FormN-CSR relates to the Funds’ annual reports.
(a)-(d)
The following tables represent the aggregate fees billed to each Fund for the Funds’ fiscal years ended July 31, 2018 and July 31, 2019 by the registrant’s principal accountant, Deloitte & Touche LLP (“D&T”), for professional services rendered for the audit of the Funds’ annual financial statements and fees billed for other services rendered by D&T during those periods.
Eaton Vance Arizona Municipal Income Fund
| | | | | | | | |
Fiscal Years Ended | | 7/31/2018 | | | 7/31/2019 | |
Audit Fees | | $ | 34,345 | | | $ | 36,050 | |
Audit-Related Fees(1) | | $ | 0 | | | $ | 0 | |
Tax Fees(2) | | $ | 9,736 | | | $ | 9,282 | |
All Other Fees(3) | | $ | 0 | | | $ | 0 | |
| | | | | | | | |
Total | | $ | 44,081 | | | $ | 45,332 | |
| | | | | | | | |
Eaton Vance Connecticut Municipal Income Fund
| | | | | | | | |
Fiscal Years Ended | | 7/31/2018 | | | 7/31/2019 | |
Audit Fees | | $ | 34,890 | | | $ | 36,350 | |
Audit-Related Fees(1) | | $ | 0 | | | $ | 0 | |
Tax Fees(2) | | $ | 9,841 | | | $ | 9,389 | |
All Other Fees(3) | | $ | 0 | | | $ | 0 | |
| | | | | | | | |
Total | | $ | 44,731 | | | $ | 45,739 | |
| | | | | | | | |
Eaton Vance Minnesota Municipal Income Fund
| | | | | | | | |
Fiscal Years Ended | | 7/31/2018 | | | 7/31/2019 | |
Audit Fees | | $ | 34,600 | | | $ | 38,100 | |
Audit-Related Fees(1) | | $ | 0 | | | $ | 0 | |
Tax Fees(2) | | $ | 8,964 | | | $ | 8,498 | |
All Other Fees(3) | | $ | 0 | | | $ | 0 | |
| | | | | | | | |
Total | | $ | 43,564 | | | $ | 46,598 | |
| | | | | | | | |
Eaton Vance Municipal Opportunities Fund
| | | | | | | | |
Fiscal Years Ended | | 7/31/2018 | | | 7/31/2019 | |
Audit Fees | | $ | 45,320 | | | $ | 46,525 | |
Audit-Related Fees(1) | | $ | 0 | | | $ | 0 | |
Tax Fees(2) | | $ | 9,365 | | | $ | 8,905 | |
All Other Fees(3) | | $ | 0 | | | $ | 0 | |
| | | | | | | | |
Total | | $ | 54,685 | | | $ | 55,430 | |
| | | | | | | | |
Eaton Vance New Jersey Municipal Income Fund
| | | | | | | | |
Fiscal Years Ended | | 7/31/2018 | | | 7/31/2019 | |
Audit Fees | | $ | 49,710 | | | $ | 51,375 | |
Audit-Related Fees(1) | | $ | 0 | | | $ | 0 | |
Tax Fees(2) | | $ | 10,443 | | | $ | 10,000 | |
All Other Fees(3) | | $ | 0 | | | $ | 0 | |
| | | | | | | | |
Total | | $ | 60,153 | | | $ | 61,375 | |
| | | | | | | | |
Eaton Vance Pennsylvania Municipal Income Fund
| | | | | | | | |
Fiscal Years Ended | | 7/31/2018 | | | 7/31/2019 | |
Audit Fees | | $ | 55,670 | | | $ | 50,300 | |
Audit-Related Fees(1) | | $ | 0 | | | $ | 0 | |
Tax Fees(2) | | $ | 11,319 | | | $ | 10,889 | |
All Other Fees(3) | | $ | 0 | | | $ | 0 | |
| | | | | | | | |
Total | | $ | 66,989 | | | $ | 61,189 | |
| | | | | | | | |
| (1) | Audit-related fees consist of the aggregate fees billed for assurance and related services that are reasonably related to the performance of the audit of the registrant’s financial statements and are not reported under the category of audit fees. |
| (2) | Tax fees consist of the aggregate fees billed for professional services rendered by the principal accountant relating to tax compliance, tax advice, and tax planning and specifically include fees for tax return preparation and other related tax compliance/planning matters. |
| (3) | All other fees consist of the aggregate fees billed for products and services provided by the principal accountant other than audit, audit-related, and tax services. |
The Series comprising the Trust have varying fiscal year ends (July 31, August 31, and September 30). The following table presents the aggregate audit, audit-related, tax, and other fees billed to all of the Series in the Trust by D&T, for the last two fiscal years of each Series.
| | | | | | | | | | | | | | | | | | | | | | | | |
Fiscal Years Ended | | 8/31/17 | | | 9/30/17 | | | 7/31/18 | | | 8/31/18 | | | 9/30/18 | | | 7/31/19 | |
Audit Fees | | $ | 253,910 | | | $ | 287,510 | | | $ | 254,535 | | | $ | 256,285 | | | $ | 289,136 | | | $ | 258,700 | |
Audit-Related Fees(1) | | $ | 0 | | | $ | 0 | | | $ | 0 | | | $ | 0 | | | $ | 0 | | | $ | 0 | |
Tax Fees(2) | | $ | 72,584 | | | $ | 66,534 | | | $ | 59,668 | | | $ | 72,584 | | | $ | 66,534 | | | $ | 56,963 | |
All Other Fees(3) | | $ | 0 | | | $ | 0 | | | $ | 0 | | | $ | 0 | | | $ | 0 | | | $ | 0 | |
| | | | | | | | | | | | | | | | | | | | | | | | |
Total | | $ | 326,494 | | | $ | 354,044 | | | $ | 314,203 | | | $ | 328,869 | | | $ | 355,670 | | | $ | 315,663 | |
| | | | | | | | | | | | | | | | | | | | | | | | |
| (1) | Audit-related fees consist of the aggregate fees billed for assurance and related services that are reasonable related to the performance of the audit of the registrant’s financial statements and are not reported under the category of audit fees. Includes consent fee forN-14 registration statements related to fund mergers. |
| (2) | Tax fees consist of the aggregate fees billed for professional services rendered by the principal accountant relating to tax compliance, tax advice, and tax planning and specifically include fees for tax return preparation and other related tax compliance/planning matters. |
| (3) | All other fees consist of the aggregate fees billed for products and services provided by the principal accountant other than audit, audit-related, and tax services. |
(e)(1) The registrant’s audit committee has adopted policies and procedures relating to thepre-approval of services provided by the registrant’s principal accountant (the“Pre-Approval Policies”). ThePre-Approval Policies establish a framework intended to assist the audit committee in the proper discharge of itspre-approval responsibilities. As a general matter, thePre-Approval Policies (i) specify certain types of audit, audit-related, tax, and other services determined to bepre-approved by the audit committee; and (ii) delineate specific procedures governing the mechanics of thepre-approval process, including the approval and monitoring of audit andnon-audit service fees. Unless a service is specificallypre-approved under thePre-Approval Policies, it must be separatelypre-approved by the audit committee.
ThePre-Approval Policies and the types of audit andnon-audit servicespre-approved therein must be reviewed and ratified by the registrant’s audit committee at least annually. The registrant’s audit committee maintains full responsibility for the appointment, compensation, and oversight of the work of the registrant’s principal accountant.
(e)(2) No services described in paragraphs (b)-(d) above were approved by the registrant’s audit committee pursuant to the “de minimis exception” set forth in Rule2-01 (c)(7)(i)(C) of RegulationS-X.
(f) Not applicable.
(g) The following table presents (i) the aggregatenon-audit fees (i.e., fees for audit-related, tax, and other services) billed for services rendered to all of the Series in the Trust by D&T for the last two fiscal years of each Series; and (ii) the aggregatenon-audit fees (i.e., fees for audit-related, tax, and other services) billed for services rendered to the Eaton Vance organization by D&T for the same time period.
| | | | | | | | | | | | | | | | | | | | | | | | |
Fiscal Years Ended | | 8/31/17 | | | 9/30/17 | | | 7/31/18 | | | 8/31/18 | | | 9/30/18 | | | 7/31/19 | |
Registrant(1) | | $ | 72,584 | | | $ | 66,534 | | | $ | 59,668 | | | $ | 72,584 | | | $ | 66,534 | | | $ | 56,963 | |
Eaton Vance(2) | | $ | 148,018 | | | $ | 148,018 | | | $ | 51,855 | | | $ | 74,355 | | | $ | 126,485 | | | $ | 60,130 | |
| (1) | Includes all of the Series in the Trust. |
| (2) | The investment adviser to the Series, as well as any of its affiliates that provide ongoing services to the Series, are subsidiaries of Eaton Vance Corp. |
(h) The registrant’s audit committee has considered whether the provision by the registrant’s principal accountant ofnon-audit services to the registrant’s investment adviser and any entity controlling, controlled by,
or under common control with the adviser that provides ongoing services to the registrant that were notpre-approved pursuant to Rule2-01(c)(7)(ii) of RegulationS-X is compatible with maintaining the principal accountant’s independence.
Item 5. Audit Committee of Listed Registrants
Not applicable.
Item 6. Schedule of Investments
Please see schedule of investments contained in the Report to Stockholders included under Item 1 of this FormN-CSR.
Item 7. Disclosure of Proxy Voting Policies and Procedures forClosed-End Management Investment Companies
Not applicable.
Item 8. Portfolio Managers ofClosed-End Management Investment Companies
Not applicable.
Item 9. Purchases of Equity Securities byClosed-End Management Investment Company and Affiliated Purchasers
Not applicable.
Item 10. Submission of Matters to a Vote of Security Holders
No material changes.
Item 11. Controls and Procedures
(a) It is the conclusion of the registrant’s principal executive officer and principal financial officer that the effectiveness of the registrant’s current disclosure controls and procedures (such disclosure controls and procedures having been evaluated within 90 days of the date of this filing) provide reasonable assurance that the information required to be disclosed by the registrant has been recorded, processed, summarized and reported within the time period specified in the Commission’s rules and forms and that the information required to be disclosed by the registrant has been accumulated and communicated to the registrant’s principal executive officer and principal financial officer in order to allow timely decisions regarding required disclosure.
(b) There have been no changes in the registrant’s internal controls over financial reporting during the period covered by this report that has materially affected, or is reasonably likely to materially affect, the registrant’s internal control over financial reporting.
Item 12. Disclosure of Securities Lending Activities forClosed-End Management Investment Companies
Not applicable.
Item 13. Exhibits
| | |
| |
| (a)(1) | | Registrant’s Code of Ethics – Not applicable (please see Item 2). |
| |
| (a)(2)(i) | | Treasurer’s Section 302 certification. |
| |
| (a)(2)(ii) | | President’s Section 302 certification. |
| |
| (b) | | Combined Section 906 certification. |
Signatures
Pursuant to the requirements of the Securities Exchange Act of 1934 and the Investment Company Act of 1940, the registrant has duly caused this report to be signed on its behalf by the undersigned, thereunto duly authorized.
Eaton Vance Municipals Trust
| | |
| By: | | /s/ Payson F. Swaffield |
| | Payson F. Swaffield |
| | President |
| |
| Date: | | September 25, 2019 |
Pursuant to the requirements of the Securities Exchange Act of 1934 and the Investment Company Act of 1940, this report has been signed below by the following persons on behalf of the registrant and in the capacities and on the dates indicated.
| | |
| By: | | /s/ James F. Kirchner |
| | James F. Kirchner |
| | Treasurer |
| |
| Date: | | September 25, 2019 |
| |
| By: | | /s/ Payson F. Swaffield |
| | Payson F. Swaffield |
| | President |
| |
| Date: | | September 25, 2019 |