UNITED STATES
SECURITIES AND EXCHANGE COMMISSION
Washington, D.C. 20549
Form N-CSR
CERTIFIED SHAREHOLDER REPORT OF REGISTERED
MANAGEMENT INVESTMENT COMPANIES
Investment Company Act File Number: 811-04409
Eaton Vance Municipals Trust
(Exact Name of Registrant as Specified in Charter)
Two International Place, Boston, Massachusetts 02110
(Address of Principal Executive Offices)
Maureen A. Gemma
Two International Place, Boston, Massachusetts 02110
(Name and Address of Agent for Services)
(617) 482-8260
(Registrant’s Telephone Number)
August 31
Date of Fiscal Year End
August 31, 2020
Date of Reporting Period
| Item 1. | Reports to Stockholders |

Eaton Vance
Municipal Income Funds
Annual Report
August 31, 2020
Georgia • Maryland • Missouri • North Carolina • Oregon South Carolina • Virginia
Important Note. Beginning on January 1, 2021, as permitted by regulations adopted by the Securities and Exchange Commission, paper copies of each Fund’s annual and semi-annual shareholder reports will no longer be sent by mail unless you specifically request paper copies of the reports. Instead, the reports will be made available on the Funds’ website (eatonvance.com/funddocuments), and you will be notified by mail each time a report is posted and provided with a website address to access the report.
If you already elected to receive shareholder reports electronically, you will not be affected by this change and you need not take any action. If you are a direct investor, you may elect to receive shareholder reports and other communications from the Funds electronically by signing up for e-Delivery at eatonvance.com/edelivery. If you own your shares through a financial intermediary (such as a broker-dealer or bank), you must contact your financial intermediary to sign up.
You may elect to receive all future Fund shareholder reports in paper free of charge. If you are a direct investor, you can inform the Funds that you wish to continue receiving paper copies of your shareholder reports by calling 1-800-262-1122. If you own these shares through a financial intermediary, you must contact your financial intermediary or follow instructions included with this disclosure, if applicable, to elect to continue to receive paper copies of your shareholder reports. Your election to receive reports in paper will apply to all Eaton Vance funds held directly or to all funds held through your financial intermediary, as applicable.

Commodity Futures Trading Commission Registration. Effective December 31, 2012, the Commodity Futures Trading Commission (“CFTC”) adopted certain regulatory changes that subject registered investment companies and advisers to regulation by the CFTC if a fund invests more than a prescribed level of its assets in certain CFTC-regulated instruments (including futures, certain options and swap agreements) or markets itself as providing investment exposure to such instruments. The investment adviser has claimed an exclusion from the definition of “commodity pool operator” under the Commodity Exchange Act with respect to its management of each Fund. Accordingly, neither the Funds nor the adviser with respect to the operation of the Funds is subject to CFTC regulation. Because of its management of other strategies, the Funds’ adviser is registered with the CFTC as a commodity pool operator. The adviser is also registered as a commodity trading advisor.
Fund shares are not insured by the FDIC and are not deposits or other obligations of, or guaranteed by, any depository institution. Shares are subject to investment risks, including possible loss of principal invested.
This report must be preceded or accompanied by a current summary prospectus or prospectus. Before investing, investors should consider carefully the investment objective, risks, and charges and expenses of a mutual fund. This and other important information is contained in the summary prospectus and prospectus, which can be obtained from a financial intermediary. Prospective investors should read the prospectus carefully before investing. For further information, please call 1-800-262-1122.
Annual Report August 31, 2020
Eaton Vance
Municipal Income Funds
Eaton Vance
Municipal Income Funds
August 31, 2020
Management’s Discussion of Fund Performance1
Economic and Market Conditions
As the 12-month period opened on September 1, 2019, Treasury and municipal bond markets were at the tail end of a rally propelled by lower-than-desired inflation, low European interest rates, on-again/off-again trade-conflict rhetoric with China, and dovish comments from the U.S. Federal Reserve (the Fed) that led many investors to conclude that further Fed rate hikes were off the table for 2019.
Additional support for the rally had come on July 31, 2019, when the Fed reversed course and cut the federal funds rate — its first reduction in over a decade. Two additional rate cuts followed in the opening months of the period, September and October 2019.
In the middle and long areas of the yield curve — where rates are influenced more by the market than the Fed — rates bottomed for 2019 at the beginning of September. From September 3 through the end of December, U.S. and European interest rates trended modestly upward, amid better-than-expected U.S. employment reports and cautious optimism about a U.S.-China trade détente.
In January 2020, however, news of the outbreak of a new coronavirus in China raised investor concerns and led to a “flight to quality” that briefly revived the bond market rally. As the virus turned into a global pandemic in February and March, however, it ended the longest-ever U.S. economic expansion and brought about a global economic slowdown. Economic activity decreased and credit markets, along with equities, declined in value amid unprecedented volatility.
In response, the Fed announced two emergency rate cuts in March 2020 — lowering the federal funds rate to 0.00%–0.25% — along with other measures designed to shore up the credit markets. At its July meeting, the Fed provided additional reassurance that it would maintain rates around zero for the foreseeable future and use all tools at its disposal to support the U.S. economy. These moves helped calm the markets and initiated a new municipal bond rally that began in April and lasted through most of the summer.
The rally was also driven by market technical factors as municipal bond demand overwhelmed supply. As municipal bonds offered attractive tax-exempt yields versus other fixed income asset classes, municipal bond funds saw net inflows in May, June, July and August of 2020 — following pandemic-induced record outflows in March and April.
Midway through the final month of the period, however, the municipal rally stalled. Rates bottomed for the fiscal year on August 11, with 10-year municipal bonds at a historic low yield of 0.58%. For the following three weeks, yields increased modestly, driven in part by Congress’ failure to pass a phase 2 stimulus bill — of which $400–$500 billion had been projected for state and local government assistance. In addition, the Fed announced a policy shift to average inflation targeting at the end of August, raising inflation concerns among some investors.
For the 12-month period ended August 31, 2020, rates declined across the municipal bond yield curve. The Bloomberg Barclays Municipal Bond Index (the Index), a broad measure of the asset class, returned 3.24% for
the fiscal year — despite a 3.63% decline in March 2020. Reflecting investors’ “flight to quality” in response to the pandemic, municipal bonds with higher credit ratings generally outperformed lower-rated issues during the period.
Fund Performance
For the fiscal year ended August 31, 2020, the Oregon Fund’s Class A shares at net asset value (NAV) outperformed the 3.24% return of the Funds’ primary benchmark, the Index. All of the other Funds’ Class A shares at NAV underperformed the Index during the same one-year period.
Generally speaking, the Funds’ overall strategy is to invest primarily in municipal bonds with maturities of 10 years or more, in order to seek to capture their typically higher yields and greater income streams relative to shorter-maturity municipal issues.
Holdings in insured Puerto Rico bonds detracted from performance versus the Index for the Oregon, North Carolina and South Carolina Funds; prices of those bonds declined in the second half of the period amid investor concerns about the effects of the coronavirus pandemic on an already-weak Puerto Rican economy. The Funds’ insured Puerto Rico holdings were insured by various municipal bond insurers. Most uninsured bonds issued by the Commonwealth of Puerto Rico and its various conduit issuers were no longer included in the Index as of this year. As Puerto Rico continued to deal with an ongoing fiscal crisis, bonds issued by its various legal entities were impacted by a number of factors throughout the period, including monetary default and the coronavirus pandemic. As the period ended, Puerto Rico continued to negotiate with creditors and address its current debt structure under the Puerto Rico Oversight, Management, and Economic Stability Act (PROMESA) passed by the U.S. Congress.
The Funds may seek to enhance tax-exempt income through the use of leveraged investments by purchasing residual interest bonds. Leverage has the effect of magnifying the Funds’ exposure to their underlying investments in both up and down markets. During the period, the South Carolina and Virginia Funds held leveraged investments in the form of residual interest bond transactions. In a fiscal year when municipal bonds in general delivered positive performance, the leveraged investments in those Funds had a modest positive effect on performance relative to the Index, which does not employ leveraged investments.
State-specific Results
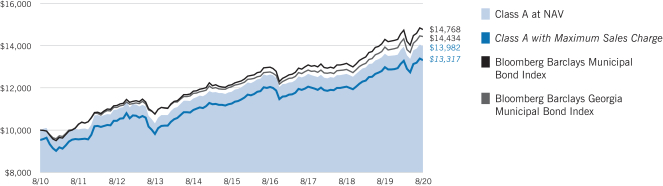
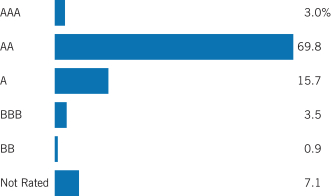
Eaton Vance Georgia Municipal Income Fund’s Class A shares at NAV returned 2.62%, underperforming the 3.24% return of the Index. Detractors from performance versus the Index included an overweight position, relative to the Index, in prerefunded, or escrowed, bonds; security selection and an overweight position in the health care sector; and an underweight position in AAA-rated bonds, which were the best-performing ratings category in the Index. Contributors to performance versus the Index included security selection and an overweight position in local general obligation bonds; an overweight position in bonds with 8–17 years remaining to maturity; and security selection in 4% coupon bonds.
See Endnotes and Additional Disclosures in this report.
Past performance is no guarantee of future results. Returns are historical and are calculated by determining the percentage change in net asset value (NAV) or offering price (as applicable) with all distributions reinvested. Investment return and principal value will fluctuate so that shares, when redeemed, may be worth more or less than their original cost. Performance for periods less than or equal to one year is cumulative. Performance is for the stated time period only; due to market volatility, current Fund performance may be lower or higher than the quoted return. For performance as of the most recent month-end, please refer to eatonvance.com.
Eaton Vance
Municipal Income Funds
August 31, 2020
Management’s Discussion of Fund Performance — continued
Eaton Vance Maryland Municipal Income Fund’s Class A shares at NAV returned 1.64%, underperforming the 3.24% return of the Index. An overweight position in prerefunded bonds, security selection in the transportation sector, and security selection and an overweight position in bonds rated BBB and below all detracted from performance versus the Index during the period. In contrast, security selection and an overweight position in 4% coupon bonds; security selection and an overweight position in AAA-rated bonds; and the Fund’s allocation to taxable municipal securities, which were not represented in the Index and generally outperformed tax-exempt municipal securities during the period, contributed to relative performance versus the Index.
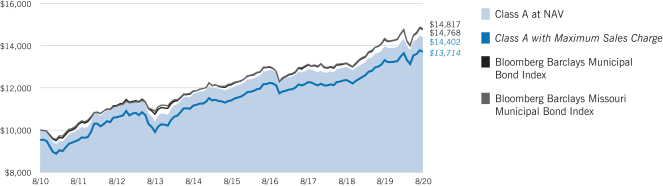
Eaton Vance Missouri Municipal Income Fund’s Class A shares at NAV returned 3.04%, underperforming the 3.24% return of the Index. Detractors from performance versus the Index included security selection in bonds rated BBB and below, an overweight position in bonds with less than one year remaining to maturity, and security selection in the health care sector. Contributors to performance relative to the Index included security selection in 4% coupon bonds, an overweight position in local general obligation bonds, and security selection in the housing sector.
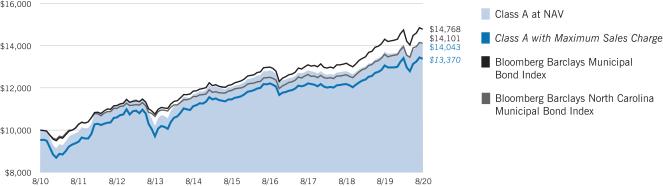
Eaton Vance North Carolina Municipal Income Fund’s Class A shares at NAV returned 2.44%, underperforming the 3.24% return of the Index. Detractors from results versus the Index included security selection in the water and sewer sector, an overweight position in insured Puerto Rico bonds, and security selection in bonds with 17–22 years remaining to maturity. In contrast, performance versus the Index was helped by an overweight position in 4% coupon bonds and security selection in the leasing and education sectors.
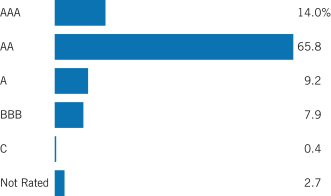
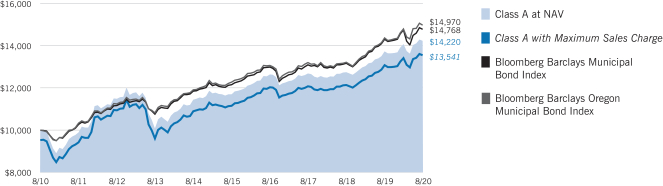
Eaton Vance Oregon Municipal Income Fund’s Class A shares at NAV returned 3.57%, outperforming the 3.24% return of the Index. Performance versus the Index benefited from an overweight position in general obligation bonds, security selection in zero-coupon bonds, and security selection in the water and sewer sector, which was the best-performing sector in the Index during the period. Detractors from performance relative to the Index included an overweight position in insured Puerto Rico bonds, security selection and an overweight position in the health care sector, and security selection in the education sector.
Eaton Vance South Carolina Municipal Income Fund’s Class A shares at NAV returned 2.97%, underperforming the 3.24% return of the Index. An overweight position in insured Puerto Rico bonds, an overweight position in prerefunded bonds, and security selection in the electric utilities sector all detracted from results relative to the Index. In contrast, contributors to performance versus the Index included security selection in the water and sewer sector, security selection in 4% coupon bonds, and security selection in local general obligation bonds.
Eaton Vance Virginia Municipal Income Fund’s Class A shares at NAV returned 3.09%, underperforming the 3.24% return of the Index.
Detractors from relative performance versus the Index included an overweight position in bonds with four years or less remaining to maturity, an overweight position in BBB-rated bonds, and security selection in state general obligation bonds. Contributors to performance relative to the Index included security selection and an overweight position in the water and sewer sector; security selection in 4% coupon bonds; and security selection and an overweight position in AAA-rated bonds.
See Endnotes and Additional Disclosures in this report.
Past performance is no guarantee of future results. Returns are historical and are calculated by determining the percentage change in net asset value (NAV) or offering price (as applicable) with all distributions reinvested. Investment return and principal value will fluctuate so that shares, when redeemed, may be worth more or less than their original cost. Performance for periods less than or equal to one year is cumulative. Performance is for the stated time period only; due to market volatility, current Fund performance may be lower or higher than the quoted return. For performance as of the most recent month-end, please refer to eatonvance.com.
Eaton Vance
Georgia Municipal Income Fund
August 31, 2020
Performance2,3
Portfolio Managers Adam A. Weigold, CFA and Trevor G. Smith
| | | | | | | | | | | | | | | | | | | | |
| % Average Annual Total Returns | | Class
Inception Date | | | Performance
Inception Date | | | One Year | | | Five Years | | | Ten Years | |
| | | | | |
Class A at NAV | | | 12/07/1993 | | | | 12/23/1991 | | | | 2.62 | % | | | 3.42 | % | | | 3.41 | % |
Class A with 4.75% Maximum Sales Charge | | | — | | | | — | | | | –2.28 | | | | 2.41 | | | | 2.90 | |
Class C at NAV | | | 04/25/2006 | | | | 12/23/1991 | | | | 1.83 | | | | 2.65 | | | | 2.64 | |
Class C with 1% Maximum Sales Charge | | | — | | | | — | | | | 0.83 | | | | 2.65 | | | | 2.64 | |
Class I at NAV | | | 03/03/2008 | | | | 12/23/1991 | | | | 2.71 | | | | 3.62 | | | | 3.60 | |
|
| |
| | | | | |
Bloomberg Barclays Municipal Bond Index | | | — | | | | — | | | | 3.24 | % | | | 3.99 | % | | | 3.97 | % |
Bloomberg Barclays Georgia Municipal Bond Index | | | — | | | | — | | | | 3.63 | | | | 3.67 | | | | 3.74 | |
| | | | | |
| % Total Annual Operating Expense Ratios4 | | | | | | | | Class A | | | Class C | | | Class I | |
| | | | | |
| | | | | | | | | | | 0.70 | % | | | 1.45 | % | | | 0.49 | % |
| | | | | |
| % Distribution Rates/Yields5 | | | | | | | | Class A | | | Class C | | | Class I | |
| | | | | |
Distribution Rate | | | | | | | | | | | 2.02 | % | | | 1.25 | % | | | 2.22 | % |
Taxable-Equivalent Distribution Rate | | | | | | | | | | | 3.78 | | | | 2.34 | | | | 4.15 | |
| | | | | |
SEC 30-day Yield | | | | | | | | | | | 0.63 | | | | –0.08 | | | | 0.86 | |
Taxable-Equivalent SEC 30-day Yield | | | | | | | | | | | 1.18 | | | | –0.16 | | | | 1.61 | |
Growth of $10,000
This graph shows the change in value of a hypothetical investment of $10,000 in Class A of the Fund for the period indicated. For comparison, the same investment is shown in the indicated index.
| | | | | | | | | | | | | | | | |
| Growth of Investment | | Amount Invested | | | Period Beginning | | | At NAV | | | With Maximum Sales Charge | |
| | | | |
Class C | | | $10,000 | | | | 08/31/2010 | | | | $12,976 | | | | N.A. | |
Class I | | | $250,000 | | | | 08/31/2010 | | | | $356,169 | | | | N.A. | |
See Endnotes and Additional Disclosures in this report.
Past performance is no guarantee of future results. Returns are historical and are calculated by determining the percentage change in net asset value (NAV) or offering price (as applicable) with all distributions reinvested. Investment return and principal value will fluctuate so that shares, when redeemed, may be worth more or less than their original cost. Performance for periods less than or equal to one year is cumulative. Performance is for the stated time period only; due to market volatility, current Fund performance may be lower or higher than the quoted return. For performance as of the most recent month-end, please refer to eatonvance.com.
Eaton Vance
Georgia Municipal Income Fund
August 31, 2020
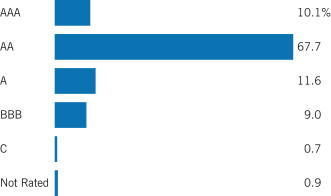
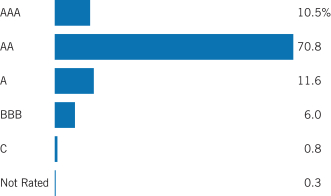
Fund Profile
Credit Quality (% of total investments)7
See Endnotes and Additional Disclosures in this report.
Eaton Vance
Maryland Municipal Income Fund
August 31, 2020
Performance2,3
Portfolio Managers Craig R. Brandon, CFA and Trevor G. Smith
| | | | | | | | | | | | | | | | | | | | |
| % Average Annual Total Returns | | Class
Inception Date | | | Performance
Inception Date | | | One Year | | | Five Years | | | Ten Years | |
| | | | | |
Class A at NAV | | | 12/10/1993 | | | | 02/03/1992 | | | | 1.64 | % | | | 2.95 | % | | | 3.24 | % |
Class A with 4.75% Maximum Sales Charge | | | — | | | | — | | | | –3.16 | | | | 1.95 | | | | 2.74 | |
Class C at NAV | | | 05/02/2006 | | | | 02/03/1992 | | | | 0.94 | | | | 2.18 | | | | 2.48 | |
Class C with 1% Maximum Sales Charge | | | — | | | | — | | | | –0.05 | | | | 2.18 | | | | 2.48 | |
Class I at NAV | | | 03/03/2008 | | | | 02/03/1992 | | | | 1.85 | | | | 3.16 | | | | 3.45 | |
|
| |
| | | | | |
Bloomberg Barclays Municipal Bond Index | | | — | | | | — | | | | 3.24 | % | | | 3.99 | % | | | 3.97 | % |
Bloomberg Barclays Maryland Municipal Bond Index | | | — | | | | — | | | | 3.68 | | | | 3.58 | | | | 3.34 | |
| | | | | |
| % Total Annual Operating Expense Ratios4 | | | | | | | | Class A | | | Class C | | | Class I | |
| | | | | |
| | | | | | | | | | | 0.73 | % | | | 1.49 | % | | | 0.52 | % |
| | | | | |
| % Distribution Rates/Yields5 | | | | | | | | Class A | | | Class C | | | Class I | |
| | | | | |
Distribution Rate | | | | | | | | | | | 2.21 | % | | | 1.45 | % | | | 2.40 | % |
Taxable-Equivalent Distribution Rate | | | | | | | | | | | 4.13 | | | | 2.71 | | | | 4.49 | |
| | | | | |
SEC 30-day Yield | | | | | | | | | | | 1.16 | | | | 0.48 | | | | 1.41 | |
Taxable-Equivalent SEC 30-day Yield | | | | | | | | | | | 2.17 | | | | 0.89 | | | | 2.63 | |
Growth of $10,000
This graph shows the change in value of a hypothetical investment of $10,000 in Class A of the Fund for the period indicated. For comparison, the same investment is shown in the indicated index.

| | | | | | | | | | | | | | | | |
| Growth of Investment | | Amount Invested | | | Period Beginning | | | At NAV | | | With Maximum Sales Charge | |
| | | | |
Class C | | | $10,000 | | | | 08/31/2010 | | | | $12,773 | | | | N.A. | |
Class I | | | $250,000 | | | | 08/31/2010 | | | | $350,942 | | | | N.A. | |
See Endnotes and Additional Disclosures in this report.
Past performance is no guarantee of future results. Returns are historical and are calculated by determining the percentage change in net asset value (NAV) or offering price (as applicable) with all distributions reinvested. Investment return and principal value will fluctuate so that shares, when redeemed, may be worth more or less than their original cost. Performance for periods less than or equal to one year is cumulative. Performance is for the stated time period only; due to market volatility, current Fund performance may be lower or higher than the quoted return. For performance as of the most recent month-end, please refer to eatonvance.com.
Eaton Vance
Maryland Municipal Income Fund
August 31, 2020
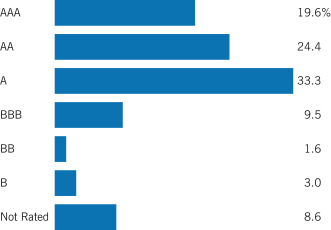
Fund Profile
Credit Quality (% of total investments)7
See Endnotes and Additional Disclosures in this report.
Eaton Vance
Missouri Municipal Income Fund
August 31, 2020
Performance2,3
Portfolio Managers Cynthia J. Clemson and Christopher J. Eustance, CFA
| | | | | | | | | | | | | | | | | | | | |
| % Average Annual Total Returns | | Class
Inception Date | | | Performance
Inception Date | | | One Year | | | Five Years | | | Ten Years | |
| | | | | |
Class A at NAV | | | 12/07/1993 | | | | 05/01/1992 | | | | 3.04 | % | | | 3.74 | % | | | 3.71 | % |
Class A with 4.75% Maximum Sales Charge | | | — | | | | — | | | | –1.83 | | | | 2.75 | | | | 3.21 | |
Class C at NAV | | | 02/16/2006 | | | | 05/01/1992 | | | | 2.35 | | | | 2.99 | | | | 2.94 | |
Class C with 1% Maximum Sales Charge | | | — | | | | — | | | | 1.35 | | | | 2.99 | | | | 2.94 | |
Class I at NAV | | | 08/03/2010 | | | | 05/01/1992 | | | | 3.33 | | | | 3.97 | | | | 3.93 | |
|
| |
| | | | | |
Bloomberg Barclays Municipal Bond Index | | | — | | | | — | | | | 3.24 | % | | | 3.99 | % | | | 3.97 | % |
Bloomberg Barclays Missouri Municipal Bond Index | | | — | | | | — | | | | 3.32 | | | | 3.98 | | | | 4.01 | |
| | | | | |
| % Total Annual Operating Expense Ratios4 | | | | | | | | Class A | | | Class C | | | Class I | |
| | | | | |
| | | | | | | | | | | 0.71 | % | | | 1.46 | % | | | 0.50 | % |
| | | | | |
| % Distribution Rates/Yields5 | | | | | | | | Class A | | | Class C | | | Class I | |
| | | | | |
Distribution Rate | | | | | | | | | | | 2.54 | % | | | 1.77 | % | | | 2.74 | % |
Taxable-Equivalent Distribution Rate | | | | | | | | | | | 4.72 | | | | 3.29 | | | | 5.09 | |
| | | | | |
SEC 30-day Yield | | | | | | | | | | | 0.64 | | | | –0.07 | | | | 0.87 | |
Taxable-Equivalent SEC 30-day Yield | | | | | | | | | | | 1.20 | | | | –0.13 | | | | 1.62 | |
Growth of $10,000
This graph shows the change in value of a hypothetical investment of $10,000 in Class A of the Fund for the period indicated. For comparison, the same investment is shown in the indicated index.
| | | | | | | | | | | | | | | | |
| Growth of Investment | | Amount Invested | | | Period Beginning | | | At NAV | | | With Maximum Sales Charge | |
| | | | |
Class C | | | $10,000 | | | | 08/31/2010 | | | | $13,359 | | | | N.A. | |
Class I | | | $250,000 | | | | 08/31/2010 | | | | $367,616 | | | | N.A. | |
See Endnotes and Additional Disclosures in this report.
Past performance is no guarantee of future results. Returns are historical and are calculated by determining the percentage change in net asset value (NAV) or offering price (as applicable) with all distributions reinvested. Investment return and principal value will fluctuate so that shares, when redeemed, may be worth more or less than their original cost. Performance for periods less than or equal to one year is cumulative. Performance is for the stated time period only; due to market volatility, current Fund performance may be lower or higher than the quoted return. For performance as of the most recent month-end, please refer to eatonvance.com.
Eaton Vance
Missouri Municipal Income Fund
August 31, 2020
Fund Profile
Credit Quality (% of total investments)7
See Endnotes and Additional Disclosures in this report.
Eaton Vance
North Carolina Municipal Income Fund
August 31, 2020
Performance2,3
Portfolio Managers Adam A. Weigold, CFA and Christopher J. Eustance, CFA
| | | | | | | | | | | | | | | | | | | | |
| % Average Annual Total Returns | | Class Inception Date | | | Performance Inception Date | | | One Year | | | Five Years | | | Ten Years | |
| | | | | |
Class A at NAV | | | 12/07/1993 | | | | 10/23/1991 | | | | 2.44 | % | | | 3.13 | % | | | 3.45 | % |
Class A with 4.75% Maximum Sales Charge | | | — | | | | — | | | | –2.44 | | | | 2.15 | | | | 2.94 | |
Class C at NAV | | | 05/02/2006 | | | | 10/23/1991 | | | | 1.69 | | | | 2.36 | | | | 2.67 | |
Class C with 1% Maximum Sales Charge | | | — | | | | — | | | | 0.69 | | | | 2.36 | | | | 2.67 | |
Class I at NAV | | | 03/03/2008 | | | | 10/23/1991 | | | | 2.64 | | | | 3.34 | | | | 3.65 | |
|
| |
| | | | | |
Bloomberg Barclays Municipal Bond Index | | | — | | | | — | | | | 3.24 | % | | | 3.99 | % | | | 3.97 | % |
Bloomberg Barclays North Carolina Municipal Bond Index | | | — | | | | — | | | | 3.78 | | | | 3.50 | | | | 3.49 | |
| | | | | |
| % Total Annual Operating Expense Ratios4 | | | | | | | | Class A | | | Class C | | | Class I | |
| | | | | |
| | | | | | | | | | | 0.74 | % | | | 1.49 | % | | | 0.53 | % |
| | | | | |
| % Distribution Rates/Yields5 | | | | | | | | Class A | | | Class C | | | Class I | |
| | | | | |
Distribution Rate | | | | | | | | | | | 2.18 | % | | | 1.45 | % | | | 2.38 | % |
Taxable-Equivalent Distribution Rate | | | | | | | | | | | 4.04 | | | | 2.69 | | | | 4.41 | |
| | | | | |
SEC 30-day Yield | | | | | | | | | | | 0.70 | | | | –0.01 | | | | 0.93 | |
Taxable-Equivalent SEC 30-day Yield | | | | | | | | | | | 1.30 | | | | –0.02 | | | | 1.73 | |
Growth of $10,000
This graph shows the change in value of a hypothetical investment of $10,000 in Class A of the Fund for the period indicated. For comparison, the same investment is shown in the indicated index.
| | | | | | | | | | | | | | | | |
| Growth of Investment | | Amount Invested | | | Period Beginning | | | At NAV | | | With Maximum Sales Charge | |
| | | | |
Class C | | | $10,000 | | | | 08/31/2010 | | | | $13,019 | | | | N.A. | |
Class I | | | $250,000 | | | | 08/31/2010 | | | | $357,733 | | | | N.A. | |
See Endnotes and Additional Disclosures in this report.
Past performance is no guarantee of future results. Returns are historical and are calculated by determining the percentage change in net asset value (NAV) or offering price (as applicable) with all distributions reinvested. Investment return and principal value will fluctuate so that shares, when redeemed, may be worth more or less than their original cost. Performance for periods less than or equal to one year is cumulative. Performance is for the stated time period only; due to market volatility, current Fund performance may be lower or higher than the quoted return. For performance as of the most recent month-end, please refer to eatonvance.com.
Eaton Vance
North Carolina Municipal Income Fund
August 31, 2020
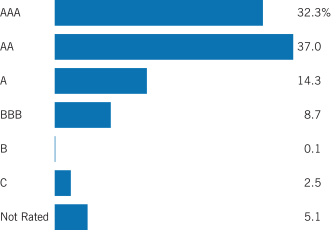
Fund Profile
Credit Quality (% of total investments)7
See Endnotes and Additional Disclosures in this report.
Eaton Vance
Oregon Municipal Income Fund
August 31, 2020
Performance2,3
Portfolio Managers Adam A. Weigold, CFA and Christopher J. Eustance, CFA
| | | | | | | | | | | | | | | | | | | | |
| % Average Annual Total Returns | | Class Inception Date | | | Performance Inception Date | | | One Year | | | Five Years | | | Ten Years | |
| | | | | |
Class A at NAV | | | 12/28/1993 | | | | 12/24/1991 | | | | 3.57 | % | | | 3.97 | % | | | 3.58 | % |
Class A with 4.75% Maximum Sales Charge | | | — | | | | — | | | | –1.35 | | | | 2.97 | | | | 3.07 | |
Class C at NAV | | | 03/02/2006 | | | | 12/24/1991 | | | | 2.82 | | | | 3.18 | | | | 2.80 | |
Class C with 1% Maximum Sales Charge | | | — | | | | — | | | | 1.82 | | | | 3.18 | | | | 2.80 | |
Class I at NAV | | | 08/03/2010 | | | | 12/24/1991 | | | | 3.76 | | | | 4.18 | | | | 3.77 | |
|
| |
| | | | | |
Bloomberg Barclays Municipal Bond Index | | | — | | | | — | | | | 3.24 | % | | | 3.99 | % | | | 3.97 | % |
Bloomberg Barclays Oregon Municipal Bond Index | | | — | | | | — | | | | 4.20 | | | | 4.06 | | | | 4.11 | |
| | | | | |
| % Total Annual Operating Expense Ratios4 | | | | | | | | Class A | | | Class C | | | Class I | |
| | | | | |
| | | | | | | | | | | 0.77 | % | | | 1.52 | % | | | 0.56 | % |
| | | | | |
| % Distribution Rates/Yields5 | | | | | | | | Class A | | | Class C | | | Class I | |
| | | | | |
Distribution Rate | | | | | | | | | | | 2.34 | % | | | 1.58 | % | | | 2.51 | % |
Taxable-Equivalent Distribution Rate | | | | | | | | | | | 4.75 | | | | 3.20 | | | | 5.09 | |
| | | | | |
SEC 30-day Yield | | | | | | | | | | | 0.84 | | | | 0.13 | | | | 1.08 | |
Taxable-Equivalent SEC 30-day Yield | | | | | | | | | | | 1.70 | | | | 0.27 | | | | 2.19 | |
Growth of $10,000
This graph shows the change in value of a hypothetical investment of $10,000 in Class A of the Fund for the period indicated. For comparison, the same investment is shown in the indicated index.
| | | | | | | | | | | | | | | | |
| Growth of Investment | | Amount Invested | | | Period Beginning | | | At NAV | | | With Maximum Sales Charge | |
| | | | |
Class C | | | $10,000 | | | | 08/31/2010 | | | | $13,188 | | | | N.A. | |
Class I | | | $250,000 | | | | 08/31/2010 | | | | $362,165 | | | | N.A. | |
See Endnotes and Additional Disclosures in this report.
Past performance is no guarantee of future results. Returns are historical and are calculated by determining the percentage change in net asset value (NAV) or offering price (as applicable) with all distributions reinvested. Investment return and principal value will fluctuate so that shares, when redeemed, may be worth more or less than their original cost. Performance for periods less than or equal to one year is cumulative. Performance is for the stated time period only; due to market volatility, current Fund performance may be lower or higher than the quoted return. For performance as of the most recent month-end, please refer to eatonvance.com.
Eaton Vance
Oregon Municipal Income Fund
August 31, 2020
Fund Profile
Credit Quality (% of total investments)7
See Endnotes and Additional Disclosures in this report.
Eaton Vance
South Carolina Municipal Income Fund
August 31, 2020
Performance2,3
Portfolio Managers Adam A. Weigold, CFA and Christopher J. Eustance, CFA
| | | | | | | | | | | | | | | | | | | | |
| % Average Annual Total Returns | | Class Inception Date | | | Performance Inception Date | | | One Year | | | Five Years | | | Ten Years | |
| | | | | |
Class A at NAV | | | 02/14/1994 | | | | 10/02/1992 | | | | 2.97 | % | | | 3.55 | % | | | 3.53 | % |
Class A with 4.75% Maximum Sales Charge | | | — | | | | — | | | | –1.94 | | | | 2.54 | | | | 3.03 | |
Class C at NAV | | | 01/12/2006 | | | | 10/02/1992 | | | | 2.17 | | | | 2.76 | | | | 2.76 | |
Class C with 1% Maximum Sales Charge | | | — | | | | — | | | | 1.17 | | | | 2.76 | | | | 2.76 | |
Class I at NAV | | | 03/03/2008 | | | | 10/02/1992 | | | | 3.17 | | | | 3.75 | | | | 3.74 | |
|
| |
| | | | | |
Bloomberg Barclays Municipal Bond Index | | | — | | | | — | | | | 3.24 | % | | | 3.99 | % | | | 3.97 | % |
Bloomberg Barclays South Carolina Municipal Bond Index | | | — | | | | — | | | | 3.83 | | | | 4.28 | | | | 4.14 | |
| | | | | |
| % Total Annual Operating Expense Ratios4 | | | | | | | | Class A | | | Class C | | | Class I | |
| | | | | |
| | | | | | | | | | | 0.75 | % | | | 1.50 | % | | | 0.55 | % |
| | | | | |
| % Distribution Rates/Yields5 | | | | | | | | Class A | | | Class C | | | Class I | |
| | | | | |
Distribution Rate | | | | | | | | | | | 2.07 | % | | | 1.30 | % | | | 2.28 | % |
Taxable-Equivalent Distribution Rate | | | | | | | | | | | 3.97 | | | | 2.49 | | | | 4.37 | |
| | | | | |
SEC 30-day Yield | | | | | | | | | | | 0.60 | | | | –0.12 | | | | 0.82 | |
Taxable-Equivalent SEC 30-day Yield | | | | | | | | | | | 1.14 | | | | –0.22 | | | | 1.58 | |
| | | | | |
| % Total Leverage6 | | | | | | | | | | | | | | | |
| | | | | |
Residual Interest Bond (RIB) Financing | | | | | | | | | | | | | | | | | | | 2.04 | % |
Growth of $10,000
This graph shows the change in value of a hypothetical investment of $10,000 in Class A of the Fund for the period indicated. For comparison, the same investment is shown in the indicated index.
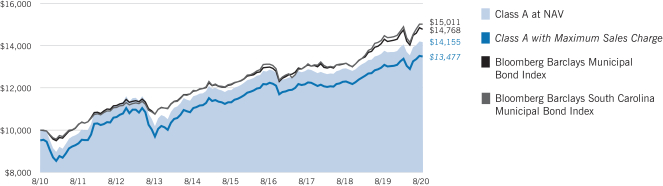
| | | | | | | | | | | | | | | | |
| Growth of Investment | | Amount Invested | | | Period Beginning | | | At NAV | | | With Maximum Sales Charge | |
| | | | |
Class C | | | $10,000 | | | | 08/31/2010 | | | | $13,130 | | | | N.A. | |
Class I | | | $250,000 | | | | 08/31/2010 | | | | $361,007 | | | | N.A. | |
See Endnotes and Additional Disclosures in this report.
Past performance is no guarantee of future results. Returns are historical and are calculated by determining the percentage change in net asset value (NAV) or offering price (as applicable) with all distributions reinvested. Investment return and principal value will fluctuate so that shares, when redeemed, may be worth more or less than their original cost. Performance for periods less than or equal to one year is cumulative. Performance is for the stated time period only; due to market volatility, current Fund performance may be lower or higher than the quoted return. For performance as of the most recent month-end, please refer to eatonvance.com.
Eaton Vance
South Carolina Municipal Income Fund
August 31, 2020
Fund Profile
Credit Quality (% of total investments)7,8
See Endnotes and Additional Disclosures in this report.
Eaton Vance
Virginia Municipal Income Fund
August 31, 2020
Performance2,3
Portfolio Managers Adam A. Weigold, CFA and Trevor G. Smith
| | | | | | | | | | | | | | | | | | | | |
| % Average Annual Total Returns | | Class Inception Date | | | Performance Inception Date | | | One Year | | | Five Years | | | Ten Years | |
| | | | | |
Class A at NAV | | | 12/17/1993 | | | | 07/26/1991 | | | | 3.09 | % | | | 3.56 | % | | | 3.25 | % |
Class A with 4.75% Maximum Sales Charge | | | — | | | | — | | | | –1.80 | | | | 2.55 | | | | 2.75 | |
Class C at NAV | | | 02/08/2006 | | | | 07/26/1991 | | | | 2.17 | | | | 2.77 | | | | 2.47 | |
Class C with 1% Maximum Sales Charge | | | — | | | | — | | | | 1.17 | | | | 2.77 | | | | 2.47 | |
Class I at NAV | | | 03/03/2008 | | | | 07/26/1991 | | | | 3.17 | | | | 3.75 | | | | 3.44 | |
|
| |
| | | | | |
Bloomberg Barclays Municipal Bond Index | | | — | | | | — | | | | 3.24 | % | | | 3.99 | % | | | 3.97 | % |
Bloomberg Barclays Virginia Municipal Bond Index | | | — | | | | — | | | | 3.84 | | | | 3.73 | | | | 3.55 | |
| | | | | |
| % Total Annual Operating Expense Ratios4 | | | | | | | | Class A | | | Class C | | | Class I | |
| | | | | |
| | | | | | | | | | | 0.82 | % | | | 1.57 | % | | | 0.61 | % |
| | | | | |
| % Distribution Rates/Yields5 | | | | | | | | Class A | | | Class C | | | Class I | |
| | | | | |
Distribution Rate | | | | | | | | | | | 2.59 | % | | | 1.82 | % | | | 2.78 | % |
Taxable-Equivalent Distribution Rate | | | | | | | | | | | 4.85 | | | | 3.41 | | | | 5.20 | |
| | | | | |
SEC 30-day Yield | | | | | | | | | | | 0.85 | | | | 0.14 | | | | 1.09 | |
Taxable-Equivalent SEC 30-day Yield | | | | | | | | | | | 1.59 | | | | 0.27 | | | | 2.04 | |
| | | | | |
| % Total Leverage6 | | | | | | | | | | | | | | | |
| | | | | |
RIB Financing | | | | | | | | | | | | | | | | | | | 3.44 | % |
Growth of $10,000
This graph shows the change in value of a hypothetical investment of $10,000 in Class A of the Fund for the period indicated. For comparison, the same investment is shown in the indicated index.

| | | | | | | | | | | | | | | | |
| Growth of Investment | | Amount Invested | | | Period Beginning | | | At NAV | | | With Maximum Sales Charge | |
| | | | |
Class C | | | $10,000 | | | | 08/31/2010 | | | | $12,767 | | | | N.A. | |
Class I | | | $250,000 | | | | 08/31/2010 | | | | $350,831 | | | | N.A. | |
See Endnotes and Additional Disclosures in this report.
Past performance is no guarantee of future results. Returns are historical and are calculated by determining the percentage change in net asset value (NAV) or offering price (as applicable) with all distributions reinvested. Investment return and principal value will fluctuate so that shares, when redeemed, may be worth more or less than their original cost. Performance for periods less than or equal to one year is cumulative. Performance is for the stated time period only; due to market volatility, current Fund performance may be lower or higher than the quoted return. For performance as of the most recent month-end, please refer to eatonvance.com.
Eaton Vance
Virginia Municipal Income Fund
August 31, 2020
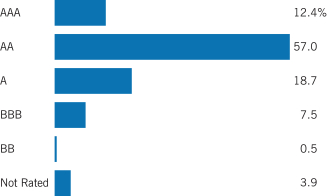
Fund Profile
Credit Quality (% of total investments)7,8
See Endnotes and Additional Disclosures in this report.
Eaton Vance
Municipal Income Funds
August 31, 2020
Endnotes and Additional Disclosures
| 1 | The views expressed in this report are those of the portfolio manager(s) and are current only through the date stated at the top of this page. These views are subject to change at any time based upon market or other conditions, and Eaton Vance and the Fund(s) disclaim any responsibility to update such views. These views may not be relied upon as investment advice and, because investment decisions are based on many factors, may not be relied upon as an indication of trading intent on behalf of any Eaton Vance fund. This commentary may contain statements that are not historical facts, referred to as “forward-looking statements.” The Fund’s actual future results may differ significantly from those stated in any forward-looking statement, depending on factors such as changes in securities or financial markets or general economic conditions, the volume of sales and purchases of Fund shares, the continuation of investment advisory, administrative and service contracts, and other risks discussed from time to time in the Fund’s filings with the Securities and Exchange Commission. |
| 2 | Bloomberg Barclays Municipal Bond Index is an unmanaged index of municipal bonds traded in the U.S. Bloomberg Barclays Georgia Municipal Bond Index is an unmanaged index of Georgia municipal bonds. Bloomberg Barclays Maryland Municipal Bond Index is an unmanaged index of Maryland municipal bonds. Bloomberg Barclays Missouri Municipal Bond Index is an unmanaged index of Missouri municipal bonds. Bloomberg Barclays North Carolina Municipal Bond Index is an unmanaged index of North Carolina municipal bonds. Bloomberg Barclays Oregon Municipal Bond Index is an unmanaged index of Oregon municipal bonds. Bloomberg Barclays South Carolina Municipal Bond Index is an unmanaged index of South Carolina municipal bonds. Bloomberg Barclays Virginia Municipal Bond Index is an unmanaged index of Virginia municipal bonds. Unless otherwise stated, index returns do not reflect the effect of any applicable sales charges, commissions, expenses, taxes or leverage, as applicable. It is not possible to invest directly in an index. |
| 3 | Total Returns at NAV do not include applicable sales charges. If sales charges were deducted, the returns would be lower. Total Returns shown with maximum sales charge reflect the stated maximum sales charge. Unless otherwise stated, performance does not reflect the deduction of taxes on Fund distributions or redemptions of Fund shares. |
| 4 | Source: Fund prospectus. The expense ratios for the current reporting period can be found in the Financial Highlights section of this report. |
| 5 | The Distribution Rate is based on the Fund’s last regular distribution per share in the period (annualized) divided by the Fund’s NAV at the end of the period. The Fund’s distributions may be comprised of amounts characterized for federal income tax purposes as tax-exempt income, qualified and non-qualified ordinary dividends, capital gains and nondividend distributions, also known as return of capital. The Fund will determine the federal income tax character of distributions paid to a shareholder after the end of the calendar year. This is reported on the IRS form 1099-DIV and provided to the shareholder shortly after each year-end. |
The Fund’s distributions are determined by the investment adviser based on its current assessment of the Fund’s long-term return potential. As portfolio and market conditions change, the rate of distributions paid by the Fund could change. Taxable-equivalent
performance is based on the highest combined federal and state income tax rates, where applicable. Lower tax rates would result in lower tax-equivalent performance. Actual tax rates will vary depending on your income, exemptions and deductions. Rates do not include local taxes. The SEC Yield is a standardized measure based on the estimated yield to maturity of a fund’s investments over a 30-day period and is based on the maximum offer price at the date specified. The SEC Yield is not based on the distributions made by the Fund, which may differ.
| 6 | Fund employs RIB financing. The leverage created by RIB investments provides an opportunity for increased income but, at the same time, creates special risks (including the likelihood of greater volatility of NAV). The cost of leverage rises and falls with changes in short-term interest rates. See “Floating Rate Notes Issued in Conjunction with Securities Held” in the notes to the financial statements for more information about RIB financing. RIB leverage represents the amount of Floating Rate Notes outstanding at period end as a percentage of Fund net assets plus Floating Rate Notes. |
| 7 | Ratings are based on Moody’s Investors Service, Inc. (“Moody’s”), S&P Global Ratings (“S&P”) or Fitch Ratings (“Fitch”), as applicable. If securities are rated differently by the ratings agencies, the highest rating is applied. Ratings, which are subject to change, apply to the creditworthiness of the issuers of the underlying securities and not to the Fund or its shares. Credit ratings measure the quality of a bond based on the issuer’s creditworthiness, with ratings ranging from AAA, being the highest, to D, being the lowest based on S&P’s measures. Ratings of BBB or higher by S&P or Fitch (Baa or higher by Moody’s) are considered to be investment-grade quality. Credit ratings are based largely on the ratings agency’s analysis at the time of rating. The rating assigned to any particular security is not necessarily a reflection of the issuer’s current financial condition and does not necessarily reflect its assessment of the volatility of a security’s market value or of the liquidity of an investment in the security. Holdings designated as “Not Rated” (if any) are not rated by the national ratings agencies stated above. |
| 8 | The chart includes the municipal bonds held by a trust that issues residual interest bonds, consistent with the Portfolio of Investments. |
| | Fund profiles subject to change due to active management. |
Additional Information
Yield curve is a graphical representation of the yields offered by bonds of various maturities. The yield curve flattens when long-term rates fall and/or short-term rates increase, and the yield curve steepens when long-term rates increase and/or short-term rates fall.
Eaton Vance
Municipal Income Funds
August 31, 2020
Fund Expenses
Example: As a Fund shareholder, you incur two types of costs: (1) transaction costs, including sales charges (loads) on purchases and redemption fees (if applicable); and (2) ongoing costs, including management fees; distribution and/or service fees; and other Fund expenses. This Example is intended to help you understand your ongoing costs (in dollars) of Fund investing and to compare these costs with the ongoing costs of investing in other mutual funds. The Example is based on an investment of $1,000 invested at the beginning of the period and held for the entire period (March 1, 2020 – August 31, 2020).
Actual Expenses: The first section of each table below provides information about actual account values and actual expenses. You may use the information in this section, together with the amount you invested, to estimate the expenses that you paid over the period. Simply divide your account value by $1,000 (for example, an $8,600 account value divided by $1,000 = 8.6), then multiply the result by the number in the first section under the heading entitled “Expenses Paid During Period” to estimate the expenses you paid on your account during this period.
Hypothetical Example for Comparison Purposes: The second section of each table below provides information about hypothetical account values and hypothetical expenses based on the actual Fund expense ratio and an assumed rate of return of 5% per year (before expenses), which is not the actual Fund return. The hypothetical account values and expenses may not be used to estimate the actual ending account balance or expenses you paid for the period. You may use this information to compare the ongoing costs of investing in your Fund and other funds. To do so, compare this 5% hypothetical example with the 5% hypothetical examples that appear in the shareholder reports of the other funds.
Please note that the expenses shown in each table are meant to highlight your ongoing costs only and do not reflect any transactional costs, such as sales charges (loads) or redemption fees (if applicable). Therefore, the second section of each table is useful in comparing ongoing costs only, and will not help you determine the relative total costs of owning different funds. In addition, if these transactional costs were included, your costs would be higher.
Eaton Vance Georgia Municipal Income Fund
| | | | | | | | | | | | | | | | |
| | | Beginning
Account Value
(3/1/20) | | | Ending
Account Value
(8/31/20) | | | Expenses Paid
During Period*
(3/1/20 – 8/31/20) | | | Annualized
Expense
Ratio | |
| | | | |
Actual | | | | | | | | | | | | | | | | |
Class A | | $ | 1,000.00 | | | $ | 1,002.70 | | | $ | 3.32 | | | | 0.66 | % |
Class C | | $ | 1,000.00 | | | $ | 999.50 | | | $ | 7.09 | | | | 1.41 | % |
Class I | | $ | 1,000.00 | | | $ | 1,003.80 | | | $ | 2.32 | | | | 0.46 | % |
| | | | | |
Hypothetical | | | | | | | | | | | | | | | | |
(5% return per year before expenses) | | | | | | | | | | | | | | | | |
Class A | | $ | 1,000.00 | | | $ | 1,021.80 | | | $ | 3.35 | | | | 0.66 | % |
Class C | | $ | 1,000.00 | | | $ | 1,018.00 | | | $ | 7.15 | | | | 1.41 | % |
Class I | | $ | 1,000.00 | | | $ | 1,022.80 | | | $ | 2.34 | | | | 0.46 | % |
| * | Expenses are equal to the Fund’s annualized expense ratio for the indicated Class, multiplied by the average account value over the period, multiplied by 184/366 (to reflect the one-half year period). The Example assumes that the $1,000 was invested at the net asset value per share determined at the close of business on February 29, 2020. |
Eaton Vance
Municipal Income Funds
August 31, 2020
Fund Expenses — continued
Eaton Vance Maryland Municipal Income Fund
| | | | | | | | | | | | | | | | |
| | | Beginning
Account Value
(3/1/20) | | | Ending
Account Value
(8/31/20) | | | Expenses Paid
During Period*
(3/1/20 – 8/31/20) | | | Annualized
Expense
Ratio | |
| | | | |
Actual | | | | | | | | | | | | | | | | |
Class A | | $ | 1,000.00 | | | $ | 990.90 | | | $ | 3.45 | | | | 0.69 | % |
Class C | | $ | 1,000.00 | | | $ | 986.90 | | | $ | 7.19 | | | | 1.44 | % |
Class I | | $ | 1,000.00 | | | $ | 991.90 | | | $ | 2.45 | | | | 0.49 | % |
| | | | | |
Hypothetical | | | | | | | | | | | | | | | | |
(5% return per year before expenses) | | | | | | | | | | | | | | | | |
Class A | | $ | 1,000.00 | | | $ | 1,021.70 | | | $ | 3.51 | | | | 0.69 | % |
Class C | | $ | 1,000.00 | | | $ | 1,017.90 | | | $ | 7.30 | | | | 1.44 | % |
Class I | | $ | 1,000.00 | | | $ | 1,022.70 | | | $ | 2.49 | | | | 0.49 | % |
| * | Expenses are equal to the Fund’s annualized expense ratio for the indicated Class, multiplied by the average account value over the period, multiplied by 184/366 (to reflect the one-half year period). The Example assumes that the $1,000 was invested at the net asset value per share determined at the close of business on February 29, 2020. |
Eaton Vance Missouri Municipal Income Fund
| | | | | | | | | | | | | | | | |
| | | Beginning
Account Value
(3/1/20) | | | Ending
Account Value
(8/31/20) | | | Expenses Paid
During Period*
(3/1/20 – 8/31/20) | | | Annualized
Expense
Ratio | |
| | | | |
Actual | | | | | | | | | | | | | | | | |
Class A | | $ | 1,000.00 | | | $ | 1,004.60 | | | $ | 3.43 | | | | 0.68 | % |
Class C | | $ | 1,000.00 | | | $ | 1,001.70 | | | $ | 7.20 | | | | 1.43 | % |
Class I | | $ | 1,000.00 | | | $ | 1,006.50 | | | $ | 2.42 | | | | 0.48 | % |
| | | | | |
Hypothetical | | | | | | | | | | | | | | | | |
(5% return per year before expenses) | | | | | | | | | | | | | | | | |
Class A | | $ | 1,000.00 | | | $ | 1,021.70 | | | $ | 3.46 | | | | 0.68 | % |
Class C | | $ | 1,000.00 | | | $ | 1,017.90 | | | $ | 7.25 | | | | 1.43 | % |
Class I | | $ | 1,000.00 | | | $ | 1,022.70 | | | $ | 2.44 | | | | 0.48 | % |
| * | Expenses are equal to the Fund’s annualized expense ratio for the indicated Class, multiplied by the average account value over the period, multiplied by 184/366 (to reflect the one-half year period). The Example assumes that the $1,000 was invested at the net asset value per share determined at the close of business on February 29, 2020. |
Eaton Vance
Municipal Income Funds
August 31, 2020
Fund Expenses — continued
Eaton Vance North Carolina Municipal Income Fund
| | | | | | | | | | | | | | | | |
| | | Beginning
Account Value
(3/1/20) | | | Ending
Account Value
(8/31/20) | | | Expenses Paid
During Period*
(3/1/20 – 8/31/20) | | | Annualized
Expense
Ratio | |
| | | | |
Actual | | | | | | | | | | | | | | | | |
Class A | | $ | 1,000.00 | | | $ | 997.90 | | | $ | 3.36 | | | | 0.67 | % |
Class C | | $ | 1,000.00 | | | $ | 994.20 | | | $ | 7.12 | | | | 1.42 | % |
Class I | | $ | 1,000.00 | | | $ | 998.90 | | | $ | 2.36 | | | | 0.47 | % |
| | | | | |
Hypothetical | | | | | | | | | | | | | | | | |
(5% return per year before expenses) | | | | | | | | | | | | | | | | |
Class A | | $ | 1,000.00 | | | $ | 1,021.80 | | | $ | 3.41 | | | | 0.67 | % |
Class C | | $ | 1,000.00 | | | $ | 1,018.00 | | | $ | 7.20 | | | | 1.42 | % |
Class I | | $ | 1,000.00 | | | $ | 1,022.80 | | | $ | 2.39 | | | | 0.47 | % |
| * | Expenses are equal to the Fund’s annualized expense ratio for the indicated Class, multiplied by the average account value over the period, multiplied by 184/366 (to reflect the one-half year period). The Example assumes that the $1,000 was invested at the net asset value per share determined at the close of business on February 29, 2020. |
Eaton Vance Oregon Municipal Income Fund
| | | | | | | | | | | | | | | | |
| | | Beginning
Account Value
(3/1/20) | | | Ending
Account Value
(8/31/20) | | | Expenses Paid
During Period*
(3/1/20 – 8/31/20) | | | Annualized
Expense
Ratio | |
| | | | |
Actual | | | | | | | | | | | | | | | | |
Class A | | $ | 1,000.00 | | | $ | 1,010.70 | | | $ | 3.34 | | | | 0.66 | % |
Class C | | $ | 1,000.00 | | | $ | 1,006.00 | | | $ | 7.11 | | | | 1.41 | % |
Class I | | $ | 1,000.00 | | | $ | 1,011.60 | | | $ | 2.33 | | | | 0.46 | % |
| | | | | |
Hypothetical | | | | | | | | | | | | | | | | |
(5% return per year before expenses) | | | | | | | | | | | | | | | | |
Class A | | $ | 1,000.00 | | | $ | 1,021.80 | | | $ | 3.35 | | | | 0.66 | % |
Class C | | $ | 1,000.00 | | | $ | 1,018.00 | | | $ | 7.15 | | | | 1.41 | % |
Class I | | $ | 1,000.00 | | | $ | 1,022.80 | | | $ | 2.34 | | | | 0.46 | % |
| * | Expenses are equal to the Fund’s annualized expense ratio for the indicated Class, multiplied by the average account value over the period, multiplied by 184/366 (to reflect the one-half year period). The Example assumes that the $1,000 was invested at the net asset value per share determined at the close of business on February 29, 2020. |
Eaton Vance
Municipal Income Funds
August 31, 2020
Fund Expenses — continued
Eaton Vance South Carolina Municipal Income Fund
| | | | | | | | | | | | | | | | |
| | | Beginning
Account Value
(3/1/20) | | | Ending
Account Value
(8/31/20) | | | Expenses Paid
During Period*
(3/1/20 – 8/31/20) | | | Annualized
Expense
Ratio | |
| | | | |
Actual | | | | | | | | | | | | | | | | |
Class A | | $ | 1,000.00 | | | $ | 1,007.40 | | | $ | 3.43 | | | | 0.68 | % |
Class C | | $ | 1,000.00 | | | $ | 1,003.80 | | | $ | 7.20 | | | | 1.43 | % |
Class I | | $ | 1,000.00 | | | $ | 1,009.50 | | | $ | 2.42 | | | | 0.48 | % |
| | | | | |
Hypothetical | | | | | | | | | | | | | | | | |
(5% return per year before expenses) | | | | | | | | | | | | | | | | |
Class A | | $ | 1,000.00 | | | $ | 1,021.70 | | | $ | 3.46 | | | | 0.68 | % |
Class C | | $ | 1,000.00 | | | $ | 1,017.90 | | | $ | 7.25 | | | | 1.43 | % |
Class I | | $ | 1,000.00 | | | $ | 1,022.70 | | | $ | 2.44 | | | | 0.48 | % |
| * | Expenses are equal to the Fund’s annualized expense ratio for the indicated Class, multiplied by the average account value over the period, multiplied by 184/366 (to reflect the one-half year period). The Example assumes that the $1,000 was invested at the net asset value per share determined at the close of business on February 29, 2020. |
Eaton Vance Virginia Municipal Income Fund
| | | | | | | | | | | | | | | | |
| | | Beginning
Account Value
(3/1/20) | | | Ending
Account Value
(8/31/20) | | | Expenses Paid
During Period*
(3/1/20 – 8/31/20) | | | Annualized
Expense
Ratio | |
| | | | |
Actual | | | | | | | | | | | | | | | | |
Class A | | $ | 1,000.00 | | | $ | 1,006.10 | | | $ | 3.73 | | | | 0.74 | % |
Class C | | $ | 1,000.00 | | | $ | 1,000.80 | | | $ | 7.49 | | | | 1.49 | % |
Class I | | $ | 1,000.00 | | | $ | 1,005.90 | | | $ | 2.72 | | | | 0.54 | % |
| | | | | |
Hypothetical | | | | | | | | | | | | | | | | |
(5% return per year before expenses) | | | | | | | | | | | | | | | | |
Class A | | $ | 1,000.00 | | | $ | 1,021.40 | | | $ | 3.76 | | | | 0.74 | % |
Class C | | $ | 1,000.00 | | | $ | 1,017.60 | | | $ | 7.56 | | | | 1.49 | % |
Class I | | $ | 1,000.00 | | | $ | 1,022.40 | | | $ | 2.75 | | | | 0.54 | % |
| * | Expenses are equal to the Fund’s annualized expense ratio for the indicated Class, multiplied by the average account value over the period, multiplied by 184/366 (to reflect the one-half year period). The Example assumes that the $1,000 was invested at the net asset value per share determined at the close of business on February 29, 2020. |
Eaton Vance
Georgia Municipal Income Fund
August 31, 2020
Portfolio of Investments
| | | | | | | | |
| Tax-Exempt Investments — 96.3% | |
| Security | | Principal
Amount
(000’s omitted) | | | Value | |
|
| Education — 8.6% | |
| | |
Cobb County Development Authority, (TUFF Cobb Research Campus - Georgia Tech Research Corp.), 4.00%, 9/1/34 | | $ | 1,000 | | | $ | 1,199,590 | |
| | |
Fulton County Development Authority, (Georgia Tech Facilities, Inc.), 5.00%, 6/15/36 | | | 425 | | | | 540,115 | |
| | |
Fulton County Development Authority, (Georgia Tech Facilities, Inc.), 5.00%, 6/15/37 | | | 520 | | | | 658,580 | |
| | |
Georgia Private Colleges and Universities Authority, (Emory University), 0.51%, (SIFMA + 0.42%), 8/16/22 (Put Date), 10/1/39(1) | | | 2,000 | | | | 1,995,900 | |
| | |
Georgia Private Colleges and Universities Authority, (Emory University), 5.00%, 10/1/31 | | | 245 | | | | 302,460 | |
| | |
Georgia Private Colleges and Universities Authority, (Emory University), 5.00%, 9/1/37 | | | 1,000 | | | | 1,301,580 | |
| | |
Georgia Private Colleges and Universities Authority, (Emory University), 5.00%, 10/1/38 | | | 1,000 | | | | 1,208,350 | |
| | |
Unified Government of Athens-Clarke County Development Authority, (UGAREF Central Precinct, LLC), 5.00%, 6/15/31 | | | 1,200 | | | | 1,450,524 | |
| | |
| | | | | | | $ | 8,657,099 | |
|
| Electric Utilities — 1.9% | |
| | |
Burke County Development Authority, (Oglethorpe Power Corp.), 3.25% to 2/3/25 (Put Date), 11/1/45 | | $ | 1,000 | | | $ | 1,080,890 | |
| | |
Georgia Municipal Gas Authority, (Gas Portfolio III), 5.00%, 10/1/27 | | | 750 | | | | 819,278 | |
| | |
| | | | | | | $ | 1,900,168 | |
|
| Escrowed / Prerefunded — 4.6% | |
| | |
Columbus, Water and Sewerage Revenue, Prerefunded to 5/1/24, 5.00%, 5/1/33 | | $ | 500 | | | $ | 585,965 | |
| | |
Forsyth County Hospital Authority, (Georgia Baptist Health Care System), Escrowed to Maturity, 6.375%, 10/1/28 | | | 740 | | | | 916,697 | |
| | |
Fulton County Development Authority, (Georgia Tech Foundation Campus Recreation Center Project), Prerefunded to 11/1/21, 5.00%, 11/1/30 | | | 750 | | | | 791,648 | |
| | |
Fulton County Development Authority, (Georgia Tech Foundation Technology Square Project), Prerefunded to 5/1/22, 5.00%, 11/1/30 | | | 750 | | | | 808,717 | |
| | |
Jefferson City School District, Prerefunded to 2/1/21, 5.25%, 2/1/33 | | | 1,500 | | | | 1,531,380 | |
| | |
| | | | | | | $ | 4,634,407 | |
|
| General Obligations — 21.6% | |
| | |
Bleckley County School District, 5.00%, 10/1/42 | | $ | 1,000 | | | $ | 1,307,570 | |
| | |
Bryan County School District, 4.00%, 8/1/33 | | | 500 | | | | 575,790 | |
| | |
Bryan County School District, 4.00%, 8/1/34 | | | 435 | | | | 498,562 | |
| | | | | | | | |
| Security | | Principal
Amount
(000’s omitted) | | | Value | |
| | |
| General Obligations (continued) | | | | | | |
| | |
Cherokee County School System, 5.00%, 2/1/29 | | $ | 1,000 | | | $ | 1,198,760 | |
| | |
Cherokee County School System, 5.00%, 2/1/33 | | | 500 | | | | 671,755 | |
| | |
Columbia County, 5.00%, 1/1/28 | | | 1,000 | | | | 1,276,080 | |
| | |
DeKalb County, (Special Transportation, Parks and Greenspace and Libraries Tax District), 5.00%, 12/1/27 | | | 1,000 | | | | 1,259,800 | |
| | |
Forsyth County Public Facilities Authority, (Forsyth County School District), 4.00%, 2/1/31 | | | 290 | | | | 337,923 | |
| | |
Forsyth County School District, 5.00%, 2/1/32 | | | 1,000 | | | | 1,292,970 | |
| | |
Forsyth County School District, 5.00%, 2/1/37 | | | 500 | | | | 634,300 | |
| | |
Fulton County, 5.00%, 7/1/31 | | | 1,000 | | | | 1,263,320 | |
| | |
Gainesville School District, 4.00%, 11/1/37(2) | | | 1,000 | | | | 1,225,160 | |
| | |
Georgia, 2.00%, 8/1/27 | | | 315 | | | | 315,340 | |
| | |
Georgia, 4.00%, 7/1/35 | | | 1,000 | | | | 1,207,230 | |
| | |
Georgia, 5.00%, 2/1/28 | | | 1,500 | | | | 1,796,895 | |
| | |
Gilmer County School District, 5.00%, 12/1/25 | | | 400 | | | | 497,192 | |
| | |
Hall County School District, 4.00%, 2/1/38 | | | 1,000 | | | | 1,239,650 | |
| | |
Harris County School District, 4.00%, 3/1/33 | | | 275 | | | | 341,220 | |
| | |
Heard County Public Facilities Authority, (Heard County School District), 4.00%, 3/1/30 | | | 575 | | | | 697,383 | |
| | |
Jackson County School District, 5.00%, 3/1/30 | | | 1,000 | | | | 1,335,510 | |
| | |
Jackson County School District, 5.00%, 3/1/32 | | | 1,000 | | | | 1,319,040 | |
| | |
Valdosta School System, 5.00%, 2/1/28 | | | 1,000 | | | | 1,230,780 | |
| | |
Worth County School District, 5.00%, 12/1/37 | | | 235 | | | | 288,634 | |
| | |
| | | | | | | $ | 21,810,864 | |
|
| Hospital — 17.5% | |
| | |
Augusta Development Authority, (AU Health System, Inc.), 5.00%, 7/1/29 | | $ | 560 | | | $ | 670,096 | |
| | |
Brookhaven Development Authority, (Children’s Healthcare of Atlanta), 5.00%, 7/1/39 | | | 500 | | | | 625,875 | |
| | |
Carroll City-County Hospital Authority, (Tanner Medical Center, Inc.), 3.00%, 7/1/38 | | | 500 | | | | 535,085 | |
| | |
Carroll City-County Hospital Authority, (Tanner Medical Center, Inc.), 4.00%, 7/1/37 | | | 500 | | | | 593,220 | |
| | |
Carroll City-County Hospital Authority, (Tanner Medical Center, Inc.), 5.00%, 7/1/29 | | | 500 | | | | 613,520 | |
| | |
Cedartown Polk County Hospital Authority, (Polk Medical Center), 5.00%, 7/1/39 | | | 850 | | | | 961,112 | |
| | |
Cobb County Kennestone Hospital Authority, (WellStar Health System, Inc.), 5.00%, 4/1/36 | | | 500 | | | | 600,235 | |
| | |
Dalton-Whitfield County Joint Development Authority, (Hamilton Health Care System), 4.00%, 8/15/34 | | | 400 | | | | 459,100 | |
| | |
DeKalb Private Hospital Authority, (Children’s Healthcare of Atlanta), 4.00%, 7/1/39 | | | 1,865 | | | | 2,149,077 | |
| | |
Fulton County Development Authority, (Piedmont Healthcare, Inc.), 5.00%, 7/1/32 | | | 1,500 | | | | 1,787,820 | |
| | | | |
| | 23 | | See Notes to Financial Statements. |
Eaton Vance
Georgia Municipal Income Fund
August 31, 2020
Portfolio of Investments — continued
| | | | | | | | |
| Security | | Principal
Amount
(000’s omitted) | | | Value | |
| | |
| Hospital (continued) | | | | | | |
| | |
Fulton County Development Authority, (WellStar Health System, Inc.), 5.00%, 4/1/37 | | $ | 1,250 | | | $ | 1,496,350 | |
| | |
Gainesville and Hall County Hospital Authority, (Northeast Georgia Health System, Inc.), 4.00%, 2/15/37 | | | 1,500 | | | | 1,739,820 | |
| | |
Gainesville and Hall County Hospital Authority, (Northeast Georgia Health System, Inc.), 5.00%, 2/15/37 | | | 1,000 | | | | 1,185,800 | |
| | |
Glynn-Brunswick Memorial Hospital Authority, (Southeast Georgia Health System), 4.00%, 8/1/37 | | | 250 | | | | 282,880 | |
| | |
Glynn-Brunswick Memorial Hospital Authority, (Southeast Georgia Health System), 4.00%, 8/1/38 | | | 500 | | | | 563,825 | |
| | |
Glynn-Brunswick Memorial Hospital Authority, (Southeast Georgia Health System), 5.00%, 8/1/28 | | | 650 | | | | 758,843 | |
| | |
Richmond County Hospital Authority, (University Health Services, Inc.), 5.00%, 1/1/31 | | | 1,260 | | | | 1,504,364 | |
| | |
Savannah Hospital Authority, (St. Joseph’s/Candler Health System, Inc.), 4.00%, 7/1/43 | | | 500 | | | | 548,485 | |
| | |
Savannah Hospital Authority, (St. Joseph’s/Candler Health System, Inc.), 5.50%, 7/1/30 | | | 500 | | | | 551,680 | |
| | |
| | | | | | | $ | 17,627,187 | |
|
| Industrial Development Revenue — 4.5% | |
| | |
Albany Dougherty Payroll Development Authority, Solid Waste Disposal, (Procter & Gamble), (AMT), 5.20%, 5/15/28 | | $ | 2,000 | | | $ | 2,522,360 | |
| | |
Monroe County Development Authority, (Georgia Power Co.), 2.25%, 7/1/25 | | | 1,000 | | | | 1,030,070 | |
| | |
Monroe County Development Authority, (Oglethorpe Power Corp.), 1.50% to 2/3/25 (Put Date), 1/1/39 | | | 500 | | | | 502,825 | |
| | |
Rockdale County Development Authority, (Pratt Paper, LLC), (AMT), 4.00%, 1/1/38(3) | | | 500 | | | | 523,605 | |
| | |
| | | | | | | $ | 4,578,860 | |
|
| Insured – Education — 1.1% | |
| | |
Savannah Economic Development Authority, (SSU Community Development I, LLC), (AGM), 5.25%, 6/15/27 | | $ | 1,125 | | | $ | 1,129,331 | |
| | |
| | | | | | | $ | 1,129,331 | |
|
| Insured – Electric Utilities — 4.2% | |
| | |
Griffin, Combined Public Utility Revenue, (AGM), 5.00%, 1/1/28 | | $ | 1,000 | | | $ | 1,106,280 | |
| | |
Newnan, Water, Sewerage and Light Commission, (AMBAC), 5.25%, 1/1/24 | | | 1,040 | | | | 1,199,817 | |
| | |
Puerto Rico Electric Power Authority, (NPFG), 5.25%, 7/1/29 | | | 980 | | | | 1,009,527 | |
| | |
Puerto Rico Electric Power Authority, (NPFG), 5.25%, 7/1/34 | | | 550 | | | | 564,141 | |
| | |
Puerto Rico Electric Power Authority, (NPFG), 5.25%, 7/1/35 | | | 300 | | | | 307,200 | |
| | |
| | | | | | | $ | 4,186,965 | |
| | | | | | | | |
| Security | | Principal
Amount
(000’s omitted) | | | Value | |
|
| Insured – General Obligations — 1.7% | |
| | |
Coweta County, Water and Sewerage Authority, (AGM), 5.00%, 6/1/26 | | $ | 1,135 | | | $ | 1,420,963 | |
| | |
Puerto Rico Public Buildings Authority, (NPFG), 6.00%, 7/1/24 | | | 295 | | | | 302,670 | |
| | |
| | | | | | | $ | 1,723,633 | |
|
| Insured – Lease Revenue / Certificates of Participation — 2.4% | |
| | |
East Point Building Authority, (Water and Sewer Project), (AGM), 5.00%, 2/1/35 | | $ | 695 | | | $ | 843,070 | |
| | |
Georgia Local Government 1998A Grantor Trust, Certificates of Participation, (NPFG), 4.75%, 6/1/28 | | | 1,428 | | | | 1,614,411 | |
| | |
| | | | | | | $ | 2,457,481 | |
|
| Insured – Special Tax Revenue — 0.7% | |
| | |
Puerto Rico Infrastructure Financing Authority, (AMBAC), 0.00%, 7/1/28 | | $ | 160 | | | $ | 112,757 | |
| | |
Puerto Rico Infrastructure Financing Authority, (AMBAC), 5.50%, 7/1/28 | | | 545 | | | | 594,175 | |
| | |
| | | | | | | $ | 706,932 | |
|
| Insured – Transportation — 0.1% | |
| | |
Puerto Rico Highway and Transportation Authority, (NPFG), 4.625%, 7/1/23 | | $ | 100 | | | $ | 100,799 | |
| | |
| | | | | | | $ | 100,799 | |
|
| Insured – Water and Sewer — 3.7% | |
| | |
Buford, Combined Utility System Revenue, (AGM), 4.00%, 7/1/37 | | $ | 500 | | | $ | 588,960 | |
| | |
DeKalb County, Water and Sewerage Revenue, (AGM), 5.25%, 10/1/32 | | | 1,590 | | | | 1,964,684 | |
| | |
Etowah Water and Sewer Authority, (BAM), 4.00%, 3/1/35 | | | 500 | | | | 583,405 | |
| | |
Henry County Water and Sewerage Authority, (NPFG), 5.25%, 2/1/25 | | | 500 | | | | 606,060 | |
| | |
| | | | | | | $ | 3,743,109 | |
|
| Lease Revenue / Certificates of Participation — 6.0% | |
| | |
Atlanta & Fulton County Recreation Authority, (Zoo Atlanta Parking Facility), 5.00%, 12/1/36 | | $ | 1,000 | | | $ | 1,251,570 | |
| | |
Downtown Savannah Authority, 4.00%, 8/1/25 | | | 2,495 | | | | 2,937,438 | |
| | |
Downtown Savannah Authority, (Chatham County Judicial Complex), 5.00%, 6/1/31 | | | 1,000 | | | | 1,231,330 | |
| | |
Georgia Municipal Association, Inc., Certificates of Participation, (Atlanta Public Safety), 5.00%, 12/1/37 | | | 500 | | | | 620,200 | |
| | |
| | | | | | | $ | 6,040,538 | |
| | | | |
| | 24 | | See Notes to Financial Statements. |
Eaton Vance
Georgia Municipal Income Fund
August 31, 2020
Portfolio of Investments — continued
| | | | | | | | |
| Security | | Principal
Amount
(000’s omitted) | | | Value | |
|
| Other Revenue — 1.2% | |
| | |
Sandy Springs Public Facilities Authority, (City Center Project), 5.00%, 5/1/35 | | $ | 1,000 | | | $ | 1,219,860 | |
| | |
| | | | | | | $ | 1,219,860 | |
|
| Senior Living / Life Care — 0.9% | |
| | |
Gainesville and Hall County Development Authority, (ACTS Retirement-Life Communities, Inc. Obligated Group), 5.00%, 11/15/33 | | $ | 500 | | | $ | 552,915 | |
| | |
Savannah Economic Development Authority, (Marshes of Skidaway Island), 6.00%, 1/1/24 | | | 345 | | | | 358,876 | |
| | |
| | | | | | | $ | 911,791 | |
|
| Special Tax Revenue — 4.4% | |
| | |
Atlanta Development Authority, (New Downtown Atlanta Stadium), 5.00%, 7/1/29 | | $ | 750 | | | $ | 842,663 | |
| | |
Metropolitan Atlanta Rapid Transit Authority, Sales Tax Revenue, 5.00%, 7/1/42 | | | 1,000 | | | | 1,178,640 | |
| | |
Metropolitan Atlanta Rapid Transit Authority, Sales Tax Revenue, 5.00%, 7/1/43 | | | 1,000 | | | | 1,198,080 | |
| | |
Unified Government of Athens-Clarke County Development Authority, (Economic Development Projects), 5.00%, 6/1/32 | | | 1,080 | | | | 1,164,056 | |
| | |
| | | | | | | $ | 4,383,439 | |
|
| Transportation — 2.8% | |
| | |
Atlanta, Airport Revenue, 5.00%, 1/1/31 | | $ | 1,000 | | | $ | 1,129,850 | |
| | |
Atlanta, Airport Revenue, (AMT), 4.00%, 7/1/39 | | | 600 | | | | 683,094 | |
| | |
Georgia State Road and Tollway Authority, 5.00%, 6/1/29 | | | 835 | | | | 1,047,641 | |
| | |
| | | | | | | $ | 2,860,585 | |
|
| Water and Sewer — 8.4% | |
| | |
Atlanta, Water and Wastewater Revenue, 5.00%, 11/1/29 | | $ | 1,000 | | | $ | 1,292,490 | |
| | |
Atlanta, Water and Wastewater Revenue, 5.25%, 11/1/30 | | | 1,000 | | | | 1,147,920 | |
| | |
Cobb County-Marietta Water Authority, 5.00%, 11/1/28 | | | 375 | | | | 458,160 | |
| | |
Columbus, Water and Sewerage Revenue, 5.00%, 5/1/36 | | | 250 | | | | 301,335 | |
| | |
Forsyth County Water and Sewerage Authority, 5.00%, 4/1/27 | | | 1,100 | | | | 1,284,767 | |
| | |
Fulton County, Water and Sewerage Revenue, 3.00%, 1/1/37 | | | 1,000 | | | | 1,121,020 | |
| | |
Fulton County, Water and Sewerage Revenue, 5.00%, 1/1/33 | | | 1,500 | | | | 1,640,220 | |
| | |
Unified Government of Athens-Clarke County, Water and Sewerage Revenue, 5.00%, 1/1/29 | | | 1,000 | | | | 1,178,770 | |
| | |
| | | | | | | $ | 8,424,682 | |
| |
Total Tax-Exempt Investments — 96.3%
(identified cost $90,546,519) | | | $ | 97,097,730 | |
| |
Other Assets, Less Liabilities — 3.7% | | | $ | 3,782,904 | |
| |
Net Assets — 100.0% | | | $ | 100,880,634 | |
The percentage shown for each investment category in the Portfolio of Investments is based on net assets.
The Fund invests primarily in debt securities issued by Georgia municipalities. The ability of the issuers of the debt securities to meet their obligations may be affected by economic developments in a specific industry or municipality. At August 31, 2020, 14.5% of total investments are backed by bond insurance of various financial institutions and financial guaranty assurance agencies. The aggregate percentage insured by an individual financial institution or financial guaranty assurance agency ranged from 0.6% to 7.3% of total investments.
| (1) | Floating rate security. The stated interest rate represents the rate in effect at August 31, 2020. |
| (2) | When-issued security. |
| (3) | Security exempt from registration pursuant to Rule 144A under the Securities Act of 1933, as amended. These securities may be sold in certain transactions in reliance on an exemption from registration (normally to qualified institutional buyers). At August 31, 2020, the aggregate value of these securities is $523,605 or 0.5% of the Fund’s net assets. |
Abbreviations:
| | | | |
| | |
| AGM | | – | | Assured Guaranty Municipal Corp. |
| | |
| AMBAC | | – | | AMBAC Financial Group, Inc. |
| | |
| AMT | | – | | Interest earned from these securities may be considered a tax preference item for purposes of the Federal Alternative Minimum Tax. |
| | |
| BAM | | – | | Build America Mutual Assurance Co. |
| | |
| NPFG | | – | | National Public Finance Guarantee Corp. |
| | |
| SIFMA | | – | | Securities Industry and Financial Markets Association Municipal Swap Index |
| | | | |
| | 25 | | See Notes to Financial Statements. |
Eaton Vance
Maryland Municipal Income Fund
August 31, 2020
Portfolio of Investments
| | | | | | | | |
| Tax-Exempt Municipal Securities — 91.6% | |
| Security | | Principal
Amount
(000’s omitted) | | | Value | |
|
| Bond Bank — 1.7% | |
| | |
Maryland Community Development Administration, (Local Government Infrastructure), 4.00%, 6/1/40 | | $ | 1,000 | | | $ | 1,181,730 | |
| |
| | | | $ | 1,181,730 | |
|
| Education — 9.6% | |
| | |
Maryland Health and Higher Educational Facilities Authority, (Goucher College), 5.00%, 7/1/34 | | $ | 1,000 | | | $ | 1,048,050 | |
| | |
Maryland Health and Higher Educational Facilities Authority, (Johns Hopkins University), Prerefunded to 7/1/22, 5.00%, 7/1/37 | | | 900 | | | | 979,245 | |
| | |
Maryland Health and Higher Educational Facilities Authority, (Loyola University Maryland), 5.00%, 10/1/49 | | | 1,000 | | | | 1,183,960 | |
| | |
Maryland Industrial Development Financing Authority, (Garrison Forest School, Inc.), 4.00%, 11/1/42 | | | 1,000 | | | | 1,122,560 | |
| | |
Maryland Industrial Development Financing Authority, (McDonogh School), 4.00%, 9/1/43 | | | 1,100 | | | | 1,266,474 | |
| | |
University System of Maryland, 4.00%, 4/1/34 | | | 1,000 | | | | 1,153,820 | |
| |
| | | | $ | 6,754,109 | |
|
| Escrowed / Prerefunded — 6.2% | |
| | |
Baltimore, Prerefunded to 10/15/22, 5.00%, 10/15/27 | | $ | 150 | | | $ | 165,221 | |
| | |
Maryland Health and Higher Educational Facilities Authority, (Charlestown Community, Inc.), Prerefunded to 1/1/21, 6.125%, 1/1/30 | | | 470 | | | | 479,179 | |
| | |
Maryland Health and Higher Educational Facilities Authority, (Johns Hopkins Health Care), Prerefunded to 7/1/22, 5.00%, 7/1/33 | | | 1,000 | | | | 1,087,080 | |
| | |
Montgomery County, Prerefunded to 11/1/24, 5.00%, 11/1/29 | | | 1,000 | | | | 1,196,170 | |
| | |
University of Maryland, Auxiliary Facility and Tuition Revenue, Prerefunded to 4/1/21, 5.00%, 4/1/28 | | | 1,425 | | | | 1,464,330 | |
| |
| | | | $ | 4,391,980 | |
|
| General Obligations — 20.8% | |
| | |
Anne Arundel County, 5.00%, 10/1/36 | | $ | 1,000 | | | $ | 1,258,160 | |
| | |
Anne Arundel County, 5.00%, 10/1/44 | | | 1,000 | | | | 1,295,880 | |
| | |
Baltimore, 4.00%, 10/15/25 | | | 1,350 | | | | 1,453,680 | |
| | |
Baltimore County, 4.00%, 3/1/40 | | | 1,000 | | | | 1,191,280 | |
| | |
Baltimore County, 5.00%, 11/1/31 | | | 1,000 | | | | 1,356,600 | |
| | |
Caroline County, 3.00%, 1/15/37 | | | 1,335 | | | | 1,464,348 | |
| | |
Frederick County, 5.00%, 8/1/24 | | | 1,000 | | | | 1,186,530 | |
| | |
Frederick County, 5.00%, 8/1/31 | | | 675 | | | | 961,349 | |
| | |
Howard County, 4.00%, 8/15/36 | | | 1,000 | | | | 1,239,570 | |
| | |
Maryland, Prerefunded to 8/1/22, 5.00%, 8/1/24 | | | 1,000 | | | | 1,091,850 | |
| | |
Montgomery County, (SPA: U.S. Bank, N.A.), 0.01%, 11/1/37(1) | | | 920 | | | | 920,000 | |
| | | | | | | | |
| Security | | Principal
Amount
(000’s omitted) | | | Value | |
|
| General Obligations (continued) | |
| | |
Worcester County, 4.00%, 8/1/33 | | $ | 1,000 | | | $ | 1,233,510 | |
| |
| | | | $ | 14,652,757 | |
|
| Hospital — 10.4% | |
| | |
Maryland Health and Higher Educational Facilities Authority, (Anne Arundel Health System), 5.00%, 7/1/32 | | $ | 1,000 | | | $ | 1,203,680 | |
| | |
Maryland Health and Higher Educational Facilities Authority, (Frederick Health System), 3.25%, 7/1/39 | | | 150 | | | | 150,613 | |
| | |
Maryland Health and Higher Educational Facilities Authority, (Mercy Medical Center), 5.00%, 7/1/31 | | | 1,000 | | | | 1,054,160 | |
| | |
Maryland Health and Higher Educational Facilities Authority, (Peninsula Regional Health System), 4.00%, 7/1/48 | | | 500 | | | | 557,685 | |
| | |
Maryland Health and Higher Educational Facilities Authority, (Peninsula Regional Medical Center), 5.00%, 7/1/45 | | | 1,000 | | | | 1,100,490 | |
| | |
Maryland Health and Higher Educational Facilities Authority, (University of Maryland Medical System), 5.00%, 7/1/29 | | | 1,000 | | | | 1,173,520 | |
| | |
Maryland Health and Higher Educational Facilities Authority, (UPMC), 4.00%, 4/15/45 | | | 500 | | | | 566,390 | |
| | |
Maryland Health and Higher Educational Facilities Authority, (UPMC), 5.00%, 4/15/32 | | | 275 | | | | 354,500 | |
| | |
Montgomery County, (Trinity Health Corp.), 5.00%, 12/1/45 | | | 1,000 | | | | 1,173,670 | |
| |
| | | | $ | 7,334,708 | |
|
| Housing — 7.0% | |
| | |
Howard County Housing Commission, (Woodfield Oxford Square Apartments), 5.00%, 12/1/37 | | $ | 1,000 | | | $ | 1,183,790 | |
| | |
Maryland Community Development Administration, 2.30%, 9/1/35 | | | 1,000 | | | | 1,026,730 | |
| | |
Maryland Community Development Administration, 4.10%, 9/1/38 | | | 335 | | | | 374,483 | |
| | |
Maryland Economic Development Corp., (Bowie State University), Student Housing Revenue, 4.00%, 7/1/50 | | | 315 | | | | 310,392 | |
| | |
Maryland Economic Development Corp., (Bowie State University), Student Housing Revenue, 5.00%, 7/1/55 | | | 1,000 | | | | 1,065,300 | |
| | |
Maryland Economic Development Corp., (Towson University), 5.00%, 7/1/37 | | | 1,000 | | | | 1,006,890 | |
| |
| | | | $ | 4,967,585 | |
|
| Industrial Development Revenue — 0.7% | |
| | |
Maryland Economic Development Corp., (AFCO Cargo), (AMT), 3.50%, 7/1/24(2) | | $ | 490 | | | $ | 504,827 | |
| |
| | | | $ | 504,827 | |
|
| Insured – Electric Utilities — 0.4% | |
| | |
Puerto Rico Electric Power Authority, (AGM), 5.00%, 7/1/23 | | $ | 135 | | | $ | 135,899 | |
| | | | |
| | 26 | | See Notes to Financial Statements. |
Eaton Vance
Maryland Municipal Income Fund
August 31, 2020
Portfolio of Investments — continued
| | | | | | | | |
| Security | | Principal
Amount
(000’s omitted) | | | Value | |
|
| Insured – Electric Utilities (continued) | |
| | |
Puerto Rico Electric Power Authority, (NPFG), 5.25%, 7/1/26 | | $ | 145 | | | $ | 149,514 | |
| |
| | | | $ | 285,413 | |
|
| Insured – Escrowed / Prerefunded — 4.3% | |
| | |
Maryland Health and Higher Educational Facilities Authority, (Helix Health Issue), (AMBAC), Escrowed to Maturity, 5.00%, 7/1/27 | | $ | 2,560 | | | $ | 3,023,386 | |
| |
| | | | $ | 3,023,386 | |
|
| Insured – General Obligations — 1.0% | |
| | |
Puerto Rico, (AGC), 5.00%, 7/1/21 | | $ | 370 | | | $ | 372,157 | |
| | |
Puerto Rico, (AGM), 5.125%, 7/1/30 | | | 195 | | | | 196,359 | |
| | |
Puerto Rico Public Buildings Authority, (NPFG), 6.00%, 7/1/24 | | | 125 | | | | 128,250 | |
| |
| | | | $ | 696,766 | |
|
| Insured – Hospital — 5.7% | |
| | |
Maryland Health and Higher Educational Facilities Authority, (Medlantic/Helix Issue), (AMBAC), 5.25%, 8/15/38 | | $ | 3,035 | | | $ | 4,013,089 | |
| |
| | | | $ | 4,013,089 | |
|
| Insured – Housing — 0.1% | |
| | |
Maryland Economic Development Corp., (University of Maryland, College Park), (AGM), 5.00%, 6/1/35 | | $ | 75 | | | $ | 87,545 | |
| |
| | | | $ | 87,545 | |
|
| Insured – Water and Sewer — 0.4% | |
| | |
Baltimore, (Wastewater Projects), (NPFG), 5.00%, 7/1/22 | | $ | 250 | | | $ | 266,277 | |
| |
| | | | $ | 266,277 | |
|
| Other Revenue — 3.0% | |
| | |
Maryland Transportation Authority, Baltimore-Washington International Airport, Parking Revenues, (AMT), 5.00%, 3/1/23 | | $ | 2,000 | | | $ | 2,115,320 | |
| |
| | | | $ | 2,115,320 | |
|
| Senior Living / Life Care — 8.1% | |
| | |
Baltimore County, (Oak Crest Village, Inc.), 4.00%, 1/1/45 | | $ | 1,000 | | | $ | 1,074,920 | |
| | |
Baltimore County, (Riderwood Village, Inc.), 4.00%, 1/1/39 | | | 1,000 | | | | 1,106,060 | |
| | |
Baltimore County, (Riderwood Village, Inc.), 4.00%, 1/1/40 | | | 95 | | | | 104,839 | |
| | |
Howard County, (Vantage House), 5.00%, 4/1/26 | | | 1,285 | | | | 1,324,976 | |
| | |
Maryland Health and Higher Educational Facilities Authority, (Edenwald), 5.25%, 1/1/37 | | | 500 | | | | 540,170 | |
| | |
Rockville, (Ingleside at King Farm), 5.00%, 11/1/37 | | | 1,000 | | | | 1,010,730 | |
| | | | | | | | |
| Security | | Principal
Amount
(000’s omitted) | | | Value | |
|
| Senior Living / Life Care (continued) | |
| | |
Washington County, (Diakon Lutheran Social Ministries), 5.00%, 1/1/32 | | $ | 500 | | | $ | 572,975 | |
| |
| | | | $ | 5,734,670 | |
|
| Special Tax Revenue — 1.3% | |
| | |
Baltimore, (Harbor Point), 3.625%, 6/1/46(2) | | $ | 1,000 | | | $ | 910,730 | |
| |
| | | | $ | 910,730 | |
|
| Transportation — 9.1% | |
| | |
Maryland Economic Development Corp., (Purple Line Light Rail), (AMT), 5.00%, 3/31/51 | | $ | 1,000 | | | $ | 964,090 | |
| | |
Maryland Economic Development Corp., (Seagirt Marine Terminal), (AMT), 5.00%, 6/1/49 | | | 350 | | | | 378,938 | |
| | |
Maryland Economic Development Corp., (Transportation Facilities), 5.00%, 6/1/32 | | | 500 | | | | 571,345 | |
| | |
Maryland Economic Development Corp., Parking Facilities Revenue, 5.00%, 6/1/58 | | | 1,000 | | | | 1,052,380 | |
| | |
Maryland Transportation Authority, 4.00%, 7/1/27 | | | 1,000 | | | | 1,060,920 | |
| | |
Maryland Transportation Authority, (AMT), 4.00%, 6/1/35 | | | 1,000 | | | | 1,119,470 | |
| | |
Washington Metropolitan Area Transit Authority, 5.00%, 7/1/31 | | | 1,000 | | | | 1,255,810 | |
| |
| | | | $ | 6,402,953 | |
|
| Water and Sewer — 1.8% | |
| | |
Washington Suburban Sanitary District, 5.00%, 6/15/30 | | $ | 1,000 | | | $ | 1,279,370 | |
| |
| | | | $ | 1,279,370 | |
| |
Total Tax-Exempt Municipal Securities — 91.6%
(identified cost $61,211,722) | | | $ | 64,603,215 | |
|
| Taxable Municipal Securities — 2.2% | |
| Security | | Principal
Amount
(000’s omitted) | | | Value | |
|
| Hospital — 1.5% | |
| | |
Maryland Health and Higher Educational Facilities Authority, (University of Maryland Medical System), 3.052%, 7/1/40 | | $ | 1,000 | | | $ | 1,045,220 | |
| |
| | | | $ | 1,045,220 | |
| | | | |
| | 27 | | See Notes to Financial Statements. |
Eaton Vance
Maryland Municipal Income Fund
August 31, 2020
Portfolio of Investments — continued
| | | | | | | | |
| Security | | Principal
Amount
(000’s omitted) | | | Value | |
|
| Transportation — 0.7% | |
| | |
Prince George’s County Revenue Authority, (Regional Medical Center Garage), 2.553%, 8/1/26 | | $ | 275 | | | $ | 280,671 | |
| | |
Prince George’s County Revenue Authority, (Regional Medical Center Garage), 2.593%, 8/1/27 | | | 260 | | | | 266,947 | |
| |
| | | | $ | 547,618 | |
| |
Total Taxable Municipal Securities — 2.2%
(identified cost $1,535,000) | | | $ | 1,592,838 | |
| |
Total Investments — 93.8%
(identified cost $62,746,722) | | | $ | 66,196,053 | |
| |
Other Assets, Less Liabilities — 6.2% | | | $ | 4,349,320 | |
| |
Net Assets — 100.0% | | | $ | 70,545,373 | |
The percentage shown for each investment category in the Portfolio of Investments is based on net assets.
The Fund invests primarily in debt securities issued by Maryland municipalities. The ability of the issuers of the debt securities to meet their obligations may be affected by economic developments in a specific industry or municipality. At August 31, 2020, 12.6% of total investments are backed by bond insurance of various financial institutions and financial guaranty assurance agencies. The aggregate percentage insured by an individual financial institution or financial guaranty assurance agency ranged from 0.6% to 10.6% of total investments.
| (1) | Variable rate demand obligation that may be tendered at par on any day for payment the same or next business day. The stated interest rate, which generally resets daily, is determined by the remarketing agent and represents the rate in effect at August 31, 2020. |
| (2) | Security exempt from registration pursuant to Rule 144A under the Securities Act of 1933, as amended. These securities may be sold in certain transactions in reliance on an exemption from registration (normally to qualified institutional buyers). At August 31, 2020, the aggregate value of these securities is $1,415,557 or 2.0% of the Fund’s net assets. |
Abbreviations:
| | | | |
| | |
| AGC | | – | | Assured Guaranty Corp. |
| | |
| AGM | | – | | Assured Guaranty Municipal Corp. |
| | |
| AMBAC | | – | | AMBAC Financial Group, Inc. |
| | |
| AMT | | – | | Interest earned from these securities may be considered a tax preference item for purposes of the Federal Alternative Minimum Tax. |
| | |
| NPFG | | – | | National Public Finance Guarantee Corp. |
| | |
| SPA | | – | | Standby Bond Purchase Agreement |
| | | | |
| | 28 | | See Notes to Financial Statements. |
Eaton Vance
Missouri Municipal Income Fund
August 31, 2020
Portfolio of Investments
| | | | | | | | |
| Tax-Exempt Municipal Securities — 101.4% | |
| Security | | Principal
Amount
(000’s omitted) | | | Value | |
|
| Education — 6.7% | |
| | |
Missouri Health and Educational Facilities Authority, (Saint Louis University), 5.00%, 10/1/36 | | $ | 1,000 | | | $ | 1,228,590 | |
| | |
Missouri Health and Educational Facilities Authority, (University of Central Missouri), 5.00%, 10/1/34 | | | 1,000 | | | | 1,119,950 | |
| | |
Missouri Health and Educational Facilities Authority, (Washington University), (SPA: U.S. Bank, N.A.), 0.02%, 3/1/40(1) | | | 500 | | | | 500,000 | |
| | |
University of Missouri, 5.00%, 11/1/25 | | | 1,000 | | | | 1,192,280 | |
| | |
University of Missouri, 5.00%, 11/1/30 | | | 1,000 | | | | 1,384,630 | |
| |
| | | | $ | 5,425,450 | |
|
| Electric Utilities — 2.8% | |
| | |
Missouri Joint Municipal Electric Utility Commission, (Iatan 2 Project), 5.00%, 1/1/34 | | $ | 1,000 | | | $ | 1,124,580 | |
| | |
Missouri Joint Municipal Electric Utility Commission, (Prairie State Energy Campus), 5.00%, 12/1/31 | | | 1,000 | | | | 1,177,910 | |
| |
| | | | $ | 2,302,490 | |
|
| Escrowed / Prerefunded — 2.5% | |
| | |
Metropolitan St. Louis Sewer District, Prerefunded to 5/1/22, 5.00%, 5/1/30 | | $ | 1,000 | | | $ | 1,080,040 | |
| | |
Missouri Environmental Improvement and Energy Resources Authority, Water Pollution Control and Drinking Water Revenue, (Revolving Funds Program), Prerefunded to 1/1/21, 5.00%, 7/1/30 | | | 970 | | | | 985,404 | |
| |
| | | | $ | 2,065,444 | |
|
| General Obligations — 31.8% | |
| | |
Cape Girardeau County Reorganized School District R-II, 5.00%, 3/1/38 | | $ | 750 | | | $ | 944,662 | |
| | |
Center School District No. 58, 4.00%, 3/1/38 | | | 1,000 | | | | 1,150,980 | |
| | |
Columbia School District, 5.00%, 3/1/31 | | | 1,000 | | | | 1,023,330 | |
| | |
Excelsior Springs School District No. 40, 5.00%, 3/1/39 | | | 820 | | | | 1,070,797 | |
| | |
Fenton Fire Protection District, 4.00%, 3/1/37 | | | 400 | | | | 458,860 | |
| | |
Fenton Fire Protection District, 4.00%, 3/1/38 | | | 500 | | | | 572,165 | |
| | |
Fort Zumwalt School District, 5.00%, 3/1/36 | | | 1,000 | | | | 1,231,530 | |
| | |
Francis Howell R-III School District, 4.00%, 3/1/30 | | | 1,500 | | | | 1,838,655 | |
| | |
Francis Howell R-III School District, 4.00%, 3/1/31(2) | | | 750 | | | | 905,745 | |
| | |
Greene County Reorganized School District No. 2, 5.00%, 3/1/38 | | | 875 | | | | 1,075,567 | |
| | |
Hazelwood School District, 5.00%, 3/1/27 | | | 1,000 | | | | 1,265,570 | |
| | |
Independence School District, 5.50%, 3/1/34 | | | 1,000 | | | | 1,275,860 | |
| | |
Jackson County Reorganized School District No. 7, 4.00%, 3/1/37(2) | | | 1,500 | | | | 1,803,225 | |
| | |
Jefferson City School District, 5.00%, 3/1/36 | | | 1,000 | | | | 1,198,890 | |
| | | | | | | | |
| Security | | Principal
Amount
(000’s omitted) | | | Value | |
|
| General Obligations (continued) | |
| | |
Jefferson City School District, 5.00%, 3/1/38 | | $ | 500 | | | $ | 611,125 | |
| | |
Joplin Schools, 5.00%, 3/1/30 | | | 1,000 | | | | 1,274,740 | |
| | |
Kansas City, 3.125%, 2/1/39 | | | 1,000 | | | | 1,082,540 | |
| | |
Kansas City, 5.00%, 2/1/32 | | | 450 | | | | 572,954 | |
| | |
Lake Ozark Osage School, (School Building), 5.00%, 3/1/34 | | | 1,000 | | | | 1,134,160 | |
| | |
Maplewood Richmond Heights School District, 3.00%, 3/1/34(2) | | | 250 | | | | 275,080 | |
| | |
Maplewood Richmond Heights School District, 3.00%, 3/1/35(2) | | | 250 | | | | 274,143 | |
| | |
Maplewood Richmond Heights School District, 4.00%, 3/1/31(2) | | | 100 | | | | 117,552 | |
| | |
Raytown C-2 School District, 5.00%, 3/1/39 | | | 1,000 | | | | 1,284,870 | |
| | |
Springfield School District No. R-12, 5.00%, 3/1/33 | | | 1,000 | | | | 1,113,660 | |
| | |
University City School District, 0.00%, 2/15/32 | | | 1,000 | | | | 832,280 | |
| | |
University City School District, 0.00%, 2/15/33 | | | 1,000 | | | | 805,530 | |
| | |
Wentzville R-IV School District, 0.00%, 3/1/27 | | | 805 | | | | 714,276 | |
| |
| | | | $ | 25,908,746 | |
|
| Hospital — 14.0% | |
| | |
Cape Girardeau County Industrial Development Authority, (St. Francis Medical Center), 5.00%, 6/1/37 | | $ | 1,000 | | | $ | 1,052,700 | |
| | |
Cape Girardeau County Industrial Development Authority, (St. Francis Medical Center), 5.00%, 6/1/39 | | | 1,000 | | | | 1,162,220 | |
| | |
Missouri Health and Educational Facilities Authority, (BJC Health System), 4.15%, 1/1/32 | | | 1,000 | | | | 1,088,920 | |
| | |
Missouri Health and Educational Facilities Authority, (BJC Health System), 5.00%, 1/1/30 | | | 1,000 | | | | 1,123,450 | |
| | |
Missouri Health and Educational Facilities Authority, (Children’s Mercy Hospital), 4.00%, 5/15/42 | | | 1,000 | | | | 1,097,560 | |
| | |
Missouri Health and Educational Facilities Authority, (CoxHealth), 4.00%, 11/15/39 | | | 1,250 | | | | 1,420,438 | |
| | |
Missouri Health and Educational Facilities Authority, (Heartland Regional Medical Center), 5.00%, 2/15/37 | | | 1,000 | | | | 1,045,320 | |
| | |
Missouri Health and Educational Facilities Authority, (Mercy Health), 5.00%, 11/15/47 | | | 1,000 | | | | 1,186,870 | |
| | |
Missouri Health and Educational Facilities Authority, (Saint Luke’s Health System), 4.00%, 11/15/33 | | | 1,480 | | | | 1,660,826 | |
| | |
Missouri Health and Educational Facilities Authority, (Saint Luke’s Health System), 4.00%, 11/15/42 | | | 500 | | | | 551,200 | |
| |
| | | | $ | 11,389,504 | |
|
| Housing — 4.9% | |
| | |
Missouri Housing Development Commission, SFMR, (FHLMC), (FNMA), (GNMA), 2.35%, 11/1/35 | | $ | 940 | | | $ | 974,667 | |
| | |
Missouri Housing Development Commission, SFMR, (FHLMC), (FNMA), (GNMA), 3.00%, 11/1/39 | | | 960 | | | | 1,023,523 | |
| | |
Missouri Housing Development Commission, SFMR, (FHLMC), (FNMA), (GNMA), 3.00%, 11/1/44 | | | 990 | | | | 1,037,491 | |
| | | | |
| | 29 | | See Notes to Financial Statements. |
Eaton Vance
Missouri Municipal Income Fund
August 31, 2020
Portfolio of Investments — continued
| | | | | | | | |
| Security | | Principal
Amount
(000’s omitted) | | | Value | |
|
| Housing (continued) | |
| | |
Missouri Housing Development Commission, SFMR, (FHLMC), (FNMA), (GNMA), 3.75%, 11/1/43 | | $ | 895 | | | $ | 973,751 | |
| |
| | | | $ | 4,009,432 | |
|
| Industrial Development Revenue — 2.5% | |
| | |
Missouri Development Finance Authority, Solid Waste Disposal, (Procter & Gamble Paper Products), (AMT), 5.20%, 3/15/29 | | $ | 1,540 | | | $ | 2,023,853 | |
| |
| | | | $ | 2,023,853 | |
|
| Insured – Education — 0.3% | |
| | |
Missouri Southern State University, (AGM), 4.00%, 10/1/37 | | $ | 85 | | | $ | 94,777 | |
| | |
Missouri Southern State University, (AGM), 4.00%, 10/1/38 | | | 70 | | | | 77,808 | |
| | |
Missouri Southern State University, (AGM), 4.00%, 10/1/39 | | | 55 | | | | 60,956 | |
| |
| | | | $ | 233,541 | |
|
| Insured – Electric Utilities — 1.6% | |
| | |
Puerto Rico Electric Power Authority, (NPFG), 5.25%, 7/1/29 | | $ | 950 | | | $ | 978,623 | |
| | |
Puerto Rico Electric Power Authority, (NPFG), 5.25%, 7/1/34 | | | 280 | | | | 287,199 | |
| |
| | | | $ | 1,265,822 | |
|
| Insured – Escrowed / Prerefunded — 4.1% | |
| | |
Missouri Health and Educational Facilities Authority, (Lester Cox Medical Center), (NPFG), Escrowed to Maturity, 0.00%, 9/1/20 | | $ | 3,340 | | | $ | 3,340,000 | |
| |
| | | | $ | 3,340,000 | |
|
| Insured – General Obligations — 1.9% | |
| | |
Francis Howell R-III School District, (NPFG), 5.25%, 3/1/21 | | $ | 1,000 | | | $ | 1,025,390 | |
| | |
Riverview Fire Protection District, (BAM), 3.00%, 3/1/36 | | | 515 | | | | 558,811 | |
| |
| | | | $ | 1,584,201 | |
|
| Insured – Hospital — 2.8% | |
| | |
Missouri Health and Educational Facilities Authority, (Lester Cox Medical Center), (NPFG), 0.00%, 9/1/20 | | $ | 2,250 | | | $ | 2,250,000 | |
| |
| | | | $ | 2,250,000 | |
|
| Insured – Lease Revenue / Certificates of Participation — 7.3% | |
| | |
Jackson County, Leasehold Revenue, (Truman Sports Complex), (AMBAC), 0.00%, 12/1/20 | | $ | 1,000 | | | $ | 997,830 | |
| | |
Kansas City, Leasehold Revenue, (Municipal Assistance), (AMBAC), 0.00%, 4/15/26 | | | 2,170 | | | | 2,037,413 | |
| | |
Kansas City, Leasehold Revenue, (Municipal Assistance), (AMBAC), 0.00%, 4/15/30 | | | 2,105 | | | | 1,791,671 | |
| | | | | | | | |
| Security | | Principal
Amount
(000’s omitted) | | | Value | |
|
| Insured – Lease Revenue / Certificates of Participation (continued) | |
| | |
Sedalia, Certificates of Participation, (BAM), 4.00%, 9/15/37 | | $ | 500 | | | $ | 563,940 | |
| | |
St. Louis Municipal Library District, (BAM), 4.00%, 3/15/34 | | | 300 | | | | 357,540 | |
| | |
St. Louis Municipal Library District, (BAM), 4.00%, 3/15/35 | | | 200 | | | | 236,470 | |
| |
| | | | $ | 5,984,864 | |
|
| Insured – Special Tax Revenue — 3.9% | |
| | |
Bi-State Development Agency, Missouri and Illinois Metropolitan District, (Saint Clair County Metrolink), (AGM), 5.25%, 7/1/28 | | $ | 2,355 | | | $ | 3,157,843 | |
| |
| | | | $ | 3,157,843 | |
|
| Insured – Transportation — 2.9% | |
| | |
Puerto Rico Highway and Transportation Authority, (AGC), 5.25%, 7/1/41 | | $ | 960 | | | $ | 1,035,110 | |
| | |
Saint Louis Airport, (Lambert International Airport), (NPFG), 5.50%, 7/1/30 | | | 1,000 | | | | 1,340,420 | |
| |
| | | | $ | 2,375,530 | |
|
| Lease Revenue / Certificates of Participation — 3.0% | |
| | |
St. Charles, Certificates of Participation, 4.00%, 2/1/34 | | $ | 1,000 | | | $ | 1,210,300 | |
| | |
Washington, Certificates of Participation, 5.00%, 3/1/28 | | | 940 | | | | 1,210,701 | |
| |
| | | | $ | 2,421,001 | |
|
| Other Revenue — 1.5% | |
| | |
Missouri Development Finance Board, (Nelson Gallery Foundation), (SPA: U.S. Bank, N.A.), 0.03%, 12/1/37(1) | | $ | 1,200 | | | $ | 1,200,000 | |
| |
| | | | $ | 1,200,000 | |
|
| Senior Living / Life Care — 3.6% | |
| | |
Missouri Health and Educational Facilities Authority, (Bethesda Health Group, Inc.), 5.00%, 8/1/40 | | $ | 500 | | | $ | 521,245 | |
| | |
Missouri Health and Educational Facilities Authority, (Lutheran Senior Services), 5.00%, 2/1/35 | | | 1,000 | | | | 1,088,280 | |
| | |
Saint Louis County Industrial Development Authority, (Friendship Village of St. Louis), 5.00%, 9/1/37 | | | 500 | | | | 536,245 | |
| | |
Saint Louis County Industrial Development Authority, (Friendship Village of St. Louis), 5.00%, 9/1/38 | | | 250 | | | | 269,035 | |
| | |
Saint Louis County Industrial Development Authority, (St. Andrew’s Resources for Seniors Obligated Group), 5.00%, 12/1/35 | | | 500 | | | | 492,625 | |
| |
| | | | $ | 2,907,430 | |
|
| Water and Sewer — 3.3% | |
| | |
Kansas City, Water Revenue, 4.00%, 12/1/40 | | $ | 500 | | | $ | 621,315 | |
| | |
Kansas City, Water Revenue, 4.00%, 12/1/41 | | | 550 | | | | 681,032 | |
| | | | |
| | 30 | | See Notes to Financial Statements. |
Eaton Vance
Missouri Municipal Income Fund
August 31, 2020
Portfolio of Investments — continued
| | | | | | | | |
| Security | | Principal
Amount
(000’s omitted) | | | Value | |
|
| Water and Sewer (continued) | |
| | |
Metropolitan St. Louis Sewer District, 5.00%, 5/1/27 | | $ | 1,000 | | | $ | 1,078,850 | |
| | |
Metropolitan St. Louis Sewer District, 5.00%, 5/1/36 | | | 250 | | | | 311,845 | |
| |
| | | | $ | 2,693,042 | |
| |
Total Tax-Exempt Municipal Securities — 101.4%
(identified cost $76,354,322) | | | $ | 82,538,193 | |
|
| Taxable Municipal Securities — 0.0%(3) | |
| Security | | Principal
Amount
(000’s omitted) | | | Value | |
|
| Special Tax Revenue — 0.0%(3) | |
| | |
St. Louis Land Clearance for Redevelopment Authority, (Kiel Opera House Renovation), 5.00%, 10/1/35 | | $ | 30 | | | $ | 26,500 | |
| |
Total Taxable Municipal Securities — 0.0%(3)
(identified cost $29,927) | | | $ | 26,500 | |
| |
Total Investments — 101.4%
(identified cost $76,384,249) | | | $ | 82,564,693 | |
| |
Other Assets, Less Liabilities — (1.4)% | | | $ | (1,167,682 | ) |
| |
Net Assets — 100.0% | | | $ | 81,397,011 | |
The percentage shown for each investment category in the Portfolio of Investments is based on net assets.
The Fund invests primarily in debt securities issued by Missouri municipalities. The ability of the issuers of the debt securities to meet their obligations may be affected by economic developments in a specific industry or municipality. At August 31, 2020, 24.5% of total investments are backed by bond insurance of various financial institutions and financial guaranty assurance agencies. The aggregate percentage insured by an individual financial institution or financial guaranty assurance agency ranged from 1.3% to 11.2% of total investments.
| (1) | Variable rate demand obligation that may be tendered at par on any day for payment the same or next business day. The stated interest rate, which generally resets daily, is determined by the remarketing agent and represents the rate in effect at August 31, 2020. |
| (2) | When-issued security. |
| (3) | Amount is less than 0.05%. |
Abbreviations:
| | | | |
| | |
| AGC | | – | | Assured Guaranty Corp. |
| | |
| AGM | | – | | Assured Guaranty Municipal Corp. |
| | |
| AMBAC | | – | | AMBAC Financial Group, Inc. |
| | |
| AMT | | – | | Interest earned from these securities may be considered a tax preference item for purposes of the Federal Alternative Minimum Tax. |
| | |
| BAM | | – | | Build America Mutual Assurance Co. |
| | |
| FHLMC | | – | | Federal Home Loan Mortgage Corp. |
| | |
| FNMA | | – | | Federal National Mortgage Association |
| | |
| GNMA | | – | | Government National Mortgage Association |
| | |
| NPFG | | – | | National Public Finance Guarantee Corp. |
| | |
| SFMR | | – | | Single Family Mortgage Revenue |
| | |
| SPA | | – | | Standby Bond Purchase Agreement |
| | | | |
| | 31 | | See Notes to Financial Statements. |
Eaton Vance
North Carolina Municipal Income Fund
August 31, 2020
Portfolio of Investments
| | | | | | | | |
| Tax-Exempt Municipal Securities — 95.2% | |
| Security | | Principal
Amount
(000’s omitted) | | | Value | |
|
| Education — 9.8% | |
| | |
North Carolina Capital Facilities Finance Agency, (Davidson College), 5.00%, 3/1/25 | | $ | 365 | | | $ | 391,087 | |
| | |
North Carolina Capital Facilities Finance Agency, (Duke University), 4.00%, 10/1/39 | | | 1,300 | | | | 1,484,925 | |
| | |
North Carolina Capital Facilities Finance Agency, (Duke University), 5.00%, 10/1/44 | | | 2,000 | | | | 2,452,060 | |
| | |
North Carolina State University at Raleigh, Prerefunded to 10/1/23, 5.00%, 10/1/42 | | | 1,140 | | | | 1,305,311 | |
| | |
University of North Carolina at Chapel Hill, 0.504%, (67% of 1 mo. USD LIBOR + 0.40%), 11/9/22 (Put Date), 12/1/41(1) | | | 750 | | | | 750,240 | |
| | |
University of North Carolina at Charlotte, 4.00%, 10/1/34 | | | 770 | | | | 894,725 | |
| | |
University of North Carolina at Charlotte, 4.00%, 10/1/45 | | | 250 | | | | 290,393 | |
| | |
University of North Carolina at Charlotte, Prerefunded to 4/1/22, 5.00%, 4/1/32 | | | 1,250 | | | | 1,344,012 | |
| | |
University of North Carolina at Greensboro, 4.00%, 4/1/35 | | | 1,000 | | | | 1,160,410 | |
| | |
University of North Carolina at Greensboro, 5.00%, 4/1/26 | | | 660 | | | | 759,429 | |
| | |
University of North Carolina at Wilmington, 4.00%, 10/1/36 | | | 1,500 | | | | 1,790,880 | |
| | |
Western Carolina University, 5.00%, 10/1/36 | | | 1,000 | | | | 1,248,470 | |
| | |
| | | | | | | $ | 13,871,942 | |
|
| Escrowed / Prerefunded — 6.0% | |
| | |
Durham Capital Financing Corp., Prerefunded to 6/1/22, 5.00%, 6/1/32 | | $ | 1,700 | | | $ | 1,842,868 | |
| | |
Durham Capital Financing Corp., Prerefunded to 6/1/23, 5.00%, 6/1/38 | | | 1,000 | | | | 1,131,140 | |
| | |
North Carolina Medical Care Commission, (Duke University Health System), Prerefunded to 6/1/22, 5.00%, 6/1/42 | | | 1,250 | | | | 1,355,050 | |
| | |
North Carolina Municipal Power Agency No. 1, (Catawba), Prerefunded to 1/1/22, 5.00%, 1/1/31 | | | 885 | | | | 941,047 | |
| | |
North Carolina, Capital Improvement Limited Obligation Bonds, Prerefunded to 5/1/21, 5.00%, 5/1/30 | | | 1,000 | | | | 1,031,900 | |
| | |
University of North Carolina at Greensboro, Prerefunded to 4/1/22, 5.00%, 4/1/31 | | | 1,020 | | | | 1,097,561 | |
| | |
Watauga Public Facilities Corp., Prerefunded to 6/1/22, 5.00%, 6/1/27 | | | 1,000 | | | | 1,083,120 | |
| | |
| | | | | | | $ | 8,482,686 | |
|
| General Obligations — 11.0% | |
| | |
Brunswick County, 4.00%, 8/1/31 | | $ | 1,000 | | | $ | 1,287,010 | |
| | |
Durham County, 4.00%, 6/1/33 | | | 1,785 | | | | 2,221,504 | |
| | |
Forsyth County, 4.00%, 3/1/28 | | | 735 | | | | 896,472 | |
| | |
Forsyth County, 5.00%, 3/1/31 | | | 1,000 | | | | 1,341,910 | |
| | |
Gainesville School District, GA, 4.00%, 11/1/33(2) | | | 500 | | | | 624,580 | |
| | |
Greensboro, Series 2014, 5.00%, 2/1/27 | | | 650 | | | | 754,728 | |
| | | | | | | | |
| Security | | Principal
Amount
(000’s omitted) | | | Value | |
|
| General Obligations (continued) | |
| | |
Guilford County, 5.00%, 2/1/21 | | $ | 2,000 | | | $ | 2,040,380 | |
| | |
Pender County, 5.00%, 3/1/27 | | | 1,015 | | | | 1,255,677 | |
| | |
Randolph County, Limited Obligation Bonds, 4.00%, 10/1/38 | | | 1,000 | | | | 1,190,720 | |
| | |
Randolph County, Limited Obligation Bonds, 4.00%, 10/1/39 | | | 500 | | | | 593,600 | |
| | |
Wilmington, Limited Obligation Bonds, 4.00%, 6/1/35 | | | 150 | | | | 184,460 | |
| | |
Wilmington, Limited Obligation Bonds, 4.00%, 6/1/37 | | | 690 | | | | 838,419 | |
| | |
Winston-Salem, 4.00%, 6/1/29 | | | 1,925 | | | | 2,280,239 | |
| | |
| | | | | | | $ | 15,509,699 | |
|
| Hospital — 10.9% | |
| | |
New Hanover County, (New Hanover Regional Medical Center), 5.00%, 10/1/30 | | $ | 250 | | | $ | 308,718 | |
| | |
New Hanover County, (New Hanover Regional Medical Center), 5.00%, 10/1/36 | | | 1,000 | | | | 1,205,370 | |
| | |
North Carolina Medical Care Commission, (Cape Fear Valley Health System), 5.00%, 10/1/32 | | | 2,000 | | | | 2,125,120 | |
| | |
North Carolina Medical Care Commission, (Novant Health Obligated Group), 4.00%, 11/1/49 | | | 2,000 | | | | 2,268,400 | |
| | |
North Carolina Medical Care Commission, (Novant Health Obligated Group), 4.75%, 11/1/43 | | | 1,000 | | | | 1,004,480 | |
| | |
North Carolina Medical Care Commission, (Rex Healthcare, Inc.), 4.00%, 7/1/39 | | | 1,000 | | | | 1,146,450 | |
| | |
North Carolina Medical Care Commission, (Rex Healthcare, Inc.), 5.00%, 7/1/32 | | | 1,000 | | | | 1,150,120 | |
| | |
North Carolina Medical Care Commission, (Southeastern Regional Medical Center), 5.00%, 6/1/32 | | | 1,645 | | | | 1,727,595 | |
| | |
North Carolina Medical Care Commission, (Vidant Health), 5.00%, 6/1/31 | | | 2,000 | | | | 2,320,040 | |
| | |
North Carolina Medical Care Commission, (WakeMed), 5.00%, 10/1/31 | | | 2,000 | | | | 2,141,000 | |
| | |
| | | | | | | $ | 15,397,293 | |
|
| Industrial Development Revenue — 0.4% | |
| | |
Columbus County Industrial Facilities & Pollution Control Financing Authority, (International Paper Co.), (AMT), 2.10% to 10/1/24 (Put Date), 3/1/27 | | $ | 500 | | | $ | 524,190 | |
| | |
| | | | | | | $ | 524,190 | |
|
| Insured – Education — 0.0%(3) | |
| | |
University of North Carolina, (AGC), 5.00%, 10/1/33 | | $ | 35 | | | $ | 35,119 | |
| | |
| | | | | | | $ | 35,119 | |
|
| Insured – Electric Utilities — 1.7% | |
| | |
Puerto Rico Electric Power Authority, (NPFG), 5.25%, 7/1/34 | | $ | 1,740 | | | $ | 1,784,735 | |
| | |
Puerto Rico Electric Power Authority, (NPFG), 5.25%, 7/1/35 | | | 600 | | | | 614,400 | |
| | |
| | | | | | | $ | 2,399,135 | |
| | | | |
| | 32 | | See Notes to Financial Statements. |
Eaton Vance
North Carolina Municipal Income Fund
August 31, 2020
Portfolio of Investments — continued
| | | | | | | | |
| Security | | Principal
Amount
(000’s omitted) | | | Value | |
|
| Insured – Special Tax Revenue — 0.4% | |
| | |
Puerto Rico Infrastructure Financing Authority, (AMBAC), 5.50%, 7/1/27 | | $ | 550 | | | $ | 598,966 | |
| | |
| | | | | | | $ | 598,966 | |
|
| Insured – Transportation — 3.9% | |
| | |
North Carolina Turnpike Authority, (Triangle Expressway System), (AGC), 0.00%, 1/1/35 | | $ | 6,500 | | | $ | 4,439,630 | |
| | |
Puerto Rico Highway and Transportation Authority, (AGC), 5.25%, 7/1/41 | | | 1,040 | | | | 1,121,370 | |
| | |
| | | | | | | $ | 5,561,000 | |
|
| Lease Revenue / Certificates of Participation — 18.0% | |
| | |
Buncombe County, 5.00%, 6/1/29 | | $ | 750 | | | $ | 877,365 | |
| | |
Buncombe County, 5.00%, 6/1/31 | | | 1,000 | | | | 1,164,130 | |
| | |
Buncombe County, Limited Obligation Bonds, 4.00%, 6/1/34 | | | 100 | | | | 123,514 | |
| | |
Buncombe County, Limited Obligation Bonds, 4.00%, 6/1/35 | | | 150 | | | | 184,460 | |
| | |
Buncombe County, Limited Obligation Bonds, 4.00%, 6/1/36 | | | 150 | | | | 182,979 | |
| | |
Buncombe County, Limited Obligation Bonds, 5.00%, 6/1/31 | | | 100 | | | | 137,114 | |
| | |
Cabarrus County, Limited Obligation Bonds, 5.00%, 6/1/28 | | | 1,600 | | | | 2,047,904 | |
| | |
Cabarrus County, Limited Obligation Bonds, 5.00%, 4/1/29 | | | 1,000 | | | | 1,224,920 | |
| | |
Cabarrus County, Limited Obligation Bonds, 5.00%, 4/1/30 | | | 1,000 | | | | 1,219,690 | |
| | |
Charlotte, 4.00%, 6/1/39 | | | 1,000 | | | | 1,170,450 | |
| | |
Charlotte, (Convention Facility), 4.00%, 6/1/39 | | | 875 | | | | 1,024,144 | |
| | |
Davidson County, Limited Obligation Bonds, 5.00%, 6/1/31 | | | 2,010 | | | | 2,446,009 | |
| | |
Durham Capital Financing Corp., 5.00%, 10/1/31 | | | 1,170 | | | | 1,539,533 | |
| | |
Johnston County Finance Corp., 4.00%, 4/1/35 | | | 400 | | | | 484,056 | |
| | |
Johnston County Finance Corp., 4.00%, 4/1/36 | | | 1,015 | | | | 1,224,547 | |
| | |
North Carolina Turnpike Authority, (Monroe Connector System), 5.00%, 7/1/31 | | | 1,000 | | | | 1,035,540 | |
| | |
North Carolina Turnpike Authority, (Monroe Connector System), 5.00%, 7/1/36 | | | 1,750 | | | | 1,808,625 | |
| | |
North Carolina, Limited Obligation Bonds, 4.00%, 5/1/33 | | | 1,000 | | | | 1,219,740 | |
| | |
North Carolina, Limited Obligation Bonds, 5.00%, 5/1/29 | | | 1,000 | | | | 1,275,010 | |
| | |
Orange County Public Facilities Co., 4.00%, 10/1/31 | | | 400 | | | | 477,812 | |
| | |
Raleigh, Limited Obligation Bonds, 4.00%, 6/1/34 | | | 500 | | | | 617,570 | |
| | |
Scotland County, Limited Obligation Bonds, 5.00%, 12/1/29 | | | 500 | | | | 624,435 | |
| | |
Scotland County, Limited Obligation Bonds, 5.00%, 12/1/31 | | | 55 | | | | 67,962 | |
| | |
Scotland County, Limited Obligation Bonds, 5.00%, 12/1/33 | | | 250 | | | | 305,997 | |
| | |
Wake County, Limited Obligation Bonds, 5.00%, 9/1/35 | | | 1,000 | | | | 1,319,470 | |
| | |
Wayne County, Limited Obligation Bonds, 5.00%, 6/1/28 | | | 500 | | | | 637,700 | |
| | |
Winston-Salem, 5.00%, 6/1/27 | | | 750 | | | | 882,270 | |
| | |
| | | | | | | $ | 25,322,946 | |
| | | | | | | | |
| Security | | Principal
Amount
(000’s omitted) | | | Value | |
|
| Other Revenue — 1.7% | |
| | |
Durham County Industrial Facilities & Pollution Control Financing Authority, (Research Triangle Institute), 5.00%, 2/1/24 | | $ | 1,000 | | | $ | 1,152,620 | |
| | |
Durham County Industrial Facilities & Pollution Control Financing Authority, (Research Triangle Institute), 5.00%, 2/1/25 | | | 1,035 | | | | 1,237,208 | |
| | |
| | | | | | | $ | 2,389,828 | |
|
| Senior Living / Life Care — 5.6% | |
| | |
North Carolina Medical Care Commission, (Deerfield Episcopal Retirement Community, Inc.), 5.00%, 11/1/31 | | $ | 2,000 | | | $ | 2,319,840 | |
| | |
North Carolina Medical Care Commission, (Galloway Ridge), 5.00%, 1/1/30 | | | 1,310 | | | | 1,432,511 | |
| | |
North Carolina Medical Care Commission, (Pennybyrn at Maryfield), 5.00%, 10/1/40(2) | | | 600 | | | | 659,178 | |
| | |
North Carolina Medical Care Commission, (The Pines at Davidson), 5.00%, 1/1/38 | | | 1,000 | | | | 1,080,030 | |
| | |
North Carolina Medical Care Commission, (Twin Lakes Community), 5.00%, 1/1/44 | | | 595 | | | | 639,822 | |
| | |
North Carolina Medical Care Commission, (United Church Homes and Services), 5.00%, 9/1/46 | | | 1,000 | | | | 1,005,660 | |
| | |
North Carolina Medical Care Commission, (United Methodist Retirement Homes), 5.00%, 10/1/30 | | | 635 | | | | 685,730 | |
| | |
| | | | | | | $ | 7,822,771 | |
|
| Solid Waste — 0.7% | |
| | |
Mecklenburg County, Special Obligation, 5.00%, 1/1/26 | | $ | 1,000 | | | $ | 1,015,720 | |
| | |
| | | | | | | $ | 1,015,720 | |
|
| Transportation — 14.7% | |
| | |
Charlotte Airport, 5.50%, 7/1/34 | | $ | 535 | | | $ | 536,910 | |
| | |
Charlotte Airport, (AMT), 5.00%, 7/1/36 | | | 1,500 | | | | 1,543,770 | |
| | |
Charlotte Airport, (AMT), 5.375%, 7/1/28 | | | 1,000 | | | | 1,003,660 | |
| | |
Charlotte, (Charlotte Douglas International Airport), (AMT), 4.00%, 7/1/36 | | | 630 | | | | 721,394 | |
| | |
Charlotte, (Charlotte Douglas International Airport), (AMT), 4.00%, 7/1/37 | | | 1,000 | | | | 1,141,090 | |
| | |
Charlotte, (Charlotte Douglas International Airport), (AMT), 5.00%, 7/1/42 | | | 550 | | | | 650,073 | |
| | |
North Carolina Turnpike Authority, (Triangle Expressway System), 4.00%, 1/1/33 | | | 2,000 | | | | 2,370,980 | |
| | |
North Carolina Turnpike Authority, (Triangle Expressway System), 5.00%, 1/1/40 | | | 2,500 | | | | 2,994,525 | |
| | |
North Carolina Turnpike Authority, (Triangle Expressway System), 5.00%, 1/1/43 | | | 500 | | | | 604,385 | |
| | | | |
| | 33 | | See Notes to Financial Statements. |
Eaton Vance
North Carolina Municipal Income Fund
August 31, 2020
Portfolio of Investments — continued
| | | | | | | | |
| Security | | Principal
Amount
(000’s omitted) | | | Value | |
|
| Transportation (continued) | |
| | |
North Carolina, Grant Anticipation Revenue Vehicle Bonds, 5.00%, 3/1/34 | | $ | 4,000 | | | $ | 5,179,360 | |
| | |
Raleigh-Durham Airport Authority, (AMT), Series 2017A, 5.00%, 5/1/36 | | | 2,000 | | | | 2,381,480 | |
| | |
Raleigh-Durham Airport Authority, (AMT), Series 2020A, 5.00%, 5/1/36 | | | 1,280 | | | | 1,621,683 | |
| | |
| | | | | | | $ | 20,749,310 | |
|
| Water and Sewer — 10.4% | |
| | |
Brunswick County, (Water and Wastewater Systems), 5.00%, 4/1/30 | | $ | 750 | | | $ | 885,878 | |
| | |
Brunswick County, Enterprise Systems Revenue, 4.00%, 4/1/34 | | | 700 | | | | 851,200 | |
| | |
Buncombe County Metropolitan Sewerage District, 5.00%, 7/1/26 | | | 305 | | | | 360,589 | |
| | |
Buncombe County Metropolitan Sewerage District, 5.00%, 7/1/28 | | | 540 | | | | 635,472 | |
| | |
Cape Fear Public Utility Authority, Water and Sewer System Revenue, 5.00%, 8/1/29 | | | 1,375 | | | | 1,708,781 | |
| | |
Cary, Combined Enterprise System Revenue, 5.00%, 12/1/30 | | | 675 | | | | 873,929 | |
| | |
Charlotte, Water and Sewer System Revenue, 5.00%, 7/1/38 | | | 1,750 | | | | 1,755,670 | |
| | |
Greensboro, Combined Enterprise System Revenue, 4.00%, 6/1/45 | | | 1,000 | | | | 1,201,300 | |
| | |
Greensboro, Combined Enterprise System Revenue, Green Bonds, 4.00%, 6/1/30 | | | 1,065 | | | | 1,287,361 | |
| | |
High Point, Combined Enterprise System Revenue, 4.00%, 11/1/34 | | | 1,000 | | | | 1,244,410 | |
| | |
Lincoln County, Enterprise System Revenue, 3.00%, 8/1/32 | | | 255 | | | | 294,851 | |
| | |
Lincoln County, Enterprise System Revenue, 3.00%, 8/1/33 | | | 235 | | | | 269,070 | |
| | |
Lincoln County, Enterprise System Revenue, 3.00%, 8/1/34 | | | 175 | | | | 198,657 | |
| | |
Lincoln County, Enterprise System Revenue, 3.00%, 8/1/35 | | | 250 | | | | 281,425 | |
| | |
Lincoln County, Enterprise System Revenue, 3.00%, 8/1/38 | | | 200 | | | | 221,020 | |
| | |
Lincoln County, Enterprise System Revenue, 3.00%, 8/1/39 | | | 240 | | | | 264,115 | |
| | |
Lincoln County, Enterprise System Revenue, 3.00%, 8/1/40 | | | 160 | | | | 175,530 | |
| | |
Union County, Enterprise Systems Revenue, 5.00%, 6/1/30 | | | 835 | | | | 1,121,230 | |
| | |
Union County, Enterprise Systems Revenue, 5.00%, 6/1/32 | | | 725 | | | | 961,067 | |
| | |
| | | | | | | $ | 14,591,555 | |
| |
Total Tax-Exempt Municipal Securities — 95.2%
(identified cost $124,727,151) | | | $ | 134,272,160 | |
| | | | | | | | |
| Corporate Bonds & Notes — 0.4% | |
| Security | | Principal
Amount
(000’s omitted) | | | Value | |
|
| Hospital — 0.4% | |
| | |
Harnett Health System, Inc., 4.25% to 10/1/20 (Put Date), 4/1/32 | | $ | 540 | | | $ | 529,308 | |
| |
Total Corporate Bonds & Notes — 0.4%
(identified cost $540,000) | | | $ | 529,308 | |
| |
Total Investments — 95.6%
(identified cost $125,267,151) | | | $ | 134,801,468 | |
| |
Other Assets, Less Liabilities — 4.4% | | | $ | 6,200,012 | |
| |
Net Assets — 100.0% | | | $ | 141,001,480 | |
The percentage shown for each investment category in the Portfolio of Investments is based on net assets.
The Fund invests primarily in debt securities issued by North Carolina municipalities. The ability of the issuers of the debt securities to meet their obligations may be affected by economic developments in a specific industry or municipality. At August 31, 2020, 6.4% of total investments are backed by bond insurance of various financial institutions and financial guaranty assurance agencies. The aggregate percentage insured by an individual financial institution or financial guaranty assurance agency ranged from 0.4% to 4.2% of total investments.
| (1) | Floating rate security. The stated interest rate represents the rate in effect at August 31, 2020. |
| (2) | When-issued security. |
| (3) | Amount is less than 0.05%. |
Abbreviations:
| | | | |
| | |
| AGC | | – | | Assured Guaranty Corp. |
| | |
| AMBAC | | – | | AMBAC Financial Group, Inc. |
| | |
| AMT | | – | | Interest earned from these securities may be considered a tax preference item for purposes of the Federal Alternative Minimum Tax. |
| | |
| LIBOR | | – | | London Interbank Offered Rate |
| | |
| NPFG | | – | | National Public Finance Guarantee Corp. |
Currency Abbreviations:
| | | | |
| | |
| USD | | – | | United States Dollar |
| | | | |
| | 34 | | See Notes to Financial Statements. |
Eaton Vance
Oregon Municipal Income Fund
August 31, 2020
Portfolio of Investments
| | | | | | | | |
| Tax-Exempt Investments — 95.9% | |
| Security | | Principal
Amount
(000’s omitted) | | | Value | |
|
| Bond Bank — 1.3% | |
| | |
Oregon, Bond Bank Revenue, 5.00%, 1/1/32 | | $ | 955 | | | $ | 1,165,195 | |
| | |
Oregon, Bond Bank Revenue, 5.00%, 1/1/33 | | | 610 | | | | 742,834 | |
| | |
| | | | | | | $ | 1,908,029 | |
|
| Education — 2.5% | |
| | |
Forest Grove, (Pacific University), 5.00%, 5/1/30 | | $ | 500 | | | $ | 547,625 | |
| | |
Forest Grove, (Pacific University), 5.25%, 5/1/34 | | | 1,000 | | | | 1,034,290 | |
| | |
Oregon Facilities Authority, (University of Portland), 5.00%, 4/1/27 | | | 500 | | | | 576,585 | |
| | |
Oregon Facilities Authority, (University of Portland), 5.00%, 4/1/29 | | | 500 | | | | 570,915 | |
| | |
Oregon Facilities Authority, (University of Portland), 5.00%, 4/1/45 | | | 1,000 | | | | 1,103,370 | |
| | |
| | | | | | | $ | 3,832,785 | |
|
| Electric Utilities — 5.0% | |
| | |
Confederated Tribes of Warm Springs Reservation, (Pelton-Round Butte Hydroelectric Project), Green Bonds, 5.00%, 11/1/32(1) | | $ | 500 | | | $ | 620,865 | |
| | |
Confederated Tribes of Warm Springs Reservation, (Pelton-Round Butte Hydroelectric Project), Green Bonds, 5.00%, 11/1/34(1) | | | 500 | | | | 612,155 | |
| | |
Confederated Tribes of Warm Springs Reservation, (Pelton-Round Butte Hydroelectric Project), Green Bonds, 5.00%, 11/1/36(1) | | | 500 | | | | 605,430 | |
| | |
Confederated Tribes of Warm Springs Reservation, (Pelton-Round Butte Hydroelectric Project), Green Bonds, 5.00%, 11/1/39(1) | | | 1,300 | | | | 1,560,338 | |
| | |
Eugene, Electric Utility System Revenue, 4.00%, 8/1/45 | | | 1,500 | | | | 1,786,650 | |
| | |
Eugene, Electric Utility System Revenue, 5.00%, 8/1/47 | | | 2,000 | | | | 2,431,880 | |
| | |
| | | | | | | $ | 7,617,318 | |
|
| Escrowed / Prerefunded — 3.6% | |
| | |
Oregon Facilities Authority, (Lewis & Clark College), Prerefunded to 10/1/21, 5.625%, 10/1/36 | | $ | 2,000 | | | $ | 2,116,600 | |
| | |
Pendleton School District No. 16R, Umatilla County, Prerefunded to 6/15/24, 5.00%, 6/15/28 | | | 1,000 | | | | 1,179,290 | |
| | |
Tri-County Metropolitan Transportation District, Prerefunded to 9/1/22, 5.00%, 9/1/30 | | | 2,000 | | | | 2,191,680 | |
| | |
| | | | | | | $ | 5,487,570 | |
| | | | | | | | |
| Security | | Principal
Amount
(000’s omitted) | | | Value | |
|
| General Obligations — 51.8% | |
| | |
Astoria School District No. 1C, Clatsop County, 5.00%, 6/15/37 | | $ | 1,380 | | | $ | 1,786,865 | |
| | |
Canby School District No. 86, 4.00%, 6/15/38 | | | 900 | | | | 1,102,194 | |
| | |
Canby School District No. 86, 4.00%, 6/15/39 | | | 850 | | | | 1,036,745 | |
| | |
Canby School District No. 86, 4.00%, 6/15/40 | | | 800 | | | | 972,824 | |
| | |
Central School District No. 13J, Polk, Marion and Benton Counties, 0.00%, 6/15/38 | | | 750 | | | | 510,878 | |
| | |
Chemeketa Community College District, 5.00%, 6/15/25 | | | 1,000 | | | | 1,173,990 | |
| | |
Coos Bay School District No. 9, 5.00%, 6/15/39 | | | 850 | | | | 1,112,676 | |
| | |
Coos Bay School District No. 9, 5.00%, 6/15/40 | | | 750 | | | | 978,893 | |
| | |
Coos Bay School District No. 9, 5.00%, 6/15/41 | | | 1,640 | | | | 2,133,230 | |
| | |
Coos Bay School District No. 9, 5.00%, 6/15/43 | | | 750 | | | | 968,820 | |
| | |
Corvallis School District No. 509J, Benton and Linn Counties, 5.00%, 6/15/27 | | | 1,280 | | | | 1,649,728 | |
| | |
David Douglas School District No. 40, Multnomah County, 0.00%, 6/15/24 | | | 1,640 | | | | 1,607,577 | |
| | |
Eugene School District No. 4J, Lane and Linn Counties, 4.00%, 6/15/35 | | | 1,500 | | | | 1,826,205 | |
| | |
Fern Ridge School District 28J, Lane and Douglas Counties, 5.00%, 6/15/25 | | | 525 | | | | 640,022 | |
| | |
Forest Grove School District No. 15, Washington County, 0.00%, 6/15/26 | | | 1,975 | | | | 1,871,016 | |
| | |
Gresham-Barlow School District No. 10Jt, Multnomah and Clackamas Counties, 0.00%, 6/15/31 | | | 200 | | | | 163,112 | |
| | |
Gresham-Barlow School District No. 10Jt, Multnomah and Clackamas Counties, 0.00%, 6/15/32 | | | 400 | | | | 312,344 | |
| | |
Gresham-Barlow School District No. 10Jt, Multnomah and Clackamas Counties, 0.00%, 6/15/33 | | | 500 | | | | 373,175 | |
| | |
Hermiston School District No. 8R, Umatilla County, 0.00%, 6/15/43 | | | 3,160 | | | | 1,641,494 | |
| | |
Hillsboro School District No. 1J, Washington, Multnomah and Yamhill Counties, 4.00%, 6/15/36 | | | 1,250 | | | | 1,537,000 | |
| | |
Hillsboro School District No. 1J, Washington, Multnomah and Yamhill Counties, 5.00%, 6/15/32 | | | 2,000 | | | | 2,524,860 | |
| | |
Hillsboro School District No. 1J, Washington, Multnomah and Yamhill Counties, 5.00%, 6/15/37 | | | 1,605 | | | | 1,993,185 | |
| | |
Jackson County School District No. 6, Central Point, 0.00%, 6/15/42 | | | 610 | | | | 320,878 | |
| | |
Jackson County School District No. 6, Central Point, 0.00%, 6/15/45 | | | 1,000 | | | | 465,130 | |
| | |
Jackson County School District No. 6, Central Point, 4.00%, 6/15/38 | | | 1,385 | | | | 1,655,117 | |
| | |
Klamath County School District, 5.00%, 6/15/29 | | | 1,155 | | | | 1,299,052 | |
| | |
Lake Oswego, 4.00%, 12/1/31 | | | 1,000 | | | | 1,198,450 | |
| | |
Lake Oswego, 5.00%, 6/1/33 | | | 2,450 | | | | 2,737,850 | |
| | |
Lane Community College, 4.00%, 6/15/38 | | | 2,535 | | | | 3,091,635 | |
| | |
Lane Community College, 4.00%, 6/15/39 | | | 1,400 | | | | 1,701,924 | |
| | |
Lane Community College, 4.00%, 6/15/40 | | | 1,265 | | | | 1,534,445 | |
| | | | |
| | 35 | | See Notes to Financial Statements. |
Eaton Vance
Oregon Municipal Income Fund
August 31, 2020
Portfolio of Investments — continued
| | | | | | | | |
| Security | | Principal
Amount
(000’s omitted) | | | Value | |
|
| General Obligations (continued) | |
| | |
Medford, 5.00%, 7/15/32 | | $ | 545 | | | $ | 613,283 | |
| | |
Metro, 4.00%, 6/1/31 | | | 1,365 | | | | 1,664,399 | |
| | |
North Clackamas School District No. 12, Clackamas County, 5.00%, 6/15/28 | | | 2,500 | | | | 2,933,950 | |
| | |
North Clackamas School District No. 12, Clackamas County, 5.00%, 6/15/35 | | | 1,000 | | | | 1,276,110 | |
| | |
North Clackamas School District No. 12, Clackamas County, 5.00%, 6/15/39 | | | 1,910 | | | | 2,407,612 | |
| | |
North Clackamas School District No. 12, Clackamas County, 5.00%, 6/15/42 | | | 1,500 | | | | 1,876,605 | |
| | |
Oregon City School District No. 62, Clackamas County, 5.00%, 6/15/38 | | | 2,000 | | | | 2,544,480 | |
| | |
Oregon Elderly and Disabled Housing, (AMT), 5.65%, 8/1/26 | | | 760 | | | | 762,751 | |
| | |
Pendleton School District No. 16R, Umatilla County, 5.00%, 6/15/24 | | | 1,220 | | | | 1,435,806 | |
| | |
Philomath School District No. 17J, Benton and Polk Counties, 0.00%, 6/15/28 | | | 1,000 | | | | 916,480 | |
| | |
Philomath School District No. 17J, Benton and Polk Counties, 0.00%, 6/15/30 | | | 700 | | | | 611,429 | |
| | |
Portland Community College District, 5.00%, 6/15/32 | | | 795 | | | | 974,988 | |
| | |
Portland Housing Authority, (Pearl Court LP), (AMT), 4.625%, 1/1/27 | | | 1,280 | | | | 1,287,027 | |
| | |
Portland Housing Authority, (Yards Union Station Project), (AMT), 4.75%, 5/1/22 | | | 195 | | | | 195,614 | |
| | |
Portland Housing Authority, (Yards Union Station Project), (AMT), 4.85%, 5/1/29 | | | 2,740 | | | | 2,746,740 | |
| | |
Redmond, 5.00%, 6/1/28 | | | 605 | | | | 705,279 | |
| | |
Redmond School District No. 2J, Deschutes and Jefferson Counties, 0.00%, 6/15/25 | | | 460 | | | | 445,156 | |
| | |
Redmond School District No. 2J, Deschutes and Jefferson Counties, 0.00%, 6/15/27 | | | 3,175 | | | | 2,966,593 | |
| | |
Riverdale School District No. 51J, Multnomah and Clackamas Counties, 0.00%, 6/15/29 | | | 1,000 | | | | 888,500 | |
| | |
Riverdale School District No. 51J, Multnomah and Clackamas Counties, 0.00%, 6/15/30 | | | 1,215 | | | | 1,049,991 | |
| | |
Salem-Keizer School District No. 24J, 0.00%, 6/15/29 | | | 1,050 | | | | 937,829 | |
| | |
Salem-Keizer School District No. 24J, 5.00%, (0.00% until 6/15/21), 6/15/35 | | | 1,025 | | | | 1,313,240 | |
| | |
Tigard-Tualatin School District No. 23J, Washington and Clackamas Counties, 5.00%, 6/15/40 | | | 2,500 | | | | 3,228,300 | |
| | |
Warrenton-Hammond School District No. 30, Clatsop County, 5.00%, 6/15/32 | | | 1,000 | | | | 1,321,680 | |
| | |
West Linn-Wilsonville School District No. 3Jt, Clackamas and Washington Counties, 0.00%, 6/15/37 | | | 1,375 | | | | 930,834 | |
| | |
Winston-Dillard School District No. 116, 0.00%, 6/15/35 | | | 230 | | | | 169,101 | |
| | |
Winston-Dillard School District No. 116, 0.00%, 6/15/36 | | | 435 | | | | 308,589 | |
| | |
Winston-Dillard School District No. 116, 0.00%, 6/15/39 | | | 605 | | | | 383,830 | |
| | |
| | | | | | | $ | 78,817,510 | |
| | | | | | | | |
| Security | | Principal
Amount
(000’s omitted) | | | Value | |
|
| Hospital — 8.4% | |
| | |
Astoria Hospital Facilities Authority, (Columbia Memorial Hospital), 5.00%, 8/1/41 | | $ | 310 | | | $ | 358,193 | |
| | |
Klamath Falls Intercommunity Hospital Authority, (Sky Lakes Medical Center), 5.00%, 9/1/20 | | | 1,320 | | | | 1,320,000 | |
| | |
Klamath Falls Intercommunity Hospital Authority, (Sky Lakes Medical Center), 5.00%, 9/1/22 | | | 250 | | | | 270,035 | |
| | |
Medford Hospital Facilities Authority, (Asante Health System), 4.00%, 8/15/39 | | | 1,000 | | | | 1,168,320 | |
| | |
Medford Hospital Facilities Authority, (Asante Health System), 5.00%, 8/15/38 | | | 1,850 | | | | 2,374,179 | |
| | |
Oregon Facilities Authority, (PeaceHealth), 5.00%, 11/15/29 | | | 1,500 | | | | 1,690,365 | |
| | |
Oregon Facilities Authority, (Samaritan Health Services), 5.00%, 10/1/29 | | | 1,000 | | | | 1,190,840 | |
| | |
Oregon Facilities Authority, (Samaritan Health Services), 5.00%, 10/1/30 | | | 300 | | | | 381,096 | |
| | |
Oregon Facilities Authority, (Samaritan Health Services), 5.00%, 10/1/35 | | | 275 | | | | 341,132 | |
| | |
Salem Hospital Facility Authority, (Salem Health), 5.00%, 5/15/44 | | | 3,000 | | | | 3,645,600 | |
| | |
| | | | | | | $ | 12,739,760 | |
|
| Housing — 2.2% | |
| | |
Oregon Housing and Community Services Department, (AMT), 3.45%, 1/1/33 | | $ | 1,475 | | | $ | 1,581,097 | |
| | |
Oregon Housing and Community Services Department, (AMT), 5.15%, 7/1/42 | | | 1,790 | | | | 1,792,846 | |
| | |
| | | | | | | $ | 3,373,943 | |
|
| Industrial Development Revenue — 0.8% | |
| | |
Gilliam County, Solid Waste Revenue, (AMT), 2.40% to 5/2/22 (Put Date), 8/1/25 | | $ | 1,175 | | | $ | 1,182,379 | |
| | |
| | | | | | | $ | 1,182,379 | |
|
| Insured – Electric Utilities — 2.6% | |
| | |
Puerto Rico Electric Power Authority, (NPFG), 5.25%, 7/1/29 | | $ | 1,045 | | | $ | 1,076,486 | |
| | |
Puerto Rico Electric Power Authority, (NPFG), 5.25%, 7/1/34 | | | 2,760 | | | | 2,830,959 | |
| | |
| | | | | | | $ | 3,907,445 | |
|
| Insured – General Obligations — 5.6% | |
| | |
Lebanon Community School District No. 9, Linn County, (NPFG), 5.50%, 6/15/30 | | $ | 4,000 | | | $ | 5,518,880 | |
| | |
Newport, (AGC), 0.00%, 6/1/28 | | | 1,000 | | | | 910,850 | |
| | |
Newport, (AGC), 0.00%, 6/1/29 | | | 1,225 | | | | 1,088,363 | |
| | |
West Linn-Wilsonville School District No. 3Jt, Clackamas and Washington Counties, (NPFG), 0.00%, 6/15/23 | | | 1,050 | | | | 1,033,851 | |
| | |
| | | | | | | $ | 8,551,944 | |
| | | | |
| | 36 | | See Notes to Financial Statements. |
Eaton Vance
Oregon Municipal Income Fund
August 31, 2020
Portfolio of Investments — continued
| | | | | | | | |
| Security | | Principal
Amount
(000’s omitted) | | | Value | |
|
| Insured – Hospital — 0.7% | |
| | |
Oregon Health and Science University, (NPFG), 0.00%, 7/1/21 | | $ | 1,055 | | | $ | 1,052,637 | |
| | |
| | | | | | | $ | 1,052,637 | |
|
| Insured – Special Tax Revenue — 0.7% | |
| | |
Puerto Rico Infrastructure Financing Authority, (AMBAC), 5.50%, 7/1/27 | | $ | 1,015 | | | $ | 1,105,365 | |
| | |
| | | | | | | $ | 1,105,365 | |
|
| Other Revenue — 2.8% | |
| | |
Metro, (Oregon Convention Center Hotel), 5.00%, 6/15/29 | | $ | 215 | | | $ | 272,413 | |
| | |
Oregon Department of Administrative Services, Lottery Revenue, 5.00%, 4/1/25 | | | 2,000 | | | | 2,331,260 | |
| | |
Oregon Department of Administrative Services, Lottery Revenue, 5.00%, 4/1/33 | | | 1,280 | | | | 1,600,397 | |
| | |
| | | | | | | $ | 4,204,070 | |
|
| Senior Living / Life Care — 1.2% | |
| | |
Clackamas County Hospital Facility Authority, (Rose Villa), 5.375%, 11/15/55 | | $ | 100 | | | $ | 106,512 | |
| | |
Multnomah County Hospital Facilities Authority, (Mirabella at South Waterfront), 5.00%, 10/1/24 | | | 340 | | | | 353,651 | |
| | |
Multnomah County Hospital Facilities Authority, (Terwilliger Plaza, Inc.), 5.00%, 12/1/36 | | | 750 | | | | 805,628 | |
| | |
Salem Hospital Facility Authority, (Capital Manor), 5.00%, 5/15/33 | | | 550 | | | | 601,612 | |
| | |
| | | | | | | $ | 1,867,403 | |
|
| Special Tax Revenue — 2.3% | |
| | |
Beaverton, Special Tax Revenue, 4.00%, 6/1/37 | | $ | 400 | | | $ | 482,432 | |
| | |
Beaverton, Special Tax Revenue, 4.00%, 6/1/40 | | | 1,000 | | | | 1,194,470 | |
| | |
Tri-County Metropolitan Transportation District, Payroll Tax Revenue, 5.00%, 9/1/38 | | | 1,500 | | | | 1,867,905 | |
| | |
| | | | | | | $ | 3,544,807 | |
|
| Transportation — 2.7% | |
| | |
Port of Portland, (Portland International Airport), (AMT), 5.00%, 7/1/29 | | $ | 1,155 | | | $ | 1,387,929 | |
| | |
Port of Portland, (Portland International Airport), (AMT), 5.00%, 7/1/34 | | | 1,000 | | | | 1,174,120 | |
| | |
Port of Portland, (Portland International Airport), (AMT), 5.00%, 7/1/35 | | | 1,300 | | | | 1,600,352 | |
| | |
| | | | | | | $ | 4,162,401 | |
| | | | | | | | |
| Security | | Principal
Amount
(000’s omitted) | | | Value | |
|
| Water and Sewer — 1.7% | |
| | |
Clackamas River Water, 5.00%, 11/1/29 | | $ | 100 | | | $ | 119,662 | |
| | |
Grants Pass, Wastewater Revenue, 4.00%, 12/1/36 | | | 1,160 | | | | 1,341,610 | |
| | |
Grants Pass, Wastewater Revenue, 4.00%, 12/1/37 | | | 1,000 | | | | 1,152,640 | |
| | |
| | | | | | | $ | 2,613,912 | |
| |
Total Tax-Exempt Investments — 95.9%
(identified cost $134,857,875) | | | $ | 145,969,278 | |
| |
Other Assets, Less Liabilities — 4.1% | | | $ | 6,245,909 | |
| |
Net Assets — 100.0% | | | $ | 152,215,187 | |
The percentage shown for each investment category in the Portfolio of Investments is based on net assets.
The Fund invests primarily in debt securities issued by Oregon municipalities. The ability of the issuers of the debt securities to meet their obligations may be affected by economic developments in a specific industry or municipality. At August 31, 2020, 10.0% of total investments are backed by bond insurance of various financial institutions and financial guaranty assurance agencies. The aggregate percentage insured by an individual financial institution or financial guaranty assurance agency ranged from 0.8% to 7.9% of total investments.
| (1) | Security exempt from registration pursuant to Rule 144A under the Securities Act of 1933, as amended. These securities may be sold in certain transactions in reliance on an exemption from registration (normally to qualified institutional buyers). At August 31, 2020, the aggregate value of these securities is $3,398,788 or 2.2% of the Fund’s net assets. |
Abbreviations:
| | | | |
| | |
| AGC | | – | | Assured Guaranty Corp. |
| | |
| AMBAC | | – | | AMBAC Financial Group, Inc. |
| | |
| AMT | | – | | Interest earned from these securities may be considered a tax preference item for purposes of the Federal Alternative Minimum Tax. |
| | |
| NPFG | | – | | National Public Finance Guarantee Corp. |
| | | | |
| | 37 | | See Notes to Financial Statements. |
Eaton Vance
South Carolina Municipal Income Fund
August 31, 2020
Portfolio of Investments
| | | | | | | | |
| Tax-Exempt Municipal Securities — 93.5% | |
| Security | | Principal
Amount
(000’s omitted) | | | Value | |
|
| Education — 9.8% | |
| | |
Clemson University, 5.00%, 5/1/26 | | $ | 2,000 | | | $ | 2,481,680 | |
| | |
College of Charleston, Academic and Administrative Facilities, 5.00%, 4/1/37 | | | 2,695 | | | | 2,751,353 | |
| | |
Florence-Darlington Commission for Technical Education, 5.00%, 3/1/28 | | | 600 | | | | 630,228 | |
| | |
South Carolina Jobs-Economic Development Authority, (Furman University), 5.00%, 10/1/32 | | | 2,000 | | | | 2,293,940 | |
| | |
South Carolina Jobs-Economic Development Authority, (Furman University), 5.00%, 10/1/45 | | | 2,000 | | | | 2,239,000 | |
| | |
South Carolina Jobs-Economic Development Authority, (Wofford College), 5.00%, 4/1/32 | | | 590 | | | | 708,749 | |
| | |
South Carolina Jobs-Economic Development Authority, (Wofford College), 5.00%, 4/1/44 | | | 1,000 | | | | 1,155,380 | |
| | |
University of South Carolina, Athletic Facilities, 5.00%, 5/1/37 | | | 1,500 | | | | 1,778,055 | |
| | |
University of South Carolina, Higher Education, 5.00%, 5/1/30 | | | 600 | | | | 660,654 | |
| | |
| | | | | | | $ | 14,699,039 | |
|
| Electric Utilities — 2.6% | |
| | |
Piedmont Municipal Power Agency, 5.00%, 1/1/24 | | $ | 250 | | | $ | 285,290 | |
| | |
Piedmont Municipal Power Agency, 5.00%, 1/1/25 | | | 1,000 | | | | 1,179,780 | |
| | |
South Carolina Public Service Authority, 5.00%, 12/1/37 | | | 2,000 | | | | 2,384,560 | |
| | |
| | | | | | | $ | 3,849,630 | |
|
| Escrowed / Prerefunded — 8.8% | |
| | |
Charleston Waterworks and Sewer Revenue, Prerefunded to 1/1/21, 5.00%, 1/1/30 | | $ | 1,000 | | | $ | 1,016,050 | |
| | |
Charleston Waterworks and Sewer Revenue, Prerefunded to 1/1/21, 5.00%, 1/1/35 | | | 3,000 | | | | 3,048,150 | |
| | |
Georgetown County, Prerefunded to 3/1/23, 5.00%, 3/1/31 | | | 2,510 | | | | 2,809,970 | |
| | |
Georgetown County, Prerefunded to 3/1/23, 5.00%, 3/1/33 | | | 2,750 | | | | 3,078,652 | |
| | |
South Carolina Jobs-Economic Development Authority, (Bon Secours Health System, Inc.), Prerefunded to 11/1/22, 5.00%, 11/1/28 | | | 2,500 | | | | 2,756,100 | |
| | |
South Carolina Jobs-Economic Development Authority, (Bon Secours Health System, Inc.), Prerefunded to 11/1/22, 5.00%, 11/1/29 | | | 450 | | | | 496,098 | |
| | |
| | | | | | | $ | 13,205,020 | |
|
| General Obligations — 23.1% | |
| | |
Aiken County Consolidated School District, 4.00%, 4/1/37 | | $ | 1,500 | | | $ | 1,807,605 | |
| | |
Aiken County Consolidated School District, 5.00%, 3/1/25 | | | 2,020 | | | | 2,441,392 | |
| | |
Anderson County School District No. 5, 5.00%, 3/1/30 | | | 2,000 | | | | 2,435,080 | |
| | |
Charleston County School District, 5.00%, 5/12/21 | | | 2,000 | | | | 2,067,000 | |
| | |
Charleston County, 4.00%, 11/1/26 | | | 1,500 | | | | 1,768,245 | |
| | | | | | | | |
| Security | | Principal
Amount
(000’s omitted) | | | Value | |
|
| General Obligations (continued) | |
| | |
Charleston County, 4.00%, 11/1/31 | | $ | 1,500 | | | $ | 1,903,440 | |
| | |
Colleton County School District, 5.00%, 3/1/25 | | | 1,060 | | | | 1,281,127 | |
| | |
Gainesville School District, GA, 4.00%, 11/1/33(1) | | | 700 | | | | 874,412 | |
| | |
Georgetown County School District, 4.00%, 3/1/33 | | | 1,000 | | | | 1,197,260 | |
| | |
Hilton Head Island, 4.00%, 3/1/23 | | | 605 | | | | 662,747 | |
| | |
Hilton Head Island, 4.00%, 3/1/25 | | | 565 | | | | 659,315 | |
| | |
Horry County School District, 5.00%, 3/1/24 | | | 1,500 | | | | 1,747,980 | |
| | |
Horry County School District, 5.00%, 3/1/25 | | | 1,500 | | | | 1,806,960 | |
| | |
Lancaster County School District, 4.00%, 3/1/30 | | | 1,500 | | | | 1,786,410 | |
| | |
Lexington County School District No. 1, 5.00%, 2/1/26 | | | 1,060 | | | | 1,317,813 | |
| | |
Oconee County School District, 5.00%, 3/1/25 | | | 1,000 | | | | 1,208,610 | |
| | |
Richland County School District No. 2, 4.00%, 3/1/32 | | | 2,000 | | | | 2,459,580 | |
| | |
Richland-Lexington Airport District, (AMT), Prerefunded to 3/1/23, 3.00%, 3/1/27 | | | 580 | | | | 616,987 | |
| | |
Richland-Lexington Airport District, (AMT), 4.00%, 3/1/22 | | | 195 | | | | 203,970 | |
| | |
Richland-Lexington Airport District, (AMT), 4.00%, 3/1/24 | | | 685 | | | | 733,834 | |
| | |
South Carolina, (Air Carrier Hub Terminal A), 1.00%, 4/1/25 | | | 4,275 | | | | 4,277,351 | |
| | |
Spartanburg County School District No. 7, 5.00%, 3/1/40 | | | 1,000 | | | | 1,275,960 | |
| | |
| | | | | | | $ | 34,533,078 | |
|
| Hospital — 12.8% | |
| | |
Florence County, (McLeod Regional Medical Center), 5.00%, 11/1/30 | | $ | 1,500 | | | $ | 1,724,295 | |
| | |
Florence County, (McLeod Regional Medical Center), 5.00%, 11/1/37 | | | 1,000 | | | | 1,007,910 | |
| | |
Greenville Health System, 5.00%, 5/1/31 | | | 1,500 | | | | 1,662,195 | |
| | |
Greenwood County, (Self Regional Healthcare), 4.00%, 10/1/21 | | | 1,050 | | | | 1,089,081 | |
| | |
Greenwood County, (Self Regional Healthcare), 5.00%, 10/1/20 | | | 300 | | | | 301,077 | |
| | |
Lexington County Health Services District, Inc., (Lexington Medical Center), 4.00%, 11/1/31 | | | 1,125 | | | | 1,296,259 | |
| | |
Lexington County Health Services District, Inc., (Lexington Medical Center), 5.00%, 11/1/29 | | | 600 | | | | 748,494 | |
| | |
South Carolina Jobs-Economic Development Authority, (AnMed Health), 5.00%, 2/1/36 | | | 2,500 | | | | 2,903,775 | |
| | |
South Carolina Jobs-Economic Development Authority, (Bon Secours Mercy Health, Inc.), 4.00%, 12/1/44 | | | 1,000 | | | | 1,144,350 | |
| | |
South Carolina Jobs-Economic Development Authority, (Bon Secours Mercy Health, Inc.), 5.00%, 12/1/46 | | | 1,000 | | | | 1,242,270 | |
| | |
South Carolina Jobs-Economic Development Authority, (McLeod Health), 5.00%, 11/1/48 | | | 1,500 | | | | 1,791,930 | |
| | |
South Carolina Jobs-Economic Development Authority, (Prisma Health Obligated Group), 5.00%, 5/1/36 | | | 1,500 | | | | 1,796,445 | |
| | |
Spartanburg Regional Health Services District, Inc., 5.00%, 4/15/48 | | | 2,000 | | | | 2,325,860 | |
| | |
| | | | | | | $ | 19,033,941 | |
| | | | |
| | 38 | | See Notes to Financial Statements. |
Eaton Vance
South Carolina Municipal Income Fund
August 31, 2020
Portfolio of Investments — continued
| | | | | | | | |
| Security | | Principal
Amount
(000’s omitted) | | | Value | |
|
| Industrial Development Revenue — 1.2% | |
| | |
Richland County, (International Paper Co.), (AMT), 3.875%, 4/1/23 | | $ | 1,670 | | | $ | 1,799,993 | |
| | |
| | | | | | | $ | 1,799,993 | |
|
| Insured – Electric Utilities — 4.7% | |
| | |
Piedmont Municipal Power Agency, (NPFG), 0.00%, 1/1/23 | | $ | 1,090 | | | $ | 1,073,574 | |
| | |
Puerto Rico Electric Power Authority, (NPFG), 5.25%, 7/1/29 | | | 1,075 | | | | 1,107,390 | |
| | |
Puerto Rico Electric Power Authority, (NPFG), 5.25%, 7/1/32 | | | 1,350 | | | | 1,388,920 | |
| | |
Puerto Rico Electric Power Authority, (NPFG), 5.25%, 7/1/34 | | | 2,375 | | | | 2,436,061 | |
| | |
Puerto Rico Electric Power Authority, (NPFG), 5.25%, 7/1/35 | | | 950 | | | | 972,800 | |
| | |
| | | | | | | $ | 6,978,745 | |
|
| Insured – Lease Revenue / Certificates of Participation — 2.5% | |
| | |
St. Peters Parish/Jasper County Public Facilities Corp., (County Office Buildings), (AGM), 5.00%, 4/1/31 | | $ | 1,000 | | | $ | 1,022,610 | |
| | |
Sumter Two School Facilities, Inc., (Sumter School District), (BAM), 5.00%, 12/1/23 | | | 1,000 | | | | 1,136,370 | |
| | |
Sumter Two School Facilities, Inc., (Sumter School District), (BAM), 5.00%, 12/1/24 | | | 1,280 | | | | 1,504,973 | |
| | |
| | | | | | | $ | 3,663,953 | |
|
| Insured – Transportation — 1.0% | |
| | |
Puerto Rico Highway and Transportation Authority, (AGC), 5.25%, 7/1/41 | | $ | 1,360 | | | $ | 1,466,406 | |
| | |
| | | | | | | $ | 1,466,406 | |
|
| Insured – Utilities — 3.1% | |
| | |
Greer, Combined Utility System, (AMBAC), 5.50%, 9/1/27 | | $ | 1,000 | | | $ | 1,273,240 | |
| | |
Greer, Combined Utility System, (AMBAC), 5.50%, 9/1/32 | | | 2,000 | | | | 2,763,020 | |
| | |
Newberry, (Combined Public Utility System), (AGM), 5.00%, 4/1/30 | | | 500 | | | | 588,125 | |
| | |
| | | | | | | $ | 4,624,385 | |
|
| Lease Revenue / Certificates of Participation — 7.2% | |
| | |
Allendale County School District, (Refunding & Improvement), 5.00%, 12/1/22 | | $ | 1,155 | | | $ | 1,216,123 | |
| | |
Allendale County School District, (Refunding & Improvement), 5.00%, 12/1/24 | | | 500 | | | | 544,280 | |
| | |
Charleston Educational Excellence Financing Corp., (Charleston County School District), 5.00%, 12/1/30(2) | | | 3,875 | | | | 4,361,622 | |
| | |
Charleston Educational Excellence Financing Corp., (Charleston County School District), 5.00%, 12/1/30 | | | 2,000 | | | | 2,251,160 | |
| | |
Dorchester County School District No. 2, (Growth Installment Purchase), 5.00%, 12/1/27 | | | 1,000 | | | | 1,148,200 | |
| | | | | | | | |
| Security | | Principal
Amount
(000’s omitted) | | | Value | |
|
| Lease Revenue / Certificates of Participation (continued) | |
| | |
Securing Assets for Education, (Berkeley County School District), 5.00%, 12/1/27 | | $ | 1,000 | | | $ | 1,148,550 | |
| | |
| | | | | | | $ | 10,669,935 | |
|
| Other Revenue — 1.5% | |
| | |
Patriots Energy Group Financing Agency, Gas Supply Revenue, 4.00% to 2/1/24 (Put Date), 10/1/48 | | $ | 2,000 | | | $ | 2,218,520 | |
| | |
| | | | | | | $ | 2,218,520 | |
|
| Senior Living / Life Care — 1.8% | |
| | |
South Carolina Jobs-Economic Development Authority, (ACTS Retirement-Life Communities, Inc. Obligated Group), 5.00%, 11/15/47 | | $ | 1,000 | | | $ | 1,142,800 | |
| | |
South Carolina Jobs-Economic Development Authority, (Bishop Gadsden Episcopal Retirement Community), 4.00%, 4/1/49 | | | 620 | | | | 622,672 | |
| | |
South Carolina Jobs-Economic Development Authority, (South Carolina Episcopal Home at Still Hopes), 5.00%, 4/1/29 | | | 640 | | | | 695,571 | |
| | |
South Carolina Jobs-Economic Development Authority, (Woodlands at Furman), 5.00%, 11/15/42 | | | 285 | | | | 294,180 | |
| | |
| | | | | | | $ | 2,755,223 | |
|
| Special Tax Revenue — 1.1% | |
| | |
Hilton Head Island, (Beach Preservation Fee Pledge), 5.00%, 8/1/25 | | $ | 400 | | | $ | 487,560 | |
| | |
Myrtle Beach, (Hospitality Fee), 5.00%, 6/1/26 | | | 1,000 | | | | 1,137,180 | |
| | |
| | | | | | | $ | 1,624,740 | |
|
| Student Loan — 0.4% | |
| | |
South Carolina Education Assistance Authority, 5.10%, 10/1/29 | | $ | 660 | | | $ | 660,403 | |
| | |
| | | | | | | $ | 660,403 | |
|
| Transportation — 2.9% | |
| | |
Port of Portland, OR, (Portland International Airport), (AMT), 5.00%, 7/1/34 | | $ | 1,000 | | | $ | 1,174,120 | |
| | |
South Carolina Ports Authority, (AMT), 5.00%, 7/1/34 | | | 1,355 | | | | 1,704,685 | |
| | |
South Carolina Transportation Infrastructure Bank, 0.554%, (67% of 1 mo. USD LIBOR + 0.45%), 10/1/22 (Put Date), 10/1/31(3) | | | 1,495 | | | | 1,485,148 | |
| | |
| | | | | | | $ | 4,363,953 | |
|
| Water and Sewer — 9.0% | |
| | |
Beaufort-Jasper Water and Sewer Authority, 4.00%, 3/1/36 | | $ | 1,000 | | | $ | 1,195,630 | |
| | |
Charleston Waterworks and Sewer System Revenue, 5.00%, 1/1/29 | | | 1,550 | | | | 1,968,345 | |
| | | | |
| | 39 | | See Notes to Financial Statements. |
Eaton Vance
South Carolina Municipal Income Fund
August 31, 2020
Portfolio of Investments — continued
| | | | | | | | |
| Security | | Principal
Amount
(000’s omitted) | | | Value | |
|
| Water and Sewer (continued) | |
| | |
Charleston, Waterworks and Sewer System Revenue, 5.00%, 1/1/37 | | $ | 1,000 | | | $ | 1,328,390 | |
| | |
Columbia, Waterworks and Sewer System Revenue, 4.00%, 2/1/34 | | | 2,000 | | | | 2,411,820 | |
| | |
Columbia, Waterworks and Sewer System Revenue, 5.00%, 2/1/49 | | | 1,000 | | | | 1,262,270 | |
| | |
Mount Pleasant, Waterworks and Sewer System Revenue, 5.00%, 6/1/37 | | | 1,000 | | | | 1,233,390 | |
| | |
North Charleston Sewer District, 2.00%, 1/1/29 | | | 500 | | | | 501,870 | |
| | |
Richland County, Utility System Revenue, 4.00%, 3/1/36 | | | 900 | | | | 1,093,554 | |
| | |
Richland County, Utility System Revenue, 4.00%, 3/1/38 | | | 630 | | | | 756,680 | |
| | |
Richland County, Utility System Revenue, 4.00%, 3/1/39 | | | 330 | | | | 395,089 | |
| | |
Startex-Jackson-Wellford-Duncan Water District, 4.00%, 4/1/33 | | | 475 | | | | 574,399 | |
| | |
Startex-Jackson-Wellford-Duncan Water District, 4.00%, 4/1/35 | | | 250 | | | | 300,083 | |
| | |
Startex-Jackson-Wellford-Duncan Water District, 5.00%, 4/1/31 | | | 265 | | | | 352,418 | |
| | |
| | | | | | | $ | 13,373,938 | |
| |
Total Tax-Exempt Municipal Securities — 93.5%
(identified cost $130,979,399) | | | $ | 139,520,902 | |
|
| Taxable Municipal Securities — 2.2% | |
| Security | | Principal
Amount
(000’s omitted) | | | Value | |
|
| General Obligations — 0.7% | |
| | |
New Caney Independent School District, TX, (PSF Guaranteed), 2.159%, 2/15/38(1) | | $ | 1,000 | | | $ | 1,002,570 | |
| | |
| | | | | | | $ | 1,002,570 | |
|
| Lease Revenue / Certificates of Participation — 0.7% | |
| | |
Florence Public Facilities Corp., 3.086%, 11/1/40(1) | | $ | 1,000 | | | $ | 1,002,050 | |
| | |
| | | | | | | $ | 1,002,050 | |
| | | | | | | | |
| Security | | Principal
Amount
(000’s omitted) | | | Value | |
|
| Student Loan — 0.8% | |
| | |
South Carolina Student Loan Corp. 3.593%, 12/1/39 | | $ | 1,250 | | | $ | 1,235,525 | |
| | |
| | | | | | | $ | 1,235,525 | |
| |
Total Taxable Municipal Securities — 2.2%
(identified cost $3,250,000) | | | $ | 3,240,145 | |
| |
Total Investments — 95.7%
(identified cost $134,229,399) | | | $ | 142,761,047 | |
| |
Other Assets, Less Liabilities — 4.3% | | | $ | 6,482,982 | |
| |
Net Assets — 100.0% | | | $ | 149,244,029 | |
The percentage shown for each investment category in the Portfolio of Investments is based on net assets.
The Fund invests primarily in debt securities issued by South Carolina municipalities. The ability of the issuers of the debt securities to meet their obligations may be affected by economic developments in a specific industry or municipality. At August 31, 2020, 11.7% of total investments are backed by bond insurance of various financial institutions and financial guaranty assurance agencies. The aggregate percentage insured by an individual financial institution or financial guaranty assurance agency ranged from 1.0% to 4.9% of total investments.
| (1) | When-issued security. |
| (2) | Security represents the municipal bond held by a trust that issues residual interest bonds (see Note 1H). |
| (3) | Floating rate security. The stated interest rate represents the rate in effect at August 31, 2020. |
Abbreviations:
| | | | |
| | |
| AGC | | – | | Assured Guaranty Corp. |
| | |
| AGM | | – | | Assured Guaranty Municipal Corp. |
| | |
| AMBAC | | – | | AMBAC Financial Group, Inc. |
| | |
| AMT | | – | | Interest earned from these securities may be considered a tax preference item for purposes of the Federal Alternative Minimum Tax. |
| | |
| BAM | | – | | Build America Mutual Assurance Co. |
| | |
| LIBOR | | – | | London Interbank Offered Rate |
| | |
| NPFG | | – | | National Public Finance Guarantee Corp. |
| | |
| PSF | | – | | Permanent School Fund |
Currency Abbreviations:
| | | | |
| | |
| USD | | – | | United States Dollar |
| | | | |
| | 40 | | See Notes to Financial Statements. |
Eaton Vance
Virginia Municipal Income Fund
August 31, 2020
Portfolio of Investments
| | | | | | | | |
| Tax-Exempt Municipal Securities — 95.6% | |
| Security | | Principal
Amount
(000’s omitted) | | | Value | |
|
| Bond Bank — 1.7% | |
| | |
Virginia Resources Authority, Infrastructure Revenue, (Pooled Financing Program), 4.00%, 11/1/32 | | $ | 1,000 | | | $ | 1,174,100 | |
| | |
| | | | | | | $ | 1,174,100 | |
|
| Education — 3.3% | |
| | |
Salem Economic Development Authority, (Roanoke College), 4.00%, 4/1/38 | | $ | 525 | | | $ | 543,522 | |
| | |
Salem Economic Development Authority, (Roanoke College), 4.00%, 4/1/40 | | | 200 | | | | 205,644 | |
| | |
University of Virginia, 5.00%, 4/1/38 | | | 1,320 | | | | 1,636,285 | |
| | |
| | | | | | | $ | 2,385,451 | |
|
| Escrowed / Prerefunded — 5.5% | |
| | |
Harrisonburg Industrial Development Authority, (Sunnyside Presbyterian Home), Prerefunded to 12/1/23, 6.25%, 12/1/33 | | $ | 750 | | | $ | 888,457 | |
| | |
Henrico County Economic Development Authority, (Bon Secours Health System, Inc.), Prerefunded to 11/1/22, 5.00%, 11/1/30 | | | 645 | | | | 709,597 | |
| | |
Norfolk, Prerefunded to 8/1/23, 5.00%, 8/1/28 | | | 750 | | | | 854,303 | |
| | |
Virginia Port Authority, (AMT), Prerefunded to 7/1/25, 5.00%, 7/1/33 | | | 1,250 | | | | 1,517,462 | |
| | |
| | | | | | | $ | 3,969,819 | |
|
| General Obligations — 15.9% | |
| | |
Alexandria, 5.00%, 7/1/28 | | $ | 1,000 | | | $ | 1,298,880 | |
| | |
Arlington County, 5.00%, 8/15/32 | | | 1,000 | | | | 1,254,350 | |
| | |
Chesterfield County, 5.00%, 1/1/32 | | | 1,500 | | | | 1,992,915 | |
| | |
Culpeper, 5.00%, 8/1/25 | | | 1,350 | | | | 1,653,615 | |
| | |
Newport News, 5.00%, 8/1/28 | | | 1,000 | | | | 1,253,060 | |
| | |
Virginia, 5.00%, 6/1/31 | | | 2,000 | | | | 2,071,180 | |
| | |
Virginia Beach, 4.00%, 7/15/32 | | | 1,500 | | | | 1,871,010 | |
| | |
| | | | | | | $ | 11,395,010 | |
|
| Hospital — 17.2% | |
| | |
Arlington County Industrial Development Authority, (Virginia Hospital Center), 4.00%, 7/1/39 | | $ | 1,200 | | | $ | 1,407,264 | |
| | |
Fairfax County Industrial Development Authority, (Inova Health System Hospitals), 5.00%, 8/15/23(1) | | | 3,840 | | | | 4,197,734 | |
| | |
Fredericksburg Economic Development Authority, (Mary Washington Healthcare), 5.00%, 6/15/24 | | | 1,000 | | | | 1,147,910 | |
| | |
Norfolk Economic Development Authority, (Sentara Healthcare), 5.00% to 11/1/28 (Put Date), 11/1/48 | | | 750 | | | | 969,067 | |
| | | | | | | | |
| Security | | Principal
Amount
(000’s omitted) | | | Value | |
|
| Hospital (continued) | |
| | |
Roanoke Economic Development Authority, (Carilion Clinic Obligated Group), 4.00%, 7/1/38 | | $ | 1,550 | | | $ | 1,825,063 | |
| | |
Virginia Small Business Financing Authority, (Bon Secours Mercy Health, Inc.), 4.00%, 12/1/49 | | | 1,000 | | | | 1,137,070 | |
| | |
Virginia Small Business Financing Authority, (Sentara Healthcare), 4.00%, 11/1/39 | | | 1,000 | | | | 1,156,430 | |
| | |
Winchester Economic Development Authority, (Valley Health System), 5.00%, 1/1/28 | | | 450 | | | | 519,548 | |
| | |
| | | | | | | $ | 12,360,086 | |
|
| Industrial Development Revenue — 4.4% | |
| | |
King George County Industrial Development Authority, (Waste Management, Inc.), (AMT), 2.50%, 6/1/23 | | $ | 2,000 | | | $ | 2,070,040 | |
| | |
Louisa Industrial Development Authority, (Virginia Electric and Power Co.), 1.90% to 6/1/23 (Put Date), 11/1/35 | | | 1,000 | | | | 1,030,750 | |
| | |
Virginia Small Business Financing Authority, (Covanta), (AMT), 5.00% to 7/1/38 (Put Date), 1/1/48(2) | | | 60 | | | | 62,255 | |
| | |
| | | | | | | $ | 3,163,045 | |
|
| Insured – Education — 4.0% | |
| | |
Virginia College Building Authority, (Washington and Lee University), (NPFG), 5.25%, 1/1/31 | | $ | 2,155 | | | $ | 2,875,029 | |
| | |
| | | | | | | $ | 2,875,029 | |
|
| Insured – Electric Utilities — 1.4% | |
| | |
Puerto Rico Electric Power Authority, (NPFG), 5.25%, 7/1/29 | | $ | 1,000 | | | $ | 1,030,130 | |
| | |
| | | | | | | $ | 1,030,130 | |
|
| Insured – Transportation — 10.1% | |
| | |
Chesapeake Bay Bridge and Tunnel District, (General Resolution), (NPFG), Escrowed to Maturity, 5.50%, 7/1/25 | | $ | 2,500 | | | $ | 2,950,675 | |
| | |
Norfolk Airport Authority, (AGM), 5.00%, 7/1/26 | | | 1,000 | | | | 1,032,730 | |
| | |
Puerto Rico Highway and Transportation Authority, (AMBAC), 5.50%, 7/1/29 | | | 1,600 | | | | 1,745,664 | |
| | |
Richmond Metropolitan Authority, (NPFG), 5.25%, 7/15/22 | | | 1,240 | | | | 1,313,470 | |
| | |
Virginia Commonwealth Transportation Board, (NPFG), 0.00%, 4/1/26 | | | 200 | | | | 191,502 | |
| | |
| | | | | | | $ | 7,234,041 | |
|
| Lease Revenue / Certificates of Participation — 0.9% | |
| | |
Virginia Public Building Authority, (AMT), 5.00%, 8/1/26 | | $ | 500 | | | $ | 629,180 | |
| | |
| | | | | | | $ | 629,180 | |
| | | | |
| | 41 | | See Notes to Financial Statements. |
Eaton Vance
Virginia Municipal Income Fund
August 31, 2020
Portfolio of Investments — continued
| | | | | | | | |
| Security | | Principal
Amount
(000’s omitted) | | | Value | |
|
| Other Revenue — 1.5% | |
| | |
Loudoun County Economic Development Authority, (Howard Hughes Medical Institute), 0.00%, 7/1/49 | | $ | 2,500 | | | $ | 1,037,050 | |
| | |
| | | | | | | $ | 1,037,050 | |
|
| Senior Living / Life Care — 5.0% | |
| | |
Albemarle County Economic Development Authority, (Westminster-Canterbury of the Blue Ridge), 5.00%, 1/1/42 | | $ | 150 | | | $ | 151,500 | |
| | |
Alexandria Industrial Development Authority, (Goodwin House, Inc.), 5.00%, 10/1/30 | | | 750 | | | | 823,515 | |
| | |
Hanover County Economic Development Authority, (Covenant Woods), 5.00%, 7/1/48 | | | 235 | | | | 238,652 | |
| | |
Norfolk Redevelopment and Housing Authority, (Fort Norfolk Retirement Community, Inc. - Harbor’s Edge), 5.00%, 1/1/34 | | | 1,000 | | | | 1,057,080 | |
| | |
Virginia Beach Development Authority, (Westminster-Canterbury on Chesapeake Bay), 5.00%, 9/1/34 | | | 1,150 | | | | 1,286,873 | |
| | |
| | | | | | | $ | 3,557,620 | |
|
| Special Tax Revenue — 0.8% | |
| | |
Puerto Rico Sales Tax Financing Corp., 0.00%, 7/1/24 | | $ | 9 | | | $ | 8,314 | |
| | |
Puerto Rico Sales Tax Financing Corp., 0.00%, 7/1/27 | | | 17 | | | | 14,443 | |
| | |
Puerto Rico Sales Tax Financing Corp., 0.00%, 7/1/29 | | | 17 | | | | 13,498 | |
| | |
Puerto Rico Sales Tax Financing Corp., 0.00%, 7/1/31 | | | 22 | | | | 16,215 | |
| | |
Puerto Rico Sales Tax Financing Corp., 0.00%, 7/1/33 | | | 24 | | | | 16,268 | |
| | |
Puerto Rico Sales Tax Financing Corp., 0.00%, 7/1/46 | | | 231 | | | | 66,267 | |
| | |
Puerto Rico Sales Tax Financing Corp., 0.00%, 7/1/51 | | | 188 | | | | 38,863 | |
| | |
Puerto Rico Sales Tax Financing Corp., 4.33%, 7/1/40 | | | 92 | | | | 96,601 | |
| | |
Puerto Rico Sales Tax Financing Corp., 4.50%, 7/1/34 | | | 18 | | | | 19,051 | |
| | |
Puerto Rico Sales Tax Financing Corp., 4.54%, 7/1/53 | | | 3 | | | | 3,110 | |
| | |
Puerto Rico Sales Tax Financing Corp., 4.55%, 7/1/40 | | | 9 | | | | 9,585 | |
| | |
Puerto Rico Sales Tax Financing Corp., 4.75%, 7/1/53 | | | 66 | | | | 69,369 | |
| | |
Puerto Rico Sales Tax Financing Corp., 4.78%, 7/1/58 | | | 37 | | | | 38,972 | |
| | |
Puerto Rico Sales Tax Financing Corp., 5.00%, 7/1/58 | | | 167 | | | | 178,306 | |
| | |
| | | | | | | $ | 588,862 | |
|
| Transportation — 10.5% | |
| | |
Metropolitan Washington, DC Airports Authority System, (AMT), 4.00%, 10/1/35 | | $ | 500 | | | $ | 555,110 | |
| | |
Metropolitan Washington, DC Airports Authority System, (AMT), 5.00%, 10/1/37 | | | 1,295 | | | | 1,558,688 | |
| | |
Metropolitan Washington, DC Airports Authority System, (AMT), 5.00%, 10/1/42 | | | 990 | | | | 1,177,833 | |
| | |
Norfolk Airport Authority, 5.00%, 7/1/37 | | | 1,000 | | | | 1,188,190 | |
| | |
Virginia Small Business Financing Authority, (Transform 66 P3 Project), (AMT), 5.00%, 12/31/47 | | | 500 | | | | 565,625 | |
| | |
Washington Metropolitan Area Transit Authority, 5.00%, 7/1/29 | | | 1,000 | | | | 1,268,480 | |
| | | | | | | | |
| Security | | Principal
Amount
(000’s omitted) | | | Value | |
|
| Transportation (continued) | |
| | |
Washington Metropolitan Area Transit Authority, 5.00%, 7/1/37 | | $ | 1,000 | | | $ | 1,228,550 | |
| | |
| | | | | | | $ | 7,542,476 | |
|
| Water and Sewer — 13.4% | |
| | |
Fairfax County Water Authority, 5.25%, 4/1/27 | | $ | 1,795 | | | $ | 2,345,598 | |
| | |
Fairfax County, Sewer Revenue, 4.00%, 7/15/37 | | | 1,000 | | | | 1,156,850 | |
| | |
Henrico County, Water and Sewer System Revenue, 4.00%, 5/1/31 | | | 1,500 | | | | 1,865,745 | |
| | |
Henrico County, Water and Sewer System Revenue, 5.00%, 5/1/28 | | | 1,000 | | | | 1,255,400 | |
| | |
Newport News, Water Revenue, 5.00%, 7/15/33 | | | 1,000 | | | | 1,235,310 | |
| | |
Virginia Beach, Water and Sewer System Revenue, 5.00%, 10/1/26 | | | 1,375 | | | | 1,747,804 | |
| | |
| | | | | | | $ | 9,606,707 | |
| |
Total Tax-Exempt Municipal Securities — 95.6%
(identified cost $62,941,072) | | | $ | 68,548,606 | |
|
| Taxable Municipal Securities — 2.8% | |
| Security | | Principal
Amount
(000’s omitted) | | | Value | |
|
| Education — 1.4% | |
| | |
Montgomery County Economic Development Authority, (Virginia Tech Foundation), 2.474%, 6/1/36 | | $ | 1,000 | | | $ | 1,025,600 | |
| | |
| | | | | | | $ | 1,025,600 | |
|
| Transportation — 1.4% | |
| | |
Virginia Port Authority, 2.449%, 7/1/40 | | $ | 1,000 | | | $ | 998,560 | |
| | |
| | | | | | | $ | 998,560 | |
| |
Total Taxable Municipal Securities — 2.8%
(identified cost $2,000,000) | | | $ | 2,024,160 | |
| |
Total Investments — 98.4%
(identified cost $64,941,072) | | | $ | 70,572,766 | |
| |
Other Assets, Less Liabilities — 1.6% | | | $ | 1,147,943 | |
| |
Net Assets — 100.0% | | | $ | 71,720,709 | |
The percentage shown for each investment category in the Portfolio of Investments is based on net assets.
| | | | |
| | 42 | | See Notes to Financial Statements. |
Eaton Vance
Virginia Municipal Income Fund
August 31, 2020
Portfolio of Investments — continued
The Fund invests primarily in debt securities issued by Virginia municipalities. The ability of the issuers of the debt securities to meet their obligations may be affected by economic developments in a specific industry or municipality. At August 31, 2020, 15.8% of total investments are backed by bond insurance of various financial institutions and financial guaranty assurance agencies. The aggregate percentage insured by an individual financial institution or financial guaranty assurance agency ranged from 1.5% to 11.8% of total investments.
| (1) | Security represents the municipal bond held by a trust that issues residual interest bonds (see Note 1H). |
| (2) | Security exempt from registration pursuant to Rule 144A under the Securities Act of 1933, as amended. These securities may be sold in certain transactions in reliance on an exemption from registration (normally to qualified institutional buyers). At August 31, 2020, the aggregate value of these securities is $62,255 or 0.1% of the Fund’s net assets. |
Abbreviations:
| | | | |
| | |
| AGM | | – | | Assured Guaranty Municipal Corp. |
| | |
| AMBAC | | – | | AMBAC Financial Group, Inc. |
| | |
| AMT | | – | | Interest earned from these securities may be considered a tax preference item for purposes of the Federal Alternative Minimum Tax. |
| | |
| NPFG | | – | | National Public Finance Guarantee Corp. |
| | | | |
| | 43 | | See Notes to Financial Statements. |
Eaton Vance
Municipal Income Funds
August 31, 2020
Statements of Assets and Liabilities
| | | | | | | | | | | | | | | | |
| | | August 31, 2020 | |
| Assets | | Georgia Fund | | | Maryland Fund | | | Missouri Fund | | | North Carolina Fund | |
| | | | |
Investments — | | | | | | | | | | | | | | | | |
| | | | |
Identified cost | | $ | 90,546,519 | | | $ | 62,746,722 | | | $ | 76,384,249 | | | $ | 125,267,151 | |
| | | | |
Unrealized appreciation | | | 6,551,211 | | | | 3,449,331 | | | | 6,180,444 | | | | 9,534,317 | |
| | | | |
Investments, at value | | $ | 97,097,730 | | | $ | 66,196,053 | | | $ | 82,564,693 | | | $ | 134,801,468 | |
| | | | |
Cash | | $ | 3,103,177 | | | $ | 3,464,302 | | | $ | 1,374,424 | | | $ | 6,325,029 | |
| | | | |
Interest receivable | | | 843,848 | | | | 635,659 | | | | 838,987 | | | | 1,473,468 | |
| | | | |
Receivable for investments sold | | | 1,000,000 | | | | — | | | | 15,188 | | | | — | |
| | | | |
Receivable for Fund shares sold | | | 326,772 | | | | 538,614 | | | | 190,569 | | | | 61,691 | |
| | | | |
Total assets | | $ | 102,371,527 | | | $ | 70,834,628 | | | $ | 84,983,861 | | | $ | 142,661,656 | |
| | | | |
| Liabilities | | | | | | | | | | | | | | | | |
| | | | |
Payable for when-issued securities | | $ | 1,237,240 | | | $ | — | | | $ | 3,378,134 | | | $ | 1,287,614 | |
| | | | |
Payable for Fund shares redeemed | | | 96,336 | | | | 168,050 | | | | 87,650 | | | | 158,907 | |
| | | | |
Distributions payable | | | 49,148 | | | | 26,960 | | | | 19,061 | | | | 70,337 | |
| | | | |
Payable to affiliates: | | | | | | | | | | | | | | | | |
| | | | |
Investment adviser fee | | | 25,854 | | | | 16,390 | | | | 19,982 | | | | 38,621 | |
| | | | |
Distribution and service fees | | | 11,979 | | | | 13,932 | | | | 14,412 | | | | 20,445 | |
| | | | |
Accrued expenses | | | 70,336 | | | | 63,923 | | | | 67,611 | | | | 84,252 | |
| | | | |
Total liabilities | | $ | 1,490,893 | | | $ | 289,255 | | | $ | 3,586,850 | | | $ | 1,660,176 | |
| | | | |
Net Assets | | $ | 100,880,634 | | | $ | 70,545,373 | | | $ | 81,397,011 | | | $ | 141,001,480 | |
| | | | |
| Sources of Net Assets | | | | | | | | | | | | | | | | |
| | | | |
Paid-in capital | | $ | 97,590,593 | | | $ | 69,851,654 | | | $ | 76,240,179 | | | $ | 137,832,845 | |
| | | | |
Distributable earnings | | | 3,290,041 | | | | 693,719 | | | | 5,156,832 | | | | 3,168,635 | |
| | | | |
Net Assets | | $ | 100,880,634 | | | $ | 70,545,373 | | | $ | 81,397,011 | | | $ | 141,001,480 | |
| | | | |
| Class A Shares | | | | | | | | | | | | | | | | |
| | | | |
Net Assets | | $ | 45,047,341 | | | $ | 38,367,623 | | | $ | 50,697,524 | | | $ | 64,513,480 | |
| | | | |
Shares Outstanding | | | 5,118,370 | | | | 4,258,529 | | | | 5,229,705 | | | | 7,019,690 | |
| | | | |
Net Asset Value and Redemption Price Per Share | | | | | | | | | | | | | | | | |
| | | | |
(net assets ÷ shares of beneficial interest outstanding) | | $ | 8.80 | | | $ | 9.01 | | | $ | 9.69 | | | $ | 9.19 | |
| | | | |
Maximum Offering Price Per Share | | | | | | | | | | | | | | | | |
| | | | |
(100 ÷ 95.25 of net asset value per share) | | $ | 9.24 | | | $ | 9.46 | | | $ | 10.17 | | | $ | 9.65 | |
| | | | |
| Class C Shares | | | | | | | | | | | | | | | | |
| | | | |
Net Assets | | $ | 5,270,638 | | | $ | 8,766,650 | | | $ | 7,209,549 | | | $ | 11,740,879 | |
| | | | |
Shares Outstanding | | | 559,935 | | | | 892,076 | | | | 673,659 | | | | 1,187,824 | |
| | | | |
Net Asset Value and Offering Price Per Share* | | | | | | | | | | | | | | | | |
| | | | |
(net assets ÷ shares of beneficial interest outstanding) | | $ | 9.41 | | | $ | 9.83 | | | $ | 10.70 | | | $ | 9.88 | |
| | | | |
| Class I Shares | | | | | | | | | | | | | | | | |
| | | | |
Net Assets | | $ | 50,562,655 | | | $ | 23,411,100 | | | $ | 23,489,938 | | | $ | 64,747,121 | |
| | | | |
Shares Outstanding | | | 5,729,925 | | | | 2,593,041 | | | | 2,419,562 | | | | 7,026,675 | |
| | | | |
Net Asset Value, Offering Price and Redemption Price Per Share | | | | | | | | | | | | | | | | |
| | | | |
(net assets ÷ shares of beneficial interest outstanding) | | $ | 8.82 | | | $ | 9.03 | | | $ | 9.71 | | | $ | 9.21 | |
On sales of $50,000 or more, the offering price of Class A shares is reduced.
| * | Redemption price per share is equal to the net asset value less any applicable contingent deferred sales charge. |
| | | | |
| | 44 | | See Notes to Financial Statements. |
Eaton Vance
Municipal Income Funds
August 31, 2020
Statements of Assets and Liabilities — continued
| | | | | | | | | | | | |
| | | August 31, 2020 | |
| Assets | | Oregon Fund | | | South Carolina Fund | | | Virginia Fund | |
| | | |
Investments — | | | | | | | | | | | | |
| | | |
Identified cost | | $ | 134,857,875 | | | $ | 134,229,399 | | | $ | 64,941,072 | |
| | | |
Unrealized appreciation | | | 11,111,403 | | | | 8,531,648 | | | | 5,631,694 | |
| | | |
Investments, at value | | $ | 145,969,278 | | | $ | 142,761,047 | | | $ | 70,572,766 | |
| | | |
Cash | | $ | 5,069,660 | | | $ | 9,907,287 | | | $ | 3,207,228 | |
| | | |
Interest receivable | | | 1,189,692 | | | | 1,825,144 | | | | 615,263 | |
| | | |
Receivable for investments sold | | | 75,000 | | | | 1,012,669 | | | | — | |
| | | |
Receivable for Fund shares sold | | | 233,429 | | | | 121,431 | | | | 68,922 | |
| | | |
Total assets | | $ | 152,537,059 | | | $ | 155,627,578 | | | $ | 74,464,179 | |
| | | |
| Liabilities | | | | | | | | | | | | |
| | | |
Payable for floating rate notes issued | | $ | — | | | $ | 3,112,501 | | | $ | 2,558,614 | |
| | | |
Payable for when-issued securities | | | — | | | | 2,882,574 | | | | — | |
| | | |
Payable for Fund shares redeemed | | | 149,600 | | | | 204,032 | | | | 61,144 | |
| | | |
Distributions payable | | | 25,470 | | | | 35,766 | | | | 26,671 | |
| | | |
Payable to affiliates: | | | | | | | | | | | | |
| | | |
Investment adviser fee | | | 42,702 | | | | 41,006 | | | | 16,983 | |
| | | |
Distribution and service fees | | | 23,063 | | | | 24,877 | | | | 11,586 | |
| | | |
Interest expense and fees payable | | | — | | | | 6,060 | | | | 731 | |
| | | |
Accrued expenses | | | 81,037 | | | | 76,733 | | | | 67,741 | |
| | | |
Total liabilities | | $ | 321,872 | | | $ | 6,383,549 | | | $ | 2,743,470 | |
| | | |
Net Assets | | $ | 152,215,187 | | | $ | 149,244,029 | | | $ | 71,720,709 | |
| | | |
| Sources of Net Assets | | | | | | | | | | | | |
| | | |
Paid-in capital | | $ | 152,410,335 | | | $ | 146,565,710 | | | $ | 71,554,444 | |
| | | |
Distributable earnings (accumulated loss) | | | (195,148 | ) | | | 2,678,319 | | | | 166,265 | |
| | | |
Net Assets | | $ | 152,215,187 | | | $ | 149,244,029 | | | $ | 71,720,709 | |
| | | |
| Class A Shares | | | | | | | | | | | | |
| | | |
Net Assets | | $ | 83,651,483 | | | $ | 78,913,754 | | | $ | 48,030,569 | |
| | | |
Shares Outstanding | | | 9,390,104 | | | | 8,362,192 | | | | 5,962,642 | |
| | | |
Net Asset Value and Redemption Price Per Share | | | | | | | | | | | | |
| | | |
(net assets ÷ shares of beneficial interest outstanding) | | $ | 8.91 | | | $ | 9.44 | | | $ | 8.06 | |
| | | |
Maximum Offering Price Per Share | | | | | | | | | | | | |
| | | |
(100 ÷ 95.25 of net asset value per share) | | $ | 9.35 | | | $ | 9.91 | | | $ | 8.46 | |
| | | |
| Class C Shares | | | | | | | | | | | | |
| | | |
Net Assets | | $ | 11,102,281 | | | $ | 14,084,668 | | | $ | 4,288,869 | |
| | | |
Shares Outstanding | | | 1,138,318 | | | | 1,406,847 | | | | 480,622 | |
| | | |
Net Asset Value and Offering Price Per Share* | | | | | | | | | | | | |
| | | |
(net assets ÷ shares of beneficial interest outstanding) | | $ | 9.75 | | | $ | 10.01 | | | $ | 8.92 | |
| | | |
| Class I Shares | | | | | | | | | | | | |
| | | |
Net Assets | | $ | 57,461,423 | | | $ | 56,245,607 | | | $ | 19,401,271 | |
| | | |
Shares Outstanding | | | 6,455,314 | | | | 5,954,917 | | | | 2,403,747 | |
| | | |
Net Asset Value, Offering Price and Redemption Price Per Share | | | | | | | | | | | | |
| | | |
(net assets ÷ shares of beneficial interest outstanding) | | $ | 8.90 | | | $ | 9.45 | | | $ | 8.07 | |
On sales of $50,000 or more, the offering price of Class A shares is reduced.
| * | Redemption price per share is equal to the net asset value less any applicable contingent deferred sales charge. |
| | | | |
| | 45 | | See Notes to Financial Statements. |
Eaton Vance
Municipal Income Funds
August 31, 2020
Statements of Operations
| | | | | | | | | | | | | | | | |
| | | Year Ended August 31, 2020 | |
| Investment Income | | Georgia Fund | | | Maryland Fund | | | Missouri Fund | | | North Carolina Fund | |
| | | | |
Interest | | $ | 2,716,684 | | | $ | 1,979,622 | | | $ | 2,512,127 | | | $ | 3,953,137 | |
| | | | |
Total investment income | | $ | 2,716,684 | | | $ | 1,979,622 | | | $ | 2,512,127 | | | $ | 3,953,137 | |
| | | | |
| Expenses | | | | | | | | | | | | | | | | |
| | | | |
Investment adviser fee | | $ | 281,724 | | | $ | 182,027 | | | $ | 219,576 | | | $ | 442,728 | |
| | | | |
Distribution and service fees | | | | | | | | | | | | | | | | |
| | | | |
Class A | | | 86,587 | | | | 75,006 | | | | 97,661 | | | | 122,151 | |
| | | | |
Class C | | | 54,494 | | | | 97,441 | | | | 73,338 | | | | 127,496 | |
| | | | |
Trustees’ fees and expenses | | | 5,289 | | | | 3,969 | | | | 4,375 | | | | 7,439 | |
| | | | |
Custodian fee | | | 32,802 | | | | 27,566 | | | | 29,238 | | | | 40,807 | |
| | | | |
Transfer and dividend disbursing agent fees | | | 25,437 | | | | 28,629 | | | | 30,566 | | | | 51,729 | |
| | | | |
Legal and accounting services | | | 58,354 | | | | 55,567 | | | | 46,274 | | | | 50,588 | |
| | | | |
Printing and postage | | | 8,163 | | | | 8,428 | | | | 8,946 | | | | 11,357 | |
| | | | |
Registration fees | | | 3,547 | | | | 6,716 | | | | 4,979 | | | | 2,209 | |
| | | | |
Miscellaneous | | | 24,144 | | | | 17,746 | | | | 20,153 | | | | 27,984 | |
| | | | |
Total expenses | | $ | 580,541 | | | $ | 503,095 | | | $ | 535,106 | | | $ | 884,488 | |
| | | | |
Net investment income | | $ | 2,136,143 | | | $ | 1,476,527 | | | $ | 1,977,021 | | | $ | 3,068,649 | |
| | | | |
| Realized and Unrealized Gain (Loss) | | | | | | | | | | | | | | | | |
| | | | |
Net realized gain (loss) — | | | | | | | | | | | | | | | | |
| | | | |
Investment transactions | | $ | 74,006 | | | $ | 75,108 | | | $ | 7,674 | | | $ | (243,630 | ) |
| | | | |
Net realized gain (loss) | | $ | 74,006 | | | $ | 75,108 | | | $ | 7,674 | | | $ | (243,630 | ) |
| | | | |
Change in unrealized appreciation (depreciation) — | | | | | | | | | | | | | | | | |
| | | | |
Investments | | $ | 143,485 | | | $ | (485,711 | ) | | $ | 271,509 | | | $ | 244,762 | |
| | | | |
Net change in unrealized appreciation (depreciation) | | $ | 143,485 | | | $ | (485,711 | ) | | $ | 271,509 | | | $ | 244,762 | |
| | | | |
Net realized and unrealized gain (loss) | | $ | 217,491 | | | $ | (410,603 | ) | | $ | 279,183 | | | $ | 1,132 | |
| | | | |
Net increase in net assets from operations | | $ | 2,353,634 | | | $ | 1,065,924 | | | $ | 2,256,204 | | | $ | 3,069,781 | |
| | | | |
| | 46 | | See Notes to Financial Statements. |
Eaton Vance
Municipal Income Funds
August 31, 2020
Statements of Operations — continued
| | | | | | | | | | | | |
| | | Year Ended August 31, 2020 | |
| Investment Income | | Oregon Fund | | | South Carolina Fund | | | Virginia Fund | |
| | | |
Interest | | $ | 4,297,848 | | | $ | 4,188,357 | | | $ | 2,303,900 | |
| | | |
Total investment income | | $ | 4,297,848 | | | $ | 4,188,357 | | | $ | 2,303,900 | |
| | | |
| Expenses | | | | | | | | | | | | |
| | | |
Investment adviser fee | | $ | 462,188 | | | $ | 464,784 | | | $ | 197,784 | |
| | | |
Distribution and service fees | | | | | | | | | | | | |
| | | |
Class A | | | 161,428 | | | | 148,537 | | | | 96,903 | |
| | | |
Class C | | | 101,126 | | | | 162,552 | | | | 39,827 | |
| | | |
Trustees’ fees and expenses | | | 7,630 | | | | 7,696 | | | | 4,076 | |
| | | |
Custodian fee | | | 40,520 | | | | 41,209 | | | | 27,934 | |
| | | |
Transfer and dividend disbursing agent fees | | | 44,796 | | | | 35,325 | | | | 30,890 | |
| | | |
Legal and accounting services | | | 48,894 | | | | 50,410 | | | | 48,787 | |
| | | |
Printing and postage | | | 13,150 | | | | 11,041 | | | | 8,367 | |
| | | |
Registration fees | | | 881 | | | | 2,046 | | | | 3,522 | |
| | | |
Interest expense and fees | | | — | | | | 49,776 | | | | 53,422 | |
| | | |
Miscellaneous | | | 26,123 | | | | 24,700 | | | | 19,886 | |
| | | |
Total expenses | | $ | 906,736 | | | $ | 998,076 | | | $ | 531,398 | |
| | | |
Net investment income | | $ | 3,391,112 | | | $ | 3,190,281 | | | $ | 1,772,502 | |
| | | |
| Realized and Unrealized Gain (Loss) | | | | | | | | | | | | |
| | | |
Net realized gain (loss) — | | | | | | | | | | | | |
| | | |
Investment transactions | | $ | 205,539 | | | $ | 420,149 | | | $ | 167,502 | |
| | | |
Net realized gain | | $ | 205,539 | | | $ | 420,149 | | | $ | 167,502 | |
| | | |
Change in unrealized appreciation (depreciation) — | | | | | | | | | | | | |
| | | |
Investments | | $ | 958,326 | | | $ | 196,210 | | | $ | 85,834 | |
| | | |
Net change in unrealized appreciation (depreciation) | | $ | 958,326 | | | $ | 196,210 | | | $ | 85,834 | |
| | | |
Net realized and unrealized gain | | $ | 1,163,865 | | | $ | 616,359 | | | $ | 253,336 | |
| | | |
Net increase in net assets from operations | | $ | 4,554,977 | | | $ | 3,806,640 | | | $ | 2,025,838 | |
| | | | |
| | 47 | | See Notes to Financial Statements. |
Eaton Vance
Municipal Income Funds
August 31, 2020
Statements of Changes in Net Assets
| | | | | | | | | | | | | | | | |
| | | Year Ended August 31, 2020 | |
| Increase (Decrease) in Net Assets | | Georgia Fund | | | Maryland Fund | | | Missouri Fund | | | North Carolina Fund | |
| | | | |
From operations — | | | | | | | | | | | | | | | | |
| | | | |
Net investment income | | $ | 2,136,143 | | | $ | 1,476,527 | | | $ | 1,977,021 | | | $ | 3,068,649 | |
| | | | |
Net realized gain (loss) | | | 74,006 | | | | 75,108 | | | | 7,674 | | | | (243,630 | ) |
| | | | |
Net change in unrealized appreciation (depreciation) | | | 143,485 | | | | (485,711 | ) | | | 271,509 | | | | 244,762 | |
| | | | |
Net increase in net assets from operations | | $ | 2,353,634 | | | $ | 1,065,924 | | | $ | 2,256,204 | | | $ | 3,069,781 | |
| | | | |
Distributions to shareholders — | | | | | | | | | | | | | | | | |
| | | | |
Class A | | $ | (973,241 | ) | | $ | (862,278 | ) | | $ | (1,365,864 | ) | | $ | (1,477,448 | ) |
| | | | |
Class C | | | (86,152 | ) | | | (159,090 | ) | | | (157,793 | ) | | | (225,095 | ) |
| | | | |
Class I | | | (1,065,955 | ) | | | (474,458 | ) | | | (542,208 | ) | | | (1,553,060 | ) |
| | | | |
Total distributions to shareholders | | $ | (2,125,348 | ) | | $ | (1,495,826 | ) | | $ | (2,065,865 | ) | | $ | (3,255,603 | ) |
| | | | |
Transactions in shares of beneficial interest — | | | | | | | | | | | | | | | | |
| | | | |
Proceeds from sale of shares | | | | | | | | | | | | | | | | |
| | | | |
Class A | | $ | 5,833,636 | | | $ | 3,758,556 | | | $ | 6,705,262 | | | $ | 8,845,033 | |
| | | | |
Class C | | | 1,063,003 | | | | 991,918 | | | | 1,663,481 | | | | 1,543,084 | |
| | | | |
Class I | | | 19,398,918 | | | | 10,704,944 | | | | 14,965,695 | | | | 21,259,044 | |
| | | | |
Net asset value of shares issued to shareholders in payment of distributions declared | | | | | | | | | | | | | | | | |
| | | | |
Class A | | | 811,560 | | | | 640,434 | | | | 1,265,952 | | | | 1,338,185 | |
| | | | |
Class C | | | 73,585 | | | | 127,363 | | | | 123,812 | | | | 201,197 | |
| | | | |
Class I | | | 631,795 | | | | 401,478 | | | | 466,426 | | | | 872,088 | |
| | | | |
Cost of shares redeemed | | | | | | | | | | | | | | | | |
| | | | |
Class A | | | (4,831,412 | ) | | | (4,403,631 | ) | | | (7,473,008 | ) | | | (9,567,919 | ) |
| | | | |
Class C | | | (1,409,467 | ) | | | (2,195,016 | ) | | | (1,594,586 | ) | | | (2,071,484 | ) |
| | | | |
Class I | | | (12,153,767 | ) | | | (2,310,783 | ) | | | (6,822,336 | ) | | | (11,912,828 | ) |
| | | | |
Net asset value of shares converted | | | | | | | | | | | | | | | | |
| | | | |
Class A | | | 227,851 | | | | 813,485 | | | | 588,629 | | | | 1,726,221 | |
| | | | |
Class C | | | (227,851 | ) | | | (813,485 | ) | | | (588,629 | ) | | | (1,726,221 | ) |
| | | | |
Net increase in net assets from Fund share transactions | | $ | 9,417,851 | | | $ | 7,715,263 | | | $ | 9,300,698 | | | $ | 10,506,400 | |
| | | | |
Net increase in net assets | | $ | 9,646,137 | | | $ | 7,285,361 | | | $ | 9,491,037 | | | $ | 10,320,578 | |
| | |
| Net Assets | | | | | | | | | |
| | | | |
At beginning of year | | $ | 91,234,497 | | | $ | 63,260,012 | | | $ | 71,905,974 | | | $ | 130,680,902 | |
| | | | |
At end of year | | $ | 100,880,634 | | | $ | 70,545,373 | | | $ | 81,397,011 | | | $ | 141,001,480 | |
| | | | |
| | 48 | | See Notes to Financial Statements. |
Eaton Vance
Municipal Income Funds
August 31, 2020
Statements of Changes in Net Assets — continued
| | | | | | | | | | | | |
| | | Year Ended August 31, 2020 | |
| Increase (Decrease) in Net Assets | | Oregon Fund | | | South Carolina Fund | | | Virginia Fund | |
| | | |
From operations — | | | | | | | | | | | | |
| | | |
Net investment income | | $ | 3,391,112 | | | $ | 3,190,281 | | | $ | 1,772,502 | |
| | | |
Net realized gain | | | 205,539 | | | | 420,149 | | | | 167,502 | |
| | | |
Net change in unrealized appreciation (depreciation) | | | 958,326 | | | | 196,210 | | | | 85,834 | |
| | | |
Net increase in net assets from operations | | $ | 4,554,977 | | | $ | 3,806,640 | | | $ | 2,025,838 | |
| | | |
Distributions to shareholders — | | | | | | | | | | | | |
| | | |
Class A | | $ | (2,105,937 | ) | | $ | (1,778,965 | ) | | $ | (1,296,925 | ) |
| | | |
Class C | | | (197,479 | ) | | | (282,319 | ) | | | (80,508 | ) |
| | | |
Class I | | | (1,281,663 | ) | | | (1,244,444 | ) | | | (500,980 | ) |
| | | |
Total distributions to shareholders | | $ | (3,585,079 | ) | | $ | (3,305,728 | ) | | $ | (1,878,413 | ) |
| | | |
Transactions in shares of beneficial interest — | | | | | | | | | | | | |
| | | |
Proceeds from sale of shares | | | | | | | | | | | | |
| | | |
Class A | | $ | 13,826,462 | | | $ | 12,886,483 | | | $ | 3,224,958 | |
| | | |
Class C | | | 3,323,678 | | | | 3,797,685 | | | | 1,437,937 | |
| | | |
Class I | | | 29,874,641 | | | | 23,785,194 | | | | 6,665,580 | |
| | | |
Net asset value of shares issued to shareholders in payment of distributions declared | | | | | | | | | | | | |
| | | |
Class A | | | 1,957,184 | | | | 1,648,189 | | | | 1,044,030 | |
| | | |
Class C | | | 182,680 | | | | 219,570 | | | | 75,000 | |
| | | |
Class I | | | 1,119,667 | | | | 985,450 | | | | 424,608 | |
| | | |
Cost of shares redeemed | | | | | | | | | | | | |
| | | |
Class A | | | (16,114,901 | ) | | | (11,163,672 | ) | | | (6,760,930 | ) |
| | | |
Class C | | | (1,911,115 | ) | | | (5,047,023 | ) | | | (784,356 | ) |
| | | |
Class I | | | (15,178,164 | ) | | | (10,360,654 | ) | | | (4,494,939 | ) |
| | | |
Net asset value of shares converted | | | | | | | | | | | | |
| | | |
Class A | | | 883,383 | | | | 2,679,094 | | | | 564,673 | |
| | | |
Class C | | | (883,383 | ) | | | (2,679,094 | ) | | | (564,673 | ) |
| | | |
Net increase in net assets from Fund share transactions | | $ | 17,080,132 | | | $ | 16,751,222 | | | $ | 831,888 | |
| | | |
Net increase in net assets | | $ | 18,050,030 | | | $ | 17,252,134 | | | $ | 979,313 | |
| |
| Net Assets | | | | | |
| | | |
At beginning of year | | $ | 134,165,157 | | | $ | 131,991,895 | | | $ | 70,741,396 | |
| | | |
At end of year | | $ | 152,215,187 | | | $ | 149,244,029 | | | $ | 71,720,709 | |
| | | | |
| | 49 | | See Notes to Financial Statements. |
Eaton Vance
Municipal Income Funds
August 31, 2020
Statements of Changes in Net Assets — continued
| | | | | | | | | | | | | | | | |
| | | Year Ended August 31, 2019 | |
| Increase (Decrease) in Net Assets | | Georgia Fund | | | Maryland Fund | | | Missouri Fund | | | North Carolina Fund | |
| | | | |
From operations — | | | | | | | | | | | | | | | | |
| | | | |
Net investment income | | $ | 2,116,279 | | | $ | 1,477,755 | | | $ | 2,040,824 | | | $ | 3,227,799 | |
| | | | |
Net realized gain (loss) | | | 43,596 | | | | (30,076 | ) | | | 60,511 | | | | (302,805 | ) |
| | | | |
Net change in unrealized appreciation (depreciation) | | | 3,718,740 | | | | 2,650,900 | | | | 2,898,645 | | | | 5,483,358 | |
| | | | |
Net increase in net assets from operations | | $ | 5,878,615 | | | $ | 4,098,579 | | | $ | 4,999,980 | | | $ | 8,408,352 | |
| | | | |
Distributions to shareholders — | | | | | | | | | | | | | | | | |
| | | | |
Class A | | $ | (1,009,200 | ) | | $ | (945,491 | ) | | $ | (1,465,825 | ) | | $ | (1,666,213 | ) |
| | | | |
Class C | | | (116,794 | ) | | | (220,511 | ) | | | (175,588 | ) | | | (292,431 | ) |
| | | | |
Class I | | | (980,795 | ) | | | (295,047 | ) | | | (406,855 | ) | | | (1,263,958 | ) |
| | | | |
Total distributions to shareholders | | $ | (2,106,789 | ) | | $ | (1,461,049 | ) | | $ | (2,048,268 | ) | | $ | (3,222,602 | ) |
| | | | |
Transactions in shares of beneficial interest — | | | | | | | | | | | | | | | | |
| | | | |
Proceeds from sale of shares | | | | | | | | | | | | | | | | |
| | | | |
Class A | | $ | 7,960,759 | | | $ | 4,373,890 | | | $ | 4,547,511 | | | $ | 5,691,212 | |
| | | | |
Class C | | | 1,199,869 | | | | 906,330 | | | | 1,446,142 | | | | 2,408,757 | |
| | | | |
Class I | | | 15,646,109 | | | | 8,484,312 | | | | 7,068,502 | | | | 27,202,447 | |
| | | | |
Net asset value of shares issued to shareholders in payment of distributions declared | | | | | | | | | | | | | | | | |
| | | | |
Class A | | | 866,271 | | | | 706,475 | | | | 1,369,350 | | | | 1,501,659 | |
| | | | |
Class C | | | 99,572 | | | | 169,626 | | | | 143,501 | | | | 263,528 | |
| | | | |
Class I | | | 538,563 | | | | 242,719 | | | | 360,018 | | | | 734,560 | |
| | | | |
Cost of shares redeemed | | | | | | | | | | | | | | | | |
| | | | |
Class A | | | (5,461,681 | ) | | | (6,750,507 | ) | | | (6,686,163 | ) | | | (13,159,737 | ) |
| | | | |
Class C | | | (1,802,766 | ) | | | (1,666,404 | ) | | | (1,088,706 | ) | | | (4,879,219 | ) |
| | | | |
Class I | | | (7,772,933 | ) | | | (2,556,114 | ) | | | (3,861,683 | ) | | | (12,941,439 | ) |
| | | | |
Net asset value of shares converted | | | | | | | | | | | | | | | | |
| | | | |
Class A | | | 877,424 | | | | 2,298,304 | | | | 1,318,992 | | | | 1,772,125 | |
| | | | |
Class C | | | (877,424 | ) | | | (2,298,304 | ) | | | (1,318,992 | ) | | | (1,772,125 | ) |
| | | | |
Net increase in net assets from Fund share transactions | | $ | 11,273,763 | | | $ | 3,910,327 | | | $ | 3,298,472 | | | $ | 6,821,768 | |
| | | | |
Net increase in net assets | | $ | 15,045,589 | | | $ | 6,547,857 | | | $ | 6,250,184 | | | $ | 12,007,518 | |
| |
| Net Assets | | | | | |
| | | | |
At beginning of year | | $ | 76,188,908 | | | $ | 56,712,155 | | | $ | 65,655,790 | | | $ | 118,673,384 | |
| | | | |
At end of year | | $ | 91,234,497 | | | $ | 63,260,012 | | | $ | 71,905,974 | | | $ | 130,680,902 | |
| | | | |
| | 50 | | See Notes to Financial Statements. |
Eaton Vance
Municipal Income Funds
August 31, 2020
Statements of Changes in Net Assets — continued
| | | | | | | | | | | | |
| | | Year Ended August 31, 2019 | |
| Increase (Decrease) in Net Assets | | Oregon Fund | | | South Carolina Fund | | | Virginia Fund | |
| | | |
From operations — | | | | | | | | | | | | |
| | | |
Net investment income | | $ | 3,408,898 | | | $ | 3,363,595 | | | $ | 2,010,581 | |
| | | |
Net realized gain (loss) | | | (71,628 | ) | | | 732,387 | | | | (487,359 | ) |
| | | |
Net change in unrealized appreciation (depreciation) | | | 5,476,088 | | | | 3,536,577 | | | | 3,257,668 | |
| | | |
Net increase in net assets from operations | | $ | 8,813,358 | | | $ | 7,632,559 | | | $ | 4,780,890 | |
| | | |
Distributions to shareholders — | | | | | | | | | | | | |
| | | |
Class A | | $ | (2,291,482 | ) | | $ | (1,948,826 | ) | | $ | (1,433,965 | ) |
| | | |
Class C | | | (215,551 | ) | | | (450,123 | ) | | | (98,594 | ) |
| | | |
Class I | | | (892,789 | ) | | | (1,069,376 | ) | | | (454,561 | ) |
| | | |
Total distributions to shareholders | | $ | (3,399,822 | ) | | $ | (3,468,325 | ) | | $ | (1,987,120 | ) |
| | | |
Transactions in shares of beneficial interest — | | | | | | | | | | | | |
| | | |
Proceeds from sale of shares | | | | | | | | | | | | |
| | | |
Class A | | $ | 14,586,570 | | | $ | 7,695,518 | | | $ | 2,847,436 | |
| | | |
Class C | | | 3,677,750 | | | | 2,153,698 | | | | 1,611,808 | |
| | | |
Class I | | | 23,411,945 | | | | 15,883,816 | | | | 6,416,142 | |
| | | |
Net asset value of shares issued to shareholders in payment of distributions declared | | | | | | | | | | | | |
| | | |
Class A | | | 2,131,064 | | | | 1,811,434 | | | | 1,152,331 | |
| | | |
Class C | | | 208,273 | | | | 376,062 | | | | 89,261 | |
| | | |
Class I | | | 773,121 | | | | 831,405 | | | | 380,129 | |
| | | |
Cost of shares redeemed | | | | | | | | | | | | |
| | | |
Class A | | | (13,453,343 | ) | | | (9,327,405 | ) | | | (6,118,385 | ) |
| | | |
Class C | | | (2,333,026 | ) | | | (5,536,495 | ) | | | (901,951 | ) |
| | | |
Class I | | | (7,427,149 | ) | | | (9,117,130 | ) | | | (3,460,613 | ) |
| | | |
Net asset value of shares converted | | | | | | | | | | | | |
| | | |
Class A | | | 1,968,913 | | | | 3,937,927 | | | | 1,667,534 | |
| | | |
Class C | | | (1,968,913 | ) | | | (3,937,927 | ) | | | (1,667,534 | ) |
| | | |
Net increase in net assets from Fund share transactions | | $ | 21,575,205 | | | $ | 4,770,903 | | | $ | 2,016,158 | |
| | | |
Net increase in net assets | | $ | 26,988,741 | | | $ | 8,935,137 | | | $ | 4,809,928 | |
| |
| Net Assets | | | | | |
| | | |
At beginning of year | | $ | 107,176,416 | | | $ | 123,056,758 | | | $ | 65,931,468 | |
| | | |
At end of year | | $ | 134,165,157 | | | $ | 131,991,895 | | | $ | 70,741,396 | |
| | | | |
| | 51 | | See Notes to Financial Statements. |
Eaton Vance
Municipal Income Funds
August 31, 2020
Financial Highlights
| | | | | | | | | | | | | | | | | | | | |
| | | Georgia Fund — Class A | |
| |
| | | Year Ended August 31, | |
| | | 2020 | | | 2019 | | | 2018 | | | 2017 | | | 2016 | |
| | | | | |
Net asset value — Beginning of year | | $ | 8.770 | | | $ | 8.370 | | | $ | 8.620 | | | $ | 8.860 | | | $ | 8.540 | |
| | | | | |
| Income (Loss) From Operations | | | | | | | | | | | | | | | | | | | | |
| | | | | |
Net investment income(1) | | $ | 0.197 | | | $ | 0.227 | | | $ | 0.248 | | | $ | 0.251 | | | $ | 0.267 | |
| | | | | |
Net realized and unrealized gain (loss) | | | 0.029 | | | | 0.399 | | | | (0.251 | ) | | | (0.240 | ) | | | 0.318 | |
| | | | | |
Total income (loss) from operations | | $ | 0.226 | | | $ | 0.626 | | | $ | (0.003 | ) | | $ | 0.011 | | | $ | 0.585 | |
| | | | | |
| Less Distributions | | | | | | | | | | | | | | | | | | | | |
| | | | | |
From net investment income | | $ | (0.196 | ) | | $ | (0.226 | ) | | $ | (0.247 | ) | | $ | (0.251 | ) | | $ | (0.265 | ) |
| | | | | |
Total distributions | | $ | (0.196 | ) | | $ | (0.226 | ) | | $ | (0.247 | ) | | $ | (0.251 | ) | | $ | (0.265 | ) |
| | | | | |
Net asset value — End of year | | $ | 8.800 | | | $ | 8.770 | | | $ | 8.370 | | | $ | 8.620 | | | $ | 8.860 | |
| | | | | |
Total Return(2) | | | 2.62 | % | | | 7.61 | % | | | (0.02 | )% | | | 0.19 | % | | | 6.94 | % |
| | | | | |
| Ratios/Supplemental Data | | | | | | | | | | | | | | | | | | | | |
| | | | | |
Net assets, end of year (000’s omitted) | | $ | 45,047 | | | $ | 42,894 | | | $ | 36,835 | | | $ | 39,422 | | | $ | 41,560 | |
| | | | | |
Ratios (as a percentage of average daily net assets): | | | | | | | | | | | | | | | | | | | | |
| | | | | |
Total expenses | | | 0.67 | % | | | 0.70 | % | | | 0.70 | % | | | 0.70 | % | | | 0.70 | % |
| | | | | |
Net investment income | | | 2.26 | % | | | 2.67 | % | | | 2.94 | % | | | 2.94 | % | | | 3.06 | % |
| | | | | |
Portfolio Turnover | | | 16 | % | | | 12 | % | | | 7 | % | | | 7 | % | | | 7 | % |
| (1) | Computed using average shares outstanding. |
| (2) | Returns are historical and are calculated by determining the percentage change in net asset value with all distributions reinvested and do not reflect the effect of sales charges. |
| | | | |
| | 52 | | See Notes to Financial Statements. |
Eaton Vance
Municipal Income Funds
August 31, 2020
Financial Highlights — continued
| | | | | | | | | | | | | | | | | | | | |
| | | Georgia Fund — Class C | |
| |
| | | Year Ended August 31, | |
| | | 2020 | | | 2019 | | | 2018 | | | 2017 | | | 2016 | |
| | | | | |
Net asset value — Beginning of year | | $ | 9.380 | | | $ | 8.950 | | | $ | 9.220 | | | $ | 9.480 | | | $ | 9.130 | |
| | | | | |
| Income (Loss) From Operations | | | | | | | | | | | | | | | | | | | | |
| | | | | |
Net investment income(1) | | $ | 0.141 | | | $ | 0.177 | | | $ | 0.197 | | | $ | 0.200 | | | $ | 0.215 | |
| | | | | |
Net realized and unrealized gain (loss) | | | 0.028 | | | | 0.427 | | | | (0.271 | ) | | | (0.260 | ) | | | 0.349 | |
| | | | | |
Total income (loss) from operations | | $ | 0.169 | | | $ | 0.604 | | | $ | (0.074 | ) | | $ | (0.060 | ) | | $ | 0.564 | |
| | | | | |
| Less Distributions | | | | | | | | | | | | | | | | | | | | |
| | | | | |
From net investment income | | $ | (0.139 | ) | | $ | (0.174 | ) | | $ | (0.196 | ) | | $ | (0.200 | ) | | $ | (0.214 | ) |
| | | | | |
Total distributions | | $ | (0.139 | ) | | $ | (0.174 | ) | | $ | (0.196 | ) | | $ | (0.200 | ) | | $ | (0.214 | ) |
| | | | | |
Net asset value — End of year | | $ | 9.410 | | | $ | 9.380 | | | $ | 8.950 | | | $ | 9.220 | | | $ | 9.480 | |
| | | | | |
Total Return(2) | | | 1.83 | % | | | 6.84 | % | | | (0.79 | )% | | | (0.60 | )% | | | 6.24 | % |
| | | | | |
| Ratios/Supplemental Data | | | | | | | | | | | | | | | | | | | | |
| | | | | |
Net assets, end of year (000’s omitted) | | $ | 5,271 | | | $ | 5,749 | | | $ | 6,869 | | | $ | 7,554 | | | $ | 7,058 | |
| | | | | |
Ratios (as a percentage of average daily net assets): | | | | | | | | | | | | | | | | | | | | |
| | | | | |
Total expenses | | | 1.42 | % | | | 1.45 | % | | | 1.45 | % | | | 1.45 | % | | | 1.45 | % |
| | | | | |
Net investment income | | | 1.51 | % | | | 1.95 | % | | | 2.19 | % | | | 2.18 | % | | | 2.30 | % |
| | | | | |
Portfolio Turnover | | | 16 | % | | | 12 | % | | | 7 | % | | | 7 | % | | | 7 | % |
| (1) | Computed using average shares outstanding. |
| (2) | Returns are historical and are calculated by determining the percentage change in net asset value with all distributions reinvested and do not reflect the effect of sales charges. |
| | | | |
| | 53 | | See Notes to Financial Statements. |
Eaton Vance
Municipal Income Funds
August 31, 2020
Financial Highlights — continued
| | | | | | | | | | | | | | | | | | | | |
| | | Georgia Fund — Class I | |
| |
| | | Year Ended August 31, | |
| | | 2020 | | | 2019 | | | 2018 | | | 2017 | | | 2016 | |
| | | | | |
Net asset value — Beginning of year | | $ | 8.800 | | | $ | 8.400 | | | $ | 8.640 | | | $ | 8.890 | | | $ | 8.560 | |
| | | | | |
| Income (Loss) From Operations | | | | | | | | | | | | | | | | | | | | |
| | | | | |
Net investment income(1) | | $ | 0.214 | | | $ | 0.243 | | | $ | 0.265 | | | $ | 0.269 | | | $ | 0.285 | |
| | | | | |
Net realized and unrealized gain (loss) | | | 0.020 | | | | 0.401 | | | | (0.241 | ) | | | (0.250 | ) | | | 0.329 | |
| | | | | |
Total income from operations | | $ | 0.234 | | | $ | 0.644 | | | $ | 0.024 | | | $ | 0.019 | | | $ | 0.614 | |
| | | | | |
| Less Distributions | | | | | | | | | | | | | | | | | | | | |
| | | | | |
From net investment income | | $ | (0.214 | ) | | $ | (0.244 | ) | | $ | (0.264 | ) | | $ | (0.269 | ) | | $ | (0.284 | ) |
| | | | | |
Total distributions | | $ | (0.214 | ) | | $ | (0.244 | ) | | $ | (0.264 | ) | | $ | (0.269 | ) | | $ | (0.284 | ) |
| | | | | |
Net asset value — End of year | | $ | 8.820 | | | $ | 8.800 | | | $ | 8.400 | | | $ | 8.640 | | | $ | 8.890 | |
| | | | | |
Total Return(2) | | | 2.71 | % | | | 7.81 | % | | | 0.31 | % | | | 0.28 | % | | | 7.27 | % |
| | | | | |
| Ratios/Supplemental Data | | | | | | | | | | | | | | | | | | | | |
| | | | | |
Net assets, end of year (000’s omitted) | | $ | 50,563 | | | $ | 42,592 | | | $ | 32,485 | | | $ | 31,107 | | | $ | 26,746 | |
| | | | | |
Ratios (as a percentage of average daily net assets): | | | | | | | | | | | | | | | | | | | | |
| | | | | |
Total expenses | | | 0.47 | % | | | 0.49 | % | | | 0.50 | % | | | 0.50 | % | | | 0.50 | % |
| | | | | |
Net investment income | | | 2.45 | % | | | 2.86 | % | | | 3.14 | % | | | 3.14 | % | | | 3.25 | % |
| | | | | |
Portfolio Turnover | | | 16 | % | | | 12 | % | | | 7 | % | | | 7 | % | | | 7 | % |
| (1) | Computed using average shares outstanding. |
| (2) | Returns are historical and are calculated by determining the percentage change in net asset value with all distributions reinvested. |
| | | | |
| | 54 | | See Notes to Financial Statements. |
Eaton Vance
Municipal Income Funds
August 31, 2020
Financial Highlights — continued
| | | | | | | | | | | | | | | | | | | | |
| | | Maryland Fund — Class A | |
| |
| | | Year Ended August 31, | |
| | | 2020 | | | 2019 | | | 2018 | | | 2017 | | | 2016 | |
| | | | | |
Net asset value — Beginning of year | | $ | 9.070 | | | $ | 8.670 | | | $ | 8.920 | | | $ | 9.130 | | | $ | 8.990 | |
| | | | | |
| Income (Loss) From Operations | | | | | | | | | | | | | | | | | | | | |
| | | | | |
Net investment income(1) | | $ | 0.203 | | | $ | 0.235 | | | $ | 0.246 | | | $ | 0.268 | | | $ | 0.294 | |
| | | | | |
Net realized and unrealized gain (loss) | | | (0.057 | ) | | | 0.398 | | | | (0.249 | ) | | | (0.208 | ) | | | 0.167 | |
| | | | | |
Total income (loss) from operations | | $ | 0.146 | | | $ | 0.633 | | | $ | (0.003 | ) | | $ | 0.060 | | | $ | 0.461 | |
| | | | | |
| Less Distributions | | | | | | | | | | | | | | | | | | | | |
| | | | | |
From net investment income | | $ | (0.206 | ) | | $ | (0.233 | ) | | $ | (0.247 | ) | | $ | (0.270 | ) | | $ | (0.321 | ) |
| | | | | |
Total distributions | | $ | (0.206 | ) | | $ | (0.233 | ) | | $ | (0.247 | ) | | $ | (0.270 | ) | | $ | (0.321 | ) |
| | | | | |
Net asset value — End of year | | $ | 9.010 | | | $ | 9.070 | | | $ | 8.670 | | | $ | 8.920 | | | $ | 9.130 | |
| | | | | |
Total Return(2) | | | 1.64 | % | | | 7.43 | % | | | (0.02 | )% | | | 0.72 | % | | | 5.20 | % |
| | | | | |
| Ratios/Supplemental Data | | | | | | | | | | | | | | | | | | | | |
| | | | | |
Net assets, end of year (000’s omitted) | | $ | 38,368 | | | $ | 37,847 | | | $ | 35,602 | | | $ | 39,642 | | | $ | 42,479 | |
| | | | | |
Ratios (as a percentage of average daily net assets): | | | | | | | | | | | | | | | | | | | | |
| | | | | |
Expenses excluding interest and fees | | | 0.69 | % | | | 0.73 | % | | | 0.73 | % | | | 0.73 | % | | | 0.74 | % |
| | | | | |
Interest and fee expense(3) | | | — | | | | — | | | | 0.04 | % | | | 0.03 | % | | | 0.02 | % |
| | | | | |
Total expenses | | | 0.69 | % | | | 0.73 | % | | | 0.77 | % | | | 0.76 | % | | | 0.76 | % |
| | | | | |
Net investment income | | | 2.27 | % | | | 2.69 | % | | | 2.82 | % | | | 3.02 | % | | | 3.24 | % |
| | | | | |
Portfolio Turnover | | | 24 | % | | | 21 | % | | | 24 | % | | | 22 | % | | | 11 | % |
| (1) | Computed using average shares outstanding. |
| (2) | Returns are historical and are calculated by determining the percentage change in net asset value with all distributions reinvested and do not reflect the effect of sales charges. |
| (3) | Interest and fee expense relates to the liability for floating rate notes issued in conjunction with residual interest bond transactions (see Note 1H). |
| | | | |
| | 55 | | See Notes to Financial Statements. |
Eaton Vance
Municipal Income Funds
August 31, 2020
Financial Highlights — continued
| | | | | | | | | | | | | | | | | | | | |
| | | Maryland Fund — Class C | |
| |
| | | Year Ended August 31, | |
| | | 2020 | | | 2019 | | | 2018 | | | 2017 | | | 2016 | |
| | | | | |
Net asset value — Beginning of year | | $ | 9.890 | | | $ | 9.460 | | | $ | 9.730 | | | $ | 9.960 | | | $ | 9.810 | |
| | | | | |
| Income (Loss) From Operations | | | | | | | | | | | | | | | | | | | | |
| | | | | |
Net investment income(1) | | $ | 0.148 | | | $ | 0.185 | | | $ | 0.197 | | | $ | 0.220 | | | $ | 0.247 | |
| | | | | |
Net realized and unrealized gain (loss) | | | (0.057 | ) | | | 0.427 | | | | (0.269 | ) | | | (0.228 | ) | | | 0.179 | |
| | | | | |
Total income (loss) from operations | | $ | 0.091 | | | $ | 0.612 | | | $ | (0.072 | ) | | $ | (0.008 | ) | | $ | 0.426 | |
| | | | | |
| Less Distributions | | | | | | | | | | | | | | | | | | | | |
| | | | | |
From net investment income | | $ | (0.151 | ) | | $ | (0.182 | ) | | $ | (0.198 | ) | | $ | (0.222 | ) | | $ | (0.276 | ) |
| | | | | |
Total distributions | | $ | (0.151 | ) | | $ | (0.182 | ) | | $ | (0.198 | ) | | $ | (0.222 | ) | | $ | (0.276 | ) |
| | | | | |
Net asset value — End of year | | $ | 9.830 | | | $ | 9.890 | | | $ | 9.460 | | | $ | 9.730 | | | $ | 9.960 | |
| | | | | |
Total Return(2) | | | 0.94 | % | | | 6.55 | % | | | (0.73 | )% | | | (0.04 | )% | | | 4.39 | % |
| | | | | |
| Ratios/Supplemental Data | | | | | | | | | | | | | | | | | | | | |
| | | | | |
Net assets, end of year (000’s omitted) | | $ | 8,767 | | | $ | 10,728 | | | $ | 13,147 | | | $ | 15,079 | | | $ | 16,356 | |
| | | | | |
Ratios (as a percentage of average daily net assets): | | | | | | | | | | | | | | | | | | | | |
| | | | | |
Expenses excluding interest and fees | | | 1.45 | % | | | 1.49 | % | | | 1.48 | % | | | 1.48 | % | | | 1.49 | % |
| | | | | |
Interest and fee expense(3) | | | — | | | | — | | | | 0.04 | % | | | 0.03 | % | | | 0.02 | % |
| | | | | |
Total expenses | | | 1.45 | % | | | 1.49 | % | | | 1.52 | % | | | 1.51 | % | | | 1.51 | % |
| | | | | |
Net investment income | | | 1.52 | % | | | 1.94 | % | | | 2.07 | % | | | 2.27 | % | | | 2.49 | % |
| | | | | |
Portfolio Turnover | | | 24 | % | | | 21 | % | | | 24 | % | | | 22 | % | | | 11 | % |
| (1) | Computed using average shares outstanding. |
| (2) | Returns are historical and are calculated by determining the percentage change in net asset value with all distributions reinvested and do not reflect the effect of sales charges. |
| (3) | Interest and fee expense relates to the liability for floating rate notes issued in conjunction with residual interest bond transactions (see Note 1H). |
| | | | |
| | 56 | | See Notes to Financial Statements. |
Eaton Vance
Municipal Income Funds
August 31, 2020
Financial Highlights — continued
| | | | | | | | | | | | | | | | | | | | |
| | | Maryland Fund — Class I | |
| |
| | | Year Ended August 31, | |
| | | 2020 | | | 2019 | | | 2018 | | | 2017 | | | 2016 | |
| | | | | |
Net asset value — Beginning of year | | $ | 9.090 | | | $ | 8.690 | | | $ | 8.940 | | | $ | 9.150 | | | $ | 9.010 | |
| | | | | |
| Income (Loss) From Operations | | | | | | | | | | | | | | | | | | | | |
| | | | | |
Net investment income(1) | | $ | 0.221 | | | $ | 0.252 | | | $ | 0.265 | | | $ | 0.287 | | | $ | 0.310 | |
| | | | | |
Net realized and unrealized gain (loss) | | | (0.057 | ) | | | 0.399 | | | | (0.250 | ) | | | (0.208 | ) | | | 0.170 | |
| | | | | |
Total income from operations | | $ | 0.164 | | | $ | 0.651 | | | $ | 0.015 | | | $ | 0.079 | | | $ | 0.480 | |
| | | | | |
| Less Distributions | | | | | | | | | | | | | | | | | | | | |
| | | | | |
From net investment income | | $ | (0.224 | ) | | $ | (0.251 | ) | | $ | (0.265 | ) | | $ | (0.289 | ) | | $ | (0.340 | ) |
| | | | | |
Total distributions | | $ | (0.224 | ) | | $ | (0.251 | ) | | $ | (0.265 | ) | | $ | (0.289 | ) | | $ | (0.340 | ) |
| | | | | |
Net asset value — End of year | | $ | 9.030 | | | $ | 9.090 | | | $ | 8.690 | | | $ | 8.940 | | | $ | 9.150 | |
| | | | | |
Total Return(2) | | | 1.85 | % | | | 7.63 | % | | | 0.19 | % | | | 0.93 | % | | | 5.41 | % |
| | | | | |
| Ratios/Supplemental Data | | | | | | | | | | | | | | | | | | | | |
| | | | | |
Net assets, end of year (000’s omitted) | | $ | 23,411 | | | $ | 14,685 | | | $ | 7,963 | | | $ | 9,874 | | | $ | 7,572 | |
| | | | | |
Ratios (as a percentage of average daily net assets): | | | | | | | | | | | | | | | | | | | | |
| | | | | |
Expenses excluding interest and fees | | | 0.49 | % | | | 0.52 | % | | | 0.53 | % | | | 0.53 | % | | | 0.54 | % |
| | | | | |
Interest and fee expense(3) | | | — | | | | — | | | | 0.04 | % | | | 0.03 | % | | | 0.02 | % |
| | | | | |
Total expenses | | | 0.49 | % | | | 0.52 | % | | | 0.57 | % | | | 0.56 | % | | | 0.56 | % |
| | | | | |
Net investment income | | | 2.47 | % | | | 2.87 | % | | | 3.02 | % | | | 3.22 | % | | | 3.41 | % |
| | | | | |
Portfolio Turnover | | | 24 | % | | | 21 | % | | | 24 | % | | | 22 | % | | | 11 | % |
| (1) | Computed using average shares outstanding. |
| (2) | Returns are historical and are calculated by determining the percentage change in net asset value with all distributions reinvested. |
| (3) | Interest and fee expense relates to the liability for floating rate notes issued in conjunction with residual interest bond transactions (see Note 1H). |
| | | | |
| | 57 | | See Notes to Financial Statements. |
Eaton Vance
Municipal Income Funds
August 31, 2020
Financial Highlights — continued
| | | | | | | | | | | | | | | | | | | | |
| | | Missouri Fund — Class A | |
| |
| | | Year Ended August 31, | |
| | | 2020 | | | 2019 | | | 2018 | | | 2017 | | | 2016 | |
| | | | | |
Net asset value — Beginning of year | | $ | 9.670 | | | $ | 9.270 | | | $ | 9.500 | | | $ | 9.820 | | | $ | 9.480 | |
| | | | | |
| Income (Loss) From Operations | | | | | | | | | | | | | | | | | | | | |
| | | | | |
Net investment income(1) | | $ | 0.256 | | | $ | 0.286 | | | $ | 0.310 | | | $ | 0.334 | | | $ | 0.346 | |
| | | | | |
Net realized and unrealized gain (loss) | | | 0.032 | | | | 0.401 | | | | (0.231 | ) | | | (0.324 | ) | | | 0.336 | |
| | | | | |
Total income from operations | | $ | 0.288 | | | $ | 0.687 | | | $ | 0.079 | | | $ | 0.010 | | | $ | 0.682 | |
| | | | | |
| Less Distributions | | | | | | | | | | | | | | | | | | | | |
| | | | | |
From net investment income | | $ | (0.268 | ) | | $ | (0.287 | ) | | $ | (0.309 | ) | | $ | (0.330 | ) | | $ | (0.342 | ) |
| | | | | |
Total distributions | | $ | (0.268 | ) | | $ | (0.287 | ) | | $ | (0.309 | ) | | $ | (0.330 | ) | | $ | (0.342 | ) |
| | | | | |
Net asset value — End of year | | $ | 9.690 | | | $ | 9.670 | | | $ | 9.270 | | | $ | 9.500 | | | $ | 9.820 | |
| | | | | |
Total Return(2) | | | 3.04 | % | | | 7.57 | % | | | 0.88 | % | | | 0.17 | % | | | 7.32 | % |
| | | | | |
| Ratios/Supplemental Data | | | | | | | | | | | | | | | | | | | | |
| | | | | |
Net assets, end of year (000’s omitted) | | $ | 50,698 | | | $ | 49,542 | | | $ | 46,928 | | | $ | 47,375 | | | $ | 61,038 | |
| | | | | |
Ratios (as a percentage of average daily net assets): | | | | | | | | | | | | | | | | | | | | |
| | | | | |
Expenses excluding interest and fees | | | 0.69 | % | | | 0.71 | % | | | 0.70 | % | | | 0.71 | % | | | 0.70 | % |
| | | | | |
Interest and fee expense(3) | | | — | | | | — | | | | 0.00 | %(4) | | | 0.02 | % | | | 0.01 | % |
| | | | | |
Total expenses | | | 0.69 | % | | | 0.71 | % | | | 0.70 | % | | | 0.73 | % | | | 0.71 | % |
| | | | | |
Net investment income | | | 2.67 | % | | | 3.07 | % | | | 3.33 | % | | | 3.52 | % | | | 3.59 | % |
| | | | | |
Portfolio Turnover | | | 17 | % | | | 19 | % | | | 35 | % | | | 12 | % | | | 10 | % |
| (1) | Computed using average shares outstanding. |
| (2) | Returns are historical and are calculated by determining the percentage change in net asset value with all distributions reinvested and do not reflect the effect of sales charges. |
| (3) | Interest and fee expense relates to the liability for floating rate notes issued in conjunction with residual interest bond transactions (see Note 1H). |
| (4) | Amount is less than 0.005%. |
| | | | |
| | 58 | | See Notes to Financial Statements. |
Eaton Vance
Municipal Income Funds
August 31, 2020
Financial Highlights — continued
| | | | | | | | | | | | | | | | | | | | |
| | | Missouri Fund — Class C | |
| |
| | | Year Ended August 31, | |
| | | 2020 | | | 2019 | | | 2018 | | | 2017 | | | 2016 | |
| | | | | |
Net asset value — Beginning of year | | $ | 10.670 | | | $ | 10.230 | | | $ | 10.490 | | | $ | 10.850 | | | $ | 10.460 | |
| | | | | |
| Income (Loss) From Operations | | | | | | | | | | | | | | | | | | | | |
| | | | | |
Net investment income(1) | | $ | 0.203 | | | $ | 0.239 | | | $ | 0.266 | | | $ | 0.290 | | | $ | 0.299 | |
| | | | | |
Net realized and unrealized gain (loss) | | | 0.043 | | | | 0.441 | | | | (0.262 | ) | | | (0.364 | ) | | | 0.389 | |
| | | | | |
Total income (loss) from operations | | $ | 0.246 | | | $ | 0.680 | | | $ | 0.004 | | | $ | (0.074 | ) | | $ | 0.688 | |
| | | | | |
| Less Distributions | | | | | | | | | | | | | | | | | | | | |
| | | | | |
From net investment income | | $ | (0.216 | ) | | $ | (0.240 | ) | | $ | (0.264 | ) | | $ | (0.286 | ) | | $ | (0.298 | ) |
| | | | | |
Total distributions | | $ | (0.216 | ) | | $ | (0.240 | ) | | $ | (0.264 | ) | | $ | (0.286 | ) | | $ | (0.298 | ) |
| | | | | |
Net asset value — End of year | | $ | 10.700 | | | $ | 10.670 | | | $ | 10.230 | | | $ | 10.490 | | | $ | 10.850 | |
| | | | | |
Total Return(2) | | | 2.35 | % | | | 6.75 | % | | | 0.06 | % | | | (0.64 | )% | | | 6.66 | % |
| | | | | |
| Ratios/Supplemental Data | | | | | | | | | | | | | | | | | | | | |
| | | | | |
Net assets, end of year (000’s omitted) | | $ | 7,210 | | | $ | 7,594 | | | $ | 8,112 | | | $ | 9,005 | | | $ | 9,420 | |
| | | | | |
Ratios (as a percentage of average daily net assets): | | | | | | | | | | | | | | | | | | | | |
| | | | | |
Expenses excluding interest and fees | | | 1.44 | % | | | 1.46 | % | | | 1.45 | % | | | 1.46 | % | | | 1.45 | % |
| | | | | |
Interest and fee expense(3) | | | — | | | | — | | | | 0.00 | %(4) | | | 0.02 | % | | | 0.01 | % |
| | | | | |
Total expenses | | | 1.44 | % | | | 1.46 | % | | | 1.45 | % | | | 1.48 | % | | | 1.46 | % |
| | | | | |
Net investment income | | | 1.92 | % | | | 2.32 | % | | | 2.59 | % | | | 2.77 | % | | | 2.81 | % |
| | | | | |
Portfolio Turnover | | | 17 | % | | | 19 | % | | | 35 | % | | | 12 | % | | | 10 | % |
| (1) | Computed using average shares outstanding. |
| (2) | Returns are historical and are calculated by determining the percentage change in net asset value with all distributions reinvested and do not reflect the effect of sales charges. |
| (3) | Interest and fee expense relates to the liability for floating rate notes issued in conjunction with residual interest bond transactions (see Note 1H). |
| (4) | Amount is less than 0.005%. |
| | | | |
| | 59 | | See Notes to Financial Statements. |
Eaton Vance
Municipal Income Funds
August 31, 2020
Financial Highlights — continued
| | | | | | | | | | | | | | | | | | | | |
| | | Missouri Fund — Class I | |
| |
| | | Year Ended August 31, | |
| | | 2020 | | | 2019 | | | 2018 | | | 2017 | | | 2016 | |
| | | | | |
Net asset value — Beginning of year | | $ | 9.680 | | | $ | 9.280 | | | $ | 9.520 | | | $ | 9.840 | | | $ | 9.490 | |
| | | | | |
| Income (Loss) From Operations | | | | | | | | | | | | | | | | | | | | |
| | | | | |
Net investment income(1) | | $ | 0.275 | | | $ | 0.305 | | | $ | 0.328 | | | $ | 0.352 | | | $ | 0.364 | |
| | | | | |
Net realized and unrealized gain (loss) | | | 0.041 | | | | 0.401 | | | | (0.240 | ) | | | (0.322 | ) | | | 0.348 | |
| | | | | |
Total income from operations | | $ | 0.316 | | | $ | 0.706 | | | $ | 0.088 | | | $ | 0.030 | | | $ | 0.712 | |
| | | | | |
| Less Distributions | | | | | | | | | | | | | | | | | | | | |
| | | | | |
From net investment income | | $ | (0.286 | ) | | $ | (0.306 | ) | | $ | (0.328 | ) | | $ | (0.350 | ) | | $ | (0.362 | ) |
| | | | | |
Total distributions | | $ | (0.286 | ) | | $ | (0.306 | ) | | $ | (0.328 | ) | | $ | (0.350 | ) | | $ | (0.362 | ) |
| | | | | |
Net asset value — End of year | | $ | 9.710 | | | $ | 9.680 | | | $ | 9.280 | | | $ | 9.520 | | | $ | 9.840 | |
| | | | | |
Total Return(2) | | | 3.33 | % | | | 7.78 | % | | | 0.97 | % | | | 0.38 | % | | | 7.64 | % |
| | | | | |
| Ratios/Supplemental Data | | | | | | | | | | | | | | | | | | | | |
| | | | | |
Net assets, end of year (000’s omitted) | | $ | 23,490 | | | $ | 14,770 | | | $ | 10,616 | | | $ | 8,070 | | | $ | 4,732 | |
| | | | | |
Ratios (as a percentage of average daily net assets): | | | | | | | | | | | | | | | | | | | | |
| | | | | |
Expenses excluding interest and fees | | | 0.49 | % | | | 0.50 | % | | | 0.50 | % | | | 0.51 | % | | | 0.50 | % |
| | | | | |
Interest and fee expense(3) | | | — | | | | — | | | | 0.00 | %(4) | | | 0.02 | % | | | 0.01 | % |
| | | | | |
Total expenses | | | 0.49 | % | | | 0.50 | % | | | 0.50 | % | | | 0.53 | % | | | 0.51 | % |
| | | | | |
Net investment income | | | 2.86 | % | | | 3.26 | % | | | 3.52 | % | | | 3.71 | % | | | 3.76 | % |
| | | | | |
Portfolio Turnover | | | 17 | % | | | 19 | % | | | 35 | % | | | 12 | % | | | 10 | % |
| (1) | Computed using average shares outstanding. |
| (2) | Returns are historical and are calculated by determining the percentage change in net asset value with all distributions reinvested. |
| (3) | Interest and fee expense relates to the liability for floating rate notes issued in conjunction with residual interest bond transactions (see Note 1H). |
| (4) | Amount is less than 0.005%. |
| | | | |
| | 60 | | See Notes to Financial Statements. |
Eaton Vance
Municipal Income Funds
August 31, 2020
Financial Highlights — continued
| | | | | | | | | | | | | | | | | | | | |
| | | North Carolina Fund — Class A | |
| |
| | | Year Ended August 31, | |
| | | 2020 | | | 2019 | | | 2018 | | | 2017 | | | 2016 | |
| | | | | |
Net asset value — Beginning of year | | $ | 9.190 | | | $ | 8.810 | | | $ | 9.110 | | | $ | 9.410 | | | $ | 9.120 | |
| | | | | |
| Income (Loss) From Operations | | | | | | | | | | | | | | | | | | | | |
| | | | | |
Net investment income(1) | | $ | 0.207 | | | $ | 0.242 | | | $ | 0.276 | | | $ | 0.289 | | | $ | 0.305 | |
| | | | | |
Net realized and unrealized gain (loss) | | | 0.013 | | | | 0.379 | | | | (0.301 | ) | | | (0.300 | ) | | | 0.289 | |
| | | | | |
Total income (loss) from operations | | $ | 0.220 | | | $ | 0.621 | | | $ | (0.025 | ) | | $ | (0.011 | ) | | $ | 0.594 | |
| | | | | |
| Less Distributions | | | | | | | | | | | | | | | | | | | | |
| | | | | |
From net investment income | | $ | (0.220 | ) | | $ | (0.241 | ) | | $ | (0.275 | ) | | $ | (0.289 | ) | | $ | (0.304 | ) |
| | | | | |
Total distributions | | $ | (0.220 | ) | | $ | (0.241 | ) | | $ | (0.275 | ) | | $ | (0.289 | ) | | $ | (0.304 | ) |
| | | | | |
Net asset value — End of year | | $ | 9.190 | | | $ | 9.190 | | | $ | 8.810 | | | $ | 9.110 | | | $ | 9.410 | |
| | | | | |
Total Return(2) | | | 2.44 | % | | | 7.19 | % | | | (0.25 | )% | | | (0.06 | )% | | | 6.61 | % |
| | | | | |
| Ratios/Supplemental Data | | | | | | | | | | | | | | | | | | | | |
| | | | | |
Net assets, end of year (000’s omitted) | | $ | 64,513 | | | $ | 62,294 | | | $ | 63,964 | | | $ | 75,159 | | | $ | 83,512 | |
| | | | | |
Ratios (as a percentage of average daily net assets): | | | | | | | | | | | | | | | | | | | | |
| | | | | |
Expenses excluding interest and fees | | | 0.67 | % | | | 0.70 | % | | | 0.70 | % | | | 0.71 | % | | | 0.70 | % |
| | | | | |
Interest and fee expense(3) | | | — | | | | 0.04 | % | | | 0.10 | % | | | 0.09 | % | | | 0.07 | % |
| | | | | |
Total expenses | | | 0.67 | % | | | 0.74 | % | | | 0.80 | % | | | 0.80 | % | | | 0.77 | % |
| | | | | |
Net investment income | | | 2.28 | % | | | 2.73 | % | | | 3.10 | % | | | 3.19 | % | | | 3.28 | % |
| | | | | |
Portfolio Turnover | | | 21 | % | | | 37 | % | | | 16 | % | | | 27 | % | | | 8 | % |
| (1) | Computed using average shares outstanding. |
| (2) | Returns are historical and are calculated by determining the percentage change in net asset value with all distributions reinvested and do not reflect the effect of sales charges. |
| (3) | Interest and fee expense relates to the liability for floating rate notes issued in conjunction with residual interest bond transactions (see Note 1H). |
| | | | |
| | 61 | | See Notes to Financial Statements. |
Eaton Vance
Municipal Income Funds
August 31, 2020
Financial Highlights — continued
| | | | | | | | | | | | | | | | | | | | |
| | | North Carolina Fund — Class C | |
| |
| | | Year Ended August 31, | |
| | | 2020 | | | 2019 | | | 2018 | | | 2017 | | | 2016 | |
| | | | | |
Net asset value — Beginning of year | | $ | 9.880 | | | $ | 9.480 | | | $ | 9.800 | | | $ | 10.120 | | | $ | 9.810 | |
| | | | | |
| Income (Loss) From Operations | | | | | | | | | | | | | | | | | | | | |
| | | | | |
Net investment income(1) | | $ | 0.150 | | | $ | 0.191 | | | $ | 0.225 | | | $ | 0.238 | | | $ | 0.252 | |
| | | | | |
Net realized and unrealized gain (loss) | | | 0.014 | | | | 0.397 | | | | (0.321 | ) | | | (0.321 | ) | | | 0.310 | |
| | | | | |
Total income (loss) from operations | | $ | 0.164 | | | $ | 0.588 | | | $ | (0.096 | ) | | $ | (0.083 | ) | | $ | 0.562 | |
| | | | | |
| Less Distributions | | | | | | | | | | | | | | | | | | | | |
| | | | | |
From net investment income | | $ | (0.164 | ) | | $ | (0.188 | ) | | $ | (0.224 | ) | | $ | (0.237 | ) | | $ | (0.252 | ) |
| | | | | |
Total distributions | | $ | (0.164 | ) | | $ | (0.188 | ) | | $ | (0.224 | ) | | $ | (0.237 | ) | | $ | (0.252 | ) |
| | | | | |
Net asset value — End of year | | $ | 9.880 | | | $ | 9.880 | | | $ | 9.480 | | | $ | 9.800 | | | $ | 10.120 | |
| | | | | |
Total Return(2) | | | 1.69 | % | | | 6.30 | % | | | (0.97 | )% | | | (0.78 | )% | | | 5.80 | % |
| | | | | |
| Ratios/Supplemental Data | | | | | | | | | | | | | | | | | | | | |
| | | | | |
Net assets, end of year (000’s omitted) | | $ | 11,741 | | | $ | 13,809 | | | $ | 17,235 | | | $ | 18,486 | | | $ | 20,927 | |
| | | | | |
Ratios (as a percentage of average daily net assets): | | | | | | | | | | | | | | | | | | | | |
| | | | | |
Expenses excluding interest and fees | | | 1.42 | % | | | 1.45 | % | | | 1.45 | % | | | 1.46 | % | | | 1.45 | % |
| | | | | |
Interest and fee expense(3) | | | — | | | | 0.04 | % | | | 0.10 | % | | | 0.09 | % | | | 0.07 | % |
| | | | | |
Total expenses | | | 1.42 | % | | | 1.49 | % | | | 1.55 | % | | | 1.55 | % | | | 1.52 | % |
| | | | | |
Net investment income | | | 1.53 | % | | | 2.00 | % | | | 2.35 | % | | | 2.43 | % | | | 2.52 | % |
| | | | | |
Portfolio Turnover | | | 21 | % | | | 37 | % | | | 16 | % | | | 27 | % | | | 8 | % |
| (1) | Computed using average shares outstanding. |
| (2) | Returns are historical and are calculated by determining the percentage change in net asset value with all distributions reinvested and do not reflect the effect of sales charges. |
| (3) | Interest and fee expense relates to the liability for floating rate notes issued in conjunction with residual interest bond transactions (see Note 1H). |
| | | | |
| | 62 | | See Notes to Financial Statements. |
Eaton Vance
Municipal Income Funds
August 31, 2020
Financial Highlights — continued
| | | | | | | | | | | | | | | | | | | | |
| | | North Carolina Fund — Class I | |
| |
| | | Year Ended August 31, | |
| | | 2020 | | | 2019 | | | 2018 | | | 2017 | | | 2016 | |
| | | | | |
Net asset value — Beginning of year | | $ | 9.210 | | | $ | 8.840 | | | $ | 9.130 | | | $ | 9.430 | | | $ | 9.140 | |
| | | | | |
| Income (Loss) From Operations | | | | | | | | | | | | | | | | | | | | |
| | | | | |
Net investment income(1) | | $ | 0.226 | | | $ | 0.257 | | | $ | 0.294 | | | $ | 0.307 | | | $ | 0.321 | |
| | | | | |
Net realized and unrealized gain (loss) | | | 0.012 | | | | 0.373 | | | | (0.290 | ) | | | (0.300 | ) | | | 0.292 | |
| | | | | |
Total income from operations | | $ | 0.238 | | | $ | 0.630 | | | $ | 0.004 | | | $ | 0.007 | | | $ | 0.613 | |
| | | | | |
| Less Distributions | | | | | | | | | | | | | | | | | | | | |
| | | | | |
From net investment income | | $ | (0.238 | ) | | $ | (0.260 | ) | | $ | (0.294 | ) | | $ | (0.307 | ) | | $ | (0.323 | ) |
| | | | | |
Total distributions | | $ | (0.238 | ) | | $ | (0.260 | ) | | $ | (0.294 | ) | | $ | (0.307 | ) | | $ | (0.323 | ) |
| | | | | |
Net asset value — End of year | | $ | 9.210 | | | $ | 9.210 | | | $ | 8.840 | | | $ | 9.130 | | | $ | 9.430 | |
| | | | | |
Total Return(2) | | | 2.64 | % | | | 7.27 | % | | | 0.06 | % | | | 0.15 | % | | | 6.82 | % |
| | | | | |
| Ratios/Supplemental Data | | | | | | | | | | | | | | | | | | | | |
| | | | | |
Net assets, end of year (000’s omitted) | | $ | 64,747 | | | $ | 54,578 | | | $ | 37,475 | | | $ | 38,642 | | | $ | 32,976 | |
| | | | | |
Ratios (as a percentage of average daily net assets): | | | | | | | | | | | | | | | | | | | | |
| | | | | |
Expenses excluding interest and fees | | | 0.47 | % | | | 0.49 | % | | | 0.50 | % | | | 0.51 | % | | | 0.50 | % |
| | | | | |
Interest and fee expense(3) | | | — | | | | 0.04 | % | | | 0.10 | % | | | 0.09 | % | | | 0.07 | % |
| | | | | |
Total expenses | | | 0.47 | % | | | 0.53 | % | | | 0.60 | % | | | 0.60 | % | | | 0.57 | % |
| | | | | |
Net investment income | | | 2.47 | % | | | 2.88 | % | | | 3.30 | % | | | 3.38 | % | | | 3.45 | % |
| | | | | |
Portfolio Turnover | | | 21 | % | | | 37 | % | | | 16 | % | | | 27 | % | | | 8 | % |
| (1) | Computed using average shares outstanding. |
| (2) | Returns are historical and are calculated by determining the percentage change in net asset value with all distributions reinvested. |
| (3) | Interest and fee expense relates to the liability for floating rate notes issued in conjunction with residual interest bond transactions (see Note 1H). |
| | | | |
| | 63 | | See Notes to Financial Statements. |
Eaton Vance
Municipal Income Funds
August 31, 2020
Financial Highlights — continued
| | | | | | | | | | | | | | | | | | | | |
| | | Oregon Fund — Class A | |
| |
| | | Year Ended August 31, | |
| | | 2020 | | | 2019 | | | 2018 | | | 2017 | | | 2016 | |
| | | | | |
Net asset value — Beginning of year | | $ | 8.830 | | | $ | 8.440 | | | $ | 8.710 | | | $ | 8.990 | | | $ | 8.630 | |
| | | | | |
| Income (Loss) From Operations | | | | | | | | | | | | | | | | | | | | |
| | | | | |
Net investment income(1) | | $ | 0.216 | | | $ | 0.255 | | | $ | 0.304 | | | $ | 0.310 | | | $ | 0.320 | |
| | | | | |
Net realized and unrealized gain (loss) | | | 0.093 | | | | 0.390 | | | | (0.271 | ) | | | (0.282 | ) | | | 0.357 | |
| | | | | |
Total income from operations | | $ | 0.309 | | | $ | 0.645 | | | $ | 0.033 | | | $ | 0.028 | | | $ | 0.677 | |
| | | | | |
| Less Distributions | | | | | | | | | | | | | | | | | | | | |
| | | | | |
From net investment income | | $ | (0.229 | ) | | $ | (0.255 | ) | | $ | (0.303 | ) | | $ | (0.308 | ) | | $ | (0.317 | ) |
| | | | | |
Total distributions | | $ | (0.229 | ) | | $ | (0.255 | ) | | $ | (0.303 | ) | | $ | (0.308 | ) | | $ | (0.317 | ) |
| | | | | |
Net asset value — End of year | | $ | 8.910 | | | $ | 8.830 | | | $ | 8.440 | | | $ | 8.710 | | | $ | 8.990 | |
| | | | | |
Total Return(2) | | | 3.57 | % | | | 7.80 | % | | | 0.42 | % | | | 0.38 | % | | | 7.98 | % |
| | | | | |
| Ratios/Supplemental Data | | | | | | | | | | | | | | | | | | | | |
| | | | | |
Net assets, end of year (000’s omitted) | | $ | 83,651 | | | $ | 82,490 | | | $ | 73,750 | | | $ | 78,931 | | | $ | 89,845 | |
| | | | | |
Ratios (as a percentage of average daily net assets): | | | | | | | | | | | | | | | | | | | | |
| | | | | |
Expenses excluding interest and fees | | | 0.67 | % | | | 0.70 | % | | | 0.71 | % | | | 0.70 | % | | | 0.70 | % |
| | | | | |
Interest and fee expense(3) | | | — | | | | 0.07 | % | | | 0.11 | % | | | 0.08 | % | | | 0.05 | % |
| | | | | |
Total expenses | | | 0.67 | % | | | 0.77 | % | | | 0.82 | % | | | 0.78 | % | | | 0.75 | % |
| | | | | |
Net investment income | | | 2.46 | % | | | 2.99 | % | | | 3.58 | % | | | 3.56 | % | | | 3.63 | % |
| | | | | |
Portfolio Turnover | | | 36 | % | | | 36 | % | | | 23 | % | | | 7 | % | | | 8 | % |
| (1) | Computed using average shares outstanding. |
| (2) | Returns are historical and are calculated by determining the percentage change in net asset value with all distributions reinvested and do not reflect the effect of sales charges. |
| (3) | Interest and fee expense relates to the liability for floating rate notes issued in conjunction with residual interest bond transactions (see Note 1H). |
| | | | |
| | 64 | | See Notes to Financial Statements. |
Eaton Vance
Municipal Income Funds
August 31, 2020
Financial Highlights — continued
| | | | | | | | | | | | | | | | | | | | |
| | | Oregon Fund — Class C | |
| |
| | | Year Ended August 31, | |
| | | 2020 | | | 2019 | | | 2018 | | | 2017 | | | 2016 | |
| | | | | |
Net asset value — Beginning of year | | $ | 9.660 | | | $ | 9.250 | | | $ | 9.540 | | | $ | 9.840 | | | $ | 9.450 | |
| | | | | |
| Income (Loss) From Operations | | | | | | | | | | | | | | | | | | | | |
| | | | | |
Net investment income(1) | | $ | 0.164 | | | $ | 0.210 | | | $ | 0.264 | | | $ | 0.268 | | | $ | 0.278 | |
| | | | | |
Net realized and unrealized gain (loss) | | | 0.104 | | | | 0.409 | | | | (0.292 | ) | | | (0.302 | ) | | | 0.387 | |
| | | | | |
Total income (loss) from operations | | $ | 0.268 | | | $ | 0.619 | | | $ | (0.028 | ) | | $ | (0.034 | ) | | $ | 0.665 | |
| | | | | |
| Less Distributions | | | | | | | | | | | | | | | | | | | | |
| | | | | |
From net investment income | | $ | (0.178 | ) | | $ | (0.209 | ) | | $ | (0.262 | ) | | $ | (0.266 | ) | | $ | (0.275 | ) |
| | | | | |
Total distributions | | $ | (0.178 | ) | | $ | (0.209 | ) | | $ | (0.262 | ) | | $ | (0.266 | ) | | $ | (0.275 | ) |
| | | | | |
Net asset value — End of year | | $ | 9.750 | | | $ | 9.660 | | | $ | 9.250 | | | $ | 9.540 | | | $ | 9.840 | |
| | | | | |
Total Return(2) | | | 2.82 | % | | | 6.80 | % | | | (0.27 | )% | | | (0.30 | )% | | | 7.13 | % |
| | | | | |
| Ratios/Supplemental Data | | | | | | | | | | | | | | | | | | | | |
| | | | | |
Net assets, end of year (000’s omitted) | | $ | 11,102 | | | $ | 10,332 | | | $ | 10,338 | | | $ | 12,342 | | | $ | 14,817 | |
| | | | | |
Ratios (as a percentage of average daily net assets): | | | | | | | | | | | | | | | | | | | | |
| | | | | |
Expenses excluding interest and fees | | | 1.42 | % | | | 1.45 | % | | | 1.46 | % | | | 1.45 | % | | | 1.45 | % |
| | | | | |
Interest and fee expense(3) | | | — | | | | 0.07 | % | | | 0.11 | % | | | 0.08 | % | | | 0.05 | % |
| | | | | |
Total expenses | | | 1.42 | % | | | 1.52 | % | | | 1.57 | % | | | 1.53 | % | | | 1.50 | % |
| | | | | |
Net investment income | | | 1.71 | % | | | 2.26 | % | | | 2.84 | % | | | 2.81 | % | | | 2.88 | % |
| | | | | |
Portfolio Turnover | | | 36 | % | | | 36 | % | | | 23 | % | | | 7 | % | | | 8 | % |
| (1) | Computed using average shares outstanding. |
| (2) | Returns are historical and are calculated by determining the percentage change in net asset value with all distributions reinvested and do not reflect the effect of sales charges. |
| (3) | Interest and fee expense relates to the liability for floating rate notes issued in conjunction with residual interest bond transactions (see Note 1H). |
| | | | |
| | 65 | | See Notes to Financial Statements. |
Eaton Vance
Municipal Income Funds
August 31, 2020
Financial Highlights — continued
| | | | | | | | | | | | | | | | | | | | |
| | | Oregon Fund — Class I | |
| |
| | | Year Ended August 31, | |
| | | 2020 | | | 2019 | | | 2018 | | | 2017 | | | 2016 | |
| | | | | |
Net asset value — Beginning of year | | $ | 8.820 | | | $ | 8.440 | | | $ | 8.700 | | | $ | 8.980 | | | $ | 8.620 | |
| | | | | |
| Income (Loss) From Operations | | | | | | | | | | | | | | | | | | | | |
| | | | | |
Net investment income(1) | | $ | 0.232 | | | $ | 0.267 | | | $ | 0.321 | | | $ | 0.326 | | | $ | 0.336 | |
| | | | | |
Net realized and unrealized gain (loss) | | | 0.093 | | | | 0.385 | | | | (0.261 | ) | | | (0.281 | ) | | | 0.358 | |
| | | | | |
Total income from operations | | $ | 0.325 | | | $ | 0.652 | | | $ | 0.060 | | | $ | 0.045 | | | $ | 0.694 | |
| | | | | |
| Less Distributions | | | | | | | | | | | | | | | | | | | | |
| | | | | |
From net investment income | | $ | (0.245 | ) | | $ | (0.272 | ) | | $ | (0.320 | ) | | $ | (0.325 | ) | | $ | (0.334 | ) |
| | | | | |
Total distributions | | $ | (0.245 | ) | | $ | (0.272 | ) | | $ | (0.320 | ) | | $ | (0.325 | ) | | $ | (0.334 | ) |
| | | | | |
Net asset value — End of year | | $ | 8.900 | | | $ | 8.820 | | | $ | 8.440 | | | $ | 8.700 | | | $ | 8.980 | |
| | | | | |
Total Return(2) | | | 3.76 | % | | | 7.89 | % | | | 0.74 | % | | | 0.58 | % | | | 8.20 | % |
| | | | | |
| Ratios/Supplemental Data | | | | | | | | | | | | | | | | | | | | |
| | | | | |
Net assets, end of year (000’s omitted) | | $ | 57,461 | | | $ | 41,343 | | | $ | 23,088 | | | $ | 26,267 | | | $ | 16,426 | |
| | | | | |
Ratios (as a percentage of average daily net assets): | | | | | | | | | | | | | | | | | | | | |
| | | | | |
Expenses excluding interest and fees | | | 0.47 | % | | | 0.49 | % | | | 0.51 | % | | | 0.50 | % | | | 0.50 | % |
| | | | | |
Interest and fee expense(3) | | | — | | | | 0.07 | % | | | 0.11 | % | | | 0.08 | % | | | 0.05 | % |
| | | | | |
Total expenses | | | 0.47 | % | | | 0.56 | % | | | 0.62 | % | | | 0.58 | % | | | 0.55 | % |
| | | | | |
Net investment income | | | 2.65 | % | | | 3.13 | % | | | 3.78 | % | | | 3.75 | % | | | 3.81 | % |
| | | | | |
Portfolio Turnover | | | 36 | % | | | 36 | % | | | 23 | % | | | 7 | % | | | 8 | % |
| (1) | Computed using average shares outstanding. |
| (2) | Returns are historical and are calculated by determining the percentage change in net asset value with all distributions reinvested. |
| (3) | Interest and fee expense relates to the liability for floating rate notes issued in conjunction with residual interest bond transactions (see Note 1H). |
| | | | |
| | 66 | | See Notes to Financial Statements. |
Eaton Vance
Municipal Income Funds
August 31, 2020
Financial Highlights — continued
| | | | | | | | | | | | | | | | | | | | |
| | | South Carolina Fund — Class A | |
| |
| | | Year Ended August 31, | |
| | | 2020 | | | 2019 | | | 2018 | | | 2017 | | | 2016 | |
| | | | | |
Net asset value — Beginning of year | | $ | 9.390 | | | $ | 9.080 | | | $ | 9.330 | | | $ | 9.610 | | | $ | 9.190 | |
| | | | | |
| Income (Loss) From Operations | | | | | | | | | | | | | | | | | | | | |
| | | | | |
Net investment income(1) | | $ | 0.216 | | | $ | 0.254 | | | $ | 0.283 | | | $ | 0.286 | | | $ | 0.319 | |
| | | | | |
Net realized and unrealized gain (loss) | | | 0.058 | | | | 0.318 | | | | (0.251 | ) | | | (0.282 | ) | | | 0.418 | |
| | | | | |
Total income from operations | | $ | 0.274 | | | $ | 0.572 | | | $ | 0.032 | | | $ | 0.004 | | | $ | 0.737 | |
| | | | | |
| Less Distributions | | | | | | | | | | | | | | | | | | | | |
| | | | | |
From net investment income | | $ | (0.224 | ) | | $ | (0.262 | ) | | $ | (0.282 | ) | | $ | (0.284 | ) | | $ | (0.317 | ) |
| | | | | |
Total distributions | | $ | (0.224 | ) | | $ | (0.262 | ) | | $ | (0.282 | ) | | $ | (0.284 | ) | | $ | (0.317 | ) |
| | | | | |
Net asset value — End of year | | $ | 9.440 | | | $ | 9.390 | | | $ | 9.080 | | | $ | 9.330 | | | $ | 9.610 | |
| | | | | |
Total Return(2) | | | 2.97 | % | | | 6.41 | % | | | 0.38 | % | | | 0.11 | % | | | 8.14 | % |
| | | | | |
| Ratios/Supplemental Data | | | | | | | | | | | | | | | | | | | | |
| | | | | |
Net assets, end of year (000’s omitted) | | $ | 78,914 | | | $ | 72,517 | | | $ | 66,077 | | | $ | 67,869 | | | $ | 72,052 | |
| | | | | |
Ratios (as a percentage of average daily net assets): | | | | | | | | | | | | | | | | | | | | |
| | | | | |
Expenses excluding interest and fees | | | 0.65 | % | | | 0.69 | % | | | 0.68 | % | | | 0.69 | % | | | 0.69 | % |
| | | | | |
Interest and fee expense(3) | | | 0.04 | % | | | 0.06 | % | | | 0.13 | % | | | 0.09 | % | | | 0.04 | % |
| | | | | |
Total expenses | | | 0.69 | % | | | 0.75 | % | | | 0.81 | % | | | 0.78 | % | | | 0.73 | % |
| | | | | |
Net investment income | | | 2.31 | % | | | 2.78 | % | | | 3.11 | % | | | 3.08 | % | | | 3.38 | % |
| | | | | |
Portfolio Turnover | | | 28 | % | | | 19 | % | | | 4 | % | | | 10 | % | | | 6 | % |
| (1) | Computed using average shares outstanding. |
| (2) | Returns are historical and are calculated by determining the percentage change in net asset value with all distributions reinvested and do not reflect the effect of sales charges. |
| (3) | Interest and fee expense relates to the liability for floating rate notes issued in conjunction with residual interest bond transactions (see Note 1H). |
| | | | |
| | 67 | | See Notes to Financial Statements. |
Eaton Vance
Municipal Income Funds
August 31, 2020
Financial Highlights — continued
| | | | | | | | | | | | | | | | | | | | |
| | | South Carolina Fund — Class C | |
| |
| | | Year Ended August 31, | |
| | | 2020 | | | 2019 | | | 2018 | | | 2017 | | | 2016 | |
| | | | | |
Net asset value — Beginning of year | | $ | 9.960 | | | $ | 9.640 | | | $ | 9.900 | | | $ | 10.190 | | | $ | 9.750 | |
| | | | | |
| Income (Loss) From Operations | | | | | | | | | | | | | | | | | | | | |
| | | | | |
Net investment income(1) | | $ | 0.155 | | | $ | 0.198 | | | $ | 0.228 | | | $ | 0.230 | | | $ | 0.262 | |
| | | | | |
Net realized and unrealized gain (loss) | | | 0.058 | | | | 0.327 | | | | (0.262 | ) | | | (0.292 | ) | | | 0.439 | |
| | | | | |
Total income (loss) from operations | | $ | 0.213 | | | $ | 0.525 | | | $ | (0.034 | ) | | $ | (0.062 | ) | | $ | 0.701 | |
| | | | | |
| Less Distributions | | | | | | | | | | | | | | | | | | | | |
| | | | | |
From net investment income | | $ | (0.163 | ) | | $ | (0.205 | ) | | $ | (0.226 | ) | | $ | (0.228 | ) | | $ | (0.261 | ) |
| | | | | |
Total distributions | | $ | (0.163 | ) | | $ | (0.205 | ) | | $ | (0.226 | ) | | $ | (0.228 | ) | | $ | (0.261 | ) |
| | | | | |
Net asset value — End of year | | $ | 10.010 | | | $ | 9.960 | | | $ | 9.640 | | | $ | 9.900 | | | $ | 10.190 | |
| | | | | |
Total Return(2) | | | 2.17 | % | | | 5.53 | % | | | (0.32 | )% | | | (0.57 | )% | | | 7.27 | % |
| | | | | |
| Ratios/Supplemental Data | | | | | | | | | | | | | | | | | | | | |
| | | | | |
Net assets, end of year (000’s omitted) | | $ | 14,085 | | | $ | 17,750 | | | $ | 24,055 | | | $ | 28,743 | | | $ | 28,739 | |
| | | | | |
Ratios (as a percentage of average daily net assets): | | | | | | | | | | | | | | | | | | | | |
| | | | | |
Expenses excluding interest and fees | | | 1.40 | % | | | 1.44 | % | | | 1.44 | % | | | 1.44 | % | | | 1.44 | % |
| | | | | |
Interest and fee expense(3) | | | 0.04 | % | | | 0.06 | % | | | 0.13 | % | | | 0.09 | % | | | 0.04 | % |
| | | | | |
Total expenses | | | 1.44 | % | | | 1.50 | % | | | 1.57 | % | | | 1.53 | % | | | 1.48 | % |
| | | | | |
Net investment income | | | 1.57 | % | | | 2.05 | % | | | 2.36 | % | | | 2.33 | % | | | 2.62 | % |
| | | | | |
Portfolio Turnover | | | 28 | % | | | 19 | % | | | 4 | % | | | 10 | % | | | 6 | % |
| (1) | Computed using average shares outstanding. |
| (2) | Returns are historical and are calculated by determining the percentage change in net asset value with all distributions reinvested and do not reflect the effect of sales charges. |
| (3) | Interest and fee expense relates to the liability for floating rate notes issued in conjunction with residual interest bond transactions (see Note 1H). |
| | | | |
| | 68 | | See Notes to Financial Statements. |
Eaton Vance
Municipal Income Funds
August 31, 2020
Financial Highlights — continued
| | | | | | | | | | | | | | | | | | | | |
| | | South Carolina Fund — Class I | |
| |
| | | Year Ended August 31, | |
| | | 2020 | | | 2019 | | | 2018 | | | 2017 | | | 2016 | |
| | | | | |
Net asset value — Beginning of year | | $ | 9.400 | | | $ | 9.090 | | | $ | 9.340 | | | $ | 9.620 | | | $ | 9.200 | |
| | | | | |
| Income (Loss) From Operations | | | | | | | | | | | | | | | | | | | | |
| | | | | |
Net investment income(1) | | $ | 0.234 | | | $ | 0.272 | | | $ | 0.302 | | | $ | 0.305 | | | $ | 0.332 | |
| | | | | |
Net realized and unrealized gain (loss) | | | 0.058 | | | | 0.318 | | | | (0.252 | ) | | | (0.282 | ) | | | 0.424 | |
| | | | | |
Total income from operations | | $ | 0.292 | | | $ | 0.590 | | | $ | 0.050 | | | $ | 0.023 | | | $ | 0.756 | |
| | | | | |
| Less Distributions | | | | | | | | | | | | | | | | | | | | |
| | | | | |
From net investment income | | $ | (0.242 | ) | | $ | (0.280 | ) | | $ | (0.300 | ) | | $ | (0.303 | ) | | $ | (0.336 | ) |
| | | | | |
Total distributions | | $ | (0.242 | ) | | $ | (0.280 | ) | | $ | (0.300 | ) | | $ | (0.303 | ) | | $ | (0.336 | ) |
| | | | | |
Net asset value — End of year | | $ | 9.450 | | | $ | 9.400 | | | $ | 9.090 | | | $ | 9.340 | | | $ | 9.620 | |
| | | | | |
Total Return(2) | | | 3.17 | % | | | 6.62 | % | | | 0.58 | % | | | 0.31 | % | | | 8.35 | % |
| | | | | |
| Ratios/Supplemental Data | | | | | | | | | | | | | | | | | | | | |
| | | | | |
Net assets, end of year (000’s omitted) | | $ | 56,246 | | | $ | 41,726 | | | $ | 32,924 | | | $ | 35,161 | | | $ | 37,265 | |
| | | | | |
Ratios (as a percentage of average daily net assets): | | | | | | | | | | | | | | | | | | | | |
| | | | | |
Expenses excluding interest and fees | | | 0.45 | % | | | 0.49 | % | | | 0.49 | % | | | 0.49 | % | | | 0.49 | % |
| | | | | |
Interest and fee expense(3) | | | 0.04 | % | | | 0.06 | % | | | 0.13 | % | | | 0.09 | % | | | 0.04 | % |
| | | | | |
Total expenses | | | 0.49 | % | | | 0.55 | % | | | 0.62 | % | | | 0.58 | % | | | 0.53 | % |
| | | | | |
Net investment income | | | 2.50 | % | | | 2.97 | % | | | 3.31 | % | | | 3.28 | % | | | 3.51 | % |
| | | | | |
Portfolio Turnover | | | 28 | % | | | 19 | % | | | 4 | % | | | 10 | % | | | 6 | % |
| (1) | Computed using average shares outstanding. |
| (2) | Returns are historical and are calculated by determining the percentage change in net asset value with all distributions reinvested. |
| (3) | Interest and fee expense relates to the liability for floating rate notes issued in conjunction with residual interest bond transactions (see Note 1H). |
| | | | |
| | 69 | | See Notes to Financial Statements. |
Eaton Vance
Municipal Income Funds
August 31, 2020
Financial Highlights — continued
| | | | | | | | | | | | | | | | | | | | |
| | | Virginia Fund — Class A | |
| |
| | | Year Ended August 31, | |
| | | 2020 | | | 2019 | | | 2018 | | | 2017 | | | 2016 | |
| | | | | |
Net asset value — Beginning of year | | $ | 8.030 | | | $ | 7.710 | | | $ | 8.010 | | | $ | 8.240 | | | $ | 7.970 | |
| | | | | |
| Income (Loss) From Operations | | | | | | | | | | | | | | | | | | | | |
| | | | | |
Net investment income(1) | | $ | 0.201 | | | $ | 0.232 | | | $ | 0.260 | | | $ | 0.279 | | | $ | 0.301 | |
| | | | | |
Net realized and unrealized gain (loss) | | | 0.042 | | | | 0.317 | | | | (0.280 | ) | | | (0.229 | ) | | | 0.268 | |
| | | | | |
Total income (loss) from operations | | $ | 0.243 | | | $ | 0.549 | | | $ | (0.020 | ) | | $ | 0.050 | | | $ | 0.569 | |
| | | | | |
| Less Distributions | | | | | | | | | | | | | | | | | | | | |
| | | | | |
From net investment income | | $ | (0.213 | ) | | $ | (0.229 | ) | | $ | (0.280 | ) | | $ | (0.280 | ) | | $ | (0.299 | ) |
| | | | | |
Total distributions | | $ | (0.213 | ) | | $ | (0.229 | ) | | $ | (0.280 | ) | | $ | (0.280 | ) | | $ | (0.299 | ) |
| | | | | |
Net asset value — End of year | | $ | 8.060 | | | $ | 8.030 | | | $ | 7.710 | | | $ | 8.010 | | | $ | 8.240 | |
| | | | | |
Total Return(2) | | | 3.09 | % | | | 7.26 | % | | | (0.21 | )% | | | 0.66 | % | | | 7.26 | % |
| | | | | |
| Ratios/Supplemental Data | | | | | | | | | | | | | | | | | | | | |
| | | | | |
Net assets, end of year (000’s omitted) | | $ | 48,031 | | | $ | 49,860 | | | $ | 48,335 | | | $ | 55,714 | | | $ | 59,460 | |
| | | | | |
Ratios (as a percentage of average daily net assets): | | | | | | | | | | | | | | | | | | | | |
| | | | | |
Expenses excluding interest and fees | | | 0.68 | % | | | 0.71 | % | | | 0.72 | % | | | 0.70 | % | | | 0.71 | % |
| | | | | |
Interest and fee expense(3) | | | 0.08 | % | | | 0.11 | % | | | 0.09 | % | | | 0.06 | % | | | 0.05 | % |
| | | | | |
Total expenses | | | 0.76 | % | | | 0.82 | % | | | 0.81 | % | | | 0.76 | % | | | 0.76 | % |
| | | | | |
Net investment income | | | 2.53 | % | | | 2.98 | % | | | 3.34 | % | | | 3.49 | % | | | 3.71 | % |
| | | | | |
Portfolio Turnover | | | 17 | % | | | 22 | % | | | 8 | % | | | 7 | % | | | 13 | % |
| (1) | Computed using average shares outstanding. |
| (2) | Returns are historical and are calculated by determining the percentage change in net asset value with all distributions reinvested and do not reflect the effect of sales charges. |
| (3) | Interest and fee expense relates to the liability for floating rate notes issued in conjunction with residual interest bond transactions (see Note 1H). |
| | | | |
| | 70 | | See Notes to Financial Statements. |
Eaton Vance
Municipal Income Funds
August 31, 2020
Financial Highlights — continued
| | | | | | | | | | | | | | | | | | | | |
| | | Virginia Fund — Class C | |
| |
| | | Year Ended August 31, | |
| | | 2020 | | | 2019 | | | 2018 | | | 2017 | | | 2016 | |
| | | | | |
Net asset value — Beginning of year | | $ | 8.900 | | | $ | 8.540 | | | $ | 8.870 | | | $ | 9.130 | | | $ | 8.830 | |
| | | | | |
| Income (Loss) From Operations | | | | | | | | | | | | | | | | | | | | |
| | | | | |
Net investment income(1) | | $ | 0.156 | | | $ | 0.193 | | | $ | 0.224 | | | $ | 0.243 | | | $ | 0.267 | |
| | | | | |
Net realized and unrealized gain (loss) | | | 0.034 | | | | 0.356 | | | | (0.310 | ) | | | (0.259 | ) | | | 0.297 | |
| | | | | |
Total income (loss) from operations | | $ | 0.190 | | | $ | 0.549 | | | $ | (0.086 | ) | | $ | (0.016 | ) | | $ | 0.564 | |
| | | | | |
| Less Distributions | | | | | | | | | | | | | | | | | | | | |
| | | | | |
From net investment income | | $ | (0.170 | ) | | $ | (0.189 | ) | | $ | (0.244 | ) | | $ | (0.244 | ) | | $ | (0.264 | ) |
| | | | | |
Total distributions | | $ | (0.170 | ) | | $ | (0.189 | ) | | $ | (0.244 | ) | | $ | (0.244 | ) | | $ | (0.264 | ) |
| | | | | |
Net asset value — End of year | | $ | 8.920 | | | $ | 8.900 | | | $ | 8.540 | | | $ | 8.870 | | | $ | 9.130 | |
| | | | | |
Total Return(2) | | | 2.17 | % | | | 6.53 | % | | | (0.95 | )% | | | (0.13 | )% | | | 6.47 | % |
| | | | | |
| Ratios/Supplemental Data | | | | | | | | | | | | | | | | | | | | |
| | | | | |
Net assets, end of year (000’s omitted) | | $ | 4,289 | | | $ | 4,114 | | | $ | 4,819 | | | $ | 6,220 | | | $ | 6,044 | |
| | | | | |
Ratios (as a percentage of average daily net assets): | | | | | | | | | | | | | | | | | | | | |
| | | | | |
Expenses excluding interest and fees | | | 1.43 | % | | | 1.46 | % | | | 1.47 | % | | | 1.45 | % | | | 1.46 | % |
| | | | | |
Interest and fee expense(3) | | | 0.08 | % | | | 0.11 | % | | | 0.09 | % | | | 0.06 | % | | | 0.05 | % |
| | | | | |
Total expenses | | | 1.51 | % | | | 1.57 | % | | | 1.56 | % | | | 1.51 | % | | | 1.51 | % |
| | | | | |
Net investment income | | | 1.77 | % | | | 2.24 | % | | | 2.60 | % | | | 2.75 | % | | | 2.97 | % |
| | | | | |
Portfolio Turnover | | | 17 | % | | | 22 | % | | | 8 | % | | | 7 | % | | | 13 | % |
| (1) | Computed using average shares outstanding. |
| (2) | Returns are historical and are calculated by determining the percentage change in net asset value with all distributions reinvested and do not reflect the effect of sales charges. |
| (3) | Interest and fee expense relates to the liability for floating rate notes issued in conjunction with residual interest bond transactions (see Note 1H). |
| | | | |
| | 71 | | See Notes to Financial Statements. |
Eaton Vance
Municipal Income Funds
August 31, 2020
Financial Highlights — continued
| | | | | | | | | | | | | | | | | | | | |
| | | Virginia Fund — Class I | |
| |
| | | Year Ended August 31, | |
| | | 2020 | | | 2019 | | | 2018 | | | 2017 | | | 2016 | |
| | | | | |
Net asset value — Beginning of year | | $ | 8.050 | | | $ | 7.730 | | | $ | 8.030 | | | $ | 8.260 | | | $ | 7.990 | |
| | | | | |
| Income (Loss) From Operations | | | | | | | | | | | | | | | | | | | | |
| | | | | |
Net investment income(1) | | $ | 0.217 | | | $ | 0.247 | | | $ | 0.276 | | | $ | 0.296 | | | $ | 0.318 | |
| | | | | |
Net realized and unrealized gain (loss) | | | 0.032 | | | | 0.318 | | | | (0.277 | ) | | | (0.230 | ) | | | 0.268 | |
| | | | | |
Total income (loss) from operations | | $ | 0.249 | | | $ | 0.565 | | | $ | (0.001 | ) | | $ | 0.066 | | | $ | 0.586 | |
| | | | | |
| Less Distributions | | | | | | | | | | | | | | | | | | | | |
| | | | | |
From net investment income | | $ | (0.229 | ) | | $ | (0.245 | ) | | $ | (0.299 | ) | | $ | (0.296 | ) | | $ | (0.316 | ) |
| | | | | |
Total distributions | | $ | (0.229 | ) | | $ | (0.245 | ) | | $ | (0.299 | ) | | $ | (0.296 | ) | | $ | (0.316 | ) |
| | | | | |
Net asset value — End of year | | $ | 8.070 | | | $ | 8.050 | | | $ | 7.730 | | | $ | 8.030 | | | $ | 8.260 | |
| | | | | |
Total Return(2) | | | 3.17 | % | | | 7.46 | % | | | 0.03 | % | | | 0.87 | % | | | 7.47 | % |
| | | | | |
| Ratios/Supplemental Data | | | | | | | | | | | | | | | | | | | | |
| | | | | |
Net assets, end of year (000’s omitted) | | $ | 19,401 | | | $ | 16,767 | | | $ | 12,777 | | | $ | 18,883 | | | $ | 15,928 | |
| | | | | |
Ratios (as a percentage of average daily net assets): | | | | | | | | | | | | | | | | | | | | |
| | | | | |
Expenses excluding interest and fees | | | 0.48 | % | | | 0.50 | % | | | 0.52 | % | | | 0.50 | % | | | 0.51 | % |
| | | | | |
Interest and fee expense(3) | | | 0.08 | % | | | 0.11 | % | | | 0.09 | % | | | 0.06 | % | | | 0.05 | % |
| | | | | |
Total expenses | | | 0.56 | % | | | 0.61 | % | | | 0.61 | % | | | 0.56 | % | | | 0.56 | % |
| | | | | |
Net investment income | | | 2.72 | % | | | 3.16 | % | | | 3.54 | % | | | 3.69 | % | | | 3.90 | % |
| | | | | |
Portfolio Turnover | | | 17 | % | | | 22 | % | | | 8 | % | | | 7 | % | | | 13 | % |
| (1) | Computed using average shares outstanding. |
| (2) | Returns are historical and are calculated by determining the percentage change in net asset value with all distributions reinvested. |
| (3) | Interest and fee expense relates to the liability for floating rate notes issued in conjunction with residual interest bond transactions (see Note 1H). |
| | | | |
| | 72 | | See Notes to Financial Statements. |
Eaton Vance
Municipal Income Funds
August 31, 2020
Notes to Financial Statements
1 Significant Accounting Policies
Eaton Vance Municipals Trust (the Trust) is a Massachusetts business trust registered under the Investment Company Act of 1940, as amended (the 1940 Act), as an open-end management investment company. The Trust presently consists of eighteen funds, seven of which, each non-diversified, are included in these financial statements. They include Eaton Vance Georgia Municipal Income Fund (Georgia Fund), Eaton Vance Maryland Municipal Income Fund (Maryland Fund), Eaton Vance Missouri Municipal Income Fund (Missouri Fund), Eaton Vance North Carolina Municipal Income Fund (North Carolina Fund), Eaton Vance Oregon Municipal Income Fund (Oregon Fund), Eaton Vance South Carolina Municipal Income Fund (South Carolina Fund) and Eaton Vance Virginia Municipal Income Fund (Virginia Fund), (each individually referred to as the Fund, and collectively, the Funds). The Funds’ investment objective is to provide current income exempt from regular federal income tax and from particular state or local income or other taxes. The Funds offer three classes of shares. Class A shares are generally sold subject to a sales charge imposed at time of purchase. Class C shares are sold at net asset value and are generally subject to a contingent deferred sales charge (see Note 5). Effective January 25, 2019, Class C shares generally automatically convert to Class A shares ten years after their purchase and, effective November 5, 2020, will automatically convert to Class A shares eight years after their purchase as described in the Funds’ prospectus. Class I shares are sold at net asset value and are not subject to a sales charge. Each class represents a pro-rata interest in the Fund, but votes separately on class-specific matters and (as noted below) is subject to different expenses. Realized and unrealized gains and losses are allocated daily to each class of shares based on the relative net assets of each class to the total net assets of the Fund. Net investment income, other than class-specific expenses, is allocated daily to each class of shares based upon the ratio of the value of each class’s paid shares to the total value of all paid shares. Each class of shares differs in its distribution plan and certain other class-specific expenses.
The following is a summary of significant accounting policies of the Funds. The policies are in conformity with accounting principles generally accepted in the United States of America (U.S. GAAP). Each Fund is an investment company and follows accounting and reporting guidance in the Financial Accounting Standards Board (FASB) Accounting Standards Codification Topic 946.
A Investment Valuation — The following methodologies are used to determine the market value or fair value of investments.
Debt Obligations. Debt obligations are generally valued on the basis of valuations provided by third party pricing services, as derived from such services’ pricing models. Inputs to the models may include, but are not limited to, reported trades, executable bid and ask prices, broker/dealer quotations, prices or yields of securities with similar characteristics, interest rates, anticipated prepayments, benchmark curves or information pertaining to the issuer, as well as industry and economic events. The pricing services may use a matrix approach, which considers information regarding securities with similar characteristics to determine the valuation for a security. Short-term debt obligations purchased with a remaining maturity of sixty days or less for which a valuation from a third party pricing service is not readily available may be valued at amortized cost, which approximates fair value.
Fair Valuation. Investments for which valuations or market quotations are not readily available or are deemed unreliable are valued at fair value using methods determined in good faith by or at the direction of the Trustees of a Fund in a manner that most fairly reflects the security’s “fair value”, which is the amount that a Fund might reasonably expect to receive for the security upon its current sale in the ordinary course. Each such determination is based on a consideration of relevant factors, which are likely to vary from one pricing context to another. These factors may include, but are not limited to, the type of security, the existence of any contractual restrictions on the security’s disposition, the price and extent of public trading in similar securities of the issuer or of comparable companies or entities, quotations or relevant information obtained from broker/dealers or other market participants, information obtained from the issuer, analysts, and/or the appropriate stock exchange (for exchange-traded securities), an analysis of the company’s or entity’s financial statements, and an evaluation of the forces that influence the issuer and the market(s) in which the security is purchased and sold.
B Investment Transactions and Related Income — Investment transactions for financial statement purposes are accounted for on a trade date basis. Realized gains and losses on investments sold are determined on the basis of identified cost. Interest income is recorded on the basis of interest accrued, adjusted for amortization of premium or accretion of discount.
C Federal Taxes — Each Fund’s policy is to comply with the provisions of the Internal Revenue Code applicable to regulated investment companies and to distribute to shareholders each year substantially all of its taxable, if any, and tax-exempt net investment income, and all or substantially all of its net realized capital gains. Accordingly, no provision for federal income or excise tax is necessary. Each Fund intends to satisfy conditions which will enable it to designate distributions from the interest income generated by its investments in non-taxable municipal securities, which are exempt from regular federal income tax when received by each Fund, as exempt-interest dividends. The portion of such interest, if any, earned on private activity bonds issued after August 7, 1986, may be considered a tax preference item to shareholders.
As of August 31, 2020, the Funds had no uncertain tax positions that would require financial statement recognition, de-recognition, or disclosure. Each Fund files a U.S. federal income tax return annually after its fiscal year-end, which is subject to examination by the Internal Revenue Service for a period of three years from the date of filing.
D Expenses — The majority of expenses of the Trust are directly identifiable to an individual fund. Expenses which are not readily identifiable to a specific fund are allocated taking into consideration, among other things, the nature and type of expense and the relative size of the funds.
E Legal Fees — Legal fees and other related expenses incurred as part of negotiations of the terms and requirement of capital infusions, or that are expected to result in the restructuring of, or a plan of reorganization for, an investment are recorded as realized losses. Ongoing expenditures to protect or enhance an investment are treated as operating expenses.
Eaton Vance
Municipal Income Funds
August 31, 2020
Notes to Financial Statements — continued
F Use of Estimates — The preparation of the financial statements in conformity with U.S. GAAP requires management to make estimates and assumptions that affect the reported amounts of assets and liabilities at the date of the financial statements and the reported amounts of income and expense during the reporting period. Actual results could differ from those estimates.
G Indemnifications — Under the Trust’s organizational documents, its officers and Trustees may be indemnified against certain liabilities and expenses arising out of the performance of their duties to the Funds. Under Massachusetts law, if certain conditions prevail, shareholders of a Massachusetts business trust (such as the Trust) could be deemed to have personal liability for the obligations of the Trust. However, the Trust’s Declaration of Trust contains an express disclaimer of liability on the part of Fund shareholders and the By-laws provide that the Trust shall assume, upon request by the shareholder, the defense on behalf of any Fund shareholders. Moreover, the By-laws also provide for indemnification out of Fund property of any shareholder held personally liable solely by reason of being or having been a shareholder for all loss or expense arising from such liability. Additionally, in the normal course of business, each Fund enters into agreements with service providers that may contain indemnification clauses. Each Fund’s maximum exposure under these arrangements is unknown as this would involve future claims that may be made against each Fund that have not yet occurred.
H Floating Rate Notes Issued in Conjunction with Securities Held — The Funds may invest in residual interest bonds, also referred to as inverse floating rate securities, whereby a Fund may sell a variable or fixed rate bond for cash to a Special-Purpose Vehicle (the SPV), (which is generally organized as a trust), while at the same time, buying a residual interest in the assets and cash flows of the SPV. The bond is deposited into the SPV with the same CUSIP number as the bond sold to the SPV by the Fund, and which may have been, but is not required to be, the bond purchased from the Fund (the Bond). The SPV also issues floating rate notes (Floating Rate Notes) which are sold to third-parties. The residual interest bond held by a Fund gives the Fund the right (1) to cause the holders of the Floating Rate Notes to generally tender their notes at par, and (2) to have the Bond held by the SPV transferred to the Fund, thereby terminating the SPV. Should the Fund exercise such right, it would generally pay the SPV the par amount due on the Floating Rate Notes and exchange the residual interest bond for the underlying Bond. Pursuant to generally accepted accounting principles for transfers and servicing of financial assets and extinguishment of liabilities, the Funds account for the transaction described above as a secured borrowing by including the Bond in their Portfolio of Investments and the Floating Rate Notes as a liability under the caption “Payable for floating rate notes issued” in their Statement of Assets and Liabilities. The Floating Rate Notes have interest rates that generally reset weekly and their holders have the option to tender their notes to the SPV for redemption at par at each reset date. Accordingly, the fair value of the payable for floating rate notes issued approximates its carrying value. If measured at fair value, the payable for floating rate notes would have been considered as Level 2 in the fair value hierarchy (see Note 9) at August 31, 2020. Interest expense related to a Fund’s liability with respect to Floating Rate Notes is recorded as incurred. The SPV may be terminated by the Fund, as noted above, or by the occurrence of certain termination events as defined in the trust agreement, such as a downgrade in the credit quality of the underlying Bond, bankruptcy of or payment failure by the issuer of the underlying Bond, the inability to remarket Floating Rate Notes that have been tendered due to insufficient buyers in the market, or the failure by the SPV to obtain renewal of the liquidity agreement under which liquidity support is provided for the Floating Rate Notes up to one year. At August 31, 2020, the amounts of the Funds’ Floating Rate Notes and related interest rates and collateral were as follows:
| | | | | | | | |
| | | South Carolina
Fund | | | Virginia
Fund | |
| | |
Floating Rate Notes Outstanding | | $ | 3,112,501 | | | $ | 2,558,614 | |
| | |
Interest Rate or Range of Interest Rates (%) | | | 0.12 | | | | 0.12 | |
| | |
Collateral for Floating Rate Notes Outstanding | | $ | 4,361,622 | | | $ | 4,197,734 | |
For the year ended August 31, 2020, the Funds’ average settled Floating Rate Notes outstanding and the average interest rate including fees were as follows:
| | | | | | | | |
| | | South Carolina
Fund | | | Virginia
Fund | |
| | |
Average Floating Rate Notes Outstanding | | $ | 3,100,000 | | | $ | 3,294,003 | |
| | |
Average Interest Rate | | | 1.61 | % | | | 1.62 | % |
In certain circumstances, the Funds may enter into shortfall and forbearance agreements with brokers by which a Fund agrees to reimburse the broker for the difference between the liquidation value of the Bond held by the SPV and the liquidation value of the Floating Rate Notes, as well as any shortfalls in interest cash flows. The Funds had no shortfalls as of August 31, 2020.
The Funds may also purchase residual interest bonds in a secondary market transaction without first owning the underlying bond. Such transactions are not required to be treated as secured borrowings. Shortfall agreements, if any, related to residual interest bonds purchased in a secondary market transaction are disclosed in the Portfolio of Investments.
Eaton Vance
Municipal Income Funds
August 31, 2020
Notes to Financial Statements — continued
The Funds’ investment policies and restrictions expressly permit investments in residual interest bonds. Such bonds typically offer the potential for yields exceeding the yields available on fixed rate bonds with comparable credit quality and maturity. These securities tend to underperform the market for fixed rate bonds in a rising long-term interest rate environment, but tend to outperform the market for fixed rate bonds when long-term interest rates decline. The value and income of residual interest bonds are generally more volatile than that of a fixed rate bond. The Funds’ investment policies do not allow the Funds to borrow money except as permitted by the 1940 Act. Management believes that the Funds’ restrictions on borrowing money and issuing senior securities (other than as specifically permitted) do not apply to Floating Rate Notes issued by the SPV and included as a liability in the Funds’ Statement of Assets and Liabilities. As secured indebtedness issued by an SPV, Floating Rate Notes are distinct from the borrowings and senior securities to which the Funds’ restrictions apply. Residual interest bonds held by the Funds are securities exempt from registration under Rule 144A of the Securities Act of 1933.
I When-Issued Securities and Delayed Delivery Transactions — The Funds may purchase or sell securities on a delayed delivery or when-issued basis. Payment and delivery may take place after the customary settlement period for that security. At the time the transaction is negotiated, the price of the security that will be delivered is fixed. The Funds maintain cash and/or security positions for these commitments such that sufficient liquid assets will be available to make payments upon settlement. Securities purchased on a delayed delivery or when-issued basis are marked-to-market daily and begin earning interest on settlement date. Losses may arise due to changes in the market value of the underlying securities or if the counterparty does not perform under the contract.
2 Distributions to Shareholders and Income Tax Information
The net investment income of each Fund is determined daily and substantially all of the net investment income so determined is declared as a dividend to shareholders of record at the time of declaration. Distributions are declared separately for each class of shares. Distributions are paid monthly. Distributions of realized capital gains are made at least annually. Shareholders may reinvest income and capital gain distributions in additional shares of the same class of a Fund at the net asset value as of the reinvestment date or, at the election of the shareholder, receive distributions in cash. Distributions to shareholders are determined in accordance with income tax regulations, which may differ from U.S. GAAP. As required by U.S. GAAP, only distributions in excess of tax basis earnings and profits are reported in the financial statements as a return of capital. Permanent differences between book and tax accounting relating to distributions are reclassified to paid-in capital. For tax purposes, distributions from short-term capital gains are considered to be from ordinary income.
The tax character of distributions declared for the years ended August 31, 2020 and August 31, 2019 was as follows:
| | | | | | | | | | | | | | | | |
| | | Year Ended August 31, 2020 | |
| | | Georgia
Fund | | | Maryland
Fund | | | Missouri
Fund | | | North Carolina
Fund | |
| | | | |
Tax-exempt income | | $ | 2,125,348 | | | $ | 1,478,603 | | | $ | 2,064,812 | | | $ | 3,225,832 | |
| | | | |
Ordinary income | | $ | — | | | $ | 17,223 | | | $ | 1,053 | | | $ | 29,771 | |
| | |
| | | | | | Year Ended August 31, 2020 | |
| | | | | | Oregon
Fund | | | South Carolina
Fund | | | Virginia
Fund | |
| | | | |
Tax-exempt income | | | | | | $ | 3,579,275 | | | $ | 3,301,252 | | | $ | 1,873,773 | |
| | | | |
Ordinary income | | | | | | $ | 5,804 | | | $ | 4,476 | | | $ | 4,640 | |
| |
| | | Year Ended August 31, 2019 | |
| | | Georgia
Fund | | | Maryland
Fund | | | Missouri
Fund | | | North Carolina
Fund | |
| | | | |
Tax-exempt income | | $ | 2,106,789 | | | $ | 1,461,049 | | | $ | 2,032,004 | | | $ | 3,191,048 | |
| | | | |
Ordinary income | | $ | — | | | $ | — | | | $ | 16,264 | | | $ | 31,554 | |
Eaton Vance
Municipal Income Funds
August 31, 2020
Notes to Financial Statements — continued
| | | | | | | | | | | | | | | | |
| | | | | | Year Ended August 31, 2019 | |
| | | | | | Oregon
Fund | | | South Carolina
Fund | | | Virginia
Fund | |
| | | | |
Tax-exempt income | | | | | | $ | 3,399,822 | | | $ | 3,372,212 | | | $ | 1,981,764 | |
| | | | |
Ordinary income | | | | | | $ | — | | | $ | 96,113 | | | $ | 5,356 | |
As of August 31, 2020, the components of distributable earnings (accumulated loss) on a tax basis were as follows:
| | | | | | | | | | | | | | | | |
| | | Georgia
Fund | | | Maryland
Fund | | | Missouri
Fund | | | North Carolina
Fund | |
| | | | |
Undistributed tax-exempt income | | $ | 4,154 | | | $ | 830 | | | $ | 18,560 | | | $ | 69,678 | |
| | | | |
Deferred capital losses | | $ | (3,278,331 | ) | | $ | (2,726,463 | ) | | $ | (1,087,612 | ) | | $ | (6,400,367 | ) |
| | | | |
Net unrealized appreciation | | $ | 6,613,366 | | | $ | 3,446,312 | | | $ | 6,244,945 | | | $ | 9,569,661 | |
| | | | |
Distributions payable | | $ | (49,148 | ) | | $ | (26,960 | ) | | $ | (19,061 | ) | | $ | (70,337 | ) |
| | | | |
| | | | | | Oregon
Fund | | | South Carolina
Fund | | | Virginia
Fund | |
| | | | |
Undistributed tax-exempt income | | | | | | $ | 24,778 | | | $ | 35,093 | | | $ | 26,219 | |
| | | | |
Deferred capital losses | | | | | | $ | (11,472,960 | ) | | $ | (5,905,763 | ) | | $ | (5,694,839 | ) |
| | | | |
Net unrealized appreciation | | | | | | $ | 11,278,504 | | | $ | 8,584,755 | | | $ | 5,861,556 | |
| | | | |
Distributions payable | | | | | | $ | (25,470 | ) | | $ | (35,766 | ) | | $ | (26,671 | ) |
At August 31, 2020, the following Funds, for federal income tax purposes, had deferred capital losses which would reduce the respective Fund’s taxable income arising from future net realized gains on investment transactions, if any, to the extent permitted by the Internal Revenue Code, and thus would reduce the amount of distributions to shareholders, which would otherwise be necessary to relieve the Funds of any liability for federal income or excise tax. The deferred capital losses are treated as arising on the first day of a Fund’s next taxable year retaining the same short-term or long-term character as when originally deferred. The amounts of the deferred capital losses are as follows:
| | | | | | | | | | | | | | | | |
| | | Georgia
Fund | | | Maryland
Fund | | | Missouri
Fund | | | North Carolina
Fund | |
| | | | |
Deferred capital losses: | | | | | | | | | | | | | | | | |
| | | | |
Short-term | | $ | 1,910,160 | | | $ | 808,772 | | | $ | 1,087,612 | | | $ | 4,082,484 | |
| | | | |
Long-term | | $ | 1,368,171 | | | $ | 1,917,691 | | | $ | — | | | $ | 2,317,883 | |
| | | | |
| | | | | | Oregon
Fund | | | South Carolina
Fund | | | Virginia
Fund | |
| | | | |
Deferred capital losses: | | | | | | | | | | | | | | | | |
| | | | |
Short-term | | | | | | $ | 5,038,772 | | | $ | 5,905,763 | | | $ | 2,873,682 | |
| | | | |
Long-term | | | | | | $ | 6,434,188 | | | $ | — | | | $ | 2,821,157 | |
Eaton Vance
Municipal Income Funds
August 31, 2020
Notes to Financial Statements — continued
The cost and unrealized appreciation (depreciation) of investments of each Fund at August 31, 2020, as determined on a federal income tax basis, were as follows:
| | | | | | | | | | | | | | | | |
| | | Georgia
Fund | | | Maryland
Fund | | | Missouri
Fund | | | North Carolina
Fund | |
| | | | |
Aggregate cost | | $ | 90,484,364 | | | $ | 62,749,741 | | | $ | 76,319,748 | | | $ | 125,231,807 | |
| | | | |
Gross unrealized appreciation | | $ | 6,725,678 | | | $ | 3,983,090 | | | $ | 6,286,942 | | | $ | 9,723,975 | |
| | | | |
Gross unrealized depreciation | | | (112,312 | ) | | | (536,778 | ) | | | (41,997 | ) | | | (154,314 | ) |
| | | | |
Net unrealized appreciation | | $ | 6,613,366 | | | $ | 3,446,312 | | | $ | 6,244,945 | | | $ | 9,569,661 | |
| | | | |
| | | | | | Oregon
Fund | | | South Carolina
Fund | | | Virginia
Fund | |
| | | | |
Aggregate cost | | | | | | $ | 134,690,774 | | | $ | 131,063,791 | | | $ | 62,152,596 | |
| | | | |
Gross unrealized appreciation | | | | | | $ | 11,397,828 | | | $ | 8,684,193 | | | $ | 5,958,417 | |
| | | | |
Gross unrealized depreciation | | | | | | | (119,324 | ) | | | (99,438 | ) | | | (96,861 | ) |
| | | | |
Net unrealized appreciation | | | | | | $ | 11,278,504 | | | $ | 8,584,755 | | | $ | 5,861,556 | |
3 Investment Adviser Fee and Other Transactions with Affiliates
The investment adviser fee is earned by Boston Management and Research (BMR), a subsidiary of Eaton Vance Management (EVM), as compensation for management and investment advisory services rendered to each Fund. The fee is based upon a percentage of average daily net assets plus a percentage of gross income (i.e., income other than gains from the sale of securities) as presented in the following table and is payable monthly.
| | | | | | | | |
| Daily Net Assets | | Annual Asset
Rate | | | Daily Income
Rate | |
| | |
Up to $20 million | | | 0.10 | % | | | 1.00 | % |
| | |
$20 million but less than $40 million | | | 0.20 | | | | 2.00 | |
| | |
$40 million but less than $500 million | | | 0.30 | | | | 3.00 | |
On average daily net assets of $500 million or more, the rates are reduced.
For the year ended August 31, 2020, investment adviser fees incurred by the Funds and the effective annual rates, as a percentage of average daily net assets, were as follows:
| | | | | | | | | | | | | | | | |
| | | Georgia
Fund | | | Maryland
Fund | | | Missouri
Fund | | | North Carolina
Fund | |
| | | | |
Investment Adviser Fee | | $ | 281,724 | | | $ | 182,027 | | | $ | 219,576 | | | $ | 442,728 | |
| | | | |
Effective Annual Rate | | | 0.30 | % | | | 0.27 | % | | | 0.29 | % | | | 0.33 | % |
| | | | |
| | | | | | Oregon
Fund | | | South Carolina
Fund | | | Virginia
Fund | |
| | | | |
Investment Adviser Fee | | | | | | $ | 462,188 | | | $ | 464,784 | | | $ | 197,784 | |
| | | | |
Effective Annual Rate | | | | | | | 0.34 | % | | | 0.33 | % | | | 0.28 | % |
Eaton Vance
Municipal Income Funds
August 31, 2020
Notes to Financial Statements — continued
EVM serves as the administrator of each Fund, but receives no compensation. EVM provides sub-transfer agency and related services to the Funds pursuant to a Sub-Transfer Agency Support Services Agreement. Eaton Vance Distributors, Inc. (EVD), an affiliate of EVM and the Funds’ principal underwriter, received a portion of the sales charge on sales of Class A shares of the Funds. EVD also received distribution and service fees from Class A and Class C shares (see Note 4) and contingent deferred sales charges (see Note 5). Sub-transfer agent fees earned by EVM, which are included in transfer and dividend disbursing agent fees on the Statements of Operations, and Class A sales charges that the Funds were informed were received by EVD for the year ended August 31, 2020 were as follows:
| | | | | | | | | | | | | | | | |
| | | Georgia
Fund | | | Maryland
Fund | | | Missouri
Fund | | | North Carolina
Fund | |
| | | | |
EVM’s Sub-Transfer Agent Fees | | $ | 3,561 | | | $ | 5,848 | | | $ | 5,666 | | | $ | 13,138 | |
| | | | |
EVD’s Class A Sales Charges | | $ | 10,947 | | | $ | 5,710 | | | $ | 13,288 | | | $ | 8,010 | |
| | | | |
| | | | | | Oregon
Fund | | | South Carolina
Fund | | | Virginia
Fund | |
| | | | |
EVM’s Sub-Transfer Agent Fees | | | | | | $ | 5,535 | | | $ | 2,850 | | | $ | 8,120 | |
| | | | |
EVD’s Class A Sales Charges | | | | | | $ | 25,218 | | | $ | 12,029 | | | $ | 4,709 | |
Trustees and officers of the Funds who are members of EVM’s or BMR’s organizations receive remuneration for their services to the Funds out of the investment adviser fee. Trustees of the Funds who are not affiliated with the investment adviser may elect to defer receipt of all or a percentage of their annual fees in accordance with the terms of the Trustees Deferred Compensation Plan. For the year ended August 31, 2020, no significant amounts have been deferred. Certain officers and Trustees of the Funds are officers of the above organizations.
4 Distribution Plans
Each Fund has in effect a distribution plan for Class A shares (Class A Plan) pursuant to Rule 12b-1 under the 1940 Act. The Class A Plan provides that each Fund will pay EVD a distribution and service fee not exceeding 0.25% per annum of its average daily net assets attributable to Class A shares for distribution services and facilities provided to each Fund by EVD, as well as for personal services and/or the maintenance of shareholder accounts. The Trustees approved distribution and service fee payments equal to 0.20% per annum of each Fund’s average daily net assets attributable to Class A shares. Distribution and service fees paid or accrued to EVD for the year ended August 31, 2020 for Class A shares amounted to the following:
| | | | | | | | | | | | | | | | |
| | | Georgia
Fund | | | Maryland
Fund | | | Missouri
Fund | | | North Carolina
Fund | |
| | | | |
Class A Distribution and Service Fees | | $ | 86,587 | | | $ | 75,006 | | | $ | 97,661 | | | $ | 122,151 | |
| | | | |
| | | | | | Oregon
Fund | | | South Carolina
Fund | | | Virginia
Fund | |
| | | | |
Class A Distribution and Service Fees | | | | | | $ | 161,428 | | | $ | 148,537 | | | $ | 96,903 | |
Eaton Vance
Municipal Income Funds
August 31, 2020
Notes to Financial Statements — continued
Each Fund also has in effect a distribution plan for Class C shares (Class C Plan) pursuant to Rule 12b-1 under the 1940 Act. Pursuant to the Class C Plan, each Fund pays EVD amounts equal to 0.75% per annum of its average daily net assets attributable to Class C shares for providing ongoing distribution services and facilities to the respective Funds. For the year ended August 31, 2020, the Funds paid or accrued to EVD the following distribution fees:
| | | | | | | | | | | | | | | | |
| | | Georgia
Fund | | | Maryland
Fund | | | Missouri
Fund | | | North Carolina
Fund | |
| | | | |
Class C Distribution Fees | | $ | 43,022 | | | $ | 76,927 | | | $ | 57,898 | | | $ | 100,655 | |
| | | | |
| | | | | | Oregon
Fund | | | South Carolina
Fund | | | Virginia
Fund | |
| | | | |
Class C Distribution Fees | | | | | | $ | 79,836 | | | $ | 128,330 | | | $ | 31,442 | |
The Class C Plan also authorizes each Fund to make payments of service fees to EVD, financial intermediaries and other persons in amounts not exceeding 0.25% per annum of the average daily net assets attributable to Class C shares. The Trustees approved service fee payments equal to 0.20% per annum of each Fund’s average daily net assets attributable to Class C shares. Service fees paid or accrued are for personal services and/or the maintenance of shareholder accounts. They are separate and distinct from the Class C sales commissions and distribution fees payable to EVD. Service fees paid or accrued for the year ended August 31, 2020 amounted to the following:
| | | | | | | | | | | | | | | | |
| | | Georgia
Fund | | | Maryland
Fund | | | Missouri
Fund | | | North Carolina
Fund | |
| | | | |
Class C Service Fees | | $ | 11,472 | | | $ | 20,514 | | | $ | 15,440 | | | $ | 26,841 | |
| | | | |
| | | | | | Oregon
Fund | | | South Carolina
Fund | | | Virginia
Fund | |
| | | | |
Class C Service Fees | | | | | | $ | 21,290 | | | $ | 34,222 | | | $ | 8,385 | |
Distribution and service fees are subject to the limitations contained in the Financial Industry Regulatory Authority Rule 2341(d).
5 Contingent Deferred Sales Charges
A contingent deferred sales charge (CDSC) of 1% generally is imposed on redemptions of Class C shares made within 12 months of purchase. Class A shares may be subject to a 1% CDSC if redeemed within 18 months of purchase (depending on the circumstances of purchase). Generally, the CDSC is based upon the lower of the net asset value at date of redemption or date of purchase. No charge is levied on shares acquired by reinvestment of dividends or capital gain distributions. For the year ended August 31, 2020, the Funds were informed that EVD received approximately the following amounts of CDSCs paid by Class A and Class C shareholders:
| | | | | | | | | | | | | | | | |
| | | Georgia
Fund | | | Maryland
Fund | | | Missouri
Fund | | | North Carolina
Fund | |
| | | | |
Class A | | $ | — | | | $ | — | | | $ | — | | | $ | — | |
| | | | |
Class C | | $ | 1,000 | | | $ | 1,000 | | | $ | 1,000 | | | $ | 500 | |
| | | | |
| | | | | | Oregon
Fund | | | South Carolina
Fund | | | Virginia
Fund | |
| | | | |
Class A | | | | | | $ | — | | | $ | — | | | $ | — | |
| | | | |
Class C | | | | | | $ | 100 | | | $ | 4,000 | | | $ | 3,000 | |
Eaton Vance
Municipal Income Funds
August 31, 2020
Notes to Financial Statements — continued
6 Purchases and Sales of Investments
Purchases and sales of investments, other than short-term obligations, for the year ended August 31, 2020 were as follows:
| | | | | | | | | | | | | | | | |
| | | Georgia
Fund | | | Maryland
Fund | | | Missouri
Fund | | | North Carolina
Fund | |
| | | | |
Purchases | | $ | 26,686,497 | | | $ | 20,857,776 | | | $ | 23,622,388 | | | $ | 35,345,197 | |
| | | | |
Sales | | $ | 14,574,815 | | | $ | 15,601,967 | | | $ | 12,521,674 | | | $ | 28,109,465 | |
| | | | |
| | | | | | Oregon
Fund | | | South Carolina
Fund | | | Virginia
Fund | |
| | | | |
Purchases | | | | | | $ | 61,025,253 | | | $ | 53,034,797 | | | $ | 12,111,600 | |
| | | | |
Sales | | | | | | $ | 48,890,257 | | | $ | 38,755,226 | | | $ | 14,285,366 | |
7 Shares of Beneficial Interest
Each Fund’s Declaration of Trust permits the Trustees to issue an unlimited number of full and fractional shares of beneficial interest (without par value). Such shares may be issued in a number of different series (such as the Funds) and classes. Transactions in Fund shares were as follows:
| | | | | | | | | | | | |
Georgia Fund | | | | | | | | | |
| | | Year Ended August 31, 2020 | |
| | | Class A | | | Class C | | | Class I | |
| | | |
Sales | | | 667,363 | | | | 113,833 | | | | 2,217,513 | |
| | | |
Issued to shareholders electing to receive payments of distributions in Fund shares | | | 93,183 | | | | 7,902 | | | | 72,336 | |
| | | |
Redemptions | | | (558,743 | ) | | | (150,183 | ) | | | (1,402,147 | ) |
| | | |
Converted from Class C shares | | | 26,147 | | | | — | | | | — | |
| | | |
Converted to Class A shares | | | — | | | | (24,447 | ) | | | — | |
| | | |
Net increase (decrease) | | | 227,950 | | | | (52,895 | ) | | | 887,702 | |
| |
| | | Year Ended August 31, 2019 | |
| | | Class A | | | Class C | | | Class I | |
| | | |
Sales | | | 929,894 | | | | 132,015 | | | | 1,832,633 | |
| | | |
Issued to shareholders electing to receive payments of distributions in Fund shares | | | 102,142 | | | | 11,010 | | | | 63,247 | |
| | | |
Redemptions | | | (645,614 | ) | | | (200,301 | ) | | | (922,988 | ) |
| | | |
Converted from Class C shares | | | 103,880 | | | | — | | | | — | |
| | | |
Converted to Class A shares | | | — | | | | (97,141 | ) | | | — | |
| | | |
Net increase (decrease) | | | 490,302 | | | | (154,417 | ) | | | 972,892 | |
Eaton Vance
Municipal Income Funds
August 31, 2020
Notes to Financial Statements — continued
| | | | | | | | | | | | |
Maryland Fund | | | | | | | | | |
| | | Year Ended August 31, 2020 | |
| | | Class A | | | Class C | | | Class I | |
| | | |
Sales | | | 420,150 | | | | 101,423 | | | | 1,190,638 | |
| | | |
Issued to shareholders electing to receive payments of distributions in Fund shares | | | 71,495 | | | | 13,040 | | | | 44,731 | |
| | | |
Redemptions | | | (497,403 | ) | | | (223,114 | ) | | | (257,867 | ) |
| | | |
Converted from Class C shares | | | 91,248 | | | | — | | | | — | |
| | | |
Converted to Class A shares | | | — | | | | (83,657 | ) | | | — | |
| | | |
Net increase (decrease) | | | 85,490 | | | | (192,308 | ) | | | 977,502 | |
| |
| | | Year Ended August 31, 2019 | |
| | | Class A | | | Class C | | | Class I | |
| | | |
Sales | | | 498,843 | | | | 94,483 | | | | 965,854 | |
| | | |
Issued to shareholders electing to receive payments of distributions in Fund shares | | | 80,654 | | | | 17,790 | | | | 27,545 | |
| | | |
Redemptions | | | (775,202 | ) | | | (175,644 | ) | | | (293,901 | ) |
| | | |
Converted from Class C shares | | | 263,947 | | | | — | | | | — | |
| | | |
Converted to Class A shares | | | — | | | | (241,872 | ) | | | — | |
| | | |
Net increase (decrease) | | | 68,242 | | | | (305,243 | ) | | | 699,498 | |
| | | |
Missouri Fund | | | | | | | | | |
| | | Year Ended August 31, 2020 | |
| | | Class A | | | Class C | | | Class I | |
| | | |
Sales | | | 696,296 | | | | 156,889 | | | | 1,559,266 | |
| | | |
Issued to shareholders electing to receive payments of distributions in Fund shares | | | 131,790 | | | | 11,680 | | | | 48,487 | |
| | | |
Redemptions | | | (785,441 | ) | | | (151,055 | ) | | | (714,139 | ) |
| | | |
Converted from Class C shares | | | 61,344 | | | | — | | | | — | |
| | | |
Converted to Class A shares | | | — | | | | (55,578 | ) | | | — | |
| | | |
Net increase (decrease) | | | 103,989 | | | | (38,064 | ) | | | 893,614 | |
| |
| | | Year Ended August 31, 2019 | |
| | | Class A | | | Class C | | | Class I | |
| | | |
Sales | | | 488,627 | | | | 140,673 | | | | 758,496 | |
| | | |
Issued to shareholders electing to receive payments of distributions in Fund shares | | | 146,523 | | | | 13,930 | | | | 38,422 | |
| | | |
Redemptions | | | (716,658 | ) | | | (106,910 | ) | | | (415,021 | ) |
| | | |
Converted from Class C shares | | | 142,412 | | | | — | | | | — | |
| | | |
Converted to Class A shares | | | — | | | | (128,948 | ) | | | — | |
| | | |
Net increase (decrease) | | | 60,904 | | | | (81,255 | ) | | | 381,897 | |
Eaton Vance
Municipal Income Funds
August 31, 2020
Notes to Financial Statements — continued
| | | | | | | | | | | | |
North Carolina Fund | | | | | | | | | |
| | | Year Ended August 31, 2020 | |
| | | Class A | | | Class C | | | Class I | |
| | | |
Sales | | | 970,466 | | | | 157,985 | | | | 2,326,609 | |
| | | |
Issued to shareholders electing to receive payments of distributions in Fund shares | | | 146,827 | | | | 20,531 | | | | 95,447 | |
| | | |
Redemptions | | | (1,064,606 | ) | | | (212,355 | ) | | | (1,318,660 | ) |
| | | |
Converted from Class C shares | | | 188,598 | | | | — | | | | — | |
| | | |
Converted to Class A shares | | | — | | | | (175,317 | ) | | | — | |
| | | |
Net increase (decrease) | | | 241,285 | | | | (209,156 | ) | | | 1,103,396 | |
| |
| | | Year Ended August 31, 2019 | |
| | | Class A | | | Class C | | | Class I | |
| | | |
Sales | | | 641,235 | | | | 252,116 | | | | 3,068,792 | |
| | | |
Issued to shareholders electing to receive payments of distributions in Fund shares | | | 169,278 | | | | 27,669 | | | | 82,446 | |
| | | |
Redemptions | | | (1,491,304 | ) | | | (514,380 | ) | | | (1,469,249 | ) |
| | | |
Converted from Class C shares | | | 200,869 | | | | — | | | | — | |
| | | |
Converted to Class A shares | | | — | | | | (186,621 | ) | | | — | |
| | | |
Net increase (decrease) | | | (479,922 | ) | | | (421,216 | ) | | | 1,681,989 | |
| | | |
Oregon Fund | | | | | | | | | |
| | | Year Ended August 31, 2020 | |
| | | Class A | | | Class C | | | Class I | |
| | | |
Sales | | | 1,568,270 | | | | 344,282 | | | | 3,395,479 | |
| | | |
Issued to shareholders electing to receive payments of distributions in Fund shares | | | 222,529 | | | | 18,978 | | | | 127,337 | |
| | | |
Redemptions | | | (1,846,192 | ) | | | (202,756 | ) | | | (1,755,436 | ) |
| | | |
Converted from Class C shares | | | 100,106 | | | | — | | | | — | |
| | | |
Converted to Class A shares | | | — | | | | (91,432 | ) | | | — | |
| | | |
Net increase | | | 44,713 | | | | 69,072 | | | | 1,767,380 | |
| |
| | | Year Ended August 31, 2019 | |
| | | Class A | | | Class C | | | Class I | |
| | | |
Sales | | | 1,707,027 | | | | 392,057 | | | | 2,738,806 | |
| | | |
Issued to shareholders electing to receive payments of distributions in Fund shares | | | 250,164 | | | | 22,370 | | | | 90,547 | |
| | | |
Redemptions | | | (1,577,403 | ) | | | (251,101 | ) | | | (877,668 | ) |
| | | |
Converted from Class C shares | | | 232,468 | | | | — | | | | — | |
| | | |
Converted to Class A shares | | | — | | | | (212,165 | ) | | | — | |
| | | |
Net increase (decrease) | | | 612,256 | | | | (48,839 | ) | | | 1,951,685 | |
Eaton Vance
Municipal Income Funds
August 31, 2020
Notes to Financial Statements — continued
| | | | | | | | | | | | |
South Carolina Fund | | | | | | | | | |
| | | Year Ended August 31, 2020 | |
| | | Class A | | | Class C | | | Class I | |
| | | |
Sales | | | 1,376,608 | | | | 382,488 | | | | 2,537,731 | |
| | | |
Issued to shareholders electing to receive payments of distributions in Fund shares | | | 176,537 | | | | 22,180 | | | | 105,439 | |
| | | |
Redemptions | | | (1,199,088 | ) | | | (509,009 | ) | | | (1,127,020 | ) |
| | | |
Converted from Class C shares | | | 286,699 | | | | — | | | | — | |
| | | |
Converted to Class A shares | | | — | | | | (270,371 | ) | | | — | |
| | | |
Net increase (decrease) | | | 640,756 | | | | (374,712 | ) | | | 1,516,150 | |
| |
| | | Year Ended August 31, 2019 | |
| | | Class A | | | Class C | | | Class I | |
| | | |
Sales | | | 839,548 | | | | 221,606 | | | | 1,732,557 | |
| | | |
Issued to shareholders electing to receive payments of distributions in Fund shares | | | 197,982 | | | | 38,836 | | | | 90,669 | |
| | | |
Redemptions | | | (1,020,793 | ) | | | (568,201 | ) | | | (1,005,103 | ) |
| | | |
Converted from Class C shares | | | 431,332 | | | | — | | | | — | |
| | | |
Converted to Class A shares | | | — | | | | (406,582 | ) | | | — | |
| | | |
Net increase (decrease) | | | 448,069 | | | | (714,341 | ) | | | 818,123 | |
| | | |
Virginia Fund | | | | | | | | | |
| | | Year Ended August 31, 2020 | |
| | | Class A | | | Class C | | | Class I | |
| | | |
Sales | | | 403,372 | | | | 163,048 | | | | 834,435 | |
| | | |
Issued to shareholders electing to receive payments of distributions in Fund shares | | | 131,023 | | | | 8,496 | | | | 53,182 | |
| | | |
Redemptions | | | (848,936 | ) | | | (89,373 | ) | | | (566,855 | ) |
| | | |
Converted from Class C shares | | | 70,782 | | | | — | | | | — | |
| | | |
Converted to Class A shares | | | — | | | | (63,871 | ) | | | — | |
| | | |
Net increase (decrease) | | | (243,759 | ) | | | 18,300 | | | | 320,762 | |
| |
| | | Year Ended August 31, 2019 | |
| | | Class A | | | Class C | | | Class I | |
| | | |
Sales | | | 367,212 | | | | 187,641 | | | | 827,773 | |
| | | |
Issued to shareholders electing to receive payments of distributions in Fund shares | | | 148,197 | | | | 10,382 | | | | 48,676 | |
| | | |
Redemptions | | | (789,529 | ) | | | (105,543 | ) | | | (446,197 | ) |
| | | |
Converted from Class C shares | | | 215,060 | | | | — | | | | — | |
| | | |
Converted to Class A shares | | | — | | | | (194,178 | ) | | | — | |
| | | |
Net increase (decrease) | | | (59,060 | ) | | | (101,698 | ) | | | 430,252 | |
Eaton Vance
Municipal Income Funds
August 31, 2020
Notes to Financial Statements — continued
8 Line of Credit
The Funds participate with other portfolios and funds managed by EVM and its affiliates in an $800 million unsecured line of credit agreement with a group of banks, which is in effect through October 27, 2020. In connection with the renewal of the agreement on October 29, 2019, funds managed by Calvert Research and Management, an affiliate of EVM, were added as participating funds to the agreement and the borrowing limit was increased from $625 million. Borrowings are made by the Funds solely for temporary purposes related to redemptions and other short-term cash needs. Interest is charged to each Fund based on its borrowings at an amount above either the Eurodollar rate or Federal Funds rate. In addition, a fee computed at an annual rate of 0.15% on the daily unused portion of the line of credit is allocated among the participating portfolios and funds at the end of each quarter. Because the line of credit is not available exclusively to the Funds, a Fund may be unable to borrow some or all of its requested amounts at any particular time. The Funds did not have any significant borrowings or allocated fees during the year ended August 31, 2020.
9 Fair Value Measurements
Under generally accepted accounting principles for fair value measurements, a three-tier hierarchy to prioritize the assumptions, referred to as inputs, is used in valuation techniques to measure fair value. The three-tier hierarchy of inputs is summarized in the three broad levels listed below.
| • | | Level 1 – quoted prices in active markets for identical investments |
| • | | Level 2 – other significant observable inputs (including quoted prices for similar investments, interest rates, prepayment speeds, credit risk, etc.) |
| • | | Level 3 – significant unobservable inputs (including a fund’s own assumptions in determining the fair value of investments) |
In cases where the inputs used to measure fair value fall in different levels of the fair value hierarchy, the level disclosed is determined based on the lowest level input that is significant to the fair value measurement in its entirety. The inputs or methodology used for valuing securities are not necessarily an indication of the risk associated with investing in those securities.
At August 31, 2020, the hierarchy of inputs used in valuing the Funds’ investments, which are carried at value, were as follows:
| | | | | | | | | | | | | | | | |
Georgia Fund | |
| Asset Description | | Level 1 | | | Level 2 | | | Level 3 | | | Total | |
| | | | |
Tax-Exempt Investments | | $ | — | | | $ | 97,097,730 | | | $ | — | | | $ | 97,097,730 | |
| | | | |
Total Investments | | $ | — | | | $ | 97,097,730 | | | $ | — | | | $ | 97,097,730 | |
|
Maryland Fund | |
| Asset Description | | Level 1 | | | Level 2 | | | Level 3 | | | Total | |
| | | | |
Tax-Exempt Municipal Securities | | $ | — | | | $ | 64,603,215 | | | $ | — | | | $ | 64,603,215 | |
| | | | |
Taxable Municipal Securities | | | — | | | | 1,592,838 | | | | — | | | | 1,592,838 | |
| | | | |
Total Investments | | $ | — | | | $ | 66,196,053 | | | $ | — | | | $ | 66,196,053 | |
|
Missouri Fund | |
| Asset Description | | Level 1 | | | Level 2 | | | Level 3 | | | Total | |
| | | | |
Tax-Exempt Municipal Securities | | $ | — | | | $ | 82,538,193 | | | $ | — | | | $ | 82,538,193 | |
| | | | |
Taxable Municipal Securities | | | — | | | | 26,500 | | | | — | | | | 26,500 | |
| | | | |
Total Investments | | $ | — | | | $ | 82,564,693 | | | $ | — | | | $ | 82,564,693 | |
Eaton Vance
Municipal Income Funds
August 31, 2020
Notes to Financial Statements — continued
| | | | | | | | | | | | | | | | |
North Carolina Fund | |
| Asset Description | | Level 1 | | | Level 2 | | | Level 3 | | | Total | |
| | | | |
Tax-Exempt Municipal Securities | | $ | — | | | $ | 134,272,160 | | | $ | — | | | $ | 134,272,160 | |
| | | | |
Corporate Bonds & Notes | | | — | | | | 529,308 | | | | — | | | | 529,308 | |
| | | | |
Total Investments | | $ | — | | | $ | 134,801,468 | | | $ | — | | | $ | 134,801,468 | |
|
Oregon Fund | |
| Asset Description | | Level 1 | | | Level 2 | | | Level 3 | | | Total | |
| | | | |
Tax-Exempt Investments | | $ | — | | | $ | 145,969,278 | | | $ | — | | | $ | 145,969,278 | |
| | | | |
Total Investments | | $ | — | | | $ | 145,969,278 | | | $ | — | | | $ | 145,969,278 | |
|
South Carolina Fund | |
| Asset Description | | Level 1 | | | Level 2 | | | Level 3 | | | Total | |
| | | | |
Tax-Exempt Municipal Securities | | $ | — | | | $ | 139,520,902 | | | $ | — | | | $ | 139,520,902 | |
| | | | |
Taxable Municipal Securities | | | — | | | | 3,240,145 | | | | — | | | | 3,240,145 | |
| | | | |
Total Investments | | $ | — | | | $ | 142,761,047 | | | $ | — | | | $ | 142,761,047 | |
|
Virginia Fund | |
| Asset Description | | Level 1 | | | Level 2 | | | Level 3 | | | Total | |
| | | | |
Tax-Exempt Municipal Securities | | $ | — | | | $ | 68,548,606 | | | $ | — | | | $ | 68,548,606 | |
| | | | |
Taxable Municipal Securities | | | — | | | | 2,024,160 | | | | — | | | | 2,024,160 | |
| | | | |
Total Investments | | $ | — | | | $ | 70,572,766 | | | $ | — | | | $ | 70,572,766 | |
10 Risk and Uncertainties
Pandemic Risk
An outbreak of respiratory disease caused by a novel coronavirus was first detected in China in December 2019 and subsequently spread internationally. This coronavirus has resulted in closing borders, enhanced health screenings, changes to healthcare service preparation and delivery, quarantines, cancellations, disruptions to supply chains and customer activity, as well as general concern and uncertainty. Health crises caused by outbreaks, such as the coronavirus outbreak, may exacerbate other pre-existing political, social and economic risks and disrupt normal market conditions and operations. The impact of this outbreak has negatively affected the worldwide economy, the economies of individual countries, individual companies, and the market in general, and may continue to do so in significant and unforeseen ways, as may other epidemics and pandemics that may arise in the future. Any such impact could adversely affect the Funds’ performance, or the performance of the securities in which the Funds invest.
11 Subsequent Event
On October 8, 2020, Morgan Stanley (“Morgan Stanley”) and Eaton Vance Corp. (“Eaton Vance”) announced that they had entered into a definitive agreement under which Morgan Stanley would acquire Eaton Vance. Under the Investment Company Act of 1940, as amended, consummation of this transaction will result in the automatic termination of each Fund’s investment advisory agreement, and any related sub-advisory agreement(s), if applicable. Thus, each Fund’s Board will be asked to approve a new investment advisory agreement (and new sub-advisory agreement(s), if applicable). If approved by each Fund’s Board, the new investment advisory agreement (and new sub-advisory agreement(s), if applicable) is expected to be presented to Fund shareholders for approval, and, if approved, would take effect upon the closing of the transaction.
Eaton Vance
Municipal Income Funds
August 31, 2020
Report of Independent Registered Public Accounting Firm
To the Trustees of Eaton Vance Municipals Trust and Shareholders of Eaton Vance Georgia Municipal Income Fund, Eaton Vance Maryland Municipal Income Fund, Eaton Vance Missouri Municipal Income Fund, Eaton Vance North Carolina Municipal Income Fund, Eaton Vance Oregon Municipal Income Fund, Eaton Vance South Carolina Municipal Income Fund, and Eaton Vance Virginia Municipal Income Fund:
Opinion on the Financial Statements and Financial Highlights
We have audited the accompanying statements of assets and liabilities of Eaton Vance Georgia Municipal Income Fund, Eaton Vance Maryland Municipal Income Fund, Eaton Vance Missouri Municipal Income Fund, Eaton Vance North Carolina Municipal Income Fund, Eaton Vance Oregon Municipal Income Fund, Eaton Vance South Carolina Municipal Income Fund, and Eaton Vance Virginia Municipal Income Fund (collectively, the “Funds”) (certain of the funds constituting Eaton Vance Municipals Trust), including the portfolios of investments, as of August 31, 2020, the related statements of operations for the year then ended, the statements of changes in net assets for each of the two years in the period then ended, the financial highlights for each of the five years in the period then ended, and the related notes. In our opinion, the financial statements and financial highlights present fairly, in all material respects, the financial position of each of the Funds as of August 31, 2020, and the results of their operations for the year then ended, the changes in their net assets for each of the two years in the period then ended, and the financial highlights for each of the five years in the period then ended in conformity with accounting principles generally accepted in the United States of America.
Basis for Opinion
These financial statements and financial highlights are the responsibility of the Funds’ management. Our responsibility is to express an opinion on the Funds’ financial statements and financial highlights based on our audits. We are a public accounting firm registered with the Public Company Accounting Oversight Board (United States) (PCAOB) and are required to be independent with respect to the Funds in accordance with the U.S. federal securities laws and the applicable rules and regulations of the Securities and Exchange Commission and the PCAOB.
We conducted our audits in accordance with the standards of the PCAOB. Those standards require that we plan and perform the audit to obtain reasonable assurance about whether the financial statements and financial highlights are free of material misstatement, whether due to error or fraud. The Funds are not required to have, nor were we engaged to perform, an audit of their internal control over financial reporting. As part of our audits we are required to obtain an understanding of internal control over financial reporting but not for the purpose of expressing an opinion on the effectiveness of the Funds’ internal control over financial reporting. Accordingly, we express no such opinion.
Our audits included performing procedures to assess the risks of material misstatement of the financial statements and financial highlights, whether due to error or fraud, and performing procedures that respond to those risks. Such procedures included examining, on a test basis, evidence regarding the amounts and disclosures in the financial statements and financial highlights. Our audits also included evaluating the accounting principles used and significant estimates made by management, as well as evaluating the overall presentation of the financial statements and financial highlights. Our procedures included confirmation of securities owned as of August 31, 2020, by correspondence with the custodian and brokers; when replies were not received from brokers, we performed other auditing procedures. We believe that our audits provide a reasonable basis for our opinion.
/s/ Deloitte & Touche LLP
Boston, Massachusetts
October 16, 2020
We have served as the auditor of one or more Eaton Vance investment companies since 1959.
Eaton Vance
Municipal Income Funds
August 31, 2020
Federal Tax Information (Unaudited)
The Form 1099-DIV you receive in February 2021 will show the tax status of all distributions paid to your account in calendar year 2020. Shareholders are advised to consult their own tax adviser with respect to the tax consequences of their investment in the Funds. As required by the Internal Revenue Code and/or regulations, shareholders must be notified regarding exempt-interest dividends.
Exempt-Interest Dividends. For the fiscal year ended August 31, 2020, the Funds designate the following percentages of distributions from net investment income as exempt-interest dividends:
| | | | |
| |
Georgia Municipal Income Fund | | | 100.00 | % |
| |
Maryland Municipal Income Fund | | | 98.85 | % |
| |
Missouri Municipal Income Fund | | | 99.95 | % |
| |
North Carolina Municipal Income Fund | | | 99.09 | % |
| |
Oregon Municipal Income Fund | | | 99.84 | % |
| |
South Carolina Municipal Income Fund | | | 99.86 | % |
| |
Virginia Municipal Income Fund | | | 99.75 | % |
Eaton Vance
Municipal Income Funds
August 31, 2020
Board of Trustees’ Contract Approval
Overview of the Contract Review Process
The Investment Company Act of 1940, as amended (the “1940 Act”), provides, in substance, that the investment advisory agreement between a fund and its investment adviser will continue in effect from year-to-year only if its continuation is approved on an annual basis by a vote of the fund’s board of trustees, including a majority of the trustees who are not “interested persons” of the fund (“independent trustees”), cast in person at a meeting called for the purpose of considering such approval.
At a meeting held on April 22, 2020 (the “April 2020 Meeting”), the Boards of Trustees/Directors comprised of the same individuals (collectively, the “Board”) that oversees a majority of the registered investment companies advised by Eaton Vance Management or its affiliate, Boston Management and Research (the “Eaton Vance Funds”), including a majority of the independent trustees (the “Independent Trustees”), voted to approve the continuation of existing investment advisory agreements and sub-advisory agreements(1) for each of the Eaton Vance Funds for an additional one-year period. The Board relied upon the affirmative recommendation of its Contract Review Committee, which is a committee exclusively comprised of Independent Trustees. Prior to making its recommendation, the Contract Review Committee reviewed information furnished by the adviser and sub-adviser to each of the Eaton Vance Funds (including information specifically requested by the Board) for a series of formal meetings held between February and April 2020. Members of the Contract Review Committee also considered information received at prior meetings of the Board and its committees, to the extent such information was relevant to the Contract Review Committee’s annual evaluation of the investment advisory agreements and sub-advisory agreements.
In connection with its evaluation of the investment advisory agreements and sub-advisory agreements, the Board considered various information relating to the Eaton Vance Funds. This included information applicable to all or groups of Eaton Vance Funds, which is referenced immediately below, and information applicable to the particular Eaton Vance Fund covered by this report (additional fund-specific information is referenced below under “Results of the Contract Review Process”). (For funds that invest through one or more underlying portfolios, references to “each fund” in this section may include information that was considered at the portfolio-level.)
Information about Fees, Performance and Expenses
| | • | | A report from an independent data provider comparing advisory and other fees paid by each fund to such fees paid by comparable funds, as identified by the independent data provider (“comparable funds”); |
| | • | | A report from an independent data provider comparing each fund’s total expense ratio (and its components) to those of comparable funds; |
| | • | | A report from an independent data provider comparing the investment performance of each fund (including, as relevant, total return data, income data, Sharpe ratios and information ratios) to the investment performance of comparable funds and, as applicable, benchmark indices, over various time periods; |
| | • | | In certain instances, data regarding investment performance relative to customized groups of peer funds and blended indices identified by the adviser in consultation with the Portfolio Management Committee of the Board; |
| | • | | Comparative information concerning the fees charged and services provided by the adviser and sub-adviser to each fund in managing other accounts (which may include other mutual funds, collective investment funds and institutional accounts) using investment strategies and techniques similar to those used in managing such fund(s), if any; |
| | • | | Profitability analyses with respect to the adviser and sub-adviser to each of the funds; |
Information about Portfolio Management and Trading
| | • | | Descriptions of the investment management services provided to each fund, as well as each of the funds’ investment strategies and policies; |
| | • | | The procedures and processes used to determine the fair value of fund assets, when necessary, and actions taken to monitor and test the effectiveness of such procedures and processes; |
| | • | | Information about the policies and practices of each fund’s adviser and sub-adviser (in the context of a sub-adviser, only those with trading responsibilities) with respect to trading, including their processes for seeking best execution of portfolio transactions; |
| | • | | Information about the allocation of brokerage transactions and the benefits, if any, received by the adviser and sub-adviser (in the context of a sub-adviser, only those with trading responsibilities) to each fund as a result of brokerage allocation, including, as applicable, information concerning the acquisition of research through client commission arrangements and policies with respect to “soft dollars”; |
| | • | | Data relating to the portfolio turnover rate of each fund; |
Information about each Adviser and Sub-adviser
| | • | | Reports detailing the financial results and condition of the adviser and sub-adviser to each fund; |
| | • | | Information regarding the individual investment professionals whose responsibilities include portfolio management and investment research for the funds, and, for portfolio managers and certain other investment professionals, information relating to their responsibilities with respect to managing other mutual funds and investment accounts, as applicable; |
| (1) | Not all Eaton Vance Funds have entered into a sub-advisory agreement with a sub-adviser. Accordingly, references to “sub-adviser” or “sub-advisory agreement” in this “Overview” section may not be applicable to the particular Eaton Vance Fund covered by this report. |
Eaton Vance
Municipal Income Funds
August 31, 2020
Board of Trustees’ Contract Approval — continued
| | • | | The Code of Ethics of the adviser and its affiliates and the sub-adviser of each fund, together with information relating to compliance with, and the administration of, such codes; |
| | • | | Policies and procedures relating to proxy voting and the handling of corporate actions and class actions; |
| | • | | Information concerning the resources devoted to compliance efforts undertaken by the adviser and its affiliates and the sub-adviser of each fund, if any, including descriptions of their various compliance programs and their record of compliance; |
| | • | | Information concerning the business continuity and disaster recovery plans of the adviser and its affiliates and the sub-adviser of each fund, if any; |
| | • | | A description of Eaton Vance Management’s and Boston Management and Research’s oversight of sub-advisers, including with respect to regulatory and compliance issues, investment management and other matters; |
Other Relevant Information
| | • | | Information concerning the nature, cost and character of the administrative and other non-investment advisory services provided by Eaton Vance Management and its affiliates; |
| | • | | Information concerning oversight of the relationship with the custodian, subcustodians and fund accountants by the adviser and/or administrator to each of the funds; |
| | • | | For an Eaton Vance Fund structured as an exchange-listed closed-end fund, information concerning the benefits of the closed-end fund structure, as well as, where relevant, the closed-end fund’s market prices, trading volume data, distribution rates and other relevant matters; and |
| | • | | The terms of each investment advisory agreement and sub-advisory agreement. |
During the various meetings of the Board and its committees throughout the twelve months ended April 2020, the Trustees received information from portfolio managers and other investment professionals of the advisers and sub-advisers of the funds regarding investment and performance matters, and considered various investment and trading strategies used in pursuing the funds’ investment objectives. The Trustees also received information regarding risk management techniques employed in connection with the management of the funds. The Board and its committees evaluated issues pertaining to industry and regulatory developments, compliance procedures, fund governance and other issues with respect to the funds, and received and participated in reports and presentations provided by Eaton Vance Management, Boston Management and Research and fund sub-advisers, with respect to such matters. In addition to the formal meetings of the Board and its committees, the Independent Trustees held regular teleconferences to discuss, among other topics, matters relating to the continuation of investment advisory agreements and sub-advisory agreements.
The Contract Review Committee was advised throughout the contract review process by Goodwin Procter LLP, independent legal counsel for the Independent Trustees. The members of the Contract Review Committee, with the advice of such counsel, exercised their own business judgment in determining the material factors to be considered in evaluating each investment advisory agreement and sub-advisory agreement and the weight to be given to each such factor. The conclusions reached with respect to each investment advisory agreement and sub-advisory agreement were based on a comprehensive evaluation of all the information provided and not any single factor. Moreover, each member of the Contract Review Committee may have placed varying emphasis on particular factors in reaching conclusions with respect to each investment advisory agreement and sub-advisory agreement. In evaluating each investment advisory agreement and sub-advisory agreement, including the fee structures and other terms contained in such agreements, the members of the Contract Review Committee were also informed by multiple years of analysis and discussion with the adviser and sub-adviser to each of the Eaton Vance Funds.
In voting its approval of the continuation of existing investment advisory agreements and sub-advisory agreements at the April 2020 Meeting, the Board relied on an order issued by the Securities and Exchange Commission on March 25, 2020, which provided temporary relief from the in-person voting requirements under Section 15 of the 1940 Act in response to the impacts of the COVID-19 pandemic.
Results of the Contract Review Process
Based on its consideration of the foregoing, and such other information it deemed relevant, including the factors and conclusions described below, the Contract Review Committee concluded that the continuation of the investment advisory agreements between each of the following funds:
| | • | | Eaton Vance Georgia Municipal Income Fund |
| | • | | Eaton Vance Maryland Municipal Income Fund |
| | • | | Eaton Vance Missouri Municipal Income Fund |
| | • | | Eaton Vance North Carolina Municipal Income Fund |
| | • | | Eaton Vance Oregon Municipal Income Fund |
| | • | | Eaton Vance South Carolina Municipal Income Fund |
| | • | | Eaton Vance Virginia Municipal Income Fund |
(the “Funds”) and Boston Management and Research (the “Adviser”), including their respective fee structures, are in the interests of shareholders and, therefore, recommended to the Board approval of each agreement. Based on the recommendation of the Contract Review Committee, the Board, including a majority of the Independent Trustees, voted to approve continuation of the investment advisory agreement for each Fund.
Eaton Vance
Municipal Income Funds
August 31, 2020
Board of Trustees’ Contract Approval — continued
Nature, Extent and Quality of Services
In considering whether to approve the investment advisory agreements for the Funds, the Board evaluated the nature, extent and quality of services provided to the Funds by the Adviser.
The Board considered the Adviser’s management capabilities and investment processes in light of the types of investments held by each Fund, including the education, experience and number of investment professionals and other personnel who provide portfolio management, investment research, and similar services to the Funds, including recent changes in such personnel, where relevant. In particular, the Board considered, where relevant, the abilities and experience of the Adviser’s investment professionals in analyzing factors such as credit risk, tax efficiency, and special considerations relevant to investing in municipal bonds. The Board considered the Adviser’s municipal bond team, which includes investment professionals and credit specialists who provide services to the Funds. The Board also took into account the resources dedicated to portfolio management and other services, the compensation methods of the Adviser and other factors, including the reputation and resources of the Adviser to recruit and retain highly qualified research, advisory and supervisory investment professionals. In addition, the Board considered the time and attention devoted to the Eaton Vance Funds, including each Fund, by senior management, as well as the infrastructure, operational capabilities and support staff in place to assist in the portfolio management and operations of the Funds, including the provision of administrative services. The Board also considered the business-related and other risks to which the Adviser or its affiliates may be subject in managing the Funds.
The Board considered the compliance programs of the Adviser and relevant affiliates thereof. The Board considered compliance and reporting matters regarding, among other things, personal trading by investment professionals, disclosure of portfolio holdings, late trading, frequent trading, portfolio valuation, business continuity and the allocation of investment opportunities. The Board also considered the responses of the Adviser and its affiliates to requests in recent years from regulatory authorities, such as the Securities and Exchange Commission and the Financial Industry Regulatory Authority.
The Board considered other administrative services provided or overseen by Eaton Vance Management and its affiliates, including transfer agency and accounting services. The Board evaluated the benefits to shareholders of investing in a fund that is a part of a large fund complex offering exposure to a variety of asset classes and investment disciplines, as well as the ability, in many cases, to exchange an investment among different funds without incurring additional sales charges.
After consideration of the foregoing factors, among others, the Board concluded that the nature, extent and quality of services provided by the Adviser, taken as a whole, are appropriate and consistent with the terms of the investment advisory agreements.
Fund Performance
The Board compared each Fund’s investment performance to that of comparable funds identified by an independent data provider (the peer group), as well as appropriate benchmark indices and a customized peer group of similarly managed funds, and assessed each Fund’s performance on the basis of total return and current income return. The Board’s review included comparative performance data with respect to each Fund for the one-, three-, five- and ten-year periods ended September 30, 2019.
In this regard, the Board noted each Fund’s performance relative to its peer group, custom peer group and primary and secondary benchmark indexes for the three-year period, as follows:
| | | | | | | | |
| Fund | | Performance Relative to: |
| | Median of
Peers | | Median of
Custom Peers | | Primary
Index | | Secondary
Index |
| | | | |
Eaton Vance Georgia Municipal Income Fund | | Higher | | Lower | | Lower | | Lower |
| | | | |
Eaton Vance Maryland Municipal Income Fund | | Higher | | Equal | | Lower | | Lower |
| | | | |
Eaton Vance Missouri Municipal Income Fund | | Higher | | Equal | | Lower | | Lower |
| | | | |
Eaton Vance North Carolina Municipal Income Fund | | Lower | | Lower | | Lower | | Lower |
| | | | |
Eaton Vance Oregon Municipal Income Fund | | Higher | | Higher | | Lower | | Lower |
| | | | |
Eaton Vance South Carolina Municipal Income Fund | | Lower | | Lower | | Lower | | Lower |
| | | | |
Eaton Vance Virginia Municipal Income Fund | | Consistent with | | Lower | | Lower | | Lower |
The Board considered, among other things, the Adviser’s efforts to generate competitive levels of tax exempt current income over time through investments that, relative to its comparable funds, focus on higher quality municipal bonds with longer maturities. On the basis of the foregoing, the performance of the Eaton Vance South Carolina Municipal Income Fund over other periods and other relevant information provided by the Adviser in response to inquiries from the Contract Review Committee, the Board concluded that the performance of the Fund was satisfactory. With respect to Eaton Vance North Carolina Municipal Income Fund, the Board noted that the Fund’s security selection, including with respect to an overweight allocation to short maturity pre-refunded bonds and an underweight position to bonds with maturities longer than 17 years, as well as the Fund’s bias to higher quality bonds, detracted from the Fund’s relative performance. With respect to all other Funds, the Board concluded that the performance of each Fund was satisfactory.
Eaton Vance
Municipal Income Funds
August 31, 2020
Board of Trustees’ Contract Approval — continued
Management Fees and Expenses
The Board considered contractual fee rates payable by each Fund for advisory and administrative services (referred to collectively as “management fees”). As part of its review, the Board considered each Fund’s management fees and total expense ratio for the one-year period ended September 30, 2019, as compared to those of comparable funds, before and after giving effect to any undertaking to waive fees or reimburse expenses. The Board also considered factors that had an impact on each Fund’s total expense ratio relative to comparable funds.
After considering the foregoing information, and in light of the nature, extent and quality of the services provided by the Adviser, the Board concluded that the management fees charged for advisory and related services are reasonable.
Profitability and “Fall-Out” Benefits
The Board considered the level of profits realized by the Adviser and relevant affiliates thereof in providing investment advisory and administrative services to each Fund and to all Eaton Vance Funds as a group. The Board considered the level of profits realized without regard to marketing support or other payments by the Adviser and its affiliates to third parties in respect of distribution or other services.
The Board concluded that, in light of the foregoing factors and the nature, extent and quality of the services rendered, the profits realized by the Adviser and its affiliates are deemed not to be excessive.
The Board also considered direct or indirect fall-out benefits received by the Adviser and its affiliates in connection with their respective relationships with the Funds, including the benefits of research services that may be available to the Adviser as a result of securities transactions effected for the Funds and other investment advisory clients.
Economies of Scale
In reviewing management fees and profitability, the Board also considered the extent to which the Adviser and its affiliates, on the one hand, and each Fund, on the other hand, can expect to realize benefits from economies of scale as the assets of each Fund increase. The Board acknowledged the difficulty in accurately measuring the benefits resulting from economies of scale, if any, with respect to the management of any specific fund or group of funds. The Board reviewed data summarizing the increases and decreases in the assets of each Fund and of all Eaton Vance Funds as a group over various time periods, and evaluated the extent to which the total expense ratio of each Fund and the profitability of the Adviser and its affiliates may have been affected by such increases or decreases. Based upon the foregoing, the Board concluded that each Fund currently shares in the benefits from economies of scale, if any, when they are realized by the Adviser. The Board also concluded that the structure of each advisory fee, which includes breakpoints at several asset levels, will allow each Fund to continue to benefit from any economies of scale in the future.
Eaton Vance
Municipal Income Funds
August 31, 2020
Liquidity Risk Management Program
The Fund has implemented a written liquidity risk management program (Program) and related procedures to manage its liquidity in accordance with Rule 22e-4 under the Investment Company Act of 1940, as amended (Liquidity Rule). The Liquidity Rule defines “liquidity risk” as the risk that a fund could not meet requests to redeem shares issued by the fund without significant dilution of the remaining investors’ interests in the fund. The Fund’s Board of Trustees/Directors has designated the investment adviser to serve as the administrator of the Program and the related procedures. The administrator has established a Liquidity Risk Management Oversight Committee (Committee) to perform the functions necessary to administer the Program. As part of the Program, the administrator is responsible for identifying illiquid investments and categorizing the relative liquidity of the Fund’s investments in accordance with the Liquidity Rule. Under the Program, the administrator assesses, manages, and periodically reviews the Fund’s liquidity risk, and is responsible for making certain reports to the Fund’s Board of Trustees/Directors and the Securities and Exchange Commission (SEC) regarding the liquidity of the Fund’s investments, and to notify the Board of Trustees/Directors and the SEC of certain liquidity events specified in the Liquidity Rule. The liquidity of the Fund’s portfolio investments is determined based on a number of factors including, but not limited to, relevant market, trading and investment-specific considerations under the Program.
At a meeting of the Fund’s Board of Trustees/Directors, the Committee provided a written report to the Fund’s Board of Trustees/Directors pertaining to the operation, adequacy, and effectiveness of implementation of the Program, as well as the operation of the highly liquid investment minimum (if applicable) for the period December 1, 2018 through December 31, 2019 (Review Period). The Program operated effectively during the Review Period, supporting the administrator’s ability to assess, manage and monitor Fund liquidity risk, including during periods of market volatility and net redemptions. During the Review Period, the Fund met redemption requests on a timely basis.
There can be no assurance that the Program will achieve its objectives in the future. Please refer to the Fund’s prospectus for more information regarding the Fund’s exposure to liquidity risk and other principal risks to which an investment in the Fund may be subject.
Eaton Vance
Municipal Income Funds
August 31, 2020
Management and Organization
Fund Management. The Trustees of Eaton Vance Municipals Trust (the Trust) are responsible for the overall management and supervision of the Trust’s affairs. The Trustees and officers of the Trust are listed below. Except as indicated, each individual has held the office shown or other offices in the same company for the last five years. Trustees and officers of the Trust hold indefinite terms of office. The “Noninterested Trustees” consist of those Trustees who are not “interested persons” of the Trust, as that term is defined under the 1940 Act. The business address of each Trustee and officer is Two International Place, Boston, Massachusetts 02110. As used below, “EVC” refers to Eaton Vance Corp., “EV” refers to Eaton Vance, Inc., “EVM” refers to Eaton Vance Management, “BMR” refers to Boston Management and Research and “EVD” refers to Eaton Vance Distributors, Inc. EVC and EV are the corporate parent and trustee, respectively, of EVM and BMR. EVD is the Funds’ principal underwriter and a wholly-owned subsidiary of EVC. Each officer affiliated with Eaton Vance may hold a position with other Eaton Vance affiliates that is comparable to his or her position with EVM listed below. Each Trustee oversees 156 portfolios (with the exception of Messrs. Faust and Wennerholm and Ms. Frost who oversee 155 portfolios) in the Eaton Vance Complex (including all master and feeder funds in a master feeder structure). Each officer serves as an officer of certain other Eaton Vance funds. Each Trustee and officer serves until his or her successor is elected.
| | | | | | |
| Name and Year of Birth | | Trust
Position(s) | | Trustee
Since(1) | | Principal Occupation(s) and Other Directorships
During Past Five Years and Other Relevant Experience |
|
| Interested Trustee |
| | | |
Thomas E. Faust Jr. 1958 | | Trustee | | 2007 | | Chairman, Chief Executive Officer and President of EVC, Director and President of EV, Chief Executive Officer and President of EVM and BMR, and Director of EVD. Trustee and/or officer of 155 registered investment companies. Mr. Faust is an interested person because of his positions with EVM, BMR, EVD, EVC and EV, which are affiliates of the Trust. Other Directorships in the Last Five Years. Director of EVC and Hexavest Inc. (investment management firm). |
|
| Noninterested Trustees |
| | | |
Mark R. Fetting 1954 | | Trustee | | 2016 | | Private investor. Formerly held various positions at Legg Mason, Inc. (investment management firm) (2000-2012), including President, Chief Executive Officer, Director and Chairman (2008-2012), Senior Executive Vice President (2004-2008) and Executive Vice President (2001-2004). Formerly, President of Legg Mason family of funds (2001-2008). Formerly, Division President and Senior Officer of Prudential Financial Group, Inc. and related companies (investment management firm) (1991-2000). Other Directorships in the Last Five Years. None. |
| | | |
Cynthia E. Frost 1961 | | Trustee | | 2014 | | Private investor. Formerly, Chief Investment Officer of Brown University (university endowment) (2000-2012). Formerly, Portfolio Strategist for Duke Management Company (university endowment manager) (1995-2000). Formerly, Managing Director, Cambridge Associates (investment consulting company) (1989-1995). Formerly, Consultant, Bain and Company (management consulting firm) (1987-1989). Formerly, Senior Equity Analyst, BA Investment Management Company (1983-1985). Other Directorships in the Last Five Years. None. |
| | | |
George J. Gorman 1952 | | Trustee | | 2014 | | Principal at George J. Gorman LLC (consulting firm). Formerly, Senior Partner at Ernst & Young LLP (a registered public accounting firm) (1974-2009). Other Directorships in the Last Five Years. Formerly, Trustee of the BofA Funds Series Trust (11 funds) (2011-2014) and of the Ashmore Funds (9 funds) (2010-2014). |
| | | |
Valerie A. Mosley 1960 | | Trustee | | 2014 | | Chairwoman and Chief Executive Officer of Valmo Ventures (a consulting and investment firm). Former Partner and Senior Vice President, Portfolio Manager and Investment Strategist at Wellington Management Company, LLP (investment management firm) (1992-2012). Former Chief Investment Officer, PG Corbin Asset Management (1990-1992). Formerly worked in institutional corporate bond sales at Kidder Peabody (1986-1990). Other Directorships in the Last Five Years. Director of Groupon, Inc. (e-commerce provider) (since April 2020). Director of Envestnet, Inc. (provider of intelligent systems for wealth management and financial wellness) (since 2018). Director of Dynex Capital, Inc. (mortgage REIT) (since 2013). |
Eaton Vance
Municipal Income Funds
August 31, 2020
Management and Organization — continued
| | | | | | |
| Name and Year of Birth | | Trust
Position(s) | | Trustee
Since(1) | | Principal Occupation(s) and Other Directorships
During Past Five Years and Other Relevant Experience |
|
| Noninterested Trustees (continued) |
| | | |
William H. Park 1947 | | Chairperson of the Board and Trustee | | 2016 (Chairperson) and 2003 (Trustee) | | Private investor. Formerly, Consultant (management and transactional) (2012-2014). Formerly, Chief Financial Officer, Aveon Group L.P. (investment management firm) (2010-2011). Formerly, Vice Chairman, Commercial Industrial Finance Corp. (specialty finance company) (2006-2010). Formerly, President and Chief Executive Officer, Prizm Capital Management, LLC (investment management firm) (2002-2005). Formerly, Executive Vice President and Chief Financial Officer, United Asset Management Corporation (investment management firm) (1982-2001). Formerly, Senior Manager, Price Waterhouse (now PricewaterhouseCoopers) (a registered public accounting firm) (1972-1981). Other Directorships in the Last Five Years. None. |
| | | |
Helen Frame Peters 1948 | | Trustee | | 2008 | | Professor of Finance, Carroll School of Management, Boston College. Formerly, Dean, Carroll School of Management, Boston College (2000-2002). Formerly, Chief Investment Officer, Fixed Income, Scudder Kemper Investments (investment management firm) (1998-1999). Formerly, Chief Investment Officer, Equity and Fixed Income, Colonial Management Associates (investment management firm) (1991-1998). Other Directorships in the Last Five Years. None. |
| | | |
Keith Quinton 1958 | | Trustee | | 2018 | | Private investor, researcher and lecturer. Independent Investment Committee Member at New Hampshire Retirement System (since 2017). Formerly, Portfolio Manager and Senior Quantitative Analyst at Fidelity Investments (investment management firm) (2001-2014). Other Directorships in the Last Five Years. Director (since 2016) and Chairman (since 2019) of New Hampshire Municipal Bond Bank. |
| | | |
Marcus L. Smith 1966 | | Trustee | | 2018 | | Private investor. Member of Posse Boston Advisory Board (foundation) (since 2015). Formerly, Portfolio Manager at MFS Investment Management (investment management firm) (1994-2017). Other Directorships in the Last Five Years. Director of MSCI Inc. (global provider of investment decision support tools) (since 2017). Formerly, Director of DCT Industrial Trust Inc. (logistics real estate company) (2017-2018). |
| | | |
Susan J. Sutherland 1957 | | Trustee | | 2015 | | Private investor. Director of Ascot Group Limited and certain of its subsidiaries (insurance and reinsurance) (since 2018). Formerly, Director of Hagerty Holding Corp. (insurance and reinsurance) (2015-2018). Formerly, Associate, Counsel and Partner at Skadden, Arps, Slate, Meagher & Flom LLP (law firm) (1982-2013). Other Directorships in the Last Five Years. Formerly, Director of Montpelier Re Holdings Ltd. (global provider of customized insurance and reinsurance products) (2013-2015). |
| | | |
Scott E. Wennerholm 1959 | | Trustee | | 2016 | | Private Investor. Formerly, Trustee at Wheelock College (postsecondary institution) (2012-2018). Formerly, Consultant at GF Parish Group (executive recruiting firm) (2016-2017). Formerly, Chief Operating Officer and Executive Vice President at BNY Mellon Asset Management (investment management firm) (2005-2011). Formerly, Chief Operating Officer and Chief Financial Officer at Natixis Global Asset Management (investment management firm) (1997-2004). Formerly, Vice President at Fidelity Investments Institutional Services (investment management firm) (1994-1997). Other Directorships in the Last Five Years. None. |
| | | | | | |
| Name and Year of Birth | | Trust
Position(s) | | Officer
Since(2) | | Principal Occupation(s) During Past Five Years |
|
| Principal Officers who are not Trustees |
| | | |
Payson F. Swaffield 1956 | | President | | 2003 | | Vice President and Chief Income Investment Officer of EVM and BMR. Also Vice President of Calvert Research and Management (“CRM”). |
| | | |
Maureen A. Gemma 1960 | | Vice President, Secretary and Chief Legal Officer | | 2005 | | Vice President of EVM and BMR. Also Vice President of CRM. |
Eaton Vance
Municipal Income Funds
August 31, 2020
Management and Organization — continued
| | | | | | |
| Name and Year of Birth | | Trust
Position(s) | | Officer
Since(2) | | Principal Occupation(s) During Past Five Years |
|
| Principal Officers who are not Trustees (continued) |
| | | |
James F. Kirchner 1967 | | Treasurer | | 2007 | | Vice President of EVM and BMR. Also Vice President of CRM. |
| | | |
Richard F. Froio 1968 | | Chief Compliance Officer | | 2017 | | Vice President of EVM and BMR since 2017. Formerly, Deputy Chief Compliance Officer (Adviser/Funds) and Chief Compliance Officer (Distribution) at PIMCO (2012-2017) and Managing Director at BlackRock/Barclays Global Investors (2009-2012). |
| (1) | Year first appointed to serve as Trustee for a fund in the Eaton Vance family of funds. Each Trustee has served continuously since appointment unless indicated otherwise. |
| (2) | Year first elected to serve as officer of a fund in the Eaton Vance family of funds when the officer has served continuously. Otherwise, year of most recent election as an officer of a fund in the Eaton Vance family of funds. Titles may have changed since initial election. |
The SAI for the Funds includes additional information about the Trustees and officers of the Funds and can be obtained without charge on Eaton Vance’s website at www.eatonvance.com or by calling 1-800-262-1122.
Eaton Vance Funds
IMPORTANT NOTICES
Privacy. The Eaton Vance organization is committed to ensuring your financial privacy. Each entity listed below has adopted a privacy policy and procedures (“Privacy Program”) Eaton Vance believes is reasonably designed to protect your personal information and to govern when and with whom Eaton Vance may share your personal information.
| • | | At the time of opening an account, Eaton Vance generally requires you to provide us with certain information such as name, address, social security number, tax status, account numbers, and account balances. This information is necessary for us to both open an account for you and to allow us to satisfy legal requirements such as applicable anti-money laundering reviews and know-your-customer requirements. |
| • | | On an ongoing basis, in the normal course of servicing your account, Eaton Vance may share your information with unaffiliated third parties that perform various services for Eaton Vance and/or your account. These third parties include transfer agents, custodians, broker/dealers and our professional advisers, including auditors, accountants, and legal counsel. Eaton Vance may additionally share your personal information with our affiliates. |
| • | | We believe our Privacy Program is reasonably designed to protect the confidentiality of your personal information and to prevent unauthorized access to that information. |
| • | | We reserve the right to change our Privacy Program at any time upon proper notification to you. You may want to review our Privacy Program periodically for changes by accessing the link on our homepage: www.eatonvance.com. |
Our pledge of protecting your personal information applies to the following entities within the Eaton Vance organization: the Eaton Vance Family of Funds, Eaton Vance Management, Eaton Vance Investment Counsel, Eaton Vance Distributors, Inc., Eaton Vance Trust Company, Eaton Vance Management (International) Limited, Eaton Vance Advisers International Ltd., Eaton Vance Global Advisors Limited, Eaton Vance Management’s Real Estate Investment Group, Boston Management and Research, Calvert Research and Management, and Calvert Funds. This Privacy Notice supersedes all previously issued privacy disclosures. For more information about our Privacy Program or about how your personal information may be used, please call 1-800-262-1122.
Delivery of Shareholder Documents. The Securities and Exchange Commission (SEC) permits funds to deliver only one copy of shareholder documents, including prospectuses, proxy statements and shareholder reports, to fund investors with multiple accounts at the same residential or post office box address. This practice is often called “householding” and it helps eliminate duplicate mailings to shareholders. Eaton Vance, or your financial intermediary, may household the mailing of your documents indefinitely unless you instruct Eaton Vance, or your financial intermediary, otherwise. If you would prefer that your Eaton Vance documents not be householded, please contact Eaton Vance at 1-800-262-1122, or contact your financial intermediary. Your instructions that householding not apply to delivery of your Eaton Vance documents will typically be effective within 30 days of receipt by Eaton Vance or your financial intermediary.
Portfolio Holdings. Each Eaton Vance Fund and its underlying Portfolio(s) (if applicable) files a schedule of portfolio holdings on Part F to Form N-PORT with the SEC. Certain information filed on Form N-PORT may be viewed on the Eaton Vance website at www.eatonvance.com, by calling Eaton Vance at 1-800-262-1122 or in the EDGAR database on the SEC’s website at www.sec.gov.
Proxy Voting. From time to time, funds are required to vote proxies related to the securities held by the funds. The Eaton Vance Funds or their underlying Portfolios (if applicable) vote proxies according to a set of policies and procedures approved by the Funds’ and Portfolios’ Boards. You may obtain a description of these policies and procedures and information on how the Funds or Portfolios voted proxies relating to portfolio securities during the most recent 12-month period ended June 30, without charge, upon request, by calling 1-800-262-1122 and by accessing the SEC’s website at www.sec.gov.
Investment Adviser
Boston Management and Research
Two International Place
Boston, MA 02110
Administrator
Eaton Vance Management
Two International Place
Boston, MA 02110
Principal Underwriter*
Eaton Vance Distributors, Inc.
Two International Place
Boston, MA 02110
(617) 482-8260
Custodian
State Street Bank and Trust Company
State Street Financial Center, One Lincoln Street
Boston, MA 02111
Transfer Agent
BNY Mellon Investment Servicing (US) Inc.
Attn: Eaton Vance Funds
P.O. Box 9653
Providence, RI 02940-9653
(800) 262-1122
Independent Registered Public Accounting Firm
Deloitte & Touche LLP
200 Berkeley Street
Boston, MA 02116-5022
Fund Offices
Two International Place
Boston, MA 02110
| * | FINRA BrokerCheck. Investors may check the background of their Investment Professional by contacting the Financial Industry Regulatory Authority (FINRA). FINRA BrokerCheck is a free tool to help investors check the professional background of current and former FINRA-registered securities firms and brokers. FINRA BrokerCheck is available by calling 1-800-289-9999 and at www.FINRA.org. The FINRA BrokerCheck brochure describing this program is available to investors at www.FINRA.org. |

445 8.31.20
The registrant (sometimes referred to as the “Fund”) has adopted a code of ethics applicable to its Principal Executive Officer, Principal Financial Officer and Principal Accounting Officer. The registrant undertakes to provide a copy of such code of ethics to any person upon request, without charge, by calling 1-800-262-1122. The registrant has not amended the code of ethics as described in Form N-CSR during the period covered by this report. The registrant has not granted any waiver, including an implicit waiver, from a provision of the code of ethics as described in Form N-CSR during the period covered by this report.
| Item 3. | Audit Committee Financial Expert |
The registrant’s Board of Trustees (the “Board”) has designated George J. Gorman and William H. Park, each an independent trustee, as audit committee financial experts. Mr. Gorman is a certified public accountant who is the Principal at George J. Gorman LLC (a consulting firm). Previously, Mr. Gorman served in various capacities at Ernst & Young LLP (a registered public accounting firm), including as Senior Partner. Mr. Gorman also has experience serving as an independent trustee and audit committee financial expert of other mutual fund complexes. Mr. Park is a certified public accountant who is a private investor. Previously, he served as a consultant, as the Chief Financial Officer of Aveon Group, L.P. (an investment management firm), as the Vice Chairman of Commercial Industrial Finance Corp. (specialty finance company), as President and Chief Executive Officer of Prizm Capital Management, LLC (investment management firm), as Executive Vice President and Chief Financial Officer of United Asset Management Corporation (an institutional investment management firm) and as a Senior Manager at Price Waterhouse (now PricewaterhouseCoopers) (a registered public accounting firm).
| Item 4. | Principal Accountant Fees and Services |
Eaton Vance Georgia Municipal Income Fund, Eaton Vance Maryland Municipal Income Fund, Eaton Vance Missouri Municipal Income Fund, Eaton Vance North Carolina Municipal Income Fund, Eaton Vance Oregon Municipal Income Fund, Eaton Vance South Carolina Municipal Income Fund and Eaton Vance Virginia Municipal Income Fund (the “Fund(s)”) are series of Eaton Vance Municipals Trust (the “Trust”), a Massachusetts business trust, which, including the Funds, contains a total of 18 series (the “Series”). The Trust is registered under the Investment Company Act of 1940 as an open-end management investment company. This Form N-CSR relates to the Funds’ annual reports.
(a)–(d)
The following tables present the aggregate fees billed to each Fund for the Funds’ fiscal years ended August 31, 2019 and August 31, 2020 by the registrant’s principal accountant, Deloitte & Touche LLP (“D&T”), for professional services rendered for the audit of the Funds’ annual financial statements and fees billed for other services rendered by D&T during those periods.
Eaton Vance Georgia Municipal Income Fund
| | | | | | | | |
Fiscal Years Ended | | 8/31/19 | | | 8/31/20 | |
Audit Fees | | $ | 37,350 | | | $ | 37,350 | |
Audit-Related Fees(1) | | $ | 0 | | | $ | 0 | |
Tax Fees(2) | | $ | 10,332 | | | $ | 7,822 | |
All Other Fees(3) | | $ | 0 | | | $ | 0 | |
| | | | | | | | |
Total | | $ | 47,682 | | | $ | 45,172 | |
| | | | | | | | |
Eaton Vance Maryland Municipal Income Fund
| | | | | | | | |
Fiscal Years Ended | | 8/31/19 | | | 8/31/20 | |
Audit Fees | | $ | 37,600 | | | $ | 36,550 | |
Audit-Related Fees(1) | | $ | 0 | | | $ | 0 | |
Tax Fees(2) | | $ | 10,225 | | | $ | 7,715 | |
All Other Fees(3) | | $ | 0 | | | $ | 0 | |
| | | | | | | | |
Total | | $ | 47,825 | | | $ | 44,265 | |
| | | | | | | | |
Eaton Vance Missouri Municipal Income Fund
| | | | | | | | |
Fiscal Years Ended | | 8/31/19 | | | 8/31/20 | |
Audit Fees | | $ | 36,800 | | | $ | 36,800 | |
Audit-Related Fees(1) | | $ | 0 | | | $ | 0 | |
Tax Fees(2) | | $ | 9,442 | | | $ | 8,132 | |
All Other Fees(3) | | $ | 0 | | | $ | 0 | |
| | | | | | | | |
Total | | $ | 46,242 | | | $ | 44,932 | |
| | | | | | | | |
Eaton Vance North Carolina Municipal Income Fund
| | | | | | | | |
Fiscal Years Ended | | 8/31/19 | | | 8/31/20 | |
Audit Fees | | $ | 38,300 | | | $ | 37,675 | |
Audit-Related Fees(1) | | $ | 0 | | | $ | 0 | |
Tax Fees(2) | | $ | 10,214 | | | $ | 8,904 | |
All Other Fees(3) | | $ | 0 | | | $ | 0 | |
| | | | | | | | |
Total | | $ | 48,514 | | | $ | 46,579 | |
| | | | | | | | |
Eaton Vance Oregon Municipal Income Fund
| | | | | | | | |
Fiscal Years Ended | | 8/31/19 | | | 8/31/20 | |
Audit Fees | | $ | 37,900 | | | $ | 37,475 | |
Audit-Related Fees(1) | | $ | 0 | | | $ | 0 | |
Tax Fees(2) | | $ | 9,604 | | | $ | 7,094 | |
All Other Fees(3) | | $ | 0 | | | $ | 0 | |
| | | | | | | | |
Total | | $ | 47,504 | | | $ | 44,569 | |
| | | | | | | | |
Eaton Vance South Carolina Municipal Income Fund
| | | | | | | | |
Fiscal Years Ended | | 8/31/19 | | | 8/31/20 | |
Audit Fees | | $ | 38,100 | | | $ | 37,050 | |
Audit-Related Fees(1) | | $ | 0 | | | $ | 0 | |
Tax Fees(2) | | $ | 10,214 | | | $ | 7,704 | |
All Other Fees(3) | | $ | 0 | | | $ | 0 | |
| | | | | | | | |
Total | | $ | 48,314 | | | $ | 44,754 | |
| | | | | | | | |
Eaton Vance Virginia Municipal Income Fund
| | | | | | | | |
Fiscal Years Ended | | 8/31/19 | | | 8/31/20 | |
Audit Fees | | $ | 36,350 | | | $ | 37,400 | |
Audit-Related Fees(1) | | $ | 0 | | | $ | 0 | |
Tax Fees(2) | | $ | 9,442 | | | $ | 6,932 | |
All Other Fees(3) | | $ | 0 | | | $ | 0 | |
| | | | | | | | |
Total | | $ | 45,792 | | | $ | 44,332 | |
| | | | | | | | |
| (1) | Audit-related fees consist of the aggregate fees billed for assurance and related services that are reasonably related to the performance of the audit of the registrant’s financial statements and are not reported under the category of audit fees. |
| (2) | Tax fees consist of the aggregate fees billed for professional services rendered by the principal accountant relating to tax compliance, tax advice, and tax planning and specifically include fees for tax return preparation and other related tax compliance/planning matters. |
| (3) | All other fees consist of the aggregate fees billed for products and services provided by the principal accountant other than audit, audit-related, and tax services. |
The Series comprising the Trust have varying fiscal year ends (July 31, August 31, and September 30). The following table presents the aggregate audit, audit-related, tax, and other fees billed to all of the Series in the Trust by D&T for the last two fiscal years of each Series.
| | | | | | | | | | | | | | | | | | | | | | | | |
Fiscal Years Ended | | 9/30/18 | | | 7/31/19 | | | 8/31/19 | | | 9/30/19 | | | 7/31/20 | | | 8/31/20 | |
Audit Fees | | $ | 289,136 | | | $ | 258,700 | | | $ | 262,400 | | | $ | 295,750 | | | $ | 278,575 | | | $ | 260,300 | |
Audit-Related Fees(1) | | $ | 0 | | | $ | 0 | | | $ | 0 | | | $ | 0 | | | $ | 0 | | | $ | 0 | |
Tax Fees(2) | | $ | 66,534 | | | $ | 56,963 | | | $ | 69,473 | | | $ | 64,533 | | | $ | 41,903 | | | $ | 54,303 | |
All Other Fees(3) | | $ | 0 | | | $ | 0 | | | $ | 0 | | | $ | 0 | | | $ | 0 | | | $ | 0 | |
| | | | | | | | | | | | | | | | | | | | | | | | |
Total | | $ | 355,670 | | | $ | 315,663 | | | $ | 331,873 | | | $ | 360,283 | | | $ | 320,478 | | | $ | 314,603 | |
| | | | | | | | | | | | | | | | | | | | | | | | |
| (1) | Audit-related fees consist of the aggregate fees billed for assurance and related services that are reasonably related to the performance of the audit of the registrant’s financial statements and are not reported under the category of audit fees. Includes consent fee for N-14 registration statements related to fund mergers. |
| (2) | Tax fees consist of the aggregate fees billed for professional services rendered by the principal accountant relating to tax compliance, tax advice, and tax planning and specifically include fees for tax return preparation and other related tax compliance/planning matters. |
| (3) | All other fees consist of the aggregate fees billed for products and services provided by the principal accountant other than audit, audit-related, and tax services. |
(e)(1) The registrant’s audit committee has adopted policies and procedures relating to the pre-approval of services provided by the registrant’s principal accountant (the “Pre-Approval Policies”). The Pre-Approval Policies establish a framework intended to assist the audit committee in the proper discharge of its pre-approval responsibilities. As a general matter, the Pre-Approval Policies (i) specify certain types of audit, audit-related, tax, and other services determined to be pre-approved by the audit committee; and (ii) delineate specific procedures governing the mechanics of the pre-approval process, including the approval and monitoring of audit and non-audit service fees. Unless a service is specifically pre-approved under the Pre-Approval Policies, it must be separately pre-approved by the audit committee.
The Pre-Approval Policies and the types of audit and non-audit services pre-approved therein must be reviewed and ratified by the registrant’s audit committee at least annually. The registrant’s audit committee maintains full responsibility for the appointment, compensation, and oversight of the work of the registrant’s principal accountant.
(e)(2) No services described in paragraphs (b)-(d) above were approved by the registrant’s audit committee pursuant to the “de minimis exception” set forth in Rule 2-01(c)(7)(i)(C) of Regulation S-X.
(f) Not applicable.
(g) The following table presents (i) the aggregate non-audit fees (i.e., fees for audit-related, tax, and other services) billed for services rendered to all of the Series in the Trust by D&T for the last two fiscal years of each Series; and (ii) the aggregate non-audit fees (i.e., fees for audit-related, tax, and other services) billed for services rendered to the Eaton Vance organization by D&T for the last two fiscal years of each Series.
| | | | | | | | | | | | | | | | | | | | | | | | |
Fiscal Years Ended | | 9/30/18 | | | 7/31/19 | | | 8/31/19 | | | 9/30/19 | | | 7/31/20 | | | 8/31/20 | |
Registrant(1) | | $ | 66,534 | | | $ | 56,963 | | | $ | 69,473 | | | $ | 64,533 | | | $ | 41,903 | | | $ | 54,303 | |
Eaton Vance(2) | | $ | 126,485 | | | $ | 60,130 | | | $ | 8,000 | | | $ | 59,903 | | | $ | 51,800 | | | $ | 51,800 | |
| (1) | Includes all of the Series in the Trust. |
| (2) | The investment adviser to the Series, as well as any of its affiliates that provide ongoing services to the Series, are subsidiaries of Eaton Vance Corp. |
(h) The registrant’s audit committee has considered whether the provision by the registrant’s principal accountant of non-audit services to the registrant’s investment adviser and any entity controlling, controlled by, or under common control with the adviser that provides ongoing services to the registrant that were not pre-approved pursuant to Rule 2-01(c)(7)(ii) of Regulation S-X is compatible with maintaining the principal accountant’s independence.
| Item 5. | Audit Committee of Listed Registrants |
Not applicable.
| Item 6. | Schedule of Investments |
Please see schedule of investments contained in the Report to Stockholders included under Item 1 of this Form N-CSR.
| Item 7. | Disclosure of Proxy Voting Policies and Procedures for Closed-End Management Investment Companies |
Not applicable.
| Item 8. | Portfolio Managers of Closed-End Management Investment Companies |
Not applicable.
| Item 9. | Purchase of Equity Securities by Closed-End Management Investment Company and Affiliated Purchases |
Not applicable.
| Item 10. | Submission of Matters to a Vote of Security Holders |
No material changes.
| Item 11. | Controls and Procedures |
(a) It is the conclusion of the registrant’s principal executive officer and principal financial officer that the effectiveness of the registrant’s current disclosure controls and procedures (such disclosure controls and procedures having been evaluated within 90 days of the date of this filing) provide reasonable assurance that the information required to be disclosed by the registrant has been recorded, processed, summarized and reported within the time period specified in the Commission’s rules and forms and that the information required to be disclosed by the registrant has been accumulated and communicated to the registrant’s principal executive officer and principal financial officer in order to allow timely decisions regarding required disclosure.
(b) There have been no changes in the registrant’s internal controls over financial reporting during the period covered by this report that has materially affected, or is reasonably likely to materially affect, the registrant’s internal control over financial reporting.
| Item 12. | Disclosure of Securities Lending Activities for Closed-End Management Investment Companies |
Not applicable.
| (a)(1) | Registrant’s Code of Ethics – Not applicable (please see Item 2). |
Signatures
Pursuant to the requirements of the Securities Exchange Act of 1934 and the Investment Company Act of 1940, the registrant has duly caused this report to be signed on its behalf by the undersigned, thereunto duly authorized.
| | |
| Eaton Vance Municipals Trust |
| |
| By: | | /s/ Payson F. Swaffield |
| | Payson F. Swaffield |
| | President |
| |
| Date: | | October 26, 2020 |
Pursuant to the requirements of the Securities Exchange Act of 1934 and the Investment Company Act of 1940, this report has been signed below by the following persons on behalf of the registrant and in the capacities and on the dates indicated.
| | |
| By: | | /s/ James F. Kirchner |
| | James F. Kirchner |
| | Treasurer |
| |
| Date: | | October 26, 2020 |
| |
| By: | | /s/ Payson F. Swaffield |
| | Payson F. Swaffield |
| | President |
| |
| Date: | | October 26, 2020 |