UNITED STATES
SECURITIES AND EXCHANGE COMMISSION
Washington, D.C. 20549
FORM N-CSR
CERTIFIED SHAREHOLDER REPORT OF REGISTERED
MANAGEMENT INVESTMENT COMPANIES
| | |
| Investment Company Act file number: | | 811-04438 |
| |
| Exact name of registrant as specified in charter: | | Aberdeen Australia Equity Fund, Inc. |
| |
| Address of principal executive offices: | | 1735 Market Street, 32nd Floor |
| | Philadelphia, PA 19103 |
| |
| Name and address of agent for service: | | Ms. Andrea Melia |
| | Aberdeen Asset Management Inc. |
| | 1735 Market Street 32nd Floor |
| | Philadelphia, PA 19103 |
| |
| Registrant’s telephone number, including area code: | | 866-839-5205 |
| |
| Date of fiscal year end: | | October 31 |
| |
| Date of reporting period: | | April 30, 2013 |
Item 1 – Reports to Stockholders
Aberdeen Australia Equity Fund, Inc.
Semi-Annual Report
April 30, 2013
Managed Distribution Policy (unaudited)
The Board of Directors of the Fund has authorized a managed distribution policy (“MDP”) of paying quarterly distributions at an annual rate, set once a year, that is a percentage of the rolling average of the Fund’s prior four quarter-end net asset values. With each distribution, the Fund will issue a notice to shareholders and an accompanying press release which will provide detailed information regarding the amount and composition of the distribution and other information required by the Fund’s MDP exemptive order. The Fund’s Board of Directors may amend or terminate the MDP at any time without prior notice to shareholders; however, at this time, there are no reasonably foreseeable circumstances that might cause the termination of the MDP. You should not draw any conclusions about the Fund’s investment performance from the amount of distributions or from the terms of the Fund’s MDP.
Distribution Disclosure Classification (unaudited)
The Fund’s policy is to provide investors with a stable distribution rate. Each quarterly distribution will be paid out of current income, supplemented by realized capital gains and, to the extent necessary, paid-in capital.
The Fund is subject to U.S. corporate, tax and securities laws. Under U.S. tax rules, the amount applicable to the Fund and character of distributable income for each fiscal period depends on the actual exchange rates during the entire year between the U.S. Dollar and the currencies in which Fund assets are denominated and on the aggregate gains and losses realized by the Fund during the entire year.
Therefore, the exact amount of distributable income for each fiscal year can only be determined as of the end of the Fund’s fiscal year, October 31. Under Section 19 of the Investment Company Act of 1940, as amended (the “1940 Act”), the Fund is required to indicate the sources of certain distributions to shareholders. The estimated distribution composition may vary from quarter to quarter because it may be materially impacted by future income, expenses and realized gains and losses on securities and fluctuations in the value of the currencies in which Fund assets are denominated.
Based on generally accepted accounting principles, the Fund estimates that distributions for the fiscal year commenced November 1, 2012, including the distribution paid on April 12, 2013, consisted of 31% net investment income, 1% net realized short-term capital gains and 68% net realized long-term capital gains.
In January 2014, a Form 1099-DIV will be sent to shareholders, which will state the amount and composition of distributions and provide information with respect to their appropriate tax treatment for the 2013 calendar year.
Dividend Reinvestment and Direct Stock Purchase Plan (unaudited)
Computershare Trust Company, N.A., the Fund’s transfer agent, sponsors and administers a Dividend Reinvestment and Direct Stock Purchase Plan (the “Plan”), which is available to shareholders.
The Plan allows registered stockholders and first time investors to buy and sell shares and automatically reinvest dividends and capital gains through the transfer agent. This is a cost-effective way to invest in the Fund.
Please note that for both purchases and reinvestment purposes, shares will be purchased in the open market at the current share price and cannot be issued directly by the Fund.
For more information about the Plan and a brochure that includes the terms and conditions of the Plan, please call Computershare at 1-800-647-0584 or visit www.computershare.com/buyaberdeen.
Letter to Shareholders (unaudited)
Dear Shareholder,
We present this Semi-Annual Report which covers the activities of Aberdeen Australia Equity Fund, Inc. (the “Fund”) for the six months ended April 30, 2013. The Fund’s principal investment objective is long-term capital appreciation through investment primarily in equity securities of Australian companies listed on the Australian Stock Exchange Limited. The Fund’s secondary investment objective is current income, which is expected to be derived primarily from dividends and interest on Australian corporate and governmental securities.
Total Return Performance
The Fund’s total return, based on net asset value (“NAV”), net of fees was 10.6% for the six months ended April 30, 2013 and 8.7% per annum since inception, assuming the reinvestment of dividends and distributions, compared to the April 30, 2013 six-month period return of 17.5%, in U.S. Dollar terms, for the S&P/ASX 200 Accumulation Index (“ASX 200”), the Fund’s benchmark. The Fund’s total return for the six-month period is based on the reported NAV on April 30, 2013.
Share Price and NAV
For the six months ended April 30, 2013, based on market price, the Fund’s total return was 8.9%, assuming reinvestment of dividends and distributions. The Fund’s share price increased by 4.0% over the six-month period, from $10.38 on October 31, 2012 to $10.80 on April 30, 2013. The Fund’s share price on April 30, 2013 represented a premium of 2.5% to the NAV per share of $10.54 on that date, compared with a premium of 4.0% to the NAV per share of $9.98 on October 31, 2012.
Managed Distribution Policy
The Fund has a managed distribution policy of paying quarterly distributions at an annual rate, set once a year, that is a percentage of the rolling average of the Fund’s prior four quarter-end net asset values. In March 2013, the Board of Directors of the Fund (the “Board”) determined the rolling distribution rate to be 10% for the 12-month period commencing with the distribution payable in April 2013. This policy will be subject to regular review by the Board. The distributions will be made from current income, supplemented by realized capital gains and, to the extent necessary, paid-in capital, which is a non-taxable return of capital.
On June 11, 2013, the Fund announced that it will pay on July 12, 2013 a distribution of US $0.26 per share to all shareholders of record as of June 28, 2013.
Open Market Repurchase Program
The Fund’s policy is generally to buy back Fund shares on the open market when the Fund trades at certain discounts to NAV. During the six months ended April 30, 2013 and fiscal year ended October 31, 2012, the Fund did not repurchase any shares.
Portfolio Holdings Disclosure
The Fund files its complete schedule of portfolio holdings with the SEC for the first and third quarters of each fiscal year on Form N-Q. The Fund’s Form N-Q filings are available on the SEC’s website at http://www.sec.gov and may be reviewed and copied at the SEC’s Public Reference Room in Washington, D.C. Information about the operation of the Public Reference Room may be obtained by calling 1-800-SEC-0330. The Fund makes the information on Form N-Q available to shareholders on the Fund’s website or upon request and without charge by calling Investor Relations toll-free at 1-866-839-5205.
Proxy Voting
A description of the policies and procedures that the Fund uses to determine how to vote proxies relating to portfolio securities, and information regarding how the Fund voted proxies relating to portfolio securities during the most recent twelve months ended June 30 is available by August 30 of the relevant year: (i) upon request and without charge by calling Investor Relations toll-free at 1-866-839-5205; and (ii) on the SEC’s website at http://www.sec.gov.
Investor Relations Information
As part of our ongoing commitment to provide information to our shareholders, I invite you to visit the Fund on the web at www.aberdeeniaf.com. From this page, you can view monthly fact sheets, portfolio manager commentary, distribution and performance information, updated daily fact sheets courtesy of Morningstar®, conduct portfolio charting and other timely data.
Please take a look at Aberdeen’s award-winning Closed-End Fund Talk Channel, where you can watch fund manager web casts and view our latest short films. For replays of recent broadcasts or to register for upcoming events, please visit Aberdeen’s Closed-End Fund Talk Channel at www.aberdeen-asset.us/aam.nsf/usClosed/aberdeentv.
Please ensure that you are enrolled in our email services, which feature timely news from Aberdeen portfolio managers located around the world. Enroll today at www.aberdeen-asset.us/aam.nsf/usclosed/email and be among the first to receive the latest closed-end fund news, announcements of upcoming fund manager web casts, films and other information.
Aberdeen Australia Equity Fund, Inc.
1
Letter to Shareholders (unaudited) (concluded)
Please contact Aberdeen Asset Management Inc. by:
| • | | calling toll free at 1-866-839-5205 in the United States, or |
| • | | emailing InvestorRelations@aberdeen-asset.com |
| • | | visiting www.aberdeeniaf.com |
Yours sincerely,

Christian Pittard
President
All amounts are U.S Dollars unless otherwise stated.
Aberdeen Australia Equity Fund, Inc.
2
Report of the Investment Manager (unaudited)
Market/Economic Review
Australian equities rose during the six-month period ended April 30, 2013. Generally, positive domestic economic and corporate earnings news bolstered market sentiment, along with the U.S. Federal Reserve’s decision to expand its bond-buying program. However, gains were pared by renewed Eurozone debt problems and investor fears over moderating Chinese economic growth, which could curtail activity across Australia’s mining sector. In an effort to boost growth in the non-mining sectors, the Reserve Bank of Australia lowered the key official cash rate1 by 25 basis points to 3.0% in December 2012. Thereafter, the central bank kept rates steady as the economy recorded a healthy expansion of 3.1% in the calendar year 2012. In politics, Prime Minister Julia Gillard called for elections on September 14, 2013. She later reshuffled the cabinet after a round of terminations and resignations following a failed coup to unseat her.
Fund Performance Review
The Fund’s holdings in UK exchange-listed BHP Billiton and Rio Tinto were the primary detractors from the relative performance for the reporting period. The miners’ earnings declined in line with our expectations on the back of lower commodity prices and impairment charges arising from earlier acquisitions. While not ideal, we continue to like both companies as we believe they have good management, were focused on cost controls during the downturn, and own high-quality mines.
For the same reason, the absence of exposure to the Australian market listing of BHP Billiton was the largest contributor to Fund’s relative return for the period. Additionally, the substantial overweight to Australian Securities Exchange (ASX) bolstered performance as the securities exchange operator’s profits were lifted by the country’s improving economic outlook and increased trading activity, despite intense competition from rival exchanges.
Outlook
Shortly after the end of the reporting period, the Australian central bank cut its benchmark interest rate to 2.75% in a bid to stimulate manufacturing, housing and other sectors of the economy outside of natural resources. This comes on the back of lower commodity prices, weakening revenue growth and investor worries that economic expansion would falter. Further complicating the outlook, in our view, is the increased likelihood of additional spending cuts and tax hikes given concerns that the federal budget would remain in deficit for much longer than earlier anticipated. Nonetheless, compared with economies in the U.S. and Europe, we feel that Australia has performed relatively well. Price cuts have supported consumer spending and unemployment is manageable, in our view. We believe that markets could also remain supported in the near term as the world’s major central banks maintain their expansionary monetary policies.
Aberdeen Asset Management Asia Limited
| 1 | | The official cash rate is the rate of interest which the Reserve Bank of Australia charges on overnight loans to commercial banks. |
Aberdeen Australia Equity Fund, Inc.
3
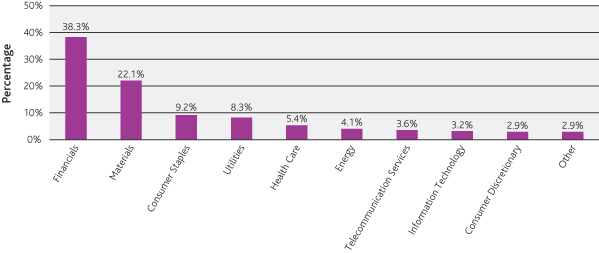
Portfolio Composition (unaudited)
The following chart summarizes the composition of the Fund’s portfolio, in Standard & Poor’s Industry Classification Standard (“GICS”) sectors, expressed as a percentage of net assets. The GICS structure consists of 10 sectors, 23 industry groups, 59 industries and 122 sub-industries. The Fund may invest between 25% and 35% of its total assets in the securities of any one industry group if, at the time of investment, that industry group represents 20% or more of the ASX 200. As of April 30, 2013, the Fund did not have more than 25% of its assets invested in any industry group.
As of April 30, 2013, the Fund held 97.1% of its net assets in equities, 1.3% in short-term investments and 1.6% in other assets in excess of liabilities.
Asset Allocation as of April 30, 2013
by Standard & Poor’s Global Industry Classification Standard Sectors
Top Ten Equity Holdings (unaudited)
The following were the Fund’s top ten holdings as of April 30, 2013:
| | | | |
| Name of Security | | Percentage of Net Assets | |
BHP Billiton PLC—London Listing | | | 9.8% | |
Australia & New Zealand Banking Group Ltd. | | | 7.5% | |
Rio Tinto PLC—London Listing | | | 6.8% | |
Commonwealth Bank of Australia | | | 6.6% | |
QBE Insurance Group Ltd. | | | 5.9% | |
Woolworths Ltd. | | | 5.4% | |
AMP Ltd. | | | 4.9% | |
Westfield Group Ltd. | | | 4.6% | |
Westpac Banking Corp. Ltd. | | | 4.5% | |
SP AusNet | | | 4.3% | |
Aberdeen Australia Equity Fund, Inc.
4
Average Annual Returns (unaudited)
April 30, 2013
The following table summarizes Fund performance compared to the S&P/ASX 200 Accumulation Index (“ASX 200”), the Fund’s benchmark, for the 1-year, 3-year, 5-year and 10-year periods as of April 30, 2013.
| | | | | | | | | | | | | | | | |
| | | 1 Year | | | 3 Years | | | 5 Years | | | 10 Years | |
Net Asset Value (NAV) | | | 16.4% | | | | 7.5% | | | | 3.1% | | | | 14.2% | |
Market Value | | | 7.9% | | | | 6.9% | | | | 2.7% | | | | 16.5% | |
Benchmark | | | 23.3% | | | | 11.3% | | | | 5.1% | | | | 16.0% | |
Returns represent past performance. Total investment return at net asset value is based on changes in the net asset value of Fund shares and assumes reinvestment of dividends and distributions, if any, at market prices pursuant to the dividend reinvestment program sponsored by the Fund’s transfer agent. Total investment return at market value is based on changes in the market price at which the Fund’s shares traded on the NYSE MKT during the period and assumes reinvestment of dividends and distributions, if any, at market prices pursuant to the dividend reinvestment program sponsored by the Fund’s transfer agent. Because the Fund’s shares trade in the stock market based on investor demand, the Fund may trade at a price higher or lower than its NAV. Therefore, returns are calculated based on both market price and NAV. The Fund’s total return for the six-month period is based on the reported NAV on April 30, 2013. Past performance is no guarantee of future results. The performance information provided does not reflect the deduction of taxes that a shareholder would pay on distributions received from the Fund. The current performance of the Fund may be lower or higher than the figures shown. The Fund’s yield, return, market price and NAV will fluctuate. Performance information current to the most recent month-end is available by calling 866-839-5205.
The net operating expense ratio is 1.32%.
Aberdeen Australia Equity Fund, Inc.
5
Portfolio of Investments (unaudited)
As of April 30, 2013
| | | | | | | | |
| Shares | | | Description | | Value (US$) | |
| | | | | | | | |
| LONG-TERM INVESTMENTS—97.1%* | |
| COMMON STOCKS—97.1% | |
| CONSUMER DISCRETIONARY—2.9% | |
| | 1,107,000 | | | David Jones Ltd. | | $ | 3,421,772 | |
| | 1,050,400 | | | Tatts Group Ltd. | | | 3,562,126 | |
| | | | | 6,983,898 | |
| CONSUMER STAPLES—9.2% | |
| | 575,100 | | | Coca-Cola Amatil Ltd. | | | 9,034,579 | |
| | 342,900 | | | Woolworths Ltd. | | | 12,951,073 | |
| | | | | 21,985,652 | |
| ENERGY—4.1% | |
| | 125,700 | | | Woodside Petroleum Ltd. | | | 4,904,021 | |
| | 206,400 | | | WorleyParsons Ltd. | | | 4,879,644 | |
| | | | | 9,783,665 | |
| FINANCIALS—38.3% | |
| | 2,053,000 | | | AMP Ltd. | | | 11,506,294 | |
| | 538,650 | | | Australia & New Zealand Banking Group Ltd. | | | 17,800,885 | |
| | 259,900 | | | Australian Stock Exchange Ltd. | | | 10,133,425 | |
| | 206,400 | | | Commonwealth Bank of Australia | | | 15,731,986 | |
| | 1,015,900 | | | QBE Insurance Group Ltd. | | | 14,099,625 | |
| | 911,500 | | | Westfield Group Ltd. | | | 11,025,636 | |
| | 306,200 | | | Westpac Banking Corp. Ltd. | | | 10,741,505 | |
| | | | | 91,039,356 | |
| HEALTH CARE—5.4% | |
| | 64,400 | | | Cochlear Ltd. | | | 4,409,888 | |
| | 127,500 | | | CSL Ltd. | | | 8,332,493 | |
| | | | | 12,742,381 | |
| INFORMATION TECHNOLOGY—3.2% | |
| | 737,700 | | | Computershare Ltd. | | | 7,599,420 | |
| MATERIALS—22.1% | |
| | 828,100 | | | BHP Billiton PLC—London Listing | | | 23,296,754 | |
| | 1,323,400 | | | Incitec Pivot Ltd. | | | 3,970,926 | |
| | 261,500 | | | Newcrest Mining Ltd. | | | 4,581,063 | |
| | 199,700 | | | Orica Ltd. | | | 4,735,547 | |
| | 351,100 | | | Rio Tinto PLC—London Listing | | | 16,122,539 | |
| | | | | 52,706,829 | |
| TELECOMMUNICATION SERVICES—3.6% | |
| | 2,655,300 | | | Singapore Telecommunications Ltd. | | | 8,455,124 | |
| UTILITIES—8.3% | |
| | 573,000 | | | AGL Energy Ltd. | | | 9,435,219 | |
| | 7,926,500 | | | SP AusNet | | | 10,315,234 | |
| | | | | 19,750,453 | |
| | | | | Total Long-Term Investments—97.1% (cost $190,312,703) | | | 231,046,778 | |
See Notes to Financial Statements.
Aberdeen Australia Equity Fund, Inc.
6
Portfolio of Investments (unaudited) (concluded)
As of April 30, 2013
| | | | | | | | |
Par
Amount | | | Description | | Value (US$) | |
| SHORT-TERM INVESTMENT—1.3% | |
| | $ 3,215,000 | | | Repurchase Agreement, State Street Bank & Trust Co.,
0.04% dated 04/30/2013, due 05/01/2013 in the amount of $3,215,004 collateralized by
U.S. Treasury Note, 0.50%, maturing 07/31/2017; total market value of $3,280,446 | | $ | 3,215,000 | |
| | | | | Total Short-Term Investment—1.3% (cost $3,215,000) | | | 3,215,000 | |
| | | | | Total Investments—98.4% (cost $193,527,703) | | | 234,261,778 | |
| | |
| | | | | Other Assets in Excess of Liabilities—1.6% | | | 3,761,022 | |
| | | | | Net Assets—100.0% | | $ | 238,022,800 | |
| * | | Fair Valued Security. Fair Values are determined pursuant to procedures approved by the Board of Directors. See Note 2(a) of the accompanying notes to financial statements. |
See Notes to Financial Statements.
Aberdeen Australia Equity Fund, Inc.
7
Statement of Assets and Liabilities (unaudited)
As of April 30, 2013
| | | | |
Assets | | | | |
Investments, at value (cost $190,312,703) | | $ | 231,046,778 | |
Repurchase agreement, at value (cost $3,215,000) | | | 3,215,000 | |
Foreign currency, at value (cost $5,685,705) | | | 5,706,478 | |
Cash | | | 111 | |
Receivable for investments sold | | | 1,168,530 | |
Interest and dividends receivable | | | 193,958 | |
Prepaid expenses in connection with the at-the-market stock offering | | | 152,559 | |
Prepaid expenses | | | 697 | |
Total assets | | | 241,484,111 | |
| |
Liabilities | | | | |
Payable for investments purchased | | | 3,071,907 | |
Investment management fees payable (Note 3) | | | 168,342 | |
Investor relations fees payable (Note 3) | | | 45,215 | |
Administration fees payable (Note 3) | | | 16,233 | |
Director fees payable | | | 10,108 | |
Other | | | 149,506 | |
Total liabilities | | | 3,461,311 | |
| | | | | |
Net Assets | | $ | 238,022,800 | |
| |
Composition of Net Assets: | | | | |
Common stock (par value $.01 per share) | | $ | 225,741 | |
Paid-in capital in excess of par | | | 164,921,111 | |
Distributions in excess of net investment income | | | (9,166,504 | ) |
Accumulated net realized gain from investment transactions | | | 10,610,962 | |
Net unrealized appreciation on investments | | | 26,295,761 | |
Accumulated net realized foreign exchange gains | | | 30,689,035 | |
Net unrealized foreign exchange gains | | | 14,446,694 | |
Net Assets | | $ | 238,022,800 | |
Net asset value per common share based on 22,574,121 shares issued and outstanding | | $ | 10.54 | |
See Notes to Financial Statements.
Aberdeen Australia Equity Fund, Inc.
8
Statement of Operations (unaudited)
For the Six Months Ended April 30, 2013
| | | | |
Net Investment Income | | | | |
| |
Income | | | | |
Dividend income (net of foreign withholding taxes of $53,901) | | $ | 4,882,951 | |
Interest and other income | | | 43,315 | |
| | | | 4,926,266 | |
| |
Expenses | | | | |
Investment management fee (Note 3) | | | 953,911 | |
Directors’ fees and expenses | | | 131,730 | |
Administration fee (Note 3) | | | 92,016 | |
Investor relations fees and expenses (Note 3) | | | 77,537 | |
Reports to shareholders and proxy solicitation | | | 58,811 | |
Legal fees and expenses | | | 47,341 | |
Insurance expense | | | 44,540 | |
Independent auditors’ fees and expenses | | | 28,960 | |
Custodian’s fees and expenses | | | 23,726 | |
Transfer agent’s fees and expenses | | | 14,221 | |
Miscellaneous | | | 45,300 | |
Total expenses | | | 1,518,093 | |
| | | | | |
Net Investment Income | | | 3,408,173 | |
| |
Realized and Unrealized Gains/(Losses) on Investments and Foreign Currencies | | | | |
| |
Net realized gain/(loss) from: | | | | |
Investment transactions | | | 10,376,923 | |
Foreign currency transactions | | | 129,624 | |
| | | | 10,506,547 | |
| |
Net change in unrealized appreciation/(depreciation) on: | | | | |
Investments | | | 15,186,241 | |
Foreign currency translation | | | (5,025,802 | ) |
| | | | 10,160,439 | |
Net gain from investments and foreign currencies | | | 20,666,986 | |
Net Increase in Net Assets Resulting from Operations | | $ | 24,075,159 | |
See Notes to Financial Statements.
Aberdeen Australia Equity Fund, Inc.
9
Statements of Changes in Net Assets
| | | | | | | | |
| | | For the
Six Months
Ended
April 30, 2013
(unaudited) | | | For the
Year Ended
October 31,
2012 | |
| | |
Increase/(Decrease) in Net Assets | | | | | | | | |
| | |
Operations: | | | | | | | | |
Net investment income | | $ | 3,408,173 | | | $ | 7,582,857 | |
Net realized gain from investment transactions | | | 10,376,923 | | | | 19,758,990 | |
Net realized gain/(loss) from foreign currency transactions | | | 129,624 | | | | (38,938 | ) |
Net change in unrealized appreciation/depreciation on investments | | | 15,186,241 | | | | 6,177,944 | |
Net change in unrealized appreciation/depreciation on foreign currency translation | | | (5,025,802 | ) | | | (13,634,382 | ) |
Net increase in net assets resulting from operations | | | 24,075,159 | | | | 19,846,471 | |
| | |
Distributions to Shareholders from: | | | | | | | | |
Net investment income | | | (11,287,061 | ) | | | (15,968,371 | ) |
Net realized gains | | | — | | | | (8,411,680 | ) |
Net decrease in net assets from distributions | | | (11,287,061 | ) | | | (24,380,051 | ) |
| | |
Common Stock Transactions: | | | | | | | | |
Expenses in connection with the at-the-market stock offering (Note 5) | | | — | | | | 152,559 | |
Change in net assets from common stock transactions | | | — | | | | 152,559 | |
Change in net assets resulting from operations | | | 12,788,098 | | | | (4,381,021 | ) |
| | |
Net Assets: | | | | | | | | |
Beginning of period | | | 225,234,702 | | | | 229,615,723 | |
End of period (including distributions in excess of net investment income of ($9,166,504) and ($1,287,616), respectively) | | $ | 238,022,800 | | | $ | 225,234,702 | |
Amounts listed as “-” are $0 or round to $0.
See Notes to Financial Statements.
Aberdeen Australia Equity Fund, Inc.
10
Financial Highlights
| | | | | | | | | | | | | | | | | | | | | | | | |
| | |
| | | For the Six
Months Ended April 30, 2013
(unaudited) | | | For the Year Ended October 31, | |
| | | | 2012 | | | 2011 | | | 2010 | | | 2009 | | | 2008 | |
Per Share Operating Performance(a): | | | | | | | | | | | | | | | | | | | | |
| Net asset value, beginning of period | | | $9.98 | | | | $10.17 | | | | $11.58 | | | | $10.96 | | | | $8.37 | | | | $18.53 | |
| Net investment income | | | 0.15 | | | | 0.34 | | | | 0.39 | | | | 0.32 | | | | 0.29 | | | | 0.51 | |
| Net realized and unrealized gains/(losses) on investments and foreign currencies | | | 0.91 | | | | 0.54 | | | | (0.68 | ) | | | 1.31 | | | | 3.34 | | | | (8.83 | ) |
| Total from investment operations | | | 1.06 | | | | 0.88 | | | | (0.29 | ) | | | 1.63 | | | | 3.63 | | | | (8.32 | ) |
| Distributions from: | | | | | | | | | | | | | | | | | | | | | | | | |
| Net investment income | | | (0.50 | ) | | | (0.71 | ) | | | (0.52 | ) | | | (0.50 | ) | | | (0.31 | ) | | | (0.24 | ) |
| Net realized gains | | | – | | | | (0.37 | ) | | | (0.44 | ) | | | (0.06 | ) | | | – | | | | (0.84 | ) |
| Tax return of capital | | | – | | | | – | | | | (0.18 | ) | | | (0.45 | ) | | | (0.73 | ) | | | (0.76 | ) |
| Total distributions | | | (0.50 | ) | | | (1.08 | ) | | | (1.14 | ) | | | (1.01 | ) | | | (1.04 | ) | | | (1.84 | ) |
| Offering cost on common stock | | | – | | | | 0.01 | | | | (0.09 | ) | | | – | | | | – | | | | – | |
| Impact of shelf offering | | | – | | | | – | | | | 0.11 | | | | – | | | | – | | | | – | |
| Net asset value, end of period | | | $10.54 | | | | $9.98 | | | | $10.17 | | | | $11.58 | | | | $10.96 | | | | $8.37 | |
| Market value, end of period | | | $10.80 | | | | $10.38 | | | | $10.31 | | | | $12.70 | | | | $11.40 | | | | $8.60 | |
| | | | |
| Total Investment Return Based on(b): | | | | | | | | | | | | | | | | |
| Market value | | | 8.85% | | | | 11.83% | | | | (10.51% | ) | | | 21.62% | | | | 50.76% | | | | (45.57% | ) |
| Net asset value | | | 10.49% | (c) | | | 9.00% | (c) | | | (3.19% | ) | | | 15.35% | | | | 48.92% | | | | (47.83% | ) |
| Ratio to Average Net Assets/Supplementary Data: | | | | | | | | | | | | | | | | | | | | | | | | |
| Net assets, end of period (000 omitted) | | | $238,023 | | | | $225,235 | | | | $229,616 | | | | $223,173 | | | | $210,866 | | | | $160,886 | |
| Average net assets (000 omitted) | | | $231,948 | | | | $218,950 | | | | $244,946 | | | | $211,324 | | | | $163,795 | | | | $282,702 | |
| Net operating expenses | | | 1.32% | (d) | | | 1.33% | | | | 1.34% | | | | 1.39% | | | | 1.73% | | | | 1.26% | |
| Net investment income | | | 2.96% | (d) | | | 3.46% | | | | 3.43% | | | | 2.91% | | | | 3.41% | | | | 3.46% | |
| Portfolio turnover | | | 7% | | | | 21% | | | | 30% | | | | 11% | | | | 16% | | | | 22% | |
| (a) | | Based on average shares outstanding. |
| (b) | | Total investment return is calculated assuming a purchase of common stock on the opening of the first day and a sale on the closing of the last day of each period reported. Dividends and distributions, if any, are assumed, for purposes of this calculation, to be reinvested at prices obtained under the Fund’s dividend reinvestment plan. Total investment return does not reflect brokerage commissions. |
| (c) | | The total return includes the impact of financial statement rounding of the NAV per share. |
Amounts listed as “-” are $0 or round to $0.
See Notes to Financial Statements.
Aberdeen Australia Equity Fund, Inc.
11
Notes to Financial Statements (unaudited)
April 30, 2013
1. Organization
Aberdeen Australia Equity Fund, Inc. (the “Fund”) is a closed-end, non-diversified management investment company incorporated in Maryland on September 30, 1985. The Fund’s principal investment objective is long-term capital appreciation through investment primarily in equity securities of Australian companies listed on the Australian Stock Exchange Limited. Its secondary objective is current income, which is expected to be derived primarily from dividends and interest on Australian corporate and governmental securities. The Fund normally invests at least 80% of its net assets, plus the amount of any borrowings for investment purposes, in equity securities, consisting of common stock, preferred stock and convertible stock, of companies tied economically to Australia (each an “Australian Company”). This 80% investment policy is a non-fundamental policy of the Fund and may be changed by the Fund’s Board of Directors (the “Board”) upon 60 days’ prior written notice to shareholders. However, it is a fundamental policy of the Fund to normally invest at least 65% of its total assets in equity securities, consisting of common stock, preferred stock and convertible preferred stock, listed on the Australian Stock Exchange Limited (“ASX”). The Board established the following criteria for determining whether a company is tied economically to Australia for purposes of the 80% test (and therefore an Australian Company): whether the company (i) is a constituent of the ASX; (ii) has its headquarters located in Australia, (iii) pays dividends on its stock in Australian Dollars; (iv) has its accounts audited by Australian auditors; (v) is subject to Australian taxes levied by the Australian Taxation Office; (vi) holds its annual general meeting in Australia; (vii) has common stock/ordinary shares and/or other principal class of securities registered with Australian regulatory authorities for sale in Australia; (viii) is incorporated in Australia; or (ix) has a majority of its assets located in Australia or a majority of its revenues are derived from Australian sources. There can be no assurance that the Fund will achieve its investment objective.
2. Summary of Significant Accounting Policies
The following is a summary of significant accounting policies followed by the Fund in the preparation of its financial statements. The policies are in conformity with accounting principles generally accepted in the United States of America (“GAAP”). The preparation of financial statements requires management to make estimates and assumptions that affect the reported amounts of assets and liabilities, disclosure of contingent assets and liabilities at the date of the financial statements, and the reported amounts of income and expenses for the period. Actual results could differ from those estimates. The accounting records of the Fund are maintained in U.S. Dollars and the U.S. Dollar is used as both the functional and
reporting currency. However, the Australian Dollar is the functional currency for U.S. federal tax purposes.
(a) Security Valuation:
The Fund is required to value its securities at fair value, which is defined as the price that would be received to sell an asset or paid to transfer a liability in an orderly transaction between market participants at the measurement date.
Equity securities that are traded on an exchange are valued at the last quoted sale price on the principal exchange on which the security is traded at the “Valuation Time”, subject to application, when appropriate, of the fair valuation factors described in the paragraph below. The Valuation Time is as of the close of regular trading on the New York Stock Exchange (usually 4:00 p.m. Eastern Time). In the absence of a sale price, the security is valued at the mean of the bid/ask prices quoted at the close on the principal exchange on which the security is traded. Securities traded on NASDAQ are valued at the NASDAQ official closing price. A security using any of these pricing methodologies is determined as a Level 1 investment.
In addition, foreign equity securities that are traded on foreign exchanges that close prior to the Valuation Time are valued by applying fair valuation factors to the last sale price or the mean price as noted above. Fair valuation factors are provided by an independent pricing service provider. These factors are used when pricing the Fund’s portfolio holding to estimate market movements between the time foreign markets close and the time the Fund values such foreign securities. These factors are based on inputs such as depositary receipts, indices, futures, sector indices/ETFs, exchange rates, and local exchange opening and closing prices of each security. When the fair value prices are utilized, the value assigned to the foreign securities may not be the same as quoted or published prices of the securities on their primary markets. Fair valuation factors are not utilized if the pricing service is unable to provide a valuation factor or if the valuation factor falls below a predetermined threshold. A security that applies a fair valuation factor is determined as a Level 2 investment because the exchange-traded price has been adjusted.
In the event that a security’s market quotations are not readily available or are deemed unreliable, the fair value of a security is determined by the Fund’s Pricing Committee (which is appointed by the Board), taking into account the relevant factors and surrounding circumstances. A security that has been fair valued by the Pricing Committee may be classified as Level 2 or 3 depending on the nature of the inputs.
Aberdeen Australia Equity Fund, Inc.
12
Notes to Financial Statements (unaudited) (continued)
April 30, 2013
In accordance with the authoritative guidance on fair value measurements and disclosures under GAAP, the Fund discloses the fair value of its investments using a three-level hierarchy that classifies the inputs to valuation techniques used to measure the fair value. The hierarchy assigns Level 1 measurements to valuations based upon unadjusted quoted prices in active markets for identical assets, Level 2 measurements to valuations based upon adjusted quoted prices in active markets for identical assets, and Level 3 measurements to valuations based upon unobservable inputs that are significant to the valuation. Observable inputs are inputs that reflect the assumptions market participants would use in pricing the asset or liability, which are based on market data obtained from sources independent of the reporting entity. Unobservable inputs are inputs that reflect the reporting entity’s own assumptions about the assumptions market participants would use in pricing the asset or liability developed based on the best information available in the circumstances. A financial instrument’s level within the fair value hierarchy is based upon the lowest level of any input that is significant to the fair value measurement. The three-tier hierarchy of inputs is summarized below:
Level 1 – quoted prices in active markets for identical investments;
Level 2 – other significant observable inputs (including quoted prices for similar securities, interest rates, prepayment speeds, and credit risk); or
Level 3 – significant unobservable inputs (including the Fund’s own assumptions in determining the fair value of investments).
The following is a summary of the inputs used as of April 30, 2013 in valuing the Fund’s investments at fair value. The inputs or methodology used for valuing securities are not necessarily an indication of the risk associated with investing in those securities. Please refer to the Portfolio of Investments for a detailed breakout of the security types:
| | | | | | | | | | | | | | | | |
| Investments | | Level 1 | | | Level 2 | | | Level 3 | | | Total | |
Long-Term Investments | | $ | — | | | $ | 231,046,778 | | | $ | — | | | $ | 231,046,778 | |
Short-Term Investment | | | — | | | | 3,215,000 | | | | — | | | | 3,215,000 | |
Total Investments | | $ | — | | | $ | 234,261,778 | | | $ | — | | | $ | 234,261,778 | |
Amounts listed as “–” are $0 or round to $0.
For movements between the levels within the fair value hierarchy, the Fund has adopted a policy of recognizing transfers at the end of each period. During the period ended April 30, 2013, there were no transfers between Level 1 and Level 2. For the period ended April 30,
2013, there have been no significant changes to the fair valuation methodologies.
(b) Repurchase Agreements:
The Fund may enter into repurchase agreements. It is the Fund’s policy that its custodian/counterparty segregate the underlying collateral securities, the value of which exceeds the principal amount of the repurchase transaction, including accrued interest. The repurchase price generally equals the price paid by the Fund plus interest negotiated on the basis of current short-term rates. To the extent that any repurchase transaction exceeds one business day, the collateral is valued on a daily basis to determine its adequacy. If the counterparty defaults and the value of the collateral declines or if bankruptcy proceedings are commenced with respect to the counterparty of the security, realization of the collateral by the Fund may be delayed or limited. The Fund held a repurchase agreement of $3,215,000 as of April 30, 2013.
(c) Foreign Currency Translation:
Foreign securities, currencies, and other assets and liabilities denominated in foreign currencies are translated into U.S. Dollars at the exchange rate of said currencies against the U.S. Dollar, as of the Valuation Time, as provided by an independent pricing service approved by the Board.
Foreign currency amounts are translated into U.S. Dollars on the following basis:
| (i) | | market value of investment securities, other assets and liabilities – at the exchange rates at the current daily rates of exchange; and |
| (ii) | | purchases and sales of investment securities, income and expenses – at the rate of exchange prevailing on the respective dates of such transactions. |
The Fund isolates that portion of the results of operations arising from changes in the foreign exchange rates due to the fluctuations in the market prices of the securities held at the end of the reporting period. Similarly, the Fund isolates the effect of changes in foreign exchange rates from the fluctuations arising from changes in the market prices of portfolio securities sold during the reporting period.
Net exchange gain/(loss) is realized from sales and maturities of portfolio securities, sales of foreign currencies, settlement of securities transactions, dividends, interest and foreign withholding taxes recorded on the Fund’s books. Net unrealized foreign exchange appreciation/(depreciation) includes changes in the value of portfolio securities and other assets and liabilities arising as a result of changes in the exchange rate. The net realized and unrealized foreign
Aberdeen Australia Equity Fund, Inc.
13
Notes to Financial Statements (unaudited) (continued)
April 30, 2013
exchange gain/(loss) shown in the composition of net assets represents foreign exchange gain/(loss) for book purposes that may not have been recognized for tax purposes.
Foreign security and currency transactions may involve certain considerations and risks not typically associated with those of domestic origin, including unanticipated movements in the value of the foreign currency relative to the U.S. Dollar. Generally, when the U.S. Dollar rises in value against foreign currency, the Fund’s investments denominated in that currency will lose value because its currency is worth fewer U.S. Dollars; the opposite effect occurs if the U.S. Dollar falls in relative value.
(d) Security Transactions, Investment Income and Expenses:
Securities transactions are recorded on the trade date. Realized and unrealized gains/(losses) from security and currency transactions are calculated on the identified cost basis. Dividend income is recorded on the ex-dividend date except for certain dividends on foreign securities, which are recorded as soon as the Fund is informed after the ex-dividend date. Interest income is recorded on an accrual basis. Expenses are recorded on an accrual basis.
(e) Distributions:
The Fund has a managed distribution policy to pay distributions from net investment income supplemented by net realized foreign exchange gains, net realized short-term capital gains and return of capital distributions, if necessary, on a quarterly basis. The managed distribution policy is subject to regular review by the Board. The Fund will also declare and pay distributions at least annually from net realized gains on investment transactions and net realized foreign exchange gains, if any. Dividends and distributions to shareholders are recorded on the ex-dividend date.
Dividends and distributions to shareholders are determined in accordance with federal income tax regulations, which may differ from GAAP. These differences are primarily due to differing treatments for foreign currencies, loss deferrals and recognition of market discount and premium.
(f) Federal Income Taxes:
For federal income and excise tax purposes, substantially all of the Fund’s transactions are accounted for using the Australian Dollar as the functional currency. Accordingly, realized currency gains/(losses) are realized from changes in the foreign exchange rates against the Australian Dollar or are a result from the repatriation of Australian Dollars into U.S. Dollars. This may differ substantially from the realized currency gains recognized under GAAP within the financial statements. Furthermore, the Fund’s distribution requirements are
calculated on a federal tax basis whereby currency gains/(losses) are considered income and distributed out as such.
The Fund intends to qualify or continue to qualify as a “regulated investment company” by complying with the provisions available to certain investment companies, as defined in Subchapter M of the Internal Revenue Code of 1986, as amended, and to make distributions of net investment income and net realized capital gains sufficient to relieve the Fund from all, or substantially all, federal income taxes. Therefore, no federal income tax provision is required. Since tax authorities can examine previously filed tax returns, the Fund’s U.S. federal and state tax returns for each of the four fiscal years up to the most recent fiscal year ended October 31 are subject to such review.
3. Agreements and Transactions with Affiliates
(a) Investment Manager and Investment Adviser:
Aberdeen Asset Management Asia Limited (the “Investment Manager”) serves as investment manager to the Fund and Aberdeen Asset Management Limited (the “Investment Adviser”) serves as investment adviser to the Fund, pursuant to a management agreement and an advisory agreement, respectively. The Investment Manager and the Investment Adviser are wholly-owned subsidiaries of Aberdeen Asset Management PLC.
The Investment Manager makes investment decisions on behalf of the Fund on the basis of recommendations and information furnished to it by the Investment Adviser, including the selection of, and responsibility for the placement of orders with, brokers and dealers to execute portfolio transactions on behalf of the Fund.
Pursuant to the management agreement, the Fund pays the Investment Manager a fee, payable monthly, at the following annual rates: 1.10% of the Fund’s average weekly Managed Assets up to $50 million, 0.90% of Managed Assets between $50 million and $100 million and 0.70% of Managed Assets in excess of $100 million. Managed Assets is defined in the management agreement as net assets plus the amount of any borrowings for investment purposes.
The Investment Manager pays fees to the Investment Adviser for its services rendered. The Investment Manager informed the Fund that it paid $235,637 to the Investment Adviser, with respect to the Fund, during the six months ended April 30, 2013.
(b) Fund Administration:
Aberdeen Asset Management Inc. (“AAMI”), an affiliate of the Investment Manager and the Investment Adviser, is the Fund’s
Aberdeen Australia Equity Fund, Inc.
14
Notes to Financial Statements (unaudited) (continued)
April 30, 2013
Administrator, pursuant to an agreement under which AAMI receives a fee, payable monthly by the Fund, at an annual fee rate of 0.08% of the Fund’s average weekly Managed Assets up to $500 million, 0.07% of the Fund’s average weekly Managed Assets between $500 million and $1.5 billion, and 0.06% of the Fund’s average weekly Managed Assets in excess of $1.5 billion.
(c) Investor Relations:
Under the terms of an Investor Relations Services Agreement, AAMI serves as the Fund’s investor relations services provider.
Pursuant to the terms of the Investor Relations Services Agreement, AAMI provides, among other things, objective and timely information to shareholders based on publicly-available information; provides information efficiently through the use of technology while offering shareholders immediate access to knowledgeable investor relations representatives; develops and maintains effective communications with investment professionals from a wide variety of firms; creates and maintains investor relations communication materials such as fund manager interviews, films and webcasts, published white papers, magazine and articles and other relevant materials discussing the Fund’s investment results, portfolio positioning and outlook; develops and maintains effective communications with large institutional shareholders; responds to specific shareholder questions; and reports activities and results to the Board and management detailing insight into general shareholder sentiment.
For the six months ended April 30, 2013, the Fund paid fees of approximately $75,409 for investor relations services. Investor relations fees and expenses in the Statement of Operations include certain out-of-pocket expenses.
4. Investment Transactions
Purchases and sales of investment securities (excluding short-term securities) for the six months ended April 30, 2013, were $16,295,920 and $23,325,235, respectively.
5. Capital
There are 30 million shares of $0.01 par value common stock authorized. As of April 30, 2013, there were 22,574,121 shares of common stock issued and outstanding.
In November 2010, the Fund filed a “shelf” registration statement with the SEC, which permitted the Fund to issue up to $130 million in shares of common stock through one or more public offerings. The shelf registration is not currently effective and the Fund cannot offer shares for sale until it becomes effective. On December 9, 2010, the Fund announced the pricing of a public offering of its shares of
common stock under which the Fund agreed to sell a total of 2,500,000 shares of common stock at a price of $12.50 per share. The offering closed on December 14, 2010. The net proceeds of the offering, which were approximately $30 million, were used to make additional portfolio investments that were consistent with the Fund’s investment objectives and policies. Under the shelf registration statement, the Fund was permitted to sell the Fund’s common shares in one or more at-the-market offerings (“ATM” offerings) when market conditions are considered favorable. Such shares would only be issued when the premium to net asset value is greater than the costs associated with the transaction. Any proceeds raised would be used for investment purposes. During the six months ended April 30, 2013, there were no shares sold through ATM offerings. In 2011, the Fund incurred offering costs associated with an ATM offering which were charged against the proceeds of the stock offering. As of October 31, 2012, the offering costs related to unsold shares which were charged to the proceeds of the stock offering in 2011 were capitalized as a prepaid asset and will be charged to paid-in capital upon the issuance of these presently unsold shares. For the six months ended April 30, 2013, there were no such costs. These costs are noted on the Statements of Changes in Net Assets.
On March 1, 2001, the Board approved a stock repurchase program. The Board amended the program on December 12, 2007. The stock repurchase program allows the Fund to repurchase up to 10% of its outstanding common stock in the open market during any 12-month period, if and when the discount to NAV is at least 8%. For the six months ended April 30, 2013 and fiscal year ended October 31, 2012, the Fund did not repurchase any shares through this program.
6. Portfolio Investment Risks
(a) Risks Associated with Foreign Securities and Currencies:
Investments in securities of foreign issuers carry certain risks not ordinarily associated with investments in securities of U.S. issuers. These risks include future political and economic developments, and the possible imposition of exchange controls or other foreign governmental laws and restrictions. In addition, with respect to certain countries, there is the possibility of expropriation of assets, confiscatory taxation, political or social instability or diplomatic developments, which could adversely affect investments in those countries.
Certain countries also may impose substantial restrictions on investments in their capital markets by foreign entities, including restrictions on investments in issuers of industries deemed sensitive to relevant national interests. These factors may limit the investment opportunities available and result in a lack of liquidity and high price volatility with respect to securities of issuers from developing countries.
Aberdeen Australia Equity Fund, Inc.
15
Notes to Financial Statements (unaudited) (concluded)
April 30, 2013
(b) Concentration Risk:
The Fund may have elements of risk not typically associated with investments in the United States of America due to concentrated investments in a limited number of countries or regions subject to foreign securities or currencies risks. Such concentrations may subject the Fund to additional risks resulting from political or economic conditions in such countries or regions and the possible imposition of adverse governmental laws or currency exchange restrictions could cause the securities and their markets to be less liquid and their prices to be more volatile than those of comparable U.S. securities.
(c) Risks Associated with European Markets:
A number of countries in Europe have experienced and continue to experience severe economic and financial difficulties. Many non-governmental issuers, and even certain governments, have defaulted on, or been forced to restructure, their debts; many other issuers have faced difficulties obtaining credit or refinancing existing obligations; financial institutions have in many cases required government or central bank support, have needed to raise capital, and/or have been impaired in their ability to extend credit; and financial markets in Europe and elsewhere have experienced extreme volatility and declines in asset values and liquidity. These difficulties may continue, worsen or spread within and outside of Europe. Whether or not the Fund invests in securities of issuers located in Europe or with significant exposure to European issuers or countries, these events could negatively affect the value and liquidity of the Fund’s investments.
7. Contingencies
In the normal course of business, the Fund may provide general indemnifications pursuant to certain contracts and organizational documents. The Fund’s maximum exposure under these arrangements is dependent on future claims that may be made against the Fund and, therefore, cannot be estimated; however,
based on experience, the risk of loss from such claims is considered remote.
8. Tax Cost of Investments
The U.S. federal income tax basis of the Fund’s investments and the net unrealized appreciation as of April 30, 2013 were as follows:
| | | | | | | | | | | | | | |
| Cost | | | Appreciation | | | Depreciation | | | Net Unrealized Appreciation | |
| | $ 207,966,017 | | | $ | 37,222,398 | | | $ | (10,926,637 | ) | | $ | 26,295,761 | |
9. Recent Accounting Pronouncements
In December 2011, the Financial Accounting Standards Board (“FASB”) issued an Accounting Standards Update (“ASU”), Disclosures about Offsetting Assets and Liabilities. The amendments in this update require an entity to disclose both gross and net information for derivatives and other financial instruments that are either offset in the statement of assets and liabilities or subject to an enforceable master netting arrangement or similar agreement. The ASU is effective for annual reporting periods beginning on or after January 1, 2013 (and interim periods within those annual periods). Management is currently evaluating the implications of this ASU and its impact on the financial statements has not been determined.
10. Subsequent Events
Management has evaluated the need for disclosures and/or adjustments resulting from subsequent events through the date the Financial Statements were issued. Based on this evaluation, no disclosures or adjustments were required to the Financial Statements as of April 30, 2013.
On June 11, 2013, the Fund announced that it will pay on July 12, 2013 a distribution of US$0.26 per share to all shareholders of record as of June 28, 2013.
Aberdeen Australia Equity Fund, Inc.
16
Supplemental Information (unaudited)
Results of Annual Meeting of Shareholders
The Annual Meeting of Shareholders was held on Thursday, March 28, 2013 at 712 Fifth Avenue, 49th Floor, New York, New York. The description of the proposals and number of shares voted at the meeting are as follows:
1. To elect two directors to serve as Class I directors for three year terms or until their successors are duly elected and qualify:
| | | | | | | | |
| | | Votes For | | | Votes
Withheld | |
Neville J. Miles | | | 19,806,496 | | | | 439,532 | |
Moritz Sell | | | 19,802,605 | | | | 443,423 | |
Directors whose term of office continued beyond this meeting are as follows: Peter D. Sacks, Hugh Young, P. Gerald Malone, William J. Potter, and John T. Sheehy.
Aberdeen Australia Equity Fund, Inc.
17
An Invitation to Aberdeen’s Investor Relations
Your Fund on the Web
As part of our ongoing commitment to provide information to shareholders, Aberdeen invites you to visit your Fund on the web at www.aberdeeniaf.com.
From this page, you can view monthly fact sheets, read news from our portfolio managers, learn more about the Fund’s distributions and results, view daily fact sheets courtesy of Morningstar®, conduct portfolio charting and see other information designed to keep you up-to-date on your investment.
Aberdeen Closed-End Fund Talk Channel
Please take a look at Aberdeen’s award-winning Closed-End Fund Talk Channel, where you can watch portfolio manager web casts and our latest short films. For replays of recent broadcasts or to register for upcoming events, please visit our Closed-End Fund Talk Channel at www.aberdeen-asset.us/aam. nsf/usClosed/aberdeentv.
E-mail Services
Make sure you are enrolled in our e-mail services, which feature timely news from Aberdeen’s portfolio managers located around the world.
Enroll today at www.aberdeen-asset.us/aam.nsf/usclosed/email and be among the first to receive the latest news about your Fund.
Please contact Aberdeen Asset Management’s Investor Relations division by:
| | • | | Calling us toll free at 1-866-839-5205 in the U.S. |
| | • | | E-mailing us at InvestorRelations@aberdeen-asset.com |
| | • | | Visiting us on the web at www.aberdeen-asset.us/cef |
Corporate Information
Directors
Neville J. Miles, Chairman
P. Gerald Malone
William J. Potter
Peter D. Sacks
Moritz Sell
John T. Sheehy
Hugh Young
Officers
Christian Pittard, President
Jeffrey Cotton, Chief Compliance Officer and Vice President, Compliance
Megan Kennedy, Vice President and Secretary
Andrea Melia, Treasurer and Principal Accounting Officer
Mark Daniels, Vice President
Martin J. Gilbert, Vice President
Alan Goodson, Vice President
Jennifer Nichols, Vice President
Lucia Sitar, Vice President
Sharon Ferrari, Assistant Treasurer
Matthew Keener, Assistant Secretary
Investment Manager
Aberdeen Asset Management Asia Limited
21 Church Street
#01-01 Capital Square Two
Singapore 049480
Investment Adviser
Aberdeen Asset Management Limited
Level 6, 201 Kent Street
Sydney, NSW 2000, Australia
Administrator
Aberdeen Asset Management Inc.
1735 Market Street, 32nd Floor
Philadelphia, PA 19103
Custodian
State Street Bank and Trust Company
One Heritage Drive
North Quincy, MA 02171
Transfer Agent
Computershare Trust Company, N.A.
250 Royall Street
Canton, MA 02021
Independent Registered Public Accounting Firm
KPMG LLP
1601 Market Street
Philadelphia, PA 19103
Legal Counsel
Willkie Farr & Gallagher LLP
787 Seventh Ave
New York, NY 10019
Investor Relations
Aberdeen Asset Management Inc.
1735 Market Street, 32nd Floor
Philadelphia, PA 19103
1-866-839-5205
InvestorRelations@aberdeen-asset.com

Aberdeen Asset Management Asia Limited
The accompanying Financial Statements as of April 30, 2013, were not audited and accordingly, no opinion is expressed thereon.
Notice is hereby given in accordance with Section 23(c) of the Investment Company Act of 1940, as amended, that the Fund may purchase, from time to time, shares of its common stock in the open market.
Shares of Aberdeen Australia Equity Fund, Inc. are traded on the NYSE MKT Equities Exchange under the symbol “IAF”. Information about the Fund’s net asset value and market price is available at www.aberdeeniaf.com.
This report, including the financial information herein, is transmitted to the shareholders of Aberdeen Australia Equity Fund, Inc. for their general information only. It does not have regard to the specific investment objectives, financial situation and the particular needs of any specific person. Past performance is no guarantee of future returns.
Item 2 – Code of Ethics.
Not applicable to this filing.
Item 3 – Audit Committee Financial Expert.
Not required to be included in this filing.
Item 4 – Principal Accountant Fees and Services.
Not required to be included in this filing.
Item 5 – Audit Committee of Listed Registrants.
Not required to be included in this filing.
Item 6 – Investments.
| | (a) | Included as part of the Report to Stockholders filed under Item 1 of this Form N-CSR. |
Item 7 – Disclosure of Proxy Voting Policies and Procedures for Closed-End Management Investment Companies.
Not required to be included in this filing.
Item 8 - Portfolio Managers of Closed-End Management Investment Companies.
(a) Not required to be included in this filing
(b) During the period ended April 30, 2013, there were no changes in any of the Portfolio Managers identified in the Registrant’s Annual Report on Form N-CSR filed on January 4, 2013.
Item 9 – Purchases of Equity Securities by Closed-End Management Investment Company and Affiliated Purchasers.
REGISTRANT PURCHASES OF EQUITY SECURITIES
| | | | | | | | | | | | | | | | |
Period | | (a)
Total
Number of
Shares
Purchased | | | (b)
Average
Price Paid
per Share | | | (c)
Total Number of
Shares Purchased as
Part of Publicly
Announced Plans or
Programs 1 | | | (d)
Maximum Number of
Shares That May Yet
Be Purchased Under
the Plans or
Programs 1 | |
November 1 through November 30, 2012 | | | 0 | | | | 0 | | | | 0 | | | | 2,257,412 | |
December 1 through December 31, 2012 | | | 0 | | | | 0 | | | | 0 | | | | 2,257,412 | |
January 1 through January 31, 2013 | | | 0 | | | | 0 | | | | 0 | | | | 2,257,412 | |
February 1 through February 28, 2013 | | | 0 | | | | 0 | | | | 0 | | | | 2,257,412 | |
March 1 through March 31, 2013 | | | 0 | | | | 0 | | | | 0 | | | | 2,257,412 | |
April 1 through April 30, 2013 | | | 0 | | | | 0 | | | | 0 | | | | 2,257,412 | |
Total | | | 0 | | | | 0 | | | | 0 | | | | — | |
| 1 | The Registrant’s stock repurchase program was announced on March 19, 2001 and further amended by the Registrant’s Board of Directors on December 12, 2007. Under the terms of the current program, the Registrant is permitted to repurchase up to 10% of its outstanding shares of common stock, par value $.01 per share, on the open market during any 12 month period if and when the discount to net asset value is at least 8%. |
Item 10 – Submission of Matters to a Vote of Security Holders.
During the period ended April 30, 2013, there were no material changes to the policies by which stockholders may recommend nominees to the Fund’s Board.
Item 11- Controls and Procedures.
| | (a) | It is the conclusion of the Registrant’s principal executive officer and principal financial officer that the effectiveness of the Registrant’s current disclosure controls and procedures (such disclosure controls and procedures having been evaluated within 90 days of the date of this filing) provide reasonable assurance that the information required to be disclosed by the Registrant has been recorded, processed, summarized and reported within the time period specified in the Commission’s rules and forms and that the information required to be disclosed by the Registrant has been accumulated and communicated to the Registrant’s principal executive officer and principal financial officer in order to allow timely decisions regarding required disclosure. |
| | (b) | There have been no changes in the Registrant’s internal control over financial reporting that occurred during the first fiscal half year of the period covered by this report that have materially affected, or are reasonably likely to materially affect, the Registrant’s internal control over financial reporting. |
Item 12 - Exhibits.
| | |
| |
| (a)(1) | | Not applicable. |
| |
| (a)(2) | | Certifications pursuant to Rule 30a-2(a) under the Investment Company Act of 1940, as amended. |
| |
| (a)(3) | | Not applicable. |
| |
| (b) | | Certifications pursuant to Rule 30a-2(b) under the Investment Company Act of 1940, as amended. |
| |
| (c) | | A copy of the Registrant’s notices to stockholders, which accompanied distributions paid, pursuant to the Registrant’s Managed Distribution Policy since the Registrant’s last filed N-CSR, are filed herewith as Exhibits (c)(1) and (c)(2), as required by the terms of the Registrant’s SEC exemptive order. |
SIGNATURES
Pursuant to the requirements of the Securities Exchange Act of 1934 and the Investment Company Act of 1940, the Registrant has duly caused this report to be signed on its behalf by the undersigned, thereunto duly authorized.
Aberdeen Australia Equity Fund, Inc.
| | |
| By: | | /s/ Christian Pittard |
| | Christian Pittard, Principal Executive Officer of Aberdeen Australia Equity Fund, Inc. |
Date: July 02, 2013
Pursuant to the requirements of the Securities Exchange Act of 1934 and the Investment Company Act of 1940, this report has been signed below by the following persons on behalf of the Registrant and in the capacities and on the dates indicated.
| | |
| By: | | /s/ Christian Pittard |
| | Christian Pittard, Principal Executive Officer of Aberdeen Australia Equity Fund, Inc. |
Date: July 02, 2013
| | |
| By: | | /s/ Andrea Melia |
| | Andrea Melia, Principal Financial Officer of Aberdeen Australia Equity Fund, Inc. |
Date: July 02, 2013
Exhibit List
12(a)(2) – Rule 30a-2(a) Certifications
12(b) – Rule 30a-2(b) Certifications
12(c)(1), 12(c)(2) Distribution notice to stockholders