UNITED STATES
SECURITIES AND EXCHANGE COMMISSION
Washington, D.C. 20549
FORM N-CSR
CERTIFIED SHAREHOLDER REPORT OF REGISTERED MANAGEMENT
INVESTMENT COMPANIES
| | |
| |
Investment Company Act file number: | | 811-04438 |
| |
Exact name of registrant as specified in charter: | | Aberdeen Australia Equity Fund, Inc. |
| |
Address of principal executive offices: | | 1735 Market Street, 32nd Floor Philadelphia, PA 19103 |
| |
Name and address of agent for service: | | Ms. Andrea Melia Aberdeen Asset Management Inc. 1735 Market Street 32nd Floor Philadelphia, PA 19103 |
| |
Registrant’s telephone number, including area code: | | 866-839-5205 |
| |
Date of fiscal year end: | | October 31 |
| |
Date of reporting period: | | April 30, 2011 |
Item 1 – Reports to Stockholders
11
Aberdeen Australia Equity Fund, Inc.
Semi-Annual Report
April 30, 2011

Invests primarily in equity securities of Australian companies listed on the
Australian Stock Exchange Limited.

Managed Distribution Policy
The Board of Directors of the Fund has authorized a managed distribution policy (MDP) of paying quarterly distributions at an annual rate, set once a year, that is a percentage of the rolling average of the Fund’s prior four quarter-end net asset values. With each distribution, the Fund will issue a notice to shareholders and an accompanying press release which will provide detailed information regarding the amount and composition of the distribution and other information required by the Fund’s MDP exemptive order. The Fund’s Board of Directors may amend or terminate the MDP at any time without prior notice to shareholders; however, at this time, there are no reasonably foreseeable circumstances that might cause the termination of the MDP. You should not draw any conclusions about the Fund’s investment performance from the amount of distributions or from the terms of the Fund’s MDP.
Distribution Disclosure Classification (unaudited)
The Fund’s policy is to provide investors with a stable distribution rate. Each quarterly distribution will be paid out of current income, supplemented by realized capital gains and, to the extent necessary, paid-in capital.
The Fund is subject to U.S. corporate, tax and securities laws. Under U.S. tax accounting rules, the amount of distributable income for each fiscal period depends on the actual exchange rates during the entire year between the U.S. Dollar and the currencies in which Fund assets are denominated and on the aggregate gains and losses realized by the Fund during the entire year.
Therefore, the exact amount of distributable income for each fiscal year can only be determined as of the end of the Fund’s fiscal year, October 31. However, under the Investment Company Act of 1940 (the “1940 Act”), the Fund is required to indicate the sources of certain distributions to shareholders.
The Fund estimates that distributions for the period commencing November 1, 2010 including the distribution paid on April 15, 2011, are comprised of 26% net investment income, 25% of net realized long-term capital gains and 49% return of paid-in capital.
This estimated distribution composition may vary from quarter to quarter because it may be materially impacted by future realized gains and losses on securities and fluctuations in the value of the currencies in which Fund assets are denominated.
In January 2012, a Form 1099-DIV will be sent to shareholders, which will state the amount and composition of distributions and provide information with respect to their appropriate tax treatment for the 2011 calendar year.
Dividend Reinvestment and Direct Stock Purchase Plan
The Fund has a Dividend Reinvestment and Direct Stock Purchase Plan (the “Plan”), which is sponsored and administered by Computershare Trust Company, N.A., the Fund’s transfer agent.
The Plan allows registered stockholders and first time investors to buy and sell shares and automatically reinvest dividends and capital gains through our transfer agent. This is a cost-effective way to invest in the Fund.
Please note that for both purchases and reinvestment purposes, shares will be purchased in the open market at the current share price and cannot be issued directly by the Fund.
For more information about the Plan and a brochure that includes the terms and conditions of the Plan, please call Computershare at 1-800-647-0584 or visit www.computershare.com/buyaberdeen.
All amounts are U.S. Dollars unless otherwise stated.
Investors should consider a fund’s investment objectives, risks, charges and expenses carefully before investing. A copy of the prospectus for Aberdeen
Australia Equity Fund, Inc. that contains this and other information about the fund may be obtained by calling 866-839-5205. Please read the
prospectus carefully before investing. Investing in funds involves risk, including possible loss of principal.
Closed-end funds have a one-time initial public offering and then are subsequently traded on the secondary market through one of the stock
exchanges. The investment return and principal value will fluctuate so that an investor’s shares may be worth more or less than the original cost. Shares
of closed-end funds may trade above (a premium) or below (a discount) the net asset value (NAV) of the fund’s portfolio. Past performance does not
guarantee future results. Foreign securities are more volatile, harder to price and less liquid than U.S. securities. These risks may be enhanced in
emerging market countries. Concentrating investments in a single country, region or industry may subject a fund to greater price volatility and risk
of loss than more diverse funds. Aberdeen Asset Management Inc., 1735 Market Street, 32nd Floor, Philadelphia, PA 19103.
NOT FDIC INSURED | NO BANK GUARANTEE | MAY LOSE VALUE
Aberdeen Asset Management Inc. celebrated 25 years of
investing in the Asia-Pacific region with the closing bell
ceremony at the New York Stock Exchange on June 7, 2011.
Aberdeen’s U.S. fund directors, executives and guests visited
the exchange to honor two of Aberdeen’s flagship U.S. closedend
funds: the Aberdeen Asia-Pacific Income Fund, Inc. (NYSE:
FAX) and the Aberdeen Australia Equity Fund, Inc. (NYSE: IAF).
The Aberdeen Australia Equity Fund, Inc. represents one of
the strongest country-specific funds with a long-term track
record, a history of prudent leadership and a disciplined
portfolio process. The Fund provides the opportunity to invest
in what we believe is one of the world’s most dynamic and
growing regions.
Visit the Fund’s website to watch a short film of the
celebration and to learn more about investing in Australia:
www.aberdeeniaf.com
Celebrating 25 Years of Investing in Australia
Letter to Shareholders (unaudited)
June 8, 2011
Dear Shareholder,
We present this Semi-Annual Report which covers the activities of Aberdeen Australia Equity Fund, Inc. (the “Fund”) for the six months ended April 30, 2011. The Fund’s principal investment objective is long-term capital appreciation through investment primarily in equity securities of Australian companies listed on the Australian Stock Exchange Limited. The Fund’s secondary investment objective is current income.
Net Asset Value Performance
The Fund’s total return based on net asset value (“NAV”) was 13.1% for the six months ended April 30, 2011, assuming reinvestment of distributions, compared with a return of 17.8% in U.S. dollar terms, for the Fund’s benchmark, the S&P/ASX 200 Accumulation Index (the “ASX 200”).
Share Price Performance
The Fund’s share price increased 1.4% over the six month period, from $12.70 on October 31, 2010 to $12.88 on April 30, 2011. The Fund’s share price on April 30, 2011 represented a premium of 3.0% to the NAV per share of $12.50 on that date, compared with a premium of 9.7% to the NAV per share of $11.58 on October 31, 2010. At the date of this letter, the share price was $12.03, representing a premium of 5.5% to the NAV per share of $11.40.
Managed Distribution Policy
The Fund has a managed distribution policy of paying quarterly distributions at an annual rate, set once a year, that is a percentage of the rolling average of the Fund’s prior four quarter-end net asset values. In March 2011, the Fund’s Board of Directors (the “Board”) determined the rolling distribution rate to be 10% for the 12 month period commencing with the distribution payable in April 2011. This policy is subject to regular review by the Board. The distributions will be made from current income, supplemented by realized capital gains and, to the extent necessary, paid-in capital, which is a non-taxable return of capital.
On June 7, 2011, the Board authorized a quarterly distribution of $0.29 per share, payable on July 15, 2011 to all shareholders of record as of June 30, 2011.
Portfolio Holdings Disclosure
The Fund files its complete schedule of portfolio holdings with the SEC for the first and third quarters of each fiscal year on Form N-Q. The Fund’s Forms N-Q are available on the SEC’s website at http://www.sec.gov and may be reviewed and copied at the SEC’s Public Reference Room in Washington, D.C. Information about the operation of the Public Reference Room may be obtained by calling
1-800-SEC-0330. The Fund makes the information on Form N-Q available to shareholders on the Fund’s website or upon request and without charge by calling Investor Relations toll-free at 1-866-839-5205.
Proxy Voting
A description of the policies and procedures that the Fund uses to determine how to vote proxies relating to portfolio securities, and information regarding how the Fund voted proxies relating to portfolio securities during the twelve months ended June 30, 2010, is available: (i) upon request and without charge by calling Investor Relations toll-free at 1-866-839-5205; and (ii) on the SEC’s website at http://www.sec.gov.
Investor Relations Information
For information about the Fund, daily updates of share price, NAV and details of recent distributions, please contact Aberdeen Asset Management Inc. by:
| • | | Calling toll free at 1-866-839-5205 in the United States, |
| • | | E-mailing InvestorRelations@aberdeen-asset.com, or |
| • | | Visiting the website at www.aberdeeniaf.com. |
For more information about Aberdeen Closed-End Funds, please visit our Closed-End Investor Center at www.aberdeen-asset.us/cef.
From the site you will also be able to review performance, download literature and sign up for email services. The site houses topical information about the funds, including fact sheets from Morningstar that are updated daily and monthly manager reports. If you sign up for our email service online, we can ensure that you are among the first to know about Aberdeen’s latest closed-end fund news.
Included within this report is a reply card with postage paid envelope. Please complete and mail the card if you would like to be added to our enhanced email service and receive future communications from Aberdeen.
Yours sincerely,

Christian Pittard
President
Aberdeen Australia Equity Fund, Inc.
1
Report of the Investment Manager (unaudited)
Economic Review
The Australian share market, as represented by the ASX 200, the Fund’s benchmark, rose by 17.8% in U.S. Dollar terms over the six months ended April 30, 2011.
In November the ASX 200 declined by 1.1%, with the stock market responding to news regarding tensions developing on the Korean peninsula, Eurozone debt worries in Ireland and policy tightening within China. The Resources sector (+1.1%) outperformed, but Banks (-5.3%) were under pressure politically from out-of-step hikes in interest rate rises on their variable mortgage books. BHP Billiton Limited withdrew its offer for Potash Corporation after political objections within Canada, but AMP Limited (“AMP”) revived its bid for AXA Asia-Pacific Holdings Limited (“AXA”) after National Australia Bank was precluded from its bid by the ACCC (Australia’s competition authority). The Annual General Meeting (“AGM”) season also featured some cautious outlook statements. After five months on hold, the Reserve Bank of Australia (“RBA”) raised its cash rate by 25 basis points on Melbourne Cup Day to 4.75%, taking the market by surprise.
December saw a rebound in the Australian Market, with ASX 200 rising by 3.7%, although not as strong as other markets such as FTSE100 which was up 6.5% and Dow Jones Industrials up 5.2%. Yet again, resources performed strongly (+6.1%) as M&A activity continued and a report was released on the proposed Mineral Resources Rent Tax which contained no surprises. Banks (+3.3%) traded roughly in-line as competition proposals from the Australian Government proved less onerous than feared. The RBA left rates on hold stating “the current setting is appropriate for the current outlook.” November employment numbers in Australia were very strong with the unemployment rate falling from 5.4% to 5.2%.
In the first month of 2011, the ASX 200 hardly moved (+0.2%), with Australia being one of the weaker developed markets. Emerging markets in general lost ground over the month. The resources sector retreated (-3.1%) with buyers favouring more domestic plays like banks (+2.9%), as RBA rate hike fears receded. Oil prices rose as attention focused on events in Tunisia and Egypt. In Australia, all eyes were focused on the floods in Queensland and Victoria and anticipating the effects on some companies. Woolworths Ltd. lowered its outlook citing weak discretionary spending as a result of the floods. The Australian Government proposed a flood levy on individuals and spending cuts to help fund reconstruction in flood-hit areas.
The Fund disposed of its small holdings in Billabong International Limited. The Fund re-allocated the proceeds by increasing its weighting by 1% to Leighton Holdings Company with the balance topping up its holding in David Jones Limited.
February was a strong month with the ASX 200 rising 2.3% higher despite the political unrest in the Middle East and North Africa which sent the price of oil northwards and sent jitters through global markets, especially emerging markets. Both the materials sector and energy sector had a strong month. The earnings season brought mixed news, with the mining sector encouraged by strong commodity prices and increased volumes, some signs of improving economic news from Europe and the U.S. and a number of Australian based companies reporting slow trading conditions, especially in retailing. Australian economic news though was positive with unemployment continuing to decline, capital expenditure intentions were positive and consumer confidence was positive despite the recent flooding in Queensland and Victoria. Another feature was the Australian Dollar (“AUD”) moving to parity with the U.S. Dollar (“USD”).
During March, the ASX 200 increased by 0.7% as continued unrest in the Middle East and North Africa weighed on markets and kept oil prices high. The energy sector was the strongest performer with property sector being the weakest. The earthquake in Japan was the focus of attention with demand for gas expected to leap due to the closure of nuclear plants in Northern Japan. Uranium stocks were hard hit in anticipation of a fall in demand. Australian economic news was mixed with employment falling, but full-time employees up, and consumer confidence, housing starts and mortgage approvals falling. The AUD closed at a record at $1.03 against the USD.
In April, the ASX 200 fell 0.3% but the focus was on the AUD which closed at $1.09 against the USD. Against this companies with large U.S. earnings were under pressure. Also two of the Fund’s holdings issued profit warnings, namely Leighton Holdings Company and Goodman Fielder Limited. Reports from the mining sector showed the impact from flooding and retailers continued to indicate tough trading conditions. The Australian Government rejected the bid by the Singapore Stock Exchange for the ASX, which was disappointing. Telecommunications was the best performing sector and industrials the worst. The RBA left interest rates on hold at 4.75%.
During the first quarter of 2011, no new holdings were initiated, but the Fund disposed of its holding in Sonic Healthcare Limited due to the Investment Managers’ concerns of alterations to the Australian Government funding to the pathology sector. The Fund added to its holdings in Tattersall’s Limited, Leighton Holdings Company and Computershare Limited. The bid for AXA, finally closed during the period with the portfolio receiving a mixture of cash and AMP Ltd. shares and topped up the shareholding in AMP Ltd. to 2% of the Fund’s holdings.
Aberdeen Australia Equity Fund, Inc.
2
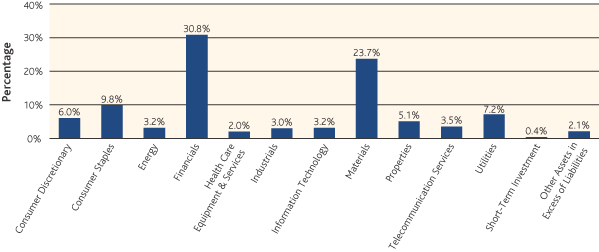
Portfolio Composition (unaudited)
The following chart summarizes the composition of the Fund’s portfolio, in industry classification standard sectors, expressed as a percentage of net assets. An industry classification standard sector can include more than one industry group. The Fund may invest between 25% and 35% of its total assets in the securities of any one industry group if, at the time of investment, that industry group represents 20% or more of the S&P/ASX 200 Accumulation Index. As of April 30, 2011, the Fund did not have more than 25% of its assets invested in any industry group. The financial industry sector is comprised of several industry groups.
As of April 30, 2011, the Fund held 97.5% of its net assets in equities, 0.4% in a short-term investment and 2.1% in other assets in excess of liabilities.
Asset Allocation as of April 30, 2011
by Standard & Poor’s Global Industry Classification Standard Sectors
Top Ten Equity Holdings (unaudited)
The following were the Fund’s top ten holdings as of April 30, 2011:
| | | | |
| Name of Security | | Percentage of Net Assets | |
BHP Billiton Ltd. | | | 12.6% | |
QBE Insurance Group Ltd. | | | 8.0% | |
Commonwealth Bank of Australia | | | 6.8% | |
Rio Tinto Ltd. | | | 6.7% | |
Woolworths Ltd. | | | 6.5% | |
Westpac Banking Corp. Ltd. | | | 5.7% | |
Australia & New Zealand Banking Group Ltd. | | | 5.0% | |
AGL Energy Ltd. | | | 4.7% | |
Westfield Group Ltd. | | | 4.0% | |
Singapore Telecommunications Ltd. | | | 3.5% | |
Aberdeen Australia Equity Fund, Inc.
3
Portfolio of Investments (unaudited)
As of April 30, 2011
| | | | | | | | |
| Shares | | | Description | | Value
(US$) | |
| | | | | | | | |
| LONG-TERM INVESTMENTS—97.5% | |
| COMMON STOCKS—97.5% | |
| CONSUMER DISCRETIONARY—6.0% | |
| | 1,736,510 | | | David Jones Ltd.* | | $ | 8,893,786 | |
| | 2,924,050 | | | Tattersall’s Ltd.* | | | 7,447,439 | |
| | | | | | | | 16,341,225 | |
| CONSUMER STAPLES—9.8% | |
| | 2,752,520 | | | Goodman Fielder Ltd.* | | | 3,248,451 | |
| | 1,263,190 | | | Metcash Ltd.* | | | 5,627,327 | |
| | 613,900 | | | Woolworths Ltd.* | | | 17,865,162 | |
| | | | | | | | 26,740,940 | |
| ENERGY—3.2% | |
| | 168,085 | | | Woodside Petroleum Ltd.* | | | 8,643,371 | |
| FINANCIALS—30.8% | |
| | 913,260 | | | AMP Ltd.* | | | 5,493,575 | |
| | 510,700 | | | Australia & New Zealand Banking Group Ltd.* | | | 13,603,649 | |
| | 258,295 | | | Australian Stock Exchange Ltd.* | | | 9,108,813 | |
| | 314,180 | | | Commonwealth Bank of Australia* | | | 18,546,909 | |
| | 1,058,220 | | | QBE Insurance Group Ltd.* | | | 21,740,301 | |
| | 563,840 | | | Westpac Banking Corp. Ltd.* | | | 15,392,906 | |
| | | | | | | | 83,886,153 | |
| HEALTH CARE EQUIPMENT & SERVICES—2.0% | |
| | 273,940 | | | Ramsay Health Care Ltd.* | | | 5,435,523 | |
| INDUSTRIALS—3.0% | |
| | 307,778 | | | Leighton Holdings Ltd.* | | | 8,199,611 | |
| INFORMATION TECHNOLOGY—3.2% | |
| | 811,330 | | | Computershare Ltd.* | | | 8,633,621 | |
| MATERIALS—23.7% | |
| | 680,280 | | | BHP Billiton Ltd.* | | | 34,442,291 | |
| | 1,175,100 | | | Incitec Pivot Ltd.* | | | 4,863,425 | |
| | 243,470 | | | Orica Ltd.* | | | 7,112,734 | |
| | 201,380 | | | Rio Tinto Ltd.* | | | 18,230,037 | |
| | | | | | | | 64,648,487 | |
| PROPERTIES—5.1% | |
| | 1,110,530 | | | Westfield Group Ltd.* | | | 11,005,068 | |
| | 1,017,130 | | | Westfield Retail Trust | | | 2,954,420 | |
| | | | | | | | 13,959,488 | |
| TELECOMMUNICATION SERVICES—3.5% | |
| | 3,707,400 | | | Singapore Telecommunications Ltd.* | | | 9,431,958 | |
| UTILITIES—7.2% | |
| | 793,825 | | | AGL Energy Ltd.* | | | 12,668,633 | |
| | 7,171,860 | | | SP AusNet* | | | 6,892,745 | |
| | | | | | | | 19,561,378 | |
| | | | | Total Long-Term Investments—97.5% (cost $169,003,912) | | | 265,481,755 | |
See Notes to Financial Statements.
Aberdeen Australia Equity Fund, Inc.
4
Portfolio of Investments (unaudited) (concluded)
As of April 30, 2011
| | | | | | |
Par
Amount | | | Description | | Value
(US$) |
| | | | | | |
| SHORT-TERM INVESTMENT—0.4% | | |
| | $ 959,000 | | | Repurchase Agreement, State Street Bank & Trust Co., 0.01% dated 04/29/2011, due 5/02/11 in the amount of $959,001, collateralized by U.S. Treasury Bond, maturing 8/15/39; total market value of $982,800 | | $ 959,000 |
| | | | | Total Short-Term Investment—0.4% (cost $959,000) | | 959,000 |
| | | | | Total Investments—97.9% (cost $169,962,912) | | 266,440,755 |
| | |
| | | | | Other Assets in Excess of Liabilities—2.1% | | 5,795,239 |
| | | | | Net Assets—100.0% | | $272,235,994 |
| * | | Fair Valued Security; Fair Values are determined pursuant to procedures approved by the Board of Directors. |
See Notes to Financial Statements.
Aberdeen Australia Equity Fund, Inc.
5
Statement of Assets and Liabilities (unaudited)
As of April 30, 2011
| | | | |
| Assets | | | |
Investments, at value (cost $169,962,912) | | $ | 266,440,755 | |
Foreign currency, at value (cost $5,163,882) | | | 5,421,152 | |
Cash | | | 136 | |
Interest and dividends receivable | | | 689,016 | |
| Prepaid expenses | | | 92,447 | |
Total assets | | | 272,643,506 | |
| |
Liabilities | | | | |
Investment management fees payable | | | 212,082 | |
Administration fees | | | 20,856 | |
| Other | | | 174,574 | |
Total liabilities | | | 407,512 | |
| | | | | |
Net Assets | | $ | 272,235,994 | |
| |
Composition of Net Assets: | | | | |
Common stock (par value $.01 per share) | | $ | 217,776 | |
Paid-in capital in excess of par | | | 159,824,860 | |
Distributions in excess of net investment income | | | (10,292,334 | ) |
Accumulated net realized gain from investment transactions | | | 10,365,107 | |
Net unrealized appreciation on investments | | | 44,712,467 | |
Accumulated net realized foreign exchange gains | | | 15,337,121 | |
| Net unrealized foreign exchange gains | | | 52,070,997 | |
Net Assets | | $ | 272,235,994 | |
| Net asset value per common share based on 21,777,602 shares issued and outstanding | | $ | 12.50 | |
See Notes to Financial Statements.
Aberdeen Australia Equity Fund, Inc.
6
Statement of Operations (unaudited)
For the Six Months Ended April 30, 2011
| | | | |
| Net Investment Income | | | |
| |
Income | | | | |
Dividend income (net of foreign withholding taxes of $56,792) | | $ | 5,448,711 | |
| Interest | | | 70,895 | |
| | | | 5,519,606 | |
| |
Expenses | | | | |
Investment management fee | | | 1,020,862 | |
Administration fee | | | 99,668 | |
Directors’ fees and expenses | | | 127,935 | |
Investor relations fees and expenses | | | 79,585 | |
Legal fees and expenses | | | 76,698 | |
Insurance expense | | | 53,397 | |
Reports to shareholders and proxy solicitation | | | 52,854 | |
Independent auditors’ fees and expenses | | | 28,714 | |
Custodian’s fees and expenses | | | 28,439 | |
Transfer agent’s fees and expenses | | | 15,329 | |
| Miscellaneous | | | 37,335 | |
| Total expenses | | | 1,620,816 | |
| | | | | |
Net investment income | | | 3,898,790 | |
| |
Realized and Unrealized Gains/(Losses) on Investments and Foreign Currencies | | | | |
| |
Net realized gain/(loss) from: | | | | |
Investment transactions | | | 7,850,978 | |
| Foreign currency transactions | | | (120,492 | ) |
| | | | 7,730,486 | |
| |
Net change in unrealized appreciation/(depreciation) on: | | | | |
Investments | | | 271,707 | |
| Foreign currency translation | | | 19,861,442 | |
| | | | 20,133,149 | |
| Net gain on investments and foreign currencies | | | 27,863,635 | |
Net Increase in Net Assets Resulting from Operations | | $ | 31,762,425 | |
See Notes to Financial Statements.
Aberdeen Australia Equity Fund, Inc.
7
Statements of Changes in Net Assets
| | | | | | | | |
| | | For the Six
Months Ended
April 30, 2011
(unaudited) | | | For the Year Ended
October 31, 2010 | |
| | |
| Increase/(Decrease) in Net Assets | | | | | | | | |
| | |
| Operations: | | | | | | | | |
Net investment income/(loss) | | $ | 3,898,790 | | | $ | 6,158,772 | |
Net realized gain/(loss) from investment transactions | | | 7,850,978 | | | | 8,794,249 | |
Net realized gain/(loss) from foreign currency transactions | | | (120,492 | ) | | | 1,626,246 | |
Net change in unrealized appreciation/depreciation on investments | | | 271,707 | | | | 6,231,484 | |
Net change in unrealized appreciation/depreciation on foreign currency translation | | | 19,861,442 | | | | 8,486,348 | |
Net increase/(decrease) in net assets resulting from operations | | | 31,762,425 | | | | 31,297,099 | |
| | |
| Distributions to Shareholders from: | | | | | | | | |
Net investment income | | | (12,195,457 | ) | | | (9,565,222 | ) |
Net realized gains | | | — | | | | (1,143,155 | ) |
Tax return of capital | | | — | | | | (8,740,575 | ) |
Net decrease in net assets from distributions | | | (12,195,457 | ) | | | (19,448,952 | ) |
| | |
| Common Stock Transactions: | | | | | | | | |
Proceeds from the offering of Common Stock (Note 4) | | | 31,250,000 | | | | — | |
Expenses in connection with the offering of Common Stock | | | (1,753,771 | ) | | | — | |
Reinvestment of dividends resulting in the issuance of 0 and 41,762 shares of common stock, respectively | | | — | | | | 459,135 | |
Change in net assets from common stock transactions | | | 29,496,229 | | | | 459,135 | |
Change in net assets resulting from operations | | | 49,063,197 | | | | 12,307,282 | |
| | |
| Net Assets: | | | | | | | | |
Beginning of period | | | 223,172,797 | | | | 210,865,515 | |
End of period (including distributions in excess of net investment income of ($10,292,334) and ($1,995,667), respectively) | | $ | 272,235,994 | | | $ | 223,172,797 | |
See Notes to Financial Statements.
Aberdeen Australia Equity Fund, Inc.
8
Financial Highlights
| | | | | | | | | | | | | | | | | | | | | | | | |
| | | For the Six
Months Ended April 30, 2011
(unaudited) | | | For the Year Ended October 31, | |
| | | | 2010 | | | 2009 | | | 2008 | | | 2007 | | | 2006 | |
| Per Share Operating Performance(a): | | | | | | | | | | | | | | | | | | | | | | | | |
| Net asset value, beginning of period | | | $11.58 | | | | $10.96 | | | | $8.37 | | | | $18.53 | | | | $13.25 | | | | $11.75 | |
| Net investment income | | | 0.18 | | | | 0.32 | | | | 0.29 | | | | 0.51 | | | | 0.39 | | | | 0.41 | |
| Net realized and unrealized gains/(losses) on investments and foreign currencies | | | 1.31 | | | | 1.31 | | | | 3.34 | | | | (8.83 | ) | | | 6.47 | | | | 2.47 | |
| Total from investment operations | | | 1.49 | | | | 1.63 | | | | 3.63 | | | | (8.32 | ) | | | 6.86 | | | | 2.88 | |
| Distributions from: | | | | | | | | | | | | | | | | | | | | | | | | |
| Net investment income | | | (0.56 | ) | | | (0.50 | ) | | | (0.31 | ) | | | (0.24 | ) | | | (0.53 | ) | | | (0.48 | ) |
| Net realized gains | | | – | | | | (0.06 | ) | | | – | | | | (0.84 | ) | | | (0.98 | ) | | | (0.90 | ) |
| Tax return of capital | | | – | | | | (0.45 | ) | | | (0.73 | ) | | | (0.76 | ) | | | – | | | | – | |
| Total distributions | | | (0.56 | ) | | | (1.01 | ) | | | (1.04 | ) | | | (1.84 | ) | | | (1.51 | ) | | | (1.38 | ) |
| Payment by shareholder of short-swing profit | | | – | | | | – | | | | – | | | | – | | | | – | | | | – | (b) |
| Offering cost on common stock | | | (0.01 | ) | | | – | | | | – | | | | – | | | | (0.07 | ) | | | – | |
| Net asset value, end of period | | | $12.50 | | | | $11.58 | | | | $10.96 | | | | $8.37 | | | | $18.53 | | | | $13.25 | |
| Market value, end of period | | | $12.88 | | | | $12.70 | | | | $11.40 | | | | $8.60 | | | | $18.25 | | | | $14.00 | |
| | | | | | |
| Total Investment Return Based on(c): | | | | | | | | | | | | | | | | | | | | | | | | |
| Market value | | | 6.23% | | | | 21.62% | | | | 50.76% | | | | (45.57% | ) | | | 43.46% | | | | 20.09% | |
| Net asset value | | | 13.07% | | | | 15.35% | | | | 48.92% | | | | (47.83% | ) | | | 53.91% | | | | 25.66% | |
| | | | | | |
| Ratio to Average Net Assets/Supplementary Data: | | | | | | | | | | | | | | | | | | | | | | | | |
| Net assets, end of period (000 omitted) | | | $272,236 | | | | $223,173 | | | | $210,866 | | | | $160,886 | | | | $354,970 | | | | $223,588 | |
| Average net assets (000 omitted) | | | $251,235 | | | | $211,324 | | | | $163,795 | | | | $282,702 | | | | $283,749 | | | | $209,507 | |
| Net operating expenses | | | 1.30% | (d) | | | 1.39% | | | | 1.73% | | | | 1.26% | | | | 1.44% | | | | 1.45% | |
| Net operating expenses without reimbursement | | | 1.30% | (d) | | | 1.39% | | | | 1.73% | | | | 1.26% | | | | 1.51% | | | | 1.55% | |
| Net investment income | | | 3.13% | (d) | | | 2.91% | | | | 3.41% | | | | 3.46% | | | | 2.56% | | | | 3.31% | |
| Portfolio turnover | | | 10% | | | | 11% | | | | 16% | | | | 22% | | | | 30% | | | | 16% | |
| (a) | | Based on average shares outstanding. |
| (b) | | Less than $0.005 per share. |
| (c) | | Total investment return is calculated assuming a purchase of common stock on the opening of the first day and a sale on the closing of the last day of each period reported. Dividends and distributions, if any, are assumed, for purposes of this calculation, to be reinvested at prices obtained under the Fund’s dividend reinvestment plan. Total investment return does not reflect brokerage commissions. |
See Notes to Financial Statements
Aberdeen Australia Equity Fund, Inc.
9
Notes to Financial Statements (unaudited)
April 30, 2011
Aberdeen Australia Equity Fund, Inc. (the “Fund”) is a closed-end, non-diversified management investment company incorporated in Maryland on September 30, 1985. The Fund’s principal investment objective is long-term capital appreciation through investment primarily in equity securities of Australian companies listed on the Australian Stock Exchange Limited (“ASX”). The Fund’s secondary investment objective is current income. In order to comply with a rule adopted by the U.S. Securities and Exchange Commission (the “SEC”) under the Investment Company Act of 1940 (the “1940 Act”) regarding fund names, the Board of Directors (the “Board”) has adopted an investment policy that, for as long as the name of the Fund remains Aberdeen Australia Equity Fund, Inc., it is the policy of the Fund normally to invest at least 80% of its net assets, plus the amount of any borrowings for investment purposes, in equity securities, consisting of common stock, preferred stock and convertible stock, of Australian companies listed on the ASX. For these purposes, “Australian companies” means companies that are tied economically to Australia. This 80% investment policy is a non-fundamental policy of the Fund and may be changed by the Board upon 60 days’ prior written notice to shareholders.
1. Accounting Policies
The following is a summary of significant accounting policies followed by the Fund in the preparation of its financial statements. The policies are in conformity with accounting principles generally accepted in the United States of America (“GAAP”). The preparation of financial statements requires management to make estimates and assumptions that affect the reported amounts of assets and liabilities, disclosure of contingent assets and liabilities at the date of the financial statements, and the reported amounts of income and expenses for the period. Actual results could differ from those estimates. The U.S. Dollar is used as both the functional and reporting currency. However, the Australian Dollar is the functional currency for U.S. federal tax purposes.
(a) Security Valuation:
Securities for which market quotations are readily available are valued at current market value as of the “Valuation Time.” The Valuation Time is as of the close of regular trading on the New York Stock Exchange (usually 4:00 p.m. Eastern Time). Equity securities are valued at the last quoted sale price. Effective January 1, 2011, if there is no sale price available, the last quoted mean price provided by an independent pricing service approved by the Board is used. Prior to January 1, 2011, if there was no sale price, the last quoted bid price provided by an independent pricing service was used. Securities traded on NASDAQ are valued at the NASDAQ official closing price. Management has concluded there is no significant effect on the value of the portfolio due to the change in
methodology. Prices are taken from the primary market or exchange on which each security trades. Investment companies are valued at net asset value as reported by such company.
Most securities listed on a foreign exchange are valued at the last sale price at the close of the exchange on which the security is principally traded or by application of a valuation factor by an independent pricing service to the last sales price as further discussed below. Foreign securities, currencies, and other assets and liabilities denominated in foreign currencies are translated into U.S. Dollars at the exchange rate of said currencies against the U.S. Dollar, as of the Valuation Time, as provided by an independent pricing service approved by the Board.
Debt and other fixed-income securities (other than short-term obligations) are valued at the last quoted bid price and/or by using a combination of daily quotes and matrix evaluations provided by an independent pricing service, the use of which has been approved by the Board. In the event such quotes are not available from such pricing agents, then the security may be priced based on bid quotations from broker-dealers. Short-term debt securities of sufficient credit quality such as commercial paper and U.S. Treasury Bills having a remaining maturity of 60 days or less at the time of purchase, are valued at amortized cost, which approximates fair value.
Securities for which market quotations are not readily available, or for which an independent pricing service does not provide a value or provides a value that does not represent fair value in the judgment of the Fund’s investment adviser or designee, are valued at fair value under procedures approved by the Board. In addition, fair value determinations are required for securities whose value is affected by a “significant” event that materially affects the value of a domestic or foreign security which occurs subsequent to the time of the close of the principal market on which such domestic or foreign security trades and before the Valuation Time (i.e., a “subsequent event”). Typically, this will involve events occurring after the close of a foreign market on which a security trades and before the next Valuation Time.
The Fund’s equity securities that are traded on a foreign exchange or market which closes prior to the Fund’s Valuation Time are fair valued by an independent pricing service. The fair value of each such security generally is calculated by applying a valuation factor provided by the independent pricing service to the last sales price for that security. If the pricing service is unable to provide a fair value for a security, the security will continue to be valued at the last sale price at the close of the exchange on which it is principally traded, subject to adjustment by the Fund’s Pricing Committee. When the fair value prices are utilized, the value assigned to the foreign
Aberdeen Australia Equity Fund, Inc.
10
Notes to Financial Statements (unaudited) (continued)
April 30, 2011
securities may not be the quoted or published prices of the securities on their primary markets.
For the six months ended April 30, 2011, other than described above, there have been no significant changes to the valuation procedures approved by the Board.
The Fund is required to disclose information regarding the fair value measurements of the Fund’s assets and liabilities. Fair value is defined as the price that the Fund would receive upon selling an investment in an orderly transaction to an independent buyer in the principal or most advantageous market for the investment. The disclosure requirements utilize a three-tier hierarchy to maximize the use of observable market data, minimize the use of unobservable inputs and establish classification of fair value measurements for disclosure purposes. Inputs refer broadly to the assumptions that market participants would use in pricing the asset or liability, including assumptions about risk (for example, the risk inherent in a particular valuation technique used to measure fair value including such a pricing model and/or the risk inherent in the inputs to the valuation technique). Inputs may be observable or unobservable.
Observable inputs are inputs that reflect the assumptions market participants would use in pricing the asset or liability, which are based on market data obtained from sources independent of the reporting entity. Unobservable inputs are inputs that reflect the reporting entity’s own assumptions about the assumptions market participants would use in pricing the asset or liability, which are based on the best information available in the circumstances.
The three-tier hierarchy of inputs is summarized below:
| • | | Level 1 – quoted prices in active markets for identical investments |
| • | | Level 2 – other significant observable inputs (including quoted prices for similar securities, interest rates, prepayment speeds, credit risk, etc.) |
| • | | Level 3 – significant unobservable inputs (including the Fund’s own assumptions in determining the fair value of investments) |
The inputs or methodology used for valuing securities are not necessarily an indication of the risk associated with investing in those securities. The Fund uses valuation techniques to measure fair value that are consistent with the market approach and/or income approach, depending on the type of security and the particular circumstance. The market approach uses prices and other relevant information generated by market transactions involving identical or comparable securities. The income approach uses valuation techniques to discount estimated future cash flows to present value. The following is a summary of the inputs used to value the Fund’s investments as of April 30, 2011:
| | | | | | | | | | | | | | | | |
| Investments | | Level 1* | | | Level 2* | | | Level 3 | | | Total | |
Equity Investments | | $ | 2,954,420 | | | $ | 262,527,335 | | | $ | – | | | $ | 265,481,755 | |
Short-Term Investment | | | – | | | | 959,000 | | | | – | | | | 959,000 | |
Total Investments | | $ | 2,954,420 | | | $ | 263,486,335 | | | $ | – | | | $ | 266,440,755 | |
| * | | For the six months ended April 30, 2011, there were no significant transfers in or out of Level 1 and Level 2 fair value measurements. |
For further information, please refer to the Portfolio of Investments that begins on page 6.
For the six months ended April 30, 2011, there have been no significant changes to the fair valuation methodologies.
(b) Repurchase Agreements:
The Fund may enter into repurchase agreements. It is the Fund’s policy that its custodian/counterparty segregate the underlying collateral securities, the value of which exceeds the principal amount of the repurchase transaction, including accrued interest. The repurchase price generally equals the price paid by the Fund plus interest negotiated on the basis of current short-term rates. To the extent that any repurchase transaction exceeds one business day, the collateral is valued on a daily basis to determine its adequacy. If the counterparty defaults and the value of the collateral declines or if bankruptcy proceedings are commenced with respect to the counterparty of the security, realization of the collateral by the Fund may be delayed or limited. The Fund held a repurchase agreement of $959,000 as of April 30, 2011.
(c) Foreign Currency Translation:
Australian Dollar amounts are translated into U.S. Dollar on the following basis:
| (i) | | market value of investment securities, other assets and liabilities – at the exchange rates at the current daily rates of exchange; and |
| (ii) | | purchases and sales of investment securities, income and expenses – at the rate of exchange prevailing on the respective dates of such transactions. |
The Fund isolates that portion of the results of operations arising from changes in the foreign exchange rates due to the fluctuations in the market prices of the securities held at the end of the reporting period. Similarly, the Fund isolates the effect of changes in foreign exchange rates from the fluctuations arising from changes in the market prices of portfolio securities sold during the reporting period.
Aberdeen Australia Equity Fund, Inc.
11
Notes to Financial Statements (unaudited) (continued)
April 30, 2011
Net exchange gain/(loss) is realized from sales and maturities of portfolio securities, sales of foreign currencies, settlement of securities transactions, dividends, interest and foreign withholding taxes recorded on the Fund’s books. Net unrealized foreign exchange appreciation/(depreciation) includes changes in the value of portfolio securities and other assets and liabilities arising as a result of changes in the exchange rate. The net realized and unrealized foreign exchange gain/(loss) shown in the composition of net assets represents foreign exchange gain/(loss) for book purposes that may not have been recognized for tax purposes.
Foreign security and currency transactions may involve certain considerations and risks not typically associated with those of domestic origin, including unanticipated movements in the value of the foreign currency relative to the U.S. Dollar. Generally, when the U.S. Dollar rises in value against foreign currency, the Fund’s investments denominated in that currency will lose value because its currency is worth fewer U.S. Dollars; the opposite effect occurs if the U.S. Dollar falls in relative value.
(d) Forward Foreign Currency Exchange Contracts:
A forward foreign currency exchange contract (“forward contract”) involves an obligation to purchase and sell a specific currency at a future date at a price set at the time of the contract. The Fund may enter into forward contracts in connection with security transactions or to hedge the U.S. Dollar value of portfolio securities denominated in Australian Dollars. The forward contract is marked-to-market daily and the change in market value is recorded by the Fund as unrealized appreciation or depreciation. Forwards prices are received daily from an independent pricing provider. When the forward contract is closed, the Fund records a realized gain or loss equal to the difference between the value at the time it was opened and the value at the time it was closed. These unrealized and realized gains and losses are reported on the Statement of Operations. The Fund could be exposed to risks if the counterparties to the contracts are unable to meet the terms of their contracts and from unanticipated movements in exchange rates. There were no forward contracts outstanding as of April 30, 2011.
(e) Security Transactions and Investment Income:
Securities transactions are recorded on the trade date. Realized and unrealized gains/(losses) from security and currency transactions are calculated on the identified cost basis. Dividend income is recorded on the ex-dividend date except for certain dividends on foreign securities, which are recorded as soon as the Fund is informed after the ex-dividend date. Interest income is recorded on an accrual basis. Expenses are recorded on an accrual basis.
(f) Distributions:
The Fund has a managed distribution policy of paying quarterly distributions at an annual rate, set once a year, that is a percentage of the rolling average of the Fund’s prior four quarter-end net asset values. In March 2011, the Board determined the rolling distribution rate to be 10% for the 12 month period commencing with the distribution payable in April 2011. This policy is subject to regular review by the Board. Under the policy, distributions will be made from current income, supplemented by realized capital gains and, to the extent necessary, paid-in capital.
On an annual basis, the Fund intends to distribute its net realized capital gains, if any, by way of a final distribution to be declared during the calendar quarter ending December 31. Dividends and distributions to shareholders are recorded on the ex-dividend date.
Dividends and distributions to shareholders are determined in accordance with federal income tax regulations, which may differ from GAAP. These differences are primarily due to differing treatments for foreign currencies.
(g) Federal Income Taxes:
For federal income and excise tax purposes, substantially all of the Fund’s transactions are accounted for using the Australian Dollar as the functional currency. Accordingly, only realized currency gains/(losses) resulting from the repatriation of Australian Dollars into U.S. Dollars are recognized for U.S. federal tax purposes.
The Fund intends to qualify or continue to qualify as a “regulated investment company” by complying with the provisions available to certain investment companies, as defined in Subchapter M of the Internal Revenue Code, and to make distributions of net investment income and net realized capital gains sufficient to relieve the Fund from all, or substantially all, federal income taxes. Therefore, no federal income tax provision is required.
Management of the Fund has concluded that there are no significant uncertain tax positions that would require recognition in the financial statements. Since tax authorities can examine previously filed tax returns, the Fund’s U.S. federal and state tax returns for each of the four fiscal years up to the period ended October 31, 2010 are subject to such review.
2. Agreements
Aberdeen Asset Management Asia Limited (the “Investment Manager”) serves as investment manager to the Fund and Aberdeen Asset Management Limited (the “Investment Adviser”) serves as investment adviser to the Fund, pursuant to a management agreement and an advisory agreement, respectively. The Investment
Aberdeen Australia Equity Fund, Inc.
12
Notes to Financial Statements (unaudited) (continued)
April 30, 2011
Adviser is an indirect, wholly-owned subsidiary of the Investment Manager, which is a direct, wholly-owned subsidiary of Aberdeen Asset Management PLC.
The Investment Manager makes investment decisions on behalf of the Fund on the basis of recommendations and information furnished to it by the Investment Adviser, including the selection of, and responsibility for the placement of orders with, brokers and dealers to execute portfolio transactions on behalf of the Fund.
The management agreement provides the Investment Manager with a fee, payable monthly, at the following annual rates: 1.10% of the Fund’s average weekly Managed Assets up to $50 million, 0.90% of Managed Assets between $50 million and $100 million and 0.70% of Managed Assets in excess of $100 million. Managed Assets are defined in the management agreement as net assets plus the
amount of any borrowings for investment purposes.
The Investment Manager pays fees to the Investment Adviser for its services rendered. The Investment Manager informed the Fund that it paid $249,922 to the Investment Adviser during the six months ended April 30, 2011.
Aberdeen Asset Management Inc. (“AAMI”), an affiliate of the Investment Manager and the Investment Adviser, is the Fund’s administrator, pursuant to an agreement under which AAMI receives a fee, payable monthly, at an annual fee rate of 0.08% of the Fund’s average weekly Managed Assets up to $500 million, 0.07% of the Fund’s average weekly Managed Assets between $500 million and $1.5 billion, and 0.06% of the Fund’s average weekly Managed Assets in excess of $1.5 billion.
Under terms of an Investor Relations Services Agreement, AAMI serves as the Fund’s investor relations services provider. During the six months ended April 30, 2011, the Fund incurred fees of approximately $75,024. Investor relations fees and expenses in the Statement of Operations include certain out-of-pocket expenses.
3. Investment Transactions
Purchases and sales of investment securities (excluding short-term securities) for the six months ended April 30, 2011, were $47,168,063 and $24,409,926, respectively.
4. Capital
There are 30 million shares of $0.01 par value common stock authorized. At April 30, 2011, there were 21,777,602 shares of common stock issued and outstanding.
The Fund has filed a “shelf” registration statement with the SEC, which would permit the Fund to issue up to $130 million in shares of
common stock through one or more public offerings. On December 9, 2010, the Fund announced the pricing of a public offering of its shares of common stock under which the Fund agreed to sell a total of 2,500,000 shares of common stock at a price of $12.50 per share. The offering closed on December 14, 2010. The net proceeds of the offering, which were approximately $30 million, were used to make additional portfolio investments that are consistent with the Fund’s investment objectives and policies. Under the shelf registration statement, the Fund may also sell the Fund’s common shares in one or more at-the-market offerings when market conditions are considered favorable. Such shares would only be issued when the premium to net asset value is greater than the costs associated with the transaction. Any proceeds raised would be used for investment purposes. Through April 30, 2011, there were no shares sold through the at-the-market offering.
On March 1, 2001, the Board approved a stock repurchase program. The Board amended the program on December 12, 2007. The stock repurchase program allows the Fund to repurchase up to 10% of its outstanding common stock in the open market during any 12-month period, if and when the discount to NAV is at least 8%. For the six months ended April 30, 2011 and fiscal year ended October 31, 2010, the Fund did not purchase any shares through this program.
5. Risks Associated with Foreign Securities and Currencies
Investments in securities of foreign issuers carry certain risks not ordinarily associated with investments in securities of U.S. issuers. These risks include future political and economic developments, and the possible imposition of exchange controls or other foreign governmental laws and restrictions. In addition, with respect to certain countries, there is the possibility of expropriation of assets, confiscatory taxation, political or social instability or diplomatic developments, which could adversely affect investments in those countries.
Certain countries also may impose substantial restrictions on investments in their capital markets by foreign entities, including restrictions on investments in issuers of industries deemed sensitive to relevant national interests. These factors may limit the investment opportunities available and result in a lack of liquidity and high price volatility with respect to securities of issuers from developing countries.
6. Contingencies
In the normal course of business, the Fund may provide general indemnifications pursuant to certain contracts and organizational documents. The Fund’s maximum exposure under these arrangements is dependent on future claims that may be made
Aberdeen Australia Equity Fund, Inc.
13
Notes to Financial Statements (unaudited) (concluded)
April 30, 2011
against the Fund, and therefore, cannot be estimated; however, based on experience, the risk of loss from such claims is considered remote.
7. Tax Cost of Investments
The United States federal income tax basis of the Fund’s investments and the net unrealized appreciation as of April 30, 2011 were as follows:
| | | | | | | | | | | | | | |
| Cost | | | Appreciation | | | Depreciation | | | Net Unrealized Appreciation | |
| | $ 170,569,396 | | | $ | 100,015,379 | | | $ | 4,144,020 | | | $ | 95,871,359 | |
8. Subsequent Events
Management has evaluated the need for disclosures and/or adjustments resulting from subsequent events through the date the Financial Statements were issued. Based on this evaluation, no disclosures or adjustments were required to the Financial Statements as of April 30, 2011 other than the following disclosed subsequent event.
The Fund declared a quarterly distribution of $0.29 cents per share payable on July 15, 2011 to shareholders of record as of June 30, 2011.
Through June 10, 2011 the Fund sold 228,182 shares through the at-the-market offering.
Supplemental Information (unaudited)
Results of Annual Meeting of Shareholders
The Annual Meeting of Shareholders was held on Tuesday, March 15, 2011 at 1735 Market Street, Philadelphia, Pennsylvania. The description of the proposals and number of shares voted at the meeting are as follows:
1. To elect three directors to serve as Class II directors for three year terms and until their successors are duly elected to qualify:
| | | | | | | | |
| | | Votes For | | | Votes Withheld | |
P. Gerald Malone | | | 18,923,138 | | | | 434,449 | |
Peter D. Sacks | | | 18,943,819 | | | | 418,769 | |
Hugh Young | | | 18,826,224 | | | | 536,364 | |
Directors whose term of office continued beyond this meeting are as follows: Neville J. Miles, William J. Potter, Moritz Sell, Brian M. Sherman and John T. Sheehy.
Aberdeen Australia Equity Fund, Inc.
14
Corporate Information
Directors
Neville J. Miles, Chairman
P. Gerald Malone
William J. Potter
Peter D. Sacks
Moritz Sell
John T. Sheehy
Brian Sherman
Hugh Young
Officers
Christian Pittard, President
Jeffrey Cotton, Chief Compliance Officer and Vice President – Compliance
Andrea Melia, Treasurer and Principal Accounting Officer
Megan Kennedy, Vice President and Secretary
Lucia Sitar, Vice President
Mark Daniels, Vice President
Martin Gilbert, Vice President
Alan Goodson, Vice President
Jennifer Nichols, Vice President
Timothy Sullivan, Vice President
Sharon Greenstein, Assistant Treasurer
Matthew Keener, Assistant Secretary
Investment Manager
Aberdeen Asset Management Asia Limited
21 Church Street
#01-01 Capital Square Two
Singapore 049480
Investment Adviser
Aberdeen Asset Management Limited
Level 6, 201 Kent Street
Sydney, NSW 2000, Australia
Administrator
Aberdeen Asset Management Inc.
1735 Market Street, 32nd Floor
Philadelphia, PA 19103
Custodian
State Street Bank and Trust Company
One Heritage Drive
North Quincy, MA 02171
Transfer Agent
Computershare Trust Company, N.A.
P.O. Box 43078
Providence, RI 02940
Independent Registered Public Accounting Firm
KPMG LLP
1601 Market Street
Philadelphia, PA 19103
Legal Counsel
Willkie Farr & Gallagher LLP
787 Seventh Ave
New York, NY 10019
Investor Relations
Aberdeen Asset Management Inc.
1735 Market Street, 32nd Floor
Philadelphia, PA 19103
1-866-839-5205
InvestorRelations@aberdeen-asset.com

Aberdeen Asset Management Asia Limited
The accompanying Financial Statements as of April 30, 2011, were not audited and accordingly, no opinion is expressed thereon.
Notice is hereby given in accordance with Section 23(c) of the Investment Company Act of 1940 that the Fund may purchase, from time to time, shares of its common stock in the open market.
Shares of Aberdeen Australia Equity Fund, Inc. are traded on the NYSE Amex Equities Exchange under the symbol “IAF”. Information about the Fund’s net asset value and market price is available at www.aberdeeniaf.com.
This report, including the financial information herein, is transmitted to the shareholders of Aberdeen Australia Equity Fund, Inc. for their general information only. It does not have regard to the specific investment objectives, financial situation and the particular needs of any specific person. Past performance is no guarantee of future returns.
Item 2 – Code of Ethics.
Not applicable to this filing.
Item 3 – Audit Committee Financial Expert.
Not required to be included in this filing.
Item 4 – Principal Accountant Fees and Services.
Not required to be included in this filing.
Item 5 – Audit Committee of Listed Registrants.
Not required to be included in this filing.
Item 6 – Investments.
(a) Included as part of the Report to Stockholders filed under Item 1 of this Form N-CSR.
(b) Not applicable.
Item 7 – Disclosure of Proxy Voting Policies and Procedures for Closed-End Management Investment Companies.
Not required to be included in this filing.
Item 8 – Portfolio Managers of Closed-End Management Investment Companies.
(a) Not required to be included in this filing
| | (b) | During the period ended April 30, 2011, there were no changes in any of the Portfolio Managers identified in the Registrant’s Annual Report on Form N-CSR filed on January 7, 2011. |
Item 9 – Purchases of Equity Securities by Closed-End Management Investment Company and Affiliated Purchasers.
REGISTRANT PURCHASES OF EQUITY SECURITIES
| | | | | | | | |
Period | | (a)
Total
Number of
Shares
Purchased | | (b)
Average
Price Paid
per Share | | (c)
Total Number of
Shares Purchased as
Part of Publicly
Announced Plans or
Programs 1 | | (d)
Maximum Number of
Shares That May Yet
Be Purchased Under the Plans or Programs 1 |
November 1 through November 30, 2010 | | 0 | | 0 | | 0 | | 1,927,760 |
December 1 through December 31, 2010 | | 0 | | 0 | | 0 | | 1,927,760 |
January 1 through January 31, 2011 | | 0 | | 0 | | 0 | | 2,177,760 |
February 1 through February 29, 2011 | | 0 | | 0 | | 0 | | 2,177,760 |
March 1 through March 31, 2011 | | 0 | | 0 | | 0 | | 2,177,760 |
April 1 through April 30, 2011 | | 0 | | 0 | | 0 | | 2,177,760 |
Total | | 0 | | 0 | | 0 | | - |
1 The Registrant’s stock repurchase program was announced on March 19, 2001 and further amended by the Registrant’s Board of Directors on December 12, 2007. Under the terms of the current program, the Registrant is permitted to repurchase up to 10% of its outstanding shares of common stock, par value $.01 per share, on the open market during any 12 month period if and when the discount to net asset value is at least 8%.
Item 10 – Submission of Matters to a Vote of Security Holders.
During the period ended April 30, 2011, the were no material changes to the policies by which stockholders may recommend nominees to the Fund’s Board.
Item 11 – Controls and Procedures.
| | (a) | It is the conclusion of the Registrant’s principal executive officer and principal financial officer that the effectiveness of the Registrant’s current disclosure controls and procedures (such disclosure controls and procedures having been evaluated within 90 days of the date of this filing) provide reasonable assurance that the information required to be disclosed by the Registrant has been recorded, processed, summarized and reported within the time period specified in the Commission’s rules and forms and that the information required to be disclosed by the Registrant has been accumulated and communicated to the Registrant’s principal executive officer and principal financial officer in order to allow timely decisions regarding required disclosure. |
| | (b) | There have been no changes in the Registrant’s internal control over financial reporting that occurred during the second fiscal quarter of the period covered by this report that have materially affected, or are reasonably likely to materially affect, the Registrant’s internal control over financial reporting. |
Item 12 – Exhibits.
| | (a)(2) | Certifications pursuant to Rule 30a-2(a) under the Investment Company Act of 1940, as amended. |
| | (b) | Certifications pursuant to Rule 30a-2(b) under the Investment Company Act of 1940, as amended. |
| | (c) | A copy of the Registrant’s notices to stockholders, which accompanied distributions paid, pursuant to the Registrant’s Managed Distribution Policy since the Registrant’s last filed N-CSR, are filed herewith as Exhibits (c)(1) and (c)(2), as required by the terms of the Registrant’s SEC exemptive order. |
SIGNATURES
Pursuant to the requirements of the Securities Exchange Act of 1934 and the Investment Company Act of 1940, the Registrant has duly caused this report to be signed on its behalf by the undersigned, thereunto duly authorized.
Aberdeen Australia Equity Fund, Inc.
| | |
| By: | | /s/ Christian Pittard |
| | Christian Pittard, |
| | President of |
| | Aberdeen Australia Equity Fund, Inc. |
Date: July 7, 2011
Pursuant to the requirements of the Securities Exchange Act of 1934 and the Investment Company Act of 1940, this report has been signed below by the following persons on behalf of the Registrant and in the capacities and on the dates indicated.
| | |
| By: | | /s/ Christian Pittard |
| | Christian Pittard, |
| | President of |
| | Aberdeen Australia Equity Fund, Inc. |
Date: July 7, 2011
| | |
| By: | | /s/ Andrea Melia |
| | Andrea Melia, |
| | Treasurer of |
| | Aberdeen Australia Equity Fund, Inc. |
Date: July 7, 2011
Exhibit List
12(a)(2) – Rule 30a-2(a) Certifications
12(b) – Rule 30a-2(b) Certifications
12(c)(1) Distribution notice to stockholders
12(c)(2) – Distribution notice to stockholders