EXHIBIT (17)(a)(i)
EATON VANCE CALIFORNIA LIMITED MATURITY MUNICIPAL INCOME FUND
Supplement to Prospectus dated August 1, 2009 |
The Board of Trustees of the fund named above (the "Fund") recently approved a proposal to reorganize the Fund into Eaton Vance National Limited Maturity Municipal Income Fund, a series of Eaton Vance Investment Trust with substantially the same investment objective as the Fund. Proxy materials describing the proposed reorganization are expected to be mailed in September 2010 to the Fund’s record date shareholders. If shareholders of the Fund approve the reorganization, it is expected to be completed in the fourth quarter of 2010. For additional information regarding the investment strategies and principal risks of National Limited Maturity Municipal Income Fund, please see that fund’s prospectus, which can be located at http://funddocuments.eatonvance.com.
After the close of business on June 18, 2010, the Fund will be closed to new investors.
| | |
| June 14, 2010 | 4646-6/10 | LTDP8/1PS |
EATON VANCE ALABAMA MUNICIPALS FUND
EATON VANCE ARKANSAS MUNICIPALS FUND
EATON VANCE GEORGIA MUNICIPALS FUND
EATON VANCE KENTUCKY MUNICIPALS FUND
EATON VANCE LOUISIANA MUNICIPALS FUND
EATON VANCE MARYLAND MUNICIPALS FUND
EATON VANCE MISSOURI MUNICIPALS FUND
EATON VANCE NORTH CAROLINA MUNICIPALS FUND
EATON VANCE OREGON MUNICIPALS FUND
EATON VANCE SOUTH CAROLINA MUNICIPALS FUND
EATON VANCE TENNESSEE MUNICIPALS FUND
EATON VANCE VIRGINIA MUNICIPALS FUND
Supplement to Prospectus dated January 1, 2009
EATON VANCE CALIFORNIA MUNICIPALS FUND
EATON VANCE MASSACHUSETTS MUNICIPALS FUND
EATON VANCE NATIONAL MUNICIPALS FUND
EATON VANCE NEW YORK MUNICIPALS FUND
EATON VANCE OHIO MUNICIPALS FUND
EATON VANCE RHODE ISLAND MUNICIPALS FUND
Supplement to Prospectuses dated February 1, 2009
EATON VANCE AMT-FREE MUNICIPAL BOND FUND
Supplement to Prospectus dated May 1, 2009
EATON VANCE HIGH YIELD MUNICIPALS FUND
EATON VANCE INSURED MUNICIPALS FUND
EATON VANCE KANSAS MUNICIPALS FUND
Supplement to Prospectuses dated June 1, 2009
EATON VANCE AMT-FREE LIMITED MATURITY MUNICIPALS FUND
EATON VANCE CALIFORNIA LIMITED MATURITY MUNICIPALS FUND
EATON VANCE MASSACHUSETTS LIMITED MATURITY MUNICIPALS FUND
EATON VANCE NATIONAL LIMITED MATURITY MUNICIPALS FUND
EATON VANCE NEW JERSEY LIMITED MATURITY MUNICIPALS FUND
EATON VANCE NEW YORK LIMITED MATURITY MUNICIPALS FUND
EATON VANCE PENNSYLVANIA LIMITED MATURITY MUNICIPALS FUND
Supplement to Prospectuses dated August 1, 2009 |
Effective December 1, 2009, each Fund will change its name as follows:
| | Eaton Vance Alabama Municipal Income Fund
Eaton Vance AMT-Free Limited Maturity Municipal Income Fund
Eaton Vance AMT-Free Municipal Income Fund
Eaton Vance Arkansas Municipal Income Fund
Eaton Vance California Limited Maturity Municipal Income Fund
Eaton Vance California Municipal Income Fund
Eaton Vance Georgia Municipal Income Fund
Eaton Vance High Yield Municipal Income Fund
Eaton Vance Insured Municipal Income Fund
Eaton Vance Kansas Municipal Income Fund
Eaton Vance Kentucky Municipal Income Fund
Eaton Vance Louisiana Municipal Income Fund
Eaton Vance Maryland Municipal Income Fund
Eaton Vance Massachusetts Limited Maturity Municipal Income Fund |
| | Eaton Vance Massachusetts Municipal Income Fund
Eaton Vance Missouri Municipal Income Fund
Eaton Vance National Limited Maturity Municipal Income Fund
Eaton Vance National Municipal Income Fund
Eaton Vance New Jersey Limited Maturity Municipal Income Fund
Eaton Vance New York Limited Maturity Municipal Income Fund
Eaton Vance New York Municipal Income Fund
Eaton Vance North Carolina Municipal Income Fund
Eaton Vance Ohio Municipal Income Fund
Eaton Vance Oregon Municipal Income Fund
Eaton Vance Pennsylvania Limited Maturity Municipal Income Fund
Eaton Vance Rhode Island Municipal Income Fund
Eaton Vance South Carolina Municipal Income Fund
Eaton Vance Tennessee Municipal Income Fund
Eaton Vance Virginia Municipal Income Fund |
In addition, the following changes to Eaton Vance Insured Municipals Fund are effective immediately:
1. The following replaces the fourth sentence in the paragraph under “Investment Objectives and Principal Strategies” under “Fund Summaries”:
The Insured Fund primarily invests in municipal obligations that are insured as to principal and interest payments by insurers having a claims-paying ability rated at least investment grade.
2. The following replaces the third paragraph under “Investment Objectives & Principal Policies and Risks” in its entirety:
At least 80% of the Insured Fund’s net assets will normally be invested in obligations that are insured as to principal and interest payments by insurers having a claims-paying ability rated at least investment grade (i.e., rated Baa or higher by Moody’s or BBB or higher by S&P or Fitch). The Insured Fund may invest up to 20% of its net assets in unrated obligations deemed by the investment adviser to be of investment grade quality and obligations that are uninsured. Insurance does not protect the market value of insured obligations or the net asset value of the Insured Fund. The value of an obligation will be affected by the credit standing of its insurer.
| | |
| November 2, 2009 | 4187-11/09 | COMBPROPS |
2
EATON VANCE FLOATING-RATE ADVANTAGE FUND
EATON VANCE FLOATING-RATE FUND
EATON VANCE FLOATING-RATE & HIGH INCOME FUND
Supplement to Prospectus dated March 1, 2009
EATON VANCE AMT-FREE LIMITED MATURITY MUNICIPALS FUND
EATON VANCE CALIFORNIA LIMITED MATURITY MUNICIPALS FUND
EATON VANCE MASSACHUSETTS LIMITED MATURITY MUNICIPALS FUND
EATON VANCE NATIONAL LIMITED MATURITY MUNICIPALS FUND
EATON VANCE NEW JERSEY LIMITED MATURITY MUNICIPALS FUND
EATON VANCE NEW YORK LIMITED MATURITY MUNICIPALS FUND
EATON VANCE PENNSYLVANIA LIMITED MATURITY MUNICIPALS FUND
Supplement to Prospectuses dated August 1, 2009 |
The following changes to each Fund’s prospectus are effective October 12, 2009:
1. The following replaces the table in "Class A Front-End Sales Charge." under "Sales Charges":
| | | |
| | Sales Charge* | Sales Charge* | Dealer Commission |
| | as Percentage of | as Percentage of Net | as Percentage of |
| Amount of Purchase | Offering Price | Amount Invested | Offering Price |
|
| Less than $100,000 | 2.25% | 2.30% | 2.00% |
| $100,000 but less than $250,000 | 1.75% | 1.78% | 1.50% |
| $250,000 but less than $500,000 | 1.50% | 1.52% | 1.25% |
| $500,000 but less than $1,000,000 | 1.00% | 1.01% | 0.85% |
| $1,000,000 or more | 0.00** | 0.00** | 0.75% |
| * | Because the offering price per share is rounded to two decimal places, the actual sales charge you pay on a purchase of Class A shares may be more or less than your total purchase amount multiplied by the applicable sales charge percentage. |
| ** | No sales charge is payable at the time of purchase on investments of $1 million or more. A CDSC of 1.00% will be imposed on such investments (as described below) in the event of redemptions within 18 months of purchase. |
| EATON VANCE MISSISSIPPI MUNICIPALS FUND
EATON VANCE WEST VIRGINIA MUNICIPALS FUND
Supplement to Prospectus dated February 1, 2009
EATON VANCE HAWAII MUNICIPALS FUND
Supplement to Prospectus dated June 1, 2009
EATON VANCE OHIO LIMITED MATURITY
MUNICIPALS FUND
Supplement to Prospectus dated August 1, 2009 |
Effective after the close of business on September 18, 2009,
shares of each Fund will no longer be available for purchase
or exchange. |
| |
| September 18, 2009 | COMBSTATEPS |

Eaton Vance California Limited Maturity Municipals Fund
Eaton Vance Massachusetts Limited Maturity Municipals Fund
Eaton Vance New Jersey Limited Maturity Municipals Fund
Eaton Vance New York Limited Maturity Municipals Fund
Eaton Vance Ohio Limited Maturity Municipals Fund
Eaton Vance Pennsylvania Limited Maturity Municipals Fund
| Mutual funds seeking tax-exempt income and limited principal fluctuation |
Prospectus Dated
August 1, 2009 |
The Securities and Exchange Commission has not approved or disapproved these securities or
determined whether this prospectus is truthful or complete. Any representation to the contrary
is a criminal offense. |
This prospectus contains important information about the Funds and the services
available to shareholder. Please save it for reference.
| |
| Table of Contents | |
| |
| Fund Summaries | 3 |
| California Fund | 4 |
| Massachusetts Fund | 5 |
| New Jersey Fund | 6 |
| New York Fund | 7 |
| Ohio Fund | 8 |
| Pennsylvania Fund | 9 |
| Fund Fees and Expenses | 10 |
| Investment Objectives & Principal Policies and Risks | 12 |
| Management and Organization | 14 |
| Valuing Shares | 15 |
| Purchasing Shares | 15 |
| Sales Charges | 18 |
| Redeeming Shares | 20 |
| Shareholder Account Features | 20 |
| Tax Information | 22 |
| Financial Highlights | 25 |
| California Fund | 25 |
| Massachusetts Fund | 27 |
| New Jersey Fund | 29 |
| New York Fund | 31 |
| Ohio Fund | 33 |
| Pennsylvania Fund | 35 |
2
Fund Summaries
This section summarizes the investment objectives, and principal strategies and risks of investing in an Eaton Vance Limited Maturity Municipals Fund. You will find more specific information about each Fund in the pages that follow.
Investment Objectives and Principal Strategies
The investment objective of each Fund is to provide a high level of current income exempt from regular federal income tax and from particular state or local income or other taxes, as applicable, and limited principal fluctuation. Under normal market conditions, each Fund will invest at least 80% of its net assets in municipal obligations that are exempt from regular federal income tax and from state taxes which, in accordance with the Fund’s investment objective, the Fund seeks to avoid. Each Fund primarily invests in investment grade municipal obligations (those rated BBB or Baa or higher), but may also invest in lower rated obligations. Each Fund invests in obligations to seek to maintain a dollar-weighted average portfolio duration of between three and nine years.
Each Fund may concentrate in certain types of municipal obligations (such as industrial development bonds, housing bonds, hospital bonds or utility bonds), so Fund shares could be affected by events that adversely affect a particular sector. Each Fund may purchase derivative instruments (such as futures contracts and options thereon, and interest rate swaps), bonds that do not make regular payments of interest, bonds issued on a “when issued” basis and municipal leases. A portion of each Fund’s distributions generally will be subject to alternative minimum tax.
Each portfolio manager purchases and sells securities to maintain a competitive yield and to enhance return based upon the relative value of the securities in the marketplace. The portfolio managers may also trade securities to minimize taxable capital gains to shareholders. The managers attempt to limit principal fluctuation by investing to limit overall portfolio duration.
Principal Risk Factors
The value of Fund shares may change when interest rates change. When interest rates rise, the value of Fund shares typically will decline. Fund yields will also fluctuate over time. Each Fund invests a significant portion of assets in obligations of issuers located in a single state and is sensitive to factors affecting that state, such as changes in the economy, decreases in tax collection or the tax base, legislation which limits taxes and changes in issuer credit ratings. Because obligations rated BBB or Baa and obligations rated below BBB or Baa (so-called “junk bonds”) are more sensitive to the financial soundness of their issuers than higher quality obligations, Fund shares may fluctuate more in value than shares of a fund investing solely in higher quality obligations. Obligations rated BBB or Baa have speculative characteristics, while lower rated obligations are predominantly speculative.
A Fund’s use of derivatives may expose the Fund to increased risk of principal loss due to imperfect correlation, failure of the counterparty and unexpected price or interest rate movements. Bonds that do not make regular interest payments may experience greater volatility in response to interest rate changes. When-issued securities are subject to the risk that when delivered to the Fund they will be worth less than the price the Fund agreed to pay for them. Municipal leases often require a legislative appropriation of funds for payment. If the necessary appropriation is not made, the issuer of the lease may not be able to meet its obligations.
As a non-diversified fund, each Fund may invest a larger portion of its assets in the obligations of a limited number of issuers than may a diversified fund. This makes each Fund more susceptible to adverse economic, business or other developments affecting such issuers. Each Fund may invest, with respect to 50% of its total assets, more than 5% (but not more than 25%) of its total assets in securities of any one issuer, such limitations do not apply to U.S. Government securities.
No Fund is a complete investment program and you may lose money by investing in a Fund. There is no guarantee that a Fund will be able to achieve its investment objective. An investment in a Fund is not a deposit in a bank and is not insured or guaranteed by the Federal Deposit Insurance Corporation or any other government agency.
3
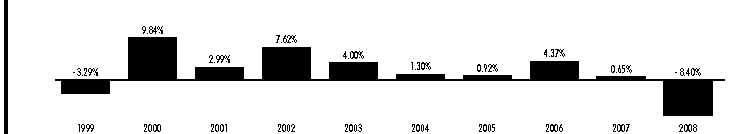
Eaton Vance California Limited Maturity Municipals Fund
The California Fund’s investment objective is to provide a high level of current income exempt from regular federal income tax and California state personal income taxes, and limited principal fluctuation.
Performance Information. The following bar chart and table provide information about the California Fund’s performance for each calendar year through December 31, 2008. The returns in the bar chart are for Class B shares and do not reflect a sales charge. If the sales charge was reflected, the returns would be lower. The table contains returns for each Class of shares and a comparison to the performance of a national index of intermediate-maturity municipal obligations. Returns in the table for Class B shares are shown before and after the reduction of taxes. Although past performance (both before and after taxes) is no guarantee of future results, this performance information demonstrates the risk that the value of your investment will change.

During the ten years ended December 31, 2008, the highest quarterly total return for Class B was 5.13% for the quarter ended September 30, 2002, and the lowest quarterly return was –6.43% for the quarter ended December 31, 2008. The year-to-date total return through the end of the most recent calendar quarter (December 31, 2008 to June 30, 2009) was 8.86%. For the 30 days ended March 31, 2009, the SEC yield and SEC tax-equivalent yield (assuming a combined state and federal income tax rate of 41.05%) for Class A shares were 3.69% and 6.26%, respectively, for Class B shares were 3.02% and 5.12%, respectively, and for Class C shares were 3.01% and 5.11%, respectively. A lower tax rate would result in lower tax-equivalent yields. For current yield information call 1-800-262-1122.
| | | |
| | One | Five | Ten |
| Average Annual Total Return as of December 31, 2008 | Year | Years | Years |
|
| Class A Return Before Taxes | –11.83% | –0.29% | 2.16% |
| Class B Return Before Taxes | –13.10% | –0.59% | 1.61% |
| Class B Return After Taxes on Distributions | –13.10% | –0.59% | 1.59% |
| Class B Return After Taxes on Distributions and the Sale of Class B Shares | –7.46% | –0.03% | 1.85% |
| Class C Return Before Taxes | –11.37% | –0.60% | 1.60% |
| Barclays Capital 7 Year Municipal Bond Index (reflects no deduction for fees, expenses or taxes) | 4.59% | 3.69% | 4.80% |
These returns reflect the maximum sales charge for Class A (2.25%) and any applicable contingent deferred sales charge ("CDSC") for Class B and Class C. The Class C performance shown above for the period prior to March 23, 2005 is the performance of Class B shares, adjusted for the sales charge that applies to Class C shares (but not adjusted for any other differences in the expenses of the classes). Barclays Capital 7 Year Municipal Bond Index is an unmanaged index of intermediate-maturity municipal obligations. Investors cannot invest directly in an Index. (Source for Barclays Capital 7 Year Municipal Bond Index: Lipper, Inc.)
Total returns are historical and are calculated by determining the percentage change in net asset value or public offering price with all distributions reinvested. The Fund's past performance (both before and after taxes) is no guarantee of future results. Investment return and principal value of Fund shares will fluctuate so that shares, when redeemed, may be worth more or less than their original cost. Performance is for the stated time period only; due to market volatility, the Fund's current performance may be lower or higher than the quoted return. For the Fund’s performance as of the most recent month-end, please refer to www.eatonvance.com.
After-tax returns are calculated using certain assumptions. After-tax returns are calculated using the highest historical individual federal income tax rates and do not reflect the impact of state and local taxes. Actual after-tax returns depend on a shareholder’s tax situation and the actual characterization of distributions, and may differ from those shown. After-tax returns are not relevant to shareholders who hold shares in tax-deferred accounts or to shares held by non-taxable entities. After-tax returns for other Classes of shares will vary from the after-tax returns presented for Class B shares. Return After Taxes on Distributions for a period may be the same as Return Before Taxes for that period because no taxable distributions were made during that period. Also, Return After Taxes on Distributions and Sale of Fund Shares for a period may be greater than or equal to Return After Taxes on Distributions for the same period because of losses realized on the sale of Fund shares.
4
Eaton Vance Massachusetts Limited Maturity Municipals Fund
The Massachusetts Fund’s investment objective is to provide a high level of current income exempt from regular federal income tax and Massachusetts state personal income taxes, and limited principal fluctuation.
Performance Information. The following bar chart and table provide information about the Massachusetts Fund’s performance for each calendar year through December 31, 2008. The returns in the bar chart are for Class B shares and do not reflect a sales charge. If the sales charge was reflected, the returns would be lower. The table contains returns for each Class of shares and a comparison to the performance of a national index of intermediate-maturity municipal obligations. Returns in the table for Class B shares are shown before and after the reduction of taxes. Although past performance (both before and after taxes) is no guarantee of future results, this performance information demonstrates the risk that the value of your investment will change.

During the ten years ended December 31, 2008, the highest quarterly total return for Class B was 4.13% for the quarter ended September 30, 2002, and the lowest quarterly return was –2.75% for the quarter ended September 30, 2008. The year-to-date total return through the end of the most recent calendar quarter (December 31, 2008 to June 30, 2009) was 6.99%. For the 30 days ended March 31, 2009, the SEC yield and SEC tax-equivalent yield (assuming a combined state and federal income tax rate of 38.45%) for Class A shares were 2.92% and 4.74%, respectively, for Class B shares were 2.24% and 3.64%, respectively, and for Class C shares were 2.29% and 3.72%, respectively. A lower tax rate would result in lower tax-equivalent yields. For current yield information call 1-800-262-1122.
| | | |
| | One | Five | Ten |
| Average Annual Total Return as of December 31, 2008 | Year | Years | Years |
|
| Class A Return Before Taxes | –6.73% | 0.70% | 2.63% |
| Class B Return Before Taxes | –8.09% | 0.41% | 2.06% |
| Class B Return After Taxes on Distributions | –8.09% | 0.41% | 2.06% |
| Class B Return After Taxes on Distributions and the Sale of Class B Shares | –4.26% | 0.78% | 2.23% |
| Class C Return Before Taxes | –6.19% | 0.40% | 2.09% |
| Barclays Capital 7 Year Municipal Bond Index (reflects no deduction for fees, expenses or taxes) | 4.59% | 3.69% | 4.80% |
These returns reflect the maximum sales charge for Class A (2.25%) and any applicable CDSC for Class B and Class C. Barclays Capital 7 Year Municipal Bond Index is an unmanaged index of intermediate-maturity municipal obligations. Investors cannot invest directly in an Index. (Source for Barclays Capital 7 Year Municipal Bond Index: Lipper, Inc.)
Total returns are historical and are calculated by determining the percentage change in net asset value or public offering price with all distributions reinvested. The Fund's past performance (both before and after taxes) is no guarantee of future results. Investment return and principal value of Fund shares will fluctuate so that shares, when redeemed, may be worth more or less than their original cost. Performance is for the stated time period only; due to market volatility, the Fund's current performance may be lower or higher than the quoted return. For the Fund’s performance as of the most recent month-end, please refer to www.eatonvance.com.
After-tax returns are calculated using certain assumptions. After-tax returns are calculated using the highest historical individual federal income tax rates and do not reflect the impact of state and local taxes. Actual after-tax returns depend on a shareholder’s tax situation and the actual characterization of distributions, and may differ from those shown. After-tax returns are not relevant to shareholders who hold shares in tax-deferred accounts or to shares held by non-taxable entities. After-tax returns for other Classes of shares will vary from the after-tax returns presented for Class B shares. Return After Taxes on Distributions for a period may be the same as Return Before Taxes for that period because no taxable distributions were made during that period. Also, Return After Taxes on Distributions and Sale of Fund Shares for a period may be greater than or equal to Return After Taxes on Distributions for the same period because of losses realized on the sale of Fund shares.
5
Eaton Vance New Jersey Limited Maturity Municipals Fund |
The New Jersey Fund’s investment objective is to provide a high level of current income exempt from regular federal income tax and New Jersey state personal income taxes, and limited principal fluctuation.
Performance Information. The following bar chart and table provide information about the New Jersey Fund’s performance for each calendar year through December 31, 2008. The returns in the bar chart are for Class B shares and do not reflect a sales charge. If the sales charge was reflected, the returns would be lower. The table contains returns for each Class of shares and a comparison to the performance of a national index of intermediate-maturity municipal obligations. Returns in the table for Class B shares are shown before and after the reduction of taxes. Although past performance (both before and after taxes) is no guarantee of future results, this performance information demonstrates the risk that the value of your investment will change.
During the ten years ended December 31, 2008, the highest quarterly total return for Class B was 3.32% for the quarter ended December 31, 2000 and the lowest quarterly return was –2.95% for the quarter ended September 30, 2008. The year-to-date total return through the end of the most recent calendar quarter (December 31, 2008 to June 30, 2009) was 7.76%. For the 30 days ended March 31, 2009, the SEC yield and SEC tax-equivalent yield (assuming a combined state and federal income tax rate of 40.83%) for Class A shares were 2.99% and 5.05%, respectively, for Class B shares were 2.30% and 3.89%, respectively, and for Class C shares were 2.30% and 3.89%, respectively. A lower tax rate would result in lower tax-equivalent yields. For current yield information call 1-800-262-1122.
| | | |
| | One | Five | Ten |
| Average Annual Total Return as of December 31, 2008 | Year | Years | Years |
|
| Class A Return Before Taxes | –7.72% | 0.63% | 2.55% |
| Class B Return Before Taxes | –8.96% | 0.37% | 2.01% |
| Class B Return After Taxes on Distributions | –8.96% | 0.36% | 2.00% |
| Class B Return After Taxes on Distributions and the Sale of Class B Shares | –4.78% | 0.76% | 2.19% |
| Class C Return After Taxes on Distributions | –7.33% | 0.32% | 1.99% |
| Barclays Capital 7 Year Municipal Bond Index (reflects no deduction for fees, expenses or taxes) | 4.59% | 3.69% | 4.80% |
These returns reflect the maximum sales charge for Class A (2.25%) and any applicable CDSC for Class B and Class C. The Class C performance shown above for the period prior to August 1, 2006 is the performance of Class B shares, adjusted for the sales charge that applies to Class C shares (but not adjusted for any other differences in the expenses of the classes). Barclays Capital 7 Year Municipal Bond Index is an unmanaged index of intermediate-maturity municipal obligations. Investors cannot invest directly in an Index. (Source of Barclays Capital 7 Year Municipal Bond Index: Lipper, Inc.)
Total returns are historical and are calculated by determining the percentage change in net asset value or public offering price with all distributions reinvested. The Fund's past performance (both before and after taxes) is no guarantee of future results. Investment return and principal value of Fund shares will fluctuate so that shares, when redeemed, may be worth more or less than their original cost. Performance is for the stated time period only; due to market volatility, the Fund's current performance may be lower or higher than the quoted return. For the Fund’s performance as of the most recent month-end, please refer to www.eatonvance.com.
After-tax returns are calculated using certain assumptions. After-tax returns are calculated using the highest historical individual federal income tax rates and do not reflect the impact of state and local taxes. Actual after-tax returns depend on a shareholder’s tax situation and the actual characterization of distributions, and may differ from those shown. After-tax returns are not relevant to shareholders who hold shares in tax-deferred accounts or to shares held by non-taxable entities. After-tax returns for other Classes of shares will vary from the after-tax returns presented for Class B shares. Return After Taxes on Distributions for a period may be the same as Return Before Taxes for that period because no taxable distributions were made during that period. Also, Return After Taxes on Distributions and Sale of Fund Shares for a period may be greater than or equal to Return After Taxes on Distributions for the same period because of losses realized on the sale of Fund shares.
6
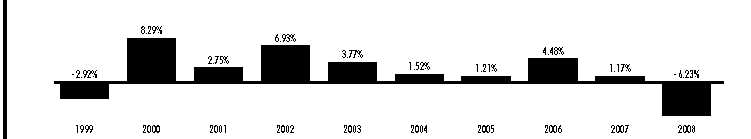
Eaton Vance New York Limited Maturity Municipals Fund
The New York Fund’s investment objective is to provide a high level of current income exempt from regular federal income tax and New York state and New York City personal income taxes, and limited principal fluctuation.
Performance Information. The following bar chart and table provide information about the New York Fund’s performance for each calendar year through December 31, 2008. The returns in the bar chart are for Class B shares and do not reflect a sales charge. If the sales charge was reflected, the returns would be lower. The table contains returns for each Class of shares and a comparison to the performance of a national index of intermediate-maturity municipal obligations. Returns in the table for Class B shares are shown before and after the reduction of taxes. Although past performance (both before and after taxes) is no guarantee of future results, this performance information demonstrates the risk that the value of your investment will change.
During the ten years ended December 31, 2008, the highest quarterly total return for Class B was 4.04% for the quarter ended December 31, 2000, and the lowest quarterly return was –4.23% for the quarter ended December 31, 2008. The year-to-date total return through the end of the most recent calendar quarter (December 31, 2008 to June 30, 2009) was 8.14%. For the 30 days ended March 31, 2009, the SEC yield and SEC tax-equivalent yield (assuming a combined state and federal income tax rate of 39.45%) for Class A shares were 3.66% and 6.04%, respectively, for Class B shares were 2.99% and 4.94%, respectively, and for Class C shares were 2.99% and 4.94%, respectively. A lower tax rate would result in lower tax-equivalent yields. For current yield information call 1-800-262-1122.
| | | |
| | One | Five | Ten |
| Average Annual Total Return as of December 31, 2008 | Year | Years | Years |
|
| Class A Return Before Taxes | –9.86% | –0.04% | 2.43% |
| Class B Return Before Taxes | –11.06% | –0.33% | 1.88% |
| Class B Return After Taxes on Distributions | –11.06% | –0.33% | 1.87% |
| Class B Return After Taxes on Distributions and the Sale of Class B Shares | –6.10% | 0.20% | 2.10% |
| Class C Return Before Taxes | –9.35% | –0.35% | 1.90% |
| Barclays Capital 7 Year Municipal Bond Index (reflects no deduction for fees, expenses or taxes) | 4.59% | 3.69% | 4.80% |
These returns reflect the maximum sales charge for Class A (2.25%) and any applicable CDSC for Class B and Class C. Barclays Capital 7 Year Municipal Bond Index is an unmanaged index of intermediate-maturity municipal obligations. Investors cannot invest directly in an Index. (Source for Barclays Capital 7 Year Municipal Bond Index: Lipper, Inc.)
Total returns are historical and are calculated by determining the percentage change in net asset value or public offering price with all distributions reinvested. The Fund's past performance (both before and after taxes) is no guarantee of future results. Investment return and principal value of Fund shares will fluctuate so that shares, when redeemed, may be worth more or less than their original cost. Performance is for the stated time period only; due to market volatility, the Fund's current performance may be lower or higher than the quoted return. For the Fund’s performance as of the most recent month-end, please refer to www.eatonvance.com.
After-tax returns are calculated using certain assumptions. After-tax returns are calculated using the highest historical individual federal income tax rates and do not reflect the impact of state and local taxes. Actual after-tax returns depend on a shareholder’s tax situation and the actual characterization of distributions, and may differ from those shown. After-tax returns are not relevant to shareholders who hold shares in tax-deferred accounts or to shares held by non-taxable entities. After-tax returns for other Classes of shares will vary from the after-tax returns presented for Class B shares. Return After Taxes on Distributions for a period may be the same as Return Before Taxes for that period because no taxable distributions were made during that period. Also, Return After Taxes on Distributions and Sale of Fund Shares for a period may be greater than or equal to Return After Taxes on Distributions for the same period because of losses realized on the sale of Fund shares.
7
| Eaton Vance Ohio Limited Maturity Municipals Fund |
The Ohio Fund’s investment objective is to provide a high level of current income exempt from regular federal income tax and Ohio state personal income taxes, and limited principal fluctuation. The Board of Trustees of the Ohio Fund has voted to recommend that shareholders approve the merger of the Ohio Fund into Eaton Vance National Limited Maturity Municipals Fund (the "National Fund"), a diversified national limited maturity municipal bond fund with substantially similar investment objectives and policies to the Ohio Fund (with the exception of policies to avoid particular state income taxes). Shareholders of the Fund will be asked to approve the merger at a special meeting scheduled to be held on September 25, 2009. If approved, the Ohio Fund will transfer its assets to the National Fund in exchange for shares of the National Fund, and the National Fund will assume the liabilities of the Ohio Fund. Immediately following this exchange, which will be effected on the basis of the relative net asset value of the Ohio Fund, the Ohio Fund will distribute shares of National Fund to its shareholders pro rata in liquidiation of the Ohio Fund.
Performance Information. The following bar chart and table provide information about the Ohio Fund’s performance for each calendar year through December 31, 2008. The returns in the bar chart are for Class B shares and do not reflect a sales charge. If the sales charge was reflected, the returns would be lower. The table contains returns for each Class of shares and a comparison to the performance of a national index of intermediate-maturity municipal obligations. Returns in the table for Class B shares are shown before and after the reduction of taxes. Although past performance (both before and after taxes) is no guarantee of future results, this performance information demonstrates the risk that the value of your investment will change.
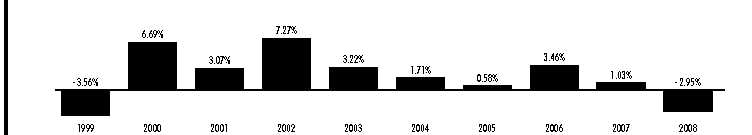
During the ten years ended December 31, 2008, the highest quarterly total return for Class B was 3.57% for the quarter ended September 30, 2002, and the lowest quarterly return was –2.21% for the quarter ended June 30, 2004. The year-to-date total return through the end of the most recent calendar quarter (December 31, 2008 to June 30, 2009) was 4.64%. For the 30 days ended March 31, 2009, the SEC yield and SEC tax-equivalent yield (assuming a combined state and federal income tax rate of 38.85%) for Class A shares were 2.27% and 3.71%, respecti vely, for Class B shares were 1.57% and 2.57%, respectively, and for Class C shares were 1.57% and 2.57%, respectively. A lower tax rate would result in lower tax-equivalent yields. For current yield information call 1-800-262-1122.
| | | |
| | One | Five | Ten |
| Average Annual Total Return as of December 31, 2008 | Year | Years | Years |
|
| Class A Return Before Taxes | –4.50% | 1.05% | 2.53% |
| Class B Return Before Taxes | –5.78% | 0.74% | 1.99% |
| Class B Return After Taxes on Distributions | –5.78% | 0.74% | 1.99% |
| Class B Return After Taxes on Distributions and the Sale of Class B Shares | –2.73% | 1.07% | 2.17% |
| Class C Return Before Taxes | –4.11% | 0.68% | 1.96% |
| Barclays Capital 7 Year Municipal Bond Index (reflects no deduction for fees, expenses or taxes) | 4.59% | 3.69% | 4.80% |
These returns reflect the maximum sales charge for Class A (2.25%) and any applicable CDSC for Class B and Class C. The Class C performance shown above for the period prior to August 1, 2006 is the performance of Class B shares, adjusted for the sales charge that applies to Class C shares (but not adjusted for any other differences in the expenses of the classes). Barclays Capital 7 Year Municipal Bond Index is an unmanaged index of intermediate-maturity municipal obligations. Investors cannot invest directly in an Index. (Source for Barclays Capital 7 Year Municipal Bond Index: Lipper, Inc.)
Total returns are historical and are calculated by determining the percentage change in net asset value or public offering price with all distributions reinvested. The Fund's past performance (both before and after taxes) is no guarantee of future results. Investment return and principal value of Fund shares will fluctuate so that shares, when redeemed, may be worth more or less than their original cost. Performance is for the stated time period only; due to market volatility, the Fund's current performance may be lower or higher than the quoted return. For the Fund’s performance as of the most recent month-end, please refer to www.eatonvance.com.
After-tax returns are calculated using certain assumptions. After-tax returns are calculated using the highest historical individual federal income tax rates and do not reflect the impact of state and local taxes. Actual after-tax returns depend on a shareholder’s tax situation and the actual characterization of distributions, and may differ from those shown. After-tax returns are not relevant to shareholders who hold shares in tax-deferred accounts or to shares held by non-taxable entities. After-tax returns for other Classes of shares will vary from the after-tax returns presented for Class B shares. Return After Taxes on Distributions for a period may be the same as Return Before Taxes for that period because no taxable distributions were made during that period. Also, Return After Taxes on Distributions and Sale of Fund Shares for a period may be greater than or equal to Return After Taxes on Distributions for the same period because of losses realized on the sale of Fund shares.
8
Eaton Vance Pennsylvania Limited Maturity Municipals Fund
The Pennsylvania Fund’s investment objective is to provide a high level of current income exempt from regular federal income tax and Pennsylvania state and local taxes in the form of an investment exempt from Pennsylvania personal property taxes, and limited principal fluctuation.
Performance Information. The following bar chart and table provide information about the Pennsylvania Fund’s performance for each calendar year through December 31, 2008. The returns in the bar chart are for Class B shares and do not reflect a sales charge. If the sales charge was reflected, the returns would be lower. The table contains returns for each Class of shares and a comparison to the performance of a national index of intermediate-maturity municipal obligations. Returns in the table for Class B shares are shown before and after the reduction of taxes. Although past performance (both before and after taxes) is no guarantee of future results, this performance information demonstrates the risk that the value of your investment will change.
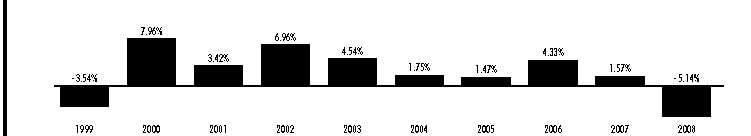
During the ten years ended December 31, 2008, the highest quarterly total return for Class B was 3.64% for the quarter ended September 30, 2002, and the lowest quarterly return was –2.26% for the quarter ended September 30, 2008. The year-to-date total return through the end of the most recent calendar quarter (December 31, 2008 to June 30, 2009) was 6.15%. For the 30 days ended March 31, 2009, the SEC yield and SEC tax-equivalent yield (assuming a combined state and federal income tax rate of 37.00%) for Class A shares were 3.04% and 4.83%, respectively, for Class B shares were 2.35% and 3.73%, respectively, and for Class C shares were 2.37% and 3.76%, respectively. A lower tax rate would result in lower tax-equivalent yields. For current yield information call 1-800-262-1122.
| | | |
| | One | Five | Ten |
| Average Annual Total Return as of December 31, 2008 | Year | Years | Years |
|
| Class A Return Before Taxes | –6.60% | 1.05% | 2.81% |
| Class B Return Before Taxes | –7.90% | 0.74% | 2.25% |
| Class B Return After Taxes on Distributions | –7.90% | 0.74% | 2.25% |
| Class B Return After Taxes on Distributions and the Sale of Class B Shares | –4.04% | 1.11% | 2.43% |
| Class C Return Before Taxes | –5.99% | 0.74% | 2.27% |
| Barclays Capital 7 Year Municipal Bond Index (reflects no deduction for fees, expenses or taxes) | 4.59% | 3.69% | 4.80% |
These returns reflect the maximum sales charge for Class A (2.25%) and any applicable CDSC for Class B and Class C. Barclays Capital 7 Year Municipal Bond Index is an unmanaged index of intermediate-maturity municipal obligations. Investors cannot invest directly in an Index. (Source for Barclays Capital 7 Year Municipal Bond Index: Lipper, Inc.)
Total returns are historical and are calculated by determining the percentage change in net asset value or public offering price with all distributions reinvested. The Fund's past performance (both before and after taxes) is no guarantee of future results. Investment return and principal value of Fund shares will fluctuate so that shares, when redeemed, may be worth more or less than their original cost. Performance is for the stated time period only; due to market volatility, the Fund's current performance may be lower or higher than the quoted return. For the Fund’s performance as of the most recent month-end, please refer to www.eatonvance.com.
After-tax returns are calculated using certain assumptions. After-tax returns are calculated using the highest historical individual federal income tax rates and do not reflect the impact of state and local taxes. Actual after-tax returns depend on a shareholder’s tax situation and the actual characterization of distributions, and may differ from those shown. After-tax returns are not relevant to shareholders who hold shares in tax-deferred accounts or to shares held by non-taxable entities. After-tax returns for other Classes of shares will vary from the after-tax returns presented for Class B shares. Return After Taxes on Distributions for a period may be the same as Return Before Taxes for that period because no taxable distributions were made during that period. Also, Return After Taxes on Distributions and Sale of Fund Shares for a period may be greater than or equal to Return After Taxes on Distributions for the same period because of losses realized on the sale of Fund shares.
9
Fund Fees and Expenses. These tables describe the fees and expenses that you may pay if you buy and hold shares. Annual Fund Operating Expenses are stated as a percentage of a Fund’s average daily net assets for its most recently completed fiscal year. In general, Annual Fund Operating Expenses as a percentage of Fund average daily net assets will change as Fund assets increase and decrease, and Annual Fund Operating Expenses may differ in the future. The net assets of each Fund as of its last five fiscal year ends are included in the Financial Highlights in this prospectus.
| Shareholder Fees (fees paid directly from your investment) | | | |
| | Class A | Class B | Class C |
|
| Maximum Sales Charge (Load) (as a percentage of offering price) | 2.25% | None | None |
| Maximum Deferred Sales Charge (Load) (as a percentage of the lower of net asset value at time of purchase or time of redemption) | None | 3.00% | 1.00% |
| Maximum Sales Charge (Load) Imposed on Reinvested Distributions | None | None | None |
| | | | |
| | | | | |
| Annual Fund Operating Expenses (expenses that are deducted from Fund assets) | | |
| | | | | | |
| | | Management | Distribution and | Other | Total Annual Fund |
| | | Fees | Service (12b-1) Fees | Expenses | Operating Expenses |
|
| California Fund | Class A shares | 0.44% | 0.15% | 0.35% | 0.94% |
| | Class B shares | 0.44% | 0.90% | 0.36% | 1.70% |
| | Class C shares | 0.44% | 0.90% | 0.36% | 1.70% |
|
| Massachusetts Fund | Class A shares | 0.45% | 0.15% | 0.25% | 0.85% |
| | Class B shares | 0.45% | 0.90% | 0.25% | 1.60% |
| | Class C shares | 0.45% | 0.90% | 0.25% | 1.60% |
|
| New Jersey Fund | Class A shares | 0.44% | 0.15% | 0.30% | 0.89% |
| | Class B shares | 0.44% | 0.90% | 0.30% | 1.64% |
| | Class C shares | 0.44% | 0.90% | 0.30% | 1.64% |
|
| New York Fund | Class A shares | 0.44% | 0.15% | 0.21% | 0.80% |
| | Class B shares | 0.44% | 0.90% | 0.21% | 1.55% |
| | Class C shares | 0.44% | 0.90% | 0.21% | 1.55% |
|
| Ohio Fund | Class A shares | 0.44% | 0.15% | 0.50% | 1.09% |
| | Class B shares | 0.44% | 0.90% | 0.50% | 1.84% |
| | Class C shares | 0.44% | 0.90% | 0.49% | 1.83% |
|
| Pennsylvania Fund | Class A shares | 0.45% | 0.15% | 0.27% | 0.87% |
| | Class B shares | 0.45% | 0.90% | 0.27% | 1.62% |
| | Class C shares | 0.45% | 0.90% | 0.27% | 1.62% |
| | | | | | |
Examples. These Examples are intended to help you compare the cost of investing in a Fund with the cost of investing in other mutual funds. Each Example assumes that you invest $10,000 in a Fund for the time periods indicated and then redeem all of your shares at the end of those periods. Each Example also assumes that your investment has a 5% return each year and that the operating expenses remain the same as stated in the Fund Fees and Expenses table above. Although your actual costs may be higher or lower, based on these assumptions your costs would be:
| | | | | |
| | | 1 Year | 3 Years | 5 Years | 10 Years |
|
| California Fund | Class A shares | $319 | $518 | $733 | $1,354 |
| | Class B shares* | $473 | $736 | $835 | $1,452 |
| | Class C shares | $273 | $536 | $923 | $2,009 |
|
| Massachusetts Fund | Class A shares | $310 | $490 | $686 | $1,250 |
| | Class B shares* | $463 | $705 | $784 | $1,345 |
| | Class C shares | $263 | $505 | $871 | $1,900 |
|
| New Jersey Fund | Class A shares | $314 | $502 | $707 | $1,296 |
| | Class B shares* | $467 | $717 | $805 | $1,391 |
| | Class C shares | $267 | $517 | $892 | $1,944 |
|
| New York Fund | Class A shares | $305 | $475 | $659 | $1,193 |
| | Class B shares* | $458 | $690 | $758 | $1,288 |
| | Class C shares | $258 | $490 | $845 | $1,845 |
|
| Ohio Fund | Class A shares | $334 | $564 | $812 | $1,524 |
| | Class B shares* | $487 | $779 | $910 | $1,617 |
| | Class C shares | $286 | $576 | $990 | $2,148 |
|
| Pennsylvania Fund | Class A shares | $312 | $496 | $696 | $1,273 |
| | Class B shares* | $465 | $711 | $795 | $1,368 |
| | Class C shares | $265 | $511 | $881 | $1,922 |
| |
| You would pay the following expenses if you did not redeem your shares: | | | |
| | | | | | |
| | | 1 Year | 3 Years | 5 Years | 10 Years |
|
| California Fund | Class A shares | $319 | $518 | $733 | $1,354 |
| | Class B shares* | $173 | $536 | $835 | $1,452 |
| | Class C shares | $173 | $536 | $923 | $2,009 |
|
| Massachusetts Fund | Class A shares | $310 | $490 | $686 | $1,250 |
| | Class B shares* | $163 | $505 | $784 | $1,345 |
| | Class C shares | $163 | $505 | $871 | $1,900 |
|
| New Jersey Fund | Class A shares | $314 | $502 | $707 | $1,296 |
| | Class B shares* | $167 | $517 | $805 | $1,391 |
| | Class C shares | $167 | $517 | $892 | $1,944 |
|
| New York Fund | Class A shares | $305 | $475 | $659 | $1,193 |
| | Class B shares* | $158 | $490 | $758 | $1,288 |
| | Class C shares | $158 | $490 | $845 | $1,845 |
|
| Ohio Fund | Class A shares | $334 | $564 | $812 | $1,524 |
| | Class B shares* | $187 | $579 | $910 | $1,617 |
| | Class C shares | $186 | $576 | $990 | $2,148 |
|
| Pennsylvania Fund | Class A shares | $312 | $496 | $696 | $1,273 |
| | Class B shares* | $165 | $511 | $795 | $1,368 |
| | Class C shares | $165 | $511 | $881 | $1,922 |
* Reflects the expenses of Class A shares after four years because Class B shares automatically convert to Class A shares after four years.
11
Investment Objectives & Principal Policies and Risks
The investment objective of each Fund is to provide a high level of current income exempt from regular federal income tax and particular state or local income or other taxes, as applicable, and limited principal fluctuation. Each Fund seeks to achieve its objective by investing primarily (i.e., at least 80% of its net assets during periods of normal market conditions) in municipal obligations, the interest on which is exempt from regular federal income tax and from the state taxes which, in accordance with the Fund’s investment objective, the Fund seeks to avoid. This is a fundamental policy of each Fund which only may be changed with shareholder approval. For purposes of this policy, "net assets" include any assets purchased with borrowings for investment purposes. Each Fund’s investment objective and certain other policies may be changed by the Trustees without shareholder approval. There is no present intention to make any such change and shareholders will receive at least 60 days’ notice of any material change in a Fund’s investment objective.
At least 75% of net assets will normally be invested in municipal obligations rated at least investment grade at the time of investment (which are those rated Baa or higher by Moody’s Investors Services, Inc. ("Moody’s"), or BBB or higher by either Standard & Poor’s Ratings Group ("S&P") or Fitch Ratings ("Fitch")) or, if unrated, determined by the investment adviser to be of at least investment grade quality. The balance of net assets may be invested in municipal obligations rated below investment grade and in unrated municipal obligations considered to be of comparable quality by the investment adviser. Municipal obligations rated Baa or BBB have speculative characteristics, while lower quality obligations are predominant ly speculative. Also, changes in economic conditions or other circumstances are more likely to reduce the capacity of issuers of lower-rated obligations to make principal and interest payments. Lower rated obligations also may be subject to greater price volatility than higher rated obligations. No Fund will invest more than 10% of its net assets in obligations rated below B by Moody’s, S&P and Fitch, or in unrated obligations considered to be of comparable quality by the investment adviser. A credit rating may have a modifier (such as plus, minus or a numerical modifier) to denote its relative status within the rating. The presence of a modifier does not change the security’s credit rating (meaning that BBB- and Baa3 are within the investment grade rating).
Municipal obligations include bonds, notes and commercial paper issued by a municipality, a group of municipalities or participants in qualified issues of tax-exempt debt for a wide variety of both public and private purposes. Municipal obligations also include municipal leases and participations in municipal leases. An issuer’s obligation under such leases is often subject to the appropriation by the appropriate legislative body, on an annual or other basis, of funds for the payment of the obligations. Certain municipal obligations may be purchased on a “when-issued” basis, which means that payment and delivery occur on a future settlement date. The price and yield of such securities are generally fixed on the date of commitment to purchase.
The investment adviser’s process for selecting securities for purchase and sale is research intensive and emphasizes the creditworthiness of the issuer or other person obligated to repay the obligation. Although the investment adviser considers ratings when making investment decisions, it performs its own credit and investment analysis and does not rely primarily on the ratings assigned by the rating services. Credit ratings are based largely on the rating agency’s investment analysis at the time of rating and the rating assigned to any particular security is not necessarily a reflection of the issuer’s current financial condition. The rating assigned to a security by a rating agency does not necessarily reflect its assessment of the volatility of the security’s market value or of the liquidity of an investment in the security.
The interest on municipal obligations is (in the opinion of the issuer’s counsel) exempt from regular federal income tax. Interest income from certain types of municipal obligations generally will be subject to the federal alternative minimum tax (the “AMT”) for individuals. Distributions to corporate investors may also be subject to the AMT. The Funds may not be suitable for investors subject to the AMT.
Although a Fund invests in obligations to maintain a dollar weighted average portfolio duration of between three and nine years, a Fund may invest in individual municipal obligations of any maturity. Duration represents the dollar weighted average maturity of expected cash flows (i.e., interest and principal payments) on one or more municipal obligations, discounted to their present values. Each Fund may use various techniques to shorten or lengthen its dollar weighted average duration, including the acquisition of municipal obligations at a premium or discount, and transactions in futures contracts and options on futures. Many obligations permit the issuer at its option to “call”, or redeem, its securities. If an issuer calls securities during a time of declining interest rates, it may not be possible to reinvest the proceeds in securities providing the same investment return as the securities redeemed.
Under normal conditions, each Fund invests at least 65% of its total assets in obligations issued by its respective state or its political subdivisions, agencies, authorities and instrumentalities. Municipal obligations of issuers in a single state may be adversely affected by economic developments (including insolvency of an issuer) and by legislation and other governmental activities in that state. Each Fund may also invest up to 35% of its net assets in municipal obligations issued by the governments of Puerto Rico, the U.S. Virgin Islands and Guam.
12
Each Fund may invest 25% or more of its total assets in municipal obligations in the same sector (such as leases, housing finance, public housing, municipal utilities, hospital and health facilities or industrial development). This may make a Fund more susceptible to adverse economic, political or regulatory occurrences or adverse court decisions affecting a particular sector.
The net asset value of a Fund’s shares will change in response to changes in prevailing interest rates and changes in the value of securities held by the Fund. The value of securities held will be affected by the credit quality of the issuer of the obligation, and general economic and business conditions that affect the specific economic sector of the issuer as well as any actual or anticipated change to the tax treatment of securities held by a Fund. Changes by rating agencies in the rating assigned to an obligation may also affect the value of that obligation. To the extent that securities held by a Fund are insured as to principal and interest payments by insurers whose claims-paying ability or other rating is downgraded by a ratings agency, the value of such securities may be affected. When the supply of municipal obligations exceeds demand, the value of Fund shares may decl ine. The increased presence of non-traditional participants in the municipal markets may lead to greater volatility in the markets.
Each Fund may purchase derivative instruments, which derive their value from another instrument, security or index. For example, each Fund may purchase and sell various kinds of financial futures contracts and options thereon to hedge against changes in interest rates or as a substitute for the purchase of portfolio securities. Each Fund may also enter into interest rate swaps, forward rate contracts and credit derivatives, which may include credit default swaps, total return swaps or credit options, as well as purchase an instrument that has greater or lesser credit risk than the municipal bonds underlying the instrument. The use of derivative instruments for both hedging and investment purposes involves a risk of loss or depreciation due to a variety of factors including counterparty risk, unexpected market, interest rate or securities price movements, and tax and regulatory constraints. The use of derivatives is highly specialized and engaging in derivative transactions for purp oses other than hedging is speculative. Derivative hedging transactions may not be effective because of imperfect correlations, i.e. offsetting markets which do not experience price changes in perfect correlation with each other, and other factors.
Each Fund may invest in residual interests of a trust (the ”trust”) that holds municipal securities (“inverse floaters”). The trust will also issue floating rate notes to third parties that may be senior to the inverse floaters held by the Fund. The Fund receives interest payments on inverse floaters that bear an inverse relationship to the interest rate paid on the floating rate notes. As a result of Financial Accounting Standards Statement No. 140 (“FAS 140”), interest paid by the trust to the floating rate note holders may be reflected as income in the Fund’s financial statements with an offsetting expense for the interest paid by the trust to the floating rate note holders. Inverse floaters involve leverage risk and will involve greater risk than an investment in a fixed rate bond. Because changes in the interest rate paid to the floating rate note holders inversely affects the interest paid on the inver se floater, the value and income of an inverse floater are generally more volatile than that of a fixed rate bond. Inverse floaters have varying degrees of liquidity, and the market for these securities is relatively volatile. These securities tend to underperform the market for fixed rate bonds in a rising long-term interest rate environment, but tend to outperform the market for fixed rate bonds when long-term interest rates decline. While inverse floaters expose a Fund to leverage risk, they do not constitute borrowings for purposes of a Fund’s restrictions on borrowings.
Each Fund may invest in zero coupon bonds, which do not require the issuer to make periodic interest payments. The values of these bonds are subject to greater fluctuation in response to changes in market interest rates than bonds which pay interest currently. Each Fund accrues income on these investments and is required to distribute that income each year. Each Fund may be required to sell securities to obtain cash needed for income distributions.
The limited liquidity of certain securities in which each Fund may invest (including those eligible for resale under Rule 144A of the Securities Act of 1933) could affect their market prices, thereby adversely affecting net asset value and the ability to pay income. The amount of publicly available information about certain municipal obligations may be limited and the investment performance of a Fund may be more dependent on the portfolio manager’s analysis than if this were not the case.
Each Fund may borrow amounts up to one-third of the value of its total assets (including assets acquired using borrowings), but it will not borrow more than 5% of the value of its total assets except to satisfy redemption requests or for other temporary purposes. Such borrowings would result in increased expense to a Fund and, while they are outstanding, would magnify increases or decreases in the value of Fund shares. No Fund will purchase additional investment securities while outstanding borrowings exceed 5% of the value of its total assets.
During unusual market conditions, each Fund may temporarily invest up to 50% of its total assets in cash or cash equivalents, including short-term municipal securities, which is not consistent with a Fund’s investment objective. While temporarily invested, a Fund may not achieve its objective, and interest income from temporary investments may be taxable. Each Fund might not use all of the strategies and techniques or invest in all of the types of securities described in this Prospectus or the Statement of Additional Information. While at times a Fund may use alternative investment strategies in an effort to limit its losses, it may choose not to do so.
13
Each Fund’s investment policies include a fundamental investment provision allowing the Fund to invest substantially all of its investable assets in one or more open-end management investment companies having substantially the same investment policies and restrictions as the Fund. Any such company or companies would be advised by the Fund’s investment adviser (or an affiliate) and the Fund would not pay directly any advisory fee with respect to the assets so invested. The Fund will indirectly bear its proportionate share of any management fees paid by investment companies in which it invests in addition to the advisory fee paid by the Fund. The Fund may initiate investments in one or more investment companies at any time without shareholder approval.
Management and Organization
Management. Each Fund’s investment adviser is Boston Management and Research (“BMR”), a subsidiary of Eaton Vance Management (“Eaton Vance”), with offices at Two International Place, Boston, MA 02110. Eaton Vance has been managing assets since 1924 and managing mutual funds since 1931. Eaton Vance and its affiliates currently manage over $135 billion on behalf of mutual funds, institutional clients and individuals.
The investment adviser manages the investments of each Fund. Under its investment advisory agreement with each Fund, BMR receives a monthly advisory fee equal to the aggregate of a daily asset based fee and a daily income based fee. The fees are applied on the basis of the following categories.
| | | |
| | | Annual | Daily |
| Category | Daily Net Assets | Asset Rate | Income Rate |
|
| 1 | up to $500 million | 0.300% | 3.00% |
| 2 | $500 million but less than $1 billion | 0.275% | 2.75% |
| 3 | $1 billion but less than $1.5 billion | 0.250% | 2.50% |
| 4 | $1.5 billion but less than $2 billion | 0.225% | 2.25% |
| 5 | $2 billion but less than $3 billion | 0.200% | 2.00% |
| 6 | $3 billion and over | 0.175% | 1.75% |
For the fiscal year ended March 31, 2009, the effective annual rate of investment advisory fees paid to BMR based on average daily net assets are stated below.
| | |
| | Net Assets on | Investment |
| Fund | March 31, 2009 | Advisory Fee |
|
| California | $22,697,542 | 0.44% |
| Massachusetts | $60,321,830 | 0.45% |
| New Jersey | $42,912,918 | 0.44% |
| New York | $87,914,751 | 0.44% |
| Ohio | $19,165,981 | 0.44% |
| Pennsylvania | $50,894,819 | 0.45% |
Each Fund’s most recent shareholder report provides information regarding the basis for the Trustees’ approval of each Fund’s investment advisory agreement.
William H. Ahern, Jr. is the portfolio manager of the Ohio Fund (since October 1994), the Massachusetts Fund (since May 1997), and the New York Fund (since November 1997). Cynthia J. Clemson is the portfolio manager of the California Fund (since May 1997). Craig R. Brandon is the portfolio manager of the New Jersey Fund (since September 2004). Adam A. Weigold is the portfolio manager of the Pennsylvania Fund (since October 2007). Each portfolio manager is a Vice President of Eaton Vance and BMR and also manages other Eaton Vance portfolios, and Mr. Ahern and Ms. Clemson have managed Eaton Vance portfolios for more than five years. Mr. Brandon was appointed portfolio manager of the New Jersey Fund in 2004, and has been a municipal credit analyst at Eaton Vance for more than five years. Mr. Weigold was appointed portfolio manager of the Pennsylvania Fund in 2007, and has been a municipal credit analyst at Eaton Vance for more than five years.
The Statement of Additional Information provides additional information about each portfolio manager’s compensation, other accounts managed by each portfolio manager, and each portfolio manager’s ownership of Fund shares with respect to which that portfolio manager has management responsibility.
Eaton Vance serves as the administrator of each Fund, providing each Fund with administrative services and related office facilities. Eaton Vance does not currently receive a fee for serving as administrator.
14
Eaton Vance also serves as the sub-transfer agent for each Fund. For the sub-transfer agency services it provides, Eaton Vance receives an aggregate fee based upon the actual expenses it incurs in the performance of sub-transfer agency services. This fee is paid to Eaton Vance by a Fund’s transfer agent from the fees the transfer agent receives from the Eaton Vance funds.
Organization. Each Fund is a series of Eaton Vance Investment Trust (the "Trust"), a Massachusetts business trust. Each Fund offers multiple classes of shares. Each Class represents a pro rata interest in a Fund but is subject to different expenses and rights. The Funds do not hold annual shareholder meetings but may hold special meetings for matters that require shareholder approval (such as electing or removing trustees, approving management or advisory contracts or changing investment policies that may only be changed with shareholder approval).
Because the Funds use this combined prospectus, a Fund could be held liable for a misstatement or omission made about another Fund. The Trust’s Trustees considered this risk in approving the use of a combined prospectus.
Valuing Shares
Each Fund values its shares once each day only when the New York Stock Exchange (the "Exchange") is open for trading (typically Monday through Friday), as of the close of regular trading on the Exchange (normally 4:00 p.m. eastern time). The purchase price of Fund shares is their net asset value (plus a sales charge for Class A shares), which is derived from the value of Fund holdings. When purchasing or redeeming Fund shares through an investment dealer, your investment dealer must communicate your order to the principal underwriter by a specific time each day in order for the purchase price or the redemption price to be based on that day’s net asset value per share. It is the investment dealer’s responsibility to transmit orders promptly. Each Fund may accept purchase and redemption orders as of the time of their receipt by certain investment dealers (or their designated intermediaries).
The Trustees have adopted procedures for valuing investments and have delegated to the investment adviser the daily valuation of such investments. Municipal obligations owned by the Funds are normally valued on the basis of valuations furnished by a pricing service. The pricing service considers various factors relating to bonds and market transactions to determine value. In certain situations, the investment adviser may use the fair value of a security if market prices are unavailable or deemed unreliable. A security that is fair valued may be valued at a price higher or lower than actual market quotations or the value determined by other funds using their own fair valuation procedures. The investment adviser expects to use fair value pricing for municipal obligations under limited circumstances, such as when an obligation is not priced by the pricing service or is in default. Eaton Vance has established a Valuation Committee that oversees the valuation of investments.
Purchasing Shares
You may purchase shares through your investment dealer or by mailing an account application form to the transfer agent (see back cover for address). Purchases will be executed at the net asset value (plus any applicable sales charge) next determined after their receipt in good order by a Fund’s transfer agent. A Fund’s transfer agent or your investment dealer must receive your purchase in good order no later than the close of regular trading on the Exchange (normally 4:00 p.m. eastern time) for your purchase to be effected at that day’s net asset value. If you purchase shares through an investment dealer, that dealer may charge you a fee for executing the purchase for you. Each Fund may suspend the sale of its shares at any time and any purchase order may be refused for any reason. The Funds do not issue share certificates.
Your initial investment must be at least $1,000. After your initial investment, additional investments may be made in any amount at any time by sending a check payable to the order of the Fund or the transfer agent directly to the transfer agent (see back cover for address). Please include your name and account number and the name of the Fund and Class of shares with each investment.
You may make automatic investments of $50 or more each month or each quarter from your bank account. You can establish bank automated investing on the account application or by providing written instructions. Please call 1-800-262-1122 Monday through Friday, 8:00 a.m. to 6:00 p.m. (eastern time) for further information. The minimum initial investment amount and Fund policy of redeeming accounts with low account balances are waived for bank automated investing accounts (other than for Class I), certain group purchase plans (including proprietary fee-based programs sponsored by broker-dealers) and for persons affiliated with Eaton Vance, its affiliates and certain Fund service providers (as described in the Statement of Additional Information).
Restrictions on Excessive Trading and Market Timing. The Funds are not intended for excessive trading or market timing. Market timers seek to profit by rapidly switching money into a fund when they expect the share price of the fund to rise and taking money out of the fund when they expect those prices to fall. By realizing profits through short-term trading, shareholders that engage in rapid purchases and sales or exchanges of a fund’s shares may dilute the value of shares held by long-term shareholders. Volatility resulting from excessive purchases and sales or exchanges of fund shares, especially involving large dollar amounts, may disrupt efficient portfolio management. In particular, excessive purchases and sales or exchanges of a fund’s shares may cause a fund to have difficulty implementing its investment strategies, may force the fund to sell portfolio securities at inopportune times to raise
15
cash or may cause increased expenses (such as increased brokerage costs, realization of taxable capital gains without attaining any investment advantage or increased administrative costs).
A fund that invests in securities that are, among other things, thinly traded, traded infrequently or relatively illiquid (including certain municipal obligations) is susceptible to the risk that the current market price for such securities may not accurately reflect current market values. A shareholder may seek to engage in short-term trading to take advantage of these pricing differences (commonly referred to as “price arbitrage”). The investment adviser is authorized to use the fair value of a security if prices are unavailable or are deemed unreliable (see “Valuing Shares”). The use of fair value pricing and the restrictions on excessive trading and market timing described below are intended to reduce a shareholder’s ability to engage in price arbitrage to the detriment of the Funds.
The Boards of Trustees of the Eaton Vance funds have adopted policies to discourage short-term trading and market timing and to seek to minimize their potentially detrimental effects. Pursuant to these policies, if an investor (through one or more accounts) makes more than one round-trip exchange (exchanging from one fund to another fund and back again) within 90 days, it will be deemed to constitute market timing or excessive trading. Under the policies, each Fund or its principal underwriter will reject or cancel a purchase order, suspend or terminate the exchange privilege or terminate the ability of an investor to invest in the Eaton Vance funds if the Fund or the principal underwriter determines that a proposed transaction involves market timing or excessive trading that it believes is likely to be detrimental to the Fund. Each Fund and its principal underwriter use reasonable efforts to detect market timing and excessive trading activity, but they cannot ensure that they will be able to identify all cases of market timing and excessive trading. Each Fund or its principal underwriter may also reject or cancel any purchase order (including an exchange) from an investor or group of investors for any other reason. Decisions to reject or cancel purchase orders (including exchanges) in a Fund are inherently subjective and will be made in a manner believed to be in the best interest of a Fund’s shareholders. No Eaton Vance fund has any arrangement to permit market timing.
The following fund share transactions generally are exempt from the market timing and excessive trading policy described above because each Fund and the principal underwriter believe they generally do not raise market timing or excessive trading concerns:
- transactions made pursuant to a systematic purchase plan or as the result of automatic reinvestment of dividends or distributions, or initiated by a Fund (e.g., for failure to meet applicable account minimums);
- transactions made by participants in employer sponsored retirement plans involving participant payroll or employer contributions or loan repayments, redemptions as part of plan terminations or at the direction of the plan, mandatory retirement distributions, or rollovers;
- transactions made by asset allocation and wrap programs where the adviser to the program directs transactions in the accounts participating in the program in concert with changes in a model portfolio; or
- transactions in shares of Eaton Vance Cash Management Fund, Eaton Vance Money Market Fund, Eaton Vance Tax Free Reserves and Eaton Vance Institutional Short Term Income Fund.
It may be difficult for a Fund or the principal underwriter to identify market timing or excessive trading in omnibus accounts traded through financial intermediaries. The Funds and the principal underwriter have provided guidance to financial intermediaries (such as banks, broker-dealers, insurance companies and retirement administrators) concerning the application of the Eaton Vance funds’ market timing and excessive trading policies to Fund shares held in omnibus accounts maintained and administered by such intermediaries, including guidance concerning situations where market timing or excessive trading is considered to be detrimental to a Fund. Each Fund or its principal underwriter may rely on a financial intermediary’s policy to restrict market timing and excessive trading if it believes that policy is likely to prevent market timing that is likely to be detrimental to the Fund. Such policy may be more or less restrictive than a Fund’s policy. Although each Fund or the principal underwriter reviews trading activity at the omnibus account level for activity that indicates potential market timing or excessive trading activity, the Funds and the principal underwriter typically will not request or receive individual account data unless suspicious trading activity is identified. Each Fund and the principal underwriter generally rely on financial intermediaries to monitor trading activity in omnibus accounts in good faith in accordance with their own or Fund policies. Each Fund and the principal underwriter cannot ensure that these financial intermediaries will in all cases apply the policies of the Fund or their own policies, as the case may be, to accounts under their control.
Choosing a Share Class. Each Fund offers different classes of shares. The different classes of shares represent investments in the same portfolio of securities, but the classes are subject to different sales charges and expenses and will likely have different share prices due to differences in class expenses. In choosing the class of shares that suits your investment needs, you should consider:
- how long you expect to own your shares;
- how much you intend to invest;
- the sales charge and total operating expenses associated with owning each class; and
16
- whether you qualify for a reduction or waiver of any applicable sales charges (see “Reducing or Eliminating Class A Sales Charges” under “Sales Charges” below).
Each investor’s considerations are different. You should speak with your investment dealer to help you decide which class of shares is best for you. Set forth below is a brief description of each class of shares offered by the Funds.
| Class A shares are offered at net asset value plus a front-end sales charge of up to 2.25%. This charge is deducted from the amount you invest. The Class A sales charge is reduced for purchases of $100,000 or more. The sales charge applicable to your purchase may be reduced under the right of accumulation or a statement of intention, which are described in “Reducing or Eliminating Class A Sales Charges” under “Sales Charges” below. Some investors may be eligible to purchase Class A shares at net asset value under certain circumstances, which are also described below. Class A shares pay distribution and service fees equal to 0.15% annually of average daily net assets. Returns on Class A shares are generally higher than returns on Class B and Class C shares because Class A has lower annual expenses than those classes. |
| Class B shares are offered at net asset value with no front-end sales charge. If you sell your Class B shares within four years of purchase, you generally will be subject to a contingent deferred sales charge or “CDSC”. The amount of the CDSC applicable to a redemption of Class B shares decreases over four years, as described in the CDSC schedule in “Contingent Deferred Sales Charge” under “Sales Charges” below. The CDSC is deducted from your redemption proceeds. Under certain circumstances, the Class B CDSC may be waived (such as in the case of the death of the shareholder). See “CDSC Waivers” under “Sales Charges” below. Class B shares pay distribution fees and service fees equal to 0.90% annually of average daily net assets. Returns on Class B shares are generally lower than returns on Class A shares because Class B has higher annual expenses than Class A. Class B shares will automatically convert to Class A shares after the longer of four years or the time when the CDSC applicable to the Class B shares expires. Because the sales charge applicable to Class A shares is reduced for larger purchases and Class A has lower operating expenses, purchasing Class B shares may not be appropriate if you are investing a large amount. |
| Orders for Class B shares of one or more Eaton Vance funds will be refused when the total value of the purchase (including the aggregate value of all Eaton Vance fund shares held within the purchasing shareholder’s account) is $100,000 or more. Investors considering cumulative purchases of $100,000 or more, or who, after a purchase of shares, would own shares of Eaton Vance funds with a current market value of $100,000 or more, should consider whether Class A shares would be more advantageous and consult their investment dealer. |
| Class C shares are offered at net asset value with no front-end sales charge. If you sell your Class C shares within one year of purchase, you generally will be subject to a CDSC. The CDSC is deducted from your redemption proceeds. Under certain circumstances, the Class C CDSC may be waived (such as certain redemptions from tax-deferred retirement plan accounts). See “CDSC Waivers” under “Sales Charges” below. Class C shares pay distribution fees and service fees equal to 0.90% annually of average daily net assets. Returns on Class C shares are generally lower than returns on Class A shares because Class C has higher annual expenses than Class A. |
| Orders for Class C shares of one or more Eaton Vance funds will be refused when the total value of the purchase (including the aggregate value of all Eaton Vance fund shares held within the purchasing shareholder’s account) is $1,000,000 or more. Investors considering cumulative purchases of $1,000,000 or more, or who, after a purchase of shares, would own shares of Eaton Vance funds with a current market value of $1,000,000 or more, should consider whether Class A shares would be more advantageous and consult their investment dealer. |
Payments to Investment Dealers. In addition to payments disclosed under "Sales Charges" below, the principal underwriter, out of its own resources, may make cash payments to certain investment dealers who provide marketing support, transaction processing and/or administrative services and, in some cases, include some or all Eaton Vance funds in preferred or specialized selling programs. Payments made by the principal underwriter to an investment dealer may be significant and are typically in the form of fees based on Fund sales, assets, transactions processed and/or accounts attributable to that investment dealer. Investment dealers also may receive amounts from the principal underwriter in connection with educational or due diligence meetings that include information concerning Eaton Vance funds. The principal underwriter may pay or allow other promotional incentives or payments to investment dealers to the extent permitted by applicable laws and regulat ions.
Certain investment dealers that maintain fund accounts for the benefit of their customers provide sub-accounting, recordkeeping and/or administrative services to the Eaton Vance funds and are compensated for such services by the funds. As used in this prospectus, the term “investment dealer” includes any broker, dealer, bank (including bank trust departments), registered investment adviser, financial planner, a retirement plan and/or its administrator, their designated intermediaries and any other firm having a selling, administration or similar agreement with the principal underwriter or its affiliates.
17
Sales Charges
Class A Front-End Sales Charge. Class A shares are offered at net asset value per share plus a sales charge that is determined by the amount of your investment. The current sales charge schedule is:
| | | |
| | Sales Charge* | Sales Charge* | Dealer Commission |
| | as Percentage of | as Percentage of Net | as a Percentage of |
| Amount of Purchase | Offering Price | Amount Invested | Offering Price |
|
| Less than $100,000 | 2.25% | 2.30% | 2.00% |
| $100,000 but less than $250,000 | 1.75% | 1.78% | 1.50% |
| $250,000 but less than $500,000 | 1.50% | 1.52% | 1.25% |
| $500,000 but less than $1,000,000 | 1.00% | 1.01% | 1.00% |
| $1,000,000 or more | 0.00** | 0.00** | 0.75% |
| * | Because the offering price per share is rounded to two decimal places, the actual sales charge you pay on a purchase of Class A shares may be more or less than your total purchase amount multiplied by the applicable sales charge percentage. |
| ** | No sales charge is payable at the time of purchase on investments of $1 million or more. A CDSC of 1.00% will be imposed on such investments (as described below) in the event of redemptions within 18 months of purchase. |
Reducing or Eliminating Class A Sales Charges. Front-end sales charges on purchases of Class A shares may be reduced under the right of accumulation or under a statement of intention. To receive a reduced sales charge, you must inform your investment dealer or a Fund at the time you purchase shares that you qualify for such a reduction. If you do not let your investment dealer or the Fund know you are eligible for a reduced sales charge at the time of purchase, you will not receive the discount to which you may otherwise be entitled.
| Right of Accumulation. Under the right of accumulation, the sales charge you pay is reduced if the current market value of your holdings in a Fund or any other Eaton Vance fund (based on the current maximum public offering price) plus your new purchase total $100,000 or more. Shares of Eaton Vance Cash Management Fund and Eaton Vance Tax Free Reserves cannot be included under the right of accumulation. Shares owned by you, your spouse and children under age twenty-one may be combined for purposes of the right of accumulation, including shares held for the benefit of any of you in omnibus or “street name” accounts. In addition, shares held in a trust or fiduciary account of which any of the foregoing persons is the sole beneficiary (including retirement accounts) may be combined for purposes of the right of accumulation. Shares purchased and/or owned in a SEP, SARSEP and SIMPLE IRA plan also may be combined for purposes of the right of accumulation fo r the plan and its participants. You may be required to provide documentation to establish your ownership of shares included under the right of accumulation (such as account statements for you, your spouse and children or marriage certificates, birth certificates and/or trust or other fiduciary-related documents). |
| Statement of Intention. Under a statement of intention, purchases of $100,000 or more made over a 13-month period are eligible for reduced sales charges. Shares eligible under the right of accumulation (other than those included in employer-sponsored retirement plans) may be included to satisfy the amount to be purchased under a statement of intention. Under a statement of intention, the principal underwriter may hold 5% of the dollar amount to be purchased in escrow in the form of shares registered in your name until you satisfy the statement or the 13-month period expires. A statement of intention does not obligate you to purchase (or a Fund to sell) the full amount indicated in the statement. |
Class A shares are offered at net asset value (without a sales charge) to clients of financial intermediaries who (i) charge an ongoing fee for advisory, investment, consulting or similar services, or (ii) have entered into an agreement with the principal underwriter to offer Class A shares through a no-load network or platform. Such clients may include individuals, corporations, foundations and endowments. Class A shares also are offered at net asset value to investment and institutional clients of Eaton Vance and its affiliates; certain persons affiliated with Eaton Vance; and to certain fund service providers as described in the Statement of Additional Information. Class A shares may also be purchased at net asset value pursuant to the reinvestment privilege and exchange privilege and when distributions are reinvested. See “Shareholder Account Features” for details.
Contingent Deferred Sales Charge. Each Class of shares is subject to a CDSC on certain redemptions. Class A shares purchased at net asset value in amounts of $1 million or more are subject to a 1.00% CDSC if redeemed within 18 months of purchase. Class C shares are subject to a 1.00% CDSC if redeemed within one year of purchase. Class B shares are subject to the following CDSC schedule:
18
| | |
| Year of Redemption After Purchase | CDSC | |
| |
| First | 3.0% | CDSCs are based on the lower of the net asset value at the |
| Second | 2.5% | time of purchase or at the time of redemption. Shares |
| Third | 2.0% | acquired through the reinvestment of distributions are |
| Fourth | 1.0% | exempt from the CDSC. Redemptions are made first from |
| Fifth or following | 0% | shares that are not subject to a CDSC. |
The sales commission payable to investment dealers in connection with sales of Class B and Class C shares is described under "Distribution and Service Fees" below.
CDSC Waivers. CDSCs are waived for certain redemptions pursuant to a Withdrawal Plan (see “Shareholder Account Features”). The CDSC is also waived following the death of a beneficial owner of shares (a death certificate and other applicable documents may be required).
Conversion Feature. After the longer of four years or the time when the CDSC applicable to your Class B shares expire, Class B shares automatically convert to Class A shares. Class B shares acquired through the reinvestment of distributions convert in proportion to shares not so acquired.
Distribution and Service Fees. Class A, Class B and Class C shares have in effect plans under Rule 12b-1 that allows each Fund to pay distribution fees for the sale and distribution of shares (so-called “12b-1 fees”) and service fees for personal and/or shareholder account services. Class B and Class C shares pay distribution fees to the principal underwriter of 0.75% of average daily net assets annually. Because these fees are paid from Fund assets on an ongoing basis, they will increase your cost over time and may cost you more than paying other types of sales charges. The principal underwriter compensates investment dealers on sales of Class B and Class C shares (except exchange transactions and reinvestments) in an amount equal to 3% and 1%, respectively, of the purchase price of the shares. After the first year, investment dealers also receive 0.75% of the value of Class C shares in annual distributio n fees. Class B and Class C shares also pay service fees to the principal underwriter equal to 0.15% of average daily net assets annually. Class A shares pay distribution and service fees equal to 0.15% of average daily net assets annually. After the sale of shares, the principal underwriter receives the Class A distribution and service fees and the Class B and Class C service fees for one year and thereafter investment dealers generally receive them based on the value of shares sold by such dealers for shareholder servicing performed by such investment dealers. Although there is no present intention to do so, Class A, Class B and Class C could pay service fees of up to 0.25% annually upon Trustee approval. Distribution and service fees are subject to the limitations contained in the sales charge rule of the Financial Industry Regulatory Authority.
More information about sales charges is available free of charge on the Eaton Vance website at www.eatonvance.com and in the Statement of Additional Information. Please consult the Eaton Vance website for any updates to sales charge information before making a purchase of Fund shares.
19
Redeeming Shares
You can redeem shares in any of the following ways: |
| |
By Mail | Send your request to the transfer agent along with any certificates and stock powers. The request must be signed exactly as your account is registered (for instance, a joint account must be signed by all registered owners to be accepted) and a signature guarantee may be required. Call 1-800-262-1122 for additional information. You can obtain a signature guarantee at banks, savings and loan institutions, credit unions, securities dealers, securities exchanges, clearing agencies and registered securities associations that participate in The Securities Transfer Agents Medallion Program, Inc. (STAMP, Inc.). Only signature guarantees issued in accordance with STAMP, Inc. will be accepted. You may be asked to provide additi onal documents if your shares are registered in the name of a corporation, partnership or fiduciary. |
| | |
By Telephone | You can redeem up to $100,000 per account (which may include shares of one or more Eaton Vance funds) per day by calling 1-800-262-1122 Monday through Friday, 8:00 a.m. to 6:00 p.m. (eastern time). Proceeds of a telephone redemption can be sent only to the account address or to a bank pursuant to prior instructions. Shares held by corporations, trusts or certain other entities and shares that are subject to fiduciary arrangements cannot be redeemed by telephone. |
| | |
Through an Investment Dealer | Your investment dealer is responsible for transmitting the order promptly. An investment dealer may charge a fee for this service. |
If you redeem shares, your redemption price will be based on the net asset value per share next computed after the redemption request is received in good order by a Fund’s transfer agent. Your redemption proceeds normally will be paid in cash within seven days, reduced by the amount of any applicable CDSC and any federal income tax required to be withheld. Payments will be sent by regular mail. However, if you have given complete written authorization in advance, you may request that the redemption proceeds be wired directly to your bank account. The bank designated may be any bank in the United States. The request may be made by calling 1-800-262-1122 or by sending a signature guaranteed letter of instruction to the transfer agent (see back cover for address). Corporations, trusts and other entities may need to provide additional documentation. You may be required to pay the costs of such transaction by a Fund or your bank. No costs are currently charged by a Fund. However, c harges may apply for expedited mail delivery services. Each Fund may suspend or terminate the expedited payment procedure upon at least 30 days’ notice.
If you recently purchased shares, the proceeds of a redemption will not be sent until the purchase check (including a certified or cashier’s check) has cleared. If the purchase check has not cleared, redemption proceeds may be delayed up to 15 days from the purchase date. If your account value falls below $750 (other than due to market decline), you may be asked either to add to your account or redeem it within 60 days. If you take no action, your account will be redeemed and the proceeds sent to you.
While redemption proceeds are normally paid in cash, redemptions may be paid by distributing marketable securities. If you receive securities, you could incur brokerage or other charges in converting the securities to cash.
Shareholder Account Features
Distributions. You may have your Fund distributions paid in one of the following ways:
| |
•Full Reinvest Option | Distributions are reinvested in additional shares. This option will be assigned if you do not specify an option. |
| | |
| •Partial Reinvest Option | Dividends are paid in cash and capital gains are reinvested in additional shares. |
| | |
| •Cash Option | Distributions are paid in cash. |
| | |
•Exchange Option | Distributions are reinvested in additional shares of any class of another Eaton Vance fund chosen by you, subject to the terms of that fund’s prospectus. Before selecting this option, you must obtain a prospectus of the other fund and consider its objectives, risks, and charges and expenses carefully. |
Information about the Funds. From time to time, you may receive the following:
20
- Semiannual and annual reports containing a list of portfolio holdings as of the end of the second and fourth fiscal quarters, respectively, performance information and financial statements.
- Periodic account statements, showing recent activity and total share balance.
- Tax information needed to prepare your income tax returns.
- Proxy materials, in the event a shareholder vote is required.
- Special notices about significant events affecting your Fund.
Most fund information (including semiannual and annual reports, prospectuses and proxy statements) as well as your periodic account statements can be delivered electronically. For more information please go to www.eatonvance.com. Select “Mutual Funds” then “Electronic Delivery”.
Each Fund will file with the Securities and Exchange Commission (“SEC”) a list of its portfolio holdings as of the end of the first and third fiscal quarters on Form N-Q. Each Fund’s annual and semiannual reports (as filed on Form N-CSR) and each Form N-Q may be viewed on the SEC’s website (www.sec.gov). The most recent fiscal quarter end holdings may also be viewed on the Eaton Vance website (www.eatonvance.com). Portfolio holdings information that is filed with the SEC is posted on the Eaton Vance website approximately 60 days after the end of the quarter to which it relates. Portfolio holdings information as of each calendar quarter end is posted to the website 30 days after such quarter end. Each Fund also posts information about certain portfolio characteristics (such as top ten holdings and asset allocation) as of the most recent calendar quarter end on the Eaton Vance website approximately ten business days after the calendar quarter end.
The Eaton Vance funds have established policies and procedures with respect to the disclosure of portfolio holdings and other information concerning Fund characteristics. A description of these policies and procedures is provided in the Statement of Additional Information. Such policies and procedures regarding disclosure of portfolio holdings are designed to prevent the misuse of material, non-public information about the funds.
Withdrawal Plan. You may redeem shares on a regular periodic basis by establishing a systematic withdrawal plan. Withdrawals will not be subject to any applicable CDSC if they are, in the aggregate, less than or equal to 12% annually of the greater of either the initial account balance or the current account balance. Because purchases of Class A shares are generally subject to an initial sales charge, Class A shareholders should not make withdrawals from their accounts while also making purchases.
Exchange Privilege. You may exchange your Fund shares for shares of the same Class of another Eaton Vance fund or, in the case of Class B and Class C shares, Eaton Vance Money Market Fund. Exchanges are made at net asset value. If your shares are subject to a CDSC, the CDSC will continue to apply to your new shares at the same CDSC rate. For purposes of the CDSC, your shares will continue to age from the date of your original purchase of Fund shares.
Before exchanging, you should read the prospectus of the new fund carefully. Exchanges are subject to the terms applicable to purchases of the new fund’s shares as set forth in its prospectus. If you wish to exchange shares, write to the transfer agent (see back cover for address) or call 1-800-262-1122. Periodic automatic exchanges are also available. The exchange privilege may be changed or discontinued at any time. You will receive at least 60 days’ notice of any material change to the privilege. This privilege may not be used for “market timing” and may be terminated for market timing accounts or for any other reason. For additional information, see "Restrictions on Excessive Trading and Market Timing" under "Purchasing Shares".
Reinvestment Privilege. If you redeem shares, you may reinvest at net asset value all or any portion of the redemption proceeds in the same class of shares of the Fund you redeemed from, provided that the reinvestment occurs within 60 days of the redemption, and the privilege has not been used more than once in the prior 12 months. Under these circumstances your account will be credited with any CDSC paid in connection with the redemption. Any CDSC period applicable to the shares you acquire upon reinvestment will run from the date of your original share purchase. Reinvestment requests must be in writing. At the time of a reinvestment, you or your financial intermediary must notify the Fund or the transfer agent that you are reinvesting redemption proceeds in accordance with this privilege. If you reinvest, your purchase will be at the next determined net asset value following receipt of your request.
Telephone and Electronic Transactions. You can redeem or exchange shares by telephone as described in this Prospectus. In addition, certain transactions may be conducted through the Eaton Vance website. The transfer agent and the principal underwriter have procedures in place to authenticate telephone and electronic instructions (such as using security codes or verifying personal account information). As long as the transfer agent and principal underwriter follow reasonable procedures, they will not be responsible for unauthorized telephone or electronic transactions and you bear the risk of possible loss resulting from these transactions. You may decline the telephone redemption option on the account application. Telephone instructions are recorded.
“Street Name” Accounts. If your shares are held in a “street name” account at an investment dealer, that dealer (and not the Fund or its transfer agent) will perform all recordkeeping, transaction processing and distribution payments. Because the Fund will have
21
no record of your transactions, you should contact your investment dealer to purchase, redeem or exchange shares, to make changes in your account, or to obtain account information. You will not be able to utilize a number of shareholder features, such as telephone transactions, directly with a Fund. If you transfer shares in a “street name” account to an account with another investment dealer or to an account directly with a Fund, you should obtain historical information about your shares prior to the transfer.
Procedures for Opening New Accounts. To help the government fight the funding of terrorism and money laundering activities, federal law requires financial institutions to obtain, verify and record information that identifies each new customer who opens a Fund account and to determine whether such person’s name appears on government lists of known or suspected terrorists or terrorist organizations. When you open an account, the transfer agent or your investment dealer will ask you for your name, address, date of birth (for individuals), residential or business street address (although post office boxes are still permitted for mailing) and social security number, taxpayer identification number, or other government-issued identifying number. You also may be asked to produce a copy of your driver’s license, passport or other identifying documents in order to verify your identity. In addition, it may be necessary to verify your identity by cross-referencing your identification information with a consumer report or other electronic databases. Other information or documents may be required to open accounts for corporations and other entities. Federal law prohibits a Fund and other financial institutions from opening a new account unless they receive the minimum identifying information described above. If a person fails to provide the information requested, any application by that person to open a new account will be rejected. Moreover, if the transfer agent or the investment dealer is unable to verify the identity of a pers on based on information provided by that person, it may take additional steps including, but not limited to, requesting additional information or documents from the person, closing the person’s account or reporting the matter to the appropriate federal authorities. If your account is closed for this reason, your shares may be automatically redeemed at the net asset value next determined. If a Fund’s net asset value has decreased since your purchase, you will lose money as a result of this redemption. Each Fund has also designated an anti-money laundering compliance officer.
Account Questions. If you have any questions about your account or the services available, please call Eaton Vance Shareholder Services at 1-800-262-1122 Monday through Friday, 8:00 a.m. to 6:00 p.m. (eastern time), or write to the transfer agent (see back cover for address).
Tax Information
Each Fund declares dividends daily and ordinarily pays distributions monthly. Different Classes of a Fund may distribute different dividend amounts. Your account will be credited with dividends beginning on the business day after the day when the funds used to purchase your Fund shares are collected by the transfer agent. For tax purposes, the entire monthly distribution of the Fund’s daily dividends ordinarily will constitute tax-exempt income to you. Distributions of net realized gains, if any, will be made at least annually (usually in December). The exemption of “exempt-interest dividend” income from regular federal income taxation does not necessarily result in similar exemptions from such income under the state or local tax laws.
A Fund may invest a portion of its assets in securities that generate income that is not exempt from federal income tax. Taxes on distributions of capital gains are determined by how long the Fund owned the investments that generated them, rather than how long a shareholder has owned his or her shares in the Fund. Distributions of any taxable income and net short-term capital gains will be taxable as ordinary income. Distributions of any long-term capital gains are taxable as long-term capital gains. Distributions of interest on certain municipal obligations are a tax preference item under the AMT provisions applicable to individuals and corporations, and all tax-exempt distributions may affect a corporation’s AMT liability. Each Fund’s distributions will be treated as described above for federal income tax purposes whether they are paid in cash or reinvested in additional shares. A redemption of Fund shares, including an exchange for shares of another fund, is a taxable transaction.
Shareholders, particularly corporations, recipients of social security or railroad retirement benefits and those subject to the AMT, should consult with their advisers concerning the applicability of federal, state, local and other taxes to an investment. Additional information about state taxes is provided below.
California. Under California law, dividends paid by the California Fund and designated by it as tax-exempt are exempt from California personal income tax on individuals who reside in California to the extent such dividends are derived from interest payments on municipal obligations exempt from California state personal income taxes and provided that at least 50% of the assets of the California Fund at the close of each quarter of its taxable year consist of obligations the interest on which is exempt under either federal or California law from taxation by the state of California. Distributions of short-term capital gains are treated as ordinary income, and distributions of long-term capital gains are treated as long-term capital gains taxable at ordinary income rates under the California personal income tax. Distributions from the California Fund, including distributions derived from interest pay ments on California tax-exempt obligations as well as from taxable income and capital gains, are included in the tax base for the California franchise tax on corporations.
22
Massachusetts. The Massachusetts Fund’s interest distributions attributable to Massachusetts obligations (debt obligations issued by The Commonwealth of Massachusetts or its political subdivisions, including agencies or instrumentalities thereof), Possessions obligations (debt obligations issued by the Governments of Puerto Rico, Guam, or the United States Virgin Islands) or United States obligations can be excluded from Massachusetts gross income for Massachusetts personal income tax purposes. Distributions properly designated as capital gain dividends and attributable to gains realized on the sale of certain Massachusetts tax-exempt obligations issued pursuant to statutes that specifically exempt such gains from Massachusetts taxation will also be exempt from Massachusetts personal income tax. Other distributions from the Massachusetts Fund that are included in a shareholder’s federal gross income, including distributions of net long-term capi tal gains not described in the preceding sentence and net short-term capital gains, are generally not exempt from Massachusetts personal income tax.
Distributions from the Massachusetts Fund and the value of the shares of the Massachusetts Fund may be subject to the Massachusetts excise tax on corporations.
New Jersey. The New Jersey Fund intends to satisfy New Jersey’s statutory requirements for treatment as a “Qualified Investment Fund” under the provisions of the New Jersey Gross Income Tax Act (N.J.S.A. Sections 54A: 5-1 et seq.), as amended and any regulations promulgated thereunder. The Fund has obtained an opinion of special tax counsel to the New Jersey Fund that, provided the New Jersey Fund limits its investments to those described in this prospectus and otherwise satisfies such statutory requirements, shareholders of the New Jersey Fund which are individuals, estates or trusts will not be required to include in their New Jersey gross income distributions from the New Jersey Fund that are attributable to interest or gain realized by the New Jersey Fund from obligations the interest on which is exempt from regular federal income tax and is exempt from New Jersey State personal income tax or othe r obligations statutorily free from New Jersey taxation. However, with regard to corporate shareholders, such counsel is also of the opinion that distributions from the New Jersey Fund will not be excluded from net income and shares of the New Jersey Fund will not be excluded from investment capital in determining New Jersey corporation business (franchise) and corporation income taxes for corporate shareholders.
New York. Under New York law, dividends paid by the New York Fund are exempt from the New York State and New York City personal income tax applicable to individuals who reside in New York State and/or City to the extent such dividends are excluded from gross income for federal income tax purposes and are derived from interest payments on tax-exempt obligations issued by or on behalf of New York State and its political subdivisions and agencies, or the governments of Puerto Rico, the U.S. Virgin Islands and Guam. Other distributions from the New York Fund, including distributions derived from taxable ordinary income and net short-term and long-term capital gains, are generally not exempt from New York State or City personal income tax. Distributions from the New York Fund, including distributions derived from interest payments on New York tax-exempt obligations as well as from taxable income and capital gains, are subject to the New York Corporation Franchise Tax and the New York City General Corporation Tax.
Ohio. In the opinion of special tax counsel to the Ohio Fund, under Ohio law individuals who are otherwise subject to the Ohio personal income tax will not be subject to such tax on dividends paid by the Ohio Fund to the extent such dividends are properly attributable to interest on obligations issued by or on behalf of the State of Ohio or its political subdivisions, or the agencies or instrumentalities thereof (“Ohio obligations”). Dividends paid by the Ohio Fund also will be excluded from the net income base of the Ohio corporation franchise tax to the extent such dividends are excluded from gross income for federal income tax purposes or are properly attributable to interest on Ohio obligations. However, the Ohio Fund’s shares will be included in the tax base for purposes of computing the Ohio corporation franchise tax on the net worth basis. Dividends paid by the Ohio Fund are exempt from Ohio municipal and joint economic development d istrict income taxes as intangible income and are not subject to any permissible Ohio municipal or joint economic development district income taxes on intangible income that are part of business net profits to the extent that such dividends are excluded from gross income for federal income tax purposes or are properly attributable to interest on Ohio obligations. Dividends paid by the Ohio Fund are exempt from Ohio school district income taxes to the extent that such dividends are excluded from gross income for federal income tax purposes or are properly attributable to interest on Ohio obligations. These conclusions regarding Ohio taxation are based on the assumption that the Ohio Fund will continue to qualify as a regulated investment company under the Internal Revenue Code and that at all times at least 50% of the value of the total assets of the Ohio Fund will consist of Ohio obligations or similar obligations of other states or their subdivisions.
Pennsylvania. Provided that the Fund qualifies as a "regulated investment company" under the Code and is registered under the 1940 Act, interest derived by the Pennsylvania Fund from obligations which are statutorily free from state taxation in Pennsylvania (“Exempt Obligations”) will not be taxable on pass through to shareholders for purposes of the Pennsylvania personal income tax. The term “Exempt Obligations” includes (i) those obligations issued by the Commonwealth of Pennsylvania and its political subdivisions, agencies and instrumentalities, the interest from which is statutorily free from state taxation in the Commonwealth of Pennsylvania, and (ii) certain U.S. government obligations and certain qualifying obligations of U.S. territories and possessions. Distributions attributable to most other sources, including capital gains, will not be exempt from Pennsylvania personal income tax.
Corporate shareholders that are subject to the Pennsylvania corporate net income tax will not be subject to corporate net income tax on distributions made by the Pennsylvania Fund, provided such distributions are derived from interest on Exempt Obligations.
23
To support any claim for exemption, the corporate taxpayer must submit evidence that the income was received from a regulated investment company and submit a schedule indicating the percentage of income applicable to exempt and non-exempt assets. Distributions of capital gain attributable to Exempt Obligations will be subject to the Pennsylvania corporate net income tax. In addition, corporate shareholders will be entitled to a pass-through exemption in computing the exempt single-asset fraction for capital stock/franchise tax purposes. Specifically, an investment in the Pennsylvania Fund is granted an exemption for the same percentage as the deduction allowed from taxable income, on a pass-through basis, for purposes of the corporate net income tax. Gain from the sale, exchange or other disposition of the shares generally will be subject to the Pennsylvania personal income tax and corporate net income tax.
Shares of the Pennsylvania Fund which are held by individual shareholders who are Pennsylvania residents and subject to the Pennsylvania county personal property tax will be exempt from such tax to the extent that the obligations held by the Pennsylvania Fund consist of Exempt Obligations on the annual assessment date. Corporations are not subject to Pennsylvania personal property taxes.
For individual shareholders who are residents of the City of Philadelphia, distributions of interest derived from Exempt Obligations will not be taxable for purposes of the Philadelphia School District Investment Net Income Tax, provided that the Pennsylvania Fund reports to its investors the percentage of Exempt Obligations held by the Pennsylvania Fund for the year. The Pennsylvania Fund will report such percentage to its investors. Gain from the sale, exchange or other disposition of shares of the Pennsylvania Fund will be subject to the Philadelphia School District Investment Net Income Tax if the shares have been held for a period of six months or less prior to the disposition.
Shares of the Pennsylvania Fund may be subject to the Pennsylvania inheritance tax and Pennsylvania estate tax if held by a Pennsylvania decedent at the time of death.
24
Financial Highlights
The financial highlights are intended to help you understand a Fund’s financial performance for the period(s) indicated. Certain information in the tables reflects the financial results for a single Fund share. The total returns in the tables represent the rate an investor would have earned (or lost) on an investment in a Fund (assuming reinvestment of all distributions at net asset value). This information has been audited by Deloitte & Touche LLP, an independent registered public accounting firm. The report of Deloitte & Touche LLP and each Fund’s financial statements are incorporated herein by reference and included in the Fund’s annual report, which is available upon request.
| | | | | | | | | |
| | California Limited Fund |
|
|
| | Year Ended March 31, |
|
|
| | 2009 | 2008 | 2007 |
|
|
| | Class A | Class B | Class C | Class A | Class B | Class C | Class A | Class B | Class C |
|
| Net asset value - Beginning of year | $10.030 | $10.000 | $ 9.690 | $10.410 | $10.370 | $10.050 | $10.330 | $10.300 | $ 9.980 |
| Income (loss) from operations | | | | | | | | | |
| Net investment income(1) | $ 0.376 | $ 0.299 | $ 0.290 | $ 0.381 | $ 0.304 | $0.294 | $ 0.378 | $ 0.303 | $ 0.280 |
| Net realized and unrealized gain (loss) | (0.734) | (0.733) | (0.703) | (0.380) | (0.372) | (0.361) | 0.082 | 0.068 | 0.082 |
| Total income (loss) from operations | $ (0.358) | $ (0.434) | $(0.413) | $ 0.001 | $ (0.068) | $ (0.067) | $ 0.460 | $ 0.371 | $ 0.362 |
| Less distributions | | | | | | | | | |
| From net investment income | $ (0.382) | $ (0.306) | $(0.297) | $ (0.381) | $ (0.302) | $ (0.293) | $ (0.380) | $ (0.301) | $ (0.292) |
| Total distributions | $ (0.382) | $ (0.306) | $(0.297) | $ (0.381) | $ (0.302) | $ (0.293) | $ (0.380) | $ (0.301) | $ (0.292) |
| Net asset value - End of year | $ 9.290 | $ 9.260 | $ 8.980 | $10.030 | $10.000 | $9.690 | $10.410 | $10.370 | $10.050 |
| Total Return(2) | (3.67)% | (4.42)% | (4.35)% | 0.00%(3) | (0.68)% | (0.69)% | 4.52% | 3.64% | 3.67% |
| Ratios/Supplemental Data | | | | | | | | | |
| Net assets, end of year (000’s omitted) | $20,017 | $ 860 | $ 1,820 | $36,615 | $ 607 | $1,449 | $35,937 | $ 770 | $ 562 |
| Ratios (As a percentage of average daily net assets): | | | | | | | | | |
| Expenses before custodian fee reduction | 0.94% | 1.70% | 1.70% | 0.85% | 1.60% | 1.60% | 0.93% | 1.68% | 1.68% |
| Expenses after custodian fee reduction | 0.93% | 1.68% | 1.68% | 0.82% | 1.57% | 1.57% | 0.90% | 1.65% | 1.65% |
| Net investment income | 3.87% | 3.14% | 3.12% | 3.70% | 2.96% | 2.96% | 3.65% | 2.94% | 2.78% |
| Portfolio Turnover of the Fund | 7% | 7% | 7% | 55% | 55% | 55% | 32% | 32% | 32% |
| (See footnotes on last page.) |
25
| Financial Highlights (continued) |
| | | | | | |
| | California Limited Fund |
|
|
| | Year Ended March 31, |
|
|
| | 2006 | 2005 |
|
|
| | Class A | Class B | Class C | Class A | Class B | Class C (6) |
|
| Net asset value - Beginning of period | $10.290 | $10.260 | $ 9.950 | $10.560 | $10.520 | $10.000 |
| Income (loss) from operations | | | | | | |
| Net investment income(1) | $ 0.377 | $ 0.298 | $ 0.282 | $0.377 | $ 0.301 | $0.002 |
| Net realized and unrealized gain (loss) | 0.036 | 0.035 | 0.034 | (0.274) | (0.268) | (0.052) |
| Total income (loss) from operations | $ 0.413 | $ 0.333 | $ 0.316 | $0.103 | $ 0.033 | $ (0.050) |
| Less distributions | | | | | | |
| From net investment income | $ (0.373) | $ (0.293) | $(0.286) | $ (0.373) | $ (0.293) | — |
| Total distributions | $ (0.373) | $ (0.293) | $(0.286) | $ (0.373) | $ (0.293) | — |
| Net asset value - End of period | $10.330 | $10.300 | $ 9.980 | $10.290 | $10.260 | $9.950 |
| Total Return(2) | 4.06% | 3.28% | 3.15% | 0.99% | 0.31% | (0.01)%(7) |
| Ratios/Supplemental Data | | | | | | |
| Net assets, end of year (000’s omitted) | $33,830 | $ 2,687 | $22 | $31,555 | $ 3,837 | $ 10 |
| Ratios (As a percentage of average daily net assets): | | | | | | |
| Expenses before custodian fee reduction | 0.86% | 1.61% | 1.61% | 0.90%(4) | 1.65%(4) | 0.00%(3)(8) |
| Expenses after custodian fee reduction | 0.84% | 1.59% | 1.59% | 0.89%(4) | 1.64%(4) | 0.00%(3)(8) |
| Net investment income | 3.64% | 2.89% | 2.83% | 3.62% | 2.90% | 0.00%(3)(8) |
| Portfolio Turnover of the Fund | 28% | 28% | 28% | 13% | 13% | 13%(7) |
| Portfolio Turnoer of the Portfolio | — | — | — | 13%(5) | 13%(5) | — |
| (See footnotes on last page.) |
26
| Financial Highlights (continued) |
| | | | | | | | | |
| | Massachusetts Limited Fund |
|
|
| | Year Ended March 31, |
|
|
| | 2009 | 2008 | 2007 |
|
|
| | Class A | Class B | Class C | Class A | Class B | Class C | Class A | Class B | Class C |
|
| Net asset value - Beginning of year | $ 9.970 | $ 9.960 | $ 9.550 | $10.200 | $10.200 | $ 9.770 | $10.110 | $10.110 | $ 9.690 |
| Income (loss) from operations | | | | | | | | | |
| Net investment income(1) | $ 0.360 | $ 0.288 | $ 0.274 | $ 0.371 | $ 0.297 | $ 0.284 | $ 0.372 | $ 0.295 | $ 0.284 |
| Net realized and unrealized gain (loss) | (0.407) | (0.399) | (0.387) | (0.231) | (0.244) | (0.223) | 0.092 | 0.092 | 0.081 |
| Total income from operations | $ (0.047) | $(0.111) | $ (0.113) | $ 0.140 | $ 0.053 | $ 0.061 | $ 0.464 | $ 0.387 | $ 0.365 |
| Less distributions | | | | | | | | | |
| From net investment income | $ (0.363) | $(0.289) | $ (0.277) | $ (0.370) | $ (0.293) | $ (0.281) | $ (0.374) | $ (0.297) | $ (0.285) |
| Total distributions | $ (0.363) | $(0.289) | $ (0.277) | $ (0.370) | $ (0.293) | $ (0.281) | $ (0.374) | $ (0.297) | $ (0.285) |
| Net asset value - End of year | $ 9.560 | $ 9.560 | $ 9.160 | $ 9.970 | $ 9.960 | $ 9.550 | $10.200 | $10.200 | $ 9.770 |
| Total Return(2) | (0.50)% | (1.15)% | (1.22)% | 1.39% | 0.52% | 0.63% | 4.66% | 3.87% | 3.81% |
| Ratios/Supplemental Data | | | | | | | | | |
| Net assets, end of year (000’s omitted) | $46,857 | $ 854 | $12,611 | $49,514 | $ 1,628 | $12,995 | $45,300 | $ 3,648 | $14,139 |
| Ratios (As a percentage of average daily net assets): | | | | | | | | | |
| Expenses before custodian fee reduction | 0.85% | 1.60% | 1.60% | 0.84% | 1.60% | 1.60% | 0.84% | 1.59% | 1.59% |
| Expenses after custodian fee reduction | 0.84% | 1.59% | 1.59% | 0.83% | 1.58% | 1.58% | 0.82% | 1.57% | 1.57% |
| Net investment income | 3.69% | 2.94% | 2.93% | 3.67% | 2.94% | 2.93% | 3.65% | 2.91% | 2.91% |
| Portfolio Turnover of the Fund | 16% | 16% | 16% | 14% | 14% | 14% | 14% | 14% | 14% |
| (See footnotes on last page.) |
27
| Financial Highlights (continued) |
| | | | | | |
| | Massachusetts Limited Fund |
|
|
| | Year Ended March 31, |
|
|
| | 2006 | 2005 |
|
|
| | Class A | Class B | Class C | Class A | Class B | Class C |
|
| Net asset value - Beginning of year | $10.180 | $10.170 | $ 9.740 | $10.460 | $10.450 | $10.020 |
| Income (loss) from operations | | | | | | |
| Net investment income(1) | $0.367 | $ 0.289 | $ 0.278 | $ 0.370 | $ 0.292 | $ 0.280 |
| Net realized and unrealized gain (loss) | (0.074) | (0.066) | (0.057) | (0.287) | (0.289) | (0.287) |
| Total income (loss) from operations | $0.293 | $ 0.223 | $ 0.221 | $ 0.083 | $ 0.003 | $ (0.007) |
| Less distributions | | | | | | |
| From net investment income | $ (0.363) | $ (0.283) | $ (0.271) | $ (0.363) | $ (0.283) | $ (0.273) |
| Total distributions | $ (0.363) | $ (0.283) | $ (0.271) | $ (0.363) | $ (0.283) | $ (0.273) |
| Net asset value - End of year | $10.110 | $10.110 | $ 9.690 | $10.180 | $10.170 | $ 9.740 |
| Total Return(2) | 2.90% | 2.20% | 2.28% | 0.79% | 0.02% | (0.14)%(9) |
| Ratios/Supplemental Data | | | | | | |
| Net assets, end of year (000’s omitted) | $47,407 | $ 7,234 | $19,901 | $48,901 | $10,350 | $27,589 |
| Ratios (As a percentage of average daily net assets): | | | | | | |
| Expenses before custodian fee reduction | 0.82% | 1.57% | 1.57% | 0.82%(4) | 1.57%(4) | 1.57%(4) |
| Expenses after custodian fee reduction | 0.81% | 1.56% | 1.56% | 0.81%(4) | 1.56%(4) | 1.56%(4) |
| Net investment income | 3.59% | 2.83% | 2.84% | 3.59% | 2.83% | 2.83% |
| Portfolio Turnover of the Fund | 7% | 7% | 7% | 7% | 7% | 7% |
| Portfolio Turnover of the Portfolio | — | — | — | 13%(5) | 13%(5) | 13%(5) |
| (See footnotes on last page.) |
28
| Financial Highlights (continued) |
| | | | | | | | | |
| | New Jersey Limited Fund |
|
|
| | Year Ended March 31, |
|
|
| | 2009 | 2008 | 2007 |
|
|
| | Class A | Class B | Class C | Class A | Class B | Class C | Class A | Class B | Class C (10) |
|
| Net asset value - Beginning of period | $ 9.900 | $ 9.900 | $ 9.910 | $10.210 | $10.210 | $10.210 | $10.110 | $10.100 | $10.110 |
| Income (loss) from operations | | | | | | | | | |
| Net investment income(1) | $ 0.363 | $ 0.291 | $ 0.291 | $ 0.372 | $0.302 | $ 0.289 | $ 0.392 | $ 0.316 | $0.210 |
| Net realized and unrealized gain (loss) | (0.401) | (0.393) | (0.412) | (0.298) | (0.305) | (0.282) | 0.083 | 0.093 | 0.089 |
| Total income (loss) from operations | $ (0.038) | $(0.102) | $(0.121) | $ 0.074 | $ (0.003) | $ 0.007 | $ 0.475 | $ 0.409 | $0.299 |
| Less distributions | | | | | | | | | |
| From net investment income | $ (0.372) | $(0.298) | $(0.299) | $ (0.384) | $ (0.307) | $ (0.307) | $ (0.375) | $ (0.299) | $ (0.199) |
| Total distributions | $ (0.372) | $(0.298) | $(0.299) | $ (0.384) | $ (0.307) | $ (0.307) | $ (0.375) | $ (0.299) | $ (0.199) |
| Net asset value - End of period | $ 9.490 | $ 9.500 | $ 9.490 | $ 9.900 | $9.900 | $ 9.910 | $10.210 | $10.210 | $10.210 |
| Total Return(2) | (0.39)% | (1.05)% | (1.24)% | 0.74% | (0.03)% | 0.08% | 4.76% | 4.09% | 2.84%(7) |
| Ratios/Supplemental Data | | | | | | | | | |
| Net assets, end of period (000’s omitted) | $41,746 | $ 648 | $ 519 | $42,612 | $801 | $ 144 | $37,031 | $ 2,875 | $1 |
| Ratios (As a percentage of average daily net assets): | | | | | | | | | |
| Expenses excluding interest and fees | 0.89% | 1.64% | 1.64% | 0.91% | 1.66% | 1.64% | 0.91% | 1.66% | 1.63%(8) |
| Interest and fee expense(12) | — | — | — | 0.02% | 0.02% | 0.02% | — | — | — |
| Total expenses before custodian fee reduction | 0.89% | 1.64% | 1.64% | 0.93% | 1.68% | 1.66% | 0.91% | 1.66% | 1.63%(8) |
| Expenses after custodian fee reduction excluding interest and fees | 0.87% | 1.62% | 1.62% | 0.88% | 1.64% | 1.61% | 0.90% | 1.65% | 1.62%(8) |
| Net investment income | 3.76% | 3.01% | 3.03% | 3.69% | 2.99% | 2.87% | 3.85% | 3.11% | 3.09%(8) |
| Portfolio Turnover of the Fund | 23% | 23% | 23% | 12% | 12% | 12% | 18% | 18% | 18%(11) |
| (See footnotes on last page.) |
29
| Financial Highlights (continued) |
| | | | |
| | New Jersey Limited Fund |
|
|
| | Year Ended March 31, |
|
|
| | 2006 | 2005 |
|
|
| | Class A | Class B | Class A | Class B |
|
| Net asset value - Beginning of year | $10.100 | $10.100 | $10.360 | $10.350 |
| Income (loss) from operations | | | | |
| Net investment income(1) | $ 0.371 | $ 0.294 | $ 0.366 | $ 0.290 |
| Net realized and unrealized gain (loss) | 0.001 | (0.009) | (0.266) | (0.260) |
| Total income from operations | $ 0.372 | $ 0.285 | $ 0.100 | $ 0.030 |
| Less distributions | | | | |
| From net investment income | $ (0.362) | $ (0.285) | $ (0.360) | $ (0.280) |
| Total distributions | $ (0.362) | $ (0.285) | $ (0.360) | $ (0.280) |
| Net asset value - End of year | $10.110 | $10.100 | $10.100 | $10.100 |
| Total Return(2) | 3.74% | 2.85% | 0.98% | 0.30% |
| Ratios/Supplemental Data | | | | |
| Net assets, end of year (000’s omitted) | $37,080 | $ 5,992 | $43,424 | $ 8,851 |
| Ratios (As a percentage of average daily net assets): | | | | |
| Expenses excluding interest and fees | 0.88% | 1.63% | 0.87%(4) | 1.62%(4) |
| Interest and fee expense(12) | — | — | — | — |
| Total expenses before custodian fee reduction | 0.88% | 1.63% | 0.87% | 1.62% |
| Expenses after custodian fee reduction excluding interest and fees | 0.87% | 1.62% | 0.86%(4) | 1.61%(4) |
| Net investment income | 3.66% | 2.91% | 3.59% | 2.84% |
| Portfolio Turnover of the Fund | 25% | 25% | 14% | 14% |
| Portfolio Turnover of the Portfolio | — | — | 11%(5) | 11%(5) |
| (See footnotes on last page.) |
30
| Financial Highlights (continued) |
| | | | | | | | | |
| | New York Limited Fund |
|
|
| | Year Ended March 31, |
|
|
| | 2009 | 2008 | 2007 |
|
|
| | Class A | Class B | Class C | Class A | Class B | Class C | Class A | Class B | Class C |
|
| Net asset value - Beginning of year | $10.200 | $10.190 | $ 9.690 | $10.600 | $10.590 | $10.070 | $10.480 | $10.470 | $ 9.960 |
| Income (loss) from operations | | | | | | | | | |
| Net investment income(1) | $ 0.387 | $ 0.312 | $ 0.297 | $ 0.402 | $ 0.324 | $ 0.308 | $ 0.395 | $ 0.317 | $ 0.301 |
| Net realized and unrealized gain (loss) | (0.642) | (0.643) | (0.603) | (0.405) | (0.406) | (0.385) | 0.118 | 0.117 | 0.107 |
| Total income (loss) from operations | $ (0.255) | $ (0.331) | $ (0.306) | $ (0.003) | $ (0.082) | $ (0.077) | $ 0.513 | $ 0.434 | $ 0.408 |
| Less distributions | | | | | | | | | |
| From net investment income | $ (0.395) | $ (0.319) | $ (0.304) | $ (0.397) | $ (0.318) | $ (0.303) | $ (0.393) | $ (0.314) | $ (0.298) |
| Total distributions | $ (0.395) | $ (0.319) | $ (0.304) | $ (0.397) | $ (0.318) | $ (0.303) | $ (0.393) | $ (0.314) | $ (0.298) |
| Net asset value - End of year | $ 9.550 | $ 9.540 | $ 9.080 | $10.200 | $10.190 | $ 9.690 | $10.600 | $10.590 | $10.070 |
| Total Return(2) | (2.56)% | (3.31)% | (3.22)% | (0.03)% | (0.79)% | (0.78)% | 4.97% | 4.19% | 4.14% |
| Ratios/Supplemental Data | | | | | | | | | |
| Net assets, end of year (000’s omitted) | $63,159 | $ 1,976 | $22,780 | $71,401 | $ 2,017 | $23,844 | $72,201 | $ 4,457 | $22,155 |
| Ratios (As a percentage of average daily net assets): | | | | | | | | | |
| Expenses excluding interest and fees | 0.80% | 1.55% | 1.55% | 0.82% | 1.57% | 1.57% | 0.82% | 1.56% | 1.56% |
| Interest and fee expense(12) | — | — | — | 0.01% | 0.01% | 0.01% | 0.02% | 0.02% | 0.02% |
| Total expenses before custodian fee reduction | 0.80% | 1.55% | 1.55% | 0.83% | 1.58% | 1.58% | 0.84% | 1.58% | 1.58% |
| Expenses after custodian fee reduction excluding interest and fees | 0.79% | 1.54% | 1.55% | 0.81% | 1.56% | 1.56% | 0.81% | 1.57% | 1.57% |
| Net investment income | 3.92% | 3.17% | 3.17% | 3.85% | 3.10% | 3.10% | 3.73% | 3.00% | 3.00% |
| Portfolio Turnover of the Fund | 22% | 22% | 22% | 14% | 14% | 14% | 22% | 22% | 22% |
| (See footnotes on last page.) |
31
| Financial Highlights (continued) |
| | | | | | |
| | New York Limited Fund |
|
|
| | Year Ended March 31, |
|
|
| | 2006 | 2005 |
|
|
| | Class A | Class B | Class C | Class A | Class B | Class C |
|
| Net asset value - Beginning of year | $10.540 | $10.530 | $10.020 | $10.850 | $10.840 | $10.310 |
| Income (loss) from operations | | | | | | |
| Net investment income(1) | $0.388 | $ 0.308 | $ 0.294 | $ 0.394 | $ 0.314 | $ 0.299 |
| Net realized and unrealized gain (loss) | (0.059) | (0.061) | (0.062) | (0.315) | (0.317) | (0.299) |
| Total income (loss) from operations | $0.329 | $ 0.247 | $ 0.232 | $ 0.079 | $ (0.003) | $— |
| Less distributions | | | | | | |
| From net investment income | $ (0.389) | $ (0.307) | $ (0.292) | $ (0.389) | $ (0.307) | $ (0.290) |
| Total distributions | $ (0.389) | $ (0.307) | $ (0.292) | $ (0.389) | $ (0.307) | $ (0.290) |
| Net asset value - End of year | $10.480 | $10.470 | $ 9.960 | $10.540 | $10.530 | $10.020 |
| Total Return(2) | 3.15% | 2.36% | 2.32% | 0.73% | (0.03)% | (0.07)%(9) |
| Ratios/Supplemental Data | | | | | | |
| Net assets, end of year (000’s omitted) | $59,546 | $ 8,978 | $26,477 | $62,843 | $12,518 | $36,837 |
| Ratios (as a percentage of average daily net assets): | | | | | | |
| Expenses excluding interest and fees | 0.82% | 1.57% | 1.57% | 0.80%(4) | 1.55%(4) | 1.55%(4) |
| Interest and fee expense(12) | — | — | — | — | — | — |
| Total expenses before custodian fee agreement | 0.82% | 1.57% | 1.57% | 0.80%(4) | 1.55%(4) | 1.55%(4) |
| Expenses after custodian fee reduction excluding interest and fees | 0.81% | 1.56% | 1.56% | 0.80%(4) | 1.55%(4) | 1.55%(4) |
| Net investment income | 3.67% | 2.92% | 2.92% | 3.69% | 2.94% | 2.94% |
| Portfolio Turnover of the Fund | 22% | 22% | 22% | 12% | 12% | 12% |
| Portfolio Turnover of the Portfolio | — | — | — | 7%(5) | 7%(5) | 7%(5) |
| (See footnotes on last page.) |
32
| Financial Highlights (continued) |
| | | | | | | | | |
| | Ohio Limited Fund |
|
|
| | Year Ended March 31, |
|
|
| | 2009 | 2008 | 2007 |
|
|
| | Class A | Class B | Class C | Class A | Class B | Class C | Class A | Class B | Class C(10) |
|
| Net asset value - Beginning of period | $ 9.420 | $ 9.410 | $ 9.400 | $9.680 | $ 9.670 | $ 9.670 | $9.620 | $ 9.610 | $ 9.600 |
| Income (loss) from operations | | | | | | | | | |
| Net investment income(1) | $ 0.327 | $ 0.256 | $ 0.254 | $0.350 | $ 0.280 | $ 0.274 | $0.349 | $ 0.278 | $ 0.182 |
| Net realized and unrealized gain (loss) | (0.199) | (0.210) | (0.218) | (0.259) | (0.262) | (0.266) | 0.061 | 0.059 | 0.072 |
| Total income from operations | $ 0.128 | $ 0.046 | $ 0.036 | $0.091 | $ 0.018 | $ 0.008 | $0.410 | $ 0.337 | $ 0.254 |
| Less distributions | | | | | | | | | |
| From net investment income | $ (0.348) | $(0.276) | $(0.276) | $ (0.351) | $(0.278) | $(0.278) | $ (0.350) | $(0.277) | $(0.184) |
| Total distributions | $ (0.348) | $(0.276) | $(0.276) | $ (0.351) | $(0.278) | $(0.278) | $ (0.350) | $(0.277) | $(0.184) |
| Net asset value - End of period | $ 9.20 | $ 9.180 | $ 9.160 | $9.420 | $ 9.410 | $ 9.400 | $9.680 | $ 9.670 | $ 9.670 |
| Total Return(2) | 1.26% | 0.39% | 0.39% | 0.96% | 0.19% | 0.08% | 4.33% | 3.56% | 2.53%(7) |
| Ratios/Supplemental Data | | | | | | | | | |
| Net assets, end of year (000’s omitted) | $18,307 | $ 187 | $ 672 | $19,394 | $ 111 | $ 131 | $19,144 | $ 438 | $1 |
| Ratios (As a percentage of average daily net assets): | | | | | | | | | |
| Expenses before custodian fee reduction | 1.09% | 1.84% | 1.83% | 1.02% | 1.77% | 1.77% | 1.03% | 1.78% | 1.78%(8) |
| Expenses after custodian fee reduction | 1.07% | 1.82% | 1.83% | 1.00% | 1.75% | 1.75% | 0.99% | 1.74% | 1.74%(8) |
| Net investment income | 3.52% | 2.77% | 2.77% | 3.65% | 2.92% | 2.88% | 3.60% | 2.88% | 2.81%(8) |
| Portfolio Turnover of the Fund | 9% | 9% | 9% | 13% | 13% | 13% | 10% | 10% | 10%(11) |
| (See footnotes on last page.) |
33
| Financial Highlights (continued) |
| | | | |
| | Ohio Limited Fund |
|
|
| | Year Ended March 31, |
|
|
| | 2006 | 2005 |
|
|
| | Class A | Class B | Class A | Class B |
|
| Net asset value - Beginning of year | $ 9.740 | $ 9.730 | $10.020 | $10.010 |
| Income (loss) from operations | | | | |
| Net investment income(1) | $ 0.346 | $ 0.274 | $ 0.363 | $ 0.289 |
| Net realized and unrealized gain (loss) | (0.104) | (0.109) | (0.293) | (0.294) |
| Total income (loss) from operations | $ 0.242 | $ 0.165 | $ 0.070 | $ (0.005) |
| Less distributions | | | | |
| From net investment income | $ (0.362) | $(0.285) | $ (0.350) | $ (0.275) |
| Total distributions | $ (0.362) | $(0.285) | $ (0.350) | $ (0.275) |
| Net asset value - End of year | $ 9.620 | $ 9.610 | $ 9.740 | $ 9.730 |
| Total Return(2) | 2.50% | 1.73% | 0.70% | (0.05)% |
| Ratios/Supplemental Data | | | | |
| Net assets, end of year (000’s omitted) | $17,286 | $ 880 | $16,783 | $ 2,159 |
| Ratios (As a percentage of average daily net assets): | | | | |
| Expenses before custodian fee reduction | 1.04% | 1.79% | 1.05%(4) | 1.80%(4) |
| Expenses after custodian fee reduction | 1.02% | 1.77% | 1.04%(4) | 1.79%(4) |
| Net investment income | 3.55% | 2.81% | 3.68% | 2.94% |
| Portfolio Turnover of the Fund | 13% | 13% | 7% | 7% |
| Portfolio Turnover of the Portfolio | — | — | 6%(5) | 6%(5) |
| (See footnotes on last page.) |
34
| Financial Highlights (continued) |
| | | | | | | | | |
| | Pennsylvania Limited Fund |
|
|
| | Year Ended March 31, |
|
|
| | 2009 | 2008 | 2007 |
|
|
| | Class A | Class B | Class C | Class A | Class B | Class C | Class A | Class B | Class C |
|
| Net asset value - Beginning of year | $10.030 | $10.030 | $ 9.510 | $10.360 | $10.360 | $9.820 | $10.270 | $10.270 | $ 9.740 |
| Income (loss) from operations | | | | | | | | | |
| Net investment income(1) | $ 0.393 | $ 0.319 | $ 0.303 | $ 0.393 | $ 0.318 | $0.301 | $ 0.396 | $ 0.319 | $ 0.302 |
| Net realized and unrealized gain (loss) | (0.313) | (0.314) | (0.304) | (0.327) | (0.329) | (0.308) | 0.087 | 0.087 | 0.078 |
| Total income (loss) from operations | $ 0.080 | $ 0.005 | $ (0.001) | $ 0.066 | $ (0.011) | $ (0.007) | $ 0.483 | $ 0.406 | $ 0.380 |
| Less distributions | | | | | | | | | |
| From net investment income | $ (0.390) | $ (0.315) | $ (0.299) | $ (0.396) | $ (0.319) | $ (0.303) | $ (0.393) | $ (0.316) | $ (0.300) |
| Total distributions | $ (0.390) | $ (0.315) | $ (0.299) | $ (0.396) | $ (0.319) | $ (0.303) | $ (0.393) | $ (0.316) | $ (0.300) |
| Net asset value - End of year | $ 9.720 | $ 9.720 | $ 9.210 | $10.030 | $10.030 | $9.510 | $10.360 | $10.360 | $ 9.820 |
| Total Return(2) | 0.83% | 0.06% | (0.01)% | 0.64% | (0.11)% | (0.08)% | 4.78% | 4.01% | 3.95% |
| Ratios/Supplemental Data | | | | | | | | | |
| Net assets, end of year (000’s omitted) | $36,461 | $ 550 | $13,884 | $39,272 | $ 1,159 | $13,427 | $33,998 | $ 3,714 | $14,209 |
| Ratios (As a percentage of average daily net assets): | | | | | | | | | |
| Expenses before custodian fee reduction | 0.87% | 1.62% | 1.62% | 0.88% | 1.63% | 1.63% | 0.88% | 1.63% | 1.63% |
| Expenses after custodian fee reduction | 0.86% | 1.61% | 1.61% | 0.85% | 1.60% | 1.60% | 0.86% | 1.61% | 1.61% |
| Net investment income | 4.00% | 3.25% | 3.25% | 3.84% | 3.10% | 3.10% | 3.83% | 3.08% | 3.08% |
| Portfolio Turnover of the Fund | 19% | 19% | 19% | 12% | 12% | 12% | 11% | 11% | 11% |
(See footnotes on last page.)
35
| Financial Highlights (continued) |
| | | | | | |
| | Pennsylvania Limited Fund |
|
|
| | Year Ended March 31, |
|
|
| | 2006 | 2005 |
|
|
| | Class A | Class B | Class C | Class A | Class B | Class C |
|
| Net asset value - Beginning of year | $10.280 | $10.280 | $ 9.750 | $10.550 | $10.550 | $10.000 |
| Income (loss) from operations | | | | | | |
| Net investment income(1) | $0.394 | $ 0.317 | $ 0.300 | $ 0.402 | $ 0.323 | $ 0.307 |
| Net realized and unrealized gain (loss) | (0.004) | (0.005) | (0.006) | (0.272) | (0.273) | (0.257) |
| Total income from operations | $0.390 | $ 0.312 | $ 0.294 | $ 0.130 | $ 0.050 | $ 0.050 |
| Less distributions | | | | | | |
| From net investment income | $ (0.400) | $ (0.322) | $ (0.304) | $ (0.400) | $ (0.320) | $ (0.300) |
| Total distributions | $ (0.400) | $ (0.322) | $ (0.304) | $ (0.400) | $ (0.320) | $ (0.300) |
| Net asset value - End of year | $10.270 | $10.270 | $ 9.740 | $10.280 | $10.280 | $ 9.750 |
| Total Return(2) | 3.84% | 3.06% | 3.05% | 1.25% | 0.48% | 0.44%(9) |
| Ratios/Supplemental Data | | | | | | |
| Net assets, end of year (000’s omitted) | $34,592 | $ 6,962 | $15,894 | $33,611 | $ 8,957 | $16,670 |
| Ratios (As a percentage of average daily net assets): | | | | | | |
| Expenses before custodian fee reduction | 0.87% | 1.62% | 1.62% | 0.88%(4) | 1.63%(4) | 1.63%(4) |
| Expenses after custodian fee reduction | 0.85% | 1.60% | 1.60% | 0.87%(4) | 1.62%(4) | 1.62%(4) |
| Net investment income | 3.82% | 3.07% | 3.07% | 3.86% | 3.11% | 3.12% |
| Portfolio Turnover of the Fund | 22% | 22% | 22% | 6% | 6% | 6% |
| Portfolio Turnover of the Portfolio | — | — | — | 0%(5) | 0%(5) | 0%(5) |
| (1) | Computed using average shares outstanding. |
| (2) | Returns are historical and are calculated by determining the percentage change in net asset value with all distributions reinvested. Total return is not computed on an annualized basis. |
| (3) | Represents less than 0.01%. |
| (4) | Includes the Fund's share of its corresponding Portfolio's allocated expenses while the Fund was making investments directly into the Portfolio. |
| (5) | Portfolio turnover represents the rate of portfolio activity for the period while the Fund was making investments directly into the Portfolio. |
| (6) | For the period from the commencement of offering of Class C shares, March 23, 2005, to March 31, 2005. |
| (7) | Not annualized. |
| (8) | Annualized. |
| (9) | Total return reflects a decrease of 0.06% for New York Fund and Pennsylvania Fund and 0.05% for Massachusetts Fund due to a change in the timing of the payment and reinvestment of distributions. |
| (10) | For the period from the commencement of offering of Class C shares, August 1, 2006, to March 31, 2007. |
| (11) | For the Fund’s fiscal year ended March 31, 2007. |
| (12) | Interest and fee expense relates to the liability for floating rate notes issued in conjunction with inverse floater securities transactions (see Note 1I to the Fund’s audited financial statements). |
36

More Information
| About the Funds: More information is available in the statement of additional information. The statement of additional information is incorporated by reference into this prospectus. Additional information about each Fund’s investments is available in the annual and semiannual reports to shareholders. In the annual report, you will find a discussion of the market conditions and investment strategies that significantly affected each Fund’s performance during the past fiscal year. You may obtain free copies of the statement of additional information and the shareholder reports on Eaton Vance’s website at www.eatonvance.com or by contacting the principal underwriter: |
Eaton Vance Distributors, Inc.
Two International Place
Boston, MA 02110
1-800-262-1122
website: www.eatonvance.com |
| You will find and may copy information about each Fund (including the statement of additional information and shareholder reports): at the Securities and Exchange Commission’s public reference room in Washington, DC (call 1-800-732-0330 for information on the operation of the public reference room); on the EDGAR Database on the SEC’s Internet site (http://www.sec.gov); or, upon payment of copying fees, by writing to the SEC’s Public Reference Section, Washington, DC 20549-0102, or by electronic mail at publicinfo@sec.gov. |
| Shareholder Inquiries: You can obtain more information from Eaton Vance Shareholder Services or the Fund transfer agent, PNC Global Investment Servicing. If you own shares and would like to add to, redeem or change your account, please write or call below: |
| | |
| Regular Mailing Address: | Overnight Mailing Address: | Phone Number: |
| Eaton Vance Funds | Eaton Vance Funds | 1-800-262-1122 |
| PO Box 9653 | 101 Sabin Street | Monday - Friday |
| Providence, RI 02940-9653 | Pawtucket, RI 02860 | |
| | | 8 a.m. - 6 p.m. ET |
| |
| The Funds’ Investment Company Act No. is 811-04443. | LTDP8/1 |
| 603-8/09 | © 2009 Eaton Vance Management |