UNITED STATES SECURITIES AND EXCHANGE COMMISSION
Washington, D.C. 20549
Form N-CSR
CERTIFIED SHAREHOLDER REPORT OF REGISTERED
MANAGEMENT INVESTMENT COMPANIES
Investment Company Act File Number: 811-04443
Eaton Vance Investment Trust
(Exact Name of Registrant as Specified in Charter)
Two International Place, Boston, Massachusetts 02110
(Address of Principal Executive Offices)
Maureen A. Gemma
Two International Place, Boston, Massachusetts 02110
(Name and Address of Agent for Services)
(617) 482-8260
(Registrant’s Telephone Number)
March 31
Date of Fiscal Year End
March 31, 2012
Date of Reporting Period
Item 1. Reports to Stockholders
| | | |
Eaton Vance
Limited Maturity Municipal Income Funds
Annual Report
March 31, 2012 | |
 |
Fund shares are not insured by the FDIC and are not deposits or other obligations of, or guaranteed by, any depository institution. Shares are subject to investment risks, including possible loss of principal invested.
This report must be preceded or accompanied by a current summary prospectus or prospectus. Before investing, investors should consider carefully the investment objective, risks, and charges and expenses of a mutual fund. This and other important information is contained in the summary prospectus and prospectus, which can be obtained from a financial advisor. Prospective investors should read the prospectus carefully before investing. For further information, please call 1-800-262-1122.
Annual Report March 31, 2012
Eaton Vance
Limited Maturity Municipal Income Funds
Table of Contents
| | | | | |
|
| Management’s Discussion of Fund Performance | | | 2 | |
| Performance and Fund Profile | | | | |
| | | | | |
| AMT-Free Limited Maturity Municipal Income Fund | | | 4 | |
| National Limited Maturity Municipal Income Fund | | | 6 | |
| | | | | |
| Endnotes and Additional Disclosures | | | 8 | |
| Fund Expenses | | | 9 | |
| Financial Statements | | | 11 | |
| Report of Independent Registered Public Accounting Firm | | | 46 | |
| Federal Tax Information | | | 47 | |
| Management and Organization | | | 48 | |
| Important Notices | | | 50 | |
Eaton Vance
Limited Maturity Municipal Income Funds
March 31, 2012
Management’s Discussion of Fund Performance1
Economic and Market Conditions
In early 2011, just prior to the start of the Funds’ fiscal year, economic indicators seemed to show that a modest recovery was under way. But in the second quarter of 2011, Europe’s sovereign debt problems began to intensify, causing investors to worry about the potential impact on the U.S. economy and U.S. banks.
Meanwhile, unemployment remained stubbornly high, the housing market was stagnant and Congressional wrangling over the debt ceiling led Standard & Poor’s (S&P) to downgrade U.S. Treasuries. Reacting to this turmoil, the S&P 500 Index2 fell more than 15% in just over two weeks during late July and early August of 2011 and spent the next several months clawing its way back.
Beginning in mid-December of 2011, a sustained equity market rally took hold and continued through the end of the fiscal year, fueled by strong economic growth in the fourth quarter, falling unemployment claims, an uptick in hiring and a restructuring of Greek debt that made investors more comfortable with the situation in Europe. After 12 tumultuous months, the S&P 500 Index finished the Fund’s fiscal period with an 8.54% gain. Overseas, however, both developed and emerging equity markets suffered significant losses during the same timeframe.
Against this backdrop, bond investors became increasingly risk-averse, as economic indicators began to suggest that the U.S. economy was not as strong as first perceived, and European sovereign debt problems became front-page news. As a result, Treasury prices rose and yields fell significantly from April through September of 2011. By October, Treasury rates had settled into a relatively stable trading range that lasted through the end of the period on March 31, 2012.
Early in the period, municipal bonds rallied along with Treasuries, but not to the same degree, because investors were still concerned about the ability of state and local governments to address historically large fiscal deficits and balance their budgets. As the period wore on, however, several factors caused performance of municipals to improve. The massive municipal defaults predicted by high-profile market analysts did not materialize, while the fiscal situation for many issuers began to recover.
As the fear that had hung over the municipal market subsided and investors appeared more comfortable taking on risk, lower-rated municipals outperformed higher-rated issues and longer-maturity bonds outperformed those with shorter maturities.
Fund Performance
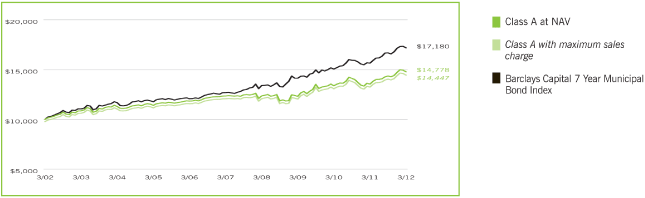
For the fiscal year ending March 31, 2012, both Funds underperformed the 9.80% return of their primary benchmark, the Barclays Capital 7 Year Municipal Bond Index (the Index), an unmanaged index of municipal bonds traded in the U.S. with maturities ranging from 6 to 8 years. Eaton Vance AMT-Free Limited Maturity Municipal Income Fund Class A shares at net asset value (NAV) had a total return of 9.13%, while Eaton Vance National Limited Maturity Municipal Income Fund Class A shares at NAV returned 8.69%.
Generally speaking, the Funds’ overall strategy is to invest primarily in limited maturity bonds with about 6–10 years remaining to maturity, in order to capture attractive yields but avoid the potentially higher interest-rate risk and volatility of longer-maturity bonds. In effect, investors in the Funds give up some of the higher potential yields of longer-maturity bonds in return for the potentially lower volatility and greater price stability of limited maturity issues.
While the Index includes only bonds with maturities of 6–8 years, the Funds tend to own securities with maturities up to about 10 years in order to capture their typically higher yields and greater income payments. The Funds hedge to various degrees against the greater risk of volatility in the 8- to 10-year part of the curve by using Treasury futures to provide downside protection. In addition, Eaton Vance AMT-Free Limited Maturity Municipal Income Fund avoids bonds with income that is taxable under the Alternative Minimum Tax (AMT), including many housing bonds and industrial development revenue (IDR) corporate issues.
For the 12-month period, the Funds’ underperformance to the Index resulted largely from their hedging strategy. Hedging interest-rate volatility, a risk management strategy, is intended to moderate performance on both the upside and the downside. So in a period when municipal bonds saw strong performance, the Funds’ hedge mitigated a portion of their positive performance and, as intended, reduced the Funds’ volatility during a year of rather pronounced market volatility.
See Endnotes and Additional Disclosures in this report.
Past performance is no guarantee of future results. Returns are historical and are calculated by determining the percentage change in net asset value (NAV) or offering price (as applicable) with all distributions reinvested. Investment return and principal value will fluctuate so that shares, when redeemed, may be worth more or less than their original cost. Performance less than one year is cumulative. Performance is for the stated time period only; due to market volatility, the Fund’s current performance may be lower or higher than quoted. Returns are before taxes unless otherwise noted. For performance as of the most recent month end, please refer to www.eatonvance.com.
2
Eaton Vance
Limited Maturity Municipal Income Funds
March 31, 2012
Management’s Discussion of Fund Performance—continued
In addition, performance of Eaton Vance National Limited Maturity Municipal Income Fund was negatively impacted by a credit event in one of its airline holdings when the airline declared bankruptcy and the value of its bonds declined.
In contrast, the Funds’ strategy of overweighting longer-maturity bonds, relative to the Index, was a primary contributor to results during a period when longer-maturity issues outperformed. Overweighting zero coupon bonds, which benefited strongly when rates declined, helped results as well. Performance of Eaton Vance AMT-Free Limited Maturity Municipal Income Fund was aided by an overweighting in 5.5% to 6.5% coupon bonds, which performed well. And outside of its airline bonds, an overweighting in IDR issues helped results for Eaton Vance National Limited Maturity Municipal Income Fund.
See Endnotes and Additional Disclosures in this report.
Past performance is no guarantee of future results. Returns are historical and are calculated by determining the percentage change in net asset value (NAV) or offering price (as applicable) with all distributions reinvested. Investment return and principal value will fluctuate so that shares, when redeemed, may be worth more or less than their original cost. Performance less than one year is cumulative. Performance is for the stated time period only; due to market volatility, the Fund’s current performance may be lower or higher than quoted. Returns are before taxes unless otherwise noted. For performance as of the most recent month end, please refer to www.eatonvance.com.
3
Eaton Vance
AMT-Free Limited Maturity Municipal Income Fund
March 31, 2012
Performance2,3
Portfolio Manager Craig R. Brandon, CFA
| | | | | | | | | | | | | | | | | | | | | |
| | | | | | | | | | | | | | | | | | | Since |
| % Average Annual Total Returns | | Inception Date | | One Year | | Five Years | | Ten Years | | Inception |
| |
| Class A at NAV | | | 6/27/1996 | | | | 9.13 | % | | | 3.65 | % | | | 3.98 | % | | | — | |
| Class A with 2.25% Maximum Sales Charge | | | — | | | | 6.72 | | | | 3.17 | | | | 3.74 | | | | — | |
| Class B at NAV | | | 5/29/1992 | | | | 8.32 | | | | 2.87 | | | | 3.20 | | | | — | |
| Class B with 3% Maximum Sales Charge | | | — | | | | 5.32 | | | | 2.87 | | | | 3.20 | | | | — | |
| Class C at NAV | | | 12/8/1993 | | | | 8.32 | | | | 2.89 | | | | 3.20 | | | | — | |
| Class C with 1% Maximum Sales Charge | | | — | | | | 7.32 | | | | 2.89 | | | | 3.20 | | | | — | |
| Class I at NAV | | | 8/3/2010 | | | | 9.29 | | | | — | | | | — | | | | 4.15 | % |
| |
| Barclays Capital 7 Year Municipal Bond Index | | | — | | | | 9.80 | % | | | 6.24 | % | | | 5.56 | % | | | — | |
| |
| |
| % Total Annual Operating Expense Ratios4 | | | | | | Class A | | Class B | | Class C | | Class I |
| |
| | | | | | | | 0.87 | % | | | 1.61 | % | | | 1.62 | % | | | 0.72 | % |
| |
| |
| % Distribution Rates/Yields5 | | | | | | Class A | | Class B | | Class C | | Class I |
| |
| Distribution Rate | | | | | | | 3.04 | % | | | 2.32 | % | | | 2.32 | % | | | 3.19 | % |
| Taxable-Equivalent Distribution Rate | | | | | | | 4.68 | | | | 3.57 | | | | 3.57 | | | | 4.91 | |
| SEC 30-day Yield | | | | | | | 1.59 | | | | 0.88 | | | | 0.88 | | | | 1.78 | |
| Taxable-Equivalent SEC 30-day Yield | | | | | | | 2.45 | | | | 1.35 | | | | 1.35 | | | | 2.74 | |
| |
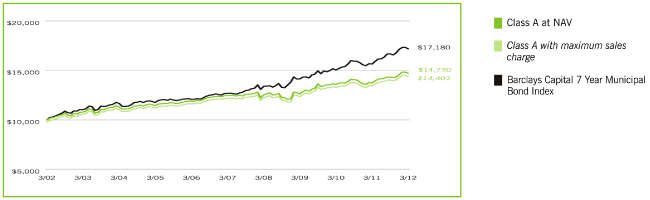
Growth of $10,000
This graph shows the change in value of a hypothetical investment of $10,000 in Class A of the Fund for the period indicated. For comparison, the same investment is shown in the indicated index.
| | | | | | | | | | | | | |
| | | | | | | | | | | With Maximum |
| | | Period Beginning | | At NAV | | Sales Charge |
| |
| Class B | | | 3/31/02 | | | $ | 13,709 | | | | N.A. | |
| |
| Class C | | | 3/31/02 | | | $ | 13,709 | | | | N.A. | |
| |
| Class I | | | 8/3/10 | | | $ | 10,699 | | | | N.A. | |
| |
See Endnotes and Additional Disclosures in this report.
Past performance is no guarantee of future results. Returns are historical and are calculated by determining the percentage change in net asset value (NAV) or offering price (as applicable) with all distributions reinvested. Investment return and principal value will fluctuate so that shares, when redeemed, may be worth more or less than their original cost. Performance less than one year is cumulative. Performance is for the stated time period only; due to market volatility, the Fund’s current performance may be lower or higher than quoted. Returns are before taxes unless otherwise noted. For performance as of the most recent month end, please refer to www.eatonvance.com.
4
Eaton Vance
AMT-Free Limited Maturity Municipal Income Fund
March 31, 2012
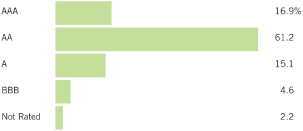
Fund Profile
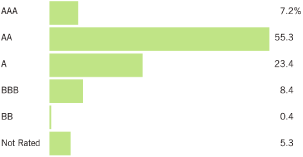
Credit Quality (% of total investments)6
See Endnotes and Additional Disclosures in this report.
5
Eaton Vance
National Limited Maturity Municipal Income Fund
March 31, 2012
Performance2,3
Portfolio Manager William H. Ahern, Jr., CFA
| | | | | | | | | | | | | | | | | | | | | |
| | | | | | | | | | | | | | | | | | | Since |
| % Average Annual Total Returns | | Inception Date | | One Year | | Five Years | | Ten Years | | Inception |
| |
| Class A at NAV | | | 6/27/1996 | | | | 8.69 | % | | | 3.54 | % | | | 4.47 | % | | | — | |
| Class A with 2.25% Maximum Sales Charge | | | — | | | | 6.29 | | | | 3.07 | | | | 4.23 | | | | — | |
| Class B at NAV | | | 5/22/1992 | | | | 7.88 | | | | 2.78 | | | | 3.69 | | | | — | |
| Class B with 3% Maximum Sales Charge | | | — | | | | 4.88 | | | | 2.78 | | | | 3.69 | | | | — | |
| Class C at NAV | | | 12/8/1993 | | | | 7.87 | | | | 2.78 | | | | 3.69 | | | | — | |
| Class C with 1% Maximum Sales Charge | | | — | | | | 6.87 | | | | 2.78 | | | | 3.69 | | | | — | |
| Class I at NAV | | | 10/1/2009 | | | | 8.74 | | | | — | | | | — | | | | 4.07 | % |
| |
| Barclays Capital 7 Year Municipal Bond Index | | | — | | | | 9.80 | % | | | 6.24 | % | | | 5.56 | % | | | — | |
| |
| % Total Annual Operating Expense Ratios4 | | | | | | Class A | | Class B | | Class C | | Class I |
| |
| | | | | | | | 0.70 | % | | | 1.45 | % | | | 1.45 | % | | | 0.55 | % |
| |
| |
| % Distribution Rates/Yields5 | | | | | | Class A | | Class B | | Class C | | Class I |
| |
| Distribution Rate | | | | | | | 3.27 | % | | | 2.54 | % | | | 2.54 | % | | | 3.41 | % |
| Taxable-Equivalent Distribution Rate | | | | | | | 5.03 | | | | 3.91 | | | | 3.91 | | | | 5.25 | |
| SEC 30-day Yield | | | | | | | 2.02 | | | | 1.32 | | | | 1.32 | | | | 2.22 | |
| Taxable-Equivalent SEC 30-day Yield | | | | | | | 3.11 | | | | 2.03 | | | | 2.03 | | | | 3.42 | |
| |
Growth of $10,000
This graph shows the change in value of a hypothetical investment of $10,000 in Class A of the Fund for the period indicated. For comparison, the same investment is shown in the indicated index.
| | | | | | | | | | | | | |
| | | | | | | | | | | With Maximum |
| | | Period Beginning | | At NAV | | Sales Charge |
| |
| Class B | | | 3/31/02 | | | $ | 14,377 | | | | N.A. | |
| |
| Class C | | | 3/31/02 | | | $ | 14,372 | | | | N.A. | |
| |
| Class I | | | 10/1/09 | | | $ | 11,048 | | | | N.A. | |
| |
See Endnotes and Additional Disclosures in this report.
Past performance is no guarantee of future results. Returns are historical and are calculated by determining the percentage change in net asset value (NAV) or offering price (as applicable) with all distributions reinvested. Investment return and principal value will fluctuate so that shares, when redeemed, may be worth more or less than their original cost. Performance less than one year is cumulative. Performance is for the stated time period only; due to market volatility, the Fund’s current performance may be lower or higher than quoted. Returns are before taxes unless otherwise noted. For performance as of the most recent month end, please refer to www.eatonvance.com.
6
Eaton Vance
National Limited Maturity Municipal Income Fund
March 31, 2012
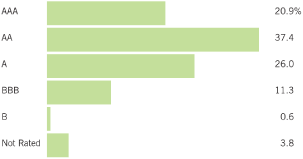
Fund Profile
Credit Quality (% of total investments)6
See Endnotes and Additional Disclosures in this report.
7
Eaton Vance
Limited Maturity Municipal Income Funds
March 31, 2012
Endnotes and Additional Disclosures
| |
| 1 | The views expressed in this report are those of the portfolio manager(s) and are current only through the date stated at the top of this page. These views are subject to change at any time based upon market or other conditions, and Eaton Vance and the Fund(s) disclaim any responsibility to update such views. These views may not be relied upon as investment advice and, because investment decisions are based on many factors, may not be relied upon as an indication of trading intent on behalf of any Eaton Vance fund. This commentary may contain statements that are not historical facts, referred to as forward looking statements. The Fund’s actual future results may differ significantly from those stated in any forward looking statement, depending on factors such as changes in securities or financial markets or general economic conditions, the volume of sales and purchases of Fund shares, the continuation of investment advisory, administrative and service contracts, and other risks discussed from time to time in the Fund’s filings with the Securities and Exchange Commission. |
| |
| 2 | S&P 500 Index is an unmanaged index of large-cap stocks commonly used as a measure of U.S. stock market performance. Barclays Capital 7 Year Municipal Bond Index is an unmanaged index of municipal bonds traded in the U.S. with maturities ranging from 6-8 years. Unless otherwise stated, index returns do not reflect the effect of any applicable sales charges, commissions, expenses, taxes or leverage, as applicable. It is not possible to invest directly in an index. |
| |
| 3 | Total Returns at NAV do not include applicable sales charges. If sales charges were deducted, the returns would be lower. Total Returns shown with maximum sales charge reflect the stated maximum sales charge. Unless otherwise stated, performance does not reflect the deduction of taxes on Fund distributions or redemptions of Fund shares. |
| |
| 4 | Source: Fund prospectus. |
| |
| 5 | The Distribution Rate is based on the Fund’s last regular distribution per share in the period (annualized) divided by the Fund’s NAV at the end of the period. The Fund’s distributions may be composed of ordinary income, tax-exempt income, net realized capital gains and return of capital. Taxable-equivalent performance is based on the highest combined federal and state income tax rates, where applicable. Lower tax rates would result in lower tax-equivalent performance. Actual tax rates will vary depending on your income, exemptions and deductions. Rates do not include local taxes. SEC Yield is a standardized measure based on the estimated yield to maturity of a fund’s investments over a 30- day period and is based on the maximum offer price at the date specified. The SEC Yield is not based on the distributions made by the Fund, which may differ. |
| |
| 6 | Ratings are based on Moody’s, S&P or Fitch, as applicable. Credit ratings are based largely on the rating agency’s investment analysis at the time of rating and the rating assigned to any particular security is not necessarily a reflection of the issuer’s current financial condition. The rating assigned to a security by a rating agency does not necessarily reflect its assessment of the volatility of a security’s market value or of the liquidity of an investment in the security. If securities are rated differently by the rating agencies, the higher rating is applied. |
| |
| | Fund profile subject to change due to active management. |
| |
| | Important Notice to Shareholders |
| | Effective August 1, 2012, the Funds’ investment objective is to provide current income exempt from regular federal income tax and limited principal fluctuation. |
8
Eaton Vance
Limited Maturity Municipal Income Funds
March 31, 2012
Example: As a Fund shareholder, you incur two types of costs: (1) transaction costs, including sales charges (loads) on purchases and redemption fees (if applicable); and (2) ongoing costs, including management fees; distribution and/or service fees; and other Fund expenses. This Example is intended to help you understand your ongoing costs (in dollars) of Fund investing and to compare these costs with the ongoing costs of investing in other mutual funds. The Example is based on an investment of $1,000 invested at the beginning of the period and held for the entire period (October 1, 2011 – March 31, 2012).
Actual Expenses: The first section of each table below provides information about actual account values and actual expenses. You may use the information in this section, together with the amount you invested, to estimate the expenses that you paid over the period. Simply divide your account value by $1,000 (for example, an $8,600 account value divided by $1,000 = 8.6), then multiply the result by the number in the first section under the heading entitled “Expenses Paid During Period” to estimate the expenses you paid on your account during this period.
Hypothetical Example for Comparison Purposes: The second section of each table below provides information about hypothetical account values and hypothetical expenses based on the actual Fund expense ratio and an assumed rate of return of 5% per year (before expenses), which is not the actual Fund return. The hypothetical account values and expenses may not be used to estimate the actual ending account balance or expenses you paid for the period. You may use this information to compare the ongoing costs of investing in your Fund and other funds. To do so, compare this 5% hypothetical example with the 5% hypothetical examples that appear in the shareholder reports of the other funds.
Please note that the expenses shown in each table are meant to highlight your ongoing costs only and do not reflect any transactional costs, such as sales charges (loads) or redemption fees (if applicable). Therefore, the second section of each table is useful in comparing ongoing costs only, and will not help you determine the relative total costs of owning different funds. In addition, if these transactional costs were included, your costs would be higher.
Eaton Vance AMT-Free Limited Maturity Municipal Income Fund
| | | | | | | | | | | | | | | | | | | |
| | | Beginning
| | Ending
| | Expenses Paid
| | Annualized
| | |
| | | Account Value
| | Account Value
| | During Period*
| | Expense
| | |
| | | (10/1/11) | | (3/31/12) | | (10/1/11 – 3/31/12) | | Ratio | | |
| |
| |
Actual | | | | | | | | | | | | | | |
| Class A | | $ | 1,000.00 | | | $ | 1,029.40 | | | $ | 4.46 | | | | 0.88 | % | | |
| Class B | | $ | 1,000.00 | | | $ | 1,025.60 | | | $ | 8.20 | | | | 1.62 | % | | |
| Class C | | $ | 1,000.00 | | | $ | 1,026.40 | | | $ | 8.26 | | | | 1.63 | % | | |
| Class I | | $ | 1,000.00 | | | $ | 1,030.10 | | | $ | 3.70 | | | | 0.73 | % | | |
| | | | | | | | | | | | | | | | | | | |
| | | | | | | | | | | | | | | | | | | |
| |
| |
Hypothetical | | | | | | | | | | | | | | |
| (5% return per year before expenses) | | | | | | | | | | | | | | |
| Class A | | $ | 1,000.00 | | | $ | 1,020.60 | | | $ | 4.45 | | | | 0.88 | % | | |
| Class B | | $ | 1,000.00 | | | $ | 1,016.90 | | | $ | 8.17 | | | | 1.62 | % | | |
| Class C | | $ | 1,000.00 | | | $ | 1,016.90 | | | $ | 8.22 | | | | 1.63 | % | | |
| Class I | | $ | 1,000.00 | | | $ | 1,021.40 | | | $ | 3.69 | | | | 0.73 | % | | |
| |
| * | Expenses are equal to the Fund’s annualized expense ratio for the indicated Class, multiplied by the average account value over the period, multiplied by 183/366 (to reflect the one-half year period). The Example assumes that the $1,000 was invested at the net asset value per share determined at the close of business on September 30, 2011. |
9
Eaton Vance
Limited Maturity Municipal Income Funds
March 31, 2012
Fund Expenses — continued
Eaton Vance National Limited Maturity Municipal Income Fund
| | | | | | | | | | | | | | | | | | | |
| | | Beginning
| | Ending
| | Expenses Paid
| | Annualized
| | |
| | | Account Value
| | Account Value
| | During Period*
| | Expense
| | |
| | | (10/1/11) | | (3/31/12) | | (10/1/11 – 3/31/12) | | Ratio | | |
| |
| |
Actual | | | | | | | | | | | | | | |
| Class A | | $ | 1,000.00 | | | $ | 1,031.90 | | | $ | 3.40 | | | | 0.67 | % | | |
| Class B | | $ | 1,000.00 | | | $ | 1,029.10 | | | $ | 7.20 | | | | 1.42 | % | | |
| Class C | | $ | 1,000.00 | | | $ | 1,029.10 | | | $ | 7.20 | | | | 1.42 | % | | |
| Class I | | $ | 1,000.00 | | | $ | 1,032.70 | | | $ | 2.64 | | | | 0.52 | % | | |
| | | | | | | | | | | | | | | | | | | |
| | | | | | | | | | | | | | | | | | | |
| |
| |
Hypothetical | | | | | | | | | | | | | | |
| (5% return per year before expenses) | | | | | | | | | | | | | | |
| Class A | | $ | 1,000.00 | | | $ | 1,021.70 | | | $ | 3.39 | | | | 0.67 | % | | |
| Class B | | $ | 1,000.00 | | | $ | 1,017.90 | | | $ | 7.16 | | | | 1.42 | % | | |
| Class C | | $ | 1,000.00 | | | $ | 1,017.90 | | | $ | 7.16 | | | | 1.42 | % | | |
| Class I | | $ | 1,000.00 | | | $ | 1,022.40 | | | $ | 2.63 | | | | 0.52 | % | | |
| |
| * | Expenses are equal to the Fund’s annualized expense ratio for the indicated Class, multiplied by the average account value over the period, multiplied by 183/366 (to reflect the one-half year period). The Example assumes that the $1,000 was invested at the net asset value per share determined at the close of business on September 30, 2011. |
10
Eaton Vance
AMT-Free Limited Maturity Municipal Income Fund
March 31, 2012
| | | | | | | | | | | |
| Tax-Exempt Investments — 98.1% |
| |
| | | Principal
| | | | | | |
| | | Amount
| | | | | | |
| Security | | (000’s omitted) | | | Value | | | |
| |
| |
| |
| Bond Bank — 3.2% |
| |
| Idaho Board Bank Authority, 5.00%, 9/15/22 | | $ | 1,000 | | | $ | 1,148,810 | | | |
| Massachusetts Water Pollution Abatement Trusts, 5.00%, 8/1/21 | | | 750 | | | | 924,083 | | | |
| |
| |
| | | | | | | $ | 2,072,893 | | | |
| |
| |
| |
| |
| Education — 8.2% |
| |
| Boise State University, ID, 5.00%, 4/1/24 | | $ | 230 | | | $ | 270,802 | | | |
| Delaware County, PA, (Villanova University), 5.00%, 12/1/20 | | | 500 | | | | 590,825 | | | |
| Missouri Health and Educational Facilities Authority, (Washington University), 5.25%, 3/15/18 | | | 1,000 | | | | 1,223,770 | | | |
| University of Cincinnati, OH, General Receipts, 4.00%, 6/1/25 | | | 395 | | | | 421,809 | | | |
| University of Cincinnati, OH, General Receipts, 4.00%, 6/1/26 | | | 170 | | | | 178,971 | | | |
| University of Houston, TX, 5.00%, 2/15/21 | | | 1,000 | | | | 1,184,940 | | | |
| University of New Mexico, 5.00%, 6/1/27 | | | 265 | | | | 305,847 | | | |
| University of Pittsburgh, PA, 5.25%, 9/15/23 | | | 1,000 | | | | 1,186,720 | | | |
| |
| |
| | | | | | | $ | 5,363,684 | | | |
| |
| |
| |
| |
| Electric Utilities — 8.3% |
| |
| Apache County, AZ, Industrial Development Authority, (Tucson Electric Power Co.), 4.50%, 3/1/30 | | $ | 340 | | | $ | 341,476 | | | |
| California Department of Water Resource Power Supply, 5.00%, 5/1/22 | | | 670 | | | | 772,959 | | | |
| Energy Northwest Electric Revenue, WA, (Columbia Station), 5.00%, 7/1/24 | | | 1,000 | | | | 1,125,390 | | | |
| Maricopa County, AZ, Pollution Control Corp., (Arizona Public Service Co.), 6.00% to 5/1/14 (Put Date), 5/1/29 | | | 500 | | | | 544,220 | | | |
| Massachusetts Development Finance Agency, (Dominion Energy Brayton), 5.75% to 5/1/19 (Put Date), 12/1/42 | | | 800 | | | | 928,344 | | | |
| Puerto Rico Electric Power Authority, 5.00%, 7/1/23 | | | 500 | | | | 531,480 | | | |
| Seattle, WA, Municipal Light and Power Revenue, 5.25%, 4/1/20 | | | 1,000 | | | | 1,220,520 | | | |
| |
| |
| | | | | | | $ | 5,464,389 | | | |
| |
| |
| |
| |
| Escrowed / Prerefunded — 1.5% |
| |
| New York Dormitory Authority, (State University Educational Facilities), Prerefunded to 5/15/12, 5.25% to 5/1/12 (Put Date), 11/15/23 | | $ | 1,000 | | | $ | 1,006,230 | | | |
| |
| |
| | | | | | | $ | 1,006,230 | | | |
| |
| |
| |
| |
| General Obligations — 11.9% |
| |
| Denver City and County, CO, School District No. 1, 4.00%, 12/1/26 | | $ | 560 | | | $ | 601,619 | | | |
| Kentwood, MI, Public Schools, 4.00%, 5/1/21 | | | 40 | | | | 45,403 | | | |
| Kentwood, MI, Public Schools, 4.00%, 5/1/23 | | | 225 | | | | 251,008 | | | |
| Laguna Beach, CA, Unified School District, (Election of 2001), 5.00%, 8/1/22 | | | 500 | | | | 600,475 | | | |
| Oregon, 4.00%, 8/1/26 | | | 420 | | | | 462,529 | | | |
| Pasadena, TX, Independent School District, (PSF Guaranteed), 5.00%, 2/15/28 | | | 1,500 | | | | 1,715,205 | | | |
| Salem-Keizer, OR, School District No. 24J, 0.00%, 6/15/17 | | | 2,000 | | | | 1,840,700 | | | |
| Virginia, 5.00%, 6/1/28 | | | 1,500 | | | | 1,723,980 | | | |
| Wilmington, DE, 5.00%, 12/1/25 | | | 500 | | | | 584,005 | | | |
| |
| |
| | | | | | | $ | 7,824,924 | | | |
| |
| |
| |
| |
| Hospital — 10.6% |
| |
| California Health Facilities Financing Authority, (Catholic Healthcare), 5.125%, 7/1/22 | | $ | 825 | | | $ | 904,819 | | | |
| California Statewide Communities Development Authority, (Kaiser Permanente), 5.00%, 4/1/19 | | | 1,000 | | | | 1,174,420 | | | |
| Fairfax County, VA, Industrial Development Authority, (Inova Health System Hospitals), 5.00%, 5/15/25 | | | 1,000 | | | | 1,125,020 | | | |
| Highlands County, FL, Health Facilities Authority, (Adventist Health), 5.00%, 11/15/20 | | | 1,000 | | | | 1,082,450 | | | |
| Kent, MI, Hospital Finance Authority, (Spectrum Health), 5.50% to 1/15/15 (Put Date), 1/15/47 | | | 275 | | | | 308,091 | | | |
Massachusetts Health and Educational Facilities Authority, (Baystate Medical Center),
5.00% to 7/1/15 (Put Date), 7/1/39 | | | 1,365 | | | | 1,502,592 | | | |
| Massachusetts Health and Educational Facilities Authority, (Lowell General Hospital), 4.75%, 7/1/25 | | | 445 | | | | 444,969 | | | |
| Washington Township, CA, Health Care District Revenue, 5.125%, 7/1/17 | | | 200 | | | | 225,632 | | | |
| Washington Township, CA, Health Care District Revenue, 5.25%, 7/1/18 | | | 175 | | | | 200,672 | | | |
| |
| |
| | | | | | | $ | 6,968,665 | | | |
| |
| |
| |
| |
| Insured – Education — 4.7% |
| |
| New York Dormitory Authority, (New York University), (AMBAC), 5.50%, 7/1/22 | | $ | 1,000 | | | $ | 1,262,570 | | | |
| Oregon Health and Science University, (NPFG), 0.00%, 7/1/21 | | | 1,000 | | | | 718,500 | | | |
| Texas University Systems Financing Revenue, (AGM), 5.00%, 3/15/21 | | | 1,000 | | | | 1,131,420 | | | |
| |
| |
| | | | | | | $ | 3,112,490 | | | |
| |
| |
| |
See Notes to Financial Statements.
11
Eaton Vance
AMT-Free Limited Maturity Municipal Income Fund
March 31, 2012
Portfolio of Investments — continued
| | | | | | | | | | | |
| | | Principal
| | | | | | |
| | | Amount
| | | | | | |
| Security | | (000’s omitted) | | | Value | | | |
| |
| |
| Insured – Electric Utilities — 3.2% |
| |
| Northern Municipal Power Agency, MN, (AGC), 5.00%, 1/1/21 | | $ | 1,000 | | | $ | 1,141,490 | | | |
| South Carolina Public Service Authority, (AGM), 5.00%, 1/1/20 | | | 850 | | | | 979,421 | | | |
| |
| |
| | | | | | | $ | 2,120,911 | | | |
| |
| |
| |
| |
| Insured – Escrowed / Prerefunded — 1.8% |
| |
| Sunrise, FL, Utilities Systems, (AMBAC), Escrowed to Maturity, 5.50%, 10/1/18 | | $ | 1,000 | | | $ | 1,192,780 | | | |
| |
| |
| | | | | | | $ | 1,192,780 | | | |
| |
| |
| |
| |
| Insured – General Obligations — 4.6% |
| |
| Massachusetts, (AMBAC), 5.50%, 12/1/23 | | $ | 1,000 | | | $ | 1,286,980 | | | |
| New York, NY, (AGM), 5.00%, 4/1/22 | | | 500 | | | | 564,480 | | | |
| Philadelphia, PA, (AGC), 5.50%, 7/15/16 | | | 1,000 | | | | 1,149,050 | | | |
| |
| |
| | | | | | | $ | 3,000,510 | | | |
| |
| |
| |
| |
| Insured – Special Tax Revenue — 2.9% |
| |
| Mesa, AZ, Street and Highway Revenue, (AGM), 5.00%, 7/1/20 | | $ | 700 | | | $ | 826,595 | | | |
| Puerto Rico Infrastructure Financing Authority, (AMBAC), 5.50%, 7/1/23 | | | 1,000 | | | | 1,107,980 | | | |
| |
| |
| | | | | | | $ | 1,934,575 | | | |
| |
| |
| |
| |
| Insured – Transportation — 2.5% |
| |
| Idaho Housing and Finance Association, (Grant and Revenue Anticipation Bonds Federal Highway Trust Fund), (AGC), 5.25%, 7/15/21 | | $ | 1,000 | | | $ | 1,167,130 | | | |
| New Orleans, LA, Aviation Board, (AGC), 6.00%, 1/1/23 | | | 420 | | | | 494,092 | | | |
| |
| |
| | | | | | | $ | 1,661,222 | | | |
| |
| |
| |
| |
| Insured – Water and Sewer — 4.0% |
| |
| Bossier City, LA, Utilities Revenue, (BHAC), 5.00%, 10/1/21 | | $ | 1,000 | | | $ | 1,153,860 | | | |
| Portland, OR, Sewer System Revenue, (AGM), 5.00%, 6/15/23 | | | 1,000 | | | | 1,150,290 | | | |
| Tallahassee, FL, Consolidated Utility System, (FGIC), (NPFG), 5.50%, 10/1/19 | | | 250 | | | | 310,640 | | | |
| |
| |
| | | | | | | $ | 2,614,790 | | | |
| |
| |
| |
| |
| Lease Revenue / Certificates of Participation — 1.0% |
| |
| Virginia Public Building Authority, Public Facilities Revenue, 5.25%, 8/1/20 | | $ | 530 | | | $ | 632,539 | | | |
| |
| |
| | | | | | | $ | 632,539 | | | |
| |
| |
| |
| |
| Nursing Home — 0.1% |
| |
| Orange County, FL, Health Facilities Authority, (Westminster Community Care Services), 6.50%, 4/1/12 | | $ | 55 | | | $ | 55,003 | | | |
| |
| |
| | | | | | | $ | 55,003 | | | |
| |
| |
| |
| |
| Other Revenue — 2.6% |
| |
| Florida Board of Education, Lottery Revenue, 5.00%, 7/1/19 | | $ | 500 | | | $ | 604,160 | | | |
| New York, NY, Transitional Finance Authority, (Building Aid), 5.25%, 1/15/27 | | | 1,000 | | | | 1,136,950 | | | |
| |
| |
| | | | | | | $ | 1,741,110 | | | |
| |
| |
| |
| |
| Senior Living / Life Care — 1.2% |
| |
| Massachusetts Development Finance Agency, (Carleton-Willard Village), 5.25%, 12/1/25 | | $ | 275 | | | $ | 291,879 | | | |
North Miami, FL, Health Care Facilities Authority, (Imperial Club), 1.838%, 1/1/42(1) | | | 590 | | | | 235,971 | | | |
| Tempe, AZ, Industrial Development Authority, (Friendship Village of Tempe), 6.00%, 12/1/27 | | | 250 | | | | 259,445 | | | |
| |
| |
| | | | | | | $ | 787,295 | | | |
| |
| |
| |
| |
| Special Tax Revenue — 4.8% |
| |
| California Economic Recovery, 5.00%, 7/1/18 | | $ | 500 | | | $ | 599,770 | | | |
| Covington Park, FL, Community Development District, (Capital Improvements), 5.00%, 5/1/21 | | | 65 | | | | 64,530 | | | |
| Dupree Lakes, FL, Community Development District, 5.00%, 5/1/12 | | | 65 | | | | 64,731 | | | |
| Dupree Lakes, FL, Community Development District, 6.83%, 11/1/15 | | | 140 | | | | 139,703 | | | |
| Fish Hawk, FL, Community Development District II, 7.04%, 11/1/14 | | | 15 | | | | 14,803 | | | |
New River, FL, Community Development District, (Capital Improvements), Series 2010A-1, 5.75%, (0.00% to 11/1/12), 5/1/38 | | | 25 | | | | 15,840 | | | |
New River, FL, Community Development District, (Capital Improvements), Series 2010A-2, 5.75%, (0.00% to 11/1/14), 5/1/38 | | | 60 | | | | 24,158 | | | |
New River, FL, Community Development District, (Capital Improvements), Series 2010B-1, 5.00%, (0.00% to 11/1/12), 5/1/15 | | | 40 | | | | 34,296 | | | |
See Notes to Financial Statements.
12
Eaton Vance
AMT-Free Limited Maturity Municipal Income Fund
March 31, 2012
Portfolio of Investments — continued
| | | | | | | | | | | |
| | | Principal
| | | | | | |
| | | Amount
| | | | | | |
| Security | | (000’s omitted) | | | Value | | | |
| |
| |
| Special Tax Revenue (continued) |
| |
| | | | | | | | | | | |
New River, FL, Community Development District, (Capital Improvements), Series 2010B-2, 5.00%, (0.00% to 11/1/13), 5/1/18 | | $ | 45 | | | $ | 20,529 | | | |
New River, FL, Community Development District, (Capital Improvements), 5.00%, 5/1/13(2) | | | 35 | | | | 0 | | | |
| North Springs, FL, Improvement District, (Heron Bay), 7.00%, 5/1/19 | | | 210 | | | | 210,132 | | | |
| North Springs, FL, Improvement District, (Heron Bay North Assessment Area), 5.00%, 5/1/14 | | | 140 | | | | 138,361 | | | |
| Poinciana West, FL, West Community Development District, 5.875%, 5/1/22 | | | 100 | | | | 98,687 | | | |
| Scottsdale, AZ, Municipal Property Corp., Excise Tax Revenue, 5.00%, 7/1/26 | | | 1,365 | | | | 1,685,024 | | | |
Sterling Hill, FL, Community Development District, (Capital Improvements), 5.10%, 5/1/11(3) | | | 20 | | | | 5,800 | | | |
Sterling Hill, FL, Community Development District, (Capital Improvements), 5.50%, 11/1/10(3) | | | 100 | | | | 70,042 | | | |
| |
| |
| | | | | | | $ | 3,186,406 | | | |
| |
| |
| |
| |
| Student Loan — 4.2% |
| |
| Iowa Student Loan Liquidity Corp., 5.25%, 12/1/22 | | $ | 1,000 | | | $ | 1,097,720 | | | |
| New Jersey Higher Education Assistance Authority, 5.00%, 6/1/16 | | | 1,500 | | | | 1,680,840 | | | |
| |
| |
| | | | | | | $ | 2,778,560 | | | |
| |
| |
| |
| |
| Transportation — 13.7% |
| |
| Charlotte, NC, Airport Revenue, 5.00%, 7/1/21 | | $ | 1,000 | | | $ | 1,182,890 | | | |
| Maryland Transportation Authority, 5.00%, 7/1/20 | | | 1,000 | | | | 1,217,780 | | | |
| Massachusetts Department of Transportation, (Metropolitan Highway System Revenue), 5.00%, 1/1/20 | | | 500 | | | | 589,705 | | | |
| North Texas Tollway Authority, (Dallas North Tollway System Revenue), 6.00%, 1/1/23 | | | 1,250 | | | | 1,479,712 | | | |
| Phoenix, AZ, Civic Improvements Corp., 5.00%, 7/1/21 | | | 1,000 | | | | 1,140,120 | | | |
| Port Authority of New York and New Jersey, 5.00%, 7/15/23 | | | 1,000 | | | | 1,126,490 | | | |
| Texas Transportation Commission, State Highway Fund, First Tier, 5.00%, 4/1/21 | | | 1,000 | | | | 1,173,350 | | | |
| Virginia Transportation Board, 4.00%, 3/15/25 | | | 1,000 | | | | 1,098,080 | | | |
| |
| |
| | | | | | | $ | 9,008,127 | | | |
| |
| |
| |
| |
| Water and Sewer — 3.1% |
| |
| Fairfax County, VA, Water Revenue, 5.25%, 4/1/23 | | $ | 1,000 | | | $ | 1,282,520 | | | |
| New York, NY, Municipal Water Finance Authority, 5.00%, 6/15/21 | | | 670 | | | | 778,332 | | | |
| |
| |
| | | | | | | $ | 2,060,852 | | | |
| |
| |
| | | |
| Total Tax-Exempt Investments — 98.1% | | |
| (identified cost $58,271,168) | | $ | 64,587,955 | | | |
| |
| |
| | | | | | | |
| Other Assets, Less Liabilities — 1.9% | | $ | 1,256,173 | | | |
| |
| |
| | | | | | | |
| Net Assets — 100.0% | | $ | 65,844,128 | | | |
| |
| |
The percentage shown for each investment category in the Portfolio of Investments is based on net assets.
| | | |
| AGC | | - Assured Guaranty Corp. |
| AGM | | - Assured Guaranty Municipal Corp. |
| AMBAC | | - AMBAC Financial Group, Inc. |
| BHAC | | - Berkshire Hathaway Assurance Corp. |
| FGIC | | - Financial Guaranty Insurance Company |
| NPFG | | - National Public Finance Guaranty Corp. |
| PSF | | - Permanent School Fund |
At March 31, 2012, the concentration of the Fund’s investments in the various states, determined as a percentage of net assets, is as follows:
| | | | | |
| Texas | | | 10.2% | |
| Others, representing less than 10% individually | | | 87.9% | |
The Fund invests primarily in debt securities issued by municipalities. The ability of the issuers of the debt securities to meet their obligations may be affected by economic developments in a specific industry or municipality. In order to reduce the risk associated with such economic developments, at March 31, 2012, 24.2% of total investments are backed by bond insurance of various financial institutions and financial guaranty assurance agencies. The aggregate percentage insured by an individual financial institution ranged from 0.5% to 7.5% of total investments.
| | |
| (1) | | Security is in default and making only partial interest payments. |
| |
| (2) | | Defaulted bond. |
| |
| (3) | | Defaulted matured bond. |
See Notes to Financial Statements.
13
Eaton Vance
National Limited Maturity Municipal Income Fund
March 31, 2012
| | | | | | | | | | | |
| Tax-Exempt Investments — 99.4% |
| |
| | | Principal
| | | | | | |
| | | Amount
| | | | | | |
| Security | | (000’s omitted) | | | Value | | | |
| |
| |
| |
| Bond Bank — 5.8% |
| |
| Cuyahoga County, OH, Port Authority, (Garfield Heights), 5.25%, 5/15/23 | | $ | 200 | | | $ | 189,600 | | | |
| Idaho Board Bank Authority, 5.00%, 9/15/21 | | | 1,120 | | | | 1,301,978 | | | |
| Kansas Development Finance Authority, (Revolving Funds-Department of Health and Environment), 5.00%, 3/1/22 | | | 9,215 | | | | 11,124,624 | | | |
| Massachusetts Water Pollution Abatement Trust, 5.00%, 8/1/25 | | | 3,000 | | | | 3,735,120 | | | |
| Minnesota Public Facilities Authority, Revolving Fund Revenue, 5.00%, 3/1/22 | | | 2,000 | | | | 2,416,080 | | | |
| Ohio Economic Development, (Ohio Enterprise Bond Fund), (AMT), 4.60%, 6/1/20 | | | 1,595 | | | | 1,689,249 | | | |
| Ohio Economic Development, (Ohio Enterprise Bond Fund), (AMT), 5.25%, 12/1/15 | | | 855 | | | | 888,875 | | | |
| Ohio Water Development Authority, Water Pollution Control, (Water Quality), 5.25%, 6/1/20 | | | 280 | | | | 352,542 | | | |
| Rhode Island Clean Water Finance Agency, Water Pollution Control, 4.00%, 10/1/20 | | | 1,850 | | | | 2,151,328 | | | |
| Summit County, OH, Port Authority, (Twinsburg Township), 5.125%, 5/15/25 | | | 300 | | | | 290,133 | | | |
| Virginia State Resources Authority, Clean Water Revenue, (Revolving Fund), 5.00%, 10/1/19 | | | 10,000 | | | | 11,715,700 | | | |
| Virginia State Resources Authority, Clean Water Revenue, (Revolving Fund), 5.50%, 10/1/19 | | | 5,000 | | | | 6,373,450 | | | |
| |
| |
| | | | | | | $ | 42,228,679 | | | |
| |
| |
| |
| |
| Cogeneration — 0.1% |
| |
| Pennsylvania Economic Development Financing Authority, (Colver), (AMT), 5.125%, 12/1/15 | | $ | 375 | | | $ | 375,506 | | | |
| |
| |
| | | | | | | $ | 375,506 | | | |
| |
| |
| |
| |
| Education — 4.9% |
| |
| Boise State University, 4.00%, 4/1/22 | | $ | 650 | | | $ | 731,100 | | | |
| California Educational Facilities Authority, (Claremont McKenna College), 5.00%, 1/1/27 | | | 500 | | | | 555,385 | | | |
| California Educational Facilities Authority, (Loyola Marymount University), 5.00%, 10/1/25 | | | 500 | | | | 555,560 | | | |
| Illinois Educational Facility Authority, (Art Institute of Chicago), 4.45% to 3/1/15 (Put Date), 3/1/34 | | | 2,000 | | | | 2,140,220 | | | |
Maryland Health and Higher Educational Facilities Authority, (Washington Christian Academy), 5.25%, 7/1/18(1) | | | 250 | | | | 106,250 | | | |
| Maryland Industrial Development Financing Authority, (Our Lady of Good Counsel High School), 5.50%, 5/1/20 | | | 350 | | | | 359,964 | | | |
| Missouri State Health and Educational Facilities Authority, (St. Louis University), 5.50%, 10/1/16 | | | 2,555 | | | | 3,064,365 | | | |
| New Jersey Educational Facilities Authority, (University of Medicine and Dentistry of New Jersey), 7.125%, 12/1/23 | | | 2,750 | | | | 3,345,732 | | | |
| New York Dormitory Authority, (Third Generation Resolution), 5.00%, 5/15/26 | | | 4,500 | | | | 5,216,760 | | | |
| Ohio Higher Educational Facility Commission, (John Carroll University), 5.00%, 11/15/13 | | | 500 | | | | 529,395 | | | |
| Ohio State University General Receipts, 5.00%, 12/1/23 | | | 250 | | | | 302,068 | | | |
| Rutgers State University, Series F, 5.00%, 5/1/23 | | | 1,000 | | | | 1,151,940 | | | |
| University of California, 5.00%, 5/15/21 | | | 500 | | | | 574,060 | | | |
| University of Cincinnati, OH, General Receipts, 4.00%, 6/1/25 | | | 4,340 | | | | 4,634,556 | | | |
| University of Cincinnati, OH, General Receipts, 4.00%, 6/1/26 | | | 1,880 | | | | 1,979,208 | | | |
| University of Illinois, 0.00%, 4/1/15 | | | 1,700 | | | | 1,628,124 | | | |
| University of Illinois, 0.00%, 4/1/16 | | | 1,000 | | | | 927,210 | | | |
| University of New Mexico, 5.00%, 6/1/26 | | | 1,000 | | | | 1,162,820 | | | |
| University of Texas, 5.25%, 7/1/26 | | | 5,245 | | | | 6,703,687 | | | |
| |
| |
| | | | | | | $ | 35,668,404 | | | |
| |
| |
| |
| |
| Electric Utilities — 8.0% |
| |
| American Municipal Power-Ohio, Inc., (Meldahl Hydroelectric Project), 5.00%, 2/15/21 | | $ | 4,235 | | | $ | 4,858,900 | | | |
| Apache County, AZ, Industrial Development Authority, (Tucson Electric Power Co.), 4.50%, 3/1/30 | | | 2,400 | | | | 2,410,416 | | | |
| California Department of Water Resource Power Supply, 5.00%, 5/1/22 | | | 6,705 | | | | 7,735,357 | | | |
| Chesterfield County, VA, Economic Development Authority, (Virginia Electric and Power Co.), 5.00%, 5/1/23 | | | 2,000 | | | | 2,256,980 | | | |
| Massachusetts Development Finance Agency, (Dominion Energy Brayton), 5.75% to 5/1/19 (Put Date), 12/1/42 | | | 3,200 | | | | 3,713,376 | | | |
| Michigan Strategic Fund Limited Obligation Revenue, (Detroit Edison Co.), 5.625%, 7/1/20 | | | 3,000 | | | | 3,534,540 | | | |
| Municipal Electric Authority of Georgia, 5.25%, 1/1/21 | | | 2,000 | | | | 2,408,080 | | | |
| Navajo County, AZ, Pollution Control Corp., 5.50% to 6/1/14 (Put Date), 6/1/34 | | | 3,500 | | | | 3,782,240 | | | |
| Navajo County, AZ, Pollution Control Corp., 5.75% to 6/1/16 (Put Date), 6/1/34 | | | 3,500 | | | | 3,957,975 | | | |
| New Hampshire Business Finance Authority Pollution Control, (Central Maine Power Co.), 5.375%, 5/1/14 | | | 2,500 | | | | 2,683,750 | | | |
| Ohio Air Quality Development Authority, (First Energy), 5.625%, 6/1/18 | | | 700 | | | | 790,307 | | | |
See Notes to Financial Statements.
14
Eaton Vance
National Limited Maturity Municipal Income Fund
March 31, 2012
Portfolio of Investments — continued
| | | | | | | | | | | |
| | | Principal
| | | | | | |
| | | Amount
| | | | | | |
| Security | | (000’s omitted) | | | Value | | | |
| |
| |
| Electric Utilities (continued) |
| |
| | | | | | | | | | | |
| Puerto Rico Electric Power Authority, 5.25%, 7/1/25 | | $ | 500 | | | $ | 544,815 | | | |
| Rapides Finance Authority, LA, (Cleco Power LLC), (AMT), 5.25% to 3/1/13 (Put Date), 11/1/37 | | | 6,500 | | | | 6,696,235 | | | |
| Sam Rayburn Municipal Power Agency, TX, Power Supply System, 6.00%, 10/1/16 | | | 1,250 | | | | 1,274,100 | | | |
| Vernon, CA, Electric System Revenue, 5.125%, 8/1/21 | | | 8,500 | | | | 9,085,565 | | | |
| Wake County, NC, Industrial Facilities and Pollution Control Financing Authority, (Carolina Power and Light Co.), 5.375%, 2/1/17 | | | 2,500 | | | | 2,534,450 | | | |
| |
| |
| | | | | | | $ | 58,267,086 | | | |
| |
| |
| |
| |
| Escrowed / Prerefunded — 2.8% |
| |
| California Department of Water Resource Power Supply, Prerefunded to 5/1/12, 5.125%, 5/1/18 | | $ | 250 | | | $ | 253,570 | | | |
| California Statewide Communities Development Authority, (San Gabriel Valley), Escrowed to Maturity, 5.50%, 9/1/14 | | | 330 | | | | 352,559 | | | |
| Cuyahoga County, OH, (Cleveland Clinic Health System), Prerefunded to 7/1/13, 6.00%, 1/1/17 | | | 3,000 | | | | 3,213,060 | | | |
| Massachusetts Turnpike Authority, Escrowed to Maturity, 5.00%, 1/1/20 | | | 3,000 | | | | 3,516,960 | | | |
| Michigan Hospital Finance Authority, (Henry Ford Health System), Prerefunded to 3/1/13, 5.50%, 3/1/14 | | | 2,000 | | | | 2,095,940 | | | |
| New Jersey Economic Development Authority, (Kapkowski Road Landfill), Prerefunded to 5/15/14, 6.375%, 4/1/18 | | | 350 | | | | 393,194 | | | |
| New Jersey Educational Facilities Authority, (Steven’s Institute of Technology), Escrowed to Maturity, 5.00%, 7/1/12 | | | 1,235 | | | | 1,250,079 | | | |
| North Carolina Eastern Municipal Power Agency, Escrowed to Maturity, 4.00%, 1/1/18 | | | 1,195 | | | | 1,367,916 | | | |
| Ohio State Water Development Authority, (Drinking Water), Prerefunded to 12/1/12, 5.50%, 12/1/14 | | | 430 | | | | 445,304 | | | |
| Orange County, FL, Health Facilities Authority, (Adventist Health System), Prerefunded to 11/15/12, 5.25%, 11/15/18 | | | 2,000 | | | | 2,082,120 | | | |
Triborough Bridge and Tunnel Authority, NY, Escrowed to Maturity, 5.50%, 1/1/17(2) | | | 5,000 | | | | 5,580,600 | | | |
| |
| |
| | | | | | | $ | 20,551,302 | | | |
| |
| |
| |
| |
| General Obligations — 13.0% |
| |
| Austin, TX, 4.00%, 9/1/28 | | $ | 3,000 | | | $ | 3,195,030 | | | |
| Bergen County, NJ, Improvement Authority, (County Administration Complex), 5.00%, 11/15/24 | | | 1,100 | | | | 1,393,128 | | | |
| Canyon County, MD, School District No. 139 Vallivue, 5.00%, 9/15/23 | | | 1,005 | | | | 1,228,633 | | | |
| Canyon County, MD, School District No. 139 Vallivue, 5.00%, 9/15/24 | | | 1,730 | | | | 2,095,168 | | | |
| Chemeketa, OR, Community College District, 5.50%, 6/15/22 | | | 1,000 | | | | 1,207,570 | | | |
| Denver City and County, CO, School District No. 1, 4.00%, 12/1/26 | | | 4,035 | | | | 4,334,881 | | | |
| Franklin County, OH, 5.00%, 12/1/12 | | | 395 | | | | 407,751 | | | |
| Franklin Township, NJ, School District, 5.00%, 8/15/22 | | | 1,000 | | | | 1,252,010 | | | |
| Gwinnett County, GA, School District, 5.00%, 2/1/26 | | | 2,220 | | | | 2,788,298 | | | |
| Gwinnett County, GA, School District, 5.00%, 2/1/29 | | | 5,400 | | | | 6,585,246 | | | |
| Hamilton, OH, School District, 6.15%, 12/1/15 | | | 500 | | | | 595,310 | | | |
| Kentwood, MI, Public Schools, 4.00%, 5/1/21 | | | 615 | | | | 698,062 | | | |
| Kentwood, MI, Public Schools, 4.00%, 5/1/23 | | | 2,475 | | | | 2,761,085 | | | |
| Maryland State and Local Facilities, 5.00%, 8/1/18 | | | 10,000 | | | | 11,917,800 | | | |
| Michigan, 6.00%, 11/1/22 | | | 2,985 | | | | 3,624,954 | | | |
| North Carolina, 5.00%, 5/1/22 | | | 10,000 | | | | 12,656,700 | | | |
| Oregon State, (Oregon University System), 5.00%, 8/1/23 | | | 5,930 | | | | 7,283,760 | | | |
| Oregon State, (Oregon University System), 5.00%, 8/1/24 | | | 2,960 | | | | 3,606,168 | | | |
| Oregon State, (Oregon University System), 5.00%, 8/1/26 | | | 1,500 | | | | 1,807,650 | | | |
| Palo Alto, CA, (Election of 2008), 5.00%, 8/1/28 | | | 1,250 | | | | 1,457,700 | | | |
| Salem-Keizer, OR, School District No. 24J, 0.00%, 6/15/23 | | | 15,320 | | | | 10,896,656 | | | |
| Wake County, NC, 5.00%, 3/1/24 | | | 10,000 | | | | 12,746,700 | | | |
| |
| |
| | | | | | | $ | 94,540,260 | | | |
| |
| |
| |
| |
| Health Care – Miscellaneous — 0.2% |
| |
| Arizona Health Facilities Authority, (Blood Systems, Inc.), 5.00%, 4/1/21 | | $ | 1,000 | | | $ | 1,051,350 | | | |
Tax Revenue Exempt Securities Trust, Community Health Provider, (Pooled Loan Program Various States Trust Certificates), 6.00%, 12/1/36(3) | | | 138 | | | | 138,042 | | | |
| |
| |
| | | | | | | $ | 1,189,392 | | | |
| |
| |
| |
| |
| Hospital — 7.8% |
| |
| California Health Facilities Financing Authority, (Catholic Healthcare), 5.125%, 7/1/22 | | $ | 5,775 | | | $ | 6,333,731 | | | |
| California Statewide Communities Development Authority, (John Muir Health), 5.00%, 7/1/18 | | | 500 | | | | 576,145 | | | |
| California Statewide Communities Development Authority, (Kaiser Permanente), 5.00%, 4/1/19 | | | 500 | | | | 587,210 | | | |
| Camden County, NJ, Improvement Authority, (Cooper Health System), 5.25%, 2/15/20 | | | 1,000 | | | | 1,045,140 | | | |
See Notes to Financial Statements.
15
Eaton Vance
National Limited Maturity Municipal Income Fund
March 31, 2012
Portfolio of Investments — continued
| | | | | | | | | | | |
| | | Principal
| | | | | | |
| | | Amount
| | | | | | |
| Security | | (000’s omitted) | | | Value | | | |
| |
| |
| Hospital (continued) |
| |
| | | | | | | | | | | |
| Dauphin County, PA, General Authority Health System, (Pinnacle Health System), 5.75%, 6/1/20 | | $ | 6,000 | | | $ | 6,808,440 | | | |
| Henderson, NV, Health Care Facilities, (Catholic Healthcare West), 5.00%, 7/1/13 | | | 2,500 | | | | 2,627,850 | | | |
| Highlands County, FL, Health Facilities Authority, (Adventist Bolingbrook), 5.00%, 11/15/16 | | | 1,205 | | | | 1,386,340 | | | |
| Highlands County, FL, Health Facilities Authority, (Adventist Bolingbrook), 5.125%, 11/15/20 | | | 1,860 | | | | 2,063,279 | | | |
| Highlands County, FL, Health Facilities Authority, (Adventist Bolingbrook), 5.125%, 11/15/22 | | | 2,835 | | | | 3,097,237 | | | |
| Kent, MI, Hospital Finance Authority, (Spectrum Health), 5.50% to 1/15/15 (Put Date), 1/15/47 | | | 2,760 | | | | 3,092,111 | | | |
| Lexington County, SC, (Health Services, Inc.), 5.00%, 11/1/15 | | | 1,000 | | | | 1,119,920 | | | |
| Massachusetts Health and Educational Facilities Authority, (Lowell General Hospital), 4.75%, 7/1/25 | | | 2,715 | | | | 2,714,810 | | | |
| Massachusetts Health and Educational Facilities Authority, (Partners Healthcare System), 5.00%, 7/1/22 | | | 1,250 | | | | 1,442,625 | | | |
| Michigan Hospital Finance Authority, (Ascension Health), 5.00% to 11/1/12 (Put Date), 11/1/27 | | | 7,470 | | | | 7,679,982 | | | |
| Michigan Hospital Finance Authority, (Memorial Healthcare Center), 5.875%, 11/15/21 | | | 1,000 | | | | 1,001,110 | | | |
| Michigan Hospital Finance Authority, (Oakwood Obligations Group), 5.00%, 7/15/12 | | | 2,000 | | | | 2,025,460 | | | |
| Michigan Hospital Finance Authority, (Oakwood Obligations Group), 5.00%, 7/15/13 | | | 1,750 | | | | 1,836,503 | | | |
| New Jersey Health Care Facilities Financing Authority, (Atlantic City Medical Care Center), 6.00%, 7/1/12 | | | 135 | | | | 136,447 | | | |
| New Jersey Health Care Facilities Financing Authority, (Hunterdon Medical Center), 5.25%, 7/1/25 | | | 500 | | | | 521,010 | | | |
| New Jersey Health Care Facilities Financing Authority, (Virtua Health, Inc.), 5.25%, 7/1/17 | | | 1,000 | | | | 1,134,540 | | | |
| New York Dormitory Authority, (NYU Hospital Center), 5.25%, 7/1/24 | | | 1,805 | | | | 1,943,588 | | | |
| Orange County, FL, Health Facilities Authority, (Orlando Health, Inc.), 5.125%, 10/1/26 | | | 955 | | | | 998,835 | | | |
| Orange County, FL, Health Facilities Authority, (Orlando Health, Inc.), 5.375%, 10/1/23 | | | 970 | | | | 1,052,964 | | | |
| South Carolina Jobs Economic Development Authority, (Palmetto Health Alliance), 6.00%, 8/1/12 | | | 2,000 | | | | 2,029,760 | | | |
| University of Kansas Hospital Authority, 5.00%, 9/1/16 | | | 1,000 | | | | 1,160,170 | | | |
| Washington Township, CA, Health Care District Revenue, 5.50%, 7/1/19 | | | 250 | | | | 288,693 | | | |
| Washington Township, CA, Health Care District Revenue, 5.75%, 7/1/24 | | | 1,750 | | | | 1,951,530 | | | |
| |
| |
| | | | | | | $ | 56,655,430 | | | |
| |
| |
| |
| |
| Housing — 0.2% |
| |
| Georgia Private Colleges and Universities Authority, Student Housing Revenue, (Mercer Housing Corp.), 6.00%, 6/1/31 | | $ | 270 | | | $ | 270,400 | | | |
| New Jersey Housing and Mortgage Finance Agency, SFMR, (AMT), 5.10%, 10/1/23 | | | 460 | | | | 479,578 | | | |
Sandoval County, NM, MFMR, 6.00%, 5/1/32(3) | | | 610 | | | | 545,297 | | | |
Texas Student Housing Corp., (University of North Texas), 9.375%, 7/1/49(1) | | | 95 | | | | 56,991 | | | |
| |
| |
| | | | | | | $ | 1,352,266 | | | |
| |
| |
| |
| |
| Industrial Development Revenue — 5.5% |
| |
| California Pollution Control Financing Authority, (Waste Management, Inc.), (AMT), 5.125%, 11/1/23 | | $ | 6,600 | | | $ | 7,035,006 | | | |
| Gulf Coast, TX, Waste Disposal Authority, (Waste Management), (AMT), 4.55%, 4/1/12 | | | 2,000 | | | | 2,000,100 | | | |
| Maine Finance Authority, Solid Waste Disposal, (Casella Waste Systems, Inc.), (AMT), 6.25%, to 2/1/17 (Put Date), 1/1/25 | | | 2,415 | | | | 2,429,731 | | | |
| Michigan Strategic Fund, (Waste Management, Inc.), (AMT), 4.50%, 12/1/13 | | | 1,000 | | | | 1,051,690 | | | |
| Mission, TX, Economic Development Corp., (Allied Waste Industries), (AMT), 5.20%, 4/1/18 | | | 5,650 | | | | 5,667,232 | | | |
| Mississippi Business Finance Corp., (Air Cargo), (AMT), 7.25%, 7/1/34 | | | 1,415 | | | | 723,673 | | | |
| New Jersey Economic Development Authority, (Continental Airlines), (AMT), 6.25%, 9/15/19 | | | 1,890 | | | | 1,894,631 | | | |
New Jersey Economic Development Authority, (New Jersey-American Water Co., Inc.), (AMT), 5.10%, 6/1/23 | | | 1,780 | | | | 1,982,760 | | | |
| New York Liberty Development Corp., (Goldman Sachs Group, Inc.), 5.50%, 10/1/37 | | | 9,990 | | | | 11,274,914 | | | |
| Ohio Water Development Authority, (Allied Waste North America, Inc.), (AMT), 5.15%, 7/15/15 | | | 1,950 | | | | 1,969,949 | | | |
| Toledo-Lucas County, OH, Port Authority, (Cargill, Inc.), 4.50%, 12/1/15 | | | 3,325 | | | | 3,585,148 | | | |
| |
| |
| | | | | | | $ | 39,614,834 | | | |
| |
| |
| |
| |
| Insured – Education — 1.9% |
| |
| California Educational Facilities Authority, (San Diego University), (AMBAC), 0.00%, 10/1/15 | | $ | 375 | | | $ | 346,733 | | | |
| California Educational Facilities Authority, (Santa Clara University), (NPFG), 5.00%, 9/1/23 | | | 500 | | | | 613,180 | | | |
| New Jersey Educational Facilities Authority, (Ramapo College), (AMBAC), 4.50%, 7/1/21 | | | 1,000 | | | | 1,080,440 | | | |
| New York Dormitory Authority, (Educational Housing Services), (AMBAC), 5.25%, 7/1/21 | | | 2,025 | | | | 2,320,164 | | | |
See Notes to Financial Statements.
16
Eaton Vance
National Limited Maturity Municipal Income Fund
March 31, 2012
Portfolio of Investments — continued
| | | | | | | | | | | |
| | | Principal
| | | | | | |
| | | Amount
| | | | | | |
| Security | | (000’s omitted) | | | Value | | | |
| |
| |
| Insured – Education (continued) |
| |
| | | | | | | | | | | |
| New York Dormitory Authority, (Rochester Institute of Technology), (AMBAC), 5.25%, 7/1/22 | | $ | 5,150 | | | $ | 6,252,203 | | | |
| New York Dormitory Authority, (SUNY), (XLCA), 5.25% to 7/1/13 (Put Date), 7/1/32 | | | 2,000 | | | | 2,118,340 | | | |
| Oregon Health and Science University, (NPFG), 0.00%, 7/1/21 | | | 1,815 | | | | 1,304,077 | | | |
| |
| |
| | | | | | | $ | 14,035,137 | | | |
| |
| |
| |
| |
| Insured – Electric Utilities — 1.1% |
| |
| California Pollution Control Financing Authority, (San Diego Gas and Electric), (NPFG), 5.90%, 6/1/14 | | $ | 600 | | | $ | 665,082 | | | |
| Cape May County, NJ, Industrial Pollution Control Financing Authority, (Atlantic City Electric Co.), (NPFG), 6.80%, 3/1/21 | | | 560 | | | | 725,637 | | | |
| Illinois Municipal Electric Agency Power Supply, (FGIC), (NPFG), 5.25%, 2/1/16 | | | 3,000 | | | | 3,442,590 | | | |
| Northern California Power Agency, (Hydroelectric), (AGC), 5.00%, 7/1/24 | | | 500 | | | | 556,755 | | | |
| Puerto Rico Electric Power Authority, (NPFG), 5.25%, 7/1/26 | | | 1,000 | | | | 1,138,830 | | | |
| Puerto Rico Electric Power Authority, (XLCA), 5.375%, 7/1/18 | | | 1,000 | | | | 1,141,170 | | | |
| |
| |
| | | | | | | $ | 7,670,064 | | | |
| |
| |
| |
| |
| Insured – Escrowed / Prerefunded — 1.5% |
| |
| Metropolitan Transportation Authority, NY, Commuter Facilities, (AMBAC), Escrowed to Maturity, 5.00%, 7/1/20 | | $ | 425 | | | $ | 443,934 | | | |
| Montgomery, AL, BMC Special Care Facilities Financing Authority, (Baptist Health Montgomery), (NPFG), Prerefunded to 11/15/14, 5.00%, 11/15/24 | | | 5,000 | | | | 5,571,400 | | | |
| New Jersey Health Care Facilities Financing Authority, (AHS Hospital Corp.), (AMBAC), Escrowed to Maturity, 6.00%, 7/1/12 | | | 1,300 | | | | 1,319,019 | | | |
| Ohio Higher Educational Facilities Authority, (Xavier University), (AGC), Prerefunded to 5/1/16, 5.00%, 5/1/22 | | | 350 | | | | 408,240 | | | |
| Sunrise, FL, Utilities Systems, (AMBAC), Escrowed to Maturity, 5.50%, 10/1/18 | | | 2,425 | | | | 2,892,491 | | | |
| |
| |
| | | | | | | $ | 10,635,084 | | | |
| |
| |
| |
| |
| Insured – General Obligations — 8.5% |
| |
| Boston, MA, (NPFG), 0.125%, 3/1/22 | | $ | 8,000 | | | $ | 6,018,240 | | | |
| Cincinnati, OH, School District, (FGIC), (NPFG), 5.25%, 12/1/30 | | | 4,500 | | | | 5,590,170 | | | |
| Clearview, NJ, Regional High School District, (FGIC), (NPFG), 5.375%, 8/1/15 | | | 330 | | | | 354,496 | | | |
| Freehold, NJ, Regional High School District, (FGIC), (NPFG), 5.00%, 3/1/18 | | | 250 | | | | 297,075 | | | |
| Hilliard, OH, School District, (FGIC), (NPFG), 0.00%, 12/1/14 | | | 1,000 | | | | 977,220 | | | |
| Hillsborough Township, NJ, School District, (AGM), 5.375%, 10/1/18 | | | 970 | | | | 1,199,347 | | | |
| Jackson Township, NJ, School District, (Baptist Healthcare Systems), (NPFG), 5.25%, 6/15/23 | | | 6,000 | | | | 7,382,100 | | | |
| Linn County, OR, Community School District No. 9, (Lebanon), (FGIC), (NPFG), 5.25%, 6/15/21 | | | 1,055 | | | | 1,330,893 | | | |
| Linn County, OR, Community School District No. 9, (Lebanon), (FGIC), (NPFG), 5.25%, 6/15/22 | | | 625 | | | | 790,581 | | | |
| Miami, FL, (Homeland Defense), (NPFG), 5.00%, 1/1/19 | | | 10,000 | | | | 10,798,800 | | | |
| New Jersey, (AMBAC), 5.25%, 7/15/19 | | | 1,120 | | | | 1,384,197 | | | |
| New Orleans, LA, (NPFG), 5.25%, 12/1/15 | | | 5,105 | | | | 5,680,793 | | | |
| Philadelphia, PA, (AGC), 5.25%, 7/15/15 | | | 3,440 | | | | 3,846,952 | | | |
| San Mateo County, CA, Community College District, (Election of 2005), (NPFG), 0.00%, 9/1/22 | | | 3,000 | | | | 2,069,610 | | | |
| Springfield, OH, City School District, (AMBAC), 4.30%, 12/1/14 | | | 1,500 | | | | 1,509,330 | | | |
| St. Louis, MO, Board of Education, (AGM), 0.00%, 4/1/16 | | | 1,000 | | | | 958,110 | | | |
| Strongsville, OH, City School District, (NPFG), 5.375%, 12/1/12 | | | 500 | | | | 517,290 | | | |
| Washington, (AMBAC), 0.00%, 12/1/22 | | | 10,000 | | | | 7,387,700 | | | |
| West Virginia, (FGIC), (NPFG), 0.00%, 11/1/21 | | | 4,275 | | | | 3,305,216 | | | |
| |
| |
| | | | | | | $ | 61,398,120 | | | |
| |
| |
| |
| |
| Insured – Hospital — 1.3% |
| |
| Harris County, TX, Hospital District, (NPFG), 5.00%, 2/15/13 | | $ | 1,000 | | | $ | 1,032,930 | | | |
| Harris County, TX, Hospital District, (NPFG), 5.00%, 2/15/14 | | | 500 | | | | 532,120 | | | |
| Waco, TX, Health Facilities Development Corp., (Hillcrest Health System), (NPFG), 5.00%, 8/1/19 | | | 3,405 | | | | 3,624,895 | | | |
| Waco, TX, Health Facilities Development Corp., (Hillcrest Health System), (NPFG), 5.00%, 8/1/20 | | | 3,745 | | | | 3,970,561 | | | |
| |
| |
| | | | | | | $ | 9,160,506 | | | |
| |
| |
| |
| |
| Insured – Lease Revenue / Certificates of Participation — 1.0% |
| |
| California State Public Works Board, (Department of Corrections), (AMBAC), 5.25%, 12/1/13 | | $ | 420 | | | $ | 434,133 | | | |
| Hudson County, NJ, (NPFG), 6.25%, 6/1/15 | | | 1,000 | | | | 1,120,780 | | | |
See Notes to Financial Statements.
17
Eaton Vance
National Limited Maturity Municipal Income Fund
March 31, 2012
Portfolio of Investments — continued
| | | | | | | | | | | |
| | | Principal
| | | | | | |
| | | Amount
| | | | | | |
| Security | | (000’s omitted) | | | Value | | | |
| |
| |
| Insured – Lease Revenue / Certificates of Participation (continued) |
| |
| | | | | | | | | | | |
| Louisiana Public Facility Authority, (Hurricane Recovery), (AMBAC), 5.00%, 6/1/19 | | $ | 5,000 | | | $ | 5,496,750 | | | |
| |
| |
| | | | | | | $ | 7,051,663 | | | |
| |
| |
| |
| |
| Insured – Other Revenue — 0.1% |
| |
| Akron, OH, Economic Development, (NPFG), 6.00%, 12/1/12 | | $ | 175 | | | $ | 181,517 | | | |
| Cleveland, OH, Parking Facilities, (AGM), 5.25%, 9/15/20 | | | 160 | | | | 200,293 | | | |
| |
| |
| | | | | | | $ | 381,810 | | | |
| |
| |
| |
| |
| Insured – Special Tax Revenue — 4.5% |
| |
| Arlington, TX, (Dallas Cowboys), (NPFG), 5.00%, 8/15/34 | | $ | 1,355 | | | $ | 1,411,002 | | | |
| Denver, CO, City and County, Excise Tax Revenue, (AGC), 6.00%, 9/1/23 | | | 5,000 | | | | 6,034,550 | | | |
| Garden State Preservation Trust, NJ, Open Space and Farmland, (AGM), 5.25%, 11/1/20 | | | 10,000 | | | | 12,463,700 | | | |
| Massachusetts, Special Obligation, (AGM), 5.50%, 6/1/21 | | | 5,000 | | | | 6,398,550 | | | |
| Massachusetts, Special Obligation, Dedicated Tax Revenue, (FGIC), (NPFG), 5.50%, 1/1/29 | | | 4,920 | | | | 5,797,826 | | | |
| Puerto Rico Infrastructure Financing Authority, (FGIC), 5.50%, 7/1/19 | | | 250 | | | | 277,878 | | | |
| San Mateo County, CA, Transportation District, (NPFG), 5.25%, 6/1/17 | | | 500 | | | | 590,080 | | | |
| |
| |
| | | | | | | $ | 32,973,586 | | | |
| |
| |
| |
| |
| Insured – Student Loan — 0.7% |
| |
| Maine Educational Loan Authority, (AGC), 5.625%, 12/1/27 | | $ | 3,445 | | | $ | 3,785,573 | | | |
| Massachusetts Educational Financing Authority, (AMBAC), (AMT), 4.60%, 1/1/22 | | | 1,140 | | | | 1,166,220 | | | |
| |
| |
| | | | | | | $ | 4,951,793 | | | |
| |
| |
| |
| |
| Insured – Transportation — 4.6% |
| |
| Chicago, IL, O’Hare International Airport, (NPFG), (AMT), 5.75%, 1/1/17 | | $ | 2,295 | | | $ | 2,301,770 | | | |
| Houston, TX, Airport System, (FGIC), (NPFG), (AMT), 5.50%, 7/1/12 | | | 1,000 | | | | 1,004,270 | | | |
| Idaho Housing and Finance Association, (Grant and Revenue Anticipation Bonds Federal Highway Trust Fund), (AGC), 5.25%, 7/15/21 | | | 1,045 | | | | 1,219,651 | | | |
| Idaho Housing and Finance Association, (Grant and Revenue Anticipation Bonds Federal Highway Trust Fund), (AGC), 5.25%, 7/15/25 | | | 1,000 | | | | 1,140,450 | | | |
| Kenton County, KY, (Cincinnati/Northern Kentucky Airport), (NPFG), (AMT), 5.625%, 3/1/13 | | | 1,105 | | | | 1,108,956 | | | |
| Miami-Dade County, FL, Aviation, (NPFG), (AMT), 5.25%, 10/1/15 | | | 8,125 | | | | 9,000,306 | | | |
| Miami-Dade County, FL, Aviation, (Miami International Airport), (FGIC), (NPFG), (AMT), 5.50%, 10/1/13 | | | 1,000 | | | | 1,022,900 | | | |
| New Jersey Transportation Trust Fund Authority, (AGC), 0.00%, 12/15/24 | | | 10,000 | | | | 5,938,500 | | | |
| New Jersey Transportation Trust Fund Authority, (FGIC), (NPFG), 5.50%, 12/15/20 | | | 5,000 | | | | 6,084,550 | | | |
| New Orleans, LA, Aviation Board, (AGC), 6.00%, 1/1/23 | | | 1,040 | | | | 1,223,466 | | | |
| Ohio Turnpike Commission, (FGIC), (NPFG), 5.50%, 2/15/18 | | | 1,750 | | | | 2,129,680 | | | |
| Port of Oakland, CA, (NPFG), (AMT), 5.00%, 11/1/21 | | | 665 | | | | 705,937 | | | |
| San Jose, CA, Airport Revenue, (AMBAC), (AMT), 5.50%, 3/1/18 | | | 675 | | | | 768,515 | | | |
| |
| |
| | | | | | | $ | 33,648,951 | | | |
| |
| |
| |
| |
| Insured – Water and Sewer — 1.8% |
| |
| Connecticut Development Authority, (Aquarion Water Co. of Connecticut), (XLCA), (AMT), 5.00%, 7/1/38 | | $ | 2,000 | | | $ | 1,978,220 | | | |
| Kansas City, MO, Water Revenue, (BHAC), 5.00%, 12/1/23 | | | 3,125 | | | | 3,603,125 | | | |
| Massachusetts Water Resources Authority, (AGM), 5.25%, 8/1/29 | | | 3,250 | | | | 4,034,973 | | | |
| North Hudson, NJ, Sewer Authority, (NPFG), 5.125%, 8/1/22 | | | 1,000 | | | | 1,131,900 | | | |
| Passaic Valley, NJ, Water Commission, (AGM), 5.00%, 12/15/17 | | | 1,020 | | | | 1,200,714 | | | |
| Pennsville, NJ, Sewer Authority, (NPFG), 0.00%, 11/1/16 | | | 565 | | | | 514,619 | | | |
| Pennsville, NJ, Sewer Authority, (NPFG), 0.00%, 11/1/17 | | | 565 | | | | 496,499 | | | |
| Pennsville, NJ, Sewer Authority, (NPFG), 0.00%, 11/1/18 | | | 565 | | | | 474,012 | | | |
| |
| |
| | | | | | | $ | 13,434,062 | | | |
| |
| |
| |
| |
| Lease Revenue / Certificates of Participation — 2.5% |
| |
| California Public Works, (University of California), 5.25%, 6/1/20 | | $ | 500 | | | $ | 615,840 | | | |
| Charleston, SC, Educational Excellence Financing Corp., (Charleston County School District), 5.00%, 12/1/20 | | | 5,265 | | | | 5,999,731 | | | |
| Lexington County, SC, One School Facilities Corp., 5.00%, 12/1/20 | | | 2,240 | | | | 2,459,050 | | | |
See Notes to Financial Statements.
18
Eaton Vance
National Limited Maturity Municipal Income Fund
March 31, 2012
Portfolio of Investments — continued
| | | | | | | | | | | |
| | | Principal
| | | | | | |
| | | Amount
| | | | | | |
| Security | | (000’s omitted) | | | Value | | | |
| |
| |
| Lease Revenue / Certificates of Participation (continued) |
| |
| | | | | | | | | | | |
| Lexington County, SC, One School Facilities Corp., 5.00%, 12/1/22 | | $ | 1,945 | | | $ | 2,105,482 | | | |
| New Jersey Economic Development Authority, (School Facilities Construction), 5.50%, 9/1/19 | | | 4,385 | | | | 5,335,317 | | | |
| Newberry, SC, Investing In Children’s Education, (Newberry County School District), 5.25%, 12/1/24 | | | 1,755 | | | | 1,844,680 | | | |
| |
| |
| | | | | | | $ | 18,360,100 | | | |
| |
| |
| |
| |
| Other Revenue — 1.8% |
| |
| Central Falls, RI, Detention Facility Corp., 7.25%, 7/15/35 | | $ | 1,220 | | | $ | 981,844 | | | |
Non-Profit Preferred Funding Trust, Various States, 4.47%, 9/15/37(3) | | | 4,500 | | | | 3,735,585 | | | |
| Otero County, NM, Jail Project Revenue, 5.50%, 4/1/13 | | | 55 | | | | 54,509 | | | |
| Otero County, NM, Jail Project Revenue, 5.75%, 4/1/18 | | | 510 | | | | 475,570 | | | |
| Riversouth Authority, OH, (Lazarus Building Redevelopment), 5.75%, 12/1/27 | | | 300 | | | | 297,954 | | | |
Seminole Tribe, FL, 5.50%, 10/1/24(3) | | | 1,825 | | | | 1,890,591 | | | |
Seminole Tribe, FL, 5.75%, 10/1/22(3) | | | 5,250 | | | | 5,553,660 | | | |
| |
| |
| | | | | | | $ | 12,989,713 | | | |
| |
| |
| |
| |
| Senior Living / Life Care — 1.0% |
| |
| California Statewide Communities Development Authority, (Senior Living-Presbyterian Homes), 4.50%, 11/15/16 | | $ | 1,520 | | | $ | 1,593,599 | | | |
| Maryland Health and Higher Educational Facilities Authority, (Edenwald), 4.85%, 1/1/13 | | | 200 | | | | 201,844 | | | |
| Maryland Health and Higher Educational Facilities Authority, (King Farm Presbyterian Community), 5.00%, 1/1/17 | | | 650 | | | | 636,246 | | | |
| Massachusetts Development Finance Agency, (Volunteers of America), 5.00%, 11/1/17 | | | 490 | | | | 479,249 | | | |
| New Jersey Economic Development Authority, (Cranes Mill Project), 5.50%, 7/1/18 | | | 520 | | | | 570,424 | | | |
| New Jersey Economic Development Authority, (Seabrook Village, Inc.), 5.00%, 11/15/12 | | | 1,150 | | | | 1,159,810 | | | |
North Miami, FL, Health Care Facilities Authority, (Imperial Club), 6.125%, 1/1/42(4) | | | 495 | | | | 197,975 | | | |
| St. Joseph County, IN, Holy Cross Village, 5.55%, 5/15/19 | | | 460 | | | | 460,092 | | | |
| Tempe, AZ, Industrial Development Authority, (Friendship Village of Tempe), 6.00%, 12/1/27 | | | 2,140 | | | | 2,220,849 | | | |
| |
| |
| | | | | | | $ | 7,520,088 | | | |
| |
| |
| |
| |
| Solid Waste — 1.0% |
| |
| Massachusetts Industrial Finance Agency, (Ogden Haverhill), (AMT), 5.50%, 12/1/13 | | $ | 4,000 | | | $ | 4,014,560 | | | |
| Napa-Vallejo, CA, Waste Management Authority, (Solid Waste Transfer Facilities), (AMT), 5.10%, 2/15/14 | | | 350 | | | | 350,714 | | | |
| Niagara County, NY, Industrial Development Agency, (American Ref-Fuel Co., LLC), (AMT), 5.55% to 11/15/13 (Put Date), 11/15/24 | | | 3,000 | | | | 3,027,420 | | | |
| |
| |
| | | | | | | $ | 7,392,694 | | | |
| |
| |
| |
| |
| Special Tax Revenue — 2.2% |
| |
| Bridgeville, DE, (Heritage Shores Special Development District), 5.125%, 7/1/35 | | $ | 741 | | | $ | 564,175 | | | |
| California Economic Recovery, 5.00%, 7/1/18 | | | 500 | | | | 599,770 | | | |
| Covington Park, FL, Community Development District, (Capital Improvements), 5.00%, 5/1/21 | | | 175 | | | | 173,733 | | | |
| Detroit, MI, Downtown Development Authority Tax Increment, 0.00%, 7/1/21 | | | 2,000 | | | | 1,204,620 | | | |
| Dupree Lakes, FL, Community Development District, 5.00%, 5/1/12 | | | 560 | | | | 557,682 | | | |
| Dupree Lakes, FL, Community Development District, 6.83%, 11/1/15 | | | 480 | | | | 478,982 | | | |
| Fish Hawk, FL, Community Development District II, 7.04%, 11/1/14 | | | 90 | | | | 88,817 | | | |
| Massachusetts Bay Transportation Authority, 5.25%, 7/1/26 | | | 1,000 | | | | 1,267,340 | | | |
| Michigan Trunk Line, 5.00%, 11/15/21 | | | 500 | | | | 615,905 | | | |
| Michigan Trunk Line, 5.00%, 11/15/22 | | | 345 | | | | 417,581 | | | |
| Michigan Trunk Line, 5.00%, 11/15/23 | | | 600 | | | | 715,926 | | | |
| Michigan Trunk Line, 5.00%, 11/15/24 | | | 500 | | | | 589,595 | | | |
| Michigan Trunk Line, 5.00%, 11/15/26 | | | 1,100 | | | | 1,268,784 | | | |
| Michigan Trunk Line, 5.00%, 11/15/28 | | | 2,000 | | | | 2,275,700 | | | |
| Michigan Trunk Line, 5.00%, 11/15/29 | | | 1,500 | | | | 1,697,520 | | | |
| New Jersey Economic Development Authority, (Newark Downtown Distribution Management Corp.), 4.625%, 6/15/12 | | | 180 | | | | 181,229 | | | |
| New Jersey Economic Development Authority, (Newark Downtown Distribution Management Corp.), 4.625%, 6/15/13 | | | 190 | | | | 196,884 | | | |
New River, FL, Community Development District, (Capital Improvements), Series 2010A-1, 5.75%, (0.00% until 11/1/12), 5/1/38 | | | 155 | | | | 98,208 | | | |
New River, FL, Community Development District, (Capital Improvements), Series 2010A-2, 5.75%, (0.00% until 11/1/14), 5/1/38 | | | 395 | | | | 159,039 | | | |
New River, FL, Community Development District, (Capital Improvements), Series 2010B-1, 5.00%, (0.00% until 11/1/12), 5/1/15 | | | 240 | | | | 205,776 | | | |
See Notes to Financial Statements.
19
Eaton Vance
National Limited Maturity Municipal Income Fund
March 31, 2012
Portfolio of Investments — continued
| | | | | | | | | | | |
| | | Principal
| | | | | | |
| | | Amount
| | | | | | |
| Security | | (000’s omitted) | | | Value | | | |
| |
| |
| Special Tax Revenue (continued) |
| |
| | | | | | | | | | | |
New River, FL, Community Development District, (Capital Improvements), Series 2010B-2, 5.00%, (0.00% until 11/1/13), 5/1/18 | | $ | 310 | | | $ | 141,425 | | | |
New River, FL, Community Development District, (Capital Improvements), 5.00%, 5/1/13(1) | | | 280 | | | | 0 | | | |
| North Springs, FL, Improvement District, (Heron Bay North Assessment Area), 5.00%, 5/1/14 | | | 830 | | | | 820,281 | | | |
| Poinciana West, FL, West Community Development District, 5.875%, 5/1/22 | | | 1,165 | | | | 1,149,704 | | | |
Sterling Hill, FL, Community Development District, (Capital Improvements), 5.10%, 5/1/11(5) | | | 275 | | | | 79,755 | | | |
Sterling Hill, FL, Community Development District, (Capital Improvements), 5.50%, 11/1/10(5) | | | 300 | | | | 210,126 | | | |
| |
| |
| | | | | | | $ | 15,758,557 | | | |
| |
| |
| |
| |
| Student Loan — 0.1% |
| |
| New Jersey Higher Education Assistance Authority, 5.25%, 6/1/21 | | $ | 1,000 | | | $ | 1,122,120 | | | |
| |
| |
| | | | | | | $ | 1,122,120 | | | |
| |
| |
| |
| |
| Transportation — 14.2% |
| |
| Bay Area Toll Authority, CA, Toll Bridge Revenue, (San Francisco Bay Area), 5.00%, 4/1/22 | | $ | 500 | | | $ | 587,565 | | | |
| Georgia State Road and Tollway Authority, (Federal Highway Grant Anticipation Revenue Bonds), 5.00%, 6/1/21 | | | 3,000 | | | | 3,555,120 | | | |
Greater Orlando, FL, Aviation Authority, 5.00%, 10/1/21(6) | | | 4,750 | | | | 5,435,377 | | | |
| Hawaii Airports System, 5.25%, 7/1/28 | | | 3,650 | | | | 4,061,319 | | | |
| Long Beach, CA, Harbor Revenue, 5.00%, 5/15/23 | | | 500 | | | | 584,415 | | | |
| Louisiana Offshore Terminal Authority, Deepwater Port Revenue, (Loop LLC), 5.25%, 9/1/15 | | | 2,500 | | | | 2,623,850 | | | |
| Maryland Transportation Authority, 5.00%, 3/1/18 | | | 10,000 | | | | 11,778,000 | | | |
| Metropolitan Washington, DC Airport Authority System, 5.00%, 10/1/22 | | | 5,000 | | | | 5,883,850 | | | |
| Metropolitan Washington, DC Airport Authority System, (AMT), 5.50%, 10/1/19 | | | 5,000 | | | | 5,864,000 | | | |
| Metropolitan Washington, DC Area Transit Authority, (Gross Revenue), 5.25%, 7/1/21 | | | 7,500 | | | | 8,931,300 | | | |
| New Jersey State Turnpike Authority, 5.00%, 1/1/20 | | | 1,500 | | | | 1,755,495 | | | |
| New Jersey Transportation Trust Fund Authority, 5.25%, 12/15/21 | | | 6,000 | | | | 7,230,480 | | | |
| North Texas Tollway Authority, (Dallas North Tollway System Revenue), 6.00%, 1/1/23 | | | 5,000 | | | | 5,918,850 | | | |
| Pennsylvania Economic Development Financing Authority, (National Railroad Passenger), 5.00%, 11/1/25 | | | 1,000 | | | | 1,079,490 | | | |
| Pennsylvania Economic Development Financing Authority, (National Railroad Passenger), 5.00%, 11/1/26 | | | 890 | | | | 955,273 | | | |
| Port Authority of New York and New Jersey, 5.375%, 3/1/28 | | | 1,000 | | | | 1,230,370 | | | |
| Port Authority of New York and New Jersey, (AMT), 5.25%, 9/15/23 | | | 11,000 | | | | 12,361,470 | | | |
| Triborough Bridge and Tunnel Authority, NY, 5.00%, 1/1/27 | | | 10,000 | | | | 11,547,100 | | | |
| Virginia Transportation Board, 4.00%, 3/15/25 | | | 10,290 | | | | 11,299,243 | | | |
| |
| |
| | | | | | | $ | 102,682,567 | | | |
| |
| |
| |
| |
| Water and Sewer — 1.3% |
| |
| Detroit, MI, Water Supply System Revenue, 5.00%, 7/1/21 | | $ | 1,610 | | | $ | 1,800,737 | | | |
| Fairfax County, VA, Water Authority, 5.00%, 4/1/18 | | | 5,000 | | | | 5,910,000 | | | |
| Gilroy, CA, Water and Sewer Revenue, 5.00%, 8/1/22 | | | 440 | | | | 551,069 | | | |
| New Jersey Economic Environmental Infrastructure Trust, 5.00%, 9/1/20 | | | 1,000 | | | | 1,251,430 | | | |
| |
| |
| | | | | | | $ | 9,513,236 | | | |
| |
| |
| | | |
| Total Tax-Exempt Investments — 99.4% | | |
| (identified cost $667,688,569) | | $ | 721,123,010 | | | |
| |
| |
| | | | | | | |
| Other Assets, Less Liabilities — 0.6% | | $ | 4,186,129 | | | |
| |
| |
| | | | | | | |
| Net Assets — 100.0% | | $ | 725,309,139 | | | |
| |
| |
The percentage shown for each investment category in the Portfolio of Investments is based on net assets.
| | | |
| AGC | | - Assured Guaranty Corp. |
| AGM | | - Assured Guaranty Municipal Corp. |
| AMBAC | | - AMBAC Financial Group, Inc. |
| AMT | | - Interest earned from these securities may be considered a tax preference item for purposes of the Federal Alternative Minimum Tax. |
| BHAC | | - Berkshire Hathaway Assurance Corp. |
| FGIC | | - Financial Guaranty Insurance Company |
| MFMR | | - Multi-Family Mortgage Revenue |
| NPFG | | - National Public Finance Guaranty Corp. |
| SFMR | | - Single Family Mortgage Revenue |
| SUNY | | - State University of New York |
| XLCA | | - XL Capital Assurance, Inc. |
See Notes to Financial Statements.
20
Eaton Vance
National Limited Maturity Municipal Income Fund
March 31, 2012
Portfolio of Investments — continued
At March 31, 2012, the concentration of the Fund’s investments in the various states, determined as a percentage of net assets, is as follows:
| | | | | |
| New Jersey | | | 12.4% | |
| Others, representing less than 10% individually | | | 87.0% | |
The Fund invests primarily in debt securities issued by municipalities. The ability of the issuers of the debt securities to meet their obligations may be affected by economic developments in a specific industry or municipality. In order to reduce the risk associated with such economic developments, at March 31, 2012, 27.1% of total investments are backed by bond insurance of various financial institutions and financial guaranty assurance agencies. The aggregate percentage insured by an individual financial institution ranged from 0.5% to 14.3% of total investments.
| | |
| (1) | | Defaulted bond. |
| |
| (2) | | Security (or a portion thereof) has been segregated to cover payable for when-issued securities. |
| |
| (3) | | Security exempt from registration pursuant to Rule 144A under the Securities Act of 1933. These securities may be sold in certain transactions (normally to qualified institutional buyers) and remain exempt from registration. At March 31, 2012, the aggregate value of these securities is $11,863,175 or 1.6% of the Fund’s net assets. |
| |
| (4) | | Security is in default and making only partial interest payments. |
| |
| (5) | | Defaulted matured bond. |
| |
| (6) | | When-issued security. |
See Notes to Financial Statements.
21
Eaton Vance
Limited Maturity Municipal Income Funds
March 31, 2012
Statements of Assets and Liabilities
| | | | | | | | | | | |
| | | March 31, 2012 | | |
| | | |
| | | AMT-Free
| | National
| | |
| Assets | | Limited Fund | | Limited Fund | | |
| |
| Investments — | | | | | | | | | | |
| Identified cost | | $ | 58,271,168 | | | $ | 667,688,569 | | | |
| Unrealized appreciation | | | 6,316,787 | | | | 53,434,441 | | | |
| |
| |
Investments, at value | | $ | 64,587,955 | | | $ | 721,123,010 | | | |
| |
| |
| Cash | | $ | — | | | $ | 482,502 | | | |
| Restricted cash* | | | 110,000 | | | | 1,100,000 | | | |
| Interest receivable | | | 746,884 | | | | 8,320,073 | | | |
| Receivable for investments sold | | | 1,203,544 | | | | 1,713,097 | | | |
| Receivable for Fund shares sold | | | 41 | | | | 622,393 | | | |
| Receivable for variation margin on open financial futures contracts | | | 31,641 | | | | 377,016 | | | |
| |
| |
Total assets | | $ | 66,680,065 | | | $ | 733,738,091 | | | |
| |
| |
| | | | | | | | | | | |
| |
| Liabilities |
| |
| Demand note payable | | $ | 600,000 | | | $ | — | | | |
| Payable for when-issued securities | | | — | | | | 5,384,553 | | | |
| Payable for Fund shares redeemed | | | 49,136 | | | | 1,410,251 | | | |
| Distributions payable | | | 83,717 | | | | 1,090,787 | | | |
| Due to custodian | | | 11,965 | | | | — | | | |
| Payable to affiliates: | | | | | | | | | | |
| Investment adviser fee | | | 23,262 | | | | 251,213 | | | |
| Distribution and service fees | | | 18,803 | | | | 154,999 | | | |
| Accrued expenses | | | 49,054 | | | | 137,149 | | | |
| |
| |
Total liabilities | | $ | 835,937 | | | $ | 8,428,952 | | | |
| |
| |
Net Assets | | $ | 65,844,128 | | | $ | 725,309,139 | | | |
| |
| |
| | | | | | | | | | | |
| |
| Sources of Net Assets |
| |
| Paid-in capital | | $ | 63,058,936 | | | $ | 724,952,348 | | | |
| Accumulated net realized loss | | | (3,528,345 | ) | | | (53,730,804 | ) | | |
| Accumulated undistributed (distributions in excess of) net investment income | | | (67,566 | ) | | | 68,168 | | | |
| Net unrealized appreciation | | | 6,381,103 | | | | 54,019,427 | | | |
| |
| |
Net Assets | | $ | 65,844,128 | | | $ | 725,309,139 | | | |
| |
| |
| | | | | | | | | | | |
| |
| Class A Shares |
| |
Net Assets | | $ | 48,353,644 | | | $ | 351,754,176 | | | |
Shares Outstanding | | | 4,710,172 | | | | 34,399,240 | | | |
Net Asset Value and Redemption Price Per Share | | | | | | | | | | |
(net assets ¸ shares of beneficial interest outstanding) | | $ | 10.27 | | | $ | 10.23 | | | |
Maximum Offering Price Per Share | | | | | | | | | | |
(100 ¸ 97.75 of net asset value per share) | | $ | 10.51 | | | $ | 10.47 | | | |
| |
| |
| | | | | | | | | | | |
| |
| Class B Shares |
| |
Net Assets | | $ | 597,915 | | | $ | 4,768,107 | | | |
Shares Outstanding | | | 58,211 | | | | 466,039 | | | |
Net Asset Value and Offering Price Per Share** | | | | | | | | | | |
(net assets ¸ shares of beneficial interest outstanding) | | $ | 10.27 | | | $ | 10.23 | | | |
| |
| |
| | | | | | | | | | | |
| |
| Class C Shares |
| |
Net Assets | | $ | 15,866,704 | | | $ | 138,971,458 | | | |
Shares Outstanding | | | 1,636,310 | | | | 14,487,982 | | | |
Net Asset Value and Offering Price Per Share** | | | | | | | | | | |
(net assets ¸ shares of beneficial interest outstanding) | | $ | 9.70 | | | $ | 9.59 | | | |
| |
| |
| | | | | | | | | | | |
| |
| Class I Shares |
| |
Net Assets | | $ | 1,025,865 | | | $ | 229,815,398 | | | |
Shares Outstanding | | | 99,852 | | | | 22,474,408 | | | |
Net Asset Value, Offering Price and Redemption Price Per Share | | | | | | | | | | |
(net assets ¸ shares of beneficial interest outstanding) | | $ | 10.27 | | | $ | 10.23 | | | |
| |
| |
On sales of $100,000 or more, the offering price of Class A shares is reduced.
| | |
| * | | Represents restricted cash on deposit at the broker for open financial futures contracts. |
| ** | | Redemption price per share is equal to the net asset value less any applicable contingent deferred sales charge. |
See Notes to Financial Statements.
22
Eaton Vance
Limited Maturity Municipal Income Funds
March 31, 2012
| | | | | | | | | | | |
| | | Year Ended March 31, 2012 | | |
| | | |
| | | AMT-Free
| | National
| | |
| Investment Income | | Limited Fund | | Limited Fund | | |
| |
| Interest | | $ | 2,789,048 | | | $ | 29,694,237 | | | |
| |
| |
Total investment income | | $ | 2,789,048 | | | $ | 29,694,237 | | | |
| |
| |
| | | | | | | | | | | |
| | | | | | | | | | | |
| |
| Expenses |
| |
| Investment adviser fee | | $ | 279,852 | | | $ | 2,902,800 | | | |
| Distribution and service fees | | | | | | | | | | |
| Class A | | | 74,190 | | | | 516,032 | | | |
| Class B | | | 6,650 | | | | 44,064 | | | |
| Class C | | | 133,584 | | | | 1,213,348 | | | |
| Trustees’ fees and expenses | | | 2,851 | | | | 25,525 | | | |
| Custodian fee | | | 43,594 | | | | 210,510 | | | |
| Transfer and dividend disbursing agent fees | | | 22,447 | | | | 251,186 | | | |
| Legal and accounting services | | | 37,392 | | | | 66,850 | | | |
| Printing and postage | | | 11,674 | | | | 38,554 | | | |
| Registration fees | | | 55,297 | | | | 76,113 | | | |
| Interest expense and fees | | | — | | | | 3,814 | | | |
| Miscellaneous | | | 29,545 | | | | 79,912 | | | |
| |
| |
Total expenses | | $ | 697,076 | | | $ | 5,428,708 | | | |
| |
| |
| Deduct — | | | | | | | | | | |
| Reduction of custodian fee | | $ | 203 | | | $ | 2,390 | | | |
| |
| |
Total expense reductions | | $ | 203 | | | $ | 2,390 | | | |
| |
| |
| | | | | | | | | | | |
Net expenses | | $ | 696,873 | | | $ | 5,426,318 | | | |
| |
| |
| | | | | | | | | | | |
Net investment income | | $ | 2,092,175 | | | $ | 24,267,919 | | | |
| |
| |
| | | | | | | | | | | |
| | | | | | | | | | | |
| |
| Realized and Unrealized Gain (Loss) |
| |
| Net realized gain (loss) — | | | | | | | | | | |
| Investment transactions | | $ | 567,625 | | | $ | 811,815 | | | |
| Financial futures contracts | | | (1,110,989 | ) | | | (10,581,687 | ) | | |
| |
| |
Net realized loss | | $ | (543,364 | ) | | $ | (9,769,872 | ) | | |
| |
| |
| Change in unrealized appreciation (depreciation) — | | | | | | | | | | |
| Investments | | $ | 3,915,350 | | | $ | 40,904,671 | | | |
| Financial futures contracts | | | 79,227 | | | | 520,197 | | | |
| |
| |
Net change in unrealized appreciation (depreciation) | | $ | 3,994,577 | | | $ | 41,424,868 | | | |
| |
| |
| | | | | | | | | | | |
Net realized and unrealized gain | | $ | 3,451,213 | | | $ | 31,654,996 | | | |
| |
| |
| | | | | | | | | | | |
Net increase in net assets from operations | | $ | 5,543,388 | | | $ | 55,922,915 | | | |
| |
| |
See Notes to Financial Statements.
23
Eaton Vance
Limited Maturity Municipal Income Funds
March 31, 2012
Statements of Changes in Net Assets
| | | | | | | | | | | |
| | | Year Ended March 31, 2012 | | |
| | | |
| | | AMT-Free
| | National
| | |
| Increase (Decrease) in Net Assets | | Limited Fund | | Limited Fund | | |
| |
| From operations — | | | | | | | | | | |
| Net investment income | | $ | 2,092,175 | | | $ | 24,267,919 | | | |
| Net realized loss from investment transactions and financial futures contracts | | | (543,364 | ) | | | (9,769,872 | ) | | |
| Net change in unrealized appreciation (depreciation) from investments and financial futures contracts | | | 3,994,577 | | | | 41,424,868 | | | |
| |
| |
Net increase in net assets from operations | | $ | 5,543,388 | | | $ | 55,922,915 | | | |
| |
| |
| Distributions to shareholders — | | | | | | | | | | |
| From net investment income | | | | | | | | | | |
| Class A | | $ | (1,640,661 | ) | | $ | (12,451,343 | ) | | |
| Class B | | | (18,984 | ) | | | (140,451 | ) | | |
| Class C | | | (380,004 | ) | | | (3,872,293 | ) | | |
| Class I | | | (20,924 | ) | | | (7,874,711 | ) | | |
| |
| |
Total distributions to shareholders | | $ | (2,060,573 | ) | | $ | (24,338,798 | ) | | |
| |
| |
| Transactions in shares of beneficial interest — | | | | | | | | | | |
| Proceeds from sale of shares | | | | | | | | | | |
| Class A | | $ | 8,472,929 | | | $ | 77,666,882 | | | |
| Class B | | | 209,955 | | | | 1,275,754 | | | |
| Class C | | | 3,730,763 | | | | 25,768,328 | | | |
| Class I | | | 1,161,270 | | | | 101,111,802 | | | |
| Net asset value of shares issued to shareholders in payment of distributions declared | | | | | | | | | | |
| Class A | | | 1,124,054 | | | | 9,304,200 | | | |
| Class B | | | 8,910 | | | | 96,637 | | | |
| Class C | | | 257,746 | | | | 2,318,441 | | | |
| Class I | | | 19,586 | | | | 977,800 | | | |
| Cost of shares redeemed | | | | | | | | | | |
| Class A | | | (14,631,348 | ) | | | (124,640,493 | ) | | |
| Class B | | | (384,437 | ) | | | (1,215,310 | ) | | |
| Class C | | | (2,368,845 | ) | | | (31,643,170 | ) | | |
| Class I | | | (253,350 | ) | | | (56,495,750 | ) | | |
| Issued in connection with tax-free reorganization (see Note 13) | | | | | | | | | | |
| Class A | | | — | | | | 33,127,013 | | | |
| Class B | | | — | | | | 469,668 | | | |
| Class C | | | — | | | | 3,188,414 | | | |
| Class I | | | — | | | | 998 | | | |
| Net asset value of shares exchanged | | | | | | | | | | |
| Class A | | | 45,000 | | | | 1,043,808 | | | |
| Class B | | | (45,000 | ) | | | (1,043,808 | ) | | |
| |
| |
Net increase (decrease) in net assets from Fund share transactions | | $ | (2,652,767 | ) | | $ | 41,311,214 | | | |
| |
| |
| | | | | | | | | | | |
Net increase in net assets | | $ | 830,048 | | | $ | 72,895,331 | | | |
| |
| |
| | | | | | | | | | | |
| | | | | | | | | | | |
| |
| Net Assets |
| |
| At beginning of year | | $ | 65,014,080 | | | $ | 652,413,808 | | | |
| |
| |
At end of year | | $ | 65,844,128 | | | $ | 725,309,139 | | | |
| |
| |
| | | | | | | | | | | |
| | | | | | | | | | | |
| |
Accumulated undistributed (distributions in excess of) net investment income
included in net assets |
| |
At end of year | | $ | (67,566 | ) | | $ | 68,168 | | | |
| |
| |
See Notes to Financial Statements.
24
Eaton Vance
Limited Maturity Municipal Income Funds
March 31, 2012
Statements of Changes in Net Assets — continued
| | | | | | | | | | | |
| | | Year Ended March 31, 2011 | | |
| | | |
| | | AMT-Free
| | National
| | |
| Increase (Decrease) in Net Assets | | Limited Fund | | Limited Fund | | |
| |
| From operations — | | | | | | | | | | |
| Net investment income | | $ | 2,380,363 | | | $ | 25,505,705 | | | |
| Net realized loss from investment transactions and financial futures contracts | | | (1,157,304 | ) | | | (9,853,784 | ) | | |
| Net change in unrealized appreciation (depreciation) from investments and financial futures contracts | | | (531,083 | ) | | | (10,440,356 | ) | | |
| |
| |
Net increase in net assets from operations | | $ | 691,976 | | | $ | 5,211,565 | | | |
| |
| |
| Distributions to shareholders — | | | | | | | | | | |
| From net investment income | | | | | | | | | | |
| Class A | | $ | (1,928,228 | ) | | $ | (14,953,044 | ) | | |
| Class B | | | (22,666 | ) | | | (177,742 | ) | | |
| Class C | | | (400,583 | ) | | | (4,451,696 | ) | | |
| Class I | | | (6,441 | ) | | | (5,786,868 | ) | | |
| |
| |
Total distributions to shareholders | | $ | (2,357,918 | ) | | $ | (25,369,350 | ) | | |
| |
| |
| Transactions in shares of beneficial interest — | | | | | | | | | | |
| Proceeds from sale of shares | | | | | | | | | | |
| Class A | | $ | 18,708,695 | | | $ | 113,152,603 | | | |
| Class B | | | 379,475 | | | | 2,202,456 | | | |
| Class C | | | 5,502,383 | | | | 35,755,460 | | | |
| Class I | | | 737,961 | | | | 139,193,941 | | | |
| Net asset value of shares issued to shareholders in payment of distributions declared | | | | | | | | | | |
| Class A | | | 1,146,754 | | | | 10,610,691 | | | |
| Class B | | | 10,860 | | | | 101,375 | | | |
| Class C | | | 233,578 | | | | 2,396,989 | | | |
| Class I | | | 5,463 | | | | 529,933 | | | |
| Cost of shares redeemed | | | | | | | | | | |
| Class A | | | (24,617,565 | ) | | | (207,387,017 | ) | | |
| Class B | | | (246,507 | ) | | | (1,785,343 | ) | | |
| Class C | | | (6,457,636 | ) | | | (47,199,734 | ) | | |
| Class I | | | (632,701 | ) | | | (57,535,716 | ) | | |
| Issued in connection with tax-free reorganization (see Note 13) | | | | | | | | | | |
| Class A | | | — | | | | 21,691,369 | | | |
| Class B | | | — | | | | 232,109 | | | |
| Class C | | | — | | | | 2,312,480 | | | |
| Net asset value of shares exchanged | | | | | | | | | | |
| Class A | | | 254,982 | | | | 1,796,600 | | | |
| Class B | | | (254,982 | ) | | | (1,796,600 | ) | | |
| |
| |
Net increase (decrease) in net assets from Fund share transactions | | $ | (5,229,240 | ) | | $ | 14,271,596 | | | |
| |
| |
| | | | | | | | | | | |
Net decrease in net assets | | $ | (6,895,182 | ) | | $ | (5,886,189 | ) | | |
| |
| |
| | | | | | | | | | | |
| | | | | | | | | | | |
| |
| Net Assets |
| |
| At beginning of year | | $ | 71,909,262 | | | $ | 658,299,997 | | | |
| |
| |
At end of year | | $ | 65,014,080 | | | $ | 652,413,808 | | | |
| |
| |
| | | | | | | | | | | |
| | | | | | | | | | | |
| |
Accumulated undistributed (distributions in excess of) net investment income
included in net assets |
| |
At end of year | | $ | (67,565 | ) | | $ | 35,109 | | | |
| |
| |
See Notes to Financial Statements.
25
Eaton Vance
Limited Maturity Municipal Income Funds
March 31, 2012
| | | | | | | | | | | | | | | | | | | | | | | |
| | | AMT-Free Limited Fund — Class A |
| | | |
| | | Year Ended March 31, | | |
| | | |
| | | 2012 | | 2011 | | 2010 | | 2009 | | 2008 | | |
| |
| Net asset value — Beginning of year | | $ | 9.730 | | | $ | 9.940 | | | $ | 9.470 | | | $ | 9.890 | | | $ | 10.280 | | | |
| |
| |
| | | | | | | | | | | | | | | | | | | | | | | |
| | | | | | | | | | | | | | | | | | | | | | | |
| |
| Income (Loss) From Operations |
| |
Net investment income(1) | | $ | 0.341 | | | $ | 0.342 | | | $ | 0.343 | | | $ | 0.343 | | | $ | 0.388 | | | |
| Net realized and unrealized gain (loss) | | | 0.535 | | | | (0.213 | ) | | | 0.462 | | | | (0.377 | ) | | | (0.382 | ) | | |
| |
| |
Total income (loss) from operations | | $ | 0.876 | | | $ | 0.129 | | | $ | 0.805 | | | $ | (0.034 | ) | | $ | 0.006 | | | |
| |
| |
| | | | | | | | | | | | | | | | | | | | | | | |
| | | | | | | | | | | | | | | | | | | | | | | |
| |
| Less Distributions |
| |
| From net investment income | | $ | (0.336) | | | $ | (0.339 | ) | | $ | (0.335 | ) | | $ | (0.386 | ) | | $ | (0.396 | ) | | |
| |
| |
Total distributions | | $ | (0.336) | | | $ | (0.339 | ) | | $ | (0.335 | ) | | $ | (0.386 | ) | | $ | (0.396 | ) | | |
| |
| |
| | | | | | | | | | | | | | | | | | | | | | | |
Net asset value — End of year | | $ | 10.270 | | | $ | 9.730 | | | $ | 9.940 | | | $ | 9.470 | | | $ | 9.890 | | | |
| |
| |
| | | | | | | | | | | | | | | | | | | | | | | |
Total Return(2) | | | 9.13 | % | | | 1.25 | % | | | 8.58 | % | | | (0.33 | )% | | | 0.05 | % | | |
| |
| |
| | | | | | | | | | | | | | | | | | | | | | | |
| | | | | | | | | | | | | | | | | | | | | | | |
| |
| Ratios/Supplemental Data |
| |
| Net assets, end of year (000’s omitted) | | $ | 48,354 | | | $ | 50,692 | | | $ | 56,413 | | | $ | 49,188 | | | $ | 29,297 | | | |
| Ratios (as a percentage of average daily net assets): | | | | | | | | | | | | | | | | | | | | | | |
| Expenses before custodian fee reduction | | | 0.89 | % | | | 0.87 | % | | | 0.91 | % | | | 0.98 | % | | | 0.92 | % | | |
| Expenses after custodian fee reduction | | | 0.89 | % | | | 0.87 | % | | | 0.91 | % | | | 0.95 | % | | | 0.90 | % | | |
| Net investment income | | | 3.37 | % | | | 3.41 | % | | | 3.47 | % | | | 3.58 | % | | | 3.83 | % | | |
| Portfolio Turnover | | | 12 | % | | | 11 | % | | | 34 | % | | | 78 | % | | | 36 | % | | |
| |
| |
| | |
| (1) | | Computed using average shares outstanding. |
| (2) | | Returns are historical and are calculated by determining the percentage change in net asset value with all distributions reinvested and do not reflect the effect of sales charges. |
See Notes to Financial Statements.
26
Eaton Vance
Limited Maturity Municipal Income Funds
March 31, 2012
Financial Highlights — continued
| | | | | | | | | | | | | | | | | | | | | | | |
| | | AMT-Free Limited Fund — Class B |
| | | |
| | | Year Ended March 31, | | |
| | | |
| | | 2012 | | 2011 | | 2010 | | 2009 | | 2008 | | |
| |
| Net asset value — Beginning of year | | $ | 9.730 | | | $ | 9.950 | | | $ | 9.480 | | | $ | 9.890 | | | $ | 10.280 | | | |
| |
| |
| | | | | | | | | | | | | | | | | | | | | | | |
| | | | | | | | | | | | | | | | | | | | | | | |
| |
| Income (Loss) From Operations |
| |
Net investment income(1) | | $ | 0.265 | | | $ | 0.267 | | | $ | 0.269 | | | $ | 0.272 | | | $ | 0.314 | | | |
| Net realized and unrealized gain (loss) | | | 0.535 | | | | (0.223 | ) | | | 0.464 | | | | (0.371 | ) | | | (0.385 | ) | | |
| |
| |
Total income (loss) from operations | | $ | 0.800 | | | $ | 0.044 | | | $ | 0.733 | | | $ | (0.099 | ) | | $ | (0.071 | ) | | |
| |
| |
| | | | | | | | | | | | | | | | | | | | | | | |
| | | | | | | | | | | | | | | | | | | | | | | |
| |
| Less Distributions |
| |
| From net investment income | | $ | (0.260) | | | $ | (0.264 | ) | | $ | (0.263 | ) | | $ | (0.311 | ) | | $ | (0.319 | ) | | |
| |
| |
Total distributions | | $ | (0.260) | | | $ | (0.264 | ) | | $ | (0.263 | ) | | $ | (0.311 | ) | | $ | (0.319 | ) | | |
| |
| |
| | | | | | | | | | | | | | | | | | | | | | | |
Net asset value — End of year | | $ | 10.270 | | | $ | 9.730 | | | $ | 9.950 | | | $ | 9.480 | | | $ | 9.890 | | | |
| |
| |
| | | | | | | | | | | | | | | | | | | | | | | |
Total Return(2) | | | 8.32 | % | | | 0.39 | % | | | 7.90 | % | | | (1.10 | )% | | | (0.71 | )% | | |
| |
| |
| | | | | | | | | | | | | | | | | | | | | | | |
| | | | | | | | | | | | | | | | | | | | | | | |
| |
| Ratios/Supplemental Data |
| |
| Net assets, end of year (000’s omitted) | | $ | 598 | | | $ | 768 | | | $ | 898 | | | $ | 962 | | | $ | 1,256 | | | |
| Ratios (as a percentage of average daily net assets): | | | | | | | | | | | | | | | | | | | | | | |
| Expenses before custodian fee reduction | | | 1.63 | % | | | 1.61 | % | | | 1.66 | % | | | 1.73 | % | | | 1.67 | % | | |
| Expenses after custodian fee reduction | | | 1.63 | % | | | 1.61 | % | | | 1.66 | % | | | 1.71 | % | | | 1.65 | % | | |
| Net investment income | | | 2.62 | % | | | 2.67 | % | | | 2.72 | % | | | 2.82 | % | | | 3.09 | % | | |
| Portfolio Turnover | | | 12 | % | | | 11 | % | | | 34 | % | | | 78 | % | | | 36 | % | | |
| |
| |
| | |
| (1) | | Computed using average shares outstanding. |
| (2) | | Returns are historical and are calculated by determining the percentage change in net asset value with all distributions reinvested and do not reflect the effect of sales charges. |
See Notes to Financial Statements.
27
Eaton Vance
Limited Maturity Municipal Income Funds
March 31, 2012
Financial Highlights — continued
| | | | | | | | | | | | | | | | | | | | | | | |
| | | AMT-Free Limited Fund — Class C |
| | | |
| | | Year Ended March 31, | | |
| | | |
| | | 2012 | | 2011 | | 2010 | | 2009 | | 2008 | | |
| |
| Net asset value — Beginning of year | | $ | 9.190 | | | $ | 9.390 | | | $ | 8.950 | | | $ | 9.340 | | | $ | 9.700 | | | |
| |
| |
| | | | | | | | | | | | | | | | | | | | | | | |
| | | | | | | | | | | | | | | | | | | | | | | |
| |
| Income (Loss) From Operations |
| |
Net investment income(1) | | $ | 0.249 | | | $ | 0.252 | | | $ | 0.253 | | | $ | 0.256 | | | $ | 0.295 | | | |
| Net realized and unrealized gain (loss) | | | 0.507 | | | | (0.203 | ) | | | 0.435 | | | | (0.352 | ) | | | (0.354 | ) | | |
| |
| |
Total income (loss) from operations | | $ | 0.756 | | | $ | 0.049 | | | $ | 0.688 | | | $ | (0.096 | ) | | $ | (0.059 | ) | | |
| |
| |
| | | | | | | | | | | | | | | | | | | | | | | |
| | | | | | | | | | | | | | | | | | | | | | | |
| |
| Less Distributions |
| |
| From net investment income | | $ | (0.246) | | | $ | (0.249 | ) | | $ | (0.248 | ) | | $ | (0.294 | ) | | $ | (0.301 | ) | | |
| |
| |
Total distributions | | $ | (0.246) | | | $ | (0.249 | ) | | $ | (0.248 | ) | | $ | (0.294 | ) | | $ | (0.301 | ) | | |
| |
| |
| | | | | | | | | | | | | | | | | | | | | | | |
Net asset value — End of year | | $ | 9.700 | | | $ | 9.190 | | | $ | 9.390 | | | $ | 8.950 | | | $ | 9.340 | | | |
| |
| |
| | | | | | | | | | | | | | | | | | | | | | | |
Total Return(2) | | | 8.32 | % | | | 0.47 | % | | | 7.74 | % | | | (1.02 | )% | | | (0.63 | )% | | |
| |
| |
| | | | | | | | | | | | | | | | | | | | | | | |
| | | | | | | | | | | | | | | | | | | | | | | |
| |
| Ratios/Supplemental Data |
| |
| Net assets, end of year (000’s omitted) | | $ | 15,867 | | | $ | 13,477 | | | $ | 14,598 | | | $ | 10,743 | | | $ | 8,522 | | | |
| Ratios (as a percentage of average daily net assets): | | | | | | | | | | | | | | | | | | | | | | |
| Expenses before custodian fee reduction | | | 1.63 | % | | | 1.62 | % | | | 1.66 | % | | | 1.74 | % | | | 1.67 | % | | |
| Expenses after custodian fee reduction | | | 1.63 | % | | | 1.62 | % | | | 1.66 | % | | | 1.71 | % | | | 1.65 | % | | |
| Net investment income | | | 2.61 | % | | | 2.67 | % | | | 2.71 | % | | | 2.82 | % | | | 3.08 | % | | |
| Portfolio Turnover | | | 12 | % | | | 11 | % | | | 34 | % | | | 78 | % | | | 36 | % | | |
| |
| |
| | |
| (1) | | Computed using average shares outstanding. |
| (2) | | Returns are historical and are calculated by determining the percentage change in net asset value with all distributions reinvested and do not reflect the effect of sales charges. |
See Notes to Financial Statements.
28
Eaton Vance
Limited Maturity Municipal Income Funds
March 31, 2012
Financial Highlights — continued
| | | | | | | | | | | |
| | | AMT-Free Limited Fund — Class I | | |
| | | |
| | | Year Ended
| | Period Ended
| | |
| | | March 31, 2012 | | March 31, 2011(1) | | |
| |
| Net asset value — Beginning of period | | $ | 9.730 | | | $ | 10.160 | | | |
| |
| |
| | | | | | | | | | | |
| | | | | | | | | | | |
| |
| Income (Loss) From Operations |
| |
| Net investment income | | $ | 0.351 | (2) | | $ | 0.235 | | | |
| Net realized and unrealized gain (loss) | | | 0.540 | | | | (0.430 | ) | | |
| |
| |
Total income (loss) from operations | | $ | 0.891 | | | $ | (0.195 | ) | | |
| |
| |
| | | | | | | | | | | |
| | | | | | | | | | | |
| |
| Less Distributions |
| |
| From net investment income | | $ | (0.351 | ) | | $ | (0.235 | ) | | |
| |
| |
Total distributions | | $ | (0.351 | ) | | $ | (0.235 | ) | | |
| |
| |
| | | | | | | | | | | |
Net asset value — End of period | | $ | 10.270 | | | $ | 9.730 | | | |
| |
| |
| | | | | | | | | | | |
Total Return(3) | | | 9.29 | % | | | (2.11 | )%(4) | | |
| |
| |
| | | | | | | | | | | |
| | | | | | | | | | | |
| |
| Ratios/Supplemental Data |
| |
| Net assets, end of period (000’s omitted) | | $ | 1,026 | | | $ | 78 | | | |
| Ratios (as a percentage of average daily net assets): | | | | | | | | | | |
Expenses(5) | | | 0.73 | % | | | 0.72 | %(6) | | |
| Net investment income | | | 3.44 | % | | | 3.76 | %(6) | | |
| Portfolio Turnover | | | 12 | % | | | 11 | %(7) | | |
| |
| |
| | |
| (1) | | For the period from the commencement of operations on August 3, 2010 to March 31, 2011. |
| (2) | | Computed using average shares outstanding. |
| (3) | | Returns are historical and are calculated by determining the percentage change in net asset value with all distributions reinvested. |
| (4) | | Not annualized. |
| (5) | | Excludes the effect of custody fee credits, if any, of less than 0.005%. |
| (6) | | Annualized. |
| (7) | | For the Fund’s year ended March 31, 2011. |
See Notes to Financial Statements.
29
Eaton Vance
Limited Maturity Municipal Income Funds
March 31, 2012
Financial Highlights — continued
| | | | | | | | | | | | | | | | | | | | | | | |
| | | National Limited Fund — Class A |
| | | |
| | | Year Ended March 31, | | |
| | | |
| | | 2012 | | 2011 | | 2010 | | 2009 | | 2008 | | |
| |
| Net asset value — Beginning of year | | $ | 9.750 | | | $ | 10.010 | | | $ | 9.200 | | | $ | 9.930 | | | $ | 10.420 | | | |
| |
| |
| | | | | | | | | | | | | | | | | | | | | | | |
| | | | | | | | | | | | | | | | | | | | | | | |
| |
| Income (Loss) From Operations |
| |
Net investment income(1) | | $ | 0.364 | | | $ | 0.382 | | | $ | 0.398 | | | $ | 0.394 | | | $ | 0.392 | | | |
| Net realized and unrealized gain (loss) | | | 0.482 | | | | (0.263 | ) | | | 0.804 | | | | (0.733 | ) | | | (0.488 | ) | | |
| |
| |
Total income (loss) from operations | | $ | 0.846 | | | $ | 0.119 | | | $ | 1.202 | | | $ | (0.339 | ) | | $ | (0.096 | ) | | |
| |
| |
| | | | | | | | | | | | | | | | | | | | | | | |
| | | | | | | | | | | | | | | | | | | | | | | |
| |
| Less Distributions |
| |
| From net investment income | | $ | (0.366) | | | $ | (0.379 | ) | | $ | (0.392 | ) | | $ | (0.391 | ) | | $ | (0.394 | ) | | |
| |
| |
Total distributions | | $ | (0.366) | | | $ | (0.379 | ) | | $ | (0.392 | ) | | $ | (0.391 | ) | | $ | (0.394 | ) | | |
| |
| |
| | | | | | | | | | | | | | | | | | | | | | | |
Net asset value — End of year | | $ | 10.230 | | | $ | 9.750 | | | $ | 10.010 | | | $ | 9.200 | | | $ | 9.930 | | | |
| |
| |
| | | | | | | | | | | | | | | | | | | | | | | |
Total Return(2) | | | 8.69 | % | | | 1.17 | % | | | 13.22 | % | | | (3.50 | )% | | | (0.94 | )% | | |
| |
| |
| | | | | | | | | | | | | | | | | | | | | | | |
| | | | | | | | | | | | | | | | | | | | | | | |
| |
| Ratios/Supplemental Data |
| |
| Net assets, end of year (000’s omitted) | | $ | 351,754 | | | $ | 339,380 | | | $ | 410,009 | | | $ | 500,869 | | | $ | 541,176 | | | |
| Ratios (as a percentage of average daily net assets): | | | | | | | | | | | | | | | | | | | | | | |
| Expenses excluding interest and fees | | | 0.68 | % | | | 0.69 | % | | | 0.71 | % | | | 0.72 | % | | | 0.71 | % | | |
Interest and fee expense(3) | | | 0.00 | %(4) | | | 0.01 | % | | | 0.01 | % | | | 0.02 | % | | | 0.05 | % | | |
| Total expenses before custodian fee reduction | | | 0.68 | % | | | 0.70 | % | | | 0.72 | % | | | 0.74 | % | | | 0.76 | % | | |
| Expenses after custodian fee reduction excluding interest and fees | | | 0.68 | % | | | 0.69 | % | | | 0.71 | % | | | 0.71 | % | | | 0.70 | % | | |
| Net investment income | | | 3.61 | % | | | 3.82 | % | | | 4.05 | % | | | 4.12 | % | | | 3.84 | % | | |
| Portfolio Turnover | | | 16 | % | | | 21 | % | | | 14 | % | | | 33 | % | | | 39 | % | | |
| |
| |
| | |
| (1) | | Computed using average shares outstanding. |
| (2) | | Returns are historical and are calculated by determining the percentage change in net asset value with all distributions reinvested and do not reflect the effect of sales charges. |
| (3) | | Interest and fee expense relates to the liability for floating rate notes issued in conjunction with residual interest bond transactions (see Note 1I). |
| (4) | | Amount is less than 0.005%. |
See Notes to Financial Statements.
30
Eaton Vance
Limited Maturity Municipal Income Funds
March 31, 2012
Financial Highlights — continued
| | | | | | | | | | | | | | | | | | | | | | | |
| | | National Limited Fund — Class B |
| | | |
| | | Year Ended March 31, | | |
| | | |
| | | 2012 | | 2011 | | 2010 | | 2009 | | 2008 | | |
| |
| Net asset value — Beginning of year | | $ | 9.760 | | | $ | 10.020 | | | $ | 9.200 | | | $ | 9.940 | | | $ | 10.420 | | | |
| |
| |
| | | | | | | | | | | | | | | | | | | | | | | |
| | | | | | | | | | | | | | | | | | | | | | | |
| |
| Income (Loss) From Operations |
| |
Net investment income(1) | | $ | 0.289 | | | $ | 0.307 | | | $ | 0.324 | | | $ | 0.322 | | | $ | 0.318 | | | |
| Net realized and unrealized gain (loss) | | | 0.471 | | | | (0.263 | ) | | | 0.815 | | | | (0.745 | ) | | | (0.482 | ) | | |
| |
| |
Total income (loss) from operations | | $ | 0.760 | | | $ | 0.044 | | | $ | 1.139 | | | $ | (0.423 | ) | | $ | (0.164 | ) | | |
| |
| |
| | | | | | | | | | | | | | | | | | | | | | | |
| | | | | | | | | | | | | | | | | | | | | | | |
| |
| Less Distributions |
| |
| From net investment income | | $ | (0.290) | | | $ | (0.304 | ) | | $ | (0.319 | ) | | $ | (0.317 | ) | | $ | (0.316 | ) | | |
| |
| |
Total distributions | | $ | (0.290) | | | $ | (0.304 | ) | | $ | (0.319 | ) | | $ | (0.317 | ) | | $ | (0.316 | ) | | |
| |
| |
| | | | | | | | | | | | | | | | | | | | | | | |
Net asset value — End of year | | $ | 10.230 | | | $ | 9.760 | | | $ | 10.020 | | | $ | 9.200 | | | $ | 9.940 | | | |
| |
| |
| | | | | | | | | | | | | | | | | | | | | | | |
Total Return(2) | | | 7.88 | % | | | 0.42 | % | | | 12.50 | % | | | (4.34 | )% | | | (1.59 | )% | | |
| |
| |
| | | | | | | | | | | | | | | | | | | | | | | |
| | | | | | | | | | | | | | | | | | | | | | | |
| |
| Ratios/Supplemental Data |
| |
| Net assets, end of year (000’s omitted) | | $ | 4,768 | | | $ | 4,955 | | | $ | 6,157 | | | $ | 6,130 | | | $ | 6,512 | | | |
| Ratios (as a percentage of average daily net assets): | | | | | | | | | | | | | | | | | | | | | | |
| Expenses excluding interest and fees | | | 1.43 | % | | | 1.44 | % | | | 1.46 | % | | | 1.47 | % | | | 1.46 | % | | |
Interest and fee expense(3) | | | 0.00 | %(4) | | | 0.01 | % | | | 0.01 | % | | | 0.02 | % | | | 0.05 | % | | |
| Total expenses before custodian fee reduction | | | 1.43 | % | | | 1.45 | % | | | 1.47 | % | | | 1.49 | % | | | 1.51 | % | | |
| Expenses after custodian fee reduction excluding interest and fees | | | 1.43 | % | | | 1.44 | % | | | 1.46 | % | | | 1.46 | % | | | 1.45 | % | | |
| Net investment income | | | 2.86 | % | | | 3.06 | % | | | 3.29 | % | | | 3.37 | % | | | 3.11 | % | | |
| Portfolio Turnover | | | 16 | % | | | 21 | % | | | 14 | % | | | 33 | % | | | 39 | % | | |
| |
| |
| | |
| (1) | | Computed using average shares outstanding. |
| (2) | | Returns are historical and are calculated by determining the percentage change in net asset value with all distributions reinvested and do not reflect the effect of sales charges. |
| (3) | | Interest and fee expense relates to the liability for floating rate notes issued in conjunction with residual interest bond transactions (see Note 1I). |
| (4) | | Amount is less than 0.005%. |
See Notes to Financial Statements.
31
Eaton Vance
Limited Maturity Municipal Income Funds
March 31, 2012
Financial Highlights — continued
| | | | | | | | | | | | | | | | | | | | | | | |
| | | National Limited Fund — Class C |
| | | |
| | | Year Ended March 31, | | |
| | | |
| | | 2012 | | 2011 | | 2010 | | 2009 | | 2008 | | |
| |
| Net asset value — Beginning of year | | $ | 9.150 | | | $ | 9.390 | | | $ | 8.630 | | | $ | 9.310 | | | $ | 9.770 | | | |
| |
| |
| | | | | | | | | | | | | | | | | | | | | | | |
| | | | | | | | | | | | | | | | | | | | | | | |
| |
| Income (Loss) From Operations |
| |
Net investment income(1) | | $ | 0.271 | | | $ | 0.287 | | | $ | 0.303 | | | $ | 0.302 | | | $ | 0.297 | | | |
| Net realized and unrealized gain (loss) | | | 0.441 | | | | (0.242 | ) | | | 0.756 | | | | (0.685 | ) | | | (0.461 | ) | | |
| |
| |
Total income (loss) from operations | | $ | 0.712 | | | $ | 0.045 | | | $ | 1.059 | | | $ | (0.383 | ) | | $ | (0.164 | ) | | |
| |
| |
| | | | | | | | | | | | | | | | | | | | | | | |
| | | | | | | | | | | | | | | | | | | | | | | |
| |
| Less Distributions |
| |
| From net investment income | | $ | (0.272) | | | $ | (0.285 | ) | | $ | (0.299 | ) | | $ | (0.297 | ) | | $ | (0.296 | ) | | |
| |
| |
Total distributions | | $ | (0.272) | | | $ | (0.285 | ) | | $ | (0.299 | ) | | $ | (0.297 | ) | | $ | (0.296 | ) | | |
| |
| |
| | | | | | | | | | | | | | | | | | | | | | | |
Net asset value — End of year | | $ | 9.590 | | | $ | 9.150 | | | $ | 9.390 | | | $ | 8.630 | | | $ | 9.310 | | | |
| |
| |
| | | | | | | | | | | | | | | | | | | | | | | |
Total Return(2) | | | 7.87 | % | | | 0.46 | % | | | 12.39 | % | | | (4.20 | )% | | | (1.70 | )% | | |
| |
| |
| | | | | | | | | | | | | | | | | | | | | | | |
| | | | | | | | | | | | | | | | | | | | | | | |
| |
| Ratios/Supplemental Data |
| |
| Net assets, end of year (000’s omitted) | | $ | 138,971 | | | $ | 133,071 | | | $ | 143,883 | | | $ | 104,893 | | | $ | 100,866 | | | |
| Ratios (as a percentage of average daily net assets): | | | | | | | | | | | | | | | | | | | | | | |
| Expenses excluding interest and fees | | | 1.43 | % | | | 1.44 | % | | | 1.46 | % | | | 1.47 | % | | | 1.46 | % | | |
Interest and fee expense(3) | | | 0.00 | %(4) | | | 0.01 | % | | | 0.01 | % | | | 0.02 | % | | | 0.05 | % | | |
| Total expenses before custodian fee reduction | | | 1.43 | % | | | 1.45 | % | | | 1.47 | % | | | 1.49 | % | | | 1.51 | % | | |
| Expenses after custodian fee reduction excluding interest and fees | | | 1.43 | % | | | 1.44 | % | | | 1.46 | % | | | 1.46 | % | | | 1.45 | % | | |
| Net investment income | | | 2.86 | % | | | 3.06 | % | | | 3.28 | % | | | 3.38 | % | | | 3.10 | % | | |
| Portfolio Turnover | | | 16 | % | | | 21 | % | | | 14 | % | | | 33 | % | | | 39 | % | | |
| |
| |
| | |
| (1) | | Computed using average shares outstanding. |
| (2) | | Returns are historical and are calculated by determining the percentage change in net asset value with all distributions reinvested and do not reflect the effect of sales charges. |
| (3) | | Interest and fee expense relates to the liability for floating rate notes issued in conjunction with residual interest bond transactions (see Note 1I). |
| (4) | | Amount is less than 0.005%. |
See Notes to Financial Statements.
32
Eaton Vance
Limited Maturity Municipal Income Funds
March 31, 2012
Financial Highlights — continued
| | | | | | | | | | | | | | | |
| | | National Limited Fund — Class I |
| | | |
| | | Year Ended March 31, |
| | | |
| | | 2012 | | 2011 | | 2010(1) | | |
| |
| Net asset value — Beginning of period | | $ | 9.760 | | | $ | 10.010 | | | $ | 10.180 | | | |
| |
| |
| | | | | | | | | | | | | | | |
| | | | | | | | | | | | | | | |
| |
| Income (Loss) From Operations |
| |
Net investment income(2) | | $ | 0.378 | | | $ | 0.395 | | | $ | 0.206 | | | |
| Net realized and unrealized gain (loss) | | | 0.473 | | | | (0.251 | ) | | | (0.190 | ) | | |
| |
| |
Total income from operations | | $ | 0.851 | | | $ | 0.144 | | | $ | 0.016 | | | |
| |
| |
| | | | | | | | | | | | | | | |
| | | | | | | | | | | | | | | |
| |
| Less Distributions |
| |
| From net investment income | | $ | (0.381 | ) | | $ | (0.394 | ) | | $ | (0.186 | ) | | |
| |
| |
Total distributions | | $ | (0.381 | ) | | $ | (0.394 | ) | | $ | (0.186 | ) | | |
| |
| |
| | | | | | | | | | | | | | | |
Net asset value — End of period | | $ | 10.230 | | | $ | 9.760 | | | $ | 10.010 | | | |
| |
| |
| | | | | | | | | | | | | | | |
Total Return(3) | | | 8.74 | % | | | 1.43 | % | | | 0.17 | %(4) | | |
| |
| |
| | | | | | | | | | | | | | | |
| | | | | | | | | | | | | | | |
| |
| Ratios/Supplemental Data |
| |
| Net assets, end of period (000’s omitted) | | $ | 229,815 | | | $ | 175,007 | | | $ | 98,250 | | | |
| Ratios (as a percentage of average daily net assets): | | | | | | | | | | | | | | |
| Expenses excluding interest and fees | | | 0.53 | % | | | 0.54 | % | | | 0.58 | %(5) | | |
Interest and fee expense(6) | | | 0.00 | %(7) | | | 0.01 | % | | | 0.01 | %(5) | | |
| Total expense before custodian fee reduction | | | 0.53 | % | | | 0.55 | % | | | 0.59 | %(5) | | |
| Expenses after custodian fee reduction excluding interest and fees | | | 0.53 | % | | | 0.54 | % | | | 0.58 | %(5) | | |
| Net investment income | | | 3.75 | % | | | 3.95 | % | | | 4.11 | %(5) | | |
| Portfolio Turnover | | | 16 | % | | | 21 | % | | | 14 | %(8) | | |
| |
| |
| | |
| (1) | | For the period from the commencement of operations on October 1, 2009 to March 31, 2010. |
| (2) | | Computed using average shares outstanding. |
| (3) | | Returns are historical and are calculated by determining the percentage change in net asset value with all distributions reinvested. |
| (4) | | Not annualized. |
| (5) | | Annualized. |
| (6) | | Interest and fee expense relates to the liability for floating rate notes issued in conjunction with residual interest bond transactions (see Note 1I). |
| (7) | | Amount is less than 0.005%. |
| (8) | | For the Fund’s year ended March 31, 2010. |
See Notes to Financial Statements.
33
Eaton Vance
Limited Maturity Municipal Income Funds
March 31, 2012
Notes to Financial Statements
1 Significant Accounting Policies
Eaton Vance Investment Trust (the Trust) is a Massachusetts business trust registered under the Investment Company Act of 1940, as amended (the 1940 Act), as an open-end management investment company. The Trust presently consists of five funds, two of which, each diversified, are included in these financial statements. They include Eaton Vance AMT-Free Limited Maturity Municipal Income Fund (AMT-Free Limited Fund) and Eaton Vance National Limited Maturity Municipal Income Fund (National Limited Fund), (each individually referred to as the Fund, and collectively, the Funds). The Funds’ current investment objective is to provide a high level of current income exempt from regular federal income tax and limited principal fluctuation. The Funds offer four classes of shares. Class A shares are generally sold subject to a sales charge imposed at time of purchase. Class B and Class C shares are sold at net asset value and are generally subject to a contingent deferred sales charge (see Note 5). Class I shares are sold at net asset value and are not subject to a sales charge. Class B shares of each Fund held for the longer of (i) four years or (ii) the time at which the contingent deferred sales charge applicable to such shares expires will automatically convert to Class A shares as described in each Fund’s prospectus. Beginning January 1, 2012, Class B shares are only available for purchase upon exchange from another Eaton Vance fund or through reinvestment of distributions. Each class represents a pro-rata interest in the Fund, but votes separately on class-specific matters and (as noted below) is subject to different expenses. Realized and unrealized gains and losses are allocated daily to each class of shares based on the relative net assets of each class to the total net assets of the Fund. Net investment income, other than class-specific expenses, is allocated daily to each class of shares based upon the ratio of the value of each class’s paid shares to the total value of all paid shares. Each class of shares differs in its distribution plan and certain other class-specific expenses.
The following is a summary of significant accounting policies of the Funds. The policies are in conformity with accounting principles generally accepted in the United States of America.
A Investment Valuation — Debt obligations (including short-term obligations with a remaining maturity of more than sixty days) are generally valued on the basis of valuations provided by third party pricing services, as derived from such services’ pricing models. Inputs to the models may include, but are not limited to, reported trades, executable bid and asked prices, broker/dealer quotations, prices or yields of securities with similar characteristics, benchmark curves or information pertaining to the issuer, as well as industry and economic events. The pricing services may use a matrix approach, which considers information regarding securities with similar characteristics to determine the valuation for a security. Short-term obligations purchased with a remaining maturity of sixty days or less are generally valued at amortized cost, which approximates market value. Financial futures contracts are valued at the closing settlement price established by the board of trade or exchange on which they are traded. Investments for which valuations or market quotations are not readily available or are deemed unreliable are valued at fair value using methods determined in good faith by or at the direction of the Trustees of a Fund in a manner that fairly reflects the security’s value, or the amount that the Fund might reasonably expect to receive for the security upon its current sale in the ordinary course. Each such determination is based on a consideration of relevant factors, which are likely to vary from one pricing context to another. These factors may include, but are not limited to, the type of security, the existence of any contractual restrictions on the security’s disposition, the price and extent of public trading in similar securities of the issuer or of comparable entities, quotations or relevant information obtained from broker/dealers or other market participants, information obtained from the issuer, analysts, and/or the appropriate stock exchange (for exchange-traded securities), an analysis of the entity’s financial condition, and an evaluation of the forces that influence the issuer and the market(s) in which the security is purchased and sold.
B Investment Transactions and Related Income — Investment transactions for financial statement purposes are accounted for on a trade date basis. Realized gains and losses on investments sold are determined on the basis of identified cost. Interest income is recorded on the basis of interest accrued, adjusted for amortization of premium or accretion of discount.
C Federal Taxes — Each Fund’s policy is to comply with the provisions of the Internal Revenue Code applicable to regulated investment companies and to distribute to shareholders each year substantially all of its taxable, if any, and tax-exempt net investment income, and all or substantially all of its net realized capital gains. Accordingly, no provision for federal income or excise tax is necessary. Each Fund intends to satisfy conditions which will enable it to designate distributions from the interest income generated by its investments in municipal obligations, which are exempt from regular federal income tax when received by each Fund, as exempt-interest dividends. For National Limited Fund, the portion of such interest, if any, earned on private activity bonds issued after August 7, 1986, may be considered a tax preference item to shareholders.
At March 31, 2012, the AMT-Free Limited Fund and National Limited Fund, for federal income tax purposes, had capital loss carryforwards of $2,853,871 and $40,952,773, respectively, and current year deferred capital losses of $688,674 and $12,647,796, respectively, which will reduce the respective Fund’s taxable income arising from future net realized gains on investment transactions, if any, to the extent permitted by the Internal Revenue Code, and thus will reduce the amount of distributions to shareholders, which would otherwise be necessary to relieve the Funds of any liability for federal income or
34
Eaton Vance
Limited Maturity Municipal Income Funds
March 31, 2012
Notes to Financial Statements — continued
excise tax. The current year deferred capital losses are treated as arising on the first day of the Funds’ next taxable year and are treated as realized prior to the utilization of the capital loss carryforwards. The amounts and expiration dates of the capital loss carryforwards are as follows:
| | | | | | | | | | | |
| | | AMT-Free
| | National
| | |
| Expiration Date | | Limited Fund | | Limited Fund | | |
| |
| |
| March 31, 2013 | | $ | 995,128 | | | $ | 1,431,742 | | | |
| March 31, 2014 | | | — | | | | 213,995 | | | |
| March 31, 2015 | | | 25,590 | | | | 935,617 | | | |
| March 31, 2016 | | | — | | | | 7,092,688 | | | |
| March 31, 2017 | | | 647,289 | | | | 12,241,519 | | | |
| March 31, 2018 | | | 233,087 | | | | 12,564,070 | | | |
| March 31, 2019 | | | 952,777 | | | | 6,473,142 | | | |
| | | | | | | | | | | |
| |
| |
| | | $ | 2,853,871 | | | $ | 40,952,773 | | | |
| | | | | | | | | | | |
| |
| |
Included in the amounts above for National Limited Fund are capital loss carryforwards of $3,303,292 as a result of reorganizations (see Note 13). Utilization of these capital loss carryforwards may be limited in accordance with certain income tax regulations.
As of March 31, 2012, the Funds had no uncertain tax positions that would require financial statement recognition, de-recognition, or disclosure. Each Fund files a U.S. federal income tax return annually after its fiscal year-end, which is subject to examination by the Internal Revenue Service for a period of three years from the date of filing.
D Expenses — The majority of expenses of the Trust are directly identifiable to an individual fund. Expenses which are not readily identifiable to a specific fund are allocated taking into consideration, among other things, the nature and type of expense and the relative size of the funds.
E Expense Reduction — State Street Bank and Trust Company (SSBT) serves as custodian of the Funds. Pursuant to the respective custodian agreements, SSBT receives a fee reduced by credits, which are determined based on the average daily cash balance each Fund maintains with SSBT. All credit balances, if any, used to reduce each Fund’s custodian fees are reported as a reduction of expenses in the Statements of Operations.
F Legal Fees — Legal fees and other related expenses incurred as part of negotiations of the terms and requirement of capital infusions, or that are expected to result in the restructuring of, or a plan of reorganization for, an investment are recorded as realized losses. Ongoing expenditures to protect or enhance an investment are treated as operating expenses.
G Use of Estimates — The preparation of the financial statements in conformity with accounting principles generally accepted in the United States of America requires management to make estimates and assumptions that affect the reported amounts of assets and liabilities at the date of the financial statements and the reported amounts of income and expense during the reporting period. Actual results could differ from those estimates.
H Indemnifications — Under the Trust’s organizational documents, its officers and Trustees may be indemnified against certain liabilities and expenses arising out of the performance of their duties to the Funds. Under Massachusetts law, if certain conditions prevail, shareholders of a Massachusetts business trust (such as the Trust) could be deemed to have personal liability for the obligations of the Trust. However, the Trust’s Declaration of Trust contains an express disclaimer of liability on the part of Fund shareholders and the By-laws provide that the Trust shall assume the defense on behalf of any Fund shareholders. Moreover, the By-laws also provide for indemnification out of Fund property of any shareholder held personally liable solely by reason of being or having been a shareholder for all loss or expense arising from such liability. Additionally, in the normal course of business, each Fund enters into agreements with service providers that may contain indemnification clauses. Each Fund’s maximum exposure under these arrangements is unknown as this would involve future claims that may be made against each Fund that have not yet occurred.
I Floating Rate Notes Issued in Conjunction with Securities Held — The Funds may invest in residual interest bonds, also referred to as inverse floating rate securities, whereby a Fund may sell a variable or fixed rate bond to a broker for cash. At the same time, the Fund buys a residual interest in the assets and cash flows of a Special-Purpose Vehicle (the SPV), (which is generally organized as a trust), set up by the broker. The broker deposits a bond into the SPV with the same CUSIP number as the bond sold to the broker by the Fund, and which may have been, but is not required to be, the bond purchased from the Fund (the Bond). The SPV also issues floating rate notes (Floating Rate Notes) which are sold to third-parties. The residual interest bond held by a Fund gives the Fund the right (1) to cause the holders of the Floating Rate Notes to generally tender their notes at par, and (2) to have the broker transfer the Bond held by the SPV to the Fund, thereby terminating the SPV. Should the Fund exercise such right, it would generally pay the broker the par amount due on the Floating Rate Notes and exchange the residual interest bond for the underlying Bond. Pursuant to generally accepted
35
Eaton Vance
Limited Maturity Municipal Income Funds
March 31, 2012
Notes to Financial Statements — continued
accounting principles for transfers and servicing of financial assets and extinguishment of liabilities, the Funds account for the transaction described above as a secured borrowing by including the Bond in their Portfolio of Investments and the Floating Rate Notes as a liability under the caption “Payable for floating rate notes issued” in their Statement of Assets and Liabilities. The Floating Rate Notes have interest rates that generally reset weekly and their holders have the option to tender their notes to the broker for redemption at par at each reset date. Accordingly, the fair value of the payable for Floating Rate Notes issued approximates its carrying value. Interest expense related to the Funds’ liability with respect to Floating Rate Notes is recorded as incurred. The SPV may be terminated by the Fund, as noted above, or by the broker upon the occurrence of certain termination events as defined in the trust agreement, such as a downgrade in the credit quality of the underlying Bond, bankruptcy of or payment failure by the issuer of the underlying Bond, the inability to remarket Floating Rate Notes that have been tendered due to insufficient buyers in the market, or the failure by the SPV to obtain renewal of the liquidity agreement under which liquidity support is provided for the Floating Rate Notes up to one year.
At March 31, 2012, the AMT-Free Limited Fund and National Limited Fund had no Floating Rate Notes outstanding. For the year ended March 31, 2012, the National Limited Fund’s average Floating Rate Notes outstanding and the average interest rate including fees were $367,377 and 1.04%, respectively. For the year ended March 31, 2012, the AMT-Free Limited Fund had no transactions in residual interest bonds.
The Funds may enter into shortfall and forbearance agreements with the broker by which a Fund agrees to reimburse the broker, in certain circumstances, for the difference between the liquidation value of the Bond held by the SPV and the liquidation value of the Floating Rate Notes, as well as any shortfalls in interest cash flows. The Funds had no shortfalls as of March 31, 2012.
The Funds may also purchase residual interest bonds from brokers in a secondary market transaction without first owning the underlying bond. Such transactions are not required to be treated as secured borrowings. Shortfall agreements, if any, related to residual interest bonds purchased in a secondary market transaction are disclosed in the Portfolio of Investments.
The Funds’ investment policies and restrictions expressly permit investments in residual interest bonds. Such bonds typically offer the potential for yields exceeding the yields available on fixed rate bonds with comparable credit quality and maturity. These securities tend to underperform the market for fixed rate bonds in a rising long-term interest rate environment, but tend to outperform the market for fixed rate bonds when long-term interest rates decline. The value and income of residual interest bonds are generally more volatile than that of a fixed rate bond. The Funds’ investment policies do not allow the Funds to borrow money except as permitted by the 1940 Act. Management believes that the Funds’ restrictions on borrowing money and issuing senior securities (other than as specifically permitted) do not apply to Floating Rate Notes issued by the SPV and included as a liability in the Funds’ Statement of Assets and Liabilities. As secured indebtedness issued by an SPV, Floating Rate Notes are distinct from the borrowings and senior securities to which the Funds’ restrictions apply. Residual interest bonds held by the Funds are securities exempt from registration under Rule 144A of the Securities Act of 1933.
J Financial Futures Contracts — Upon entering into a financial futures contract, a Fund is required to deposit with the broker, either in cash or securities, an amount equal to a certain percentage of the purchase price (initial margin). Subsequent payments, known as variation margin, are made or received by the Fund each business day, depending on the daily fluctuations in the value of the underlying security, and are recorded as unrealized gains or losses by the Fund. Gains (losses) are realized upon the expiration or closing of the financial futures contracts. Should market conditions change unexpectedly, the Fund may not achieve the anticipated benefits of the financial futures contracts and may realize a loss. Futures contracts have minimal counterparty risk as they are exchange traded and the clearinghouse for the exchange is substituted as the counterparty, guaranteeing counterparty performance.
K When-Issued Securities and Delayed Delivery Transactions — The Funds may purchase or sell securities on a delayed delivery or when-issued basis. Payment and delivery may take place after the customary settlement period for that security. At the time the transaction is negotiated, the price of the security that will be delivered is fixed. The Funds maintain security positions for these commitments such that sufficient liquid assets will be available to make payments upon settlement. Securities purchased on a delayed delivery or when-issued basis are marked-to-market daily and begin earning interest on settlement date. Losses may arise due to changes in the market value of the underlying securities or if the counterparty does not perform under the contract.
2 Distributions to Shareholders
The net investment income of each Fund is determined daily and substantially all of the net investment income so determined is declared as a dividend to shareholders of record at the time of declaration. Distributions are declared separately for each class of shares. Distributions are paid monthly. Distributions of realized capital gains (reduced by available capital loss carryforwards, if any) are made at least annually. Shareholders may reinvest income and capital gain distributions in additional shares of the same class of a Fund at the net asset value as of the reinvestment date or, at the election of the shareholder, receive distributions in cash. The Funds distinguish between distributions on a tax basis and a financial reporting basis. Accounting principles generally accepted in the United States of America require that only distributions in excess of tax basis earnings and profits be reported in the financial statements as a return of capital. Permanent differences between book and tax accounting relating to distributions are reclassified to paid-in capital. For tax purposes, distributions from short-term capital gains are considered to be from ordinary income.
36
Eaton Vance
Limited Maturity Municipal Income Funds
March 31, 2012
Notes to Financial Statements — continued
The tax character of distributions declared for the years ended March 31, 2012 and March 31, 2011 was as follows:
| | | | | | | | | | | |
| | | Year Ended March 31, 2012 | | |
| | | |
| | | AMT-Free
| | National
| | |
| | | Limited Fund | | Limited Fund | | |
| |
| |
Distributions declared from: | | | | | | | | | | |
| Tax-exempt income | | $ | 2,060,460 | | | $ | 24,110,701 | | | |
| Ordinary income | | $ | 113 | | | $ | 228,097 | | | |
| | | | | | | | | | | |
| |
| |
| | | | | | | | | | | |
| | | Year Ended March 31, 2011 | | |
| | | |
| | | AMT-Free
| | National
| | |
| | | Limited Fund | | Limited Fund | | |
| |
| |
Distributions declared from: | | | | | | | | | | |
| Tax-exempt income | | $ | 2,357,774 | | | $ | 25,289,851 | | | |
| Ordinary income | | $ | 144 | | | $ | 79,499 | | | |
| | | | | | | | | | | |
| |
| |
During the year ended March 31, 2012, the following amounts were reclassified due to expired capital loss carryforwards and differences between book and tax accounting, primarily for accretion of market discount, expenditures on defaulted bonds and defaulted bond interest:
| | | | | | | | | | | |
| | | AMT-Free
| | National
| | |
| | | Limited Fund | | Limited Fund | | |
| |
| |
| Change in: | | | | | | | | | | |
| Paid-in capital | | $ | — | | | $ | (2,539,756 | ) | | |
| Accumulated net realized loss | | $ | 31,603 | | | $ | 2,435,818 | | | |
| Accumulated undistributed (distributions in excess of) net investment income | | $ | (31,603 | ) | | $ | 103,938 | | | |
| | | | | | | | | | | |
| |
| |
These reclassifications had no effect on the net assets or net asset value per share of the Funds.
As of March 31, 2012, the components of distributable earnings (accumulated losses) and unrealized appreciation (depreciation) on a tax basis were as follows:
| | | | | | | | | | | |
| | | AMT-Free
| | National
| | |
| | | Limited Fund | | Limited Fund | | |
| |
| |
| Undistributed tax-exempt income | | $ | 24,651 | | | $ | 1,216,585 | | | |
| Capital loss carryforward and deferred capital losses | | $ | (3,542,545 | ) | | $ | (53,600,569 | ) | | |
| Net unrealized appreciation | | $ | 6,386,803 | | | $ | 53,831,562 | | | |
| Other temporary differences | | $ | (83,717 | ) | | $ | (1,090,787 | ) | | |
| | | | | | | | | | | |
| |
| |
The differences between components of distributable earnings (accumulated losses) on a tax basis and the amounts reflected in the Statements of Assets and Liabilities are primarily due to futures contracts, the timing of recognizing distributions to shareholders, expenditures on defaulted bonds, defaulted bond interest and accretion of market discount.
37
Eaton Vance
Limited Maturity Municipal Income Funds
March 31, 2012
Notes to Financial Statements — continued
3 Investment Adviser Fee and Other Transactions with Affiliates
The investment adviser fee is earned by Boston Management and Research (BMR), a subsidiary of Eaton Vance Management (EVM), as compensation for management and investment advisory services rendered to each Fund. The fee is based upon a percentage of average daily net assets plus a percentage of gross income (i.e., income other than gains from the sale of securities) as presented in the following table and is payable monthly.
| | | | | | | | | | | |
| | | Annual Asset
| | Daily Income
| | |
| Daily Net Assets | | Rate | | Rate | | |
| |
| |
| Up to $500 million | | | 0.300 | % | | | 3.00 | % | | |
| $500 million up to $1 billion | | | 0.275 | | | | 2.75 | | | |
| |
| |
On average daily net assets of $1 billion or more, the rates are further reduced.
For the year ended March 31, 2012, investment adviser fees incurred by the Funds and the effective annual rates, as a percentage of average daily net assets, were as follows:
| | | | | | | | | | | |
| | | AMT-Free
| | National
| | |
| | | Limited Fund | | Limited Fund | | |
| |
| |
| Investment Adviser Fee | | $ | 279,852 | | | $ | 2,902,800 | | | |
| Effective Annual Rate | | | 0.43 | % | | | 0.42 | % | | |
| | | | | | | | | | | |
| |
| |
EVM serves as administrator of each Fund, but receives no compensation. EVM serves as the sub-transfer agent of each Fund and receives from the transfer agent an aggregate fee based upon the actual expenses incurred by EVM in the performance of these services. Eaton Vance Distributors, Inc. (EVD), an affiliate of EVM and the Funds’ principal underwriter, received a portion of the sales charge on sales of Class A shares of the Funds. EVD also received distribution and service fees from Class A, Class B and Class C shares (see Note 4) and contingent deferred sales charges (see Note 5). Sub-transfer agent fees earned by EVM and Class A sales charges that the Funds were informed were received by EVD for the year ended March 31, 2012 were as follows:
| | | | | | | | | | | |
| | | AMT-Free
| | National
| | |
| | | Limited Fund | | Limited Fund | | |
| |
| |
EVM’s Sub-Transfer Agent Fees | | $ | 1,010 | | | $ | 8,311 | | | |
| EVD’s Class A Sales Charges | | $ | 3,337 | | | $ | 17,300 | | | |
| | | | | | | | | | | |
| |
| |
Except for Trustees of the Funds who are not members of EVM’s or BMR’s organizations, officers and Trustees receive remuneration for their services to the Funds out of the investment adviser fee. Trustees of the Funds who are not affiliated with the investment adviser may elect to defer receipt of all or a percentage of their annual fees in accordance with the terms of the Trustees Deferred Compensation Plan. For the year ended March 31, 2012, no significant amounts have been deferred. Certain officers and Trustees of the Funds are officers of the above organizations.
4 Distribution Plans
Each Fund has in effect a distribution plan for Class A shares (Class A Plan) pursuant to Rule 12b-1 under the 1940 Act. The Class A Plan provides that each Fund will pay EVD a distribution and service fee not exceeding 0.25% per annum of its average daily net assets attributable to Class A shares for distribution services and facilities provided to each Fund by EVD, as well as for personal services and/or the maintenance of shareholder accounts. The Trustees approved distribution and service fee payments equal to 0.15% per annum of each Fund’s average daily net assets attributable to Class A shares. Distribution and service fees paid or accrued to EVD for the year ended March 31, 2012 for Class A shares amounted to the following:
| | | | | | | | | | | |
| | | AMT-Free
| | National
| | |
| | | Limited Fund | | Limited Fund | | |
| |
| |
| Class A Distribution and Service Fees | | $ | 74,190 | | | $ | 516,032 | | | |
| | | | | | | | | | | |
| |
| |
38
Eaton Vance
Limited Maturity Municipal Income Funds
March 31, 2012
Notes to Financial Statements — continued
Each Fund also has in effect distribution plans for Class B shares (Class B Plan) and Class C shares (Class C Plan) pursuant to Rule 12b-1 under the 1940 Act. Pursuant to the Class B and Class C Plans, each Fund pays EVD amounts equal to 0.75% per annum of its average daily net assets attributable to Class B and Class C shares for providing ongoing distribution services and facilities to the respective Funds. Each Fund will automatically discontinue payments to EVD during any period in which there are no outstanding Uncovered Distribution Charges, which are equivalent to the sum of (i) 3% and 6.25% of the aggregate amount received by each Fund for Class B and Class C shares sold, respectively, plus (ii) interest calculated by applying the rate of 1% over the prevailing prime rate to the outstanding balance of Uncovered Distribution Charges of EVD of each respective class, reduced by the aggregate amount of contingent deferred sales charges (see Note 5) and amounts theretofore paid or payable to EVD by each respective class. For the year ended March 31, 2012, the Funds paid or accrued to EVD the following distribution fees, representing 0.75% of the average daily net assets of each Fund’s Class B and Class C shares:
| | | | | | | | | | | |
| | | AMT-Free
| | National
| | |
| | | Limited Fund | | Limited Fund | | |
| |
| |
| Class B Distribution Fees | | $ | 5,542 | | | $ | 36,720 | | | |
| Class C Distribution Fees | | $ | 111,320 | | | $ | 1,011,123 | | | |
| | | | | | | | | | | |
| |
| |
At March 31, 2012, the amounts of Uncovered Distribution Charges of EVD calculated under the Class B and Class C Plans were approximately as follows:
| | | | | | | | | | | |
| | | AMT-Free
| | National
| | |
| | | Limited Fund | | Limited Fund | | |
| |
| |
| Class B | | $ | 1,157,000 | | | $ | 3,828,000 | | | |
| Class C | | $ | 11,593,000 | | | $ | 22,547,000 | | | |
| | | | | | | | | | | |
| |
| |
The Class B and Class C Plans also authorize the Funds to make payments of service fees to EVD, financial intermediaries and other persons in amounts not exceeding 0.25% per annum of the average daily net assets attributable to that class. The Trustees approved service fee payments equal to 0.15% per annum of each Fund’s average daily net assets attributable to Class B and Class C shares. Service fees paid or accrued are for personal services and/or the maintenance of shareholder accounts. They are separate and distinct from the Class B and Class C sales commissions and distribution fees and, as such, are not subject to automatic discontinuance when there are no outstanding Uncovered Distribution Charges of EVD. Service fees paid or accrued for the year ended March 31, 2012 amounted to the following:
| | | | | | | | | | | |
| | | AMT-Free
| | National
| | |
| | | Limited Fund | | Limited Fund | | |
| |
| |
| Class B Service Fees | | $ | 1,108 | | | $ | 7,344 | | | |
| Class C Service Fees | | $ | 22,264 | | | $ | 202,225 | | | |
| | | | | | | | | | | |
| |
| |
5 Contingent Deferred Sales Charges
A contingent deferred sales charge (CDSC) generally is imposed on redemptions of Class B shares made within four years of purchase and on redemptions of Class C shares made within one year of purchase. Class A shares may be subject to a 1% CDSC if redeemed within eighteen months of purchase (depending on the circumstances of purchase). Generally, the CDSC is based upon the lower of the net asset value at date of redemption or date of purchase. No charge is levied on shares acquired by reinvestment of dividends or capital gain distributions. The CDSC for Class B shares is imposed at declining rates that begin at 3% in the case of redemptions in the first year after purchase, declining half a percentage point in the second and third year and one percentage point in the fourth year. Class C shares are subject to a 1% CDSC if redeemed within one year of purchase. No CDSC is levied on shares which have been sold to EVM or its affiliates or to their respective employees or clients and may be waived under certain other limited conditions. CDSCs received on Class B and Class C redemptions are paid to EVD to reduce the amount of Uncovered Distribution Charges calculated under each
39
Eaton Vance
Limited Maturity Municipal Income Funds
March 31, 2012
Notes to Financial Statements — continued
Fund’s Class B and Class C Plans. CDSCs received on Class B and Class C redemptions when no Uncovered Distribution Charges exist are credited to each Fund. For the year ended March 31, 2012, the Funds were informed that EVD received approximately the following amounts of CDSCs paid by Class A, Class B and Class C shareholders:
| | | | | | | | | | | |
| | | AMT-Free
| | National
| | |
| | | Limited Fund | | Limited Fund | | |
| |
| |
| Class A | | $ | 2,000 | | | $ | 32,000 | | | |
| Class B | | $ | 3,000 | | | $ | 7,000 | | | |
| Class C | | $ | 100 | | | $ | 9,000 | | | |
| | | | | | | | | | | |
| |
| |
6 Purchases and Sales of Investments
Purchases and sales of investments, other than short-term obligations, for the year ended March 31, 2012 were as follows:
| | | | | | | | | | | |
| | | AMT-Free
| | National
| | |
| | | Limited Fund | | Limited Fund | | |
| |
| |
| Purchases | | $ | 7,613,434 | | | $ | 108,124,995 | | | |
| Sales | | $ | 11,558,466 | | | $ | 113,648,370 | | | |
| | | | | | | | | | | |
| |
| |
7 Shares of Beneficial Interest
Each Fund’s Declaration of Trust permits the Trustees to issue an unlimited number of full and fractional shares of beneficial interest (without par value). Such shares may be issued in a number of different series (such as the Funds) and classes. Transactions in Fund shares were as follows:
| | | | | | | | | | | |
AMT-Free Limited Fund |
| | | Year Ended
| | Year Ended
| | |
| Class A | | March 31, 2012 | | March 31, 2011 | | |
| |
| |
| Sales | | | 833,432 | | | | 1,876,137 | | | |
| Issued to shareholders electing to receive payments of distributions in Fund shares | | | 111,034 | | | | 114,980 | | | |
| Redemptions | | | (1,450,298 | ) | | | (2,478,705 | ) | | |
| Exchange from Class B shares | | | 4,453 | | | | 25,232 | | | |
| | | | | | | | | | | |
| |
| |
Net decrease | | | (501,379 | ) | | | (462,356 | ) | | |
| | | | | | | | | | | |
| |
| |
| | | | | | | | | | | |
| | | | | | | | | | | |
| | | Year Ended
| | Year Ended
| | |
| Class B | | March 31, 2012 | | March 31, 2011 | | |
| |
| |
| Sales | | | 20,854 | | | | 37,806 | | | |
| Issued to shareholders electing to receive payments of distributions in Fund shares | | | 880 | | | | 1,088 | | | |
| Redemptions | | | (37,970 | ) | | | (25,089 | ) | | |
| Exchange to Class A shares | | | (4,453 | ) | | | (25,215 | ) | | |
| | | | | | | | | | | |
| |
| |
Net decrease | | | (20,689 | ) | | | (11,410 | ) | | |
| | | | | | | | | | | |
| |
| |
40
Eaton Vance
Limited Maturity Municipal Income Funds
March 31, 2012
Notes to Financial Statements — continued
| | | | | | | | | | | |
| | | Year Ended
| | Year Ended
| | |
| Class C | | March 31, 2012 | | March 31, 2011 | | |
| |
| |
| Sales | | | 390,383 | | | | 582,128 | | | |
| Issued to shareholders electing to receive payments of distributions in Fund shares | | | 26,930 | | | | 24,805 | | | |
| Redemptions | | | (247,856 | ) | | | (694,464 | ) | | |
| | | | | | | | | | | |
| |
| |
Net increase (decrease) | | | 169,457 | | | | (87,531 | ) | | |
| | | | | | | | | | | |
| |
| |
| | | | | | | | | | | |
| | | | | | | | | | | |
| | | Year Ended
| | Period Ended
| | |
| Class I | | March 31, 2012 | | March 31, 2011(1) | | |
| |
| |
| Sales | | | 114,631 | | | | 72,415 | | | |
| Issued to shareholders electing to receive payments of distributions in Fund shares | | | 1,918 | | | | 556 | | | |
| Redemptions | | | (24,673 | ) | | | (64,995 | ) | | |
| | | | | | | | | | | |
| |
| |
Net increase | | | 91,876 | | | | 7,976 | | | |
| | | | | | | | | | | |
| |
| |
| | | | | | | | | | | |
| | | | | | | | | | | |
National Limited Fund |
| | | Year Ended
| | Year Ended
| | |
| Class A | | March 31, 2012 | | March 31, 2011 | | |
| |
| |
| Sales | | | 7,735,677 | | | | 11,328,749 | | | |
| Issued to shareholders electing to receive payments of distributions in Fund shares | | | 923,128 | | | | 1,062,336 | | | |
| Redemptions | | | (12,414,323 | ) | | | (20,866,049 | ) | | |
| Issued in connection with tax-free reorganizations (see Note 13) | | | 3,259,884 | | | | 2,132,312 | | | |
| Exchange from Class B shares | | | 103,495 | | | | 179,864 | | | |
| | | | | | | | | | | |
| |
| |
Net decrease | | | (392,139 | ) | | | (6,162,788 | ) | | |
| | | | | | | | | | | |
| |
| |
| | | | | | | | | | | |
| | | | | | | | | | | |
| | | Year Ended
| | Year Ended
| | |
| Class B | | March 31, 2012 | | March 31, 2011 | | |
| |
| |
| Sales | | | 126,815 | | | | 220,271 | | | |
| Issued to shareholders electing to receive payments of distributions in Fund shares | | | 9,585 | | | | 10,154 | | | |
| Redemptions | | | (120,782 | ) | | | (180,447 | ) | | |
| Issued in connection with tax-free reorganizations (see Note 13) | | | 46,192 | | | | 22,804 | | | |
| Exchange to Class A shares | | | (103,457 | ) | | | (179,787 | ) | | |
| | | | | | | | | | | |
| |
| |
Net decrease | | | (41,647 | ) | | | (107,005 | ) | | |
| | | | | | | | | | | |
| |
| |
41
Eaton Vance
Limited Maturity Municipal Income Funds
March 31, 2012
Notes to Financial Statements — continued
| | | | | | | | | | | |
| | | Year Ended
| | Year Ended
| | |
| Class C | | March 31, 2012 | | March 31, 2011 | | |
| |
| |
| Sales | | | 2,722,101 | | | | 3,801,779 | | | |
| Issued to shareholders electing to receive payments of distributions in Fund shares | | | 245,188 | | | | 255,911 | | | |
| Redemptions | | | (3,356,207 | ) | | | (5,078,472 | ) | | |
| Issued in connection with tax-free reorganizations (see Note 13) | | | 334,479 | | | | 242,332 | | | |
| | | | | | | | | | | |
| |
| |
Net decrease | | | (54,439 | ) | | | (778,450 | ) | | |
| | | | | | | | | | | |
| |
| |
| | | | | | | | | | | |
| | | | | | | | | | | |
| | | Year Ended
| | Year Ended
| | |
| Class I | | March 31, 2012 | | March 31, 2011 | | |
| |
| |
| Sales | | | 10,031,774 | | | | 13,860,458 | | | |
| Issued to shareholders electing to receive payments of distributions in Fund shares | | | 96,846 | | | | 53,133 | | | |
| Redemptions | | | (5,594,372 | ) | | | (5,786,628 | ) | | |
| Issued in connection with tax-free reorganizations (see Note 13) | | | 98 | | | | — | | | |
| | | | | | | | | | | |
| |
| |
Net increase | | | 4,534,346 | | | | 8,126,963 | | | |
| | | | | | | | | | | |
| |
| |
| | |
| (1) | | Class I of AMT-Free Limited Fund commenced operations on August 3, 2010. |
8 Federal Income Tax Basis of Investments
The cost and unrealized appreciation (depreciation) of investments of each Fund at March 31, 2012, as determined on a federal income tax basis, were as follows:
| | | | | | | | | | | |
| | | AMT-Free
| | National
| | |
| | | Limited Fund | | Limited Fund | | |
| |
| |
Aggregate cost | | $ | 58,201,152 | | | $ | 667,291,448 | | | |
| | | | | | | | | | | |
| |
| |
| Gross unrealized appreciation | | $ | 6,984,710 | | | $ | 58,542,694 | | | |
| Gross unrealized depreciation | | | (597,907 | ) | | | (4,711,132 | ) | | |
| | | | | | | | | | | |
| |
| |
Net unrealized appreciation | | $ | 6,386,803 | | | $ | 53,831,562 | | | |
| | | | | | | | | | | |
| |
| |
9 Line of Credit
The Funds participate with other portfolios and funds managed by EVM and its affiliates in a $600 million unsecured line of credit agreement with a group of banks. Borrowings are made by the Funds solely to facilitate the handling of unusual and/or unanticipated short-term cash requirements. Interest is charged to each Fund based on its borrowings at an amount above either the Eurodollar rate or Federal Funds rate. In addition, a fee computed at an annual rate of 0.08% on the daily unused portion of the line of credit is allocated among the participating portfolios and funds at the end of each quarter. Because the line of credit is not available exclusively to the Funds, a Fund may be unable to borrow some or all of its requested amounts at any particular time. At March 31, 2012, AMT-Free Limited Fund had a balance outstanding pursuant to this line of credit of $600,000 at an interest rate of 1.13%. Based on the short-term nature of the borrowings under the line of credit and variable interest rate, the carrying value of the borrowings approximated its fair value at March 31, 2012. The Funds’ average borrowings or allocated fees during the year ended March 31, 2012 were not significant.
10 Overdraft Advances
Pursuant to the custodian agreement, SSBT may, in its discretion, advance funds to the Funds to make properly authorized payments. When such payments result in an overdraft, the Funds are obligated to repay SSBT at the current rate of interest charged by SSBT for secured loans (currently, a rate above the Federal Funds rate). This obligation is payable on demand to SSBT. SSBT has a lien on a Fund’s assets to the extent of any overdraft. At March 31, 2012, the AMT-Free Limited Fund had payments due to SSBT pursuant to the foregoing arrangement of $11,965.
42
Eaton Vance
Limited Maturity Municipal Income Funds
March 31, 2012
Notes to Financial Statements — continued
11 Financial Instruments
The Funds may trade in financial instruments with off-balance sheet risk in the normal course of their investing activities. These financial instruments may include financial futures contracts and may involve, to a varying degree, elements of risk in excess of the amounts recognized for financial statement purposes. The notional or contractual amounts of these instruments represent the investment a Fund has in particular classes of financial instruments and do not necessarily represent the amounts potentially subject to risk. The measurement of the risks associated with these instruments is meaningful only when all related and offsetting transactions are considered.
A summary of obligations under these financial instruments at March 31, 2012 is as follows:
| | | | | | | | | | | | | | | | | | | | | |
| Futures Contracts |
| | | | | | | | | | | | | Net
| | |
| | | Expiration
| | | | | | Aggregate
| | | | Unrealized
| | |
| Fund | | Month/Year | | Contracts | | Position | | Cost | | Value | | Appreciation | | |
| |
| |
| AMT-Free Limited | | 6/12 | | 75
U.S. 10-Year Treasury Note | | Short | | $ | (9,775,644 | ) | | $ | (9,711,328 | ) | | $ | 64,316 | | | |
| | | | | | | | | | | | | | | | | | | | | |
| |
| |
| National Limited | | 6/12 | | 187
U.S. 10-Year Treasury Note | | Short | | $ | (24,373,939 | ) | | $ | (24,213,578 | ) | | $ | 160,361 | | | |
| | | 6/12 | | 265
U.S. 30-Year Treasury Bond | | Short | | | (36,928,375 | ) | | | (36,503,750 | ) | | | 424,625 | | | |
| | | | | | | | | | | | | | | | | | | | | |
| |
| |
At March 31, 2012, the Funds had sufficient cash and/or securities to cover commitments under these contracts.
Each Fund is subject to interest rate risk in the normal course of pursuing its investment objectives. Because the Funds hold fixed-rate bonds, the value of these bonds may decrease if interest rates rise. The Funds purchase and sell U.S. Treasury futures contracts to hedge against changes in interest rates.
The fair values of open derivative instruments (not considered to be hedging instruments for accounting disclosure purposes) and whose primary underlying risk exposure is interest rate risk at March 31, 2012 were as follows:
| | | | | | | | | | | |
| | | AMT-Free
| | National
| | |
| | | Limited Fund | | Limited Fund | | |
| |
| |
Asset Derivative: | | | | | | | | | | |
| Futures Contracts | | $ | 64,316 | (1) | | $ | 584,986 | (1) | | |
| | | | | | | | | | | |
| |
| |
Total | | $ | 64,316 | | | $ | 584,986 | | | |
| | | | | | | | | | | |
| |
| |
| | |
| (1) | | Amount represents cumulative unrealized appreciation on futures contracts in the Futures Contracts table above. Only the current day’s variation margin on open futures contracts is reported within the Statement of Assets and Liabilities as Receivable or Payable for variation margin, as applicable. |
The effect of derivative instruments (not considered to be hedging instruments for accounting disclosure purposes) on the Statement of Operations and whose primary underlying risk exposure is interest rate risk for the year ended March 31, 2012 was as follows:
| | | | | | | | | | | |
| | | AMT-Free
| | National
| | |
| | | Limited Fund | | Limited Fund | | |
| |
| |
| Realized Gain (Loss) on Derivatives Recognized in Income | | $ | (1,110,989 | )(1) | | $ | (10,581,687 | )(1) | | |
| Change in Unrealized Appreciation (Depreciation) on Derivatives Recognized in Income | | $ | 79,227 | (2) | | $ | 520,197 | (2) | | |
| | | | | | | | | | | |
| |
| |
| | |
| (1) | | Statement of Operations location: Net realized gain (loss) – Financial futures contracts. |
| (2) | | Statement of Operations location: Change in unrealized appreciation (depreciation) – Financial futures contracts. |
43
Eaton Vance
Limited Maturity Municipal Income Funds
March 31, 2012
Notes to Financial Statements — continued
The average notional amounts of futures contracts outstanding during the year ended March 31, 2012, which are indicative of the volume of this derivative type, were approximately as follows:
| | | | | | | | | | | |
| | | AMT-Free
| | National
| | |
| | | Limited Fund | | Limited Fund | | |
| |
| |
Average Notional Amount: | | | | | | | | | | |
| Futures Contracts | | $ | 7,500,000 | | | $ | 46,192,000 | | | |
| | | | | | | | | | | |
| |
| |
12 Fair Value Measurements
Under generally accepted accounting principles for fair value measurements, a three-tier hierarchy to prioritize the assumptions, referred to as inputs, is used in valuation techniques to measure fair value. The three-tier hierarchy of inputs is summarized in the three broad levels listed below.
| |
| • | Level 1 – quoted prices in active markets for identical investments |
| |
| • | Level 2 – other significant observable inputs (including quoted prices for similar investments, interest rates, prepayment speeds, credit risk, etc.) |
| |
| • | Level 3 – significant unobservable inputs (including a fund’s own assumptions in determining the fair value of investments) |
In cases where the inputs used to measure fair value fall in different levels of the fair value hierarchy, the level disclosed is determined based on the lowest level input that is significant to the fair value measurement in its entirety. The inputs or methodology used for valuing securities are not necessarily an indication of the risk associated with investing in those securities.
At March 31, 2012, the hierarchy of inputs used in valuing the Funds’ investments and open derivative instruments, which are carried at value, were as follows:
| | | | | | | | | | | | | | | | | | | |
AMT-Free Limited Fund |
| Asset Description | | Level 1 | | Level 2 | | Level 3 | | Total | | |
| |
| |
| Tax-Exempt Investments | | $ | — | | | $ | 64,587,955 | | | $ | — | | | $ | 64,587,955 | | | |
| | | | | | | | | | | | | | | | | | | |
| |
| |
Total Investments | | $ | — | | | $ | 64,587,955 | | | $ | — | | | $ | 64,587,955 | | | |
| | | | | | | | | | | | | | | | | | | |
| |
| |
| Futures Contracts | | $ | 64,316 | | | $ | — | | | $ | — | | | $ | 64,316 | | | |
| | | | | | | | | | | | | | | | | | | |
| |
| |
Total | | $ | 64,316 | | | $ | 64,587,955 | | | $ | — | | | $ | 64,652,271 | | | |
| | | | | | | | | | | | | | | | | | | |
| |
| |
| | | | | | | | | | | | | | | | | | | |
| | | | | | | | | | | | | | | | | | | |
National Limited Fund |
| Asset Description | | Level 1 | | Level 2 | | Level 3 | | Total | | |
| |
| |
| Tax-Exempt Investments | | $ | — | | | $ | 721,123,010 | | | $ | — | | | $ | 721,123,010 | | | |
| | | | | | | | | | | | | | | | | | | |
| |
| |
Total Investments | | $ | — | | | $ | 721,123,010 | | | $ | — | | | $ | 721,123,010 | | | |
| | | | | | | | | | | | | | | | | | | |
| |
| |
| Futures Contracts | | $ | 584,986 | | | $ | — | | | $ | — | | | $ | 584,986 | | | |
| | | | | | | | | | | | | | | | | | | |
| |
| |
Total | | $ | 584,986 | | | $ | 721,123,010 | | | $ | — | | | $ | 721,707,996 | | | |
| | | | | | | | | | | | | | | | | | | |
| |
| |
The Funds held no investments or other financial instruments as of March 31, 2011 whose fair value was determined using Level 3 inputs. At March 31, 2012, the value of investments transferred between Level 1 and Level 2, if any, during the year then ended was not significant.
13 Reorganizations
As of the close of business on September 23, 2011, the National Limited Fund acquired the net assets of Eaton Vance New Jersey Limited Maturity Municipal Income Fund (New Jersey Limited Fund) pursuant to a plan of reorganization approved by the shareholders of New Jersey Limited Fund. The purpose of the transaction was to combine two funds managed by BMR with substantially similar investment objectives and policies. The acquisition was accomplished by a tax-free exchange of 3,259,884 shares of Class A of the National Limited Fund (valued at $33,127,013) for the 3,275,936 shares of
44
Eaton Vance
Limited Maturity Municipal Income Funds
March 31, 2012
Notes to Financial Statements — continued
Class A of New Jersey Limited Fund, 46,192 shares of Class B of the National Limited Fund (valued at $469,668) for the 46,438 shares of Class B of New Jersey Limited Fund, 334,479 shares of Class C of the National Limited Fund (valued at $3,188,414) for the 315,368 shares of Class C of New Jersey Limited Fund, and 98 shares of Class I of the National Limited Fund (valued at $998) for the 99 shares of Class I of New Jersey Limited Fund each outstanding on September 23, 2011. The investment portfolio of New Jersey Limited Fund, with a fair value of $36,398,464 and identified cost of $33,146,730 was the principal asset acquired by the National Limited Fund. For financial reporting purposes, assets received and shares issued by the National Limited Fund were recorded at fair value; however, the identified cost of the investments received from the New Jersey Limited Fund was carried forward to align ongoing reporting of the National Limited Fund’s realized and unrealized gains and losses with amounts distributable to shareholders for tax purposes. The aggregate net assets of the National Limited Fund immediately before the acquisition were $676,048,146. The net assets of New Jersey Limited Fund at that date of $36,786,093, including $2,702,517 of accumulated net realized losses and $3,251,734 of unrealized appreciation, were combined with those of the National Limited Fund, resulting in combined net assets of $712,834,239.
Assuming the acquisition had been completed on April 1, 2011, the beginning of the National Limited Fund’s annual reporting period, the National Limited Fund’s pro forma results of operations for the year ended March 31, 2012 were as follows:
| | | | | | | |
| | | | | | | |
| |
| |
| Net investment income | | $ | 24,865,260 | | | |
| Net realized loss | | $ | (10,056,213 | ) | | |
| Net increase in net assets from operations | | $ | 58,599,841 | | | |
| | | | | | | |
| |
| |
Because the combined investment portfolios have been managed as a single integrated portfolio since the acquisition was completed, it is not practicable to separate the amounts of revenue and earnings of New Jersey Limited Fund that have been included in the National Limited Fund’s Statement of Operations since September 23, 2011.
As of the close of business on November 5, 2010, the National Limited Fund acquired the net assets of Eaton Vance California Limited Maturity Municipal Income Fund (California Limited Fund) pursuant to a plan of reorganization approved by the shareholders of California Limited Fund. The purpose of the transaction was to combine two funds managed by BMR with substantially similar investment objectives and policies. The acquisition was accomplished by a tax-free exchange of 2,132,312 shares of Class A of the National Limited Fund (valued at $21,691,369) for the 2,131,927 shares of Class A of California Limited Fund, 22,804 shares of Class B of the National Limited Fund (valued at $232,109) for the 22,881 shares of Class B of California Limited Fund, and 242,332 shares of Class C of the National Limited Fund (valued at $2,312,480) for the 235,057 shares of Class C of California Limited Fund, each outstanding on November 5, 2010. The investment portfolio of California Limited Fund, with a fair value of $22,772,001 and identified cost of $21,460,937 was the principal asset acquired by the National Limited Fund. For financial reporting purposes, assets received and shares issued by the National Limited Fund were recorded at fair value; however, the identified cost of the investments received from the California Limited Fund was carried forward to align ongoing reporting of the National Limited Fund’s realized and unrealized gains and losses with amounts distributable to shareholders for tax purposes. The aggregate net assets of the National Limited Fund immediately before the acquisition were $720,762,615. The net assets of California Limited Fund at that date of $24,235,958, including $2,315,192 of accumulated net realized losses and $1,311,064 of unrealized appreciation, were combined with those of the National Limited Fund, resulting in combined net assets of $744,998,573.
Assuming the acquisition had been completed on April 1, 2010, the beginning of the National Limited Fund’s annual reporting period, the National Limited Fund’s pro forma results of operations for the year ended March 31, 2011 are as follows:
| | | | | | | |
| |
| |
| Net investment income | | $ | 26,042,552 | | | |
| Net realized loss | | $ | (9,919,309 | ) | | |
| Net increase in net assets from operations | | $ | 9,003,912 | | | |
| | | | | | | |
| |
| |
Because the combined investment portfolios have been managed as a single integrated portfolio since the acquisition was completed, it is not practicable to separate the amounts of revenue and earnings of California Limited Fund since November 5, 2010 through March 31, 2011.
45
Eaton Vance
Limited Maturity Municipal Income Funds
March 31, 2012
Report of Independent Registered Public Accounting Firm
To the Trustees of Eaton Vance Investment Trust and Shareholders of Eaton Vance AMT-Free Limited Maturity Municipal Income Fund and Eaton Vance National Limited Maturity Municipal Income Fund:
We have audited the accompanying statements of assets and liabilities of Eaton Vance AMT-Free Limited Maturity Municipal Income Fund and Eaton Vance National Limited Maturity Municipal Income Fund (collectively, the “Funds”) (certain of the funds constituting Eaton Vance Investment Trust), including the portfolios of investments, as of March 31, 2012, and the related statements of operations for the year then ended, the statements of changes in net assets for each of the two years in the period then ended, and the financial highlights for each of the five years in the period then ended. These financial statements and financial highlights are the responsibility of the Funds’ management. Our responsibility is to express an opinion on these financial statements and financial highlights based on our audits.
We conducted our audits in accordance with the standards of the Public Company Accounting Oversight Board (United States). Those standards require that we plan and perform the audits to obtain reasonable assurance about whether the financial statements and financial highlights are free of material misstatement. The Funds are not required to have, nor were we engaged to perform, an audit of its internal control over financial reporting. Our audits included consideration of internal control over financial reporting as a basis for designing audit procedures that are appropriate in the circumstances, but not for the purpose of expressing an opinion on the effectiveness of the Funds’ internal control over financial reporting. Accordingly, we express no such opinion. An audit also includes examining, on a test basis, evidence supporting the amounts and disclosures in the financial statements, assessing the accounting principles used and significant estimates made by management, as well as evaluating the overall financial statement presentation. Our procedures included confirmation of securities owned as of March 31, 2012, by correspondence with the custodian and brokers; where replies were not received from brokers, we performed other auditing procedures. We believe that our audits provide a reasonable basis for our opinion.
In our opinion, the financial statements and financial highlights referred to above present fairly, in all material respects, the financial positions of Eaton Vance AMT-Free Limited Maturity Municipal Income Fund and Eaton Vance National Limited Maturity Municipal Income Fund as of March 31, 2012, the results of their operations for the year then ended, the changes in their net assets for each of the two years in the period then ended, and the financial highlights for each of the five years in the period then ended, in conformity with accounting principles generally accepted in the United States of America.
DELOITTE & TOUCHE LLP
Boston, Massachusetts
May 18, 2012
46
Eaton Vance
Limited Maturity Municipal Income Funds
March 31, 2012
Federal Tax Information (Unaudited)
The Form 1099-DIV you receive in January 2013 will show the tax status of all distributions paid to your account in calendar year 2012. Shareholders are advised to consult their own tax adviser with respect to the tax consequences of their investment in a Fund. As required by the Internal Revenue Code and/or regulations, shareholders must be notified regarding exempt-interest dividends.
Exempt-Interest Dividends. The Funds designate the following percentages of dividends from net investment income as exempt-interest dividends:
| | | | | | | |
| AMT-Free Limited Maturity Municipal Income Fund | | | 99.99 | % | | |
| | | | | | | |
| National Limited Maturity Municipal Income Fund | | | 99.06 | % | | |
47
Eaton Vance
Limited Maturity Municipal Income Funds
March 31, 2012
Management and Organization
Fund Management. The Trustees of Eaton Vance Investment Trust (the Trust) are responsible for the overall management and supervision of the Trust’s affairs. The Trustees and officers of the Trust are listed below. Except as indicated, each individual has held the office shown or other offices in the same company for the last five years. Trustees and officers of the Trust hold indefinite terms of office. The “Noninterested Trustees” consist of those Trustees who are not “interested persons” of the Trust, as that term is defined under the 1940 Act. The business address of each Trustee and officer is Two International Place, Boston, Massachusetts 02110. As used below, “EVC” refers to Eaton Vance Corp., “EV” refers to Eaton Vance, Inc., “EVM” refers to Eaton Vance Management, “BMR” refers to Boston Management and Research and “EVD” refers to Eaton Vance Distributors, Inc. EVC and EV are the corporate parent and trustee, respectively, of EVM and BMR. EVD is the Funds’ principal underwriter and a wholly-owned subsidiary of EVC. Each officer affiliated with Eaton Vance may hold a position with other Eaton Vance affiliates that is comparable to his or her position with EVM listed below. Each Trustee oversees 180 portfolios in the Eaton Vance Complex (including all master and feeder funds in a master feeder structure). Each officer serves as an officer of certain other Eaton Vance funds. Each Trustee and officer serves until his or her successor is elected.
| | | | | | | |
| | | Position(s)
| | | | |
| | | with the
| | Length of
| | Principal Occupation(s) and Directorships
|
| Name and Year of Birth | | Trust | | Service | | During Past Five Years and Other Relevant Experience |
| |
| |
| |
| Interested Trustee |
| | | | | | | |
Thomas E. Faust Jr.
1958 | | Trustee | | Since 2007 | | Chairman, Chief Executive Officer and President of EVC, Director and President of EV, Chief Executive Officer and President of EVM and BMR, and Director of EVD. Trustee and/or officer of 180 registered investment companies. Mr. Faust is an interested person because of his positions with EVM, BMR, EVD, EVC and EV, which are affiliates of the Trust.
Directorships in the Last Five Years.(1) Director of EVC. |
| |
| Noninterested Trustees |
| | | | | | | |
Scott E. Eston
1956 | | Trustee | | Since 2011 | | Private investor. Formerly held various positions at Grantham, Mayo, Van Otterloo and Co., L.L.C. (investment management firm) (1997-2009), including Chief Operating Officer (2002-2009), Chief Financial Officer (1997-2009) and Chairman of the Executive Committee (2002-2008); President and Principal Executive Officer, GMO Trust (open-end registered investment company) (2006-2009). Former Partner, Coopers and Lybrand L.L.P. (now PricewaterhouseCoopers) (public accounting firm) (1987-1997).
Directorships in the Last Five Years. None. |
| | | | | | | |
Benjamin C. Esty
1963 | | Trustee | | Since 2005 | | Roy and Elizabeth Simmons Professor of Business Administration and Finance Unit Head, Harvard University Graduate School of Business Administration.
Directorships in the Last Five Years.(1) None. |
| | | | | | | |
Allen R. Freedman
1940 | | Trustee | | Since 2007 | | Private Investor. Former Chairman (2002-2004) and a Director (1983-2004) of Systems & Computer Technology Corp. (provider of software to higher education). Formerly, a Director of Loring Ward International (fund distributor) (2005-2007). Former Chairman and a Director of Indus International, Inc. (provider of enterprise management software to the power generating industry) (2005-2007). Former Chief Executive Officer of Assurant, Inc. (insurance provider) (1979-2000).
Directorships in the Last Five Years.(1) Director of Stonemor Partners, L.P. (owner and operator of cemeteries). Formerly, Director of Assurant, Inc. (insurance provider) (1979-2011). |
| | | | | | | |
William H. Park
1947 | | Trustee | | Since 2003 | | Consultant and private investor. Formerly, Chief Financial Officer, Aveon Group L.P. (investment management firm) (2010-2011). Formerly, Vice Chairman, Commercial Industrial Finance Corp. (specialty finance company) (2006-2010). Formerly, President and Chief Executive Officer, Prizm Capital Management, LLC (investment management firm) (2002-2005). Formerly, Executive Vice President and Chief Financial Officer, United Asset Management Corporation (investment management firm) (1982-2001). Formerly, Senior Manager, Price Waterhouse (now PricewaterhouseCoopers) (an independent registered public accounting firm) (1972-1981).
Directorships in the Last Five Years.(1) None. |
| | | | | | | |
Ronald A. Pearlman
1940 | | Trustee | | Since 2003 | | Professor of Law, Georgetown University Law Center. Formerly, Deputy Assistant Secretary (Tax Policy) and Assistant Secretary (Tax Policy), U.S. Department of the Treasury (1983-1985). Formerly, Chief of Staff, Joint Committee on Taxation, U.S. Congress (1988-1990).
Directorships in the Last Five Years.(1) None. |
48
Eaton Vance
Limited Maturity Municipal Income Funds
March 31, 2012
Management and Organization — continued
| | | | | | | |
| | | Position(s)
| | | | |
| | | with the
| | Length of
| | Principal Occupation(s) and Directorships
|
| Name and Year of Birth | | Trust | | Service | | During Past Five Years and Other Relevant Experience |
| |
| |
| Noninterested Trustees (continued) |
| | | | | | | |
Helen Frame Peters
1948 | | Trustee | | Since 2008 | | Professor of Finance, Carroll School of Management, Boston College. Formerly, Dean, Carroll School of Management, Boston College (2000-2002). Formerly, Chief Investment Officer, Fixed Income, Scudder Kemper Investments (investment management firm) (1998-1999). Formerly, Chief Investment Officer, Equity and Fixed Income, Colonial Management Associates (investment management firm) (1991-1998).
Directorships in the Last Five Years.(1) Formerly, Director of BJ’s Wholesale Club, Inc. (wholesale club retailer) (2004-2011). Formerly, Trustee of SPDR Index Shares Funds and SPDR Series Trust (exchange traded funds) (2000-2009). Formerly, Director of Federal Home Loan Bank of Boston (a bank for banks) (2007-2009). |
| | | | | | | |
Lynn A. Stout
1957 | | Trustee | | Since 1998 | | Distinguished Professor of Corporate and Business Law, Jack C. Clarke Business Law Institute, Comell University Law School. Formerly, the Paul Hastings Professor of Corporate and Securities Law (2006-2012) and Professor of Law (2001-2006), University of California at Los Angeles School of Law.
Directorships in the Last Five Years.(1) None. |
| | | | | | | |
Harriett Tee Taggart
1948 | | Trustee | | Since 2011 | | Managing Director, Taggart Associates (a professional practice firm). Formerly, Partner and Senior Vice President, Wellington Management Company, LLP (investment management firm) (1983-2006).
Directorships in the Last Five Years. Director of Albemarle Corporation (chemicals manufacturer) (since 2007) and The Hanover Group (specialty property and casualty insurance company) (since 2009). Formerly, Director of Lubrizol Corporation (specialty chemicals) (2007-2011). |
| | | | | | | |
Ralph F. Verni
1943 | | Chairman of
the Board
and Trustee | | Chairman of the Board since 2007 and Trustee since 2005 | | Consultant and private investor. Formerly, Chief Investment Officer (1982-1992), Chief Financial Officer (1988-1990) and Director (1982-1992), New England Life. Formerly, Chairperson, New England Mutual Funds (1982-1992). Formerly, President and Chief Executive Officer, State Street Management & Research (1992-2000). Formerly, Chairperson, State Street Research Mutual Funds (1992-2000). Formerly, Director, W.P. Carey, LLC (1998-2004) and First Pioneer Farm Credit Corp. (2002-2006).
Directorships in the Last Five Years.(1) None. |
Principal Officers who are not Trustees
| | | | | | | |
| | | Position(s)
| | | | |
| | | with the
| | Length of
| | Principal Occupation(s)
|
| Name and Year of Birth | | Trust | | Service | | During Past Five Years |
| |
Cynthia J. Clemson
1963 | | President | | Since 2005 | | Vice President of EVM and BMR. |
| | | | | | | |
Payson F. Swaffield
1956 | | Vice President | | Since 2011 | | Chief Income Investment Officer of EVC. Vice President of EVM and BMR. |
| | | | | | | |
Barbara E. Campbell
1957 | | Treasurer | | Since 2005 | | Vice President of EVM and BMR. |
| | | | | | | |
Maureen A. Gemma
1960 | | Vice President, Secretary and Chief Legal Officer | | Vice President since 2011, Secretary since 2007 and Chief Legal Officer since 2008 | | Vice President of EVM and BMR. |
| | | | | | | |
Paul M. O’Neil
1953 | | Chief Compliance Officer | | Since 2004 | | Vice President of EVM and BMR. |
| | |
| (1) | | During their respective tenures, the Trustees (except Mr. Eston and Ms. Taggart) also served as trustees of one or more of the following Eaton Vance funds (which operated in the years noted): Eaton Vance Credit Opportunities Fund (launched in 2005 and terminated in 2010); Eaton Vance Insured Florida Plus Municipal Bond Fund (launched in 2002 and terminated in 2009); and Eaton Vance National Municipal Income Trust (launched in 1998 and terminated in 2009). |
The SAI for the Funds includes additional information about the Trustees and officers of the Funds and can be obtained without charge on Eaton Vance’s website at www.eatonvance.com or by calling 1-800-262-1122.
49
Eaton Vance
Limited Maturity Municipal Income Funds
March 31, 2012
Privacy. The Eaton Vance organization is committed to ensuring your financial privacy. Each of the financial institutions identified below has in effect the following policy (Privacy Policy) with respect to nonpublic personal information about its customers:
| |
| • | Only such information received from you, through application forms or otherwise, and information about your Eaton Vance fund transactions will be collected. This may include information such as name, address, social security number, tax status, account balances and transactions. |
| |
| • | None of such information about you (or former customers) will be disclosed to anyone, except as permitted by law (which includes disclosure to employees necessary to service your account). In the normal course of servicing a customer’s account, Eaton Vance may share information with unaffiliated third parties that perform various required services such as transfer agents, custodians and broker/dealers. |
| |
| • | Policies and procedures (including physical, electronic and procedural safeguards) are in place that are designed to protect the confidentiality of such information. |
| |
| • | We reserve the right to change our Privacy Policy at any time upon proper notification to you. Customers may want to review our Privacy Policy periodically for changes by accessing the link on our homepage: www.eatonvance.com. |
Our pledge of privacy applies to the following entities within the Eaton Vance organization: the Eaton Vance Family of Funds, Eaton Vance Management, Eaton Vance Investment Counsel, Eaton Vance Distributors, Inc., Eaton Vance Trust Company, Eaton Vance Management’s Real Estate Investment Group and Boston Management and Research. In addition, our Privacy Policy applies only to those Eaton Vance customers who are individuals and who have a direct relationship with us. If a customer’s account (i.e., fund shares) is held in the name of a third-party financial advisor/broker-dealer, it is likely that only such advisor’s privacy policies apply to the customer. This notice supersedes all previously issued privacy disclosures. For more information about Eaton Vance’s Privacy Policy, please call 1-800-262-1122.
Delivery of Shareholder Documents. The Securities and Exchange Commission (the “SEC”) permits funds to deliver only one copy of shareholder documents, including prospectuses, proxy statements and shareholder reports, to fund investors with multiple accounts at the same residential or post office box address. This practice is often called “householding” and it helps eliminate duplicate mailings to shareholders. Eaton Vance, or your financial adviser, may household the mailing of your documents indefinitely unless you instruct Eaton Vance, or your financial adviser, otherwise. If you would prefer that your Eaton Vance documents not be householded, please contact Eaton Vance at 1-800-262-1122, or contact your financial adviser. Your instructions that householding not apply to delivery of your Eaton Vance documents will be effective within 30 days of receipt by Eaton Vance or your financial adviser.
Portfolio Holdings. Each Eaton Vance Fund and its underlying Portfolio(s) (if applicable) will file a schedule of portfolio holdings on Form N-Q with the SEC for the first and third quarters of each fiscal year. The Form N-Q will be available on the Eaton Vance website at www.eatonvance.com, by calling Eaton Vance at 1-800-262-1122 or in the EDGAR database on the SEC’s website at www.sec.gov. Form N-Q may also be reviewed and copied at the SEC’s public reference room in Washington, D.C. (call 1-800-732-0330 for information on the operation of the public reference room).
Proxy Voting. From time to time, funds are required to vote proxies related to the securities held by the funds. The Eaton Vance Funds or their underlying Portfolios (if applicable) vote proxies according to a set of policies and procedures approved by the Funds’ and Portfolios’ Boards. You may obtain a description of these policies and procedures and information on how the Funds or Portfolios voted proxies relating to portfolio securities during the most recent 12-month period ended June 30, without charge, upon request, by calling 1-800-262-1122. This description is also available on the SEC’s website at www.sec.gov.
50
This Page Intentionally Left Blank
This Page Intentionally Left Blank
Investment Adviser
Boston Management and Research
Two International Place
Boston, MA 02110
Administrator
Eaton Vance Management
Two International Place
Boston, MA 02110
Principal Underwriter*
Eaton Vance Distributors, Inc.
Two International Place
Boston, MA 02110
(617) 482-8260
Custodian
State Street Bank and Trust Company
200 Clarendon Street
Boston, MA 02116
Transfer Agent
BNY Mellon Investment Servicing (US) Inc.
Attn: Eaton Vance Funds
P.O. Box 9653
Providence, RI 02940-9653
(800) 262-1122
Independent Registered Public Accounting Firm
Deloitte & Touche LLP
200 Berkeley Street
Boston, MA 02116-5022
Fund Offices
Two International Place
Boston, MA 02110
| |
| * | FINRA BrokerCheck. Investors may check the background of their Investment Professional by contacting the Financial Industry Regulatory Authority (FINRA). FINRA BrokerCheck is a free tool to help investors check the professional background of current and former FINRA-registered securities firms and brokers. FINRA BrokerCheck is available by calling 1-800-289-9999 and at www.FINRA.org. The FINRA BrokerCheck brochure describing this program is available to investors at www.FINRA.org. |
| | | |
Eaton Vance
Limited Maturity Municipal
Income Funds
Annual Report
March 31, 2012 | |
 |
Massachusetts • New York • Pennsylvania
Fund shares are not insured by the FDIC and are not deposits or other obligations of, or guaranteed by, any depository institution. Shares are subject to investment risks, including possible loss of principal invested.
This report must be preceded or accompanied by a current summary prospectus or prospectus. Before investing, investors should consider carefully the investment objective, risks, and charges and expenses of a mutual fund. This and other important information is contained in the summary prospectus and prospectus, which can be obtained from a financial advisor. Prospective investors should read the prospectus carefully before investing. For further information, please call 1-800-262-1122.
Annual Report March 31, 2012
Eaton Vance
Limited Maturity Municipal Income Funds
Table of Contents
| | | | | |
| Management’s Discussion of Fund Performance | | | 2 | |
| Performance and Fund Profile | | | | |
| | | | | |
| Massachusetts Limited Maturity Municipal Income Fund | | | 4 | |
| |
| New York Limited Maturity Municipal Income Fund | | | 6 | |
| |
| Pennsylvania Limited Maturity Municipal Income Fund | | | 8 | |
| | | | | |
| Endnotes and Additional Disclosures | | | 10 | |
| Fund Expenses | | | 11 | |
| Financial Statements | | | 13 | |
| Report of Independent Registered Public Accounting Firm | | | 49 | |
| Federal Tax Information | | | 50 | |
| Management and Organization | | | 51 | |
| Important Notices | | | 53 | |
Eaton Vance
Limited Maturity Municipal Income Funds
March 31, 2012
Management’s Discussion of Fund Performance1
Economic and Market Conditions
In early 2011, just prior to the start of the Funds’ fiscal year, economic indicators seemed to show that a modest recovery was under way. But in the second quarter of 2011, Europe’s sovereign debt problems began to intensify, causing investors to worry about the potential impact on the U.S. economy and U.S. banks.
Meanwhile, unemployment remained stubbornly high, the housing market was stagnant, and Congressional wrangling over the debt ceiling led Standard & Poor’s (S&P) to downgrade U.S. Treasuries. Reacting to this turmoil, the S&P 500 Index2 fell more than 15% in just over two weeks during late July and early August of 2011 and spent the next several months clawing its way back.
Beginning in mid-December of 2011, a sustained equity market rally took hold and continued through the end of the fiscal year, fueled by strong economic growth in the fourth quarter, falling unemployment claims, an uptick in hiring and a restructuring of Greek sovereign debt that made investors more comfortable with the situation in Europe. After 12 tumultuous months, the S&P 500 Index finished the period with an 8.54% gain. Overseas, however, both developed and emerging equity markets suffered significant losses during the same timeframe.
Against this backdrop, bond investors became increasingly risk-averse, as economic indicators began to suggest that the U.S. economy was not as strong as first perceived, and European sovereign debt problems became front-page news. As a result, Treasury prices rose and yields fell significantly from April through September of 2011. By October, Treasury rates had settled into a relatively stable trading range that lasted through the end of the period on March 31, 2012.
Early in the period, municipal bonds rallied along with Treasuries, but not to the same degree, because investors were still concerned about the ability of state and local governments to address historically large fiscal deficits and balance their budgets. As the period wore on, however, several factors caused performance of municipals to improve. The massive municipal defaults predicted by high-profile market analysts did not materialize, while the fiscal situation for many issuers began to recover.
As the fear that had hung over the municipal market subsided and investors appeared more comfortable taking on risk, lower-rated municipals outperformed higher-rated issues and longer-maturity bonds outperformed those with shorter maturities.
Fund Performance
For the fiscal year ending March 31, 2012, the Massachusetts, New York and Pennsylvania Funds’ shares at net asset value (NAV) underperformed the Funds’ primary benchmark, the Barclays Capital 7 Year Municipal Bond Index (the Index), an unmanaged index of municipal bonds traded in the U.S. with maturities ranging from 6 to 8 years.
Generally speaking, the Funds’ overall strategy is to invest primarily in limited maturity bonds with about 6–10 years remaining to maturity, in order to capture attractive yields but avoid the potentially higher interest rate risk and volatility of longer-maturity bonds. In effect, investors in the Funds give up some of the higher potential yields of longer-maturity bonds in return for the potentially lower volatility and greater price stability of limited maturity issues.
While the Index includes only bonds with maturities of 6–8 years, the Funds tend to own securities with maturities up to about 10 years, in order to capture their typically higher yields and greater income payments. The Funds hedge to various degrees against the greater risk of volatility in the 8–10 year part of the curve by using Treasury futures to provide downside protection. The Funds may also diversify into securities with shorter maturities than those in the Index.
For the 12-month period, the Funds’ underperformance to the benchmark resulted in part from their hedging strategy. Hedging interest rate volatility, a risk management strategy, is intended to moderate performance on both the upside and the downside. So in a period when municipal bonds saw strong performance, the Funds’ hedge mitigated a portion of their positive performance and, as intended, reduced the Funds’ volatility during a year of rather pronounced market volatility.
In addition, performance of all three Funds was negatively impacted by holdings in the 0–5 year maturity range, which are not represented in the Index and which underperformed relative to longer-maturity bonds.
See Endnotes and Additional Disclosures in this report.
Past performance is no guarantee of future results. Returns are historical and are calculated by determining the percentage change in net asset value (NAV) or offering price (as applicable) with all distributions reinvested. Investment return and principal value will fluctuate so that shares, when redeemed, may be worth more or less than their original cost. Performance less than one year is cumulative. Performance is for the stated time period only; due to market volatility, the Fund’s current performance may be lower or higher than quoted. Returns are before taxes unless otherwise noted. For performance as of the most recent month end, please refer to www.eatonvance.com.
2
Eaton Vance
Limited Maturity Municipal Income Funds
March 31, 2012
Management’s Discussion of Fund Performance—continued
State-specific Results
Eaton Vance Massachusetts Limited Maturity Municipal Income Fund’s Class A shares at NAV had a total return of 7.43%, underperforming the 9.80% return of the Index. As noted above, the key detractors were the hedging strategy and an overweight in bonds with 0–5 years remaining to maturity. Relative performance versus the Index was helped, however, by overweights in the hospital and industrial development revenue (IDR) sectors, which performed strongly during the period, and by security selection in AAA-rated6 issues.
Eaton Vance New York Limited Maturity Municipal Income Fund’s Class A shares at NAV returned 7.30%, trailing the 9.80% return of the Index. In addition to the detractors noted above, an underweighting in general obligation bonds, which outpaced the overall market, also held back results. Relative contributors to performance versus the Index included overweights in the hospital and IDR sectors and in 5.5% to 6.5% coupon bonds, all of which performed well during the period.
Eaton Vance Pennsylvania Limited Maturity Municipal Income Fund’s Class A shares at NAV had a total return of 7.17%, lagging the 9.80% return of the Index. Along with the detractors mentioned above, performance was hurt by a credit event at one of the Fund’s airline holdings, when the carrier declared bankruptcy and the value of its bonds declined. In contrast, relative results versus the Index benefited from overweights in the strong-performing hospital and education sectors and in longer-maturity issues, which outperformed shorter-maturity credits during the period.
See Endnotes and Additional Disclosures in this report.
Past performance is no guarantee of future results. Returns are historical and are calculated by determining the percentage change in net asset value (NAV) or offering price (as applicable) with all distributions reinvested. Investment return and principal value will fluctuate so that shares, when redeemed, may be worth more or less than their original cost. Performance less than one year is cumulative. Performance is for the stated time period only; due to market volatility, the Fund’s current performance may be lower or higher than quoted. Returns are before taxes unless otherwise noted. For performance as of the most recent month end, please refer to www.eatonvance.com.
3
Eaton Vance
Massachusetts Limited Maturity Municipal Income Fund
March 31, 2012
Portfolio Manager William H. Ahern, Jr., CFA
| | | | | | | | | | | | | | | | | | | | | |
| | | | | | | | | | | | | | | | | | | Since |
| % Average Annual Total Returns | | Inception Date | | One Year | | Five Years | | Ten Years | | Inception |
| |
| Class A at NAV | | | 6/27/1996 | | | | 7.43 | % | | | 3.65 | % | | | 3.94 | % | | | — | |
| Class A with 2.25% Maximum Sales Charge | | | — | | | | 4.98 | | | | 3.19 | | | | 3.71 | | | | — | |
| Class B at NAV | | | 6/1/1992 | | | | 6.64 | | | | 2.86 | | | | 3.16 | | | | — | |
| Class B with 3% Maximum Sales Charge | | | — | | | | 3.64 | | | | 2.86 | | | | 3.16 | | | | — | |
| Class C at NAV | | | 12/8/1993 | | | | 6.71 | | | | 2.89 | | | | 3.16 | | | | — | |
| Class C with 1% Maximum Sales Charge | | | — | | | | 5.71 | | | | 2.89 | | | | 3.16 | | | | — | |
| Class I at NAV | | | 8/3/2010 | | | | 7.59 | | | | — | | | | — | | | | 3.62 | % |
| |
| Barclays Capital 7 Year Municipal Bond Index | | | — | | | | 9.80 | % | | | 6.24 | % | | | 5.56 | % | | | — | |
| | | | | | | | | | | | | | | | | | | | | |
| % Total Annual Operating Expense Ratios4 | | | | | | Class A | | Class B | | Class C | | Class I |
| |
| | | | | | | | 0.81 | % | | | 1.56 | % | | | 1.56 | % | | | 0.67 | % |
| | | | | | | | | | | | | | | | | | | | | |
| % Distribution Rates/Yields5 | | | | | | Class A | | Class B | | Class C | | Class I |
| |
| Distribution Rate | | | | | | | 2.93 | % | | | 2.21 | % | | | 2.21 | % | | | 3.08 | % |
| Taxable-Equivalent Distribution Rate | | | | | | | 4.76 | | | | 3.59 | | | | 3.59 | | | | 5.00 | |
| SEC 30-day Yield | | | | | | | 1.40 | | | | 0.69 | | | | 0.69 | | | | 1.59 | |
| Taxable-Equivalent SEC 30-day Yield | | | | | | | 2.27 | | | | 1.12 | | | | 1.12 | | | | 2.58 | |
This graph shows the change in value of a hypothetical investment of $10,000 in Class A of the Fund for the period indicated. For comparison, the same investment is shown in the indicated index.
| | | | | | | | | | | | | |
| | | | | | | | | | | With Maximum |
| | | Period Beginning | | At NAV | | Sales Charge |
| |
| Class B | | | 3/31/02 | | | $ | 13,653 | | | | N.A. | |
| |
| Class C | | | 3/31/02 | | | $ | 13,652 | | | | N.A. | |
| |
| Class I | | | 8/3/10 | | | $ | 10,609 | | | | N.A. | |
| |
See Endnotes and Additional Disclosures in this report.
Past performance is no guarantee of future results. Returns are historical and are calculated by determining the percentage change in net asset value (NAV) or offering price (as applicable) with all distributions reinvested. Investment return and principal value will fluctuate so that shares, when redeemed, may be worth more or less than their original cost. Performance less than one year is cumulative. Performance is for the stated time period only; due to market volatility, the Fund’s current performance may be lower or higher than quoted. Returns are before taxes unless otherwise noted. For performance as of the most recent month end, please refer to www.eatonvance.com.
4
Eaton Vance
Massachusetts Limited Maturity Municipal Income Fund
March 31, 2012
Credit Quality (% of total investments)6
See Endnotes and Additional Disclosures in this report.
5
Eaton Vance
New York Limited Maturity Municipal Income Fund
March 31, 2012
Portfolio Manager William H. Ahern, Jr., CFA
| | | | | | | | | | | | | | | | | | | | | |
| | | | | | | | | | | | | | | | | | | Since |
| % Average Annual Total Returns | | Inception Date | | One Year | | Five Years | | Ten Years | | Inception |
| |
| Class A at NAV | | | 6/27/1996 | | | | 7.30 | % | | | 3.25 | % | | | 3.78 | % | | | — | |
| Class A with 2.25% Maximum Sales Charge | | | — | | | | 4.88 | | | | 2.79 | | | | 3.54 | | | | — | |
| Class B at NAV | | | 5/29/1992 | | | | 6.60 | | | | 2.50 | | | | 3.02 | | | | — | |
| Class B with 3% Maximum Sales Charge | | | — | | | | 3.60 | | | | 2.50 | | | | 3.02 | | | | — | |
| Class C at NAV | | | 12/8/1993 | | | | 6.47 | | | | 2.50 | | | | 3.00 | | | | — | |
| Class C with 1% Maximum Sales Charge | | | — | | | | 5.47 | | | | 2.50 | | | | 3.00 | | | | — | |
| Class I at NAV | | | 8/3/2010 | | | | 7.56 | | | | — | | | | — | | | | 3.69 | % |
| |
| Barclays Capital 7 Year Municipal Bond Index | | | — | | | | 9.80 | % | | | 6.24 | % | | | 5.56 | % | | | — | |
| | | | | | | | | | | | | | | | | | | | | |
| % Total Annual Operating Expense Ratios4 | | | | | | Class A | | Class B | | Class C | | Class I |
| |
| | | | | | | | 0.78 | % | | | 1.53 | % | | | 1.53 | % | | | 0.63 | % |
| | | | | | | | | | | | | | | | | | | | | |
| % Distribution Rates/Yields5 | | | | | | Class A | | Class B | | Class C | | Class I |
| |
| Distribution Rate | | | | | | | 3.04 | % | | | 2.32 | % | | | 2.32 | % | | | 3.19 | % |
| Taxable-Equivalent Distribution Rate | | | | | | | 5.13 | | | | 3.91 | | | | 3.91 | | | | 5.38 | |
| SEC 30-day Yield | | | | | | | 1.55 | | | | 0.84 | | | | 0.84 | | | | 1.73 | |
| Taxable-Equivalent SEC 30-day Yield | | | | | | | 2.62 | | | | 1.42 | | | | 1.42 | | | | 2.92 | |
This graph shows the change in value of a hypothetical investment of $10,000 in Class A of the Fund for the period indicated. For comparison, the same investment is shown in the indicated index.
| | | | | | | | | | | | | |
| | | | | | | | | | | With Maximum |
| | | Period Beginning | | At NAV | | Sales Charge |
| |
| Class B | | | 3/31/02 | | | $ | 13,466 | | | | N.A. | |
| |
| Class C | | | 3/31/02 | | | $ | 13,437 | | | | N.A. | |
| |
| Class I | | | 8/3/10 | | | $ | 10,621 | | | | N.A. | |
| |
See Endnotes and Additional Disclosures in this report.
Past performance is no guarantee of future results. Returns are historical and are calculated by determining the percentage change in net asset value (NAV) or offering price (as applicable) with all distributions reinvested. Investment return and principal value will fluctuate so that shares, when redeemed, may be worth more or less than their original cost. Performance less than one year is cumulative. Performance is for the stated time period only; due to market volatility, the Fund’s current performance may be lower or higher than quoted. Returns are before taxes unless otherwise noted. For performance as of the most recent month end, please refer to www.eatonvance.com.
6
Eaton Vance
New York Limited Maturity Municipal Income Fund
March 31, 2012
Credit Quality (% of total investments)6
See Endnotes and Additional Disclosures in this report.
7
Eaton Vance
Pennsylvania Limited Maturity Municipal Income Fund
March 31, 2012
Portfolio Manager Adam A. Weigold, CFA
| | | | | | | | | | | | | | | | | | | | | |
| | | | | | | | | | | | | | | | | | | Since |
| % Average Annual Total Returns | | Inception Date | | One Year | | Five Years | | Ten Years | | Inception |
| |
| Class A at NAV | | | 6/27/1996 | | | | 7.17 | % | | | 3.41 | % | | | 3.95 | % | | | — | |
| Class A with 2.25% Maximum Sales Charge | | | — | | | | 4.72 | | | | 2.93 | | | | 3.71 | | | | — | |
| Class B at NAV | | | 6/1/1992 | | | | 6.38 | | | | 2.64 | | | | 3.18 | | | | — | |
| Class B with 3% Maximum Sales Charge | | | — | | | | 3.38 | | | | 2.64 | | | | 3.18 | | | | — | |
| Class C at NAV | | | 12/8/1993 | | | | 6.36 | | | | 2.63 | | | | 3.16 | | | | — | |
| Class C with 1% Maximum Sales Charge | | | — | | | | 5.36 | | | | 2.63 | | | | 3.16 | | | | — | |
| Class I at NAV | | | 8/3/2010 | | | | 7.32 | | | | — | | | | — | | | | 3.54 | % |
| |
| Barclays Capital 7 Year Municipal Bond Index | | | — | | | | 9.80 | % | | | 6.24 | % | | | 5.56 | % | | | — | |
| | | | | | | | | | | | | | | | | | | | | |
| % Total Annual Operating Expense Ratios4 | | | | | | Class A | | Class B | | Class C | | Class I |
| |
| | | | | | | | 0.82 | % | | | 1.57 | % | | | 1.57 | % | | | 0.67 | % |
| | | | | | | | | | | | | | | | | | | | | |
| % Distribution Rates/Yields5 | | | | | | Class A | | Class B | | Class C | | Class I |
| |
| Distribution Rate | | | | | | | 3.09 | % | | | 2.37 | % | | | 2.37 | % | | | 3.24 | % |
| Taxable-Equivalent Distribution Rate | | | | | | | 4.90 | | | | 3.76 | | | | 3.76 | | | | 5.14 | |
| SEC 30-day Yield | | | | | | | 1.91 | | | | 1.21 | | | | 1.21 | | | | 2.10 | |
| Taxable-Equivalent SEC 30-day Yield | | | | | | | 3.03 | | | | 1.92 | | | | 1.92 | | | | 3.33 | |
This graph shows the change in value of a hypothetical investment of $10,000 in Class A of the Fund for the period indicated. For comparison, the same investment is shown in the indicated index.
| | | | | | | | | | | | | |
| | | | | | | | | | | With Maximum |
| | | Period Beginning | | At NAV | | Sales Charge |
| |
| Class B | | | 3/31/02 | | | $ | 13,674 | | | | N.A. | |
| |
| Class C | | | 3/31/02 | | | $ | 13,658 | | | | N.A. | |
| |
| Class I | | | 8/3/10 | | | $ | 10,596 | | | | N.A. | |
| |
See Endnotes and Additional Disclosures in this report.
Past performance is no guarantee of future results. Returns are historical and are calculated by determining the percentage change in net asset value (NAV) or offering price (as applicable) with all distributions reinvested. Investment return and principal value will fluctuate so that shares, when redeemed, may be worth more or less than their original cost. Performance less than one year is cumulative. Performance is for the stated time period only; due to market volatility, the Fund’s current performance may be lower or higher than quoted. Returns are before taxes unless otherwise noted. For performance as of the most recent month end, please refer to www.eatonvance.com.
8
Eaton Vance
Pennsylvania Limited Maturity Municipal Income Fund
March 31, 2012
Credit Quality (% of total investments)6
See Endnotes and Additional Disclosures in this report.
9
Eaton Vance
Limited Maturity Municipal Income Funds
March 31, 2012
Endnotes and Additional Disclosures
| | |
| 1 | | The views expressed in this report are those of the portfolio manager(s) and are current only through the date stated at the top of this page. These views are subject to change at any time based upon market or other conditions, and Eaton Vance and the Fund(s) disclaim any responsibility to update such views. These views may not be relied upon as investment advice and, because investment decisions are based on many factors, may not be relied upon as an indication of trading intent on behalf of any Eaton Vance fund. This commentary may contain statements that are not historical facts, referred to as forward looking statements. The Fund’s actual future results may differ significantly from those stated in any forward looking statement, depending on factors such as changes in securities or financial markets or general economic conditions, the volume of sales and purchases of Fund shares, the continuation of investment advisory, administrative and service contracts, and other risks discussed from time to time in the Fund’s filings with the Securities and Exchange Commission. |
| |
| 2 | | S&P 500 Index is an unmanaged index of large-cap stocks commonly used as a measure of U.S. stock market performance. Barclays Capital 7 Year Municipal Bond Index is an unmanaged index of municipal bonds traded in the U.S. with maturities ranging from 6-8 years. Unless otherwise stated, index returns do not reflect the effect of any applicable sales charges, commissions, expenses, taxes or leverage, as applicable. It is not possible to invest directly in an index. |
| |
| 3 | | Total Returns at NAV do not include applicable sales charges. If sales charges were deducted, the returns would be lower. Total Returns shown with maximum sales charge reflect the stated maximum sales charge. Unless otherwise stated, performance does not reflect the deduction of taxes on Fund distributions or redemptions of Fund shares. |
| |
| 4 | | Source: Fund prospectus. |
| |
| 5 | | The Distribution Rate is based on the Fund’s last regular distribution per share in the period (annualized) divided by the Fund’s NAV at the end of the period. The Fund’s distributions may be composed of ordinary income, tax-exempt income, net realized capital gains and return of capital. Taxable-equivalent performance is based on the highest combined federal and state income tax rates, where applicable. Lower tax rates would result in lower tax-equivalent performance. Actual tax rates will vary depending on your income, exemptions and deductions. Rates do not include local taxes. SEC Yield is a standardized measure based on the estimated yield to maturity of a fund’s investments over a 30-day period and is based on the maximum offer price at the date specified. The SEC Yield is not based on the distributions made by the Fund, which may differ. |
| |
| 6 | | Ratings are based on Moody’s, S&P or Fitch, as applicable. Credit ratings are based largely on the rating agency’s investment analysis at the time of rating and the rating assigned to any particular security is not necessarily a reflection of the issuer’s current financial condition. The rating assigned to a security by a rating agency does not necessarily reflect its assessment of the volatility of a security’s market value or of the liquidity of an investment in the security. If securities are rated differently by the rating agencies, the higher rating is applied. |
| |
| | | Fund profile subject to change due to active management. |
| |
| | | Important Notice to Shareholders |
| | | Effective August 1, 2012, the Funds’ investment objectives are to provide current income exempt from regular federal income tax and applicable state and local taxes, and limited principal fluctuation. |
10
Eaton Vance
Limited Maturity Municipal Income Funds
March 31, 2012
Example: As a Fund shareholder, you incur two types of costs: (1) transaction costs, including sales charges (loads) on purchases and redemption fees (if applicable); and (2) ongoing costs, including management fees; distribution and/or service fees; and other Fund expenses. This Example is intended to help you understand your ongoing costs (in dollars) of Fund investing and to compare these costs with the ongoing costs of investing in other mutual funds. The Example is based on an investment of $1,000 invested at the beginning of the period and held for the entire period (October 1, 2011 – March 31, 2012).
Actual Expenses: The first section of each table below provides information about actual account values and actual expenses. You may use the information in this section, together with the amount you invested, to estimate the expenses that you paid over the period. Simply divide your account value by $1,000 (for example, an $8,600 account value divided by $1,000 = 8.6), then multiply the result by the number in the first section under the heading entitled “Expenses Paid During Period” to estimate the expenses you paid on your account during this period.
Hypothetical Example for Comparison Purposes: The second section of each table below provides information about hypothetical account values and hypothetical expenses based on the actual Fund expense ratio and an assumed rate of return of 5% per year (before expenses), which is not the actual Fund return. The hypothetical account values and expenses may not be used to estimate the actual ending account balance or expenses you paid for the period. You may use this information to compare the ongoing costs of investing in your Fund and other funds. To do so, compare this 5% hypothetical example with the 5% hypothetical examples that appear in the shareholder reports of the other funds.
Please note that the expenses shown in each table are meant to highlight your ongoing costs only and do not reflect any transactional costs, such as sales charges (loads) or redemption fees (if applicable). Therefore, the second section of each table is useful in comparing ongoing costs only, and will not help you determine the relative total costs of owning different funds. In addition, if these transactional costs were included, your costs would be higher.
Eaton Vance Massachusetts Limited Maturity Municipal Income Fund
| | | | | | | | | | | | | | | | | | | |
| | | Beginning
| | Ending
| | Expenses Paid
| | Annualized
| | |
| | | Account Value
| | Account Value
| | During Period*
| | Expense
| | |
| | | (10/1/11) | | (3/31/12) | | (10/1/11 – 3/31/12) | | Ratio | | |
| |
| |
Actual | | | | | | | | | | | | | | |
| Class A | | $ | 1,000.00 | | | $ | 1,026.10 | | | $ | 4.10 | | | | 0.81 | % | | |
| Class B | | $ | 1,000.00 | | | $ | 1,022.30 | | | $ | 7.89 | | | | 1.56 | % | | |
| Class C | | $ | 1,000.00 | | | $ | 1,022.80 | | | $ | 7.89 | | | | 1.56 | % | | |
| Class I | | $ | 1,000.00 | | | $ | 1,026.90 | | | $ | 3.34 | | | | 0.66 | % | | |
| | | | | | | | | | | | | | | | | | | |
| | | | | | | | | | | | | | | | | | | |
| |
| |
Hypothetical | | | | | | | | | | | | | | |
| (5% return per year before expenses) | | | | | | | | | | | | | | | | | | |
| Class A | | $ | 1,000.00 | | | $ | 1,021.00 | | | $ | 4.09 | | | | 0.81 | % | | |
| Class B | | $ | 1,000.00 | | | $ | 1,017.20 | | | $ | 7.87 | | | | 1.56 | % | | |
| Class C | | $ | 1,000.00 | | | $ | 1,017.20 | | | $ | 7.87 | | | | 1.56 | % | | |
| Class I | | $ | 1,000.00 | | | $ | 1,021.70 | | | $ | 3.34 | | | | 0.66 | % | | |
| |
| * | Expenses are equal to the Fund’s annualized expense ratio for the indicated Class, multiplied by the average account value over the period, multiplied by 183/366 (to reflect the one-half year period). The Example assumes that the $1,000 was invested at the net asset value per share determined at the close of business on September 30, 2011. |
11
Eaton Vance
Limited Maturity Municipal Income Funds
March 31, 2012
Fund Expenses — continued
Eaton Vance New York Limited Maturity Municipal Income Fund
| | | | | | | | | | | | | | | | | | | |
| | | Beginning
| | Ending
| | Expenses Paid
| | Annualized
| | |
| | | Account Value
| | Account Value
| | During Period*
| | Expense
| | |
| | | (10/1/11) | | (3/31/12) | | (10/1/11 – 3/31/12) | | Ratio | | |
| |
| |
Actual | | | | | | | | | | | | | | |
| Class A | | $ | 1,000.00 | | | $ | 1,030.50 | | | $ | 3.91 | | | | 0.77 | % | | |
| Class B | | $ | 1,000.00 | | | $ | 1,027.70 | | | $ | 7.71 | | | | 1.52 | % | | |
| Class C | | $ | 1,000.00 | | | $ | 1,026.30 | | | $ | 7.70 | | | | 1.52 | % | | |
| Class I | | $ | 1,000.00 | | | $ | 1,032.30 | | | $ | 3.20 | | | | 0.63 | % | | |
| | | | | | | | | | | | | | | | | | | |
| | | | | | | | | | | | | | | | | | | |
| |
| |
Hypothetical | | | | | | | | | | | | | | |
| (5% return per year before expenses) | | | | | | | | | | | | | | |
| Class A | | $ | 1,000.00 | | | $ | 1,021.20 | | | $ | 3.89 | | | | 0.77 | % | | |
| Class B | | $ | 1,000.00 | | | $ | 1,017.40 | | | $ | 7.67 | | | | 1.52 | % | | |
| Class C | | $ | 1,000.00 | | | $ | 1,017.40 | | | $ | 7.67 | | | | 1.52 | % | | |
| Class I | | $ | 1,000.00 | | | $ | 1,021.90 | | | $ | 3.18 | | | | 0.63 | % | | |
* Expenses are equal to the Fund’s annualized expense ratio for the indicated Class, multiplied by the average account value over the period, multiplied by 183/366 (to reflect the one-half year period). The Example assumes that the $1,000 was invested at the net asset value per share determined at the close of business on September 30, 2011. |
Eaton Vance Pennsylvania Limited Maturity Municipal Income Fund
| | | | | | | | | | | | | | | | | | | |
| | | Beginning
| | Ending
| | Expenses Paid
| | Annualized
| | |
| | | Account Value
| | Account Value
| | During Period*
| | Expense
| | |
| | | (10/1/11) | | (3/31/12) | | (10/1/11 – 3/31/12) | | Ratio | | |
| |
| |
Actual | | | | | | | | | | | | | | |
| Class A | | $ | 1,000.00 | | | $ | 1,027.50 | | | $ | 4.16 | | | | 0.82 | % | | |
| Class B | | $ | 1,000.00 | | | $ | 1,023.70 | | | $ | 7.94 | | | | 1.57 | % | | |
| Class C | | $ | 1,000.00 | | | $ | 1,022.10 | | | $ | 7.94 | | | | 1.57 | % | | |
| Class I | | $ | 1,000.00 | | | $ | 1,027.20 | | | $ | 3.40 | | | | 0.67 | % | | |
| | | | | | | | | | | | | | | | | | | |
| | | | | | | | | | | | | | | | | | | |
| |
| |
Hypothetical | | | | | | | | | | | | | | |
| (5% return per year before expenses) | | | | | | | | | | | | | | |
| Class A | | $ | 1,000.00 | | | $ | 1,020.90 | | | $ | 4.14 | | | | 0.82 | % | | |
| Class B | | $ | 1,000.00 | | | $ | 1,017.20 | | | $ | 7.92 | | | | 1.57 | % | | |
| Class C | | $ | 1,000.00 | | | $ | 1,017.20 | | | $ | 7.92 | | | | 1.57 | % | | |
| Class I | | $ | 1,000.00 | | | $ | 1,021.70 | | | $ | 3.39 | | | | 0.67 | % | | |
* Expenses are equal to the Fund’s annualized expense ratio for the indicated Class, multiplied by the average account value over the period, multiplied by 183/366 (to reflect the one-half year period). The Example assumes that the $1,000 was invested at the net asset value per share determined at the close of business on September 30, 2011. |
12
Eaton Vance
Massachusetts Limited Maturity Municipal Income Fund
March 31, 2012
| | | | | | | | | | | |
| Tax-Exempt Investments — 96.8% |
| |
| | | Principal
| | | | | | |
| | | Amount
| | | | | | |
| Security | | (000’s omitted) | | | Value | | | |
| |
| |
| |
| Bond Bank — 4.0% |
| |
| Massachusetts Water Pollution Abatement Trust, 5.00%, 8/1/21 | | $ | 1,000 | | | $ | 1,249,570 | | | |
| Massachusetts Water Pollution Abatement Trust, 5.00%, 8/1/25 | | | 1,000 | | | | 1,245,040 | | | |
| |
| |
| | | | | | | $ | 2,494,610 | | | |
| |
| |
| |
| |
| Education — 15.8% |
| |
| Massachusetts Health and Educational Facilities Authority, (Boston College), 5.375%, 6/1/14 | | $ | 770 | | | $ | 808,431 | | | |
| Massachusetts Health and Educational Facilities Authority, (College of the Holy Cross), 5.00%, 9/1/20 | | | 1,000 | | | | 1,174,870 | | | |
| Massachusetts Health and Educational Facilities Authority, (Harvard University), 5.50%, 11/15/36 | | | 1,055 | | | | 1,265,915 | | | |
| Massachusetts Health and Educational Facilities Authority, (Massachusetts Institute of Technology), 5.375%, 7/1/17 | | | 1,000 | | | | 1,224,180 | | | |
| Massachusetts Health and Educational Facilities Authority, (Massachusetts Institute of Technology), 5.50%, 7/1/22 | | | 1,645 | | | | 2,173,588 | | | |
| Massachusetts Health and Educational Facilities Authority, (Northeastern University), 5.00%, 10/1/24 | | | 500 | | | | 581,200 | | | |
| Massachusetts Health and Educational Facilities Authority, (Tufts University), 5.00%, 8/15/18 | | | 100 | | | | 120,836 | | | |
| Massachusetts Health and Educational Facilities Authority, (Tufts University), 5.25%, 8/15/19 | | | 200 | | | | 241,566 | | | |
| Massachusetts Health and Educational Facilities Authority, (Tufts University), 5.25%, 8/15/20 | | | 150 | | | | 179,049 | | | |
| Massachusetts Health and Educational Facilities Authority, (Tufts University), 5.50%, 8/15/15 | | | 750 | | | | 868,035 | | | |
| University of Massachusetts Building Authority, 5.00%, 5/1/20 | | | 1,000 | | | | 1,195,960 | | | |
| |
| |
| | | | | | | $ | 9,833,630 | | | |
| |
| |
| |
| |
| Electric Utilities — 5.4% |
| |
| Massachusetts Development Finance Agency, (Dominion Energy Brayton), 5.75% to 5/1/19 (Put Date), 12/1/42 | | $ | 1,000 | | | $ | 1,160,430 | | | |
| Puerto Rico Electric Power Authority, 5.25%, 7/1/25 | | | 2,000 | | | | 2,179,260 | | | |
| |
| |
| | | | | | | $ | 3,339,690 | | | |
| |
| |
| |
| |
| Escrowed / Prerefunded — 8.7% |
| |
| Massachusetts State Federal Highway Grant Anticipation Notes, Escrowed to Maturity, 0.00%, 6/15/15 | | $ | 2,000 | | | $ | 1,952,040 | | | |
| Massachusetts Turnpike Authority, Escrowed to Maturity, 5.00%, 1/1/13 | | | 265 | | | | 273,549 | | | |
| Massachusetts Turnpike Authority, Escrowed to Maturity, 5.00%, 1/1/20 | | | 2,100 | | | | 2,461,872 | | | |
| Massachusetts Water Pollution Abatement Trust, Escrowed to Maturity, 5.25%, 8/1/14 | | | 680 | | | | 721,997 | | | |
| |
| |
| | | | | | | $ | 5,409,458 | | | |
| |
| |
| |
| |
| General Obligations — 19.9% |
| |
| Brookline, 4.00%, 5/15/22 | | $ | 1,195 | | | $ | 1,399,668 | | | |
| Burlington, 5.00%, 2/1/15 | | | 500 | | | | 562,720 | | | |
| Burlington, 5.00%, 2/1/16 | | | 500 | | | | 578,555 | | | |
| Cambridge, 5.00%, 1/1/23 | | | 850 | | | | 1,056,584 | | | |
| Commonwealth of Massachusetts, 4.00%, 10/1/28 | | | 815 | | | | 868,407 | | | |
| Gloucester, 4.00%, 3/15/22 | | | 640 | | | | 725,062 | | | |
| Manchester Essex Regional School District, 5.00%, 1/15/20 | | | 1,000 | | | | 1,175,830 | | | |
| Medfield, 4.00%, 3/15/22 | | | 625 | | | | 726,631 | | | |
| Southborough, 3.00%, 6/1/21 | | | 1,060 | | | | 1,152,930 | | | |
| Wellesley, 5.00%, 6/1/16 | | | 1,100 | | | | 1,291,939 | | | |
| Wellesley, 5.00%, 6/1/17 | | | 1,150 | | | | 1,382,714 | | | |
| Westwood, 3.00%, 6/1/21 | | | 1,320 | | | | 1,435,725 | | | |
| |
| |
| | | | | | | $ | 12,356,765 | | | |
| |
| |
| |
| |
| Hospital — 11.2% |
| |
| Massachusetts Development Finance Agency, (Tufts Medical Center), 5.50%, 1/1/22 | | $ | 500 | | | $ | 546,590 | | | |
| Massachusetts Health and Educational Facilities Authority, (Baystate Medical Center), 5.00% to 7/1/15 (Put Date), 7/1/39 | | | 500 | | | | 550,400 | | | |
| Massachusetts Health and Educational Facilities Authority, (Baystate Medical Center), 5.75%, 7/1/14 | | | 600 | | | | 605,688 | | | |
| Massachusetts Health and Educational Facilities Authority, (Baystate Medical Center), 5.75%, 7/1/15 | | | 865 | | | | 872,707 | | | |
| Massachusetts Health and Educational Facilities Authority, (Dana-Farber Cancer Institute), 5.25%, 12/1/24 | | | 1,000 | | | | 1,106,810 | | | |
| Massachusetts Health and Educational Facilities Authority, (Jordan Hospital), 6.75%, 10/1/33 | | | 545 | | | | 554,936 | | | |
| Massachusetts Health and Educational Facilities Authority, (Lowell General Hospital), 4.75%, 7/1/25 | | | 710 | | | | 709,950 | | | |
| Massachusetts Health and Educational Facilities Authority, (Partners Healthcare System), 5.00%, 7/1/18 | | | 750 | | | | 877,965 | | | |
See Notes to Financial Statements.
13
Eaton Vance
Massachusetts Limited Maturity Municipal Income Fund
March 31, 2012
Portfolio of Investments — continued
| | | | | | | | | | | |
| | | Principal
| | | | | | |
| | | Amount
| | | | | | |
| Security | | (000’s omitted) | | | Value | | | |
| |
| |
| Hospital (continued) |
| |
| | | | | | | | | | | |
| Massachusetts Health and Educational Facilities Authority, (Partners Healthcare System), 5.00%, 7/1/22 | | $ | 1,000 | | | $ | 1,154,100 | | | |
| |
| |
| | | | | | | $ | 6,979,146 | | | |
| |
| |
| |
| |
| Insured – Education — 1.7% |
| |
| University of Massachusetts Building Authority, (AMBAC), 5.25%, 11/1/13 | | $ | 1,000 | | | $ | 1,069,250 | | | |
| |
| |
| | | | | | | $ | 1,069,250 | | | |
| |
| |
| |
| |
| Insured – Escrowed / Prerefunded — 1.3% |
| |
| Massachusetts Turnpike Authority, (FGIC), Escrowed to Maturity, 5.125%, 1/1/23 | | $ | 635 | | | $ | 813,022 | | | |
| |
| |
| | | | | | | $ | 813,022 | | | |
| |
| |
| |
| |
| Insured – General Obligations — 7.4% |
| |
| Boston, (NPFG), 0.125%, 3/1/22 | | $ | 3,105 | | | $ | 2,335,830 | | | |
| Massachusetts, (AMBAC), 5.00%, 7/1/12 | | | 1,000 | | | | 1,012,370 | | | |
| Massachusetts, (NPFG), 5.25%, 8/1/22 | | | 1,000 | | | | 1,262,720 | | | |
| |
| |
| | | | | | | $ | 4,610,920 | | | |
| |
| |
| |
| |
| Insured – Hospital — 2.7% |
| |
| Massachusetts Health and Educational Facilities Authority, (Cape Cod Healthcare), (AGC), 5.00%, 11/15/21 | | $ | 500 | | | $ | 563,910 | | | |
| Massachusetts Health and Educational Facilities Authority, (Caregroup Healthcare System), (NPFG), 5.25%, 7/1/21 | | | 1,000 | | | | 1,123,730 | | | |
| |
| |
| | | | | | | $ | 1,687,640 | | | |
| |
| |
| |
| |
| Insured – Special Tax Revenue — 4.2% |
| |
| Massachusetts, Special Obligation, (AGM), 5.50%, 6/1/21 | | $ | 1,600 | | | $ | 2,047,536 | | | |
| Massachusetts, Special Obligation, Dedicated Tax Revenue, (FGIC), (NPFG), 5.50%, 1/1/29 | | | 500 | | | | 589,210 | | | |
| |
| |
| | | | | | | $ | 2,636,746 | | | |
| |
| |
| |
| |
| Insured – Water and Sewer — 2.1% |
| |
| Massachusetts Water Resources Authority, (AGM), 5.50%, 8/1/22 | | $ | 1,000 | | | $ | 1,281,930 | | | |
| |
| |
| | | | | | | $ | 1,281,930 | | | |
| |
| |
| |
| |
| Other Revenue — 2.8% |
| |
| Massachusetts Health and Educational Facilities Authority, (Isabella Stewart Gardner Museum), 5.00%, 5/1/23 | | $ | 1,000 | | | $ | 1,139,250 | | | |
| Massachusetts Health and Educational Facilities Authority, (Woods Hole Oceanographic), 5.25%, 6/1/18 | | | 500 | | | | 610,180 | | | |
| |
| |
| | | | | | | $ | 1,749,430 | | | |
| |
| |
| |
| |
| Senior Living / Life Care — 1.6% |
| |
| Massachusetts Development Finance Agency, (Berkshire Retirement), 5.60%, 7/1/19 | | $ | 505 | | | $ | 505,535 | | | |
Massachusetts Development Finance Agency, (Carleton-Willard Village), 5.25%, 12/1/25 | | | 275 | | | | 291,879 | | | |
| Massachusetts Development Finance Agency, (Volunteers of America), 5.00%, 11/1/17 | | | 210 | | | | 205,393 | | | |
| |
| |
| | | | | | | $ | 1,002,807 | | | |
| |
| |
| |
| |
| Solid Waste — 1.6% |
| |
| Massachusetts Industrial Finance Agency, (Ogden Haverhill), (AMT), 5.50%, 12/1/13 | | $ | 1,000 | | | $ | 1,003,640 | | | |
| |
| |
| | | | | | | $ | 1,003,640 | | | |
| |
| |
| |
| |
| Special Tax Revenue — 5.4% |
| |
| Massachusetts, Special Obligation, 5.00%, 6/1/14 | | $ | 500 | | | $ | 549,780 | | | |
| Massachusetts Bay Transportation Authority, 5.25%, 7/1/26 | | | 1,280 | | | | 1,622,195 | | | |
| Massachusetts Bay Transportation Authority, Sales Tax, 5.25%, 7/1/16 | | | 1,000 | | | | 1,185,920 | | | |
| |
| |
| | | | | | | $ | 3,357,895 | | | |
| |
| |
| |
| |
| Transportation — 1.0% |
| |
| Massachusetts Department of Transportation, (Metropolitan Highway System Revenue), 5.00%, 1/1/20 | | $ | 500 | | | $ | 589,705 | | | |
| |
| |
| | | | | | | $ | 589,705 | | | |
| |
| |
| | | |
| Total Tax-Exempt Investments — 96.8% | | |
| (identified cost $54,756,189) | | $ | 60,216,284 | | | |
| |
| |
| | | | | | | |
| Other Assets, Less Liabilities — 3.2% | | $ | 2,016,025 | | | |
| |
| |
| | | | | | | |
| Net Assets — 100.0% | | $ | 62,232,309 | | | |
| |
| |
See Notes to Financial Statements.
14
Eaton Vance
Massachusetts Limited Maturity Municipal Income Fund
March 31, 2012
Portfolio of Investments — continued
The percentage shown for each investment category in the Portfolio of Investments is based on net assets.
| | | |
| AGC | | - Assured Guaranty Corp. |
| AGM | | - Assured Guaranty Municipal Corp. |
| AMBAC | | - AMBAC Financial Group, Inc. |
| AMT | | - Interest earned from these securities may be considered a tax preference item for purposes of the Federal Alternative Minimum Tax. |
| FGIC | | - Financial Guaranty Insurance Company |
| NPFG | | - National Public Finance Guaranty Corp. |
The Fund invests primarily in debt securities issued by Massachusetts municipalities. The ability of the issuers of the debt securities to meet their obligations may be affected by economic developments in a specific industry or municipality. In order to reduce the risk associated with such economic developments, at March 31, 2012, 20.1% of total investments are backed by bond insurance of various financial institutions and financial guaranty assurance agencies. The aggregate percentage insured by an individual financial institution ranged from 0.9% to 8.8% of total investments.
See Notes to Financial Statements.
15
Eaton Vance
New York Limited Maturity Municipal Income Fund
March 31, 2012
| | | | | | | | | | | |
| Tax-Exempt Investments — 100.1% |
| |
| | | Principal
| | | | | | |
| | | Amount
| | | | | | |
| Security | | (000’s omitted) | | | Value | | | |
| |
| |
| |
| Bond Bank — 2.5% |
| |
| New York Environmental Facilities Corp., Clean Water and Drinking Water, (Municipal Water Finance), 5.00%, 6/15/18 | | $ | 515 | | | $ | 541,780 | | | |
| New York Environmental Facilities Corp., Clean Water and Drinking Water, (Municipal Water Finance), 5.00%, 6/15/20 | | | 1,000 | | | | 1,145,940 | | | |
| New York Environmental Facilities Corp., Clean Water and Drinking Water, (Municipal Water Finance), 5.25%, 6/15/14 | | | 500 | | | | 505,210 | | | |
| |
| |
| | | | | | | $ | 2,192,930 | | | |
| |
| |
| |
| |
| Cogeneration — 3.3% |
| |
| Babylon Industrial Development Agency, (Covanta Energy Corp.), 5.00%, 1/1/19 | | $ | 2,000 | | | $ | 2,297,440 | | | |
| Suffolk County Industrial Development Agency, (Nissequogue Cogeneration Partners Facility), (AMT), 5.50%, 1/1/23 | | | 600 | | | | 585,546 | | | |
| |
| |
| | | | | | | $ | 2,882,986 | | | |
| |
| |
| |
| |
| Education — 8.0% |
| |
| New York Dormitory Authority, (Cornell University), 5.00%, 7/1/23 | | $ | 1,500 | | | $ | 1,795,950 | | | |
| New York Dormitory Authority, (Hamilton College), 5.00%, 7/1/21 | | | 455 | | | | 569,551 | | | |
| New York Dormitory Authority, (St. Lawrence University), 5.00%, 7/1/14 | | | 1,000 | | | | 1,086,060 | | | |
| New York Dormitory Authority, (State University Educational Facilities), 5.00%, 7/1/20 | | | 1,500 | | | | 1,756,485 | | | |
| New York Dormitory Authority, (State University Educational Facilities), 5.25%, 5/15/15 | | | 600 | | | | 663,540 | | | |
| New York Dormitory Authority, (Third Generation Resolution), 5.00%, 5/15/26 | | | 500 | | | | 579,640 | | | |
| Troy Industrial Development Authority, (Rensselaer Polytechnic Institute), 5.50%, 9/1/15 | | | 625 | | | | 637,762 | | | |
| |
| |
| | | | | | | $ | 7,088,988 | | | |
| |
| |
| |
| |
| Electric Utilities — 3.1% |
| |
| Puerto Rico Electric Power Authority, 5.25%, 7/1/25 | | $ | 2,500 | | | $ | 2,724,075 | | | |
| |
| |
| | | | | | | $ | 2,724,075 | | | |
| |
| |
| |
| |
| Escrowed / Prerefunded — 5.1% |
| |
| 34th Street Partnership, Inc., Prerefunded to 1/1/13, 5.00%, 1/1/17 | | $ | 1,140 | | | $ | 1,181,006 | | | |
| Suffolk County Industrial Development Agency, (Huntington Hospital), Escrowed to Maturity, 6.00%, 11/1/22 | | | 750 | | | | 775,643 | | | |
| Triborough Bridge and Tunnel Authority, Escrowed to Maturity, 5.00%, 1/1/20 | | | 1,170 | | | | 1,427,926 | | | |
| Triborough Bridge and Tunnel Authority, Prerefunded to 1/1/16, 5.375%, 1/1/19 | | | 1,000 | | | | 1,168,990 | | | |
| |
| |
| | | | | | | $ | 4,553,565 | | | |
| |
| |
| |
| |
| General Obligations — 5.1% |
| |
| Clarence Central School District, 4.00%, 5/15/20 | | $ | 300 | | | $ | 342,825 | | | |
| Clarence Central School District, 4.00%, 5/15/21 | | | 250 | | | | 284,820 | | | |
| Haverstraw-Stony Point Central School District, 4.50%, 5/1/26 | | | 1,010 | | | | 1,141,179 | | | |
| New York City, 5.00%, 8/1/24 | | | 1,600 | | | | 1,857,056 | | | |
| Pittsford Central School District, 4.00%, 10/1/22 | | | 750 | | | | 861,345 | | | |
| |
| |
| | | | | | | $ | 4,487,225 | | | |
| |
| |
| |
| |
| Health Care – Miscellaneous — 0.1% |
| |
| Suffolk County Industrial Development Agency, (Alliance of Long Island Agencies), 7.50%, 9/1/15 | | $ | 100 | | | $ | 100,806 | | | |
| |
| |
| | | | | | | $ | 100,806 | | | |
| |
| |
| |
| |
| Hospital — 8.3% |
| |
| Nassau County Local Economic Assistance & Financing Corp., (Catholic Health Service of Long Island), 5.00%, 7/1/22 | | $ | 1,000 | | | $ | 1,120,150 | | | |
| New York Dormitory Authority, (Interfaith Medical Center), 5.00%, 2/15/21 | | | 2,000 | | | | 2,369,480 | | | |
| New York Dormitory Authority, (NYU Hospital Center), 5.00%, 7/1/20 | | | 740 | | | | 825,951 | | | |
| New York Dormitory Authority, (NYU Hospital Center), 5.25%, 7/1/24 | | | 360 | | | | 387,641 | | | |
| New York Health and Hospital Corp., 5.50%, 2/15/19 | | | 1,000 | | | | 1,169,670 | | | |
| Saratoga County Industrial Development Agency, (Saratoga Hospital Project), 5.00%, 12/1/17 | | | 1,325 | | | | 1,456,652 | | | |
| |
| |
| | | | | | | $ | 7,329,544 | | | |
| |
| |
| |
| |
| Housing — 2.1% |
| |
| New York Housing Finance Agency, (Affordable Housing), (AMT), 5.05%, 11/1/22 | | $ | 1,000 | | | $ | 1,045,190 | | | |
| New York Mortgage Agency, (AMT), 4.95%, 10/1/21 | | | 795 | | | | 821,784 | | | |
| |
| |
| | | | | | | $ | 1,866,974 | | | |
| |
| |
| |
See Notes to Financial Statements.
16
Eaton Vance
New York Limited Maturity Municipal Income Fund
March 31, 2012
Portfolio of Investments — continued
| | | | | | | | | | | |
| | | Principal
| | | | | | |
| | | Amount
| | | | | | |
| Security | | (000’s omitted) | | | Value | | | |
| |
| |
| |
| Industrial Development Revenue — 3.0% |
| |
| New York Environmental Facilities Corp., Solid Waste Disposal, (Waste Management Project), (AMT), 4.55%, 5/1/12 | | $ | 1,000 | | | $ | 1,002,630 | | | |
| New York Liberty Development Corp., (Goldman Sachs Group, Inc.), 5.50%, 10/1/37 | | | 1,500 | | | | 1,692,930 | | | |
| |
| |
| | | | | | | $ | 2,695,560 | | | |
| |
| |
| |
| |
| Insured – Education — 12.9% |
| |
| New York Dormitory Authority, (Canisius College), (NPFG), 5.00%, 7/1/16 | | $ | 1,000 | | | $ | 1,075,000 | | | |
| New York Dormitory Authority, (City University), (AMBAC), 5.625%, 7/1/16 | | | 1,000 | | | | 1,125,640 | | | |
| New York Dormitory Authority, (Educational Housing Services), (AMBAC), 5.25%, 7/1/20 | | | 1,420 | | | | 1,622,407 | | | |
| New York Dormitory Authority, (New York University), (AMBAC), 5.50%, 7/1/19 | | | 1,000 | | | | 1,238,600 | | | |
| New York Dormitory Authority, (Rochester Institute of Technology), (AMBAC), 5.25%, 7/1/21 | | | 1,085 | | | | 1,321,063 | | | |
| New York Dormitory Authority, (St. John’s University), (NPFG), 5.25%, 7/1/21 | | | 1,455 | | | | 1,751,631 | | | |
| New York Dormitory Authority, (State University Educational Facilities), (AGM), 5.75%, 5/15/17 | | | 1,000 | | | | 1,215,210 | | | |
| New York Dormitory Authority, (Student Housing), (FGIC), (NPFG), 5.25%, 7/1/15 | | | 1,000 | | | | 1,080,650 | | | |
| New York Dormitory Authority, (University Educational Facilities), (FGIC), (NPFG), 5.25%, 5/15/13 | | | 1,000 | | | | 1,017,630 | | | |
| |
| |
| | | | | | | $ | 11,447,831 | | | |
| |
| |
| |
| |
| Insured – Electric Utilities — 1.8% |
| |
| Long Island Power Authority, Electric Systems Revenue, (AGM), 0.00%, 6/1/15 | | $ | 500 | | | $ | 486,340 | | | |
| Long Island Power Authority, Electric Systems Revenue, (FGIC), (NPFG), 5.00%, 12/1/22 | | | 1,000 | | | | 1,108,200 | | | |
| |
| |
| | | | | | | $ | 1,594,540 | | | |
| |
| |
| |
| |
| Insured – Escrowed / Prerefunded — 0.9% |
| |
| Clarence Central School District, (AGM), Prerefunded to 5/15/12, 5.00%, 5/15/17 | | $ | 500 | | | $ | 503,030 | | | |
| Niagara County Industrial Development Agency, (Niagara University), (AMBAC), Escrowed to Maturity, 5.25%, 10/1/18 | | | 250 | | | | 288,157 | | | |
| |
| |
| | | | | | | $ | 791,187 | | | |
| |
| |
| |
| |
| Insured – General Obligations — 2.9% |
| |
| Monroe County, (Public Improvements), (NPFG), 6.00%, 3/1/19 | | $ | 1,000 | | | $ | 1,183,840 | | | |
Mount Vernon School District, (AGM), 4.50%, 8/15/23(1) | | | 500 | | | | 548,740 | | | |
Mount Vernon School District, (AGM), 5.00%, 8/15/24(1) | | | 735 | | | | 831,432 | | | |
| |
| |
| | | | | | | $ | 2,564,012 | | | |
| |
| |
| |
| |
| Insured – Hospital — 2.2% |
| |
| New York Dormitory Authority, (Memorial Sloan Kettering Cancer Center), (NPFG), 5.50%, 7/1/17 | | $ | 1,600 | | | $ | 1,934,768 | | | |
| |
| |
| | | | | | | $ | 1,934,768 | | | |
| |
| |
| |
| |
| Insured – Lease Revenue / Certificates of Participation — 1.3% |
| |
| New York Dormitory Authority, (Master BOCES Program-Oneida Herkimer Madison BOCES), (AGM), 5.25%, 8/15/20 | | $ | 1,000 | | | $ | 1,171,250 | | | |
| |
| |
| | | | | | | $ | 1,171,250 | | | |
| |
| |
| |
| |
| Insured – Special Tax Revenue — 7.2% |
| |
New York Local Government Assistance Corp., (NPFG), 0.00%, 4/1/13(2) | | $ | 2,250 | | | $ | 2,245,500 | | | |
| New York Urban Development Corp., (Personal Income Tax), (AMBAC), 5.50%, 3/15/19 | | | 2,000 | | | | 2,497,500 | | | |
| Puerto Rico Infrastructure Financing Authority, (FGIC), 5.50%, 7/1/19 | | | 1,500 | | | | 1,667,265 | | | |
| |
| |
| | | | | | | $ | 6,410,265 | | | |
| |
| |
| |
| |
| Insured – Transportation — 9.7% |
| |
| Metropolitan Transportation Authority, (AMBAC), 5.50%, 11/15/18 | | $ | 1,000 | | | $ | 1,219,120 | | | |
| Metropolitan Transportation Authority, (NPFG), 5.50%, 11/15/13 | | | 1,000 | | | | 1,081,320 | | | |
| Monroe County Airport Authority, (NPFG), (AMT), 5.875%, 1/1/17 | | | 1,000 | | | | 1,124,530 | | | |
| New York Thruway Authority, (AMBAC), 5.50%, 4/1/20 | | | 2,235 | | | | 2,806,691 | | | |
| Triborough Bridge and Tunnel Authority, (NPFG), 5.50%, 11/15/18 | | | 1,920 | | | | 2,363,097 | | | |
| |
| |
| | | | | | | $ | 8,594,758 | | | |
| |
| |
| |
| |
| Lease Revenue / Certificates of Participation — 0.7% |
| |
| New York Urban Development Corp., 5.00%, 1/1/18 | | $ | 500 | | | $ | 589,600 | | | |
| |
| |
| | | | | | | $ | 589,600 | | | |
| |
| |
| |
See Notes to Financial Statements.
17
Eaton Vance
New York Limited Maturity Municipal Income Fund
March 31, 2012
Portfolio of Investments — continued
| | | | | | | | | | | |
| | | Principal
| | | | | | |
| | | Amount
| | | | | | |
| Security | | (000’s omitted) | | | Value | | | |
| |
| |
| |
| Other Revenue — 6.0% |
| |
Albany Industrial Development Agency, (Charitable Leadership), 6.00%, 7/1/19(3) | | $ | 741 | | | $ | 453,474 | | | |
| Brooklyn Arena Local Development Corp., (Brooklyn Center Project), 5.75%, 7/15/16 | | | 750 | | | | 837,562 | | | |
| New York City Transitional Finance Authority, 5.25%, 1/15/27 | | | 1,000 | | | | 1,136,950 | | | |
| New York City Transitional Finance Authority, 6.00%, 7/15/33 | | | 540 | | | | 627,021 | | | |
| New York City Trust for Cultural Resources, (Museum of Modern Art), 5.00%, 4/1/26 | | | 2,030 | | | | 2,281,375 | | | |
| |
| |
| | | | | | | $ | 5,336,382 | | | |
| |
| |
| |
| |
| Senior Living / Life Care — 0.4% |
| |
| Mt. Vernon Industrial Development Agency, (Wartburg Senior Housing, Inc.), 6.15%, 6/1/19 | | $ | 315 | | | $ | 315,038 | | | |
| |
| |
| | | | | | | $ | 315,038 | | | |
| |
| |
| |
| |
| Special Tax Revenue — 6.4% |
| |
| New York City Transitional Finance Authority, (Future Tax), 5.00%, 5/1/24 | | $ | 1,900 | | | $ | 2,211,771 | | | |
| New York Local Government Assistance Corp., 5.25%, 4/1/16 | | | 3,000 | | | | 3,418,920 | | | |
| |
| |
| | | | | | | $ | 5,630,691 | | | |
| |
| |
| |
| |
| Transportation — 2.6% |
| |
| Metropolitan Transportation Authority, 5.00%, 11/15/21 | | $ | 1,000 | | | $ | 1,142,640 | | | |
| Port Authority of New York and New Jersey, (AMT), 5.25%, 9/15/23 | | | 1,000 | | | | 1,123,770 | | | |
| |
| |
| | | | | | | $ | 2,266,410 | | | |
| |
| |
| |
| |
| Water and Sewer — 4.5% |
| |
| Erie County Water Authority, 5.00%, 12/1/18 | | $ | 1,000 | | | $ | 1,204,910 | | | |
| New York City Municipal Water Finance Authority, 5.00%, 6/15/21 | | | 2,430 | | | | 2,822,907 | | | |
| |
| |
| | | | | | | $ | 4,027,817 | | | |
| |
| |
| | | |
| Total Tax-Exempt Investments — 100.1% | | |
| (identified cost $81,421,392) | | $ | 88,597,202 | | | |
| |
| |
| | | | | | | |
| Other Assets, Less Liabilities — (0.1)% | | $ | (124,526 | ) | | |
| |
| |
| | | | | | | |
| Net Assets — 100.0% | | $ | 88,472,676 | | | |
| |
| |
The percentage shown for each investment category in the Portfolio of Investments is based on net assets.
| | | |
| AGM | | - Assured Guaranty Municipal Corp. |
| AMBAC | | - AMBAC Financial Group, Inc. |
| AMT | | - Interest earned from these securities may be considered a tax preference item for purposes of the Federal Alternative Minimum Tax. |
| FGIC | | - Financial Guaranty Insurance Company |
| NPFG | | - National Public Finance Guaranty Corp. |
The Fund invests primarily in debt securities issued by New York municipalities. The ability of the issuers of the debt securities to meet their obligations may be affected by economic developments in a specific industry or municipality. In order to reduce the risk associated with such economic developments, at March 31, 2012, 39.0% of total investments are backed by bond insurance of various financial institutions and financial guaranty assurance agencies. The aggregate percentage insured by an individual financial institution ranged from 5.4% to 18.0% of total investments.
| | |
| (1) | | When-issued security. |
| |
| (2) | | Security (or a portion thereof) has been segregated to cover payable for when-issued securities. |
| |
| (3) | | Security is in default and making only partial interest payments. |
See Notes to Financial Statements.
18
Eaton Vance
Pennsylvania Limited Maturity Municipal Income Fund
March 31, 2012
| | | | | | | | | | | |
| Tax-Exempt Investments — 100.7% |
| |
| | | Principal
| | | | | | |
| | | Amount
| | | | | | |
| Security | | (000’s omitted) | | | Value | | | |
| |
| |
| |
| Cogeneration — 0.3% |
| |
| Pennsylvania Economic Development Financing Authority, (Colver), (AMT), 5.125%, 12/1/15 | | $ | 200 | | | $ | 200,270 | | | |
| |
| |
| | | | | | | $ | 200,270 | | | |
| |
| |
| |
| |
| Education — 14.4% |
| |
| Pennsylvania Higher Educational Facilities Authority, (Carnegie Mellon University), 5.00%, 8/1/19 | | $ | 1,150 | | | $ | 1,379,793 | | | |
| Pennsylvania Higher Educational Facilities Authority, (University of Pennsylvania), 5.00%, 7/15/21 | | | 1,040 | | | | 1,158,300 | | | |
| Pennsylvania Higher Educational Facilities Authority, (University of Pennsylvania), 5.00%, 9/1/27 | | | 1,000 | | | | 1,151,660 | | | |
| Pennsylvania State University, 5.00%, 3/1/24 | | | 1,000 | | | | 1,150,730 | | | |
Union County Higher Educational Facilities Financing Authority, (Bucknell University), 4.00%, 4/1/26(1) | | | 460 | | | | 498,378 | | | |
Union County Higher Educational Facilities Financing Authority, (Bucknell University), 5.00%, 4/1/27(1) | | | 300 | | | | 353,022 | | | |
Union County Higher Educational Facilities Financing Authority, (Bucknell University), 5.00%, 4/1/28(1) | | | 530 | | | | 617,773 | | | |
| University of Pittsburgh, 5.50%, 9/15/23 | | | 750 | | | | 912,165 | | | |
| Washington County Industrial Development Authority, (Washington & Jefferson College), 5.00%, 11/1/23 | | | 1,000 | | | | 1,099,130 | | | |
| |
| |
| | | | | | | $ | 8,320,951 | | | |
| |
| |
| |
| |
| Electric Utilities — 3.9% |
| |
| Pennsylvania Economic Development Financing Authority, (Exelon Generation Company, LLC), 5.00% to 6/1/12 (Put Date), 12/1/42 | | $ | 750 | | | $ | 755,805 | | | |
| Puerto Rico Electric Power Authority, 5.00%, 7/1/17 | | | 1,000 | | | | 1,115,840 | | | |
| York County Industrial Development Authority, (Public Service Enterprise Group, Inc.), 5.50%, 9/1/20 | | | 400 | | | | 404,640 | | | |
| |
| |
| | | | | | | $ | 2,276,285 | | | |
| |
| |
| |
| |
| Escrowed / Prerefunded — 1.4% |
| |
| Washington County Hospital Authority, (Monongahela Vineyard Hospital), Escrowed to Maturity, 5.00%, 6/1/12 | | $ | 800 | | | $ | 806,568 | | | |
| |
| |
| | | | | | | $ | 806,568 | | | |
| |
| |
| |
| |
| General Obligations — 14.4% |
| |
| Bucks County, 5.125%, 5/1/21 | | $ | 500 | | | $ | 591,190 | | | |
| Chester County, 5.00%, 7/15/28 | | | 1,530 | | | | 1,755,445 | | | |
| Daniel Boone Area School District, 5.00%, 8/15/19 | | | 1,000 | | | | 1,179,880 | | | |
| Gettysburg Area School District, 5.25%, 1/15/24 | | | 1,000 | | | | 1,180,990 | | | |
| Montgomery County, 4.375%, 12/1/31 | | | 400 | | | | 431,080 | | | |
| Mount Lebanon School District, 5.00%, 2/15/28 | | | 1,780 | | | | 2,049,617 | | | |
| Pittsburgh, 5.00%, 9/1/26 | | | 1,000 | | | | 1,096,290 | | | |
| |
| |
| | | | | | | $ | 8,284,492 | | | |
| |
| |
| |
| |
| Hospital — 8.0% |
| |
| Allegheny County Hospital Development Authority, (University of Pittsburgh Medical Center), 5.00%, 6/15/18 | | $ | 500 | | | $ | 584,670 | | | |
| Allegheny County Hospital Development Authority, (University of Pittsburgh Medical Center), 5.00%, 9/1/18 | | | 500 | | | | 593,980 | | | |
| Dauphin County General Authority Health System, (Pinnacle Health System), 5.75%, 6/1/20 | | | 500 | | | | 567,370 | | | |
| Lancaster County Hospital Authority, (Lancaster General Hospital), 5.00%, 3/15/22 | | | 635 | | | | 697,243 | | | |
| Lebanon County Health Facility Authority, (Good Samaritan Hospital), 5.50%, 11/15/18 | | | 200 | | | | 202,308 | | | |
| Lycoming County Authority, (Susquehanna Health System), 5.10%, 7/1/20 | | | 750 | | | | 817,462 | | | |
| Monroe County Hospital Authority, (Pocono Medical Center), 5.00%, 1/1/17 | | | 1,000 | | | | 1,129,280 | | | |
| |
| |
| | | | | | | $ | 4,592,313 | | | |
| |
| |
| |
| |
| Housing — 3.3% |
| |
| Allegheny County Residential Finance Authority, SFMR, (AMT), 4.80%, 11/1/22 | | $ | 1,335 | | | $ | 1,384,475 | | | |
| Pennsylvania Housing Finance Agency, SFMR, (AMT), 4.75%, 10/1/25 | | | 500 | | | | 517,705 | | | |
| |
| |
| | | | | | | $ | 1,902,180 | | | |
| |
| |
| |
| |
| Industrial Development Revenue — 1.1% |
| |
| Pennsylvania Economic Development Financing Authority, (Aqua Pennsylvania, Inc.), (AMT), 6.75%, 10/1/18 | | $ | 500 | | | $ | 621,715 | | | |
| |
| |
| | | | | | | $ | 621,715 | | | |
| |
| |
| |
| |
| Insured – Cogeneration — 2.2% |
| |
| Pennsylvania Economic Development Financing Authority, (Resource Recovery-Colver), (AMBAC), (AMT), 4.625%, 12/1/18 | | $ | 1,300 | | | $ | 1,271,829 | | | |
| |
| |
| | | | | | | $ | 1,271,829 | | | |
| |
| |
| |
See Notes to Financial Statements.
19
Eaton Vance
Pennsylvania Limited Maturity Municipal Income Fund
March 31, 2012
Portfolio of Investments — continued
| | | | | | | | | | | |
| | | Principal
| | | | | | |
| | | Amount
| | | | | | |
| Security | | (000’s omitted) | | | Value | | | |
| |
| |
| |
| Insured – Education — 7.3% |
| |
| Delaware County, (Villanova University), (AMBAC), 5.00%, 8/1/20 | | $ | 1,500 | | | $ | 1,661,805 | | | |
| Lycoming County College Authority, (Pennsylvania College of Technology), (AMBAC), 5.125%, 5/1/22 | | | 1,100 | | | | 1,103,102 | | | |
| Pennsylvania Higher Educational Facilities Authority, (Thomas Jefferson University), (AMBAC), 5.25%, 9/1/19 | | | 500 | | | | 590,535 | | | |
| Pennsylvania Higher Educational Facilities Authority, (University of the Sciences in Philadelphia), (AGC), 5.00%, 11/1/24 | | | 750 | | | | 832,635 | | | |
| |
| |
| | | | | | | $ | 4,188,077 | | | |
| |
| |
| |
| |
| Insured – Escrowed / Prerefunded — 4.7% |
| |
| Philadelphia Gas Works Revenue, (AGM), Prerefunded to 8/1/13, 5.25%, 8/1/17 | | $ | 1,000 | | | $ | 1,066,060 | | | |
| Westmoreland Municipal Authority, (FGIC), Escrowed to Maturity, 0.00%, 8/15/19 | | | 1,900 | | | | 1,637,762 | | | |
| |
| |
| | | | | | | $ | 2,703,822 | | | |
| |
| |
| |
| |
| Insured – General Obligations — 18.0% |
| |
| Bethlehem Area School District, (AGM), 5.25%, 1/15/25 | | $ | 1,250 | | | $ | 1,401,875 | | | |
| Cornwall Lebanon School District, (AGM), 0.00%, 3/15/16 | | | 1,020 | | | | 967,133 | | | |
| Delaware Valley Regional Financial Authority, (AMBAC), 5.50%, 8/1/18 | | | 750 | | | | 866,228 | | | |
| Harrisburg, (AMBAC), 0.00%, 9/15/12 | | | 1,635 | | | | 1,584,217 | | | |
| Pennsylvania, (NPFG), 5.375%, 7/1/19 | | | 1,000 | | | | 1,254,390 | | | |
| Philadelphia, (AGM), 5.25%, 12/15/19 | | | 750 | | | | 867,697 | | | |
| Philadelphia School District, (AGM), 5.50%, 6/1/21 | | | 1,000 | | | | 1,213,280 | | | |
| Pittsburgh School District, (AGM), 5.00%, 9/1/22 | | | 1,000 | | | | 1,166,830 | | | |
| Pocono Mountain School District, (AGM), 5.00%, 9/1/28 | | | 1,000 | | | | 1,060,490 | | | |
| |
| |
| | | | | | | $ | 10,382,140 | | | |
| |
| |
| |
| |
| Insured – Hospital — 1.5% |
| |
| Allegheny County Hospital Development Authority, (UPMC Health System), (NPFG), 6.00%, 7/1/24 | | $ | 250 | | | $ | 320,040 | | | |
| Washington County Hospital Authority, (Washington Hospital), (AMBAC), 5.375%, 7/1/14 | | | 500 | | | | 529,300 | | | |
| |
| |
| | | | | | | $ | 849,340 | | | |
| |
| |
| |
| |
| Insured – Lease Revenue / Certificates of Participation — 1.8% |
| |
| Philadelphia Authority for Industrial Development Revenue, (FGIC), (NPFG), 5.00%, 12/1/22 | | $ | 1,000 | | | $ | 1,046,140 | | | |
| |
| |
| | | | | | | $ | 1,046,140 | | | |
| |
| |
| |
| |
| Insured – Transportation — 2.1% |
| |
| Pennsylvania Turnpike Commission, Registration Fee Revenue, (AGM), 5.25%, 7/15/22 | | $ | 1,000 | | | $ | 1,224,330 | | | |
| |
| |
| | | | | | | $ | 1,224,330 | | | |
| |
| |
| |
| |
| Insured – Water and Sewer — 6.2% |
| |
| Allegheny County Sanitation Authority, (AGM), 5.00%, 6/1/24 | | $ | 500 | | | $ | 568,865 | | | |
| Allegheny County Sanitation Authority, (BHAC), (NPFG), 5.00%, 12/1/22 | | | 500 | | | | 540,700 | | | |
Altoona City Authority, Water Revenue, (AGM), 5.25%, 11/1/19(2) | | | 2,000 | | | | 2,453,480 | | | |
| |
| |
| | | | | | | $ | 3,563,045 | | | |
| |
| |
| |
| |
| Other Revenue — 2.9% |
| |
| Southeastern Pennsylvania Transportation Authority, Federal Grant Receipts, 5.00%, 6/1/27 | | $ | 1,500 | | | $ | 1,662,330 | | | |
| |
| |
| | | | | | | $ | 1,662,330 | | | |
| |
| |
| |
| |
| Senior Living / Life Care — 0.7% |
| |
Cliff House Trust, (AMT), 6.625%, 6/1/27(3) | | $ | 390 | | | $ | 206,248 | | | |
| Lancaster County Hospital Authority, (Health Center-Willow Valley Retirement), 5.55%, 6/1/15 | | | 185 | | | | 185,518 | | | |
| |
| |
| | | | | | | $ | 391,766 | | | |
| |
| |
| |
| |
| Special Tax Revenue — 1.5% |
| |
| Pennsylvania Intergovernmental Cooperative Authority, (Philadelphia Funding Program), 5.00%, 6/15/23 | | $ | 750 | | | $ | 861,165 | | | |
| |
| |
| | | | | | | $ | 861,165 | | | |
| |
| |
| |
| |
| Transportation — 5.0% |
| |
| Delaware River Port Authority, 5.00%, 1/1/27 | | $ | 1,105 | | | $ | 1,217,025 | | | |
| Pennsylvania Turnpike Commission, 5.00%, 12/1/22 | | | 500 | | | | 561,190 | | | |
| Philadelphia Airport Revenue, (AMT), 5.00%, 6/15/23 | | | 1,000 | | | | 1,086,940 | | | |
| |
| |
| | | | | | | $ | 2,865,155 | | | |
| |
| |
| | | |
| Total Tax-Exempt Investments — 100.7% | | |
| (identified cost $54,218,678) | | $ | 58,013,913 | | | |
| |
| |
| | | | | | | |
| Other Assets, Less Liabilities — (0.7)% | | $ | (396,004 | ) | | |
| |
| |
| | | | | | | |
| Net Assets — 100.0% | | $ | 57,617,909 | | | |
| |
| |
See Notes to Financial Statements.
20
Eaton Vance
Pennsylvania Limited Maturity Municipal Income Fund
March 31, 2012
Portfolio of Investments — continued
The percentage shown for each investment category in the Portfolio of Investments is based on net assets.
| | | |
| AGC | | - Assured Guaranty Corp. |
| AGM | | - Assured Guaranty Municipal Corp. |
| AMBAC | | - AMBAC Financial Group, Inc. |
| AMT | | - Interest earned from these securities may be considered a tax preference item for purposes of the Federal Alternative Minimum Tax. |
| BHAC | | - Berkshire Hathaway Assurance Corp. |
| FGIC | | - Financial Guaranty Insurance Company |
| NPFG | | - National Public Finance Guaranty Corp. |
| SFMR | | - Single Family Mortgage Revenue |
The Fund invests primarily in debt securities issued by Pennsylvania municipalities. The ability of the issuers of the debt securities to meet their obligations may be affected by economic developments in a specific industry or municipality. In order to reduce the risk associated with such economic developments, at March 31, 2012, 43.5% of total investments are backed by bond insurance of various financial institutions and financial guaranty assurance agencies. The aggregate percentage insured by an individual financial institution ranged from 0.9% to 20.7% of total investments.
| | |
| (1) | | When-issued security. |
| |
| (2) | | Security (or a portion thereof) has been segregated to cover payable for when-issued securities. |
| |
| (3) | | Security is in default and making only partial interest payments. |
See Notes to Financial Statements.
21
Eaton Vance
Limited Maturity Municipal Income Funds
March 31, 2012
Statements of Assets and Liabilities
| | | | | | | | | | | | | | | |
| | | March 31, 2012 | | |
| | | |
| | | Massachusetts
| | New York Limited
| | Pennsylvania
| | |
| Assets | | Limited Fund | | Fund | | Limited Fund | | |
| |
| Investments — | | | | | | | | | | | | | | |
| Identified cost | | $ | 54,756,189 | | | $ | 81,421,392 | | | $ | 54,218,678 | | | |
| Unrealized appreciation | | | 5,460,095 | | | | 7,175,810 | | | | 3,795,235 | | | |
| |
| |
Investments, at value | | $ | 60,216,284 | | | $ | 88,597,202 | | | $ | 58,013,913 | | | |
| |
| |
| Cash | | $ | 1,509,153 | | | $ | — | | | $ | 499,167 | | | |
| Restricted cash* | | | 70,000 | | | | 100,000 | | | | 150,000 | | | |
| Interest receivable | | | 618,854 | | | | 1,101,624 | | | | 599,101 | | | |
| Receivable for Fund shares sold | | | 48,406 | | | | 435,701 | | | | 62,627 | | | |
| Receivable for variation margin on open financial futures contracts | | | 23,484 | | | | 33,891 | | | | 46,406 | | | |
| |
| |
Total assets | | $ | 62,486,181 | | | $ | 90,268,418 | | | $ | 59,371,214 | | | |
| |
| |
| |
| Liabilities |
| |
| Payable for when-issued securities | | $ | — | | | $ | 1,372,375 | | | $ | 1,465,915 | | | |
| Payable for Fund shares redeemed | | | 97,411 | | | | 101,242 | | | | 128,108 | | | |
| Distributions payable | | | 72,622 | | | | 113,753 | | | | 71,729 | | | |
| Due to custodian | | | — | | | | 93,348 | | | | — | | | |
| Payable to affiliates: | | | | | | | | | | | | | | |
| Investment adviser fee | | | 21,084 | | | | 31,061 | | | | 20,197 | | | |
| Distribution and service fees | | | 15,504 | | | | 28,030 | | | | 19,323 | | | |
| Accrued expenses | | | 47,251 | | | | 55,933 | | | | 48,033 | | | |
| |
| |
Total liabilities | | $ | 253,872 | | | $ | 1,795,742 | | | $ | 1,753,305 | | | |
| |
| |
Net Assets | | $ | 62,232,309 | | | $ | 88,472,676 | | | $ | 57,617,909 | | | |
| |
| |
| |
| Sources of Net Assets |
| |
| Paid-in capital | | $ | 61,324,984 | | | $ | 89,358,985 | | | $ | 57,505,732 | | | |
| Accumulated net realized loss | | | (4,570,598 | ) | | | (8,044,827 | ) | | | (3,710,036 | ) | | |
| Accumulated distributions in excess of net investment income | | | (11,830 | ) | | | (80,202 | ) | | | (90,805 | ) | | |
| Net unrealized appreciation | | | 5,489,753 | | | | 7,238,720 | | | | 3,913,018 | | | |
| |
| |
Net Assets | | $ | 62,232,309 | | | $ | 88,472,676 | | | $ | 57,617,909 | | | |
| |
| |
| |
| Class A Shares |
| |
Net Assets | | $ | 43,283,057 | | | $ | 56,993,350 | | | $ | 37,365,648 | | | |
Shares Outstanding | | | 4,226,546 | | | | 5,504,435 | | | | 3,677,794 | | | |
Net Asset Value and Redemption Price Per Share | | | | | | | | | | | | | | |
(net assets ¸ shares of beneficial interest outstanding) | | $ | 10.24 | | | $ | 10.35 | | | $ | 10.16 | | | |
Maximum Offering Price Per Share | | | | | | | | | | | | | | |
(100 ¸ 97.75 of net asset value per share) | | $ | 10.48 | | | $ | 10.59 | | | $ | 10.39 | | | |
| |
| |
| |
| Class B Shares |
| |
Net Assets | | $ | 253,089 | | | $ | 1,314,493 | | | $ | 405,051 | | | |
Shares Outstanding | | | 24,734 | | | | 127,046 | | | | 39,866 | | | |
Net Asset Value and Offering Price Per Share** | | | | | | | | | | | | | | |
(net assets ¸ shares of beneficial interest outstanding) | | $ | 10.23 | | | $ | 10.35 | | | $ | 10.16 | | | |
| |
| |
| |
| Class C Shares |
| |
Net Assets | | $ | 12,646,610 | | | $ | 25,823,228 | | | $ | 18,709,759 | | | |
Shares Outstanding | | | 1,289,300 | | | | 2,623,023 | | | | 1,941,772 | | | |
Net Asset Value and Offering Price Per Share** | | | | | | | | | | | | | | |
(net assets ¸ shares of beneficial interest outstanding) | | $ | 9.81 | | | $ | 9.84 | | | $ | 9.64 | | | |
| |
| |
| |
| Class I Shares |
| |
Net Assets | | $ | 6,049,553 | | | $ | 4,341,605 | | | $ | 1,137,451 | | | |
Shares Outstanding | | | 590,825 | | | | 419,382 | | | | 112,007 | | | |
Net Asset Value, Offering Price and Redemption Price Per Share | | | | | | | | | | | | | | |
(net assets ¸ shares of beneficial interest outstanding) | | $ | 10.24 | | | $ | 10.35 | | | $ | 10.16 | | | |
| |
| |
On sales of $100,000 or more, the offering price of Class A shares is reduced.
| | |
| * | | Represents restricted cash on deposit at the broker for open financial futures contracts. |
| ** | | Redemption price per share is equal to the net asset value less any applicable contingent deferred sales charge. |
See Notes to Financial Statements.
22
Eaton Vance
Limited Maturity Municipal Income Funds
March 31, 2012
| | | | | | | | | | | | | | | |
| | | Year Ended March 31, 2012 | | |
| | | |
| | | Massachusetts
| | New York Limited
| �� | Pennsylvania
| | |
| Investment Income | | Limited Fund | | Fund | | Limited Fund | | |
| |
| Interest | | $ | 2,356,149 | | | $ | 3,650,590 | | | $ | 2,441,607 | | | |
| |
| |
Total investment income | | $ | 2,356,149 | | | $ | 3,650,590 | | | $ | 2,441,607 | | | |
| |
| |
| | | | | | | | | | | | | | | |
| | | | | | | | | | | | | | | |
| |
| Expenses |
| |
| Investment adviser fee | | $ | 243,943 | | | $ | 375,101 | | | $ | 248,841 | | | |
| Distribution and service fees | | | | | | | | | | | | | | |
| Class A | | | 65,693 | | | | 90,104 | | | | 58,185 | | | |
| Class B | | | 2,042 | | | | 12,175 | | | | 3,796 | | | |
| Class C | | | 116,974 | | | | 224,189 | | | | 163,373 | | | |
| Trustees’ fees and expenses | | | 2,582 | | | | 3,650 | | | | 2,596 | | | |
| Custodian fee | | | 41,327 | | | | 52,906 | | | | 42,032 | | | |
| Transfer and dividend disbursing agent fees | | | 22,709 | | | | 35,644 | | | | 30,331 | | | |
| Legal and accounting services | | | 39,603 | | | | 45,340 | | | | 38,392 | | | |
| Printing and postage | | | 10,648 | | | | 13,772 | | | | 13,428 | | | |
| Registration fees | | | 5,487 | | | | 6,934 | | | | 1,872 | | | |
| Miscellaneous | | | 18,232 | | | | 20,039 | | | | 18,042 | | | |
| |
| |
Total expenses | | $ | 569,240 | | | $ | 879,854 | | | $ | 620,888 | | | |
| |
| |
| Deduct — | | | | | | | | | | | | | | |
| Reduction of custodian fee | | $ | 224 | | | $ | 441 | | | $ | 152 | | | |
| |
| |
Total expense reductions | | $ | 224 | | | $ | 441 | | | $ | 152 | | | |
| |
| |
| | | | | | | | | | | | | | | |
Net expenses | | $ | 569,016 | | | $ | 879,413 | | | $ | 620,736 | | | |
| |
| |
| | | | | | | | | | | | | | | |
Net investment income | | $ | 1,787,133 | | | $ | 2,771,177 | | | $ | 1,820,871 | | | |
| |
| |
| | | | | | | | | | | | | | | |
| | | | | | | | | | | | | | | |
| |
| Realized and Unrealized Gain (Loss) |
| |
| Net realized gain (loss) — | | | | | | | | | | | | | | |
| Investment transactions | | $ | 171,020 | | | $ | (27,216 | ) | | $ | (36,585 | ) | | |
| Financial futures contracts | | | (839,424 | ) | | | (1,714,394 | ) | | | (1,024,095 | ) | | |
| |
| |
Net realized loss | | $ | (668,404 | ) | | $ | (1,741,610 | ) | | $ | (1,060,680 | ) | | |
| |
| |
| Change in unrealized appreciation (depreciation) — | | | | | | | | | | | | | | |
| Investments | | $ | 2,852,069 | | | $ | 4,949,012 | | | $ | 2,939,439 | | | |
| Financial futures contracts | | | 25,246 | | | | 54,590 | | | | 146,013 | | | |
| |
| |
Net change in unrealized appreciation (depreciation) | | $ | 2,877,315 | | | $ | 5,003,602 | | | $ | 3,085,452 | | | |
| |
| |
| | | | | | | | | | | | | | | |
Net realized and unrealized gain | | $ | 2,208,911 | | | $ | 3,261,992 | | | $ | 2,024,772 | | | |
| |
| |
| | | | | | | | | | | | | | | |
Net increase in net assets from operations | | $ | 3,996,044 | | | $ | 6,033,169 | | | $ | 3,845,643 | | | |
| |
| |
See Notes to Financial Statements.
23
Eaton Vance
Limited Maturity Municipal Income Funds
March 31, 2012
Statements of Changes in Net Assets
| | | | | | | | | | | | | | | |
| | | Year Ended March 31, 2012 | | |
| | | |
| | | Massachusetts
| | New York Limited
| | Pennsylvania
| | |
| Increase (Decrease) in Net Assets | | Limited Fund | | Fund | | Limited Fund | | |
| |
| From operations — | | | | | | | | | | | | | | |
| Net investment income | | $ | 1,787,133 | | | $ | 2,771,177 | | | $ | 1,820,871 | | | |
| Net realized loss from investment transactions and financial futures contracts | | | (668,404 | ) | | | (1,741,610 | ) | | | (1,060,680 | ) | | |
| Net change in unrealized appreciation (depreciation) from investments and financial futures contracts | | | 2,877,315 | | | | 5,003,602 | | | | 3,085,452 | | | |
| |
| |
Net increase in net assets from operations | | $ | 3,996,044 | | | $ | 6,033,169 | | | $ | 3,845,643 | | | |
| |
| |
| Distributions to shareholders — | | | | | | | | | | | | | | |
| From net investment income | | | | | | | | | | | | | | |
| Class A | | $ | (1,426,610 | ) | | $ | (2,029,549 | ) | | $ | (1,298,569 | ) | | |
| Class B | | | (5,673 | ) | | | (35,561 | ) | | | (10,981 | ) | | |
| Class C | | | (326,260 | ) | | | (654,230 | ) | | | (472,258 | ) | | |
| Class I | | | (23,909 | ) | | | (70,192 | ) | | | (32,318 | ) | | |
| Tax return of capital | | | | | | | | | | | | | | |
| Class A | | | — | | | | — | | | | (18,388 | ) | | |
| Class B | | | — | | | | — | | | | (155 | ) | | |
| Class C | | | — | | | | — | | | | (6,687 | ) | | |
| Class I | | | — | | | | — | | | | (458 | ) | | |
| |
| |
Total distributions to shareholders | | $ | (1,782,452 | ) | | $ | (2,789,532 | ) | | $ | (1,839,814 | ) | | |
| |
| |
| Transactions in shares of beneficial interest — | | | | | | | | | | | | | | |
| Proceeds from sale of shares | | | | | | | | | | | | | | |
| Class A | | $ | 5,022,402 | | | $ | 6,968,963 | | | $ | 4,649,361 | | | |
| Class B | | | 125,609 | | | | 185,900 | | | | 49,924 | | | |
| Class C | | | 682,789 | | | | 4,409,996 | | | | 2,788,697 | | | |
| Class I | | | 6,197,081 | | | | 4,767,644 | | | | 1,486,436 | | | |
| Net asset value of shares issued to shareholders in payment of distributions declared | | | | | | | | | | | | | | |
| Class A | | | 1,064,853 | | | | 1,710,667 | | | | 1,016,935 | | | |
| Class B | | | 5,711 | | | | 22,621 | | | | 10,316 | | | |
| Class C | | | 229,343 | | | | 476,330 | | | | 297,025 | | | |
| Class I | | | 12,733 | | | | 64,531 | | | | 31,034 | | | |
| Cost of shares redeemed | | | | | | | | | | | | | | |
| Class A | | | (8,945,584 | ) | | | (15,145,722 | ) | | | (9,728,577 | ) | | |
| Class B | | | (29,197 | ) | | | (201,822 | ) | | | (59,919 | ) | | |
| Class C | | | (2,183,302 | ) | | | (5,449,746 | ) | | | (2,369,835 | ) | | |
| Class I | | | (166,766 | ) | | | (681,406 | ) | | | (399,864 | ) | | |
| Net asset value of shares exchanged | | | | | | | | | | | | | | |
| Class A | | | 75,294 | | | | 170,945 | | | | 52,871 | | | |
| Class B | | | (75,294 | ) | | | (170,945 | ) | | | (52,871 | ) | | |
| |
| |
Net increase (decrease) in net assets from Fund share transactions | | $ | 2,015,672 | | | $ | (2,872,044 | ) | | $ | (2,228,467 | ) | | |
| |
| |
| | | | | | | | | | | | | | | |
Net increase (decrease) in net assets | | $ | 4,229,264 | | | $ | 371,593 | | | $ | (222,638 | ) | | |
| |
| |
| | | | | | | | | | | | | | | |
| | | | | | | | | | | | | | | |
| |
| Net Assets |
| |
| At beginning of year | | $ | 58,003,045 | | | $ | 88,101,083 | | | $ | 57,840,547 | | | |
| |
| |
At end of year | | $ | 62,232,309 | | | $ | 88,472,676 | | | $ | 57,617,909 | | | |
| |
| |
| | | | | | | | | | | | | | | |
| | | | | | | | | | | | | | | |
| |
Accumulated distributions in excess of net investment income
included in net assets |
| |
At end of year | | $ | (11,830 | ) | | $ | (80,202 | ) | | $ | (90,805 | ) | | |
| |
| |
See Notes to Financial Statements.
24
Eaton Vance
Limited Maturity Municipal Income Funds
March 31, 2012
Statements of Changes in Net Assets — continued
| | | | | | | | | | | | | | | |
| | | Year Ended March 31, 2011 | | |
| | | |
| | | Massachusetts
| | New York Limited
| | Pennsylvania
| | |
| Increase (Decrease) in Net Assets | | Limited Fund | | Fund | | Limited Fund | | |
| |
| From operations — | | | | | | | | | | | | | | |
| Net investment income | | $ | 2,084,523 | | | $ | 3,298,232 | | | $ | 2,257,948 | | | |
| Net realized loss from investment transactions and financial futures contracts | | | (440,797 | ) | | | (1,020,914 | ) | | | (350,112 | ) | | |
| Net change in unrealized appreciation (depreciation) from investments and financial futures contracts | | | (698,460 | ) | | | (973,980 | ) | | | (1,367,632 | ) | | |
| |
| |
Net increase in net assets from operations | | $ | 945,266 | | | $ | 1,303,338 | | | $ | 540,204 | | | |
| |
| |
| Distributions to shareholders — | | | | | | | | | | | | | | |
| From net investment income | | | | | | | | | | | | | | |
| Class A | | $ | (1,681,302 | ) | | $ | (2,485,993 | ) | | $ | (1,694,772 | ) | | |
| Class B | | | (7,485 | ) | | | (43,482 | ) | | | (12,734 | ) | | |
| Class C | | | (390,538 | ) | | | (769,392 | ) | | | (538,637 | ) | | |
| Class I | | | (121 | ) | | | (869 | ) | | | (25 | ) | | |
| |
| |
Total distributions to shareholders | | $ | (2,079,446 | ) | | $ | (3,299,736 | ) | | $ | (2,246,168 | ) | | |
| |
| |
| Transactions in shares of beneficial interest — | | | | | | | | | | | | | | |
| Proceeds from sale of shares | | | | | | | | | | | | | | |
| Class A | | $ | 7,329,256 | | | $ | 13,726,079 | | | $ | 9,541,077 | | | |
| Class B | | | 79,438 | | | | 167,649 | | | | 143,520 | | | |
| Class C | | | 2,089,737 | | | | 4,331,283 | | | | 3,666,682 | | | |
| Class I | | | 31,000 | | | | 101,000 | | | | 1,000 | | | |
| Net asset value of shares issued to shareholders in payment of distributions declared | | | | | | | | | | | | | | |
| Class A | | | 1,133,587 | | | | 1,893,823 | | | | 1,214,647 | | | |
| Class B | | | 7,417 | | | | 25,912 | | | | 10,900 | | | |
| Class C | | | 257,211 | | | | 491,380 | | | | 310,648 | | | |
| Class I | | | 47 | | | | 667 | | | | — | | | |
| Cost of shares redeemed | | | | | | | | | | | | | | |
| Class A | | | (16,268,815 | ) | | | (24,605,026 | ) | | | (17,341,898 | ) | | |
| Class B | | | (39,422 | ) | | | (213,991 | ) | | | (88,789 | ) | | |
| Class C | | | (3,459,307 | ) | | | (7,130,678 | ) | | | (4,132,293 | ) | | |
| Net asset value of shares exchanged | | | | | | | | | | | | | | |
| Class A | | | 279,499 | | | | 272,237 | | | | 39,975 | | | |
| Class B | | | (279,499 | ) | | | (272,237 | ) | | | (39,975 | ) | | |
| |
| |
Net decrease in net assets from Fund share transactions | | $ | (8,839,851 | ) | | $ | (11,211,902 | ) | | $ | (6,674,506 | ) | | |
| |
| |
| | | | | | | | | | | | | | | |
Net decrease in net assets | | $ | (9,974,031 | ) | | $ | (13,208,300 | ) | | $ | (8,380,470 | ) | | |
| |
| |
| | | | | | | | | | | | | | | |
| | | | | | | | | | | | | | | |
| |
| Net Assets |
| |
| At beginning of year | | $ | 67,977,076 | | | $ | 101,309,383 | | | $ | 66,221,017 | | | |
| |
| |
At end of year | | $ | 58,003,045 | | | $ | 88,101,083 | | | $ | 57,840,547 | | | |
| |
| |
| | | | | | | | | | | | | | | |
| | | | | | | | | | | | | | | |
| |
Accumulated distributions in excess of net investment income
included in net assets |
| |
At end of year | | $ | (11,828 | ) | | $ | (71,712 | ) | | $ | (97,417 | ) | | |
| |
| |
See Notes to Financial Statements.
25
Eaton Vance
Limited Maturity Municipal Income Funds
March 31, 2012
| | | | | | | | | | | | | | | | | | | | | | | |
| | | Massachusetts Limited Fund — Class A | | |
| | | |
| | | Year Ended March 31, | | |
| | | |
| | | 2012 | | 2011 | | 2010 | | 2009 | | 2008 | | |
| |
| Net asset value — Beginning of year | | $ | 9.850 | | | $ | 10.040 | | | $ | 9.560 | | | $ | 9.970 | | | $ | 10.200 | | | |
| |
| |
| | | | | | | | | | | | | | | | | | | | | | | |
| | | | | | | | | | | | | | | | | | | | | | | |
| |
| Income (Loss) From Operations |
| |
Net investment income(1) | | $ | 0.331 | | | $ | 0.340 | | | $ | 0.347 | | | $ | 0.360 | | | $ | 0.371 | | | |
| Net realized and unrealized gain (loss) | | | 0.390 | | | | (0.191 | ) | | | 0.490 | | | | (0.407 | ) | | | (0.231 | ) | | |
| |
| |
Total income (loss) from operations | | $ | 0.721 | | | $ | 0.149 | | | $ | 0.837 | | | $ | (0.047 | ) | | $ | 0.140 | | | |
| |
| |
| | | | | | | | | | | | | | | | | | | | | | | |
| | | | | | | | | | | | | | | | | | | | | | | |
| |
| Less Distributions |
| |
| From net investment income | | $ | (0.331 | ) | | $ | (0.339 | ) | | $ | (0.357 | ) | | $ | (0.363 | ) | | $ | (0.370 | ) | | |
| |
| |
Total distributions | | $ | (0.331 | ) | | $ | (0.339 | ) | | $ | (0.357 | ) | | $ | (0.363 | ) | | $ | (0.370 | ) | | |
| |
| |
| | | | | | | | | | | | | | | | | | | | | | | |
Net asset value — End of year | | $ | 10.240 | | | $ | 9.850 | | | $ | 10.040 | | | $ | 9.560 | | | $ | 9.970 | | | |
| |
| |
| | | | | | | | | | | | | | | | | | | | | | | |
Total Return(2) | | | 7.43 | % | | | 1.46 | % | | | 8.83 | % | | | (0.50 | )% | | | 1.39 | % | | |
| |
| |
| | | | | | | | | | | | | | | | | | | | | | | |
| | | | | | | | | | | | | | | | | | | | | | | |
| |
| Ratios/Supplemental Data |
| |
| Net assets, end of year (000’s omitted) | | $ | 43,283 | | | $ | 44,351 | | | $ | 52,719 | | | $ | 46,857 | | | $ | 49,514 | | | |
| Ratios (as a percentage of average daily net assets): | | | | | | | | | | | | | | | | | | | | | | |
| Total expenses before custodian fee reduction | | | 0.82 | % | | | 0.81 | % | | | 0.82 | % | | | 0.85 | % | | | 0.84 | % | | |
| Expenses after custodian fee reduction | | | 0.82 | % | | | 0.81 | % | | | 0.82 | % | | | 0.84 | % | | | 0.83 | % | | |
| Net investment income | | | 3.27 | % | | | 3.37 | % | | | 3.47 | % | | | 3.69 | % | | | 3.67 | % | | |
| Portfolio Turnover | | | 19 | % | | | 2 | % | | | 11 | % | | | 16 | % | | | 14 | % | | |
| |
| |
| | |
| (1) | | Computed using average shares outstanding. |
| (2) | | Returns are historical and are calculated by determining the percentage change in net asset value with all distributions reinvested and do not reflect the effect of sales charges. |
See Notes to Financial Statements.
26
Eaton Vance
Limited Maturity Municipal Income Funds
March 31, 2012
Financial Highlights — continued
| | | | | | | | | | | | | | | | | | | | | | | |
| | | Massachusetts Limited Fund — Class B | | |
| | | |
| | | Year Ended March 31, | | |
| | | |
| | | 2012 | | 2011 | | 2010 | | 2009 | | 2008 | | |
| |
| Net asset value — Beginning of year | | $ | 9.840 | | | $ | 10.030 | | | $ | 9.560 | | | $ | 9.960 | | | $ | 10.200 | | | |
| |
| |
| | | | | | | | | | | | | | | | | | | | | | | |
| | | | | | | | | | | | | | | | | | | | | | | |
| |
| Income (Loss) From Operations |
| |
Net investment income(1) | | $ | 0.254 | | | $ | 0.265 | | | $ | 0.275 | | | $ | 0.288 | | | $ | 0.297 | | | |
| Net realized and unrealized gain (loss) | | | 0.390 | | | | (0.192 | ) | | | 0.479 | | | | (0.399 | ) | | | (0.244 | ) | | |
| |
| |
Total income (loss) from operations | | $ | 0.644 | | | $ | 0.073 | | | $ | 0.754 | | | $ | (0.111 | ) | | $ | 0.053 | | | |
| |
| |
| | | | | | | | | | | | | | | | | | | | | | | |
| | | | | | | | | | | | | | | | | | | | | | | |
| |
| Less Distributions |
| |
| From net investment income | | $ | (0.254 | ) | | $ | (0.263 | ) | | $ | (0.284 | ) | | $ | (0.289 | ) | | $ | (0.293 | ) | | |
| |
| |
Total distributions | | $ | (0.254 | ) | | $ | (0.263 | ) | | $ | (0.284 | ) | | $ | (0.289 | ) | | $ | (0.293 | ) | | |
| |
| |
| | | | | | | | | | | | | | | | | | | | | | | |
Net asset value — End of year | | $ | 10.230 | | | $ | 9.840 | | | $ | 10.030 | | | $ | 9.560 | | | $ | 9.960 | | | |
| |
| |
| | | | | | | | | | | | | | | | | | | | | | | |
Total Return(2) | | | 6.64 | % | | | 0.70 | % | | | 7.94 | % | | | (1.15 | )% | | | 0.52 | % | | |
| |
| |
| | | | | | | | | | | | | | | | | | | | | | | |
| | | | | | | | | | | | | | | | | | | | | | | |
| |
| Ratios/Supplemental Data |
| |
| Net assets, end of year (000’s omitted) | | $ | 253 | | | $ | 218 | | | $ | 451 | | | $ | 854 | | | $ | 1,628 | | | |
| Ratios (as a percentage of average daily net assets): | | | | | | | | | | | | | | | | | | | | | | |
| Expenses before custodian fee reduction | | | 1.57 | % | | | 1.56 | % | | | 1.57 | % | | | 1.60 | % | | | 1.60 | % | | |
| Expenses after custodian fee reduction | | | 1.57 | % | | | 1.56 | % | | | 1.57 | % | | | 1.59 | % | | | 1.58 | % | | |
| Net investment income | | | 2.51 | % | | | 2.62 | % | | | 2.76 | % | | | 2.94 | % | | | 2.94 | % | | |
| Portfolio Turnover | | | 19 | % | | | 2 | % | | | 11 | % | | | 16 | % | | | 14 | % | | |
| |
| |
| | |
| (1) | | Computed using average shares outstanding. |
| (2) | | Returns are historical and are calculated by determining the percentage change in net asset value with all distributions reinvested and do not reflect the effect of sales charges. |
See Notes to Financial Statements.
27
Eaton Vance
Limited Maturity Municipal Income Funds
March 31, 2012
Financial Highlights — continued
| | | | | | | | | | | | | | | | | | | | | | | |
| | | Massachusetts Limited Fund — Class C | | |
| | | |
| | | Year Ended March 31, | | |
| | | |
| | | 2012 | | 2011 | | 2010 | | 2009 | | 2008 | | |
| |
| Net asset value — Beginning of year | | $ | 9.430 | | | $ | 9.620 | | | $ | 9.160 | | | $ | 9.550 | | | $ | 9.770 | | | |
| |
| |
| | | | | | | | | | | | | | | | | | | | | | | |
| | | | | | | | | | | | | | | | | | | | | | | |
| |
| Income (Loss) From Operations |
| |
Net investment income(1) | | $ | 0.245 | | | $ | 0.253 | | | $ | 0.260 | | | $ | 0.274 | | | $ | 0.284 | | | |
| Net realized and unrealized gain (loss) | | | 0.379 | | | | (0.191 | ) | | | 0.472 | | | | (0.387 | ) | | | (0.223 | ) | | |
| |
| |
Total income (loss) from operations | | $ | 0.624 | | | $ | 0.062 | | | $ | 0.732 | | | $ | (0.113 | ) | | $ | 0.061 | | | |
| |
| |
| | | | | | | | | | | | | | | | | | | | | | | |
| | | | | | | | | | | | | | | | | | | | | | | |
| |
| Less Distributions |
| |
| From net investment income | | $ | (0.244 | ) | | $ | (0.252 | ) | | $ | (0.272 | ) | | $ | (0.277 | ) | | $ | (0.281 | ) | | |
| |
| |
Total distributions | | $ | (0.244 | ) | | $ | (0.252 | ) | | $ | (0.272 | ) | | $ | (0.277 | ) | | $ | (0.281 | ) | | |
| |
| |
| | | | | | | | | | | | | | | | | | | | | | | |
Net asset value — End of year | | $ | 9.810 | | | $ | 9.430 | | | $ | 9.620 | | | $ | 9.160 | | | $ | 9.550 | | | |
| |
| |
| | | | | | | | | | | | | | | | | | | | | | | |
Total Return(2) | | | 6.71 | % | | | 0.62 | % | | | 8.05 | % | | | (1.22 | )% | | | 0.63 | % | | |
| |
| |
| | | | | | | | | | | | | | | | | | | | | | | |
| | | | | | | | | | | | | | | | | | | | | | | |
| |
| Ratios/Supplemental Data |
| |
| Net assets, end of year (000’s omitted) | | $ | 12,647 | | | $ | 13,403 | | | $ | 14,807 | | | $ | 12,611 | | | $ | 12,995 | | | |
| Ratios (as a percentage of average daily net assets): | | | | | | | | | | | | | | | | | | | | | | |
| Expenses before custodian fee reduction | | | 1.57 | % | | | 1.56 | % | | | 1.57 | % | | | 1.60 | % | | | 1.60 | % | | |
| Expenses after custodian fee reduction | | | 1.57 | % | | | 1.56 | % | | | 1.57 | % | | | 1.59 | % | | | 1.58 | % | | |
| Net investment income | | | 2.52 | % | | | 2.62 | % | | | 2.71 | % | | | 2.93 | % | | | 2.93 | % | | |
| Portfolio Turnover | | | 19 | % | | | 2 | % | | | 11 | % | | | 16 | % | | | 14 | % | | |
| |
| |
| | |
| (1) | | Computed using average shares outstanding. |
| (2) | | Returns are historical and are calculated by determining the percentage change in net asset value with all distributions reinvested and do not reflect the effect of sales charges. |
See Notes to Financial Statements.
28
Eaton Vance
Limited Maturity Municipal Income Funds
March 31, 2012
Financial Highlights — continued
| | | | | | | | | | | |
| | | Massachusetts Limited Fund — Class I | | |
| | | |
| | | Year Ended
| | Period Ended
| | |
| | | March 31, 2012 | | March 31, 2011(1) | | |
| |
| Net asset value — Beginning of period | | $ | 9.850 | | | $ | 10.210 | | | |
| |
| |
| | | | | | | | | | | |
| | | | | | | | | | | |
| |
| Income (Loss) From Operations |
| |
| Net investment income | | $ | 0.346 | | | $ | 0.235 | | | |
| Net realized and unrealized gain (loss) | | | 0.390 | | | | (0.360 | ) | | |
| |
| |
Total income (loss) from operations | | $ | 0.736 | | | $ | (0.125 | ) | | |
| |
| |
| | | | | | | | | | | |
| | | | | | | | | | | |
| |
| Less Distributions |
| |
| From net investment income | | $ | (0.346 | ) | | $ | (0.235 | ) | | |
| |
| |
Total distributions | | $ | (0.346 | ) | | $ | (0.235 | ) | | |
| |
| |
| | | | | | | | | | | |
Net asset value — End of period | | $ | 10.240 | | | $ | 9.850 | | | |
| |
| |
| | | | | | | | | | | |
Total Return(2) | | | 7.59 | % | | | (1.39 | )%(3) | | |
| |
| |
| | | | | | | | | | | |
| | | | | | | | | | | |
| |
| Ratios/Supplemental Data |
| |
| Net assets, end of period (000’s omitted) | | $ | 6,050 | | | $ | 31 | | | |
| Ratios (as a percentage of average daily net assets): | | | | | | | | | | |
Expenses(4) | | | 0.66 | % | | | 0.67 | %(5) | | |
| Net investment income | | | 3.02 | % | | | 3.26 | %(5) | | |
| Portfolio Turnover | | | 19 | % | | | 2 | %(6) | | |
| |
| |
| | |
| (1) | | For the period from the commencement of operations on August 3, 2010 to March 31, 2011. |
| (2) | | Returns are historical and are calculated by determining the percentage change in net asset value with all distributions reinvested. |
| (3) | | Not annualized. |
| (4) | | Excludes the effect of custody fee credits, if any, of less than 0.005%. |
| (5) | | Annualized. |
| (6) | | For the Fund’s year ended March 31, 2011. |
See Notes to Financial Statements.
29
Eaton Vance
Limited Maturity Municipal Income Funds
March 31, 2012
Financial Highlights — continued
| | | | | | | | | | | | | | | | | | | | | | | |
| | | New York Limited Fund — Class A | | |
| | | |
| | | Year Ended March 31, | | |
| | | |
| | | 2012 | | 2011 | | 2010 | | 2009 | | 2008 | | |
| |
| Net asset value — Beginning of year | | $ | 9.980 | | | $ | 10.190 | | | $ | 9.550 | | | $ | 10.200 | | | $ | 10.600 | | | |
| |
| |
| | | | | | | | | | | | | | | | | | | | | | | |
| | | | | | | | | | | | | | | | | | | | | | | |
| |
| Income (Loss) From Operations |
| |
Net investment income(1) | | $ | 0.344 | | | $ | 0.358 | | | $ | 0.368 | | | $ | 0.387 | | | $ | 0.402 | | | |
| Net realized and unrealized gain (loss) | | | 0.372 | | | | (0.210 | ) | | | 0.644 | | | | (0.642 | ) | | | (0.405 | ) | | |
| |
| |
Total income (loss) from operations | | $ | 0.716 | | | $ | 0.148 | | | $ | 1.012 | | | $ | (0.255 | ) | | $ | (0.003 | ) | | |
| |
| |
| | | | | | | | | | | | | | | | | | | | | | | |
| | | | | | | | | | | | | | | | | | | | | | | |
| |
| Less Distributions |
| |
| From net investment income | | $ | (0.346 | ) | | $ | (0.358 | ) | | $ | (0.372 | ) | | $ | (0.395 | ) | | $ | (0.397 | ) | | |
| |
| |
Total distributions | | $ | (0.346 | ) | | $ | (0.358 | ) | | $ | (0.372 | ) | | $ | (0.395 | ) | | $ | (0.397 | ) | | |
| |
| |
| | | | | | | | | | | | | | | | | | | | | | | |
Net asset value — End of year | | $ | 10.350 | | | $ | 9.980 | | | $ | 10.190 | | | $ | 9.550 | | | $ | 10.200 | | | |
| |
| |
| | | | | | | | | | | | | | | | | | | | | | | |
Total Return(2) | | | 7.30 | % | | | 1.42 | % | | | 10.72 | % | | | (2.56 | )% | | | (0.03 | )% | | |
| |
| |
| | | | | | | | | | | | | | | | | | | | | | | |
| | | | | | | | | | | | | | | | | | | | | | | |
| |
| Ratios/Supplemental Data |
| |
| Net assets, end of year (000’s omitted) | | $ | 56,993 | | | $ | 61,099 | | | $ | 71,238 | | | $ | 63,159 | | | $ | 71,401 | | | |
| Ratios (as a percentage of average daily net assets): | | | | | | | | | | | | | | | | | | | | | | |
| Expenses excluding interest and fees | | | 0.78 | % | | | 0.78 | % | | | 0.81 | % | | | 0.80 | % | | | 0.82 | % | | |
Interest and fee expense(3) | | | — | | | | — | | | | — | | | | — | | | | 0.01 | % | | |
| Total expenses before custodian fee reduction | | | 0.78 | % | | | 0.78 | % | | | 0.81 | % | | | 0.80 | % | | | 0.83 | % | | |
| Expenses after custodian fee reduction excluding interest and fees | | | 0.78 | % | | | 0.78 | % | | | 0.81 | % | | | 0.79 | % | | | 0.81 | % | | |
| Net investment income | | | 3.36 | % | | | 3.50 | % | | | 3.66 | % | | | 3.92 | % | | | 3.85 | % | | |
| Portfolio Turnover | | | 12 | % | | | 8 | % | | | 6 | % | | | 22 | % | | | 14 | % | | |
| |
| |
| | |
| (1) | | Computed using average shares outstanding. |
| (2) | | Returns are historical and are calculated by determining the percentage change in net asset value with all distributions reinvested and do not reflect the effect of sales charges. |
| (3) | | Interest and fee expense relates to the liability for floating rate notes issued in conjunction with residual interest bond transactions. |
See Notes to Financial Statements.
30
Eaton Vance
Limited Maturity Municipal Income Funds
March 31, 2012
Financial Highlights — continued
| | | | | | | | | | | | | | | | | | | | | | | |
| | | New York Limited Fund — Class B | | |
| | | |
| | | Year Ended March 31, | | |
| | | |
| | | 2012 | | 2011 | | 2010 | | 2009 | | 2008 | | |
| |
| Net asset value — Beginning of year | | $ | 9.970 | | | $ | 10.180 | | | $ | 9.540 | | | $ | 10.190 | | | $ | 10.590 | | | |
| |
| |
| | | | | | | | | | | | | | | | | | | | | | | |
| | | | | | | | | | | | | | | | | | | | | | | |
| |
| Income (Loss) From Operations |
| |
Net investment income(1) | | $ | 0.267 | | | $ | 0.281 | | | $ | 0.293 | | | $ | 0.312 | | | $ | 0.324 | | | |
| Net realized and unrealized gain (loss) | | | 0.382 | | | | (0.210 | ) | | | 0.644 | | | | (0.643 | ) | | | (0.406 | ) | | |
| |
| |
Total income (loss) from operations | | $ | 0.649 | | | $ | 0.071 | | | $ | 0.937 | | | $ | (0.331 | ) | | $ | (0.082 | ) | | |
| |
| |
| | | | | | | | | | | | | | | | | | | | | | | |
| | | | | | | | | | | | | | | | | | | | | | | |
| |
| Less Distributions |
| |
| From net investment income | | $ | (0.269 | ) | | $ | (0.281 | ) | | $ | (0.297 | ) | | $ | (0.319 | ) | | $ | (0.318 | ) | | |
| |
| |
Total distributions | | $ | (0.269 | ) | | $ | (0.281 | ) | | $ | (0.297 | ) | | $ | (0.319 | ) | | $ | (0.318 | ) | | |
| |
| |
| | | | | | | | | | | | | | | | | | | | | | | |
Net asset value — End of year | | $ | 10.350 | | | $ | 9.970 | | | $ | 10.180 | | | $ | 9.540 | | | $ | 10.190 | | | |
| |
| |
| | | | | | | | | | | | | | | | | | | | | | | |
Total Return(2) | | | 6.60 | % | | | 0.66 | % | | | 9.92 | % | | | (3.31 | )% | | | (0.79 | )% | | |
| |
| |
| | | | | | | | | | | | | | | | | | | | | | | |
| | | | | | | | | | | | | | | | | | | | | | | |
| |
| Ratios/Supplemental Data |
| |
| Net assets, end of year (000’s omitted) | | $ | 1,314 | | | $ | 1,428 | | | $ | 1,746 | | | $ | 1,976 | | | $ | 2,017 | | | |
| Ratios (as a percentage of average daily net assets): | | | | | | | | | | | | | | | | | | | | | | |
| Expenses excluding interest and fees | | | 1.53 | % | | | 1.53 | % | | | 1.56 | % | | | 1.55 | % | | | 1.57 | % | | |
Interest and fee expense(3) | | | — | | | | — | | | | — | | | | — | | | | 0.01 | % | | |
| Total expenses before custodian fee reduction | | | 1.53 | % | | | 1.53 | % | | | 1.56 | % | | | 1.55 | % | | | 1.58 | % | | |
| Expenses after custodian fee reduction excluding interest and fees | | | 1.53 | % | | | 1.53 | % | | | 1.56 | % | | | 1.54 | % | | | 1.56 | % | | |
| Net investment income | | | 2.61 | % | | | 2.75 | % | | | 2.92 | % | | | 3.17 | % | | | 3.10 | % | | |
| Portfolio Turnover | | | 12 | % | | | 8 | % | | | 6 | % | | | 22 | % | | | 14 | % | | |
| |
| |
| | |
| (1) | | Computed using average shares outstanding. |
| (2) | | Returns are historical and are calculated by determining the percentage change in net asset value with all distributions reinvested and do not reflect the effect of sales charges. |
| (3) | | Interest and fee expense relates to the liability for floating rate notes issued in conjunction with residual interest bond transactions. |
See Notes to Financial Statements.
31
Eaton Vance
Limited Maturity Municipal Income Funds
March 31, 2012
Financial Highlights — continued
| | | | | | | | | | | | | | | | | | | | | | | |
| | | New York Limited Fund — Class C | | |
| | | |
| | | Year Ended March 31, | | |
| | | |
| | | 2012 | | 2011 | | 2010 | | 2009 | | 2008 | | |
| |
| Net asset value — Beginning of year | | $ | 9.490 | | | $ | 9.690 | | | $ | 9.080 | | | $ | 9.690 | | | $ | 10.070 | | | |
| |
| |
| | | | | | | | | | | | | | | | | | | | | | | |
| | | | | | | | | | | | | | | | | | | | | | | |
| |
| Income (Loss) From Operations |
| |
Net investment income(1) | | $ | 0.254 | | | $ | 0.267 | | | $ | 0.278 | | | $ | 0.297 | | | $ | 0.308 | | | |
| Net realized and unrealized gain (loss) | | | 0.352 | | | | (0.200 | ) | | | 0.615 | | | | (0.603 | ) | | | (0.385 | ) | | |
| |
| |
Total income (loss) from operations | | $ | 0.606 | | | $ | 0.067 | | | $ | 0.893 | | | $ | (0.306 | ) | | $ | (0.077 | ) | | |
| |
| |
| | | | | | | | | | | | | | | | | | | | | | | |
| | | | | | | | | | | | | | | | | | | | | | | |
| |
| Less Distributions |
| |
| From net investment income | | $ | (0.256 | ) | | $ | (0.267 | ) | | $ | (0.283 | ) | | $ | (0.304 | ) | | $ | (0.303 | ) | | |
| |
| |
Total distributions | | $ | (0.256 | ) | | $ | (0.267 | ) | | $ | (0.283 | ) | | $ | (0.304 | ) | | $ | (0.303 | ) | | |
| |
| |
| | | | | | | | | | | | | | | | | | | | | | | |
Net asset value — End of year | | $ | 9.840 | | | $ | 9.490 | | | $ | 9.690 | | | $ | 9.080 | | | $ | 9.690 | | | |
| |
| |
| | | | | | | | | | | | | | | | | | | | | | | |
Total Return(2) | | | 6.47 | % | | | 0.66 | % | | | 9.92 | % | | | (3.22 | )% | | | (0.78 | )% | | |
| |
| |
| | | | | | | | | | | | | | | | | | | | | | | |
| | | | | | | | | | | | | | | | | | | | | | | |
| |
| Ratios/Supplemental Data |
| |
| Net assets, end of year (000’s omitted) | | $ | 25,823 | | | $ | 25,473 | | | $ | 28,326 | | | $ | 22,780 | | | $ | 23,844 | | | |
| Ratios (as a percentage of average daily net assets): | | | | | | | | | | | | | | | | | | | | | | |
| Expenses excluding interest and fees | | | 1.53 | % | | | 1.53 | % | | | 1.56 | % | | | 1.55 | % | | | 1.57 | % | | |
Interest and fee expense(3) | | | — | | | | — | | | | — | | | | — | | | | 0.01 | % | | |
| Total expenses before custodian fee reduction | | | 1.53 | % | | | 1.53 | % | | | 1.56 | % | | | 1.55 | % | | | 1.58 | % | | |
| Expenses after custodian fee reduction excluding interest and fees | | | 1.53 | % | | | 1.53 | % | | | 1.56 | % | | | 1.55 | % | | | 1.56 | % | | |
| Net investment income | | | 2.61 | % | | | 2.75 | % | | | 2.90 | % | | | 3.17 | % | | | 3.10 | % | | |
| Portfolio Turnover | | | 12 | % | | | 8 | % | | | 6 | % | | | 22 | % | | | 14 | % | | |
| |
| |
| | |
| (1) | | Computed using average shares outstanding. |
| (2) | | Returns are historical and are calculated by determining the percentage change in net asset value with all distributions reinvested and do not reflect the effect of sales charges. |
| (3) | | Interest and fee expense relates to the liability for floating rate notes issued in conjunction with residual interest bond transactions. |
See Notes to Financial Statements.
32
Eaton Vance
Limited Maturity Municipal Income Funds
March 31, 2012
Financial Highlights — continued
| | | | | | | | | | | |
| | | New York Limited Fund — Class I | | |
| | | |
| | | Year Ended
| | Period Ended
| | |
| | | March 31, 2012 | | March 31, 2011(1) | | |
| |
| Net asset value — Beginning of period | | $ | 9.970 | | | $ | 10.330 | | | |
| |
| |
| | | | | | | | | | | |
| | | | | | | | | | | |
| |
| Income (Loss) From Operations |
| |
| Net investment income | | $ | 0.364 | | | $ | 0.250 | | | |
| Net realized and unrealized gain (loss) | | | 0.378 | | | | (0.360 | ) | | |
| |
| |
Total income (loss) from operations | | $ | 0.742 | | | $ | (0.110 | ) | | |
| |
| |
| | | | | | | | | | | |
| | | | | | | | | | | |
| |
| Less Distributions |
| |
| From net investment income | | $ | (0.362 | ) | | $ | (0.250 | ) | | |
| |
| |
Total distributions | | $ | (0.362 | ) | | $ | (0.250 | ) | | |
| |
| |
| | | | | | | | | | | |
Net asset value — End of period | | $ | 10.350 | | | $ | 9.970 | | | |
| |
| |
| | | | | | | | | | | |
Total Return(2) | | | 7.56 | % | | | (1.26 | )%(3) | | |
| |
| |
| | | | | | | | | | | |
| | | | | | | | | | | |
| |
| Ratios/Supplemental Data |
| |
| Net assets, end of year (000’s omitted) | | $ | 4,342 | | | $ | 101 | | | |
| Ratios (as a percentage of average daily net assets): | | | | | | | | | | |
Expenses(4) | | | 0.63 | % | | | 0.63 | %(5) | | |
| Net investment income | | | 3.41 | % | | | 3.68 | %(5) | | |
| Portfolio Turnover | | | 12 | % | | | 8 | %(6) | | |
| |
| |
| | |
| (1) | | For the period from the commencement of operations on August 3, 2010 to March 31, 2011. |
| (2) | | Returns are historical and are calculated by determining the percentage change in net asset value with all distributions reinvested. |
| (3) | | Not annualized. |
| (4) | | Excludes the effect of custody fee credits, if any, of less than 0.005%. |
| (5) | | Annualized. |
| (6) | | For the Fund’s year ended March 31, 2011. |
See Notes to Financial Statements.
33
Eaton Vance
Limited Maturity Municipal Income Funds
March 31, 2012
Financial Highlights — continued
| | | | | | | | | | | | | | | | | | | | | | | |
| | | Pennsylvania Limited Fund — Class A | | |
| | | |
| | | Year Ended March 31, | | |
| | | |
| | | 2012 | | 2011 | | 2010 | | 2009 | | 2008 | | |
| |
| Net asset value — Beginning of year | | $ | 9.810 | | | $ | 10.060 | | | $ | 9.720 | | | $ | 10.030 | | | $ | 10.360 | | | |
| |
| |
| | | | | | | | | | | | | | | | | | | | | | | |
| | | | | | | | | | | | | | | | | | | | | | | |
| |
| Income (Loss) From Operations |
| |
Net investment income(1) | | $ | 0.338 | | | $ | 0.371 | | | $ | 0.372 | | | $ | 0.393 | | | $ | 0.393 | | | |
| Net realized and unrealized gain (loss) | | | 0.354 | | | | (0.252 | ) | | | 0.348 | | | | (0.313 | ) | | | (0.327 | ) | | |
| |
| |
Total income from operations | | $ | 0.692 | | | $ | 0.119 | | | $ | 0.720 | | | $ | 0.080 | | | $ | 0.066 | | | |
| |
| |
| | | | | | | | | | | | | | | | | | | | | | | |
| | | | | | | | | | | | | | | | | | | | | | | |
| |
| Less Distributions |
| |
| From net investment income | | $ | (0.337 | ) | | $ | (0.369 | ) | | $ | (0.380 | ) | | $ | (0.390 | ) | | $ | (0.396 | ) | | |
| Tax return of capital | | | (0.005 | ) | | | — | | | | — | | | | — | | | | — | | | |
| |
| |
Total distributions | | $ | (0.342 | ) | | $ | (0.369 | ) | | $ | (0.380 | ) | | $ | (0.390 | ) | | $ | (0.396 | ) | | |
| |
| �� |
| | | | | | | | | | | | | | | | | | | | | | | |
Net asset value — End of year | | $ | 10.160 | | | $ | 9.810 | | | $ | 10.060 | | | $ | 9.720 | | | $ | 10.030 | | | |
| |
| |
| | | | | | | | | | | | | | | | | | | | | | | |
Total Return(2) | | | 7.17 | % | | | 1.16 | % | | | 7.49 | % | | | 0.83 | % | | | 0.64 | % | | |
| |
| |
| | | | | | | | | | | | | | | | | | | | | | | |
| | | | | | | | | | | | | | | | | | | | | | | |
| |
| Ratios/Supplemental Data |
| |
| Net assets, end of year (000’s omitted) | | $ | 37,366 | | | $ | 40,024 | | | $ | 47,779 | | | $ | 36,461 | | | $ | 39,272 | | | |
| Ratios (as a percentage of average daily net assets): | | | | | | | | | | | | | | | | | | | | | | |
| Expenses before custodian fee reduction | | | 0.83 | % | | | 0.82 | % | | | 0.84 | % | | | 0.87 | % | | | 0.88 | % | | |
| Expenses after custodian fee reduction | | | 0.83 | % | | | 0.82 | % | | | 0.84 | % | | | 0.86 | % | | | 0.85 | % | | |
| Net investment income | | | 3.36 | % | | | 3.69 | % | | | 3.71 | % | | | 4.00 | % | | | 3.84 | % | | |
| Portfolio Turnover | | | 15 | % | | | 9 | % | | | 6 | % | | | 19 | % | | | 12 | % | | |
| |
| |
| | |
| (1) | | Computed using average shares outstanding. |
| (2) | | Returns are historical and are calculated by determining the percentage change in net asset value with all distributions reinvested and do not reflect the effect of sales charges. |
See Notes to Financial Statements.
34
Eaton Vance
Limited Maturity Municipal Income Funds
March 31, 2012
Financial Highlights — continued
| | | | | | | | | | | | | | | | | | | | | | | |
| | | Pennsylvania Limited Fund — Class B | | |
| | | |
| | | Year Ended March 31, | | |
| | | |
| | | 2012 | | 2011 | | 2010 | | 2009 | | 2008 | | |
| |
| Net asset value — Beginning of year | | $ | 9.810 | | | $ | 10.060 | | | $ | 9.720 | | | $ | 10.030 | | | $ | 10.360 | | | |
| |
| |
| | | | | | | | | | | | | | | | | | | | | | | |
| | | | | | | | | | | | | | | | | | | | | | | |
| |
| Income (Loss) From Operations |
| |
Net investment income(1) | | $ | 0.262 | | | $ | 0.296 | | | $ | 0.300 | | | $ | 0.319 | | | $ | 0.318 | | | |
| Net realized and unrealized gain (loss) | | | 0.354 | | | | (0.252 | ) | | | 0.346 | | | | (0.314 | ) | | | (0.329 | ) | | |
| |
| |
Total income (loss) from operations | | $ | 0.616 | | | $ | 0.044 | | | $ | 0.646 | | | $ | 0.005 | | | $ | (0.011 | ) | | |
| |
| |
| | | | | | | | | | | | | | | | | | | | | | | |
| | | | | | | | | | | | | | | | | | | | | | | |
| |
| Less Distributions |
| |
| From net investment income | | $ | (0.262 | ) | | $ | (0.294 | ) | | $ | (0.306 | ) | | $ | (0.315 | ) | | $ | (0.319 | ) | | |
| Tax return of capital | | | (0.004 | ) | | | — | | | | — | | | | — | | | | — | | | |
| |
| |
Total distributions | | $ | (0.266 | ) | | $ | (0.294 | ) | | $ | (0.306 | ) | | $ | (0.315 | ) | | $ | (0.319 | ) | | |
| |
| |
| | | | | | | | | | | | | | | | | | | | | | | |
Net asset value — End of year | | $ | 10.160 | | | $ | 9.810 | | | $ | 10.060 | | | $ | 9.720 | | | $ | 10.030 | | | |
| |
| |
| | | | | | | | | | | | | | | | | | | | | | | |
Total Return(2) | | | 6.38 | % | | | 0.41 | % | | | 6.70 | % | | | 0.06 | % | | | (0.11 | )% | | |
| |
| |
| | | | | | | | | | | | | | | | | | | | | | | |
| | | | | | | | | | | | | | | | | | | | | | | |
| |
| Ratios/Supplemental Data |
| |
| Net assets, end of year (000’s omitted) | | $ | 405 | | | $ | 442 | | | $ | 428 | | | $ | 550 | | | $ | 1,159 | | | |
| Ratios (as a percentage of average daily net assets): | | | | | | | | | | | | | | | | | | | | | | |
| Expenses before custodian fee reduction | | | 1.58 | % | | | 1.57 | % | | | 1.59 | % | | | 1.62 | % | | | 1.63 | % | | |
| Expenses after custodian fee reduction | | | 1.58 | % | | | 1.57 | % | | | 1.59 | % | | | 1.61 | % | | | 1.60 | % | | |
| Net investment income | | | 2.61 | % | | | 2.95 | % | | | 3.00 | % | | | 3.25 | % | | | 3.10 | % | | |
| Portfolio Turnover | | | 15 | % | | | 9 | % | | | 6 | % | | | 19 | % | | | 12 | % | | |
| |
| |
| | |
| (1) | | Computed using average shares outstanding. |
| (2) | | Returns are historical and are calculated by determining the percentage change in net asset value with all distributions reinvested and do not reflect the effect of sales charges. |
See Notes to Financial Statements.
35
Eaton Vance
Limited Maturity Municipal Income Funds
March 31, 2012
Financial Highlights — continued
| | | | | | | | | | | | | | | | | | | | | | | |
| | | Pennsylvania Limited Fund — Class C | | |
| | | |
| | | Year Ended March 31, | | |
| | | |
| | | 2012 | | 2011 | | 2010 | | 2009 | | 2008 | | |
| |
| Net asset value — Beginning of year | | $ | 9.300 | | | $ | 9.540 | | | $ | 9.210 | | | $ | 9.510 | | | $ | 9.820 | | | |
| |
| |
| | | | | | | | | | | | | | | | | | | | | | | |
| | | | | | | | | | | | | | | | | | | | | | | |
| |
| Income (Loss) From Operations |
| |
Net investment income(1) | | $ | 0.249 | | | $ | 0.280 | | | $ | 0.282 | | | $ | 0.303 | | | $ | 0.301 | | | |
| Net realized and unrealized gain (loss) | | | 0.344 | | | | (0.241 | ) | | | 0.337 | | | | (0.304 | ) | | | (0.308 | ) | | |
| |
| |
Total income (loss) from operations | | $ | 0.593 | | | $ | 0.039 | | | $ | 0.619 | | | $ | (0.001 | ) | | $ | (0.007 | ) | | |
| |
| |
| | | | | | | | | | | | | | | | | | | | | | | |
| | | | | | | | | | | | | | | | | | | | | | | |
| |
| Less Distributions |
| |
| From net investment income | | $ | (0.249 | ) | | $ | (0.279 | ) | | $ | (0.289 | ) | | $ | (0.299 | ) | | $ | (0.303 | ) | | |
| Tax return of capital | | | (0.004 | ) | | | — | | | | — | | | | — | | | | — | | | |
| |
| |
Total distributions | | $ | (0.253 | ) | | $ | (0.279 | ) | | $ | (0.289 | ) | | $ | (0.299 | ) | | $ | (0.303 | ) | | |
| |
| |
| | | | | | | | | | | | | | | | | | | | | | | |
Net asset value — End of year | | $ | 9.640 | | | $ | 9.300 | | | $ | 9.540 | | | $ | 9.210 | | | $ | 9.510 | | | |
| |
| |
| | | | | | | | | | | | | | | | | | | | | | | |
Total Return(2) | | | 6.36 | % | | | 0.38 | % | | | 6.78 | % | | | (0.01 | )% | | | (0.08 | )% | | |
| |
| |
| | | | | | | | | | | | | | | | | | | | | | | |
| | | | | | | | | | | | | | | | | | | | | | | |
| |
| Ratios/Supplemental Data |
| |
| Net assets, end of year (000’s omitted) | | $ | 18,710 | | | $ | 17,374 | | | $ | 18,014 | | | $ | 13,884 | | | $ | 13,427 | | | |
| Ratios (as a percentage of average daily net assets): | | | | | | | | | | | | | | | | | | | | | | |
| Expenses before custodian fee reduction | | | 1.58 | % | | | 1.57 | % | | | 1.59 | % | | | 1.62 | % | | | 1.63 | % | | |
| Expenses after custodian fee reduction | | | 1.58 | % | | | 1.57 | % | | | 1.59 | % | | | 1.61 | % | | | 1.60 | % | | |
| Net investment income | | | 2.61 | % | | | 2.95 | % | | | 2.96 | % | | | 3.25 | % | | | 3.10 | % | | |
| Portfolio Turnover | | | 15 | % | | | 9 | % | | | 6 | % | | | 19 | % | | | 12 | % | | |
| |
| |
| | |
| (1) | | Computed using average shares outstanding. |
| (2) | | Returns are historical and are calculated by determining the percentage change in net asset value with all distributions reinvested and do not reflect the effect of sales charges. |
See Notes to Financial Statements.
36
Eaton Vance
Limited Maturity Municipal Income Funds
March 31, 2012
Financial Highlights — continued
| | | | | | | | | | | |
| | | Pennsylvania Limited Fund — Class I | | |
| | | |
| | | Year Ended
| | Period Ended
| | |
| | | March 31, 2012 | | March 31, 2011(1) | | |
| |
| Net asset value — Beginning of period | | $ | 9.800 | | | $ | 10.160 | | | |
| |
| |
| | | | | | | | | | | |
| | | | | | | | | | | |
| |
| Income (Loss) From Operations |
| |
| Net investment income | | $ | 0.357 | | | $ | 0.249 | | | |
| Net realized and unrealized gain (loss) | | | 0.359 | | | | (0.360 | ) | | |
| |
| |
Total income (loss) from operations | | $ | 0.716 | | | $ | (0.111 | ) | | |
| |
| |
| | | | | | | | | | | |
| | | | | | | | | | | |
| |
| Less Distributions |
| |
| From net investment income | | $ | (0.351 | ) | | $ | (0.249 | ) | | |
| Tax return of capital | | | (0.005 | ) | | | — | | | |
| |
| |
Total distributions | | $ | (0.356 | ) | | $ | (0.249 | ) | | |
| |
| |
| | | | | | | | | | | |
Net asset value — End of period | | $ | 10.160 | | | $ | 9.800 | | | |
| |
| |
| | | | | | | | | | | |
Total Return(2) | | | 7.32 | % | | | (1.27 | )%(3) | | |
| |
| |
| | | | | | | | | | | |
| | | | | | | | | | | |
| |
| Ratios/Supplemental Data |
| |
| Net assets, end of period (000’s omitted) | | $ | 1,137 | | | $ | 1 | | | |
| Ratios (as a percentage of average daily net assets): | | | | | | | | | | |
Expenses(4) | | | 0.68 | % | | | 0.67 | %(5) | | |
| Net investment income | | | 3.45 | % | | | 3.81 | %(5) | | |
| Portfolio Turnover | | | 15 | % | | | 9 | %(6) | | |
| |
| |
| | |
| (1) | | For the period from the commencement of operations on August 3, 2010 to March 31, 2011. |
| (2) | | Returns are historical and are calculated by determining the percentage change in net asset value with all distributions reinvested. |
| (3) | | Not annualized. |
| (4) | | Excludes the effect of custody fee credits, if any, of less than 0.005%. |
| (5) | | Annualized. |
| (6) | | For the Fund’s year ended March 31, 2011. |
See Notes to Financial Statements.
37
Eaton Vance
Limited Maturity Municipal Income Funds
March 31, 2012
Notes to Financial Statements
1 Significant Accounting Policies
Eaton Vance Investment Trust (the Trust) is a Massachusetts business trust registered under the Investment Company Act of 1940, as amended (the 1940 Act), as an open-end management investment company. The Trust presently consists of five funds, three of which, each non-diversified, are included in these financial statements. They include Eaton Vance Massachusetts Limited Maturity Municipal Income Fund (Massachusetts Limited Fund), Eaton Vance New York Limited Maturity Municipal Income Fund (New York Limited Fund) and Eaton Vance Pennsylvania Limited Maturity Municipal Income Fund (Pennsylvania Limited Fund), (each individually referred to as the Fund, and collectively, the Funds). The Funds’ current investment objective is to provide a high level of current income exempt from regular federal income tax and from particular state or local income or other taxes, as applicable and to provide limited principal fluctuation. The Funds offer four classes of shares. Class A shares are generally sold subject to a sales charge imposed at time of purchase. Class B and Class C shares are sold at net asset value and are generally subject to a contingent deferred sales charge (see Note 5). Class I shares are sold at net asset value and are not subject to a sales charge. Class B shares of each Fund held for the longer of (i) four years or (ii) the time at which the contingent deferred sales charge applicable to such shares expires will automatically convert to Class A shares as described in each Fund’s prospectus. Beginning January 1, 2012, Class B shares are only available for purchase upon exchange from another Eaton Vance fund or through reinvestments of distributions. Each class represents a pro-rata interest in the Fund, but votes separately on class-specific matters and (as noted below) is subject to different expenses. Realized and unrealized gains and losses are allocated daily to each class of shares based on the relative net assets of each class to the total net assets of the Fund. Net investment income, other than class-specific expenses, is allocated daily to each class of shares based upon the ratio of the value of each class’s paid shares to the total value of all paid shares. Each class of shares differs in its distribution plan and certain other class-specific expenses.
The following is a summary of significant accounting policies of the Funds. The policies are in conformity with accounting principles generally accepted in the United States of America.
A Investment Valuation — Debt obligations (including short-term obligations with a remaining maturity of more than sixty days) are generally valued on the basis of valuations provided by third party pricing services, as derived from such services’ pricing models. Inputs to the models may include, but are not limited to, reported trades, executable bid and asked prices, broker/dealer quotations, prices or yields of securities with similar characteristics, benchmark curves or information pertaining to the issuer, as well as industry and economic events. The pricing services may use a matrix approach, which considers information regarding securities with similar characteristics to determine the valuation for a security. Short-term obligations purchased with a remaining maturity of sixty days or less are generally valued at amortized cost, which approximates market value. Financial futures contracts are valued at the closing settlement price established by the board of trade or exchange on which they are traded. Investments for which valuations or market quotations are not readily available or are deemed unreliable are valued at fair value using methods determined in good faith by or at the direction of the Trustees of a Fund in a manner that fairly reflects the security’s value, or the amount that the Fund might reasonably expect to receive for the security upon its current sale in the ordinary course. Each such determination is based on a consideration of relevant factors, which are likely to vary from one pricing context to another. These factors may include, but are not limited to, the type of security, the existence of any contractual restrictions on the security’s disposition, the price and extent of public trading in similar securities of the issuer or of comparable entities, quotations or relevant information obtained from broker/dealers or other market participants, information obtained from the issuer, analysts, and/or the appropriate stock exchange (for exchange-traded securities), an analysis of the entity’s financial condition, and an evaluation of the forces that influence the issuer and the market(s) in which the security is purchased and sold.
B Investment Transactions and Related Income — Investment transactions for financial statement purposes are accounted for on a trade date basis. Realized gains and losses on investments sold are determined on the basis of identified cost. Interest income is recorded on the basis of interest accrued, adjusted for amortization of premium or accretion of discount.
C Federal Taxes — Each Fund’s policy is to comply with the provisions of the Internal Revenue Code applicable to regulated investment companies and to distribute to shareholders each year substantially all of its taxable, if any, and tax-exempt net investment income, and all or substantially all of its net realized capital gains. Accordingly, no provision for federal income or excise tax is necessary. Each Fund intends to satisfy conditions which will enable it to designate distributions from the interest income generated by its investments in municipal obligations, which are exempt from regular federal income tax when received by each Fund, as exempt-interest dividends. The portion of such interest, if any, earned on private activity bonds issued after August 7, 1986, may be considered a tax preference item to shareholders.
At March 31, 2012, the following Funds, for federal income tax purposes, had capital loss carryforwards of $3,930,141, $6,341,280 and $2,733,803 and current year deferred capital losses of $639,872, $1,694,220 and $891,592 for Massachusetts Limited Fund, New York Limited Fund and Pennsylvania Limited Fund, respectively, which will reduce the respective Fund’s taxable income arising from future net realized gains on investment transactions, if any, to the extent permitted by the Internal Revenue Code, and thus will reduce the amount of distributions to shareholders, which would otherwise be necessary to relieve the Funds of any liability for federal income or excise tax. The current year deferred capital losses are treated as arising
38
Eaton Vance
Limited Maturity Municipal Income Funds
March 31, 2012
Notes to Financial Statements — continued
on the first day of the Funds’ next taxable year and are treated as realized prior to the utilization of the capital loss carryforwards. The amounts and expiration dates of the capital loss carryforwards are as follows:
| | | | | | | | | | | | | | | |
| | | Massachusetts
| | New York
| | Pennsylvania
| | |
| Expiration Date | | Limited Fund | | Limited Fund | | Limited Fund | | |
| |
| |
| March 31, 2013 | | $ | 1,336,686 | | | $ | 1,522,094 | | | $ | 954,523 | | | |
| March 31, 2014 | | | 25,938 | | | | — | | | | — | | | |
| March 31, 2015 | | | — | | | | 97,867 | | | | 29,139 | | | |
| March 31, 2016 | | | 103,860 | | | | 394,181 | | | | 107,086 | | | |
| March 31, 2017 | | | 1,158,951 | | | | 718,716 | | | | 310,885 | | | |
| March 31, 2018 | | | 869,381 | | | | 2,585,819 | | | | 975,763 | | | |
| March 31, 2019 | | | 435,325 | | | | 1,022,603 | | | | 356,407 | | | |
| | | | | | | | | | | | | | | |
| |
| |
| | | $ | 3,930,141 | | | $ | 6,341,280 | | | $ | 2,733,803 | | | |
| | | | | | | | | | | | | | | |
| |
| |
As of March 31, 2012, the Funds had no uncertain tax positions that would require financial statement recognition, de-recognition, or disclosure. Each Fund files a U.S. federal income tax return annually after its fiscal year-end, which is subject to examination by the Internal Revenue Service for a period of three years from the date of filing.
D Expenses — The majority of expenses of the Trust are directly identifiable to an individual fund. Expenses which are not readily identifiable to a specific fund are allocated taking into consideration, among other things, the nature and type of expense and the relative size of the funds.
E Expense Reduction — State Street Bank and Trust Company (SSBT) serves as custodian of the Funds. Pursuant to the respective custodian agreements, SSBT receives a fee reduced by credits, which are determined based on the average daily cash balance each Fund maintains with SSBT. All credit balances, if any, used to reduce each Fund’s custodian fees are reported as a reduction of expenses in the Statements of Operations.
F Legal Fees — Legal fees and other related expenses incurred as part of negotiations of the terms and requirement of capital infusions, or that are expected to result in the restructuring of, or a plan of reorganization for, an investment are recorded as realized losses. Ongoing expenditures to protect or enhance an investment are treated as operating expenses.
G Use of Estimates — The preparation of the financial statements in conformity with accounting principles generally accepted in the United States of America requires management to make estimates and assumptions that affect the reported amounts of assets and liabilities at the date of the financial statements and the reported amounts of income and expense during the reporting period. Actual results could differ from those estimates.
H Indemnifications — Under the Trust’s organizational documents, its officers and Trustees may be indemnified against certain liabilities and expenses arising out of the performance of their duties to the Funds. Under Massachusetts law, if certain conditions prevail, shareholders of a Massachusetts business trust (such as the Trust) could be deemed to have personal liability for the obligations of the Trust. However, the Trust’s Declaration of Trust contains an express disclaimer of liability on the part of Fund shareholders and the By-laws provide that the Trust shall assume the defense on behalf of any Fund shareholders. Moreover, the By-laws also provide for indemnification out of Fund property of any shareholder held personally liable solely by reason of being or having been a shareholder for all loss or expense arising from such liability. Additionally, in the normal course of business, each Fund enters into agreements with service providers that may contain indemnification clauses. Each Fund’s maximum exposure under these arrangements is unknown as this would involve future claims that may be made against each Fund that have not yet occurred.
I Financial Futures Contracts — Upon entering into a financial futures contract, a Fund is required to deposit with the broker, either in cash or securities, an amount equal to a certain percentage of the purchase price (initial margin). Subsequent payments, known as variation margin, are made or received by the Fund each business day, depending on the daily fluctuations in the value of the underlying security, and are recorded as unrealized gains or losses by the Fund. Gains (losses) are realized upon the expiration or closing of the financial futures contracts. Should market conditions change unexpectedly, the Fund may not achieve the anticipated benefits of the financial futures contracts and may realize a loss. Futures contracts have minimal counterparty risk as they are exchange traded and the clearinghouse for the exchange is substituted as the counterparty, guaranteeing counterparty performance.
J When-Issued Securities and Delayed Delivery Transactions — The Funds may purchase or sell securities on a delayed delivery or when-issued basis. Payment and delivery may take place after the customary settlement period for that security. At the time the transaction is negotiated, the price of the security that will be delivered is fixed. The Funds maintain security positions for these commitments such that sufficient liquid assets will be available to make payments upon settlement. Securities purchased on a delayed delivery or when-issued basis are marked-to-market daily and begin earning interest on settlement date. Losses may arise due to changes in the market value of the underlying securities or if the counterparty does not perform under the contract.
39
Eaton Vance
Limited Maturity Municipal Income Funds
March 31, 2012
Notes to Financial Statements — continued
2 Distributions to Shareholders
The net investment income of each Fund is determined daily and substantially all of the net investment income so determined is declared as a dividend to shareholders of record at the time of declaration. Distributions are declared separately for each class of shares. Distributions are paid monthly. Distributions of realized capital gains (reduced by available capital loss carryforwards, if any) are made at least annually. Shareholders may reinvest income and capital gain distributions in additional shares of the same class of a Fund at the net asset value as of the reinvestment date or, at the election of the shareholder, receive distributions in cash. The Funds distinguish between distributions on a tax basis and a financial reporting basis. Accounting principles generally accepted in the United States of America require that only distributions in excess of tax basis earnings and profits be reported in the financial statements as a return of capital. Permanent differences between book and tax accounting relating to distributions are reclassified to paid-in capital. For tax purposes, distributions from short-term capital gains are considered to be from ordinary income.
The tax character of distributions declared for the year ended March 31, 2012 and March 31, 2011 was as follows:
| | | | | | | | | | | | | | | |
| | | Year Ended March 31, 2012
| | |
| | | |
| | | Massachusetts
| | New York
| | Pennsylvania
| | |
| | | Limited Fund | | Limited Fund | | Limited Fund | | |
| |
| |
Distributions declared from: | | | | | | | | | | | | | | |
| Tax-exempt income | | $ | 1,782,396 | | | $ | 2,789,532 | | | $ | 1,812,801 | | | |
| Ordinary income | | $ | 56 | | | $ | — | | | $ | 1,325 | | | |
| Tax return of capital | | $ | — | | | $ | — | | | $ | 25,688 | | | |
| | | | | | | | | | | | | | | |
| |
| |
| | | | | | | | | | | | | | | |
| | | Year Ended March 31, 2011
|
| | | |
| | | Massachusetts
| | New York
| | Pennsylvania
| | |
| | | Limited Fund | | Limited Fund | | Limited Fund | | |
| |
| |
Distributions declared from: | | | | | | | | | | | | | | |
| Tax-exempt income | | $ | 2,074,067 | | | $ | 3,299,736 | | | $ | 2,240,541 | | | |
| Ordinary income | | $ | 5,379 | | | $ | — | | | $ | 5,627 | | | |
| | | | | | | | | | | | | | | |
| |
| |
During the year ended March 31, 2012, the following amounts were reclassified due to expired capital loss carryforwards and differences between book and tax accounting, primarily for accretion of market discount and defaulted bond interest.
| | | | | | | | | | | | | | | |
| | | Massachusetts
| | New York
| | Pennsylvania
| | |
| | | Limited Fund | | Limited Fund | | Limited Fund | | |
| |
| |
| Increase (decrease): | | | | | | | | | | | | | | |
| Paid-in capital | | $ | (393,962 | ) | | $ | (483,774 | ) | | $ | (154,413 | ) | | |
| Accumulated net realized loss | | $ | (398,645 | ) | | $ | (473,909 | ) | | $ | (154,546 | ) | | |
| Accumulated distributions in excess of net investment income | | $ | 4,683 | | | $ | (9,865 | ) | | $ | 133 | | | |
| | | | | | | | | | | | | | | |
| |
| |
These reclassifications had no effect on the net assets or net asset value per share of the Funds.
40
Eaton Vance
Limited Maturity Municipal Income Funds
March 31, 2012
Notes to Financial Statements — continued
As of March 31, 2012, the components of distributable earnings (accumulated losses) and unrealized appreciation (depreciation) on a tax basis were as follows:
| | | | | | | | | | | | | | | |
| | | Massachusetts
| | New York
| | Pennsylvania
| | |
| | | Limited Fund | | Limited Fund | | Limited Fund | | |
| |
| |
| Undistributed tax-exempt income | | $ | 60,792 | | | $ | 48,426 | | | $ | — | | | |
| Capital loss carryforward and deferred capital losses | | $ | (4,570,013 | ) | | $ | (8,035,500 | ) | | $ | (3,625,395 | ) | | |
| Net unrealized appreciation | | $ | 5,489,168 | | | $ | 7,214,518 | | | $ | 3,809,301 | | | |
| Other temporary differences | | $ | (72,622 | ) | | $ | (113,753 | ) | | $ | (71,729 | ) | | |
| | | | | | | | | | | | | | | |
| |
| |
The differences between components of distributable earnings (accumulated losses) on a tax basis and the amounts reflected in the Statements of Assets and Liabilities are primarily due to futures contacts, defaulted bonds interest, accretion of market discount and the timing of recognizing distributions to shareholders.
3 Investment Adviser Fee and Other Transactions with Affiliates
The investment adviser fee is earned by Boston Management and Research (BMR), a subsidiary of Eaton Vance Management (EVM), as compensation for management and investment advisory services rendered to each Fund. The fee is based upon a percentage of average daily net assets plus a percentage of gross income (i.e., income other than gains from the sale of securities) and is payable monthly. The annual asset rate and daily income rate are 0.30% and 3.00%, respectively, on average daily net assets of up to $500 million and at reduced rates on daily net assets of $500 million or more.
For the year ended March 31, 2012, investment adviser fees incurred by the Funds and the effective annual rates, as a percentage of average daily net assets, were as follows:
| | | | | | | | | | | | | | | |
| | | Massachusetts
| | New York
| | Pennsylvania
| | |
| | | Limited Fund | | Limited Fund | | Limited Fund | | |
| |
| |
| Investment Adviser Fee | | $ | 243,943 | | | $ | 375,101 | | | $ | 248,841 | | | |
| Effective Annual Rate | | | 0.42 | % | | | 0.42 | % | | | 0.43 | % | | |
| | | | | | | | | | | | | | | |
| |
| |
EVM serves as administrator of each Fund, but receives no compensation. EVM serves as the sub-transfer agent of each Fund and receives from the transfer agent an aggregate fee based upon the actual expenses incurred by EVM in the performance of these services. Eaton Vance Distributors, Inc. (EVD), an affiliate of EVM and the Funds’ principal underwriter, received a portion of the sales charge on sales of Class A shares of the Funds. EVD also received distribution and service fees from Class A, Class B and Class C shares (see Note 4) and contingent deferred sales charges (see Note 5). Sub-transfer agent fees earned by EVM and Class A sales charges that the Funds were informed were received by EVD for the year ended March 31, 2012 were as follows:
| | | | | | | | | | | | | | | |
| | | Massachusetts
| | New York
| | Pennsylvania
| | |
| | | Limited Fund | | Limited Fund | | Limited Fund | | |
| |
| |
EVM’s Sub-Transfer Agent Fees | | $ | 1,392 | | | $ | 2,102 | | | $ | 1,946 | | | |
| EVD’s Class A Sales Charges | | $ | 3,355 | | | $ | 5,318 | | | $ | 3,674 | | | |
| | | | | | | | | | | | | | | |
| |
| |
Except for Trustees of the Funds who are not members of EVM’s or BMR’s organizations, officers and Trustees receive remuneration for their services to the Funds out of the investment adviser fee. Trustees of the Funds who are not affiliated with the investment adviser may elect to defer receipt of all or a percentage of their annual fees in accordance with the terms of the Trustees Deferred Compensation Plan. For the year ended March 31, 2012, no significant amounts have been deferred. Certain officers and Trustees of the Funds are officers of the above organizations.
4 Distribution Plans
Each Fund has in effect a distribution plan for Class A shares (Class A Plan) pursuant to Rule 12b-1 under the 1940 Act. The Class A Plan provides that each Fund will pay EVD a distribution and service fee not exceeding 0.25% per annum of its average daily net assets attributable to Class A shares for
41
Eaton Vance
Limited Maturity Municipal Income Funds
March 31, 2012
Notes to Financial Statements — continued
distribution services and facilities provided to each Fund by EVD, as well as for personal services and/or the maintenance of shareholder accounts. The Trustees approved distribution and service fee payments equal to 0.15% per annum of each Fund’s average daily net assets attributable to Class A shares. Distribution and service fees paid or accrued to EVD for the year ended March 31, 2012 for Class A shares amounted to the following:
| | | | | | | | | | | | | | | |
| | | Massachusetts
| | New York
| | Pennsylvania
| | |
| | | Limited Fund | | Limited Fund | | Limited Fund | | |
| |
| |
| Class A Distribution and Service Fees | | $ | 65,693 | | | $ | 90,104 | | | $ | 58,185 | | | |
| | | | | | | | | | | | | | | |
| |
| |
Each Fund also has in effect distribution plans for Class B shares (Class B Plan) and Class C shares (Class C Plan) pursuant to Rule 12b-1 under the 1940 Act. Pursuant to the Class B and Class C Plans, each Fund pays EVD amounts equal to 0.75% per annum of its average daily net assets attributable to Class B and Class C shares for providing ongoing distribution services and facilities to the respective Funds. Each Fund will automatically discontinue payments to EVD during any period in which there are no outstanding Uncovered Distribution Charges, which are equivalent to the sum of (i) 3% and 6.25% of the aggregate amount received by each Fund for Class B and Class C shares sold, respectively, plus (ii) interest calculated by applying the rate of 1% over the prevailing prime rate to the outstanding balance of Uncovered Distribution Charges of EVD of each respective class, reduced by the aggregate amount of contingent deferred sales charges (see Note 5) and amounts theretofore paid or payable to EVD by each respective class. For the year ended March 31, 2012, the Funds paid or accrued to EVD the following distribution fees, representing 0.75% of the average daily net assets of each Fund’s Class B and Class C shares:
| | | | | | | | | | | | | | | |
| | | Massachusetts
| | New York
| | Pennsylvania
| | |
| | | Limited Fund | | Limited Fund | | Limited Fund | | |
| |
| |
| Class B Distribution Fees | | $ | 1,702 | | | $ | 10,146 | | | $ | 3,163 | | | |
| Class C Distribution Fees | | $ | 97,478 | | | $ | 186,824 | | | $ | 136,144 | | | |
| | | | | | | | | | | | | | | |
| |
| |
At March 31, 2012, the amounts of Uncovered Distribution Charges of EVD calculated under the Class B and Class C Plans were approximately as follows:
| | | | | | | | | | | | | | | |
| | | Massachusetts
| | New York
| | Pennsylvania
| | |
| | | Limited Fund | | Limited Fund | | Limited Fund | | |
| |
| |
| Class B | | $ | 640,000 | | | $ | 956,000 | | | $ | 428,000 | | | |
| Class C | | $ | 5,643,000 | | | $ | 7,388,000 | | | $ | 7,189,000 | | | |
| | | | | | | | | | | | | | | |
| |
| |
The Class B and Class C Plans also authorize the Funds to make payments of service fees to EVD, financial intermediaries and other persons in amounts not exceeding 0.25% per annum of the average daily net assets attributable to that class. The Trustees approved service fee payments equal to 0.15% per annum of each Fund’s average daily net assets attributable to Class B and Class C shares. Service fees paid or accrued are for personal services and/or the maintenance of shareholder accounts. They are separate and distinct from the Class B and Class C sales commissions and distribution fees and, as such, are not subject to automatic discontinuance when there are no outstanding Uncovered Distribution Charges of EVD. Service fees paid or accrued for the year ended March 31, 2012 amounted to the following:
| | | | | | | | | | | | | | | |
| | | Massachusetts
| | New York
| | Pennsylvania
| | |
| | | Limited Fund | | Limited Fund | | Limited Fund | | |
| |
| |
| Class B Service Fees | | $ | 340 | | | $ | 2,029 | | | $ | 633 | | | |
| Class C Service Fees | | $ | 19,496 | | | $ | 37,365 | | | $ | 27,229 | | | |
| | | | | | | | | | | | | | | |
| |
| |
5 Contingent Deferred Sales Charges
A contingent deferred sales charge (CDSC) generally is imposed on redemptions of Class B shares made within four years of purchase and on redemptions of Class C shares made within one year of purchase. Class A shares may be subject to a 1% CDSC if redeemed within eighteen months of purchase (depending on the circumstances of purchase). Generally, the CDSC is based upon the lower of the net asset value at date of redemption or date of purchase. No charge is levied on shares acquired by reinvestment of dividends or capital gain distributions. The CDSC for Class B shares is imposed at declining rates that begin at 3% in the case of redemptions in the first year after purchase, declining half a percentage point in the second and third year
42
Eaton Vance
Limited Maturity Municipal Income Funds
March 31, 2012
Notes to Financial Statements — continued
and one percentage point in the fourth year. Class C shares are subject to a 1% CDSC if redeemed within one year of purchase. No CDSC is levied on shares which have been sold to EVM or its affiliates or to their respective employees or clients and may be waived under certain other limited conditions. CDSCs received on Class B and Class C redemptions are paid to EVD to reduce the amount of Uncovered Distribution Charges calculated under each Fund’s Class B and Class C Plans. CDSCs received on Class B and Class C redemptions when no Uncovered Distribution Charges exist are credited to each Fund. For the year ended March 31, 2012, the Funds were informed that EVD received approximately the following amounts of CDSCs paid by Class A, Class B and Class C shareholders:
| | | | | | | | | | | | | | | |
| | | Massachusetts
| | New York
| | Pennsylvania
| | |
| | | Limited Fund | | Limited Fund | | Limited Fund | | |
| |
| |
| Class A | | $ | 4,400 | | | $ | 200 | | | $ | 1,100 | | | |
| Class B | | $ | 500 | | | $ | 2,500 | | | $ | 500 | | | |
| Class C | | $ | 500 | | | $ | 1,900 | | | $ | 700 | | | |
| | | | | | | | | | | | | | | |
| |
| |
6 Purchases and Sales of Investments
Purchases and sales of investments, other than short-term obligations, for the year ended March 31, 2012 were as follows:
| | | | | | | | | | | | | | | |
| | | Massachusetts
| | New York
| | Pennsylvania
| | |
| | | Limited Fund | | Limited Fund | | Limited Fund | | |
| |
| |
| Purchases | | $ | 11,338,813 | | | $ | 10,136,739 | | | $ | 8,457,680 | | | |
| Sales | | $ | 10,509,202 | | | $ | 12,498,372 | | | $ | 10,433,105 | | | |
| | | | | | | | | | | | | | | |
| |
| |
7 Shares of Beneficial Interest
Each Fund’s Declaration of Trust permits the Trustees to issue an unlimited number of full and fractional shares of beneficial interest (without par value). Such shares may be issued in a number of different series (such as the Funds) and classes. Transactions in Fund shares were as follows:
| | | | | | | | | | | |
Massachusetts Limited Fund |
| | | Year Ended March 31, | | |
| | | |
| Class A | | 2012 | | 2011 | | |
| |
| |
| Sales | | | 496,011 | | | | 727,236 | | | |
| Issued to shareholders electing to receive payments of distributions in Fund shares | | | 105,062 | | | | 112,740 | | | |
| Redemptions | | | (884,559 | ) | | | (1,615,323 | ) | | |
| Exchange from Class B shares | | | 7,445 | | | | 27,564 | | | |
| | | | | | | | | | | |
| |
| |
Net decrease | | | (276,041 | ) | | | (747,783 | ) | | |
| | | | | | | | | | | |
| |
| |
| | | | | | | | | | | |
| | | | | | | | | | | |
| | | Year Ended March 31, | | |
| | | |
| Class B | | 2012 | | 2011 | | |
| |
| |
| Sales | | | 12,362 | | | | 7,928 | | | |
| Issued to shareholders electing to receive payments of distributions in Fund shares | | | 564 | | | | 737 | | | |
| Redemptions | | | (2,884 | ) | | | (3,913 | ) | | |
| Exchange to Class A shares | | | (7,448 | ) | | | (27,580 | ) | | |
| | | | | | | | | | | |
| |
| |
Net increase (decrease) | | | 2,594 | | | | (22,828 | ) | | |
| | | | | | | | | | | |
| |
| |
| | | | | | | | | | | |
| | | | | | | | | | | |
43
Eaton Vance
Limited Maturity Municipal Income Funds
March 31, 2012
Notes to Financial Statements — continued
| | | | | | | | | | | |
| | | Year Ended March 31, | | |
| | | |
| Class C | | 2012 | | 2011 | | |
| |
| |
| Sales | | | 70,230 | | | | 216,540 | | | |
| Issued to shareholders electing to receive payments of distributions in Fund shares | | | 23,632 | | | | 26,720 | | | |
| Redemptions | | | (225,154 | ) | | | (362,331 | ) | | |
| | | | | | | | | | | |
| |
| |
Net decrease | | | (131,292 | ) | | | (119,071 | ) | | |
| | | | | | | | | | | |
| |
| |
| | | | | | | | | | | |
| | | | | | | | | | | |
| | | Year Ended
| | Period Ended
| | |
| Class I | | March 31, 2012 | | March 31, 2011(1) | | |
| |
| |
| Sales | | | 602,721 | | | | 3,137 | | | |
| Issued to shareholders electing to receive payments of distributions in Fund shares | | | 1,236 | | | | 5 | | | |
| Redemptions | | | (16,274 | ) | | | — | | | |
| | | | | | | | | | | |
| |
| |
Net increase | | | 587,683 | | | | 3,142 | | | |
| | | | | | | | | | | |
| |
| |
| | | | | | | | | | | |
| | | | | | | | | | | |
New York Limited Fund |
| | | Year Ended March 31, | | |
| | | |
| Class A | | 2012 | | 2011 | | |
| |
| |
| Sales | | | 680,115 | | | | 1,344,314 | | | |
| Issued to shareholders electing to receive payments of distributions in Fund shares | | | 167,286 | | | | 185,575 | | | |
| Redemptions | | | (1,482,954 | ) | | | (2,426,245 | ) | | |
| Exchange from Class B shares | | | 16,836 | | | | 26,436 | | | |
| | | | | | | | | | | |
| |
| |
Net decrease | | | (618,717 | ) | | | (869,920 | ) | | |
| | | | | | | | | | | |
| |
| |
| | | | | | | | | | | |
| | | | | | | | | | | |
| | | Year Ended March 31, | | |
| | | |
| Class B | | 2012 | | 2011 | | |
| |
| |
| Sales | | | 18,189 | | | | 16,607 | | | |
| Issued to shareholders electing to receive payments of distributions in Fund shares | | | 2,214 | | | | 2,542 | | | |
| Redemptions | | | (19,747 | ) | | | (20,963 | ) | | |
| Exchange to Class A shares | | | (16,853 | ) | | | (26,449 | ) | | |
| | | | | | | | | | | |
| |
| |
Net decrease | | | (16,197 | ) | | | (28,263 | ) | | |
| | | | | | | | | | | |
| |
| |
| | | | | | | | | | | |
| | | | | | | | | | | |
| | | Year Ended March 31, | | |
| | | |
| Class C | | 2012 | | 2011 | | |
| |
| |
| Sales | | | 450,512 | | | | 446,798 | | | |
| Issued to shareholders electing to receive payments of distributions in Fund shares | | | 48,964 | | | | 50,662 | | | |
| Redemptions | | | (561,436 | ) | | | (736,891 | ) | | |
| | | | | | | | | | | |
| |
| |
Net decrease | | | (61,960 | ) | | | (239,431 | ) | | |
| | | | | | | | | | | |
| |
| |
| | | | | | | | | | | |
| | | | | | | | | | | |
44
Eaton Vance
Limited Maturity Municipal Income Funds
March 31, 2012
Notes to Financial Statements — continued
| | | | | | | | | | | |
| | | Year Ended
| | Period Ended
| | |
| Class I | | March 31, 2012 | | March 31, 2011(1) | | |
| |
| |
| Sales | | | 468,256 | | | | 10,057 | | | |
| Issued to shareholders electing to receive payments of distributions in Fund shares | | | 6,239 | | | | 67 | | | |
| Redemptions | | | (65,237 | ) | | | — | | | |
| | | | | | | | | | | |
| |
| |
Net increase | | | 409,258 | | | | 10,124 | | | |
| | | | | | | | | | | |
| |
| |
| | | | | | | | | | | |
| | | | | | | | | | | |
Pennsylvania Limited Fund |
| | | Year Ended March 31, | | |
| | | |
| Class A | | 2012 | | 2011 | | |
| |
| |
| Sales | | | 461,429 | | | | 949,147 | | | |
| Issued to shareholders electing to receive payments of distributions in Fund shares | | | 101,145 | | | | 121,295 | | | |
| Redemptions | | | (970,477 | ) | | | (1,742,215 | ) | | |
| Exchange from Class B shares | | | 5,227 | | | | 3,938 | | | |
| | | | | | | | | | | |
| |
| |
Net decrease | | | (402,676 | ) | | | (667,835 | ) | | |
| | | | | | | | | | | |
| |
| |
| | | | | | | | | | | |
| | | | | | | | | | | |
| | | Year Ended March 31, | | |
| | | |
| Class B | | 2012 | | 2011 | | |
| |
| |
| Sales | | | 4,960 | | | | 14,233 | | | |
| Issued to shareholders electing to receive payments of distributions in Fund shares | | | 1,026 | | | | 1,088 | | | |
| Redemptions | | | (5,933 | ) | | | (8,925 | ) | | |
| Exchange to Class A shares | | | (5,226 | ) | | | (3,938 | ) | | |
| | | | | | | | | | | |
| |
| |
Net increase (decrease) | | | (5,173 | ) | | | 2,458 | | | |
| | | | | | | | | | | |
| |
| |
| | | | | | | | | | | |
| | | | | | | | | | | |
| | | Year Ended March 31, | | |
| | | |
| Class C | | 2012 | | 2011 | | |
| |
| |
| Sales | | | 291,267 | | | | 385,379 | | | |
| Issued to shareholders electing to receive payments of distributions in Fund shares | | | 31,134 | | | | 32,720 | | | |
| Redemptions | | | (248,219 | ) | | | (438,126 | ) | | |
| | | | | | | | | | | |
| |
| |
Net increase (decrease) | | | 74,182 | | | | (20,027 | ) | | |
| | | | | | | | | | | |
| |
| |
| | | | | | | | | | | |
| | | | | | | | | | | |
| | | Year Ended
| | Period Ended
| | |
| Class I | | March 31, 2012 | | March 31, 2011(1) | | |
| |
| |
| Sales | | | 148,484 | | | | 98 | | | |
| Issued to shareholders electing to receive payments of distributions in Fund shares | | | 3,074 | | | | — | | | |
| Redemptions | | | (39,649 | ) | | | — | | | |
| | | | | | | | | | | |
| |
| |
Net increase | | | 111,909 | | | | 98 | | | |
| | | | | | | | | | | |
| |
| |
| | |
| (1) | | Class I of Massachusetts Limited Fund, New York Limited Fund and Pennsylvania Limited Fund commenced operations on August 3, 2010. |
45
Eaton Vance
Limited Maturity Municipal Income Funds
March 31, 2012
Notes to Financial Statements — continued
8 Federal Income Tax Basis of Investments
The cost and unrealized appreciation (depreciation) of investments of each Fund at March 31, 2012, as determined on a federal income tax basis, were as follows:
| | | | | | | | | | | | | | | |
| | | Massachusetts
| | New York
| | Pennsylvania
| | |
| | | Limited Fund | | Limited Fund | | Limited Fund | | |
| |
| |
Aggregate cost | | $ | 54,727,116 | | | $ | 81,382,684 | | | $ | 54,204,612 | | | |
| | | | | | | | | | | | | | | |
| |
| |
| Gross unrealized appreciation | | | 5,613,210 | | | | 7,607,013 | | | | 4,126,340 | | | |
| Gross unrealized depreciation | | | (124,042 | ) | | | (392,495 | ) | | | (317,039 | ) | | |
| | | | | | | | | | | | | | | |
| |
| |
Net unrealized appreciation | | $ | 5,489,168 | | | $ | 7,214,518 | | | $ | 3,809,301 | | | |
| | | | | | | | | | | | | | | |
| |
| |
9 Line of Credit
The Funds participate with other portfolios and funds managed by EVM and its affiliates in a $600 million unsecured line of credit agreement with a group of banks. Borrowings are made by the Funds solely to facilitate the handling of unusual and/or unanticipated short-term cash requirements. Interest is charged to each Fund based on its borrowings at an amount above either the Eurodollar rate or Federal Funds rate. In addition, a fee computed at an annual rate of 0.08% on the daily unused portion of the line of credit is allocated among the participating portfolios and funds at the end of each quarter. Because the line of credit is not available exclusively to the Funds, a Fund may be unable to borrow some or all of its requested amounts at any particular time. The Funds did not have any significant borrowings or allocated fees during the year ended March 31, 2012.
10 Overdraft Advances
Pursuant to the respective custodian agreements, SSBT may, in its discretion, advance funds to the Funds to make properly authorized payments. When such payments result in an overdraft, the Funds are obligated to repay SSBT at the current rate of interest charged by SSBT for secured loans (currently, a rate above the Federal Funds rate). This obligation is payable on demand to SSBT. SSBT has a lien on a Fund’s assets to the extent of any overdraft. At March 31, 2012, New York Limited Fund had payments due to SSBT pursuant to the foregoing arrangement of $93,348.
11 Financial Instruments
The Funds may trade in financial instruments with off-balance sheet risk in the normal course of their investing activities. These financial instruments may include financial futures contracts and may involve, to a varying degree, elements of risk in excess of the amounts recognized for financial statement purposes. The notional or contractual amounts of these instruments represent the investment a Fund has in particular classes of financial instruments and do not necessarily represent the amounts potentially subject to risk. The measurement of the risks associated with these instruments is meaningful only when all related and offsetting transactions are considered.
46
Eaton Vance
Limited Maturity Municipal Income Funds
March 31, 2012
Notes to Financial Statements — continued
A summary of obligations under these financial instruments at March 31, 2012 is as follows:
| | | | | | | | | | | | | | | | | | | | | |
| Futures Contracts |
| | | | | | | | | | | | | Net
| | |
| | | Expiration
| | | | | | Aggregate
| | | | Unrealized
| | |
| Fund | | Month/Year | | Contracts | | Position | | Cost | | Value | | Appreciation | | |
| |
| |
| Massachusetts Limited | | 6/12 | | 13
U.S. 10-Year Treasury Note | | Short | | $ | (1,694,445 | ) | | $ | (1,683,297 | ) | | $ | 11,148 | | | |
| | | 6/12 | | 16
U.S. 30-Year Treasury Bond | | Short | | | (2,222,510 | ) | | | (2,204,000 | ) | | | 18,510 | | | |
| | | | | | | | | | | | | | | | | | | | | |
| |
| |
| New York Limited | | 6/12 | | 11
U.S. 10-Year Treasury Note | | Short | | $ | (1,433,761 | ) | | $ | (1,424,328 | ) | | $ | 9,433 | | | |
| | | 6/12 | | 26
U.S. 30-Year Treasury Bond | | Short | | | (3,634,977 | ) | | | (3,581,500 | ) | | | 53,477 | | | |
| | | | | | | | | | | | | | | | | | | | | |
| |
| |
| Pennsylvania Limited | | 6/12 | | 30
U.S. 10-Year Treasury Note | | Short | | $ | (3,910,258 | ) | | $ | (3,884,532 | ) | | $ | 25,726 | | | |
| | | 6/12 | | 30
U.S. 30-Year Treasury Bond | | Short | | | (4,224,556 | ) | | | (4,132,499 | ) | | | 92,057 | | | |
| | | | | | | | | | | | | | | | | | | | | |
| |
| |
At March 31, 2012, the Funds had sufficient cash and/or securities to cover commitments under these contracts.
Each Fund is subject to interest rate risk in the normal course of pursuing its investment objectives. Because the Funds hold fixed-rate bonds, the value of these bonds may decrease if interest rates rise. The Funds purchase and sell U.S. Treasury futures contracts to hedge against changes in interest rates.
The fair values of open derivative instruments (not considered to be hedging instruments for accounting disclosure purposes) and whose primary underlying risk exposure is interest rate risk at March 31, 2012 were as follows:
| | | | | | | | | | | | | | | |
| | | Massachusetts
| | New York
| | Pennsylvania
| | |
| | | Limited Fund | | Limited Fund | | Limited Fund | | |
| |
| |
Asset Derivative: | | | | | | | | | | | | | | |
| Futures Contracts | | $ | 29,658 | (1) | | $ | 62,910 | (1) | | $ | 117,783 | (1) | | |
| | | | | | | | | | | | | | | |
| |
| |
Total | | $ | 29,658 | | | $ | 62,910 | | | $ | 117,783 | | | |
| | | | | | | | | | | | | | | |
| |
| |
| | |
| (1) | | Amount represents cumulative unrealized appreciation on futures contracts in the Futures Contracts table above. Only the current day’s variation margin on open futures contracts is reported within the Statement of Assets and Liabilities as Receivable or Payable for variation margin, as applicable. |
The effect of derivative instruments (not considered to be hedging instruments for accounting disclosure purposes) on the Statement of Operations and whose primary underlying risk exposure is interest rate risk for the year ended March 31, 2012 was as follows:
| | | | | | | | | | | | | | | |
| | | Massachusetts
| | New York
| | Pennsylvania
| | |
| | | Limited Fund | | Limited Fund | | Limited Fund | | |
| |
| |
| Realized Gain (Loss) on Derivatives Recognized in Income | | $ | (839,424 | )(1) | | $ | (1,714,394 | )(1) | | $ | (1,024,095 | )(1) | | |
| Change in Unrealized Appreciation (Depreciation) on Derivatives Recognized in Income | | $ | 25,246 | (2) | | $ | 54,590 | (2) | | $ | 146,013 | (2) | | |
| | | | | | | | | | | | | | | |
| |
| |
| | |
| (1) | | Statement of Operations location: Net realized gain (loss) – Financial futures contracts. |
| (2) | | Statement of Operations location: Change in unrealized appreciation (depreciation) – Financial futures contracts. |
47
Eaton Vance
Limited Maturity Municipal Income Funds
March 31, 2012
Notes to Financial Statements — continued
The average notional amounts of futures contracts outstanding during the year ended March 31, 2012, which are indicative of the volume of this derivative type, were approximately as follows:
| | | | | | | | | | | | | | | |
| | | Massachusetts
| | New York
| | Pennsylvania
| | |
| | | Limited Fund | | Limited Fund | | Limited Fund | | |
| |
| |
Average Notional Amount: | | | | | | | | | | | | | | |
| Futures Contracts | | $ | 3,469,000 | | | $ | 6,000,000 | | | $ | 5,308,000 | | | |
| | | | | | | | | | | | | | | |
| |
| |
12 Fair Value Measurements
Under generally accepted accounting principles for fair value measurements, a three-tier hierarchy to prioritize the assumptions, referred to as inputs, is used in valuation techniques to measure fair value. The three-tier hierarchy of inputs is summarized in the three broad levels listed below.
| |
| • | Level 1 – quoted prices in active markets for identical investments |
| |
| • | Level 2 – other significant observable inputs (including quoted prices for similar investments, interest rates, prepayment speeds, credit risk, etc.) |
| |
| • | Level 3 – significant unobservable inputs (including a fund’s own assumptions in determining the fair value of investments) |
In cases where the inputs used to measure fair value fall in different levels of the fair value hierarchy, the level disclosed is determined based on the lowest level input that is significant to the fair value measurement in its entirety. The inputs or methodology used for valuing securities are not necessarily an indication of the risk associated with investing in those securities.
At March 31, 2012, the hierarchy of inputs used in valuing the Funds’ investments and open derivative instruments, which are carried at value, were as follows:
| | | | | | | | | | | | | | | | | | | |
Massachusetts Limited Fund |
| Asset Description | | Level 1 | | Level 2 | | Level 3 | | Total | | |
| |
| |
| Tax-Exempt Investments | | $ | — | | | $ | 60,216,284 | | | $ | — | | | $ | 60,216,284 | | | |
| | | | | | | | | | | | | | | | | | | |
| |
| |
Total Investments | | $ | — | | | $ | 60,216,284 | | | $ | — | | | $ | 60,216,284 | | | |
| | | | | | | | | | | | | | | | | | | |
| |
| |
| Futures Contracts | | $ | 29,658 | | | $ | — | | | $ | — | | | $ | 29,658 | | | |
| | | | | | | | | | | | | | | | | | | |
| |
| |
Total | | $ | 29,658 | | | $ | 60,216,284 | | | $ | — | | | $ | 60,245,942 | | | |
| | | | | | | | | | | | | | | | | | | |
| |
| |
| | | | | | | | | | | | | | | | | | | |
| | | | | | | | | | | | | | | | | | | |
New York Limited Fund |
| Asset Description | | Level 1 | | Level 2 | | Level 3 | | Total | | |
| |
| |
| Tax-Exempt Investments | | $ | — | | | $ | 88,597,202 | | | $ | — | | | $ | 88,597,202 | | | |
| | | | | | | | | | | | | | | | | | | |
| |
| |
Total Investments | | $ | — | | | $ | 88,597,202 | | | $ | — | | | $ | 88,597,202 | | | |
| | | | | | | | | | | | | | | | | | | |
| |
| |
| Futures Contracts | | $ | 62,910 | | | $ | — | | | $ | — | | | $ | 62,910 | | | |
| | | | | | | | | | | | | | | | | | | |
| |
| |
Total | | $ | 62,910 | | | $ | 88,597,202 | | | $ | — | | | $ | 88,660,112 | | | |
| | | | | | | | | | | | | | | | | | | |
| |
| |
| | | | | | | | | | | | | | | | | | | |
| | | | | | | | | | | | | | | | | | | |
Pennsylvania Limited Fund |
| Asset Description | | Level 1 | | Level 2 | | Level 3 | | Total | | |
| |
| |
| Tax-Exempt Investments | | $ | — | | | $ | 58,013,913 | | | $ | — | | | $ | 58,013,913 | | | |
| | | | | | | | | | | | | | | | | | | |
| |
| |
Total Investments | | $ | — | | | $ | 58,013,913 | | | $ | — | | | $ | 58,013,913 | | | |
| | | | | | | | | | | | | | | | | | | |
| |
| |
| Futures Contracts | | $ | 117,783 | | | $ | — | | | $ | — | | | $ | 117,783 | | | |
| | | | | | | | | | | | | | | | | | | |
| |
| |
Total | | $ | 117,783 | | | $ | 58,013,913 | | | $ | — | | | $ | 58,131,696 | | | |
| | | | | | | | | | | | | | | | | | | |
| |
| |
The Funds held no investments or other financial instruments as of March 31, 2011 whose fair value was determined using Level 3 inputs. At March 31, 2012, the value of investments transferred between Level 1 and Level 2, if any, during the year then ended was not significant.
48
Eaton Vance
Limited Maturity Municipal Income Funds
March 31, 2012
Report of Independent Registered Public Accounting Firm
To the Trustees of Eaton Vance Investment Trust and Shareholders of Eaton Vance Massachusetts Limited Maturity Municipal Income Fund, Eaton Vance New York Limited Maturity Municipal Income Fund and Eaton Vance Pennsylvania Limited Maturity Municipal Income Fund:
We have audited the accompanying statements of assets and liabilities of Eaton Vance Massachusetts Limited Maturity Municipal Income Fund, Eaton Vance New York Limited Maturity Municipal Income Fund and Eaton Vance Pennsylvania Limited Maturity Municipal Income Fund (collectively, the “Funds”) (certain of the funds constituting Eaton Vance Investment Trust), including the portfolios of investments, as of March 31, 2012, and the related statements of operations for the year then ended, the statements of changes in net assets for each of the two years in the period then ended, and the financial highlights for each of the five years in the period then ended. These financial statements and financial highlights are the responsibility of the Funds’ management. Our responsibility is to express an opinion on these financial statements and financial highlights based on our audits.
We conducted our audits in accordance with the standards of the Public Company Accounting Oversight Board (United States). Those standards require that we plan and perform the audits to obtain reasonable assurance about whether the financial statements and financial highlights are free of material misstatement. The Funds are not required to have, nor were we engaged to perform, an audit of their internal control over financial reporting. Our audits included consideration of internal control over financial reporting as a basis for designing audit procedures that are appropriate in the circumstances, but not for the purpose of expressing an opinion on the effectiveness of the Funds’ internal control over financial reporting. Accordingly, we express no such opinion. An audit also includes examining, on a test basis, evidence supporting the amounts and disclosures in the financial statements, assessing the accounting principles used and significant estimates made by management, as well as evaluating the overall financial statement presentation. Our procedures included confirmation of securities owned as of March 31, 2012, by correspondence with the custodian and brokers; where replies were not received from brokers, we performed other auditing procedures. We believe that our audits provide a reasonable basis for our opinion.
In our opinion, the financial statements and financial highlights referred to above present fairly, in all material respects, the financial positions of Eaton Vance Massachusetts Limited Maturity Municipal Income Fund, Eaton Vance New York Limited Maturity Municipal Income Fund and Eaton Vance Pennsylvania Limited Maturity Municipal Income Fund as of March 31, 2012, the results of their operations for the year then ended, the changes in their net assets for each of the two years in the period then ended, and the financial highlights for each of the five years in the period then ended, in conformity with accounting principles generally accepted in the United States of America.
DELOITTE & TOUCHE LLP
Boston, Massachusetts
May 17, 2012
49
Eaton Vance
Limited Maturity Municipal Income Funds
March 31, 2012
Federal Tax Information (Unaudited)
The Form 1099-DIV you receive in January 2013 will show the tax status of all distributions paid to your account in calendar year 2012. Shareholders are advised to consult their own tax adviser with respect to the tax consequences of their investment in the Funds. As required by the Internal Revenue Code and/or regulations, shareholders must be notified regarding exempt-interest dividends.
Exempt-Interest Dividends. The Funds designate the following percentages of dividends from net investment income as exempt-interest dividends:
| | | | | |
| Massachusetts Limited Maturity Municipal Income Fund | | | 99.99% | |
| New York Limited Maturity Municipal Income Fund | | | 100.00% | |
| Pennsylvania Limited Maturity Municipal Income Fund | | | 99.93% | |
50
Eaton Vance
Limited Maturity Municipal Income Funds
March 31, 2012
Management and Organization
Fund Management. The Trustees of Eaton Vance Investment Trust (the Trust) are responsible for the overall management and supervision of the Trust’s affairs. The Trustees and officers of the Trust are listed below. Except as indicated, each individual has held the office shown or other offices in the same company for the last five years. Trustees and officers of the Trust hold indefinite terms of office. The “Noninterested Trustees” consist of those Trustees who are not “interested persons” of the Trust, as that term is defined under the 1940 Act. The business address of each Trustee and officer is Two International Place, Boston, Massachusetts 02110. As used below, “EVC” refers to Eaton Vance Corp., “EV” refers to Eaton Vance, Inc., “EVM” refers to Eaton Vance Management, “BMR” refers to Boston Management and Research and “EVD” refers to Eaton Vance Distributors, Inc. EVC and EV are the corporate parent and trustee, respectively, of EVM and BMR. EVD is the Funds’ principal underwriter and a wholly-owned subsidiary of EVC. Each officer affiliated with Eaton Vance may hold a position with other Eaton Vance affiliates that is comparable to his or her position with EVM listed below. Each Trustee oversees 180 portfolios in the Eaton Vance Complex (including all master and feeder funds in a master feeder structure). Each officer serves as an officer of certain other Eaton Vance funds. Each Trustee and officer serves until his or her successor is elected.
| | | | | | | |
| | | Position(s)
| | | | |
| | | with the
| | Length of
| | Principal Occupation(s) and Directorships
|
| Name and Year of Birth | | Trust | | Service | | During Past Five Years and Other Relevant Experience |
| |
| |
| |
| Interested Trustee |
| | | | | | | |
Thomas E. Faust Jr.
1958 | | Trustee | | Since 2007 | | Chairman, Chief Executive Officer and President of EVC, Director and President of EV, Chief Executive Officer and President of EVM and BMR, and Director of EVD. Trustee and/or officer of 180 registered investment companies. Mr. Faust is an interested person because of his positions with EVM, BMR, EVD, EVC and EV, which are affiliates of the Trust.
Directorships in the Last Five Years.(1) Director of EVC. |
| |
| Noninterested Trustees |
| | | | | | | |
Scott E. Eston
1956 | | Trustee | | Since 2011 | | Private investor. Formerly held various positions at Grantham, Mayo, Van Otterloo and Co., L.L.C. (investment management firm) (1997-2009), including Chief Operating Officer (2002-2009), Chief Financial Officer (1997-2009) and Chairman of the Executive Committee (2002-2008); President and Principal Executive Officer, GMO Trust (open-end registered investment company) (2006-2009). Former Partner, Coopers and Lybrand L.L.P. (now PricewaterhouseCoopers) (public accounting firm) (1987-1997).
Directorships in the Last Five Years. None. |
| | | | | | | |
Benjamin C. Esty
1963 | | Trustee | | Since 2005 | | Roy and Elizabeth Simmons Professor of Business Administration and Finance Unit Head, Harvard University Graduate School of Business Administration.
Directorships in the Last Five Years.(1) None. |
| | | | | | | |
Allen R. Freedman
1940 | | Trustee | | Since 2007 | | Private Investor. Former Chairman (2002-2004) and a Director (1983-2004) of Systems & Computer Technology Corp. (provider of software to higher education). Formerly, a Director of Loring Ward International (fund distributor) (2005-2007). Former Chairman and a Director of Indus International, Inc. (provider of enterprise management software to the power generating industry) (2005-2007). Former Chief Executive Officer of Assurant, Inc. (insurance provider) (1979-2000).
Directorships in the Last Five Years.(1) Director of Stonemor Partners, L.P. (owner and operator of cemeteries). Formerly, Director of Assurant, Inc. (insurance provider) (1979-2011). |
| | | | | | | |
William H. Park
1947 | | Trustee | | Since 2003 | | Consultant and private investor. Formerly, Chief Financial Officer, Aveon Group L.P. (investment management firm) (2010-2011). Formerly, Vice Chairman, Commercial Industrial Finance Corp. (specialty finance company) (2006-2010). Formerly, President and Chief Executive Officer, Prizm Capital Management, LLC (investment management firm) (2002-2005). Formerly, Executive Vice President and Chief Financial Officer, United Asset Management Corporation (investment management firm) (1982-2001). Formerly, Senior Manager, Price Waterhouse (now PricewaterhouseCoopers) (an independent registered public accounting firm) (1972-1981).
Directorships in the Last Five Years.(1) None. |
| | | | | | | |
Ronald A. Pearlman
1940 | | Trustee | | Since 2003 | | Professor of Law, Georgetown University Law Center. Formerly, Deputy Assistant Secretary (Tax Policy) and Assistant Secretary (Tax Policy), U.S. Department of the Treasury (1983-1985). Formerly, Chief of Staff, Joint Committee on Taxation, U.S. Congress (1988-1990).
Directorships in the Last Five Years.(1) None. |
51
Eaton Vance
Limited Maturity Municipal Income Funds
March 31, 2012
Management and Organization — continued
| | | | | | | |
| | | Position(s)
| | | | |
| | | with the
| | Length of
| | Principal Occupation(s) and Directorships
|
| Name and Year of Birth | | Trust | | Service | | During Past Five Years and Other Relevant Experience |
| |
| |
| Noninterested Trustees (continued) |
| | | | | | | |
Helen Frame Peters
1948 | | Trustee | | Since 2008 | | Professor of Finance, Carroll School of Management, Boston College. Formerly, Dean, Carroll School of Management, Boston College (2000-2002). Formerly, Chief Investment Officer, Fixed Income, Scudder Kemper Investments (investment management firm) (1998-1999). Formerly, Chief Investment Officer, Equity and Fixed Income, Colonial Management Associates (investment management firm) (1991-1998).
Directorships in the Last Five Years.(1) Formerly, Director of BJ’s Wholesale Club, Inc. (wholesale club retailer) (2004-2011). Formerly, Trustee of SPDR Index Shares Funds and SPDR Series Trust (exchange traded funds) (2000-2009). Formerly, Director of Federal Home Loan Bank of Boston (a bank for banks) (2007-2009). |
| | | | | | | |
Lynn A. Stout
1957 | | Trustee | | Since 1998 | | Distinguished Professor of Corporate and Business Law, Jack C. Clarke Business Law Institute, Cornell University Law School. Formerly, the Paul Hastings Professor of Corporate and Securities Law (2006-2012) and Professor of Law (2001-2006), University of California at Los Angeles School of Law.
Directorships in the Last Five Years.(1) None. |
| | | | | | | |
Harriett Tee Taggart
1948 | | Trustee | | Since 2011 | | Managing Director, Taggart Associates (a professional practice firm). Formerly, Partner and Senior Vice President, Wellington Management Company, LLP (investment management firm) (1983-2006).
Directorships in the Last Five Years. Director of Albemarle Corporation (chemicals manufacturer) (since 2007) and The Hanover Group (specialty property and casualty insurance company) (since 2009). Formerly, Director of Lubrizol Corporation (specialty chemicals) (2007-2011). |
| | | | | | | |
Ralph F. Verni
1943 | | Chairman of
the Board
and Trustee | | Chairman of the Board since 2007 and Trustee since 2005 | | Consultant and private investor. Formerly, Chief Investment Officer (1982-1992), Chief Financial Officer (1988-1990) and Director (1982-1992), New England Life. Formerly, Chairperson, New England Mutual Funds (1982-1992). Formerly, President and Chief Executive Officer, State Street Management & Research (1992-2000). Formerly, Chairperson, State Street Research Mutual Funds (1992-2000). Formerly, Director, W.P. Carey, LLC (1998-2004) and First Pioneer Farm Credit Corp. (2002-2006).
Directorships in the Last Five Years.(1) None. |
| Principal Officers who are not Trustees |
| | | Position(s)
| | | | |
| | | with the
| | Length of
| | Principal Occupation(s)
|
| Name and Year of Birth | | Trust | | Service | | During Past Five Years |
| |
| |
| | | | | | | |
Cynthia J. Clemson
1963 | | President | | Since 2005 | | Vice President of EVM and BMR. |
| | | | | | | |
Payson F. Swaffield
1956 | | Vice President | | Since 2011 | | Chief Income Investment Officer of EVC. Vice President of EVM and BMR. |
| | | | | | | |
Barbara E. Campbell
1957 | | Treasurer | | Since 2005 | | Vice President of EVM and BMR. |
| | | | | | | |
Maureen A. Gemma
1960 | | Vice President, Secretary and Chief Legal Officer | | Vice President since 2011, Secretary since 2007 and Chief Legal Officer since 2008 | | Vice President of EVM and BMR. |
| | | | | | | |
Paul M. O’Neil
1953 | | Chief Compliance Officer | | Since 2004 | | Vice President of EVM and BMR. |
| | |
| (1) | | During their respective tenures, the Trustees (except Mr. Eston and Ms. Taggart) also served as trustees of one or more of the following Eaton Vance funds (which operated in the years noted): Eaton Vance Credit Opportunities Fund (launched in 2005 and terminated in 2010); Eaton Vance Insured Florida Plus Municipal Bond Fund (launched in 2002 and terminated in 2009); and Eaton Vance National Municipal Income Trust (launched in 1998 and terminated in 2009). |
The SAI for the Funds includes additional information about the Trustees and officers of the Funds and can be obtained without charge on Eaton Vance’s website at www.eatonvance.com or by calling 1-800-262-1122.
52
Eaton Vance
Limited Maturity Municipal Income Funds
March 31, 2012
Privacy. The Eaton Vance organization is committed to ensuring your financial privacy. Each of the financial institutions identified below has in effect the following policy (“Privacy Policy”) with respect to nonpublic personal information about its customers:
| |
| • | Only such information received from you, through application forms or otherwise, and information about your Eaton Vance fund transactions will be collected. This may include information such as name, address, social security number, tax status, account balances and transactions. |
| |
| • | None of such information about you (or former customers) will be disclosed to anyone, except as permitted by law (which includes disclosure to employees necessary to service your account). In the normal course of servicing a customer’s account, Eaton Vance may share information with unaffiliated third parties that perform various required services such as transfer agents, custodians and broker/dealers. |
| |
| • | Policies and procedures (including physical, electronic and procedural safeguards) are in place that are designed to protect the confidentiality of such information. |
| |
| • | We reserve the right to change our Privacy Policy at any time upon proper notification to you. Customers may want to review our Privacy Policy periodically for changes by accessing the link on our homepage: www.eatonvance.com. |
Our pledge of privacy applies to the following entities within the Eaton Vance organization: the Eaton Vance Family of Funds, Eaton Vance Management, Eaton Vance Investment Counsel, Eaton Vance Distributors, Inc., Eaton Vance Trust Company, Eaton Vance Management’s Real Estate Investment Group and Boston Management and Research. In addition, our Privacy Policy applies only to those Eaton Vance customers who are individuals and who have a direct relationship with us. If a customer’s account (i.e., fund shares) is held in the name of a third-party financial advisor/broker-dealer, it is likely that only such advisor’s privacy policies apply to the customer. This notice supersedes all previously issued privacy disclosures. For more information about Eaton Vance’s Privacy Policy, please call 1-800-262-1122.
Delivery of Shareholder Documents. The Securities and Exchange Commission (the SEC) permits funds to deliver only one copy of shareholder documents, including prospectuses, proxy statements and shareholder reports, to fund investors with multiple accounts at the same residential or post office box address. This practice is often called “householding” and it helps eliminate duplicate mailings to shareholders. Eaton Vance, or your financial advisor, may household the mailing of your documents indefinitely unless you instruct Eaton Vance, or your financial advisor, otherwise. If you would prefer that your Eaton Vance documents not be householded, please contact Eaton Vance at 1-800-262-1122, or contact your financial advisor. Your instructions that householding not apply to delivery of your Eaton Vance documents will be effective within 30 days of receipt by Eaton Vance or your financial advisor.
Portfolio Holdings. Each Eaton Vance Fund and its underlying Portfolio(s) (if applicable) will file a schedule of portfolio holdings on Form N-Q with the SEC for the first and third quarters of each fiscal year. The Form N-Q will be available on the Eaton Vance website at www.eatonvance.com, by calling Eaton Vance at 1-800-262-1122 or in the EDGAR database on the SEC’s website at www.sec.gov. Form N-Q may also be reviewed and copied at the SEC’s public reference room in Washington, D.C. (call 1-800-732-0330 for information on the operation of the public reference room).
Proxy Voting. From time to time, funds are required to vote proxies related to the securities held by the funds. The Eaton Vance Funds or their underlying Portfolios (if applicable) vote proxies according to a set of policies and procedures approved by the Funds’ and Portfolios’ Boards. You may obtain a description of these policies and procedures and information on how the Funds or Portfolios voted proxies relating to portfolio securities during the most recent 12-month period ended June 30, without charge, upon request, by calling 1-800-262-1122 and by accessing the SEC’s website at www.sec.gov.
53
This Page Intentionally Left Blank
This Page Intentionally Left Blank
This Page Intentionally Left Blank
Investment Adviser
Boston Management and Research
Two International Place
Boston, MA 02110
Administrator
Eaton Vance Management
Two International Place
Boston, MA 02110
Principal Underwriter*
Eaton Vance Distributors, Inc.
Two International Place
Boston, MA 02110
(617) 482-8260
Custodian
State Street Bank and Trust Company
200 Clarendon Street
Boston, MA 02116
Independent Registered Public Accounting Firm
Deloitte & Touche LLP
200 Berkeley Street
Boston, MA 02116-5022
Transfer Agent
BNY Mellon Investment Servicing (US) Inc.
Attn: Eaton Vance Funds
P.O. Box 9653
Providence, RI 02940-9653
(800) 262-1122
Fund Offices
Two International Place
Boston, MA 02110
| |
| * | FINRA BrokerCheck. Investors may check the background of their Investment Professional by contacting the Financial Industry Regulatory Authority (FINRA). FINRA BrokerCheck is a free tool to help investors check the professional background of current and former FINRA-registered securities firms and brokers. FINRA BrokerCheck is available by calling 1-800-289-9999 and at www.FINRA.org. The FINRA BrokerCheck brochure describing this program is available to investors at www.FINRA.org. |
Item 2. Code of Ethics
The registrant has adopted a code of ethics applicable to its Principal Executive Officer, Principal Financial Officer and Principal Accounting Officer. The registrant undertakes to provide a copy of such code of ethics to any person upon request, without charge, by calling 1-800-262-1122.
Item 3. Audit Committee Financial Expert
The registrant’s Board has designated William H. Park, an independent trustee, as its audit committee financial expert. Mr. Park is a certified public accountant who is a consultant and private investor. Previously, he served as the Chief Financial Officer of Aveon Group, L.P. (an investment management firm), as the Vice Chairman of Commercial Industrial Finance Corp. (specialty finance company), as President and Chief Executive Officer of Prizm Capital Management, LLC (investment management firm), as Executive Vice President and Chief Financial Officer of United Asset Management Corporation (an institutional investment management firm) and as a Senior Manager at Price Waterhouse (now PricewaterhouseCoopers) (an independent registered public accounting firm).
Item 4. Principal Accountant Fees and Services
Eaton Vance AMT-Free Limited Maturity Municipal Income Fund, Eaton Vance Massachusetts Limited Maturity Municipal Income Fund, Eaton Vance National Limited Maturity Municipal Income Fund, Eaton Vance New York Limited Maturity Municipal Income Fund, and Eaton Vance Pennsylvania Limited Maturity Municipal Income Fund (the “Fund(s)”) are the series of Eaton Vance Investment Trust (the “Trust”), a Massachusetts business trust, which, including the Funds, contains a total of 5 series (the “Series”). The Trust is registered under the Investment Company Act of 1940 as an open-end management investment company.
The following tables present the aggregate fees billed to each Fund for the Fund’s respective fiscal years ended March 31, 2011 and March 31, 2012 by the Fund’s principal accountant, Deloitte & Touche LLP (“D&T”), for professional services rendered for the audit of the Fund’s annual financial statements and fees billed for other services rendered by D&T during those periods.
Eaton Vance AMT-Free Limited Maturity Municipal Income Fund
| | | | | | | | | |
| Fiscal Years Ended | | 03/31/11 | | 03/31/12 |
| |
| Audit Fees | | $ | 27,150 | | | $ | 27,410 | |
Audit-Related Fees(1) | | $ | 0 | | | $ | 0 | |
Tax Fees(2) | | $ | 7,800 | | | $ | 7,880 | |
All Other Fees(3) | | $ | 500 | | | $ | 300 | |
| | | |
| Total | | $ | 35,450 | | | $ | 35,590 | |
| | | |
Eaton Vance Massachusetts Limited Maturity Municipal Income Fund
| | | | | | | | | |
| Fiscal Years Ended | | 03/31/11 | | 03/31/12 |
| |
| Audit Fees | | $ | 28,930 | | | $ | 29,200 | |
Audit-Related Fees(1) | | $ | 0 | | | $ | 0 | |
Tax Fees(2) | | $ | 7,800 | | | $ | 7,880 | |
All Other Fees(3) | | $ | 500 | | | $ | 300 | |
| | | |
| Total | | $ | 37,230 | | | $ | 37,380 | |
| | | |
Eaton Vance National Limited Maturity Municipal Income Fund
| | | | | | | | | |
| Fiscal Years Ended | | 03/31/11 | | 03/31/12 |
| | | |
| Audit Fees | | $ | 46,508 | | | $ | 46,958 | |
Audit-Related Fees(1) | | $ | 0 | | | $ | 0 | |
Tax Fees(2) | | $ | 7,959 | | | $ | 10,180 | |
All Other Fees(3) | | $ | 500 | | | $ | 300 | |
| | | |
| Total | | $ | 54,967 | | | $ | 57,438 | |
| | | |
Eaton Vance New York Limited Maturity Municipal Income Fund
| | | | | | | | | |
| Fiscal Years Ended | | 03/31/11 | | 03/31/12 |
| |
| Audit Fees | | $ | 32,088 | | | $ | 32,388 | |
Audit-Related Fees(1) | | $ | 0 | | | $ | 0 | |
Tax Fees(2) | | $ | 7,959 | | | $ | 8,080 | |
All Other Fees(3) | | $ | 500 | | | $ | 300 | |
| | | |
| Total | | $ | 40,547 | | | $ | 40,768 | |
| | | |
Eaton Vance Pennsylvania Limited Maturity Municipal Income Fund
| | | | | | | | | |
| Fiscal Years Ended | | 03/31/11 | | 03/31/12 |
| |
| Audit Fees | | $ | 27,150 | | | $ | 27,410 | |
Audit-Related Fees(1) | | $ | 0 | | | $ | 0 | |
Tax Fees(2) | | $ | 7,800 | | | $ | 7,880 | |
All Other Fees(3) | | $ | 500 | | | $ | 300 | |
| | | |
| Total | | $ | 35,450 | | | $ | 35,590 | |
| | | |
| | |
| (1) | | Audit-related fees consist of the aggregate fees billed for assurance and related services that are reasonably related to the performance of the audit of financial statements and are not reported under the category of audit fees. |
| |
| (2) | | Tax fees consist of the aggregate fees billed for professional services rendered by the principal accountant relating to tax compliance, tax advice, and tax planning and specifically include fees for tax return preparation. |
| |
| (3) | | All other fees consist of the aggregate fees billed for products and services provided by the principal accountant other than audit, audit-related, and tax services. |
The Funds comprised all of the series of the Trust at 3/31/2012, and have the same fiscal year end (March 31). The following table presents the aggregate audit, audit-related, tax, and other fees billed to all of the Series in the Trust by D&T for the last two fiscal years of each Series.
| | | | | | | | | |
| Fiscal Years Ended | | 03/31/11 | | 03/31/12 |
| |
| Audit Fees | | $ | 189,805 | | | $ | 163,366 | |
Audit-Related Fees(1) | | $ | 0 | | | $ | 0 | |
Tax Fees(2) | | $ | 47,118 | | | $ | 41,900 | |
All Other Fees(3) | | $ | 3,000 | | | $ | 1,500 | |
| | | |
| Total | | $ | 239,923 | | | $ | 206,766 | |
| | | |
| | |
| (1) | | Audit-related fees consist of the aggregate fees billed for assurance and related services that are reasonably related to the performance of the audit of financial statements and are not reported under the category of audit fees. |
| |
| (2) | | Tax fees consist of the aggregate fees billed for professional services rendered by the principal accountant relating to tax compliance, tax advice, and tax planning and specifically include fees for tax return preparation. |
| | |
| (3) | | All other fees consist of the aggregate fees billed for products and services provided by the principal accountant other than audit, audit-related, and tax services. |
(e)(1) The Trust’s audit committee has adopted policies and procedures relating to the pre-approval of services provided by the Trust’s principal accountant (the “Pre-Approval Policies”). The Pre-Approval Policies establish a framework intended to assist the audit committee in the proper discharge f its pre-approval responsibilities. As a general matter, the Pre-Approval Policies (i) specify certain types of audit, audit-related, tax, and other services determined to be pre-approved by the audit committee; and (ii) delineate specific procedures governing the mechanics of the pre-approval process, including the approval and monitoring of audit and non-audit service fees. Unless a service is specifically pre-approved under the Pre-Approval Policies, it must be separately pre-approved by the audit committee.
The Pre-Approval Policies and the types of audit and non-audit services pre-approved therein must be reviewed and ratified by the Trust’s audit committee at least annually. The Trust’s audit committee maintains full responsibility for the appointment, compensation, and oversight of the work of the registrant’s principal accountant.
(e)(2) No services described in paragraphs (b)-(d) above were approved by the Trust’s audit committee pursuant to the “de minimis exception” set forth in Rule 2-01(c)(7)(i)(C) of Regulation S-X.
(f) Not applicable.
(g) The following table presents (i) the aggregate non-audit fees (i.e., fees for audit-related, tax, and other services) billed for services rendered to all of the Funds in the Trust by D&T for the last two fiscal years of each Fund; and (ii) the aggregate non-audit fees (i.e., fees for audit-related, tax, and other services) billed for services rendered to the Eaton Vance organization by D&T for the last two fiscal years of each Fund.
| | | | | | | | | |
| Fiscal Years Ended | | 03/31/11 | | 03/31/12 |
| |
Registrant(1) | | $ | 50,118 | | | $ | 43,400 | |
Eaton Vance(2) | | $ | 253,107 | | | $ | 356,561 | |
| | |
| (1) | | Includes all of the Funds of the Trust. |
| |
| (2) | | The investment adviser to the Funds, as well as any of its affiliates that provide ongoing services to the Funds, are subsidiaries of Eaton Vance Corp. |
(h) The Trust’s audit committee has considered whether the provision by the Trust’s principal accountant of non-audit services to the Trust’s investment adviser and any entity controlling, controlled by, or under common control with the adviser that provides ongoing services to the registrant that were not pre-approved pursuant to Rule 2-01(c)(7)(ii) of Regulation S-X is compatible with maintaining the principal accountant’s independence.
Item 5. Audit Committee of Listed Registrants
Not required in this filing.
Item 6. Schedule of Investments
Please see schedule of investments contained in the Report to Stockholders included under Item 1 of this Form N-CSR.
Item 7. Disclosure of Proxy Voting Policies and Procedures for Closed-End Management Investment Companies
Not applicable.
Item 8. Portfolio Managers of Closed-End Management Investment Companies
Not applicable.
Item 9. Purchases of Equity Securities by Closed-End Management Investment Company and Affiliated Purchasers
Not applicable.
Item 10. Submission of Matters to a Vote of Security Holders
No Material Changes.
Item 11. Controls and Procedures
(a) It is the conclusion of the registrant’s principal executive officer and principal financial officer that the effectiveness of the registrant’s current disclosure controls and procedures (such disclosure controls and procedures having been evaluated within 90 days of the date of this filing) provide reasonable assurance that the information required to be disclosed by the registrant has been recorded, processed, summarized and reported within the time period specified in the Commission’s rules and forms and that the information required to be disclosed by the registrant has been accumulated and communicated to the registrant’s principal executive officer and principal financial officer in order to allow timely decisions regarding required disclosure.
(b) There have been no changes in the registrant’s internal controls over financial reporting during the second fiscal quarter of the period covered by this report that has materially affected, or is reasonably likely to materially affect, the registrant’s internal control over financial reporting.
Item 12. Exhibits
| | | | | |
|
| (a)(1) | | Registrant’s Code of Ethics. | | |
| | | |
| (a)(2)(i) | | Treasurer’s Section 302 certification. | | |
| | | |
| (a)(2)(ii) | | President’s Section 302 certification. | | |
| | | |
| (b) | | Combined Section 906 certification. | | |
Signatures
Pursuant to the requirements of the Securities Exchange Act of 1934 and the Investment Company Act of 1940, the registrant has duly caused this report to be signed on its behalf by the undersigned, thereunto duly authorized.
Eaton Vance Investment Trust
| | | | | |
|
| By: | | /s/ Cynthia J. Clemson Cynthia J. Clemson President | | |
| | | | | |
| Date: | | May 17, 2012 | | |
Pursuant to the requirements of the Securities Exchange Act of 1934 and the Investment Company Act of 1940, this report has been signed below by the following persons on behalf of the registrant and in the capacities and on the dates indicated.
| | | | | |
|
| By: | | /s/ Barbara E. Campbell Barbara E. Campbell | | |
| | | Treasurer | | |
| | | | | |
| Date: | | May 17, 2012 | | |
| | | | | |
| By: | | /s/ Cynthia J. Clemson Cynthia J. Clemson | | |
| | | President | | |
| | | | | |
| Date: | | May 17, 2012 | | |