UNITED STATES SECURITIES AND EXCHANGE COMMISSION
Washington, D.C. 20549
Form N-CSR
CERTIFIED SHAREHOLDER REPORT OF REGISTERED
MANAGEMENT INVESTMENT COMPANIES
Investment Company Act File Number: 811-04443
Eaton Vance Investment Trust
(Exact Name of registrant as Specified in Charter)
Two International Place, Boston, Massachusetts 02110
(Address of Principal Executive Offices)
Maureen A. Gemma
Two International Place, Boston, Massachusetts 02110
(Name and Address of Agent for Services)
(617) 482-8260
(registrant’s Telephone Number)
March 31
March 31, 2009
Item 1. Reports to Stockholders
| A n n u a l R e p o r t M a r c h 3 1 , 2 0 0 9 EATON VANCE AMT-Free LIMITED National MATURITY MUNICIPALS FUNDS |
IMPORTANT NOTICES REGARDING PRIVACY,
DELIVERY OF SHAREHOLDER DOCUMENTS,
PORTFOLIO HOLDINGS, AND PROXY VOTING
Privacy. The Eaton Vance organization is committed to ensuring your financial privacy. Each of the financial institutions identified below has in effect the following policy (“Privacy Policy”) with respect to nonpublic personal information about its customers:
| | |
| | • | Only such information received from you, through application forms or otherwise, and information about your Eaton Vance fund transactions will be collected. This may include information such as name, address, social security number, tax status, account balances and transactions. |
| |
| | • | None of such information about you (or former customers) will be disclosed to anyone, except as permitted by law (which includes disclosure to employees necessary to service your account). In the normal course of servicing a customer’s account, Eaton Vance may share information with unaffiliated third parties that perform various required services such as transfer agents, custodians and broker/dealers. |
| |
| | • | Policies and procedures (including physical, electronic and procedural safeguards) are in place that are designed to protect the confidentiality of such information. |
| |
| | • | We reserve the right to change our Privacy Policy at any time upon proper notification to you. Customers may want to review our Policy periodically for changes by accessing the link on our homepage: www.eatonvance.com. |
Our pledge of privacy applies to the following entities within the Eaton Vance organization: the Eaton Vance Family of Funds, Eaton Vance Management, Eaton Vance Investment Counsel, Boston Management and Research, and Eaton Vance Distributors, Inc.
In addition, our Privacy Policy only applies to those Eaton Vance customers who are individuals and who have a direct relationship with us. If a customer’s account (i.e., fund shares) is held in the name of a third-party financial adviser/broker-dealer, it is likely that only such adviser’s privacy policies apply to the customer. This notice supersedes all previously issued privacy disclosures.
For more information about Eaton Vance’s Privacy Policy, please call 1-800-262-1122.
Delivery of Shareholder Documents. The Securities and Exchange Commission (the “SEC”) permits funds to deliver only one copy of shareholder documents, including prospectuses, proxy statements and shareholder reports, to fund investors with multiple accounts at the same residential or post office box address. This practice is often called “householding” and it helps eliminate duplicate mailings to shareholders.
Eaton Vance, or your financial adviser, may household the mailing of your documents indefinitely unless you instruct Eaton Vance, or your financial adviser, otherwise.
If you would prefer that your Eaton Vance documents not be householded, please contact Eaton Vance at 1-800-262-1122, or contact your financial adviser.
Your instructions that householding not apply to delivery of your Eaton Vance documents will be effective within 30 days of receipt by Eaton Vance or your financial adviser.
Portfolio Holdings. Each Eaton Vance Fund and its underlying Portfolio (if applicable) will file a schedule of its portfolio holdings on Form N-Q with the SEC for the first and third quarters of each fiscal year. The Form N-Q will be available on the Eaton Vance website www.eatonvance.com, by calling Eaton Vance at 1-800-262-1122 or in the EDGAR database on the SEC’s website at www.sec.gov. Form N-Q may also be reviewed and copied at the SEC’s public reference room in Washington, D.C. (call 1-800-732-0330 for information on the operation of the public reference room).
Proxy Voting. From time to time, funds are required to vote proxies related to the securities held by the funds. The Eaton Vance Funds or their underlying Portfolios (if applicable) vote proxies according to a set of policies and procedures approved by the Funds’ and Portfolios’ Boards. You may obtain a description of these policies and procedures and information on how the Funds or Portfolios voted proxies relating to portfolio securities during the most recent 12 month period ended June 30, without charge, upon request, by calling 1-800-262-1122. This description is also available on the SEC’s website at www.sec.gov.
Eaton Vance Limited Maturity Municipals Funds as of March 31, 2009
TABLE OF CONTENTS
| | | | | |
| Management’s Discussion of Fund Performance | | | 2 | |
| | | | | |
| Performance Information and Portfolio Composition | | | | |
| AMT-Free | | | 4 | |
| National | | | 6 | |
| | | | | |
| Fund Expenses | | | 8 | |
| | | | | |
| Financial Statements | | | 10 | |
| | | | | |
| Federal Tax Information | | | 39 | |
| | | | | |
| Special Meeting of Shareholders | | | 40 | |
| | | | | |
Board of Trustees’ Annual Approval
of the Investment Advisory Agreements | | | 41 | |
| | | | | |
| Management and Organization | | | 47 | |
1
Eaton Vance Limited Maturity Municipals Funds as of March 31, 2009
MANAGEMENT’S DISCUSSION OF FUND PERFORMANCE
Economic and Market Conditions
The 12-month period ending March 31, 2009, had more than its share of economic and market upheaval. For instance, the U.S. economy, as measured by gross domestic product (GDP), contracted sharply in both the fourth quarter of 2008 and the first quarter of 2009 by 6.2% and 6.1%, respectively, after a 0.3% decline in the third quarter of 2008, according to the U.S. Department of Commerce. The first quarter 2009 figure was a preliminary estimate. Most of the major GDP components contributed to the decline, but a sharp downturn in consumer spending was particularly influential and continued to weigh on the economy in early 2009. While high commodity prices eased since their summertime peaks, consumers continued to pare spending as they remained cautious of what increasingly became a weaker economic environment. Rising unemployment levels, at a five-year high at period end, led to constrained personal consumption and overall economic contraction. For much of the past 12 months, the housing market weighed on the economy, with new and existing home sales falling especially hard in the second half of calendar 2008.
In the first quarter of 2009, the U.S. economy began showing some signs of life. Although most economists forecast anemic growth for the remainder of the year, some of the data turned more positive early on. February was a particularly strong month for economic data: factory orders increased 1.8%; new home sales rose 4.7% — the first increase in seven months; and existing home sales surged 5.1%, the largest monthly gain since 2003. The upturn in the housing market was bolstered by historically low mortgage rates, an $8,000 tax credit for first-time home buyers that was part of President Obama’s stimulus legislation, and a plethora of distressed properties on the market.
For the year ending March 31, 2009, the capital markets experienced steep declines, followed by a welcome rally during the final three and a half months of the period. The fall of 2008 witnessed a number of distressing events, resulting in a freefall in both the credit and equity markets. Several calamitous events occurred in September alone, including the federal takeover of federally chartered mortgage giants Fannie Mae and Freddie Mac, the bankruptcy of Lehman Brothers, and the announcement by Bank of America that it was acquiring Merrill Lynch. These actions, along with several other corporate shakeups, bank failures and bailouts, drastically redefined the Wall Street landscape.
In response, the U.S. government enacted a number of bold stimulus programs. Last fall, Congress approved a $700 billion program authorizing the federal government to purchase troubled assets from financial institutions, a program that continued to evolve since the bill was enacted into law. On February 17, 2009, President Obama signed an historic $787 billion stimulus program into law and outlined a $50 billion foreclosure rescue plan. Additionally, between March 31, 2008, and December 31, 2008, the U.S. Federal Reserve (the Fed) lowered the federal funds rate to a range of 0.0% to 0.25% from 2.25%. Also during the 12-month period, the Fed took extraordinary actions through a variety of innovative lending techniques in an attempt to ease the credit crisis.
Management Discussion
Relative to the Funds’ primary benchmark, the Barclays Capital 7-Year Municipal Bond Index1 (the Index) — a broad-based, unmanaged index of intermediate-maturity municipal bonds — the Funds under-performed for the year ending March 31, 2009. As a result of an active management style that focuses on income and longer call protection, the Funds generally hold longer-duration intermediate-maturity bonds relative to other intermediate bond funds. Much of their underperformance occurred in the first nine months of the period and, management believes, can be attributed to the shift of investors’ capital into shorter-maturity bonds — a result of the broader-based credit crisis — during this period. The move to shorter-term investments was originally driven by uncertainty surrounding financial companies’ exposure to subprime mortgage-backed debt but later spread to the muni market when major municipal bond insurers suffered rating downgrades due to their exposure to mortgage-related structured products. In addition, management has historically used Treasury futures to seek to offset interest-rate volatility associated with investing in longer-maturity municipal bonds. Investors’ flight to quality during the first nine months of the year pushed Treasury yields to historic lows, causing the Funds’ Treasury futures positions to detract from performance for the year as a whole.
Fund shares are not insured by the FDIC and are not deposits or other obligations of, or guaranteed by, any depository institution. Shares are subject to investment risks, including possible loss of principal invested.
| | |
| 1 | | Formerly called Lehman Brothers 7-Year Municipal Bond Index. It is not possible to invest directly in an Index. |
The views expressed throughout this report are those of the portfolio managers and are current only through the end of the period of the report as stated on the cover. These views are subject to change at any time based upon market or other conditions, and the investment adviser disclaims any responsibility to update such views. These views may not be relied on as investment advice and, because investment decisions for a fund are based on many factors, may not be relied on as an indication of trading intent on behalf of any Eaton Vance fund. Portfolio information provided in the report may not be representative of the Funds’ current or future investments and may change due to active management.
2
Eaton Vance Limited Maturity Municipals Funds as of March 31, 2009
MANAGEMENT’S DISCUSSION OF FUND PERFORMANCE
Since mid-December 2008, however, the municipal market rallied considerably, and Eaton Vance’s Limited Maturity Municipal Funds outperformed the Index. A number of factors appeared to be at work in the market’s rebound. Municipal demand, while anemic for much of last year, returned in dramatic fashion during the first quarter of 2009. Retail muni investors — those who buy municipal bonds directly or through managed products such as mutual funds — were the predominant force behind the renewed demand. While many retail investors fled the market in 2008 as a result of market volatility and intimidating news reports, the perception of risk began to mitigate during the early stages of the new year. While institutional demand was largely absent during the first quarter of 2009 — as it was for much of 2008 — retail purchases kept overall demand levels strong.
Against this backdrop, we continue to manage our municipal funds with the same relative value approach that we have traditionally employed, maintaining a long-term perspective when markets exhibit extreme short-term volatility. We believe this approach has provided excellent long-term benefits to our investors over time. Furthermore, we believe that the 138.9% yield ratio of insured municipal bonds to 30-year Treasuries as of March 31, 2009 — as compared with the long-term average of 85%-90% — indicates that there is still relative value in municipal bonds when compared with their taxable counterparts.1
| | |
| 1 | | Source: Bloomberg L.P. Yields are a compilation of a representative variety of general obligations and are not necessarily representative of a Fund’s yield. |
3
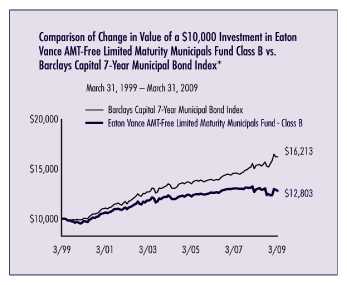
Eaton Vance AMT-Free Limited Maturity Municipals Fund as of March 31, 2009
PERFORMANCE INFORMATION
The line graph and table set forth below provide information about the Fund’s performance. The line graph compares the performance of Class B of the Fund with that of the Barclays Capital 7-Year Municipal Bond Index, an unmanaged market index of intermediate-maturity municipal obligations. The lines on the graph represent the total returns of a hypothetical investment of $10,000 in each of Class B and in the Barclays Capital 7-Year Municipal Bond Index. The table includes the total returns of each Class of the Fund at net asset value and maximum public offering price. The performance presented below does not reflect the deduction of taxes, if any, that a shareholder would pay on distributions or redemptions of Fund shares.
| | | | | | | | | | | | | |
| Fund Performance1 | | Class A | | Class B | | Class C |
| Share Class Symbol | | EXFLX | | ELFLX | | EZFLX |
| |
| Average Annual Total Returns (at net asset value) | | | | | | | | | | | | |
| One Year | | | -0.33 | % | | | -1.10 | % | | | -1.02 | % |
| Five Years | | | 1.75 | | | | 0.98 | | | | 1.00 | |
| Ten Years | | | 3.27 | | | | 2.50 | | | | 2.49 | |
Life of Fund† | | | 3.72 | | | | 3.36 | | | | 2.78 | |
| | | | | | | | | | | | | |
| SEC Average Annual Total Returns (including sales charge or applicable CDSC) | | | | | | | | |
| One Year | | | -2.59 | % | | | -3.97 | % | | | -1.98 | % |
| Five Years | | | 1.29 | | | | 0.98 | | | | 1.00 | |
| Ten Years | | | 3.03 | | | | 2.50 | | | | 2.49 | |
Life of Fund† | | | 3.54 | | | | 3.36 | | | | 2.78 | |
| | |
| † | | Inception dates: Class A: 6/27/96; Class B: 5/29/92; Class C: 12/8/93 |
| | | | | | | | | | | | | |
| Total Annual | | | | | | |
| Operating Expenses2 | | Class A | | Class B | | Class C |
| |
| Expense Ratio | | | 0.92 | % | | | 1.67 | % | | | 1.67 | % |
| | | | | | | | | | | | | |
| Distribution Rates/Yields | | Class A | | Class B | | Class C |
| |
Distribution Rate3 | | | 3.96 | % | | | 3.21 | % | | | 3.21 | % |
Taxable-Equivalent Distribution Rate3,4 | | | 6.09 | | | | 4.94 | | | | 4.94 | |
SEC 30-day Yield5 | | | 3.28 | | | | 2.60 | | | | 2.61 | |
Taxable-Equivalent SEC 30-day Yield4,5 | | | 5.05 | | | | 4.00 | | | | 4.02 | |
Index Performance6 (Average Annual Total Returns)
| | | | | |
| Barclays Capital 7-Year Municipal Bond Index | | | | |
| |
| One Year | | | 5.53 | % |
| Five Years | | | 3.90 | |
| Ten Years | | | 4.95 | |
Lipper Averages7 (Average Annual Total Returns)
| | | | | |
| Lipper Intermediate Municipal Debt Funds Classification | | | | |
| |
| One Year | | | 1.33 | % |
| Five Years | | | 2.31 | |
| Ten Years | | | 3.63 | |
Past performance is no guarantee of future results. Returns are historical and are calculated by determining the percentage change in net asset value or offering price (as applicable) with all distributions reinvested. Investment return and principal value will fluctuate so that shares, when redeemed, may be worth more or less than their original cost. Performance is for the stated time period only; due to market volatility, the Fund’s current performance may be lower or higher than the quoted return. For performance as of the most recent month end, please refer to www.eatonvance.com.
Portfolio Manager: Craig R. Brandon, CFA
| | |
| * | | Source: Lipper, Inc. Class B of the Fund commenced operations on 5/29/92. A $10,000 hypothetical investment at net asset value in Class A and Class C on 3/31/99 would have been valued at $13,800 ($13,490 at the maximum offering price) and $12,796, respectively, on 3/31/09. It is not possible to invest directly in an Index. The Index’s total return does not reflect the expenses that would have been incurred if an investor individually purchased or sold the securities represented in the Index. |
| |
| 1 | | Average Annual Total Returns do not include the 2.25% maximum sales charge for Class A shares or the applicable contingent deferred sales charges (CDSC) for Class B and Class C shares. If sales charges were deducted, the returns would be lower. SEC Average Annual Total Returns for Class A reflect the maximum 2.25% sales charge. SEC Average Annual Total Returns for Class B reflect the applicable CDSC based on the following schedule: 3% — 1st year; 2.5% — 2nd year; 2% - 3rd year; 1% — 4th year. SEC Average Annual Total Returns for Class C reflect a 1% CDSC for the first year. 2 Source: Prospectus dated 8/1/08. 3 The Fund’s distribution rate represents actual distributions paid to shareholders and is calculated by dividing the last distribution per share (annualized) by the net asset value. 4 Taxable-equivalent figures assume a maximum 35.00% federal income tax rate. A lower tax rate would result in lower tax-equivalent figures. 5 The Fund’s SEC yield is calculated by dividing the net investment income per share for the 30-day period by the offering price at the end of the period and annualizing the result. 6 It is not possible to invest directly in an Index. The Index’s total return does not reflect the expenses that would have been incurred if an investor individually purchased or sold the securities represented in the Index. Index performance is available as of month end only. 7 The Lipper Averages are the average annual total returns, at net asset value, of the funds that are in the same Lipper Classification as the Fund. It is not possible to invest in a Lipper Classification. Lipper Classifications may include insured and uninsured funds, as well as leveraged and unleveraged funds. The Lipper Intermediate Municipal Debt Funds Classification contained 161, 130 and 76 funds for the 1-year, 5-year and 10-year time periods, respectively. Lipper Averages are available as of month end only. |
4
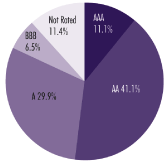
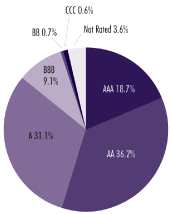
Eaton Vance AMT-Free Limited Maturity Municipals Funds as of March 31, 2009
PORTFOLIO COMPOSITION
Rating Distribution1
By total investments
| | |
| 1 | | Rating Distribution is determined by dividing the total market value of the issues by the total investments of the Fund. Although the investment adviser considers ratings when making investment decisions, it performs its own credit and investment analysis and does not rely primarily on the ratings assigned by the rating services. Credit quality can change from time to time, and recently issued credit ratings may not fully reflect the actual risks posed by a particular security or the issuer’s current financial condition. |
Fund Statistics
| | | |
• Number of Issues: | | 82 |
• Average Maturity: | | 12.0 years |
• Average Effective Maturity: | | 9.0 years |
• Average Rating: | | AA |
• Average Call Protection: | | 8.3 years |
• Average Dollar Price: | | $104.18 |
5
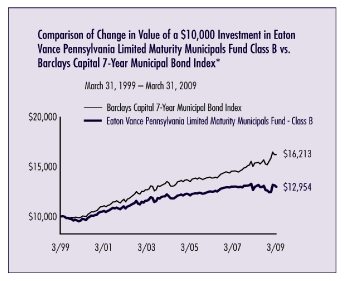
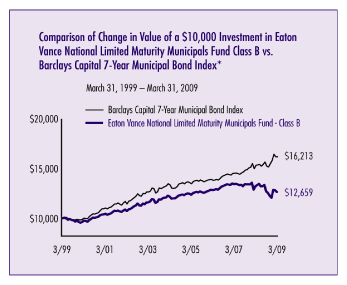
Eaton Vance National Limited Maturity Municipals Funds as of March 31, 2009
PERFORMANCE INFORMATION
The line graph and table set forth below provide information about the Fund’s performance. The line graph compares the performance of Class B of the Fund with that of the Barclays Capital 7-Year Municipal Bond Index, an unmanaged market index of intermediate-maturity municipal obligations. The lines on the graph represent the total returns of a hypothetical investment of $10,000 in each of Class B and in the Barclays Capital 7-Year Municipal Bond Index. The table includes the total returns of each Class of the Fund at net asset value and maximum public offering price. The performance presented below does not reflect the deduction of taxes, if any, that a shareholder would pay on Fund distributions or redemptions of Fund shares.
| | | | | | | | | | | | | |
| Fund Performance1 | | Class A | | Class B | | Class C |
| Share Class Symbol | | EXNAX | | ELNAX | | EZNAX |
| |
| Average Annual Total Returns (at net asset value) | | | | | | | | | | | | |
| One Year | | | -3.50 | % | | | -4.34 | % | | | -4.20 | % |
| Five Years | | | 1.56 | | | | 0.78 | | | | 0.79 | |
| Ten Years | | | 3.17 | | | | 2.38 | | | | 2.38 | |
Life of Fund† | | | 3.91 | | | | 3.54 | | | | 2.87 | |
| | | | | | | | | | | | | |
| SEC Average Annual Total Returns (including sales charge or applicable CDSC) | | | | | | | | |
| One Year | | | -5.68 | % | | | -7.12 | % | | | -5.13 | % |
| Five Years | | | 1.10 | | | | 0.78 | | | | 0.79 | |
| Ten Years | | | 2.94 | | | | 2.38 | | | | 2.38 | |
Life of Fund† | | | 3.72 | | | | 3.54 | | | | 2.87 | |
| | |
| † | | Inception dates: Class A: 6/27/96; Class B: 5/22/92; Class C: 12/8/93 |
| | | | | | | | | | | | | |
| Total Annual | | | | | | |
| Operating Expenses2 | | Class A | | Class B | | Class C |
| |
| Expense Ratio | | | 0.76 | % | | | 1.51 | % | | | 1.51 | % |
| | | | | | | | | | | | | |
| Distribution Rates/Yields | | Class A | | Class B | | Class C |
| |
Distribution Rate3 | | | 4.29 | % | | | 3.54 | % | | | 3.53 | % |
Taxable-Equivalent Distribution Rate3,4 | | | 6.60 | | | | 5.45 | | | | 5.43 | |
SEC 30-day Yield5 | | | 4.13 | | | | 3.47 | | | | 3.47 | |
Taxable-Equivalent SEC 30-day Yield4,5 | | | 6.35 | | | | 5.34 | | | | 5.34 | |
Index Performance6 (Average Annual Total Returns)
| | | | | |
| Barclays Capital 7-Year Municipal Bond Index | | | | |
| |
| One Year | | | 5.53 | % |
| Five Years | | | 3.90 | |
| Ten Years | | | 4.95 | |
Lipper Averages7 (Average Annual Total Returns)
| | | | | |
| Lipper Intermediate Municipal Debt Funds Classification | | | | |
| |
| One Year | | | 1.33 | % |
| Five Years | | | 2.31 | |
| Ten Years | | | 3.63 | |
Past performance is no guarantee of future results. Returns are historical and are calculated by determining the percentage change in net asset value or offering price (as applicable) with all distributions reinvested. Investment return and principal value will fluctuate so that shares, when redeemed, may be worth more or less than their original cost. Performance is for the stated time period only; due to market volatility, the Fund’s current performance may be lower or higher than the quoted return. For performance as of the most recent month end, please refer to www.eatonvance.com.
Portfolio Manager: William H. Ahern, Jr., CFA
| | |
| * | | Source: Lipper, Inc. Class B of the Fund commenced operations on 5/22/92. A $10,000 hypothetical investment at net asset value in Class A and Class C on 3/31/99 would have been valued at $13,670 ($13,363 at the maximum offering price) and $12,652, respectively, on 3/31/09. It is not possible to invest directly in an Index. The Index’s total return does not reflect the expenses that would have been incurred if an investor individually purchased or sold the securities represented in the Index. |
| |
| 1 | | Average Annual Total Returns do not include the 2.25% maximum sales charge for Class A shares or the applicable contingent deferred sales charges (CDSC) for Class B and Class C shares. If sales charges were deducted, the returns would be lower. SEC Average Annual Total Returns for Class A reflect the maximum 2.25% sales charge. SEC Average Annual Total Returns for Class B reflect the applicable CDSC based on the following schedule: 3% — 1st year; 2.5% — 2nd year; 2% - 3rd year; 1% — 4th year. SEC Average Annual Total Returns for Class C reflect a 1% CDSC for the first year. 2 Source: Prospectus dated 8/1/08. Includes interest expense of 0.05% relating to the Fund’s liability with respect to floating rate notes held by third parties in conjunction with inverse floater securities transactions by the Fund. The Fund also records offsetting interest income relating to the municipal obligations underlying such transactions, and as a result, net asset value and performance have not been affected by this expense. 3 The Fund’s distribution rate represents actual distributions paid to shareholders and is calculated by dividing the last distribution per share (annualized) by the net asset value. 4 Taxable-equivalent figures assume a maximum 35.00% federal income tax rate. A lower tax rate would result in lower tax-equivalent figures. 5 The Fund’s SEC yield is calculated by dividing the net investment income per share for the 30-day period by the offering price at the end of the period and annualizing the result. 6 It is not possible to invest directly in an Index. The Index’s total return does not reflect the expenses that would have been incurred if an investor individually purchased or sold the securities represented in the Index. Index performance is available as of month end only. 7 The Lipper Averages are the average annual total returns, at net asset value, of the funds that are in the same Lipper Classification as the Fund. It is not possible to invest in a Lipper Classification. Lipper Classifications may include insured and uninsured funds, as well as leveraged and unleveraged funds. The Lipper Intermediate Municipal Debt Funds Classification contained 161, 130 and 76 funds for the 1-year, 5-year and 10-year time periods, respectively. Lipper Averages are available as of month end only. |
6
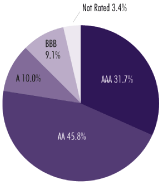
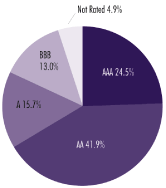
Eaton Vance National Limited Maturity Municipals Funds as of March 31, 2009
PORTFOLIO COMPOSITION
Rating Distribution*1
By total investments
| | |
| * | | The rating distribution presented above includes the ratings of securities held by special purpose vehicles in which the Fund holds a residual interest. See Note 1I to the Fund’s financial statements. Absent such securities, the Fund’s rating distribution at 3/31/09, is as follows, and the average rating is AA. |
| | | |
AAA | 19.6% | |
AA | 40.0% | |
A | 17.3% | |
BBB | 14.9% | |
B | 0.8% | |
CCC | 0.1% | |
Not Rated | 7.3% | |
Fund Statistics2
| | | |
• Number of Issues: | | 233 |
• Average Maturity: | | 11.7 years |
• Average Effective Maturity: | | 9.1 years |
• Average Call Protection: | | 7.4 years |
• Average Dollar Price: | | $97.19 |
• TOB Leverage3: | | 0.8 % |
| | |
| 1 | | Rating Distribution is determined by dividing the total market value of the issues by the total investments of the Fund. Although the investment adviser considers ratings when making investment decisions, it performs its own credit and investment analysis and does not rely primarily on the ratings assigned by the rating services. Credit quality can change from time to time, and recently issued credit ratings may not fully reflect the actual risks posed by a particular security or the issuer’s current financial condition. |
| |
| 2 | | Fund holdings information excludes securities held by special purpose vehicles in which the Fund holds a residual interest. See Note 1I to the Fund’s financial statements. |
| |
| 3 | | See Note 1l to the Fund’s financial statements. Tender option bonds (TOBs) are a form of investment leverage that create an opportunity for increased income but, at the same time, create special risks (including the likelihood of greater volatility of net asset value). TOB leverage represents the amount of Floating Rate Notes outstanding at 3/31/09 as a percentage of the Fund’s net assets plus Floating Rate Notes. |
7
Eaton Vance Limited Maturity Municipals Funds as of March 31, 2009
FUND EXPENSES
Example: As a shareholder of a Fund, you incur two types of costs: (1) transaction costs, including sales charges (loads) on purchases and redemption fees (if applicable); and (2) ongoing costs, including management fees; distribution or service fees; and other Fund expenses. This Example is intended to help you understand your ongoing costs (in dollars) of investing in a Fund and to compare these costs with the ongoing costs of investing in other mutual funds. The Example is based on an investment of $1,000 invested at the beginning of the period and held for the entire period (October 1, 2008 — March 31, 2009).
Actual Expenses: The first section of each table below provides information about actual account values and actual expenses. You may use the information in this section, together with the amount you invested, to estimate the expenses that you paid over the period. Simply divide your account value by $1,000 (for example, an $8,600 account value divided by $1,000 = 8.6), then multiply the result by the number in the first section under the heading entitled “Expenses Paid During Period” to estimate the expenses you paid on your account during this period.
Hypothetical Example for Comparison Purposes: The second section of each table below provides information about hypothetical account values and hypothetical expenses based on the actual Fund expense ratio and an assumed rate of return of 5% per year (before expenses), which is not the actual return of the Fund. The hypothetical account values and expenses may not be used to estimate the actual ending account balance or expenses you paid for the period. You may use this information to compare the ongoing costs of investing in your Fund and other funds. To do so, compare this 5% hypothetical example with the 5% hypothetical examples that appear in the shareholder reports of the other funds.
Please note that the expenses shown in each table are meant to highlight your ongoing costs only and do not reflect any transactional costs, such as sales charges (loads) or redemption fees (if applicable). Therefore, the second section of each table is useful in comparing ongoing costs only, and will not help you determine the relative total costs of owning different funds. In addition, if these transactional costs were included, your costs would have been higher.
Eaton Vance AMT-Free Limited Maturity Municipals Fund
| | | | | | | | | | | | | | | |
| | | Beginning Account Value
| | | Ending Account Value
| | | Expenses Paid During Period*
| | | |
| | | (10/1/08) | | | (3/31/09) | | | (10/1/08 – 3/31/09) | | | |
| |
| |
Actual | | | | | | | | | | | | | | |
| Class A | | | $1,000.00 | | | | $1,039.20 | | | | $4.37 | | | |
| Class B | | | $1,000.00 | | | | $1,035.20 | | | | $7.97 | | | |
| Class C | | | $1,000.00 | | | | $1,036.30 | | | | $8.17 | | | |
| | | | | | | | | | | | | | | |
| | | | | | | | | | | | | | | |
| |
| |
| | | | | | | | | | | | | | | |
Hypothetical | | | | | | | | | | | | | | |
| (5% return per year before expenses) | | | | | | | | | | | | | | |
| Class A | | | $1,000.00 | | | | $1,020.60 | | | | $4.33 | | | |
| Class B | | | $1,000.00 | | | | $1,017.10 | | | | $7.90 | | | |
| Class C | | | $1,000.00 | | | | $1,016.90 | | | | $8.10 | | | |
| | | |
| | * | Expenses are equal to the Fund’s annualized expense ratio of 0.86% for Class A shares, 1.57% for Class B shares and 1.61% for Class C shares, multiplied by the average account value over the period, multiplied by 182/365 (to reflect the one-half year period). The Example assumes that the $1,000 was invested at the net asset value per share determined at the close of business on September 30, 2008. | |
8
Eaton Vance Limited Maturity Municipals Funds as of March 31, 2009
FUND EXPENSES CONT’D
Eaton Vance National Limited Maturity Municipals Fund
| | | | | | | | | | | | | | | |
| | | Beginning Account Value
| | | Ending Account Value
| | | Expenses Paid During Period*
| | | |
| | | (10/1/08) | | | (3/31/09) | | | (10/1/08 – 3/31/09) | | | |
| |
| |
Actual | | | | | | | | | | | | | | |
| Class A | | | $1,000.00 | | | | $998.80 | | | | $3.69 | | | |
| Class B | | | $1,000.00 | | | | $994.90 | | | | $7.41 | | | |
| Class C | | | $1,000.00 | | | | $995.60 | | | | $7.41 | | | |
| | | | | | | | | | | | | | | |
| | | | | | | | | | | | | | | |
| |
| |
| | | | | | | | | | | | | | | |
Hypothetical | | | | | | | | | | | | | | |
| (5% return per year before expenses) | | | | | | | | | | | | | | |
| Class A | | | $1,000.00 | | | | $1,021.20 | | | | $3.73 | | | |
| Class B | | | $1,000.00 | | | | $1,017.50 | | | | $7.49 | | | |
| Class C | | | $1,000.00 | | | | $1,017.50 | | | | $7.49 | | | |
| | | |
| | * | Expenses are equal to the Fund’s annualized expense ratio of 0.74% for Class A shares, 1.49% for Class B shares and 1.49% for Class C shares, multiplied by the average account value over the period, multiplied by 182/365 (to reflect the one-half year period). The Example assumes that the $1,000 was invested at the net asset value per share determined at the close of business on September 30, 2008. | |
9
Eaton Vance AMT-Free Limited Maturity Municipals Fund as of March 31, 2009
PORTFOLIO OF INVESTMENTS
| | | | | | | | | | | |
| Tax-Exempt Investments — 97.9% |
| |
Principal Amount
| | | | | | | | |
| (000’s omitted) | | | Security | | Value | | | |
| |
| |
| |
| Bond Bank — 4.0% |
| |
| $ | 1,000 | | | Idaho Board Bank Authority, 5.00%, 9/15/22 | | $ | 1,060,120 | | | |
| | 1,255 | | | Virginia Resources Authority Infrastructure Revenue, 5.25%, 11/1/26 | | | 1,346,766 | | | |
| |
| |
| | | | | | | $ | 2,406,886 | | | |
| |
| |
| |
| |
| Education — 9.9% |
| |
| $ | 280 | | | Indiana University, IN, 5.00%, 8/1/20 | | $ | 302,590 | | | |
| | 1,000 | | | Massachusetts Health and Educational Facilities Authority, (Harvard University), 5.25%, 11/15/19 | | | 1,164,180 | | | |
| | 1,000 | | | Missouri Health and Educational Facilities Authority, (Washington University), 5.25%, 3/15/18 | | | 1,176,400 | | | |
| | 1,000 | | | New York Dormitory Authority, (State University Educational Facilities), 5.25% to 5/15/12 (Put Date), 11/15/23 | | | 1,056,090 | | | |
| | 150 | | | Purdue University, IN, 5.00%, 7/1/21 | | | 160,938 | | | |
| | 1,000 | | | University of Houston, TX, 5.00%, 2/15/21 | | | 1,073,340 | | | |
| | 1,000 | | | University of Pittsburgh, PA, 5.25%, 9/15/23 | | | 1,062,840 | | | |
| |
| |
| | | | | | | $ | 5,996,378 | | | |
| |
| |
| |
| |
| Electric Utilities — 12.3% |
| |
| $ | 670 | | | California Department of Water Resource Power Supply, 5.00%, 5/1/22 | | $ | 684,894 | | | |
| | 1,000 | | | Chesterfield County, VA, Industrial Development Authority, (Virginia Electric and Power Co.), 5.50%, 10/1/09 | | | 1,001,950 | | | |
| | 1,000 | | | Connecticut State Development Authority, (United Illuminating Co.), 5.75% to 2/1/12 (Put Date), 6/1/26 | | | 1,000,480 | | | |
| | 1,000 | | | Energy Northwest Electric Revenue, WA, (Columbia Station), 5.00%, 7/1/24(1) | | | 1,015,110 | | | |
| | 1,000 | | | Municipal Electric Authority of Georgia, 5.25%, 1/1/21 | | | 1,051,000 | | | |
| | 500 | | | Puerto Rico Electric Power Authority, 5.00%, 7/1/23 | | | 433,880 | | | |
| | 1,000 | | | Salt River, AZ, Agricultural Improvements and Power District, 5.00%, 1/1/21 | | | 1,081,700 | | | |
| | 1,000 | | | Seattle, WA, Municipal Light and Power Revenue, 5.25%, 4/1/20 | | | 1,093,570 | | | |
| | 135 | | | Titus County, TX, Fresh Water Supply District, 4.50%, 7/1/11 | | | 133,867 | | | |
| |
| |
| | | | | | | $ | 7,496,451 | | | |
| |
| |
| |
| Escrowed / Prerefunded — 3.9% |
| |
| $ | 1,000 | | | Tobacco Settlement Financing Corp., NJ, Prerefunded to 6/1/13, 6.75%, 6/1/39 | | $ | 1,201,470 | | | |
| | 1,000 | | | Triborough Bridge and Tunnel Authority, NY, Prerefunded to 1/1/22, 5.50%, 1/1/30 | | | 1,183,270 | | | |
| |
| |
| | | | | | | $ | 2,384,740 | | | |
| |
| |
| |
| |
| General Obligations — 4.9% |
| |
| $ | 250 | | | Henrico County, VA, (Public Improvements), 5.00%, 12/1/20 | | $ | 283,083 | | | |
| | 2,000 | | | Salem-Keizer, OR, School District No. 24J, 0.00%, 6/15/17 | | | 1,452,780 | | | |
| | 500 | | | Seattle, WA, 5.00%, 12/1/22 | | | 539,070 | | | |
| | 645 | | | Will Grundy ETC Counties, IL, Community College District No. 525, 5.50%, 6/1/18 | | | 728,263 | | | |
| |
| |
| | | | | | | $ | 3,003,196 | | | |
| |
| |
| |
| |
| Health Care-Miscellaneous — 0.1% |
| |
| $ | 100 | | | Puerto Rico Infrastructure Financing Authority, (Mepsi Campus Project), 6.25%, 10/1/24 | | $ | 77,772 | | | |
| |
| |
| | | | | | | $ | 77,772 | | | |
| |
| |
| |
| |
| Hospital — 5.2% |
| |
| $ | 1,000 | | | California Health Facilities Financing Authority, (Catholic Healthcare), 5.125%, 7/1/22 | | $ | 972,010 | | | |
| | 1,000 | | | Highlands County, FL, Health Facilities Authority, (Adventist Health), 5.00%, 11/15/20 | | | 969,940 | | | |
| | 275 | | | Kent, MI, Hospital Finance Authority, (Spectrum Health), 5.50% to 1/15/15 (Put Date), 1/15/47 | | | 280,637 | | | |
| | 480 | | | Massachusetts Health and Educational Facilities Authority, (Caregroup, Inc.), 5.375%, 7/1/21 | | | 443,405 | | | |
| | 500 | | | West Orange, FL, Healthcare District, 5.50%, 2/1/10 | | | 505,205 | | | |
| |
| |
| | | | | | | $ | 3,171,197 | | | |
| |
| |
| |
| |
| Insured-Education — 3.6% |
| |
| $ | 1,000 | | | New York Dormitory Authority, (New York University), (AMBAC), 5.50%, 7/1/22 | | $ | 1,115,350 | | | |
| | 1,000 | | | Texas University Systems Financing Revenue, (FSA), 5.00%, 3/15/21 | | | 1,058,680 | | | |
| |
| |
| | | | | | | $ | 2,174,030 | | | |
| |
| |
| |
See notes to financial statements10
Eaton Vance AMT-Free Limited Maturity Municipals Fund as of March 31, 2009
PORTFOLIO OF INVESTMENTS CONT’D
| | | | | | | | | | | |
Principal Amount
| | | | | | | | |
| (000’s omitted) | | | Security | | Value | | | |
| |
| |
| |
| Insured-Electric Utilities — 4.9% |
| |
| $ | 1,000 | | | North Carolina Eastern Municipal Power Agency, (AGC), 5.25%, 1/1/19 | | $ | 1,042,660 | | | |
| | 1,000 | | | Northern Municipal Power Agency, MN, (AGC), 5.00%, 1/1/21 | | | 1,013,370 | | | |
| | 850 | | | South Carolina Public Service Authority, (FSA), 5.00%, 1/1/20 | | | 916,096 | | | |
| |
| |
| | | | | | | $ | 2,972,126 | | | |
| |
| |
| |
| |
| Insured-General Obligations — 5.9% |
| |
| $ | 1,000 | | | Massachusetts, (AMBAC), 5.50%, 12/1/23 | | $ | 1,139,090 | | | |
| | 750 | | | Miami-Dade County, FL, (Fire and Rescue Service District), (AMBAC), 5.25%, 4/1/17 | | | 813,217 | | | |
| | 500 | | | New York, NY, (FSA), 5.00%, 4/1/22 | | | 511,255 | | | |
| | 1,000 | | | Philadelphia, PA, (AGC), 5.50%, 7/15/16 | | | 1,097,670 | | | |
| |
| |
| | | | | | | $ | 3,561,232 | | | |
| |
| |
| |
| |
| Insured-Other Revenue — 3.0% |
| |
| $ | 490 | | | Louisiana Citizens Property, (AMBAC), 5.00%, 6/1/22 | | $ | 438,178 | | | |
| | 1,000 | | | New York, NY, Industrial Development Agency, (Yankee Stadium), (AGC), 0.00%, 3/1/12 | | | 900,060 | | | |
| | 500 | | | Saint Johns County, FL, Industrial Development Authority, (Professional Golf Hall of Fame), (NPFG), 5.00%, 9/1/20 | | | 511,470 | | | |
| |
| |
| | | | | | | $ | 1,849,708 | | | |
| |
| |
| |
| |
| Insured-Special Tax Revenue — 6.2% |
| |
| $ | 1,755 | | | Julington Creek Plantation, FL, Community Development District, (NPFG), 4.75%, 5/1/19 | | $ | 1,578,412 | | | |
| | 700 | | | Mesa, AZ, Street and Highway Revenue, (FSA), 5.00%, 7/1/20 | | | 759,570 | | | |
| | 1,000 | | | Puerto Rico Infrastructure Financing Authority, (AMBAC), 5.50%, 7/1/23 | | | 910,470 | | | |
| | 500 | | | Tamarac, FL, Sales Tax, (FGIC), (NPFG), 5.00%, 4/1/18 | | | 516,430 | | | |
| |
| |
| | | | | | | $ | 3,764,882 | | | |
| |
| |
| |
| |
| Insured-Transportation — 2.5% |
| |
| $ | 1,000 | | | Idaho Housing and Finance Association, (Grant and Revenue Anticipation Bonds Federal Highway Trust Fund), (AGC), 5.25%, 7/15/21 | | $ | 1,089,810 | | | |
| | 420 | | | New Orleans, LA, Aviation Board Revenue, (AGC), 6.00%, 1/1/23 | | | 425,519 | | | |
| |
| |
| | | | | | | $ | 1,515,329 | | | |
| |
| |
| |
| Insured-Water and Sewer — 5.7% |
| |
| $ | 1,000 | | | Bossier City, LA, Utilities Revenue, (BHAC), 5.00%, 10/1/21 | | $ | 1,068,440 | | | |
| | 1,000 | | | Portland, OR, Sewer System Revenue, (FSA), 5.00%, 6/15/23 | | | 1,070,430 | | | |
| | 1,000 | | | Sunrise, FL, Utilities Systems, (AMBAC), 5.50%, 10/1/18 | | | 1,069,040 | | | |
| | 250 | | | Tallahassee, FL, Consolidated Utility System, (FGIC), (NPFG), 5.50%, 10/1/19 | | | 279,915 | | | |
| |
| |
| | | | | | | $ | 3,487,825 | | | |
| |
| |
| |
| |
| Nursing Home — 0.4% |
| |
| $ | 235 | | | Orange County, FL, Health Facilities Authority, (Westminster Community Care Services), 6.50%, 4/1/12 | | $ | 231,776 | | | |
| |
| |
| | | | | | | $ | 231,776 | | | |
| |
| |
| |
| |
| Other Revenue — 2.1% |
| |
| $ | 965 | | | Buckeye, OH, Tobacco Settlement Financing Authority, 5.125%, 6/1/24 | | $ | 691,432 | | | |
| | 530 | | | Virginia Public Building Authority, Public Facilities Revenue, 5.25%, 8/1/20 | | | 600,257 | | | |
| |
| |
| | | | | | | $ | 1,291,689 | | | |
| |
| |
| |
| |
| Senior Living / Life Care — 0.5% |
| |
| $ | 590 | | | North Miami, FL, Health Care Facilities Authority, (Imperial Club), 6.125%, 1/1/42 | | $ | 329,916 | | | |
| |
| |
| | | | | | | $ | 329,916 | | | |
| |
| |
| |
| |
| Special Tax Revenue — 5.8% |
| |
| $ | 420 | | | Arbor Greene, FL, Community Development District, 5.00%, 5/1/19 | | $ | 365,308 | | | |
| | 310 | | | Concorde Estates, FL, Community Development District, (Capital Improvements), 5.00%, 5/1/11 | | | 164,861 | | | |
| | 80 | | | Covington Park, FL, Community Development District, (Capital Improvements), 5.00%, 5/1/21 | | | 74,065 | | | |
| | 150 | | | Dupree Lakes, FL, Community Development District, 5.00%, 11/1/10 | | | 103,848 | | | |
| | 230 | | | Dupree Lakes, FL, Community Development District, 5.00%, 5/1/12 | | | 144,601 | | | |
| | 130 | | | FishHawk, FL, Community Development District II, 5.125%, 11/1/09 | | | 104,169 | | | |
| | 60 | | | Longleaf, FL, Community Development District, 6.20%, 5/1/09 | | | 58,452 | | | |
| | 500 | | | Mahoning County, OH, (Sales Tax), 5.60%, 12/1/11 | | | 516,370 | | | |
| | 1,000 | | | Massachusetts Transportation Authority, 5.25%, 7/1/20 | | | 1,152,470 | | | |
See notes to financial statements11
Eaton Vance AMT-Free Limited Maturity Municipals Fund as of March 31, 2009
PORTFOLIO OF INVESTMENTS CONT’D
| | | | | | | | | | | |
Principal Amount
| | | | | | | | |
| (000’s omitted) | | | Security | | Value | | | |
| |
| |
| Special Tax Revenue (continued) |
| |
| | | | | | | | | | | |
| $ | 170 | | | New River, FL, Community Development District, (Capital Improvements), 5.00%, 5/1/13 | | $ | 70,611 | | | |
| | 275 | | | North Springs, FL, Improvement District, (Heron Bay), 7.00%, 5/1/19 | | | 268,301 | | | |
| | 140 | | | North Springs, FL, Improvement District, (Heron Bay North Assessment Area), 5.00%, 5/1/14 | | | 114,139 | | | |
| | 100 | | | Poinciana West, FL, West Community Development District, 5.875%, 5/1/22 | | | 77,882 | | | |
| | 100 | | | Sterling Hill, FL, Community Development District, (Capital Improvements), 5.10%, 5/1/11 | | | 52,089 | | | |
| | 115 | | | Sterling Hill, FL, Community Development District, (Capital Improvements), 5.50%, 11/1/10 | | | 100,213 | | | |
| | 520 | | | Tison’s Landing, FL, Community Development District, (Capital Improvements), 5.00%, 11/1/11(2) | | | 190,981 | | | |
| |
| |
| | | | | | | $ | 3,558,360 | | | |
| |
| |
| |
| |
| Transportation — 9.1% |
| |
| $ | 1,000 | | | Maryland Transportation Authority, 5.25%, 3/1/19 | | $ | 1,165,130 | | | |
| | 1,000 | | | Ohio Major New Street Infrastructure Project Revenue, 5.75%, 6/15/19 | | | 1,156,870 | | | |
| | 1,000 | | | Phoenix, AZ, Civic Improvements Corp., 5.00%, 7/1/21 | | | 1,047,450 | | | |
| | 1,000 | | | Port Authority of New York and New Jersey, 5.00%, 7/15/23 | | | 1,045,980 | | | |
| | 1,000 | | | Texas State Transportation Commission First Tier, 5.00%, 4/1/21 | | | 1,092,740 | | | |
| |
| |
| | | | | | | $ | 5,508,170 | | | |
| |
| |
| |
| |
| Water and Sewer — 7.9% |
| |
| $ | 750 | | | Austin, TX, Water and Wastewater System Revenue, 5.00%, 11/15/21 | | $ | 804,877 | | | |
| | 1,000 | | | Fairfax County, VA, Water Revenue, 5.25%, 4/1/23 | | | 1,136,810 | | | |
| | 600 | | | Massachusetts Water Pollution Abatement Trust, 5.25%, 8/1/19 | | | 696,462 | | | |
| | 970 | | | New York, NY, Municipal Water Finance, 5.00%, 6/15/21 | | | 1,019,451 | | | |
| | 1,000 | | | New York Environmental Facilities Corp., Clean Water, 5.50%, 6/15/16 | | | 1,164,320 | | | |
| |
| |
| | | | | | | $ | 4,821,920 | | | |
| |
| |
| | | |
| Total Tax-Exempt Investments — 97.9% | | |
| (identified cost $58,718,898) | | $ | 59,603,583 | | | |
| |
| |
| | | | | | | |
| Other Assets, Less Liabilities — 2.1% | | $ | 1,289,325 | | | |
| |
| |
| | | | | | | |
| Net Assets — 100.0% | | $ | 60,892,908 | | | |
| |
| |
Industry and sector classifications included in the Portfolio of Investments are unaudited.
AGC - Assured Guaranty Corp.
AMBAC - AMBAC Financial Group, Inc.
BHAC - Berkshire Hathaway Assurance Corp.
FGIC - Financial Guaranty Insurance Company
FSA - Financial Security Assurance, Inc.
NPFG - National Public Finance Guaranty Corp.
At March 31, 2009, the concentration of the Fund’s investments in the various states, determined as a percentage of net assets, is as follows:
| | | | | |
| Florida | | | 14.3% | |
| New York | | | 13.1% | |
| Others, representing less than 10% individually | | | 70.5% | |
The Fund invests primarily in debt securities issued by municipalities. The ability of the issuers of the debt securities to meet their obligations may be affected by economic developments in a specific industry or municipality. In order to reduce the risk associated with such economic developments, at March 31, 2009, 32.4% of total investments are backed by bond insurance of various financial institutions and financial guaranty assurance agencies. The aggregate percentage insured by an individual financial institution ranged from 1.3% to 9.3% of total investments.
| | |
| (1) | | Security (or a portion thereof) has been segregated to cover margin requirements on open financial futures contracts. |
| |
| (2) | | Defaulted bond. |
See notes to financial statements12
Eaton Vance National Limited Maturity Municipals Fund as of March 31, 2009
PORTFOLIO OF INVESTMENTS
| | | | | | | | | | | |
| Tax-Exempt Investments — 99.5% |
| |
Principal Amount
| | | | | | | | |
| (000’s omitted) | | | Security | | Value | | | |
| |
| |
| |
| Cogeneration — 0.7% |
| |
| $ | 1,620 | | | Carbon County, PA, Industrial Development Authority, (Panther Creek Partners), (AMT), 6.65%, 5/1/10 | | $ | 1,621,636 | | | |
| | 985 | | | Ohio Water Development Authority, Solid Waste Disposal, (Bay Shore Power), (AMT), 6.625%, 9/1/20 | | | 819,185 | | | |
| | 625 | | | Pennsylvania Economic Development Financing Authority, (Resource Recovery-Colver), (AMT), 5.125%, 12/1/15 | | | 497,000 | | | |
| | 1,600 | | | Western Generation Agency, OR,
(Wauna Cogeneration), (AMT), 5.00%, 1/1/12 | | | 1,474,336 | | | |
| |
| |
| | | | | | | $ | 4,412,157 | | | |
| |
| |
| |
| |
| Education — 1.1% |
| |
| $ | 2,000 | | | Illinois Educational Facility Authority,
(Art Institute of Chicago), 4.45%, 3/1/34 | | $ | 2,100,800 | | | |
| | 420 | | | Maryland Industrial Development Financing Authority, (Our Lady of Good Counsel High School), 5.50%, 5/1/20 | | | 321,254 | | | |
| | 250 | | | Maryland State Health and Higher Educational Facilities Authority, (Washington Christian Academy), 5.25%, 7/1/18 | | | 171,457 | | | |
| | 1,580 | | | Missouri State Health and Educational Facilities Authority, (St. Louis University), 5.50%, 10/1/16 | | | 1,824,600 | | | |
| | 1,700 | | | University of Illinois, 0.00%, 4/1/15 | | | 1,405,985 | | | |
| | 1,000 | | | University of Illinois, 0.00%, 4/1/16 | | | 786,690 | | | |
| |
| |
| | | | | | | $ | 6,610,786 | | | |
| |
| |
| |
| |
| Electric Utilities — 8.8% |
| |
| $ | 6,705 | | | California Department of Water Resource Power Supply, 5.00%, 5/1/22 | | $ | 6,854,052 | | | |
| | 6,500 | | | Chesterfield County, VA, Industrial Development Authority, (Virginia Electric and Power Co.), 5.50%, 10/1/09 | | | 6,512,675 | | | |
| | 2,000 | | | Connecticut State Development Authority, Pollution Control Revenue, (Connecticut Light and Power Co.), (AMT), 5.25% to 4/1/10 (Put Date), 5/1/31(1) | | | 2,003,560 | | | |
| | 2,900 | | | Delaware County, PA, Industrial Development Authority Pollution Control, (Peco Energy Co.), 4.00%, 12/1/12 | | | 2,975,023 | | | |
| | 2,000 | | | Municipal Electric Authority of Georgia, 5.25%, 1/1/21 | | | 2,102,000 | | | |
| | 2,500 | | | New Hampshire Business Finance Authority Pollution Control, (Central Maine Power Co.), 5.375%, 5/1/14 | | | 2,453,125 | | | |
| | 3,000 | | | New Hampshire Business Finance Authority Pollution Control, (United Illuminating Co.), (AMT), 7.125% to 2/1/12 (Put Date), 7/1/27 | | | 3,010,590 | | | |
| | 3,050 | | | New York Energy Research and Development Authority Facility, (AMT), 4.70% to 10/1/12 (Put Date), 6/1/36 | | | 3,050,061 | | | |
| | 1,000 | | | North Carolina Municipal Power Agency, (Catawba), 6.375%, 1/1/13 | | | 1,031,250 | | | |
| | 3,800 | | | Ohio Air Quality Development Authority, (Ohio Power Company), (AMT), 7.125% to 6/1/10 (Put Date), 6/1/41 | | | 3,819,646 | | | |
| | 5,000 | | | Pennsylvania Economic Development Financing Authority, Pollution Control, (PPL Electric Utility Corp.), 4.85% to 10/1/10 (Put Date), 10/1/23 | | | 5,072,650 | | | |
| | 3,000 | | | Rapides Finance Authority, LA, (Cleco Power LLC), (AMT), 6.00% to 10/1/11 (Put Date), 10/1/38 | | | 3,010,680 | | | |
| | 6,500 | | | Rapides Finance Authority, LA, (Cleco Power LLC), (AMT), 5.25% to 3/1/13 (Put Date), 11/1/37 | | | 6,193,525 | | | |
| | 1,250 | | | Sam Rayburn, TX, Municipal Power Agency, Power Supply System, 6.00%, 10/1/16 | | | 1,204,762 | | | |
| | 685 | | | San Antonio, TX, Electric and Natural Gas, 4.50%, 2/1/21 | | | 685,185 | | | |
| | 1,365 | | | Titus County, TX, Fresh Water Supply District, 4.50%, 7/1/11 | | | 1,353,548 | | | |
| | 2,500 | | | Wake County, NC, Industrial Facilities and Pollution Control Financing Authority, (Carolina Power and Light Co.), 5.375%, 2/1/17 | | | 2,575,750 | | | |
| |
| |
| | | | | | | $ | 53,908,082 | | | |
| |
| |
| |
| |
| Escrowed / Prerefunded — 3.0% |
| |
| $ | 1,500 | | | California Department of Water Resource Power Supply, Prerefunded to 5/1/12, 5.125%, 5/1/18 | | $ | 1,693,350 | | | |
| | 45 | | | Highlands County, FL, Health Facilities Authority, (Adventist Bolingbrook), Escrowed to Maturity, 5.00%, 11/15/16 | | | 52,569 | | | |
| | 65 | | | Highlands County, FL, Health Facilities Authority, (Adventist Bolingbrook), Prerefunded to 11/15/16, 5.125%, 11/15/20 | | | 75,417 | | | |
| | 85 | | | Highlands County, FL, Health Facilities Authority, (Adventist Bolingbrook), Prerefunded to 11/15/16, 5.125%, 11/15/22 | | | 98,623 | | | |
| | 3,000 | | | Massachusetts Turnpike Authority, Escrowed to Maturity, 5.00%, 1/1/20 | | | 3,441,870 | | | |
| | 65 | | | Mesquite, TX, Health Facilities Development, (Christian Care Centers), Escrowed to Maturity, 7.00%, 2/15/10 | | | 67,673 | | | |
| | 2,000 | | | Michigan Hospital Finance Authority, (Henry Ford Health System), Prerefunded to 3/1/13, 5.50%, 3/1/14 | | | 2,264,420 | | | |
| | 1,235 | | | New Jersey Educational Facilities Authority, (Steven’s Institute of Technology), Escrowed to Maturity, 5.00%, 7/1/12 | | | 1,377,630 | | | |
| | 1,195 | | | North Carolina Eastern Municipal Power Agency, Escrowed to Maturity, 4.00%, 1/1/18 | | | 1,288,712 | | | |
See notes to financial statements13
Eaton Vance National Limited Maturity Municipals Fund as of March 31, 2009
PORTFOLIO OF INVESTMENTS CONT’D
| | | | | | | | | | | |
Principal Amount
| | | | | | | | |
| (000’s omitted) | | | Security | | Value | | | |
| |
| |
| Escrowed / Prerefunded (continued) |
| |
| | | | | | | | | | | |
| $ | 2,000 | | | Orange County, FL, Health Facilities Authority, (Adventist Health System), Prerefunded to 11/15/12, 5.25%, 11/15/18 | | $ | 2,236,760 | | | |
| | 5,000 | | | Triborough Bridge and Tunnel Authority, NY, Escrowed to Maturity, 5.50%, 1/1/17 | | | 5,774,250 | | | |
| |
| |
| | | | | | | $ | 18,371,274 | | | |
| |
| |
| |
| |
| General Obligations — 5.4% |
| |
| $ | 1,000 | | | Chemeketa, OR, Community College District, 5.50%, 6/15/22 | | $ | 1,112,630 | | | |
| | 10,000 | | | Maryland State and Local Facilities, 5.00%, 8/1/18 | | | 11,482,100 | | | |
| | 1,035 | | | New York, NY, 5.625%, 12/1/13 | | | 1,101,478 | | | |
| | 15,320 | | | Salem-Keizer, OR, School District No. 24, 0.00%, 6/15/23 | | | 7,581,255 | | | |
| | 10,000 | | | Wake County, NC, 5.00%, 2/1/16 | | | 11,548,200 | | | |
| |
| |
| | | | | | | $ | 32,825,663 | | | |
| |
| |
| |
| |
| Health Care-Miscellaneous — 0.3% |
| |
| $ | 640 | | | Puerto Rico Infrastructure Financing Authority,
(Mepsi Campus Project), 5.60%, 10/1/14 | | $ | 590,643 | | | |
| | 1,200 | | | Puerto Rico Infrastructure Financing Authority,
(Mepsi Campus Project), 6.25%, 10/1/24 | | | 933,264 | | | |
| | 290 | | | Tax Revenue Exempt Securities Trust, Community Health Provider, (Pooled Loan Program Various States Trust Certificates), 6.00%, 12/1/36(2) | | | 297,323 | | | |
| |
| |
| | | | | | | $ | 1,821,230 | | | |
| |
| |
| |
| |
| Hospital — 8.7% |
| |
| $ | 6,500 | | | California Health Facilities Financing Authority, (Catholic Healthcare), 5.125%, 7/1/22 | | $ | 6,318,065 | | | |
| | 550 | | | Colorado Health Facilities Authority, (Parkview Episcopal Medical Center), 5.75%, 9/1/09 | | | 555,401 | | | |
| | 2,500 | | | Cuyahoga County, OH, (Cleveland Clinic Health System), 6.00%, 1/1/17 | | | 2,747,250 | | | |
| | 2,500 | | | Henderson, NV, Health Care Facilities,
(Catholic Healthcare West), 5.00%, 7/1/13 | | | 2,564,700 | | | |
| | 1,205 | | | Highlands County, FL, Health Facilities Authority, (Adventist Bolingbrook), 5.00%, 11/15/16 | | | 1,222,858 | | | |
| | 1,860 | | | Highlands County, FL, Health Facilities Authority, (Adventist Bolingbrook), 5.125%, 11/15/20 | | | 1,825,590 | | | |
| | 2,835 | | | Highlands County, FL, Health Facilities Authority, (Adventist Bolingbrook), 5.125%, 11/15/22 | | | 2,686,956 | | | |
| | 2,760 | | | Kent, MI, Hospital Finance Authority, (Spectrum Health), 5.50% to 1/15/15 (Put Date), 1/15/47 | | | 2,816,580 | | | |
| | 1,000 | | | Lexington County, SC, (Health Services, Inc.), 5.00%, 11/1/15 | | | 1,021,490 | | | |
| | 5,260 | | | Massachusetts Health and Educational Facilities Authority, (Caregroup, Inc.), 5.375%, 7/1/21 | | | 4,858,978 | | | |
| | 7,470 | | | Michigan Hospital Finance Authority,
(Ascension Health Care), 5.00% to 11/1/12
(Put Date), 11/1/27(3) | | | 7,858,266 | | | |
| | 1,000 | | | Michigan Hospital Finance Authority,
(Memorial Healthcare Center), 5.875%, 11/15/21 | | | 896,970 | | | |
| | 2,000 | | | Michigan Hospital Finance Authority,
(Oakwood Obligations Group), 5.00%, 7/15/12 | | | 2,003,220 | | | |
| | 1,750 | | | Michigan Hospital Finance Authority,
(Oakwood Obligations Group), 5.00%, 7/15/13 | | | 1,747,060 | | | |
| | 2,085 | | | New York Dormitory Authority,
(NYU Hospital Center), 5.25%, 7/1/24 | | | 1,481,455 | | | |
| | 1,740 | | | Saginaw, MI, Hospital Finance Authority, 5.125%, 7/1/22 | | | 1,611,779 | | | |
| | 2,000 | | | South Carolina Jobs Economic Development Authority, (Palmetto Health Alliance), 6.00%, 8/1/12 | | | 2,032,140 | | | |
| | 6,785 | | | South Miami, FL, Health Facilities Authority,
(Baptist Health), 5.00%, 8/15/15 | | | 6,964,328 | | | |
| | 1,000 | | | Sullivan County, TN, Health Educational and Housing Facilities Board, (Wellmont Health System), 5.00%, 9/1/19 | | | 722,010 | | | |
| | 1,000 | | | University of Kansas Hospital Authority, 5.00%, 9/1/16 | | | 1,060,440 | | | |
| | 250 | | | University of Kansas Hospital Authority, 5.00%, 9/1/17 | | | 262,542 | | | |
| |
| |
| | | | | | | $ | 53,258,078 | | | |
| |
| |
| |
| |
| Housing — 0.5% |
| |
| $ | 2,500 | | | California Housing Finance Agency, (AMT), 4.75%, 8/1/21 | | $ | 2,250,600 | | | |
| | 600 | | | Georgia Private Colleges and Universities Authority, Student Housing Revenue, (Mercer Housing Corp.), 6.00%, 6/1/31 | | | 445,872 | | | |
| | 640 | | | Sandoval County, NM, Multifamily, 6.00%, 5/1/32(2) | | | 450,567 | | | |
| | 95 | | | Texas Student Housing Corp., (University of North Texas), 3.281%, 7/1/49(4) | | | 80,974 | | | |
| |
| |
| | | | | | | $ | 3,228,013 | | | |
| |
| |
| |
| |
| Industrial Development Revenue — 9.0% |
| |
| $ | 400 | | | Austin, TX, (Cargoport Development LLC), (AMT), 8.30%, 10/1/21 | | $ | 360,604 | | | |
| | 1,500 | | | Dallas-Fort Worth, TX, International Airport Facilities Improvements Corp., (AMT), 9.00%, 5/1/29 | | | 782,685 | | | |
| | 3,000 | | | De Soto Parish, LA, (International Paper Co.), (AMT), 5.00%, 11/1/18 | | | 2,022,510 | | | |
| | 860 | | | Denver, CO, City and County Special Facilities, (United Airlines), (AMT), 5.25%, 10/1/32 | | | 387,568 | | | |
| | 1,905 | | | Denver, CO, City and County Special Facilities, (United Airlines), (AMT), 5.75%, 10/1/32 | | | 910,933 | | | |
See notes to financial statements14
Eaton Vance National Limited Maturity Municipals Fund as of March 31, 2009
PORTFOLIO OF INVESTMENTS CONT’D
| | | | | | | | | | | |
Principal Amount
| | | | | | | | |
| (000’s omitted) | | | Security | | Value | | | |
| |
| |
| Industrial Development Revenue (continued) |
| |
| | | | | | | | | | | |
| $ | 4,400 | | | Gilliam County, OR, Solid Waste Revenue, 4.15% to 5/1/09 (Put Date), 8/1/25 | | $ | 4,392,036 | | | |
| | 2,000 | | | Gulf Coast, TX, Waste Disposal Authority, (Waste Management), (AMT), 4.55%, 4/1/12 | | | 1,880,080 | | | |
| | 1,630 | | | Houston, TX, Industrial Development Corp., (AMT), 6.375%, 1/1/23 | | | 1,270,259 | | | |
| | 9,990 | | | Liberty Development Corp., NY, (Goldman Sachs Group, Inc.), 5.50%, 10/1/37 | | | 8,523,468 | | | |
| | 1,000 | | | Massachusetts Development Finance Agency, (Waste Management, Inc.), (AMT), 6.90% to 12/1/09 (Put Date), 12/1/29 | | | 1,004,220 | | | |
| | 1,000 | | | Michigan Strategic Fund, (Waste Management, Inc.), (AMT), 4.50%, 12/1/13 | | | 908,320 | | | |
| | 5,650 | | | Mission, TX, Economic Development Corp., (Allied Waste Industries), (AMT), 5.20%, 4/1/18 | | | 4,909,228 | | | |
| | 1,430 | | | Mississippi Business Finance Corp., (Air Cargo), (AMT), 7.25%, 7/1/34 | | | 1,070,927 | | | |
| | 1,440 | | | New Jersey Economic Development Authority, (Continental Airlines), (AMT), 6.25%, 9/15/19 | | | 965,880 | | | |
| | 3,000 | | | New York, NY, Industrial Development Agency, (American Airlines, Inc. – JFK International Airport), (AMT), 7.50%, 8/1/16 | | | 2,373,300 | | | |
| | 2,750 | | | New York, NY, Industrial Development Agency, (Terminal One Group), (AMT), 5.50%, 1/1/14 | | | 2,624,270 | | | |
| | 5,000 | | | New York, NY, Industrial Development Agency, (Terminal One Group), (AMT), 5.50%, 1/1/15 | | | 4,702,200 | | | |
| | 1,850 | | | Ohio Water Development Authority, Solid Waste Disposal, (Allied Waste North America, Inc.), (AMT), 5.15%, 7/15/15 | | | 1,651,606 | | | |
| | 10,175 | | | St. John Baptist Parish, LA, (Marathon Oil Corp.), 5.125%, 6/1/37 | | | 7,127,994 | | | |
| | 2,825 | | | Toledo-Lucas County, OH, Port Authority, (Cargill, Inc.), 4.50%, 12/1/15 | | | 2,910,965 | | | |
| | 7,605 | | | Virgin Islands Public Financing Authority, (HOVENSA LLC), (AMT), 4.70%, 7/1/22 | | | 4,614,334 | | | |
| |
| |
| | | | | | | $ | 55,393,387 | | | |
| |
| |
| |
| |
| Insured-Education — 1.2% |
| |
| $ | 2,025 | | | New York Dormitory Authority, (Educational Housing Services), (AMBAC), 5.25%, 7/1/21 | | $ | 1,934,948 | | | |
| | 5,150 | | | New York Dormitory Authority, (Rochester Institute of Technology), (AMBAC), 5.25%, 7/1/22 | | | 5,213,397 | | | |
| | 500 | | | Southern Illinois University, Housing and Auxiliary Facilities, (NPFG), 0.00%, 4/1/17 | | | 355,845 | | | |
| |
| |
| | | | | | | $ | 7,504,190 | | | |
| |
| |
| |
| Insured-Electric Utilities — 4.1% |
| |
| $ | 5,435 | | | California Pollution Control Financing Authority, (Pacific Gas and Electric), (FGIC), 4.75%, 12/1/23 | | $ | 4,485,940 | | | |
| | 750 | | | California Pollution Control Financing Authority, (Pacific Gas and Electric), (NPFG), (AMT), 5.35%, 12/1/16 | | | 727,530 | | | |
| | 8,000 | | | Hillsborough County, FL, Industrial Development Authority, Pollution Control Revenue,
(Tampa Electric Co.), (AMBAC), 5.00% to 3/15/12 (Put Date), 12/1/34 | | | 8,048,880 | | | |
| | 3,000 | | | Illinois Municipal Electric Agency Power Supply, (FGIC), (NPFG), 5.25%, 2/1/16 | | | 3,292,020 | | | |
| | 4,225 | | | Long Island Power Authority, NY, (FGIC), (NPFG), 5.00%, 12/1/19 | | | 4,252,294 | | | |
| | 3,465 | | | New Hampshire Business Finance Authority Pollution Control, (Public Service of New Hampshire), (NPFG), (AMT), 4.75%, 5/1/21 | | | 2,868,777 | | | |
| | 400 | | | Piedmont, SC, Municipal Power Agency, (NPFG), 5.00%, 1/1/15 | | | 401,872 | | | |
| | 1,000 | | | Puerto Rico Electric Power Authority, (XLCA), 5.375%, 7/1/18 | | | 957,390 | | | |
| |
| |
| | | | | | | $ | 25,034,703 | | | |
| |
| |
| |
| |
| Insured-Escrowed / Prerefunded — 2.6% |
| |
| $ | 425 | | | Metropolitan Transportation Authority, NY, Commuter Facilities, (AMBAC), Escrowed to Maturity, 5.00%, 7/1/20 | | $ | 428,770 | | | |
| | 1,000 | | | Metropolitan Transportation Authority, NY, Transit Facilities, (FGIC), Prerefunded to 10/1/15, 4.50%, 4/1/18 | | | 1,142,500 | | | |
| | 3,000 | | | Montgomery, AL, BMC Special Care Facilities Financing Authority, (Baptist Health Montgomery), (NPFG), Prerefunded to 11/15/14, 5.00%, 11/15/17 | | | 3,432,150 | | | |
| | 2,000 | | | Montgomery, AL, BMC Special Care Facilities Financing Authority, (Baptist Health Montgomery), (NPFG), Prerefunded to 11/15/14, 5.00%, 11/15/18 | | | 2,288,100 | | | |
| | 1,000 | | | Montgomery, AL, BMC Special Care Facilities Financing Authority, (Baptist Health Montgomery), (NPFG), Prerefunded to 11/15/14, 5.00%, 11/15/22 | | | 1,144,050 | | | |
| | 5,000 | | | Montgomery, AL, BMC Special Care Facilities Financing Authority, (Baptist Health Montgomery), (NPFG), Prerefunded to 11/15/14, 5.00%, 11/15/24 | | | 5,720,250 | | | |
| | 1,400 | | | Springfield, OH, City School District, Clark County, (FGIC), Prerefunded to 12/1/11, 5.00%, 12/1/17 | | | 1,570,310 | | | |
| |
| |
| | | | | | | $ | 15,726,130 | | | |
| |
| |
| |
See notes to financial statements15
Eaton Vance National Limited Maturity Municipals Fund as of March 31, 2009
PORTFOLIO OF INVESTMENTS CONT’D
| | | | | | | | | | | |
Principal Amount
| | | | | | | | |
| (000’s omitted) | | | Security | | Value | | | |
| |
| |
| |
| Insured-General Obligations — 7.9% |
| |
| $ | 8,000 | | | Boston, MA, (NPFG), 0.125%, 3/1/22 | | $ | 4,459,440 | | | |
| | 500 | | | Hillsborough Township, NJ, School District, (FSA), 5.375%, 10/1/18 | | | 582,775 | | | |
| | 5,000 | | | Jackson Township, NJ, School District, (Baptist Healthcare Systems), (NPFG), 5.25%, 6/15/23 | | | 5,609,600 | | | |
| | 1,055 | | | Linn County, OR, Community School District No. 9, (Lebanon), (FGIC), (NPFG), 5.25%, 6/15/21 | | | 1,201,350 | | | |
| | 625 | | | Linn County, OR, Community School District No. 9, (Lebanon), (FGIC), (NPFG), 5.25%, 6/15/22 | | | 704,300 | | | |
| | 10,000 | | | Miami, FL, (Homeland Defense), (NPFG), 5.00%, 1/1/19 | | | 10,517,200 | | | |
| | 5,580 | | | New Orleans, LA, (NPFG), 5.25%, 12/1/15 | | | 5,494,961 | | | |
| | 3,440 | | | Philadelphia, PA, (AGC), 5.25%, 7/15/15 | | | 3,758,922 | | | |
| | 5,000 | | | Puerto Rico, (AGC), 5.00%, 7/1/16 | | | 5,032,850 | | | |
| | 2,150 | | | Springfield, OH, City School District, Clark County, (AMBAC), 4.30%, 12/1/14 | | | 2,264,186 | | | |
| | 1,000 | | | St. Louis, MO, Board of Education, (FSA), 0.00%, 4/1/16 | | | 792,120 | | | |
| | 10,000 | | | Washington, (AMBAC), 0.00%, 12/1/22 | | | 5,252,000 | | | |
| | 4,275 | | | West Virginia, (FGIC), (NPFG), 0.00%, 11/1/21 | | | 2,432,988 | | | |
| |
| |
| | | | | | | $ | 48,102,692 | | | |
| |
| |
| |
| |
| Insured-Hospital — 1.7% |
| |
| $ | 1,000 | | | Harris County, TX, Hospital District, (NPFG), 5.00%, 2/15/11 | | $ | 1,044,300 | | | |
| | 1,000 | | | Harris County, TX, Hospital District, (NPFG), 5.00%, 2/15/12 | | | 1,056,900 | | | |
| | 1,000 | | | Harris County, TX, Hospital District, (NPFG), 5.00%, 2/15/13 | | | 1,059,640 | | | |
| | 500 | | | Harris County, TX, Hospital District, (NPFG), 5.00%, 2/15/14 | | | 526,685 | | | |
| | 3,555 | | | Waco, TX, Health Facilities Development Corp., (Hillcrest Health System), (NPFG), 5.00%, 8/1/19 | | | 3,452,829 | | | |
| | 3,745 | | | Waco, TX, Health Facilities Development Corp., (Hillcrest Health System), (NPFG), 5.00%, 8/1/20 | | | 3,446,561 | | | |
| |
| |
| | | | | | | $ | 10,586,915 | | | |
| |
| |
| |
| |
| Insured-Lease Revenue / Certificates of Participation — 0.7% |
| |
| $ | 2,000 | | | New York Dormitory Authority, (SUNY), (XLCA), 5.25% to 7/1/13 (Put Date), 7/1/32 | | $ | 2,110,300 | | | |
| | 2,100 | | | Texas Public Finance Authority, (NPFG), 0.00%, 2/1/12 | | | 1,942,143 | | | |
| |
| |
| | | | | | | $ | 4,052,443 | | | |
| |
| |
| |
| Insured-Other Revenue — 2.9% |
| |
| $ | 10,285 | | | Citizens Property Insurance Corp., FL,
(Senior Secured High Risk Account), (NPFG), 5.00%, 3/1/13 | | $ | 10,399,267 | | | |
| | 4,905 | | | Louisiana Citizens Property, (AMBAC), 5.00%, 6/1/22 | | | 4,386,247 | | | |
| | 1,000 | | | Louisiana Public Facility Authority, (Roman Catholic Church of New Orleans), (CIFG), 5.00%, 7/1/19 | | | 940,210 | | | |
| | 1,000 | | | Missouri Development Finance Board Cultural Facility, (Nelson Gallery Foundation), (NPFG), 5.25%, 12/1/14 | | | 1,074,390 | | | |
| | 1,250 | | | New York, NY, Industrial Development Agency, (Queens Baseball Stadium Project), (AMBAC), 5.00%, 1/1/23 | | | 1,132,875 | | | |
| |
| |
| | | | | | | $ | 17,932,989 | | | |
| |
| |
| |
| |
| Insured-Pooled Loans — 2.8% |
| |
| $ | 5,000 | | | Louisiana Public Facility Authority,
(Hurricane Recovery), (AMBAC), 5.00%, 6/1/19 | | $ | 5,017,300 | | | |
| | 14,205 | | | Massachusetts Educational Financing Authority, (AMBAC), (AMT), 4.60%, 1/1/22 | | | 12,151,241 | | | |
| |
| |
| | | | | | | $ | 17,168,541 | | | |
| |
| |
| |
| |
| Insured-Special Tax Revenue — 5.6% |
| |
| $ | 3,000 | | | Arlington, TX, (Dallas Cowboys), (NPFG), 5.00%, 8/15/34 | | $ | 3,019,830 | | | |
| | 7,020 | | | Denver, CO, Convention Center, (XLCA), 5.25%, 12/1/22 | | | 5,563,350 | | | |
| | 1,000 | | | Denver, CO, Convention Center, (XLCA), 5.25%, 12/1/23 | | | 782,700 | | | |
| | 10,000 | | | Garden State Preservation Trust, NJ, Open Space and Farmland, (FSA), 5.25%, 11/1/20 | | | 11,383,400 | | | |
| | 2,770 | | | Julington Creek Plantation, FL, Community Development District, (NPFG), 4.75%, 5/1/19 | | | 2,491,283 | | | |
| | 4,920 | | | Massachusetts Special Obligations, (FGIC), (NPFG), 5.50%, 1/1/29 | | | 5,008,855 | | | |
| | 5,000 | | | Massachusetts Special Obligations, (FSA), 5.50%, 6/1/21 | | | 5,845,600 | | | |
| |
| |
| | | | | | | $ | 34,095,018 | | | |
| |
| |
| |
| |
| Insured-Transportation — 7.0% |
| |
| $ | 2,295 | | | Chicago, IL, O’Hare International Airport, (NPFG), (AMT), 5.75%, 1/1/17 | | $ | 2,289,102 | | | |
| | 1,000 | | | Denver, CO, City and County Airport, (FSA), (AMT), 5.00%, 11/15/11 | | | 1,027,350 | | | |
| | 1,000 | | | Houston, TX, Airport System, (FGIC), (NPFG), (AMT), 5.50%, 7/1/12 | | | 1,034,150 | | | |
| | 1,045 | | | Idaho Housing and Finance Association, (Grant and Revenue Anticipation Bonds Federal Highway Trust Fund), (AGC), 5.25%, 7/15/21 | | | 1,138,851 | | | |
See notes to financial statements16
Eaton Vance National Limited Maturity Municipals Fund as of March 31, 2009
PORTFOLIO OF INVESTMENTS CONT’D
| | | | | | | | | | | |
Principal Amount
| | | | | | | | |
| (000’s omitted) | | | Security | | Value | | | |
| |
| |
| Insured-Transportation (continued) |
| |
| | | | | | | | | | | |
| $ | 1,000 | | | Idaho Housing and Finance Association, (Grant and Revenue Anticipation Bonds Federal Highway Trust Fund), (AGC), 5.25%, 7/15/25 | | $ | 1,049,770 | | | |
| | 2,000 | | | Kenton County, KY, Airport, (Cincinnati/Northern Kentucky), (NPFG), (AMT), 5.625%, 3/1/13 | | | 2,056,640 | | | |
| | 2,500 | | | Massachusetts Port Authority, (Delta Airlines), (AMBAC), (AMT), 5.50%, 1/1/15 | | | 1,765,125 | | | |
| | 8,125 | | | Miami-Dade County, FL, Aviation, (NPFG), (AMT), 5.25%, 10/1/15 | | | 7,987,850 | | | |
| | 1,000 | | | Miami-Dade County, FL, Aviation, (Miami International Airport), (FGIC), (NPFG), (AMT), 5.50%, 10/1/13 | | | 1,014,500 | | | |
| | 2,000 | | | Minneapolis and St. Paul, MN, Metropolitan Airport Commission, (FGIC), (NPFG), (AMT), 5.25%, 1/1/11 | | | 2,011,120 | | | |
| | 1,430 | | | Minneapolis and St. Paul, MN, Metropolitan Airport Commission, (FGIC), (NPFG), (AMT), 6.00%, 1/1/11 | | | 1,472,886 | | | |
| | 5,000 | | | New Jersey Transportation Trust Fund Authority, (FGIC), (NPFG), 5.50%, 12/15/20(5) | | | 5,367,800 | | | |
| | 1,040 | | | New Orleans, LA, Aviation Board Revenue, (AGC), 6.00%, 1/1/23 | | | 1,053,666 | | | |
| | 1,000 | | | Ohio Turnpike Commission, (FGIC), (NPFG), 5.50%, 2/15/18 | | | 1,142,190 | | | |
| | 1,000 | | | Port Seattle, WA, (NPFG), (AMT), 6.00%, 2/1/11 | | | 1,039,460 | | | |
| | 9,285 | | | St. Louis, MO, Lambert-St. Louis International Airport, (FSA), 5.00%, 7/1/20 | | | 9,447,580 | | | |
| | 2,000 | | | Wayne Charter County, MI, Metropolitan Airport, (FGIC), (NPFG), (AMT), 5.50%, 12/1/15 | | | 2,012,020 | | | |
| |
| |
| | | | | | | $ | 42,910,060 | | | |
| |
| |
| |
| |
| Insured-Water and Sewer — 1.0% |
| |
| $ | 3,125 | | | Kansas City, MO, Water Revenue, (BHAC), 5.00%, 12/1/23 | | $ | 3,324,844 | | | |
| | 2,425 | | | Sunrise, FL, Utilities Systems, (AMBAC), 5.50%, 10/1/18 | | | 2,592,422 | | | |
| |
| |
| | | | | | | $ | 5,917,266 | | | |
| |
| |
| |
| |
| Lease Revenue / Certificates of Participation — 2.4% |
| |
| $ | 5,265 | | | Charleston, SC, Educational Excellence Finance Corp., (Charleston County School District Project), 5.00%, 12/1/20 | | $ | 5,380,672 | | | |
| | 2,240 | | | Lexington County, SC, One School Facilities Corp., 5.00%, 12/1/20 | | | 2,269,031 | | | |
| | 1,945 | | | Lexington County, SC, One School Facilities Corp., 5.00%, 12/1/22 | | | 1,934,205 | | | |
| | 3,385 | | | New Jersey Economic Development Authority,
(School Facilities Construction), 5.50%, 9/1/19 | | | 3,704,307 | | | |
| | 1,755 | | | Newberry, SC, (Newberry County School District Project), 5.25%, 12/1/24 | | | 1,580,307 | | | |
| |
| |
| | | | | | | $ | 14,868,522 | | | |
| |
| |
| |
| |
| Nursing Home — 0.3% |
| |
| $ | 2,565 | | | Connecticut State Development Authority,
(Alzheimers Resource Center), 5.20%, 8/15/17 | | $ | 2,015,449 | | | |
| |
| |
| | | | | | | $ | 2,015,449 | | | |
| |
| |
| |
| |
| Other Revenue — 3.8% |
| |
| $ | 1,000 | | | Arizona Health Facilities Authority,
(Blood Systems, Inc.), 5.00%, 4/1/21 | | $ | 955,650 | | | |
| | 890 | | | Barona, CA, (Band of Mission Indians), 8.25%, 1/1/20(2) | | | 722,511 | | | |
| | 4,490 | | | Buckeye, OH, Tobacco Settlement Financing Authority, 5.125%, 6/1/24 | | | 3,217,130 | | | |
| | 1,220 | | | Central Falls, RI, Detention Facility, 7.25%, 7/15/35 | | | 830,588 | | | |
| | 400 | | | Mohegan Tribe, CT, Gaming Authority, 5.375%, 1/1/11(2) | | | 340,404 | | | |
| | 4,500 | | | Non-Profit Preferred Funding Trust, Various States, 4.47%, 9/15/37(2) | | | 2,862,090 | | | |
| | 5,130 | | | Northern Tobacco Securitization Corp., AK, 4.625%, 6/1/23 | | | 4,210,396 | | | |
| | 195 | | | Otero County, NM, Jail Project Revenue, 5.50%, 4/1/13 | | | 176,120 | | | |
| | 700 | | | Otero County, NM, Jail Project Revenue, 5.75%, 4/1/18 | | | 579,054 | | | |
| | 5,250 | | | Seminole Tribe of Florida, 5.75%, 10/1/22(2) | | | 4,042,343 | | | |
| | 1,700 | | | Silicon Valley Tobacco Securitization Authority, CA, 0.00%, 6/1/36 | | | 108,766 | | | |
| | 4,580 | | | Tennessee Energy Acquisition Corp., 5.25%, 9/1/17 | | | 3,691,617 | | | |
| | 1,415 | | | White Earth Band of Chippewa Indians, MN, 6.375%, 12/1/11(2) | | | 1,279,868 | | | |
| | 265 | | | Willacy County, TX, Local Government Corp., 6.00%, 9/1/10 | | | 256,411 | | | |
| |
| |
| | | | | | | $ | 23,272,948 | | | |
| |
| |
| |
| |
| Pooled Loans — 0.5% |
| |
| $ | 1,120 | | | Idaho Board Bank Authority, 5.00%, 9/15/21 | | $ | 1,201,144 | | | |
| | 1,300 | | | Ohio Economic Development, (Ohio Enterprise Bond Fund), (AMT), 4.60%, 6/1/20 | | | 1,353,508 | | | |
| | 790 | | | Ohio Economic Development, (Ohio Enterprise Bond Fund), (AMT), 5.25%, 12/1/15 | | | 817,895 | | | |
| |
| |
| | | | | | | $ | 3,372,547 | | | |
| |
| |
| |
See notes to financial statements17
Eaton Vance National Limited Maturity Municipals Fund as of March 31, 2009
PORTFOLIO OF INVESTMENTS CONT’D
| | | | | | | | | | | |
Principal Amount
| | | | | | | | |
| (000’s omitted) | | | Security | | Value | | | |
| |
| |
| |
| Senior Living / Life Care — 1.0% |
| |
| $ | 1,105 | | | Arizona Health Facilities Authority,
(Care Institute, Inc. – Mesa), 7.625%, 1/1/49(6) | | $ | 742,472 | | | |
| | 1,000 | | | California Statewide Communities Development Authority, (Senior Living-Presbyterian Homes), 4.50%, 11/15/16 | | | 876,260 | | | |
| | 500 | | | Kansas City, MO, Industrial Development Revenue, (Kingswood Manor), 5.80%, 11/15/17 | | | 400,855 | | | |
| | 200 | | | Maryland Health and Higher Educational Facilities Authority, (Edenwald), 4.85%, 1/1/13 | | | 185,922 | | | |
| | 1,350 | | | Maryland Health and Higher Educational Facilities Authority, (King Farm Presbyterian Community), 5.00%, 1/1/17 | | | 1,033,884 | | | |
| | 1,150 | | | Massachusetts Development Finance Agency, (Linden Ponds, Inc.), 5.50%, 11/15/22 | | | 785,301 | | | |
| | 640 | | | Massachusetts Development Finance Agency, (Volunteers of America), 5.00%, 11/1/17 | | | 512,614 | | | |
| | 750 | | | New Jersey Economic Development Authority, (Seabrook Village, Inc.), 5.00%, 11/15/12 | | | 707,805 | | | |
| | 495 | | | North Miami, FL, Health Care Facilities Authority, (Imperial Club), 6.125%, 1/1/42 | | | 276,794 | | | |
| | 460 | | | St. Joseph County, IN, Holy Cross Village, 5.55%, 5/15/19 | | | 361,638 | | | |
| |
| |
| | | | | | | $ | 5,883,545 | | | |
| |
| |
| |
| |
| Solid Waste — 1.0% |
| |
| $ | 4,000 | | | Massachusetts Industrial Finance Agency, (Ogden Haverhill), (AMT), 5.50%, 12/1/13 | | $ | 3,632,680 | | | |
| | 3,000 | | | Niagara County, NY, Industrial Development Agency, (American Ref-Fuel Co., LLC), (AMT), 5.55% to 11/15/13 (Put Date), 11/15/24 | | | 2,775,270 | | | |
| |
| |
| | | | | | | $ | 6,407,950 | | | |
| |
| |
| |
| |
| Special Tax Revenue — 3.1% |
| |
| $ | 895 | | | Arbor Greene, FL, Community Development District, 5.00%, 5/1/19 | | $ | 778,453 | | | |
| | 250 | | | Black Hawk, CO, Device Tax, 5.00%, 12/1/18 | | | 213,468 | | | |
| | 1,154 | | | Bridgeville, DE, (Heritage Shores Special Development District), 5.125%, 7/1/35 | | | 751,900 | | | |
| | 265 | | | Concorde Estates, FL, Community Development District, (Capital Improvements), 5.00%, 5/1/11 | | | 140,930 | | | |
| | 245 | | | Covington Park, FL, Community Development District, (Capital Improvements), 5.00%, 5/1/21 | | | 226,823 | | | |
| | 2,000 | | | Detroit, MI, Downtown Development Authority Tax Increment, 0.00%, 7/1/21 | | | 936,600 | | | |
| | 530 | | | Dupree Lakes, FL, Community Development District, 5.00%, 11/1/10 | | | 366,930 | | | |
| | 1,955 | | | Dupree Lakes, FL, Community Development District, 5.00%, 5/1/12 | | | 1,229,108 | | | |
| | 685 | | | FishHawk, FL, Community Development District II, 5.125%, 11/1/09 | | | 548,891 | | | |
| | 250 | | | Frederick County, MD, Urbana Community Development Authority, 6.625%, 7/1/25 | | | 189,810 | | | |
| | 45 | | | Longleaf, FL, Community Development District, 6.20%, 5/1/09 | | | 43,839 | | | |
| | 3,750 | | | Mahoning County, OH, (Sales Tax), 5.00%, 12/1/10 | | | 3,789,637 | | | |
| | 2,000 | | | Mahoning County, OH, (Sales Tax), 5.60%, 12/1/11 | | | 2,065,480 | | | |
| | 3,000 | | | New Jersey Economic Development Authority, (Cigarette Tax), 5.50%, 6/15/16 | | | 2,734,110 | | | |
| | 1,130 | | | New River, FL, Community Development District, (Capital Improvements), 5.00%, 5/1/13 | | | 469,357 | | | |
| | 840 | | | North Springs, FL, Improvement District, (Heron Bay North Assessment Area), 5.00%, 5/1/14 | | | 684,835 | | | |
| | 375 | | | Park Meadows, CO, Business Improvement District, 5.00%, 12/1/17 | | | 297,660 | | | |
| | 1,335 | | | Poinciana West, FL, West Community Development District, 5.875%, 5/1/22 | | | 1,039,725 | | | |
| | 1,390 | | | Sterling Hill, FL, Community Development District, (Capital Improvements), 5.10%, 5/1/11 | | | 724,037 | | | |
| | 350 | | | Sterling Hill, FL, Community Development District, (Capital Improvements), 5.50%, 11/1/10 | | | 304,997 | | | |
| | 2,960 | | | Tison’s Landing, FL, Community Development District, (Capital Improvements), 5.00%, 11/1/11(7) | | | 1,087,119 | | | |
| | 125 | | | Tiverton, RI, Obligation Tax Increment, (Mount Hope Bay Village), 6.00%, 5/1/09 | | | 125,080 | | | |
| |
| |
| | | | | | | $ | 18,748,789 | | | |
| |
| |
| |
| |
| Transportation — 8.1% |
| |
| $ | 1,140 | | | Branson, MO, Regional Airport Transportation Development District, (Branson Airport LLC), (AMT), 6.00%, 7/1/25 | | $ | 722,646 | | | |
| | 3,510 | | | Branson, MO, Regional Airport Transportation Development District, (Branson Airport LLC), (AMT), 6.00%, 7/1/37 | | | 1,995,610 | | | |
| | 3,000 | | | Georgia State Road and Tollway Authority, (Federal Highway Grant Anticipation Revenue Bonds), 5.00%, 6/1/21 | | | 3,181,710 | | | |
| | 7,700 | | | Idaho Housing and Finance Association, (Grant and Revenue Anticipation Bonds Federal Highway Trust Fund), 4.75%, 7/15/19 | | | 8,137,437 | | | |
| | 2,500 | | | Louisiana Offshore Terminal Authority, Deepwater Port Revenue, (Loop, LLC), 5.25%, 9/1/15 | | | 2,577,875 | | | |
| | 10,000 | | | Maryland Transportation Authority, 5.00%, 3/1/18 | | | 11,363,600 | | | |
| | 5,000 | | | Metropolitan Airport Authority System, DC, (AMT), 5.50%, 10/1/19 | | | 5,062,700 | | | |
| | 5,000 | | | New Jersey Transportation Trust Fund Authority, 5.25%, 12/15/21 | | | 5,228,300 | | | |
See notes to financial statements18
Eaton Vance National Limited Maturity Municipals Fund as of March 31, 2009
PORTFOLIO OF INVESTMENTS CONT’D
| | | | | | | | | | | |
Principal Amount
| | | | | | | | |
| (000’s omitted) | | | Security | | Value | | | |
| |
| |
| Transportation (continued) |
| |
| | | | | | | | | | | |
| $ | 1,000 | | | Port Authority of New York and New Jersey, 5.375%, 3/1/28 | | $ | 1,045,240 | | | |
| | 10,000 | | | Port Authority of New York and New Jersey, (AMT), 5.25%, 9/15/23 | | | 10,016,000 | | | |
| |
| |
| | | | | | | $ | 49,331,118 | | | |
| |
| |
| |
| |
| Water and Sewer — 4.3% |
| |
| $ | 5,000 | | | Fairfax County, VA, Water Authority, 5.00%, 4/1/18(8) | | $ | 5,684,850 | | | |
| | 3,000 | | | Massachusetts Water Pollution Abatement Trust, 5.00%, 8/1/25 | | | 3,255,480 | | | |
| | 10,000 | | | Virginia State Resources Authority, Clean Water Revenue, (Revolving Fund), 5.00%, 10/1/19 | | | 11,244,800 | | | |
| | 5,000 | | | Virginia State Resources Authority, Clean Water Revenue, (Revolving Fund), 5.50%, 10/1/19 | | | 5,941,100 | | | |
| |
| |
| | | | | | | $ | 26,126,230 | | | |
| |
| |
| | | |
| Total Tax-Exempt Investments — 99.5% | | |
| (identified cost $642,752,245) | | $ | 608,886,715 | | | |
| |
| |
| | | | | | | |
| Other Assets, Less Liabilities — 0.5% | | $ | 3,005,799 | | | |
| |
| |
| | | | | | | |
| Net Assets — 100.0% | | $ | 611,892,514 | | | |
| |
| |
Industry and sector classifications included in the Portfolio of Investments are unaudited.
AGC - Assured Guaranty Corp.
AMBAC - AMBAC Financial Group, Inc.
AMT - Interest earned from these securities may be considered a tax preference item for purposes of the Federal Alternative Minimum Tax.
BHAC - Berkshire Hathaway Assurance Corp.
CIFG - CIFG Assurance North America, Inc.
FGIC - Financial Guaranty Insurance Company
FSA - Financial Security Assurance, Inc.
NPFG - National Public Finance Guaranty Corp.
SUNY - State University of New York
XLCA - XL Capital Assurance, Inc.
At March 31, 2009, the concentration of the Fund’s investments in the various states, determined as a percentage of net assets, is as follows:
| | | | | |
| Florida | | | 11.5% | |
| Others, representing less than 10% individually | | | 88.0% | |
The Fund invests primarily in debt securities issued by municipalities. The ability of the issuers of the debt securities to meet their obligations may be affected by economic developments in a specific industry or municipality. In order to reduce the risk associated with such economic developments, at March 31, 2009, 37.6% of total investments are backed by bond insurance of various financial institutions and financial guaranty assurance
agencies. The aggregate percentage insured by an individual financial institution ranged from 0.2% to 19.1% of total investments.
| | |
| (1) | | When-issued security. |
| |
| (2) | | Security exempt from registration under Rule 144A of the Securities Act of 1933. These securities may be sold in transactions exempt from registration, normally to qualified institutional buyers. At March 31, 2009, the aggregate value of these securities is $9,995,106 or 1.6% of the Fund’s net assets. |
| |
| (3) | | Security represents the underlying municipal bond of a tender option bond trust (see Note 1I). |
| |
| (4) | | Security is in default and making only partial interest payments. |
| |
| (5) | | Security (or a portion thereof) has been segregated to cover payable for when-issued securities. |
| |
| (6) | | Security is in default with respect to scheduled principal payments. |
| |
| (7) | | Defaulted bond. |
| |
| (8) | | Security (or a portion thereof) has been segregated to cover margin requirements on open financial futures contracts. |
See notes to financial statements19
Eaton Vance Limited Maturity Municipals Funds as of March 31, 2009
FINANCIAL STATEMENTS
Statements of Assets and Liabilities
| | | | | | | | | | | |
| | | AMT-Free
| | | National
| | | |
| As of March 31, 2009 | | Limited Fund | | | Limited Fund | | | |
| |
| |
| |
| Assets |
| |
| Investments — | | | | | | | | | | |
| Identified cost | | $ | 58,718,898 | | | $ | 642,752,245 | | | |
| Unrealized appreciation (depreciation) | | | 884,685 | | | | (33,865,530 | ) | | |
| |
| |
Investments, at value | | $ | 59,603,583 | | | $ | 608,886,715 | | | |
| |
| |
| Cash | | $ | 1,539,440 | | | $ | 2,957,180 | | | |
| Interest receivable | | | 806,621 | | | | 8,809,063 | | | |
| Receivable for investments sold | | | 55,000 | | | | 323,243 | | | |
| Receivable for Fund shares sold | | | 84,989 | | | | 1,499,218 | | | |
| |
| |
Total assets | | $ | 62,089,633 | | | $ | 622,475,419 | | | |
| |
| |
| Liabilities |
| |
| Payable for floating rate notes issued | | $ | — | | | $ | 4,980,000 | | | |
| Payable for when-issued securities | | | — | | | | 2,000,000 | | | |
| Payable for variation margin on open financial futures contracts | | | 30,000 | | | | 494,937 | | | |
| Payable for Fund shares redeemed | | | 982,756 | | | | 1,494,108 | | | |
| Distributions payable | | | 91,218 | | | | 1,041,138 | | | |
| Payable to affiliates: | | | | | | | | | | |
| Investment adviser fee | | | 22,289 | | | | 192,148 | | | |
| Distribution and service fees | | | 15,292 | | | | 149,126 | | | |
| Interest expense and fees payable | | | — | | | | 41,786 | | | |
| Accrued expenses | | | 55,170 | | | | 189,662 | | | |
| |
| |
Total liabilities | | $ | 1,196,725 | | | $ | 10,582,905 | | | |
| |
| |
Net Assets | | $ | 60,892,908 | | | $ | 611,892,514 | | | |
| |
| |
| Sources of Net Assets |
| |
| Paid-in capital | | $ | 62,758,934 | | | $ | 682,368,424 | | | |
| Accumulated net realized loss | | | (2,576,228 | ) | | | (34,638,923 | ) | | |
| Accumulated distributions in excess of net investment income | | | (91,218 | ) | | | (123,804 | ) | | |
| Net unrealized appreciation (depreciation) | | | 801,420 | | | | (35,713,183 | ) | | |
| |
| |
Net Assets | | $ | 60,892,908 | | | $ | 611,892,514 | | | |
| |
| |
| Class A Shares |
| |
Net Assets | | $ | 49,188,156 | | | $ | 500,869,484 | | | |
Shares Outstanding | | | 5,194,054 | | | | 54,464,850 | | | |
Net Asset Value and Redemption Price Per Share | | | | | | | | | | |
(net assets ¸ shares of beneficial interest outstanding) | | $ | 9.47 | | | $ | 9.20 | | | |
Maximum Offering Price Per Share | | | | | | | | | | |
(100 ¸ 97.75 of net asset value per share) | | $ | 9.69 | | | $ | 9.41 | | | |
| |
| |
| Class B Shares |
| |
Net Assets | | $ | 962,069 | | | $ | 6,130,103 | | | |
Shares Outstanding | | | 101,537 | | | | 666,236 | | | |
Net Asset Value and Offering Price Per Share* | | | | | | | | | | |
(net assets ¸ shares of beneficial interest outstanding) | | $ | 9.48 | | | $ | 9.20 | | | |
| |
| |
| Class C Shares |
| |
Net Assets | | $ | 10,742,683 | | | $ | 104,892,927 | | | |
Shares Outstanding | | | 1,200,721 | | | | 12,159,477 | | | |
Net Asset Value and Offering Price Per Share* | | | | | | | | | | |
(net assets ¸ shares of beneficial interest outstanding) | | $ | 8.95 | | | $ | 8.63 | | | |
| |
| |
On sales of $100,000 or more, the offering price of Class A shares is reduced.
| |
| * | Redemption price per share is equal to the net asset value less any applicable contingent deferred sales charge. |
See notes to financial statements20
Eaton Vance Limited Maturity Municipals Funds as of March 31, 2009
FINANCIAL STATEMENTS CONT’D
Statements of Operations
| | | | | | | | | | | |
| | | AMT-Free
| | | National
| | | |
| For the Year Ended March 31, 2009 | | Limited Fund | | | Limited Fund | | | |
| |
| |
| |
| Investment Income |
| |
| Interest | | $ | 2,004,915 | | | $ | 30,746,806 | | | |
| |
| |
Total investment income | | $ | 2,004,915 | | | $ | 30,746,806 | | | |
| |
| |
| | | | | | | | | | | |
| | | | | | | | | | | |
| |
| Expenses |
| |
| Investment adviser fee | | $ | 192,321 | | | $ | 2,741,473 | | | |
| Distribution and service fees | | | | | | | | | | |
| Class A | | | 51,435 | | | | 787,616 | | | |
| Class B | | | 9,689 | | | | 50,795 | | | |
| Class C | | | 79,257 | | | | 925,269 | | | |
| Trustees’ fees and expenses | | | 2,300 | | | | 22,676 | | | |
| Custodian fee | | | 40,745 | | | | 288,472 | | | |
| Transfer and dividend disbursing agent fees | | | 17,736 | | | | 285,786 | | | |
| Legal and accounting services | | | 38,378 | | | | 64,336 | | | |
| Printing and postage | | | 6,968 | | | | 54,108 | | | |
| Registration fees | | | 49,502 | | | | 64,172 | | | |
| Interest expense and fees | | | — | | | | 127,433 | | | |
| Miscellaneous | | | 19,087 | | | | 71,611 | | | |
| |
| |
Total expenses | | $ | 507,418 | | | $ | 5,483,747 | | | |
| |
| |
| Deduct — | | | | | | | | | | |
| Reduction of custodian fee | | $ | 10,019 | | | $ | 34,864 | | | |
| |
| |
Total expense reductions | | $ | 10,019 | | | $ | 34,864 | | | |
| |
| |
| | | | | | | | | | | |
Net expenses | | $ | 497,399 | | | $ | 5,448,883 | | | |
| |
| |
| | | | | | | | | | | |
Net investment income | | $ | 1,507,516 | | | $ | 25,297,923 | | | |
| |
| |
| | | | | | | | | | | |
| | | | | | | | | | | |
| |
| Realized and Unrealized Gain (Loss) |
| |
| Net realized gain (loss) — | | | | | | | | | | |
| Investment transactions | | $ | (901,727 | ) | | $ | (2,621,951 | ) | | |
| Financial futures contracts | | | (690,325 | ) | | | (19,133,804 | ) | | |
| |
| |
Net realized loss | | $ | (1,592,052 | ) | | $ | (21,755,755 | ) | | |
| |
| |
| Change in unrealized appreciation (depreciation) — | | | | | | | | | | |
| Investments | | $ | 712,609 | | | $ | (30,727,754 | ) | | |
| Financial futures contracts | | | 86,563 | | | | 2,347,966 | | | |
| |
| |
Net change in unrealized appreciation (depreciation) | | $ | 799,172 | | | $ | (28,379,788 | ) | | |
| |
| |
| | | | | | | | | | | |
Net realized and unrealized loss | | $ | (792,880 | ) | | $ | (50,135,543 | ) | | |
| |
| |
| | | | | | | | | | | |
Net increase (decrease) in net assets from operations | | $ | 714,636 | | | $ | (24,837,620 | ) | | |
| |
| |
See notes to financial statements21
Eaton Vance Limited Maturity Municipals Funds as of March 31, 2009
FINANCIAL STATEMENTS CONT’D
Statements of Changes in Net Assets
| | | | | | | | | | | |
| | | AMT-Free
| | | National
| | | |
| For the Year Ended March 31, 2009 | | Limited Fund | | | Limited Fund | | | |
| |
| |
| |
| Increase (Decrease) in Net Assets |
| |
| From operations — | | | | | | | | | | |
| Net investment income | | $ | 1,507,516 | | | $ | 25,297,923 | | | |
Net realized loss from investment transactions and
financial futures contracts | | | (1,592,052 | ) | | | (21,755,755 | ) | | |
Net change in unrealized appreciation (depreciation) from investments
and financial futures contracts | | | 799,172 | | | | (28,379,788 | ) | | |
| |
| |
Net increase (decrease) in net assets from operations | | $ | 714,636 | | | $ | (24,837,620 | ) | | |
| |
| |
| Distributions to shareholders — | | | | | | | | | | |
| From net investment income | | | | | | | | | | |
| Class A | | $ | (1,371,482 | ) | | $ | (21,507,938 | ) | | |
| Class B | | | (34,887 | ) | | | (187,841 | ) | | |
| Class C | | | (285,120 | ) | | | (3,418,273 | ) | | |
| |
| |
Total distributions to shareholders | | $ | (1,691,489 | ) | | $ | (25,114,052 | ) | | |
| |
| |
| Transactions in shares of beneficial interest — | | | | | | | | | | |
| Proceeds from sale of shares | | | | | | | | | | |
| Class A | | $ | 27,826,205 | | | $ | 281,851,976 | | | |
| Class B | | | 760,465 | | | | 4,974,478 | | | |
| Class C | | | 4,902,322 | | | | 52,306,181 | | | |
Net asset value of shares issued to shareholders in payment of
distributions declared | | | | | | | | | | |
| Class A | | | 806,358 | | | | 13,822,720 | | | |
| Class B | | | 19,831 | | | | 95,728 | | | |
| Class C | | | 139,227 | | | | 1,505,087 | | | |
| Cost of shares redeemed | | | | | | | | | | |
| Class A | | | (8,637,957 | ) | | | (297,658,446 | ) | | |
| Class B | | | (461,799 | ) | | | (1,528,941 | ) | | |
| Class C | | | (2,560,043 | ) | | | (42,078,655 | ) | | |
| Net asset value of shares exchanged | | | | | | | | | | |
| Class A | | | 583,287 | | | | 3,559,715 | | | |
| Class B | | | (583,287 | ) | | | (3,559,715 | ) | | |
| |
| |
Net increase in net assets from Fund share transactions | | $ | 22,794,609 | | | $ | 13,290,128 | | | |
| |
| |
| | | | | | | | | | | |
Net increase (decrease) in net assets | | $ | 21,817,756 | | | $ | (36,661,544 | ) | | |
| |
| |
| | | | | | | | | | | |
| | | | | | | | | | | |
| |
| Net Assets |
| |
| At beginning of year | | $ | 39,075,152 | | | $ | 648,554,058 | | | |
| |
| |
At end of year | | $ | 60,892,908 | | | $ | 611,892,514 | | | |
| |
| |
| | | | | | | | | | | |
| | | | | | | | | | | |
| |
Accumulated distributions
in excess of net investment
income included in net assets |
| |
At end of year | | $ | (91,218 | ) | | $ | (123,804 | ) | | |
| |
| |
See notes to financial statements22
Eaton Vance Limited Maturity Municipals Funds as of March 31, 2009
FINANCIAL STATEMENTS CONT’D
Statements of Changes in Net Assets
| | | | | | | | | | | |
| | | AMT-Free
| | | National
| | | |
| For the Year Ended March 31, 2008 | | Limited Fund | | | Limited Fund | | | |
| |
| |
| |
| Increase (Decrease) in Net Assets |
| |
| From operations — | | | | | | | | | | |
| Net investment income | | $ | 1,530,141 | | | $ | 21,414,871 | | | |
Net realized gain (loss) from investment transactions and
financial futures contracts | | | 282,847 | | | | (8,806,427 | ) | | |
Net change in unrealized appreciation (depreciation) from investments
and financial futures contracts | | | (1,853,322 | ) | | | (18,794,940 | ) | | |
| |
| |
Net decrease in net assets from operations | | $ | (40,334 | ) | | $ | (6,186,496 | ) | | |
| |
| |
| Distributions to shareholders — | | | | | | | | | | |
| From net investment income | | | | | | | | | | |
| Class A | | $ | (1,228,918 | ) | | $ | (18,398,082 | ) | | |
| Class B | | | (52,383 | ) | | | (256,350 | ) | | |
| Class C | | | (280,187 | ) | | | (2,773,571 | ) | | |
| |
| |
Total distributions to shareholders | | $ | (1,561,488 | ) | | $ | (21,428,003 | ) | | |
| |
| |
| Proceeds from sale of shares | | | | | | | | | | |
| Class A | | $ | 3,761,337 | | | $ | 420,803,160 | | | |
| Class B | | | 893,268 | | | | 3,585,732 | | | |
| Class C | | | 1,565,531 | | | | 55,236,420 | | | |
Net asset value of shares issued to shareholders in payment of
distributions declared | | | | | | | | | | |
| Class A | | | 646,118 | | | | 12,533,194 | | | |
| Class B | | | 32,577 | | | | 161,203 | | | |
| Class C | | | 112,680 | | | | 1,207,554 | | | |
| Cost of shares redeemed | | | | | | | | | | |
| Class A | | | (9,025,554 | ) | | | (242,096,051 | ) | | |
| Class B | | | (691,604 | ) | | | (2,477,864 | ) | | |
| Class C | | | (2,429,504 | ) | | | (32,641,360 | ) | | |
| Net asset value of shares exchanged | | | | | | | | | | |
| Class A | | | 1,680,610 | | | | 5,802,569 | | | |
| Class B | | | (1,680,610 | ) | | | (5,802,569 | ) | | |
| |
| |
Net increase (decrease) in net assets from Fund share transactions | | $ | (5,135,151 | ) | | $ | 216,311,988 | | | |
| |
| |
| | | | | | | | | | | |
Net increase (decrease) in net assets | | $ | (6,736,973 | ) | | $ | 188,697,489 | | | |
| |
| |
| | | | | | | | | | | |
| | | | | | | | | | | |
| |
| Net Assets |
| |
| At beginning of year | | $ | 45,812,125 | | | $ | 459,856,569 | | | |
| |
| |
At end of year | | $ | 39,075,152 | | | $ | 648,554,058 | | | |
| |
| |
| | | | | | | | | | | |
| | | | | | | | | | | |
| |
Accumulated undistributed
(distributions in excess of) net
investment income included in net assets |
| |
At end of year | | $ | 21,830 | | | $ | (432,979 | ) | | |
| |
| |
See notes to financial statements23
Eaton Vance Limited Maturity Municipals Funds as of March 31, 2009
FINANCIAL STATEMENTS CONT’D
Financial Highlights
| | | | | | | | | | | | | | | | | | | | | | | |
| | | AMT-Free Limited Fund — Class A |
| | | |
| | | Year Ended March 31, |
| | | |
| | | 2009 | | | 2008 | | | 2007 | | | 2006 | | | 2005 | | | |
| |
| Net asset value — Beginning of year | | $ | 9.890 | | | $ | 10.280 | | | $ | 10.230 | | | $ | 10.230 | | | $ | 10.500 | | | |
| |
| |
| | | | | | | | | | | | | | | | | | | | | | | |
| | | | | | | | | | | | | | | | | | | | | | | |
| |
| Income (Loss) From Operations |
| |
Net investment income(1) | | $ | 0.343 | | | $ | 0.388 | | | $ | 0.394 | | | $ | 0.385 | | | $ | 0.387 | | | |
| Net realized and unrealized gain (loss) | | | (0.377 | ) | | | (0.382 | ) | | | 0.041 | | | | (0.005 | ) | | | (0.277 | ) | | |
| |
| |
Total income (loss) from operations | | $ | (0.034 | ) | | $ | 0.006 | | | $ | 0.435 | | | $ | 0.380 | | | $ | 0.110 | | | |
| |
| |
| | | | | | | | | | | | | | | | | | | | | | | |
| | | | | | | | | | | | | | | | | | | | | | | |
| |
| Less Distributions |
| |
| From net investment income | | $ | (0.386 | ) | | $ | (0.396 | ) | | $ | (0.385 | ) | | $ | (0.380 | ) | | $ | (0.380 | ) | | |
| |
| |
Total distributions | | $ | (0.386 | ) | | $ | (0.396 | ) | | $ | (0.385 | ) | | $ | (0.380 | ) | | $ | (0.380 | ) | | |
| |
| |
| | | | | | | | | | | | | | | | | | | | | | | |
Net asset value — End of year | | $ | 9.470 | | | $ | 9.890 | | | $ | 10.280 | | | $ | 10.230 | | | $ | 10.230 | | | |
| |
| |
| | | | | | | | | | | | | | | | | | | | | | | |
Total Return(2) | | | (0.33 | )% | | | 0.05 | % | | | 4.32 | % | | | 3.76 | % | | | 1.06 | % | | |
| |
| |
| | | | | | | | | | | | | | | | | | | | | | | |
| | | | | | | | | | | | | | | | | | | | | | | |
| |
| Ratios/Supplemental Data |
| |
| Net assets, end of year (000’s omitted) | | $ | 49,188 | | | $ | 29,297 | | | $ | 33,440 | | | $ | 36,064 | | | $ | 44,720 | | | |
| Ratios (As a percentage of average daily net assets): | | | | | | | | | | | | | | | | | | | | | | |
| Expenses before custodian fee reduction | | | 0.98 | % | | | 0.92 | % | | | 0.89 | % | | | 0.85 | % | | | 0.82 | %(3) | | |
| Expenses after custodian fee reduction | | | 0.95 | % | | | 0.90 | % | | | 0.87 | % | | | 0.84 | % | | | 0.81 | %(3) | | |
| Net investment income | | | 3.58 | % | | | 3.83 | % | | | 3.83 | % | | | 3.74 | % | | | 3.74 | % | | |
| Portfolio Turnover of the Portfolio | | | — | | | | — | | | | — | | | | — | | | | 8 | %(4) | | |
| Portfolio Turnover of the Fund | | | 78 | % | | | 36 | % | | | 18 | % | | | 23 | % | | | 16 | % | | |
| |
| |
| | |
| (1) | | Computed using average shares outstanding. |
| |
| (2) | | Returns are historical and are calculated by determining the percentage change in net asset value with all distributions reinvested and do not reflect the effect of sales charges. |
| |
| (3) | | Includes the Fund’s share of the corresponding Portfolio’s allocated expenses while the Fund was making investments directly into the Portfolio. |
| |
| (4) | | Portfolio turnover represents the rate of portfolio activity for the period while the Fund was making investments directly into the Portfolio. |
See notes to financial statements24
Eaton Vance Limited Maturity Municipals Funds as of March 31, 2009
FINANCIAL STATEMENTS CONT’D
Financial Highlights
| | | | | | | | | | | | | | | | | | | | | | | |
| | | AMT-Free Limited Fund — Class B |
| | | |
| | | Year Ended March 31, |
| | | |
| | | 2009 | | | 2008 | | | 2007 | | | 2006 | | | 2005 | | | |
| |
| Net asset value — Beginning of year | | $ | 9.890 | | | $ | 10.280 | | | $ | 10.230 | | | $ | 10.230 | | | $ | 10.500 | | | |
| |
| |
| | | | | | | | | | | | | | | | | | | | | | | |
| | | | | | | | | | | | | | | | | | | | | | | |
| |
| Income (Loss) From Operations |
| |
Net investment income(1) | | $ | 0.272 | | | $ | 0.314 | | | $ | 0.317 | | | $ | 0.307 | | | $ | 0.310 | | | |
| Net realized and unrealized gain (loss) | | | (0.371 | ) | | | (0.385 | ) | | | 0.040 | | | | (0.007 | ) | | | (0.280 | ) | | |
| |
| |
Total income (loss) from operations | | $ | (0.099 | ) | | $ | (0.071 | ) | | $ | 0.357 | | | $ | 0.300 | | | $ | 0.030 | | | |
| |
| |
| | | | | | | | | | | | | | | | | | | | | | | |
| | | | | | | | | | | | | | | | | | | | | | | |
| |
| Less Distributions |
| |
| From net investment income | | $ | (0.311 | ) | | $ | (0.319 | ) | | $ | (0.307 | ) | | $ | (0.300 | ) | | $ | (0.300 | ) | | |
| |
| |
Total distributions | | $ | (0.311 | ) | | $ | (0.319 | ) | | $ | (0.307 | ) | | $ | (0.300 | ) | | $ | (0.300 | ) | | |
| |
| |
| | | | | | | | | | | | | | | | | | | | | | | |
Net asset value — End of year | | $ | 9.480 | | | $ | 9.890 | | | $ | 10.280 | | | $ | 10.230 | | | $ | 10.230 | | | |
| |
| |
| | | | | | | | | | | | | | | | | | | | | | | |
Total Return(2) | | | (1.10 | )% | | | (0.71 | )% | | | 3.54 | % | | | 2.96 | % | | | 0.28 | % | | |
| |
| |
| | | | | | | | | | | | | | | | | | | | | | | |
| | | | | | | | | | | | | | | | | | | | | | | |
| |
| Ratios/Supplemental Data |
| |
| Net assets, end of year (000’s omitted) | | $ | 962 | | | $ | 1,256 | | | $ | 2,760 | | | $ | 5,925 | | | $ | 8,361 | | | |
| Ratios (As a percentage of average daily net assets): | | | | | | | | | | | | | | | | | | | | | | |
| Expenses before custodian fee reduction | | | 1.73 | % | | | 1.67 | % | | | 1.64 | % | | | 1.60 | % | | | 1.57 | %(3) | | |
| Expenses after custodian fee reduction | | | 1.71 | % | | | 1.65 | % | | | 1.62 | % | | | 1.59 | % | | | 1.56 | %(3) | | |
| Net investment income | | | 2.82 | % | | | 3.09 | % | | | 3.08 | % | | | 2.98 | % | | | 3.00 | % | | |
| Portfolio Turnover of the Portfolio | | | — | | | | — | | | | — | | | | — | | | | 8 | %(4) | | |
| Portfolio Turnover of the Fund | | | 78 | % | | | 36 | % | | | 18 | % | | | 23 | % | | | 16 | % | | |
| |
| |
| | |
| (1) | | Computed using average shares outstanding. |
| |
| (2) | | Returns are historical and are calculated by determining the percentage change in net asset value with all distributions reinvested and do not reflect the effect of sales charges. |
| |
| (3) | | Includes the Fund’s share of the corresponding Portfolio’s allocated expenses while the Fund was making investments directly into the Portfolio. |
| |
| (4) | | Portfolio turnover represents the rate of portfolio activity for the period while the Fund was making investments directly into the Portfolio. |
See notes to financial statements25
Eaton Vance Limited Maturity Municipals Funds as of March 31, 2009
FINANCIAL STATEMENTS CONT’D
Financial Highlights
| | | | | | | | | | | | | | | | | | | | | | | |
| | | AMT-Free Limited Fund — Class C |
| | | |
| | | Year Ended March 31, |
| | | |
| | | 2009 | | | 2008 | | | 2007 | | | 2006 | | | 2005 | | | |
| |
| Net asset value — Beginning of year | | $ | 9.340 | | | $ | 9.700 | | | $ | 9.660 | | | $ | 9.650 | | | $ | 9.910 | | | |
| |
| |
| | | | | | | | | | | | | | | | | | | | | | | |
| | | | | | | | | | | | | | | | | | | | | | | |
| |
| Income (Loss) From Operations |
| |
Net investment income(1) | | $ | 0.256 | | | $ | 0.295 | | | $ | 0.299 | | | $ | 0.291 | | | $ | 0.293 | | | |
| Net realized and unrealized gain (loss) | | | (0.352 | ) | | | (0.354 | ) | | | 0.031 | | | | 0.004 | | | | (0.268 | ) | | |
| |
| |
Total income (loss) from operations | | $ | (0.096 | ) | | $ | (0.059 | ) | | $ | 0.330 | | | $ | 0.295 | | | $ | 0.025 | | | |
| |
| |
| | | | | | | | | | | | | | | | | | | | | | | |
| | | | | | | | | | | | | | | | | | | | | | | |
| |
| Less Distributions |
| |
| From net investment income | | $ | (0.294 | ) | | $ | (0.301 | ) | | $ | (0.290 | ) | | $ | (0.285 | ) | | $ | (0.285 | ) | | |
| |
| |
Total distributions | | $ | (0.294 | ) | | $ | (0.301 | ) | | $ | (0.290 | ) | | $ | (0.285 | ) | | $ | (0.285 | ) | | |
| |
| |
| | | | | | | | | | | | | | | | | | | | | | | |
Net asset value — End of year | | $ | 8.950 | | | $ | 9.340 | | | $ | 9.700 | | | $ | 9.660 | | | $ | 9.650 | | | |
| |
| |
| | | | | | | | | | | | | | | | | | | | | | | |
Total Return(2) | | | (1.02 | )% | | | (0.63 | )% | | | 3.46 | % | | | 3.07 | % | | | 0.19 | %(3) | | |
| |
| |
| | | | | | | | | | | | | | | | | | | | | | | |
| | | | | | | | | | | | | | | | | | | | | | | |
| |
| Ratios/Supplemental Data |
| |
| Net assets, end of year (000’s omitted) | | $ | 10,743 | | | $ | 8,522 | | | $ | 9,612 | | | $ | 13,466 | | | $ | 17,467 | | | |
| Ratios (As a percentage of average daily net assets): | | | | | | | | | | | | | | | | | | | | | | |
| Expenses before custodian fee reduction | | | 1.74 | % | | | 1.67 | % | | | 1.64 | % | | | 1.60 | % | | | 1.57 | %(4) | | |
| Expenses after custodian fee reduction | | | 1.71 | % | | | 1.65 | % | | | 1.62 | % | | | 1.59 | % | | | 1.56 | %(4) | | |
| Net investment income | | | 2.82 | % | | | 3.08 | % | | | 3.09 | % | | | 2.99 | % | | | 3.00 | % | | |
| Portfolio Turnover of the Portfolio | | | — | | | | — | | | | — | | | | — | | | | 8 | %(5) | | |
| Portfolio Turnover of the Fund | | | 78 | % | | | 36 | % | | | 18 | % | | | 23 | % | | | 16 | % | | |
| |
| |
| | |
| (1) | | Computed using average shares outstanding. |
| |
| (2) | | Returns are historical and are calculated by determining the percentage change in net asset value with all distributions reinvested and do not reflect the effect of sales charges. |
| |
| (3) | | Total return reflects a decrease of 0.06% due to a change in the timing of the payment and reinvestment of distributions. |
| |
| (4) | | Includes the Fund’s share of the corresponding Portfolio’s allocated expenses while the Fund was making investments directly into the Portfolio. |
| |
| (5) | | Portfolio turnover represents the rate of portfolio activity for the period while the Fund was making investments directly into the Portfolio. |
See notes to financial statements26
Eaton Vance Limited Maturity Municipals Funds as of March 31, 2009
FINANCIAL STATEMENTS CONT’D
Financial Highlights
| | | | | | | | | | | | | | | | | | | | | | | |
| | | National Limited Fund — Class A |
| | | |
| | | Year Ended March 31, |
| | | |
| | | 2009 | | | 2008 | | | 2007 | | | 2006 | | | 2005 | | | |
| |
| Net asset value — Beginning of year | | $ | 9.930 | | | $ | 10.420 | | | $ | 10.290 | | | $ | 10.210 | | | $ | 10.400 | | | |
| |
| |
| | | | | | | | | | | | | | | | | | | | | | | |
| | | | | | | | | | | | | | | | | | | | | | | |
| |
| Income (Loss) From Operations |
| |
Net investment income(1) | | $ | 0.394 | | | $ | 0.392 | | | $ | 0.410 | | | $ | 0.411 | | | $ | 0.422 | | | |
| Net realized and unrealized gain (loss) | | | (0.733 | ) | | | (0.488 | ) | | | 0.134 | | | | 0.078 | | | | (0.187 | ) | | |
| |
| |
Total income (loss) from operations | | $ | (0.339 | ) | | $ | (0.096 | ) | | $ | 0.544 | | | $ | 0.489 | | | $ | 0.235 | | | |
| |
| |
| | | | | | | | | | | | | | | | | | | | | | | |
| | | | | | | | | | | | | | | | | | | | | | | |
| |
| Less Distributions |
| |
| From net investment income | | $ | (0.391 | ) | | $ | (0.394 | ) | | $ | (0.414 | ) | | $ | (0.409 | ) | | $ | (0.425 | ) | | |
| |
| |
Total distributions | | $ | (0.391 | ) | | $ | (0.394 | ) | | $ | (0.414 | ) | | $ | (0.409 | ) | | $ | (0.425 | ) | | |
| |
| |
| | | | | | | | | | | | | | | | | | | | | | | |
Net asset value — End of year | | $ | 9.200 | | | $ | 9.930 | | | $ | 10.420 | | | $ | 10.290 | | | $ | 10.210 | | | |
| |
| |
| | | | | | | | | | | | | | | | | | | | | | | |
Total Return(2) | | | (3.50 | )% | | | (0.94 | )% | | | 5.38 | % | | | 4.88 | % | | | 2.29 | % | | |
| |
| |
| | | | | | | | | | | | | | | | | | | | | | | |
| | | | | | | | | | | | | | | | | | | | | | | |
| |
| Ratios/Supplemental Data |
| |
| Net assets, end of year (000’s omitted) | | $ | 500,869 | | | $ | 541,176 | | | $ | 367,010 | | | $ | 180,401 | | | $ | 152,111 | | | |
| Ratios (As a percentage of average daily net assets): | | | | | | | | | | | | | | | | | | | | | | |
| Expenses excluding interest and fees | | | 0.72 | % | | | 0.71 | % | | | 0.78 | % | | | 0.79 | % | | | 0.80 | %†(3) | | |
Interest and fee expense(4) | | | 0.02 | % | | | 0.05 | % | | | 0.10 | % | | | — | | | | — | | | |
| Total expenses before custodian fee reduction | | | 0.74 | % | | | 0.76 | % | | | 0.88 | % | | | 0.79 | % | | | 0.80 | %†(3) | | |
| Expenses after custodian fee reduction excluding interest and fees | | | 0.71 | % | | | 0.70 | % | | | 0.76 | % | | | 0.78 | % | | | 0.79 | %†(3) | | |
| Net investment income | | | 4.12 | % | | | 3.84 | % | | | 3.95 | % | | | 3.99 | % | | | 4.09 | % | | |
| Portfolio Turnover of the Portfolio | | | — | | | | — | | | | — | | | | — | | | | 14 | %(5) | | |
| Portfolio Turnover of the Fund | | | 33 | % | | | 39 | % | | | 38 | % | | | 48 | % | | | 19 | % | | |
| |
| |
| | |
| † | | The operating expenses of the Fund reflect a reduction of the investment adviser fee. Had such actions not been taken, the ratios would have been the same. |
| |
| (1) | | Computed using average shares outstanding. |
| |
| (2) | | Returns are historical and are calculated by determining the percentage change in net asset value with all distributions reinvested and do not reflect the effect of sales charges. |
| |
| (3) | | Includes the Fund’s share of the corresponding Portfolio’s allocated expenses while the Fund was making investments directly into the Portfolio. |
| |
| (4) | | Interest and fee expense relates to the liability for floating rate notes issued in conjunction with inverse floater securities transactions (see Note 1I). |
| |
| (5) | | Portfolio turnover represents the rate of portfolio activity for the period while the Fund was making investments directly into the Portfolio. |
See notes to financial statements27
Eaton Vance Limited Maturity Municipals Funds as of March 31, 2009
FINANCIAL STATEMENTS CONT’D
Financial Highlights
| | | | | | | | | | | | | | | | | | | | | | | |
| | | National Limited Fund — Class B |
| | | |
| | | Year Ended March 31, |
| | | |
| | | 2009 | | | 2008 | | | 2007 | | | 2006 | | | 2005 | | | |
| |
| Net asset value — Beginning of year | | $ | 9.940 | | | $ | 10.420 | | | $ | 10.290 | | | $ | 10.220 | | | $ | 10.410 | | | |
| |
| |
| | | | | | | | | | | | | | | | | | | | | | | |
| | | | | | | | | | | | | | | | | | | | | | | |
| |
| Income (Loss) From Operations |
| |
Net investment income(1) | | $ | 0.322 | | | $ | 0.318 | | | $ | 0.340 | | | $ | 0.335 | | | $ | 0.346 | | | |
| Net realized and unrealized gain (loss) | | | (0.745 | ) | | | (0.482 | ) | | | 0.127 | | | | 0.068 | | | | (0.191 | ) | | |
| |
| |
Total income (loss) from operations | | $ | (0.423 | ) | | $ | (0.164 | ) | | $ | 0.467 | | | $ | 0.403 | | | $ | 0.155 | | | |
| |
| |
| | | | | | | | | | | | | | | | | | | | | | | |
| | | | | | | | | | | | | | | | | | | | | | | |
| |
| Less Distributions |
| |
| From net investment income | | $ | (0.317 | ) | | $ | (0.316 | ) | | $ | (0.337 | ) | | $ | (0.333 | ) | | $ | (0.345 | ) | | |
| |
| |
Total distributions | | $ | (0.317 | ) | | $ | (0.316 | ) | | $ | (0.337 | ) | | $ | (0.333 | ) | | $ | (0.345 | ) | | |
| |
| |
| | | | | | | | | | | | | | | | | | | | | | | |
Net asset value — End of year | | $ | 9.200 | | | $ | 9.940 | | | $ | 10.420 | | | $ | 10.290 | | | $ | 10.220 | | | |
| |
| |
| | | | | | | | | | | | | | | | | | | | | | | |
Total Return(2) | | | (4.34 | )% | | | (1.59 | )% | | | 4.60 | % | | | 3.99 | % | | | 1.51 | % | | |
| |
| |
| | | | | | | | | | | | | | | | | | | | | | | |
| | | | | | | | | | | | | | | | | | | | | | | |
| |
| Ratios/Supplemental Data |
| |
| Net assets, end of year (000’s omitted) | | $ | 6,130 | | | $ | 6,512 | | | $ | 11,435 | | | $ | 20,610 | | | $ | 27,157 | | | |
| Ratios (As a percentage of average daily net assets): | | | | | | | | | | | | | | | | | | | | | | |
| Expenses excluding interest and fees | | | 1.47 | % | | | 1.46 | % | | | 1.53 | % | | | 1.54 | % | | | 1.55 | %†(3) | | |
Interest and fee expense(4) | | | 0.02 | % | | | 0.05 | % | | | 0.10 | % | | | — | | | | — | | | |
| Total expenses before custodian fee reduction | | | 1.49 | % | | | 1.51 | % | | | 1.63 | % | | | 1.54 | % | | | 1.55 | %†(3) | | |
| Expenses after custodian fee reduction excluding interest and fees | | | 1.46 | % | | | 1.45 | % | | | 1.51 | % | | | 1.53 | % | | | 1.54 | %†(3) | | |
| Net investment income | | | 3.37 | % | | | 3.11 | % | | | 3.27 | % | | | 3.25 | % | | | 3.36 | % | | |
| Portfolio Turnover of the Portfolio | | | — | | | | — | | | | — | | | | — | | | | 14 | %(5) | | |
| Portfolio Turnover of the Fund | | | 33 | % | | | 39 | % | | | 38 | % | | | 48 | % | | | 19 | % | | |
| |
| |
| | |
| † | | The operating expenses of the Fund reflect a reduction of the investment adviser fee. Had such actions not been taken, the ratios would have been the same. |
| |
| (1) | | Computed using average shares outstanding. |
| |
| (2) | | Returns are historical and are calculated by determining the percentage change in net asset value with all distributions reinvested and do not reflect the effect of sales charges. |
| |
| (3) | | Includes the Fund’s share of the corresponding Portfolio’s allocated expenses while the Fund was making investments directly into the Portfolio. |
| |
| (4) | | Interest and fee expense relates to the liability for floating rate notes issued in conjunction with inverse floater securities transactions (see Note 1I). |
| |
| (5) | | Portfolio turnover represents the rate of portfolio activity for the period while the Fund was making investments directly into the Portfolio. |
See notes to financial statements28
Eaton Vance Limited Maturity Municipals Funds as of March 31, 2009
FINANCIAL STATEMENTS CONT’D
Financial Highlights
| | | | | | | | | | | | | | | | | | | | | | | |
| | | National Limited Fund — Class C |
| | | |
| | | Year Ended March 31, |
| | | |
| | | 2009 | | | 2008 | | | 2007 | | | 2006 | | | 2005 | | | |
| |
| Net asset value — Beginning of year | | $ | 9.310 | | | $ | 9.770 | | | $ | 9.640 | | | $ | 9.580 | | | $ | 9.750 | | | |
| |
| |
| | | | | | | | | | | | | | | | | | | | | | | |
| | | | | | | | | | | | | | | | | | | | | | | |
| |
| Income (Loss) From Operations |
| |
Net investment income(1) | | $ | 0.302 | | | $ | 0.297 | | | $ | 0.316 | | | $ | 0.313 | | | $ | 0.324 | | | |
| Net realized and unrealized gain (loss) | | | (0.685 | ) | | | (0.461 | ) | | | 0.130 | | | | 0.059 | | | | (0.171 | ) | | |
| |
| |
Total income (loss) from operations | | $ | (0.383 | ) | | $ | (0.164 | ) | | $ | 0.446 | | | $ | 0.372 | | | $ | 0.153 | | | |
| |
| |
| | | | | | | | | | | | | | | | | | | | | | | |
| | | | | | | | | | | | | | | | | | | | | | | |
| |
| Less Distributions |
| |
| From net investment income | | $ | (0.297 | ) | | $ | (0.296 | ) | | $ | (0.315 | ) | | $ | (0.312 | ) | | $ | (0.323 | ) | | |
| |
| |
Total distributions | | $ | (0.297 | ) | | $ | (0.296 | ) | | $ | (0.315 | ) | | $ | (0.312 | ) | | $ | (0.323 | ) | | |
| |
| |
| | | | | | | | | | | | | | | | | | | | | | | |
Net asset value — End of year | | $ | 8.630 | | | $ | 9.310 | | | $ | 9.770 | | | $ | 9.640 | | | $ | 9.580 | | | |
| |
| |
| | | | | | | | | | | | | | | | | | | | | | | |
Total Return(2) | | | (4.20 | )% | | | (1.70 | )% | | | 4.68 | % | | | 3.93 | % | | | 1.51 | %(3) | | |
| |
| |
| | | | | | | | | | | | | | | | | | | | | | | |
| | | | | | | | | | | | | | | | | | | | | | | |
| |
| Ratios/Supplemental Data |
| |
| Net assets, end of year (000’s omitted) | | $ | 104,893 | | | $ | 100,866 | | | $ | 81,411 | | | $ | 77,379 | | | $ | 77,325 | | | |
| Ratios (As a percentage of average daily net assets): | | | | | | | | | | | | | | | | | | | | | | |
| Expenses excluding interest and fees | | | 1.47 | % | | | 1.46 | % | | | 1.53 | % | | | 1.54 | % | | | 1.55 | %†(4) | | |
Interest and fee expense(5) | | | 0.02 | % | | | 0.05 | % | | | 0.10 | % | | | — | | | | — | | | |
| Total expenses before custodian fee reduction | | | 1.49 | % | | | 1.51 | % | | | 1.63 | % | | | 1.54 | % | | | 1.55 | %†(4) | | |
| Expenses after custodian fee reduction excluding interest and fees | | | 1.46 | % | | | 1.45 | % | | | 1.51 | % | | | 1.53 | % | | | 1.54 | %†(4) | | |
| Net investment income | | | 3.38 | % | | | 3.10 | % | | | 3.24 | % | | | 3.25 | % | | | 3.35 | % | | |
| Portfolio Turnover of the Portfolio | | | — | | | | — | | | | — | | | | — | | | | 14 | %(6) | | |
| Portfolio Turnover of the Fund | | | 33 | % | | | 39 | % | | | 38 | % | | | 48 | % | | | 19 | % | | |
| |
| |
| | |
| † | | The operating expenses of the Fund reflect a reduction of the investment adviser fee. Had such actions not been taken, the ratios would have been the same. |
| |
| (1) | | Computed using average shares outstanding. |
| |
| (2) | | Returns are historical and are calculated by determining the percentage change in net asset value with all distributions reinvested and do not reflect the effect of sales charges. |
| |
| (3) | | Total return reflects a decrease of 0.07% due to a change in the timing of the payment and reinvestment of distributions. |
| |
| (4) | | Includes the Fund’s share of the corresponding Portfolio’s allocated expenses while the Fund was making investments directly into the Portfolio. |
| |
| (5) | | Interest and fee expense relates to the liability for floating rate notes issued in conjunction with inverse floater securities transactions (see Note 1I). |
| |
| (6) | | Portfolio turnover represents the rate of portfolio activity for the period while the Fund was making investments directly into the Portfolio. |
See notes to financial statements29
Eaton Vance Limited Maturity Municipals Funds as of March 31, 2009
NOTES TO FINANCIAL STATEMENTS
1 Significant Accounting Policies
Eaton Vance Investment Trust (the Trust) is a Massachusetts business trust registered under the Investment Company Act of 1940, as amended (the 1940 Act), as an open-end management investment company. The Trust presently consists of eight Funds, two of which, each diversified, are included in these financial statements. They include Eaton Vance AMT-Free Limited Maturity Municipals Fund (AMT-Free Limited Fund) and Eaton Vance National Limited Maturity Municipals Fund (National Limited Fund), (each individually referred to as the Fund, and collectively, the Funds). The Funds seek to provide a high level of current income exempt from regular federal income tax and limited principal fluctuation. The Funds offer three classes of shares. Class A shares are generally sold subject to a sales charge imposed at time of purchase. Class B and Class C shares are sold at net asset value and are generally subject to a contingent deferred sales charge (see Note 5). Class B shares of each Fund held for the longer of (i) four years or (ii) the time at which the contingent deferred sales charge applicable to such shares expires will automatically convert to Class A shares as described in each Fund’s prospectus. Each class represents a pro-rata interest in the Fund, but votes separately on class-specific matters and (as noted below) is subject to different expenses. Realized and unrealized gains and losses are allocated daily to each class of shares based on the relative net assets of each class to the total net assets of the Fund. Net investment income, other than class-specific expenses, is allocated daily to each class of shares based upon the ratio of the value of each class’s paid shares to the total value of all paid shares. Each class of shares differs in its distribution plan and certain other class-specific expenses.
The following is a summary of significant accounting policies of the Funds. The policies are in conformity with accounting principles generally accepted in the United States of America.
A Investment Valuation — Municipal bonds and taxable obligations, if any, are generally valued on the basis of valuations furnished by a pricing vendor, as derived from such vendor’s pricing models. Inputs to the models may include, but are not limited to, reported trades, executable bid and asked prices, broker/dealer quotations, benchmark curves or information pertaining to the issuer. The pricing vendor may use a matrix approach, which considers information regarding securities with similar characteristics to determine the valuation for a security. Financial futures contracts and options on financial futures contracts listed on commodity exchanges are valued based on the closing price on the primary exchange on which such contracts trade. Interest rate swaps are normally valued using valuations provided by a pricing vendor. Such vendor valuations are based on the present value of fixed and projected floating rate cash flows over the term of the swap contract. Future cash flows are discounted to their present value using swap curves provided by electronic data services or by broker/dealers. Short-term obligations, maturing in sixty days or less, are valued at amortized cost, which approximates market value. Investments for which valuations or market quotations are not readily available or are deemed unreliable are valued at fair value using methods determined in good faith by or at the direction of the Trustees of a Fund in a manner that most fairly reflects the security’s value, or the amount that the Fund might reasonably expect to receive for the security upon its current sale in the ordinary course. Each such determination is based on a consideration of all relevant factors, which are likely to vary from one pricing context to another. These factors may include, but are not limited to, the type of security, the existence of any contractual restrictions on the security’s disposition, the price and extent of public trading in similar securities of the issuer or of comparable companies, quotations or relevant information obtained from broker-dealers or other market participants, information obtained from the issuer, analysts, and/or the appropriate stock exchange (for exchange-traded securities), an analysis of the company’s financial condition, and an evaluation of the forces that influence the issuer and the market(s) in which the security is purchased and sold.
B Investment Transactions and Related Income — Investment transactions for financial statement purposes are accounted for on a trade date basis. Realized gains and losses on investments sold are determined on the basis of identified cost. Interest income is recorded on the basis of interest accrued, adjusted for amortization of premium or accretion of discount.
C Federal Taxes — Each Fund’s policy is to comply with the provisions of the Internal Revenue Code applicable to regulated investment companies and to distribute to shareholders each year substantially all of its taxable, if any, and tax-exempt net investment income, and all or substantially all of its net realized capital gains. Accordingly, no provision for federal income or excise tax is necessary. Each Fund intends to satisfy conditions which will enable it to designate distributions from the interest income generated by its investments in municipal obligations, which are exempt from regular federal income tax when received by each Fund, as exempt-interest dividends. For National Limited Fund, the portion of such interest, if any, earned on private activity bonds issued after August 7, 1986, may be considered a tax preference item to shareholders.
At March 31, 2009, the following Funds, for federal income tax purposes, had capital loss carryforwards which will reduce the respective Fund’s taxable income arising from future net realized gains on investment transactions, if any, to the extent permitted by the Internal Revenue Code, and thus will reduce the amount of distributions to
30
Eaton Vance Limited Maturity Municipals Funds as of March 31, 2009
NOTES TO FINANCIAL STATEMENTS CONT’D
shareholders which would otherwise be necessary to relieve the Funds of any liability for federal income or excise tax. The amounts and expiration dates of the capital loss carryforwards are as follows:
| | | | | | | | | | | |
| Fund | | Amount | | | Expiration Date | | | |
| |
| AMT-Free Limited | | $ | 175,227 | | | | March 31, 2011 | | | |
| | | | 995,128 | | | | March 31, 2013 | | | |
| | | | 25,590 | | | | March 31, 2015 | | | |
| | | | 647,289 | | | | March 31, 2017 | | | |
| National Limited | | | 1,047,498 | | | | March 31, 2011 | | | |
| | | | 779,785 | | | | March 31, 2012 | | | |
| | | | 1,412,625 | | | | March 31, 2013 | | | |
| | | | 721,882 | | | | March 31, 2015 | | | |
| | | | 6,352,310 | | | | March 31, 2016 | | | |
| | | | 10,299,983 | | | | March 31, 2017 | | | |
Additionally, at March 31, 2009, the AMT-Free Limited Fund and National Limited Fund had net capital losses of $824,521 and $16,204,771, respectively, attributable to security transactions incurred after October 31, 2008. These net capital losses are treated as arising on the first day of the Funds’ taxable year ending March 31, 2010.
As of March 31, 2009, the Funds had no uncertain tax positions that would require financial statement recognition, de-recognition, or disclosure. Each of the Funds’ federal tax returns filed in the 3-year period ended March 31, 2009 remains subject to examination by the Internal Revenue Service.
D Expenses — The majority of expenses of the Trust are directly identifiable to an individual fund. Expenses which are not readily identifiable to a specific fund are allocated taking into consideration, among other things, the nature and type of expense and the relative size of the funds.
E Expense Reduction — State Street Bank and Trust Company (SSBT) serves as custodian of the Funds. Pursuant to the respective custodian agreements, SSBT receives a fee reduced by credits, which are determined based on the average daily cash balance each Fund maintains with SSBT. All credit balances, if any, used to reduce each Fund’s custodian fees are reported as a reduction of expenses in the Statements of Operations.
F Legal Fees — Legal fees and other related expenses incurred as part of negotiations of the terms and requirement of capital infusions, or that are expected to result in the restructuring of, or a plan of reorganization for, an investment are recorded as realized losses. Ongoing expenditures to protect or enhance an investment are treated as operating expenses.
G Use of Estimates — The preparation of the financial statements in conformity with accounting principles generally accepted in the United States of America requires management to make estimates and assumptions that affect the reported amounts of assets and liabilities at the date of the financial statements and the reported amounts of income and expense during the reporting period. Actual results could differ from those estimates.
H Indemnifications — Under the Trust’s organizational documents, its officers and Trustees may be indemnified against certain liabilities and expenses arising out of the performance of their duties to the Funds, and shareholders are indemnified against personal liability for the obligations of the Trust. Additionally, in the normal course of business, each Fund enters into agreements with service providers that may contain indemnification clauses. Each Fund’s maximum exposure under these arrangements is unknown as this would involve future claims that may be made against each Fund that have not yet occurred.
I Floating Rate Notes Issued in Conjunction with Securities Held — The Funds may invest in inverse floating rate securities, also referred to as tender option bonds (TOBs), whereby a Fund may sell a fixed rate bond to a broker for cash. At the same time, the Fund buys a residual interest in the assets and cash flows of a Special-Purpose Vehicle (the SPV), (which is generally organized as a trust), set up by the broker, often referred to as an inverse floating rate obligation (Inverse Floater). The broker deposits a fixed rate bond into the SPV with the same CUSIP number as the fixed rate bond sold to the broker by the Fund, and which may have been, but is not required to be, the fixed rate bond purchased from the Fund (the Fixed Rate Bond). The SPV also issues floating rate notes (Floating Rate Notes) which are sold to third-parties. The Inverse Floater held by a Fund gives the Fund the right (1) to cause the holders of the Floating Rate Notes to tender their notes at par, and (2) to have the broker transfer the Fixed Rate Bond held by the SPV to the Fund, thereby terminating the SPV. Should the Fund exercise such right, it would pay the broker the par amount due on the Floating Rate Notes and exchange the Inverse Floater for the underlying Fixed Rate Bond. Pursuant to Financial Accounting Standards Board (FASB) Statement No. 140, “Accounting for Transfers and Servicing of Financial Assets and Extinguishment of Liabilities” (FAS 140), the Funds account for the transaction described above as a secured borrowing by including the Fixed Rate Bond in their Portfolio of Investments and the Floating Rate Notes as a liability under the caption “Payable for floating rate notes issued” in their Statement of Assets and Liabilities. The Floating Rate Notes have interest rates that generally reset weekly and their holders have the option to tender their notes to
31
Eaton Vance Limited Maturity Municipals Funds as of March 31, 2009
NOTES TO FINANCIAL STATEMENTS CONT’D
the broker for redemption at par at each reset date. Interest expense related to the Funds’ liability with respect to Floating Rate Notes is recorded as incurred. The SPV may be terminated by the Fund, as noted above, or by the broker upon the occurrence of certain termination events as defined in the trust agreement, such as a downgrade in the credit quality of the underlying bond, bankruptcy of or payment failure by the issuer of the underlying bond, the inability to remarket Floating Rate Notes that have been tendered due to insufficient buyers in the market, or the failure by the SPV to obtain renewal of the liquidity agreement under which liquidity support is provided for the Floating Rate Notes up to one year. At March 31, 2009, the amounts of the Funds’ Floating Rate Notes and related interest rates and collateral were as follows:
| | | | | | | | | | | | | | | |
| | | | | | | | | Collateral for
| | | |
| | | Floating Rate
| | | | | | Floating Rate
| | | |
| | | Notes
| | | | | | Notes
| | | |
| Fund | | Outstanding | | | Interest Rate | | | Outstanding | | | |
| |
| National Limited | | $ | 4,980,000 | | | | 0.59 | % | | $ | 7,858,266 | | | |
The Funds may enter into shortfall and forbearance agreements with the broker by which a Fund agrees to reimburse the broker, in certain circumstances, for the difference between the liquidation value of the Fixed Rate Bond held by the SPV and the liquidation value of the Floating Rate Notes, as well as any shortfalls in interest cash flows. The Funds had no shortfalls as of March 31, 2009.
The Funds may also purchase Inverse Floaters from brokers in a secondary market transaction without first owning the underlying fixed rate bond. Such transactions are not required to be treated as secured borrowings. Shortfall agreements, if any, related to Inverse Floaters purchased in a secondary market transaction are disclosed in the Portfolio of Investments. The Funds’ investment policies and restrictions expressly permit investments in Inverse Floaters. Inverse floating rate securities typically offer the potential for yields exceeding the yields available on fixed rate bonds with comparable credit quality and maturity. These securities tend to underperform the market for fixed rate bonds in a rising long-term interest rate environment, but tend to outperform the market for fixed rate bonds when long-term interest rates decline. The value and income of inverse floating rate securities are generally more volatile than that of a fixed rate bond. The Funds’ investment policies do not allow the Funds to borrow money for purposes of making investments. Management believes that the Funds’ restrictions on borrowing money and issuing senior securities (other than as specifically permitted) do not apply to Floating Rate Notes issued by the SPV and included as a liability in the Funds’ Statements of Assets and Liabilities. As secured indebtedness issued by an SPV, Floating Rate Notes are distinct from the borrowings and senior securities to which the Funds’ restrictions apply. Inverse Floaters held by the Funds are securities exempt from registration under Rule 144A of the Securities Act of 1933.
J Financial Futures Contracts — The Funds may enter into financial futures contracts. The Funds’ investment in financial futures contracts is designed for hedging against changes in interest rates or as a substitute for the purchase of securities. Upon entering into a financial futures contract, a Fund is required to deposit with the broker, either in cash or securities an amount equal to a certain percentage of the purchase price (initial margin). Subsequent payments, known as variation margin, are made or received by the Fund each business day, depending on the daily fluctuations in the value of the underlying security, and are recorded as unrealized gains or losses by the Fund. Gains (losses) are realized upon the expiration or closing of the financial futures contracts. Should market conditions change unexpectedly, the Fund may not achieve the anticipated benefits of the financial futures contracts and may realize a loss. In entering such contracts, the Fund bears the risk if the counterparties do not perform under the contracts’ terms.
K When-Issued Securities and Delayed Delivery Transactions — The Funds may purchase or sell securities on a delayed delivery or when-issued basis. Payment and delivery may take place after the customary settlement period for that security. At the time the transaction is negotiated, the price of the security that will be delivered is fixed. The Funds maintain security positions for these commitments such that sufficient liquid assets will be available to make payments upon settlement. Securities purchased on a delayed delivery or when-issued basis are marked-to-market daily and begin earning interest on settlement date. Losses may arise due to changes in the market value of the underlying securities or if the counterparty does not perform under the contract.
2 Distributions to Shareholders
The net investment income of each Fund is determined daily and substantially all of the net investment income so determined is declared as a dividend to shareholders of record at the time of declaration. Distributions are declared separately for each class of shares. Distributions are paid monthly. Distributions of realized capital gains (reduced by available capital loss carryforwards, if any), are made at least annually. Shareholders may reinvest income and capital gain distributions in additional shares of the same class of a Fund at the net asset value as of the reinvestment date or, at the election of the shareholder, receive distributions in cash. The Funds distinguish between distributions on a tax basis and a financial reporting basis. Accounting principles generally accepted in the United States of America require that only distributions in excess of tax basis earnings and profits be
32
Eaton Vance Limited Maturity Municipals Funds as of March 31, 2009
NOTES TO FINANCIAL STATEMENTS CONT’D
reported in the financial statements as a return of capital. Permanent differences between book and tax accounting relating to distributions are reclassified to paid-in capital.
The tax character of distributions declared for the years ended March 31, 2009 and March 31, 2008 was as follows:
| | | | �� | | | | | | | |
| | | AMT-Free
| | | National
| | | |
| Year Ended March 31, 2009 | | Limited Fund | | | Limited Fund | | | |
| |
| Distributions declared from: | | | | | | | | | | |
| Tax-exempt income | | $ | 1,605,571 | | | $ | 25,086,973 | | | |
| Ordinary income | | $ | 85,918 | | | $ | 27,079 | | | |
| | | | | | | | | | | |
| | | AMT-Free
| | | National
| | | |
| Year Ended March 31, 2008 | | Limited Fund | | | Limited Fund | | | |
| |
| Distributions declared from: | | | | | | | | | | |
| Tax-exempt income | | $ | 1,540,593 | | | $ | 21,395,609 | | | |
| Ordinary income | | $ | 20,895 | | | $ | 32,394 | | | |
During the year ended March 31, 2009, the following amounts were reclassified due to the tax treatment of distributions in excess of net tax-exempt income and differences between book and tax accounting, primarily for accretion of market discount:
| | | | | | | | | | | |
| | | AMT-Free
| | | National
| | | |
| | | Limited Fund | | | Limited Fund | | | |
| |
| Increase (decrease): | | | | | | | | | | |
| Paid-in capital | | $ | (70,072 | ) | | $ | — | | | |
| Accumulated net realized loss | | $ | (853 | ) | | $ | (125,304 | ) | | |
| Accumulated undistributed net investment income | | $ | 70,925 | | | $ | 125,304 | | | |
These reclassifications had no effect on the net assets or net asset value per share of the Funds.
As of March 31, 2009, the components of distributable earnings (accumulated losses) and unrealized appreciation (depreciation) on a tax basis were as follows:
| | | | | | | | | | | |
| | | AMT-Free
| | | National
| | | |
| | | Limited Fund | | | Limited Fund | | | |
| |
| Undistributed tax-exempt income | | $ | – | | | $ | 917,334 | | | |
| Capital loss carryforward and post October losses | | $ | (2,667,755 | ) | | $ | (36,818,854 | ) | | |
| Net unrealized appreciation (depreciation) | | $ | 892,947 | | | $ | (33,533,252 | ) | | |
| Other temporary differences | | $ | (91,218 | ) | | $ | (1,041,138 | ) | | |
The differences between components of distributable earnings (accumulated losses) on a tax basis and the amounts reflected in the Statements of Assets and Liabilities are primarily due to futures contracts, accretion of market discount and inverse floaters.
3 Investment Adviser Fee and Other Transactions with Affiliates
The investment adviser fee is earned by Boston Management and Research (BMR), a subsidiary of Eaton Vance Management (EVM), as compensation for management and investment advisory services rendered to each Fund. The fee is based upon a percentage of average daily net assets plus a percentage of gross income (i.e., income other than gains from the sale of securities) as presented in the following table and is payable monthly.
| | | | | | | | | | | |
| | | Annual
| | | Daily
| | | |
| Daily Net Assets | | Asset Rate | | | Income Rate | | | |
| |
| Up to $500 million | | | 0.300 | % | | | 3.00 | % | | |
| $500 million up to $1 billion | | | 0.275 | % | | | 2.75 | % | | |
On average daily net assets of $1 billion or more, the rates are further reduced.
For the year ended March 31, 2009, investment adviser fees incurred by the Funds and the effective annual rates, as a percentage of average daily net assets, were as follows:
| | | | | | | | | | | |
| | | Investment
| | | Effective
| | | |
| Fund | | Adviser Fee | | | Annual Rate | | | |
| |
| AMT-Free Limited | | $ | 192,321 | | | | 0.43 | % | | |
| National Limited | | | 2,741,473 | | | | 0.43 | | | |
EVM serves as administrator of each Fund, but receives no compensation. EVM serves as the sub-transfer agent of each Fund and receives from the transfer agent an aggregate fee based upon the actual expenses incurred by EVM in the performance of these services. Eaton Vance Distributors, Inc. (EVD), an affiliate of EVM and the Funds’ principal underwriter, received a portion of the sales charge on sales of Class A shares of the Funds. EVD also received distribution and service fees from Class A, Class B and Class C shares (see Note 4) and contingent deferred sales charges (see Note 5). Sub-transfer agent fees earned by EVM and Class A sales charges that the Funds were informed were received by EVD for the year ended March 31, 2009 were as follows:
| | | | | | | | | | | |
| | | EVM’s Sub-Transfer
| | | EVD’s Class A
| | | |
| Fund | | Agent Fees | | | Sales Charges | | | |
| |
| AMT-Free Limited | | $ | 868 | | | $ | 3,455 | | | |
| National Limited | | | 13,968 | | | | 25,842 | | | |
Except for Trustees of the Funds who are not members of EVM’s or BMR’s organizations, officers and Trustees receive remuneration for their services to the Funds out of the investment adviser fee. Trustees of the Funds who are not affiliated with the investment adviser may elect to defer receipt of all or a percentage of their annual fees in accordance with the terms of the Trustees Deferred Compensation Plan. For the year ended March 31, 2009,
33
Eaton Vance Limited Maturity Municipals Funds as of March 31, 2009
NOTES TO FINANCIAL STATEMENTS CONT’D
no significant amounts have been deferred. Certain officers and Trustees of the Funds are officers of the above organizations.
4 Distribution Plans
Each Fund has in effect a distribution plan for Class A shares (Class A Plan) pursuant to Rule 12b-1 under the 1940 Act. The Class A Plan provides that each Fund will pay EVD a distribution and service fee not exceeding 0.25% per annum of its average daily net assets attributable to Class A shares for distribution services and facilities provided to each Fund by EVD, as well as for personal services and/or the maintenance of shareholder accounts. The Trustees approved distribution and service fee payments equal to 0.15% per annum of each Fund’s average daily net assets attributable to Class A shares. Distribution and service fees paid or accrued to EVD for the year ended March 31, 2009 for Class A shares amounted to the following:
| | | | | | | |
| | | Class A
| | | |
| | | Distribution and
| | | |
| Fund | | Service Fees | | | |
| |
| AMT-Free Limited | | $ | 51,435 | | | |
| National Limited | | | 787,616 | | | |
Each Fund also has in effect distribution plans for Class B shares (Class B Plan) and Class C shares (Class C Plan) pursuant to Rule 12b-1 under the 1940 Act. The Class B and Class C Plans require each Fund to pay EVD amounts equal to 0.75% per annum of its average daily net assets attributable to Class B and Class C shares for providing ongoing distribution services and facilities to the respective Funds. Each Fund will automatically discontinue payments to EVD during any period in which there are no outstanding Uncovered Distribution Charges, which are equivalent to the sum of (i) 3% and 6.25% of the aggregate amount received by each Fund for Class B and Class C shares sold, respectively, plus (ii) interest calculated by applying the rate of 1% over the prevailing prime rate to the outstanding balance of Uncovered Distribution Charges of EVD of each respective class, reduced by the aggregate amount of contingent deferred sales charges (see Note 5) and amounts theretofore paid or payable to EVD by each respective class. For the year ended March 31, 2009, the Funds paid or accrued to EVD the following distribution fees, representing 0.75% of the average daily net assets of each Fund’s Class B and Class C shares:
| | | | | | | | | | | |
| | | Class B
| | | Class C
| | | |
| | | Distribution
| | | Distribution
| | | |
| Fund | | Fees | | | Fees | | | |
| |
| AMT-Free Limited | | $ | 8,074 | | | $ | 66,048 | | | |
| National Limited | | | 42,329 | | | | 771,058 | | | |
At March 31, 2009, the amounts of Uncovered Distribution Charges of EVD calculated under the Class B and Class C Plans were approximately as follows:
| | | | | | | | | | | |
| Fund | | Class B | | | Class C | | | |
| |
| AMT-Free Limited | | $ | 1,022,000 | | | $ | 9,955,000 | | | |
| National Limited | | | 1,467,000 | | | | 17,412,000 | | | |
The Class B and Class C Plans also authorize the Funds to make payments of service fees to EVD, investment dealers and other persons in amounts not exceeding 0.25% per annum of the average daily net assets attributable to that class. The Trustees approved service fee payments equal to 0.15% per annum of each Fund’s average daily net assets attributable to Class B and Class C shares. Service fees paid or accrued are for personal services and/or the maintenance of shareholder accounts. They are separate and distinct from the Class B and Class C sales commissions and distribution fees and, as such, are not subject to automatic discontinuance when there are no outstanding Uncovered Distribution Charges of EVD. Service fees paid or accrued for the year ended March 31, 2009 amounted to the following:
| | | | | | | | | | | |
| | | Class B
| | | Class C
| | | |
| Fund | | Service Fees | | | Service Fees | | | |
| |
| AMT-Free Limited | | $ | 1,615 | | | $ | 13,209 | | | |
| National Limited | | | 8,466 | | | | 154,211 | | | |
5 Contingent Deferred Sales Charges
A contingent deferred sales charge (CDSC) generally is imposed on redemptions of Class B shares made within four years of purchase and on redemptions of Class C shares made within one year of purchase. Class A shares may be subject to a 1% CDSC if redeemed within eighteen months of purchase (depending on the circumstances of purchase). Generally, the CDSC is based upon the lower of the net asset value at date of redemption or date of purchase. No charge is levied on shares acquired by reinvestment of dividends or capital gain distributions. The CDSC for Class B shares is imposed at declining rates that begin at 3% in the case of redemptions in the first year after purchase, declining half a percentage point in the second and third year and one percentage point in the fourth year. Class C shares are subject to a 1% CDSC if redeemed within one year of purchase. No CDSC is levied on shares which have been sold to EVM or its affiliates or to their respective employees or clients and may be waived under certain other limited conditions. CDSCs received on Class B and Class C redemptions are paid to EVD to reduce the amount of Uncovered Distribution Charges calculated under each Fund’s Class B and Class C Plans. CDSCs received on Class B and Class C redemptions when no Uncovered Distribution Charges exist are credited to each Fund. For the year ended March 31, 2009, the Funds were
34
Eaton Vance Limited Maturity Municipals Funds as of March 31, 2009
NOTES TO FINANCIAL STATEMENTS CONT’D
informed that EVD received approximately the following amounts of CDSCs paid by Class A, Class B and Class C shareholders:
| | | | | | | | | | | | | | | |
| Fund | | Class A | | | Class B | | | Class C | | | |
| |
| AMT-Free Limited | | $ | 300 | | | $ | 8,000 | | | $ | 400 | | | |
| National Limited | | | 100,000 | | | | 14,000 | | | | 27,000 | | | |
6 Purchases and Sales of Investments
Purchases and sales of investments, other than short-term obligations, for the year ended March 31, 2009 were as follows:
| | | | | | | | | | | |
| Fund | | Purchases | | | Sales | | | |
| |
| AMT-Free Limited | | $ | 54,878,187 | | | $ | 33,583,133 | | | |
| National Limited | | | 209,997,126 | | | | 202,861,010 | | | |
7 Shares of Beneficial Interest
Each Fund’s Declaration of Trust permits the Trustees to issue an unlimited number of full and fractional shares of beneficial interest (without par value). Such shares may be issued in a number of different series (such as the Funds) and classes. Transactions in Fund shares were as follows:
| | | | | | | | | | | |
| AMT-Free Limited Fund |
| |
| | | Year Ended March 31, |
| Class A | | 2009 | | | 2008 | | | |
| |
| Sales | | | 2,992,848 | | | | 370,678 | | | |
| Issued to shareholders electing to receive payments of distributions in Fund shares | | | 84,122 | | | | 63,755 | | | |
| Redemptions | | | (907,639 | ) | | | (890,150 | ) | | |
| Exchange from Class B shares | | | 61,223 | | | | 165,022 | | | |
| |
| |
Net increase (decrease) | | | 2,230,554 | | | | (290,695 | ) | | |
| |
| |
| | | | | | | | | | | |
| | | | | | | | | | | |
| | | Year Ended March 31, |
| Class B | | 2009 | | | 2008 | | | |
| |
| Sales | | | 81,336 | | | | 88,494 | | | |
| Issued to shareholders electing to receive payments of distributions in Fund shares | | | 2,052 | | | | 3,208 | | | |
| Redemptions | | | (47,714 | ) | | | (68,308 | ) | | |
| Exchange to Class A shares | | | (61,183 | ) | | | (164,923 | ) | | |
| |
| |
Net decrease | | | (25,509 | ) | | | (141,529 | ) | | |
| |
| |
| | | | | | | | | | | |
| | | | | | | | | | | |
| | | Year Ended March 31, |
| Class C | | 2009 | | | 2008 | | | |
| |
| Sales | | | 559,392 | | | | 163,733 | | | |
| Issued to shareholders electing to receive payments of distributions in Fund shares | | | 15,366 | | | | 11,775 | | | |
| Redemptions | | | (286,730 | ) | | | (253,409 | ) | | |
| |
| |
Net increase (decrease) | | | 288,028 | | | | (77,901 | ) | | |
| |
| |
| | | | | | | | | | | |
| National Limited Fund |
| |
| | | Year Ended March 31, |
| Class A | | 2009 | | | 2008 | | | |
| |
| Sales | | | 29,829,409 | | | | 41,246,963 | | | |
| Issued to shareholders electing to receive payments of distributions in Fund shares | | | 1,444,865 | | | | 1,228,854 | | | |
| Redemptions | | | (31,669,859 | ) | | | (23,789,515 | ) | | |
| Exchange from Class B shares | | | 370,690 | | | | 567,874 | | | |
| |
| |
Net increase (decrease) | | | (24,895 | ) | | | 19,254,176 | | | |
| |
| |
| | | | | | | | | | | |
| | | | | | | | | | | |
| | | Year Ended December 31, |
| Class B | | 2009 | | | 2008 | | | |
| |
| Sales | | | 533,121 | | | | 352,741 | | | |
| Issued to shareholders electing to receive payments of distributions in Fund shares | | | 9,991 | | | | 15,752 | | | |
| Redemptions | | | (161,765 | ) | | | (242,951 | ) | | |
| Exchange to Class A shares | | | (370,340 | ) | | | (567,495 | ) | | |
| |
| |
Net increase (decrease) | | | 11,007 | | | | (441,953 | ) | | |
| |
| |
| | | | | | | | | | | |
| | | | | | | | | | | |
| | | Year Ended December 31, |
| Class C | | 2009 | | | 2008 | | | |
| |
| Sales | | | 5,916,492 | | | | 5,790,528 | | | |
| Issued to shareholders electing to receive payments of distributions in Fund shares | | | 168,622 | | | | 126,175 | | | |
| Redemptions | | | (4,756,943 | ) | | | (3,421,894 | ) | | |
| |
| |
Net increase | | | 1,328,171 | | | | 2,494,809 | | | |
| |
| |
8 Federal Income Tax Basis of Investments
The cost and unrealized appreciation (depreciation) of investments of each Fund at March 31, 2009, as determined on a federal income tax basis, were as follows:
| | | | | | | |
AMT-Free Limited Fund | | | | | | |
| |
| |
Aggregate cost | | $ | 58,710,636 | | | |
| |
| |
| Gross unrealized appreciation | | $ | 2,728,157 | | | |
| Gross unrealized depreciation | | | (1,835,210 | ) | | |
| |
| |
Net unrealized appreciation | | $ | 892,947 | | | |
| |
| |
| | | | | | | |
National Limited Fund | | | | | | |
| |
| |
Aggregate cost | | $ | 637,439,967 | | | |
| |
| |
| Gross unrealized appreciation | | $ | 13,202,550 | | | |
| Gross unrealized depreciation | | | (46,735,802 | ) | | |
| |
| |
Net unrealized depreciation | | $ | (33,533,252 | ) | | |
| |
| |
35
Eaton Vance Limited Maturity Municipals Funds as of March 31, 2009
NOTES TO FINANCIAL STATEMENTS CONT’D
9 Line of Credit
The Funds participate with other portfolios and funds managed by EVM and its affiliates in a $450 million unsecured line of credit agreement with a group of banks. Borrowings are made by the Funds solely to facilitate the handling of unusual and/or unanticipated short-term cash requirements. Interest is charged to each Fund based on its borrowings at an amount above either the Eurodollar rate or Federal Funds rate. In addition, a fee computed at an annual rate of 0.10% on the daily unused portion of the line of credit is allocated among the participating portfolios and funds at the end of each quarter. The Funds did not have any significant borrowings or allocated fees during the year ended March 31, 2009.
10 Financial Instruments
The Funds may trade in financial instruments with off-balance sheet risk in the normal course of their investing activities. These financial instruments may include financial futures contracts and may involve, to a varying degree, elements of risk in excess of the amounts recognized for financial statement purposes. The notional or contractual amounts of these instruments represent the investment a Fund has in particular classes of financial instruments and does not necessarily represent the amounts potentially subject to risk. The measurement of the risks associated with these instruments is meaningful only when all related and offsetting transactions are considered.
A summary of obligations under these financial instruments outstanding at March 31, 2009 is as follows:
| | | | | | | | | | | | | | | | | | | | | |
| Futures Contracts |
| |
| | | | | | | | | | | | | | | Net
| | | |
| | | Expiration
| | | | | | Aggregate
| | | | | | Unrealized
| | | |
| Fund | | Date | | Contracts | | Position | | Cost | | | Value | | | Depreciation | | | |
| |
| AMT-Free Limited | | 6/09 | | 40
U.S. Treasury Bond | | Short | | $ | (5,104,860 | ) | | $ | (5,188,125 | ) | | $ | (83,265 | ) | | |
| |
| |
| National Limited | | 6/09 | | 477 | | | | | | | | | | | | | | | | |
| | | | | U.S. Treasury Bond | | Short | | $ | (60,875,456 | ) | | $ | (61,868,391 | ) | | $ | (992,935 | ) | | |
| | | 6/09 | | 439 | | | | | | | | | | | | | | | | |
| | | | | U.S. Treasury Note | | Short | | $ | (53,615,579 | ) | | $ | (54,470,297 | ) | | $ | (854,718 | ) | | |
| |
| |
At March 31, 2009, the Funds had sufficient cash and/or securities to cover commitments under these contracts.
11 Fair Value Measurements
The Funds adopted FASB Statement of Financial Accounting Standards No. 157 (FAS 157), “Fair Value Measurements”, effective April 1, 2008. FAS 157 established a three-tier hierarchy to prioritize the assumptions, referred to as inputs, used in valuation techniques to measure fair value. The three-tier hierarchy of inputs is summarized in the three broad levels listed below.
| | |
| | • | Level 1 – quoted prices in active markets for identical investments |
| |
| | • | Level 2 – other significant observable inputs (including quoted prices for similar investments, interest rates, prepayment speeds, credit risk, etc.) |
| |
| | • | Level 3 – significant unobservable inputs (including a fund’s own assumptions in determining the fair value of investments) |
The inputs or methodology used for valuing securities are not necessarily an indication of the risk associated with investing in those securities.
At March 31, 2009, the inputs used in valuing the Funds’ investments, which are carried at value, were as follows:
| | | | | | | | | | | | | |
| AMT-Free Limited Fund |
| |
| | | | | Investments in
| | | Other Financial
| | | |
| | | Valuation Inputs | | Securities | | | Instruments* | | | |
| |
| Level 1 | | Quoted Prices | | $ | — | | | $ | (83,265 | ) | | |
| Level 2 | | Other Significant Observable Inputs | | | 59,603,583 | | | | — | | | |
| Level 3 | | Significant Unobservable Inputs | | | — | | | | — | | | |
| |
| |
Total | | | | $ | 59,603,583 | | | $ | (83,265 | ) | | |
| |
| |
| | | | | | | | | | | | | |
| | | | | | | | | | | | | |
| National Limited Fund |
| |
| | | | | Investments in
| | | Other Financial
| | | |
| | | Valuation Inputs | | Securities | | | Instruments* | | | |
| |
| Level 1 | | Quoted Prices | | $ | — | | | $ | (1,847,653 | ) | | |
| Level 2 | | Other Significant Observable Inputs | | | 608,886,715 | | | | — | | | |
| Level 3 | | Significant Unobservable Inputs | | | — | | | | — | | | |
| |
| |
Total | | | | $ | 608,886,715 | | | $ | (1,847,653 | ) | | |
| |
| |
| | |
| * | | Other financial instruments are futures contracts not reflected in the Portfolio of Investments, which are valued at the unrealized appreciation (depreciation) on the instrument. |
The Funds held no investments or other financial instruments as of March 31, 2008 whose fair value was determined using Level 3 inputs.
12 Recently Issued Accounting Pronouncement
In March 2008, the FASB issued Statement of Financial Accounting Standards No. 161 (FAS 161), “Disclosures about Derivative Instruments and Hedging Activities”. FAS 161 requires enhanced disclosures about an entity’s derivative and hedging activities, including qualitative disclosures about the objectives and strategies for using derivatives, quantitative disclosures about fair value amounts of and gains and losses on derivative instruments, and disclosures about credit-risk related contingent features in derivative instruments. FAS 161 is effective for fiscal years and interim periods beginning after
36
Eaton Vance Limited Maturity Municipals Funds as of March 31, 2009
NOTES TO FINANCIAL STATEMENTS CONT’D
November 15, 2008. Management is currently evaluating the impact the adoption of FAS 161 will have on the Funds’ financial statement disclosures.
13 Subsequent Event — Proposed Plan of Reorganization
On April 27, 2009, the Trustees of the Trust approved an Agreement and Plan of Reorganization whereby National Limited Fund would acquire substantially all the assets and assume substantially all the liabilities of Eaton Vance Ohio Limited Maturity Municipals Fund in exchange for shares of National Limited Fund. The proposed reorganization is subject to approval by the shareholders of Eaton Vance Ohio Limited Maturity Municipals Fund.
37
Eaton Vance Limited Maturity Municipals Funds as of March 31, 2009
REPORT OF INDEPENDENT REGISTERED PUBLIC ACCOUNTING FIRM
To the Trustees of Eaton Vance Investment Trust and Shareholders of Eaton Vance AMT-Free Limited Maturity Municipals Fund (formerly Eaton Vance Florida Plus Limited Maturity Municipals Fund) and Eaton Vance National Limited Maturity Municipals Fund:
We have audited the accompanying statements of assets and liabilities of Eaton Vance AMT-Free Limited Maturity Municipals Fund (formerly Eaton Vance Florida Plus Limited Maturity Municipals Fund) and Eaton Vance National Limited Maturity Municipals Fund (collectively, the “Funds”) (certain of the funds constituting Eaton Vance Investment Trust), including the portfolios of investments, as of March 31, 2009, and the related statements of operations for the year then ended, the statements of changes in net assets for each of the two years in the period then ended, and the financial highlights for each of the five years in the period then ended. These financial statements and financial highlights are the responsibility of the Funds’ management. Our responsibility is to express an opinion on these financial statements and financial highlights based on our audits.
We conducted our audits in accordance with the standards of the Public Company Accounting Oversight Board (United States). Those standards require that we plan and perform the audit to obtain reasonable assurance about whether the financial statements and financial highlights are free of material misstatement. The Funds are not required to have, nor were we engaged to perform, an audit of the Funds’ internal control over financial reporting. Our audits included consideration of internal control over financial reporting as a basis for designing audit procedures that are appropriate in the circumstances, but not for the purpose of expressing an opinion on the effectiveness of the Funds’ internal control over financial reporting. Accordingly, we express no such opinion. An audit also includes examining, on a test basis, evidence supporting the amounts and disclosures in the financial statements, assessing the accounting principles used and significant estimates made by management, as well as evaluating the overall financial statement presentation. Our procedures included confirmation of securities owned as of March 31, 2009, by correspondence with the custodian. We believe that our audits provide a reasonable basis for our opinion.
In our opinion, the financial statements and financial highlights referred to above present fairly, in all material respects, the financial positions of Eaton Vance AMT-Free Limited Maturity Municipals Fund and Eaton Vance National Limited Maturity Municipals Fund as of March 31, 2009, the results of their operations for the year then ended, the changes in their net assets for each of the two years in the period then ended, and the financial highlights for each of the five years in the period then ended, in conformity with accounting principles generally accepted in the United States of America.
DELOITTE & TOUCHE LLP
Boston, Massachusetts
May 15, 2009
38
Eaton Vance Limited Maturity Municipals Funds as of March 31, 2009
FEDERAL TAX INFORMATION (Unaudited)
The Form 1099-DIV you receive in January 2010 will show the tax status of all distributions paid to your account in calendar 2009. Shareholders are advised to consult their own tax adviser with respect to the tax consequences of their investment in a Fund. As required by the Internal Revenue Code regulations, shareholders must be notified within 60 days of a Fund’s fiscal year end regarding the status of exempt-interest dividends.
Exempt-Interest Dividends. The Funds designate the following percentages of dividends from net investment income as an exempt-interest dividend.
| | | | | |
| AMT-Free Limited Maturity Municipals Fund | | | 94.92% | |
| National Limited Maturity Municipals Fund | | | 99.89% | |
39
Eaton Vance Limited Maturity Municipals Funds as of March 31, 2009
SPECIAL MEETING OF SHAREHOLDERS (Unaudited)
Eaton Vance AMT-Free Limited Maturity Municipals Fund
The Fund held a Special Meeting of Shareholders on November 14, 2008 to elect Trustees. The results of the vote were as follows:
| | | | | | | | | | | |
| | | Number of Shares | | | |
| Nominee for Trustee | | For | | | Withheld | | | |
| |
| |
| Benjamin C. Esty | | | 3,602,458 | | | | 76,240 | | | |
| Thomas E. Faust Jr. | | | 3,602,458 | | | | 76,240 | | | |
| Allen R. Freedman | | | 3,602,458 | | | | 76,240 | | | |
| William H. Park | | | 3,602,458 | | | | 76,240 | | | |
| Ronald A. Pearlman | | | 3,602,458 | | | | 76,240 | | | |
| Helen Frame Peters | | | 3,602,458 | | | | 76,240 | | | |
| Heidi L. Steiger | | | 3,602,458 | | | | 76,240 | | | |
| Lynn A. Stout | | | 3,602,458 | | | | 76,240 | | | |
| Ralph F. Verni | | | 3,602,458 | | | | 76,240 | | | |
Eaton Vance National Limited Maturity Municipals Fund
The Fund held a Special Meeting of Shareholders on November 14, 2008 to elect Trustees. The results of the vote were as follows:
| | | | | | | | | | | |
| | | Number of Shares | | | |
| Nominee for Trustee | | For | | | Withheld | | | |
| |
| |
| Benjamin C. Esty | | | 63,202,717 | | | | 173,923 | | | |
| Thomas E. Faust Jr. | | | 63,167,952 | | | | 208,689 | | | |
| Allen R. Freedman | | | 63,121,934 | | | | 254,707 | | | |
| William H. Park | | | 63,189,657 | | | | 186,984 | | | |
| Ronald A. Pearlman | | | 63,111,061 | | | | 265,580 | | | |
| Helen Frame Peters | | | 63,197,258 | | | | 179,382 | | | |
| Heidi L. Steiger | | | 63,164,215 | | | | 212,426 | | | |
| Lynn A. Stout | | | 63,205,685 | | | | 170,955 | | | |
| Ralph F. Verni | | | 63,166,059 | | | | 210,582 | | | |
40
Eaton Vance Limited Maturity Municipals Funds
BOARD OF TRUSTEES’ ANNUAL APPROVAL OF THE INVESTMENT ADVISORY AGREEMENT
AMT-Free Limited Maturity Municipals Fund
Overview of the Contract Review Process
The Investment Company Act of 1940, as amended (the “1940 Act”), provides, in substance, that each investment advisory agreement between a fund and its investment adviser will continue in effect from year to year only if its continuance is approved at least annually by the fund’s board of trustees, including by a vote of a majority of the trustees who are not “interested persons” of the fund (“Independent Trustees”), cast in person at a meeting called for the purpose of considering such approval.
At a meeting of the Boards of Trustees (each a “Board”) of the Eaton Vance group of mutual funds (the “Eaton Vance Funds”) held on April 21, 2008, the Board, including a majority of the Independent Trustees, voted to approve continuation of existing advisory and sub-advisory agreements for the Eaton Vance Funds for an additional one-year period. In voting its approval, the Board relied upon the affirmative recommendation of the Contract Review Committee of the Board (formerly the Special Committee), which is a committee comprised exclusively of Independent Trustees. Prior to making its recommendation, the Contract Review Committee reviewed information furnished for a series of meetings of the Contract Review Committee held in February, March and April 2008. Such information included, among other things, the following:
Information about Fees, Performance and Expenses
| | |
| | • | An independent report comparing the advisory and related fees paid by each fund with fees paid by comparable funds; |
| | • | An independent report comparing each fund’s total expense ratio and its components to comparable funds; |
| | • | An independent report comparing the investment performance of each fund to the investment performance of comparable funds over various time periods; |
| | • | Data regarding investment performance in comparison to relevant peer groups of funds and appropriate indices; |
| | • | Comparative information concerning fees charged by each adviser for managing other mutual funds and institutional accounts using investment strategies and techniques similar to those used in managing the fund; |
| | • | Profitability analyses for each adviser with respect to each fund; |
Information about Portfolio Management
| | |
| | • | Descriptions of the investment management services provided to each fund, including the investment strategies and processes employed, and any changes in portfolio management processes and personnel; |
| | • | Information concerning the allocation of brokerage and the benefits received by each adviser as a result of brokerage allocation, including information concerning the acquisition of research through “soft dollar” benefits received in connection with the funds’ brokerage, and the implementation of a soft dollar reimbursement program established with respect to the funds; |
| | • | Data relating to portfolio turnover rates of each fund; |
| | • | The procedures and processes used to determine the fair value of fund assets and actions taken to monitor and test the effectiveness of such procedures and processes; |
Information about each Adviser
| | |
| | • | Reports detailing the financial results and condition of each adviser; |
| | • | Descriptions of the qualifications, education and experience of the individual investment professionals whose responsibilities include portfolio management and investment research for the funds, and information relating to their compensation and responsibilities with respect to managing other mutual funds and investment accounts; |
| | • | Copies of the Codes of Ethics of each adviser and its affiliates, together with information relating to compliance with and the administration of such codes; |
| | • | Copies of or descriptions of each adviser’s proxy voting policies and procedures; |
| | • | Information concerning the resources devoted to compliance efforts undertaken by each adviser and its affiliates on behalf of the funds (including descriptions of various compliance programs) and their record of compliance with investment policies and restrictions, including policies with respect to market-timing, late trading and selective portfolio disclosure, and with policies on personal securities transactions; |
| | • | Descriptions of the business continuity and disaster recovery plans of each adviser and its affiliates; |
Other Relevant Information
| | |
| | • | Information concerning the nature, cost and character of the administrative and other non-investment management services provided by Eaton Vance Management and its affiliates; |
| | • | Information concerning management of the relationship with the custodian, subcustodians and fund accountants by each adviser or the funds’ administrator; and |
| | • | The terms of each advisory agreement. |
41
Eaton Vance Limited Maturity Municipals Funds
BOARD OF TRUSTEES’ ANNUAL APPROVAL OF THE INVESTMENT ADVISORY AGREEMENT CONT’D
AMT-Free Limited Maturity Municipals Fund
In addition to the information identified above, the Contract Review Committee considered information provided from time to time by each adviser throughout the year at meetings of the Board and its committees. Over the course of the twelve-month period ended April 30, 2008, the Board met eleven times and the Contract Review Committee, the Audit Committee and the Governance Committee, each of which is a Committee comprised solely of Independent Trustees, met twelve, seven and five times, respectively. At such meetings, the Trustees received, among other things, presentations by the portfolio managers and other investment professionals of each adviser relating to the investment performance of each fund and the investment strategies used in pursuing the fund’s investment objective. The Portfolio Management Committee and the Compliance Reports and Regulatory Matters Committee are newly established and did not meet during the twelve-month period ended April 30, 2008.
For funds that invest through one or more underlying portfolios, the Board considered similar information about the portfolio(s) when considering the approval of advisory agreements. In addition, in cases where the fund’s investment adviser has engaged a sub-adviser, the Board considered similar information about the sub-adviser when considering the approval of any sub-advisory agreement.
The Contract Review Committee was assisted throughout the contract review process by Goodwin Procter LLP, legal counsel for the Independent Trustees. The members of the Contract Review Committee relied upon the advice of such counsel and their own business judgment in determining the material factors to be considered in evaluating each advisory and sub-advisory agreement and the weight to be given to each such factor. The conclusions reached with respect to each advisory and sub-advisory agreement were based on a comprehensive evaluation of all the information provided and not any single factor. Moreover, each member of the Contract Review Committee may have placed varying emphasis on particular factors in reaching conclusions with respect to each advisory and sub-advisory agreement.
Results of the Process
Based on its consideration of the foregoing, and such other information as it deemed relevant, including the factors and conclusions described below, the Contract Review Committee concluded that the continuance of the investment advisory agreement of the Eaton Vance AMT-Free Limited Maturity Municipals Fund (the “Fund”) with Boston Management and Research (the “Adviser”), including its fee structure, is in the interests of shareholders and, therefore, the Contract Review Committee recommended to the Board approval of the agreement. The Board accepted the recommendation of the Contract Review Committee as well as the factors considered and conclusions reached by the Contract Review Committee with respect to the agreement. Accordingly, the Board, including a majority of the Independent Trustees, voted to approve continuation of the investment advisory agreement for the Fund.
Nature, Extent and Quality of Services
In considering whether to approve the investment advisory agreement of the Fund, the Board evaluated the nature, extent and quality of services provided to the Fund by the Adviser.
The Board considered the Adviser’s management capabilities and investment process with respect to the types of investments held by the Fund, including the education, experience and number of its investment professionals and other personnel who provide portfolio management, investment research, and similar services to the Fund. In particular, the Board evaluated the abilities and experience of such investment personnel in analyzing factors such as credit risk, tax efficiency, and special considerations relevant to investing in municipal obligations. Specifically, the Board considered the Adviser’s large municipal bond team, which includes portfolio managers and credit specialists who provide services to the Funds. The Board also took into account the resources dedicated to portfolio management and other services, including the compensation paid to recruit and retain investment personnel, and the time and attention devoted to the Fund by senior management.
The Board also reviewed the compliance programs of the Adviser and relevant affiliates thereof. Among other matters, the Board considered compliance and reporting matters relating to personal trading by investment personnel, selective disclosure of portfolio holdings, late trading, frequent trading, portfolio valuation, business continuity and the allocation of investment opportunities. The Board also evaluated the responses of the Adviser and its affiliates to requests from regulatory authorities such as the Securities and Exchange Commission.
The Board also considered shareholder and other administrative services provided or managed by Eaton Vance Management and its affiliates, including transfer agency and accounting services. The Board evaluated the benefits to shareholders of investing in a fund that is a part of a large family of funds, including the ability, in many cases, to exchange an investment among different funds without incurring additional sales charges.
After consideration of the foregoing factors, among others, the Board concluded that the nature, extent and quality of services provided by the Adviser, taken as a whole, are appropriate and consistent with the terms of the investment advisory agreement.
42
Eaton Vance Limited Maturity Municipals Funds
BOARD OF TRUSTEES’ ANNUAL APPROVAL OF THE INVESTMENT ADVISORY AGREEMENT CONT’D
AMT-Free Limited Maturity Municipals Fund
Fund Performance
The Board compared the Fund’s investment performance to a relevant universe of similarly managed funds identified by an independent data provider and appropriate benchmark indices. The Board reviewed comparative performance data for the one-, three-, five- and ten-year periods ended September 30, 2007 for the Fund in operation over such periods. On the basis of the foregoing and other relevant information, the Board concluded that the performance of the Fund was satisfactory.
Management Fees and Expenses
The Board reviewed contractual investment advisory fee rates, including any administrative fee rates, payable by the Fund (referred to collectively as “management fees”). As part of its review, the Board considered the Fund’s management fee and total expense ratio for the one year period ended September 30, 2007, as compared to a group of similarly managed funds selected by an independent data provider.
After reviewing the foregoing information, and in light of the nature, extent and quality of the services provided by the Adviser, the Board concluded with respect to the Fund that the management fees charged to the Fund for advisory and related services and the total expense ratio of the Fund are reasonable.
Profitability
The Board reviewed the level of profits realized by the Adviser and, if applicable, its affiliates in providing investment advisory and administrative services to the Fund and to all Eaton Vance Funds as a group. The Board considered the level of profits realized without regard to revenue sharing or other payments by the Adviser and its affiliates to third parties in respect of distribution services. The Board also considered other direct or indirect benefits received by the Adviser and its affiliates in connection with its relationship with the Fund.
The Board concluded that, in light of the foregoing factors and the nature, extent and quality of the services rendered, the profits realized by the Adviser and its affiliates are reasonable.
Economies of Scale
In reviewing management fees and profitability, the Board also considered the extent to which the Adviser and its affiliates, on the one hand, and the Fund, on the other hand, can expect to realize benefits from economies of scale as the assets of the Fund increase. The Board acknowledged the difficulty in accurately measuring the benefits resulting from the economies of scale with respect to the management of any specific fund or group of funds. The Board reviewed data summarizing the increases and decreases in the assets of the Fund and of all Eaton Vance Funds as a group over various time periods, and evaluated the extent to which the total expense ratio of the Fund and the profitability of the Adviser and its affiliates may have been affected by such increases or decreases. Based upon the foregoing, the Board concluded that the benefits from economies of scale are currently being shared equitably by the Adviser and its affiliates and the Fund. The Board also concluded that, assuming reasonably foreseeable increases in the assets of the Fund, the structure of the advisory fee, which includes breakpoints at several asset levels, can be expected to cause the Adviser and its affiliates and the Fund to continue to share such benefits equitably.
43
Eaton Vance Limited Maturity Municipals Funds
BOARD OF TRUSTEES’ ANNUAL APPROVAL OF THE INVESTMENT ADVISORY AGREEMENT
National Limited Maturity Municipals Fund
Overview of the Contract Review Process
The Investment Company Act of 1940, as amended (the “1940 Act”), provides, in substance, that each investment advisory agreement between a fund and its investment adviser will continue in effect from year to year only if its continuance is approved at least annually by the fund’s board of trustees, including by a vote of a majority of the trustees who are not “interested persons” of the fund (“Independent Trustees”), cast in person at a meeting called for the purpose of considering such approval.
At a meeting of the Boards of Trustees (each a “Board”) of the Eaton Vance group of mutual funds (the “Eaton Vance Funds”) held on April 21, 2008, the Board, including a majority of the Independent Trustees, voted to approve continuation of existing advisory and sub-advisory agreements for the Eaton Vance Funds for an additional one-year period. In voting its approval, the Board relied upon the affirmative recommendation of the Contract Review Committee of the Board (formerly the Special Committee), which is a committee comprised exclusively of Independent Trustees. Prior to making its recommendation, the Contract Review Committee reviewed information furnished for a series of meetings of the Contract Review Committee held in February, March and April 2008. Such information included, among other things, the following:
Information about Fees, Performance and Expenses
| | |
| | • | An independent report comparing the advisory and related fees paid by each fund with fees paid by comparable funds; |
| | • | An independent report comparing each fund’s total expense ratio and its components to comparable funds; |
| | • | An independent report comparing the investment performance of each fund to the investment performance of comparable funds over various time periods; |
| | �� | Data regarding investment performance in comparison to relevant peer groups of funds and appropriate indices; |
| | • | Comparative information concerning fees charged by each adviser for managing other mutual funds and institutional accounts using investment strategies and techniques similar to those used in managing the fund; |
| | • | Profitability analyses for each adviser with respect to each fund; |
Information about Portfolio Management
| | |
| | • | Descriptions of the investment management services provided to each fund, including the investment strategies and processes employed, and any changes in portfolio management processes and personnel; |
| | • | Information concerning the allocation of brokerage and the benefits received by each adviser as a result of brokerage allocation, including information concerning the acquisition of research through “soft dollar” benefits received in connection with the funds’ brokerage, and the implementation of a soft dollar reimbursement program established with respect to the funds; |
| | • | Data relating to portfolio turnover rates of each fund; |
| | • | The procedures and processes used to determine the fair value of fund assets and actions taken to monitor and test the effectiveness of such procedures and processes; |
Information about each Adviser
| | |
| | • | Reports detailing the financial results and condition of each adviser; |
| | • | Descriptions of the qualifications, education and experience of the individual investment professionals whose responsibilities include portfolio management and investment research for the funds, and information relating to their compensation and responsibilities with respect to managing other mutual funds and investment accounts; |
| | • | Copies of the Codes of Ethics of each adviser and its affiliates, together with information relating to compliance with and the administration of such codes; |
| | • | Copies of or descriptions of each adviser’s proxy voting policies and procedures; |
| | • | Information concerning the resources devoted to compliance efforts undertaken by each adviser and its affiliates on behalf of the funds (including descriptions of various compliance programs) and their record of compliance with investment policies and restrictions, including policies with respect to market-timing, late trading and selective portfolio disclosure, and with policies on personal securities transactions; |
| | • | Descriptions of the business continuity and disaster recovery plans of each adviser and its affiliates; |
Other Relevant Information
| | |
| | • | Information concerning the nature, cost and character of the administrative and other non-investment management services provided by Eaton Vance Management and its affiliates; |
| | • | Information concerning management of the relationship with the custodian, subcustodians and fund accountants by each adviser or the funds’ administrator; and |
| | • | The terms of each advisory agreement. |
44
Eaton Vance Limited Maturity Municipals Funds
BOARD OF TRUSTEES’ ANNUAL APPROVAL OF THE INVESTMENT ADVISORY AGREEMENT CONT’D
National Limited Maturity Municipals Fund
In addition to the information identified above, the Contract Review Committee considered information provided from time to time by each adviser throughout the year at meetings of the Board and its committees. Over the course of the twelve-month period ended April 30, 2008, the Board met eleven times and the Contract Review Committee, the Audit Committee and the Governance Committee, each of which is a Committee comprised solely of Independent Trustees, met twelve, seven and five times, respectively. At such meetings, the Trustees received, among other things, presentations by the portfolio managers and other investment professionals of each adviser relating to the investment performance of each fund and the investment strategies used in pursuing the fund’s investment objective. The Portfolio Management Committee and the Compliance Reports and Regulatory Matters Committee are newly established and did not meet during the twelve-month period ended April 30, 2008.
For funds that invest through one or more underlying portfolios, the Board considered similar information about the portfolio(s) when considering the approval of advisory agreements. In addition, in cases where the fund’s investment adviser has engaged a sub-adviser, the Board considered similar information about the sub-adviser when considering the approval of any sub-advisory agreement.
The Contract Review Committee was assisted throughout the contract review process by Goodwin Procter LLP, legal counsel for the Independent Trustees. The members of the Contract Review Committee relied upon the advice of such counsel and their own business judgment in determining the material factors to be considered in evaluating each advisory and sub-advisory agreement and the weight to be given to each such factor. The conclusions reached with respect to each advisory and sub-advisory agreement were based on a comprehensive evaluation of all the information provided and not any single factor. Moreover, each member of the Contract Review Committee may have placed varying emphasis on particular factors in reaching conclusions with respect to each advisory and sub-advisory agreement.
Results of the Process
Based on its consideration of the foregoing, and such other information as it deemed relevant, including the factors and conclusions described below, the Contract Review Committee concluded that the continuance of the investment advisory agreement of the Eaton Vance National Limited Maturity Municipals Fund (the “Fund”) with Boston Management and Research (the “Adviser”), including its fee structure, is in the interests of shareholders and, therefore, the Contract Review Committee recommended to the Board approval of the agreement. The Board accepted the recommendation of the Contract Review Committee as well as the factors considered and conclusions reached by the Contract Review Committee with respect to the agreement. Accordingly, the Board, including a majority of the Independent Trustees, voted to approve continuation of the investment advisory agreement for the Fund.
Nature, Extent and Quality of Services
In considering whether to approve the investment advisory agreement of the Fund, the Board evaluated the nature, extent and quality of services provided to the Fund by the Adviser.
The Board considered the Adviser’s management capabilities and investment process with respect to the types of investments held by the Fund, including the education, experience and number of its investment professionals and other personnel who provide portfolio management, investment research, and similar services to the Fund. In particular, the Board evaluated, where relevant, the abilities and experience of such investment personnel in analyzing factors such as credit risk, tax efficiency, and special considerations relevant to investing in particular foreign markets or industries. Specifically, the Board considered the Adviser’s large municipal bond team, which includes portfolio managers and credit specialists who provide services to the Funds. The Board also took into account the resources dedicated to portfolio management and other services, including the compensation paid to recruit and retain investment personnel, and the time and attention devoted to the Fund by senior management.
The Board also reviewed the compliance programs of the Adviser and relevant affiliates thereof. Among other matters, the Board considered compliance and reporting matters relating to personal trading by investment personnel, selective disclosure of portfolio holdings, late trading, frequent trading, portfolio valuation, business continuity and the allocation of investment opportunities. The Board also evaluated the responses of the Adviser and its affiliates to requests from regulatory authorities such as the Securities and Exchange Commission.
The Board considered shareholder and other administrative services provided or managed by Eaton Vance Management and its affiliates, including transfer agency and accounting services. The Board evaluated the benefits to shareholders of investing in a fund that is a part of a large family of funds, including the ability, in many cases, to exchange an investment among different funds without incurring additional sales charges.
After consideration of the foregoing factors, among others, the Board concluded that the nature, extent and quality of services provided by the Adviser, taken as a whole, are appropriate and consistent with the terms of the investment advisory agreement.
45
Eaton Vance Limited Maturity Municipals Funds
BOARD OF TRUSTEES’ ANNUAL APPROVAL OF THE INVESTMENT ADVISORY AGREEMENT CONT’D
National Limited Maturity Municipals Fund
Fund Performance
The Board compared the Fund’s investment performance to a relevant universe of similarly managed funds identified by an independent data provider and appropriate benchmark indices. The Board reviewed comparative performance data for the one-, three-, five- and ten-year periods ended September 30, 2007 for the Fund. On the basis of the foregoing and other relevant information, the Board concluded that the performance of the Fund was satisfactory.
Management Fees and Expenses
The Board reviewed contractual investment advisory fee rates, including any administrative fee rates, payable by the Fund, (referred to as “management fees”). As part of its review, the Board considered the Fund’s management fee and total expense ratio for the year ended September 30, 2007, as compared to a group of similarly managed funds selected by an independent data provider.
After reviewing the foregoing information, and in light of the nature, extent and quality of the services provided by the Adviser, the Board concluded with respect to the Fund that the management fee charged to the Fund for advisory and related services and the total expense ratio of the Fund are reasonable.
Profitability
The Board reviewed the level of profits realized by the Adviser and, if applicable, its affiliates in providing investment advisory and administrative services to the Fund and to all Eaton Vance Funds as a group. The Board considered the level of profits realized without regard to revenue sharing or other payments by the Adviser and its affiliates to third parties in respect of distribution services. The Board also considered other direct or indirect benefits received by the Adviser in connection with its relationship with the Fund.
The Board concluded that, in light of the foregoing factors and the nature, extent and quality of the services rendered, the profits realized by the Adviser and its affiliates are reasonable.
Economies of Scale
In reviewing management fees and profitability, the Board also considered the extent to which the Adviser and its affiliates, on the one hand, and the Fund, on the other hand, can expect to realize benefits from economies of scale as the assets of the Fund increase. The Board acknowledged the difficulty in accurately measuring the benefits resulting from the economies of scale with respect to the management of any specific fund or group of funds. The Board reviewed data summarizing the increases and decreases in the assets of the Fund and of all Eaton Vance Funds as a group over various time periods, and evaluated the extent to which the total expense ratio of the Fund and the Adviser’s profitability may have been affected by such increases or decreases. Based upon the foregoing, the Board concluded that the benefits from economies of scale are currently being shared equitably by the Adviser and the Fund. The Board also concluded that, assuming reasonably foreseeable increases in the assets of the Fund, the structure of the advisory fee, which includes breakpoints at several asset levels, can be expected to cause the Adviser and its affiliates and the Fund to continue to share such benefits equitably.
46
Eaton Vance Limited Maturity Municipals Funds
MANAGEMENT AND ORGANIZATION
Fund Management. The Trustees of Eaton Vance Investment Trust (the Trust) are responsible for the overall management and supervision of the Trust’s affairs. The Trustees and officers of the Trust are listed below. Except as indicated, each individual has held the office shown or other offices in the same company for the last five years. Trustees and officers of the Trust hold indefinite terms of office. The “noninterested Trustees” consist of those Trustees who are not “interested persons” of the Trust, as that term is defined under the 1940 Act. The business address of each Trustee and officer is Two International Place, Boston, Massachusetts 02110. As used below, “EVC” refers to Eaton Vance Corp., “EV” refers to Eaton Vance, Inc., “EVM” refers to Eaton Vance Management, “BMR” refers to Boston Management and Research and “EVD” refers to Eaton Vance Distributors, Inc. EVC and EV are the corporate parent and trustee, respectively, of EVM and BMR. EVD is the Fund’s principal underwriter and a wholly-owned subsidiary of EVC. Each officer affiliated with Eaton Vance may hold a position with other Eaton Vance affiliates that is comparable to his or her position with EVM listed below.
| | | | | | | | | | | | | |
| | | | | Term of
| | | | Number of Portfolios
| | | |
| | | Position(s)
| | Office and
| | | | in Fund Complex
| | | |
Name and
| | with the
| | Length of
| | Principal Occupation(s)
| | Overseen By
| | | |
| Date of Birth | | Trust | | Service | | During Past Five Years | | Trustee(1) | | | Other Directorships Held |
| |
| |
| |
| Interested Trustee |
| | | | | | | | | | | | | |
Thomas E. Faust Jr.
5/31/58 | | Trustee | | Since 2007 | | Chairman, Chief Executive Officer and President of EVC, Director and President of EV, Chief Executive Officer and President of EVM and BMR, and Director of EVD. Trustee and/or Officer of 174 registered investment companies and 4 private companies managed by EVM or BMR. Mr. Faust is an interested person because of his positions with EVM, BMR, EVD, EVC and EV, which are affiliates of the Trust. | | | 174 | | | Director of EVC |
| |
| Noninterested Trustees |
| | | | | | | | | | | | | |
Benjamin C. Esty
1/2/63 | | Trustee | | Since 2005 | | Roy and Elizabeth Simmons Professor of Business Administration, Harvard University Graduate School of Business Administration. | | | 174 | | | None |
| | | | | | | | | | | | | |
Allen R. Freedman
4/3/40 | | Trustee | | Since 2007 | | Former Chairman (2002-2004) and a Director (1983-2004) of Systems & Computer Technology Corp. (provider of software to higher education). Formerly, a Director of Loring Ward International (fund distributor) (2005-2007). Formerly, Chairman and a Director of Indus International, Inc. (provider of enterprise management software to the power generating industry) (2005-2007). | | | 174 | | | Director of Assurant, Inc. (insurance provider) and Stonemor Partners, L.P. (owner and operator of cemeteries) |
| | | | | | | | | | | | | |
William H. Park
9/19/47 | | Trustee | | Since 2003 | | Vice Chairman, Commercial Industrial Finance Corp. (specialty finance company) (since 2006). Formerly, President and Chief Executive Officer, Prizm Capital Management, LLC (investment management firm) (2002-2005). | | | 174 | | | None |
| | | | | | | | | | | | | |
Ronald A. Pearlman
7/10/40 | | Trustee | | Since 2003 | | Professor of Law, Georgetown University Law Center. | | | 174 | | | None |
| | | | | | | | | | | | | |
Helen Frame Peters
3/22/48 | | Trustee | | Since 2008 | | Professor of Finance, Carroll School of Management, Boston College. Adjunct Professor of Finance, Peking University, Beijing, China (since 2005). | | | 174 | | | Director of Federal Home Loan Bank of Boston (a bank for banks) and BJ’s Wholesale Clubs (wholesale club retailer); Trustee of SPDR Index Shares Funds and SPDR Series Trust (exchange traded funds) |
| | | | | | | | | | | | | |
Heidi L. Steiger
7/8/53 | | Trustee | | Since 2007 | | Managing Partner, Topridge Associates LLC (global wealth management firm) (since 2008); Senior Advisor (since 2008), President (2005-2008), Lowenhaupt Global Advisors, LLC (global wealth management firm). Formerly, President and Contributing Editor, Worth Magazine (2004-2005). Formerly, Executive Vice President and Global Head of Private Asset Management (and various other positions), Neuberger Berman (investment firm) (1986-2004). | | | 174 | | | Director of Nuclear Electric Insurance Ltd. (nuclear insurance provider) and Aviva USA (insurance provider) |
47
Eaton Vance Limited Maturity Municipals Funds
MANAGEMENT AND ORGANIZATION CONT’D
| | | | | | | | | | | | | |
| | | | | Term of
| | | | Number of Portfolios
| | | |
| | | Position(s)
| | Office and
| | | | in Fund Complex
| | | |
Name and
| | with the
| | Length of
| | Principal Occupation(s)
| | Overseen By
| | | |
| Date of Birth | | Trust | | Service | | During Past Five Years | | Trustee(1) | | | Other Directorships Held |
| |
| |
| Noninterested Trustees (continued) |
| | | | | | | | | | | | | |
Lynn A. Stout
9/14/57 | | Trustee | | Since 1998 | | Paul Hastings Professor of Corporate and Securities Law (since 2006) and Professor of Law (2001-2006), University of California at Los Angeles School of Law. | | | 174 | | | None |
| | | | | | | | | | | | | |
Ralph F. Verni
1/26/43 | | Chairman of
the Board
and Trustee | | Chairman of the Board since 2007 and Trustee since 2005 | | Consultant and private investor. | | | 174 | | | None |
Principal Officers who are not Trustees
| | | | | | | |
| | | | | Term of
| | |
| | | Position(s)
| | Office and
| | |
Name and
| | with the
| | Length of
| | Principal Occupation(s)
|
| Date of Birth | | Trust | | Service | | During Past Five Years |
| |
| | | | | | | |
Cynthia J. Clemson
3/2/63 | | President | | Since 2005 | | Vice President of EVM and BMR. Officer of 92 registered investment companies managed by EVM or BMR. |
| | | | | | | |
William H. Ahern, Jr.
7/28/59 | | Vice President | | Since 2004 | | Vice President of EVM and BMR. Officer of 76 registered investment companies managed by EVM or BMR. |
| | | | | | | |
Craig R. Brandon
12/21/66 | | Vice President | | Since 2004 | | Vice President of EVM and BMR. Officer of 45 registered investment companies managed by EVM or BMR. |
| | | | | | | |
Robert B. MacIntosh
1/22/57 | | Vice President | | Since 1993 | | Vice President of EVM and BMR. Officer of 92 registered investment companies managed by EVM or BMR. |
| | | | | | | |
Thomas M. Metzold
8/3/58 | | Vice President | | Since 2004 | | Vice President of EVM and BMR. Officer of 46 registered investment companies managed by EVM or BMR. |
| | | | | | | |
Adam A. Weigold
3/22/75 | | Vice President | | Since 2007 | | Vice President of EVM and BMR. Officer of 72 registered investment companies managed by EVM or BMR. |
| | | | | | | |
Barbara E. Campbell
6/19/57 | | Treasurer | | Since 2005 | | Vice President of EVM and BMR. Officer of 174 registered investment companies managed by EVM or BMR. |
| | | | | | | |
Maureen A. Gemma
5/24/60 | | Secretary and Chief Legal Officer | | Secretary since 2007 and Chief Legal Officer since 2008 | | Vice President of EVM and BMR. Officer of 174 registered investment companies managed by EVM or BMR. |
| | | | | | | |
Paul M. O’Neil
7/11/53 | | Chief Compliance Officer | | Since 2004 | | Vice President of EVM and BMR. Officer of 174 registered investment companies managed by EVM or BMR. |
| | |
| (1) | | Includes both master and feeder funds in a master-feeder structure. |
The SAI for the Funds includes additional information about the Trustees and officers of the Funds and can be obtained without charge on Eaton Vance’s website at www.eatonvance.com or by calling 1-800-262-1122.
48
Investment Adviser
Boston Management and Research
Two International Place
Boston, MA 02110
Fund Administrator
Eaton Vance Management
Two International Place
Boston, MA 02110
Principal Underwriter
Eaton Vance Distributors, Inc.
Two International Place
Boston, MA 02110
(617) 482-8260
Custodian
State Street Bank and Trust Company
200 Clarendon Street
Boston, MA 02116
Transfer Agent
PNC Global Investment Servicing
Attn: Eaton Vance Funds
P.O. Box 9653
Providence, RI 02940-9653
(800) 262-1122
Independent Registered Public Accounting Firm
Deloitte & Touche LLP
200 Berkeley Street
Boston, MA 02116-5022
Eaton Vance Limited Maturity Municipals Funds
Two International Place
Boston, MA 02110
This report must be preceded or accompanied by a current prospectus. Before investing, investors should consider carefully a Fund’s investment objective(s), risks, and charges and expenses. The Funds’ current prospectus contains this and other information about the Funds and is available through your financial advisor. Please read the prospectus carefully before you invest or send money. For further information please call 1-800-262-1122.
IMPORTANT NOTICES REGARDING PRIVACY,
DELIVERY OF SHAREHOLDER DOCUMENTS,
PORTFOLIO HOLDINGS, AND PROXY VOTING
Privacy. The Eaton Vance organization is committed to ensuring your financial privacy. Each of the financial institutions identified below has in effect the following policy (“Privacy Policy”) with respect to nonpublic personal information about its customers:
| | |
| | • | Only such information received from you, through application forms or otherwise, and information about your Eaton Vance fund transactions will be collected. This may include information such as name, address, social security number, tax status, account balances and transactions. |
| |
| | • | None of such information about you (or former customers) will be disclosed to anyone, except as permitted by law (which includes disclosure to employees necessary to service your account). In the normal course of servicing a customer’s account, Eaton Vance may share information with unaffiliated third parties that perform various required services such as transfer agents, custodians and broker/dealers. |
| |
| | • | Policies and procedures (including physical, electronic and procedural safeguards) are in place that are designed to protect the confidentiality of such information. |
| |
| | • | We reserve the right to change our Privacy Policy at any time upon proper notification to you. Customers may want to review our Policy periodically for changes by accessing the link on our homepage: www.eatonvance.com. |
Our pledge of privacy applies to the following entities within the Eaton Vance organization: the Eaton Vance Family of Funds, Eaton Vance Management, Eaton Vance Investment Counsel, Boston Management and Research, and Eaton Vance Distributors, Inc.
In addition, our Privacy Policy only applies to those Eaton Vance customers who are individuals and who have a direct relationship with us. If a customer’s account (i.e., fund shares) is held in the name of a third-party financial adviser/broker-dealer, it is likely that only such adviser’s privacy policies apply to the customer. This notice supersedes all previously issued privacy disclosures.
For more information about Eaton Vance’s Privacy Policy, please call 1-800-262-1122.
Delivery of Shareholder Documents. The Securities and Exchange Commission (the “SEC”) permits funds to deliver only one copy of shareholder documents, including prospectuses, proxy statements and shareholder reports, to fund investors with multiple accounts at the same residential or post office box address. This practice is often called “householding” and it helps eliminate duplicate mailings to shareholders.
Eaton Vance, or your financial adviser, may household the mailing of your documents indefinitely unless you instruct Eaton Vance, or your financial adviser, otherwise.
If you would prefer that your Eaton Vance documents not be householded, please contact Eaton Vance at 1-800-262-1122, or contact your financial adviser.
Your instructions that householding not apply to delivery of your Eaton Vance documents will be effective within 30 days of receipt by Eaton Vance or your financial adviser.
Portfolio Holdings. Each Eaton Vance Fund and its underlying Portfolio (if applicable) will file a schedule of its portfolio holdings on Form N-Q with the SEC for the first and third quarters of each fiscal year. The Form N-Q will be available on the Eaton Vance website www.eatonvance.com, by calling Eaton Vance at 1-800-262-1122 or in the EDGAR database on the SEC’s website at www.sec.gov. Form N-Q may also be reviewed and copied at the SEC’s public reference room in Washington, D.C. (call 1-800-732-0330 for information on the operation of the public reference room).
Proxy Voting. From time to time, funds are required to vote proxies related to the securities held by the funds. The Eaton Vance Funds or their underlying Portfolios (if applicable) vote proxies according to a set of policies and procedures approved by the Funds’ and Portfolios’ Boards. You may obtain a description of these policies and procedures and information on how the Funds or Portfolios voted proxies relating to portfolio securities during the most recent 12 month period ended June 30, without charge, upon request, by calling 1-800-262-1122. This description is also available on the SEC’s website at www.sec.gov.
Eaton Vance Limited Maturity Municipals Funds as of March 31, 2009
TABLE OF CONTENTS
| | | | | |
| | | 2 | |
| | | | | |
| | | | |
| | | 4 | |
| | | 6 | |
| | | 8 | |
| | | 10 | |
| | | 12 | |
| | | 14 | |
| | | | | |
| Fund Expenses | | | 16 | |
| | | | | |
| Financial Statements | | | 20 | |
| | | | | |
| Federal Tax Information | | | 75 | |
| | | | | |
| Special Meeting of Shareholders | | | 76 | |
| | | | | |
| Board of Trustees’ Annual Approval | | | | |
| of the Investment Advisory Agreements | | | 78 | |
| | | | | |
| Management and Organization | | | 81 | |
1
Eaton Vance Limited Maturity Municipals Funds as of March 31, 2009
MANAGEMENT’S DISCUSSION OF FUND PERFORMANCE
Economic and Market Conditions
The 12-month period ending March 31, 2009, had more than its share of economic and market upheaval. For instance, the U.S. economy, as measured by gross domestic product (GDP), contracted sharply in both the fourth quarter of 2008 and the first quarter of 2009 by 6.2% and 6.1%, respectively, after a 0.3% decline in the third quarter of 2008, according to the U.S. Department of Commerce. The first quarter 2009 figure was a preliminary estimate. Most of the major GDP components contributed to the decline, but a sharp downturn in consumer spending was particularly influential and continued to weigh on the economy in early 2009. While high commodity prices eased since their summertime peaks, consumers continued to pare spending as they remained cautious of what increasingly became a weaker economic environment. Rising unemployment levels, at a five-year high at period end, led to constrained personal consumption and overall economic contraction. For much of the past 12 months, the housing market weighed on the economy, with new and existing home sales falling especially hard in the second half of calendar 2008.
In the first quarter of 2009, the U.S. economy began showing some signs of life. Although most economists forecast anemic growth for the remainder of the year, some of the data turned more positive early on. February was a particularly strong month for economic data: factory orders increased 1.8%; new home sales rose 4.7% — the first increase in seven months; and existing home sales surged 5.1%, the largest monthly gain since 2003. The upturn in the housing market was bolstered by historically low mortgage rates, an $8,000 tax credit for first-time home buyers that was part of President Obama’s stimulus legislation, and a plethora of distressed properties on the market.
For the year ending March 31, 2009, the capital markets experienced steep declines, followed by a welcome rally during the final three and a half months of the period. The fall of 2008 witnessed a number of distressing events, resulting in a freefall in both the credit and equity markets. Several calamitous events occurred in September alone, including the federal takeover of federally chartered mortgage giants Fannie Mae and Freddie Mac, the bankruptcy of Lehman Brothers, and the announcement by Bank of America that it was acquiring Merrill Lynch. These actions, along with several other corporate shakeups, bank failures and bailouts, drastically redefined the Wall Street landscape.
In response, the U.S. government enacted a number of bold stimulus programs. Last fall, Congress approved a $700 billion program authorizing the federal government to purchase troubled assets from financial institutions, a program that continued to evolve since the bill was enacted into law. On February 17, 2009, President Obama signed an historic $787 billion stimulus program into law and outlined a $50 billion foreclosure rescue plan. Additionally, between March 31, 2008, and December 31, 2008, the U.S. Federal Reserve (the Fed) lowered the federal funds rate to a range of 0.0% to 0.25% from 2.25%. Also during the 12-month period, the Fed took extraordinary actions through a variety of innovative lending techniques in an attempt to ease the credit crisis.
Management Discussion
Relative to the Funds’ primary benchmark, the Barclays Capital 7-Year Municipal Bond Index1 (the Index) — a broad-based, unmanaged index of intermediate-maturity municipal bonds — the Funds under-performed for the year ending March 31, 2009. As a result of an active management style that focuses on income and longer call protection, the Funds generally hold longer-duration intermediate-maturity bonds relative to other intermediate bond funds. Much of their underperformance occurred in the first nine months of the period and, management believes, can be attributed to the shift of investors’ capital into shorter-maturity bonds — a result of the broader-based credit crisis — during this period. The move to shorter-term investments was originally driven by uncertainty surrounding financial companies’ exposure to subprime mortgage-backed debt but later spread to the muni market when major municipal bond insurers suffered rating downgrades due to their exposure to mortgage-related structured products. In addition, management has historically used Treasury futures to seek to offset interest-rate volatility associated with investing in longer-maturity municipal bonds. Investors’ flight to quality during the first nine months of the year pushed Treasury yields to historic lows, causing the Funds’ Treasury futures positions to detract from performance for the year as a whole.
Fund shares are not insured by the FDIC and are not deposits or other obligations of, or guaranteed by, any depository institution. Shares are subject to investment risks, including possible loss of principal invested.
| | |
| 1 | | Formerly called Lehman Brothers 7-Year Municipal Bond Index. It is not possible to invest directly in an Index. |
The views expressed throughout this report are those of the portfolio managers and are current only through the end of the period of the report as stated on the cover. These views are subject to change at any time based upon market or other conditions, and the investment adviser disclaims any responsibility to update such views. These views may not be relied on as investment advice and, because investment decisions for a fund are based on many factors, may not be relied on as an indication of trading intent on behalf of any Eaton Vance fund. Portfolio information provided in the report may not be representative of the Funds’ current or future investments and may change due to active management.
2
Eaton Vance Limited Maturity Municipals Funds as of March 31, 2009
MANAGEMENT’S DISCUSSION OF FUND PERFORMANCE
Since mid-December 2008, however, the municipal market rallied considerably, and Eaton Vance’s Limited Maturity Municipals Funds outperformed the Index. A number of factors appeared to be at work in the market’s rebound. Municipal demand, while anemic for much of last year, returned in dramatic fashion during the first quarter of 2009. Retail muni investors — those who buy municipal bonds directly or through managed products such as mutual funds — were the predominant force behind the renewed demand. While many retail investors fled the market in 2008 as a result of market volatility and intimidating news reports, the perception of risk began to mitigate during the early stages of the new year. While institutional demand was largely absent during the first quarter of 2009 — as it was for much of 2008 — retail purchases kept overall demand levels strong.
Against this backdrop, we continue to manage our municipal funds with the same relative value approach that we have traditionally employed, maintaining a long-term perspective when markets exhibit extreme short-term volatility. We believe this approach has provided excellent long-term benefits to our investors over time. Furthermore, we believe that the 138.9% yield ratio of insured municipal bonds to 30-year Treasuries as of March 31, 2009 — as compared with the long-term average of 85%-90% — indicates that there is still relative value in municipal bonds when compared with their taxable counterparts.1
| | |
| 1 | | Source: Bloomberg L.P. Yields are a compilation of a representative variety of general obligations and are not necessarily representative of a Fund’s yield. |
3
Eaton Vance California Limited Maturity Municipals Fund as of March 31, 2009
PERFORMANCE INFORMATION
The line graph and table set forth below provide information about the Fund’s performance. The line graph compares the performance of Class B of the Fund with that of the Barclays Capital 7-Year Municipal Bond Index, an unmanaged market index of intermediate-maturity municipal obligations. The lines on the graph represent the total returns of a hypothetical investment of $10,000 in each of Class B and in the Barclays Capital 7-Year Municipal Bond Index. The table includes the total returns of each Class of the Fund at net asset value and maximum public offering price. The performance presented below does not reflect the deduction of taxes, if any, that a shareholder would pay on distributions or redemptions of Fund shares.
| | | | | | | | | | | | | |
| Fund Performance1 | | Class A | | Class B | | Class C |
| Share Class Symbol | | EXCAX | | ELCAX | | EZCAX |
| |
| Average Annual Total Returns (at net asset value) |
| One Year | | | -3.67 | % | | | -4.42 | % | | | -4.35 | % |
| Five Years | | | 1.14 | | | | 0.38 | | | | N.A. | |
| Ten Years | | | 2.88 | | | | 2.10 | | | | N.A. | |
Life of Fund† | | | 3.56 | | | | 3.18 | | | | 0.26 | |
| SEC Average Annual Total Returns (including sales charge or applicable CDSC) |
| One Year | | | -5.83 | % | | | -7.20 | % | | | -5.28 | % |
| Five Years | | | 0.68 | | | | 0.38 | | | | N.A. | |
| Ten Years | | | 2.65 | | | | 2.10 | | | | N.A. | |
Life of Fund† | | | 3.38 | | | | 3.18 | | | | 0.26 | |
| | |
| † | | Inception dates: Class A: 6/27/96; Class B: 5/29/92; Class C: 3/23/05 |
| | | | | | | | | | | | | |
| Total Annual | | | | | | |
| Operating Expenses2 | | Class A | | Class B | | Class C |
| |
| Expense Ratio | | | 0.85 | % | | | 1.60 | % | | | 1.60 | % |
| | | | | | | | | | | | | |
| Distribution Rates/Yields | | Class A | | Class B | | Class C |
| |
Distribution Rate3 | | | 4.11 | % | | | 3.35 | % | | | 3.34 | % |
Taxable-Equivalent Distribution Rate3,4 | | | 6.97 | | | | 5.68 | | | | 5.67 | |
SEC 30-day Yield5 | | | 3.69 | | | | 3.02 | | | | 3.01 | |
Taxable-Equivalent SEC 30-day Yield4,5 | | | 6.26 | | | | 5.12 | | | | 5.11 | |
Index Performance6 (Average Annual Total Returns)
| | | | | |
| Barclays Capital 7-Year Municipal Bond Index | | | | |
| |
| One Year | | | 5.53 | % |
| Five Years | | | 3.90 | |
| Ten Years | | | 4.95 | |
Lipper Averages7 (Average Annual Total Returns)
| | | | | |
| Lipper California Intermediate Municipal Debt Funds Classification | | | | |
| |
| One Year | | | 0.27 | % |
| Five Years | | | 1.96 | |
| Ten Years | | | 3.65 | |
Portfolio Manager: Cynthia J. Clemson
| | |
| * | | Source: Lipper, Inc. Class B of the Fund commenced operations on 5/29/92. A $10,000 hypothetical investment at net asset value in Class A on 3/31/99 and Class C on 3/23/05 (commencement of operations), would have been valued at $13,292 ($12,993 at the maximum offering price) and $10,107, respectively, on 3/31/09. It is not possible to invest directly in an Index. The Index’s total return does not reflect the expenses that would have been incurred if an investor individually purchased or sold the securities represented in the Index. |
Past performance is no guarantee of future results. Returns are historical and are calculated by determining the percentage change in net asset value or offering price (as applicable) with all distributions reinvested. Investment return and principal value will fluctuate so that shares, when redeemed, may be worth more or less than their original cost. Performance is for the stated time period only; due to market volatility, the Fund’s current performance may be lower or higher than the quoted return. For performance as of the most recent month end, please refer to www.eatonvance.com.
| | |
| 1 | | Average Annual Total Returns do not include the 2.25% maximum sales charge for Class A shares or the applicable contingent deferred sales charges (CDSC) for Class B and Class C shares. If sales charges were deducted, the returns would be lower. SEC Average Annual Total Returns for Class A reflect the maximum 2.25% sales charge. SEC Average Annual Total Returns for Class B reflect the applicable CDSC based on the following schedule: 3% — 1st year; 2.5% — 2nd year; 2% — 3rd year; 1% - - 4th year. SEC Average Annual Total Returns for Class C reflect a 1% CDSC for the first year. 2 Source: Prospectus dated 8/1/08. 3 The Fund’s distribution rate represents actual distributions paid to shareholders and is calculated by dividing the last distribution per share (annualized) by the net asset value. 4 Taxable-equivalent figures assume a maximum 41.05% combined federal and state income tax rate. A lower tax rate would result in lower tax-equivalent figures. 5 The Fund’s SEC yield is calculated by dividing the net investment income per share for the 30-day period by the offering price at the end of the period and annualizing the result. 6 It is not possible to invest directly in an Index. The Index’s total return does not reflect the expenses that would have been incurred if an investor individually purchased or sold the securities represented in the Index. Index performance is available as of month end only. 7 The Lipper Averages are the average annual total returns, at net asset value, of the funds that are in the same Lipper Classification as the Fund. It is not possible to invest in a Lipper Classification. Lipper Classifications may include insured and uninsured funds, as well as leveraged and unleveraged funds. The Lipper California Intermediate Municipal Debt Funds Classification contained 40, 38 and 17 funds for the 1-year, 5-year and 10-year time periods, respectively. Lipper Averages are available as of month end only. |
4
Eaton Vance California Limited Maturity Municipals Fund as of March 31, 2009
PORTFOLIO COMPOSITION
Rating Distribution1
By total investments
| | |
| 1 | | Rating Distribution is determined by dividing the total market value of the issues by the total investments of the Fund. Although the investment adviser considers ratings when making investment decisions, it performs its own credit and investment analysis and does not rely primarily on the ratings assigned by the rating services. Credit quality can change from time to time, and recently issued credit ratings may not fully reflect the actual risks posed by a particular security or the issuer’s current financial condition. |
Fund Statistics
| | | |
• Number of Issues: | | 52 |
• Average Maturity: | | 8.9 years |
• Average Effective Maturity: | | 8.2 years |
• Average Rating: | | A+ |
• Average Call Protection: | | 6.1 years |
• Average Dollar Price: | | $93.47 |
5
Eaton Vance Massachusetts Limited Maturity Municipals Fund as of March 31, 2009
PERFORMANCE INFORMATION
The line graph and table set forth below provide information about the Fund’s performance. The line graph compares the performance of Class B of the Fund with that of the Barclays Capital 7-Year Municipal Bond Index, an unmanaged market index of intermediate-maturity municipal obligations. The lines on the graph represent the total returns of a hypothetical investment of $10,000 in each of Class B and in the Barclays Capital 7-Year Municipal Bond Index. The table includes the total returns of each Class of the Fund at net asset value and maximum public offering price. The performance presented below does not reflect the deduction of taxes, if any, that a shareholder would pay on distributions or redemptions of Fund shares.
| | | | | | | | | | | | | |
| Fund Performance1 | | Class A | | | Class B | | | Class C | |
| Share Class Symbol | | EXMAX | | | ELMAX | | | EZMAX | |
| |
| Average Annual Total Returns (at net asset value) |
| One Year | | | -0.50 | % | | | -1.15 | % | | | -1.22 | % |
| Five Years | | | 1.83 | | | | 1.08 | | | | 1.06 | |
| Ten Years | | | 3.22 | | | | 2.43 | | | | 2.45 | |
Life of Fund† | | | 3.78 | | | | 3.35 | | | | 2.87 | |
| SEC Average Annual Total Returns (including sales charge or applicable CDSC) |
| One Year | | | -2.74 | % | | | -4.03 | % | | | -2.18 | % |
| Five Years | | | 1.37 | | | | 1.08 | | | | 1.06 | |
| Ten Years | | | 2.98 | | | | 2.43 | | | | 2.45 | |
Life of Fund† | | | 3.59 | | | | 3.35 | | | | 2.87 | |
| | |
| † | | Inception dates: Class A: 6/27/96; Class B: 6/1/92; Class C: 12/8/93 |
| | | | | | | | | | | | | |
| Total Annual | | | | | | |
| Operating Expenses2 | | Class A | | Class B | | Class C |
| |
| Expense Ratio | | | 0.84 | % | | | 1.60 | % | | | 1.60 | % |
| | | | | | | | | | | | | |
| Distribution Rates/Yields | | Class A | | Class B | | Class C |
| |
Distribution Rate3 | | | 3.87 | % | | | 3.13 | % | | | 3.13 | % |
Taxable-Equivalent Distribution Rate3,4 | | | 6.29 | | | | 5.09 | | | | 5.09 | |
SEC 30-day Yield5 | | | 2.92 | | | | 2.24 | | | | 2.29 | |
Taxable-Equivalent SEC 30-day Yield4,5 | | | 4.74 | | | | 3.64 | | | | 3.72 | |
Index Performance6 (Average Annual Total Returns)
| | | | | |
| Barclays Capital 7-Year Municipal Bond Index | | | | |
| |
| One Year | | | 5.53 | % |
| Five Years | | | 3.90 | |
| Ten Years | | | 4.95 | |
Lipper Averages7 (Average Annual Total Returns)
| | | | | |
| Lipper Massachusetts Intermediate Municipal Debt Funds Classification | | | | |
| |
| One Year | | | 2.36 | % |
| Five Years | | | 2.35 | |
| Ten Years | | | 3.46 | |
Portfolio Manager: William H. Ahern, Jr., CFA
| | |
| * | | Source: Lipper, Inc. Class B of the Fund commenced operations on 6/1/92. A $10,000 hypothetical investment at net asset value in Class A and Class C on 3/31/99 would have been valued at $13,735 ($13,426 at the maximum offering price) and $12,747, respectively, on 3/31/09. It is not possible to invest directly in an Index. The Index’s total return does not reflect the expenses that would have been incurred if an investor individually purchased or sold the securities represented in the Index. |
Past performance is no guarantee of future results. Returns are historical and are calculated by determining the percentage change in net asset value or offering price (as applicable) with all distributions reinvested. Investment return and principal value will fluctuate so that shares, when redeemed, may be worth more or less than their original cost. Performance is for the stated time period only; due to market volatility, the Fund’s current performance may be lower or higher than the quoted return. For performance as of the most recent month end, please refer to www.eatonvance.com.
| | |
| 1 | | Average Annual Total Returns do not include the 2.25% maximum sales charge for Class A shares or the applicable contingent deferred sales charges (CDSC) for Class B and Class C shares. If sales charges were deducted, the returns would be lower. SEC Average Annual Total Returns for Class A reflect the maximum 2.25% sales charge. SEC Average Annual Total Returns for Class B reflect the applicable CDSC based on the following schedule: 3% — 1st year; 2.5% — 2nd year; 2% — 3rd year; 1% - - 4th year. SEC Average Annual Total Returns for Class C reflect a 1% CDSC for the first year. 2 Source: Prospectus dated 8/1/08. 3 The Fund’s distribution rate represents actual distributions paid to shareholders and is calculated by dividing the last distribution per share (annualized) by the net asset value. 4 Taxable-equivalent figures assume a maximum 38.45% combined federal and state income tax rate. A lower tax rate would result in lower tax-equivalent figures. 5 The Fund’s SEC yield is calculated by dividing the net investment income per share for the 30-day period by the offering price at the end of the period and annualizing the result. 6 It is not possible to invest directly in an Index. The Index’s total return does not reflect the expenses that would have been incurred if an investor individually purchased or sold the securities represented in the Index. Index performance is available as of month end only. 7 The Lipper Averages are the average annual total returns, at net asset value, of the funds that are in the same Lipper Classification as the Fund. It is not possible to invest in a Lipper Classification. Lipper Classifications may include insured and uninsured funds, as well as leveraged and unleveraged funds. The Lipper Massachusetts Intermediate Municipal Debt Funds Classification contained 12, 12 and 8 funds for the 1-year, 5-year and 10-year time periods, respectively. Lipper Averages are available as of month end only. |
6
Eaton Vance Massachusetts Limited Maturity Municipals Fund as of March 31, 2009
PORTFOLIO COMPOSITION
Rating Distribution1
By total investments
| | |
| 1 | | Rating Distribution is determined by dividing the total market value of the issues by the total investments of the Fund. Although the investment adviser considers ratings when making investment decisions, it performs its own credit and investment analysis and does not rely primarily on the ratings assigned by the rating services. Credit quality can change from time to time, and recently issued credit ratings may not fully reflect the actual risks posed by a particular security or the issuer’s current financial condition. |
Fund Statistics
| | | |
• Number of Issues: | | 68 |
• Average Maturity: | | 9.0 years |
• Average Effective Maturity: | | 7.5 years |
• Average Rating: | | AA |
• Average Call Protection: | | 6.8 years |
• Average Dollar Price: | | $103.62 |
7
Eaton Vance New Jersey Limited Maturity Municipals Fund as of March 31, 2009
PERFORMANCE INFORMATION
The line graph and table set forth below provide information about the Fund’s performance. The line graph compares the performance of Class B of the Fund with that of the Barclays Capital 7-Year Municipal Bond Index, an unmanaged market index of intermediate-maturity municipal obligations. The lines on the graph represent the total returns of a hypothetical investment of $10,000 in each of Class B and in the Barclays Capital 7-Year Municipal Bond Index. The table includes the total returns of each Class of the Fund at net asset value and maximum public offering price. The performance presented below does not reflect the deduction of taxes, if any, that a shareholder would pay on distributions or redemptions of Fund shares.
| | | | | | | | | | | | | |
| Fund Performance1 | | Class A | | Class B | | Class C |
| Share Class Symbol | | EXNJX | | ELNJX | | EZNJX |
| |
| Average Annual Total Returns (at net asset value) |
| One Year | | | -0.39 | % | | | -1.05 | % | | | -1.24 | % |
| Five Years | | | 1.95 | | | | 1.21 | | | | N.A. | |
| Ten Years | | | 3.22 | | | | 2.44 | | | | N.A. | |
Life of Fund† | | | 3.77 | | | | 3.35 | | | | 0.61 | |
| SEC Average Annual Total Returns (including sales charge or applicable CDSC) |
| One Year | | | -2.65 | % | | | -3.92 | % | | | -2.20 | % |
| Five Years | | | 1.48 | | | | 1.21 | | | | N.A. | |
| Ten Years | | | 2.98 | | | | 2.44 | | | | N.A. | |
Life of Fund† | | | 3.59 | | | | 3.35 | | | | 0.61 | |
| | |
| † | | Inception dates: Class A: 6/27/96; Class B: 6/1/92; Class C: 8/1/06 |
| | | | | | | | | | | | | |
| Total Annual | | | | | | |
| Operating Expenses2 | | Class A | | Class B | | Class C |
| |
| Expense Ratio | | | 0.93 | % | | | 1.68 | % | | | 1.66 | % |
| | | | | | | | | | | | | |
| Distribution Rates/Yields | | Class A | | Class B | | Class C |
| |
Distribution Rate3 | | | 3.90 | % | | | 3.15 | % | | | 3.15 | % |
Taxable-Equivalent Distribution Rate3,4 | | | 6.59 | | | | 5.32 | | | | 5.32 | |
SEC 30-day Yield5 | | | 2.99 | | | | 2.30 | | | | 2.30 | |
Taxable-Equivalent SEC 30-day Yield4,5 | | | 5.05 | | | | 3.89 | | | | 3.89 | |
Index Performance6 (Average Annual Total Returns)
| | | | | |
| Barclays Capital 7-Year Municipal Bond Index | | | | |
| |
| One Year | | | 5.53 | % |
| Five Years | | | 3.90 | |
| Ten Years | | | 4.95 | |
Lipper Averages7 (Average Annual Total Returns)
| | | | | |
| Lipper Other States Intermediate Municipal Debt Funds Classification | | | | |
| |
| One Year | | | 2.60 | % |
| Five Years | | | 2.36 | |
| Ten Years | | | 3.48 | |
Portfolio Manager: Craig R. Brandon, CFA
| | |
| * | | Source: Lipper, Inc. Class B of the Fund commenced operations on 6/1/92. A $10,000 hypothetical investment at net asset value in Class A on 3/31/99 and Class C on 8/1/06 (commencement of operations) would have been valued at $13,729 ($13,420 at the maximum offering price) and $10,164, respectively, on 3/31/09. It is not possible to invest directly in an Index. The Index’s total return does not reflect the expenses that would have been incurred if an investor individually purchased or sold the securities represented in the Index. |
Past performance is no guarantee of future results. Returns are historical and are calculated by determining the percentage change in net asset value or offering price (as applicable) with all distributions reinvested. Investment return and principal value will fluctuate so that shares, when redeemed, may be worth more or less than their original cost. Performance is for the stated time period only; due to market volatility, the Fund’s current performance may be lower or higher than the quoted return. For performance as of the most recent month end, please refer to www.eatonvance.com.
| | |
| 1 | | Average Annual Total Returns do not include the 2.25% maximum sales charge for Class A shares or the applicable contingent deferred sales charges (CDSC) for Class B and Class C shares. If sales charges were deducted, the returns would be lower. SEC Average Annual Total Returns for Class A reflect the maximum 2.25% sales charge. SEC Average Annual Total Returns for Class B reflect the applicable CDSC based on the following schedule: 3% — 1st year; 2.5% — 2nd year; 2% — 3rd year; 1% - - 4th year. SEC Average Annual Total Returns for Class C reflect a 1% CDSC for the first year. 2 Source: Prospectus dated 8/1/08. Includes interest expense of 0.02% relating to the Fund’s liability with respect to floating rate notes held by third parties in conjunction with inverse floater securities transactions by the Fund. The Fund also records offsetting interest income relating to the municipal obligations underlying such transactions, and, as a result, net asset value and performance have not been affected by this expense. 3 The Fund’s distribution rate represents actual distributions paid to shareholders and is calculated by dividing the last distribution per share (annualized) by the net asset value. 4 Taxable-equivalent figures assume a maximum 40.83% combined federal and state income tax rate. A lower tax rate would result in lower tax-equivalent figures. 5 The Fund’s SEC yield is calculated by dividing the net investment income per share for the 30-day period by the offering price at the end of the period and annualizing the result. 6 It is not possible to invest directly in an Index. The Index’s total return does not reflect the expenses that would have been incurred if an investor individually purchased or sold the securities represented in the Index. Index performance is available as of month end only. 7 The Lipper Averages are the average annual total returns, at net asset value, of the funds that are in the same Lipper Classification as the Fund. It is not possible to invest in a Lipper Classification. Lipper Classifications may include insured and uninsured funds, as well as leveraged and unleveraged funds. The Lipper Other States Intermediate Municipal Debt Funds Classification contained 126, 118 and 86 funds for the 1-year, 5-year and 10-year time periods, respectively. Lipper Averages are available as of month end only. |
8
Eaton Vance New Jersey Limited Maturity Municipals Fund as of March 31, 2009
PORTFOLIO COMPOSITION
Rating Distribution1
By total investments
| | |
| 1 | | Rating Distribution is determined by dividing the total market value of the issues by the total investments of the Fund. Although the investment adviser considers ratings when making investment decisions, it performs its own credit and investment analysis and does not rely primarily on the ratings assigned by the rating services. Credit quality can change from time to time, and recently issued credit ratings may not fully reflect the actual risks posed by a particular security or the issuer’s current financial condition. |
Fund Statistics
| | | |
• Number of Issues: | | 58 |
• Average Maturity: | | 9.3 years |
• Average Effective Maturity: | | 8.3 years |
• Average Rating: | | AA- |
• Average Call Protection: | | 7.4 years |
• Average Dollar Price: | | $102.88 |
9
Eaton Vance New York Limited Maturity Municipals Fund as of March 31, 2009
PERFORMANCE INFORMATION
The line graph and table set forth below provide information about the Fund’s performance. The line graph compares the performance of Class B of the Fund with that of the Barclays Capital 7-Year Municipal Bond Index, an unmanaged market index of intermediate-maturity municipal obligations. The lines on the graph represent the total returns of a hypothetical investment of $10,000 in each of Class B and in the Barclays Capital 7-Year Municipal Bond Index. The table includes the total returns of each Class of the Fund at net asset value and maximum public offering price. The performance presented below does not reflect the deduction of taxes, if any, that a shareholder would pay on distributions or redemptions of Fund shares.
| | | | | | | | | | | | | |
| Fund Performance1 | | Class A | | Class B | | Class C |
| Share Class Symbol | | EXNYX | | ELNYX | | EZNYX |
| |
| Average Annual Total Returns (at net asset value) |
| One Year | | | -2.56 | % | | | -3.31 | % | | | -3.22 | % |
| Five Years | | | 1.22 | | | | 0.45 | | | | 0.45 | |
| Ten Years | | | 3.07 | | | | 2.28 | | | | 2.29 | |
Life of Fund† | | | 3.80 | | | | 3.38 | | | | 2.84 | |
| SEC Average Annual Total Returns (including sales charge or applicable CDSC) |
| One Year | | | -4.71 | % | | | -6.11 | % | | | -4.16 | % |
| Five Years | | | 0.76 | | | | 0.45 | | | | 0.45 | |
| Ten Years | | | 2.84 | | | | 2.28 | | | | 2.29 | |
Life of Fund† | | | 3.61 | | | | 3.38 | | | | 2.84 | |
| | |
| † | | Inception dates: Class A: 6/27/96; Class B: 5/29/92; Class C: 12/8/93 |
| | | | | | | | | | | | | |
| Total Annual | | | | | | |
| Operating Expenses2 | | Class A | | Class B | | Class C |
| |
| Expense Ratio | | | 0.83 | % | | | 1.58 | % | | | 1.58 | % |
| | | | | | | | | | | | | |
| Distribution Rates/Yields | | Class A | | Class B | | Class C |
| |
Distribution Rate3 | | | 4.10 | % | | | 3.35 | % | | | 3.35 | % |
Taxable-Equivalent Distribution Rate3,4 | | | 6.77 | | | | 5.53 | | | | 5.53 | |
SEC 30-day Yield5 | | | 3.66 | | | | 2.99 | | | | 2.99 | |
Taxable-Equivalent SEC 30-day Yield4,5 | | | 6.04 | | | | 4.94 | | | | 4.94 | |
Index Performance6 (Average Annual Total Returns)
| | | | | |
| Barclays Capital 7-Year Municipal Bond Index | | | | |
| |
| One Year | | | 5.53 | % |
| Five Years | | | 3.90 | |
| Ten Years | | | 4.95 | |
Lipper Averages7 (Average Annual Total Returns)
| | | | | |
| Lipper New York Intermediate Municipal Debt Funds Classification | | | | |
| |
| One Year | | | 1.79 | % |
| Five Years | | | 2.18 | |
| Ten Years | | | 3.60 | |
Portfolio Manager: William H. Ahern, Jr., CFA
| | |
| * | | Source: Lipper, Inc. Class B of the Fund commenced operations on 5/29/92. A $10,000 hypothetical investment at net asset value in Class A and Class C on 3/31/99 would have been valued at $13,531 ($13,227 at the maximum offering price) and $12,547, respectively, on 3/31/09. It is not possible to invest directly in an Index. The Index’s total return does not reflect the expenses that would have been incurred if an investor individually purchased or sold the securities represented in the Index. |
Past performance is no guarantee of future results. Returns are historical and are calculated by determining the percentage change in net asset value or offering price (as applicable) with all distributions reinvested. Investment return and principal value will fluctuate so that shares, when redeemed, may be worth more or less than their original cost. Performance is for the stated time period only; due to market volatility, the Fund’s current performance may be lower or higher than the quoted return. For performance as of the most recent month end, please refer to www.eatonvance.com.
| | |
| 1 | | Average Annual Total Returns do not include the 2.25% maximum sales charge for Class A shares or the applicable contingent deferred sales charges (CDSC) for Class B and Class C shares. If sales charges were deducted, the returns would be lower. SEC Average Annual Total Returns for Class A reflect the maximum 2.25% sales charge. SEC Average Annual Total Returns for Class B reflect the applicable CDSC based on the following schedule: 3% — 1st year; 2.5% — 2nd year; 2% — 3rd year; 1% — 4th year. SEC Average Annual Total Returns for Class C reflect a 1% CDSC for the first year. 2 Source: Prospectus dated 8/1/08. Includes interest expense of 0.01% relating to the Fund’s liability with respect to floating rate notes held by third parties in conjunction with inverse floater securities transactions by the Fund. The Fund also records offsetting interest income relating to the municipal obligations underlying such transactions, and, as a result, net asset value and performance have not been affected by this expense. 3 The Fund’s distribution rate represents actual distributions paid to shareholders and is calculated by dividing the last distribution per share (annualized) by the net asset value. 4 Taxable-equivalent figures assume a maximum 39.45% combined federal and state income tax rate. A lower tax rate would result in lower tax-equivalent figures. 5 The Fund’s SEC yield is calculated by dividing the net investment income per share for the 30-day period by the offering price at the end of the period and annualizing the result. 6 It is not possible to invest directly in an Index. The Index’s total return does not reflect the expenses that would have been incurred if an investor individually purchased or sold the securities represented in the Index. Index performance is available as of month end only. 7 The Lipper Averages are the average annual total returns, at net asset value, of the funds that are in the same Lipper Classification as the Fund. It is not possible to invest in a Lipper Classification. Lipper Classifications may include insured and uninsured funds, as well as leveraged and unleveraged funds. The Lipper New York Intermediate Municipal Debt Funds Classification contained 28, 28 and 14 funds for the 1-year, 5-year and 10-year time periods, respectively. Lipper Averages are available as of month end only. |
10
Eaton Vance New York Limited Maturity Municipals Fund as of March 31, 2009
PORTFOLIO COMPOSITION
Rating Distribution1
By total investments
| | |
| 1 | | Rating Distribution is determined by dividing the total market value of the issues by the total investments of the Fund. Although the investment adviser considers ratings when making investment decisions, it performs its own credit and investment analysis and does not rely primarily on the ratings assigned by the rating services. Credit quality can change from time to time, and recently issued credit ratings may not fully reflect the actual risks posed by a particular security or the issuer’s current financial condition. |
Fund Statistics
| | | |
• Number of Issues: | | 84 |
• Average Maturity: | | 10.1 years |
• Average Effective Maturity: | | 7.9 years |
• Average Rating: | | AA- |
• Average Call Protection: | | 6.9 years |
• Average Dollar Price: | | $101.48 |
11
Eaton Vance Ohio Limited Maturity Municipals Fund as of March 31, 2009
PERFORMANCE INFORMATION
The line graph and table set forth below provide information about the Fund’s performance. The line graph compares the performance of Class B of the Fund with that of the Barclays Capital 7-Year Municipal Bond Index, an unmanaged market index of intermediate-maturity municipal obligations. The lines on the graph represent the total returns of a hypothetical investment of $10,000 in each of Class B and in the Barclays Capital 7-Year Municipal Bond Index. The table includes the total returns of each Class of the Fund at net asset value and maximum public offering price. The performance presented below does not reflect the deduction of taxes, if any, that a shareholder would pay on distributions or redemptions of Fund shares.
| | | | | | | | | | | | | |
| Fund Performance1 | | Class A | | Class B | | Class C |
| Share Class Symbol | | EXOHX | | ELOHX | | EZOHX |
| |
| Average Annual Total Returns (at net asset value) |
| One Year | | | 1.26 | % | | | 0.39 | % | | | 0.39 | % |
| Five Years | | | 1.94 | | | | 1.15 | | | | N.A. | |
| Ten Years | | | 3.04 | | | | 2.26 | | | | N.A. | |
Life of Fund† | | | 3.57 | | | | 3.01 | | | | 1.12 | |
| SEC Average Annual Total Returns (including sales charge or applicable CDSC) |
| One Year | | | -1.05 | % | | | -2.54 | % | | | -0.59 | % |
| Five Years | | | 1.48 | | | | 1.15 | | | | N.A. | |
| Ten Years | | | 2.81 | | | | 2.26 | | | | N.A. | |
Life of Fund† | | | 3.37 | | | | 3.01 | | | | 1.12 | |
| | |
| † | | Inception dates: Class A: 10/22/96; Class B: 4/16/93; Class C: 8/1/06 |
| | | | | | | | | | | | | |
| Total Annual | | | | | | |
| Operating Expenses2 | | Class A | | Class B | | Class C |
| |
| Expense Ratio | | | 1.02 | % | | | 1.77 | % | | | 1.77 | % |
| | | | | | | | | | | | | |
| Distribution Rates/Yields | | Class A | | Class B | | Class C |
| |
Distribution Rate3 | | | 3.76 | % | | | 3.02 | % | | | 3.02 | % |
Taxable-Equivalent Distribution Rate3,4 | | | 6.15 | | | | 4.94 | | | | 4.94 | |
SEC 30-day Yield5 | | | 2.27 | | | | 1.57 | | | | 1.57 | |
Taxable-Equivalent SEC 30-day Yield4,5 | | | 3.71 | | | | 2.57 | | | | 2.57 | |
Index Performance6 (Average Annual Total Returns)
| | | | | |
| Barclays Capital 7-Year Municipal Bond Index | | | | |
| |
| One Year | | | 5.53 | % |
| Five Years | | | 3.90 | |
| Ten Years | | | 4.95 | |
Lipper Averages7 (Average Annual Total Returns)
| | | | | |
| Lipper Other States Intermediate Municipal Debt Funds Classification | | | | |
| |
| One Year | | | 2.60 | % |
| Five Years | | | 2.36 | |
| Ten Years | | | 3.48 | |
Portfolio Manager: William H. Ahern, Jr., CFA
| | |
| * | | Source: Lipper, Inc. Class B of the Fund commenced operations on 4/16/93. A $10,000 hypothetical investment at net asset value in Class A on 3/31/99 and Class C on 8/1/06 (commencement of operations) would have been valued at $13,491 ($13,187 at the maximum offering price) and $10,302, respectively, on 3/31/09. It is not possible to invest directly in an Index. The Index’s total return does not reflect the expenses that would have been incurred if an investor individually purchased or sold the securities represented in the Index. |
Past performance is no guarantee of future results. Returns are historical and are calculated by determining the percentage change in net asset value or offering price (as applicable) with all distributions reinvested. Investment return and principal value will fluctuate so that shares, when redeemed, may be worth more or less than their original cost. Performance is for the stated time period only; due to market volatility, the Fund’s current performance may be lower or higher than the quoted return. For performance as of the most recent month end, please refer to www.eatonvance.com.
| | |
| 1 | | Average Annual Total Returns do not include the 2.25% maximum sales charge for Class A shares or the applicable contingent deferred sales charges (CDSC) for Class B and Class C shares. If sales charges were deducted, the returns would be lower. SEC Average Annual Total Returns for Class A reflect the maximum 2.25% sales charge. SEC Average Annual Total Returns for Class B reflect the applicable CDSC based on the following schedule: 3% — 1st year; 2.5% — 2nd year; 2% — 3rd year; 1% - - 4th year. SEC Average Annual Total Returns for Class C reflect a 1% CDSC for the first year. 2 Source: Prospectus dated 8/1/08. 3 The Fund’s distribution rate represents actual distributions paid to shareholders and is calculated by dividing the last distribution per share (annualized) by the net asset value. 4 Taxable-equivalent figures assume a maximum 38.85% combined federal and state income tax rate. A lower tax rate would result in lower tax-equivalent figures. 5 The Fund’s SEC yield is calculated by dividing the net investment income per share for the 30-day period by the offering price at the end of the period and annualizing the result. 6 It is not possible to invest directly in an Index. The Index’s total return does not reflect the expenses that would have been incurred if an investor individually purchased or sold the securities represented in the Index. Index performance is available as of month end only. 7 The Lipper Averages are the average annual total returns, at net asset value, of the funds that are in the same Lipper Classification as the Fund. It is not possible to invest in a Lipper Classification. Lipper Classifications may include insured and uninsured funds, as well as leveraged and unleveraged funds. The Lipper Other States Intermediate Municipal Debt Funds Classification contained 126, 118 and 86 funds for the 1-year, 5-year and 10-year time periods, respectively. Lipper Averages are available as of month end only. |
12
Eaton Vance Ohio Limited Maturity Municipals Fund as of March 31, 2009
PORTFOLIO COMPOSITION
Rating Distribution1
By total investments
| | |
| 1 | | Rating Distribution is determined by dividing the total market value of the issues by the total investments of the Fund. Although the investment adviser considers ratings when making investment decisions, it performs its own credit and investment analysis and does not rely primarily on the ratings assigned by the rating services. Credit quality can change from time to time, and recently issued credit ratings may not fully reflect the actual risks posed by a particular security or the issuer’s current financial condition. |
Fund Statistics
| | | |
• Number of Issues: | | 51 |
• Average Maturity: | | 8.0 years |
• Average Effective Maturity: | | 5.8 years |
• Average Rating: | | AA- |
• Average Call Protection: | | 5.2 years |
• Average Dollar Price: | | $103.87 |
13
Eaton Vance Pennsylvania Limited Maturity Municipals Fund as of March 31, 2009
PERFORMANCE INFORMATION
The line graph and table set forth below provide information about the Fund’s performance. The line graph compares the performance of Class B of the Fund with that of the Barclays Capital 7-Year Municipal Bond Index, an unmanaged market index of intermediate-maturity municipal obligations. The lines on the graph represent the total returns of a hypothetical investment of $10,000 in each of Class B and in the Barclays Capital 7-Year Municipal Bond Index. The table includes the total returns of each Class of the Fund at net asset value and maximum public offering price. The performance presented below does not reflect the deduction of taxes, if any, that a shareholder would pay on distributions or redemptions of Fund shares.
| | | | | | | | | | | | | |
| Fund Performance1 | | Class A | | Class B | | Class C |
| Share Class Symbol | | EXPNX | | ELPNX | | EZPNX |
| |
| Average Annual Total Returns (at net asset value) |
| One Year | | | 0.83 | % | | | 0.06 | % | | | -0.01 | % |
| Five Years | | | 2.25 | | | | 1.48 | | | | 1.46 | |
| Ten Years | | | 3.41 | | | | 2.62 | | | | 2.62 | |
Life of Fund† | | | 4.02 | | | | 3.59 | | | | 3.04 | |
| SEC Average Annual Total Returns (including sales charge or applicable CDSC) |
| One Year | | | -1.43 | % | | | -2.85 | % | | | -0.98 | % |
| Five Years | | | 1.80 | | | | 1.48 | | | | 1.46 | |
| Ten Years | | | 3.17 | | | | 2.62 | | | | 2.62 | |
Life of Fund† | | | 3.84 | | | | 3.59 | | | | 3.04 | |
| | |
| † | | Inception dates: Class A: 6/27/96; Class B: 6/1/92; Class C: 12/8/93 |
| | | | | | | | | | | | | |
| Total Annual | | | | | | |
| Operating Expenses2 | | Class A | | Class B | | Class C |
| |
| Expense Ratio | | | 0.88 | % | | | 1.63 | % | | | 1.63 | % |
| | | | | | | | | | | | | |
| Distribution Rates/Yields | | Class A | | Class B | | Class C |
| |
Distribution Rate3 | | | 3.99 | % | | | 3.25 | % | | | 3.25 | % |
Taxable-Equivalent Distribution Rate3,4 | | | 6.33 | | | | 5.16 | | | | 5.16 | |
SEC 30-day Yield5 | | | 3.04 | | | | 2.35 | | | | 2.37 | |
Taxable-Equivalent SEC 30-day Yield4,5 | | | 4.83 | | | | 3.73 | | | | 3.76 | |
Index Performance6 (Average Annual Total Returns)
| | | | | |
| Barclays Capital 7-Year Municipal Bond Index | | | | |
| |
| One Year | | | 5.53 | % |
| Five Years | | | 3.90 | |
| Ten Years | | | 4.95 | |
Lipper Averages7 (Average Annual Total Returns)
| | | | | |
| Lipper Other States Intermediate Municipal Debt Funds Classification | | | | |
| |
| One Year | | | 2.60 | % |
| Five Years | | | 2.36 | |
| Ten Years | | | 3.48 | |
Portfolio Manager: Adam A. Weigold, CFA
| | |
| * | | Source: Lipper, Inc. Class B of the Fund commenced operations on 6/1/92. A $10,000 hypothetical investment at net asset value in Class A and Class C on 3/31/99 would have been valued at $13,984 ($13,670 at the maximum offering price) and $12,957, respectively, on 3/31/09. It is not possible to invest directly in an Index. The Index’s total return does not reflect the expenses that would have been incurred if an investor individually purchased or sold the securities represented in the Index. |
Past performance is no guarantee of future results. Returns are historical and are calculated by determining the percentage change in net asset value or offering price (as applicable) with all distributions reinvested. Investment return and principal value will fluctuate so that shares, when redeemed, may be worth more or less than their original cost. Performance is for the stated time period only; due to market volatility, the Fund’s current performance may be lower or higher than the quoted return. For performance as of the most recent month end, please refer to www.eatonvance.com.
| | |
| 1 | | Average Annual Total Returns do not include the 2.25% maximum sales charge for Class A shares or the applicable contingent deferred sales charges (CDSC) for Class B and Class C shares. If sales charges were deducted, the returns would be lower. SEC Average Annual Total Returns for Class A reflect the maximum 2.25% sales charge. SEC Average Annual Total Returns for Class B reflect the applicable CDSC based on the following schedule: 3% — 1st year; 2.5% — 2nd year; 2% — 3rd year; 1% - - 4th year. SEC Average Annual Total Returns for Class C reflect a 1% CDSC for the first year. 2 Source: Prospectus dated 8/1/08. 3 The Fund’s distribution rate represents actual distributions paid to shareholders and is calculated by dividing the last distribution per share (annualized) by the net asset value. 4 Taxable-equivalent figures assume a maximum 37.00% combined federal and state income tax rate. A lower tax rate would result in lower tax-equivalent figures. 5 The Fund’s SEC yield is calculated by dividing the net investment income per share for the 30-day period by the offering price at the end of the period and annualizing the result. 6 It is not possible to invest directly in an Index. The Index’s total return does not reflect the expenses that would have been incurred if an investor individually purchased or sold the securities represented in the Index. Index performance is available as of month end only. 7 The Lipper Averages are the average annual total returns, at net asset value, of the funds that are in the same Lipper Classification as the Fund. It is not possible to invest in a Lipper Classification. Lipper Classifications may include insured and uninsured funds, as well as leveraged and unleveraged funds. The Lipper Other States Intermediate Municipal Debt Funds Classification contained 126, 118 and 86 funds for the 1-year, 5-year and 10-year time periods, respectively. Lipper Averages are available as of month end only. |
14
Eaton Vance Pennsylvania Limited Maturity Municipals Fund as of March 31, 2009
PORTFOLIO COMPOSITION
Rating Distribution1
By total investments
| | |
| 1 | | Rating Distribution is determined by dividing the total market value of the issues by the total investments of the Fund. Although the investment adviser considers ratings when making investment decisions, it performs its own credit and investment analysis and does not rely primarily on the ratings assigned by the rating services. Credit quality can change from time to time, and recently issued credit ratings may not fully reflect the actual risks posed by a particular security or the issuer’s current financial condition. |
Fund Statistics
| | | |
• Number of Issues: | | 59 |
• Average Maturity: | | 9.5 years |
• Average Effective Maturity: | | 6.9 years |
• Average Rating: | | A+ |
• Average Call Protection: | | 5.7 years |
• Average Dollar Price: | | $99.08 |
15
Eaton Vance Limited Maturity Municipals Funds as of March 31, 2009
FUND EXPENSES
Example: As a shareholder of a Fund, you incur two types of costs: (1) transaction costs, including sales charges (loads) on purchases and redemption fees (if applicable); and (2) ongoing costs, including management fees; distribution or service fees; and other Fund expenses. This Example is intended to help you understand your ongoing costs (in dollars) of investing in a Fund and to compare these costs with the ongoing costs of investing in other mutual funds. The Example is based on an investment of $1,000 invested at the beginning of the period and held for the entire period (October 1, 2008 – March 31, 2009).
Actual Expenses: The first section of each table below provides information about actual account values and actual expenses. You may use the information in this section, together with the amount you invested, to estimate the expenses that you paid over the period. Simply divide your account value by $1,000 (for example, an $8,600 account value divided by $1,000 = 8.6), then multiply the result by the number in the first section under the heading entitled “Expenses Paid During Period” to estimate the expenses you paid on your account during this period.
Hypothetical Example for Comparison Purposes: The second section of each table below provides information about hypothetical account values and hypothetical expenses based on the actual Fund expense ratio and an assumed rate of return of 5% per year (before expenses), which is not the actual return of the Fund. The hypothetical account values and expenses may not be used to estimate the actual ending account balance or expenses you paid for the period. You may use this information to compare the ongoing costs of investing in your Fund and other funds. To do so, compare this 5% hypothetical example with the 5% hypothetical examples that appear in the shareholder reports of the other funds.
Please note that the expenses shown in each table are meant to highlight your ongoing costs only and do not reflect any transactional costs, such as sales charges (loads) or redemption fees (if applicable). Therefore, the second section of each table is useful in comparing ongoing costs only, and will not help you determine the relative total costs of owning different funds. In addition, if these transactional costs were included, your costs would have been higher.
Eaton Vance California Limited Maturity Municipals Fund
| | | | | | | | | | | | | | | |
| | | Beginning Account Value
| | | Ending Account Value
| | | Expenses Paid During Period*
| | | |
| | | (10/1/08) | | | (3/31/09) | | | (10/1/08 – 3/31/09) | | | |
| |
| |
Actual | | | | | | | | | | | | | | |
| Class A | | | $1,000.00 | | | | $988.80 | | | | $4.91 | | | |
| Class B | | | $1,000.00 | | | | $984.80 | | | | $8.51 | | | |
| Class C | | | $1,000.00 | | | | $983.90 | | | | $8.56 | | | |
| | | | | | | | | | | | | | | |
| | | | | | | | | | | | | | | |
| |
| |
| | | | | | | | | | | | | | | |
Hypothetical | | | | | | | | | | | | | | |
| (5% return per year before expenses) | | | | | | | | | | | | | | |
| Class A | | | $1,000.00 | | | | $1,020.00 | | | | $4.99 | | | |
| Class B | | | $1,000.00 | | | | $1,016.40 | | | | $8.65 | | | |
| Class C | | | $1,000.00 | | | | $1,016.30 | | | | $8.70 | | | |
| | | |
| | * | Expenses are equal to the Fund’s annualized expense ratio of 0.99% for Class A shares, 1.72% for Class B shares and 1.73% for Class C shares, multiplied by the average account value over the period, multiplied by 182/365 (to reflect the one-half year period). The Example assumes that the $1,000 was invested at the net asset value per share determined at the close of business on September 30, 2008. | |
16
Eaton Vance Limited Maturity Municipals Funds as of March 31, 2009
FUND EXPENSES CONT’D
Eaton Vance Massachusetts Limited Maturity Municipals Fund
| | | | | | | | | | | | | | | |
| | | Beginning Account Value
| | | Ending Account Value
| | | Expenses Paid During Period*
| | | |
| | | (10/1/08) | | | (3/31/09) | | | (10/1/08 – 3/31/09) | | | |
| |
| |
Actual | | | | | | | | | | | | | | |
| Class A | | | $1,000.00 | | | | $1,017.20 | | | | $4.33 | | | |
| Class B | | | $1,000.00 | | | | $1,014.40 | | | | $8.09 | | | |
| Class C | | | $1,000.00 | | | | $1,014.40 | | | | $8.09 | | | |
| | | | | | | | | | | | | | | |
| | | | | | | | | | | | | | | |
| |
| |
| | | | | | | | | | | | | | | |
Hypothetical | | | | | | | | | | | | | | |
| (5% return per year before expenses) | | | | | | | | | | | | | | |
| Class A | | | $1,000.00 | | | | $1,020.60 | | | | $4.33 | | | |
| Class B | | | $1,000.00 | | | | $1,016.90 | | | | $8.10 | | | |
| Class C | | | $1,000.00 | | | | $1,016.90 | | | | $8.10 | | | |
| | | |
| | * | Expenses are equal to the Fund’s annualized expense ratio of 0.86% for Class A shares, 1.61% for Class B shares and 1.61% for Class C shares, multiplied by the average account value over the period, multiplied by 182/365 (to reflect the one-half year period). The Example assumes that the $1,000 was invested at the net asset value per share determined at the close of business on September 30, 2008. | |
Eaton Vance New Jersey Limited Maturity Municipals Fund
| | | | | | | | | | | | | | | |
| | | Beginning Account Value
| | | Ending Account Value
| | | Expenses Paid During Period*
| | | |
| | | (10/1/08) | | | (3/31/09) | | | (10/1/08 – 3/31/09) | | | |
| |
| |
Actual | | | | | | | | | | | | | | |
| Class A | | | $1,000.00 | | | | $1,026.30 | | | | $4.55 | | | |
| Class B | | | $1,000.00 | | | | $1,023.40 | | | | $8.32 | | | |
| Class C | | | $1,000.00 | | | | $1,022.40 | | | | $8.27 | | | |
| | | | | | | | | | | | | | | |
| | | | | | | | | | | | | | | |
| |
| |
| | | | | | | | | | | | | | | |
Hypothetical | | | | | | | | | | | | | | |
| (5% return per year before expenses) | | | | | | | | | | | | | | |
| Class A | | | $1,000.00 | | | | $1,020.40 | | | | $4.53 | | | |
| Class B | | | $1,000.00 | | | | $1,016.70 | | | | $8.30 | | | |
| Class C | | | $1,000.00 | | | | $1,016.80 | | | | $8.25 | | | |
| | | |
| | * | Expenses are equal to the Fund’s annualized expense ratio of 0.90% for Class A shares, 1.65% for Class B shares and 1.64% for Class C shares, multiplied by the average account value over the period, multiplied by 182/365 (to reflect the one-half year period). The Example assumes that the $1,000 was invested at the net asset value per share determined at the close of business on September 30, 2008. | |
17
Eaton Vance Limited Maturity Municipals Funds as of March 31, 2009
FUND EXPENSES CONT’D
Eaton Vance New York Limited Maturity Municipals Fund
| | | | | | | | | | | | | | | |
| | | Beginning Account Value
| | | Ending Account Value
| | | Expenses Paid During Period*
| | | |
| | | (10/1/08) | | | (3/31/09) | | | (10/1/08 – 3/31/09) | | | |
| |
| |
Actual | | | | | | | | | | | | | | |
| Class A | | | $1,000.00 | | | | $1,002.90 | | | | $4.29 | | | |
| Class B | | | $1,000.00 | | | | $999.10 | | | | $7.97 | | | |
| Class C | | | $1,000.00 | | | | $999.30 | | | | $8.03 | | | |
| | | | | | | | | | | | | | | |
| | | | | | | | | | | | | | | |
| |
| |
| | | | | | | | | | | | | | | |
Hypothetical | | | | | | | | | | | | | | |
| (5% return per year before expenses) | | | | | | | | | | | | | | |
| Class A | | | $1,000.00 | | | | $1,020.60 | | | | $4.33 | | | |
| Class B | | | $1,000.00 | | | | $1,017.00 | | | | $8.05 | | | |
| Class C | | | $1,000.00 | | | | $1,016.90 | | | | $8.10 | | | |
| | | |
| | * | Expenses are equal to the Fund’s annualized expense ratio of 0.86% for Class A shares, 1.60% for Class B shares and 1.61% for Class C shares, multiplied by the average account value over the period, multiplied by 182/365 (to reflect the one-half year period). The Example assumes that the $1,000 was invested at the net asset value per share determined at the close of business on September 30, 2008. | |
Eaton Vance Ohio Limited Maturity Municipals Fund
| | | | | | | | | | | | | | | |
| | | Beginning Account Value
| | | Ending Account Value
| | | Expenses Paid During Period*
| | | |
| | | (10/1/08) | | | (3/31/09) | | | (10/1/08 – 3/31/09) | | | |
| |
| |
Actual | | | | | | | | | | | | | | |
| Class A | | | $1,000.00 | | | | $1,024.70 | | | | $5.60 | | | |
| Class B | | | $1,000.00 | | | | $1,020.80 | | | | $9.37 | | | |
| Class C | | | $1,000.00 | | | | $1,020.80 | | | | $9.27 | | | |
| | | | | | | | | | | | | | | |
| | | | | | | | | | | | | | | |
| |
| |
| | | | | | | | | | | | | | | |
Hypothetical | | | | | | | | | | | | | | |
| (5% return per year before expenses) | | | | | | | | | | | | | | |
| Class A | | | $1,000.00 | | | | $1,019.40 | | | | $5.59 | | | |
| Class B | | | $1,000.00 | | | | $1,015.70 | | | | $9.35 | | | |
| Class C | | | $1,000.00 | | | | $1,015.80 | | | | $9.25 | | | |
| | | |
| | * | Expenses are equal to the Fund’s annualized expense ratio of 1.11% for Class A shares, 1.86% for Class B shares and 1.84% for Class C shares, multiplied by the average account value over the period, multiplied by 182/365 (to reflect the one-half year period). The Example assumes that the $1,000 was invested at the net asset value per share determined at the close of business on September 30, 2008. | |
18
Eaton Vance Limited Maturity Municipals Funds as of March 31, 2009
FUND EXPENSES CONT’D
Eaton Vance Pennsylvania Limited Maturity Municipals Fund
| | | | | | | | | | | | | | | |
| | | Beginning Account Value
| | | Ending Account Value
| | | Expenses Paid During Period*
| | | |
| | | (10/1/08) | | | (3/31/09) | | | (10/1/08 – 3/31/09) | | | |
| |
| |
Actual | | | | | | | | | | | | | | |
| Class A | | | $1,000.00 | | | | $1,030.00 | | | | $4.45 | | | |
| Class B | | | $1,000.00 | | | | $1,026.00 | | | | $8.28 | | | |
| Class C | | | $1,000.00 | | | | $1,025.40 | | | | $8.23 | | | |
| | | | | | | | | | | | | | | |
| | | | | | | | | | | | | | | |
| |
| |
| | | | | | | | | | | | | | | |
Hypothetical | | | | | | | | | | | | | | |
| (5% return per year before expenses) | | | | | | | | | | | | | | |
| Class A | | | $1,000.00 | | | | $1,020.50 | | | | $4.43 | | | |
| Class B | | | $1,000.00 | | | | $1,016.80 | | | | $8.25 | | | |
| Class C | | | $1,000.00 | | | | $1,016.80 | | | | $8.20 | | | |
| | | |
| | * | Expenses are equal to the Fund’s annualized expense ratio of 0.88% for Class A shares, 1.64% for Class B shares and 1.63% for Class C shares, multiplied by the average account value over the period, multiplied by 182/365 (to reflect the one-half year period). The Example assumes that the $1,000 was invested at the net asset value per share determined at the close of business on September 30, 2008. | |
19
Eaton Vance California Limited Maturity Municipals Fund as of March 31, 2009
PORTFOLIO OF INVESTMENTS
| | | | | | | | | | | |
| Tax-Exempt Investments — 98.8% |
| |
Principal Amount
| | | | | | | | |
| (000’s omitted) | | | Security | | Value | | | |
| |
| |
| |
| Escrowed / Prerefunded — 4.9% |
| |
| $ | 250 | | | California Department of Water Resource Power Supply, Prerefunded to 5/1/12, 5.125%, 5/1/18(1) | | $ | 282,225 | | | |
| | 520 | | | California Statewide Communities Development Authority, (San Gabriel Valley), Escrowed to Maturity, 5.50%, 9/1/14 | | | 582,270 | | | |
| | 181 | | | Roseville Special Tax, Prerefunded to 9/1/09, 6.00%, 9/1/11 | | | 187,849 | | | |
| | 55 | | | Santa Margarita Water District, Prerefunded to 9/1/09, 6.10%, 9/1/14 | | | 57,394 | | | |
| |
| |
| | | | | | | $ | 1,109,738 | | | |
| |
| |
| |
| |
| Health Care-Miscellaneous — 0.3% |
| |
| $ | 100 | | | Puerto Rico Infrastructure Financing Authority,
(Mepsi Campus Project), 6.25%, 10/1/24 | | $ | 77,772 | | | |
| |
| |
| | | | | | | $ | 77,772 | | | |
| |
| |
| |
| |
| Hospital — 12.8% |
| |
| $ | 500 | | | California Health Facilities Financing Authority, (Catholic Healthcare), 5.125%, 7/1/22 | | $ | 486,005 | | | |
| | 500 | | | California Health Facilities Financing Authority,
(Cedars-Sinai Medical Center), 5.00%, 11/15/16 | | | 509,565 | | | |
| | 500 | | | California Health Facilities Financing Authority,
(Scripps Health), 5.00%, 10/1/21 | | | 461,225 | | | |
| | 1,000 | | | California Statewide Communities Development Authority, (Huntington Memorial Hospital), 5.00%, 7/1/21 | | | 946,810 | | | |
| | 200 | | | San Benito Health Care District, 5.375%, 10/1/12 | | | 191,116 | | | |
| | 300 | | | Torrance Hospital, (Torrance Memorial Medical Center), 5.40%, 6/1/15 | | | 306,915 | | | |
| |
| |
| | | | | | | $ | 2,901,636 | | | |
| |
| |
| |
| |
| Housing — 5.0% |
| |
| $ | 500 | | | California Department of Veterans Affairs, Home Purchase Revenue, (AMT), 4.50%, 12/1/18 | | $ | 459,370 | | | |
| | 750 | | | California Housing Finance Agency, (AMT), 4.75%, 8/1/21 | | | 675,180 | | | |
| |
| |
| | | | | | | $ | 1,134,550 | | | |
| |
| |
| |
| |
| Industrial Development Revenue — 0.8% |
| |
| $ | 200 | | | California Pollution Control Financing Authority, (Browning Ferris Industries), (AMT), 5.80%, 12/1/16 | | $ | 183,644 | | | |
| |
| |
| | | | | | | $ | 183,644 | | | |
| |
| |
| |
| Insured-Education — 1.6% |
| |
| $ | 475 | | | California Educational Facilities Authority,
(San Diego University), (AMBAC), 0.00%, 10/1/15 | | $ | 365,555 | | | |
| |
| |
| | | | | | | $ | 365,555 | | | |
| |
| |
| |
| |
| Insured-Electric Utilities — 7.8% |
| |
| $ | 500 | | | California Pollution Control Financing Authority, (Pacific Gas and Electric), (NPFG), (AMT), 5.35%, 12/1/16 | | $ | 485,020 | | | |
| | 750 | | | California Pollution Control Financing Authority, (San Diego Gas and Electric), (NPFG), 5.90%, 6/1/14 | | | 792,247 | | | |
| | 500 | | | Puerto Rico Electric Power Authority, (NPFG), 5.50%, 7/1/18 | | | 483,085 | | | |
| |
| |
| | | | | | | $ | 1,760,352 | | | |
| |
| |
| |
| |
| Insured-General Obligations — 17.3% |
| |
| $ | 400 | | | Barstow Unified School District, (FGIC), (NPFG), 5.25%, 8/1/18 | | $ | 420,216 | | | |
| | 500 | | | Burbank Unified School District, (FGIC), (NPFG), 0.00%, 8/1/12 | | | 450,130 | | | |
| | 1,080 | | | Fillmore Unified School District, (FGIC), (NPFG), 0.00%, 7/1/15 | | | 841,115 | | | |
| | 760 | | | Fresno Unified School District, (NPFG), 5.80%, 2/1/16 | | | 831,630 | | | |
| | 750 | | | Oakland Unified School District, Alameda County, (FGIC), (NPFG), 5.00%, 8/1/22 | | | 689,070 | | | |
| | 1,000 | | | San Juan Unified School District, (FSA), 0.00%, 8/1/17 | | | 687,120 | | | |
| |
| |
| | | | | | | $ | 3,919,281 | | | |
| |
| |
| |
| |
| Insured-Lease Revenue / Certificates of Participation — 6.8% |
| |
| $ | 1,750 | | | Anaheim Public Financing Authority Lease Revenue, (Public Improvements), (FSA), 0.00%, 9/1/19 | | $ | 1,018,238 | | | |
| | 505 | | | California State Public Works Board, (Department of Corrections), (AMBAC), 5.25%, 12/1/13 | | | 528,230 | | | |
| |
| |
| | | | | | | $ | 1,546,468 | | | |
| |
| |
| |
| |
| Insured-Other Revenue — 3.2% |
| |
| $ | 800 | | | Golden State Tobacco Securitization Corp.,
(Tobacco Settlement Revenue), (AGC), (FGIC), 5.00%, 6/1/35 | | $ | 718,272 | | | |
| |
| |
| | | | | | | $ | 718,272 | | | |
| |
| |
| |
See notes to financial statements20
Eaton Vance California Limited Maturity Municipals Fund as of March 31, 2009
PORTFOLIO OF INVESTMENTS CONT’D
| | | | | | | | | | | |
Principal Amount
| | | | | | | | |
| (000’s omitted) | | | Security | | Value | | | |
| |
| |
| |
| Insured-Special Tax Revenue — 6.9% |
| |
| $ | 1,000 | | | Garden Grove Community Development, (Tax Allocation), (AMBAC), 5.25%, 10/1/16 | | $ | 1,014,470 | | | |
| | 500 | | | San Mateo County Transportation District, (NPFG), 5.25%, 6/1/17 | | | 560,005 | | | |
| |
| |
| | | | | | | $ | 1,574,475 | | | |
| |
| |
| |
| |
| Insured-Transportation — 10.7% |
| |
| $ | 975 | | | Port of Oakland, (NPFG), (AMT), 5.00%, 11/1/21 | | $ | 848,503 | | | |
| | 975 | | | San Joaquin Hills Transportation Corridor Agency Bridge & Toll Road, (NPFG), 0.00%, 1/15/12 | | | 846,807 | | | |
| | 750 | | | San Jose Airport Revenue, (AMBAC), (AMT), 5.50%, 3/1/18 | | | 734,160 | | | |
| |
| |
| | | | | | | $ | 2,429,470 | | | |
| |
| |
| |
| |
| Insured-Water and Sewer — 2.2% |
| |
| $ | 500 | | | Sunnyvale Financing Authority Water and Wastewater, (AMBAC), 5.00%, 10/1/22 | | $ | 507,030 | | | |
| |
| |
| | | | | | | $ | 507,030 | | | |
| |
| |
| |
| |
| Lease Revenue / Certificates of Participation — 2.3% |
| |
| $ | 500 | | | California Public Works, (University of California), 5.25%, 6/1/20 | | $ | 531,470 | | | |
| |
| |
| | | | | | | $ | 531,470 | | | |
| |
| |
| |
| |
| Senior Living / Life Care — 3.4% |
| |
| $ | 230 | | | ABAG Finance Authority, (American Baptist Homes), 5.75%, 10/1/17 | | $ | 191,222 | | | |
| | 670 | | | California Statewide Communities Development Authority, (Senior Living-Presbyterian Homes), 4.50%, 11/15/16 | | | 587,094 | | | |
| |
| |
| | | | | | | $ | 778,316 | | | |
| |
| |
| |
| |
| Solid Waste — 1.4% |
| |
| $ | 350 | | | Napa-Vallejo Waste Management Authority, (Solid Waste Transfer Facilities), (AMT), 5.10%, 2/15/14 | | $ | 321,626 | | | |
| |
| |
| | | | | | | $ | 321,626 | | | |
| |
| |
| |
| |
| Special Tax Revenue — 10.2% |
| |
| $ | 290 | | | Alameda Public Financing Authority, 5.45%, 9/2/14 | | $ | 274,627 | | | |
| | 205 | | | Brentwood Infrastructure Financing Authority, 4.625%, 9/2/18 | | | 163,928 | | | |
| | 195 | | | Corona Public Financing Authority, 5.70%, 9/1/13 | | | 190,281 | | | |
| | 100 | | | Eastern Municipal Water District, 4.80%, 9/1/20 | | | 76,373 | | | |
| | 75 | | | Eastern Municipal Water District, 4.85%, 9/1/21 | | | 55,909 | | | |
| | 200 | | | Fontana Redevelopment Agency, (Jurupa Hills), 5.50%, 10/1/17 | | | 201,716 | | | |
| | 40 | | | Moreno Valley Unified School District,
(Community District No. 2003-2), 5.20%, 9/1/17 | | | 35,209 | | | |
| | 80 | | | Moreno Valley Unified School District,
(Community District No. 2003-2), 5.25%, 9/1/18 | | | 69,187 | | | |
| | 390 | | | Pomona Redevelopment Agency,
(West Holt Avenue Redevelopment), 5.50%, 5/1/13 | | | 402,082 | | | |
| | 145 | | | Santa Margarita Water District, 6.10%, 9/1/14 | | | 144,958 | | | |
| | 200 | | | Santaluz Community Facility District No. 2, 5.80%, 9/1/14 | | | 193,194 | | | |
| | 100 | | | Temecula Valley Unified School District, 4.75%, 9/1/21 | | | 74,837 | | | |
| | 200 | | | Torrance Redevelopment Agency, 5.50%, 9/1/12 | | | 195,886 | | | |
| | 250 | | | Whittier Public Financing Authority, (Greenleaf Ave. Whittier Redevelopment), 5.50%, 11/1/16 | | | 226,360 | | | |
| |
| |
| | | | | | | $ | 2,304,547 | | | |
| |
| |
| |
| |
| Transportation — 1.2% |
| |
| $ | 290 | | | Port Redwood City, (AMT), 5.40%, 6/1/19 | | $ | 262,001 | | | |
| |
| |
| | | | | | | $ | 262,001 | | | |
| |
| |
| | | |
| Total Tax-Exempt Investments — 98.8% | | |
| (identified cost $22,982,345) | | $ | 22,426,203 | | | |
| |
| |
| | | | | | | |
| Other Assets, Less Liabilities — 1.2% | | $ | 271,339 | | | |
| |
| |
| | | | | | | |
| Net Assets — 100.0% | | $ | 22,697,542 | | | |
| |
| |
Industry and sector classifications included in the Portfolio of Investments are unaudited.
AGC - Assured Guaranty Corp.
AMBAC - AMBAC Financial Group, Inc.
AMT - Interest earned from these securities may be considered a tax preference item for purposes of the Federal Alternative Minimum Tax.
FGIC - Financial Guaranty Insurance Company
FSA - Financial Security Assurance, Inc.
NPFG - National Public Finance Guaranty Corp.
The Fund invests primarily in debt securities issued by California municipalities. The ability of the issuers of the debt securities to meet their obligations may be affected by economic developments in a specific industry or municipality. In order to reduce the risk associated with such economic developments, at March 31, 2009, 57.2% of total investments are backed by bond insurance of various financial institutions and financial guaranty assurance agencies. The aggregate percentage insured by an individual financial institution ranged from 3.2% to 32.3% of total investments.
| | |
| (1) | | Security (or a portion thereof) has been segregated to cover margin requirements on open financial futures contracts. |
See notes to financial statements21
Eaton Vance Massachusetts Limited Maturity Municipals Fund as of March 31, 2009
PORTFOLIO OF INVESTMENTS
| | | | | | | | | | | |
| Tax-Exempt Investments — 99.3% |
| |
Principal Amount
| | | | | | | | |
| (000’s omitted) | | | Security | | Value | | | |
| |
| |
| |
| Education — 16.4% |
| |
| $ | 1,000 | | | Massachusetts Development Finance Agency, (Milton Academy), 5.00%, 9/1/19 | | $ | 1,051,660 | | | |
| | 400 | | | Massachusetts Development Finance Agency, (Xaverian Brothers High School), 5.55%, 7/1/19 | | | 350,176 | | | |
| | 1,000 | | | Massachusetts Health and Educational Facilities Authority, (Boston College), 5.375%, 6/1/14 | | | 1,136,790 | | | |
| | 1,000 | | | Massachusetts Health and Educational Facilities Authority, (College of the Holy Cross), 5.00%, 9/1/20 | | | 1,063,020 | | | |
| | 1,000 | | | Massachusetts Health and Educational Facilities Authority, (Massachusetts Institute of Technology), 5.375%, 7/1/17 | | | 1,186,850 | | | |
| | 1,645 | | | Massachusetts Health and Educational Facilities Authority, (Massachusetts Institute of Technology), 5.50%, 7/1/22(1) | | | 1,918,021 | | | |
| | 100 | | | Massachusetts Health and Educational Facilities Authority, (Tufts University), 5.00%, 8/15/18 | | | 113,882 | | | |
| | 200 | | | Massachusetts Health and Educational Facilities Authority, (Tufts University), 5.25%, 8/15/19 | | | 227,820 | | | |
| | 150 | | | Massachusetts Health and Educational Facilities Authority, (Tufts University), 5.25%, 8/15/20 | | | 168,645 | | | |
| | 750 | | | Massachusetts Health and Educational Facilities Authority, (Tufts University), 5.50%, 8/15/15 | | | 867,547 | | | |
| | 1,000 | | | Massachusetts Health and Educational Facilities Authority, (Williams College), 5.00%, 7/1/23 | | | 1,067,200 | | | |
| | 750 | | | Massachusetts Industrial Finance Agency,
(St. John’s High School, Inc.), 5.70%, 6/1/18 | | | 751,567 | | | |
| |
| |
| | | | | | | $ | 9,903,178 | | | |
| |
| |
| |
| |
| Electric Utilities — 0.8% |
| |
| $ | 500 | | | Massachusetts Development Finance Agency, (Devens Electric System), 5.75%, 12/1/20 | | $ | 511,630 | | | |
| |
| |
| | | | | | | $ | 511,630 | | | |
| |
| |
| |
| |
| Escrowed / Prerefunded — 10.5% |
| |
| $ | 1,000 | | | Boston, Prerefunded to 2/1/11, 5.00%, 2/1/18 | | $ | 1,073,950 | | | |
| | 580 | | | Massachusetts Development Finance Agency, (Massachusetts College of Pharmacy), Escrowed to Maturity, 5.00%, 7/1/11 | | | 631,278 | | | |
| | 985 | | | Massachusetts Turnpike Authority, Escrowed to Maturity, 5.00%, 1/1/13 | | | 1,059,880 | | | |
| | 2,100 | | | Massachusetts Turnpike Authority, Escrowed to Maturity, 5.00%, 1/1/20 | | | 2,409,309 | | | |
| | 680 | | | Massachusetts Water Pollution Abatement Trust, Escrowed to Maturity, 5.25%, 8/1/14 | | | 765,530 | | | |
| | 400 | | | Rail Connections, Inc., (Route 128 Parking Garage), Escrowed to Maturity, 5.30%, 7/1/09 | | | 404,936 | | | |
| |
| |
| | | | | | | $ | 6,344,883 | | | |
| |
| |
| |
| |
| General Obligations — 9.5% |
| |
| $ | 500 | | | Burlington, 5.00%, 2/1/15 | | $ | 569,800 | | | |
| | 500 | | | Burlington, 5.00%, 2/1/16 | | | 575,715 | | | |
| | 750 | | | Falmouth, 5.25%, 2/1/16 | | | 818,183 | | | |
| | 1,000 | | | Manchester Essex Regional School District, 5.00%, 1/15/20 | | | 1,126,860 | | | |
| | 1,100 | | | Wellesley, 5.00%, 6/1/16 | | | 1,274,526 | | | |
| | 1,150 | | | Wellesley, 5.00%, 6/1/17 | | | 1,337,162 | | | |
| |
| |
| | | | | | | $ | 5,702,246 | | | |
| |
| |
| |
| |
| Health Care-Miscellaneous — 0.5% |
| |
| $ | 165 | | | Massachusetts Development Finance Agency, (MCHSP Human Services), 6.60%, 8/15/29 | | $ | 115,639 | | | |
| | 90 | | | Puerto Rico Infrastructure Financing Authority, (Mepsi Campus Project), 5.60%, 10/1/14 | | | 83,059 | | | |
| | 100 | | | Puerto Rico Infrastructure Financing Authority, (Mepsi Campus Project), 6.25%, 10/1/24 | | | 77,772 | | | |
| |
| |
| | | | | | | $ | 276,470 | | | |
| |
| |
| |
| |
| Hospital — 8.1% |
| |
| $ | 600 | | | Massachusetts Health and Educational Facilities Authority, (Baystate Medical Center), 5.75%, 7/1/14 | | $ | 623,040 | | | |
| | 865 | | | Massachusetts Health and Educational Facilities Authority, (Baystate Medical Center), 5.75%, 7/1/15 | | | 891,616 | | | |
| | 295 | | | Massachusetts Health and Educational Facilities Authority, (Central New England Health Systems), 6.125%, 8/1/13 | | | 294,988 | | | |
| | 1,000 | | | Massachusetts Health and Educational Facilities Authority, (Dana-Farber Cancer Institute), 5.25%, 12/1/24 | | | 988,470 | | | |
| | 250 | | | Massachusetts Health and Educational Facilities Authority, (Partners Healthcare System), 5.00%, 7/1/09 | | | 251,828 | | | |
| | 750 | | | Massachusetts Health and Educational Facilities Authority, (Partners Healthcare System), 5.00%, 7/1/18 | | | 781,065 | | | |
| | 1,000 | | | Massachusetts Health and Educational Facilities Authority, (Partners Healthcare System), 5.50%, 7/1/10 | | | 1,036,090 | | | |
| |
| |
| | | | | | | $ | 4,867,097 | | | |
| |
| |
| |
See notes to financial statements22
Eaton Vance Massachusetts Limited Maturity Municipals Fund as of March 31, 2009
PORTFOLIO OF INVESTMENTS CONT’D
| | | | | | | | | | | |
Principal Amount
| | | | | | | | |
| (000’s omitted) | | | Security | | Value | | | |
| |
| |
| |
| Industrial Development Revenue — 2.4% |
| |
| $ | 1,000 | | | Massachusetts Development Finance Agency, (Waste Management, Inc.), (AMT), 6.90% to 12/1/09 (Put Date), 12/1/29 | | $ | 1,004,220 | | | |
| | 745 | | | Virgin Islands Public Financing Authority, (HOVENSA LLC), (AMT), 4.70%, 7/1/22 | | | 452,029 | | | |
| |
| |
| | | | | | | $ | 1,456,249 | | | |
| |
| |
| |
| |
| Insured-Education — 3.8% |
| |
| $ | 1,400 | | | Massachusetts Development Finance Agency, (Simmons College), (XLCA), 5.25%, 10/1/21 | | $ | 1,202,810 | | | |
| | 1,000 | | | University of Massachusetts Building Authority, (AMBAC), 5.25%, 11/1/13 | | | 1,103,680 | | | |
| |
| |
| | | | | | | $ | 2,306,490 | | | |
| |
| |
| |
| |
| Insured-Electric Utilities — 6.7% |
| |
| $ | 1,000 | | | Massachusetts Power Supply System, (Municipal Wholesale Electric Co.), (NPFG), 5.25%, 7/1/12 | | $ | 1,061,000 | | | |
| | 1,000 | | | Massachusetts Power Supply System, (Municipal Wholesale Electric Co.), (NPFG), 5.25%, 7/1/13 | | | 1,049,290 | | | |
| | 2,000 | | | Puerto Rico Electric Power Authority, (NPFG), 5.50%, 7/1/18 | | | 1,932,340 | | | |
| |
| |
| | | | | | | $ | 4,042,630 | | | |
| |
| |
| |
| |
| Insured-Escrowed / Prerefunded — 4.8% |
| |
| $ | 1,000 | | | Boston, (NPFG), Prerefunded to 2/1/12, 5.00%, 2/1/19 | | $ | 1,105,000 | | | |
| | 1,000 | | | Massachusetts Health and Educational Facilities Authority, (Tufts-New England Medical Center), (FGIC), Prerefunded to 5/15/12, 5.375%, 5/15/15 | | | 1,111,590 | | | |
| | 635 | | | Massachusetts Turnpike Authority, (FGIC), Escrowed to Maturity, 5.125%, 1/1/23 | | | 698,005 | | | |
| |
| |
| | | | | | | $ | 2,914,595 | | | |
| |
| |
| |
| |
| Insured-General Obligations — 6.6% |
| |
| $ | 3,105 | | | Boston, (NPFG), 0.125%, 3/1/22 | | $ | 1,730,820 | | | |
| | 1,000 | | | Massachusetts, (AMBAC), 5.00%, 7/1/12 | | | 1,110,930 | | | |
| | 1,000 | | | Massachusetts, (NPFG), 5.25%, 8/1/22 | | | 1,117,270 | | | |
| |
| |
| | | | | | | $ | 3,959,020 | | | |
| |
| |
| |
| |
| Insured-Hospital — 1.5% |
| |
| $ | 1,000 | | | Massachusetts Health and Educational Facilities Authority, (Caregroup Healthcare System), (NPFG), 5.25%, 7/1/21 | | $ | 901,300 | | | |
| |
| |
| | | | | | | $ | 901,300 | | | |
| |
| |
| |
| Insured-Pooled Loans — 2.2% |
| |
| $ | 1,545 | | | Massachusetts Educational Financing Authority, (AMBAC), (AMT), 4.60%, 1/1/22 | | $ | 1,321,624 | | | |
| |
| |
| | | | | | | $ | 1,321,624 | | | |
| |
| |
| |
| |
| Insured-Solid Waste — 3.1% |
| |
| $ | 1,000 | | | Massachusetts Development Finance Agency, (SEMASS System), (NPFG), 5.625%, 1/1/13 | | $ | 997,400 | | | |
| | 890 | | | Massachusetts Development Finance Agency, (SEMASS System), (NPFG), 5.625%, 1/1/16 | | | 864,884 | | | |
| |
| |
| | | | | | | $ | 1,862,284 | | | |
| |
| |
| |
| |
| Insured-Special Tax Revenue — 3.9% |
| |
| $ | 500 | | | Massachusetts Special Obligations, (FGIC), (NPFG), 5.50%, 1/1/29 | | $ | 509,030 | | | |
| | 1,600 | | | Massachusetts Special Obligations, (FSA), 5.50%, 6/1/21 | | | 1,870,592 | | | |
| |
| |
| | | | | | | $ | 2,379,622 | | | |
| |
| |
| |
| |
| Insured-Transportation — 2.3% |
| |
| $ | 500 | | | Massachusetts Port Authority, (Delta Airlines), (AMBAC), (AMT), 5.50%, 1/1/15 | | $ | 353,025 | | | |
| | 1,000 | | | Puerto Rico Highway and Transportation Authority, (FSA), 5.50%, 7/1/11 | | | 1,046,830 | | | |
| |
| |
| | | | | | | $ | 1,399,855 | | | |
| |
| |
| |
| |
| Insured-Water and Sewer — 1.9% |
| |
| $ | 1,000 | | | Massachusetts Water Resources Authority, (FSA), 5.50%, 8/1/22 | | $ | 1,126,280 | | | |
| |
| |
| | | | | | | $ | 1,126,280 | | | |
| |
| |
| |
| |
| Other Revenue — 0.9% |
| |
| $ | 500 | | | Massachusetts Health and Educational Facilities Authority, (Woods Hole Oceanographic), 5.25%, 6/1/18 | | $ | 559,715 | | | |
| |
| |
| | | | | | | $ | 559,715 | | | |
| |
| |
| |
| |
| Senior Living / Life Care — 1.9% |
| |
| $ | 600 | | | Massachusetts Development Finance Agency, (Berkshire Retirement), 5.60%, 7/1/19 | | $ | 497,712 | | | |
| | 600 | | | Massachusetts Development Finance Agency, (Linden Ponds, Inc.), 5.50%, 11/15/22 | | | 409,722 | | | |
| | 275 | | | Massachusetts Development Finance Agency, (Volunteers of America), 5.00%, 11/1/17 | | | 220,264 | | | |
| |
| |
| | | | | | | $ | 1,127,698 | | | |
| |
| |
| |
See notes to financial statements23
Eaton Vance Massachusetts Limited Maturity Municipals Fund as of March 31, 2009
PORTFOLIO OF INVESTMENTS CONT’D
| | | | | | | | | | | |
Principal Amount
| | | | | | | | |
| (000’s omitted) | | | Security | | Value | | | |
| |
| |
| |
| Solid Waste — 1.5% |
| |
| $ | 1,000 | | | Massachusetts Industrial Finance Agency, (Ogden Haverhill), (AMT), 5.50%, 12/1/13 | | $ | 908,170 | | | |
| |
| |
| | | | | | | $ | 908,170 | | | |
| |
| |
| |
| |
| Special Tax Revenue — 2.9% |
| |
| $ | 1,000 | | | Massachusetts Bay Transportation Authority, Sales Tax, 5.25%, 7/1/16 | | $ | 1,158,990 | | | |
| | 500 | | | Massachusetts Special Obligations, 5.00%, 6/1/14 | | | 560,140 | | | |
| |
| |
| | | | | | | $ | 1,719,130 | | | |
| |
| |
| |
| |
| Transportation — 4.4% |
| |
| $ | 1,000 | | | Massachusetts Port Authority, (AMT), 6.25%, 7/1/17 | | $ | 1,022,130 | | | |
| | 2,000 | | | Massachusetts State Federal Highway Grant Anticipation Notes, 0.00%, 6/15/15 | | | 1,643,980 | | | |
| |
| |
| | | | | | | $ | 2,666,110 | | | |
| |
| |
| |
| |
| Water and Sewer — 2.7% |
| |
| $ | 1,000 | | | Massachusetts Water Pollution Abatement Trust, 5.00%, 8/1/25 | | $ | 1,085,160 | | | |
| | 500 | | | Massachusetts Water Pollution Abatement Trust, 5.25%, 2/1/12 | | | 544,285 | | | |
| |
| |
| | | | | | | $ | 1,629,445 | | | |
| |
| |
| | | |
| Total Tax-Exempt Investments — 99.3% | | |
| (identified cost $59,294,004) | | $ | 59,885,721 | | | |
| |
| |
| | | | | | | |
| Other Assets, Less Liabilities — 0.7% | | $ | 436,109 | | | |
| |
| |
| | | | | | | |
| Net Assets — 100.0% | | $ | 60,321,830 | | | |
| |
| |
Industry and sector classifications included in the Portfolio of Investments are unaudited.
AMBAC - AMBAC Financial Group, Inc.
AMT - Interest earned from these securities may be considered a tax preference item for purposes of the Federal Alternative Minimum Tax.
FGIC - Financial Guaranty Insurance Company
FSA - Financial Security Assurance, Inc.
NPFG - National Public Finance Guaranty Corp.
XLCA - XL Capital Assurance, Inc.
The Fund invests primarily in debt securities issued by Massachusetts municipalities. The ability of the issuers of the debt securities to meet their obligations may be affected by economic developments in a specific industry or municipality. In order to reduce the risk associated with such economic developments, at March 31, 2009, 37.1% of total investments are backed by bond insurance of various financial institutions and financial guaranty assurance agencies. The aggregate percentage insured by an individual financial institution ranged from 2.0% to 18.8% of total investments.
| | |
| (1) | | Security (or a portion thereof) has been segregated to cover margin requirements on open financial futures contracts. |
See notes to financial statements24
Eaton Vance New Jersey Limited Maturity Municipals Fund as of March 31, 2009
PORTFOLIO OF INVESTMENTS
| | | | | | | | | | | |
| Tax-Exempt Investments — 94.8% |
| |
Principal Amount
| | | | | | | | |
| (000’s omitted) | | | Security | | Value | | | |
| |
| |
| |
| Education — 2.5% |
| |
| $ | 1,000 | | | Rutgers State University, Series F, 5.00%, 5/1/23 | | $ | 1,069,170 | | | |
| |
| |
| | | | | | | $ | 1,069,170 | | | |
| |
| |
| |
| |
| Electric Utilities — 1.0% |
| |
| $ | 420 | | | New Jersey Economic Development Authority, Pollution Control Revenue, (PSEG Power), 5.00%, 3/1/12 | | $ | 409,492 | | | |
| |
| |
| | | | | | | $ | 409,492 | | | |
| |
| |
| |
| |
| Escrowed / Prerefunded — 9.5% |
| |
| $ | 350 | | | New Jersey Economic Development Authority, (Kapkowski Road Landfill), Prerefunded to 5/15/14, 6.375%, 4/1/18 | | $ | 418,215 | | | |
| | 2,030 | | | New Jersey Economic Development Authority, (Principal Custodial Receipts), Escrowed to Maturity, 0.00%, 12/15/12 | | | 1,886,662 | | | |
| | 300 | | | New Jersey Economic Development Authority, (The Seeing Eye, Inc.), Prerefunded to 12/1/09, 6.20%, 12/1/24 | | | 316,557 | | | |
| | 600 | | | New Jersey Educational Facilities Authority, (Higher Education Capital Improvements), Prerefunded to 9/1/10, 5.00%, 9/1/15 | | | 635,250 | | | |
| | 750 | | | New Jersey Educational Facilities Authority, (Stevens Institute of Technology), Escrowed to Maturity, 5.00%, 7/1/11 | | | 815,430 | | | |
| |
| |
| | | | | | | $ | 4,072,114 | | | |
| |
| |
| |
| |
| General Obligations — 2.5% |
| |
| $ | 500 | | | Jersey City School District, 6.25%, 10/1/10 | | $ | 534,895 | | | |
| | 500 | | | Monmouth County Improvement Authority, 5.00%, 12/1/21 | | | 545,010 | | | |
| |
| |
| | | | | | | $ | 1,079,905 | | | |
| |
| |
| |
| |
| Health Care-Miscellaneous — 0.2% |
| |
| $ | 100 | | | Puerto Rico Infrastructure Financing Authority, (Mepsi Campus Project), 6.25%, 10/1/24 | | $ | 77,772 | | | |
| |
| |
| | | | | | | $ | 77,772 | | | |
| |
| |
| |
| |
| Hospital — 7.3% |
| |
| $ | 1,000 | | | Camden County Improvement Authority,
(Cooper Health System), 5.25%, 2/15/20 | | $ | 794,910 | | | |
| | 500 | | | New Jersey Health Care Facilities Financing Authority, (Atlantic City Medical Care Center), 6.00%, 7/1/12 | | | 519,140 | | | |
| | 425 | | | New Jersey Health Care Facilities Financing Authority, (Capital Health System), 5.75%, 7/1/23 | | | 396,555 | | | |
| | 450 | | | New Jersey Health Care Facilities Financing Authority, (Hackensack University Medical Center), 6.125%, 1/1/20 | | | 455,148 | | | |
| | 500 | | | New Jersey Health Care Facilities Financing Authority, (Hunterdon Medical Center), 5.25%, 7/1/25 | | | 444,465 | | | |
| | 500 | | | New Jersey Health Care Facilities Financing Authority, (Robert Wood Johnson University Hospital), 5.60%, 7/1/15 | | | 506,330 | | | |
| |
| |
| | | | | | | $ | 3,116,548 | | | |
| |
| |
| |
| |
| Housing — 1.1% |
| |
| $ | 500 | | | New Jersey Housing and Mortgage Finance Agency, Single Family Housing, (AMT), 5.10%, 10/1/23 | | $ | 488,585 | | | |
| |
| |
| | | | | | | $ | 488,585 | | | |
| |
| |
| |
| |
| Industrial Development Revenue — 1.0% |
| |
| $ | 350 | | | New Jersey Economic Development Authority, (American Airlines, Inc.), (AMT), 7.10%, 11/1/31 | | $ | 129,220 | | | |
| | 450 | | | New Jersey Economic Development Authority, (Continental Airlines), (AMT), 6.25%, 9/15/19 | | | 301,837 | | | |
| |
| |
| | | | | | | $ | 431,057 | | | |
| |
| |
| |
| |
| Insured-Education — 5.6% |
| |
| $ | 545 | | | New Jersey Educational Facilities Authority, (Montclair State University), (NPFG), 3.75%, 7/1/24 | | $ | 452,726 | | | |
| | 1,000 | | | New Jersey Educational Facilities Authority, (Ramapo College), (AMBAC), 4.50%, 7/1/21 | | | 1,027,000 | | | |
| | 900 | | | New Jersey Educational Facilities Authority, (Ramapo College), (AMBAC), 4.60%, 7/1/14 | | | 934,875 | | | |
| |
| |
| | | | | | | $ | 2,414,601 | | | |
| |
| |
| |
| |
| Insured-Electric Utilities — 3.5% |
| |
| $ | 560 | | | Cape May County Industrial Pollution Control Financing Authority, (Atlantic City Electric Co.), (NPFG), 6.80%, 3/1/21 | | $ | 641,984 | | | |
| | 1,000 | | | Puerto Rico Electric Power Authority, (NPFG), 5.25%, 7/1/26 | | | 871,380 | | | |
| |
| |
| | | | | | | $ | 1,513,364 | | | |
| |
| |
| |
| |
| Insured-Escrowed/Prerefunded — 3.5% |
| |
| $ | 1,300 | | | New Jersey Health Care Facilities Financing Authority, (AHS Hospital Corp.), (AMBAC), Escrowed to Maturity, 6.00%, 7/1/12 | | $ | 1,484,626 | | | |
| |
| |
| | | | | | | $ | 1,484,626 | | | |
| |
| |
| |
See notes to financial statements25
Eaton Vance New Jersey Limited Maturity Municipals Fund as of March 31, 2009
PORTFOLIO OF INVESTMENTS CONT’D
| | | | | | | | | | | |
Principal Amount
| | | | | | | | |
| (000’s omitted) | | | Security | | Value | | | |
| |
| |
| |
| Insured-General Obligations — 14.7% |
| |
| $ | 330 | | | Clearview Regional High School District, (FGIC), (NPFG), 5.375%, 8/1/15 | | $ | 363,502 | | | |
| | 250 | | | Freehold Regional High School District, (FGIC), (NPFG), 5.00%, 3/1/18 | | | 282,365 | | | |
| | 470 | | | Hillsborough Township School District, (FSA), 5.375%, 10/1/18 | | | 547,808 | | | |
| | 1,000 | | | Jackson Township School District, (Baptist Healthcare Systems), (NPFG), 5.25%, 6/15/23 | | | 1,121,920 | | | |
| | 725 | | | Monroe Township Board of Education, (FGIC), (NPFG), 5.20%, 8/1/11 | | | 776,236 | | | |
| | 825 | | | Monroe Township Board of Education, (FGIC), (NPFG), 5.20%, 8/1/14 | | | 904,596 | | | |
| | 1,120 | | | New Jersey, (AMBAC), 5.25%, 7/15/19 | | | 1,271,581 | | | |
| | 500 | | | New Jersey, (FSA), 5.00%, 1/15/22 | | | 528,840 | | | |
| | 500 | | | New Jersey, (FSA), 5.00%, 1/15/23 | | | 523,945 | | | |
| |
| |
| | | | | | | $ | 6,320,793 | | | |
| |
| |
| |
| |
| Insured-Lease Revenue / Certificates of Participation — 3.9% |
| |
| $ | 1,000 | | | Hudson County, (NPFG), 6.25%, 6/1/15 | | $ | 1,085,520 | | | |
| | 500 | | | Puerto Rico Public Finance Corp., (AMBAC), 5.375%, 6/1/17 | | | 582,825 | | | |
| |
| |
| | | | | | | $ | 1,668,345 | | | |
| |
| |
| |
| |
| Insured-Transportation — 6.0% |
| |
| $ | 500 | | | Delaware River Port Authority, (FSA), 5.50%, 1/1/10 | | $ | 515,155 | | | |
| | 1,000 | | | New Jersey Transportation Trust Fund Authority, (NPFG), 5.50%, 12/15/17 | | | 1,093,450 | | | |
| | 770 | | | Port Authority of New York and New Jersey, (FGIC), (NPFG), (AMT), 4.50%, 10/1/20 | | | 729,983 | | | |
| | 250 | | | South Jersey Transportation Authority, (AMBAC), 5.00%, 11/1/18 | | | 253,283 | | | |
| |
| |
| | | | | | | $ | 2,591,871 | | | |
| |
| |
| |
| |
| Insured-Water and Sewer — 10.4% |
| |
| $ | 1,135 | | | Bayonne Municipal Utilities Authority, (XLCA), 5.25%, 4/1/19 | | $ | 1,096,058 | | | |
| | 1,000 | | | North Hudson Sewer Authority, (NPFG), 5.125%, 8/1/22 | | | 1,020,290 | | | |
| | 1,020 | | | Passaic Valley Water Commission, (FSA), 5.00%, 12/15/17 | | | 1,150,805 | | | |
| | 565 | | | Pennsville Sewer Authority, (NPFG), 0.00%, 11/1/16 | | | 423,682 | | | |
| | 565 | | | Pennsville Sewer Authority, (NPFG), 0.00%, 11/1/17 | | | 400,178 | | | |
| | 565 | | | Pennsville Sewer Authority, (NPFG), 0.00%, 11/1/18 | | | 376,917 | | | |
| |
| |
| | | | | | | $ | 4,467,930 | | | |
| |
| |
| |
| Lease Revenue / Certificates of Participation — 5.4% |
| |
| $ | 1,100 | | | Bergen County Improvement Authority, (County Administration Complex), 5.00%, 11/15/24(1) | | $ | 1,213,333 | | | |
| | 1,000 | | | New Jersey Economic Development Authority, (School Facilities Construction), 5.50%, 9/1/19 | | | 1,094,330 | | | |
| |
| |
| | | | | | | $ | 2,307,663 | | | |
| |
| |
| |
| |
| Nursing Home — 1.2% |
| |
| $ | 500 | | | New Jersey Economic Development Authority, (Masonic Charity Foundation), 4.80%, 6/1/11 | | $ | 516,205 | | | |
| |
| |
| | | | | | | $ | 516,205 | | | |
| |
| |
| |
| |
| Pooled Loans — 5.2% |
| |
| $ | 2,000 | | | New Jersey Economic Environmental Infrastructure Trust, 5.00%, 9/1/20 | | $ | 2,248,200 | | | |
| |
| |
| | | | | | | $ | 2,248,200 | | | |
| |
| |
| |
| |
| Senior Living/Life Care — 2.0% |
| |
| $ | 520 | | | New Jersey Economic Development Authority,
(Cranes Mill Project), 5.50%, 7/1/18 | | $ | 475,587 | | | |
| | 400 | | | New Jersey Economic Development Authority,
(Seabrook Village, Inc.), 5.00%, 11/15/12 | | | 377,496 | | | |
| |
| |
| | | | | | | $ | 853,083 | | | |
| |
| |
| |
| |
| Special Tax Revenue — 1.9% |
| |
| $ | 500 | | | New Jersey Economic Development Authority, (Cigarette Tax), 5.50%, 6/15/16 | | $ | 455,685 | | | |
| | 180 | | | New Jersey Economic Development Authority, (Newark Downtown Distribution Management Corp.), 4.625%, 6/15/12 | | | 172,107 | | | |
| | 190 | | | New Jersey Economic Development Authority, (Newark Downtown Distribution Management Corp.), 4.625%, 6/15/13 | | | 176,462 | | | |
| |
| |
| | | | | | | $ | 804,254 | | | |
| |
| |
| |
| |
| Transportation — 6.4% |
| |
| $ | 1,000 | | | New Jersey Transportation Trust Fund Authority, 5.25%, 12/15/21 | | $ | 1,045,660 | | | |
| | 1,000 | | | Port Authority of New York and New Jersey, (AMT), 5.25%, 9/15/23 | | | 1,001,600 | | | |
| | 700 | | | Port Authority of New York and New Jersey, (AMT), 5.50%, 7/15/12 | | | 708,295 | | | |
| |
| |
| | | | | | | $ | 2,755,555 | | | |
| |
| |
| | | |
| Total Tax-Exempt Investments — 94.8% | | |
| (identified cost $40,299,041) | | $ | 40,691,133 | | | |
| |
| |
| |
See notes to financial statements26
Eaton Vance New Jersey Limited Maturity Municipals Fund as of March 31, 2009
PORTFOLIO OF INVESTMENTS CONT’D
| | | | | | | | | | | |
| Short-Term Investments — 4.7% |
| |
Principal Amount
| | | | | | | | |
| (000’s omitted) | | | Security | | Value | | | |
| |
| |
| $ | 2,000 | | | California Housing Finance Agency Revenue, Variable Rate, (SPA: Bank of Nova Scotia), 0.40%, 2/1/25(2) | | $ | 2,000,000 | | | |
| |
| |
| | | |
| Total Short-Term Investments — 4.7% | | |
| (identified cost $2,000,000) | | $ | 2,000,000 | | | |
| |
| |
| | | |
| Total Investments — 99.5% | | |
| (identified cost $42,299,041) | | $ | 42,691,133 | | | |
| |
| |
| | | | | | | |
| Other Assets, Less Liabilities — 0.5% | | $ | 221,785 | | | |
| |
| |
| | | | | | | |
| Net Assets — 100.0% | | $ | 42,912,918 | | | |
| |
| |
Industry and sector classifications included in the Portfolio of Investments are unaudited.
AMBAC - AMBAC Financial Group, Inc.
AMT - Interest earned from these securities may be considered a tax preference item for purposes of the Federal Alternative Minimum Tax.
FGIC - Financial Guaranty Insurance Company
FSA - Financial Security Assurance, Inc.
NPFG - National Public Finance Guaranty Corp.
XLCA - XL Capital Assurance, Inc.
The Fund invests primarily in debt securities issued by New Jersey municipalities. The ability of the issuers of the debt securities to meet their obligations may be affected by economic developments in a specific industry or municipality. In order to reduce the risk associated with such economic developments, at March 31, 2009, 47.9% of total investments are backed by bond insurance of various financial institutions and financial guaranty assurance agencies. The aggregate percentage insured by an individual financial institution ranged from 2.6% to 24.7% of total investments.
| | |
| (1) | | Security (or a portion thereof) has been segregated to cover margin requirements on open financial futures contracts. |
| |
| (2) | | Variable rate demand obligation. The stated interest rate represents the rate in effect at March 31, 2009. |
See notes to financial statements27
Eaton Vance New York Limited Maturity Municipals Fund as of March 31, 2009
PORTFOLIO OF INVESTMENTS
| | | | | | | | | | | |
| Tax-Exempt Investments — 97.7% |
| |
Principal Amount
| | | | | | | | |
| (000’s omitted) | | | Security | | Value | | | |
| |
| |
| |
| Cogeneration — 0.5% |
| |
| $ | 600 | | | Suffolk County Industrial Development Agency, (Nissequogue Cogeneration Partners Facility), (AMT), 5.50%, 1/1/23 | | $ | 421,980 | | | |
| |
| |
| | | | | | | $ | 421,980 | | | |
| |
| |
| |
| |
| Education — 3.4% |
| |
| $ | 1,500 | | | New York Dormitory Authority, (State University Educational Facilities), 5.00%, 7/1/20 | | $ | 1,611,330 | | | |
| | 600 | | | New York Dormitory Authority, (State University Educational Facilities), 5.25%, 5/15/15 | | | 675,684 | | | |
| | 625 | | | Troy Industrial Development Authority, (Rensselaer Polytechnic Institute), 5.50%, 9/1/15 | | | 686,150 | | | |
| |
| |
| | | | | | | $ | 2,973,164 | | | |
| |
| |
| |
| |
| Electric Utilities — 2.8% |
| |
| $ | 2,500 | | | New York Energy Research and Development Authority Facility, (AMT), 4.70%, 6/1/36 | | $ | 2,500,050 | | | |
| |
| |
| | | | | | | $ | 2,500,050 | | | |
| |
| |
| |
| |
| Escrowed / Prerefunded — 4.2% |
| |
| $ | 1,000 | | | New York Dormitory Authority, (Child Care Facility), Prerefunded to 4/1/12, 5.375%, 4/1/14 | | $ | 1,124,400 | | | |
| | 70 | | | New York Urban Development Corp., (Correctional and Youth Facilities), Prerefunded to 1/1/11, 5.50%, 1/1/17 | | | 75,673 | | | |
| | 25 | | | Suffolk County Industrial Development Agency, (Jefferson’s Ferry Project), Prerefunded to 11/1/09, 7.20%, 11/1/19 | | | 26,415 | | | |
| | 1,170 | | | Triborough Bridge and Tunnel Authority, Escrowed to Maturity, 5.00%, 1/1/20 | | | 1,295,939 | | | |
| | 1,000 | | | Triborough Bridge and Tunnel Authority, Prerefunded to 1/1/16, 5.375%, 1/1/19 | | | 1,189,480 | | | |
| |
| |
| | | | | | | $ | 3,711,907 | | | |
| |
| |
| |
| |
| Health Care-Miscellaneous — 0.8% |
| |
| $ | 90 | | | Puerto Rico Infrastructure Financing Authority, (Mepsi Campus Project), 5.60%, 10/1/14 | | $ | 83,059 | | | |
| | 200 | | | Puerto Rico Infrastructure Financing Authority, (Mepsi Campus Project), 6.25%, 10/1/24 | | | 155,544 | | | |
| | 100 | | | Suffolk County Industrial Development Agency,
(Alliance of Long Island Agencies), 7.50%, 9/1/15 | | | 97,471 | | | |
| | 400 | | | Westchester County Industrial Development Agency, (Children’s Village), 5.375%, 3/15/19 | | | 319,316 | | | |
| |
| |
| | | | | | | $ | 655,390 | | | |
| |
| |
| |
| Hospital — 9.4% |
| |
| $ | 370 | | | Chautauqua County Industrial Development Agency, (Women’s Christian Association), 6.35%, 11/15/17 | | $ | 316,383 | | | |
| | 130 | | | Fulton County Industrial Development Agency, (Nathan Littauer Hospital), 5.75%, 11/1/09 | | | 129,916 | | | |
| | 265 | | | Nassau County Industrial Development Agency, (North Shore Health System), 5.625%, 11/1/10 | | | 271,132 | | | |
| | 460 | | | Nassau County Industrial Development Agency, (North Shore Health System), 5.875%, 11/1/11 | | | 477,448 | | | |
| | 2,000 | | | New York Dormitory Authority, (Interfaith Medical Center), 5.00%, 2/15/21 | | | 2,031,060 | | | |
| | 1,000 | | | New York Dormitory Authority, (Lenox Hill Hospital), 5.75%, 7/1/13 | | | 942,880 | | | |
| | 200 | | | New York Dormitory Authority, (Lenox Hill Hospital), 5.75%, 7/1/15 | | | 183,556 | | | |
| | 500 | | | New York Dormitory Authority, (Lenox Hill Hospital), 5.75%, 7/1/17 | | | 434,705 | | | |
| | 415 | | | New York Dormitory Authority, (NYU Hospital Center), 5.25%, 7/1/24 | | | 294,870 | | | |
| | 1,000 | | | New York Health and Hospital Corp., 5.50%, 2/15/19 | | | 1,056,620 | | | |
| | 180 | | | Oneida County Industrial Development Agency, (St. Elizabeth Medical Center), 5.50%, 12/1/10 | | | 175,788 | | | |
| | 1,325 | | | Saratoga County Industrial Development Agency, (Saratoga Hospital Project), 5.00%, 12/1/17 | | | 1,262,592 | | | |
| | 750 | | | Suffolk County Industrial Development Agency, (Huntington Hospital), 6.00%, 11/1/22 | | | 714,053 | | | |
| |
| |
| | | | | | | $ | 8,291,003 | | | |
| |
| |
| |
| |
| Housing — 3.4% |
| |
| $ | 1,000 | | | New York Housing Finance Agency, (Affordable Housing), (AMT), 5.05%, 11/1/22 | | $ | 988,350 | | | |
| | 2,000 | | | New York State Mortgage Agency, (AMT), 4.95%, 10/1/21 | | | 1,995,380 | | | |
| |
| |
| | �� | | | | | $ | 2,983,730 | | | |
| |
| |
| |
| |
| Industrial Development Revenue — 6.8% |
| |
| $ | 1,000 | | | Dutchess County Industrial Development Agency, (IBM Corporation), (AMT), 5.45%, 12/1/29 | | $ | 1,015,410 | | | |
| | 1,500 | | | Liberty Development Corp., (Goldman Sachs Group, Inc.), 5.50%, 10/1/37 | | | 1,279,800 | | | |
| | 1,250 | | | New York City Industrial Development Agency, (Terminal One Group), (AMT), 5.50%, 1/1/14 | | | 1,192,850 | | | |
| | 1,000 | | | New York State Environmental Facilities Corp., Solid Waste Disposal, (Waste Management Project), (AMT), 4.55%, 5/1/12 | | | 936,320 | | | |
| | 250 | | | Onondaga County Industrial Development Agency, (Senior Air Cargo), (AMT), 6.125%, 1/1/32 | | | 176,473 | | | |
See notes to financial statements28
Eaton Vance New York Limited Maturity Municipals Fund as of March 31, 2009
PORTFOLIO OF INVESTMENTS CONT’D
| | | | | | | | | | | |
Principal Amount
| | | | | | | | |
| (000’s omitted) | | | Security | | Value | | | |
| |
| |
| Industrial Development Revenue (continued) |
| |
| | | | | | | | | | | |
| $ | 1,500 | | | Puerto Rico Port Authority, (American Airlines, Inc.), (AMT), 6.25%, 6/1/26 | | $ | 591,960 | | | |
| | 1,250 | | | Virgin Islands Public Financing Authority, (HOVENSA LLC), (AMT), 4.70%, 7/1/22 | | | 758,437 | | | |
| |
| |
| | | | | | | $ | 5,951,250 | | | |
| |
| |
| |
| |
| Insured-Education — 10.3% |
| |
| $ | 1,000 | | | New York Dormitory Authority, (Canisius College), (NPFG), 5.00%, 7/1/16 | | $ | 969,480 | | | |
| | 1,000 | | | New York Dormitory Authority, (City University), (AMBAC), 5.625%, 7/1/16 | | | 1,086,180 | | | |
| | 1,420 | | | New York Dormitory Authority, (Educational Housing Services), (AMBAC), 5.25%, 7/1/20 | | | 1,371,904 | | | |
| | 1,000 | | | New York Dormitory Authority, (New York University), (AMBAC), 5.50%, 7/1/19 | | | 1,132,700 | | | |
| | 1,085 | | | New York Dormitory Authority, (Rochester Institute of Technology), (AMBAC), 5.25%, 7/1/21 | | | 1,109,532 | | | |
| | 1,000 | | | New York Dormitory Authority, (State University Educational Facilities), (FSA), 5.75%, 5/15/17 | | | 1,159,370 | | | |
| | 1,000 | | | New York Dormitory Authority, (Student Housing), (FGIC), (NPFG), 5.25%, 7/1/15 | | | 1,109,010 | | | |
| | 1,000 | | | New York Dormitory Authority, (University Educational Facilities), (FGIC), (NPFG), 5.25%, 5/15/13 | | | 1,073,630 | | | |
| |
| |
| | | | | | | $ | 9,011,806 | | | |
| |
| |
| |
| |
| Insured-Electric Utilities — 6.1% |
| |
| $ | 2,500 | | | Long Island Power Authority, Electric Systems Revenue, (FGIC), (NPFG), 5.00%, 12/1/22 | | $ | 2,506,925 | | | |
| | 500 | | | Long Island Power Authority, Electric Systems Revenue, (FSA), 0.00%, 6/1/15 | | | 404,175 | | | |
| | 1,250 | | | Puerto Rico Electric Power Authority, (XLCA), 5.375%, 7/1/17 | | | 1,213,050 | | | |
| | 1,250 | | | Puerto Rico Electric Power Authority, (XLCA), 5.375%, 7/1/18 | | | 1,196,737 | | | |
| |
| |
| | | | | | | $ | 5,320,887 | | | |
| |
| |
| |
| |
| Insured-Escrowed / Prerefunded — 0.3% |
| |
| $ | 250 | | | Niagara County Industrial Development Agency, (Niagara University), (AMBAC), Escrowed to Maturity, 5.25%, 10/1/18 | | $ | 301,478 | | | |
| |
| |
| | | | | | | $ | 301,478 | | | |
| |
| |
| |
| Insured-General Obligations — 3.9% |
| |
| $ | 500 | | | Clarence Central School District, (FSA), 5.00%, 5/15/17 | | $ | 540,560 | | | |
| | 1,000 | | | Monroe County, (Public Improvements), (NPFG), 6.00%, 3/1/19 | | | 1,095,250 | | | |
| | 1,915 | | | Puerto Rico, (FGIC), 5.50%, 7/1/17 | | | 1,788,763 | | | |
| |
| |
| | | | | | | $ | 3,424,573 | | | |
| |
| |
| |
| |
| Insured-Hospital — 2.6% |
| |
| $ | 1,600 | | | New York Dormitory Authority, (Memorial Sloan Kettering Cancer Center), (NPFG), 5.50%, 7/1/17 | | $ | 1,777,824 | | | |
| | 500 | | | New York Dormitory Authority, (New York and Presbyterian Hospital), (AMBAC), 5.50%, 8/1/11 | | | 538,330 | | | |
| |
| |
| | | | | | | $ | 2,316,154 | | | |
| |
| |
| |
| |
| Insured-Lease Revenue / Certificates of Participation — 2.4% |
| |
| $ | 1,000 | | | New York Dormitory Authority, (Master BOCES Program-Oneida Herkimer Madison BOCES), (FSA), 5.25%, 8/15/20 | | $ | 1,074,830 | | | |
| | 1,000 | | | New York Dormitory Authority, (Municipal Health Facilities), (FSA), 5.50%, 1/15/13 | | | 1,071,420 | | | |
| |
| |
| | | | | | | $ | 2,146,250 | | | |
| |
| |
| |
| |
| Insured-Other Revenue — 2.7% |
| |
| $ | 500 | | | New York City Industrial Development Agency, (Queens Baseball Stadium), (AMBAC), 5.00%, 1/1/22 | | $ | 457,090 | | | |
| | 2,500 | | | New York City Industrial Development Agency, (Yankee Stadium), (AGC), 0.00%, 3/1/15 | | | 1,916,950 | | | |
| |
| |
| | | | | | | $ | 2,374,040 | | | |
| |
| |
| |
| |
| Insured-Special Tax Revenue — 6.5% |
| |
| $ | 2,250 | | | New York Local Government Assistance Corp., (NPFG), 0.00%, 4/1/13 | | $ | 2,047,230 | | | |
| | 2,000 | | | New York Urban Development Corp., (Personal Income Tax), (AMBAC), 5.50%, 3/15/19 | | | 2,295,340 | | | |
| | 1,500 | | | Puerto Rico Infrastructure Financing Authority, (FGIC), 5.50%, 7/1/19 | | | 1,356,525 | | | |
| |
| |
| | | | | | | $ | 5,699,095 | | | |
| |
| |
| |
| |
| Insured-Transportation — 8.9% |
| |
| $ | 1,000 | | | Metropolitan Transportation Authority, (AMBAC), 5.50%, 11/15/18 | | $ | 1,070,170 | | | |
| | 1,000 | | | Metropolitan Transportation Authority, (NPFG), 5.50%, 11/15/13 | | | 1,093,290 | | | |
| | 1,000 | | | Monroe County Airport Authority, (NPFG), (AMT), 5.875%, 1/1/17 | | | 1,005,140 | | | |
| | 2,235 | | | New York Thruway Authority, (AMBAC), 5.50%, 4/1/20 | | | 2,488,851 | | | |
See notes to financial statements29
Eaton Vance New York Limited Maturity Municipals Fund as of March 31, 2009
PORTFOLIO OF INVESTMENTS CONT’D
| | | | | | | | | | | |
Principal Amount
| | | | | | | | |
| (000’s omitted) | | | Security | | Value | | | |
| |
| |
| Insured-Transportation (continued) |
| |
| | | | | | | | | | | |
| $ | 1,920 | | | Triborough Bridge and Tunnel Authority, (NPFG), 5.50%, 11/15/18 | | $ | 2,178,432 | | | |
| |
| |
| | | | | | | $ | 7,835,883 | | | |
| |
| |
| |
| |
| Lease Revenue / Certificates of Participation — 1.8% |
| |
| $ | 500 | | | New York Urban Development Corp., 5.00%, 1/1/18 | | $ | 538,490 | | | |
| | 1,025 | | | New York Urban Development Corp., (Correctional and Youth Facilities), 5.50%, 1/1/17 | | | 1,063,161 | | | |
| |
| |
| | | | | | | $ | 1,601,651 | | | |
| |
| |
| |
| |
| Other Revenue — 0.7% |
| |
| $ | 750 | | | Albany Industrial Development Agency, (Charitable Leadership), 6.00%, 7/1/19 | | $ | 630,300 | | | |
| |
| |
| | | | | | | $ | 630,300 | | | |
| |
| |
| |
| |
| Senior Living / Life Care — 0.4% |
| |
| $ | 400 | | | Mt. Vernon Industrial Development Agency, (Wartburg Senior Housing, Inc.), 6.15%, 6/1/19 | | $ | 336,436 | | | |
| |
| |
| | | | | | | $ | 336,436 | | | |
| |
| |
| |
| |
| Solid Waste — 2.9% |
| |
| $ | 750 | | | Hempstead Industrial Development Agency, (American Refuel), 5.00%, 12/1/10 | | $ | 730,192 | | | |
| | 2,000 | | | Niagara County Industrial Development Agency, (American Ref-Fuel Co., LLC), (AMT), 5.55%, 11/15/24 | | | 1,850,180 | | | |
| |
| |
| | | | | | | $ | 2,580,372 | | | |
| |
| |
| |
| |
| Special Tax Revenue — 8.0% |
| |
| $ | 1,140 | | | 34th Street Partnership, Inc., 5.00%, 1/1/17 | | $ | 1,226,537 | | | |
| | 500 | | | New York City Transitional Finance Authority, 5.375%, 2/15/14 | | | 541,220 | | | |
| | 865 | | | New York City Transitional Finance Authority, (Future Tax), 4.75%, 11/15/23 | | | 867,898 | | | |
| | 1,000 | | | New York City Transitional Finance Authority, (Future Tax), 5.375%, 2/1/13 | | | 1,065,780 | | | |
| | 3,000 | | | New York State Local Government Assistance Corp., 5.25%, 4/1/16 | | | 3,322,290 | | | |
| |
| |
| | | | | | | $ | 7,023,725 | | | |
| |
| |
| |
| |
| Transportation — 2.3% |
| |
| $ | 1,000 | | | Metropolitan Transportation Authority, 5.00%, 11/15/21 | | $ | 1,004,120 | | | |
| | 1,000 | | | Port Authority of New York and New Jersey, (AMT), 5.25%, 9/15/23 | | | 1,001,600 | | | |
| |
| |
| | | | | | | $ | 2,005,720 | | | |
| |
| |
| |
| Water and Sewer — 6.6% |
| |
| $ | 1,000 | | | Erie County Water Authority, 5.00%, 12/1/18 | | $ | 1,121,200 | | | |
| | 2,430 | | | New York City Municipal Water Finance, 5.00%, 6/15/21 | | | 2,553,882 | | | |
| | 515 | | | New York State Environmental Facilities Corp., Clean Water, (Municipal Water Finance), 5.00%, 6/15/18(1) | | | 547,553 | | | |
| | 1,000 | | | New York State Environmental Facilities Corp., Clean Water, (Municipal Water Finance), 5.00%, 6/15/20 | | | 1,066,460 | | | |
| | 500 | | | New York State Environmental Facilities Corp., Clean Water, (Municipal Water Finance), 5.25%, 6/15/14(1) | | | 545,245 | | | |
| |
| |
| | | | | | | $ | 5,834,340 | | | |
| |
| |
| | | |
| Total Tax-Exempt Investments — 97.7% | | |
| (identified cost $87,946,528) | | $ | 85,931,184 | | | |
| |
| |
| | | | | | | |
| Other Assets, Less Liabilities — 2.3% | | $ | 1,983,567 | | | |
| |
| |
| | | | | | | |
| Net Assets — 100.0% | | $ | 87,914,751 | | | |
| |
| |
Industry and sector classifications included in the Portfolio of Investments are unaudited.
AGC - Assured Guaranty Corp.
AMBAC - AMBAC Financial Group, Inc.
AMT - Interest earned from these securities may be considered a tax preference item for purposes of the Federal Alternative Minimum Tax.
FGIC - Financial Guaranty Insurance Company
FSA - Financial Security Assurance, Inc.
NPFG - National Public Finance Guaranty Corp.
XLCA - XL Capital Assurance, Inc.
The Fund invests primarily in debt securities issued by New York municipalities. The ability of the issuers of the debt securities to meet their obligations may be affected by economic developments in a specific industry or municipality. In order to reduce the risk associated with such economic developments, at March 31, 2009, 44.7% of total investments are backed by bond insurance of various financial institutions and financial guaranty assurance agencies. The aggregate percentage insured by an individual financial institution ranged from 2.2% to 17.3% of total investments.
| | |
| (1) | | Security (or a portion thereof) has been segregated to cover margin requirements on open financial futures contracts. |
See notes to financial statements30
Eaton Vance Ohio Limited Maturity Municipals Fund as of March 31, 2009
PORTFOLIO OF INVESTMENTS
| | | | | | | | | | | |
| Tax-Exempt Investments — 99.5% |
| |
Principal Amount
| | | | | | | | |
| (000’s omitted) | | | Security | | Value | | | |
| |
| |
| |
| Cogeneration — 0.4% |
| |
| $ | 95 | | | Ohio Water Development Authority, Solid Waste Disposal, (Bay Shore Power), (AMT), 6.625%, 9/1/20 | | $ | 79,008 | | | |
| |
| |
| | | | | | | $ | 79,008 | | | |
| |
| |
| |
| |
| Education — 7.0% |
| |
| $ | 500 | | | Ohio Higher Educational Facilities Commission, (John Carroll University), 5.00%, 11/15/13 | | $ | 534,925 | | | |
| | 250 | | | Ohio State University General Receipts, 5.00%, 12/1/23 | | | 264,560 | | | |
| | 500 | | | Ohio State University General Receipts, 5.25%, 12/1/17 | | | 546,440 | | | |
| |
| |
| | | | | | | $ | 1,345,925 | | | |
| |
| |
| |
| |
| Electric Utilities — 1.0% |
| |
| $ | 200 | | | Ohio Air Quality Development Authority, (Ohio Power Company), (AMT), Variable Rate, 7.125% to 6/1/10, 6/1/41 | | $ | 201,034 | | | |
| |
| |
| | | | | | | $ | 201,034 | | | |
| |
| |
| |
| |
| Escrowed/Prerefunded — 0.9% |
| |
| $ | 165 | | | Richland County Hospital Facilities, (Medcentral Health Systems), Prerefunded to 11/15/10, 6.375%, 11/15/22 | | $ | 180,602 | | | |
| |
| |
| | | | | | | $ | 180,602 | | | |
| |
| |
| |
| |
| General Obligations — 5.4% |
| |
| $ | 395 | | | Franklin County, 5.00%, 12/1/12 | | $ | 446,263 | | | |
| | 500 | | | Hamilton School District, 6.15%, 12/1/15 | | | 594,800 | | | |
| |
| |
| | | | | | | $ | 1,041,063 | | | |
| |
| |
| |
| |
| Health Care-Miscellaneous — 0.4% |
| |
| $ | 90 | | | Puerto Rico Infrastructure Financing Authority, (Mepsi Campus Project), 5.60%, 10/1/14 | | $ | 83,059 | | | |
| |
| |
| | | | | | | $ | 83,059 | | | |
| |
| |
| |
| |
| Hospital — 6.0% |
| |
| $ | 500 | | | Cuyahoga County, (Cleveland Clinic Health System), 6.00%, 1/1/17 | | $ | 549,450 | | | |
| | 500 | | | Erie County Hospital Facilities, (Firelands Regional Medical Center), 5.50%, 8/15/12 | | | 506,200 | | | |
| | 85 | | | Richland County Hospital Facilities, (Medcentral Health Systems), 6.375%, 11/15/22 | | | 85,921 | | | |
| |
| |
| | | | | | | $ | 1,141,571 | | | |
| |
| |
| |
| Housing — 1.0% |
| |
| $ | 185 | | | Ohio Housing Finance Agency, (AMT), 4.55%, 9/1/11 | | $ | 189,973 | | | |
| |
| |
| | | | | | | $ | 189,973 | | | |
| |
| |
| |
| |
| Industrial Development Revenue — 6.8% |
| |
| $ | 500 | | | Dayton Special Facilities Revenue, (Emery Air Freight), 5.625%, 2/1/18 | | $ | 503,100 | | | |
| | 100 | | | Ohio Water Development Authority, Solid Waste Disposal, (Allied Waste North America, Inc.), (AMT), 5.15%, 7/15/15 | | | 89,276 | | | |
| | 500 | | | Toledo-Lucas County Port Authority, (Cargill, Inc.), 4.50%, 12/1/15 | | | 515,215 | | | |
| | 310 | | | Virgin Islands Public Financing Authority, (HOVENSA LLC), (AMT), 4.70%, 7/1/22 | | | 188,092 | | | |
| |
| |
| | | | | | | $ | 1,295,683 | | | |
| |
| |
| |
| |
| Insured-Education — 4.0% |
| |
| $ | 750 | | | Cleveland-Cuyahoga County Port Authority, (Euclid Avenue Housing Corp.), (AMBAC), 5.00%, 8/1/21 | | $ | 759,405 | | | |
| |
| |
| | | | | | | $ | 759,405 | | | |
| |
| |
| |
| |
| Insured-Escrowed / Prerefunded — 3.7% |
| |
| $ | 300 | | | Cleveland Airport System, (FSA), Prerefunded to 1/1/10, 5.25%, 1/1/14 | | $ | 313,770 | | | |
| | 350 | | | Ohio Higher Educational Facilities Authority, (Xavier University), (CIFG), Prerefunded to 5/1/16, 5.00%, 5/1/22 | | | 400,725 | | | |
| |
| |
| | | | | | | $ | 714,495 | | | |
| |
| |
| |
| |
| Insured-General Obligations — 24.2% |
| |
| $ | 200 | | | Amherst School District, (FGIC), (NPFG), 5.00%, 12/1/11 | | $ | 214,734 | | | |
| | 250 | | | Athens City School District, (FSA), 5.45%, 12/1/10 | | | 268,400 | | | |
| | 265 | | | Clinton Massie Local School District, (AMBAC), 0.00%, 12/1/09 | | | 262,149 | | | |
| | 265 | | | Clinton Massie Local School District, (AMBAC), 0.00%, 12/1/11 | | | 249,940 | | | |
| | 225 | | | Finneytown Local School District, (FGIC), (NPFG), 6.15%, 12/1/11 | | | 249,892 | | | |
| | 1,000 | | | Hilliard School District, (FGIC), (NPFG), 0.00%, 12/1/14 | | | 847,900 | | | |
| | 175 | | | Scioto Valley and Ross County School District, (FGIC), (NPFG), 0.00%, 12/1/11 | | | 162,510 | | | |
| | 550 | | | Springfield City School District, Clark County, (AMBAC), 4.30%, 12/1/14 | | | 579,210 | | | |
| | 500 | | | Strongsville City School District, (NPFG), 5.375%, 12/1/12 | | | 567,345 | | | |
| | 670 | | | Upper Arlington City School District, (FSA), 5.00%, 12/1/21 | | | 709,148 | | | |
See notes to financial statements31
Eaton Vance Ohio Limited Maturity Municipals Fund as of March 31, 2009
PORTFOLIO OF INVESTMENTS CONT’D
| | | | | | | | | | | |
Principal Amount
| | | | | | | | |
| (000’s omitted) | | | Security | | Value | | | |
| |
| |
| Insured-General Obligations (continued) |
| |
| | | | | | | | | | | |
| $ | 460 | | | Wyoming School District, (FGIC), (NPFG), 5.75%, 12/1/17 | | $ | 519,446 | | | |
| |
| |
| | | | | | | $ | 4,630,674 | | | |
| |
| |
| |
| |
| Insured-Hospital — 2.7% |
| |
| $ | 500 | | | Cuyahoga County, (MetroHealth System), (NPFG), 5.50%, 2/15/12 | | $ | 513,005 | | | |
| |
| |
| | | | | | | $ | 513,005 | | | |
| |
| |
| |
| |
| Insured-Industrial Development Revenue — 2.8% |
| |
| $ | 500 | | | Akron Economic Development, (NPFG), 6.00%, 12/1/12 | | $ | 543,730 | | | |
| |
| |
| | | | | | | $ | 543,730 | | | |
| |
| |
| |
| |
| Insured-Lease Revenue / Certificates of Participation — 2.9% |
| |
| $ | 500 | | | Ohio Building Authority, (FSA), 5.50%, 10/1/11 | | $ | 550,060 | | | |
| |
| |
| | | | | | | $ | 550,060 | | | |
| |
| |
| |
| |
| Insured-Other Revenue — 2.8% |
| |
| $ | 500 | | | Cleveland Parking Facilities, (FSA), 5.25%, 9/15/20 | | $ | 546,060 | | | |
| |
| |
| | | | | | | $ | 546,060 | | | |
| |
| |
| |
| |
| Insured-Special Tax Revenue — 1.2% |
| |
| $ | 250 | | | Puerto Rico Infrastructure Financing Authority, (FGIC), 5.50%, 7/1/19 | | $ | 226,088 | | | |
| |
| |
| | | | | | | $ | 226,088 | | | |
| |
| |
| |
| |
| Insured-Transportation — 5.8% |
| |
| $ | 250 | | | Cleveland Airport System, (FSA), 5.00%, 1/1/23 | | $ | 254,320 | | | |
| | 750 | | | Ohio Turnpike Commission, (FGIC), (NPFG), 5.50%, 2/15/18 | | | 856,642 | | | |
| |
| |
| | | | | | | $ | 1,110,962 | | | |
| |
| |
| |
| |
| Insured-Water and Sewer — 2.7% |
| |
| $ | 475 | | | Cleveland Waterworks, (FSA), 5.375%, 1/1/16 | | $ | 510,530 | | | |
| |
| |
| | | | | | | $ | 510,530 | | | |
| |
| |
| |
| |
| Lease Revenue / Certificates of Participation — 0.8% |
| |
| $ | 180 | | | Union County, (Pleasant Valley Joint Fire District), 6.125%, 12/1/19 | | $ | 160,506 | | | |
| |
| |
| | | | | | | $ | 160,506 | | | |
| |
| |
| |
| Other Revenue — 2.3% |
| |
| $ | 310 | | | Buckeye Tobacco Settlement Financing Authority, 5.125%, 6/1/24 | | $ | 222,118 | | | |
| | 300 | | | Riversouth Authority, (Lazarus Building Redevelopment), 5.75%, 12/1/27 | | | 213,093 | | | |
| |
| |
| | | | | | | $ | 435,211 | | | |
| |
| |
| |
| |
| Pooled Loans — 5.1% |
| |
| $ | 240 | | | Cuyahoga County Port Authority, (Garfield Heights), 5.25%, 5/15/23 | | $ | 181,224 | | | |
| | 295 | | | Ohio Economic Development, (Ohio Enterprise Bond Fund), (AMT), 4.60%, 6/1/20 | | | 307,142 | | | |
| | 250 | | | Ohio Economic Development, (Ohio Enterprise Bond Fund), (AMT), 5.25%, 12/1/15 | | | 258,828 | | | |
| | 315 | | | Summit County Port Authority, (Twinsburg Township), 5.125%, 5/15/25 | | | 220,648 | | | |
| |
| |
| | | | | | | $ | 967,842 | | | |
| |
| |
| |
| |
| Special Tax Revenue — 1.3% |
| |
| $ | 250 | | | Mahoning County, (Sales Tax), 5.00%, 12/1/10 | | $ | 252,643 | | | |
| |
| |
| | | | | | | $ | 252,643 | | | |
| |
| |
| |
| |
| Transportation — 1.5% |
| |
| $ | 250 | | | Ohio Major New Street Infrastructure Project Revenue, 5.75%, 6/15/19 | | $ | 289,217 | | | |
| |
| |
| | | | | | | $ | 289,217 | | | |
| |
| |
| |
| |
| Water and Sewer — 6.8% |
| |
| $ | 400 | | | Cincinnati Water System, 4.50%, 12/1/21 | | $ | 418,048 | | | |
| | 500 | | | Ohio Water Development Authority, (Drinking Water), 5.50%, 12/1/14 | | | 555,230 | | | |
| | 280 | | | Ohio Water Development Authority, Water Pollution Control, (Fresh Water Quality), 5.25%, 6/1/20(1) | | | 325,153 | | | |
| |
| |
| | | | | | | $ | 1,298,431 | | | |
| |
| |
| | | |
| Total Tax-Exempt Investments — 99.5% | | |
| (identified cost $18,678,884) | | $ | 19,066,777 | | | |
| |
| |
| | | | | | | |
| Other Assets, Less Liabilities — 0.5% | | $ | 99,204 | | | |
| |
| |
| | | | | | | |
| Net Assets — 100.0% | | $ | 19,165,981 | | | |
| |
| |
See notes to financial statements32
Eaton Vance Ohio Limited Maturity Municipals Fund as of March 31, 2009
PORTFOLIO OF INVESTMENTS CONT’D
Industry and sector classifications included in the Portfolio of Investments are unaudited.
AMBAC - AMBAC Financial Group, Inc.
AMT - Interest earned from these securities may be considered a tax preference item for purposes of the Federal Alternative Minimum Tax.
CIFG - CIFG Assurance North America, Inc.
FGIC - Financial Guaranty Insurance Company
FSA - Financial Security Assurance, Inc.
NPFG - National Public Finance Guaranty Corp.
The Fund invests primarily in debt securities issued by Ohio municipalities. The ability of the issuers of the debt securities to meet their obligations may be affected by economic developments in a specific industry or municipality. In order to reduce the risk associated with such economic developments, at March 31, 2009, 53.0% of total investments are backed by bond insurance of various financial institutions and financial guaranty assurance agencies. The aggregate percentage insured by an individual financial institution ranged from 2.1% to 23.5% of total investments.
| | |
| (1) | | Security (or a portion thereof) has been segregated to cover margin requirements on open financial futures contracts. |
See notes to financial statements33
Eaton Vance Pennsylvania Limited Maturity Municipals Fund as of March 31, 2009
PORTFOLIO OF INVESTMENTS
| | | | | | | | | | | |
| Tax-Exempt Investments — 97.4% |
| |
Principal Amount
| | | | | | | | |
| (000’s omitted) | | | Security | | Value | | | |
| |
| |
| |
| Cogeneration — 1.2% |
| |
| $ | 310 | | | Carbon County Industrial Development Authority, (Panther Creek Partners), (AMT), 6.65%, 5/1/10 | | $ | 310,313 | | | |
| | 350 | | | Pennsylvania Economic Development Financing Authority, (Resource Recovery-Colver), (AMT), 5.125%, 12/1/15 | | | 278,320 | | | |
| |
| |
| | | | | | | $ | 588,633 | | | |
| |
| |
| |
| Education — 2.1% |
| |
| $ | 1,040 | | | Pennsylvania Higher Educational Facilities Authority, (University of Pennsylvania), 5.00%, 7/15/21 | | $ | 1,095,016 | | | |
| |
| |
| | | | | | | $ | 1,095,016 | | | |
| |
| |
| |
| Electric Utilities — 3.5% |
| |
| $ | 500 | | | Pennsylvania Economic Development Financing Authority, Pollution Control, (PPL Electric Utility Corp.), 4.85% to 10/1/10 (Put Date), 10/1/23 | | $ | 507,265 | | | |
| | 1,000 | | | Puerto Rico Electric Power Authority, 5.00%, 7/1/17 | | | 946,160 | | | |
| | 400 | | | York County Industrial Development Authority, Pollution Control, (Public Service Enterprise Group, Inc.), 5.50%, 9/1/20 | | | 351,760 | | | |
| |
| |
| | | | | | | $ | 1,805,185 | | | |
| |
| |
| |
| Escrowed / Prerefunded — 2.7% |
| |
| $ | 250 | | | Allegheny County Industrial Development Authority, (Residential Resources, Inc.), Prerefunded to 9/1/11, 6.50%, 9/1/21 | | $ | 281,925 | | | |
| | 500 | | | Bucks County Industrial Development Authority, (Pennswood), Prerefunded to 10/1/10, 5.80%, 10/1/20 | | | 545,455 | | | |
| | 520 | | | Lehigh County General Purpose Authority, (Muhlenberg Hospital), Escrowed to Maturity, 5.75%, 7/15/10 | | | 536,500 | | | |
| |
| |
| | | | | | | $ | 1,363,880 | | | |
| |
| |
| |
| General Obligations — 3.2% |
| |
| $ | 500 | | | Bucks County, 5.125%, 5/1/21 | | $ | 560,420 | | | |
| | 1,000 | | | Daniel Boone Area School District, 5.00%, 8/15/19 | | | 1,085,950 | | | |
| |
| |
| | | | | | | $ | 1,646,370 | | | |
| |
| |
| |
| Health Care-Miscellaneous — 0.3% |
| |
| $ | 200 | | | Puerto Rico Infrastructure Financing Authority, (Mepsi Campus Project), 6.25%, 10/1/24 | | $ | 155,544 | | | |
| |
| |
| | | | | | | $ | 155,544 | | | |
| |
| |
| |
| Hospital — 8.1% |
| |
| $ | 500 | | | Allegheny County Hospital Development Authority, (University of Pittsburgh Medical Center), 5.00%, 6/15/18 | | $ | 513,515 | | | |
| | 500 | | | Allegheny County Hospital Development Authority, (University of Pittsburgh Medical Center), 5.00%, 9/1/18 | | | 508,810 | | | |
| | 635 | | | Lancaster County Hospital Authority, (Lancaster General Hospital), 5.00%, 3/15/22 | | | 617,004 | | | |
| | 200 | | | Lebanon County Health Facility Authority, (Good Samaritan Hospital), 5.50%, 11/15/18 | | | 182,434 | | | |
| | 1,000 | | | Monroe County Hospital Authority, (Pocono Medical Center), 5.00%, 1/1/17 | | | 969,630 | | | |
| | 500 | | | Pennsylvania Higher Educational Facilities Authority, (UPMC Health System), 6.25%, 1/15/18 | | | 516,880 | | | |
| | 800 | | | Washington County Hospital Authority, (Monongahela Vineyard Hospital), 5.00%, 6/1/12 | | | 812,888 | | | |
| |
| |
| | | | | | | $ | 4,121,161 | | | |
| |
| |
| |
| |
| Housing — 2.5% |
| |
| $ | 1,335 | | | Allegheny County Residential Finance Authority, Single Family Mortgages, (AMT), 4.80%, 11/1/22 | | $ | 1,292,227 | | | |
| |
| |
| | | | | | | $ | 1,292,227 | | | |
| |
| |
| |
| |
| Industrial Development Revenue — 2.6% |
| |
| $ | 700 | | | Erie Industrial Development Authority, (International Paper), (AMT), 5.85%, 12/1/20 | | $ | 503,398 | | | |
| | 500 | | | Pennsylvania Economic Development Financing Authority, (Aqua Pennsylvania, Inc.), (AMT), 6.75%, 10/1/18 | | | 524,165 | | | |
| | 750 | | | Puerto Rico Port Authority, (American Airlines, Inc.), (AMT), 6.25%, 6/1/26 | | | 295,980 | | | |
| |
| |
| | | | | | | $ | 1,323,543 | | | |
| |
| |
| |
| |
| Insured-Cogeneration — 2.1% |
| |
| $ | 1,300 | | | Pennsylvania Economic Development Financing Authority, (Resource Recovery-Colver), (AMBAC), (AMT), 4.625%, 12/1/18 | | $ | 1,045,343 | | | |
| |
| |
| | | | | | | $ | 1,045,343 | | | |
| |
| |
| |
| |
| Insured-Education — 6.2% |
| |
| $ | 2,000 | | | Delaware County, (Villanova University), (AMBAC), 5.00%, 8/1/20 | | $ | 2,078,460 | | | |
| | 1,100 | | | Lycoming County College Authority, (Pennsylvania College of Technology), (AMBAC), 5.125%, 5/1/22 | | | 1,071,829 | | | |
| |
| |
| | | | | | | $ | 3,150,289 | | | |
| |
| |
| |
See notes to financial statements34
Eaton Vance Pennsylvania Limited Maturity Municipals Fund as of March 31, 2009
PORTFOLIO OF INVESTMENTS CONT’D
| | | | | | | | | | | |
Principal Amount
| | | | | | | | |
| (000’s omitted) | | | Security | | Value | | | |
| |
| |
| |
| Insured-Electric Utilities — 3.1% |
| |
| $ | 1,500 | | | Cambria County Industrial Development Authority, (Pennsylvania Electric), (NPFG), 5.35%, 11/1/10 | | $ | 1,581,855 | | | |
| |
| |
| | | | | | | $ | 1,581,855 | | | |
| |
| |
| |
| |
| Insured-Escrowed / Prerefunded — 18.6% |
| |
| $ | 1,000 | | | Council Rock School District, (NPFG), Prerefunded to 11/15/11, 5.00%, 11/15/19 | | $ | 1,100,680 | | | |
| | 500 | | | Pennsylvania Public School Building Authority, (Garnet Valley School District), (AMBAC), Prerefunded to 2/1/11, 5.50%, 2/1/20 | | | 538,180 | | | |
| | 1,000 | | | Pennsylvania Turnpike Commission, Registration Fee Revenue, (AMBAC), Prerefunded to 7/15/11, 5.125%, 7/15/22 | | | 1,102,680 | | | |
| | 1,000 | | | Philadelphia Gas Works Revenue, (FSA), Prerefunded to 8/1/13, 5.25%, 8/1/17 | | | 1,146,860 | | | |
| | 1,000 | | | Pittsburgh, (AMBAC), Prerefunded to 3/1/12, 5.25%, 9/1/22 | | | 1,112,320 | | | |
| | 1,000 | | | Spring-Ford Area School District, (FSA), Prerefunded to 9/1/11, 5.00%, 9/1/19 | | | 1,094,810 | | | |
| | 5,000 | | | Westmoreland Municipal Authority, (FGIC), Escrowed to Maturity, 0.00%, 8/15/19 | | | 3,390,000 | | | |
| |
| |
| | | | | | | $ | 9,485,530 | | | |
| |
| |
| |
| |
| Insured-General Obligations — 20.5% |
| |
| $ | 1,020 | | | Cornwall Lebanon School District, (FSA), 0.00%, 3/15/16 | | $ | 789,766 | | | |
| | 1,250 | | | Cranberry Township, (FGIC), (NPFG), 5.00%, 12/1/20 | | | 1,309,637 | | | |
| | 1,635 | | | Harrisburg, (AMBAC), 0.00%, 9/15/12 | | | 1,488,717 | | | |
| | 1,355 | | | McKeesport, (FGIC), (NPFG), 0.00%, 10/1/11 | | | 1,270,976 | | | |
| | 1,000 | | | Palmyra Area School District, (FGIC), (NPFG), 5.00%, 5/1/17 | | | 1,073,850 | | | |
| | 1,000 | | | Pennsylvania, (NPFG), 5.375%, 7/1/19 | | | 1,174,880 | | | |
| | 1,000 | | | Philadelphia School District, (FSA), 5.50%, 6/1/21 | | | 1,094,510 | | | |
| | 1,000 | | | Reading School District, (FGIC), (NPFG), 0.00%, 1/15/12 | | | 920,110 | | | |
| | 1,250 | | | Sto-Rox School District, (FGIC), (NPFG), 5.125%, 12/15/22 | | | 1,294,413 | | | |
| |
| |
| | | | | | | $ | 10,416,859 | | | |
| |
| |
| |
| |
| Insured-Hospital — 1.5% |
| |
| $ | 250 | | | Allegheny County Hospital Development Authority, (NPFG), 6.00%, 7/1/24 | | $ | 262,370 | | | |
| | 500 | | | Washington County Hospital Authority, (Washington Hospital), (AMBAC), 5.375%, 7/1/14 | | | 503,705 | | | |
| |
| |
| | | | | | | $ | 766,075 | | | |
| |
| |
| |
| Insured-Other Revenue — 2.6% |
| |
| $ | 1,500 | | | Philadelphia Authority for Industrial Development Revenue, (FGIC), (NPFG), 5.00%, 12/1/22 | | $ | 1,327,230 | | | |
| |
| |
| | | | | | | $ | 1,327,230 | | | |
| |
| |
| |
| |
| Insured-Special Tax Revenue — 0.7% |
| |
| $ | 350 | | | Pittsburgh and Allegheny County Public Auditorium Authority, (AMBAC), 5.00%, 2/1/24 | | $ | 341,386 | | | |
| |
| |
| | | | | | | $ | 341,386 | | | |
| |
| |
| |
| |
| Insured-Transportation — 8.3% |
| |
| $ | 1,000 | | | Allegheny County Airport, (NPFG), (AMT), 5.75%, 1/1/10 | | $ | 1,018,240 | | | |
| | 590 | | | Allegheny County Airport, (NPFG), (AMT), 5.75%, 1/1/12 | | | 610,526 | | | |
| | 1,000 | | | Pennsylvania Turnpike Commission, Registration Fee Revenue, (FSA), 5.25%, 7/15/22 | | | 1,107,440 | | | |
| | 1,000 | | | Philadelphia Airport, (FGIC), (NPFG), (AMT), 5.375%, 7/1/14 | | | 1,003,930 | | | |
| | 500 | | | Southeastern Pennsylvania Transportation Authority, (FGIC), (NPFG), 5.25%, 3/1/16 | | | 506,435 | | | |
| |
| |
| | | | | | | $ | 4,246,571 | | | |
| |
| |
| |
| |
| Insured-Water and Sewer — 5.9% |
| |
| $ | 500 | | | Allegheny County Sanitation Authority, (BHAC), (NPFG), 5.00%, 12/1/22(1) | | $ | 522,575 | | | |
| | 250 | | | Allegheny County Sanitation Authority, (NPFG), 5.00%, 12/1/19 | | | 254,235 | | | |
| | 2,000 | | | Altoona City Authority Water Revenue, (FSA), 5.25%, 11/1/19 | | | 2,223,960 | | | |
| |
| |
| | | | | | | $ | 3,000,770 | | | |
| |
| |
| |
| |
| Senior Living / Life Care — 1.5% |
| |
| $ | 390 | | | Cliff House Trust, (AMT), 6.625%, 6/1/27(2) | | $ | 241,043 | | | |
| | 335 | | | Crawford County Hospital Authority, (Wesbury United Methodist Community), 6.00%, 8/15/11 | | | 328,437 | | | |
| | 185 | | | Lancaster County Hospital Authority, (Health Center-Willow Valley Retirement), 5.55%, 6/1/15 | | | 188,436 | | | |
| |
| |
| | | | | | | $ | 757,916 | | | |
| |
| |
| |
See notes to financial statements35
Eaton Vance Pennsylvania Limited Maturity Municipals Fund as of March 31, 2009
PORTFOLIO OF INVESTMENTS CONT’D
| | | | | | | | | | | |
Principal Amount
| | | | | | | | |
| (000’s omitted) | | | Security | | Value | | | |
| |
| |
| |
| Transportation — 0.2% |
| |
| $ | 85 | | | Erie Municipal Airport Authority, (AMT), 5.50%, 7/1/09 | | $ | 84,851 | | | |
| |
| |
| | | | | | | $ | 84,851 | | | |
| |
| |
| | | |
| Total Tax-Exempt Investments — 97.4% | | |
| (identified cost $48,820,081) | | $ | 49,596,234 | | | |
| |
| |
| | | | | | | |
| Other Assets, Less Liabilities — 2.6% | | $ | 1,298,585 | | | |
| |
| |
| | | | | | | |
| Net Assets — 100.0% | | $ | 50,894,819 | | | |
| |
| |
Industry and sector classifications included in the Portfolio of Investments are unaudited.
AMBAC - AMBAC Financial Group, Inc.
AMT - Interest earned from these securities may be considered a tax preference item for purposes of the Federal Alternative Minimum Tax.
BHAC - Berkshire Hathaway Assurance Corp.
FGIC - Financial Guaranty Insurance Company
FSA - Financial Security Assurance, Inc.
NPFG - National Public Finance Guaranty Corp.
The Fund invests primarily in debt securities issued by Pennsylvania municipalities. The ability of the issuers of the debt securities to meet their obligations may be affected by economic developments in a specific industry or municipality. In order to reduce the risk associated with such economic developments, at March 31, 2009, 71.3% of total investments are backed by bond insurance of various financial institutions and financial guaranty assurance agencies. The aggregate percentage insured by an individual financial institution ranged from 1.1% to 30.7% of total investments.
| | |
| (1) | | Security (or a portion thereof) has been segregated to cover margin requirements on open financial futures contracts. |
| |
| (2) | | Security is in default with respect to scheduled principal payments. |
See notes to financial statements36
Eaton Vance Limited Maturity Municipals Funds as of March 31, 2009
FINANCIAL STATEMENTS
Statements of Assets and Liabilities
| | | | | | | | | | | | | | | |
| | | California
| | | Massachusetts
| | | New Jersey
| | | |
| As of March 31, 2009 | | Limited Fund | | | Limited Fund | | | Limited Fund | | | |
| |
| |
| |
| Assets |
| |
| Investments — | | | | | | | | | | | | | | |
| Identified cost | | $ | 22,982,345 | | | $ | 59,294,004 | | | $ | 42,299,041 | | | |
| Unrealized appreciation (depreciation) | | | (556,142 | ) | | | 591,717 | | | | 392,092 | | | |
| |
| |
Investments, at value | | $ | 22,426,203 | | | $ | 59,885,721 | | | $ | 42,691,133 | | | |
| |
| |
| Cash | | $ | 83,138 | | | $ | 64,548 | | | $ | 74,423 | | | |
| Interest receivable | | | 283,646 | | | | 739,101 | | | | 481,316 | | | |
| Receivable for Fund shares sold | | | 33,000 | | | | 27,573 | | | | 47,520 | | | |
| |
| |
Total assets | | $ | 22,825,987 | | | $ | 60,716,943 | | | $ | 43,294,392 | | | |
| |
| |
| Liabilities |
| |
| Demand note payable | | $ | — | | | $ | 100,000 | | | $ | 100,000 | | | |
| Payable for variation margin on open financial futures contracts | | | 30,000 | | | | 42,812 | | | | 50,250 | | | |
| Payable for Fund shares redeemed | | | — | | | | 54,613 | | | | 83,291 | | | |
| Distributions payable | | | 37,437 | | | | 91,874 | | | | 67,939 | | | |
| Payable to affiliates: | | | | | | | | | | | | | | |
| Investment adviser fee | | | 7,223 | | | | 26,672 | | | | 16,953 | | | |
| Distribution and service fees | | | 4,627 | | | | 16,324 | | | | 6,136 | | | |
| Accrued expenses | | | 49,158 | | | | 62,818 | | | | 56,905 | | | |
| |
| |
Total liabilities | | $ | 128,445 | | | $ | 395,113 | | | $ | 381,474 | | | |
| |
| |
Net Assets | | $ | 22,697,542 | | | $ | 60,321,830 | | | $ | 42,912,918 | | | |
| |
| |
| Sources of Net Assets |
| |
| Paid-in capital | | $ | 25,882,241 | | | $ | 64,225,300 | | | $ | 44,986,640 | | | |
| Accumulated net realized loss | | | (2,462,070 | ) | | | (4,374,675 | ) | | | (2,342,019 | ) | | |
| Accumulated undistributed (distributions in excess of) net investment income | | | (25,722 | ) | | | 42,579 | | | | 15,674 | | | |
| Net unrealized appreciation (depreciation) | | | (696,907 | ) | | | 428,626 | | | | 252,623 | | | |
| |
| |
Net Assets | | $ | 22,697,542 | | | $ | 60,321,830 | | | $ | 42,912,918 | | | |
| |
| |
| Class A Shares |
| |
Net Assets | | $ | 20,017,481 | | | $ | 46,856,774 | | | $ | 41,745,951 | | | |
Shares Outstanding | | | 2,154,111 | | | | 4,900,455 | | | | 4,396,707 | | | |
Net Asset Value and Redemption Price Per Share | | | | | | | | | | | | | | |
(net assets ¸ shares of beneficial interest outstanding) | | $ | 9.29 | | | $ | 9.56 | | | $ | 9.49 | | | |
Maximum Offering Price Per Share | | | | | | | | | | | | | | |
(100 ¸ 97.75 of net asset value per share) | | $ | 9.50 | | | $ | 9.78 | | | $ | 9.71 | | | |
| |
| |
| Class B Shares |
| |
Net Assets | | $ | 859,608 | | | $ | 853,931 | | | $ | 647,851 | | | |
Shares Outstanding | | | 92,819 | | | | 89,360 | | | | 68,198 | | | |
Net Asset Value and Offering Price Per Share* | | | | | | | | | | | | | | |
(net assets ¸ shares of beneficial interest outstanding) | | $ | 9.26 | | | $ | 9.56 | | | $ | 9.50 | | | |
| |
| |
| Class C Shares |
| |
Net Assets | | $ | 1,820,453 | | | $ | 12,611,125 | | | $ | 519,116 | | | |
Shares Outstanding | | | 202,634 | | | | 1,376,710 | | | | 54,697 | | | |
Net Asset Value and Offering Price Per Share* | | | | | | | | | | | | | | |
(net assets ¸ shares of beneficial interest outstanding) | | $ | 8.98 | | | $ | 9.16 | | | $ | 9.49 | | | |
| |
| |
On sales of $100,000 or more, the offering price of Class A shares is reduced.
| |
| * | Redemption price per share is equal to the net asset value less any applicable contingent deferred sales charge. |
See notes to financial statements37
Eaton Vance Limited Maturity Municipals Funds as of March 31, 2009
FINANCIAL STATEMENTS CONT’D
Statements of Assets and Liabilities
| | | | | | | | | | | | | | | |
| | | New York
| | | Ohio
| | | Pennsylvania
| | | |
| As of March 31, 2009 | | Limited Fund | | | Limited Fund | | | Limited Fund | | | |
| |
| |
| |
| Assets |
| |
| Investments — | | | | | | | | | | | | | | |
| Identified cost | | $ | 87,946,528 | | | $ | 18,678,884 | | | $ | 48,820,081 | | | |
| Unrealized appreciation (depreciation) | | | (2,015,344 | ) | | | 387,893 | | | | 776,153 | | | |
| |
| |
Investments, at value | | $ | 85,931,184 | | | $ | 19,066,777 | | | $ | 49,596,234 | | | |
| |
| |
| Cash | | $ | 899,392 | | | $ | 1,300 | | | $ | 124,840 | | | |
| Interest receivable | | | 1,310,244 | | | | 257,378 | | | | 623,014 | | | |
| Receivable for investments sold | | | — | | | | — | | | | 750,000 | | | |
| Receivable for Fund shares sold | | | 162,537 | | | | 29,330 | | | | 115,455 | | | |
| Other assets | | | — | | | | 19,459 | | | | — | | | |
| |
| |
Total assets | | $ | 88,303,357 | | | $ | 19,374,244 | | | $ | 51,209,543 | | | |
| |
| |
| Liabilities |
| |
| Demand note payable | | $ | — | | | $ | 100,000 | | | $ | — | | | |
| Payable for variation margin on open financial futures contracts | | | 67,625 | | | | 8,438 | | | | 34,250 | | | |
| Payable for Fund shares redeemed | | | 48,491 | | | | 9,660 | | | | 105,076 | | | |
| Distributions payable | | | 139,819 | | | | 29,237 | | | | 78,779 | | | |
| Payable to affiliates: | | | | | | | | | | | | | | |
| Investment adviser fee | | | 27,389 | | | | 6,137 | | | | 21,127 | | | |
| Distribution and service fees | | | 26,768 | | | | 3,017 | | | | 15,602 | | | |
| Accrued expenses | | | 78,514 | | | | 51,774 | | | | 59,890 | | | |
| |
| |
Total liabilities | | $ | 388,606 | | | $ | 208,263 | | | $ | 314,724 | | | |
| |
| |
Net Assets | | $ | 87,914,751 | | | $ | 19,165,981 | | | $ | 50,894,819 | | | |
| |
| |
| Sources of Net Assets |
| |
| Paid-in capital | | $ | 96,674,179 | | | $ | 20,174,835 | | | $ | 53,576,687 | | | |
| Accumulated net realized loss | | | (6,410,895 | ) | | | (1,333,851 | ) | | | (3,237,850 | ) | | |
| Accumulated distributions in excess of net investment income | | | (44,011 | ) | | | (23,283 | ) | | | (53,831 | ) | | |
| Net unrealized appreciation (depreciation) | | | (2,304,522 | ) | | | 348,280 | | | | 609,813 | | | |
| |
| |
Net Assets | | $ | 87,914,751 | | | $ | 19,165,981 | | | $ | 50,894,819 | | | |
| |
| |
| Class A Shares |
| |
Net Assets | | $ | 63,159,206 | | | $ | 18,306,804 | | | $ | 36,460,535 | | | |
Shares Outstanding | | | 6,616,146 | | | | 1,989,700 | | | | 3,752,867 | | | |
Net Asset Value and Redemption Price Per Share | | | | | | | | | | | | | | |
(net assets ¸ shares of beneficial interest outstanding) | | $ | 9.55 | | | $ | 9.20 | | | $ | 9.72 | | | |
Maximum Offering Price Per Share | | | | | | | | | | | | | | |
(100 ¸ 97.75 of net asset value per share) | | $ | 9.77 | | | $ | 9.41 | | | $ | 9.94 | | | |
| |
| |
| Class B Shares |
| |
Net Assets | | $ | 1,975,805 | | | $ | 187,416 | | | $ | 550,000 | | | |
Shares Outstanding | | | 207,105 | | | | 20,425 | | | | 56,613 | | | |
Net Asset Value and Offering Price Per Share* | | | | | | | | | | | | | | |
(net assets ¸ shares of beneficial interest outstanding) | | $ | 9.54 | | | $ | 9.18 | | | $ | 9.72 | | | |
| |
| |
| Class C Shares |
| |
Net Assets | | $ | 22,779,740 | | | $ | 671,761 | | | $ | 13,884,284 | | | |
Shares Outstanding | | | 2,509,491 | | | | 73,308 | | | | 1,506,729 | | | |
Net Asset Value and Offering Price Per Share* | | | | | | | | | | | | | | |
(net assets ¸ shares of beneficial interest outstanding) | | $ | 9.08 | | | $ | 9.16 | | | $ | 9.21 | | | |
| |
| |
On sales of $100,000 or more, the offering price of Class A shares is reduced.
| |
| * | Redemption price per share is equal to the net asset value less any applicable contingent deferred sales charge. |
See notes to financial statements38
Eaton Vance Limited Maturity Municipals Funds as of March 31, 2009
FINANCIAL STATEMENTS CONT’D
Statements of Operations
| | | | | | | | | | | | | | | |
| | | California
| | | Massachusetts
| | | New Jersey
| | | |
| For the Year Ended March 31, 2009 | | Limited Fund | | | Limited Fund | | | Limited Fund | | | |
| |
| |
| |
| Investment Income |
| |
| Interest | | $ | 1,526,534 | | | $ | 2,783,970 | | | $ | 1,926,845 | | | |
| |
| |
Total investment income | | $ | 1,526,534 | | | $ | 2,783,970 | | | $ | 1,926,845 | | | |
| |
| |
| | | | | | | | | | | | | | | |
| | | | | | | | | | | | | | | |
| |
| Expenses |
| |
| Investment adviser fee | | $ | 140,139 | | | $ | 275,000 | | | $ | 183,876 | | | |
| Distribution and service fees | | | | | | | | | | | | | | |
| Class A | | | 43,975 | | | | 70,873 | | | | 60,787 | | | |
| Class B | | | 6,715 | | | | 11,278 | | | | 6,241 | | | |
| Class C | | | 16,302 | | | | 116,633 | | | | 3,103 | | | |
| Trustees’ fees and expenses | | | 1,566 | | | | 2,657 | | | | 1,987 | | | |
| Custodian fee | | | 38,116 | | | | 55,979 | | | | 32,439 | | | |
| Transfer and dividend disbursing agent fees | | | 13,217 | | | | 27,712 | | | | 20,677 | | | |
| Legal and accounting services | | | 34,220 | | | | 37,267 | | | | 41,315 | | | |
| Printing and postage | | | 5,552 | | | | 11,750 | | | | 7,756 | | | |
| Registration fees | | | 3,036 | | | | 2,058 | | | | 1,681 | | | |
| Miscellaneous | | | 15,569 | | | | 17,592 | | | | 17,017 | | | |
| |
| |
Total expenses | | $ | 318,407 | | | $ | 628,799 | | | $ | 376,879 | | | |
| |
| |
| Deduct — | | | | | | | | | | | | | | |
| Reduction of custodian fee | | $ | 4,474 | | | $ | 4,578 | | | $ | 6,340 | | | |
| |
| |
Total expense reductions | | $ | 4,474 | | | $ | 4,578 | | | $ | 6,340 | | | |
| |
| |
| | | | | | | | | | | | | | | |
Net expenses | | $ | 313,933 | | | $ | 624,221 | | | $ | 370,539 | | | |
| |
| |
| | | | | | | | | | | | | | | |
Net investment income | | $ | 1,212,601 | | | $ | 2,159,749 | | | $ | 1,556,306 | | | |
| |
| |
| | | | | | | | | | | | | | | |
| | | | | | | | | | | | | | | |
| |
| Realized and Unrealized Gain (Loss) |
| |
| Net realized gain (loss) — | | | | | | | | | | | | | | |
| Investment transactions | | $ | (485,922 | ) | | $ | 78,983 | | | $ | 137,837 | | | |
| Financial futures contracts | | | (1,173,968 | ) | | | (1,764,249 | ) | | | (1,156,295 | ) | | |
| |
| |
Net realized loss | | $ | (1,659,890 | ) | | $ | (1,685,266 | ) | | $ | (1,018,458 | ) | | |
| |
| |
| Change in unrealized appreciation (depreciation) — | | | | | | | | | | | | | | |
| Investments | | $ | (1,086,323 | ) | | $ | (1,173,524 | ) | | $ | (790,723 | ) | | |
| Financial futures contracts | | | 126,692 | | | | 248,326 | | | | 144,992 | | | |
| |
| |
Net change in unrealized appreciation (depreciation) | | $ | (959,631 | ) | | $ | (925,198 | ) | | $ | (645,731 | ) | | |
| |
| |
| | | | | | | | | | | | | | | |
Net realized and unrealized loss | | $ | (2,619,521 | ) | | $ | (2,610,464 | ) | | $ | (1,664,189 | ) | | |
| |
| |
| | | | | | | | | | | | | | | |
Net decrease in net assets from operations | | $ | (1,406,920 | ) | | $ | (450,715 | ) | | $ | (107,883 | ) | | |
| |
| |
See notes to financial statements39
Eaton Vance Limited Maturity Municipals Funds as of March 31, 2009
FINANCIAL STATEMENTS CONT’D
Statements of Operations
| | | | | | | | | | | | | | | |
| | | New York
| | | Ohio
| | | Pennsylvania
| | | |
| For the Year Ended March 31, 2009 | | Limited Fund | | | Limited Fund | | | Limited Fund | | | |
| |
| |
| |
| Investment Income |
| |
| Interest | | $ | 4,354,808 | | | $ | 904,435 | | | $ | 2,537,874 | | | |
| |
| |
Total investment income | | $ | 4,354,808 | | | $ | 904,435 | | | $ | 2,537,874 | | | |
| |
| |
| | | | | | | | | | | | | | | |
| | | | | | | | | | | | | | | |
| |
| Expenses |
| |
| Investment adviser fee | | $ | 402,634 | | | $ | 85,697 | | | $ | 235,037 | | | |
| Distribution and service fees | | | | | | | | | | | | | | |
| Class A | | | 101,095 | | | | 28,724 | | | | 57,811 | | | |
| Class B | | | 15,554 | | | | 1,447 | | | | 7,528 | | | |
| Class C | | | 208,931 | | | | 2,807 | | | | 115,903 | | | |
| Trustees’ fees and expenses | | | 3,691 | | | | 1,217 | | | | 2,339 | | | |
| Custodian fee | | | 62,949 | | | | 31,492 | | | | 44,289 | | | |
| Transfer and dividend disbursing agent fees | | | 41,937 | | | | 12,060 | | | | 27,360 | | | |
| Legal and accounting services | | | 50,818 | | | | 34,486 | | | | 39,034 | | | |
| Printing and postage | | | 13,341 | | | | 3,002 | | | | 10,391 | | | |
| Registration fees | | | 3,962 | | | | 2,733 | | | | 1,968 | | | |
| Miscellaneous | | | 23,248 | | | | 13,897 | | | | 14,353 | | | |
| |
| |
Total expenses | | $ | 928,160 | | | $ | 217,562 | | | $ | 556,013 | | | |
| |
| |
| Deduct — | | | | | | | | | | | | | | |
| Reduction of custodian fee | | $ | 7,303 | | | $ | 3,129 | | | $ | 5,977 | | | |
| |
| |
Total expense reductions | | $ | 7,303 | | | $ | 3,129 | | | $ | 5,977 | | | |
| |
| |
| | | | | | | | | | | | | | | |
Net expenses | | $ | 920,857 | | | $ | 214,433 | | | $ | 550,036 | | | |
| |
| |
| | | | | | | | | | | | | | | |
Net investment income | | $ | 3,433,951 | | | $ | 690,002 | | | $ | 1,987,838 | | | |
| |
| |
| | | | | | | | | | | | | | | |
| | | | | | | | | | | | | | | |
| |
| Realized and Unrealized Gain (Loss) |
| |
| Net realized gain (loss) — | | | | | | | | | | | | | | |
| Investment transactions | | $ | (182,210 | ) | | $ | 104,490 | | | $ | 126,094 | | | |
| Financial futures contracts | | | (2,882,864 | ) | | | (287,613 | ) | | | (1,294,617 | ) | | |
| |
| |
Net realized loss | | $ | (3,065,074 | ) | | $ | (183,123 | ) | | $ | (1,168,523 | ) | | |
| |
| |
| Change in unrealized appreciation (depreciation) — | | | | | | | | | | | | | | |
| Investments | | $ | (3,549,219 | ) | | $ | (312,566 | ) | | $ | (743,929 | ) | | |
| Financial futures contracts | | | 353,616 | | | | 89,492 | | | | 160,902 | | | |
| |
| |
Net change in unrealized appreciation (depreciation) | | $ | (3,195,603 | ) | | $ | (223,074 | ) | | $ | (583,027 | ) | | |
| |
| |
| | | | | | | | | | | | | | | |
Net realized and unrealized loss | | $ | (6,260,677 | ) | | $ | (406,197 | ) | | $ | (1,751,550 | ) | | |
| |
| |
| | | | | | | | | | | | | | | |
Net increase (decrease) in net assets from operations | | $ | (2,826,726 | ) | | $ | 283,805 | | | $ | 236,288 | | | |
| |
| |
See notes to financial statements40
Eaton Vance Limited Maturity Municipals Funds as of March 31, 2009
FINANCIAL STATEMENTS CONT’D
Statements of Changes in Net Assets
| | | | | | | | | | | | | | | |
| | | California
| | | Massachusetts
| | | New Jersey
| | | |
| For the Year Ended March 31, 2009 | | Limited Fund | | | Limited Fund | | | Limited Fund | | | |
| |
| |
| |
| Increase (Decrease) in Net Assets |
| |
| From operations — | | | | | | | | | | | | | | |
| Net investment income | | $ | 1,212,601 | | | $ | 2,159,749 | | | $ | 1,556,306 | | | |
Net realized loss from investment transactions and
financial futures contracts | | | (1,659,890 | ) | | | (1,685,266 | ) | | | (1,018,458 | ) | | |
Net change in unrealized appreciation (depreciation) from investments
and financial futures contracts | | | (959,631 | ) | | | (925,198 | ) | | | (645,731 | ) | | |
| |
| |
Net decrease in net assets from operations | | $ | (1,406,920 | ) | | $ | (450,715 | ) | | $ | (107,883 | ) | | |
| |
| |
| Distributions to shareholders — | | | | | | | | | | | | | | |
| From net investment income | | | | | | | | | | | | | | |
| Class A | | $ | (1,154,391 | ) | | $ | (1,759,322 | ) | | $ | (1,566,533 | ) | | |
| Class B | | | (24,016 | ) | | | (36,864 | ) | | | (21,357 | ) | | |
| Class C | | | (57,793 | ) | | | (384,049 | ) | | | (10,635 | ) | | |
| |
| |
Total distributions to shareholders | | $ | (1,236,200 | ) | | $ | (2,180,235 | ) | | $ | (1,598,525 | ) | | |
| |
| |
| Transactions in shares of beneficial interest — | | | | | | | | | | | | | | |
| Proceeds from sale of shares | | | | | | | | | | | | | | |
| Class A | | $ | 3,984,258 | | | $ | 18,333,272 | | | $ | 15,722,875 | | | |
| Class B | | | 539,587 | | | | 589,942 | | | | 452,095 | | | |
| Class C | | | 805,254 | | | | 2,274,534 | | | | 712,065 | | | |
Net asset value of shares issued to shareholders in payment of
distributions declared | | | | | | | | | | | | | | |
| Class A | | | 601,551 | | | | 1,160,179 | | | | 951,726 | | | |
| Class B | | | 9,345 | | | | 25,695 | | | | 14,394 | | | |
| Class C | | | 19,124 | | | | 250,969 | | | | 7,384 | | | |
| Cost of shares redeemed | | | | | | | | | | | | | | |
| Class A | | | (18,931,650 | ) | | | (21,217,161 | ) | | | (16,399,535 | ) | | |
| Class B | | | (60,142 | ) | | | (248,539 | ) | | | (69,515 | ) | | |
| Class C | | | (297,771 | ) | | | (2,352,902 | ) | | | (329,870 | ) | | |
| Net asset value of shares exchanged | | | | | | | | | | | | | | |
| Class A | | | 173,098 | | | | 1,087,537 | | | | 523,381 | | | |
| Class B | | | (173,098 | ) | | | (1,087,537 | ) | | | (523,381 | ) | | |
| |
| |
Net increase (decrease) in net assets from Fund share transactions | | $ | (13,330,444 | ) | | $ | (1,184,011 | ) | | $ | 1,061,619 | | | |
| |
| |
| | | | | | | | | | | | | | | |
Net decrease in net assets | | $ | (15,973,564 | ) | | $ | (3,814,961 | ) | | $ | (644,789 | ) | | |
| |
| |
| | | | | | | | | | | | | | | |
| | | | | | | | | | | | | | | |
| |
| Net Assets |
| |
| At beginning of year | | $ | 38,671,106 | | | $ | 64,136,791 | | | $ | 43,557,707 | | | |
| |
| |
At end of year | | $ | 22,697,542 | | | $ | 60,321,830 | | | $ | 42,912,918 | | | |
| |
| |
| | | | | | | | | | | | | | | |
| | | | | | | | | | | | | | | |
| |
Accumulated undistributed
(distributions in excess of) net
investment income included in net assets |
| |
At end of year | | $ | (25,722 | ) | | $ | 42,579 | | | $ | 15,674 | | | |
| |
| |
See notes to financial statements41
Eaton Vance Limited Maturity Municipals Funds as of March 31, 2009
FINANCIAL STATEMENTS CONT’D
Statements of Changes in Net Assets
| | | | | | | | | | | | | | | |
| | | New York
| | | Ohio
| | | Pennsylvania
| | | |
| For the Year Ended March 31, 2009 | | Limited Fund | | | Limited Fund | | | Limited Fund | | | |
| |
| |
| |
| Increase (Decrease) in Net Assets |
| |
| From operations — | | | | | | | | | | | | | | |
| Net investment income | | $ | 3,433,951 | | | $ | 690,002 | | | $ | 1,987,838 | | | |
Net realized loss from investment transactions and
financial futures contracts | | | (3,065,074 | ) | | | (183,123 | ) | | | (1,168,523 | ) | | |
Net change in unrealized appreciation (depreciation) from investments
and financial futures contracts | | | (3,195,603 | ) | | | (223,074 | ) | | | (583,027 | ) | | |
| |
| |
Net increase (decrease) in net assets from operations | | $ | (2,826,726 | ) | | $ | 283,805 | | | $ | 236,288 | | | |
| |
| |
| Distributions to shareholders — | | | | | | | | | | | | | | |
| From net investment income | | | | | | | | | | | | | | |
| Class A | | $ | (2,704,516 | ) | | $ | (718,193 | ) | | $ | (1,533,981 | ) | | |
| Class B | | | (55,791 | ) | | | (4,801 | ) | | | (26,780 | ) | | |
| Class C | | | (753,275 | ) | | | (9,519 | ) | | | (413,985 | ) | | |
| |
| |
Total distributions to shareholders | | $ | (3,513,582 | ) | | $ | (732,513 | ) | | $ | (1,974,746 | ) | | |
| |
| |
| Transactions in shares of beneficial interest — | | | | | | | | | | | | | | |
| Proceeds from sale of shares | | | | | | | | | | | | | | |
| Class A | | $ | 13,356,546 | | | $ | 4,662,225 | | | $ | 10,073,900 | | | |
| Class B | | | 1,320,383 | | | | 202,089 | | | | 370,834 | | | |
| Class C | | | 7,388,421 | | | | 685,906 | | | | 3,305,521 | | | |
Net asset value of shares issued to shareholders in payment of
distributions declared | | | | | | | | | | | | | | |
| Class A | | | 1,979,581 | | | | 327,121 | | | | 778,812 | | | |
| Class B | | | 30,351 | | | | 4,044 | | | | 17,859 | | | |
| Class C | | | 448,913 | | | | 7,785 | | | | 158,792 | | | |
| Cost of shares redeemed | | | | | | | | | | | | | | |
| Class A | | | (19,790,596 | ) | | | (5,685,271 | ) | | | (13,033,002 | ) | | |
| Class B | | | (489,656 | ) | | | (72,667 | ) | | | (270,844 | ) | | |
| Class C | | | (7,250,841 | ) | | | (152,004 | ) | | | (2,625,503 | ) | | |
| Net asset value of shares exchanged | | | | | | | | | | | | | | |
| Class A | | | 795,658 | | | | 50,928 | | | | 702,719 | | | |
| Class B | | | (795,658 | ) | | | (50,928 | ) | | | (702,719 | ) | | |
| |
| |
Net decrease in net assets from Fund share transactions | | $ | (3,006,898 | ) | | $ | (20,772 | ) | | $ | (1,223,631 | ) | | |
| |
| |
| | | | | | | | | | | | | | | |
Net decrease in net assets | | $ | (9,347,206 | ) | | $ | (469,480 | ) | | $ | (2,962,089 | ) | | |
| |
| |
| | | | | | | | | | | | | | | |
| | | | | | | | | | | | | | | |
| |
| Net Assets |
| |
| At beginning of year | | $ | 97,261,957 | | | $ | 19,635,461 | | | $ | 53,856,908 | | | |
| |
| |
At end of year | | $ | 87,914,751 | | | $ | 19,165,981 | | | $ | 50,894,819 | | | |
| |
| |
| | | | | | | | | | | | | | | |
| | | | | | | | | | | | | | | |
| |
Accumulated distributions
in excess of net investment
income included in net assets |
| |
At end of year | | $ | (44,011 | ) | | $ | (23,283 | ) | | $ | (53,831 | ) | | |
| |
| |
See notes to financial statements42
Eaton Vance Limited Maturity Municipals Funds as of March 31, 2009
FINANCIAL STATEMENTS CONT’D
Statements of Changes in Net Assets
| | | | | | | | | | | | | | | |
| | | California
| | | Massachusetts
| | | New Jersey
| | | |
| For the Year Ended March 31, 2008 | | Limited Fund | | | Limited Fund | | | Limited Fund | | | |
| |
| |
| |
| Increase (Decrease) in Net Assets |
| |
| From operations — | | | | | | | | | | | | | | |
| Net investment income | | $ | 1,467,505 | | | $ | 2,213,543 | | | $ | 1,469,932 | | | |
Net realized loss from investment transactions and
financial futures contracts | | | (101,375 | ) | | | (465,868 | ) | | | (131,214 | ) | | |
Net change in unrealized appreciation (depreciation) from investments
and financial futures contracts | | | (1,319,205 | ) | | | (1,079,766 | ) | | | (1,121,252 | ) | | |
| |
| |
Net increase in net assets from operations | | $ | 46,925 | | | $ | 667,909 | | | $ | 217,466 | | | |
| |
| |
| Distributions to shareholders — | | | | | | | | | | | | | | |
| From net investment income | | | | | | | | | | | | | | |
| Class A | | $ | (1,426,343 | ) | | $ | (1,721,662 | ) | | $ | (1,458,404 | ) | | |
| Class B | | | (18,806 | ) | | | (70,611 | ) | | | (54,327 | ) | | |
| Class C | | | (22,929 | ) | | | (393,990 | ) | | | (2,024 | ) | | |
| |
| |
Total distributions to shareholders | | $ | (1,468,078 | ) | | $ | (2,186,263 | ) | | $ | (1,514,755 | ) | | |
| |
| |
| Proceeds from sale of shares | | | | | | | | | | | | | | |
| Class A | | $ | 20,742,539 | | | $ | 16,293,882 | | | $ | 11,940,718 | | | |
| Class B | | | 444,388 | | | | 183,836 | | | | 117,531 | | | |
| Class C | | | 1,801,390 | | | | 1,411,574 | | | | 143,200 | | | |
Net asset value of shares issued to shareholders in payment of
distributions declared | | | | | | | | | | | | | | |
| Class A | | | 600,333 | | | | 1,106,021 | | | | 935,605 | | | |
| Class B | | | 9,381 | | | | 43,685 | | | | 36,344 | | | |
| Class C | | | 8,566 | | | | 266,858 | | | | 1,856 | | | |
| Cost of shares redeemed | | | | | | | | | | | | | | |
| Class A | | | (19,746,067 | ) | | | (13,725,522 | ) | | | (7,653,821 | ) | | |
| Class B | | | (164,557 | ) | | | (507,396 | ) | | | (574,169 | ) | | |
| Class C | | | (872,889 | ) | | | (2,505,608 | ) | | | — | | | |
| Net asset value of shares exchanged | | | | | | | | | | | | | | |
| Class A | | | 431,354 | | | | 1,683,508 | | | | 1,605,600 | | | |
| Class B | | | (431,354 | ) | | | (1,683,508 | ) | | | (1,605,600 | ) | | |
| |
| |
Net increase in net assets from Fund share transactions | | $ | 2,823,084 | | | $ | 2,567,330 | | | $ | 4,947,264 | | | |
| |
| |
| | | | | | | | | | | | | | | |
Net increase in net assets | | $ | 1,401,931 | | | $ | 1,048,976 | | | $ | 3,649,975 | | | |
| |
| |
| | | | | | | | | | | | | | | |
| | | | | | | | | | | | | | | |
| |
| Net Assets |
| |
| At beginning of year | | $ | 37,269,175 | | | $ | 63,087,815 | | | $ | 39,907,732 | | | |
| |
| |
At end of year | | $ | 38,671,106 | | | $ | 64,136,791 | | | $ | 43,557,707 | | | |
| |
| |
| | | | | | | | | | | | | | | |
| | | | | | | | | | | | | | | |
| |
Accumulated undistributed
(distributions in excess of) net
investment income included in net assets |
| |
At end of year | | $ | 1,251 | | | $ | (23,794 | ) | | $ | 39,338 | | | |
| |
| |
See notes to financial statements43
Eaton Vance Limited Maturity Municipals Funds as of March 31, 2009
FINANCIAL STATEMENTS CONT’D
Statements of Changes in Net Assets
| | | | | | | | | | | | | | | |
| | | New York
| | | Ohio
| | | Pennsylvania
| | | |
| For the Year Ended March 31, 2008 | | Limited Fund | | | Limited Fund | | | Limited Fund | | | |
| |
| |
| |
| Increase (Decrease) in Net Assets |
| |
| From operations — | | | | | | | | | | | | | | |
| Net investment income | | $ | 3,512,447 | | | $ | 731,584 | | | $ | 1,925,052 | | | |
Net realized loss from investment transactions and
financial futures contracts | | | (1,046,806 | ) | | | (222,125 | ) | | | (413,650 | ) | | |
Net change in unrealized appreciation (depreciation) from investments
and financial futures contracts | | | (2,759,079 | ) | | | (326,181 | ) | | | (1,243,685 | ) | | |
| |
| |
Net increase (decrease) in net assets from operations | | $ | (293,438 | ) | | $ | 183,278 | | | $ | 267,717 | | | |
| |
| |
| Distributions to shareholders — | | | | | | | | | | | | | | |
| From net investment income | | | | | | | | | | | | | | |
| Class A | | $ | (2,705,598 | ) | | $ | (726,581 | ) | | $ | (1,445,100 | ) | | |
| Class B | | | (80,066 | ) | | | (6,264 | ) | | | (66,605 | ) | | |
| Class C | | | (676,008 | ) | | | (873 | ) | | | (427,188 | ) | | |
| |
| |
Total distributions to shareholders | | $ | (3,461,672 | ) | | $ | (733,718 | ) | | $ | (1,938,893 | ) | | |
| |
| |
| Proceeds from sale of shares | | | | | | | | | | | | | | |
| Class A | | $ | 19,329,482 | | | $ | 4,366,922 | | | $ | 10,024,969 | | | |
| Class B | | | 636,460 | | | | 36,226 | | | | 34,597 | | | |
| Class C | | | 6,974,414 | | | | 174,171 | | | | 2,925,390 | | | |
Net asset value of shares issued to shareholders in payment of
distributions declared | | | | | | | | | | | | | | |
| Class A | | | 2,004,730 | | | | 370,938 | | | | 763,476 | | | |
| Class B | | | 52,062 | | | | 4,975 | | | | 41,261 | | | |
| Class C | | | 398,652 | | | | 724 | | | | 174,325 | | | |
| Cost of shares redeemed | | | | | | | | | | | | | | |
| Class A | | | (22,068,992 | ) | | | (4,263,125 | ) | | | (6,340,021 | ) | | |
| Class B | | | (322,284 | ) | | | (45,204 | ) | | | (580,890 | ) | | |
| Class C | | | (4,799,890 | ) | | | (42,882 | ) | | | (3,436,892 | ) | | |
| Net asset value of shares exchanged | | | | | | | | | | | | | | |
| Class A | | | 2,706,622 | | | | 318,329 | | | | 1,987,242 | | | |
| Class B | | | (2,706,622 | ) | | | (318,329 | ) | | | (1,987,242 | ) | | |
| |
| |
Net increase in net assets from Fund share transactions | | $ | 2,204,634 | | | $ | 602,745 | | | $ | 3,606,215 | | | |
| |
| |
Net increase (decrease) in net assets | | $ | (1,550,476 | ) | | $ | 52,305 | | | $ | 1,935,039 | | | |
| |
| |
| | | | | | | | | | | | | | | |
| | | | | | | | | | | | | | | |
| |
| Net Assets |
| |
| At beginning of year | | $ | 98,812,433 | | | $ | 19,583,156 | | | $ | 51,921,869 | | | |
| |
| |
At end of year | | $ | 97,261,957 | | | $ | 19,635,461 | | | $ | 53,856,908 | | | |
| |
| |
| | | | | | | | | | | | | | | |
| | | | | | | | | | | | | | | |
| |
Distributions in excess
of net investment income
included in net assets |
| |
At end of year | | $ | (9,204 | ) | | $ | (510 | ) | | $ | (62,135 | ) | | |
| |
| |
See notes to financial statements44
Eaton Vance Limited Maturity Municipals Funds as of March 31, 2009
FINANCIAL STATEMENTS CONT’D
Financial Highlights
| | | | | | | | | | | | | | | | | | | | | | | |
| | | California Limited Fund — Class A |
| | | |
| | | Year Ended March 31, |
| | | |
| | | 2009 | | | 2008 | | | 2007 | | | 2006 | | | 2005 | | | |
| |
| Net asset value — Beginning of year | | $ | 10.030 | | | $ | 10.410 | | | $ | 10.330 | | | $ | 10.290 | | | $ | 10.560 | | | |
| |
| |
| | | | | | | | | | | | | | | | | | | | | | | |
| | | | | | | | | | | | | | | | | | | | | | | |
| |
| Income (Loss) From Operations |
| |
Net investment income(1) | | $ | 0.376 | | | $ | 0.381 | | | $ | 0.378 | | | $ | 0.377 | | | $ | 0.377 | | | |
| Net realized and unrealized gain (loss) | | | (0.734 | ) | | | (0.380 | ) | | | 0.082 | | | | 0.036 | | | | (0.274 | ) | | |
| |
| |
Total income (loss) from operations | | $ | (0.358 | ) | | $ | 0.001 | | | $ | 0.460 | | | $ | 0.413 | | | $ | 0.103 | | | |
| |
| |
| | | | | | | | | | | | | | | | | | | | | | | |
| | | | | | | | | | | | | | | | | | | | | | | |
| |
| Less Distributions |
| |
| From net investment income | | $ | (0.382 | ) | | $ | (0.381 | ) | | $ | (0.380 | ) | | $ | (0.373 | ) | | $ | (0.373 | ) | | |
| |
| |
Total distributions | | $ | (0.382 | ) | | $ | (0.381 | ) | | $ | (0.380 | ) | | $ | (0.373 | ) | | $ | (0.373 | ) | | |
| |
| |
| | | | | | | | | | | | | | | | | | | | | | | |
Net asset value — End of year | | $ | 9.290 | | | $ | 10.030 | | | $ | 10.410 | | | $ | 10.330 | | | $ | 10.290 | | | |
| |
| |
| | | | | | | | | | | | | | | | | | | | | | | |
Total Return(2) | | | (3.67 | )% | | | 0.00 | %(3) | | | 4.52 | % | | | 4.06 | % | | | 0.99 | % | | |
| |
| |
| | | | | | | | | | | | | | | | | | | | | | | |
| | | | | | | | | | | | | | | | | | | | | | | |
| |
| Ratios/Supplemental Data |
| |
| Net assets, end of year (000’s omitted) | | $ | 20,017 | | | $ | 36,615 | | | $ | 35,937 | | | $ | 33,830 | | | $ | 31,555 | | | |
| Ratios (As a percentage of average daily net assets): | | | | | | | | | | | | | | | | | | | | | | |
| Expenses before custodian fee reduction | | | 0.94 | % | | | 0.85 | % | | | 0.93 | % | | | 0.86 | % | | | 0.90 | %(4) | | |
| Expenses after custodian fee reduction | | | 0.93 | % | | | 0.82 | % | | | 0.90 | % | | | 0.84 | % | | | 0.89 | %(4) | | |
| Net investment income | | | 3.87 | % | | | 3.70 | % | | | 3.65 | % | | | 3.64 | % | | | 3.62 | % | | |
| Portfolio Turnover of the Portfolio | | | — | | | | — | | | | — | | | | — | | | | 13 | %(5) | | |
| Portfolio Turnover of the Fund | | | 7 | % | | | 55 | % | | | 32 | % | | | 28 | % | | | 13 | % | | |
| |
| |
| | |
| (1) | | Computed using average shares outstanding. |
| |
| (2) | | Returns are historical and are calculated by determining the percentage change in net asset value with all distributions reinvested and do not reflect the effect of sales charges. |
| |
| (3) | | Amount is less than 0.01%. |
| |
| (4) | | Includes the Fund’s share of the corresponding Portfolio’s allocated expenses while the Fund was making investments directly into the Portfolio. |
| |
| (5) | | Portfolio turnover represents the rate of portfolio activity for the period while the Fund was making investments directly into the Portfolio. |
See notes to financial statements45
Eaton Vance Limited Maturity Municipals Funds as of March 31, 2009
FINANCIAL STATEMENTS CONT’D
Financial Highlights
| | | | | | | | | | | | | | | | | | | | | | | |
| | | California Limited Fund — Class B | | | |
| | | |
| | | Year Ended March 31, |
| | | |
| | | 2009 | | | 2008 | | | 2007 | | | 2006 | | | 2005 | | | |
| |
| Net asset value — Beginning of year | | $ | 10.000 | | | $ | 10.370 | | | $ | 10.300 | | | $ | 10.260 | | | $ | 10.520 | | | |
| |
| |
| | | | | | | | | | | | | | | | | | | | | | | |
| | | | | | | | | | | | | | | | | | | | | | | |
| |
| Income (Loss) From Operations |
| |
Net investment income(1) | | $ | 0.299 | | | $ | 0.304 | | | $ | 0.303 | | | $ | 0.298 | | | $ | 0.301 | | | |
| Net realized and unrealized gain (loss) | | | (0.733 | ) | | | (0.372 | ) | | | 0.068 | | | | 0.035 | | | | (0.268 | ) | | |
| |
| |
Total income (loss) from operations | | $ | (0.434 | ) | | $ | (0.068 | ) | | $ | 0.371 | | | $ | 0.333 | | | $ | 0.033 | | | |
| |
| |
| | | | | | | | | | | | | | | | | | | | | | | |
| | | | | | | | | | | | | | | | | | | | | | | |
| |
| Less Distributions |
| |
| From net investment income | | $ | (0.306 | ) | | $ | (0.302 | ) | | $ | (0.301 | ) | | $ | (0.293 | ) | | $ | (0.293 | ) | | |
| |
| |
Total distributions | | $ | (0.306 | ) | | $ | (0.302 | ) | | $ | (0.301 | ) | | $ | (0.293 | ) | | $ | (0.293 | ) | | |
| |
| |
| | | | | | | | | | | | | | | | | | | | | | | |
Net asset value — End of year | | $ | 9.260 | | | $ | 10.000 | | | $ | 10.370 | | | $ | 10.300 | | | $ | 10.260 | | | |
| |
| |
| | | | | | | | | | | | | | | | | | | | | | | |
Total Return(2) | | | (4.42 | )% | | | (0.68 | )% | | | 3.64 | % | | | 3.28 | % | | | 0.31 | % | | |
| |
| |
| | | | | | | | | | | | | | | | | | | | | | | |
| | | | | | | | | | | | | | | | | | | | | | | |
| |
| Ratios/Supplemental Data |
| |
| Net assets, end of year (000’s omitted) | | $ | 860 | | | $ | 607 | | | $ | 770 | | | $ | 2,687 | | | $ | 3,837 | | | |
| Ratios (As a percentage of average daily net assets): | | | | | | | | | | | | | | | | | | | | | | |
| Expenses before custodian fee reduction | | | 1.70 | % | | | 1.60 | % | | | 1.68 | % | | | 1.61 | % | | | 1.65 | %(3) | | |
| Expenses after custodian fee reduction | | | 1.68 | % | | | 1.57 | % | | | 1.65 | % | | | 1.59 | % | | | 1.64 | %(3) | | |
| Net investment income | | | 3.14 | % | | | 2.96 | % | | | 2.94 | % | | | 2.89 | % | | | 2.90 | % | | |
| Portfolio Turnover of the Portfolio | | | — | | | | — | | | | — | | | | — | | | | 13 | %(4) | | |
| Portfolio Turnover of the Fund | | | 7 | % | | | 55 | % | | | 32 | % | | | 28 | % | | | 13 | % | | |
| |
| |
| | |
| (1) | | Computed using average shares outstanding. |
| |
| (2) | | Returns are historical and are calculated by determining the percentage change in net asset value with all distributions reinvested and do not reflect the effect of sales charges. |
| |
| (3) | | Includes the Fund’s share of the corresponding Portfolio’s allocated expenses while the Fund was making investments directly into the Portfolio. |
| |
| (4) | | Portfolio turnover represents the rate of portfolio activity for the period while the Fund was making investments directly into the Portfolio. |
See notes to financial statements46
Eaton Vance Limited Maturity Municipals Funds as of March 31, 2009
FINANCIAL STATEMENTS CONT’D
Financial Highlights
| | | | | | | | | | | | | | | | | | | | | | | |
| | | California Limited Fund — Class C |
| | | |
| | | Year Ended March 31, | | | | | | |
| | | | | | Period Ended
| | | |
| | | 2009 | | | 2008 | | | 2007 | | | 2006 | | | March 31, 2005(1) | | | |
| |
| Net asset value — Beginning of period | | $ | 9.690 | | | $ | 10.050 | | | $ | 9.980 | | | $ | 9.950 | | | $ | 10.000 | | | |
| |
| |
| | | | | | | | | | | | | | | | | | | | | | | |
| | | | | | | | | | | | | | | | | | | | | | | |
| |
| Income (Loss) From Operations |
| |
Net investment income(2) | | $ | 0.290 | | | $ | 0.294 | | | $ | 0.280 | | | $ | 0.282 | | | $ | 0.002 | | | |
| Net realized and unrealized gain (loss) | | | (0.703 | ) | | | (0.361 | ) | | | 0.082 | | | | 0.034 | | | | (0.052 | ) | | |
| |
| |
Total income (loss) from operations | | $ | (0.413 | ) | | $ | (0.067 | ) | | $ | 0.362 | | | $ | 0.316 | | | $ | (0.050 | ) | | |
| |
| |
| | | | | | | | | | | | | | | | | | | | | | | |
| | | | | | | | | | | | | | | | | | | | | | | |
| |
| Less Distributions |
| |
| From net investment income | | $ | (0.297 | ) | | $ | (0.293 | ) | | $ | (0.292 | ) | | $ | (0.286 | ) | | $ | — | | | |
| |
| |
Total distributions | | $ | (0.297 | ) | | $ | (0.293 | ) | | $ | (0.292 | ) | | $ | (0.286 | ) | | $ | — | | | |
| |
| |
| | | | | | | | | | | | | | | | | | | | | | | |
Net asset value — End of period | | $ | 8.980 | | | $ | 9.690 | | | $ | 10.050 | | | $ | 9.980 | | | $ | 9.950 | | | |
| |
| |
| | | | | | | | | | | | | | | | | | | | | | | |
Total Return(3) | | | (4.35 | )% | | | (0.69 | )% | | | 3.67 | % | | | 3.15 | % | | | (0.01 | )%(7) | | |
| |
| |
| | | | | | | | | | | | | | | | | | | | | | | |
| | | | | | | | | | | | | | | | | | | | | | | |
| |
| Ratios/Supplemental Data |
| |
| Net assets, end of period (000’s omitted) | | $ | 1,820 | | | $ | 1,449 | | | $ | 562 | | | $ | 22 | | | $ | 10 | | | |
| Ratios (As a percentage of average daily net assets): | | | | | | | | | | | | | | | | | | | | | | |
| Expenses before custodian fee reduction | | | 1.70 | % | | | 1.60 | % | | | 1.68 | % | | | 1.61 | % | | | 0.00 | %(4)(5) | | |
| Expenses after custodian fee reduction | | | 1.68 | % | | | 1.57 | % | | | 1.65 | % | | | 1.59 | % | | | — | | | |
| Net investment income | | | 3.12 | % | | | 2.96 | % | | | 2.78 | % | | | 2.83 | % | | | 0.00 | %(4)(5) | | |
| Portfolio Turnover | | | 7 | % | | | 55 | % | | | 32 | % | | | 28 | % | | | 13 | %(6) | | |
| |
| |
| | |
| (1) | | For the period from the commencement of offering of Class C shares, March 23, 2005, to March 31, 2005. |
| |
| (2) | | Computed using average shares outstanding. |
| |
| (3) | | Returns are historical and are calculated by determining the percentage change in net asset value with all distributions reinvested and do not reflect the effect of sales charges. |
| |
| (4) | | Annualized. |
| |
| (5) | | Amount is less than 0.01%. |
| |
| (6) | | For the Fund’s year ended March 31, 2005. |
| |
| (7) | | Not annualized. |
See notes to financial statements47
Eaton Vance Limited Maturity Municipals Funds as of March 31, 2009
FINANCIAL STATEMENTS CONT’D
Financial Highlights
| | | | | | | | | | | | | | | | | | | | | | | |
| | | Massachusetts Limited Fund — Class A |
| | | |
| | | Year Ended March 31, |
| | | |
| | | 2009 | | | 2008 | | | 2007 | | | 2006 | | | 2005 | | | |
| |
| Net asset value — Beginning of year | | $ | 9.970 | | | $ | 10.200 | | | $ | 10.110 | | | $ | 10.180 | | | $ | 10.460 | | | |
| |
| |
| | | | | | | | | | | | | | | | | | | | | | | |
| | | | | | | | | | | | | | | | | | | | | | | |
| |
| Income (Loss) From Operations |
| |
Net investment income(1) | | $ | 0.360 | | | $ | 0.371 | | | $ | 0.372 | | | $ | 0.367 | | | $ | 0.370 | | | |
| Net realized and unrealized gain (loss) | | | (0.407 | ) | | | (0.231 | ) | | | 0.092 | | | | (0.074 | ) | | | (0.287 | ) | | |
| |
| |
Total income (loss) from operations | | $ | (0.047 | ) | | $ | 0.140 | | | $ | 0.464 | | | $ | 0.293 | | | $ | 0.083 | | | |
| |
| |
| | | | | | | | | | | | | | | | | | | | | | | |
| | | | | | | | | | | | | | | | | | | | | | | |
| |
| Less Distributions |
| |
| From net investment income | | $ | (0.363 | ) | | $ | (0.370 | ) | | $ | (0.374 | ) | | $ | (0.363 | ) | | $ | (0.363 | ) | | |
| |
| |
Total distributions | | $ | (0.363 | ) | | $ | (0.370 | ) | | $ | (0.374 | ) | | $ | (0.363 | ) | | $ | (0.363 | ) | | |
| |
| |
| | | | | | | | | | | | | | | | | | | | | | | |
Net asset value — End of year | | $ | 9.560 | | | $ | 9.970 | | | $ | 10.200 | | | $ | 10.110 | | | $ | 10.180 | | | |
| |
| |
| | | | | | | | | | | | | | | | | | | | | | | |
Total Return(2) | | | (0.50 | )% | | | 1.39 | % | | | 4.66 | % | | | 2.90 | % | | | 0.79 | % | | |
| |
| |
| | | | | | | | | | | | | | | | | | | | | | | |
| | | | | | | | | | | | | | | | | | | | | | | |
| |
| Ratios/Supplemental Data |
| |
| Net assets, end of year (000’s omitted) | | $ | 46,857 | | | $ | 49,514 | | | $ | 45,300 | | | $ | 47,407 | | | $ | 48,901 | | | |
| Ratios (As a percentage of average daily net assets): | | | | | | | | | | | | | | | | | | | | | | |
| Expenses before custodian fee reduction | | | 0.85 | % | | | 0.84 | % | | | 0.84 | % | | | 0.82 | % | | | 0.82 | %(3) | | |
| Expenses after custodian fee reduction | | | 0.84 | % | | | 0.83 | % | | | 0.82 | % | | | 0.81 | % | | | 0.81 | %(3) | | |
| Net investment income | | | 3.69 | % | | | 3.67 | % | | | 3.65 | % | | | 3.59 | % | | | 3.59 | % | | |
| Portfolio Turnover of the Portfolio | | | — | | | | — | | | | — | | | | — | | | | 13 | %(4) | | |
| Portfolio Turnover of the Fund | | | 16 | % | | | 14 | % | | | 14 | % | | | 7 | % | | | 7 | % | | |
| |
| |
| | |
| (1) | | Computed using average shares outstanding. |
| |
| (2) | | Returns are historical and are calculated by determining the percentage change in net asset value with all distributions reinvested and do not reflect the effect of sales charges. |
| |
| (3) | | Includes the Fund’s share of the corresponding Portfolio’s allocated expenses while the Fund was making investments directly into the Portfolio. |
| |
| (4) | | Portfolio turnover represents the rate of portfolio activity for the period while the Fund was making investments directly into the Portfolio. |
See notes to financial statements48
Eaton Vance Limited Maturity Municipals Funds as of March 31, 2009
FINANCIAL STATEMENTS CONT’D
Financial Highlights
| | | | | | | | | | | | | | | | | | | | | | | |
| | | Massachusetts Limited Fund — Class B |
| | | |
| | | Year Ended March 31, |
| | | |
| | | 2009 | | | 2008 | | | 2007 | | | 2006 | | | 2005 | | | |
| |
| Net asset value — Beginning of year | | $ | 9.960 | | | $ | 10.200 | | | $ | 10.110 | | | $ | 10.170 | | | $ | 10.450 | | | |
| |
| |
| | | | | | | | | | | | | | | | | | | | | | | |
| | | | | | | | | | | | | | | | | | | | | | | |
| |
| Income (Loss) From Operations |
| |
Net investment income(1) | | $ | 0.288 | | | $ | 0.297 | | | $ | 0.295 | | | $ | 0.289 | | | $ | 0.292 | | | |
| Net realized and unrealized gain (loss) | | | (0.399 | ) | | | (0.244 | ) | | | 0.092 | | | | (0.066 | ) | | | (0.289 | ) | | |
| |
| |
Total income (loss) from operations | | $ | (0.111 | ) | | $ | 0.053 | | | $ | 0.387 | | | $ | 0.223 | | | $ | 0.003 | | | |
| |
| |
| | | | | | | | | | | | | | | | | | | | | | | |
| | | | | | | | | | | | | | | | | | | | | | | |
| |
| Less Distributions |
| |
| From net investment income | | $ | (0.289 | ) | | $ | (0.293 | ) | | $ | (0.297 | ) | | $ | (0.283 | ) | | $ | (0.283 | ) | | |
| |
| |
Total distributions | | $ | (0.289 | ) | | $ | (0.293 | ) | | $ | (0.297 | ) | | $ | (0.283 | ) | | $ | (0.283 | ) | | |
| |
| |
| | | | | | | | | | | | | | | | | | | | | | | |
Net asset value — End of year | | $ | 9.560 | | | $ | 9.960 | | | $ | 10.200 | | | $ | 10.110 | | | $ | 10.170 | | | |
| |
| |
| | | | | | | | | | | | | | | | | | | | | | | |
Total Return(2) | | | (1.15 | )% | | | 0.52 | % | | | 3.87 | % | | | 2.20 | % | | | 0.02 | % | | |
| |
| |
| | | | | | | | | | | | | | | | | | | | | | | |
| | | | | | | | | | | | | | | | | | | | | | | |
| |
| Ratios/Supplemental Data |
| |
| Net assets, end of year (000’s omitted) | | $ | 854 | | | $ | 1,628 | | | $ | 3,648 | | | $ | 7,234 | | | $ | 10,350 | | | |
| Ratios (As a percentage of average daily net assets): | | | | | | | | | | | | | | | | | | | | | | |
| Expenses before custodian fee reduction | | | 1.60 | % | | | 1.60 | % | | | 1.59 | % | | | 1.57 | % | | | 1.57 | %(3) | | |
| Expenses after custodian fee reduction | | | 1.59 | % | | | 1.58 | % | | | 1.57 | % | | | 1.56 | % | | | 1.56 | %(3) | | |
| Net investment income | | | 2.94 | % | | | 2.94 | % | | | 2.91 | % | | | 2.83 | % | | | 2.83 | % | | |
| Portfolio Turnover of the Portfolio | | | — | | | | — | | | | — | | | | — | | | | 13 | %(4) | | |
| Portfolio Turnover of the Fund | | | 16 | % | | | 14 | % | | | 14 | % | | | 7 | % | | | 7 | % | | |
| |
| |
| | |
| (1) | | Computed using average shares outstanding. |
| |
| (2) | | Returns are historical and are calculated by determining the percentage change in net asset value with all distributions reinvested and do not reflect the effect of sales charges. |
| |
| (3) | | Includes the Fund’s share of the corresponding Portfolio’s allocated expenses while the Fund was making investments directly into the Portfolio. |
| |
| (4) | | Portfolio turnover represents the rate of portfolio activity for the period while the Fund was making investments directly into the Portfolio. |
See notes to financial statements49
Eaton Vance Limited Maturity Municipals Funds as of March 31, 2009
FINANCIAL STATEMENTS CONT’D
Financial Highlights
| | | | | | | | | | | | | | | | | | | | | | | |
| | | Massachusetts Limited Fund — Class C |
| | | |
| | | Year Ended March 31, |
| | | |
| | | 2009 | | | 2008 | | | 2007 | | | 2006 | | | 2005 | | | |
| |
| Net asset value — Beginning of year | | $ | 9.550 | | | $ | 9.770 | | | $ | 9.690 | | | $ | 9.740 | | | $ | 10.020 | | | |
| |
| |
| | | | | | | | | | | | | | | | | | | | | | | |
| | | | | | | | | | | | | | | | | | | | | | | |
| |
| Income (Loss) From Operations |
| |
Net investment income(1) | | $ | 0.274 | | | $ | 0.284 | | | $ | 0.284 | | | $ | 0.278 | | | $ | 0.280 | | | |
| Net realized and unrealized gain (loss) | | | (0.387 | ) | | | (0.223 | ) | | | 0.081 | | | | (0.057 | ) | | | (0.287 | ) | | |
| |
| |
Total income (loss) from operations | | $ | (0.113 | ) | | $ | 0.061 | | | $ | 0.365 | | | $ | 0.221 | | | $ | (0.007 | ) | | |
| |
| |
| | | | | | | | | | | | | | | | | | | | | | | |
| | | | | | | | | | | | | | | | | | | | | | | |
| |
| Less Distributions |
| |
| From net investment income | | $ | (0.277 | ) | | $ | (0.281 | ) | | $ | (0.285 | ) | | $ | (0.271 | ) | | $ | (0.273 | ) | | |
| |
| |
Total distributions | | $ | (0.277 | ) | | $ | (0.281 | ) | | $ | (0.285 | ) | | $ | (0.271 | ) | | $ | (0.273 | ) | | |
| |
| |
| | | | | | | | | | | | | | | | | | | | | | | |
Net asset value — End of year | | $ | 9.160 | | | $ | 9.550 | | | $ | 9.770 | | | $ | 9.690 | | | $ | 9.740 | | | |
| |
| |
| | | | | | | | | | | | | | | | | | | | | | | |
Total Return(2) | | | (1.22 | )% | | | 0.63 | % | | | 3.81 | % | | | 2.28 | % | | | (0.14 | )%(3) | | |
| |
| |
| | | | | | | | | | | | | | | | | | | | | | | |
| | | | | | | | | | | | | | | | | | | | | | | |
| |
| Ratios/Supplemental Data |
| |
| Net assets, end of year (000’s omitted) | | $ | 12,611 | | | $ | 12,995 | | | $ | 14,139 | | | $ | 19,901 | | | $ | 27,589 | | | |
| Ratios (As a percentage of average daily net assets): | | | | | | | | | | | | | | | | | | | | | | |
| Expenses before custodian fee reduction | | | 1.60 | % | | | 1.60 | % | | | 1.59 | % | | | 1.57 | % | | | 1.57 | %(4) | | |
| Expenses after custodian fee reduction | | | 1.59 | % | | | 1.58 | % | | | 1.57 | % | | | 1.56 | % | | | 1.56 | %(4) | | |
| Net investment income | | | 2.93 | % | | | 2.93 | % | | | 2.91 | % | | | 2.84 | % | | | 2.83 | % | | |
| Portfolio Turnover of the Portfolio | | | — | | | | — | | | | — | | | | — | | | | 13 | %(5) | | |
| Portfolio Turnover of the Fund | | | 16 | % | | | 14 | % | | | 14 | % | | | 7 | % | | | 7 | % | | |
| |
| |
| | |
| (1) | | Computed using average shares outstanding. |
| |
| (2) | | Returns are historical and are calculated by determining the percentage change in net asset value with all distributions reinvested and do not reflect the effect of sales charges. |
| |
| (3) | | Total return reflects a decrease of 0.05% due to a change in the timing of the payment and reinvestment of distributions. |
| |
| (4) | | Includes the Fund’s share of the corresponding Portfolio’s allocated expenses while the Fund was making investments directly into the Portfolio. |
| |
| (5) | | Portfolio turnover represents the rate of portfolio activity for the period while the Fund was making investments directly into the Portfolio. |
See notes to financial statements50
Eaton Vance Limited Maturity Municipals Funds as of March 31, 2009
FINANCIAL STATEMENTS CONT’D
Financial Highlights
| | | | | | | | | | | | | | | | | | | | | | | |
| | | New Jersey Limited Fund — Class A | | | |
| | | |
| | | Year Ended March 31, |
| | | |
| | | 2009 | | | 2008 | | | 2007 | | | 2006 | | | 2005 | | | |
| |
| Net asset value — Beginning of year | | $ | 9.900 | | | $ | 10.210 | | | $ | 10.110 | | �� | $ | 10.100 | | | $ | 10.360 | | | |
| |
| |
| | | | | | | | | | | | | | | | | | | | | | | |
| | | | | | | | | | | | | | | | | | | | | | | |
| |
| Income (Loss) From Operations |
| |
Net investment income(1) | | $ | 0.363 | | | $ | 0.372 | | | $ | 0.392 | | | $ | 0.371 | | | $ | 0.366 | | | |
| Net realized and unrealized gain (loss) | | | (0.401 | ) | | | (0.298 | ) | | | 0.083 | | | | 0.001 | | | | (0.266 | ) | | |
| |
| |
Total income (loss) from operations | | $ | (0.038 | ) | | $ | 0.074 | | | $ | 0.475 | | | $ | 0.372 | | | $ | 0.100 | | | |
| |
| |
| | | | | | | | | | | | | | | | | | | | | | | |
| | | | | | | | | | | | | | | | | | | | | | | |
| |
| Less Distributions |
| |
| From net investment income | | $ | (0.372 | ) | | $ | (0.384 | ) | | $ | (0.375 | ) | | $ | (0.362 | ) | | $ | (0.360 | ) | | |
| |
| |
Total distributions | | $ | (0.372 | ) | | $ | (0.384 | ) | | $ | (0.375 | ) | | $ | (0.362 | ) | | $ | (0.360 | ) | | |
| |
| |
| | | | | | | | | | | | | | | | | | | | | | | |
Net asset value — End of year | | $ | 9.490 | | | $ | 9.900 | | | $ | 10.210 | | | $ | 10.110 | | | $ | 10.100 | | | |
| |
| |
| | | | | | | | | | | | | | | | | | | | | | | |
Total Return(2) | | | (0.39 | )% | | | 0.74 | % | | | 4.76 | % | | | 3.74 | % | | | 0.98 | % | | |
| |
| |
| | | | | | | | | | | | | | | | | | | | | | | |
| | | | | | | | | | | | | | | | | | | | | | | |
| |
| Ratios/Supplemental Data |
| |
| Net assets, end of year (000’s omitted) | | $ | 41,746 | | | $ | 42,612 | | | $ | 37,031 | | | $ | 37,080 | | | $ | 43,424 | | | |
| Ratios (As a percentage of average daily net assets): | | | | | | | | | | | | | | | | | | | | | | |
| Expenses excluding interest and fees | | | 0.89 | % | | | 0.91 | % | | | 0.91 | % | | | 0.88 | % | | | 0.87 | %(3) | | |
Interest and fee expense(4) | | | — | | | | 0.02 | % | | | — | | | | — | | | | — | | | |
| Expenses before custodian fee reduction | | | 0.89 | % | | | 0.93 | % | | | 0.91 | % | | | 0.88 | % | | | 0.87 | %(3) | | |
| Expenses after custodian fee reduction | | | 0.87 | % | | | 0.88 | % | | | 0.90 | % | | | 0.87 | % | | | 0.86 | %(3) | | |
| Net investment income | | | 3.76 | % | | | 3.69 | % | | | 3.85 | % | | | 3.66 | % | | | 3.59 | % | | |
| Portfolio Turnover of the Portfolio | | | — | | | | — | | | | — | | | | — | | | | 11 | %(5) | | |
| Portfolio Turnover of the Fund | | | 23 | % | | | 12 | % | | | 18 | % | | | 25 | % | | | 14 | % | | |
| |
| |
| | |
| (1) | | Computed using average shares outstanding. |
| |
| (2) | | Returns are historical and are calculated by determining the percentage change in net asset value with all distributions reinvested and do not reflect the effect of sales charges. |
| |
| (3) | | Includes the Fund’s share of the corresponding Portfolio’s allocated expenses while the Fund was making investments directly into the Portfolio. |
| |
| (4) | | Interest and fee expense relates to the liability for floating rate notes issued in conjunction with inverse floater securities transactions (see Note 1I). |
| |
| (5) | | Portfolio turnover represents the rate of portfolio activity for the period while the Fund was making investments directly into the Portfolio. |
See notes to financial statements51
Eaton Vance Limited Maturity Municipals Funds as of March 31, 2009
FINANCIAL STATEMENTS CONT’D
Financial Highlights
| | | | | | | | | | | | | | | | | | | | | | | |
| | | New Jersey Limited Fund — Class B |
| | | |
| | | Year Ended March 31, |
| | | |
| | | 2009 | | | 2008 | | | 2007 | | | 2006 | | | 2005 | | | |
| |
| Net asset value — Beginning of year | | $ | 9.900 | | | $ | 10.210 | | | $ | 10.100 | | | $ | 10.100 | | | $ | 10.350 | | | |
| |
| |
| | | | | | | | | | | | | | | | | | | | | | | |
| | | | | | | | | | | | | | | | | | | | | | | |
| |
| Income (Loss) From Operations |
| |
Net investment income(1) | | $ | 0.291 | | | $ | 0.302 | | | $ | 0.316 | | | $ | 0.294 | | | $ | 0.290 | | | |
| Net realized and unrealized gain (loss) | | | (0.393 | ) | | | (0.305 | ) | | | 0.093 | | | | (0.009 | ) | | | (0.260 | ) | | |
| |
| |
Total income (loss) from operations | | $ | (0.102 | ) | | $ | (0.003 | ) | | $ | 0.409 | | | $ | 0.285 | | | $ | 0.030 | | | |
| |
| |
| | | | | | | | | | | | | | | | | | | | | | | |
| | | | | | | | | | | | | | | | | | | | | | | |
| |
| Less Distributions |
| |
| From net investment income | | $ | (0.298 | ) | | $ | (0.307 | ) | | $ | (0.299 | ) | | $ | (0.285 | ) | | $ | (0.280 | ) | | |
| |
| |
Total distributions | | $ | (0.298 | ) | | $ | (0.307 | ) | | $ | (0.299 | ) | | $ | (0.285 | ) | | $ | (0.280 | ) | | |
| |
| |
| | | | | | | | | | | | | | | | | | | | | | | |
Net asset value — End of year | | $ | 9.500 | | | $ | 9.900 | | | $ | 10.210 | | | $ | 10.100 | | | $ | 10.100 | | | |
| |
| |
| | | | | | | | | | | | | | | | | | | | | | | |
Total Return(2) | | | (1.05 | )% | | | (0.03 | )% | | | 4.09 | % | | | 2.85 | % | | | 0.30 | % | | |
| |
| |
| | | | | | | | | | | | | | | | | | | | | | | |
| | | | | | | | | | | | | | | | | | | | | | | |
| |
| Ratios/Supplemental Data |
| |
| Net assets, end of year (000’s omitted) | | $ | 648 | | | $ | 801 | | | $ | 2,875 | | | $ | 5,992 | | | $ | 8,851 | | | |
| Ratios (As a percentage of average daily net assets): | | | | | | | | | | | | | | | | | | | | | | |
| Expenses excluding interest and fees | | | 1.64 | % | | | 1.66 | % | | | 1.66 | % | | | 1.63 | % | | | 1.62 | %(3) | | |
Interest and fee expense(4) | | | — | | | | 0.02 | % | | | — | | | | — | | | | — | | | |
| Expenses before custodian fee reduction | | | 1.64 | % | | | 1.68 | % | | | 1.66 | % | | | 1.63 | % | | | 1.62 | %(3) | | |
| Expenses after custodian fee reduction | | | 1.62 | % | | | 1.64 | % | | | 1.65 | % | | | 1.62 | % | | | 1.61 | %(3) | | |
| Net investment income | | | 3.01 | % | | | 2.99 | % | | | 3.11 | % | | | 2.91 | % | | | 2.84 | % | | |
| Portfolio Turnover of the Portfolio | | | — | | | | — | | | | — | | | | — | | | | 11 | %(5) | | |
| Portfolio Turnover of the Fund | | | 23 | % | | | 12 | % | | | 18 | % | | | 25 | % | | | 14 | % | | |
| |
| |
| | |
| (1) | | Computed using average shares outstanding. |
| |
| (2) | | Returns are historical and are calculated by determining the percentage change in net asset value with all distributions reinvested and do not reflect the effect of sales charges. |
| |
| (3) | | Includes the Fund’s share of the corresponding Portfolio’s allocated expenses while the Fund was making investments directly into the Portfolio. |
| |
| (4) | | Interest and fee expense relates to the liability for floating rate notes issued in conjunction with inverse floater securities transactions (see Note 1I). |
| |
| (5) | | Portfolio turnover represents the rate of portfolio activity for the period while the Fund was making investments directly into the Portfolio. |
See notes to financial statements52
Eaton Vance Limited Maturity Municipals Funds as of March 31, 2009
FINANCIAL STATEMENTS CONT’D
Financial Highlights
| | | | | | | | | | | | | | | |
| | | New Jersey Limited Fund — Class C |
| | | |
| | | Year Ended March 31, | | | | | | |
| | | | | | Period Ended
| | | |
| | | 2009 | | | 2008 | | | March 31, 2007(1) | | | |
| |
| Net asset value — Beginning of period | | $ | 9.910 | | | $ | 10.210 | | | $ | 10.110 | | | |
| |
| |
| | | | | | | | | | | | | | | |
| | | | | | | | | | | | | | | |
| |
| Income (Loss) From Operations |
| |
Net investment income(2) | | $ | 0.291 | | | $ | 0.289 | | | $ | 0.210 | | | |
| Net realized and unrealized gain (loss) | | | (0.412 | ) | | | (0.282 | ) | | | 0.089 | | | |
| |
| |
Total income (loss) from operations | | $ | (0.121 | ) | | $ | 0.007 | | | $ | 0.299 | | | |
| |
| |
| | | | | | | | | | | | | | | |
| | | | | | | | | | | | | | | |
| |
| Less Distributions |
| |
| From net investment income | | $ | (0.299 | ) | | $ | (0.307 | ) | | $ | (0.199 | ) | | |
| |
| |
Total distributions | | $ | (0.299 | ) | | $ | (0.307 | ) | | $ | (0.199 | ) | | |
| |
| |
| | | | | | | | | | | | | | | |
Net asset value — End of period | | $ | 9.490 | | | $ | 9.910 | | | $ | 10.210 | | | |
| |
| |
| | | | | | | | | | | | | | | |
Total Return(3) | | | (1.24 | )% | | | 0.08 | % | | | 2.84 | %(7) | | |
| |
| |
| | | | | | | | | | | | | | | |
| | | | | | | | | | | | | | | |
| |
| Ratios/Supplemental Data |
| |
| Net assets, end of period (000’s omitted) | | $ | 519 | | | $ | 144 | | | $ | 1 | | | |
| Ratios (As a percentage of average daily net assets): | | | | | | | | | | | | | | |
| Expenses excluding interest and fees | | | 1.64 | % | | | 1.64 | % | | | 1.63 | %(4) | | |
Interest and fee expense(5) | | | — | | | | 0.02 | % | | | — | | | |
| Expenses before custodian fee reduction | | | 1.64 | % | | | 1.66 | % | | | 1.63 | %(4) | | |
| Expenses after custodian fee reduction | | | 1.62 | % | | | 1.61 | % | | | 1.62 | %(4) | | |
| Net investment income | | | 3.03 | % | | | 2.87 | % | | | 3.09 | %(4) | | |
| Portfolio Turnover | | | 23 | % | | | 12 | % | | | 18 | %(6) | | |
| |
| |
| | |
| (1) | | For the period from the commencement of offering of Class C shares, August 1, 2006, to March 31, 2007. |
| |
| (2) | | Computed using average shares outstanding. |
| |
| (3) | | Returns are historical and are calculated by determining the percentage change in net asset value with all distributions reinvested and do not reflect the effect of sales charges. |
| |
| (4) | | Annualized. |
| |
| (5) | | Interest and fee expense relates to the liability for floating rate notes issued in conjunction with inverse floater securities transactions (see Note 1I). |
| |
| (6) | | For the Fund’s year ended March 31, 2007. |
| |
| (7) | | Not annualized. |
See notes to financial statements53
Eaton Vance Limited Maturity Municipals Funds as of March 31, 2009
FINANCIAL STATEMENTS CONT’D
Financial Highlights
| | | | | | | | | | | | | | | | | | | | | | | |
| | | New York Limited Fund — Class A |
| | | |
| | | Year Ended March 31, |
| | | |
| | | 2009 | | | 2008 | | | 2007 | | | 2006 | | | 2005 | | | |
| |
| Net asset value — Beginning of year | | $ | 10.200 | | | $ | 10.600 | | | $ | 10.480 | | | $ | 10.540 | | | $ | 10.850 | | | |
| |
| |
| | | | | | | | | | | | | | | | | | | | | | | |
| | | | | | | | | | | | | | | | | | | | | | | |
| |
| Income (Loss) From Operations |
| |
Net investment income(1) | | $ | 0.387 | | | $ | 0.402 | | | $ | 0.395 | | | $ | 0.388 | | | $ | 0.394 | | | |
| Net realized and unrealized gain (loss) | | | (0.642 | ) | | | (0.405 | ) | | | 0.118 | | | | (0.059 | ) | | | (0.315 | ) | | |
| |
| |
Total income (loss) from operations | | $ | (0.255 | ) | | $ | (0.003 | ) | | $ | 0.513 | | | $ | 0.329 | | | $ | 0.079 | | | |
| |
| |
| | | | | | | | | | | | | | | | | | | | | | | |
| | | | | | | | | | | | | | | | | | | | | | | |
| |
| Less Distributions |
| |
| From net investment income | | $ | (0.395 | ) | | $ | (0.397 | ) | | $ | (0.393 | ) | | $ | (0.389 | ) | | $ | (0.389 | ) | | |
| |
| |
Total distributions | | $ | (0.395 | ) | | $ | (0.397 | ) | | $ | (0.393 | ) | | $ | (0.389 | ) | | $ | (0.389 | ) | | |
| |
| |
| | | | | | | | | | | | | | | | | | | | | | | |
Net asset value — End of year | | $ | 9.550 | | | $ | 10.200 | | | $ | 10.600 | | | $ | 10.480 | | | $ | 10.540 | | | |
| |
| |
| | | | | | | | | | | | | | | | | | | | | | | |
Total Return(2) | | | (2.56 | )% | | | (0.03 | )% | | | 4.97 | % | | | 3.15 | % | | | 0.73 | % | | |
| |
| |
| | | | | | | | | | | | | | | | | | | | | | | |
| | | | | | | | | | | | | | | | | | | | | | | |
| |
| Ratios/Supplemental Data |
| |
| Net assets, end of year (000’s omitted) | | $ | 63,159 | | | $ | 71,401 | | | $ | 72,201 | | | $ | 59,546 | | | $ | 62,843 | | | |
| Ratios (As a percentage of average daily net assets): | | | | | | | | | | | | | | | | | | | | | | |
| Expenses excluding interest and fees | | | 0.80 | % | | | 0.82 | % | | | 0.82 | % | | | 0.82 | % | | | 0.80 | %(3) | | |
Interest and fee expense(4) | | | — | | | | 0.01 | % | | | 0.02 | % | | | — | | | | — | | | |
| Expenses before custodian fee reduction | | | 0.80 | % | | | 0.83 | % | | | 0.84 | % | | | 0.82 | % | | | 0.80 | %(3) | | |
| Expenses after custodian fee reduction | | | 0.79 | % | | | 0.81 | % | | | 0.81 | % | | | 0.81 | % | | | 0.80 | %(3) | | |
| Net investment income | | | 3.92 | % | | | 3.85 | % | | | 3.73 | % | | | 3.67 | % | | | 3.69 | % | | |
| Portfolio Turnover of the Portfolio | | | — | | | | — | | | | — | | | | — | | | | 7 | %(5) | | |
| Portfolio Turnover of the Fund | | | 22 | % | | | 14 | % | | | 22 | % | | | 22 | % | | | 12 | % | | |
| |
| |
| | |
| (1) | | Computed using average shares outstanding. |
| |
| (2) | | Returns are historical and are calculated by determining the percentage change in net asset value with all distributions reinvested and do not reflect the effect of sales charges. |
| |
| (3) | | Includes the Fund’s share of the corresponding Portfolio’s allocated expenses while the Fund was making investments directly into the Portfolio. |
| |
| (4) | | Interest and fee expense relates to the liability for floating rate notes issued in conjunction with inverse floater securities transactions (see Note 1I). |
| |
| (5) | | Portfolio turnover represents the rate of portfolio activity for the period while the Fund was making investments directly into the Portfolio. |
See notes to financial statements54
Eaton Vance Limited Maturity Municipals Funds as of March 31, 2009
FINANCIAL STATEMENTS CONT’D
Financial Highlights
| | | | | | | | | | | | | | | | | | | | | | | |
| | | New York Limited Fund — Class B |
| | | |
| | | Year Ended March 31, |
| | | |
| | | 2009 | | | 2008 | | | 2007 | | | 2006 | | | 2005 | | | |
| |
| Net asset value — Beginning of year | | $ | 10.190 | | | $ | 10.590 | | | $ | 10.470 | | | $ | 10.530 | | | $ | 10.840 | | | |
| |
| |
| | | | | | | | | | | | | | | | | | | | | | | |
| | | | | | | | | | | | | | | | | | | | | | | |
| |
| Income (Loss) From Operations |
| |
Net investment income(1) | | $ | 0.312 | | | $ | 0.324 | | | $ | 0.317 | | | $ | 0.308 | | | $ | 0.314 | | | |
| Net realized and unrealized gain (loss) | | | (0.643 | ) | | | (0.406 | ) | | | 0.117 | | | | (0.061 | ) | | | (0.317 | ) | | |
| |
| |
Total income (loss) from operations | | $ | (0.331 | ) | | $ | (0.082 | ) | | $ | 0.434 | | | $ | 0.247 | | | $ | (0.003 | ) | | |
| |
| |
| | | | | | | | | | | | | | | | | | | | | | | |
| | | | | | | | | | | | | | | | | | | | | | | |
| |
| Less Distributions |
| |
| From net investment income | | $ | (0.319 | ) | | $ | (0.318 | ) | | $ | (0.314 | ) | | $ | (0.307 | ) | | $ | (0.307 | ) | | |
| |
| |
Total distributions | | $ | (0.319 | ) | | $ | (0.318 | ) | | $ | (0.314 | ) | | $ | (0.307 | ) | | $ | (0.307 | ) | | |
| |
| |
| | | | | | | | | | | | | | | | | | | | | | | |
Net asset value — End of year | | $ | 9.540 | | | $ | 10.190 | | | $ | 10.590 | | | $ | 10.470 | | | $ | 10.530 | | | |
| |
| |
| | | | | | | | | | | | | | | | | | | | | | | |
Total Return(2) | | | (3.31 | )% | | | (0.79 | )% | | | 4.19 | % | | | 2.36 | % | | | (0.03 | )% | | |
| |
| |
| | | | | | | | | | | | | | | | | | | | | | | |
| | | | | | | | | | | | | | | | | | | | | | | |
| |
| Ratios/Supplemental Data |
| |
| Net assets, end of year (000’s omitted) | | $ | 1,976 | | | $ | 2,017 | | | $ | 4,457 | | | $ | 8,978 | | | $ | 12,518 | | | |
| Ratios (As a percentage of average daily net assets): | | | | | | | | | | | | | | | | | | | | | | |
| Expenses excluding interest and fees | | | 1.55 | % | | | 1.57 | % | | | 1.56 | % | | | 1.57 | % | | | 1.55 | %(3) | | |
Interest and fee expense(4) | | | — | | | | 0.01 | % | | | 0.02 | % | | | — | | | | — | | | |
| Expenses before custodian fee reduction | | | 1.55 | % | | | 1.58 | % | | | 1.58 | % | | | 1.57 | % | | | 1.55 | %(3) | | |
| Expenses after custodian fee reduction | | | 1.54 | % | | | 1.56 | % | | | 1.57 | % | | | 1.56 | % | | | 1.55 | %(3) | | |
| Net investment income | | | 3.17 | % | | | 3.10 | % | | | 3.00 | % | | | 2.92 | % | | | 2.94 | % | | |
| Portfolio Turnover of the Portfolio | | | — | | | | — | | | | — | | | | — | | | | 7 | %(5) | | |
| Portfolio Turnover of the Fund | | | 22 | % | | | 14 | % | | | 22 | % | | | 22 | % | | | 12 | % | | |
| |
| |
| | |
| (1) | | Computed using average shares outstanding. |
| |
| (2) | | Returns are historical and are calculated by determining the percentage change in net asset value with all distributions reinvested and do not reflect the effect of sales charges. |
| |
| (3) | | Includes the Fund’s share of the corresponding Portfolio’s allocated expenses while the Fund was making investments directly into the Portfolio. |
| |
| (4) | | Interest and fee expense relates to the liability for floating rate notes issued in conjunction with inverse floater securities transactions (see Note 1I). |
| |
| (5) | | Portfolio turnover represents the rate of portfolio activity for the period while the Fund was making investments directly into the Portfolio. |
See notes to financial statements55
Eaton Vance Limited Maturity Municipals Funds as of March 31, 2009
FINANCIAL STATEMENTS CONT’D
Financial Highlights
| | | | | | | | | | | | | | | | | | | | | | | |
| | | New York Limited Fund — Class C |
| | | |
| | | Year Ended March 31, |
| | | |
| | | 2009 | | | 2008 | | | 2007 | | | 2006 | | | 2005 | | | |
| |
| Net asset value — Beginning of year | | $ | 9.690 | | | $ | 10.070 | | | $ | 9.960 | | | $ | 10.020 | | | $ | 10.310 | | | |
| |
| |
| | | | | | | | | | | | | | | | | | | | | | | |
| | | | | | | | | | | | | | | | | | | | | | | |
| |
| Income (Loss) From Operations |
| |
Net investment income(1) | | $ | 0.297 | | | $ | 0.308 | | | $ | 0.301 | | | $ | 0.294 | | | $ | 0.299 | | | |
| Net realized and unrealized gain (loss) | | | (0.603 | ) | | | (0.385 | ) | | | 0.107 | | | | (0.062 | ) | | | (0.299 | ) | | |
| |
| |
Total income (loss) from operations | | $ | (0.306 | ) | | $ | (0.077 | ) | | $ | 0.408 | | | $ | 0.232 | | | $ | — | | | |
| |
| |
| | | | | | | | | | | | | | | | | | | | | | | |
| | | | | | | | | | | | | | | | | | | | | | | |
| |
| Less Distributions |
| |
| From net investment income | | $ | (0.304 | ) | | $ | (0.303 | ) | | $ | (0.298 | ) | | $ | (0.292 | ) | | $ | (0.290 | ) | | |
| |
| |
Total distributions | | $ | (0.304 | ) | | $ | (0.303 | ) | | $ | (0.298 | ) | | $ | (0.292 | ) | | $ | (0.290 | ) | | |
| |
| |
| | | | | | | | | | | | | | | | | | | | | | | |
Net asset value — End of year | | $ | 9.080 | | | $ | 9.690 | | | $ | 10.070 | | | $ | 9.960 | | | $ | 10.020 | | | |
| |
| |
| | | | | | | | | | | | | | | | | | | | | | | |
Total Return(2) | | | (3.22 | )% | | | (0.78 | )% | | | 4.14 | % | | | 2.32 | % | | | (0.07 | )%(3) | | |
| |
| |
| | | | | | | | | | | | | | | | | | | | | | | |
| | | | | | | | | | | | | | | | | | | | | | | |
| |
| Ratios/Supplemental Data |
| |
| Net assets, end of year (000’s omitted) | | $ | 22,780 | | | $ | 23,844 | | | $ | 22,155 | | | $ | 26,477 | | | $ | 36,837 | | | |
| Ratios (As a percentage of average daily net assets): | | | | | | | | | | | | | | | | | | | | | | |
| Expenses excluding interest and fees | | | 1.55 | % | | | 1.57 | % | | | 1.56 | % | | | 1.57 | % | | | 1.55 | %(4) | | |
Interest and fee expense(5) | | | — | | | | 0.01 | % | | | 0.02 | % | | | — | | | | — | | | |
| Expenses before custodian fee reduction | | | 1.55 | % | | | 1.58 | % | | | 1.58 | % | | | 1.57 | % | | | 1.55 | %(4) | | |
| Expenses after custodian fee reduction | | | 1.55 | % | | | 1.56 | % | | | 1.57 | % | | | 1.56 | % | | | 1.55 | %(4) | | |
| Net investment income | | | 3.17 | % | | | 3.10 | % | | | 3.00 | % | | | 2.92 | % | | | 2.94 | % | | |
| Portfolio Turnover of the Portfolio | | | — | | | | — | | | | — | | | | — | | | | 7 | %(6) | | |
| Portfolio Turnover of the Fund | | | 22 | % | | | 14 | % | | | 22 | % | | | 22 | % | | | 12 | % | | |
| |
| |
| | |
| (1) | | Computed using average shares outstanding. |
| |
| (2) | | Returns are historical and are calculated by determining the percentage change in net asset value with all distributions reinvested and do not reflect the effect of sales charges. |
| |
| (3) | | Total return reflects a decrease of 0.06% due to a change in the timing of the payment and reinvestment of distributions. |
| |
| (4) | | Includes the Fund’s share of the corresponding Portfolio’s allocated expenses while the Fund was making investments directly into the Portfolio. |
| |
| (5) | | Interest and fee expense relates to the liability for floating rate notes issued in conjunction with inverse floater securities transactions (see Note 1I). |
| |
| (6) | | Portfolio turnover represents the rate of portfolio activity for the period while the Fund was making investments directly into the Portfolio. |
See notes to financial statements56
Eaton Vance Limited Maturity Municipals Funds as of March 31, 2009
FINANCIAL STATEMENTS CONT’D
Financial Highlights
| | | | | | | | | | | | | | | | | | | | | | | |
| | | Ohio Limited Fund — Class A |
| | | |
| | | Year Ended March 31, |
| | | |
| | | 2009 | | | 2008 | | | 2007 | | | 2006 | | | 2005 | | | |
| |
| Net asset value — Beginning of year | | $ | 9.420 | | | $ | 9.680 | | | $ | 9.620 | | | $ | 9.740 | | | $ | 10.020 | | | |
| |
| |
| | | | | | | | | | | | | | | | | | | | | | | |
| | | | | | | | | | | | | | | | | | | | | | | |
| |
| Income (Loss) From Operations |
| |
Net investment income(1) | | $ | 0.327 | | | $ | 0.350 | | | $ | 0.349 | | | $ | 0.346 | | | $ | 0.363 | | | |
| Net realized and unrealized gain (loss) | | | (0.199 | ) | | | (0.259 | ) | | | 0.061 | | | | (0.104 | ) | | | (0.293 | ) | | |
| |
| |
Total income from operations | | $ | 0.128 | | | $ | 0.091 | | | $ | 0.410 | | | $ | 0.242 | | | $ | 0.070 | | | |
| |
| |
| | | | | | | | | | | | | | | | | | | | | | | |
| | | | | | | | | | | | | | | | | | | | | | | |
| |
| Less Distributions |
| |
| From net investment income | | $ | (0.348 | ) | | $ | (0.351 | ) | | $ | (0.350 | ) | | $ | (0.362 | ) | | $ | (0.350 | ) | | |
| |
| |
Total distributions | | $ | (0.348 | ) | | $ | (0.351 | ) | | $ | (0.350 | ) | | $ | (0.362 | ) | | $ | (0.350 | ) | | |
| |
| |
| | | | | | | | | | | | | | | | | | | | | | | |
Net asset value — End of year | | $ | 9.20 | | | $ | 9.420 | | | $ | 9.680 | | | $ | 9.620 | | | $ | 9.740 | | | |
| |
| |
| | | | | | | | | | | | | | | | | | | | | | | |
Total Return(2) | | | 1.26 | % | | | 0.96 | % | | | 4.33 | % | | | 2.50 | % | | | 0.70 | % | | |
| |
| |
| | | | | | | | | | | | | | | | | | | | | | | |
| | | | | | | | | | | | | | | | | | | | | | | |
| |
| Ratios/Supplemental Data |
| |
| Net assets, end of year (000’s omitted) | | $ | 18,307 | | | $ | 19,394 | | | $ | 19,144 | | | $ | 17,286 | | | $ | 16,783 | | | |
| Ratios (As a percentage of average daily net assets): | | | | | | | | | | | | | | | | | | | | | | |
| Expenses before custodian fee reduction | | | 1.09 | % | | | 1.02 | % | | | 1.03 | % | | | 1.04 | % | | | 1.05 | %(3) | | |
| Expenses after custodian fee reduction | | | 1.07 | % | | | 1.00 | % | | | 0.99 | % | | | 1.02 | % | | | 1.04 | %(3) | | |
| Net investment income | | | 3.52 | % | | | 3.65 | % | | | 3.60 | % | | | 3.55 | % | | | 3.68 | % | | |
| Portfolio Turnover of the Portfolio | | | — | | | | — | | | | — | | | | — | | | | 6 | %(4) | | |
| Portfolio Turnover of the Fund | | | 9 | % | | | 13 | % | | | 10 | % | | | 13 | % | | | 7 | % | | |
| |
| |
| | |
| (1) | | Computed using average shares outstanding. |
| |
| (2) | | Returns are historical and are calculated by determining the percentage change in net asset value with all distributions reinvested and do not reflect the effect of sales charges. |
| |
| (3) | | Includes the Fund’s share of the corresponding Portfolio’s allocated expenses while the Fund was making investments directly into the Portfolio. |
| |
| (4) | | Portfolio turnover represents the rate of portfolio activity for the period while the Fund was making investments directly into the Portfolio. |
See notes to financial statements57
Eaton Vance Limited Maturity Municipals Funds as of March 31, 2009
FINANCIAL STATEMENTS CONT’D
Financial Highlights
| | | | | | | | | | | | | | | | | | | | | | | |
| | | Ohio Limited Fund — Class B |
| | | |
| | | Year Ended March 31, |
| | | |
| | | 2009 | | | 2008 | | | 2007 | | | 2006 | | | 2005 | | | |
| |
| Net asset value — Beginning of year | | $ | 9.410 | | | $ | 9.670 | | | $ | 9.610 | | | $ | 9.730 | | | $ | 10.010 | | | |
| |
| |
| | | | | | | | | | | | | | | | | | | | | | | |
| | | | | | | | | | | | | | | | | | | | | | | |
| |
| Income (Loss) From Operations |
| |
Net investment income(1) | | $ | 0.256 | | | $ | 0.280 | | | $ | 0.278 | | | $ | 0.274 | | | $ | 0.289 | | | |
| Net realized and unrealized gain (loss) | | | (0.210 | ) | | | (0.262 | ) | | | 0.059 | | | | (0.109 | ) | | | (0.294 | ) | | |
| |
| |
Total income (loss) from operations | | $ | 0.046 | | | $ | 0.018 | | | $ | 0.337 | | | $ | 0.165 | | | $ | (0.005 | ) | | |
| |
| |
| | | | | | | | | | | | | | | | | | | | | | | |
| | | | | | | | | | | | | | | | | | | | | | | |
| |
| Less Distributions |
| |
| From net investment income | | $ | (0.276 | ) | | $ | (0.278 | ) | | $ | (0.277 | ) | | $ | (0.285 | ) | | $ | (0.275 | ) | | |
| |
| |
Total distributions | | $ | (0.276 | ) | | $ | (0.278 | ) | | $ | (0.277 | ) | | $ | (0.285 | ) | | $ | (0.275 | ) | | |
| |
| |
| | | | | | | | | | | | | | | | | | | | | | | |
Net asset value — End of year | | $ | 9.180 | | | $ | 9.410 | | | $ | 9.670 | | | $ | 9.610 | | | $ | 9.730 | | | |
| |
| |
| | | | | | | | | | | | | | | | | | | | | | | |
Total Return(2) | | | 0.39 | % | | | 0.19 | % | | | 3.56 | % | | | 1.73 | % | | | (0.05 | )% | | |
| |
| |
| | | | | | | | | | | | | | | | | | | | | | | |
| | | | | | | | | | | | | | | | | | | | | | | |
| |
| Ratios/Supplemental Data |
| |
| Net assets, end of year (000’s omitted) | | $ | 187 | | | $ | 111 | | | $ | 438 | | | $ | 880 | | | $ | 2,159 | | | |
| Ratios (As a percentage of average daily net assets): | | | | | | | | | | | | | | | | | | | | | | |
| Expenses before custodian fee reduction | | | 1.84 | % | | | 1.77 | % | | | 1.78 | % | | | 1.79 | % | | | 1.80 | %(3) | | |
| Expenses after custodian fee reduction | | | 1.82 | % | | | 1.75 | % | | | 1.74 | % | | | 1.77 | % | | | 1.79 | %(3) | | |
| Net investment income | | | 2.77 | % | | | 2.92 | % | | | 2.88 | % | | | 2.81 | % | | | 2.94 | % | | |
| Portfolio Turnover of the Portfolio | | | — | | | | — | | | | — | | | | — | | | | 6 | %(4) | | |
| Portfolio Turnover of the Fund | | | 9 | % | | | 13 | % | | | 10 | % | | | 13 | % | | | 7 | % | | |
| |
| |
| | |
| (1) | | Computed using average shares outstanding. |
| |
| (2) | | Returns are historical and are calculated by determining the percentage change in net asset value with all distributions reinvested and do not reflect the effect of sales charges. |
| |
| (3) | | Includes the Fund’s share of the corresponding Portfolio’s allocated expenses while the Fund was making investments directly into the Portfolio. |
| |
| (4) | | Portfolio turnover represents the rate of portfolio activity for the period while the Fund was making investments directly into the Portfolio. |
See notes to financial statements58
Eaton Vance Limited Maturity Municipals Funds as of March 31, 2009
FINANCIAL STATEMENTS CONT’D
Financial Highlights
| | | | | | | | | | | | | | | |
| | | Ohio Limited Fund — Class C |
| | | |
| | | Year Ended March 31, | | | | | | |
| | | | | | Period Ended
| | | |
| | | 2009 | | | 2008 | | | March 31, 2007(1) | | | |
| |
| Net asset value — Beginning of period | | $ | 9.400 | | | $ | 9.670 | | | $ | 9.600 | | | |
| |
| |
| | | | | | | | | | | | | | | |
| | | | | | | | | | | | | | | |
| |
| Income (Loss) From Operations |
| |
Net investment income(2) | | $ | 0.254 | | | $ | 0.274 | | | $ | 0.182 | | | |
| Net realized and unrealized gain (loss) | | | (0.218 | ) | | | (0.266 | ) | | | 0.072 | | | |
| |
| |
Total income from operations | | $ | 0.036 | | | $ | 0.008 | | | $ | 0.254 | | | |
| |
| |
| | | | | | | | | | | | | | | |
| | | | | | | | | | | | | | | |
| |
| Less Distributions |
| |
| From net investment income | | $ | (0.276 | ) | | $ | (0.278 | ) | | $ | (0.184 | ) | | |
| |
| |
Total distributions | | $ | (0.276 | ) | | $ | (0.278 | ) | | $ | (0.184 | ) | | |
| |
| |
| | | | | | | | | | | | | | | |
Net asset value — End of period | | $ | 9.160 | | | $ | 9.400 | | | $ | 9.670 | | | |
| |
| |
| | | | | | | | | | | | | | | |
Total Return(3) | | | 0.39 | % | | | 0.08 | % | | | 2.53 | %(6) | | |
| |
| |
| | | | | | | | | | | | | | | |
| | | | | | | | | | | | | | | |
| |
| Ratios/Supplemental Data |
| |
| Net assets, end of period (000’s omitted) | | $ | 672 | | | $ | 131 | | | $ | 1 | | | |
| Ratios (As a percentage of average daily net assets): | | | | | | | | | | | | | | |
| Expenses before custodian fee reduction | | | 1.83 | % | | | 1.77 | % | | | 1.78 | %(4) | | |
| Expenses after custodian fee reduction | | | 1.83 | % | | | 1.75 | % | | | 1.74 | %(4) | | |
| Net investment income | | | 2.77 | % | | | 2.88 | % | | | 2.81 | %(4) | | |
| Portfolio Turnover | | | 9 | % | | | 13 | % | | | 10 | %(5) | | |
| |
| |
| | |
| (1) | | For the period from the commencement of offering of Class C shares, August 1, 2006, to March 31, 2007. |
| |
| (2) | | Computed using average shares outstanding. |
| |
| (3) | | Returns are historical and are calculated by determining the percentage change in net asset value with all distributions reinvested and do not reflect the effect of sales charges. |
| |
| (4) | | Annualized. |
| |
| (5) | | For the Fund’s year ended March 31, 2007. |
| |
| (6) | | Not annualized. |
See notes to financial statements59
Eaton Vance Limited Maturity Municipals Funds as of March 31, 2009
FINANCIAL STATEMENTS CONT’D
Financial Highlights
| | | | | | | | | | | | | | | | | | | | | | | |
| | | Pennsylvania Limited Fund — Class A |
| | | |
| | | Year Ended March 31, |
| | | |
| | | 2009 | | | 2008 | | | 2007 | | | 2006 | | | 2005 | | | |
| |
| Net asset value — Beginning of year | | $ | 10.030 | | | $ | 10.360 | | | $ | 10.270 | | | $ | 10.280 | | | $ | 10.550 | | | |
| |
| |
| | | | | | | | | | | | | | | | | | | | | | | |
| | | | | | | | | | | | | | | | | | | | | | | |
| |
| Income (Loss) From Operations |
| |
Net investment income(1) | | $ | 0.393 | | | $ | 0.393 | | | $ | 0.396 | | | $ | 0.394 | | | $ | 0.402 | | | |
| Net realized and unrealized gain (loss) | | | (0.313 | ) | | | (0.327 | ) | | | 0.087 | | | | (0.004 | ) | | | (0.272 | ) | | |
| |
| |
Total income from operations | | $ | 0.080 | | | $ | 0.066 | | | $ | 0.483 | | | $ | 0.390 | | | $ | 0.130 | | | |
| |
| |
| | | | | | | | | | | | | | | | | | | | | | | |
| | | | | | | | | | | | | | | | | | | | | | | |
| |
| Less Distributions |
| |
| From net investment income | | $ | (0.390 | ) | | $ | (0.396 | ) | | $ | (0.393 | ) | | $ | (0.400 | ) | | $ | (0.400 | ) | | |
| |
| |
Total distributions | | $ | (0.390 | ) | | $ | (0.396 | ) | | $ | (0.393 | ) | | $ | (0.400 | ) | | $ | (0.400 | ) | | |
| |
| |
| | | | | | | | | | | | | | | | | | | | | | | |
Net asset value — End of year | | $ | 9.720 | | | $ | 10.030 | | | $ | 10.360 | | | $ | 10.270 | | | $ | 10.280 | | | |
| |
| |
| | | | | | | | | | | | | | | | | | | | | | | |
Total Return(2) | | | 0.83 | % | | | 0.64 | % | | | 4.78 | % | | | 3.84 | % | | | 1.25 | % | | |
| |
| |
| | | | | | | | | | | | | | | | | | | | | | | |
| | | | | | | | | | | | | | | | | | | | | | | |
| |
| Ratios/Supplemental Data |
| |
| Net assets, end of year (000’s omitted) | | $ | 36,461 | | | $ | 39,272 | | | $ | 33,998 | | | $ | 34,592 | | | $ | 33,611 | | | |
| Ratios (As a percentage of average daily net assets): | | | | | | | | | | | | | | | | | | | | | | |
| Expenses before custodian fee reduction | | | 0.87 | % | | | 0.88 | % | | | 0.88 | % | | | 0.87 | % | | | 0.88 | %(3) | | |
| Expenses after custodian fee reduction | | | 0.86 | % | | | 0.85 | % | | | 0.86 | % | | | 0.85 | % | | | 0.87 | %(3) | | |
| Net investment income | | | 4.00 | % | | | 3.84 | % | | | 3.83 | % | | | 3.82 | % | | | 3.86 | % | | |
| Portfolio Turnover of the Portfolio | | | — | | | | — | | | | — | | | | — | | | | 0 | %(4) | | |
| Portfolio Turnover of the Fund | | | 19 | % | | | 12 | % | | | 11 | % | | | 22 | % | | | 6 | % | | |
| |
| |
| | |
| (1) | | Computed using average shares outstanding. |
| |
| (2) | | Returns are historical and are calculated by determining the percentage change in net asset value with all distributions reinvested and do not reflect the effect of sales charges. |
| |
| (3) | | Includes the Fund’s share of the corresponding Portfolio’s allocated expenses while the Fund was making investments directly into the Portfolio. |
| |
| (4) | | Portfolio turnover represents the rate of portfolio activity for the period while the Fund was making investments directly into the Portfolio. |
See notes to financial statements60
Eaton Vance Limited Maturity Municipals Funds as of March 31, 2009
FINANCIAL STATEMENTS CONT’D
Financial Highlights
| | | | | | | | | | | | | | | | | | | | | | | |
| | | Pennsylvania Limited Fund — Class B |
| | | |
| | | Year Ended March 31, |
| | | |
| | | 2009 | | | 2008 | | | 2007 | | | 2006 | | | 2005 | | | |
| |
| Net asset value — Beginning of year | | $ | 10.030 | | | $ | 10.360 | | | $ | 10.270 | | | $ | 10.280 | | | $ | 10.550 | | | |
| |
| |
| | | | | | | | | | | | | | | | | | | | | | | |
| | | | | | | | | | | | | | | | | | | | | | | |
| |
| Income (Loss) From Operations |
| |
Net investment income(1) | | $ | 0.319 | | | $ | 0.318 | | | $ | 0.319 | | | $ | 0.317 | | | $ | 0.323 | | | |
| Net realized and unrealized gain (loss) | | | (0.314 | ) | | | (0.329 | ) | | | 0.087 | | | | (0.005 | ) | | | (0.273 | ) | | |
| |
| |
Total income (loss) from operations | | $ | 0.005 | | | $ | (0.011 | ) | | $ | 0.406 | | | $ | 0.312 | | | $ | 0.050 | | | |
| |
| |
| | | | | | | | | | | | | | | | | | | | | | | |
| | | | | | | | | | | | | | | | | | | | | | | |
| |
| Less Distributions |
| |
| From net investment income | | $ | (0.315 | ) | | $ | (0.319 | ) | | $ | (0.316 | ) | | $ | (0.322 | ) | | $ | (0.320 | ) | | |
| |
| |
Total distributions | | $ | (0.315 | ) | | $ | (0.319 | ) | | $ | (0.316 | ) | | $ | (0.322 | ) | | $ | (0.320 | ) | | |
| |
| |
| | | | | | | | | | | | | | | | | | | | | | | |
Net asset value — End of year | | $ | 9.720 | | | $ | 10.030 | | | $ | 10.360 | | | $ | 10.270 | | | $ | 10.280 | | | |
| |
| |
| | | | | | | | | | | | | | | | | | | | | | | |
Total Return(2) | | | 0.06 | % | | | (0.11 | )% | | | 4.01 | % | | | 3.06 | % | | | 0.48 | % | | |
| |
| |
| | | | | | | | | | | | | | | | | | | | | | | |
| | | | | | | | | | | | | | | | | | | | | | | |
| |
| Ratios/Supplemental Data |
| |
| Net assets, end of year (000’s omitted) | | $ | 550 | | | $ | 1,159 | | | $ | 3,714 | | | $ | 6,962 | | | $ | 8,957 | | | |
| Ratios (As a percentage of average daily net assets): | | | | | | | | | | | | | | | | | | | | | | |
| Expenses before custodian fee reduction | | | 1.62 | % | | | 1.63 | % | | | 1.63 | % | | | 1.62 | % | | | 1.63 | %(3) | | |
| Expenses after custodian fee reduction | | | 1.61 | % | | | 1.60 | % | | | 1.61 | % | | | 1.60 | % | | | 1.62 | %(3) | | |
| Net investment income | | | 3.25 | % | | | 3.10 | % | | | 3.08 | % | | | 3.07 | % | | | 3.11 | % | | |
| Portfolio Turnover of the Portfolio | | | — | | | | — | | | | — | | | | — | | | | 0 | %(4) | | |
| Portfolio Turnover of the Fund | | | 19 | % | | | 12 | % | | | 11 | % | | | 22 | % | | | 6 | % | | |
| |
| |
| | |
| (1) | | Computed using average shares outstanding. |
| |
| (2) | | Returns are historical and are calculated by determining the percentage change in net asset value with all distributions reinvested and do not reflect the effect of sales charges. |
| |
| (3) | | Includes the Fund’s share of the corresponding Portfolio’s allocated expenses while the Fund was making investments directly into the Portfolio. |
| |
| (4) | | Portfolio turnover represents the rate of portfolio activity for the period while the Fund was making investments directly into the Portfolio. |
See notes to financial statements61
Eaton Vance Limited Maturity Municipals Funds as of March 31, 2009
FINANCIAL STATEMENTS CONT’D
Financial Highlights
| | | | | | | | | | | | | | | | | | | | | | | |
| | | Pennsylvania Limited Fund — Class C |
| | | |
| | | Year Ended March 31, |
| | | |
| | | 2009 | | | 2008 | | | 2007 | | | 2006 | | | 2005 | | | |
| |
| Net asset value — Beginning of year | | $ | 9.510 | | | $ | 9.820 | | | $ | 9.740 | | | $ | 9.750 | | | $ | 10.000 | | | |
| |
| |
| | | | | | | | | | | | | | | | | | | | | | | |
| | | | | | | | | | | | | | | | | | | | | | | |
| |
| Income (Loss) From Operations |
| |
Net investment income(1) | | $ | 0.303 | | | $ | 0.301 | | | $ | 0.302 | | | $ | 0.300 | | | $ | 0.307 | | | |
| Net realized and unrealized gain (loss) | | | (0.304 | ) | | | (0.308 | ) | | | 0.078 | | | | (0.006 | ) | | | (0.257 | ) | | |
| |
| |
Total income (loss) from operations | | $ | (0.001 | ) | | $ | (0.007 | ) | | $ | 0.380 | | | $ | 0.294 | | | $ | 0.050 | | | |
| |
| |
| | | | | | | | | | | | | | | | | | | | | | | |
| | | | | | | | | | | | | | | | | | | | | | | |
| |
| Less Distributions |
| |
| From net investment income | | $ | (0.299 | ) | | $ | (0.303 | ) | | $ | (0.300 | ) | | $ | (0.304 | ) | | $ | (0.300 | ) | | |
| |
| |
Total distributions | | $ | (0.299 | ) | | $ | (0.303 | ) | | $ | (0.300 | ) | | $ | (0.304 | ) | | $ | (0.300 | ) | | |
| |
| |
| | | | | | | | | | | | | | | | | | | | | | | |
Net asset value — End of year | | $ | 9.210 | | | $ | 9.510 | | | $ | 9.820 | | | $ | 9.740 | | | $ | 9.750 | | | |
| |
| |
| | | | | | | | | | | | | | | | | | | | | | | |
Total Return(2) | | | (0.01 | )% | | | (0.08 | )% | | | 3.95 | % | | | 3.05 | % | | | 0.44 | %(3) | | |
| |
| |
| | | | | | | | | | | | | | | | | | | | | | | |
| | | | | | | | | | | | | | | | | | | | | | | |
| |
| Ratios/Supplemental Data |
| |
| Net assets, end of year (000’s omitted) | | $ | 13,884 | | | $ | 13,427 | | | $ | 14,209 | | | $ | 15,894 | | | $ | 16,670 | | | |
| Ratios (As a percentage of average daily net assets): | | | | | | | | | | | | | | | | | | | | | | |
| Expenses before custodian fee reduction | | | 1.62 | % | | | 1.63 | % | | | 1.63 | % | | | 1.62 | % | | | 1.63 | %(4) | | |
| Expenses after custodian fee reduction | | | 1.61 | % | | | 1.60 | % | | | 1.61 | % | | | 1.60 | % | | | 1.62 | %(4) | | |
| Net investment income | | | 3.25 | % | | | 3.10 | % | | | 3.08 | % | | | 3.07 | % | | | 3.12 | % | | |
| Portfolio Turnover of the Portfolio | | | — | | | | — | | | | — | | | | — | | | | 0 | %(5) | | |
| Portfolio Turnover of the Fund | | | 19 | % | | | 12 | % | | | 11 | % | | | 22 | % | | | 6 | % | | |
| |
| |
| | |
| (1) | | Computed using average shares outstanding. |
| |
| (2) | | Returns are historical and are calculated by determining the percentage change in net asset value with all distributions reinvested and do not reflect the effect of sales charges. |
| |
| (3) | | Total return reflects a decrease of 0.06% due to a change in the timing of the payment and reinvestment of distributions. |
| |
| (4) | | Includes the Fund’s share of the corresponding Portfolio’s allocated expenses while the Fund was making investments directly into the Portfolio. |
| |
| (5) | | Portfolio turnover represents the rate of portfolio activity for the period while the Fund was making investments directly into the Portfolio. |
See notes to financial statements62
Eaton Vance Limited Maturity Municipals Funds as of March 31, 2009
NOTES TO FINANCIAL STATEMENTS
1 Significant Accounting Policies
Eaton Vance Investment Trust (the Trust) is a Massachusetts business trust registered under the Investment Company Act of 1940, as amended (the 1940 Act), as an open-end management investment company. The Trust presently consists of eight Funds, six of which, each non-diversified, are included in these financial statements. They include Eaton Vance California Limited Maturity Municipals Fund (California Limited Fund), Eaton Vance Massachusetts Limited Maturity Municipals Fund (Massachusetts Limited Fund), Eaton Vance New Jersey Limited Maturity Municipals Fund (New Jersey Limited Fund), Eaton Vance New York Limited Maturity Municipals Fund (New York Limited Fund), Eaton Vance Ohio Limited Maturity Municipals Fund (Ohio Limited Fund) and Eaton Vance Pennsylvania Limited Maturity Municipals Fund (Pennsylvania Limited Fund), (each individually referred to as the Fund, and collectively, the Funds). The Funds seek to provide a high level of current income exempt from regular federal income tax and from particular state or local income or other taxes, as applicable. The Funds also seek to provide limited principal fluctuation. The Funds offer three classes of shares. Class A shares are generally sold subject to a sales charge imposed at time of purchase. Class B and Class C shares are sold at net asset value and are generally subject to a contingent deferred sales charge (see Note 5). Class B shares of each Fund held for the longer of (i) four years or (ii) the time at which the contingent deferred sales charge applicable to such shares expires will automatically convert to Class A shares as described in each Fund’s prospectus. Each class represents a pro-rata interest in the Fund, but votes separately on class-specific matters and (as noted below) is subject to different expenses. Realized and unrealized gains and losses are allocated daily to each class of shares based on the relative net assets of each class to the total net assets of the Fund. Net investment income, other than class-specific expenses, is allocated daily to each class of shares based upon the ratio of the value of each class’s paid shares to the total value of all paid shares. Each class of shares differs in its distribution plan and certain other class-specific expenses.
The following is a summary of significant accounting policies of the Funds. The policies are in conformity with accounting principles generally accepted in the United States of America.
A Investment Valuation — Municipal bonds and taxable obligations, if any, are generally valued on the basis of valuations furnished by a pricing vendor, as derived from such vendor’s pricing models. Inputs to the models may include, but are not limited to, reported trades, executable bid and asked prices, broker/dealer quotations, benchmark curves or information pertaining to the issuer. The pricing vendor may use a matrix approach, which considers information regarding securities with similar characteristics to determine the valuation for a security. Financial futures contracts and options on financial futures contracts listed on commodity exchanges are valued based on the closing price on the primary exchange on which such contracts trade. Interest rate swaps are normally valued using valuations provided by a pricing vendor. Such vendor valuations are based on the present value of fixed and projected floating rate cash flows over the term of the swap contract. Future cash flows are discounted to their present value using swap curves provided by electronic data services or by broker/dealers. Short-term obligations, maturing in sixty days or less, are valued at amortized cost, which approximates market value. Investments for which valuations or market quotations are not readily available or are deemed unreliable are valued at fair value using methods determined in good faith by or at the direction of the Trustees of a Fund in a manner that most fairly reflects the security’s value, or the amount that the Fund might reasonably expect to receive for the security upon its current sale in the ordinary course. Each such determination is based on a consideration of all relevant factors, which are likely to vary from one pricing context to another. These factors may include, but are not limited to, the type of security, the existence of any contractual restrictions on the security’s disposition, the price and extent of public trading in similar securities of the issuer or of comparable companies, quotations or relevant information obtained from broker-dealers or other market participants, information obtained from the issuer, analysts, and/or the appropriate stock exchange (for exchange-traded securities), an analysis of the company’s financial condition, and an evaluation of the forces that influence the issuer and the market(s) in which the security is purchased and sold.
B Investment Transactions and Related Income — Investment transactions for financial statement purposes are accounted for on a trade date basis. Realized gains and losses on investments sold are determined on the basis of identified cost. Interest income is recorded on the basis of interest accrued, adjusted for amortization of premium or accretion of discount.
C Federal Taxes — Each Fund’s policy is to comply with the provisions of the Internal Revenue Code applicable to regulated investment companies and to distribute to shareholders each year substantially all of its taxable, if any, and tax-exempt net investment income, and all or substantially all of its net realized capital gains. Accordingly, no provision for federal income or excise tax is necessary. Each Fund intends to satisfy conditions which will enable it to designate distributions from the interest income generated by its investments in municipal obligations, which are exempt from regular federal income tax when received by each Fund, as exempt-interest
63
Eaton Vance Limited Maturity Municipals Funds as of March 31, 2009
NOTES TO FINANCIAL STATEMENTS CONT’D
dividends. The portion of such interest, if any, earned on private activity bonds issued after August 7, 1986, may be considered a tax preference item to shareholders.
At March 31, 2009, the following Funds, for federal income tax purposes, had capital loss carryforwards which will reduce the respective Fund’s taxable income arising from future net realized gains on investment transactions, if any, to the extent permitted by the Internal Revenue Code, and thus will reduce the amount of distributions to shareholders which would otherwise be necessary to relieve the Funds of any liability for federal income or excise tax. The amounts and expiration dates of the capital loss carryforwards are as follows:
| | | | | | | | | | | |
| Fund | | Amount | | | Expiration Date | | | |
| |
| California Limited | | $ | 46,725 | | | | March 31, 2011 | | | |
| | | | 13,351 | | | | March 31, 2012 | | | |
| | | | 384,970 | | | | March 31, 2013 | | | |
| | | | 176,040 | | | | March 31, 2015 | | | |
| | | | 146,189 | | | | March 31, 2016 | | | |
| | | | 461,024 | | | | March 31, 2017 | | | |
| Massachusetts Limited | | | 398,029 | | | | March 31, 2011 | | | |
| | | | 393,962 | | | | March 31, 2012 | | | |
| | | | 1,336,686 | | | | March 31, 2013 | | | |
| | | | 25,938 | | | | March 31, 2014 | | | |
| | | | 103,860 | | | | March 31, 2016 | | | |
| | | | 1,158,951 | | | | March 31, 2017 | | | |
| New Jersey Limited | | | 129,576 | | | | March 31, 2011 | | | |
| | | | 298,472 | | | | March 31, 2012 | | | |
| | | | 728,451 | | | | March 31, 2013 | | | |
| | | | 126,854 | | | | March 31, 2017 | | | |
| New York Limited | | | 144,635 | | | | March 31, 2011 | | | |
| | | | 483,774 | | | | March 31, 2012 | | | |
| | | | 1,522,094 | | | | March 31, 2013 | | | |
| | | | 97,867 | | | | March 31, 2015 | | | |
| | | | 394,181 | | | | March 31, 2016 | | | |
| | | | 718,716 | | | | March 31, 2017 | | | |
| Ohio Limited | | | 69,085 | | | | March 31, 2010 | | | |
| | | | 366,442 | | | | March 31, 2011 | | | |
| | | | 60,692 | | | | March 31, 2012 | | | |
| | | | 358,602 | | | | March 31, 2013 | | | |
| | | | 19,117 | | | | March 31, 2014 | | | |
| | | | 37,955 | | | | March 31, 2015 | | | |
| | | | 67,546 | | | | March 31, 2016 | | | |
| | | | 152,500 | | | | March 31, 2017 | | | |
| Pennsylvania Limited | | $ | 59,482 | | | | March 31, 2010 | | | |
| | | | 400,339 | | | | March 31, 2011 | | | |
| | | | 154,413 | | | | March 31, 2012 | | | |
| | | | 954,523 | | | | March 31, 2013 | | | |
| | | | 29,139 | | | | March 31, 2015 | | | |
| | | | 107,086 | | | | March 31, 2016 | | | |
| | | | 310,885 | | | | March 31, 2017 | | | |
Additionally, at March 31, 2009, the California Limited Fund, Massachusetts Limited Fund, New Jersey Limited Fund, New York Limited Fund, Ohio Limited Fund and Pennsylvania Limited Fund had net capital losses of $1,406,663, $1,124,284, $1,241,352, $3,383,434, $241,745 and $1,428,724, respectively, attributable to security transactions incurred after October 31, 2008. These net capital losses are treated as arising on the first day of the Funds’ taxable year ending March 31, 2010.
As of March 31, 2009, the Funds had no uncertain tax positions that would require financial statement recognition, de-recognition, or disclosure. Each of the Funds’ federal tax returns filed in the 3-year period ended March 31, 2009 remains subject to examination by the Internal Revenue Service.
D Expenses — The majority of expenses of the Trust are directly identifiable to an individual fund. Expenses which are not readily identifiable to a specific fund are allocated taking into consideration, among other things, the nature and type of expense and the relative size of the funds.
E Expense Reduction — State Street Bank and Trust Company (SSBT) serves as custodian of the Funds. Pursuant to the respective custodian agreements, SSBT receives a fee reduced by credits, which are determined based on the average daily cash balance each Fund maintains with SSBT. All credit balances, if any, used to reduce each Fund’s custodian fees are reported as a reduction of expenses in the Statements of Operations.
F Legal Fees — Legal fees and other related expenses incurred as part of negotiations of the terms and requirement of capital infusions, or that are expected to result in the restructuring of, or a plan of reorganization for, an investment are recorded as realized losses. Ongoing expenditures to protect or enhance an investment are treated as operating expenses.
G Use of Estimates — The preparation of the financial statements in conformity with accounting principles generally accepted in the United States of America requires management to make estimates and
64
Eaton Vance Limited Maturity Municipals Funds as of March 31, 2009
NOTES TO FINANCIAL STATEMENTS CONT’D
assumptions that affect the reported amounts of assets and liabilities at the date of the financial statements and the reported amounts of income and expense during the reporting period. Actual results could differ from those estimates.
H Indemnifications — Under the Trust’s organizational documents, its officers and Trustees may be indemnified against certain liabilities and expenses arising out of the performance of their duties to the Funds, and shareholders are indemnified against personal liability for the obligations of the Trust. Additionally, in the normal course of business, each Fund enters into agreements with service providers that may contain indemnification clauses. Each Fund’s maximum exposure under these arrangements is unknown as this would involve future claims that may be made against each Fund that have not yet occurred.
I Floating Rate Notes Issued in Conjunction with Securities Held — The Funds may invest in inverse floating rate securities, also referred to as tender option bonds (TOBs), whereby a Fund may sell a fixed rate bond to a broker for cash. At the same time, the Fund buys a residual interest in the assets and cash flows of a Special-Purpose Vehicle (the SPV), (which is generally organized as a trust), set up by the broker, often referred to as an inverse floating rate obligation (Inverse Floater). The broker deposits a fixed rate bond into the SPV with the same CUSIP number as the fixed rate bond sold to the broker by the Fund, and which may have been, but is not required to be, the fixed rate bond purchased from the Fund (the Fixed Rate Bond). The SPV also issues floating rate notes (Floating Rate Notes) which are sold to third-parties. The Inverse Floater held by a Fund gives the Fund the right (1) to cause the holders of the Floating Rate Notes to tender their notes at par, and (2) to have the broker transfer the Fixed Rate Bond held by the SPV to the Fund, thereby terminating the SPV. Should the Fund exercise such right, it would pay the broker the par amount due on the Floating Rate Notes and exchange the Inverse Floater for the underlying Fixed Rate Bond. Pursuant to Financial Accounting Standards Board (FASB) Statement No. 140, “Accounting for Transfers and Servicing of Financial Assets and Extinguishment of Liabilities” (FAS 140), the Funds account for the transaction described above as a secured borrowing by including the Fixed Rate Bond in their Portfolio of Investments and the Floating Rate Notes as a liability under the caption “Payable for floating rate notes issued” in their Statement of Assets and Liabilities. The Floating Rate Notes have interest rates that generally reset weekly and their holders have the option to tender their notes to the broker for redemption at par at each reset date. Interest expense related to the Funds’ liability with respect to Floating Rate Notes is recorded as incurred. The SPV may be terminated by the Fund, as noted above, or by the broker upon the occurrence of certain termination events as defined in the trust agreement, such as a downgrade in the credit quality of the underlying bond, bankruptcy of or payment failure by the issuer of the underlying bond, the inability to remarket Floating Rate Notes that have been tendered due to insufficient buyers in the market, or the failure by the SPV to obtain renewal of the liquidity agreement under which liquidity support is provided for the Floating Rate Notes up to one year. At March 31, 2009, the Funds had no Floating Rate Notes outstanding.
The Funds may also purchase Inverse Floaters from brokers in a secondary market transaction without first owning the underlying fixed rate bond. Such transactions are not required to be treated as secured borrowings. Shortfall agreements, if any, related to Inverse Floaters purchased in a secondary market transaction are disclosed in the Portfolio of Investments. The Funds’ investment policies and restrictions expressly permit investments in Inverse Floaters. Inverse floating rate securities typically offer the potential for yields exceeding the yields available on fixed rate bonds with comparable credit quality and maturity. These securities tend to underperform the market for fixed rate bonds in a rising long-term interest rate environment, but tend to outperform the market for fixed rate bonds when long-term interest rates decline. The value and income of inverse floating rate securities are generally more volatile than that of a fixed rate bond. The Funds’ investment policies do not allow the Funds to borrow money for purposes of making investments. Management believes that the Funds’ restrictions on borrowing money and issuing senior securities (other than as specifically permitted) do not apply to Floating Rate Notes issued by the SPV and included as a liability in the Funds’ Statements of Assets and Liabilities. As secured indebtedness issued by an SPV, Floating Rate Notes are distinct from the borrowings and senior securities to which the Funds’ restrictions apply. Inverse Floaters held by the Funds are securities exempt from registration under Rule 144A of the Securities Act of 1933.
J Financial Futures Contracts — The Funds may enter into financial futures contracts. The Funds’ investment in financial futures contracts is designed for hedging against changes in interest rates or as a substitute for the purchase of securities. Upon entering into a financial futures contract, a Fund is required to deposit with the broker, either in cash or securities an amount equal to a certain percentage of the purchase price (initial margin). Subsequent payments, known as variation margin, are made or received by the Fund each business day, depending on the daily fluctuations in the value of the underlying security, and are recorded as unrealized gains or losses by the Fund. Gains (losses) are realized upon the expiration or closing of the financial futures contracts. Should market conditions change unexpectedly, the Fund may not achieve the anticipated benefits of the
65
Eaton Vance Limited Maturity Municipals Funds as of March 31, 2009
NOTES TO FINANCIAL STATEMENTS CONT’D
financial futures contracts and may realize a loss. In entering such contracts, the Fund bears the risk if the counterparties do not perform under the contracts’ terms.
K When-Issued Securities and Delayed Delivery Transactions — The Funds may purchase or sell securities on a delayed delivery or when-issued basis. Payment and delivery may take place after the customary settlement period for that security. At the time the transaction is negotiated, the price of the security that will be delivered is fixed. The Funds maintain security positions for these commitments such that sufficient liquid assets will be available to make payments upon settlement. Securities purchased on a delayed delivery or when-issued basis are marked-to-market daily and begin earning interest on settlement date. Losses may arise due to changes in the market value of the underlying securities or if the counterparty does not perform under the contract.
2 Distributions to Shareholders
The net investment income of each Fund is determined daily and substantially all of the net investment income so determined is declared as a dividend to shareholders of record at the time of declaration. Distributions are declared separately for each class of shares. Distributions are paid monthly. Distributions of realized capital gains (reduced by available capital loss carryforwards, if any), are made at least annually. Shareholders may reinvest income and capital gain distributions in additional shares of the same class of a Fund at the net asset value as of the reinvestment date or, at the election of the shareholder, receive distributions in cash. The Funds distinguish between distributions on a tax basis and a financial reporting basis. Accounting principles generally accepted in the United States of America require that only distributions in excess of tax basis earnings and profits be reported in the financial statements as a return of capital. Permanent differences between book and tax accounting relating to distributions are reclassified to paid-in capital.
The tax character of distributions declared for the years ended March 31, 2009 and March 31, 2008 was as follows:
| | | | | | | | | | | | | | | | | | | | | | | | | | | |
| | | California
| | | Massachusetts
| | | New Jersey
| | | New York
| | | Ohio
| | | Pennsylvania
| | | |
| Year Ended March 31, 2009 | | Limited | | | Limited | | | Limited | | | Limited | | | Limited | | | Limited | | | |
| |
| Distributions declared from: | | | | | | | | | | | | | | | | | | | | | | | | | | |
| Tax-exempt income | | $ | 1,236,067 | | | $ | 2,180,235 | | | $ | 1,581,063 | | | $ | 3,478,784 | | | $ | 732,513 | | | $ | 1,972,680 | | | |
| Ordinary income | | $ | 133 | | | $ | — | | | $ | 17,462 | | | $ | 34,798 | | | $ | — | | | $ | 2,066 | | | |
| | | | | | | | | | | | | | | | | | | | | | | | | | | |
| | | | | | | | | | | | | | | | | | | | | | | | | | | |
| | | California
| | | Massachusetts
| | | New Jersey
| | | New York
| | | Ohio
| | | Pennsylvania
| | | |
| Year Ended March 31, 2008 | | Limited | | | Limited | | | Limited | | | Limited | | | Limited | | | Limited | | | |
| |
| Distributions declared from: | | | | | | | | | | | | | | | | | | | | | | | | | | |
| Tax-exempt income | | $ | 1,468,078 | | | $ | 2,186,263 | | | $ | 1,514,755 | | | $ | 3,461,672 | | | $ | 733,718 | | | $ | 1,938,893 | | | |
| |
| During the year ended March 31, 2009, the following amounts were reclassified due to expired capital loss carryforwards and differences between book and tax accounting, primarily for accretion of market discount: |
| | | | | | | | | | | | | | | | | | | | | | | | | | | |
| | | | | | | | | | | | | | | | | | | | | | | | | | | |
| | | California
| | | Massachusetts
| | | New Jersey
| | | New York
| | | Ohio
| | | Pennsylvania
| | | |
| | | Limited | | | Limited | | | Limited | | | Limited | | | Limited | | | Limited | | | |
| |
| Increase (decrease): | | | | | | | | | | | | | | | | | | | | | | | | | | |
| Paid-in capital | | $ | — | | | $ | — | | | $ | — | | | $ | — | | | $ | (36,233 | ) | | $ | (35,623 | ) | | |
| Accumulated net realized loss | | $ | 3,374 | | | $ | (86,859 | ) | | $ | (18,555 | ) | | $ | (44,824 | ) | | $ | 16,495 | | | $ | 40,411 | | | |
| Accumulated undistributed net investment income | | $ | (3,374 | ) | | $ | 86,859 | | | $ | 18,555 | | | $ | 44,824 | | | $ | 19,738 | | | $ | (4,788 | ) | | |
| |
These reclassifications had no effect on the net assets or net asset value per share of the Funds.
|
| |
As of March 31, 2009, the components of distributable earnings (accumulated losses) and unrealized appreciation (depreciation) on a tax basis were as follows: |
| | | | | | | | | | | | | | | | | | | | | | | | | | | |
| | | | | | | | | | | | | | | | | | | | | | | | | | | |
| | | California
| | | Massachusetts
| | | New Jersey
| | | New York
| | | Ohio
| | | Pennsylvania
| | | |
| | | Limited | | | Limited | | | Limited | | | Limited | | | Limited | | | Limited | | | |
| |
| Undistributed tax-exempt income | | $ | 11,715 | | | $ | 134,453 | | | $ | 83,613 | | | $ | 95,808 | | | $ | 5,954 | | | $ | 24,948 | | | |
| Capital loss carryforward and post October losses | | $ | (2,634,962 | ) | | $ | (4,541,710 | ) | | $ | (2,524,705 | ) | | $ | (6,744,701 | ) | | $ | (1,373,684 | ) | | $ | (3,444,591 | ) | | |
| Net unrealized appreciation (depreciation) | | $ | (524,015 | ) | | $ | 595,661 | | | $ | 435,309 | | | $ | (1,970,716 | ) | | $ | 388,113 | | | $ | 816,554 | | | |
| Other temporary differences | | $ | (37,437 | ) | | $ | (91,874 | ) | | $ | (67,939 | ) | | $ | (139,819 | ) | | $ | (29,237 | ) | | $ | (78,779 | ) | | |
66
Eaton Vance Limited Maturity Municipals Funds as of March 31, 2009
NOTES TO FINANCIAL STATEMENTS CONT’D
The differences between components of distributable earnings (accumulated losses) on a tax basis and the amounts reflected in the Statements of Assets and Liabilities are primarily due to futures contracts, accretion of market discount and the timing of recognizing distributions to shareholders.
3 Investment Adviser Fee and Other Transactions with Affiliates
The investment adviser fee is earned by Boston Management and Research (BMR), a subsidiary of Eaton Vance Management (EVM), as compensation for management and investment advisory services rendered to each Fund. The fee is based upon a percentage of average daily net assets plus a percentage of gross income (i.e., income other than gains from the sale of securities) and is payable monthly. The annual asset rate and daily income rate are 0.30% and 3.00%, respectively, on average daily net assets of up to $500 million and at reduced rates as daily net assets exceed that level.
For the year ended March 31, 2009, investment adviser fees incurred by the Funds and the effective annual rates, as a percentage of average daily net assets, were as follows:
| | | | | | | | | | | |
| | | Investment
| | | Effective
| | | |
| Fund | | Adviser Fee | | | Annual Rate | | | |
| |
| California Limited | | $ | 140,139 | | | | 0.44 | % | | |
| Massachusetts Limited | | | 275,000 | | | | 0.45 | | | |
| New Jersey Limited | | | 183,876 | | | | 0.44 | | | |
| New York Limited | | | 402,634 | | | | 0.44 | | | |
| Ohio Limited | | | 85,697 | | | | 0.44 | | | |
| Pennsylvania Limited | | | 235,037 | | | | 0.45 | | | |
EVM serves as administrator of each Fund, but receives no compensation. EVM serves as the sub-transfer agent of each Fund and receives from the transfer agent an aggregate fee based upon the actual expenses incurred by EVM in the performance of these services. Eaton Vance Distributors, Inc. (EVD), an affiliate of EVM and the Funds’ principal underwriter, received a portion of the sales charge on sales of Class A shares of the Funds. EVD also received distribution and service fees from Class A, Class B and Class C shares (see Note 4) and contingent deferred sales charges (see Note 5). Sub-transfer agent fees earned by EVM and Class A sales charges that the Funds were informed were received by EVD for the year ended March 31, 2009 were as follows:
| | | | | | | | | | | |
| | | EVM’s Sub-Transfer
| | | EVD’s Class A
| | | |
| Fund | | Agent Fees | | | Sales Charges | | | |
| |
| California Limited | | $ | 573 | | | $ | 2,348 | | | |
| Massachusetts Limited | | | 1,749 | | | | 4,097 | | | |
| New Jersey Limited | | | 1,034 | | | | 2,089 | | | |
| New York Limited | | $ | 2,283 | | | $ | 3,243 | | | |
| Ohio Limited | | | 448 | | | | 4,043 | | | |
| Pennsylvania Limited | | | 1,375 | | | | 5,202 | | | |
Except for Trustees of the Funds who are not members of EVM’s or BMR’s organizations, officers and Trustees receive remuneration for their services to the Funds out of the investment adviser fee. Trustees of the Funds who are not affiliated with the investment adviser may elect to defer receipt of all or a percentage of their annual fees in accordance with the terms of the Trustees Deferred Compensation Plan. For the year ended March 31, 2009, no significant amounts have been deferred. Certain officers and Trustees of the Funds are officers of the above organizations.
4 Distribution Plans
Each Fund has in effect a distribution plan for Class A shares (Class A Plan) pursuant to Rule 12b-1 under the 1940 Act. The Class A Plan provides that each Fund will pay EVD a distribution and service fee not exceeding 0.25% per annum of its average daily net assets attributable to Class A shares for distribution services and facilities provided to each Fund by EVD, as well as for personal services and/or the maintenance of shareholder accounts. The Trustees approved distribution and service fee payments equal to 0.15% per annum of each Fund’s average daily net assets attributable to Class A shares. Distribution and service fees paid or accrued to EVD for the year ended March 31, 2009 for Class A shares amounted to the following:
| | | | | | | |
| | | Class A
| | | |
| | | Distribution and
| | | |
| Fund | | Service Fees | | | |
| |
| California Limited | | $ | 43,975 | | | |
| Massachusetts Limited | | | 70,873 | | | |
| New Jersey Limited | | | 60,787 | | | |
| New York Limited | | | 101,095 | | | |
| Ohio Limited | | | 28,724 | | | |
| Pennsylvania Limited | | | 57,811 | | | |
Each Fund also has in effect distribution plans for Class B shares (Class B Plan) and Class C shares (Class C Plan) pursuant to Rule 12b-1 under the 1940 Act. The Class B and Class C Plans require each Fund to pay EVD amounts equal to 0.75% per annum of its average daily net assets attributable to Class B and Class C shares for providing ongoing distribution services and facilities to the respective Funds. Each Fund will automatically discontinue payments to EVD during any period in which there are no outstanding Uncovered Distribution Charges, which are equivalent to the sum of (i) 3% (3.5% for Ohio Limited
67
Eaton Vance Limited Maturity Municipals Funds as of March 31, 2009
NOTES TO FINANCIAL STATEMENTS CONT’D
Fund) and 6.25% of the aggregate amount received by each Fund for Class B and Class C shares sold, respectively, plus (ii) interest calculated by applying the rate of 1% over the prevailing prime rate to the outstanding balance of Uncovered Distribution Charges of EVD of each respective class, reduced by the aggregate amount of contingent deferred sales charges (see Note 5) and amounts theretofore paid or payable to EVD by each respective class. For the year ended March 31, 2009, the Funds paid or accrued to EVD the following distribution fees, representing 0.75% of the average daily net assets of each Fund’s Class B and Class C shares:
| | | | | | | | | | | |
| | | Class B
| | | Class C
| | | |
| | | Distribution
| | | Distribution
| | | |
| Fund | | Fees | | | Fees | | | |
| |
| California Limited | | $ | 5,599 | | | $ | 13,585 | | | |
| Massachusetts Limited | | | 9,398 | | | | 97,194 | | | |
| New Jersey Limited | | | 5,201 | | | | 2,586 | | | |
| New York Limited | | | 12,961 | | | | 174,109 | | | |
| Ohio Limited | | | 1,206 | | | | 2,338 | | | |
| Pennsylvania Limited | | | 6,273 | | | | 96,586 | | | |
At March 31, 2009, the amounts of Uncovered Distribution Charges of EVD calculated under the Class B and Class C Plans were approximately as follows:
| | | | | | | | | | | |
| Fund | | Class B | | | Class C | | | |
| |
| California Limited | | $ | 545,000 | | | $ | 124,000 | | | |
| Massachusetts Limited | | | 567,000 | | | | 4,970,000 | | | |
| New Jersey Limited | | | 564,000 | | | | 41,000 | | | |
| New York Limited | | | 867,000 | | | | 6,249,000 | | | |
| Ohio Limited | | | 891,000 | | | | 30,000 | | | |
| Pennsylvania Limited | | | 377,000 | | | | 6,098,000 | | | |
The Class B and Class C Plans also authorize the Funds to make payments of service fees to EVD, investment dealers and other persons in amounts not exceeding 0.25% per annum of the average daily net assets attributable to that class. The Trustees approved service fee payments equal to 0.15% per annum of each Fund’s average daily net assets attributable to Class B and Class C shares. Service fees paid or accrued are for personal services and/or the maintenance of shareholder accounts. They are separate and distinct from the Class B and Class C sales commissions and distribution fees and, as such, are not subject to automatic discontinuance when there are no outstanding Uncovered Distribution Charges of EVD. Service fees paid or accrued for the year ended March 31, 2009 amounted to the following:
| | | | | | | | | | | |
| | | Class B
| | | Class C
| | | |
| Fund | | Service Fees | | | Service Fees | | | |
| |
| California Limited | | $ | 1,116 | | | $ | 2,717 | | | |
| Massachusetts Limited | | | 1,880 | | | | 19,439 | | | |
| New Jersey Limited | | | 1,040 | | | | 517 | | | |
| New York Limited | | | 2,593 | | | | 34,822 | | | |
| Ohio Limited | | | 241 | | | | 469 | | | |
| Pennsylvania Limited | | | 1,255 | | | | 19,317 | | | |
5 Contingent Deferred Sales Charges
A contingent deferred sales charge (CDSC) generally is imposed on redemptions of Class B shares made within four years of purchase and on redemptions of Class C shares made within one year of purchase. Class A shares may be subject to a 1% CDSC if redeemed within eighteen months of purchase (depending on the circumstances of purchase). Generally, the CDSC is based upon the lower of the net asset value at date of redemption or date of purchase. No charge is levied on shares acquired by reinvestment of dividends or capital gain distributions. The CDSC for Class B shares is imposed at declining rates that begin at 3% in the case of redemptions in the first year after purchase, declining half a percentage point in the second and third year and one percentage point in the fourth year. Class C shares are subject to a 1% CDSC if redeemed within one year of purchase. No CDSC is levied on shares which have been sold to EVM or its affiliates or to their respective employees or clients and may be waived under certain other limited conditions. CDSCs received on Class B and Class C redemptions are paid to EVD to reduce the amount of Uncovered Distribution Charges calculated under each Fund’s Class B and Class C Plans. CDSCs received on Class B and Class C redemptions when no Uncovered Distribution Charges exist are credited to each Fund. For the year ended March 31, 2009, the Funds were informed that EVD received approximately the following amounts of CDSCs paid by Class A, Class B and Class C shareholders:
| | | | | | | | | | | | | | | |
| Fund | | Class A | | | Class B | | | Class C | | | |
| |
| California Limited | | $ | 25,000 | | | $ | 70 | | | $ | 300 | | | |
| Massachusetts Limited | | | 3,000 | | | | 2,100 | | | | 600 | | | |
| New Jersey Limited | | | 30 | | | | 1,000 | | | | 2,400 | �� | | |
| New York Limited | | | 7,000 | | | | 4,600 | | | | 6,400 | | | |
| Ohio Limited | | | — | | | | — | | | | 1,200 | | | |
| Pennsylvania Limited | | | 1,000 | | | | 2,100 | | | | 2,800 | | | |
68
Eaton Vance Limited Maturity Municipals Funds as of March 31, 2009
NOTES TO FINANCIAL STATEMENTS CONT’D
6 Purchases and Sales of Investments
Purchases and sales of investments, other than short-term obligations, for the year ended March 31, 2009 were as follows:
| | | | | | | | | | | |
| Fund | | Purchases | | | Sales | | | |
| |
| California Limited | | $ | 2,297,010 | | | $ | 16,598,769 | | | |
| Massachusetts Limited | | | 9,541,484 | | | | 10,827,080 | | | |
| New Jersey Limited | | | 9,278,399 | | | | 10,438,261 | | | |
| New York Limited | | | 20,384,586 | | | | 26,205,590 | | | |
| Ohio Limited | | | 1,710,830 | | | | 1,812,212 | | | |
| Pennsylvania Limited | | | 9,658,179 | | | | 12,961,400 | | | |
7 Shares of Beneficial Interest
Each Fund’s Declaration of Trust permits the Trustees to issue an unlimited number of full and fractional shares of beneficial interest (without par value). Such shares may be issued in a number of different series (such as the Funds) and classes. Transactions in Fund shares were as follows:
| | | | | | | | | | | |
| California Limited Fund |
| |
| | | Year Ended March 31, |
| Class A | | 2009 | | | 2008 | | | |
| |
| Sales | | | 406,183 | | | | 2,016,272 | | | |
| Issued to shareholders electing to receive payments of distributions in Fund shares | | | 61,900 | | | | 58,409 | | | |
| Redemptions | | | (1,982,872 | ) | | | (1,918,785 | ) | | |
| Exchange from Class B shares | | | 17,572 | | | | 41,894 | | | |
| |
| |
Net increase (decrease) | | | (1,497,217 | ) | | | 197,790 | | | |
| |
| |
| | | | | | | | | | | |
| | | | | | | | | | | |
| | | Year Ended March 31, |
| Class B | | 2009 | | | 2008 | | | |
| |
| Sales | | | 55,426 | | | | 43,627 | | | |
| Issued to shareholders electing to receive payments of distributions in Fund shares | | | 970 | | | | 915 | | | |
| Redemptions | | | (6,705 | ) | | | (16,028 | ) | | |
| Exchange to Class A shares | | | (17,624 | ) | | | (42,017 | ) | | |
| |
| |
Net increase (decrease) | | | 32,067 | | | | (13,503 | ) | | |
| |
| |
| | | | | | | | | | | |
| | | | | | | | | | | |
| | | Year Ended March 31, |
| Class C | | 2009 | | | 2008 | | | |
| |
| Sales | | | 84,507 | | | | 180,673 | | | |
| Issued to shareholders electing to receive payments of distributions in Fund shares | | | 2,060 | | | | 863 | | | |
| Redemptions | | | (33,411 | ) | | | (87,978 | ) | | |
| |
| |
Net increase | | | 53,156 | | | | 93,558 | | | |
| |
| |
| | | | | | | | | | | |
| Massachusetts Limited Fund |
| |
| | | Year Ended March 31, |
| Class A | | 2009 | | | 2008 | | | |
| |
| Sales | | | 1,898,025 | | | | 1,610,174 | | | |
| Issued to shareholders electing to receive payments of distributions in Fund shares | | | 118,776 | | | | 109,447 | | | |
| Redemptions | | | (2,196,838 | ) | | | (1,357,397 | ) | | |
| Exchange from Class B shares | | | 112,871 | | | | 166,127 | | | |
| |
| |
Net increase (decrease) | | | (67,166 | ) | | | 528,351 | | | |
| |
| |
| | | | | | | | | | | |
| | | | | | | | | | | |
| | | Year Ended March 31, |
| Class B | | 2009 | | | 2008 | | | |
| |
| Sales | | | 62,371 | | | | 18,157 | | | |
| Issued to shareholders electing to receive payments of distributions in Fund shares | | | 2,627 | | | | 4,325 | | | |
| Redemptions | | | (26,102 | ) | | | (50,671 | ) | | |
| Exchange to Class A shares | | | (112,954 | ) | | | (166,156 | ) | | |
| |
| |
Net decrease | | | (74,058 | ) | | | (194,345 | ) | | |
| |
| |
| | | | | | | | | | | |
| | | | | | | | | | | |
| | | Year Ended March 31, |
| Class C | | 2009 | | | 2008 | | | |
| |
| Sales | | | 244,370 | | | | 146,203 | | | |
| Issued to shareholders electing to receive payments of distributions in Fund shares | | | 26,839 | | | | 27,564 | | | |
| Redemptions | | | (255,603 | ) | | | (259,219 | ) | | |
| |
| |
Net increase (decrease) | | | 15,606 | | | | (85,452 | ) | | |
| |
| |
| | | | | | | | | | | |
| New Jersey Limited Fund |
| |
| | | Year Ended March 31, |
| Class A | | 2009 | | | 2008 | | | |
| |
| Sales | | | 1,625,831 | | | | 1,185,717 | | | |
| Issued to shareholders electing to receive payments of distributions in Fund shares | | | 98,385 | | | | 92,752 | | | |
| Redemptions | | | (1,685,448 | ) | | | (759,245 | ) | | |
| Exchange from Class B shares | | | 54,287 | | | | 158,879 | | | |
| |
| |
Net increase | | | 93,055 | | | | 678,103 | | | |
| |
| |
| | | | | | | | | | | |
| | | | | | | | | | | |
| | | Year Ended March 31, |
| Class B | | 2009 | | | 2008 | | | |
| |
| Sales | | | 47,314 | | | | 11,520 | | | |
| Issued to shareholders electing to receive payments of distributions in Fund shares | | | 1,484 | | | | 3,599 | | | |
| Redemptions | | | (7,287 | ) | | | (56,878 | ) | | |
| Exchange to Class A shares | | | (54,248 | ) | | | (158,871 | ) | | |
| |
| |
Net decrease | | | (12,737 | ) | | | (200,630 | ) | | |
| |
| |
| | | | | | | | | | | |
| | | | | | | | | | | |
69
Eaton Vance Limited Maturity Municipals Funds as of March 31, 2009
NOTES TO FINANCIAL STATEMENTS CONT’D
New Jersey Limited Fund (continued)
| | | | | | | | | | | |
| | | Year Ended March 31, |
| Class C | | 2009 | | | 2008 | | | |
| |
| | | Year Ended March 31, |
| Class C | | 2009 | | | 2008 | | | |
| |
| Sales | | | 73,272 | | | | 14,275 | | | |
| Issued to shareholders electing to receive payments of distributions in Fund shares | | | 768 | | | | 184 | | | |
| Redemptions | | | (33,903 | ) | | | — | | | |
| |
| |
Net increase | | | 40,137 | | | | 14,459 | | | |
| |
| |
| | | | | | | | | | | |
| New York Limited Fund |
| |
| | | Year Ended March 31, |
| Class A | | 2009 | | | 2008 | | | |
| |
| Sales | | | 1,362,132 | | | | 1,854,466 | | | |
| Issued to shareholders electing to receive payments of distributions in Fund shares | | | 200,648 | | | | 192,043 | | | |
| Redemptions | | | (2,028,966 | ) | | | (2,115,985 | ) | | |
| Exchange from Class B shares | | | 80,064 | | | | 258,119 | | | |
| |
| |
Net increase (decrease) | | | (386,122 | ) | | | 188,643 | | | |
| |
| |
| | | | | | | | | | | |
| | | | | | | | | | | |
| | | Year Ended March 31, |
| Class B | | 2009 | | | 2008 | | | |
| |
| Sales | | | 136,133 | | | | 61,091 | | | |
| Issued to shareholders electing to receive payments of distributions in Fund shares | | | 3,076 | | | | 4,984 | | | |
| Redemptions | | | (49,980 | ) | | | (30,769 | ) | | |
| Exchange to Class A shares | | | (80,100 | ) | | | (258,235 | ) | | |
| |
| |
Net increase (decrease) | | | 9,129 | | | | (222,929 | ) | | |
| |
| |
| | | | | | | | | | | |
| | | | | | | | | | | |
| | | Year Ended March 31, |
| Class C | | 2009 | | | 2008 | | | |
| |
| Sales | | | 788,590 | | | | 704,481 | | | |
| Issued to shareholders electing to receive payments of distributions in Fund shares | | | 47,954 | | | | 40,174 | | | |
| Redemptions | | | (786,587 | ) | | | (484,217 | ) | | |
| |
| |
Net increase | | | 49,957 | | | | 260,438 | | | |
| |
| |
| | | | | | | | | | | |
| Ohio Limited Fund |
| |
| | | Year Ended March 31, |
| Class A | | 2009 | | | 2008 | | | |
| |
| Sales | | | 507,641 | | | | 457,764 | | | |
| Issued to shareholders electing to receive payments of distributions in Fund shares | | | 35,170 | | | | 38,746 | | | |
| Redemptions | | | (617,570 | ) | | | (447,253 | ) | | |
| Exchange from Class B shares | | | 5,390 | | | | 33,096 | | | |
| |
| |
Net increase (decrease) | | | (69,369 | ) | | | 82,353 | | | |
| |
| |
| | | | | | | | | | | |
| | | | | | | | | | | |
| | | Year Ended March 31, |
| Class B | | 2009 | | | 2008 | | | |
| |
| Sales | | | 21,494 | | | | 3,800 | | | |
| Issued to shareholders electing to receive payments of distributions in Fund shares | | | 436 | | | | 519 | | | |
| Redemptions | | | (7,889 | ) | | | (4,720 | ) | | |
| Exchange to Class A shares | | | (5,394 | ) | | | (33,128 | ) | | |
| |
| |
Net increase (decrease) | | | 8,647 | | | | (33,529 | ) | | |
| |
| |
| | | | | | | | | | | |
| | | | | | | | | | | |
| | | Year Ended March 31, |
| Class C | | 2009 | | | 2008 | | | |
| |
| Sales | | | 74,671 | | | | 18,226 | | | |
| Issued to shareholders electing to receive payments of distributions in Fund shares | | | 849 | | | | 76 | | | |
| Redemptions | | | (16,143 | ) | | | (4,477 | ) | | |
| |
| |
Net increase | | | 59,377 | | | | 13,825 | | | |
| |
| |
| | | | | | | | | | | |
| Pennsylvania Limited Fund |
| |
| | | Year Ended March 31, |
| Class A | | 2009 | | | 2008 | | | |
| |
| Sales | | | 1,028,122 | | | | 985,042 | | | |
| Issued to shareholders electing to receive payments of distributions in Fund shares | | | 79,460 | | | | 74,547 | | | |
| Redemptions | | | (1,342,050 | ) | | | (618,786 | ) | | |
| Exchange from Class B shares | | | 70,833 | | | | 193,922 | | | |
| |
| |
Net increase (decrease) | | | (163,635 | ) | | | 634,725 | | | |
| |
| |
| | | | | | | | | | | |
| | | | | | | | | | | |
| | | Year Ended March 31, |
| Class B | | 2009 | | | 2008 | | | |
| |
| Sales | | | 37,999 | | | | 3,389 | | | |
| Issued to shareholders electing to receive payments of distributions in Fund shares | | | 1,817 | | | | 4,024 | | | |
| Redemptions | | | (27,931 | ) | | | (56,469 | ) | | |
| Exchange to Class A shares | | | (70,807 | ) | | | (193,901 | ) | | |
| |
| |
Net decrease | | | (58,922 | ) | | | (242,957 | ) | | |
| |
| |
| | | | | | | | | | | |
| | | | | | | | | | | |
| | | Year Ended March 31, |
| Class C | | 2009 | | | 2008 | | | |
| |
| Sales | | | 360,210 | | | | 301,201 | | | |
| Issued to shareholders electing to receive payments of distributions in Fund shares | | | 17,064 | | | | 17,952 | | | |
| Redemptions | | | (282,629 | ) | | | (353,647 | ) | | |
| |
| |
Net increase (decrease) | | | 94,645 | | | | (34,494 | ) | | |
| |
| |
70
Eaton Vance Limited Maturity Municipals Funds as of March 31, 2009
NOTES TO FINANCIAL STATEMENTS CONT’D
8 Federal Income Tax Basis of Investments
The cost and unrealized appreciation (depreciation) of investments of each Fund at March 31, 2009, as determined on a federal income tax basis, were as follows:
| | | | | | | |
| California Limited Fund |
| |
| |
Aggregate cost | | $ | 22,950,218 | | | |
| |
| |
| Gross unrealized appreciation | | $ | 573,038 | | | |
| Gross unrealized depreciation | | | (1,097,053 | ) | | |
| |
| |
Net unrealized depreciation | | $ | (524,015 | ) | | |
| |
| |
| | | | | | | |
Massachusetts Limited Fund | | | | | | |
| |
| |
Aggregate cost | | $ | 59,290,060 | | | |
| |
| |
| Gross unrealized appreciation | | $ | 2,825,547 | | | |
| Gross unrealized depreciation | | | (2,229,886 | ) | | |
| |
| |
Net unrealized appreciation | | $ | 595,661 | | | |
| |
| |
| | | | | | | |
New Jersey Limited Fund | | | | | | |
| |
| |
Aggregate cost | | $ | 42,255,824 | | | |
| |
| |
| Gross unrealized appreciation | | $ | 1,603,920 | | | |
| Gross unrealized depreciation | | | (1,168,611 | ) | | |
| |
| |
Net unrealized appreciation | | $ | 435,309 | | | |
| |
| |
| | | | | | | |
New York Limited Fund | | | | | | |
| |
| |
Aggregate cost | | $ | 87,901,900 | | | |
| |
| |
| Gross unrealized appreciation | | $ | 2,799,347 | | | |
| Gross unrealized depreciation | | | (4,770,063 | ) | | |
| |
| |
Net unrealized depreciation | | $ | (1,970,716 | ) | | |
| |
| |
| | | | | | | |
Ohio Limited Fund | | | | | | |
| |
| |
Aggregate cost | | $ | 18,678,664 | | | |
| |
| |
| Gross unrealized appreciation | | $ | 959,445 | | | |
| Gross unrealized depreciation | | | (571,332 | ) | | |
| |
| |
Net unrealized appreciation | | $ | 388,113 | | | |
| |
| |
| | | | | | | |
Pennsylvania Limited Fund | | | | | | |
| |
| |
Aggregate cost | | $ | 48,779,680 | | | |
| |
| |
| Gross unrealized appreciation | | $ | 2,351,465 | | | |
| Gross unrealized depreciation | | | (1,534,911 | ) | | |
| |
| |
Net unrealized appreciation | | $ | 816,554 | | | |
| |
| |
9 Line of Credit
The Funds participate with other portfolios and funds managed by EVM and its affiliates in a $450 million unsecured line of credit agreement with a group of banks. Borrowings are made by the Funds solely to facilitate the handling of unusual and/or unanticipated short-term cash requirements. Interest is charged to each Fund based on its borrowings at an amount above either the Eurodollar rate or Federal Funds rate. In addition, a fee computed at an annual rate of 0.10% on the daily unused portion of the line of credit is allocated among the participating portfolios and funds at the end of each quarter. At March 31, 2009, the Massachusetts Limited Fund, New Jersey Limited and Ohio Limited each had a balance outstanding pursuant to this line of credit of $100,000, at an interest rate of 0.80%. The Funds’ average borrowings or allocated fees during the year ended March 31, 2009 were not significant.
10 Financial Instruments
The Funds may trade in financial instruments with off-balance sheet risk in the normal course of their investing activities. These financial instruments may include financial futures contracts and may involve, to a varying degree, elements of risk in excess of the amounts recognized for financial statement purposes. The notional or contractual amounts of these instruments represent the investment a Fund has in particular classes of financial instruments and does not necessarily represent the amounts potentially subject to risk. The measurement of the risks associated with these instruments is meaningful only when all related and offsetting transactions are considered.
71
Eaton Vance Limited Maturity Municipals Funds as of March 31, 2009
NOTES TO FINANCIAL STATEMENTS CONT’D
A summary of obligations under these financial instruments outstanding at March 31, 2009 is as follows:
| | | | | | | | | | | | | | | | | | | |
| Futures Contract | |
| | |
| | | | | | | | | | | | | | | Net
| |
| | | Expiration
| | | | | | | Aggregate
| | | | | Unrealized
| |
| Fund | | Date | | | Contracts | | Position | | Cost | | Value | | | Depreciation | |
| | |
California
Limited | | | 6/09 | | | 40
U.S. Treasury Bond | | Short | | $(5,047,360) | | $ | (5,188,125 | ) | | $ | (140,765 | ) |
| |
| |
Massachusetts
Limited | | | 6/09 | | | 40
U.S. Treasury Bond | | Short | | $(5,104,860) | | $ | (5,188,125 | ) | | $ | (83,265 | ) |
| | | | 6/09 | | | 41
U.S. Treasury Note | | Short | | $(5,007,378) | | $ | (5,087,204 | ) | | $ | (79,826 | ) |
| |
| |
New Jersey
Limited | | | 6/09 | | | 67
U.S. Treasury Bond | | Short | | $(8,550,640) | | $ | (8,690,109 | ) | | $ | (139,469 | ) |
| |
| |
New York
Limited | | | 6/09 | | | 51
U.S. Treasury Bond | | Short | | $(6,508,697) | | $ | (6,614,860 | ) | | $ | (106,163 | ) |
| | | | 6/09 | | | 94
U.S. Treasury Note | | Short | | $(11,480,329) | | $ | (11,663,344 | ) | | $ | (183,015 | ) |
| |
| |
Ohio
Limited | | | 6/09 | | | 5
U.S. Treasury Bond | | Short | | $(638,108) | | $ | (648,516 | ) | | $ | (10,408 | ) |
| | | | 6/09 | | | 15
U.S. Treasury Note | | Short | | $(1,831,967) | | $ | (1,861,172 | ) | | $ | (29,205 | ) |
| |
| |
Pennsylvania
Limited | | | 6/09 | | | 29
U.S. Treasury Bond | | Short | | $(3,672,930) | | $ | (3,761,391 | ) | | $ | (88,461 | ) |
| | | | 6/09 | | | 40
U.S. Treasury Note | | Short | | $(4,885,246) | | $ | (4,963,125 | ) | | $ | (77,879 | ) |
| |
| |
At March 31, 2009, the Funds had sufficient cash and/or securities to cover commitments under these contracts.
11 Fair Value Measurements
The Funds adopted FASB Statement of Financial Accounting Standards No. 157 (FAS 157), “Fair Value Measurements”, effective April 1, 2008. FAS 157 established a three-tier hierarchy to prioritize the assumptions, referred to as inputs, used in valuation techniques to measure fair value. The three-tier hierarchy of inputs is summarized in the three broad levels listed below.
| | |
| | • | Level 1 – quoted prices in active markets for identical investments |
| |
| | • | Level 2 – other significant observable inputs (including quoted prices for similar investments, interest rates, prepayment speeds, credit risk, etc.) |
| |
| | • | Level 3 – significant unobservable inputs (including a fund’s own assumptions in determining the fair value of investments) |
The inputs or methodology used for valuing securities are not necessarily an indication of the risk associated with investing in those securities.
At March 31, 2009, the inputs used in valuing the Funds’ investments, which are carried at value, were as follows:
| | | | | | | | | | | | | |
| California Limited Fund |
| |
| | | | | Investments in
| | | Other Financial
| | | |
| | | Valuation Inputs | | Securities | | | Instruments* | | | |
| |
| Level 1 | | Quoted Prices | | $ | — | | | $ | (140,765 | ) | | |
| Level 2 | | Other Significant Observable Inputs | | | 22,426,203 | | | | — | | | |
| Level 3 | | Significant Unobservable Inputs | | | — | | | | — | | | |
| |
| |
Total | | | | $ | 22,426,203 | | | $ | (140,765 | ) | | |
| |
| |
| | | | | | | | | | | | | |
| Massachusetts Limited Fund |
| |
| | | | | Investments in
| | | Other Financial
| | | |
| | | Valuation Inputs | | Securities | | | Instruments* | | | |
| |
| Level 1 | | Quoted Prices | | $ | — | | | $ | (163,091 | ) | | |
| Level 2 | | Other Significant Observable Inputs | | | 59,885,721 | | | | — | | | |
| Level 3 | | Significant Unobservable Inputs | | | — | | | | — | | | |
| |
| |
Total | | | | $ | 59,885,721 | | | $ | (163,091 | ) | | |
| |
| |
| | | | | | | | | | | | | |
| New Jersey Limited Fund |
| |
| | | | | Investments in
| | | Other Financial
| | | |
| | | Valuation Inputs | | Securities | | | Instruments* | | | |
| |
| Level 1 | | Quoted Prices | | $ | — | | | $ | (139,469 | ) | | |
| Level 2 | | Other Significant Observable Inputs | | | 42,691,133 | | | | — | | | |
| Level 3 | | Significant Unobservable Inputs | | | — | | | | — | | | |
| |
| |
Total | | | | $ | 42,691,133 | | | $ | (139,469 | ) | | |
| |
| |
| | | | | | | | | | | | | |
| New York Limited Fund |
| |
| | | | | Investments in
| | | Other Financial
| | | |
| | | Valuation Inputs | | Securities | | | Instruments* | | | |
| |
| Level 1 | | Quoted Prices | | $ | — | | | $ | (289,178 | ) | | |
| Level 2 | | Other Significant Observable Inputs | | | 85,931,184 | | | | — | | | |
| Level 3 | | Significant Unobservable Inputs | | | — | | | | — | | | |
| |
| |
Total | | | | $ | 85,931,184 | | | $ | (289,178 | ) | | |
| |
| |
| | | | | | | | | | | | | |
| Ohio Limited Fund |
| |
| | | | | Investments in
| | | Other Financial
| | | |
| | | Valuation Inputs | | Securities | | | Instruments* | | | |
| |
| Level 1 | | Quoted Prices | | $ | — | | | $ | (39,613 | ) | | |
| Level 2 | | Other Significant Observable Inputs | | | 19,066,777 | | | | — | | | |
| Level 3 | | Significant Unobservable Inputs | | | — | | | | — | | | |
| |
| |
Total | | | | $ | 19,066,777 | | | $ | (39,613 | ) | | |
| |
| |
72
Eaton Vance Limited Maturity Municipals Funds as of March 31, 2009
NOTES TO FINANCIAL STATEMENTS CONT’D
| | | | | | | | | | | | | |
| Pennsylvania Limited Fund |
| |
| | | | | Investments in
| | | Other Financial
| | | |
| | | Valuation Inputs | | Securities | | | Instruments* | | | |
| |
| Level 1 | | Quoted Prices | | $ | — | | | $ | (166,340 | ) | | |
| Level 2 | | Other Significant Observable Inputs | | | 49,596,234 | | | | — | | | |
| Level 3 | | Significant Unobservable Inputs | | | — | | | | — | | | |
| |
| |
Total | | | | $ | 49,596,234 | | | $ | (166,340 | ) | | |
| |
| |
| | |
| * | | Other financial instruments are futures contracts not reflected in the Portfolio of Investments, which are valued at the unrealized appreciation (depreciation) on the instrument. |
The Funds held no investments or other financial instruments as of March 31, 2008 whose fair value was determined using Level 3 inputs.
12 Recently Issued Accounting Pronouncement
In March 2008, the FASB issued Statement of Financial Accounting Standards No. 161 (FAS 161), “Disclosures about Derivative Instruments and Hedging Activities”. FAS 161 requires enhanced disclosures about an entity’s derivative and hedging activities, including qualitative disclosures about the objectives and strategies for using derivatives, quantitative disclosures about fair value amounts of and gains and losses on derivative instruments, and disclosures about credit-risk related contingent features in derivative instruments. FAS 161 is effective for fiscal years and interim periods beginning after November 15, 2008. Management is currently evaluating the impact the adoption of FAS 161 will have on the Funds’ financial statement disclosures.
13 Subsequent Event — Proposed Plan of Reorganization
On April 27, 2009, the Trustees of the Trust approved an Agreement and Plan of Reorganization whereby Eaton Vance National Limited Maturity Municipals Fund (National Limited Fund) would acquire substantially all the assets and assume substantially all the liabilities of Ohio Limited Fund in exchange for shares of National Limited Fund. The proposed reorganization is subject to approval by the shareholders of Ohio Limited Fund.
73
Eaton Vance Limited Maturity Municipals Funds as of March 31, 2009
REPORT OF INDEPENDENT REGISTERED PUBLIC ACCOUNTING FIRM
To the Trustees of Eaton Vance Investment Trust and the Shareholders of Eaton Vance California Limited Maturity Municipals Fund, Eaton Vance Massachusetts Limited Maturity Municipals Fund, Eaton Vance New Jersey Limited Maturity Municipals Fund, Eaton Vance New York Limited Maturity Municipals Fund, Eaton Vance Ohio Limited Maturity Municipals Fund and Eaton Vance Pennsylvania Limited Maturity Municipals Fund:
We have audited the accompanying statements of assets and liabilities of Eaton Vance California Limited Maturity Municipals Fund, Eaton Vance Massachusetts Limited Maturity Municipals Fund, Eaton Vance New Jersey Limited Maturity Municipals Fund, Eaton Vance New York Limited Maturity Municipals Fund, Eaton Vance Ohio Limited Maturity Municipals Fund and Eaton Vance Pennsylvania Limited Maturity Municipals Fund (collectively the “Funds”) (certain of the funds constituting Eaton Vance Investment Trust), including the portfolios of investments, as of March 31, 2009, and the related statements of operations for the year then ended, the statements of changes in net assets for each of the two years in the period then ended, and the financial highlights for the periods presented. These financial statements and financial highlights are the responsibility of the Funds’ management. Our responsibility is to express an opinion on these financial statements and financial highlights based on our audits.
We conducted our audits in accordance with the standards of the Public Company Accounting Oversight Board (United States). Those standards require that we plan and perform the audit to obtain reasonable assurance about whether the financial statements and financial highlights are free of material misstatement. The Funds are not required to have, nor were we engaged to perform, an audit of their internal control over financial reporting. Our audits included consideration of internal control over financial reporting as a basis for designing audit procedures that are appropriate in the circumstances, but not for the purpose of expressing an opinion on the effectiveness of the Funds’ internal control over financial reporting. Accordingly, we express no such opinion. An audit also includes examining, on a test basis, evidence supporting the amounts and disclosures in the financial statements, assessing the accounting principles used and significant estimates made by management, as well as evaluating the overall financial statement presentation. Our procedures included confirmation of securities owned as of March 31, 2009, by correspondence with the custodian. We believe that our audits provide a reasonable basis for our opinion.
In our opinion, the financial statements and financial highlights referred to above present fairly, in all material respects, the financial positions of Eaton Vance California Limited Maturity Municipals Fund, Eaton Vance Massachusetts Limited Maturity Municipals Fund, Eaton Vance New Jersey Limited Maturity Municipals Fund, Eaton Vance New York Limited Maturity Municipals Fund, Eaton Vance Ohio Limited Maturity Municipals Fund and Eaton Vance Pennsylvania Limited Maturity Municipals Fund as of March 31, 2009, the results of their operations for the year then ended, the changes in their net assets for each of the two years in the period then ended, and the financial highlights for the periods presented, in conformity with accounting principles generally accepted in the United States of America.
DELOITTE & TOUCHE LLP
Boston, Massachusetts
May 15, 2009
74
Eaton Vance Limited Maturity Municipals Funds as of March 31, 2009
FEDERAL TAX INFORMATION (Unaudited)
The Form 1099-DIV you receive in January 2010 will show the tax status of all distributions paid to your account in calendar 2009. Shareholders are advised to consult their own tax adviser with respect to the tax consequences of their investment in a Fund. As required by the Internal Revenue Code regulations, shareholders must be notified within 60 days of a Fund’s fiscal year end regarding the status of exempt-interest dividends.
Exempt-Interest Dividends — The Funds designate the following amounts of dividends from net investment income as an exempt-interest dividend.
| | | | | |
| California Limited Maturity Municipals Fund | | | 99.99 | % |
| Massachusetts Limited Maturity Municipals Fund | | | 100.00 | % |
| New Jersey Limited Maturity Municipals Fund | | | 98.91 | % |
| New York Limited Maturity Municipals Fund | | | 99.01 | % |
| Ohio Limited Maturity Municipals Fund | | | 100.00 | % |
| Pennsylvania Limited Maturity Municipals Fund | | | 99.90 | % |
75
Eaton Vance Limited Maturity Municipals Funds as of March 31, 2009
SPECIAL MEETING OF SHAREHOLDERS (Unaudited)
Eaton Vance California Limited Maturity Municipals Fund
The Fund held a Special Meeting of Shareholders on November 14, 2008 to elect Trustees. The results of the vote were as follows:
| | | | | | | | | | | |
| | | Number of Shares | | | |
| Nominee for Trustee | | For | | | Withheld | | | |
| |
| |
| Benjamin C. Esty | | | 2,742,511 | | | | 4,896 | | | |
| Thomas E. Faust Jr. | | | 2,742,511 | | | | 4,896 | | | |
| Allen R. Freedman | | | 2,742,511 | | | | 4,896 | | | |
| William H. Park | | | 2,742,511 | | | | 4,896 | | | |
| Ronald A. Pearlman | | | 2,742,511 | | | | 4,896 | | | |
| Helen Frame Peters | | | 2,745,014 | | | | 2,393 | | | |
| Heidi L. Steiger | | | 2,745,014 | | | | 2,393 | | | |
| Lynn A. Stout | | | 2,745,014 | | | | 2,393 | | | |
| Ralph F. Verni | | | 2,742,511 | | | | 4,896 | | | |
Eaton Vance Massachusetts Limited Maturity Municipals Fund
The Fund held a Special Meeting of Shareholders on November 14, 2008 to elect Trustees. The results of the vote were as follows:
| | | | | | | | | | | |
| | | Number of Shares | | | |
| Nominee for Trustee | | For | | | Withheld | | | |
| |
| |
| Benjamin C. Esty | | | 5,602,016 | | | | 20,438 | | | |
| Thomas E. Faust Jr. | | | 5,593,011 | | | | 29,443 | | | |
| Allen R. Freedman | | | 5,591,245 | | | | 31,209 | | | |
| William H. Park | | | 5,602,016 | | | | 20,438 | | | |
| Ronald A. Pearlman | | | 5,602,016 | | | | 20,438 | | | |
| Helen Frame Peters | | | 5,593,011 | | | | 29,443 | | | |
| Heidi L. Steiger | | | 5,591,245 | | | | 31,209 | | | |
| Lynn A. Stout | | | 5,602,016 | | | | 20,438 | | | |
| Ralph F. Verni | | | 5,602,016 | | | | 20,438 | | | |
Eaton Vance New Jersey Limited Maturity Municipals Fund
The Fund held a Special Meeting of Shareholders on November 14, 2008 to elect Trustees. The results of the vote were as follows:
| | | | | | | | | | | |
| | | Number of Shares | | | |
| Nominee for Trustee | | For | | | Withheld | | | |
| |
| |
| Benjamin C. Esty | | | 3,481,841 | | | | 20,593 | | | |
| Thomas E. Faust Jr. | | | 3,481,841 | | | | 20,593 | | | |
| Allen R. Freedman | | | 3,472,691 | | | | 29,743 | | | |
| William H. Park | | | 3,481,841 | | | | 20,593 | | | |
| Ronald A. Pearlman | | | 3,472,691 | | | | 29,743 | | | |
| Helen Frame Peters | | | 3,482,452 | | | | 19,982 | | | |
| Heidi L. Steiger | | | 3,480,004 | | | | 22,430 | | | |
| Lynn A. Stout | | | 3,482,452 | | | | 19,982 | | | |
| Ralph F. Verni | | | 3,479,393 | | | | 23,041 | | | |
76
Eaton Vance Limited Maturity Municipals Funds as of March 31, 2009
SPECIAL MEETING OF SHAREHOLDERS (Unaudited) CONT’D
Eaton Vance New York Limited Maturity Municipals Fund
The Fund held a Special Meeting of Shareholders on November 14, 2008 to elect Trustees. The results of the vote were as follows:
| | | | | | | | | | | |
| | | Number of Shares | | | |
| Nominee for Trustee | | For | | | Withheld | | | |
| |
| |
| Benjamin C. Esty | | | 7,945,187 | | | | 601,542 | | | |
| Thomas E. Faust Jr. | | | 7,945,187 | | | | 601,542 | | | |
| Allen R. Freedman | | | 7,945,187 | | | | 601,542 | | | |
| William H. Park | | | 7,945,187 | | | | 601,542 | | | |
| Ronald A. Pearlman | | | 7,945,187 | | | | 601,542 | | | |
| Helen Frame Peters | | | 7,945,187 | | | | 601,542 | | | |
| Heidi L. Steiger | | | 7,945,187 | | | | 601,542 | | | |
| Lynn A. Stout | | | 7,945,187 | | | | 601,542 | | | |
| Ralph F. Verni | | | 7,945,187 | | | | 601,542 | | | |
Eaton Vance Ohio Limited Maturity Municipals Fund
The Fund held a Special Meeting of Shareholders on November 14, 2008 to elect Trustees. The results of the vote were as follows:
| | | | | | | | | | | |
| | | Number of Shares | | | |
| Nominee for Trustee | | For | | | Withheld | | | |
| |
| |
| Benjamin C. Esty | | | 1,842,861 | | | | 17,114 | | | |
| Thomas E. Faust Jr. | | | 1,842,862 | | | | 17,113 | | | |
| Allen R. Freedman | | | 1,842,861 | | | | 17,114 | | | |
| William H. Park | | | 1,842,862 | | | | 17,113 | | | |
| Ronald A. Pearlman | | | 1,842,862 | | | | 17,113 | | | |
| Helen Frame Peters | | | 1,842,862 | | | | 17,113 | | | |
| Heidi L. Steiger | | | 1,842,861 | | | | 17,114 | | | |
| Lynn A. Stout | | | 1,842,862 | | | | 17,113 | | | |
| Ralph F. Verni | | | 1,842,862 | | | | 17,113 | | | |
Eaton Vance Pennsylvania Limited Maturity Municipals Fund
The Fund held a Special Meeting of Shareholders on November 14, 2008 to elect Trustees. The results of the vote were as follows:
| | | | | | | | | | | |
| | | Number of Shares | | | |
| Nominee for Trustee | | For | | | Withheld | | | |
| |
| |
| Benjamin C. Esty | | | 4,703,449 | | | | 45,653 | | | |
| Thomas E. Faust Jr. | | | 4,696,267 | | | | 52,835 | | | |
| Allen R. Freedman | | | 4,702,857 | | | | 46,245 | | | |
| William H. Park | | | 4,696,267 | | | | 52,835 | | | |
| Ronald A. Pearlman | | | 4,701,964 | | | | 47,138 | | | |
| Helen Frame Peters | | | 4,699,899 | | | | 49,203 | | | |
| Heidi L. Steiger | | | 4,699,899 | | | | 49,203 | | | |
| Lynn A. Stout | | | 4,700,491 | | | | 48,611 | | | |
| Ralph F. Verni | | | 4,696,267 | | | | 52,835 | | | |
77
Eaton Vance Limited Maturity Municipals Funds
BOARD OF TRUSTEES’ ANNUAL APPROVAL OF THE INVESTMENT ADVISORY AGREEMENTS
Overview of the Contract Review Process
The Investment Company Act of 1940, as amended (the “1940 Act”), provides, in substance, that each investment advisory agreement between a fund and its investment adviser will continue in effect from year to year only if its continuance is approved at least annually by the fund’s board of trustees, including by a vote of a majority of the trustees who are not “interested persons” of the fund (“Independent Trustees”), cast in person at a meeting called for the purpose of considering such approval.
At a meeting of the Boards of Trustees (each a “Board”) of the Eaton Vance group of mutual funds (the “Eaton Vance Funds”) held on April 21, 2008, the Board, including a majority of the Independent Trustees, voted to approve continuation of existing advisory and sub-advisory agreements for the Eaton Vance Funds for an additional one-year period. In voting its approval, the Board relied upon the affirmative recommendation of the Contract Review Committee of the Board (formerly the Special Committee), which is a committee comprised exclusively of Independent Trustees. Prior to making its recommendation, the Contract Review Committee reviewed information furnished for a series of meetings of the Contract Review Committee held in February, March and April 2008. Such information included, among other things, the following:
Information about Fees, Performance and Expenses
| | |
| | • | An independent report comparing the advisory and related fees paid by each fund with fees paid by comparable funds; |
| | • | An independent report comparing each fund’s total expense ratio and its components to comparable funds; |
| | • | An independent report comparing the investment performance of each fund to the investment performance of comparable funds over various time periods; |
| | • | Data regarding investment performance in comparison to relevant peer groups of funds and appropriate indices; |
| | • | Comparative information concerning fees charged by each adviser for managing other mutual funds and institutional accounts using investment strategies and techniques similar to those used in managing the fund; |
| | • | Profitability analyses for each adviser with respect to each fund; |
Information about Portfolio Management
| | |
| | • | Descriptions of the investment management services provided to each fund, including the investment strategies and processes employed, and any changes in portfolio management processes and personnel; |
| | • | Information concerning the allocation of brokerage and the benefits received by each adviser as a result of brokerage allocation, including information concerning the acquisition of research through “soft dollar” benefits received in connection with the funds’ brokerage, and the implementation of a soft dollar reimbursement program established with respect to the funds; |
| | • | Data relating to portfolio turnover rates of each fund; |
| | • | The procedures and processes used to determine the fair value of fund assets and actions taken to monitor and test the effectiveness of such procedures and processes; |
Information about each Adviser
| | |
| | • | Reports detailing the financial results and condition of each adviser; |
| | • | Descriptions of the qualifications, education and experience of the individual investment professionals whose responsibilities include portfolio management and investment research for the funds, and information relating to their compensation and responsibilities with respect to managing other mutual funds and investment accounts; |
| | • | Copies of the Codes of Ethics of each adviser and its affiliates, together with information relating to compliance with and the administration of such codes; |
| | • | Copies of or descriptions of each adviser’s proxy voting policies and procedures; |
| | • | Information concerning the resources devoted to compliance efforts undertaken by each adviser and its affiliates on behalf of the funds (including descriptions of various compliance programs) and their record of compliance with investment policies and restrictions, including policies with respect to market-timing, late trading and selective portfolio disclosure, and with policies on personal securities transactions; |
| | • | Descriptions of the business continuity and disaster recovery plans of each adviser and its affiliates; |
Other Relevant Information
| | |
| | • | Information concerning the nature, cost and character of the administrative and other non-investment management services provided by Eaton Vance Management and its affiliates; |
| | • | Information concerning management of the relationship with the custodian, subcustodians and fund accountants by each adviser or the funds’ administrator; and |
| | • | The terms of each advisory agreement. |
78
Eaton Vance Limited Maturity Municipals Funds
BOARD OF TRUSTEES’ ANNUAL APPROVAL OF THE INVESTMENT ADVISORY AGREEMENTS CONT’D
In addition to the information identified above, the Contract Review Committee considered information provided from time to time by each adviser throughout the year at meetings of the Board and its committees. Over the course of the twelve-month period ended April 30, 2008, the Board met eleven times and the Contract Review Committee, the Audit Committee and the Governance Committee, each of which is a Committee comprised solely of Independent Trustees, met twelve, seven and five times, respectively. At such meetings, the Trustees received, among other things, presentations by the portfolio managers and other investment professionals of each adviser relating to the investment performance of each fund and the investment strategies used in pursuing the fund’s investment objective. The Portfolio Management Committee and the Compliance Reports and Regulatory Matters Committee are newly established and did not meet during the twelve-month period ended April 30, 2008.
For funds that invest through one or more underlying portfolios, the Board considered similar information about the portfolio(s) when considering the approval of advisory agreements. In addition, in cases where the fund’s investment adviser has engaged a sub-adviser, the Board considered similar information about the sub-adviser when considering the approval of any sub-advisory agreement.
The Contract Review Committee was assisted throughout the contract review process by Goodwin Procter LLP, legal counsel for the Independent Trustees. The members of the Contract Review Committee relied upon the advice of such counsel and their own business judgment in determining the material factors to be considered in evaluating each advisory and sub-advisory agreement and the weight to be given to each such factor. The conclusions reached with respect to each advisory and sub-advisory agreement were based on a comprehensive evaluation of all the information provided and not any single factor. Moreover, each member of the Contract Review Committee may have placed varying emphasis on particular factors in reaching conclusions with respect to each advisory and sub-advisory agreement.
Results of the Process
Based on its consideration of the foregoing, and such other information as it deemed relevant, including the factors and conclusions described below, the Contract Review Committee concluded that the continuance of the investment advisory agreements of the following funds:
Eaton Vance California Limited Maturity Municipals Fund
Eaton Vance Massachusetts Limited Maturity Municipals Fund
Eaton Vance New Jersey Limited Maturity Municipals Fund
Eaton Vance New York Limited Maturity Municipals Fund
Eaton Vance Ohio Limited Maturity Municipals Fund
Eaton Vance Pennsylvania Limited Maturity Municipals Fund
(the “Funds”), each with Boston Management and Research (the “Adviser”), including their fee structures, is in the interests of shareholders and, therefore, the Contract Review Committee recommended to the Board approval of each agreement. The Board accepted the recommendation of the Contract Review Committee as well as the factors considered and conclusions reached by the Contract Review Committee with respect to each agreement. Accordingly, the Board, including a majority of the Independent Trustees, voted to approve continuation of the investment advisory agreement for each Fund.
Nature, Extent and Quality of Services
In considering whether to approve the investment advisory agreements of the Funds, the Board evaluated the nature, extent and quality of services provided to the Funds by the Adviser.
The Board considered the Adviser’s management capabilities and investment process with respect to the types of investments held by each Fund, including the education, experience and number of its investment professionals and other personnel who provide portfolio management, investment research, and similar services to the Funds. In particular, the Board evaluated the abilities and experience of such investment personnel in analyzing factors such as credit risk, tax efficiency, and special considerations relevant to investing in municipal obligations. Specifically, the Board considered the Adviser’s large municipal bond team, which includes portfolio managers and credit specialists who provide services to the Funds. The Board also took into account the resources dedicated to portfolio management and other services, including the compensation paid to recruit and retain investment personnel, and the time and attention devoted to each Fund by senior management.
The Board also reviewed the compliance programs of the Adviser and relevant affiliates thereof. Among other matters, the Board considered compliance and reporting matters relating to personal trading by investment personnel, selective disclosure of portfolio holdings, late trading, frequent trading, portfolio valuation, business continuity and the allocation of investment opportunities. The Board also evaluated the responses of the Adviser and its affiliates to requests from regulatory authorities such as the Securities and Exchange Commission.
79
Eaton Vance Limited Maturity Municipals Funds
BOARD OF TRUSTEES’ ANNUAL APPROVAL OF THE INVESTMENT ADVISORY AGREEMENTS CONT’D
The Board also considered shareholder and other administrative services provided or managed by Eaton Vance Management and its affiliates, including transfer agency and accounting services. The Board evaluated the benefits to shareholders of investing in a fund that is a part of a large family of funds, including the ability, in many cases, to exchange an investment among different funds without incurring additional sales charges.
After consideration of the foregoing factors, among others, the Board concluded that the nature, extent and quality of services provided by the Adviser, taken as a whole, are appropriate and consistent with the terms of the respective investment advisory agreement.
Fund Performance
The Board compared each Fund’s investment performance to a relevant universe of similarly managed funds identified by an independent data provider and appropriate benchmark indices. The Board reviewed comparative performance data for the one-, three-, five- and ten-year periods ended September 30, 2007 for each Fund in operation over such periods. On the basis of the foregoing and other relevant information, the Board concluded that the performance of each Fund was satisfactory.
Management Fees and Expenses
The Board reviewed contractual investment advisory fee rates, including any administrative fee rates, payable by each Fund (referred to collectively as “management fees”). As part of its review, the Board considered each Fund’s management fee and total expense ratio for the one year period ended September 30, 2007, as compared to a group of similarly managed funds selected by an independent data provider.
After reviewing the foregoing information, and in light of the nature, extent and quality of the services provided by the Adviser, the Board concluded with respect to each Fund that the management fees charged to the Fund for advisory and related services and the total expense ratio of the Fund are reasonable.
Profitability
The Board reviewed the level of profits realized by the Adviser and, if applicable, its affiliates in providing investment advisory and administrative services to each Fund and to all Eaton Vance Funds as a group. The Board considered the level of profits realized without regard to revenue sharing or other payments by the Adviser and its affiliates to third parties in respect of distribution services. The Board also considered other direct or indirect benefits received by the Adviser and its affiliates in connection with their relationship with the Funds.
The Board concluded that, in light of the foregoing factors and the nature, extent and quality of the services rendered, the profits realized by the Adviser and its affiliates are reasonable.
Economies of Scale
In reviewing management fees and profitability, the Board also considered the extent to which the Adviser and its affiliates, on the one hand, and each Fund, on the other hand, can expect to realize benefits from economies of scale as the assets of the Fund increase. The Board acknowledged the difficulty in accurately measuring the benefits resulting from the economies of scale with respect to the management of any specific fund or group of funds. The Board reviewed data summarizing the increases and decreases in the assets of each Fund and of all Eaton Vance Funds as a group over various time periods, and evaluated the extent to which the total expense ratio of each Fund and the profitability of the Adviser and its affiliates may have been affected by such increases or decreases. Based upon the foregoing, the Board concluded that the benefits from economies of scale are currently being shared equitably by the Adviser and its affiliates and each Fund. The Board also concluded that, assuming reasonably foreseeable increases in the assets of each Fund, the structure of each advisory fee, which includes breakpoints at several asset levels, can be expected to cause the Adviser and its affiliates and the Fund to continue to share such benefits equitably.
80
Eaton Vance Limited Maturity Municipals Funds
MANAGEMENT AND ORGANIZATION
Fund Management. The Trustees of Eaton Vance Investment Trust (the Trust) are responsible for the overall management and supervision of the Trust’s affairs. The Trustees and officers of the Trust are listed below. Except as indicated, each individual has held the office shown or other offices in the same company for the last five years. Trustees and officers of the Trust hold indefinite terms of office. The “noninterested Trustees” consist of those Trustees who are not “interested persons” of the Trust, as that term is defined under the 1940 Act. The business address of each Trustee and officer is Two International Place, Boston, Massachusetts 02110. As used below, “EVC” refers to Eaton Vance Corp., “EV” refers to Eaton Vance, Inc., “EVM” refers to Eaton Vance Management, “BMR” refers to Boston Management and Research and “EVD” refers to Eaton Vance Distributors, Inc. EVC and EV are the corporate parent and trustee, respectively, of EVM and BMR. EVD is the Funds’ principal underwriter and a wholly-owned subsidiary of EVC. Each officer affiliated with Eaton Vance may hold a position with other Eaton Vance affiliates that is comparable to his or her position with EVM listed below.
| | | | | | | | | | | | | |
| | | | | Term of
| | | | Number of Portfolios
| | | |
| | | Position(s)
| | Office and
| | | | in Fund Complex
| | | |
Name and
| | with the
| | Length of
| | Principal Occupation(s)
| | Overseen By
| | | |
| Date of Birth | | Trust | | Service | | During Past Five Years | | Trustee(1) | | | Other Directorships Held |
| |
| |
| |
| Interested Trustee |
| | | | | | | | | | | | | |
Thomas E. Faust Jr.
5/31/58 | | Trustee | | Since 2007 | | Chairman, Chief Executive Officer and President of EVC, Director and President of EV, Chief Executive Officer and President of EVM and BMR, and Director of EVD. Trustee and/or Officer of 174 registered investment companies and 4 private companies managed by EVM or BMR. Mr. Faust is an interested person because of his positions with EVM, BMR, EVD, EVC and EV, which are affiliates of the Trust. | | | 174 | | | Director of EVC |
| |
| Noninterested Trustees |
| | | | | | | | | | | | | |
Benjamin C. Esty
1/2/63 | | Trustee | | Since 2005 | | Roy and Elizabeth Simmons Professor of Business Administration, Harvard University Graduate School of Business Administration. | | | 174 | | | None |
| | | | | | | | | | | | | |
Allen R. Freedman
4/3/40 | | Trustee | | Since 2007 | | Former Chairman (2002-2004) and a Director (1983-2004) of Systems & Computer Technology Corp. (provider of software to higher education). Formerly, a Director of Loring Ward International (fund distributor) (2005-2007). Formerly, Chairman and a Director of Indus International, Inc. (provider of enterprise management software to the power generating industry) (2005-2007). | | | 174 | | | Director of Assurant, Inc. (insurance provider) and Stonemor Partners, L.P. (owner and operator of cemeteries) |
| | | | | | | | | | | | | |
William H. Park
9/19/47 | | Trustee | | Since 2003 | | Vice Chairman, Commercial Industrial Finance Corp. (specialty finance company) (since 2006). Formerly, President and Chief Executive Officer, Prizm Capital Management, LLC (investment management firm) (2002-2005). | | | 174 | | | None |
| | | | | | | | | | | | | |
Ronald A. Pearlman
7/10/40 | | Trustee | | Since 2003 | | Professor of Law, Georgetown University Law Center. | | | 174 | | | None |
| | | | | | | | | | | | | |
Helen Frame Peters
3/22/48 | | Trustee | | Since 2008 | | Professor of Finance, Carroll School of Management, Boston College. Adjunct Professor of Finance, Peking University, Beijing, China (since 2005). | | | 174 | | | Director of Federal Home Loan Bank of Boston (a bank for banks) and BJ’s Wholesale Clubs (wholesale club retailer); Trustee of SPDR Index Shares Funds and SPDR Series Trust (exchange traded funds) |
| | | | | | | | | | | | | |
Heidi L. Steiger
7/8/53 | | Trustee | | Since 2007 | | Managing Partner, Topridge Associates LLC (global wealth management firm) (since 2008); Senior Advisor (since 2008), President (2005-2008), Lowenhaupt Global Advisors, LLC (global wealth management firm). Formerly, President and Contributing Editor, Worth Magazine (2004-2005). Formerly, Executive Vice President and Global Head of Private Asset Management (and various other positions), Neuberger Berman (investment firm) (1986-2004). | | | 174 | | | Director of Nuclear Electric Insurance Ltd. (nuclear insurance provider) and Aviva USA (insurance provider) |
81
Eaton Vance Limited Maturity Municipals Funds
MANAGEMENT AND ORGANIZATION CONT’D
| | | | | | | | | | | | | |
| | | | | Term of
| | | | Number of Portfolios
| | | |
| | | Position(s)
| | Office and
| | | | in Fund Complex
| | | |
Name and
| | with the
| | Length of
| | Principal Occupation(s)
| | Overseen By
| | | |
| Date of Birth | | Trust | | Service | | During Past Five Years | | Trustee(1) | | | Other Directorships Held |
| |
| |
| Noninterested Trustees (continued) |
| | | | | | | | | | | | | |
Lynn A. Stout
9/14/57 | | Trustee | | Since 1998 | | Paul Hastings Professor of Corporate and Securities Law (since 2006) and Professor of Law (2001-2006), University of California at Los Angeles School of Law. | | | 174 | | | None |
| | | | | | | | | | | | | |
Ralph F. Verni
1/26/43 | | Chairman of
the Board
and Trustee | | Chairman of the Board since 2007 and Trustee since 2005 | | Consultant and private investor. | | | 174 | | | None |
Principal Officers who are not Trustees
| | | | | | | |
| | | | | Term of
| | |
| | | Position(s)
| | Office and
| | |
Name and
| | with the
| | Length of
| | Principal Occupation(s)
|
| Date of Birth | | Trust | | Service | | During Past Five Years |
| |
| |
| | | | | | | |
Cynthia J. Clemson
3/2/63 | | President | | Since 2005 | | Vice President of EVM and BMR. Officer of 92 registered investment companies managed by EVM or BMR. |
| | | | | | | |
William H. Ahern, Jr.
7/28/59 | | Vice President | | Since 2004 | | Vice President of EVM and BMR. Officer of 76 registered investment companies managed by EVM or BMR. |
| | | | | | | |
Craig R. Brandon
12/21/66 | | Vice President | | Since 2004 | | Vice President of EVM and BMR. Officer of 45 registered investment companies managed by EVM or BMR. |
| | | | | | | |
Robert B. MacIntosh
1/22/57 | | Vice President | | Since 1993 | | Vice President of EVM and BMR. Officer of 92 registered investment companies managed by EVM or BMR. |
| | | | | | | |
Thomas M. Metzold
8/3/58 | | Vice President | | Since 2004 | | Vice President of EVM and BMR. Officer of 46 registered investment companies managed by EVM or BMR. |
| | | | | | | |
Adam A. Weigold
3/22/75 | | Vice President | | Since 2007 | | Vice President of EVM and BMR. Officer of 72 registered investment companies managed by EVM or BMR. |
| | | | | | | |
Barbara E. Campbell
6/19/57 | | Treasurer | | Since 2005 | | Vice President of EVM and BMR. Officer of 174 registered investment companies managed by EVM or BMR. |
| | | | | | | |
Maureen A. Gemma
5/24/60 | | Secretary and Chief Legal Officer | | Secretary since 2007 and Chief Legal Officer since 2008 | | Vice President of EVM and BMR. Officer of 174 registered investment companies managed by EVM or BMR. |
| | | | | | | |
Paul M. O’Neil
7/11/53 | | Chief Compliance Officer | | Since 2004 | | Vice President of EVM and BMR. Officer of 174 registered investment companies managed by EVM or BMR. |
| | |
| (1) | | Includes both master and feeder funds in a master-feeder structure. |
The SAI for the Funds includes additional information about the Trustees and officers of the Funds and can be obtained without charge on Eaton Vance’s website at www.eatonvance.com or by calling 1-800-262-1122.
82
This Page Intentionally Left Blank
This Page Intentionally Left Blank
Investment Adviser
Boston Management and Research
Two International Place
Boston, MA 02110
Fund Administrator
Eaton Vance Management
Two International Place
Boston, MA 02110
Principal Underwriter
Eaton Vance Distributors, Inc.
Two International Place
Boston, MA 02110
(617) 482-8260
Custodian
State Street Bank and Trust Company
200 Clarendon Street
Boston, MA 02116
Transfer Agent
PNC Global Investment Servicing
Attn: Eaton Vance Funds
P.O. Box 9653
Providence, RI 02940-9653
(800) 262-1122
Independent Registered Public Accounting Firm
Deloitte & Touche LLP
200 Berkeley Street
Boston, MA 02116-5022
Eaton Vance Investment Trust
Two International Place
Boston, MA 02110
This report must be preceded or accompanied by a current prospectus. Before investing, investors should consider carefully a Fund’s investment
objective(s), risks, and charges and expenses. The Funds’ current prospectus contains this and other information about the Funds and is available
through your financial advisor. Please read the prospectus carefully before you invest or send money. For further information please call 1-800-262-1122.
Item 2. Code of Ethics
The registrant has adopted a code of ethics applicable to its Principal Executive Officer, Principal Financial Officer and Principal Accounting Officer. The registrant undertakes to provide a copy of such code of ethics to any person upon request, without charge, by calling 1-800-262-1122.
Item 3. Audit Committee Financial Expert
The registrant’s Board has designated William H. Park, an independent trustee, as its audit committee financial expert. Mr. Park is a certified public accountant who is the Vice Chairman of Commercial Industrial Finance Corp (specialty finance company). Previously, he served as President and Chief
Executive Officer of Prizm Capital Management, LLC (investment management firm) and as Executive Vice President and Chief Financial Officer of United Asset Management Corporation (“UAM”) (a holding company owning institutional investment management firms).
Item 4. Principal Accountant Fees and Services
Eaton Vance California Limited Maturity Municipals Fund, Eaton Vance AMT-Free Limited Maturity Municipals Fund, Eaton Vance Massachusetts Limited Maturity Municipals Fund, Eaton Vance National Limited Maturity Municipals Fund, Eaton Vance New Jersey Limited Maturity Municipals Fund, Eaton Vance New York Limited Maturity Municipals Fund, Eaton Vance Ohio Limited Maturity Municipals Fund and Eaton Vance Pennsylvania Limited Maturity Municipals Fund (the “Fund(s)”) are the series of Eaton Vance Investment Trust (the “Trust”), a Massachusetts business trust. The Trust is registered under the Investment Company Act of 1940 as an open-end management investment company.
The following tables present the aggregate fees billed to each Fund for the Fund’s respective fiscal years ended March 31, 2008 and March 31, 2009 by the Fund’s principal accountant for professional services rendered for the audit of the Fund’s annual financial statements and fees billed for other services rendered by the principal accountant during those periods.
Eaton Vance California Limited Maturity Municipals Fund
| | | | | | | | | |
| Fiscal Years Ended | | 03/31/2008 | | 03/31/2009 |
| |
| Audit Fees | | $ | 25,320 | | | $ | 24,965 | |
| |
Audit-Related Fees(1) | | $ | 0 | | | | 0 | |
| |
Tax Fees(2) | | $ | 7,535 | | | $ | 7,800 | |
| |
All Other Fees(3) | | $ | 29 | | | $ | 0 | |
| | | |
| |
| Total | | $ | 32,884 | | | $ | 32,765 | |
| | | |
Eaton Vance AMT-Free Limited Maturity Municipals Fund
| | | | | | | | | |
| Fiscal Years Ended | | 03/31/2008 | | 03/31/2009 |
| |
| Audit Fees | | $ | 27,950 | | | $ | 27,685 | |
| |
Audit-Related Fees(1) | | $ | 0 | | | $ | 0 | |
| |
Tax Fees(2) | | $ | 7,535 | | | $ | 7,800 | |
| |
All Other Fees(3) | | $ | 33 | | | $ | 0 | |
| | | |
| |
| Total | | $ | 35,518 | | | $ | 35,485 | |
| | | |
Eaton Vance Massachusetts Limited Maturity Municipals Fund
| | | | | | | | | |
| Fiscal Years Ended | | 03/31/2008 | | 03/31/2009 |
| |
| Audit Fees | | $ | 29,670 | | | $ | 29,465 | |
| |
Audit-Related Fees(1) | | $ | 0 | | | $ | 0 | |
| |
Tax Fees(2) | | $ | 7,535 | | | $ | 7,800 | |
| |
All Other Fees(3) | | $ | 48 | | | $ | 0 | |
| | | |
| |
| Total | | $ | 37,253 | | | $ | 37,265 | |
| | | |
Eaton Vance National Limited Maturity Municipals Fund
| | | | | | | | | |
| Fiscal Years Ended | | 03/31/2008 | | 03/31/2009 |
| |
| Audit Fees | | $ | 48,390 | | | $ | 46,765 | |
| |
Audit-Related Fees(1) | | $ | 0 | | | $ | 0 | |
| |
Tax Fees(2) | | $ | 7,535 | | | $ | 7,800 | |
| |
All Other Fees(3) | | $ | 418 | | | $ | 0 | |
| | | |
| |
| Total | | $ | 56,343 | | | $ | 54,565 | |
| | | |
Eaton Vance New Jersey Limited Maturity Municipals Fund
| | | | | | | | | |
| Fiscal Years Ended | | 03/31/2008 | | 03/31/2009 |
| |
| Audit Fees | | $ | 30,250 | | | $ | 28,515 | |
| |
Audit-Related Fees(1) | | $ | 0 | | | $ | 0 | |
| |
Tax Fees(2) | | $ | 7,535 | | | $ | 7,800 | |
| |
All Other Fees(3) | | $ | 30 | | | $ | 0 | |
| | | |
| |
| Total | | $ | 37,815 | | | $ | 36,315 | |
| | | |
Eaton Vance New York Limited Maturity Municipals Fund
| | | | | | | | | |
| Fiscal Years Ended | | 03/31/2008 | | 03/31/2009 |
| |
| Audit Fees | | $ | 34,450 | | | $ | 32,345 | |
| |
Audit-Related Fees(1) | | $ | 0 | | | $ | 0 | |
| |
Tax Fees(2) | | $ | 7,535 | | | $ | 7,800 | |
| |
All Other Fees(3) | | $ | 74 | | | $ | 0 | |
| | | |
| |
| Total | | $ | 42,059 | | | $ | 40,145 | |
| | | |
Eaton Vance Ohio Limited Maturity Municipals Fund
| | | | | | | | | |
| Fiscal Years Ended | | 03/31/2008 | | 03/31/2009 |
| |
| Audit Fees | | $ | 23,670 | | | $ | 23,255 | |
| |
Audit-Related Fees(1) | | $ | 0 | | | $ | 0 | |
| |
Tax Fees(2) | | $ | 7,535 | | | $ | 7,800 | |
| |
All Other Fees(3) | | $ | 16 | | | $ | 0 | |
| | | |
| |
| Total | | $ | 31,221 | | | $ | 31,055 | |
| | | |
Eaton Vance Pennsylvania Limited Maturity Municipals Fund
| | | | | | | | | |
| Fiscal Years Ended | | 03/31/2008 | | 03/31/2009 |
| |
| Audit Fees | | $ | 27,950 | | | $ | 27,685 | |
| |
Audit-Related Fees(1) | | $ | 0 | | | $ | 0 | |
| |
Tax Fees(2) | | $ | 7,535 | | | $ | 7,800 | |
| |
All Other Fees(3) | | $ | 39 | | | $ | 0 | |
| | | |
| |
| Total | | $ | 35,524 | | | $ | 35,485 | |
| | | |
| | |
| (1) | | Audit-related fees consist of the aggregate fees billed for assurance and related services that are reasonably related to the performance of the audit of financial statements and are not reported under the category of audit fees. |
| |
| (2) | | Tax fees consist of the aggregate fees billed for professional services rendered by the principal accountant relating to tax compliance, tax advice, and tax planning and specifically include fees for tax return preparation. |
| |
| (3) | | All other fees consist of the aggregate fees billed for products and services provided by the principal accountant other than audit, audit-related, and tax services. |
The Funds, comprising all of the series of the Trust, have the same fiscal year end (March 31). The following table presents the aggregate audit, audit-related, tax, and other fees billed to the Trust by the principal accountant of each Fund, Deloitte & Touche LLP (“D&T”), for the last two fiscal years of the Funds.
| | | | | | | | | |
| Fiscal Years Ended | | 3/31/08 | | 3/31/09 |
| |
| Audit Fees | | $ | 247,650 | | | $ | 240,680 | |
| |
Audit-Related Fees(1) | | $ | 0 | | | $ | 0 | |
| |
Tax Fees(2) | | $ | 60,280 | | | $ | 62,400 | |
| |
All Other Fees(3) | | $ | 687 | | | $ | 0 | |
| | | |
| |
| Total | | $ | 308,617 | | | $ | 303,080 | |
| | | |
| | |
| (1) | | Audit-related fees consist of the aggregate fees billed for assurance and related services that are reasonably related to the performance of the audit of financial statements and are not reported under the category of audit fees. |
| |
| (2) | | Tax fees consist of the aggregate fees billed for professional services rendered by the principal accountant relating to tax compliance, tax advice, and tax planning and specifically include fees for tax return preparation. |
| |
| (3) | | All other fees consist of the aggregate fees billed for products and services provided by the principal accountant other than audit, audit-related, and tax services. |
During the Funds fiscal years ended March 31, 2008 and March 31, 2009, $35,000 and $40,000, respectively, was billed by “D&T”, the principal accountant for the Funds, for work done in connection with its Rule 17Ad-13 examination of Eaton Vance Management’s assertion that it has maintained an effective internal control; structure over the sub-transfer agent and registrar functions, such services being pre-approved in accordance with Rule 2-01(c)(7) (ii) of Regulation S-X.
(e)(1) The registrant’s audit committee has adopted policies and procedures relating to the pre-approval of services provided by the registrant’s principal accountant (the “Pre-Approval Policies”). The Pre-Approval Policies establish a framework intended to assist the audit committee in the proper discharge f its pre-approval responsibilities. As a general matter, the Pre-Approval Policies (i) specify certain types of audit, audit-related, tax, and other services determined to be pre-approved by the audit committee; and (ii) delineate specific procedures governing the mechanics of the pre-approval process, including the approval and monitoring of audit and non-audit service fees. Unless a service is specifically pre-approved under the Pre-Approval Policies, it must be separately pre-approved by the audit committee.
The Pre-Approval Policies and the types of audit and non-audit services pre-approved therein must be reviewed and ratified by the registrant’s audit committee at least annually. The registrant’s audit committee maintains full responsibility for the appointment, compensation, and oversight of the work of the registrant’s principal accountant.
(e)(2) No services described in paragraphs (b)-(d) above were approved by the registrant’s audit committee pursuant to the “de minimis exception” set forth in Rule 2-01(c)(7)(i)(C) of Regulation S-X.
(f) Not applicable.
(g) The following table presents (i) the aggregate non-audit fees (i.e., fees for audit-related, tax, and other services) billed for services rendered to all of the Series in the Trust by the Series’ principal accountant for the last two fiscal years of each Series; and (ii) the aggregate non-audit fees (i.e., fees for audit-related, tax, and other services) billed for services rendered to the Eaton Vance organization by D&T for the last two fiscal years of each Series.
| | | | | | | | | |
| Fiscal Years Ended | | 3/31/08 | | | 3/31/09 | |
| |
Registrant(1) | | $ | 60,967 | | | $ | 62,400 | |
| |
Eaton Vance(2) | | $ | 299,530 | | | $ | 343,889 | |
| | |
| (1) | | Includes all of the Series of the Trust. |
| |
| (2) | | The investment adviser to the Series, as well as any of its affiliates that provide ongoing services to the Series, are subsidiaries of Eaton Vance Corp. |
(h) The registrant’s audit committee has considered whether the provision by the registrant’s principal accountant of non-audit services to the registrant’s investment adviser and any entity controlling, controlled by, or under common control with the adviser that provides ongoing services to the registrant that were not pre-approved pursuant to Rule 2-01(c)(7)(ii) of Regulation S-X is compatible with maintaining the principal accountant’s independence.
Item 5. Audit Committee of Listed registrants
Not required in this filing.
Item 6. Schedule of Investments
Please see schedule of investments contained in the Report to Stockholders included under Item 1 of this Form N-CSR.
Item 7. Disclosure of Proxy Voting Policies and Procedures for Closed-End Management Investment Companies
Not required in this filing.
Item 8. Portfolio Managers of Closed-End Management Investment Companies
Not required in this filing.
Item 9. Purchases of Equity Securities by Closed-End Management Investment Company and Affiliated Purchasers.
Not required in this filing.
Item 10. Submission of Matters to a Vote of Security Holders.
No Material Changes.
Item 11. Controls and Procedures
(a) It is the conclusion of the registrant’s principal executive officer and principal financial officer that the effectiveness of the registrant’s current disclosure controls and procedures (such disclosure controls and procedures having been evaluated within 90 days of the date of this filing) provide reasonable assurance that the information required to be disclosed by the registrant has been recorded, processed, summarized and reported within the time period specified in the Commission’s rules and forms and that
the information required to be disclosed by the registrant has been accumulated and communicated to the registrant’s principal executive officer and principal financial officer in order to allow timely decisions regarding required disclosure.
(b) There have been no changes in the registrant’s internal controls over financial reporting during the second fiscal quarter of the period covered by this report that has materially affected, or is reasonably likely to materially affect, the registrant’s internal control over financial reporting.
Item 12. Exhibits
| | | |
| (a)(1) | | Registrant’s Code of Ethics – Not applicable (please see Item 2). |
| (a)(2)(i) | | Treasurer’s Section 302 certification. |
| (a)(2)(ii) | | President’s Section 302 certification. |
| (b) | | Combined Section 906 certification. |
Signatures
Pursuant to the requirements of the Securities Exchange Act of 1934 and the Investment Company Act of 1940, the registrant has duly caused this report to be signed on its behalf by the undersigned, thereunto duly authorized.
Eaton Vance Investment Trust
| | | | | |
| By: | /s/ Cynthia J. Clemson | |
| | | Cynthia J. Clemson | |
| | | President | |
Date: May 12, 2009
Pursuant to the requirements of the Securities Exchange Act of 1934 and the Investment Company Act of 1940, this report has been signed below by the following persons on behalf of the registrant and in the capacities and on the dates indicated.
| | | | | |
| By: | /s/ Barbara E. Campbell | |
| | | Barbara E. Campbell | |
| | | Treasurer | |
Date: May 12, 2009
| | | | | |
| By: | /s/ Cynthia J. Clemson | |
| | | Cynthia J. Clemson | |
| | | President | |
Date: May 12, 2009