UNITED STATES
SECURITIES AND EXCHANGE COMMISSION
Washington, D.C. 20549
FORM N-CSR
CERTIFIED SHAREHOLDER REPORT OF REGISTERED
MANAGEMENT INVESTMENT COMPANIES
Investment Company Act file number | 811-04443 |
|
Eaton Vance Investment Trust |
(Exact name of registrant as specified in charter) |
|
The Eaton Vance Building, 255 State Street, Boston, Massachusetts | | 02109 |
(Address of principal executive offices) | | (Zip code) |
|
Maureen A. Gemma
The Eaton Vance Building, 255 State Street, Boston, Massachusetts 02109 |
(Name and address of agent for service) |
|
Registrant’s telephone number, including area code: | (617) 482-8260 | |
|
Date of fiscal year end: | March 31 | |
|
Date of reporting period: | March 31, 2008 | |
| | | | | | | | |
Item 1. Reports to Stockholders

Annual Report March 31, 2008


EATON VANCE
NATIONAL
LIMITED
MATURITY
MUNICIPALS
FUND
IMPORTANT NOTICES REGARDING PRIVACY,
DELIVERY OF SHAREHOLDER DOCUMENTS,
PORTFOLIO HOLDINGS AND PROXY VOTING
Privacy. The Eaton Vance organization is committed to ensuring your financial privacy. Each of the financial institutions identified below has in effect the following policy ("Privacy Policy") with respect to nonpublic personal information about
its customers:
• Only such information received from you, through application forms or otherwise, and information about your Eaton Vance fund transactions will be collected. This may include information such as name, address, social security number, tax status, account balances and transactions.
• None of such information about you (or former customers) will be disclosed to anyone, except as permitted by law (which includes disclosure to employees necessary to service your account). In the normal course of servicing a customer's account, Eaton Vance may share information with unaffiliated third parties that perform various required services such as transfer agents, custodians and broker/dealers.
• Policies and procedures (including physical, electronic and procedural safeguards) are in place that are designed to protect the confidentiality of such information.
• We reserve the right to change our Privacy Policy at any time upon proper notification to you. Customers may want to review our Policy periodically for changes by accessing the link on our homepage: www.eatonvance.com.
Our pledge of privacy applies to the following entities within the Eaton Vance organization: the Eaton Vance Family of Funds, Eaton Vance Management, Eaton Vance Investment Counsel, Boston Management and Research, and Eaton Vance Distributors, Inc.
In addition, our Privacy Policy only applies to those Eaton Vance customers who are individuals and who have a direct relationship with us. If a customer's account (i.e., fund shares) is held in the name of a third-party financial adviser/broker-dealer, it is likely that only such adviser's privacy policies apply to the customer. This notice supersedes all previously issued privacy disclosures.
For more information about Eaton Vance's Privacy Policy, please call 1-800-262-1122.
Delivery of Shareholder Documents. The Securities and Exchange Commission (the "SEC") permits funds to deliver only one copy of shareholder documents, including prospectuses, proxy statements and shareholder reports, to fund investors with multiple accounts at the same residential or post office box address. This practice is often called "householding" and it helps eliminate duplicate mailings to shareholders.
Eaton Vance, or your financial adviser, may household the mailing of your documents indefinitely unless you instruct Eaton Vance, or your financial adviser, otherwise.
If you would prefer that your Eaton Vance documents not be householded, please contact Eaton Vance at 1-800-262-1122, or contact your financial adviser.
Your instructions that householding not apply to delivery of your Eaton Vance documents will be effective within 30 days of receipt by Eaton Vance or your financial adviser.
Portfolio Holdings. Each Eaton Vance Fund and its underlying Portfolio (if applicable) will file a schedule of its portfolio holdings on Form N-Q with the SEC for the first and third quarters of each fiscal year. The Form N-Q will be available on the Eaton Vance website www.eatonvance.com, by calling Eaton Vance at 1-800-262-1122 or in the EDGAR database on the SEC's website at www.sec.gov. Form N-Q may also be reviewed and copied at the SEC's public reference room in Washington, D.C. (call 1-800-732-0330 for information on the operation of the public reference room).
Proxy Voting. From time to time, funds are required to vote proxies related to the securities held by the funds. The Eaton Vance Funds or their underlying Portfolios (if applicable) vote proxies according to a set of policies and procedures approved by the Funds' and Portfolios' Boards. You may obtain a description of these policies and procedures and information on how the Funds or Portfolios voted proxies relating to portfolio securities during the 12 month period ended June 30, without charge, upon request, by calling 1-800-262-1122. This description is also available on the SEC's website at www.sec.gov.
Eaton Vance National Limited Maturity Municipals Fund as of March 31, 2008
INVESTMENT UPDATE
Eaton Vance National Limited Maturity Municipals Fund (the “Fund”) is designed to provide a high level of current income exempt from regular federal income tax and limited principal fluctuation. The Fund invests primarily in investment-grade municipal obligations but may also invest in lower-rated obligations.
Economic and Market Conditions
Economic growth in the first quarter of 2008 measured 0.6%, according to preliminary Commerce Department data reported in April 2008, following the 0.6% growth rate achieved in the fourth quarter 2007. The housing sector continued to struggle in the first quarter due to market concerns related to subprime mortgages. Although the weaker dollar was having a beneficial effect on export- related industries, tourism, and U.S.-based multinational companies, consumers started to curtail spending as food and energy costs continued to climb, according to the U.S. Commerce Department, and consumer confidence levels fell to 25-year lows, according to University of Michigan data.
On March 16, 2008, the Federal Reserve (the “Fed”) took extraordinary actions to support orderly market functioning after it learned that Bear Stearns faced a liquidity crisis which could have triggered a wider market crisis. In addition to approving a financing arrangement to support JPMorgan Chase’s acquisition of Bear Stearns, the Fed created a new lending facility that expanded the potential collateral it would accept from member banks and extended the new lending facility to securities firms. The Fed also lowered the Discount Rate, the rate at which it will lend to these firms, to 3.25% from 3.50%. Two days later, on March 18, 2008, at a regularly scheduled meeting of the Federal Open Market Committee, the Fed lowered the Federal Funds Rate by 75 basis points to 2.25% from 3.00% and further lowered the Discount Rate to 2.50%. The Federal Funds Rate has been lowered by a total of 300 basis points (3.00%) since September 18, 2007, from 5.25%, and the Discount Rate has been lowered by a total of 375 basis points (3.75%) since August 17, 2007, from 6.25%. Management believes that all of these actions were aimed at providing market liquidity during this period of extreme uncertainty and tight credit conditions that first surfaced in August 2007.
Management Discussion
The Fund currently invests primarily in intermediate- maturity municipal bonds, seeking to maintain a weighted average duration of between three and nine years (duration is a measure of interest-rate sensitivity; the shorter a bond’s duration, the less sensitive its price will be to changes in market interest rates). Shorter maturity bonds usually provide somewhat less tax-exempt income than longer ones but also usually exhibit lower price volatility.
The Fund underperformed its benchmark, the Lehman Brothers 7-Year Municipal Bond Index – an unmanaged market index of intermediate-maturity municipal obligations – for the year ended March 31, 2008.(1) Management believes that much of the underperformance can be attributed to the broader-based credit crisis that has shaken the fixed-income markets since August 2007, which led investors to move their capital into the Treasury market, particularly in shorter-maturity bonds. This move was originally driven by uncertainty surrounding financial companies’ exposure to mortgage-backed collateralized debt obligations (CDOs). More recently, the municipal bond market has been impacted by the downgrade of major municipal bond insurers due to their exposure to mortgage-related CDO debt. As a result of an active management style that focuses on income and longer call protection, the Fund generally holds longer-duration intermediate-maturity bonds. Although the municipal bond market stabilized and Fund performance improved during March 2008, management believes that investors’ flight – from September 2007 through February 2008 – to shorter-intermediate maturity uninsured bonds from longer-intermediate maturity insured bonds resulted in the Fund’s relative underperformance for the period.
The ratio of yields on current coupon AAA-rated insured bonds to the yield on 30-year Treasury bonds was 116% as of March 31, 2008, with many individual bonds trading higher than 116%.(2) Management believes that this was the result of dislocation in the fixed-income marketplace caused by fears of subprime contagion, insurance companies’ mark-to-market risks and the decentralized nature of the municipal marketplace. Historically, this is a rare occurrence in the municipal bond market and is generally considered a signal that municipal bonds are significantly undervalued compared to Treasuries.
With this backdrop, management continues to manage all of its municipal funds with the same relative value approach that it has traditionally employed – maintaining a long-term perspective when markets exhibit extreme short-term volatility. We believe this approach has provided excellent long-term benefits to our investors over time.
(1) It is not possible to invest directly in an Index. The Index’s total return does not reflect expenses that would have been incurred if an investor individually purchased or sold the securities represented in the Index.
(2) Source: Bloomberg L.P. Yields are a compilation of a representative variety of general obligations and are not necessarily representative of a Fund’s yield.
Past performance is no guarantee of future results.
The views expressed throughout this report are those of the portfolio manager and are current only through the end of the period of the report as stated on the cover. These views are subject to change at any time based upon market or other conditions, and the investment adviser disclaims any responsibility to update such views. These views may not be relied on as investment advice and, because investment decisions for a fund are based on many factors, may not be relied on as an indication of trading intent on behalf of any Eaton Vance fund. Portfolio information provided in the report may not be representative of the Fund’s current or future investments and may change due to active management.
Fund shares are not insured by the FDIC and are not deposits or other obligations of, or guaranteed by, any depository institution. Shares are subject to investment risks, including possible loss of principal invested.
1
Eaton Vance National Limited Maturity Municipals Fund as of March 31, 2008
PERFORMANCE INFORMATION AND PORTFOLIO COMPOSITION
The line graph and table set forth below provide information about the Fund’s performance. The line graph compares the performance of Class B of the Fund with that of the Lehman Brothers 7-Year Municipal Bond Index, an unmanaged market index of intermediate-maturity municipal obligations. The lines on the graph represent the total returns of a hypothetical investment of $10,000 in each of Class B and in the Lehman Brothers 7-Year Municipal Bond Index. The table includes the total returns of each Class of the Fund at net asset value and maximum public offering price. The performance presented below does not reflect the deduction of taxes, if any, that a shareholder would pay on Fund distributions or redemptions of Fund shares.
Fund Performance(1)
| | Class A | | Class B | | Class C | |
Share Class Symbol | | EXNAX | | ELNAX | | EZNAX | |
| | | | | | | |
Average Annual Total Returns (at net asset value) | | | | | | | |
One Year | | -0.94 | % | -1.59 | % | -1.70 | % |
Five Years | | 3.43 | | 2.66 | | 2.64 | |
Ten Years | | 3.94 | | 3.17 | | 3.15 | |
Life of Fund† | | 4.56 | | 4.06 | | 3.38 | |
| | | | | | | |
SEC Average Annual Total Returns (including sales charge or applicable CDSC) | | | | | | | |
One Year | | -3.17 | % | -4.45 | % | -2.65 | % |
Five Years | | 2.95 | | 2.66 | | 2.64 | |
Ten Years | | 3.70 | | 3.17 | | 3.15 | |
Life of Fund† | | 4.36 | | 4.06 | | 3.38 | |
†Inception Dates – Class A: 6/27/96; Class B: 5/22/92; Class C: 12/8/93
Total Annual Operating Expenses(2)
| | Class A | | Class B | | Class C | |
| | | | | | | |
Expense Ratio | | 0.88 | % | 1.63 | % | 1.63 | % |
Distribution Rates/Yields
| | Class A | | Class B | | Class C | |
| | | | | | | |
Distribution Rate(3) | | 3.93 | % | 3.15 | % | 3.15 | % |
Taxable-Equivalent Distribution Rate(3),(4) | | 6.05 | | 4.85 | | 4.85 | |
SEC 30-day Yield(5) | | 3.79 | | 3.13 | | 3.13 | |
Taxable-Equivalent SEC 30-day Yield(4),(5) | | 5.83 | | 4.82 | | 4.82 | |
Index Performance(6)
Lehman Brothers 7-Year Municipal Bond Index – Average Annual Total Returns | |
One Year | | 5.59 | % |
Five Years | | 3.92 | |
Ten Years | | 4.99 | |
Lipper Averages(7)
Lipper Intermediate Municipal Debt Funds Classification – Average Annual Total Returns | |
One Year | | 2.61 | % |
Five Years | | 2.87 | |
Ten Years | | 4.04 | |
Portfolio Manager: William H. Ahern, Jr., CFA

* Source: Lipper, Inc. Class B of the Fund commenced operations on 5/22/92.
A $10,000 hypothetical investment at net asset value in Class A and Class C on 3/31/98 would have been valued at $14,718 ($14,386 at the maximum offering price) and $13,633, respectively, on 3/31/08. It is not possible to invest directly in an Index. The Index’s total return does not reflect the expenses that would have been incurred if an investor individually purchased or sold the securities represented in the Index.
(1) Average Annual Total Returns do not include the 2.25% maximum sales charge for Class A shares or the applicable contingent deferred sales charges (CDSC) for Class B and Class C shares. If sales charges were deducted, the returns would be lower. SEC average annual total returns for Class A reflect the maximum 2.25% sales charge. SEC returns for Class B reflect the applicable CDSC based on the following schedule: 3% - 1st year; 2.5% - 2nd year; 2% - 3rd year; 1% - 4th year. SEC returns for Class C reflect a 1% CDSC for the first year.
(2) Source: Prospectus dated 8/1/07. Includes interest expense of 0.10% relating to the Fund’s liability with respect to floating rate notes held by third parties in conjunction with inverse floater securities transactions by the Fund. The Fund also records offsetting interest income relating to the municipal obligations underlying such transactions, and as a result net asset value and performance have not been affected by this expense.
(3) The Fund’s distribution rate represents actual distributions paid to shareholders and is calculated by dividing the last distribution per share in the period (annualized) by the net asset value at the end of the period.
(4) Taxable-equivalent figure assumes a maximum 35.00% federal income tax rate. A lower tax rate would result in lower tax-equivalent figures.
(5) The Fund’s SEC yield is calculated by dividing the net investment income per share for the 30-day period by the offering price at the end of the period and annualizing the result.
(6) It is not possible to invest directly in an Index. The Index’s total return does not reflect the expenses that would have been incurred if an investor individually purchased or sold the securities represented in the Index. Index performance is available as of month end only.
(7) The Lipper Averages are the average annual total returns, at net asset value, of the funds that are in the same Lipper Classification as the Fund. It is not possible to invest in a Lipper Classification. Lipper Classifications may include insured and uninsured funds, as well as leveraged and unleveraged funds. The Lipper Intermediate Municipal Debt Funds Classification contained 158, 120 and 76 funds for the 1-year, 5-year and 10-year time periods, respectively. Lipper Averages are available as of month end only.
Past performance is no guarantee of future results. Returns are historical and are calculated by determining the percentage change in net asset value or offering price (as applicable) with all distributions reinvested. Investment return and principal value will fluctuate so that shares, when redeemed, may be worth more or less than their original cost. Performance is for the stated time period only; due to market volatility, the Fund’s current performance may be lower or higher than the quoted return. For performance as of the most recent month end, please refer to www.eatonvance.com.
2
Rating Distribution*(1)
By total investments
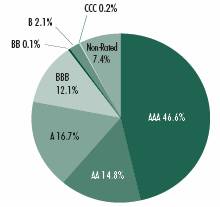
* The rating distribution presented above includes the ratings of securities held by special purpose vehicles in which the Fund holds a residual interest. See Note 1I to the Fund’s financial statements. Absent such securities, the Fund’s rating distribution at 3/31/08 is as folows, and the average rating is AA-:
AAA | | 47.1 | % |
AA | | 14.1 | % |
A | | 16.9 | % |
BBB | | 12.2 | % |
BB | | 0.1 | % |
B | | 2.1 | % |
CCC | | 0.2 | % |
Non-Rated | | 7.3 | % |
(1) Rating Distribution is determined by dividing the total market value of the issues by the total investments of the Fund.
Fund Statistics(2)
· | Number of Issues: | | 228 | |
· | Average Maturity: | | 12.4 years | |
· | Average Effective Maturity: | | 9.4 years | |
· | Average Call Protection: | | 7.8 years | |
· | Average Dollar Price: | | $102.50 | |
(2) Fund holdings information excludes securities held by special purpose vehicles in which the Fund holds a residual interest. See Note 1I to the Fund’s financial statements.
Morningstar RatingsTM
EATON VANCE NATIONAL LIMITED MATURITY
MUNICIPALS FUND – CLASS A | | OVERALL | | 3-YEAR | | 5-YEAR | | 10-YEAR |
| | | | | | | | |
| | *** | | ** | | *** | | *** |
Load waived | | *** | | *** | | **** | | *** |
MUNI NATIONAL INTERMEDIATE CATEGORY | | 241 FUNDS | | 241 FUNDS | | 217 FUNDS | | 130 FUNDS |
Based on risk-adjusted returns. Eaton Vance offers other mutual funds that are not listed here and that do not have similar performance records.
The Overall Morningstar RatingTM for a fund is derived from a weighted average of the performance figures associated with its 3-, 5- and 10-year (if applicable) Morningstar RatingTM metrics.
©2008 Morningstar, Inc. All Rights Reserved. The information contained herein: (1) is proprietary to Morningstar and/or its content providers; (2) may not be copied or distributed; and (3) is not warranted to be accurate, complete or timely. Neither Morningstar nor its content providers is responsible for any damages or losses arising from any use of this information. Past performance is no guarantee of future results. For each fund with at least a three-year history, Morningstar calculates a Morningstar Rating TM based on how a fund ranks on a Morningstar Risk-Adjusted Return measure against other funds in the same category. This measure takes into account variations in a fund’s monthly performance after adjusting for sales loads (except for load-waived A shares), redemption fees, and the risk-free rate, placing more emphasis on downward variations and rewarding consistent performance. The top 10% of funds in each category receive 5 stars; the next 22.5% receive 4 stars; the next 35% receive 3 stars; the next 22.5% receive 2 stars, and the bottom 10% receive 1 star.
Load-waived A share star ratings do not include any front-end sales load and are intended for those investors who have access to such purchase terms (e.g., plan participants of a defined contribution plan). Not all A share mutual funds for which Morningstar calculates a load-waived A share star rating may actually waive their front-end sales load. Therefore, Morningstar strongly encourages investors to contact their investment professional to determine whether they are eligible to purchase the A share without paying the front-end sales load. The Morningstar Rating may differ among share classes of a mutual fund as a result of different sales loads and/or expense structure.
As interest rates rise, the value of fixed-income securities is likely to decrease. Fluctuations in the value of securities may not affect interest income on existing securities, but will be reflected in the Fund’s net asset value. A portion of income may be subject to federal alternative minimum tax. Please see the Fund’s prospectus for more information. Consult your tax/legal advisor before making any tax-related investment decisions.
3
Eaton Vance National Limited Maturity Municipals Fund as of March 31, 2008
FUND EXPENSES
Example: As a shareholder of the Fund, you incur two types of costs: (1) transaction costs, including sales charges (loads) on purchases and redemption fees (if applicable); and (2) ongoing costs, including management fees; distribution or service fees; and other Fund expenses. This Example is intended to help you understand your ongoing costs (in dollars) of investing in the Fund and to compare these costs with the ongoing costs of investing in other mutual funds. The Example is based on an investment of $1,000 invested at the beginning of the period and held for the entire period (October 1, 2007 – March 31, 2008).
Actual Expenses: The first section of the table below provides information about actual account values and actual expenses. You may use the information in this section, together with the amount you invested, to estimate the expenses that you paid over the period. Simply divide your account value by $1,000 (for example, an $8,600 account value divided by $1,000 = 8.6), then multiply the result by the number in the first section under the heading entitled "Expenses Paid During Period" to estimate the expenses you paid on your account during this period.
Hypothetical Example for Comparison Purposes: The second section of the table below provides information about hypothetical account values and hypothetical expenses based on the actual Fund expense ratio and an assumed rate of return of 5% per year (before expenses), which is not the actual return of the Fund. The hypothetical account values and expenses may not be used to estimate the actual ending account balance or expenses you paid for the period. You may use this information to compare the ongoing costs of investing in your Fund and other funds. To do so, compare this 5% hypothetical example with the 5% hypothetical examples that appear in the shareholder reports of the other funds.
Please note that the expenses shown in the table are meant to highlight your ongoing costs only and do not reflect any transactional costs, such as sales charges (loads) or redemption fees (if applicable). Therefore, the second section of the table is useful in comparing ongoing costs only, and will not help you determine the relative total costs of owning different funds. In addition, if these transactional costs were included, your costs would have been higher.
Eaton Vance National Limited Maturity Municipals Fund
| | | Beginning Account Value
(10/1/07) | | Ending Account Value
(3/31/08) | | Expenses Paid During Period*
(10/1/07 – 3/31/08) | |
| Actual | |
| Class A | | $ | 1,000.00 | | | $ | 987.50 | | | $ | 3.73 | | |
| Class B | | $ | 1,000.00 | | | $ | 984.70 | | | $ | 7.44 | | |
| Class C | | $ | 1,000.00 | | | $ | 983.70 | | | $ | 7.44 | | |
| Hypothetical | |
| (5% return per year before expenses) | |
| Class A | | $ | 1,000.00 | | | $ | 1,021.30 | | | $ | 3.79 | | |
| Class B | | $ | 1,000.00 | | | $ | 1,017.50 | | | $ | 7.57 | | |
| Class C | | $ | 1,000.00 | | | $ | 1,017.50 | | | $ | 7.57 | | |
* Expenses are equal to the Fund's annualized expense ratio of 0.75% for Class A shares, 1.50% for Class B shares and 1.50% for Class C shares, multiplied by the average account value over the period, multiplied by 183/366 (to reflect the one-half year period). The Example assumes that the $1,000 was invested at the net asset value per share determined at the close of business on September 30, 2007.
4
Eaton Vance National Limited Maturity Municipals Fund as of March 31, 2008
PORTFOLIO OF INVESTMENTS
Tax-Exempt Investments — 98.1% | | | |
Principal Amount
(000's omitted) | |
Security | |
Value | |
| Cogeneration — 0.9% | | | |
| $ | 2,260 | | | Carbon County, PA, Industrial Development
Authority/Agency, (Panther Creek Partners),
(AMT), 6.65%, 5/1/10 | | $ | 2,297,087 | | |
| | 985 | | | Ohio Water Development Authority, Solid Waste Disposal,
(Bay Shore Power), (AMT), 6.625%, 9/1/20 | | | 987,748 | | |
| | 675 | | | Pennsylvania Economic Development Financing Authority,
(Resource Recovery-Colver), (AMT), 5.125%, 12/1/15 | | | 642,053 | | |
| | 2,065 | | | Western Generation Agency, OR, (Wauna Cogeneration),
(AMT), 5.00%, 1/1/12 | | | 2,085,567 | | |
| | | | | | | $ | 6,012,455 | | |
| Education — 2.2% | | | |
| $ | 2,000 | | | Illinois Educational Facility Authority,
(Art Institute of Chicago), 4.45%, 3/1/34 | | $ | 2,031,480 | | |
| | 420 | | | Maryland Industrial Development Financing Authority,
(Our Lady of Good Counsel High School), 5.50%, 5/1/20 | | | 415,057 | | |
| | 250 | | | Maryland State Health and Higher Educational Facilities
Authority, (Washington Christian Academy),
5.25%, 7/1/18 | | | 234,227 | | |
| | 2,815 | | | Missouri State Health and Educational Facilities Authority,
(St. Louis University), 5.50%, 10/1/16 | | | 3,147,930 | | |
| | 6,000 | | | New York Dormitory Authority, (State University
Educational Facilities), 5.25%, 11/15/23 | | | 6,414,540 | | |
| | 1,700 | | | University of Illinois, 0.00%, 4/1/15 | | | 1,268,047 | | |
| | 1,000 | | | University of Illinois, 0.00%, 4/1/16 | | | 705,860 | | |
| | | | | | | $ | 14,217,141 | | |
| Electric Utilities — 3.4% | | | |
| $ | 1,000 | | | Brazos River Authority, TX, (Reliant Energy, Inc.),
7.75%, 12/1/18 | | $ | 1,020,820 | | |
| | 3,000 | | | Delaware County, PA, Industrial Development Authority
Pollution Control, (Peco Energy Co.), 4.00%, 12/1/12 | | | 3,022,770 | | |
| | 2,500 | | | New Hampshire Business Finance Authority Pollution Control,
(Central Maine Power Co.), 5.375%, 5/1/14 | | | 2,631,475 | | |
| | 3,050 | | | New York Energy Research and Development Authority
Facility, (AMT), 4.70%, 6/1/36 | | | 3,052,226 | | |
| | 1,000 | | | North Carolina Municipal Power Agency, (Catawba),
6.375%, 1/1/13 | | | 1,064,160 | | |
| | 6,500 | | | Rapides, LA, Finance Authority Revenue, (Cleco Power LLC),
Variable Rate, 5.25% until 3/1/13, 11/1/37 | | | 6,490,770 | | |
| | 1,250 | | | Sam Rayburn, TX, Municipal Power Agency, Power
Supply System, 6.00%, 10/1/16 | | | 1,294,987 | | |
Principal Amount
(000's omitted) | |
Security | |
Value | |
| Electric Utilities (continued) | | | |
| $ | 1,000 | | | San Antonio, TX, Electric and Natural Gas, 4.50%, 2/1/21 | | $ | 1,000,420 | | |
| | 2,500 | | | Wake County, NC, Industrial Facilities and Pollution
Control Financing Authority, (Carolina Power and Light Co.),
5.375%, 2/1/17 | | | 2,598,950 | | |
| | | | | | | $ | 22,176,578 | | |
| Escrowed / Prerefunded — 4.9% | | | |
| $ | 1,500 | | | California Department of Water Resource Power Supply,
Prerefunded to 5/1/12, 5.125%, 5/1/18 | | $ | 1,647,765 | | |
| | 125 | | | Forsyth County, GA, Hospital Authority, (Georgia Baptist
Health Care System), Escrowed to Maturity,
6.00%, 10/1/08 | | | 127,191 | | |
| | 500 | | | Kershaw County, SC, School District,
Prerefunded to 2/1/10, 5.00%, 2/1/18 | | | 524,315 | | |
| | 3,345 | | | Maricopa County, AZ, Industrial Development Authority,
Multifamily, Escrowed to Maturity, 6.45%, 1/1/17(1) | | | 3,377,881 | | |
| | 320 | | | Maricopa County, AZ, Industrial Development Authority,
Multifamily, Escrowed to Maturity, 7.875%, 1/1/11 | | | 342,019 | | |
| | 235 | | | Massachusetts Industrial Finance Agency, (Forge Hill),
(AMT), Prerefunded to 4/1/08, 6.75%, 4/1/30 | | | 239,700 | | |
| | 3,000 | | | Massachusetts Turnpike Authority, Escrowed to Maturity,
5.00%, 1/1/20 | | | 3,220,590 | | |
| | 125 | | | Mesquite, TX, Health Facilities Development,
(Christian Care Centers), Escrowed to Maturity,
7.00%, 2/15/10 | | | 132,054 | | |
| | 2,000 | | | Michigan Hospital Finance Authority, (Henry Ford Health
System), Prerefunded to 3/1/13, 5.50%, 3/1/14 | | | 2,219,680 | | |
| | 1,235 | | | New Jersey Educational Facilities Authority, (Steven's
Institute of Technology), Escrowed to Maturity,
5.00%, 7/1/12 | | | 1,339,753 | | |
| | 465 | | | New York City, NY, Prerefunded to 12/1/11,
5.625%, 12/1/13 | | | 513,444 | | |
| | 1,195 | | | North Carolina Eastern Municipal Power Agency,
Escrowed to Maturity, 4.00%, 1/1/18 | | | 1,197,820 | | |
| | 455 | | | North Miami, FL, Health Facilities Authority, (Imperial Club),
Prerefunded to 1/1/09, 6.75%, 1/1/33 | | | 481,977 | | |
| | 2,000 | | | Orange County, FL, Health Facilities Authority,
(Adventist Health System), Prerefunded to 11/15/10,
6.375%, 11/15/20 | | | 2,209,340 | | |
| | 2,000 | | | Orange County, FL, Health Facilities Authority, (Adventist
Health System), Prerefunded to 11/15/12,
5.25%, 11/15/18 | | | 2,208,220 | | |
| | 10,000 | | | Triborough Bridge and Tunnel Authority,
NY, Escrowed to Maturity, 5.50%, 1/1/17 | | | 11,000,700 | | |
| | 125 | | | Willacy County, TX, Local Government Corp.,
Escrowed to Maturity, 6.00%, 3/1/09 | | | 129,329 | | |
| | 470 | | | Wisconsin Health and Educational Facilities Authority,
(Wisconsin Illinois Senior Housing), Prerefunded to 8/1/09,
7.00%, 8/1/29 | | | 504,785 | | |
| | | | | | | $ | 31,416,563 | | |
See notes to financial statements
5
Eaton Vance National Limited Maturity Municipals Fund as of March 31, 2008
PORTFOLIO OF INVESTMENTS CONT'D
Principal Amount
(000's omitted) | |
Security | |
Value | |
| General Obligations — 11.7% | | | |
| $ | 15,000 | | | California, 5.00%, 8/1/19 | | $ | 15,660,900 | | |
| | 9,450 | | | Klein, TX, Independent School District, 3.75%, 8/1/21 | | | 8,775,270 | | |
| | 10,000 | | | Maryland, 5.00%, 3/15/21 | | | 10,644,000 | | |
| | 10,000 | | | Maryland State and Local Facilities, 5.00%, 8/1/18 | | | 10,990,300 | | |
| | 1,650 | | | McAllen, TX, Independent School District,
(PSF), 4.50%, 2/15/18 | | | 1,651,798 | | |
| | 10,000 | | | Minnesota, 5.00%, 11/1/22 | | | 10,519,600 | | |
| | 5,000 | | | New York City, NY, 5.00%, 8/1/19 | | | 5,241,950 | | |
| | 1,035 | | | New York City, NY, 5.625%, 12/1/13 | | | 1,115,078 | | |
| | 10,000 | | | Wake County, NC, 5.00%, 2/1/16 | | | 11,093,900 | | |
| | | | | | | $ | 75,692,796 | | |
| Health Care-Miscellaneous — 0.3% | | | |
| $ | 700 | | | Puerto Rico Infrastructure Financing Authority,
(Mepsi Campus Project), 5.60%, 10/1/14 | | $ | 698,684 | | |
| | 1,200 | | | Puerto Rico Infrastructure Financing Authority,
(Mepsi Campus Project), 6.25%, 10/1/24 | | | 1,165,776 | | |
| | 333 | | | Tax Revenue Exempt Securities Trust, Community Health
Provider, (Pooled Loan Program Various States Trust
Certificates), 6.00%, 12/1/36(2) | | | 341,038 | | |
| | | | | | | $ | 2,205,498 | | |
| Hospital — 6.6% | | | |
| $ | 550 | | | Colorado Health Facilities Authority, (Parkview Episcopal
Medical Center), 5.75%, 9/1/09 | | $ | 569,283 | | |
| | 2,500 | | | Cuyahoga County, OH, (Cleveland Clinic Health System),
6.00%, 1/1/17 | | | 2,808,050 | | |
| | 2,500 | | | Henderson, NV, Health Care Facilities, (Catholic Healthcare
West), 5.00%, 7/1/13 | | | 2,624,425 | | |
| | 1,250 | | | Highlands County, FL, Health Facilities Authority,
(Adventist Bolingbrook), 5.00%, 11/15/16 | | | 1,294,825 | | |
| | 1,950 | | | Highlands County, FL, Health Facilities Authority,
(Adventist Bolingbrook), 5.125%, 11/15/20 | | | 1,966,789 | | |
| | 2,760 | | | Kent, MI, Hospital Finance Authority, (Spectrum Health),
5.50%, 1/15/47(3) | | | 2,893,225 | | |
| | 1,000 | | | Lexington County, SC, (Health Services, Inc.),
5.00%, 11/1/15 | | | 1,047,820 | | |
| | 7,470 | | | Michigan Hospital Finance Authority, (Ascension Health),
5.00%, 11/1/12(4) | | | 7,986,226 | | |
| | 1,000 | | | Michigan Hospital Finance Authority,
(Memorial Healthcare Center), 5.875%, 11/15/21 | | | 1,018,100 | | |
| | 2,000 | | | Michigan Hospital Finance Authority,
(Oakwood Obligations Group), 5.00%, 7/15/12 | | | 2,104,960 | | |
| | 1,750 | | | Michigan Hospital Finance Authority,
(Oakwood Obligations Group), 5.00%, 7/15/13 | | | 1,845,795 | | |
| | 2,085 | | | New York Dormitory Authority, (NYU Hospital Center),
5.25%, 7/1/24 | | | 1,988,360 | | |
Principal Amount
(000's omitted) | |
Security | |
Value | |
| Hospital (continued) | | | |
| $ | 500 | | | Quincy, IL, Hospital Revenue, 5.00%, 11/15/08 | | $ | 506,195 | | |
| | 1,740 | | | Saginaw, MI, Hospital Finance Authority, 5.125%, 7/1/22 | | | 1,749,100 | | |
| | 2,000 | | | South Carolina Jobs Economic Development Authority,
(Palmetto Health Alliance), 6.00%, 8/1/12 | | | 2,132,980 | | |
| | 6,785 | | | South Miami, FL, Health Facilities Authority, (Baptist Health),
5.00%, 8/15/15 | | | 7,228,943 | | |
| | 1,000 | | | Sullivan County, TN, Health Educational and Housing Facilities
Board, (Wellmont Health System), 5.00%, 9/1/19 | | | 968,680 | | |
| | 1,000 | | | University of Kansas Hospital Authority, 5.00%, 9/1/16 | | | 1,040,570 | | |
| | 1,000 | | | University of Kansas Hospital Authority, 5.00%, 9/1/17 | | | 1,034,670 | | |
| | | | | | | $ | 42,808,996 | | |
| Housing — 0.6% | | | |
| $ | 2,500 | | | California Housing Finance Agency, (AMT),
4.75%, 8/1/21 | | $ | 2,405,400 | | |
| | 600 | | | Georgia Private Colleges and Universities Authority, Student
Housing Revenue, (Mercer Housing Corp.), 6.00%, 6/1/31 | | | 604,770 | | |
| | 650 | | | Sandoval County, NM, Multifamily,
6.00%, 5/1/32(2) | | | 577,902 | | |
| | 95 | | | Texas Student Housing Corp., (University of North Texas),
9.375%, 7/1/06(5) | | | 91,589 | | |
| | | | | | | $ | 3,679,661 | | |
| Industrial Development Revenue — 11.4% | | | |
| $ | 415 | | | Austin, TX, (Cargoport Development LLC), (AMT),
8.30%, 10/1/21 | | $ | 437,929 | | |
| | 2,300 | | | California Pollution Control Financing Authority,
(Solid Waste Disposal), (AMT), 5.10%, 6/1/18 | | | 2,300,782 | | |
| | 1,500 | | | Dallas-Fort Worth, TX, International Airport Facilities
Improvements Corp., (AMT), 9.00%, 5/1/29 | | | 1,495,545 | | |
| | 3,000 | | | De Soto Parish, LA, (International Paper Co.), (AMT),
5.00%, 11/1/18 | | | 2,813,130 | | |
| | 1,625 | | | Denver, CO, City and County Special Facilities,
(United Airlines), (AMT), 5.25%, 10/1/32 | | | 1,231,734 | | |
| | 1,195 | | | Denver, CO, City and County Special Facilities,
(United Airlines), (AMT), 5.75%, 10/1/32 | | | 972,897 | | |
| | 3,400 | | | Gilliam County, OR, Solid Waste Revenue, 4.15%, 8/1/25 | | | 3,404,012 | | |
| | 2,000 | | | Gulf Coast, TX, Waste Disposal Authority,
(Waste Management), (AMT), 4.55%, 4/1/12 | | | 1,977,340 | | |
| | 1,630 | | | Houston, TX, Industrial Development Corp., (AMT),
6.375%, 1/1/23 | | | 1,632,103 | | |
| | 10,000 | | | Liberty Development Corp., NY, (Goldman Sachs Group, Inc.),
5.50%, 10/1/37 | | | 10,496,700 | | |
| | 1,000 | | | Massachusetts Development Finance Agency,
(Waste Management, Inc.), 6.90%, 12/1/29 | | | 1,044,950 | | |
| | 1,000 | | | Michigan Strategic Fund, (Waste Management, Inc.), (AMT),
4.50%, 12/1/13 | | | 988,380 | | |
See notes to financial statements
6
Eaton Vance National Limited Maturity Municipals Fund as of March 31, 2008
PORTFOLIO OF INVESTMENTS CONT'D
Principal Amount
(000's omitted) | |
Security | |
Value | |
| Industrial Development Revenue (continued) | | | |
| $ | 5,650 | | | Mission, TX, Economic Development Corp., (Allied Waste
Industries), (AMT), 5.20%, 4/1/18 | | $ | 4,968,101 | | |
| | 1,435 | | | Mississippi Business Finance Corp., (Air Cargo), (AMT),
7.25%, 7/1/34 | | | 1,441,472 | | |
| | 1,440 | | | New Jersey Economic Development Authority,
(Continental Airlines), (AMT), 6.25%, 9/15/19 | | | 1,326,528 | | |
| | 3,000 | | | New York City, NY, Industrial Development Agency,
(American Airlines), (AMT), 7.50%, 8/1/16 | | | 3,026,310 | | |
| | 2,750 | | | New York City, NY, Industrial Development Agency,
(Terminal One Group), (AMT), 5.50%, 1/1/14 | | | 2,910,600 | | |
| | 5,000 | | | New York City, NY, Industrial Development Agency,
(Terminal One Group), (AMT), 5.50%, 1/1/15 | | | 5,290,900 | | |
| | 1,850 | | | Ohio Water Development Authority, Solid Waste Disposal,
(Allied Waste North America, Inc.), (AMT),
5.15%, 7/15/15 | | | 1,693,046 | | |
| | 6,000 | | | Port Longview, WA, Industrial Development Corp.,
Solid Waste Disposal, (Weyerhaeuser Co.), (AMT),
6.875%, 10/1/08 | | | 6,085,920 | | |
| | 10,175 | | | St. John Baptist Parish, LA, (Marathon Oil Corp.),
5.125%, 6/1/37 | | | 8,986,560 | | |
| | 2,825 | | | Toledo Lucas County, OH, Port Authority, (Cargill, Inc.),
4.50%, 12/1/15 | | | 2,909,806 | | |
| | 7,605 | | | Virgin Islands Public Financing Authority, (HOVENSA LLC),
(AMT), 4.70%, 7/1/22 | | | 6,477,939 | | |
| | | | | | | $ | 73,912,684 | | |
| Insured-Education — 1.2% | | | |
| $ | 2,025 | | | New York Dormitory Authority, (Educational Housing Services),
(AMBAC), 5.25%, 7/1/21 | | $ | 2,188,883 | | |
| | 5,150 | | | New York Dormitory Authority, (Rochester Institute of
Technology), (AMBAC), 5.25%, 7/1/22 | | | 5,535,838 | | |
| | 500 | | | Southern Illinois University, Housing and Auxiliary Facilities,
(MBIA), 0.00%, 4/1/17 | | | 330,250 | | |
| | | | | | | $ | 8,054,971 | | |
| Insured-Electric Utilities — 3.2% | | | |
| $ | 750 | | | California Pollution Control Financing Authority, PCR,
(Pacific Gas and Electric), (MBIA), (AMT),
5.35%, 12/1/16 | | $ | 780,540 | | |
| | 2,000 | | | Forsyth, MT, PCR, (Avista Corp.), (AMBAC),
5.00%, 10/1/32(6) | | | 2,018,280 | | |
| | 8,000 | | | Hillsborough County, FL, Industrial Development Authority,
Pollution Control Revenue, (Tampa Electric Co.), (AMBAC),
5.00%, 12/1/34 | | | 7,924,400 | | |
| | 3,000 | | | Illinois Municipal Electric Agency Power Supply, (FGIC),
5.25%, 2/1/16 | | | 3,248,850 | | |
| | 4,800 | | | Long Island Power Authority, NY, (FGIC), 5.00%, 12/1/19 | | | 4,983,168 | | |
Principal Amount
(000's omitted) | |
Security | |
Value | |
| Insured-Electric Utilities (continued) | | | |
| $ | 400 | | | Piedmont, SC, Municipal Power Agency, (MBIA),
5.00%, 1/1/15 | | $ | 404,360 | | |
| | 1,000 | | | Puerto Rico Electric Power Authority, (XLCA),
5.375%, 7/1/18 | | | 1,070,300 | | |
| | | | | | | $ | 20,429,898 | | |
| Insured-Escrowed / Prerefunded — 2.3% | | | |
| $ | 425 | | | Metropolitan Transportation Authority, NY,
Commuter Facilities, (AMBAC), Escrowed to Maturity,
5.00%, 7/1/20 | | $ | 431,222 | | |
| | 1,000 | | | Metropolitan Transportation Authority, NY, Transit Facilities,
(FGIC), Prerefunded to 10/1/15, 4.50%, 4/1/18 | | | 1,078,460 | | |
| | 3,000 | | | Montgomery, AL, BMC Special Care Facilities Financing
Authority, (Baptist Health Montgomery), (MBIA),
Prerefunded to 11/15/14, 5.00%, 11/15/17 | | | 3,304,410 | | |
| | 2,000 | | | Montgomery, AL, BMC Special Care Facilities Financing
Authority, (Baptist Health Montgomery), (MBIA),
Prerefunded to 11/15/14, 5.00%, 11/15/18 | | | 2,202,940 | | |
| | 1,000 | | | Montgomery, AL, BMC Special Care Facilities Financing
Authority, (Baptist Health Montgomery), (MBIA),
Prerefunded to 11/15/14, 5.00%, 11/15/22 | | | 1,096,480 | | |
| | 5,000 | | | Montgomery, AL, BMC Special Care Facilities Financing
Authority, (Baptist Health Montgomery), (MBIA),
Prerefunded to 11/15/14, 5.00%, 11/15/24 | | | 5,507,350 | | |
| | 1,400 | | | Springfield, OH, City School District, Clark County, (FGIC),
Prerefunded to 12/1/11, 5.00%, 12/1/17 | | | 1,540,910 | | |
| | | | | | | $ | 15,161,772 | | |
| Insured-General Obligations — 7.4% | | | |
| $ | 2,565 | | | Boise City, ID, Independent School District, (MBIA),
5.00%, 8/1/17 | | $ | 2,806,161 | | |
| | 8,000 | | | Boston, MA, (MBIA), 0.125%, 3/1/22 | | | 4,309,600 | | |
| | 1,000 | | | Canyon County, ID, School District No. 131 Nampa, (FSA),
5.00%, 9/15/16 | | | 1,107,640 | | |
| | 1,000 | | | Hillsborough Township, NJ, School District, (FSA),
5.375%, 10/1/18 | | | 1,130,510 | | |
| | 5,000 | | | Jackson Township, NJ, School District, (Baptist Healthcare
Systems), (MBIA), 5.25%, 6/15/23 | | | 5,403,650 | | |
| | 1,055 | | | Linn County, OR, Community School District No. 9, (Lebanon),
(FGIC), 5.25%, 6/15/21 | | | 1,143,472 | | |
| | 1,175 | | | Linn County, OR, Community School District No. 9, (Lebanon),
(FGIC), 5.25%, 6/15/22 | | | 1,266,674 | | |
| | 650 | | | Los Angeles, CA, Unified School District, (AMBAC),
5.00%, 7/1/17 | | | 714,045 | | |
| | 5,000 | | | Massachusetts, (MBIA), 5.50%, 10/1/20 | | | 5,617,800 | | |
| | 10,000 | | | Miami, FL, (MBIA), (Homeland Defense), 5.00%, 1/1/19 | | | 10,550,100 | | |
| | 5,580 | | | New Orleans, LA, (MBIA), 5.25%, 12/1/15 | | | 6,011,501 | | |
See notes to financial statements
7
Eaton Vance National Limited Maturity Municipals Fund as of March 31, 2008
PORTFOLIO OF INVESTMENTS CONT'D
Principal Amount
(000's omitted) | |
Security | |
Value | |
| Insured-General Obligations (continued) | | | |
| $ | 2,450 | | | Springfield, OH, City School District, Clark County, (AMBAC),
4.30%, 12/1/14 | | $ | 2,531,218 | | |
| | 1,000 | | | St. Louis, MO, Board of Education, (FSA), 0.00%, 4/1/16 | | | 714,200 | | |
| | 10,000 | | | Washington State, (AMBAC), 0.00%, 12/1/22 | | | 4,757,300 | | |
| | | | | | | $ | 48,063,871 | | |
| Insured-Hospital — 1.7% | | | |
| $ | 1,000 | | | Harris County, TX, Hospital District, (MBIA),
5.00%, 2/15/11 | | $ | 1,051,400 | | |
| | 1,000 | | | Harris County, TX, Hospital District, (MBIA),
5.00%, 2/15/12 | | | 1,060,160 | | |
| | 1,000 | | | Harris County, TX, Hospital District, (MBIA),
5.00%, 2/15/13 | | | 1,066,760 | | |
| | 500 | | | Harris County, TX, Hospital District, (MBIA),
5.00%, 2/15/14 | | | 534,905 | | |
| | 3,555 | | | Waco, TX, Health Facilities Development Corp.,
(Hillcrest Health System), (MBIA), 5.00%, 8/1/19 | | | 3,701,750 | | |
| | 3,745 | | | Waco, TX, Health Facilities Development Corp.,
(Hillcrest Health System), (MBIA), 5.00%, 8/1/20 | | | 3,864,241 | | |
| | | | | | | $ | 11,279,216 | | |
Insured-Lease Revenue / Certificates of
Participation — 0.6% | | | |
| $ | 2,000 | | | New York Dormitory Authority, (SUNY), (XLCA),
5.25%, 7/1/32 | | $ | 2,130,360 | | |
| | 2,100 | | | Texas Public Finance Authority, (MBIA),
0.00%, 2/1/12 | | | 1,845,207 | | |
| | | | | | | $ | 3,975,567 | | |
| Insured-Other Revenue — 2.9% | | | |
| $ | 10,800 | | | Citizens Property Insurance Corp., FL, (Senior Secured High
Risk Account), (MBIA), 5.00%, 3/1/13 | | $ | 11,606,436 | | |
| | 5,000 | | | Louisiana Citizens Property, (AMBAC), 5.00%, 6/1/22 | | | 4,954,600 | | |
| | 1,000 | | | Louisiana Public Facility Authority, (Roman Catholic Church
of New Orleans), (CIFG), 5.00%, 7/1/19 | | | 1,020,720 | | |
| | 1,000 | | | Missouri Development Finance Board Cultural Facility,
(Nelson Gallery Foundation), (MBIA), 5.25%, 12/1/14 | | | 1,065,110 | | |
| | | | | | | $ | 18,646,866 | | |
| Insured-Pooled Loans — 2.2% | | | |
| $ | 5,000 | | | Louisiana Public Facility Authority, (Hurricane Recovery),
(AMBAC), 5.00%, 6/1/19 | | $ | 5,275,350 | | |
| | 9,650 | | | Massachusetts Educational Financing Authority, (AMBAC),
4.60%, 1/1/22 | | | 9,006,345 | | |
| | | | | | | $ | 14,281,695 | | |
Principal Amount
(000's omitted) | |
Security | |
Value | |
| Insured-Special Tax Revenue — 4.7% | | | |
| $ | 3,000 | | | Arlington, TX, (Dallas Cowboys), (MBIA), 5.00%, 8/15/34 | | $ | 3,113,100 | | |
| | 7,020 | | | Denver, CO, Convention Center, (XLCA), 5.25%, 12/1/22 | | | 6,998,168 | | |
| | 1,000 | | | Denver, CO, Convention Center, (XLCA), 5.25%, 12/1/23 | | | 986,280 | | |
| | 10,000 | | | Garden State Preservation Trust, NJ, Open Space and
Farmland, (FSA), 5.25%, 11/1/20 | | | 11,196,700 | | |
| | 2,770 | | | Julington Creek Plantation, FL, Community Development
District, (MBIA), 4.75%, 5/1/19 | | | 2,808,226 | | |
| | 5,000 | | | Massachusetts Special Obligations, (FSA), 5.50%, 6/1/21 | | | 5,617,450 | | |
| | | | | | | $ | 30,719,924 | | |
| Insured-Transportation — 5.8% | | | |
| $ | 2,295 | | | Chicago, IL, O'Hare International Airport, (MBIA), (AMT),
5.75%, 1/1/17 | | $ | 2,380,764 | | |
| | 1,000 | | | Denver, CO, City and County Airport, (FSA), (AMT),
5.00%, 11/15/11 | | | 1,053,540 | | |
| | 1,000 | | | Houston, TX, Airport System, (FGIC), (AMT),
5.50%, 7/1/12 | | | 1,047,430 | | |
| | 2,000 | | | Kenton County, KY, Airport, (Cincinnati/Northern Kentucky),
(MBIA), (AMT), 5.625%, 3/1/13(6) | | | 2,114,440 | | |
| | 2,500 | | | Massachusetts Port Authority, (Delta Airlines), (AMBAC),
(AMT), 5.50%, 1/1/15 | | | 2,518,275 | | |
| | 1,000 | | | Miami-Dade County, FL, Aviation, (Miami International Airport),
(FGIC), (AMT), 5.50%, 10/1/13 | | | 1,052,590 | | |
| | 2,000 | | | Minneapolis and St. Paul, MN, Metropolitan Airport
Commission, (FGIC), (AMT), 5.25%, 1/1/11 | | | 2,081,300 | | |
| | 1,430 | | | Minneapolis and St. Paul, MN, Metropolitan Airport
Commission, (FGIC), (AMT), 6.00%, 1/1/11 | | | 1,497,811 | | |
| | 5,000 | | | New Jersey Transportation Trust Fund Authority, (FGIC),
5.50%, 12/15/20 | | | 5,561,550 | | |
| | 1,000 | | | Ohio Turnpike Commission, (FGIC), 5.50%, 2/15/18 | | | 1,114,910 | | |
| | 3,515 | | | Port Authority of New York and New Jersey, (FGIC), (AMT),
4.50%, 10/1/20 | | | 3,404,524 | | |
| | 1,000 | | | Port Seattle, WA, (MBIA), (AMT), 6.00%, 2/1/11 | | | 1,073,620 | | |
| | 10,000 | | | St. Louis, MO, Airport, (Lambert-St. Louis International Airport),
(FSA), 5.00%, 7/1/20 | | | 10,478,400 | | |
| | 2,000 | | | Wayne Charter County, MI, Metropolitan Airport, (FGIC),
(AMT), 5.50%, 12/1/15 | | | 2,084,500 | | |
| | | | | | | $ | 37,463,654 | | |
| Insured-Water and Sewer — 0.4% | | | |
| $ | 2,425 | | | Sunrise, FL, Utilities Systems, (AMBAC), 5.50%, 10/1/18 | | $ | 2,621,934 | | |
| | | | | | | $ | 2,621,934 | | |
| Lease Revenue / Certificates of Participation — 3.3% | | | |
| $ | 7,870 | | | California Public Works Board, (Department Health Services),
5.00%, 11/1/19 | | $ | 8,101,299 | | |
See notes to financial statements
8
Eaton Vance National Limited Maturity Municipals Fund as of March 31, 2008
PORTFOLIO OF INVESTMENTS CONT'D
Principal Amount
(000's omitted) | |
Security | |
Value | |
Lease Revenue / Certificates of
Participation (continued) | | | |
| $ | 5,565 | | | Charleston, SC, Educational Excellence Finance Corp.,
(Charleston County School District Project),
5.00%, 12/1/20 | | $ | 5,706,685 | | |
| | 2,020 | | | Lexington County, SC, One School Facility Corp.,
5.00%, 12/1/22 | | | 2,043,957 | | |
| | 3,385 | | | New Jersey Economic Development Authority, (School
Facilities Construction), 5.50%, 9/1/19 | | | 3,802,641 | | |
| | 1,855 | | | Newberry, SC, (Newberry County School District Project),
5.25%, 12/1/24 | | | 1,789,964 | | |
| | | | | | | $ | 21,444,546 | | |
| Nursing Home — 0.4% | | | |
| $ | 2,565 | | | Connecticut State Development Authority, (Alzheimers
Resource Center), 5.20%, 8/15/17 | | $ | 2,383,321 | | |
| | | | | | | $ | 2,383,321 | | |
| Other Revenue — 3.9% | | | |
| $ | 1,000 | | | Arizona Health Facilities Authority,
(Blood Systems, Inc.), 5.00%, 4/1/21 | | $ | 998,110 | | |
| | 890 | | | Barona, CA, (Band of Mission Indians), 8.25%, 1/1/20(2) | | | 897,120 | | |
| | 4,675 | | | Buckeye, OH, Tobacco Settlement Financing Authority,
5.125%, 6/1/24 | | | 4,374,351 | | |
| | 1,220 | | | Central Falls, RI, Detention Facility Revenue,
7.25%, 7/15/35 | | | 1,255,429 | | |
| | 600 | | | Mohegan Tribe, CT, Gaming Authority, 5.375%, 1/1/11(2) | | | 611,916 | | |
| | 4,500 | | | Non-Profit Preferred Funding Trust, Various States,
4.47%, 9/15/37(2) | | | 4,347,810 | | |
| | 240 | | | Otero County, NM, Jail Project Revenue, 5.50%, 4/1/13 | | | 233,825 | | |
| | 700 | | | Otero County, NM, Jail Project Revenue, 5.75%, 4/1/18 | | | 671,503 | | |
| | 5,000 | | | Seminole Tribe of Florida, 5.75%, 10/1/22(2) | | | 4,901,400 | | |
| | 1,700 | | | Silicon Valley, CA, Tobacco Securitization Authority,
0.00%, 6/1/36 | | | 227,460 | | |
| | 4,500 | | | Tennessee Energy Acquisition Corp., 5.00%, 9/1/16 | | | 4,405,185 | | |
| | 1,830 | | | White Earth Band of Chippewa Indians, MN,
6.375%, 12/1/11(2) | | | 1,765,438 | | |
| | 370 | | | Willacy County, TX, Local Government Corp. ,
6.00%, 9/1/10 | | | 368,731 | | |
| | | | | | | $ | 25,058,278 | | |
| Pooled Loans — 0.3% | | | |
| $ | 1,300 | | | Ohio Economic Development, (Ohio Enterprise Bond Fund),
(AMT), 4.60%, 6/1/20 | | $ | 1,315,600 | | |
| | 790 | | | Ohio Economic Development, (Ohio Enterprise Bond Fund),
(AMT), 5.25%, 12/1/15 | | | 829,081 | | |
| | | | | | | $ | 2,144,681 | | |
Principal Amount
(000's omitted) | |
Security | |
Value | |
| Senior Living / Life Care — 1.2% | | | |
| $ | 745 | | | Albuquerque, NM, Retirement Facilities, (La Vida Liena
Retirement Center), 6.60%, 12/15/28 | | $ | 741,826 | | |
| | 1,105 | | | Arizona Health Facilities Authority, (Care Institute, Inc. - Mesa),
7.625%, 1/1/06(7) | | | 1,005,517 | | |
| | 1,000 | | | California Statewide Communities Development Authority,
(Senior Living-Presbyterian Homes), 4.50%, 11/15/16 | | | 977,380 | | |
| | 500 | | | Kansas City, MO, Industrial Development Revenue,
(Kingswood Manor), 5.80%, 11/15/17 | | | 470,270 | | |
| | 200 | | | Maryland Health and Higher Educational Facilities Authority,
(Edenwald), 4.85%, 1/1/13 | | | 195,716 | | |
| | 1,350 | | | Maryland Health and Higher Educational Facilities Authority,
(King Farm Presbyterian Community), 5.00%, 1/1/17 | | | 1,286,820 | | |
| | 1,150 | | | Massachusetts Development Finance Agency, (Linden
Ponds, Inc.), 5.50%, 11/15/22 | | | 1,026,950 | | |
| | 700 | | | Massachusetts Development Finance Agency,
(Volunteers of America), 5.00%, 11/1/17 | | | 645,421 | | |
| | 750 | | | New Jersey Economic Development Authority, (Seabrook
Village, Inc.), 5.00%, 11/15/12 | | | 742,500 | | |
| | 500 | | | North Miami, FL, Health Care Facilties Revenue,
(Imperial Club), 6.125%, 1/1/42 | | | 447,090 | | |
| | 460 | | | St. Joseph County, IN, Holy Cross Village, 5.55%, 5/15/19 | | | 430,822 | | |
| | | | | | | $ | 7,970,312 | | |
| Solid Waste — 1.1% | | | |
| $ | 4,000 | | | Massachusetts Industrial Finance Agency, (Ogden Haverhill),
(AMT), 5.50%, 12/1/13 | | $ | 4,021,600 | | |
| | 3,000 | | | Niagara County, NY, Industrial Development Agency,
(American Ref-Fuel Co., LLC), (AMT), 5.55%, 11/15/24 | | | 2,979,090 | | |
| | | | | | | $ | 7,000,690 | | |
| Special Tax Revenue — 4.6% | | | |
| $ | 1,030 | | | Arbor Greene, FL, Community Development District,
5.00%, 5/1/19 | | $ | 1,024,335 | | |
| | 250 | | | Black Hawk, CO, Device Tax Revenue, 5.00%, 12/1/18 | | | 242,050 | | |
| | 1,251 | | | Bridgeville, DE, (Heritage Shores Special Development
District), 5.125%, 7/1/35 | | | 1,101,080 | | |
| | 275 | | | Concorde Estates, FL, Community Development District,
Capital Improvements, 5.00%, 5/1/11 | | | 263,442 | | |
| | 260 | | | Covington Park, FL, Community Development District,
Capital Improvements, 5.00%, 5/1/21 | | | 260,603 | | |
| | 2,000 | | | Detroit, MI, Downtown Development Authority Tax Increment,
0.00%, 7/1/21 | | | 979,860 | | |
| | 625 | | | Dupree Lakes, FL, Community Development District,
5.00%, 11/1/10 | | | 603,356 | | |
| | 1,955 | | | Dupree Lakes, FL, Community Development District,
5.00%, 5/1/12 | | | 1,828,922 | | |
| | 685 | | | Fishhawk, FL, Community Development District II,
5.125%, 11/1/09 | | | 673,362 | | |
See notes to financial statements
9
Eaton Vance National Limited Maturity Municipals Fund as of March 31, 2008
PORTFOLIO OF INVESTMENTS CONT'D
Principal Amount
(000's omitted) | |
Security | |
Value | |
| Special Tax Revenue (continued) | | | |
| $ | 3,795 | | | Florida State Department Transportation, 5.00%, 7/1/12 | | $ | 4,086,152 | | |
| | 250 | | | Frederick County, MD, Urbana Community Development
Authority, 6.625%, 7/1/25 | | | 250,470 | | |
| | 5 | | | Gateway, FL, Services Community Development District,
(Stoneybrook), 5.50%, 7/1/08 | | | 4,996 | | |
| | 330 | | | Heritage Harbor South, FL, Community Development District,
Capital Improvements, 5.25%, 11/1/08 | | | 329,020 | | |
| | 2,500 | | | Highlands County, FL, Health Facility, 5.125%, 11/15/22 | | | 2,490,950 | | |
| | 45 | | | Longleaf, FL, Community Development District,
6.20%, 5/1/09 | | | 44,967 | | |
| | 3,750 | | | Mahoning County, OH, (Sales Tax), 5.00%, 12/1/10 | | | 3,873,488 | | |
| | 3,000 | | | New Jersey Economic Development Authority,
(Cigarette Tax), 5.50%, 6/15/16 | | | 3,051,210 | | |
| | 1,130 | | | New River Community Development District, FL,
(Capital Improvements), 5.00%, 5/1/13 | | | 1,033,521 | | |
| | 890 | | | North Springs, FL, Improvements District,
(Heron Bay North Assessment Area), 5.00%, 5/1/14 | | | 781,847 | | |
| | 375 | | | Park Meadows, CO, Business Improvement District,
5.00%, 12/1/17 | | | 370,313 | | |
| | 1,450 | | | Poinciana, FL, West Community Development District,
5.875%, 5/1/22 | | | 1,311,917 | | |
| | 1,400 | | | Sterling Hill, FL, Community Development District,
Capital Improvements, 5.10%, 5/1/11 | | | 1,330,056 | | |
| | 375 | | | Sterling Hill, FL, Community Development District,
Capital Improvements, 5.50%, 11/1/10 | | | 372,450 | | |
| | 3,400 | | | Tisons Landing, FL, Community Development District,
5.00%, 11/1/11 | | | 3,183,964 | | |
| | 245 | | | Tiverton, RI, Obligation Tax Increment,
(Mount Hope Bay Village), 6.00%, 5/1/09 | | | 248,408 | | |
| | | | | | | $ | 29,740,739 | | |
| Transportation — 4.5% | | | |
| $ | 1,140 | | | Branson, MO, Regional Airport Transportation Development
District, (Branson Airport LLC), (AMT), 6.00%, 7/1/25 | | $ | 1,034,641 | | |
| | 3,510 | | | Branson, MO, Regional Airport Transportation Development
District, (Branson Airport LLC), (AMT), 6.00%, 7/1/37 | | | 3,026,849 | | |
| | 2,500 | | | Louisiana Offshore Terminal Authority, Deepwater Port
Revenue, (Loop, LLC), 5.25%, 9/1/15 | | | 2,663,275 | | |
| | 10,000 | | | Maryland Transportation Authority, 5.00%, 3/1/18 | | | 10,801,100 | | |
| | 5,000 | | | Metropolitan Transportation Authority, NY,
5.00%, 11/15/30 | | | 5,320,450 | | |
| | 5,000 | | | New Jersey Transportation Trust Fund Authority,
5.25%, 12/15/21 | | | 5,374,850 | | |
| | 1,000 | | | Port Authority of New York and New Jersey,
5.375%, 3/1/28 | | | 1,069,180 | | |
| | | | | | | $ | 29,290,345 | | |
Principal Amount
(000's omitted) | |
Security | |
Value | |
| Water and Sewer — 4.4% | | | |
| $ | 9,085 | | | Fairfax County, VA, Water Authority, 5.00%, 4/1/18 | | $ | 9,887,751 | | |
| | 11,980 | | | Virginia State Resources Authority, Clean Water Revenue,
(Revolving Fund), 5.00%, 10/1/19 | | | 12,973,262 | | |
| | 5,000 | | | Virginia State Resources Authority, Clean Water Revenue,
(Revolving Fund), 5.50%, 10/1/19 | | | 5,733,200 | | |
| | | | | | | $ | 28,594,213 | | |
Total Tax-Exempt Investments
(identified cost $639,586,641) | | $ | 636,448,865 | | |
| Short-Term Investments — 0.3% | | | |
Principal Amount
(000's omitted) | |
Description | |
Value | |
| Insured-Education — 0.3% | | | |
| $ | 2,000 | | | New York Dormitory Authority, (FGIC), Variable Rate,
(SPA: Wachovia Bank N.A.), 4.00%, 5/15/29(8) | | $ | 2,000,000 | | |
Total Short-Term Investments
(identified cost $2,000,000) | | $ | 2,000,000 | | |
Total Investments — 98.4%
(identified cost $641,586,641) | | $ | 638,448,865 | | |
| Other Assets, Less Liabilities — 1.6% | | $ | 10,105,193 | | |
| Net Assets — 100.0% | | $ | 648,554,058 | | |
AMBAC - AMBAC Financial Group, Inc.
AMT - Interest earned from these securities may be considered a tax preference item for purposes of the Federal Alternative Minimum Tax.
CIFG - CIFG Assurance North America, Inc.
FGIC - Financial Guaranty Insurance Company
FSA - Financial Security Assurance, Inc.
MBIA - Municipal Bond Insurance Association
PCR - Pollution Control Revenue
PSF - Permanent School Fund
SPA - Standby Bond Purchase Agreement
SUNY - State University of New York
XLCA - XL Capital Assurance, Inc.
See notes to financial statements
10
Eaton Vance National Limited Maturity Municipals Fund as of March 31, 2008
PORTFOLIO OF INVESTMENTS CONT'D
At March 31, 2008, the concentration of the Fund's investments in the various states, determined as a percentage of net assets, is as follows:
| New York | | | 12.7 | % | |
| Florida | | | 11.9 | % | |
| Others, representing less than 10% individually | | | 73.8 | % | |
The Fund invests primarily in debt securities issued by municipalities. The ability of the issuers of the debt securities to meet their obligations may be affected by economic developments in a specific industry or municipality. In order to reduce the risk associated with such economic developments, at March 31, 2008, 33.3% of total investments are backed by bond insurance of various financial institutions and financial guaranty assurance agencies. The aggregate percentage insured by an individual financial institution ranged from 0.2% to 13.4% of total investments.
(1) Security (or a portion thereof) has been segregated to cover payable for when-issued securities.
(2) Security exempt from registration under Rule 144A of the Securities Act of 1933. These securities may be sold in transactions exempt from registration, normally to qualified institutional buyers. At March 31, 2008, the aggregate value of the securities is $13,442,624 or 2.1% of the Fund's net assets.
(3) When-issued security.
(4) Security represents the underlying municipal obligation of an inverse floating rate obligation held by the Fund.
(5) Security is in default and is making only partial interest payments.
(6) Security (or a portion thereof) has been segregated to cover margin requirements on open financial futures contracts.
(7) Security is in default with respect to scheduled principal payments.
(8) Variable rate demand obligation. The stated interest rate represents the rate in effect at March 31, 2008.
See notes to financial statements
11
Eaton Vance National Limited Maturity Municipals Fund as of March 31, 2008
FINANCIAL STATEMENTS
Statement of Assets and Liabilities
As of March 31, 2008
| Assets | |
| Investments, at value (identified cost, $641,586,641) | | $ | 638,448,865 | | |
| Cash | | | 778,489 | | |
| Receivable for investments sold | | | 7,248,196 | | |
| Receivable for Fund shares sold | | | 5,393,817 | | |
| Interest receivable | | | 9,177,493 | | |
| Total assets | | $ | 661,046,860 | | |
| Liabilities | |
| Payable for floating rate notes issued | | $ | 4,980,000 | | |
| Payable for when-issued securities | | | 2,886,215 | | |
| Payable for Fund shares redeemed | | | 2,781,339 | | |
| Dividends payable | | | 933,497 | | |
| Payable for daily variation margin on open financial futures contracts | | | 317,738 | | |
| Payable to affiliate for investment adviser fee | | | 231,848 | | |
| Payable to affiliate for distribution and service fees | | | 148,929 | | |
| Interest expense and fees payable | | | 65,007 | | |
| Accrued expenses | | | 148,229 | | |
| Total liabilities | | $ | 12,492,802 | | |
| Net Assets | | $ | 648,554,058 | | |
| Sources of Net Assets | |
| Paid-in capital | | $ | 669,078,296 | | |
| Accumulated net realized loss (computed on the basis of identified cost) | | | (12,757,864 | ) | |
| Accumulated distributions in excess of net investment income | | | (432,979 | ) | |
| Net unrealized depreciation (computed on the basis of identified cost) | | | (7,333,395 | ) | |
| Total | | $ | 648,554,058 | | |
| Class A Shares | |
| Net Assets | | $ | 541,176,379 | | |
| Shares Outstanding | | | 54,489,745 | | |
Net Asset Value and Redemption Price Per Share
(net assets ÷ shares of beneficial interest outstanding) | | $ | 9.93 | | |
Maximum Offering Price Per Share
(100 ÷ 97.75 of $9.93) | | $ | 10.16 | | |
| Class B Shares | |
| Net Assets | | $ | 6,511,631 | | |
| Shares Outstanding | | | 655,229 | | |
Net Asset Value and Offering Price Per Share*
(net assets ÷ shares of beneficial interest outstanding) | | $ | 9.94 | | |
| Class C Shares | |
| Net Assets | | $ | 100,866,048 | | |
| Shares Outstanding | | | 10,831,306 | | |
Net Asset Value and Offering Price Per Share*
(net assets ÷ shares of beneficial interest outstanding) | | $ | 9.31 | | |
On sales of $100,000 or more, the offering price of Class A shares is reduced.
* Redemption price per share is equal to the net asset value less any applicable contingent deferred sales charge.
Statement of Operations
For the Year Ended
March 31, 2008
| Investment Income | |
| Interest | | $ | 26,473,993 | | |
| Total investment income | | $ | 26,473,993 | | |
| Expenses | |
| Investment adviser fee | | $ | 2,477,355 | | |
| Trustees' fees and expenses | | | 22,653 | | |
Distribution and service fees
Class A | | | 717,170 | | |
| Class B | | | 74,528 | | |
| Class C | | | 807,142 | | |
| Interest expense and fees | | | 271,224 | | |
| Custodian fee | | | 236,451 | | |
| Transfer and dividend disbursing agent fees | | | 226,297 | | |
| Registration fees | | | 157,535 | | |
| Legal and accounting services | | | 62,437 | | |
| Printing and postage | | | 35,037 | | |
| Miscellaneous | | | 42,809 | | |
| Total expenses | | $ | 5,130,638 | | |
Deduct —
Reduction of custodian fee | | $ | 71,516 | | |
| Total expense reductions | | $ | 71,516 | | |
| Net expenses | | $ | 5,059,122 | | |
| Net investment income | | $ | 21,414,871 | | |
| Realized and Unrealized Gain (Loss) | |
Net realized gain (loss) —
Investment transactions (identified cost basis) | | $ | (1,704,333 | ) | |
| Financial futures contracts | | | (7,102,094 | ) | |
| Net realized loss | | $ | (8,806,427 | ) | |
Change in unrealized appreciation (depreciation) —
Investments (identified cost basis) | | $ | (14,131,332 | ) | |
| Financial futures contracts | | | (4,663,608 | ) | |
| Net change in unrealized appreciation (depreciation) | | $ | (18,794,940 | ) | |
| Net realized and unrealized loss | | $ | (27,601,367 | ) | |
| Net decrease in net assets from operations | | $ | (6,186,496 | ) | |
See notes to financial statements
12
Eaton Vance National Limited Maturity Municipals Fund as of March 31, 2008
FINANCIAL STATEMENTS CONT'D
Statements of Changes in Net Assets
Increase (Decrease)
in Net Assets | | Year Ended
March 31, 2008 | | Year Ended
March 31, 2007 | |
From operations —
Net investment income | | $ | 21,414,871 | | | $ | 12,218,504 | | |
Net realized gain (loss) from investment
transactions and financial
futures contracts | | | (8,806,427 | ) | | | 132,986 | | |
Net change in unrealized appreciation
(depreciation) of investments and
financial futures contracts | | | (18,794,940 | ) | | | 2,947,179 | | |
Net increase (decrease) in net assets
from operations | | $ | (6,186,496 | ) | | $ | 15,298,669 | | |
Distributions to shareholders —
From net investment income
Class A | | $ | (18,398,082 | ) | | $ | (9,215,354 | ) | |
| Class B | | | (256,350 | ) | | | (522,817 | ) | |
| Class C | | | (2,773,571 | ) | | | (2,485,942 | ) | |
| Total distributions to shareholders | | $ | (21,428,003 | ) | | $ | (12,224,113 | ) | |
Transactions in shares of beneficial interest —
Proceeds from sale of shares
Class A | | $ | 420,803,160 | | | $ | 271,099,267 | | |
| Class B | | | 3,585,732 | | | | 2,076,410 | | |
| Class C | | | 55,236,420 | | | | 25,131,039 | | |
Net asset value of shares issued to
shareholders in payment of
distributions declared
Class A | | | 12,533,194 | | | | 5,156,778 | | |
| Class B | | | 161,203 | | | | 325,919 | | |
| Class C | | | 1,207,554 | | | | 1,123,843 | | |
Cost of shares redeemed
Class A | | | (242,096,051 | ) | | | (98,725,649 | ) | |
| Class B | | | (2,477,864 | ) | | | (4,671,636 | ) | |
| Class C | | | (32,641,360 | ) | | | (23,124,512 | ) | |
Net asset value of shares exchanged
Class A | | | 5,802,569 | | | | 7,137,837 | | |
| Class B | | | (5,802,569 | ) | | | (7,137,837 | ) | |
Net increase in net assets from
Fund share transactions | | $ | 216,311,988 | | | $ | 178,391,459 | | |
| Net increase in net assets | | $ | 188,697,489 | | | $ | 181,466,015 | | |
| Net Assets | |
| At beginning of year | | $ | 459,856,569 | | | $ | 278,390,554 | | |
| At end of year | | $ | 648,554,058 | | | $ | 459,856,569 | | |
Accumulated distributions
in excess of net investment
income included in net assets | |
| At end of year | | $ | (432,979 | ) | | $ | (146,496 | ) | |
See notes to financial statements
13
Eaton Vance National Limited Maturity Municipals Fund as of March 31, 2008
FINANCIAL STATEMENTS CONT'D
Financial Highlights
| | | Class A | |
| | | Year Ended March 31, | |
| | | 2008(1) | | 2007(1) | | 2006(1) | | 2005(1) | | 2004(1) | |
| Net asset value — Beginning of year | | $ | 10.420 | | | $ | 10.290 | | | $ | 10.210 | | | $ | 10.400 | | | $ | 10.250 | | |
| Income (loss) from operations | |
| Net investment income | | $ | 0.392 | | | $ | 0.410 | | | $ | 0.411 | | | $ | 0.422 | | | $ | 0.437 | | |
| Net realized and unrealized gain (loss) | | | (0.488 | ) | | | 0.134 | | | | 0.078 | | | | (0.187 | ) | | | 0.138 | | |
| Total income (loss) from operations | | $ | (0.096 | ) | | $ | 0.544 | | | $ | 0.489 | | | $ | 0.235 | | | $ | 0.575 | | |
| Less distributions | |
| From net investment income | | $ | (0.394 | ) | | $ | (0.414 | ) | | $ | (0.409 | ) | | $ | (0.425 | ) | | $ | (0.425 | ) | |
| Total distributions | | $ | (0.394 | ) | | $ | (0.414 | ) | | $ | (0.409 | ) | | $ | (0.425 | ) | | $ | (0.425 | ) | |
| Net asset value — End of year | | $ | 9.930 | | | $ | 10.420 | | | $ | 10.290 | | | $ | 10.210 | | | $ | 10.400 | | |
| Total Return(2) | | | (0.94 | )% | | | 5.38 | % | | | 4.88 | % | | | 2.29 | % | | | 5.70 | % | |
| Ratios/Supplemental Data | |
| Net assets, end of year (000's omitted) | | $ | 541,176 | | | $ | 367,010 | | | $ | 180,401 | | | $ | 152,111 | | | $ | 130,466 | | |
| Ratios (As a percentage of average daily net assets): | |
| Expenses excluding interest and fees | | | 0.71 | % | | | 0.78 | % | | | 0.79 | % | | | 0.80 | %†(3) | | | 0.80 | %(3) | |
| Interest and fee expense(4) | | | 0.05 | % | | | 0.10 | % | | | — | | | | — | | | | — | | |
| Total expenses before custodian fee reduction | | | 0.76 | % | | | 0.88 | % | | | 0.79 | % | | | 0.80 | %†(3) | | | 0.80 | %(3) | |
| Expenses after custodian fee reduction excluding interest and fees | | | 0.70 | % | | | 0.76 | % | | | 0.78 | % | | | 0.79 | %†(3) | | | 0.80 | %(3) | |
| Net investment income | | | 3.84 | % | | | 3.95 | % | | | 3.99 | % | | | 4.09 | % | | | 4.22 | % | |
| Portfolio Turnover of the Portfolio | | | — | | | | — | | | | — | | | | 14 | %(5) | | | 27 | %(5) | |
| Portfolio Turnover of the Fund | | | 39 | % | | | 38 | % | | | 48 | % | | | 19 | % | | | — | | |
† The operating expenses of the Fund reflect a reduction of the investment adviser fee. Had such actions not been taken, the ratios would have been the same.
(1) Net investment income per share was computed using average shares outstanding.
(2) Returns are historical and are calculated by determining the percentage change in net asset value with all distributions reinvested.
(3) Includes the Fund's share of the Portfolio's allocated expenses while the Fund was making investments directly into the Portfolio.
(4) Interest and fee expense relates to the liability for floating rate notes issued in conjunction with inverse floater securities transactions (See Note 1I).
(5) Portfolio turnover represents the rate of portfolio activity for the period while the Fund was making investments directly into the Portfolio.
See notes to financial statements
14
Eaton Vance National Limited Maturity Municipals Fund as of March 31, 2008
FINANCIAL STATEMENTS CONT'D
Financial Highlights
| | | Class B | |
| | | Year Ended March 31, | |
| | | 2008(1) | | 2007(1) | | 2006(1) | | 2005(1) | | 2004(1) | |
| Net asset value — Beginning of year | | $ | 10.420 | | | $ | 10.290 | | | $ | 10.220 | | | $ | 10.410 | | | $ | 10.260 | | |
| Income (loss) from operations | |
| Net investment income | | $ | 0.318 | | | $ | 0.340 | | | $ | 0.335 | | | $ | 0.346 | | | $ | 0.360 | | |
| Net realized and unrealized gain (loss) | | | (0.482 | ) | | | 0.127 | | | | 0.068 | | | | (0.191 | ) | | | 0.142 | | |
| Total income (loss) from operations | | $ | (0.164 | ) | | $ | 0.467 | | | $ | 0.403 | | | $ | 0.155 | | | $ | 0.502 | | |
| Less distributions | |
| From net investment income | | $ | (0.316 | ) | | $ | (0.337 | ) | | $ | (0.333 | ) | | $ | (0.345 | ) | | $ | (0.352 | ) | |
| Total distributions | | $ | (0.316 | ) | | $ | (0.337 | ) | | $ | (0.333 | ) | | $ | (0.345 | ) | | $ | (0.352 | ) | |
| Net asset value — End of year | | $ | 9.940 | | | $ | 10.420 | | | $ | 10.290 | | | $ | 10.220 | | | $ | 10.410 | | |
| Total Return(2) | | | (1.59 | )% | | | 4.60 | % | | | 3.99 | % | | | 1.51 | % | | | 4.94 | % | |
| Ratios/Supplemental Data | |
| Net assets, end of year (000's omitted) | | $ | 6,512 | | | $ | 11,435 | | | $ | 20,610 | | | $ | 27,157 | | | $ | 33,731 | | |
| Ratios (As a percentage of average daily net assets): | |
| Expenses excluding interest and fees | | | 1.46 | % | | | 1.53 | % | | | 1.54 | % | | | 1.55 | %†(3) | | | 1.55 | %(3) | |
| Interest and fee expense(4) | | | 0.05 | % | | | 0.10 | % | | | — | | | | — | | | | — | | |
| Total expenses before custodian fee reduction | | | 1.51 | % | | | 1.63 | % | | | 1.54 | % | | | 1.55 | %†(3) | | | 1.55 | %(3) | |
| Expenses after custodian fee reduction excluding interest and fees | | | 1.45 | % | | | 1.51 | % | | | 1.53 | % | | | 1.54 | %†(3) | | | 1.55 | %(3) | |
| Net investment income | | | 3.11 | % | | | 3.27 | % | | | 3.25 | % | | | 3.36 | % | | | 3.48 | % | |
| Portfolio Turnover of the Portfolio | | | — | | | | — | | | | — | | | | 14 | %(5) | | | 27 | %(5) | |
| Portfolio Turnover of the Fund | | | 39 | % | | | 38 | % | | | 48 | % | | | 19 | % | | | — | | |
† The operating expenses of the Fund reflect a reduction of the investment adviser fee. Had such actions not been taken, the ratios would have been the same.
(1) Net investment income per share was computed using average shares outstanding.
(2) Returns are historical and are calculated by determining the percentage change in net asset value with all distributions reinvested.
(3) Includes the Fund's share of the Portfolio's allocated expenses while the Fund was making investments directly into the Portfolio.
(4) Interest and fee expense relates to the liability for floating rate notes issued in conjunction with inverse floater securities transactions (See Note 1I).
(5) Portfolio turnover represents the rate of portfolio activity for the period while the Fund was making investments directly into the Portfolio.
See notes to financial statements
15
Eaton Vance National Limited Maturity Municipals Fund as of March 31, 2008
FINANCIAL STATEMENTS CONT'D
Financial Highlights
| | | Class C | |
| | | Year Ended March 31, | |
| | | 2008(1) | | 2007(1) | | 2006(1) | | 2005(1) | | 2004(1) | |
| Net asset value — Beginning of year | | $ | 9.770 | | | $ | 9.640 | | | $ | 9.580 | | | $ | 9.750 | | | $ | 9.610 | | |
| Income (loss) from operations | |
| Net investment income | | $ | 0.297 | | | $ | 0.316 | | | $ | 0.313 | | | $ | 0.324 | | | $ | 0.335 | | |
| Net realized and unrealized gain (loss) | | | (0.461 | ) | | | 0.130 | | | | 0.059 | | | | (0.171 | ) | | | 0.133 | | |
| Total income (loss) from operations | | $ | (0.164 | ) | | $ | 0.446 | | | $ | 0.372 | | | $ | 0.153 | | | $ | 0.468 | | |
| Less distributions | |
| From net investment income | | $ | (0.296 | ) | | $ | (0.315 | ) | | $ | (0.312 | ) | | $ | (0.323 | ) | | $ | (0.328 | ) | |
| Total distributions | | $ | (0.296 | ) | | $ | (0.315 | ) | | $ | (0.312 | ) | | $ | (0.323 | ) | | $ | (0.328 | ) | |
| Net asset value — End of year | | $ | 9.310 | | | $ | 9.770 | | | $ | 9.640 | | | $ | 9.580 | | | $ | 9.750 | | |
| Total Return(2) | | | (1.70 | )% | | | 4.68 | % | | | 3.93 | % | | | 1.51 | %(3) | | | 4.93 | % | |
| Ratios/Supplemental Data | |
| Net assets, end of year (000's omitted) | | $ | 100,866 | | | $ | 81,411 | | | $ | 77,379 | | | $ | 77,325 | | | $ | 67,073 | | |
| Ratios (As a percentage of average daily net assets): | |
| Expenses excluding interest and fees | | | 1.46 | % | | | 1.53 | % | | | 1.54 | % | | | 1.55 | %†(4) | | | 1.55 | %(4) | |
| Interest and fee expense(5) | | | 0.05 | % | | | 0.10 | % | | | — | | | | — | | | | — | | |
| Total expenses before custodian fee reduction | | | 1.51 | % | | | 1.63 | % | | | 1.54 | % | | | 1.55 | %†(4) | | | 1.55 | %(4) | |
| Expenses after custodian fee reduction excluding interest and fees | | | 1.45 | % | | | 1.51 | % | | | 1.53 | % | | | 1.54 | %†(4) | | | 1.55 | %(4) | |
| Net investment income | | | 3.10 | % | | | 3.24 | % | | | 3.25 | % | | | 3.35 | % | | | 3.45 | % | |
| Portfolio Turnover of the Portfolio | | | — | | | | — | | | | — | | | | 14 | %(6) | | | 27 | %(6) | |
| Portfolio Turnover of the Fund | | | 39 | % | | | 38 | % | | | 48 | % | | | 19 | % | | | — | | |
† The operating expenses of the Fund reflect a reduction of the investment adviser fee. Had such actions not been taken, the ratios would have been the same.
(1) Net investment income per share was computed using average shares outstanding.
(2) Returns are historical and are calculated by determining the percentage change in net asset value with all distributions reinvested.
(3) Total return reflects a decrease of 0.07% due to a change in the timing of the payment and reinvestment of distributions.
(4) Includes the Fund's share of the Portfolio's allocated expenses while the Fund was making investments directly into the Portfolio.
(5) Interest and fee expense relates to the liability for floating rate notes issued in conjunction with inverse floater securities transactions (See Note 1I).
(6) Portfolio turnover represents the rate of portfolio activity for the period while the Fund was making investments directly into the Portfolio.
See notes to financial statements
16
Eaton Vance National Limited Maturity Municipals Fund as of March 31, 2008
NOTES TO FINANCIAL STATEMENTS
1 Significant Accounting Policies
Eaton Vance National Limited Maturity Municipals Fund (the Fund) is a diversified series of Eaton Vance Investment Trust (the Trust). The Trust is a Massachusetts business trust registered under the Investment Company Act of 1940, as amended (the 1940 Act), as an open-end management investment company. The Fund seeks to provide a high level of current income exempt from regular federal income tax and limited principal fluctuation. The Fund offers three classes of shares. Class A shares are generally sold subject to a sales charge imposed at time of purchase. Class B and Class C shares are sold at net asset value and are generally subject to a contingent deferred sales charge (see Note 5). Class B shares of the Fund held for the longer of (i) four years or (ii) the time at which the conti ngent deferred sales charge applicable to such shares expires will automatically convert to Class A shares as described in the Fund's prospectus. Each class represents a pro-rata interest in the Fund, but votes separately on class-specific matters and (as noted below) is subject to different expenses. Realized and unrealized gains and losses are allocated daily to each class of shares based on the relative net assets of each class to the total net assets of the Fund. Net investment income, other than class-specific expenses, is allocated daily to each class of shares based upon the ratio of the value of each class's paid shares to the total value of all paid shares. Each class of shares differs in its distribution plan and certain other class-specific expenses.
The following is a summary of significant accounting policies of the Fund. The policies are in conformity with accounting principles generally accepted in the United States of America.
A Investment Valuations — Municipal bonds and taxable obligations, if any, are generally valued on the basis of valuations furnished by a pricing service. Financial futures contracts and options on financial futures contracts listed on commodity exchanges are valued at closing settlement prices. Short-term obligations, maturing in sixty days or less, are valued at amortized cost, which approximates market value. Investments for which valuations or market quotations are not readily available, and investments for which the price of a security is not believed to represent its fair market value, are valued at fair value using methods determined in good faith by or at the direction of the Trustees.
B Investment Transactions and Related Income — Investment transactions for financial statement purposes are accounted for on a trade date basis. Realized gains and losses on investments sold are determined on the basis of identified cost. Interest income is recorded on the basis of interest accrued, adjusted for amortization of premium or accretion of discount.
C Federal Taxes — The Fund's policy is to comply with the provisions of the Internal Revenue Code applicable to regulated investment companies and to distribute to shareholders each year substantially all of its taxable, if any, and tax-exempt net investment income, and all or substantially all of its net realized capital gains. Accordingly, no provision for federal income or excise tax is necessary. The Fund intends to satisfy conditions which will enable it to designate distributions from the interest income generated by its investments in municipal obligations, which are exempt from regular federal income tax when received by the Fund, as exempt-interest dividends. The portion of such interest, if any, earned on private activity bonds issued after August 7, 1986, may be considered a tax preference item to shareholders.
At March 31, 2008, the Fund, for federal income tax purposes, had a capital loss carryforward of $10,314,100 which will reduce its taxable income arising from future net realized gains on investment transactions, if any, to the extent permitted by the Internal Revenue Code, and thus will reduce the amount of distributions to shareholders, which would otherwise be necessary to relieve the Fund of any liability for federal income or excise tax. Such capital loss carryforward will expire on March 31, 2011 ($1,047,498), March 31, 2012 ($779,785), March 31, 2013 ($1,412,625), March 31, 2015 ($721,882) and March 31, 2016 ($6,352,310).
Additionally, at March 31, 2008, the Fund had net capital losses of $6,928,449 attributable to security transactions incurred after October 31, 2007. These net capital losses are treated as arising on the first day of the Fund's taxable year ending March 31, 2009.
In June 2006, the Financial Accounting Standards Board (FASB) issued FASB Interpretation No. 48 (FIN 48), "Accounting for Uncertainty in Income Taxes – an interpretation of FASB Statement No. 109". FIN 48 clarifies the accounting for uncertainty in income taxes recognized in accordance with FASB Statement No. 109, "Accounting for Income Taxes". This interpretation prescribes a recognition threshold and measurement attribute for the financial statement recognition and
17
Eaton Vance National Limited Maturity Municipals Fund as of March 31, 2008
NOTES TO FINANCIAL STATEMENTS CONT'D
measurement of a tax position taken or expected to be taken in a tax return. It also provides guidance on de-recognition, classification, interest and penalties, accounting in interim periods, disclosure and transition. FIN 48 is effective on the last business day of the first required financial reporting period for fiscal years beginning after December 15, 2006. Management has concluded that as of March 31, 2008, there are no uncertain tax positions that would require financial statement recognition, de-recognition, or disclosure. Each of the Fund's federal tax returns filed in the 3-year period ended March 31, 2008 remains subject to examination by the Internal Revenue Service.
D Expenses — The majority of expenses of the Trust are directly identifiable to an individual fund. Expenses which are not readily identifiable to a specific fund are allocated taking into consideration, among other things, the nature and type of expense and the relative size of the funds.
E Expense Reduction — State Street Bank and Trust Company (SSBT) serves as custodian of the Fund. Pursuant to the custodian agreement, SSBT receives a fee reduced by credits, which are determined based on the average daily cash balance the Fund maintains with SSBT. All credit balances, if any, used to reduce the Fund's custodian fees are reported as a reduction of expenses in the Statement of Operations.
F Legal Fees — Legal fees and other related expenses incurred as part of negotiations of the terms and requirement of capital infusions, or that are expected to result in the restructuring of, or a plan of reorganization for, an investment are recorded as realized losses. Ongoing expenditures to protect or enhance an investment are treated as operating expenses.
G Use of Estimates — The preparation of the financial statements in conformity with accounting principles generally accepted in the United States of America requires management to make estimates and assumptions that affect the reported amounts of assets and liabilities at the date of the financial statements and the reported amounts of income and expense during the reporting period. Actual results could differ from those estimates.
H Indemnifications — Under the Trust's organizational documents, its officers and Trustees may be indemnified against certain liabilities and expenses arising out of the performance of their duties to the Fund, and shareholders are indemnified against personal liability for the obligations of the Trust. Additionally, in the normal course of business, the Fund enters into agreements with service providers that may contain indemnification clauses. The Fund's maximum exposure under these arrangements is unknown as this would involve future claims that may be made against the Fund that have not yet occurred.
I Floating Rate Notes Issued in Conjunction with Securities Held — The Fund may invest in inverse floating rate securities, whereby the Fund may sell a fixed rate bond to a broker for cash. At the same time, the Fund buys a residual interest in the assets and cash flows of a Special-Purpose Vehicle (the SPV), (which is generally organized as a trust), set up by the broker, often referred to as an inverse floating rate obligation (Inverse Floater). The broker deposits a fixed rate bond into the SPV with the same CUSIP number as the fixed rate bond sold to the broker by the Fund, and which may have been, but is not required to be, the fixed rate bond purchased from the Fund (the Fixed Rate Bond). The SP V also issues floating rate notes (Floating Rate Notes) which are sold to third-parties. The Fund may enter into shortfall and forbearance agreements with the broker by which the Fund agrees to reimburse the broker, in certain circumstances, for the difference between the liquidation value of the Fixed Rate Bond held by the SPV and the liquidation value of the Floating Rate Notes, as well as any shortfalls in interest cash flows. The Inverse Floater held by the Fund gives the Fund the right (1) to cause the holders of the Floating Rate Notes to tender their notes at par, and (2) to have the broker transfer the Fixed Rate Bond held by the SPV to the Fund, thereby collapsing the SPV. Pursuant to Financial Accounting Standards Board (FASB) Statement No. 140, "Accounting for Transfers and Servicing of Financial Assets and Extinguishment of Liabilities" (FAS 140), the Fund accounts for the transaction described above as a secured borrowing by including the Fixed Rate Bond in its Portfolio of Investments and the Floating Rate Notes as a liability under the caption "Payable for floating rate notes issued" in its Statement of Assets and Liabilities. The Floating Rate Notes have interest rates that generally reset weekly and their holders have the option to tender their notes to the broker for redemption at par at each reset date. Interest expense related to the Fund's liability with respect to Floating Rate Notes is recorded as incurred. At March 31, 2008, the amount of the Fund's Floating Rate Notes outstanding and the related collateral were $4,980,000 and $7,986,226, respectively. The interest rate on the Floating Rate Notes outstanding at March 31, 2008 was 2.16%.
18
Eaton Vance National Limited Maturity Municipals Fund as of March 31, 2008
NOTES TO FINANCIAL STATEMENTS CONT'D
The Fund's investment policies and restrictions expressly permit investments in Inverse Floaters. Inverse floating rate securities typically offer the potential for yields exceeding the yields available on fixed rate bonds with comparable credit quality and maturity. The Fund's investment policies do not allow the Fund to borrow money for purposes of making investments. Management believes that the Fund's restrictions on borrowings do not apply to the secured borrowings deemed to have occurred for accounting purposes pursuant to FAS 140, which is distinct from a legal borrowing of the Fund to which the policies apply. Inverse Floaters held by the Fund are securities exempt from registration under Rule 144A of the Securities Act of 1933.
J Financial Futures Contracts — The Fund may enter into financial futures contracts. The Fund's investment in financial futures contracts is designed for hedging against changes in interest rates or as a substitute for the purchase of securities. Upon entering into a financial futures contract, the Fund is required to deposit with the broker, either in cash or securities an amount equal to a certain percentage of the purchase price (initial margin). Subsequent payments, known as variation margin, are made or received by the Fund each business day, depending on the daily fluctuations in the value of the underlying security, and are recorded as unrealized gains or losses by the Fund. Gains (losses) are realized upon the expiration or closing of the financial futures contracts. Should market conditions change unexpectedly, the Fund may not achieve the anticipated benefits of the financial futures contracts and may realize a loss. In entering such contracts, the Fund bears the risk if the counterparties do not perform under the contracts' terms.
K When-Issued Securities and Delayed Delivery Transactions — The Fund may purchase or sell securities on a delayed delivery or when-issued basis. Payment and delivery may take place after the customary settlement period for that security. At the time the transaction is negotiated, the price of the security that will be delivered is fixed. The Fund maintains security positions for these commitments such that sufficient liquid assets will be available to make payments upon settlement. Securities purchased on a delayed delivery or when-issued basis are marked-to-market daily and begin earning interest on settlement date. Losses may arise due to changes in the market value of the underlying securities or if the counterparty does not perform under the contract.
2 Distributions to Shareholders
The net investment income of the Fund is determined daily and substantially all of the net investment income so determined is declared as a dividend to shareholders of record at the time of declaration. Distributions are declared separately for each class of shares. Distributions are paid monthly. Distributions of realized capital gains (reduced by available capital loss carryforwards, if any), are made at least annually. Shareholders may reinvest income and capital gain distributions in additional shares of the same class of the Fund at the net asset value as of the reinvestment date or, at the election of the shareholder, receive distributions in cash. The Fund distinguishes between distributions on a tax basis and a financial reporting basis. Accounting principles generally accepted in the United States of America require that only distributions in excess of tax basis earnings and profits be reported in the financial statemen ts as a return of capital. Permanent differences between book and tax accounting relating to distributions are reclassified to paid-in capital.
The tax character of distributions declared for the years ended March 31, 2008 and March 31, 2007 was as follows:
| | | Year Ended March 31, | |
| | | 2008 | | 2007 | |
| Distributions declared from: | |
| Tax-exempt income | | $ | 21,395,609 | | | $ | 12,187,541 | | |
| Ordinary income | | $ | 32,394 | | | $ | 36,572 | | |
During the year ended March 31, 2008, accumulated net realized loss was decreased by $273,351 and accumulated distributions in excess of net investment income was increased by $273,351 due to differences between book and tax accounting, primarily for accretion of market discount. These reclassifications had no effect on the net assets or net asset value per share of the Fund.
As of March 31, 2008, the components of distributable earnings (accumulated losses) and unrealized appreciation (depreciation) on a tax basis were as follows:
| Undistributed ordinary income | | $ | 500,518 | | |
| Capital loss carryforward and post October losses | | $ | (17,242,549 | ) | |
| Net unrealized depreciation | | $ | (2,848,710 | ) | |
| Other temporary differences | | $ | (933,497 | ) | |
19
Eaton Vance National Limited Maturity Municipals Fund as of March 31, 2008
NOTES TO FINANCIAL STATEMENTS CONT'D
The differences between components of distributable earnings (accumulated losses) on a tax basis and the amounts reflected in the Statement of Assets and Liabilities are primarily due to accretion of market discount, futures contracts, inverse floaters and the timing of recognizing distributions to shareholders.
3 Investment Adviser Fee and Other Transactions with Affiliates
The investment adviser fee is earned by Boston Management and Research (BMR), a subsidiary of Eaton Vance Management (EVM), as compensation for management and investment advisory services rendered to the Fund. The fee is based upon a percentage of average daily net assets plus a percentage of gross income (i.e., income other than gains from the sale of securities) and is payable monthly. For the year ended March 31, 2008, the advisory fee amounted to $2,477,355 representing 0.43% of the Fund's average daily net assets. EVM serves as the administrator to the Fund, but receives no compensation. EVM serves as the sub-transfer agent of the Fund and receives from the transfer agent an aggregate fee based upon the actual expenses incurred by EVM in the performance of these services. For the ye ar ended March 31, 2008, EVM earned $12,585 in sub-transfer agent fees. The Fund was informed that Eaton Vance Distributors, Inc. (EVD), the Fund's principal underwriter and an affiliate of EVM, received $37,303 as its portion of the sales charge on sales of Class A shares for the year ended March 31, 2008. EVD also received distribution and service fees from Class A, Class B and Class C shares (see Note 4) and contingent deferred sales charges (see Note 5).
Except for Trustees of the Fund who are not members of EVM's or BMR's organizations, officers and Trustees receive remuneration for their services to the Fund out of the investment adviser fee. Trustees of the Fund who are not affiliated with the investment adviser may elect to defer receipt of all or a percentage of their annual fees in accordance with the terms of the Trustees Deferred Compensation Plan. For the year ended March 31, 2008, no significant amounts have been deferred. Certain officers and Trustees of the Fund are officers of the above organizations.
4 Distribution Plans
The Fund has in effect a distribution plan for Class A shares (Class A Plan) pursuant to Rule 12b-1 under the 1940 Act. The Class A Plan provides that the Fund will pay EVD a distribution and service fee not exceeding 0.25% per annum of its average daily net assets attributable to Class A shares for distribution services and facilities provided to the Fund by EVD, as well as for personal services and/or the maintenance of shareholder accounts. The Trustees approved distribution and service fee payments equal to 0.15% per annum of the Fund's average daily net assets attributab le to Class A shares. Distribution and service fees paid or accrued to EVD for the year ended March 31, 2008 for Class A shares amounted to $717,170. The Fund also has in effect distribution plans for Class B shares (Class B Plan) and Class C shares (Class C Plan) pursuant to Rule 12b-1 under the 1940 Act. The Class B and Class C Plans require the Fund to pay EVD amounts equal to 0.75% per annum of its average daily net assets attributable to Class B and Class C shares for providing ongoing distribution services and facilities to the Fund. The Fund will automatically discontinue payments to EVD during any period in which there are no outstanding Uncovered Distribution Charges, which are equivalent to the sum of (i) 3% and 6.25% of the aggregate amount received by the Fund for Class B and Class C shares sold, respectively, plus (ii) interest calculated by applying the rate of 1% over the prevailing prime rate to the outstanding balance of Uncovered Distribution Charges of EVD of each respective class, reduced by the aggregate amount of contingent deferred sales charges (see Note 5) and amounts theretofore paid or payable to EVD by each respective class. For the year ended March 31, 2008, the Fund paid or accrued to EVD $62,107 and $672,618 for Class B and Class C shares, respectively, representing 0.75% of the average daily net assets for Class B and Class C shares. At March 31, 2008, the amounts of Uncovered Distribution Charges of EVD calculated under the Class B and Class C Plans were approximately $1,379,000 and $16,127,000, respectively. The Class B and Class C Plans also authorize the Fund to make payments of service fees to EVD, investment dealers and other persons in amounts not exceeding 0.25% per annum of its average daily net assets attributable to that class. The Trustees approved service fee payments equal to 0.15% per annum of the Fund's average daily net a ssets attributable to Class B and Class C shares. Service fees paid or accrued are for personal services and/or the maintenance of shareholder accounts. They are separate and distinct from the Class B and Class C sales commissions and distribution fees and, as such, are not subject to automatic discontinuance when there are no outstanding Uncovered Distribution Charges of EVD. Service fees paid or accrued for the year ended March 31, 2008 amounted to $12,421 and $134,524 for Class B and Class C shares, respectively.
20
Eaton Vance National Limited Maturity Municipals Fund as of March 31, 2008
NOTES TO FINANCIAL STATEMENTS CONT'D
5 Contingent Deferred Sales Charges
A contingent deferred sales charge (CDSC) generally is imposed on redemptions of Class B shares made within four years of purchase and on redemptions of Class C shares made within one year of purchase. Class A shares may be subject to a 1% CDSC if redeemed within eighteen months of purchase (depending on the circumstances of purchase) or a 1% or 0.50% CDSC if redeemed within one year or two years, respectively, on purchases through the Eaton Vance Supplemental Retirement Account. Generally, the CDSC is based upon the lower of the net asset value at date of redemption or date of purchase. No charge is levied on shares acquired by reinvestment of dividends or capital gains distributions. The CDSC for Class B shares is imposed at declining rates that begin at 3% in the case of redemptions in the first year after purchase, declining half a percentage point in the second and third year and one percentage point in the fourth year. Cla ss C shares are subject to a 1% CDSC if redeemed within one year of purchase. No CDSC is levied on shares which have been sold to EVM or its affiliates or to their respective employees or clients and may be waived under certain other limited conditions. CDSCs received on Class B and Class C redemptions are paid to EVD to reduce the amount of Uncovered Distribution Charges calculated under the Fund's Class B and Class C Plans. CDSCs received on Class B and Class C redemptions when no Uncovered Distribution Charges exist are credited to the Fund. For the year ended March 31, 2008, the Fund was informed that EVD received approximately $170,000, $15,000 and $24,000 of CDSCs paid by Class A, Class B and Class C shareholders, respectively.
6 Purchases and Sales of Investments
Purchases and sales of investments, other than short-term obligations, aggregated $409,620,686 and $224,194,187, respectively, for the year ended March 31, 2008.
7 Shares of Beneficial Interest
The Fund's Declaration of Trust permits the Trustees to issue an unlimited number of full and fractional shares of beneficial interest (without par value). Such shares may be issued in a number of different series (such as the Fund) and classes. Transactions in Fund shares were as follows:
| | | Year Ended March 31, | |
| Class A | | 2008 | | 2007 | |
| Sales | | | 41,246,963 | | | | 26,015,182 | | |
Issued to shareholders electing
to receive payments of distributions
in Fund shares | | | 1,228,854 | | | | 496,020 | | |
| Redemptions | | | (23,789,515 | ) | | | (9,498,191 | ) | |
| Exchange from Class B shares | | | 567,874 | | | | 685,546 | | |
| Net increase | | | 19,254,176 | | | | 17,698,557 | | |
| | | Year Ended March 31, | |
| Class B | | 2008 | | 2007 | |
| Sales | | | 352,741 | | | | 199,911 | | |
Issued to shareholders electing
to receive payments of distributions
in Fund shares | | | 15,752 | | | | 31,405 | | |
| Redemptions | | | (242,951 | ) | | | (451,304 | ) | |
| Exchange to Class A shares | | | (567,495 | ) | | | (684,977 | ) | |
| Net decrease | | | (441,953 | ) | | | (904,965 | ) | |
| | | Year Ended March 31, | |
| Class C | | 2008 | | 2007 | |
| Sales | | | 5,790,528 | | | | 2,576,619 | | |
Issued to shareholders electing
to receive payments of distributions
in Fund shares | | | 126,175 | | | | 115,419 | | |
| Redemptions | | | (3,421,894 | ) | | | (2,378,414 | ) | |
| Net increase | | | 2,494,809 | | | | 313,624 | | |
8 Federal Income Tax Basis of Investments
The cost and unrealized appreciation (depreciation) of investments of the Fund at March 31, 2008, as determined on a federal income tax basis, were as follows:
| Aggregate cost | | $ | 636,317,575 | | |
| Gross unrealized appreciation | | $ | 9,785,446 | | |
| Gross unrealized depreciation | | | (12,634,156 | ) | |
| Net unrealized depreciation | | $ | (2,848,710 | ) | |
21
Eaton Vance National Limited Maturity Municipals Fund as of March 31, 2008
NOTES TO FINANCIAL STATEMENTS CONT'D
9 Line of Credit
The Fund participates with other portfolios and funds managed by EVM and its affiliates in a $200 million unsecured line of credit agreement with a group of banks. Borrowings are made by the Fund solely to facilitate the handling of unusual and/or unanticipated short-term cash requirements. Interest is charged to the Fund based on its borrowings at an amount above either the Eurodollar rate or Federal Funds rate. In addition, a fee computed at an annual rate of 0.07% on the daily unused portion of the line of credit is allocated among the participating portfolios and funds at the end of each quarter. The Fund did not have any significant borrowings or allocated fees during the year ended March 31, 2008.
10 Financial Instruments
The Fund may trade in financial instruments with off-balance sheet risk in the normal course of its investing activities to assist in managing exposure to various market risks. These financial instruments may include financial futures contracts and may involve, to a varying degree, elements of risk in excess of the amounts recognized for financial statement purposes. The notional or contractual amounts of these instruments represent the investment the Fund has in particular classes of financial instruments and does not necessarily represent the amounts potentially subject to risk. The measurement of the risks associated with these instruments is meaningful only when all related and offsetting transactions are considered.
A summary of obligations under these financial instruments at March 31, 2008 is as follows:
Futures Contracts
Expiration
Date(s) | | Contracts | | Position | | Aggregate
Cost | | Value | | Net
Unrealized
Depreciation | |
| 06/08 | | 439
U.S. Treasury Note | | Short | | $ | (50,744,120 | ) | | $ | (52,220,424 | ) | | $ | (1,476,304 | ) | |
| 06/08 | | 783
U.S. Treasury Bond | | Short | | $ | (90,298,642 | ) | | $ | (93,017,957 | ) | | | (2,719,315 | ) | |
| | | | | $ | (4,195,619 | ) | |
At March 31, 2008, the Fund had sufficient cash and/or securities to cover commitments under these contracts.
11 Recently Issued Accounting Pronouncements
In September 2006, the FASB issued Statement of Financial Accounting Standards No. 157 (FAS 157), "Fair Value Measurements". FAS 157 defines fair value, establishes a framework for measuring fair value in accordance with generally accepted accounting principles and expands disclosure about fair value measurements. FAS 157 is effective for fiscal years beginning after November 15, 2007. As of March 31, 2008, management does not believe the adoption of FAS 157 will impact the amounts reported in the financial statements; however, additional disclosures may be required about the inputs used to develop the measurements of fair value and the effect of certain of the measurements on changes in net assets for the period.
In March 2008, the FASB issued Statement of Financial Accounting Standards No. 161 (FAS 161), "Disclosures about Derivative Instruments and Hedging Activities." FAS 161 requires enhanced disclosures about an entity's derivative and hedging activities, including qualitative disclosures about the objectives and strategies for using derivatives, quantitative disclosures about fair value amounts of and gains and losses on derivative instruments, and disclosures about credit-risk related contingent features in derivative instruments. FAS 161 is effective for fiscal years and interim periods beginning after November 15, 2008. Management is currently evaluating the impact the adoption of FAS 161 will have on the Fund's financial statement disclosures.
22
Eaton Vance National Limited Maturity Municipals Fund as of March 31, 2008
REPORT OF INDEPENDENT REGISTERED PUBLIC ACCOUNTING FIRM
To the Trustees of Eaton Vance Investment Trust and Shareholders of Eaton Vance National Limited Maturity Municipals Fund:
We have audited the accompanying statement of assets and liabilities of Eaton Vance National Limited Maturity Municipals Fund (the "Fund") (one of the funds constituting Eaton Vance Investment Trust), including the portfolio of investments, as of March 31, 2008, and the related statement of operations for the year then ended, the statements of changes in net assets for each of the two years in the period then ended, and the financial highlights for each of the five years in the period then ended. These financial statements and financial highlights are the responsibility of the Fund's management. Our responsibility is to express an opinion on these financial statements and financial highlights based on our audits.
We conducted our audits in accordance with the standards of the Public Company Accounting Oversight Board (United States). Those standards require that we plan and perform the audit to obtain reasonable assurance about whether the financial statements and financial highlights are free of material misstatement. The Fund is not required to have, nor were we engaged to perform, an audit of its internal control over financial reporting. Our audits included consideration of internal control over financial reporting as a basis for designing audit procedures that are appropriate in the circumstances, but not for the purpose of expressing an opinion on the effectiveness of the Fund's internal control over financial reporting. Accordingly, we express no such opinion. An audit also includes examining, on a test basis, evidence supporting the amounts and disclosures in the financial statements, assessing the accounting principles used and significant estimates made by management, as well as evaluating the overall financial statement presentation. Our procedures included confirmation of securities owned as of March 31, 2008, by correspondence with the custodian and brokers; where replies were not received from brokers, we performed other auditing procedures. We believe that our audits provide a reasonable basis for our opinion.
In our opinion, the financial statements and financial highlights referred to above present fairly, in all material respects, the financial position of Eaton Vance National Limited Maturity Municipals Fund as of March 31, 2008, the results of its operations for the year then ended, the changes in its net assets for each of the two years in the period then ended, and the financial highlights for each of the five years in the period then ended, in conformity with accounting principles generally accepted in the United States of America.
DELOITTE & TOUCHE LLP
Boston, Massachusetts
May 15, 2008
23
Eaton Vance National Limited Maturity Municipals Fund as of March 31, 2008
FEDERAL TAX INFORMATION (Unaudited)
The Form 1099-DIV you receive in January 2009 will show the tax status of all distributions paid to your account in calendar 2008. Shareholders are advised to consult their own tax adviser with respect to the tax consequences of their investment in the Fund. As required by the Internal Revenue Code regulations, shareholders must be notified within 60 days of the Fund's fiscal year end regarding exempt-interest dividends.
Exempt-Interest Dividends — The Fund designates 99.85% of dividends from net investment income as an exempt-interest dividend.
24
Eaton Vance National Limited Maturity Municipals Fund
BOARD OF TRUSTEES' ANNUAL APPROVAL OF THE INVESTMENT ADVISORY AGREEMENT
Overview of the Contract Review Process
The Investment Company Act of 1940, as amended (the "1940 Act"), provides, in substance, that each investment advisory agreement between a fund and its investment adviser will continue in effect from year to year only if its continuance is approved at least annually by the fund's board of trustees, including by a vote of a majority of the trustees who are not "interested persons" of the fund ("Independent Trustees"), cast in person at a meeting called for the purpose of considering such approval.
At a meeting of the Boards of Trustees (each a "Board") of the Eaton Vance group of mutual funds (the "Eaton Vance Funds") held on April 23, 2007, the Board, including a majority of the Independent Trustees, voted to approve continuation of existing advisory and sub-advisory agreements for the Eaton Vance Funds for an additional one-year period. In voting its approval, the Board relied upon the affirmative recommendation of the Special Committee of the Board, which is a committee comprised exclusively of Independent Trustees. Prior to making its recommendation, the Special Committee reviewed information furnished for a series of meetings of the Special Committee held in February, March and April 2007. Such information included, among other things, the following:
Information about Fees, Performance and Expenses
• An independent report comparing the advisory and related fees paid by each fund with fees paid by comparable funds;
• An independent report comparing each fund's total expense ratio and its components to comparable funds;
• An independent report comparing the investment performance of each fund to the investment performance of comparable funds over various time periods;
• Data regarding investment performance in comparison to relevant peer groups of funds and appropriate indices;
• Comparative information concerning fees charged by each adviser for managing other mutual funds and institutional accounts using investment strategies and techniques similar to those used in managing the fund;
• Profitability analyses for each adviser with respect to each fund;
Information about Portfolio Management
• Descriptions of the investment management services provided to each fund, including the investment strategies and processes employed;
• Information concerning the allocation of brokerage and the benefits received by each adviser as a result of brokerage allocation, including information concerning the acquisition of research through "soft dollar" benefits received in connection with the funds' brokerage, and the implementation of a soft dollar reimbursement program established with respect to the funds;
• Data relating to portfolio turnover rates of each fund;
• The procedures and processes used to determine the fair value of fund assets and actions taken to monitor and test the effectiveness of such procedures and processes;
Information about each Adviser
• Reports detailing the financial results and condition of each adviser;
• Descriptions of the qualifications, education and experience of the individual investment professionals whose responsibilities include portfolio management and investment research for the funds, and information relating to their compensation and responsibilities with respect to managing other mutual funds and investment accounts;
• Copies of the Codes of Ethics of each adviser and its affiliates, together with information relating to compliance with and the administration of such codes;
• Copies of or descriptions of each adviser's proxy voting policies and procedures;
• Information concerning the resources devoted to compliance efforts undertaken by each adviser and its affiliates on behalf of the funds (including descriptions of various compliance programs) and their record of compliance with investment policies and restrictions, including policies with respect to market-timing, late trading and selective portfolio disclosure, and with policies on personal securities transactions;
• Descriptions of the business continuity and disaster recovery plans of each adviser and its affiliates;
25
Eaton Vance National Limited Maturity Municipals Fund
BOARD OF TRUSTEES' ANNUAL APPROVAL OF THE INVESTMENT ADVISORY AGREEMENT CONT'D
Other Relevant Information
• Information concerning the nature, cost and character of the administrative and other non-investment management services provided by Eaton Vance Management and its affiliates;
• Information concerning management of the relationship with the custodian, subcustodians and fund accountants by each adviser or the funds' administrator; and
• The terms of each advisory agreement.
In addition to the information identified above, the Special Committee considered information provided from time to time by each adviser throughout the year at meetings of the Board and its committees. Over the course of the twelve-month period ended April 30, 2007, the Board met ten times and the Special Committee, the Audit Committee and the Governance Committee, each of which is a Committee comprised solely of Independent Trustees, met twelve, fourteen and eight times, respectively. At such meetings, the Trustees received, among other things, presentations by the portfolio managers and other investment professionals of each adviser relating to the investment performance of each fund and the investment strategies used in pursuing the fund's investment objective.
For funds that invest through one or more underlying portfolios, the Board considered similar information about the portfolio(s) when considering the approval of advisory agreements. In addition, in cases where the fund's investment adviser has engaged a sub-adviser, the Board considered similar information about the sub-adviser when considering the approval of any sub-advisory agreement.
The Special Committee was assisted throughout the contract review process by Goodwin Procter LLP, legal counsel for the Independent Trustees. The members of the Special Committee relied upon the advice of such counsel and their own business judgment in determining the material factors to be considered in evaluating each advisory and sub-advisory agreement and the weight to be given to each such factor. The conclusions reached with respect to each advisory and sub-advisory agreement were based on a comprehensive evaluation of all the information provided and not any single factor. Moreover, each member of the Special Committee may have placed varying emphasis on particular factors in reaching conclusions with respect to each advisory and sub-advisory agreement.
Results of the Process
Based on its consideration of the foregoing, and such other information as it deemed relevant, including the factors and conclusions described below, the Special Committee concluded that the continuance of the investment advisory agreement of the Eaton Vance National Limited Maturity Municipals Fund (the "Fund") with Boston Management and Research (the "Adviser"), including its fee structure, is in the interests of shareholders and, therefore, the Special Committee recommended to the Board approval of the agreement. The Board accepted the recommendation of the Special Committee as well as the factors considered and conclusions reached by the Special Committee with respect to the agreement. Accordingly, the Board, including a majority of the Independent Trustees, voted to approve continuation of the advisory agreement for the Fund.
Nature, Extent and Quality of Services
In considering whether to approve the investment advisory agreement of the Fund, the Board evaluated the nature, extent and quality of services provided to the Fund by the Adviser.
The Board considered the Adviser's management capabilities and investment process with respect to the types of investments held by the Fund, including the education, experience and number of its investment professionals and other personnel who provide portfolio management, investment research, and similar services to the Fund. In particular, the Board evaluated, where relevant, the abilities and experience of such investment personnel in analyzing factors such as credit risk, tax efficiency, and special considerations relevant to investing in particular foreign markets or industries. Specifically, the Board considered the Adviser's 30-person municipal bond team, which includes six portfolio managers and nine credit specialists who provide services to the Funds. The Board also took into account the resources dedicated to portfolio management and other services, including the compensation paid to recruit and retain investment pers onnel, and the time and attention devoted to the Fund by senior management.
The Board reviewed the compliance programs of the Adviser and relevant affiliates thereof. Among other matters, the Board considered compliance and reporting matters relating to personal trading by investment personnel, selective disclosure of portfolio holdings, late trading, frequent trading, portfolio valuation, business continuity and the allocation of investment opportunities. The Board also evaluated the responses of the Adviser and its affiliates to requests from regulatory authorities such as the Securities and Exchange Commission and the National Association of Securities Dealers.
The Board considered shareholder and other administrative services provided or managed by Eaton Vance Management and its affiliates, including transfer agency and accounting services. The Board evaluated the benefits to shareholders of investing in a fund that is a part
26
Eaton Vance National Limited Maturity Municipals Fund
BOARD OF TRUSTEES' ANNUAL APPROVAL OF THE INVESTMENT ADVISORY AGREEMENT CONT'D
of a large family of funds, including the ability, in many cases, to exchange an investment among different funds without incurring additional sales charges.
After consideration of the foregoing factors, among others, the Board concluded that the nature, extent and quality of services provided by the Adviser, taken as a whole, are appropriate and consistent with the terms of the investment advisory agreement.
Fund Performance
The Board compared the Fund's investment performance to a relevant universe of similarly managed funds identified by an independent data provider and appropriate benchmark indices. The Board reviewed comparative performance data for the one-, three-, five- and ten-year periods ended September 30, 2006 for the Fund. On the basis of the foregoing and other relevant information, the Board concluded that the performance of the Fund was satisfactory.
Management Fees and Expenses
The Board reviewed contractual investment advisory fee rates, including any administrative fee rates, payable by the Fund, (referred to as "management fees"). As part of its review, the Board considered the Fund's management fee and total expense ratio for the year ended September 30, 2006, as compared to a group of similarly managed funds selected by an independent data provider.
After reviewing the foregoing information, and in light of the nature, extent and quality of the services provided by the Adviser, the Board concluded with respect to the Fund that the management fee charged to the Fund for advisory and related services and the total expense ratio of the Fund are reasonable.
Profitability
The Board reviewed the level of profits realized by the Adviser and, if applicable, its affiliates in providing investment advisory and administrative services to the Fund and to all Eaton Vance Funds as a group. The Board considered the level of profits realized without regard to revenue sharing or other payments by the Adviser and its affiliates to third parties in respect of distribution services. The Board also considered other direct or indirect benefits received by the Adviser in connection with its relationship with the Fund.
The Board concluded that, in light of the foregoing factors and the nature, extent and quality of the services rendered, the profits realized by the Adviser and its affiliates are reasonable.
Economies of Scale
In reviewing management fees and profitability, the Board also considered the extent to which the Adviser and its affiliates, on the one hand, and the Fund, on the other hand, can expect to realize benefits from economies of scale as the assets of the Fund increase. The Board acknowledged the difficulty in accurately measuring the benefits resulting from the economies of scale with respect to the management of any specific fund or group of funds. The Board reviewed data summarizing the increases and decreases in the assets of the Fund and of all Eaton Vance Funds as a group over various time periods, and evaluated the extent to which the total expense ratio of the Fund and the Adviser's profitability may have been affected by such increases or decreases. Based upon the foregoing, the Board concluded that the benefits from economies of scale are currently being shared equitably by the Adviser and the Fund. The Board also conclude d that, assuming reasonably foreseeable increases in the assets of the Fund, the structure of the advisory fee, which includes breakpoints at several asset levels, can be expected to cause the Adviser and its affiliates and the Fund to continue to share such benefits equitably.
27
Eaton Vance National Limited Maturity Municipals Fund
MANAGEMENT AND ORGANIZATION
Fund Management. The Trustees of Eaton Vance Investment Trust (the Trust) are responsible for the overall management and supervision of the Trust's affairs. The Trustees and officers of the Trust are listed below. Except as indicated, each individual has held the office shown or other offices in the same company for the last five years. Trustees and officers of the Trust hold indefinite terms of office. The "noninterested Trustees" consist of those Trustees who are not "interested persons" of the Trust, as that term is defined under the 1940 Act. The business address of each Trustee and officer is The Eaton Vance Building, 255 State Street, Boston, Massachusetts 02109. As used below, "EVC" refers to Eaton Vance Corp., "EV" refers to Eaton Vance, Inc., "EVM" refers to Eaton Vance Management, "BMR" refers to Boston Management and Research, and "EVD" refers to Eaton Vance Distributors, Inc. EVC and EV are the corporate parent and trustee, respectively, of EVM and BMR. EVD is the Fund's principal underwriter and a wholly-owned subsidiary of EVC. Each officer affiliated with Eaton Vance may hold a position with other Eaton Vance affiliates that is comparable to his or her position with EVM listed below.
Name and
Date of Birth | | Position(s)
with the
Trust | | Term of
Office and
Length of
Service | | Principal Occupation(s)
During Past Five Years | | Number of Portfolios
in Fund Complex
Overseen By
Trustee(1) | | Other Directorships Held | |
| Interested Trustee | | | | | | | | | | | | | |
|
| Thomas E. Faust Jr. 5/31/58 | | Trustee | | Since 2007 | | Chairman, Chief Executive Officer and President of EVC, President of EV, Chief Executive Officer and President of EVM and BMR, and Director of EVD. Trustee and/or Officer of 177 registered investment companies and 5 private investment companies managed by EVM or BMR. Mr. Faust is an interested person because of his positions with EVM, BMR, EVD, EVC and EV which are affiliates of the Trust. | | | 177 | | | Director of EVC | |
|
| Noninterested Trustees | | | | | | | | | | | | | |
|
| Benjamin C. Esty 1/2/63 | | Trustee | | Since 2005 | | Roy and Elizabeth Simmons Professor of Business Administration, Harvard University Graduate School of Business Administration. | | | 177 | | | None | |
|
| Allen R. Freedman 4/3/40 | | Trustee | | Since 2007 | | Former Chairman (2002-2004) and a Director (1983-2004) of Systems & Computer Technology Corp. (provider of software to higher education). Formerly, a Director of Loring Ward International (fund distributor) (2005-2007). Formerly, Chairman and a Director of Indus International Inc. (provider of enterprise management software to the power generating industry) (2006-2007). | | | 177 | | | Director of Assurant, Inc. (insurance provider) and Stonemor Partners L.P. (owner and operator of cemeteries) | |
|
| William H. Park 9/19/47 | | Trustee | | Since 2003 | | Vice Chairman, Commercial Industrial Finance Corp. (specialty finance company) (since 2006). Formerly, President and Chief Executive Officer, Prizm Capital Management, LLC (investment management firm) (2002-2005). | | | 177 | | | None | |
|
| Ronald A. Pearlman 7/10/40 | | Trustee | | Since 2003 | | Professor of Law, Georgetown University Law Center. | | | 177 | | | None | |
|
| Norton H. Reamer 9/21/35 | | Trustee | | Since 1985 | | Chairman (since 2007) and President, Chief Executive Officer and a Director (since 2003) of Asset Management Finance Corp. (a specialty finance company serving the investment management industry). President, Unicorn Corporation (an investment and financial advisory services company) (since September 2000). Formerly, Chairman and Chief Operating Officer, Hellman, Jordan Management Co., Inc. (an investment management company) (2000-2003). Formerly, Advisory Director of Berkshire Capital Corporation (investment banking firm) (2002-2003). | | | 177 | | | None | |
|
28
Eaton Vance National Limited Maturity Municipals Fund
MANAGEMENT AND ORGANIZATION CONT'D
Name and
Date of Birth | | Position(s)
with the
Trust | | Term of
Office and
Length of
Service | | Principal Occupation(s)
During Past Five Years | | Number of Portfolios
in Fund Complex
Overseen By
Trustee(1) | | Other Directorships Held | |
| Noninterested Trustees (continued) | | | | | | | | | | | | | |
|
Heidi L. Steiger
7/8/53 | | Trustee | | Since 2007 | | President, Lowenhaupt Global Advisors, LLC (global wealth management firm) (since 2005). Formerly, President and Contributing Editor, Worth Magazine (2004-2005). Formerly, Executive Vice President and Global Head of Private Asset Management (and various other positions), Neuberger Berman (investment firm) (1986-2004). | | | 177 | | | Director of Nuclear Electric Insurance Ltd. (nuclear insurance provider) and Aviva USA (insurance provider) | |
|
| Lynn A. Stout 9/14/57 | | Trustee | | Since 1998 | | Paul Hastings Professor of Corporate and Securities Law (since 2006) and Professor of Law (2001-2006), University of California at Los Angeles School of Law. | | | 177 | | | None | |
|
| Ralph F. Verni 1/26/43 | | Chairman of the Board and Trustee | | Chairman of the Board since 2007 and Trustee since 2005 | | Consultant and private investor. | | | 177 | | | None | |
|
| Principal Officers who are not Trustees | | | | | | | | | | | | | |
|
Name and
Date of Birth | | Position(s)
with the
Trust | | Term of
Office and
Length of
Service | | Principal Occupation(s)
During Past Five Years | |
| Cynthia J. Clemson 3/2/63 | | President | | Since 2005 | | Vice President of EVM and BMR. Officer of 90 registered investment companies managed by EVM or BMR. | |
|
| William H. Ahern, Jr. 7/28/59 | | Vice President | | Since 2004 | | Vice President of EVM and BMR. Officer of 75 registered investment companies managed by EVM or BMR. | |
|
| Craig R. Brandon 12/21/66 | | Vice President | | Since 2004 | | Vice President of EVM and BMR. Officer of 44 registered investment companies managed by EVM or BMR. | |
|
| Robert B. MacIntosh 1/22/57 | | Vice President | | Since 1993 | | Vice President of EVM and BMR. Officer of 90 registered investment companies managed by EVM or BMR. | |
|
| Thomas M. Metzold 8/3/58 | | Vice President | | Since 2004 | | Vice President of EVM and BMR. Officer of 43 registered investment companies managed by EVM or BMR. | |
|
| Adam A. Weigold 3/22/75 | | Vice President | | Since 2007 | | Vice President of EVM and BMR. Officer of 70 registered investment companies managed by EVM or BMR. | |
|
| Barbara E. Campbell 6/19/57 | | Treasurer | | Since 2005 | | Vice President of EVM and BMR. Officer of 177 registered investment companies managed by EVM or BMR. | |
|
Maureen A. Gemma
5/24/60 | | Secretary | | Since 2007 | | Deputy Chief Legal Officer and Vice President of EVM and BMR. Officer of 177 registered investment companies managed by EVM or BMR. | |
|
| Paul M. O'Neil 7/11/53 | | Chief Compliance Officer | | Since 2004 | | Vice President of EVM and BMR. Officer of 177 registered investment companies managed by EVM or BMR. | |
|
| John E. Pelletier 6/24/64 | | Chief Legal Officer | | Since 2007 | | Vice President and Chief Legal Officer of BMR, EVM, EVD, EV and EVC. Previously, Chief Operating Officer and Executive Vice President (2004-2007) and General Counsel (1997-2004) of Natixis Global Associates. Officer of 177 registered investment companies managed by EVM or BMR. | |
|
(1) Includes both master and feeder funds in a master-feeder structure.
The SAI for the Fund includes additional information about the Trustees and officers of the Fund and can be obtained, without charge, on Eaton Vance's website at www.eatonvance.com, or by calling 1-800-225-6265.
29
This Page Intentionally Left Blank
This Page Intentionally Left Blank
This Page Intentionally Left Blank
Investment Adviser of Eaton Vance National Limited Maturity Municipals Fund
Boston Management and Research
The Eaton Vance Building
255 State Street
Boston, MA 02109
Administrator of Eaton Vance National Limited Maturity Municipals Fund
Eaton Vance Management
The Eaton Vance Building
255 State Street
Boston, MA 02109
Principal Underwriter
Eaton Vance Distributors, Inc.
The Eaton Vance Building
255 State Street
Boston, MA 02109
(617) 482-8260
Custodian
State Street Bank and Trust Company
200 Clarendon Street
Boston, MA 02116
Transfer Agent
PFPC Inc.
Attn: Eaton Vance Funds
P.O. Box 9653
Providence, RI 02940-9653
(800) 262-1122
Independent Registered Public Accounting Firm
Deloitte & Touche LLP
200 Berkeley Street
Boston, MA 02116-5022
Eaton Vance National Limited Maturity Municipals Fund
The Eaton Vance Building
255 State Street
Boston, MA 02109
This report must be preceded or accompanied by a current prospectus. Before investing, investors should consider carefully the Fund's investment objective(s), risks, and charges and expenses. The Fund's current prospectus contains this and other information about the Fund and is available through your financial advisor. Please read the prospectus carefully before you invest or send money. For further information please call 1-800-225-6265.
439-5/08 LNASRC

Annual Report March 31, 2008


EATON VANCE LIMITED MATURITY MUNICIPALS FUNDS
California
Florida Plus
Massachusetts
New Jersey
New York
Ohio
Pennsylvania
IMPORTANT NOTICES REGARDING PRIVACY,
DELIVERY OF SHAREHOLDER DOCUMENTS,
PORTFOLIO HOLDINGS AND PROXY VOTING
Privacy. The Eaton Vance organization is committed to ensuring your financial privacy. Each of the financial institutions identified below has in effect the following policy ("Privacy Policy") with respect to nonpublic personal information about its customers:
• Only such information received from you, through application forms or otherwise, and information about your Eaton Vance fund transactions will be collected. This may include information such as name, address, social security number, tax status, account balances and transactions.
• None of such information about you (or former customers) will be disclosed to anyone, except as permitted by law (which includes disclosure to employees necessary to service your account). In the normal course of servicing a customer's account, Eaton Vance may share information with unaffiliated third parties that perform various required services such as transfer agents, custodians and broker/dealers.
• Policies and procedures (including physical, electronic and procedural safeguards) are in place that are designed to protect the confidentiality of such information.
• We reserve the right to change our Privacy Policy at any time upon proper notification to you. Customers may want to review our Policy periodically for changes by accessing the link on our homepage: www.eatonvance.com.
Our pledge of privacy applies to the following entities within the Eaton Vance organization: the Eaton Vance Family of Funds, Eaton Vance Management, Eaton Vance Investment Counsel, Boston Management and Research, and Eaton Vance Distributors, Inc.
In addition, our Privacy Policy only applies to those Eaton Vance customers who are individuals and who have a direct relationship with us. If a customer's account (i.e. fund shares) is held in the name of a third-party financial adviser/broker-dealer, it is likely that only such adviser's privacy policies apply to the customer. This notice supersedes all previously issued privacy disclosures.
For more information about Eaton Vance's Privacy Policy, please call 1-800-262-1122.
Delivery of Shareholder Documents. The Securities and Exchange Commission (the "SEC") permits funds to deliver only one copy of shareholder documents, including prospectuses, proxy statements and shareholder reports, to fund investors with multiple accounts at the same residential or post office box address. This practice is often called "householding" and it helps eliminate duplicate mailings to shareholders.
Eaton Vance, or your financial adviser, may household the mailing of your documents indefinitely unless you instruct Eaton Vance, or your financial adviser, otherwise.
If you would prefer that your Eaton Vance documents not be householded, please contact Eaton Vance at 1-800-262-1122, or contact your financial adviser.
Your instructions that householding not apply to delivery of your Eaton Vance documents will be effective within 30 days of receipt by Eaton Vance or your financial adviser.
Portfolio Holdings. Each Eaton Vance Fund and its underlying Portfolio (if applicable) will file a schedule of its portfolio holdings on Form N-Q with the SEC for the first and third quarters of each fiscal year. The Form N-Q will be available on the Eaton Vance website www.eatonvance.com, by calling Eaton Vance at 1-800-262-1122 or in the EDGAR database on the SEC's website at www.sec.gov. Form N-Q may also be reviewed and copied at the SEC's public reference room in Washington, D.C. (call 1-800-732-0330 for information on the operation of the public reference room).
Proxy Voting. From time to time, funds are required to vote proxies related to the securities held by the funds. The Eaton Vance Funds or their underlying Portfolios (if applicable) vote proxies according to a set of policies and procedures approved by the Funds' and Portfolios' Boards. You may obtain a description of these policies and procedures and information on how the Funds or Portfolios voted proxies relating to portfolio securities during the most recent 12 month period ended June 30, without charge, upon request, by calling 1-800-262-1122. This description is also available on the SEC's website at www.sec.gov.
Eaton Vance Limited Maturity Municipals Funds as of March 31, 2008
TABLE OF CONTENTS
Management’s Discussion of Fund Performance | 2 |
| |
Morningstar RatingsTM | 3 |
| |
Performance Information and Portfolio Composition | |
California | 4 |
Florida Plus | 6 |
Massachusetts | 8 |
New Jersey | 10 |
New York | 12 |
Ohio | 14 |
Pennsylvania | 16 |
| |
Fund Expenses | 18 |
| |
Financial Statements | 22 |
| |
Federal Tax Information | 83 |
| |
Board of Trustees’ Annual Approval of the Investment Advisory Agreements | 84 |
| |
Management and Organization | 87 |
1
Eaton Vance Limited Maturity Municipals Funds as of March 31, 2008
MANAGEMENT’S DISCUSSION OF FUND PERFORMANCE
Eaton Vance Limited Maturity Municipals Funds (the “Funds”) are designed to provide a high level of current income exempt from regular federal income tax and from particular state or local income or other taxes. The Funds also seek to provide limited principal fluctuation.
Economic and Market Conditions
Economic growth in the first quarter of 2008 measured 0.6%, according to preliminary Commerce Department data reported in April 2008, following the 0.6% growth rate achieved in the fourth quarter 2007. The housing sector continued to struggle in the first quarter due to market concerns related to subprime mortgages. Although the weaker dollar was having a beneficial effect on export- related industries, tourism, and U.S.-based multinational companies, consumers started to curtail spending as food and energy costs continued to climb, according to the U.S. Commerce Department, and consumer confidence levels fell to 25-year lows, according to University of Michigan data.
On March 16, 2008, the Federal Reserve (the “Fed”) took extraordinary actions to support orderly market functioning after it learned that Bear Stearns faced a liquidity crisis which could have triggered a wider market crisis. In addition to approving a financing arrangement to support JPMorgan Chase’s acquisition of Bear Stearns, the Fed created a new lending facility that expanded the potential collateral it would accept from member banks and extended the new lending facility to securities firms. The Fed also lowered the Discount Rate, the rate at which it will lend to these firms, to 3.25% from 3.50%. Two days later, on March 18, 2008, at a regularly scheduled meeting of the Federal Open Market Committee, the Fed lowered the Federal Funds Rate by 75 basis points to 2.25% from 3.00% and further lowered the Discount Rate to 2.50%. The Federal Funds Rate has been lowered by a total of 300 basis points (3.00%) since September 18, 2007, from 5.25%, and the Discount Rate has been lowered by a total of 375 basis points (3.75%) since August 17, 2007, from 6.25%. Management believes that all of these actions were aimed at providing market liquidity during this period of extreme uncertainty and tight credit conditions that first surfaced in August 2007.
Management Discussion
The Funds currently invest primarily in intermediate- maturity municipal bonds, seeking to maintain a weighted average duration of between three and nine years (duration is a measure of interest-rate sensitivity; the shorter a bond’s duration, the less sensitive its price will be to changes in market interest rates). Shorter maturity bonds usually provide somewhat less tax-exempt income than longer ones but also usually exhibit lower price volatility.
The Funds underperformed their benchmark, the Lehman Brothers 7-Year Municipal Bond Index – an unmanaged market index of intermediate-maturity municipal obligations – for the year ended March 31, 2008.(1) Management believes that much of the underperformance can be attributed to the broader-based credit crisis that has shaken the fixed-income markets since August 2007, which led investors to move their capital into the Treasury market, particularly in shorter-maturity bonds. This move was originally driven by uncertainty surrounding financial companies’ exposure to mortgage-backed collateralized debt obligations (CDOs). More recently, the municipal bond market has been impacted by the downgrade of major municipal bond insurers due to their exposure to mortgage-related CDO debt. As a result of an active management style that focuses on income and longer call protection, the Funds generally hold longer-duration intermediate-maturity bonds. Although the municipal bond market stabilized and Fund performance improved during March 2008, management believes that investors’ flight – from September 2007 through February 2008 – to shorter-intermediate maturity uninsured bonds from longer-intermediate maturity insured bonds resulted in the Funds’ relative underperformance for the period.
The ratio of yields on current coupon AAA-rated insured bonds to the yield on 30-year Treasury bonds was 116% as of March 31, 2008, with many individual bonds trading higher than 116%.(2) Management believes that this was the result of dislocation in the fixed-income marketplace caused by fears of subprime contagion, insurance companies’ mark-to-market risks and the decentralized nature of the municipal marketplace. Historically, this is a rare occurrence in the municipal bond market and is generally considered a signal that municipal bonds are significantly undervalued compared to Treasuries.
With this backdrop, management continues to manage all of its municipal funds with the same relative value approach that it has traditionally employed – maintaining a long-term perspective when markets exhibit extreme short-term volatility. We believe this approach has provided excellent long-term benefits to our investors over time.
(1) It is not possible to invest directly in an Index. The Index’s total return does not reflect expenses that would have been incurred if an investor individually purchased or sold the securities represented in the Index.
(2) Source: Bloomberg L.P. Yields are a compilation of a representative variety of general obligations and are not necessarily representative of a Fund’s yield.
Past performance is no guarantee of future results.
The views expressed throughout this report are those of the portfolio managers and are current only through the end of the period of the report as stated on the cover. These views are subject to change at any time based upon market or other conditions, and the investment adviser disclaims any responsibility to update such views. These views may not be relied on as investment advice and, because investment decisions for a fund are based on many factors, may not be relied on as an indication of trading intent on behalf of any Eaton Vance fund. Portfolio information provided in the report may not be representative of the Funds’ current or future investments and may change due to active management.
Fund shares are not insured by the FDIC and are not deposits or other obligations of, or guaranteed by, any depository institution. Shares are subject to investment risks, including possible loss of principal invested.
2
Eaton Vance Limited Maturity Municipals Funds as of March 31, 2008
MORNINGSTAR RATINGSTM
As of March 31, 2008
FUND | | OVERALL | | 3-YEAR | | 5-YEAR | | 10-YEAR | |
| | | | | | | | | |
CALIFORNIA LIMITED MATURITY MUNICIPALS FUND – CLASS A | | ** | | ** | | ** | | ** | |
Load waived | | *** | | *** | | *** | | ** | |
MUNI CALIFORNIA INTERMEDIATE/SHORT CATEGORY | | 78 FUNDS | | 78 FUNDS | | 67 FUNDS | | 34 FUNDS | |
| | | | | | | | | |
FLORIDA PLUS LIMITED MATURITY MUNICIPALS FUND – CLASS A | | ** | | *** | | ** | | ** | |
Load waived | | *** | | *** | | *** | | ** | |
MUNI FLORIDA CATEGORY | | 40 FUNDS | | 40 FUNDS | | 40 FUNDS | | 37 FUNDS | |
| | | | | | | | | |
MASSACHUSETTS LIMITED MATURITY MUNICIPALS FUND – CLASS A | | ** | | *** | | ** | | ** | |
Load waived | | *** | | *** | | *** | | ** | |
MUNI MASSACHUSETTS CATEGORY | | 77 FUNDS | | 77 FUNDS | | 75 FUNDS | | 62 FUNDS | |
| | | | | | | | | |
NEW JERSEY LIMITED MATURITY MUNICIPALS FUND – CLASS A | | ** | | *** | | ** | | ** | |
Load waived | | *** | | *** | | *** | | ** | |
MUNI NEW JERSEY CATEGORY | | 66 FUNDS | | 66 FUNDS | | 66 FUNDS | | 53 FUNDS | |
| | | | | | | | | |
NEW YORK LIMITED MATURITY MUNICIPALS FUND – CLASS A | | *** | | ** | | *** | | *** | |
Load waived | | *** | | *** | | *** | | *** | |
MUNI NEWYORK INTERMEDIATE/SHORT CATEGORY | | 66 FUNDS | | 66 FUNDS | | 61 FUNDS | | 37 FUNDS | |
| | | | | | | | | |
OHIO LIMITED MATURITY MUNICIPALS FUND – CLASS A | | ** | | *** | | ** | | ** | |
Load waived | | *** | | *** | | *** | | ** | |
MUNI OHIO CATEGORY | | 71 FUNDS | | 71 FUNDS | | 69 FUNDS | | 58 FUNDS | |
| | | | | | | | | |
PENNSYLVANIA LIMITED MATURITY MUNICIPALS FUND – CLASS A | | *** | | *** | | *** | | ** | |
Load waived | | *** | | *** | | *** | | *** | |
MUNI PENNSYLVANIA CATEGORY | | 85 FUNDS | | 85 FUNDS | | 85 FUNDS | | 78 FUNDS | |
Based on risk-adjusted returns. Eaton vance offers other mutual funds that are not listed here and that do not have similar performance records.
The Overall Morningstar RatingTM for a fund is derived from a weighted average of the performance figures associated with its 3-, 5- and 10-year (if applicable) Morningstar RatingTM metrics.
©2008 Morningstar, Inc. All Rights Reserved. The information contained herein: (1) is proprietary to Morningstar and/or its content providers; (2) may not be copied or distributed; and (3) is not warranted to be accurate, complete or timely. Neither Morningstar nor its content providers is responsible for any damages or losses arising from any use of this information. Past performance is no guarantee of future results. For each fund with at least a three-year history, Morningstar calculates a Morningstar RatingTM based on how a fund ranks on a Morningstar Risk-Adjusted Return measure against other funds in the same category. This measure takes into account variations in a fund’s monthly performance after adjusting for sales loads (except for load-waived A shares), redemption fees, and the risk-free rate, placing more emphasis on downward variations and rewarding consistent performance. The top 10% of funds in each category receive 5 stars; the next 22.5% receive 4 stars; the next 35% receive 3 stars; the next 22.5% receive 2 stars, and the bottom 10% receive 1 star.
Load-waived A share star ratings do not include any front-end sales load and are intended for those investors who have access to such purchase terms (e.g., plan participants of a defined contribution plan). Not all A share mutual funds for which Morningstar calculates a load-waived A share star rating may actually waive their front-end sales load. Therefore, Morningstar strongly encourages investors to contact their investment professional to determine whether they are eligible to purchase the A share without paying the front-end sales load. The Morningstar Rating may differ among share classes of a mutual fund as a result of different sales loads and/or expense structure.
As interest rates rise, the value of fixed-income securities is likely to decrease. Fluctuations in the value of securities may not affect interest income on existing securities, but will be reflected in the Funds’ net asset values. A portion of income may be subject to federal alternative minimum tax. Please see the Funds’ prospectus for more information. Consult your tax/legal advisor before making any tax-related investment decisions.
For information regarding each Fund’s performance, please refer to pages titled “Performance Information and Portfolio Composition” contained in this report.
3
Eaton Vance California Limited Maturity Municipals Fund as of March 31, 2008
PERFORMANCE INFORMATION AND PORTFOLIO COMPOSITION
The line graph and table set forth below provide information about the Fund’s performance. The line graph compares the performance of Class B of the Fund with that of the Lehman Brothers 7-Year Municipal Bond Index, an unmanaged market index of intermediate-maturity municipal obligations. The lines on the graph represent the total returns of a hypothetical investment of $10,000 in each of Class B and in the Lehman Brothers 7-Year Municipal Bond Index. The table includes the total returns of each Class of the Fund at net asset value and maximum public offering price. The performance presented below does not reflect the deduction of taxes, if any, that a shareholder would pay on distributions or redemptions of Fund shares.
Performance(1)
| | Class A | | Class B | | Class C | |
Share Class Symbol | | EXCAX | | ELCAX | | EZCAX | |
| | | | | | | |
Average Annual Total Returns (at net asset value) | | | | | | | |
One Year | | 0.00 | % | -0.68 | % | -0.69 | % |
Five Years | | 2.68 | | 1.93 | | N.A. | |
Ten Years | | 3.73 | | 2.96 | | N.A. | |
Life of Fund† | | 4.20 | | 3.68 | | 1.84 | |
| | | | | | | |
SEC Average Annual Total Returns (including sales charge or applicable CDSC) | | | | | | | |
One Year | | -2.25 | % | -3.57 | % | -1.65 | % |
Five Years | | 2.22 | | 1.93 | | N.A. | |
Ten Years | | 3.49 | | 2.96 | | N.A. | |
Life of Fund† | | 4.00 | | 3.68 | | 1.84 | |
†Inception Dates – Class A: 6/27/96; Class B: 5/29/92; Class C: 3/23/05
Total Annual Operating Expenses(2)
| | Class A | | Class B | | Class C | |
| | | | | | | |
Expense Ratio | | 0.93 | % | 1.68 | % | 1.68 | % |
Distribution Rates/Yields
| | Class A | | Class B | | Class C | |
| | | | | | | |
Distribution Rate(3) | | 3.79 | % | 3.01 | % | 3.01 | % |
Taxable-Equivalent Distribution Rate(3),(4) | | 6.43 | | 5.11 | | 5.11 | |
SEC 30-day Yield(5) | | 3.31 | | 2.64 | | 2.65 | |
Taxable-Equivalent SEC 30-day Yield(4),(5) | | 5.61 | | 4.48 | | 4.50 | |
Index Performance(6)
Lehman Brothers 7-Year Municipal Bond Index – Average Annual Total Returns |
One Year | | 5.59 | % |
Five Years | | 3.92 | |
Ten Years | | 4.99 | |
Lipper Averages(7)
Lipper California Intermediate Municipal Debt Funds Classification – Average Annual Total Returns | | | |
One Year | | 1.94 | % |
Five Years | | 2.73 | |
Ten Years | | 4.13 | |
Portfolio Manager: Cynthia J. Clemson
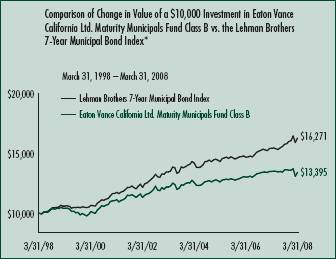
*Source: Lipper, Inc. Class B of the Fund commenced operations on 5/29/92.
A $10,000 hypothetical investment at net asset value in Class A and Class C on 3/31/98 and 3/23/05 (commencement of operations), respectively, would have been valued at $14,426 ($14,102 at the maximum offering price) and $10,620, respectively, on 3/31/08. It is not possible to invest directly in an Index. The Index’s total return does not reflect the expenses that would have been incurred if an investor individually purchased or sold the securities represented in the Index.
(1) Average annual total returns do not include the 2.25% maximum sales charge for Class A shares or the applicable contingent deferred sales charges (CDSC) for Class B and Class C shares. If sales charges were deducted, the returns would be lower. SEC average annual total returns for Class A reflect the maximum 2.25% sales charge. SEC returns for Class B reflect the applicable CDSC based on the following schedule: 3% - 1st year; 2.5% - 2nd year; 2% - 3rd year; 1% - 4th year. SEC returns for Class C reflect a 1% CDSC for the first year.
(2) Source: Prospectus dated 8/1/07.
(3) The Fund’s distribution rate represents actual distributions paid to shareholders and is calculated by dividing the last distribution per share in the period (annualized) by the net asset value at the end of the period.
(4) Taxable-equivalent figure assumes a maximum 41.05% combined federal and state income tax rate. A lower tax rate would result in lower tax-equivalent figures.
(5) The Fund’s SEC yield is calculated by dividing the net investment income per share for the 30-day period by the offering price at the end of the period and annualizing the result.
(6) It is not possible to invest directly in an Index. The Index’s total return does not reflect the expenses that would have been incurred if an investor individually purchased or sold the securities represented in the Index. Index performance is available as of month end only.
(7) The Lipper Averages are the average annual total returns, at net asset value, of the funds that are in the same Lipper Classification as the Fund. It is not possible to invest in a Lipper Classification. Lipper Classifications may include insured and uninsured funds, as well as leveraged and unleveraged funds. The Lipper California Intermediate Municipal Debt Funds Classification contained 43, 39 and 18 funds for the 1-year, 5-year and 10-year time periods, respectively. Lipper Averages are available as of month end only.
Past performance is no guarantee of future results. Returns are historical and are calculated by determining the percentage change in net asset value or offering price (as applicable) with all distributions reinvested. Investment return and principal value will fluctuate so that shares, when redeemed, may be worth more or less than their original cost. Performance is for the stated time period only; due to market volatility, the Fund’s current performance may be lower or higher than the quoted return. For performance as of the most recent month end, please refer to www.eatonvance.com.
4
Rating Distribution(1)
By total investments
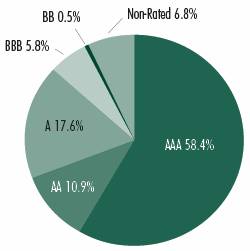
(1)Rating Distribution is determined by dividing the total market value of the issues by the total investments of the Fund.
Fund Statistics
· | | Number of Issues: | | | 67 |
· | | Average Maturity: | | | 11.0 years |
· | | Average Effective Maturity: | | | 7.5 years |
· | | Average Rating: | | | AA |
· | | Average Call Protection: | | | 6.3 years |
· | | Average Dollar Price: | | | $99.73 |
5
Eaton Vance Florida Plus Limited Maturity Municipals Fund as of March 31, 2008
PERFORMANCE INFORMATION AND PORTFOLIO COMPOSITION
The line graph and table set forth below provide information about the Fund’s performance. The line graph compares the performance of Class B of the Fund with that of the Lehman Brothers 7-Year Municipal Bond Index, an unmanaged market index of intermediate-maturity municipal obligations. The lines on the graph represent the total returns of a hypothetical investment of $10,000 in each of Class B and in the Lehman Brothers 7-Year Municipal Bond Index. The table includes the total returns of each Class of the Fund at net asset value and maximum public offering price. The performance presented below does not reflect the deduction of taxes, if any, that a shareholder would pay on distributions or redemptions of Fund shares.
Performance(1)
| | Class A | | Class B | | Class C | |
Share Class Symbol | | eXFLX | | eLFLX | | eZFLX | |
| | | | | | | |
Average Annual Total Returns (at net asset value) | | | | | | | |
One Year | | 0.05 | % | -0.71 | % | -0.63 | % |
Five Years | | 2.62 | | 1.84 | | 1.85 | |
Ten Years | | 3.72 | | 2.97 | | 2.96 | |
Life of Fund† | | 4.07 | | 3.65 | | 3.05 | |
| | | | | | | |
SEC Average Annual Total Returns (including sales charge or applicable CdSC) | | | | | | | |
One Year | | -2.23 | % | -3.60 | % | -1.59 | % |
Five Years | | 2.15 | | 1.84 | | 1.85 | |
Ten Years | | 3.48 | | 2.97 | | 2.96 | |
Life of Fund† | | 3.87 | | 3.65 | | 3.05 | |
†Inception date: Class A: 6/27/96; Class B: 5/29/92; Class C: 12/8/93
Total Annual Operating Expenses(2)
| | Class A | | Class B | | Class C | |
| | | | | | | |
Expense Ratio | | 0.89 | % | 1.64 | % | 1.64 | % |
Distribution Rates/Yields
| | Class A | | Class B | | Class C | |
| | | | | | | |
Distribution Rate(3) | | 3.99 | % | 3.22 | % | 3.21 | % |
Taxable-Equivalent Distribution Rate(3),(4) | | 6.14 | | 4.95 | | 4.94 | |
SEC 30-day Yield(5) | | 2.96 | | 2.28 | | 2.28 | |
Taxable-Equivalent SEC 30-day Yield(4),(5) | | 4.55 | | 3.51 | | 3.51 | |
Index Performance(6)
Lehman Brothers 7-Year Municipal Bond Index – Average Annual Total Returns | | | | | | | |
One Year | | | | | | 5.59 | % |
Five Years | | | | | | 3.92 | |
Ten Years | | | | | | 4.99 | |
Lipper Averages(7)
Lipper Florida Intermediate Municipal Debt Funds Classification – Average Annual Total Returns | | | | | |
One Year | | | | | | -0.44 | % |
Five Years | | | | | | 2.10 | |
Ten Years | | | | | | 3.22 | |
Portfolio Manager: Craig R. Brandon, CFA
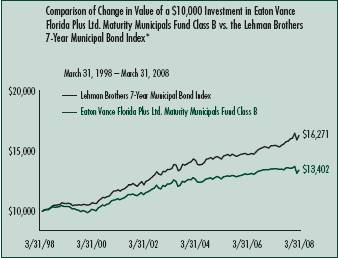
*Source: Lipper, Inc. Class B of the Fund commenced operations on 5/29/92.
A $10,000 hypothetical investment at net asset value in Class A and Class C on 3/31/98 would have been valued at $14,413 ($14,088 at the maximum offering price) and $13,390, respectively, on 3/31/08. It is not possible to invest directly in an Index. The Index’s total return does not reflect the expenses that would have been incurred if an investor individually purchased or sold the securities represented in the Index.
(1) Average annual total returns do not include the 2.25% maximum sales charge for Class A shares or the applicable contingent deferred sales charges (CDSC) for Class B and Class C shares. If sales charges were deducted, the returns would be lower. SEC average annual total returns for Class A reflect the maximum 2.25% sales charge. SEC returns for Class B reflect the applicable CDSC based on the following schedule: 3% - 1st year; 2.5% - 2nd year; 2% - 3rd year; 1% - 4th year. SEC returns for Class C reflect a 1% CDSC for the first year.
(2) Source: Prospectus dated 8/1/07.
(3) The Fund’s distribution rate represents actual distributions paid to shareholders and is calculated by dividing the last distribution per share in the period (annualized) by the net asset value at the end of the period.
(4) Taxable-equivalent figure assumes a maximum 35.00% federal income tax rate. A lower tax rate would result in lower tax-equivalent figures.
(5) The Fund’s SEC yield is calculated by dividing the net investment income per share for the 30-day period by the offering price at the end of the period and annualizing the result.
(6) It is not possible to invest directly in an Index. The Index’s total return does not reflect the expenses that would have been incurred if an investor individually purchased or sold the securities represented in the Index. Index performance is available as of month end only.
(7) The Lipper Averages are the average annual total returns, at net asset value, of the funds that are in the same Lipper Classification as the Fund. It is not possible to invest in a Lipper Classification. Lipper Classifications may include insured and uninsured funds, as well as leveraged and unleveraged funds. The Lipper Florida Intermediate Municipal Debt Funds Classification contained 3 funds each for the 1-year, 5-year and 10-year time periods. Lipper Averages are available as of month end only.
Past performance is no guarantee of future results. Returns are historical and are calculated by determining the percentage change in net asset value or offering price (as applicable) with all distributions reinvested. Investment return and principal value will fluctuate so that shares, when redeemed, may be worth more or less than their original cost. Performance is for the stated time period only; due to market volatility, the Fund’s current performance may be lower or higher than the quoted return. For performance as of the most recent month end, please refer to www.eatonvance.com.
6
Rating Distribution(1)
By total investments
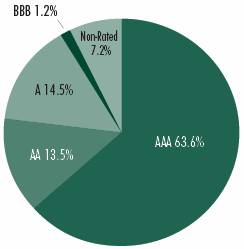
(1)Rating Distribution is determined by dividing the total market value of the issues by the total investments of the Fund.
��
Fund Statistics
· | Number of Issues: | | 61 | |
· | Average Maturity: | | 11.1 years | |
· | Average Effective Maturity: | | 7.6 years | |
· | Average Rating: | | AA+ | |
· | Average Call Protection: | | 6.9 years | |
· | Average Dollar Price: | | $102.38 | |
7
Eaton Vance Massachusetts Limited Maturity Municipals Fund as of March 31, 2008
PERFORMANCE INFORMATION AND PORTFOLIO COMPOSITION
The line graph and table set forth below provide information about the Fund’s performance. The line graph compares the performance of Class B of the Fund with that of the Lehman Brothers 7-Year Municipal Bond Index, an unmanaged market index of intermediate-maturity municipal obligations. The lines on the graph represent the total returns of a hypothetical investment of $10,000 in each of Class B and in the Lehman Brothers 7-Year Municipal Bond Index. The table includes the total returns of each Class of the Fund at net asset value and maximum public offering price. The performance presented below does not reflect the deduction of taxes, if any, that a shareholder would pay on distributions or redemptions of Fund shares.
Performance(1)
| | Class A | | Class B | | Class C | |
Share Class Symbol | | EXMAX | | ELMAX | | EZMAX | |
| | | | | | | |
Average Annual Total Returns (at net asset value) | | | | | | | |
One Year | | 1.39 | % | 0.52 | % | 0.63 | % |
Five Years | | 2.70 | | 1.94 | | 1.92 | |
Ten Years | | 3.70 | | 2.91 | | 2.94 | |
Life of Fund† | | 4.15 | | 3.64 | | 3.17 | |
| | | | | | | |
SEC Average Annual Total Returns (including sales charge or applicable CDSC) | | | | | | | |
One Year | | -0.85 | % | -2.41 | % | -0.35 | % |
Five Years | | 2.24 | | 1.94 | | 1.92 | |
Ten Years | | 3.46 | | 2.91 | | 2.94 | |
Life of Fund† | | 3.95 | | 3.64 | | 3.17 | |
†Inception date: Class A: 6/27/96; Class B: 6/1/92; Class C: 12/8/93
Total Annual Operating Expenses(2)
| | Class A | | Class B | | Class C | |
| | | | | | | |
Expense Ratio | | 0.84 | % | 1.59 | % | 1.59 | % |
Distribution Rates/Yields
| | Class A | | Class B | | Class C | |
| | | | | | | |
Distribution Rate(3) | | 3.61 | % | 2.85 | % | 2.85 | % |
Taxable-Equivalent Distribution Rate(3),(4) | | 5.87 | | 4.63 | | 4.63 | |
SEC 30-day Yield(5) | | 2.81 | | 2.15 | | 2.13 | |
Taxable-Equivalent SEC 30-day Yield(4),(5) | | 4.57 | | 3.49 | | 3.46 | |
Index Performance(6) | | | |
| | | |
Lehman Brothers 7-Year Municipal Bond Index – Average Annual Total Returns | | | |
One Year | | 5.59 | % |
Five Years | | 3.92 | |
Ten Years | | 4.99 | |
Lipper Averages(7) | | | |
| | | |
Lipper Massachusetts Intermediate Municipal Debt Funds Classification – Average Annual Total Returns | | | |
One Year | | 2.54 | % |
Five Years | | 2.65 | |
Ten Years | | 3.66 | |
Portfolio Manager: William H. Ahern, Jr., CFA
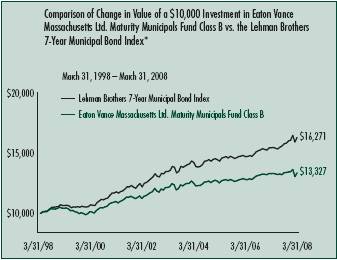
*Source: Lipper, Inc. Class B of the Fund commenced operations on 6/1/92.
A $10,000 hypothetical investment at net asset value in Class A and Class C on 3/31/98 would have been valued at $14,382 ($14,058 at the maximum offering price) and $13,363, respectively, on 3/31/08. It is not possible to invest directly in an Index. The Index’s total return does not reflect the expenses that would have been incurred if an investor individually purchased or sold the securities represented in the Index.
(1) Average annual total returns do not include the 2.25% maximum sales charge for Class A shares or the applicable contingent deferred sales charges (CDSC) for Class B and Class C shares. If sales charges were deducted, the returns would be lower. SEC average annual total returns for Class A reflect the maximum 2.25% sales charge. SEC returns for Class B reflect the applicable CDSC based on the following schedule: 3% - 1st year; 2.5% - 2nd year; 2% - 3rd year; 1% - 4th year. SEC returns for Class C reflect a 1% CDSC for the first year.
(2) Source: Prospectus dated 8/1/07.
(3) The Fund’s distribution rate represents actual distributions paid to shareholders and is calculated by dividing the last distribution per share in the period (annualized) by the net asset value at the end of the period.
(4) Taxable-equivalent figure assumes a maximum 38.45% combined federal and state income tax rate. A lower tax rate would result in lower tax-equivalent figures.
(5) The Fund’s SEC yield is calculated by dividing the net investment income per share for the 30-day period by the offering price at the end of the period and annualizing the result.
(6) It is not possible to invest directly in an Index. The Index’s total return does not reflect the expenses that would have been incurred if an investor individually purchased or sold the securities represented in the Index. Index performance is available as of month end only.
(7) The Lipper Averages are the average annual total returns, at net asset value, of the funds that are in the same Lipper Classification as the Fund. It is not possible to invest in a Lipper Classification. Lipper Classifications may include insured and uninsured funds, as well as leveraged and unleveraged funds. The Lipper Massachusetts Intermediate Municipal Debt Funds Classification contained 12, 12 and 7 funds for the 1-year, 5-year and 10-year time periods, respectively. Lipper Averages are available as of month end only.
Past performance is no guarantee of future results. Returns are historical and are calculated by determining the percentage change in net asset value or offering price (as applicable) with all distributions reinvested. Investment return and principal value will fluctuate so that shares, when redeemed, may be worth more or less than their original cost. Performance is for the stated time period only; due to market volatility, the Fund’s current performance may be lower or higher than the quoted return. For performance as of the most recent month end, please refer to www.eatonvance.com.
8
Rating Distribution(1)
By total investments
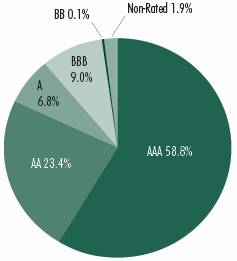
(1)Rating Distribution is determined by dividing the total market value of the issues by the total investments of the Fund.
Fund Statistics
· | | Number of Issues: | | 69 | |
· | | Average Maturity: | | 9.7 years | |
· | | Average Effective Maturity: | | 6.8 years | |
· | | Average Rating: | | AA+ | |
· | | Average Call Protection: | | 6.4 years | |
· | | Average Dollar Price: | | $104.51 | |
9
Eaton Vance New Jersey Limited Maturity Municipals Fund as of March 31, 2008
PERFORMANCE INFORMATION AND PORTFOLIO COMPOSITION
The line graph and table set forth below provide information about the Fund’s performance. The line graph compares the performance of Class B of the Fund with that of the Lehman Brothers 7-Year Municipal Bond Index, an unmanaged market index of intermediate-maturity municipal obligations. The lines on the graph represent the total returns of a hypothetical investment of $10,000 in each of Class B and in the Lehman Brothers 7-Year Municipal Bond Index. The table includes the total returns of each Class of the Fund at net asset value and maximum public offering price. The performance presented below does not reflect the deduction of taxes, if any, that a shareholder would pay on distributions or redemptions of Fund shares.
Performance(1)
| | Class A | | Class B | | Class C | |
Share Class Symbol | | EXNJX | | ELNJX | | EZNJX | |
| | | | | | | |
Average Annual Total Returns (at net asset value) | | | | | | | |
One Year | | 0.74 | % | -0.03 | % | 0.08 | % |
Five Years | | 2.87 | | 2.12 | | N.A. | |
Ten Years | | 3.67 | | 2.90 | | N.A. | |
Life of Fund† | | 4.13 | | 3.63 | | 1.74 | |
| | | | | | | |
SEC Average Annual Total Returns (including sales charge or applicable CDSC) | | | | | | | |
One Year | | -1.57 | % | -2.93 | % | -0.89 | % |
Five Years | | 2.40 | | 2.12 | | N.A. | |
Ten Years | | 3.43 | | 2.90 | | N.A. | |
Life of Fund† | | 3.93 | | 3.63 | | 1.74 | |
†Inception date: Class A: 6/27/96; Class B: 6/1/92; Class C: 8/1/06 | |
Total Annual Operating Expenses(2)
| | Class A | | Class B | | Class C | |
| | | | | | | |
Expense Ratio | | 0.91 | % | 1.66 | % | 1.63 | % |
Distribution Rates/Yields
| | Class A | | Class B | | Class C | |
| | | | | | | |
Distribution Rate(3) | | 3.79 | % | 3.02 | % | 3.03 | % |
Taxable-Equivalent Distribution Rate(3),(4) | | 6.41 | | 5.10 | | 5.12 | |
SEC 30-day Yield(5) | | 2.80 | | 2.12 | | 2.12 | |
Taxable-Equivalent SEC 30-day Yield(4),(5) | | 4.73 | | 3.58 | | 3.58 | |
Index Performance(6)
Lehman Brothers 7-Year Municipal Bond Index – Average Annual Total Returns | | | |
One Year | | 5.59 | % |
Five Years | | 3.92 | |
Ten Years | | 4.99 | |
| | | |
Lipper Other States Intermediate Municipal Debt Funds Classification – Average Annual Total Returns | | | |
One Year | | 2.54 | % |
Five Years | | 2.67 | |
Ten Years | | 3.72 | |
Portfolio Manager: Craig R. Brandon, CFA

*Source: Lipper, Inc. Class B of the Fund commenced operations on 6/1/92.
A $10,000 hypothetical investment at net asset value in Class A on 3/31/98 and Class C on 8/1/06 (commencement of operations) would have been valued at $14,341 ($14,018 at the maximum offering price) and $10,292, respectively, on 3/31/08. It is not possible to invest directly in an Index. The Index’s total return does not reflect the expenses that would have been incurred if an investor individually purchased or sold the securities represented in the Index.
(1) Average annual total returns do not include the 2.25% maximum sales charge for Class A shares or the applicable contingent deferred sales charges (CDSC) for Class B and Class C shares. If sales charges were deducted, the returns would be lower. SEC average annual total returns for Class A reflect the maximum 2.25% sales charge. SEC returns for Class B reflect the applicable CDSC based on the following schedule: 3% - 1st year; 2.5% - 2nd year; 2% - 3rd year; 1% - 4th year. SEC returns for Class C reflect a 1% CDSC for the first year.
(2) Source: Prospectus dated 8/1/07.
(3) The Fund’s distribution rate represents actual distributions paid to shareholders and is calculated by dividing the last distribution per share in the period (annualized) by the net asset value at the end of the period.
(4) Taxable-equivalent figure assumes a maximum 40.83% combined federal and state income tax rate. A lower tax rate would result in lower tax-equivalent figures.
(5) The Fund’s SEC yield is calculated by dividing the net investment income per share for the 30-day period by the offering price at the end of the period and annualizing the result.
(6) It is not possible to invest directly in an Index. The Index’s total return does not reflect the expenses that would have been incurred if an investor individually purchased or sold the securities represented in the Index. Index performance is available as of month end only.
(7) The Lipper Averages are the average annual total returns, at net asset value, of the funds that are in the same Lipper Classification as the Fund. It is not possible to invest in a Lipper Classification. Lipper Classifications may include insured and uninsured funds, as well as leveraged and unleveraged funds. The Lipper Other States Intermediate Municipal Debt Funds Classification contained 108, 100 and 73 funds for the 1-year, 5-year and 10-year time periods, respectively. Lipper Averages are available as of month end only.
Past performance is no guarantee of future results. Returns are historical and are calculated by determining the percentage change in net asset value or offering price (as applicable) with all distributions reinvested. Investment return and principal value will fluctuate so that shares, when redeemed, may be worth more or less than their original cost. Performance is for the stated time period only; due to market volatility, the Fund’s current performance may be lower or higher than the quoted return. For performance as of the most recent month end, please refer to www.eatonvance.com.
10
Rating Distribution(1)
By total investments
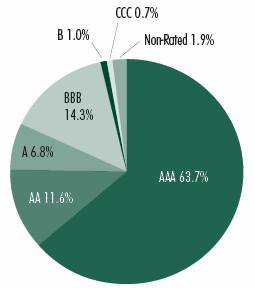
(1)Rating Distribution is determined by dividing the total market value of the issues by the total investments of the Fund.
Fund Statistics
· Number of Issues: | | 56 | |
· Average Maturity: | | 10.2 years | |
· Average Effective Maturity: | | 8.5 years | |
· Average Rating: | | AA | |
· Average Call Protection: | | 7.6 years | |
· Average Dollar Price: | | $104.74 | |
11
Eaton Vance New York Limited Maturity Municipals Fund as of March 31, 2008
PERFORMANCE INFORMATION AND PORTFOLIO COMPOSITION
The line graph and table set forth below provide information about the Fund’s performance. The line graph compares the performance of Class B of the Fund with that of the Lehman Brothers 7-Year Municipal Bond Index, an unmanaged market index of intermediate-maturity municipal obligations. The lines on the graph represent the total returns of a hypothetical investment of $10,000 in each of Class B and in the Lehman Brothers 7-Year Municipal Bond Index. The table includes the total returns of each Class of the Fund at net asset value and maximum public offering price. The performance presented below does not reflect the deduction of taxes, if any, that a shareholder would pay on distributions or redemptions of Fund shares.
Performance(1)
| | Class A | | Class B | | Class C | |
Share Class Symbol | | EXNYX | | ELNYX | | EZNYX | |
| | | | | | | |
Average Annual Total Returns (at net asset value) | | | | | | | |
One Year | | -0.03 | % | -0.79 | % | -0.78 | % |
Five Years | | 2.64 | | 1.87 | | 1.86 | |
Ten Years | | 3.82 | | 3.04 | | 3.06 | |
Life of Fund† | | 4.35 | | 3.82 | | 3.28 | |
SEC Average Annual Total Returns (including sales charge or applicable CDSC) | | | | | | | |
One Year | | -2.25 | % | -3.67 | % | -1.74 | % |
Five Years | | 2.18 | | 1.87 | | 1.86 | |
Ten Years | | 3.58 | | 3.04 | | 3.06 | |
Life of Fund† | | 4.15 | | 3.82 | | 3.28 | |
†Inception date: Class A: 6/27/96; Class B: 5/29/92; Class C: 12/8/93
Total Annual Operating Expenses(2)
| | Class A | | Class B | | Class C | |
| | | | | | | |
Expense Ratio | | 0.84 | % | 1.58 | % | 1.58 | % |
Distribution Rates/Yields
| | Class A | | Class B | | Class C | |
| | | | | | | |
Distribution Rate(3) | | 3.90 | % | 3.14 | % | 3.14 | % |
Taxable-Equivalent Distribution Rate (3),(4) | | 6.44 | | 5.19 | | 5.19 | |
SEC 30-day Yield(5) | | 3.17 | | 2.50 | | 2.50 | |
Taxable-Equivalent SEC 30-day Yield(4),(5) | | 5.24 | | 4.13 | | 4.13 | |
Index Performance(6)
Lehman Brothers 7-Year Municipal Bond Index – Average Annual Total Returns | | | |
One Year | | 5.59 | % |
Five Years | | 3.92 | |
Ten Years | | 4.99 | |
Lipper Averages(7)
Lipper New York Intermediate Municipal debt Funds Classification – Average Annual Total returns | | | |
One Year | | 2.58 | % |
Five Years | | 2.71 | |
Ten Years | | 4.00 | |
Portfolio Manager: William H. Ahern, Jr., CFA
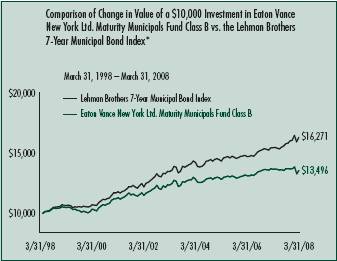
* Source: Lipper, Inc. Class B of the Fund commenced operations on 5/29/92.
A $10,000 hypothetical investment at net asset value in Class A and Class C on 3/31/98 would have been valued at $14,551 ($14,223 at the maximum offering price) and $13,520, respectively, on 3/31/08. It is not possible to invest directly in an Index. The Index’s total return does not reflect the expenses that would have been incurred if an investor individually purchased or sold the securities represented in the Index.
(1) Average annual total returns do not include the 2.25% maximum sales charge for Class A shares or the applicable contingent deferred sales charges (CDSC) for Class B and Class C shares. If sales charges were deducted, the returns would be lower. SEC average annual total returns for Class A reflect the maximum 2.25% sales charge. SEC returns for Class B reflect the applicable CDSC based on the following schedule: 3% - 1st year; 2.5% - 2nd year; 2% - 3rd year; 1% - 4th year. SEC returns for Class C reflect a 1% CDSC for the first year.
(2) Source: Prospectus dated 8/1/07. Includes interest expense of 0.02% relating to the Fund’s liability with respect to floating-rate notes held by third parties in conjunction with inverse floater securities transactions by the Fund. The Fund also records offsetting interest income relating to the municipal obligations underlying such transactions, and as a result net asset value and performance have not been affected by this expense.
(3) The Fund’s distribution rate represents actual distributions paid to shareholders and is calculated by dividing the last distribution per share in the period (annualized) by the net asset value at the end of the period.
(4) Taxable-equivalent figure assumes a maximum 39.45% combined federal and state income tax rate. A lower tax rate would result in lower tax-equivalent figures.
(5) The Fund’s SEC yield is calculated by dividing the net investment income per share for the 30-day period by the offering price at the end of the period and annualizing the result.
(6) It is not possible to invest directly in an Index. The Index’s total return does not reflect the expenses that would have been incurred if an investor individually purchased or sold the securities represented in the Index. Index performance is available as of month end only.
(7) The Lipper Averages are the average annual total returns, at net asset value, of the funds that are in the same Lipper Classification as the Fund. It is not possible to invest in a Lipper Classification. Lipper Classifications may include insured and uninsured funds, as well as leveraged and unleveraged funds. The Lipper New York Intermediate Municipal Debt Funds Classification contained 33, 30 and 15 funds for the 1-year, 5-year and 10-year time periods, respectively. Lipper Averages are available as of month end only.
Past performance is no guarantee of future results. Returns are historical and are calculated by determining the percentage change in net asset value or offering price (as applicable) with all distributions reinvested. Investment return and principal value will fluctuate so that shares, when redeemed, may be worth more or less than their original cost. Performance is for the stated time period only; due to market volatility, the Fund’s current performance may be lower or higher than the quoted return. For performance as of the most recent month end, please refer to www.eatonvance.com.
12
Rating Distribution(1)
By total investments
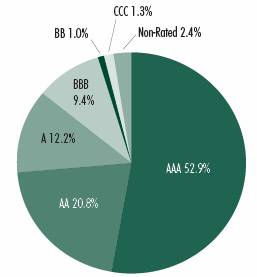
(1)Rating Distribution is determined by dividing the total market value of the issues by the total investments of the Fund.
Fund Statistics
· | Number of Issues: | | 92 | |
· | Average Maturity: | | 10.6 years | |
· | Average Effective Maturity: | | 7.5 years | |
· | Average Rating: | | AA | |
· | Average Call Protection: | | 6.6 years | |
· | Average Dollar Price: | | $104.73 | |
13
Eaton Vance Ohio Limited Maturity Municipals Fund as of March 31, 2008
PERFORMANCE INFORMATION AND PORTFOLIO COMPOSITION
The line graph and table set forth below provide information about the Fund’s performance. The line graph compares the performance of Class B of the Fund with that of the Lehman Brothers 7-Year Municipal Bond Index, an unmanaged market index of intermediate-maturity municipal obligations. The lines on the graph represent the total returns of a hypothetical investment of $10,000 in each of Class B and in the Lehman Brothers 7-Year Municipal Bond Index. The table includes the total returns of each Class of the Fund at net asset value and maximum public offering price. The performance presented below does not reflect the deduction of taxes, if any, that a shareholder would pay on distributions or redemptions of Fund shares.
Performance(1)
| | Class A | | Class B | | Class C | |
Share Class Symbol | | EXOHX | | ELOHX | | EZOHX | |
| | | | | | | |
Average Annual Total Returns (at net asset value) | | | | | | | |
One Year | | 0.96 | % | 0.19 | % | 0.08 | % |
Five Years | | 2.45 | | 1.69 | | N.A. | |
Ten Years | | 3.33 | | 2.58 | | N.A. | |
Life of Fund† | | 3.77 | | 3.19 | | 1.56 | |
| | | | | | | |
SEC Average Annual Total Returns (including sales charge or applicable CDSC) | | | | | | | |
One Year | | -1.28 | % | -2.73 | % | -0.89 | % |
Five Years | | 1.98 | | 1.69 | | N.A. | |
Ten Years | | 3.10 | | 2.58 | | N.A. | |
Life of Fund† | | 3.56 | | 3.19 | | 1.56 | |
†Inception date: Class A: 10/22/96; Class B: 4/16/93; Class C: 8/1/06
Total Annual Operating Expenses(2)
| | Class A | | Class B | | Class C | |
| | | | | | | |
Expense Ratio | | 1.03 | % | 1.78 | % | 1.78 | % |
Distribution Rates/Yields
| | Class A | | Class B | | Class C | |
| | | | | | | |
Distribution Rate(3) | | 3.72 | % | 2.94 | % | 2.95 | % |
Taxable-Equivalent Distribution rate(3),(4) | | 6.12 | | 4.84 | | 4.86 | |
SEC 30-day Yield(5) | | 2.66 | | 1.98 | | 1.99 | |
Taxable-Equivalent SEC 30-day Yield(4),(5) | | 4.38 | | 3.52 | | 2.86 | |
Lehman Brothers 7-Year Municipal Bond Index – Average Annual Total Returns | | | | | | | |
One Year | | | | | | 5.59 | % |
Five Years | | | | | | 3.92 | |
Ten Years | | | | | | 4.99 | |
Lipper Ohio Intermediate Municipal Debt Funds Classification – Average Annual Total Returns | | | | | |
One Year | | | | | | 2.73 | % |
Five Years | | | | | | 2.33 | |
Ten Years | | | | | | 3.47 | |
Portfolio Manager: William H. Ahern, Jr., CFA
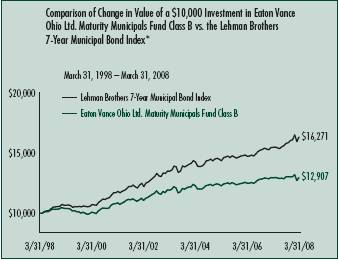
*Source: Lipper, Inc. Class B of the Fund commenced operations on 4/16/93.
A $10,000 hypothetical investment at net asset value in Class A on 3/31/98 and Class C on 8/1/06 (commencement of operations) would have been valued at $13,881 ($13,569 at the maximum offering price) and $10,262, respectively, on 3/31/08. It is not possible to invest directly in an Index. The Index’s total return does not reflect the expenses that would have been incurred if an investor individually purchased or sold the securities represented in the Index.
(1) Average annual total returns do not include the 2.25% maximum sales charge for Class A shares or the applicable contingent deferred sales charges (CDSC) for Class B and Class C shares. If sales charges were deducted, the returns would be lower. SEC average annual total returns for Class A reflect the maximum 2.25% sales charge. SEC returns for Class B reflect the applicable CDSC based on the following schedule: 3% - 1st year; 2.5% - 2nd year; 2% - 3rd year; 1% - 4th year. SEC returns for Class C reflect a 1% CDSC for the first year.
(2) Source: Prospectus dated 8/1/07.
(3) The Fund’s distribution rate represents actual distributions paid to shareholders and is calculated by dividing the last distribution per share in the period (annualized) by the net asset value at the end of the period.
(4) Taxable-equivalent figure assumes a maximum 39.26% combined federal and state income tax rate. A lower tax rate would result in lower tax-equivalent figures.
(5) The Fund’s SEC yield is calculated by dividing the net investment income per share for the 30-day period by the offering price at the end of the period and annualizing the result.
(6) It is not possible to invest directly in an Index. The Index’s total return does not reflect the expenses that would have been incurred if an investor individually purchased or sold the securities represented in the Index. Index performance is available as of month end only.
(7) The Lipper Averages are the average annual total returns, at net asset value, of the funds that are in the same Lipper Classification as the Fund. It is not possible to invest in a Lipper Classification. Lipper Classifications may include insured and uninsured funds, as well as leveraged and unleveraged funds. The Lipper Ohio Intermediate Municipal Debt Funds Classification contained 18, 15 and 11 funds for the 1-year, 5-year and 10-year time periods, respectively. Lipper Averages are available as of month end only.
Past performance is no guarantee of future results. Returns are historical and are calculated by determining the percentage change in net asset value or offering price (as applicable) with all distributions reinvested. Investment return and principal value well fluctuate so that shares, when redeemed, may be worth more or less than their original cost. Performance is for the stated time period only; due to market volatility, the Fund’s current performance may be lower or higher than the quoted return. For performance as of the most recent month end, please refer to www.eatonvance.com.
14
Rating Distribution(1)
By total investments

(1)Rating Distribution is determined by dividing the total market value of the issues by the total investments of the Fund.
Fund Statistics
· Number of Issues: | | 51 |
· Average Maturity: | | 8.4 years |
· Average Effective Maturity: | | 6.4 years |
· Average Rating: | | AA |
· Average Call Protection: | | 5.7 years |
· Average Dollar Price: | | $104.20 |
15
Eaton Vance Pennsylvania Limited Maturity Municipals Fund as of March 31, 2008
PERFORMANCE INFORMATION AND PORTFOLIO COMPOSITION
The line graph and table set forth below provide information about the Fund’s performance. The line graph compares the performance of Class B of the Fund with that of the Lehman Brothers 7-Year Municipal Bond Index, an unmanaged market index of intermediate-maturity municipal obligations. The lines on the graph represent the total returns of a hypothetical investment of $10,000 in each of Class B and in the Lehman Brothers 7-Year Municipal Bond Index. The table includes the total returns of each Class of the Fund at net asset value and maximum public offering price. The performance presented below does not reflect the deduction of taxes, if any, that a shareholder would pay on distributions or redemptions of Fund shares.
Performance(1)
| | Class A | | Class B | | Class C | |
Share Class Symbol | | EXPNX | | ELPNX | | EZPNX | |
| | | | | | | |
Average Annual Total Returns (at net asset value) | | | | | | | |
One Year | | 0.64 | % | -0.11 | % | -0.08 | % |
Five Years | | 3.03 | | 2.28 | | 2.27 | |
Ten Years | | 3.72 | | 2.95 | | 2.96 | |
Life of Fund† | | 4.30 | | 3.82 | | 3.26 | |
| | | | | | | |
SEC Average Annual Total Returns (including sales charge or applicable CDSC) | | | | | | | |
One Year | | -1.64 | % | -3.01 | % | -1.05 | % |
Five Years | | 2.57 | | 2.28 | | 2.27 | |
Ten Years | | 3.49 | | 2.95 | | 2.96 | |
Life of Fund† | | 4.10 | | 3.82 | | 3.26 | |
†Inception date: Class A: 6/27/96; Class B: 6/1/92; Class C: 12/8/93
Total Annual Operating Expenses(2)
| | Class A | | Class B | | Class C | |
| | | | | | | |
Expense Ratio | | 0.88 | % | 1.63 | % | 1.63 | % |
Distribution Rates/Yields
| | Class A | | Class B | | Class C | |
| | | | | | | |
Distribution Rate(3) | | 3.92 | % | 3.15 | % | 3.15 | % |
Taxable-Equivalent Distribution Rate(3),(4) | | 6.22 | | 5.00 | | 5.00 | |
SEC 30-day Yield(5) | | 2.91 | | 2.24 | | 2.24 | |
Taxable-Equivalent SEC 30-day Yield(4),(5) | | 4.62 | | 3.56 | | 3.56 | |
Index Performance(6)
Lehman Brothers 7-Year Municipal Bond Index – Average Annual Total Returns | | | | | | | |
One Year | | | | | | 5.59 | % |
Five Years | | | | | | 3.92 | |
Ten Years | | | | | | 4.99 | |
Lipper Averages(7)
Lipper Pennsylvania Intermediate Municipal Debt Funds Classification – Average Annual Total Returns | | | |
One Year | | | | | | 2.33 | % |
Five Years | | | | | | 2.70 | |
Ten Years | | | | | | 3.71 | |
Portfolio Manager: Adam A. Weigold, CFA
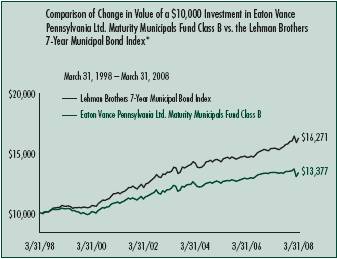
*Source: Lipper, Inc. Class B of the Fund commenced operations on 6/1/92.
A $10,000 hypothetical investment at net asset value in Class A and Class C on 3/31/98 would have been valued at $14,411 ($14,087 at the maximum offering price) and $13,394, respectively, on 3/31/08. It is not possible to invest directly in an Index. The Index’s total return does not reflect the expenses that would have been incurred if an investor individually purchased or sold the securities represented in the Index.
(1) Average annual total returns do not include the 2.25% maximum sales charge for Class A shares or the applicable contingent deferred sales charges (CDSC) for Class B and Class C shares. If sales charges were deducted, the returns would be lower. SEC average annual total returns for Class A reflect the maximum 2.25% sales charge. SEC returns for Class B reflect the applicable CDSC based on the following schedule: 3% - 1st year; 2.5% - 2nd year; 2% - 3rd year; 1% - 4th year. SEC returns for Class C reflect a 1% CDSC for the first year.
(2) Source: Prospectus dated 8/1/07.
(3) The Fund’s distribution rate represents actual distributions paid to shareholders and is calculated by dividing the last distribution per share in the period (annualized) by the net asset value at the end of the period.
(4) Taxable-equivalent figure assumes a maximum 37.00% combined federal and state income tax rate. A lower tax rate would result in lower tax-equivalent figures.
(5) The Fund’s SEC yield is calculated by dividing the net investment income per share for the 30-day period by the offering price at the end of the period and annualizing the result.
(6) It is not possible to invest directly in an Index. The Index’s total return does not reflect the expenses that would have been incurred if an investor individually purchased or sold the securities represented in the Index. Index performance is available as of month end only.
(7) The Lipper Averages are the average annual total returns, at net asset value, of the funds that are in the same Lipper Classification as the Fund. It is not possible to invest in a Lipper Classification. Lipper Classifications may include insured and uninsured funds, as well as leveraged and unleveraged funds. The Lipper Pennsylvania Intermediate Municipal Debt Funds Classification contained 13, 13 and 8 funds for the 1-year, 5-year and 10-year time periods, respectively. Lipper Averages are available as of month end only.
Past performance is no guarantee of future results. Returns are historical and are calculated by determining the percentage change in net asset value or offering price (as applicable) with all distributions reinvested. Investment return and principal value will fluctuate so that shares, when redeemed, may be worth more or less than their original cost. Performance is for the stated time period only; due to market volatility, the Fund’s current performance may be lower or higher than the quoted return. For performance as of the most recent month end, please refer to www.eatonvance.com.
16
Rating Distribution(1)
By total investments
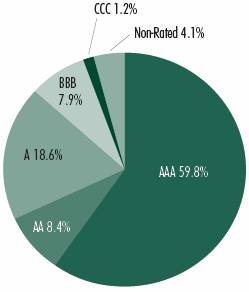
(1)Rating Distribution is determined by dividing the total market value of the issues by the total investments of the Fund.
Fund Statistics
· Number of Issues: | | 55 |
· Average Maturity: | | 10.5 years |
· Average Effective Maturity: | | 6.9 years |
· Average Rating: | | AA |
· Average Call Protection: | | 6.1 years |
· Average Dollar Price: | | $100.36 |
17
Eaton Vance Limited Maturity Municipals Funds as of March 31, 2008
FUND EXPENSES
Example: As a shareholder of a Fund, you incur two types of costs: (1) transaction costs, including sales charges (loads) on purchases and redemption fees (if applicable); and (2) ongoing costs, including management fees; distribution or service fees; and other Fund expenses. This Example is intended to help you understand your ongoing costs (in dollars) of investing in a Fund and to compare these costs with the ongoing costs of investing in other mutual funds. The Example is based on an investment of $1,000 invested at the beginning of the period and held for the entire period (October 1, 2007 – March 31, 2008).
Actual Expenses: The first section of each table below provides information about actual account values and actual expenses. You may use the information in this section, together with the amount you invested, to estimate the expenses that you paid over the period. Simply divide your account value by $1,000 (for example, an $8,600 account value divided by $1,000 = 8.6), then multiply the result by the number in the first section under the heading entitled "Expenses Paid During Period" to estimate the expenses you paid on your account during this period.
Hypothetical Example for Comparison Purposes: The second section of each table below provides information about hypothetical account values and hypothetical expenses based on the actual Fund expense ratio and an assumed rate of return of 5% per year (before expenses), which is not the actual return of the Fund. The hypothetical account values and expenses may not be used to estimate the actual ending account balance or expenses you paid for the period. You may use this information to compare the ongoing costs of investing in your Fund and other funds. To do so, compare this 5% hypothetical example with the 5% hypothetical examples that appear in the shareholder reports of the other funds.
Please note that the expenses shown in each table are meant to highlight your ongoing costs only and do not reflect any transactional costs, such as sales charges (loads) or redemption fees (if applicable). Therefore, the second section of each table is useful in comparing ongoing costs only, and will not help you determine the relative total costs of owning different funds. In addition, if these transactional costs were included, your costs would have been higher.
Eaton Vance California Limited Maturity Municipals Fund
| | | Beginning Account Value
(10/1/07) | | Ending Account Value
(3/31/08) | | Expenses Paid During Period*
(10/1/07 – 3/31/08) | |
| Actual | |
| Class A | | $ | 1,000.00 | | | $ | 987.10 | | | $ | 4.42 | | |
| Class B | | $ | 1,000.00 | | | $ | 984.20 | | | $ | 8.14 | | |
| Class C | | $ | 1,000.00 | | | $ | 983.30 | | | $ | 8.03 | | |
| Hypothetical | |
| (5% return per year before expenses) | |
| Class A | | $ | 1,000.00 | | | $ | 1,020.60 | | | $ | 4.50 | | |
| Class B | | $ | 1,000.00 | | | $ | 1,016.80 | | | $ | 8.27 | | |
| Class C | | $ | 1,000.00 | | | $ | 1,016.90 | | | $ | 8.17 | | |
* Expenses are equal to the Fund's annualized expense ratio of 0.89% for Class A shares, 1.64% for Class B shares and 1.62% for Class C shares, multiplied by the average account value over the period, multiplied by 183/366 (to reflect the one-half year period). The Example assumes that the $1,000 was invested at the net asset value per share determined at the close of business on September 30, 2007.
18
Eaton Vance Limited Maturity Municipals Funds as of March 31, 2008
FUND EXPENSES CONT'D
Eaton Vance Florida Plus Limited Maturity Municipals Fund
| | | Beginning Account Value
(10/1/07) | | Ending Account Value
(3/31/08) | | Expenses Paid During Period*
(10/1/07 – 3/31/08) | |
| Actual | |
| Class A | | $ | 1,000.00 | | | $ | 991.60 | | | $ | 4.73 | | |
| Class B | | $ | 1,000.00 | | | $ | 986.90 | | | $ | 8.44 | | |
| Class C | | $ | 1,000.00 | | | $ | 987.20 | | | $ | 8.45 | | |
| Hypothetical | |
| (5% return per year before expenses) | |
| Class A | | $ | 1,000.00 | | | $ | 1,020.30 | | | $ | 4.80 | | |
| Class B | | $ | 1,000.00 | | | $ | 1,016.50 | | | $ | 8.57 | | |
| Class C | | $ | 1,000.00 | | | $ | 1,016.50 | | | $ | 8.57 | | |
* Expenses are equal to the Fund's annualized expense ratio of 0.95% for Class A shares, 1.70% for Class B shares and 1.70% for Class C shares, multiplied by the average account value over the period, multiplied by 183/366 (to reflect the one-half year period). The Example assumes that the $1,000 was invested at the net asset value per share determined at the close of business on September 30, 2007.
Eaton Vance Massachusetts Limited Maturity Municipals Fund
| | | Beginning Account Value
(10/1/07) | | Ending Account Value
(3/31/08) | | Expenses Paid During Period*
(10/1/07 – 3/31/08) | |
| Actual | |
| Class A | | $ | 1,000.00 | | | $ | 1,003.00 | | | $ | 4.16 | | |
| Class B | | $ | 1,000.00 | | | $ | 999.20 | | | $ | 7.95 | | |
| Class C | | $ | 1,000.00 | | | $ | 999.60 | | | $ | 7.95 | | |
| Hypothetical | |
| (5% return per year before expenses) | |
| Class A | | $ | 1,000.00 | | | $ | 1,020.90 | | | $ | 4.19 | | |
| Class B | | $ | 1,000.00 | | | $ | 1,017.10 | | | $ | 8.02 | | |
| Class C | | $ | 1,000.00 | | | $ | 1,017.10 | | | $ | 8.02 | | |
* Expenses are equal to the Fund's annualized expense ratio of 0.83% for Class A shares, 1.59% for Class B shares and 1.59% for Class C shares, multiplied by the average account value over the period, multiplied by 183/366 (to reflect the one-half year period). The Example assumes that the $1,000 was invested at the net asset value per share determined at the close of business on September 30, 2007.
19
Eaton Vance Limited Maturity Municipals Funds as of March 31, 2008
FUND EXPENSES CONT'D
Eaton Vance New Jersey Limited Maturity Municipals Fund
| | | Beginning Account Value
(10/1/07) | | Ending Account Value
(3/31/08) | | Expenses Paid During Period*
(10/1/07 – 3/31/08) | |
| Actual | |
| Class A | | $ | 1,000.00 | | | $ | 996.90 | | | $ | 4.54 | | |
| Class B | | $ | 1,000.00 | | | $ | 994.10 | | | $ | 8.23 | | |
| Class C | | $ | 1,000.00 | | | $ | 994.10 | | | $ | 8.28 | | |
| Hypothetical | |
| (5% return per year before expenses) | |
| Class A | | $ | 1,000.00 | | | $ | 1,020.50 | | | $ | 4.60 | | |
| Class B | | $ | 1,000.00 | | | $ | 1,016.80 | | | $ | 8.32 | | |
| Class C | | $ | 1,000.00 | | | $ | 1,016.70 | | | $ | 8.37 | | |
* Expenses are equal to the Fund's annualized expense ratio of 0.91% for Class A shares, 1.65% for Class B shares and 1.66% for Class C shares, multiplied by the average account value over the period, multiplied by 183/366 (to reflect the one-half year period). The Example assumes that the $1,000 was invested at the net asset value per share determined at the close of business on September 30, 2007.
Eaton Vance New York Limited Maturity Municipals Fund
| | | Beginning Account Value
(10/1/07) | | Ending Account Value
(3/31/08) | | Expenses Paid During Period*
(10/1/07 – 3/31/08) | |
| Actual | |
| Class A | | $ | 1,000.00 | | | $ | 992.00 | | | $ | 4.08 | | |
| Class B | | $ | 1,000.00 | | | $ | 988.30 | | | $ | 7.80 | | |
| Class C | | $ | 1,000.00 | | | $ | 987.90 | | | $ | 7.80 | | |
| Hypothetical | |
| (5% return per year before expenses) | |
| Class A | | $ | 1,000.00 | | | $ | 1,020.90 | | | $ | 4.14 | | |
| Class B | | $ | 1,000.00 | | | $ | 1,017.20 | | | $ | 7.92 | | |
| Class C | | $ | 1,000.00 | | | $ | 1,017.20 | | | $ | 7.92 | | |
* Expenses are equal to the Fund's annualized expense ratio of 0.82% for Class A shares, 1.57% for Class B shares and 1.57% for Class C shares, multiplied by the average account value over the period, multiplied by 183/366 (to reflect the one-half year period). The Example assumes that the $1,000 was invested at the net asset value per share determined at the close of business on September 30, 2007.
20
Eaton Vance Limited Maturity Municipals Funds as of March 31, 2008
FUND EXPENSES CONT'D
Eaton Vance Ohio Limited Maturity Municipals Fund
| | | Beginning Account Value
(10/1/07) | | Ending Account Value
(3/31/08) | | Expenses Paid During Period*
(10/1/07 – 3/31/08) | |
| Actual | |
| Class A | | $ | 1,000.00 | | | $ | 999.30 | | | $ | 5.10 | | |
| Class B | | $ | 1,000.00 | | | $ | 995.50 | | | $ | 8.83 | | |
| Class C | | $ | 1,000.00 | | | $ | 995.50 | | | $ | 8.83 | | |
| Hypothetical | |
| (5% return per year before expenses) | |
| Class A | | $ | 1,000.00 | | | $ | 1,019.90 | | | $ | 5.15 | | |
| Class B | | $ | 1,000.00 | | | $ | 1,016.10 | | | $ | 8.92 | | |
| Class C | | $ | 1,000.00 | | | $ | 1,016.10 | | | $ | 8.92 | | |
* Expenses are equal to the Fund's annualized expense ratio of 1.02% for Class A shares, 1.77% for Class B shares and 1.77% for Class C shares, multiplied by the average account value over the period, multiplied by 183/366 (to reflect the one-half year period). The Example assumes that the $1,000 was invested at the net asset value per share determined at the close of business on September 30, 2007.
Eaton Vance Pennsylvania Limited Maturity Municipals Fund
| | | Beginning Account Value
(10/1/07) | | Ending Account Value
(3/31/08) | | Expenses Paid During Period*
(10/1/07 – 3/31/08) | |
| Actual | |
| Class A | | $ | 1,000.00 | | | $ | 995.60 | | | $ | 4.39 | | |
| Class B | | $ | 1,000.00 | | | $ | 991.90 | | | $ | 8.12 | | |
| Class C | | $ | 1,000.00 | | | $ | 991.70 | | | $ | 8.12 | | |
| Hypothetical | |
| (5% return per year before expenses) | |
| Class A | | $ | 1,000.00 | | | $ | 1,020.60 | | | $ | 4.45 | | |
| Class B | | $ | 1,000.00 | | | $ | 1,016.90 | | | $ | 8.22 | | |
| Class C | | $ | 1,000.00 | | | $ | 1,016.90 | | | $ | 8.22 | | |
* Expenses are equal to the Fund's annualized expense ratio of 0.88% for Class A shares, 1.63% for Class B shares and 1.63% for Class C shares, multiplied by the average account value over the period, multiplied by 183/366 (to reflect the one-half year period). The Example assumes that the $1,000 was invested at the net asset value per share determined at the close of business on September 30, 2007.
21
Eaton Vance California Limited Maturity Municipals Fund as of March 31, 2008
PORTFOLIO OF INVESTMENTS
Tax-Exempt Investments — 98.6% | | | |
Principal Amount
(000's omitted) | |
Security | |
Value | |
| Escrowed / Prerefunded — 3.0% | | | |
| $ | 250 | | | California Department of Water Resource Power Supply,
Prerefunded to 5/1/12, 5.125%, 5/1/18 | | $ | 274,627 | | |
| | 520 | | | California Statewide Communities Development Authority,
(San Gabriel Valley), Escrowed to Maturity,
5.50%, 9/1/14 | | | 566,134 | | |
| | 235 | | | Roseville Special Tax, Prerefunded to 9/1/09,
6.00%, 9/1/11 | | | 253,184 | | |
| | 55 | | | Santa Margarita Water District, Prerefunded to 9/1/09,
6.10%, 9/1/14 | | | 59,300 | | |
| | | | | | | $ | 1,153,245 | | |
| General Obligations — 3.9% | | | |
| $ | 400 | | | California, 5.25%, 2/1/14 | | $ | 428,744 | | |
| | 1,000 | | | California, 5.25%, 11/1/16 | | | 1,064,530 | | |
| | | | | | | $ | 1,493,274 | | |
| Health Care-Miscellaneous — 0.3% | | | |
| $ | 100 | | | Puerto Rico Infrastructure Financing Authority,
(Mepsi Campus Project), 6.25%, 10/1/24 | | $ | 97,148 | | |
| | | | | | | $ | 97,148 | | |
| Hospital — 6.3% | | | |
| $ | 500 | | | California Health Facilities Financing Authority,
(Cedars-Sinai Medical Center), 5.00%, 11/15/16 | | $ | 522,255 | | |
| | 1,000 | | | California Statewide Communities Development Authority,
(Huntington Memorial Hospital), 5.00%, 7/1/21 | | | 1,010,220 | | |
| | 200 | | | San Benito Health Care District, 5.375%, 10/1/12 | | | 202,014 | | |
| | 400 | | | Stockton Health Facilities Authority, (Dameron Hospital),
5.70%, 12/1/14 | | | 406,440 | | |
| | 300 | | | Torrance Hospital, (Torrance Memorial Medical Center),
5.40%, 6/1/15 | | | 312,639 | | |
| | | | | | | $ | 2,453,568 | | |
| Housing — 3.1% | | | |
| $ | 500 | | | California Department of Veterans Affairs,
Home Purchase Revenue, (AMT), 4.50%, 12/1/18 | | $ | 488,500 | | |
| | 750 | | | California Housing Finance Agency, (AMT),
4.75%, 8/1/21 | | | 721,620 | | |
| | | | | | | $ | 1,210,120 | | |
Principal Amount
(000's omitted) | |
Security | |
Value | |
| Industrial Development Revenue — 0.5% | | | |
| $ | 200 | | | California Pollution Control Financing Authority,
(Browning Ferris Industries), (AMT), 5.80%, 12/1/16 | | $ | 186,608 | | |
| | | | | | | $ | 186,608 | | |
| Insured-Education — 4.5% | | | |
| $ | 475 | | | California Educational Facilities Authority,
(San Diego University), (AMBAC), 0.00%, 10/1/15 | | $ | 346,584 | | |
| | 500 | | | California Educational Facilities Authority,
(Santa Clara University), (MBIA), 5.00%, 2/1/19 | | | 514,800 | | |
| | 1,000 | | | Santa Monica Community College District,
(FGIC), 0.00%, 8/1/12 | | | 861,610 | | |
| | | | | | | $ | 1,722,994 | | |
| Insured-Electric Utilities — 5.7% | | | |
| $ | 1,000 | | | California Pollution Control Financing Authority,
(San Diego Gas and Electric), (MBIA),
5.90%, 6/1/14(1) | | $ | 1,148,460 | | |
| | 500 | | | California Pollution Control Financing Authority,
Pollution Control Revenue, (Pacific Gas and Electric),
(MBIA), (AMT), 5.35%, 12/1/16 | | | 520,360 | | |
| | 500 | | | Puerto Rico Electric Power Authority, (MBIA),
5.50%, 7/1/18 | | | 548,845 | | |
| | | | | | | $ | 2,217,665 | | |
| Insured-Escrowed / Prerefunded — 0.6% | | | |
| $ | 210 | | | California University Foundation Revenue,
(Sacramento Auxiliary), (MBIA),
Prerefunded to 10/1/12, 5.50%, 10/1/20 | | $ | 233,816 | | |
| | | | | | | $ | 233,816 | | |
| Insured-General Obligations — 18.7% | | | |
| $ | 400 | | | Barstow Unified School District, (FGIC), 5.25%, 8/1/18 | | $ | 421,072 | | |
| | 1,000 | | | Burbank Unified School District, (FGIC), 0.00%, 8/1/12 | | | 859,410 | | |
| | 1,200 | | | Coachella Valley Unified School District, (2005 Election),
(FSA), 5.00%, 8/1/27 | | | 1,223,232 | | |
| | 1,080 | | | Fillmore Unified School District, (FGIC), 0.00%, 7/1/15 | | | 790,268 | | |
| | 760 | | | Fresno Unified School District, (MBIA), 5.80%, 2/1/16 | | | 822,426 | | |
| | 1,000 | | | Los Angeles Unified School District, (FSA), 5.00%, 7/1/20 | | | 1,063,120 | | |
| | 750 | | | Oakland Unified School District, Alameda County, (FGIC),
5.00%, 8/1/22 | | | 749,948 | | |
| | 1,000 | | | San Juan Unified School District, (FSA), 0.00%, 8/1/17 | | | 660,960 | | |
| | 705 | | | Ukiah Unified School District, (FGIC), 0.00%, 8/1/10 | | | 659,499 | | |
| | | | | | | $ | 7,249,935 | | |
See notes to financial statements
22
Eaton Vance California Limited Maturity Municipals Fund as of March 31, 2008
PORTFOLIO OF INVESTMENTS CONT'D
Principal Amount
(000's omitted) | |
Security | |
Value | |
| Insured-Hospital — 1.1% | | | |
| $ | 400 | | | California Statewide Communities Development Authority,
(Sutter Health), (FSA), 6.00%, 8/15/13 | | $ | 420,644 | | |
| | | | | | | $ | 420,644 | | |
Insured-Lease Revenue / Certificates of
Participation — 6.1% | | | |
| $ | 1,750 | | | Anaheim Public Financing Authority Lease Revenue,
(Public Improvements), (FSA), 0.00%, 9/1/19 | | $ | 1,014,860 | | |
| | 750 | | | California Public Works, (UCLA Replacement Hospital),
(FSA), 5.375%, 10/1/16 | | | 818,753 | | |
| | 505 | | | California State Public Works Board,
(Department of Corrections), (AMBAC), 5.25%, 12/1/13 | | | 535,275 | | |
| | | | | | | $ | 2,368,888 | | |
| Insured-Other Revenue — 2.4% | | | |
| $ | 1,000 | | | Golden State Tobacco Securitization Corp.,
(Tobacco Settlement Revenue), (FGIC), 5.00%, 6/1/35 | | $ | 947,360 | | |
| | | | | | | $ | 947,360 | | |
| Insured-Public Power / Electric Utilities — 2.6% | | | |
| $ | 1,000 | | | Los Angeles Department of Water and Power,
Waterworks Revenue, (AMBAC), 5.00%, 7/1/35 | | $ | 1,001,260 | | |
| | | | | | | $ | 1,001,260 | | |
| Insured-Special Tax Revenue — 5.7% | | | |
| $ | 1,000 | | | Garden Grove Community Development,
(Tax Allocation), (AMBAC), 5.25%, 10/1/16 | | $ | 1,083,640 | | |
| | 1,000 | | | San Mateo County Transportation District,
(MBIA), 5.25%, 6/1/17 | | | 1,114,500 | | |
| | | | | | | $ | 2,198,140 | | |
| Insured-Transportation — 13.0% | | | |
| $ | 1,500 | | | Port of Oakland, (MBIA), (AMT), 5.00%, 11/1/21 | | $ | 1,477,710 | | |
| | 500 | | | Puerto Rico Highway and Transportation Authority,
(FSA), 5.50%, 7/1/17 | | | 557,275 | | |
| | 1,000 | | | San Joaquin Hills Transportation Corridor Agency Bridge &
Toll Road, (MBIA), 0.00%, 1/15/12 | | | 872,940 | | |
| | 1,000 | | | San Jose Airport Revenue, (AMBAC), (AMT),
5.50%, 3/1/18 | | | 1,057,100 | | |
| | 1,000 | | | San Jose Airport Revenue,(FSA), (AMT),
5.00%, 3/1/11 | | | 1,045,660 | | |
| | | | | | | $ | 5,010,685 | | |
Principal Amount
(000's omitted) | |
Security | |
Value | |
| Insured-Water and Sewer — 3.9% | | | |
| $ | 1,000 | | | East Bay Municipal Utility District Water System,
(MBIA), 5.00%, 6/1/35 | | $ | 1,001,120 | | |
| | 500 | | | Sunnyvale Financing Authority Water and Wastewater,
(AMBAC), 5.00%, 10/1/22 | | | 511,895 | | |
| | | | | | | $ | 1,513,015 | | |
| Lease Revenue / Certificates of Participation — 2.8% | | | |
| $ | 1,000 | | | California Public Works, (University of California),
5.25%, 6/1/20 | | $ | 1,086,830 | | |
| | | | | | | $ | 1,086,830 | | |
| Senior Living / Life Care — 2.3% | | | |
| $ | 250 | | | ABAG Finance Authority, (American Baptist Homes),
5.75%, 10/1/17 | | $ | 252,175 | | |
| | 670 | | | California Statewide Communities Development Authority,
(Senior Living-Presbyterian Homes), 4.50%, 11/15/16 | | | 654,845 | | |
| | | | | | | $ | 907,020 | | |
| Solid Waste — 0.9% | | | |
| $ | 350 | | | Napa-Vallejo Waste Management Authority,
(Solid Waste Transfer Facilities), (AMT), 5.10%, 2/15/14 | | $ | 351,474 | | |
| | | | | | | $ | 351,474 | | |
| Special Tax Revenue — 6.5% | | | |
| $ | 300 | | | Alameda Public Financing Authority, 5.45%, 9/2/14 | | $ | 307,260 | | |
| | 205 | | | Brentwood Infrastructure Financing Authority,
4.625%, 9/2/18 | | | 186,425 | | |
| | 195 | | | Corona Public Financing Authority, 5.70%, 9/1/13 | | | 195,770 | | |
| | 100 | | | Eastern Municipal Water District, 4.80%, 9/1/20 | | | 93,168 | | |
| | 75 | | | Eastern Municipal Water District, 4.85%, 9/1/21 | | | 69,787 | | |
| | 200 | | | Fontana Redevelopment Agency, (Jurupa Hills),
5.50%, 10/1/17 | | | 208,502 | | |
| | 40 | | | Moreno Valley Unified School District,
(Community District No. 2003-2), 5.20%, 9/1/17 | | | 39,492 | | |
| | 80 | | | Moreno Valley Unified School District,
(Community District No. 2003-2), 5.25%, 9/1/18 | | | 77,778 | | |
| | 390 | | | Pomona Redevelopment Agency,
(West Holt Avenue Redevelopment), 5.50%, 5/1/13 | | | 413,158 | | |
| | 145 | | | Santa Margarita Water District, 6.10%, 9/1/14 | | | 150,875 | | |
| | 200 | | | Santaluz Community Facility District No. 2, 5.80%, 9/1/14 | | | 201,132 | | |
| | 100 | | | Temecula Valley Unified School District, 4.75%, 9/1/21 | | | 92,720 | | |
| | 200 | | | Torrance Redevelopment Agency, 5.50%, 9/1/12 | | | 204,848 | | |
| | 250 | | | Whittier Public Financing Authority,
(Greenleaf Ave. Whittier Redevelopment), 5.50%, 11/1/16 | | | 256,190 | | |
| | | | | | | $ | 2,497,105 | | |
See notes to financial statements
23
Eaton Vance California Limited Maturity Municipals Fund as of March 31, 2008
PORTFOLIO OF INVESTMENTS CONT'D
Principal Amount
(000's omitted) | |
Security | |
Value | |
| Transportation — 3.4% | | | |
| $ | 1,000 | | | Bay Area Toll Authority, Toll Bridge Revenue,
(San Francisco Bay Area), 5.00%, 4/1/31 | | $ | 1,003,270 | | |
| | 290 | | | Port Redwood City, (AMT), 5.40%, 6/1/19 | | | 293,167 | | |
| | | | | | | $ | 1,296,437 | | |
| Water and Sewer — 1.3% | | | |
| $ | 500 | | | Metropolitan Water District,
(Southern California Waterworks), 4.75%, 7/1/22 | | $ | 504,210 | | |
| | | | | | | $ | 504,210 | | |
Total Tax-Exempt Investments — 98.6%
(identified cost $37,591,260) | | $ | 38,121,441 | | |
| Other Assets, Less Liabilities — 1.4% | | $ | 549,665 | | |
| Net Assets — 100.0% | | $ | 38,671,106 | | |
AMBAC - AMBAC Financial Group, Inc.
AMT - Interest earned from these securities may be considered a tax preference item for purposes of the Federal Alternative Minimum Tax.
FGIC - Financial Guaranty Insurance Company
FSA - Financial Security Assurance, Inc.
MBIA - Municipal Bond Insurance Association
The Fund invests primarily in debt securities issued by California municipalities. The ability of the issuers of the debt securities to meet their obligations may be affected by economic developments in a specific industry or municipality. In order to reduce the risk associated with such economic developments, at March 31, 2008, 65.3% of total investments are backed by bond insurance of various financial institutions and financial guaranty assurance agencies. The aggregate percentage insured by an individual financial institution ranged from 11.9% to 21.7% of total investments.
(1) Security (or a portion thereof) has been segregated to cover margin requirements on open financial futures contracts.
See notes to financial statements
24
Eaton Vance Florida Plus Limited Maturity Municipals Fund as of March 31, 2008
PORTFOLIO OF INVESTMENTS
Tax-Exempt Investments — 98.7% | | | |
Principal Amount
(000's omitted) | |
Security | |
Value | |
| Education — 2.7% | | | |
| $ | 1,000 | | | Indiana University, IN, 5.00%, 8/1/20 | | $ | 1,065,070 | | |
| | | | | | | $ | 1,065,070 | | |
| Escrowed / Prerefunded — 1.4% | | | |
| $ | 250 | | | Lee County Industrial Development Authority,
(Shell Point Village), Prerefunded to 11/15/09,
5.50%, 11/15/21 | | $ | 265,840 | | |
| | 250 | | | Lee County Industrial Development Authority,
(Shell Point Village), Prerefunded to 11/15/09,
5.75%, 11/15/14 | | | 266,830 | | |
| | | | | | | $ | 532,670 | | |
| General Obligations — 5.4% | | | |
| $ | 1,000 | | | Houston, TX, Independent School District, (PSF),
5.00%, 2/15/20 | | $ | 1,057,860 | | |
| | 1,000 | | | Washington State, 5.00%, 1/1/20 | | | 1,065,050 | | |
| | | | | | | $ | 2,122,910 | | |
| Health Care-Miscellaneous — 0.2% | | | |
| $ | 100 | | | Puerto Rico Infrastructure Financing Authority,
(Mepsi Campus Project), 6.25%, 10/1/24 | | $ | 97,148 | | |
| | | | | | | $ | 97,148 | | |
| Hospital — 4.7% | | | |
| $ | 1,000 | | | Brevard County Health Facilities Authority, (Health First, Inc.),
5.00%, 4/1/18 | | $ | 1,016,480 | | |
| | 275 | | | Kent, MI, Hospital Finance Authority,
(Spectrum Health), 5.50%, 1/15/47(1) | | | 288,274 | | |
| | 500 | | | West Orange Healthcare District, 5.50%, 2/1/10 | | | 518,665 | | |
| | | | | | | $ | 1,823,419 | | |
| Housing — 4.0% | | | |
| $ | 620 | | | Capital Trust Agency, (Atlantic Housing Foundation),
4.50%, 7/1/15 | | $ | 584,530 | | |
| | 1,000 | | | Louisiana Housing Finance Agency, LA, Single Family, (AMT),
5.05%, 12/1/22 | | | 980,850 | | |
| | | | | | | $ | 1,565,380 | | |
| Industrial Development Revenue — 1.3% | | | |
| $ | 500 | | | Polk County Industrial Development Authority,
(Cargill Fertilizer), (AMT), 5.50%, 11/1/09 | | $ | 519,490 | | |
| | | | | | | $ | 519,490 | | |
Principal Amount
(000's omitted) | |
Security | |
Value | |
| Insured-Electric Utilities — 9.2% | | | |
| $ | 2,000 | | | Escambia County Utilities Authority, (FGIC),
0.00%, 1/1/15 | | $ | 1,500,760 | | |
| | 1,000 | | | Northern Minnesota Municipal Power Agency, MN, (AGC),
5.00%, 1/1/21(1) | | | 1,038,240 | | |
| | 1,000 | | | South Carolina Public Service Authority, SC, (FSA),
5.00%, 1/1/20 | | | 1,059,510 | | |
| | | | | | | $ | 3,598,510 | | |
| Insured-Escrowed / Prerefunded — 2.1% | | | |
| $ | 750 | | | Miami-Dade County Health Facilities Authority,
(Miami Children's Hospital), (AMBAC),
Prerefunded to 8/15/11, 5.625%, 8/15/16 | | $ | 826,957 | | |
| | | | | | | $ | 826,957 | | |
| Insured-General Obligations — 14.2% | | | |
| $ | 1,000 | | | Du Page County, IL, Community Unit School
District No. 200 Wheaton, (FSA), 5.00%, 10/1/20 | | $ | 1,058,280 | | |
| | 1,000 | | | Los Angeles, CA, Unified School District, (FSA),
5.00%, 7/1/20 | | | 1,063,120 | | |
| | 750 | | | Miami-Dade County, (Fire and Rescue Service District),
(AMBAC), 5.25%, 4/1/17 | | | 802,147 | | |
| | 825 | | | Monroe Township, NJ, Board of Education,
Middlesex County, (AGC), 4.75%, 3/1/20 | | | 864,055 | | |
| | 1,675 | | | Three Rivers, MI, Community Schools, (FSA),
5.00%, 5/1/23(2) | | | 1,739,471 | | |
| | | | | | | $ | 5,527,073 | | |
| Insured-Hospital — 4.2% | | | |
| $ | 1,000 | | | Saint Petersburg Health Facilities Authority,
(All Children's Hospital), (AMBAC), 5.50%, 11/15/17 | | $ | 1,087,480 | | |
| | 500 | | | Sarasota County Public Hospital, (MBIA), 5.25%, 7/1/18 | | | 537,935 | | |
| | | | | | | $ | 1,625,415 | | |
| Insured-Housing — 1.7% | | | |
| $ | 330 | | | Florida Housing Finance Authority,
(Leigh Meadows Apartments), (AMBAC), (AMT),
5.85%, 9/1/10 | | $ | 332,551 | | |
| | 315 | | | Florida Housing Finance Authority,
(Stottert Arms Apartments), (AMBAC), (AMT),
5.90%, 9/1/10 | | | 317,495 | | |
| | | | | | | $ | 650,046 | | |
See notes to financial statements
25
Eaton Vance Florida Plus Limited Maturity Municipals Fund as of March 31, 2008
PORTFOLIO OF INVESTMENTS CONT'D
Principal Amount
(000's omitted) | |
Security | |
Value | |
| Insured-Other Revenue — 2.6% | | | |
| $ | 500 | | | Louisiana Citizens Property, (AMBAC), 5.00%, 6/1/22 | | $ | 495,460 | | |
| | 500 | | | Saint Johns County Industrial Development Authority,
(Professional Golf Hall of Fame), (MBIA), 5.00%, 9/1/20 | | �� | 513,825 | | |
| | | | | | | $ | 1,009,285 | | |
| Insured-Special Tax Revenue — 11.7% | | | |
| $ | 1,755 | | | Julington Creek Plantation, Community Development District,
(MBIA), 4.75%, 5/1/19 | | $ | 1,779,219 | | |
| | 1,000 | | | Mesa, AZ, Street and Highway Revenue, (FSA),
5.00%, 7/1/20 | | | 1,080,420 | | |
| | 330 | | | Miami-Dade County, (MBIA), 0.00%, 10/1/08 | | | 326,476 | | |
| | 595 | | | St. Cloud Sales Tax, (FGIC), 5.00%, 9/1/18 | | | 609,952 | | |
| | 250 | | | St. Cloud Sales Tax, (FGIC), 5.00%, 9/1/19 | | | 254,838 | | |
| | 500 | | | Tamarac Sales Tax, (FGIC), 5.00%, 4/1/18 | | | 515,795 | | |
| | | | | | | $ | 4,566,700 | | |
| Insured-Transportation — 9.1% | | | |
| $ | 2,000 | | | Hillsborough County Aviation Authority, (AMBAC), (AMT),
5.25%, 10/1/18(3) | | $ | 2,058,040 | | |
| | 1,460 | | | Port Tacoma, WA, (FSA), 5.00%, 12/1/23 | | | 1,516,531 | | |
| | | | | | | $ | 3,574,571 | | |
| Insured-Water and Sewer — 8.9% | | | |
| $ | 750 | | | Hillsborough County Capacity Assessment, (FSA),
5.125%, 3/1/20 | | $ | 778,080 | | |
| | 1,000 | | | Sunrise Utilities Systems, (AMBAC), 5.20%, 10/1/22 | | | 1,062,630 | | |
| | 1,000 | | | Sunrise Utilities Systems, (AMBAC), 5.50%, 10/1/18 | | | 1,081,210 | | |
| | 500 | | | Tallahassee Consolidated Utility System, (FGIC),
5.50%, 10/1/19 | | | 558,565 | | |
| | | | | | | $ | 3,480,485 | | |
| Nursing Home — 0.6% | | | |
| $ | 235 | | | Orange County Health Facilities Authority,
(Westminster Community Care Services), 6.50%, 4/1/12 | | $ | 239,747 | | |
| | | | | | | $ | 239,747 | | |
Principal Amount
(000's omitted) | |
Security | |
Value | |
| Senior Living / Life Care — 1.4% | | | |
| $ | 595 | | | North Miami Health Care Facilities Authority,
(Imperial Club), 6.125%, 1/1/42 | | $ | 532,037 | | |
| | | | | | | $ | 532,037 | | |
| Special Tax Revenue — 10.3% | | | |
| $ | 475 | | | Arbor Greene Community Development District,
5.00%, 5/1/19 | | $ | 472,388 | | |
| | 325 | | | Concorde Estates Community Development District,
(Capital Improvements), 5.00%, 5/1/11 | | | 311,340 | | |
| | 90 | | | Covington Park Community Development District,
(Capital Improvements), 5.00%, 5/1/21 | | | 90,209 | | |
| | 175 | | | Dupree Lakes Community Development District,
5.00%, 11/1/10 | | | 168,940 | | |
| | 230 | | | Dupree Lakes Community Development District,
5.00%, 5/1/12 | | | 215,167 | | |
| | 130 | | | FishHawk Community Development District II,
5.125%, 11/1/09 | | | 127,791 | | |
| | 5 | | | Gateway Services Community Development District,
(Stoneybrook), 5.50%, 7/1/08 | | | 4,996 | | |
| | 65 | | | Heritage Harbor South Community Development District,
(Capital Improvements), 5.25%, 11/1/08 | | | 64,807 | | |
| | 60 | | | Longleaf Community Development District, 6.20%, 5/1/09 | | | 59,956 | | |
| | 170 | | | New River Community Development District,
(Capital Improvements), 5.00%, 5/1/13 | | | 155,485 | | |
| | 150 | | | North Springs Improvement District, (Heron Bay),
5.00%, 5/1/14 | | | 131,772 | | |
| | 315 | | | North Springs Improvement District, (Heron Bay),
7.00%, 5/1/19 | | | 315,375 | | |
| | 1,000 | | | Orlando Capital Improvements, 5.00%, 10/1/18 | | | 1,016,520 | | |
| | 100 | | | Poinciana West Community Development District,
5.875%, 5/1/22 | | | 90,477 | | |
| | 100 | | | Sterling Hill Community Development District,
(Capital Improvements), 5.10%, 5/1/11 | | | 95,004 | | |
| | 125 | | | Sterling Hill Community Development District,
(Capital Improvements), 5.50%, 11/1/10 | | | 124,150 | | |
| | 600 | | | Tison's Landing Community Development District,
(Capital Improvements), 5.00%, 11/1/11 | | | 561,876 | | |
| | 5 | | | Waterlefe Community Development District,
(Capital Improvements), 6.25%, 5/1/10 | | | 5,017 | | |
| | | | | | | $ | 4,011,270 | | |
See notes to financial statements
26
Eaton Vance Florida Plus Limited Maturity Municipals Fund as of March 31, 2008
PORTFOLIO OF INVESTMENTS CONT'D
Principal Amount
(000's omitted) | |
Security | |
Value | |
| Utilities — 3.0% | | | |
| $ | 240 | | | Orlando Utilities Commission Water and Electric,
5.00%, 10/1/18 | | $ | 248,441 | | |
| | 500 | | | Orlando Utilities Commission Water and Electric,
5.00%, 10/1/22 | | | 517,865 | | |
| | 405 | | | Orlando Utilities Commission Water and Electric,
5.25%, 10/1/20 | | | 426,198 | | |
| | | | | | | $ | 1,192,504 | | |
Total Tax-Exempt Investments — 98.7%
(identified cost $38,388,611) | | $ | 38,560,687 | | |
| Other Assets, Less Liabilities — 1.3% | | $ | 514,465 | | |
| Net Assets — 100.0% | | $ | 39,075,152 | | |
AGC - Assured Guaranty Corp.
AMBAC - AMBAC Financial Group, Inc.
AMT - Interest earned from these securities may be considered a tax preference item for purposes of the Federal Alternative Minimum Tax.
FGIC - Financial Guaranty Insurance Company
FSA - Financial Security Assurance, Inc.
MBIA - Municipal Bond Insurance Association
PSF - Permanent School Fund
At March 31, 2008, the concentration of the Fund's investments in the various states determined as a percentage of net assets, is as follows:
| Florida | | | 61.7 | % | |
|
| Others, representing less than 10% individually | | | 37.0 | % | |
|
The Fund invests primarily in debt securities issued by Florida and other state municipalities. The ability of the issuers of the debt securities to meet their obligations may be affected by economic developments in a specific industry or municipality. In order to reduce the risk associated with such economic developments, at March 31, 2008, 64.5% of total investments are backed by bond insurance of various financial institutions and financial guaranty assurance agencies. The aggregate percentage insured by an individual financial institution ranged from 4.9% to 21.5% of total investments.
(1) When-issued security.
(2) Security (or a portion thereof) has been segregated to cover margin requirements on open financial futures contracts.
(3) Security (or a portion thereof) has been segregated to cover payable for when-issued securities.
See notes to financial statements
27
Eaton Vance Massachusetts Limited Maturity Municipals Fund as of March 31, 2008
PORTFOLIO OF INVESTMENTS
Tax-Exempt Investments — 97.2% | | | |
Principal Amount
(000's omitted) | |
Security | |
Value | |
| Education — 15.0% | | | |
| $ | 1,000 | | | Massachusetts Development Finance Agency,
(Milton Academy), 5.00%, 9/1/19 | | $ | 1,068,260 | | |
| | 400 | | | Massachusetts Development Finance Agency,
(Xaverian Brothers High School), 5.55%, 7/1/19 | | | 404,996 | | |
| | 1,305 | | | Massachusetts Health and Educational Facilities Authority,
(Boston College), 5.25%, 6/1/20 | | | 1,385,714 | | |
| | 1,000 | | | Massachusetts Health and Educational Facilities Authority,
(Boston College), 5.375%, 6/1/14 | | | 1,113,400 | | |
| | 1,000 | | | Massachusetts Health and Educational Facilities Authority,
(Harvard University), 5.00%, 7/15/22 | | | 1,033,140 | | |
| | 1,000 | | | Massachusetts Health and Educational Facilities Authority,
(Massachusetts Institute of Technology), 5.375%, 7/1/17 | | | 1,136,430 | | |
| | 1,645 | | | Massachusetts Health and Educational Facilities Authority,
(Massachusetts Institute of Technology), 5.50%, 7/1/22 | | | 1,859,212 | | |
| | 750 | | | Massachusetts Health and Educational Facilities Authority,
(Tufts University), 5.50%, 8/15/15 | | | 852,067 | | |
| | 750 | | | Massachusetts Industrial Finance Agency,
(St. John's High School, Inc.), 5.70%, 6/1/18 | | | 759,367 | | |
| | | | | | | $ | 9,612,586 | | |
| Electric Utilities — 0.8% | | | |
| $ | 500 | | | Massachusetts Development Finance Agency,
(Devens Electric System), 5.75%, 12/1/20 | | $ | 519,850 | | |
| | | | | | | $ | 519,850 | | |
| Escrowed / Prerefunded — 12.9% | | | |
| $ | 1,000 | | | Boston, Prerefunded to 2/1/11, 5.00%, 2/1/18 | | $ | 1,066,840 | | |
| | 580 | | | Massachusetts Development Finance Agency,
(Massachusetts College of Pharmacy), Escrowed to Maturity,
5.00%, 7/1/11 | | | 622,618 | | |
| | 350 | | | Massachusetts Development Finance Agency,
(YMCA of Greater Boston), Prerefunded to 11/1/08,
5.25%, 11/1/13 | | | 363,734 | | |
| | 500 | | | Massachusetts Industrial Finance Agency,
(Belmont Hill School), Prerefunded to 9/1/08,
5.15%, 9/1/13 | | | 510,665 | | |
| | 465 | | | Massachusetts Industrial Finance Agency, (Forge Hill), (AMT),
Prerefunded to 4/1/08, 6.75%, 4/1/30 | | | 474,300 | | |
| | 500 | | | Massachusetts Industrial Finance Agency,
(Wentworth Institute of Technology),
Prerefunded to 10/1/08, 5.55%, 10/1/13 | | | 519,265 | | |
| | 1,200 | | | Massachusetts Turnpike Authority, Escrowed to Maturity,
5.00%, 1/1/13 | | | 1,263,252 | | |
| | 2,100 | | | Massachusetts Turnpike Authority, Escrowed to Maturity,
5.00%, 1/1/20 | | | 2,254,413 | | |
Principal Amount
(000's omitted) | |
Security | |
Value | |
| Escrowed / Prerefunded (continued) | | | |
| $ | 680 | | | Massachusetts Water Pollution Abatement Trust,
Escrowed to Maturity, 5.25%, 8/1/14 | | $ | 736,875 | | |
| | 400 | | | Rail Connections, Inc., (Route 128 Parking Garage),
Escrowed to Maturity, 5.30%, 7/1/09 | | | 417,700 | | |
| | | | | | | $ | 8,229,662 | | |
| General Obligations — 8.6% | | | |
| $ | 500 | | | Burlington, 5.00%, 2/1/15 | | $ | 551,375 | | |
| | 500 | | | Burlington, 5.00%, 2/1/16 | | | 553,610 | | |
| | 750 | | | Falmouth, 5.25%, 2/1/16 | | | 812,992 | | |
| | 1,000 | | | Manchester Essex Regional School District, 5.00%, 1/15/20 | | | 1,083,660 | | |
| | 1,100 | | | Wellesley, 5.00%, 6/1/16 | | | 1,225,950 | | |
| | 1,150 | | | Wellesley, 5.00%, 6/1/17 | | | 1,282,112 | | |
| | | | | | | $ | 5,509,699 | | |
| Health Care-Miscellaneous — 0.7% | | | |
| $ | 165 | | | Massachusetts Development Finance Agency,
(MCHSP Human Services), 6.60%, 8/15/29 | | $ | 151,165 | | |
| | 75 | | | Massachusetts Development Finance Agency,
(New England Center for Children), 5.30%, 11/1/08 | | | 74,957 | | |
| | 100 | | | Puerto Rico Infrastructure Financing Authority,
(Mepsi Campus Project), 5.60%, 10/1/14 | | | 99,812 | | |
| | 100 | | | Puerto Rico Infrastructure Financing Authority,
(Mepsi Campus Project), 6.25%, 10/1/24 | | | 97,148 | | |
| | | | | | | $ | 423,082 | | |
| Hospital — 6.2% | | | |
| $ | 600 | | | Massachusetts Health and Educational Facilities Authority,
(Baystate Medical Center), 5.75%, 7/1/14 | | $ | 638,814 | | |
| | 865 | | | Massachusetts Health and Educational Facilities Authority,
(Baystate Medical Center), 5.75%, 7/1/15 | | | 915,421 | | |
| | 345 | | | Massachusetts Health and Educational Facilities Authority,
(Central New England Health Systems), 6.125%, 8/1/13 | | | 345,562 | | |
| | 250 | | | Massachusetts Health and Educational Facilities Authority,
(Partners Healthcare System), 5.00%, 7/1/09 | | | 257,293 | | |
| | 750 | | | Massachusetts Health and Educational Facilities Authority,
(Partners Healthcare System), 5.00%, 7/1/18 | | | 797,025 | | |
| | 1,000 | | | Massachusetts Health and Educational Facilities Authority,
(Partners Healthcare System), 5.50%, 7/1/10 | | | 1,058,210 | | |
| | | | | | | $ | 4,012,325 | | |
| Industrial Development Revenue — 2.6% | | | |
| $ | 1,000 | | | Massachusetts Development Finance Agency,
(Waste Management, Inc.), 6.90%, 12/1/29 | | $ | 1,044,950 | | |
See notes to financial statements
28
Eaton Vance Massachusetts Limited Maturity Municipals Fund as of March 31, 2008
PORTFOLIO OF INVESTMENTS CONT'D
Principal Amount
(000's omitted) | |
Security | |
Value | |
| Industrial Development Revenue (continued) | | | |
| $ | 745 | | | Virgin Islands Public Financing Authority, (HOVENSA LLC),
(AMT), 4.70%, 7/1/22 | | $ | 634,591 | | |
| | | | | | | $ | 1,679,541 | | |
| Insured-Education — 4.7% | | | |
| $ | 1,785 | | | Massachusetts Development Finance Agency,
(Simmons College), (XLCA), 5.25%, 10/1/21 | | $ | 1,895,545 | | |
| | 1,000 | | | University of Massachusetts Building Authority, (AMBAC),
5.25%, 11/1/13(1) | | | 1,094,390 | | |
| | | | | | | $ | 2,989,935 | | |
| Insured-Electric Utilities — 6.8% | | | |
| $ | 1,000 | | | Massachusetts Power Supply System,
(Municipal Wholesale Electric Co.), (MBIA),
5.25%, 7/1/12 | | $ | 1,078,740 | | |
| | 1,000 | | | Massachusetts Power Supply System,
(Municipal Wholesale Electric Co.), (MBIA),
5.25%, 7/1/13 | | | 1,068,810 | | |
| | 2,000 | | | Puerto Rico Electric Power Authority, (MBIA),
5.50%, 7/1/18 | | | 2,195,380 | | |
| | | | | | | $ | 4,342,930 | | |
| Insured-Escrowed / Prerefunded — 4.1% | | | |
| $ | 1,000 | | | Boston, (MBIA), Prerefunded to 2/1/12, 5.00%, 2/1/19 | | $ | 1,077,970 | | |
| | 635 | | | Massachusetts Turnpike Authority, (FGIC),
Escrowed to Maturity, 5.125%, 1/1/23 | | | 670,160 | | |
| | 850 | | | Route 3 North Transportation Improvements Association,
(MBIA), Prerefunded to 6/15/10, 5.625%, 6/15/21 | | | 910,027 | | |
| | | | | | | $ | 2,658,157 | | |
| Insured-General Obligations — 7.3% | | | |
| $ | 3,105 | | | Boston, (MBIA), 0.125%, 3/1/22 | | $ | 1,672,664 | | |
| | 780 | | | Groton-Dunstable Regional School District, (FSA),
5.00%, 10/15/17 | | | 836,784 | | |
| | 1,000 | | | Massachusetts, (AMBAC), 5.00%, 7/1/12 | | | 1,084,610 | | |
| | 1,000 | | | Massachusetts, (MBIA), 5.25%, 8/1/22 | | | 1,086,260 | | |
| | | | | | | $ | 4,680,318 | | |
| Insured-Hospital — 1.7% | | | |
| $ | 1,000 | | | Massachusetts Health and Educational Facilities Authority,
(Tufts-New England Medical Center), (FGIC),
5.375%, 5/15/15 | | $ | 1,096,700 | | |
| | | | | | | $ | 1,096,700 | | |
Principal Amount
(000's omitted) | |
Security | |
Value | |
| Insured-Pooled Loans — 1.6% | | | |
| $ | 1,100 | | | Massachusetts Educational Financing Authority, (AMBAC),
4.60%, 1/1/22 | | $ | 1,026,630 | | |
| | | | | | | $ | 1,026,630 | | |
| Insured-Solid Waste — 3.4% | | | |
| $ | 1,000 | | | Massachusetts Development Finance Agency,
(SEMASS System), (MBIA), 5.625%, 1/1/13 | | $ | 1,087,210 | | |
| | 1,000 | | | Massachusetts Development Finance Agency,
(SEMASS System), (MBIA), 5.625%, 1/1/16 | | | 1,083,530 | | |
| | | | | | | $ | 2,170,740 | | |
| Insured-Special Tax Revenue — 2.8% | | | |
| $ | 1,600 | | | Massachusetts Special Obligations,
(FSA), 5.50%, 6/1/21 | | $ | 1,797,584 | | |
| | | | | | | $ | 1,797,584 | | |
| Insured-Transportation — 5.3% | | | |
| $ | 500 | | | Massachusetts Port Authority, (Delta Airlines),
(AMBAC), (AMT), 5.50%, 1/1/15 | | $ | 503,655 | | |
| | 1,225 | | | Massachusetts Port Authority, (FSA), 5.125%, 7/1/17 | | | 1,288,394 | | |
| | 1,000 | | | Puerto Rico Highway and Transportation Authority,
(FSA), 5.50%, 7/1/11 | | | 1,075,850 | | |
| | 500 | | | Puerto Rico Highway and Transportation Authority, (FSA),
5.50%, 7/1/17 | | | 557,275 | | |
| | | | | | | $ | 3,425,174 | | |
| Miscellaneous — 1.6% | | | |
| $ | 1,000 | | | Massachusetts Development Finance Agency,
(Jewish Philanthropies), 5.25%, 2/1/22 | | $ | 1,047,420 | | |
| | | | | | | $ | 1,047,420 | | |
| Senior Living / Life Care — 2.2% | | | |
| $ | 600 | | | Massachusetts Development Finance Agency,
(Berkshire Retirement), 5.60%, 7/1/19 | | $ | 602,592 | | |
| | 600 | | | Massachusetts Development Finance Agency,
(Linden Ponds, Inc.), 5.50%, 11/15/22 | | | 535,800 | | |
| | 300 | | | Massachusetts Development Finance Agency,
(Volunteers of America), 5.00%, 11/1/17 | | | 276,609 | | |
| | | | | | | $ | 1,415,001 | | |
| Solid Waste — 1.6% | | | |
| $ | 1,000 | | | Massachusetts Industrial Finance Agency,
(Ogden Haverhill), (AMT), 5.50%, 12/1/13 | | $ | 1,005,400 | | |
| | | | | | | $ | 1,005,400 | | |
See notes to financial statements
29
Eaton Vance Massachusetts Limited Maturity Municipals Fund as of March 31, 2008
PORTFOLIO OF INVESTMENTS CONT'D
Principal Amount
(000's omitted) | |
Security | |
Value | |
| Special Tax Revenue — 2.6% | | | |
| $ | 1,000 | | | Massachusetts Bay Transportation Authority,
Sales Tax, 5.25%, 7/1/16 | | $ | 1,116,060 | | |
| | 500 | | | Massachusetts Special Obligations, 5.00%, 6/1/14 | | | 546,325 | | |
| | | | | | | $ | 1,662,385 | | |
| Transportation — 3.9% | | | |
| $ | 1,000 | | | Massachusetts Port Authority, (AMT), 6.25%, 7/1/17 | | $ | 1,044,150 | | |
| | 2,000 | | | Massachusetts State Federal Highway Grant
Anticipation Notes, 0.00%, 6/15/15 | | | 1,487,100 | | |
| | | | | | | $ | 2,531,250 | | |
| Water and Sewer — 0.8% | | | |
| $ | 500 | | | Massachusetts Water Pollution Abatement Trust,
5.25%, 2/1/12 | | $ | 538,325 | | |
| | | | | | | $ | 538,325 | | |
Total Tax-Exempt Investments
(identified cost $60,609,453) | | $ | 62,374,694 | | |
| Short-Term Investments — 1.6% | | | |
Principal Amount
(000's omitted) | | Description | | Value | |
| $ | 1,000 | | | Massachusetts Development Finance Agency, (Wentworth
Institute), (AMBAC), (SPA: State Street Bank and Trust Co.)
Variable Rate, 6.25%, 10/1/30(2) | | $ | 1,000,000 | | |
Total Short-Term Investments
(identified cost $1,000,000) | | $ | 1,000,000 | | |
Total Investments — 98.8%
(identified cost $61,609,453) | | $ | 63,374,694 | | |
| Other Assets, Less Liabilities — 1.2% | | $ | 762,097 | | |
| Net Assets — 100.0% | | $ | 64,136,791 | | |
AMBAC - AMBAC Financial Group, Inc.
AMT - Interest earned from these securities may be considered a tax preference item for purposes of the Federal Alternative Minimum Tax.
FGIC - Financial Guaranty Insurance Company
FSA - Financial Security Assurance, Inc.
MBIA - Municipal Bond Insurance Association
SPA - Standby Bond Purchase Agreement
XLCA - XL Capital Assurance, Inc.
The Fund invests primarily in debt securities issued by Massachusetts municipalities. The ability of the issuers of the debt securities to meet their obligations may be affected by economic developments in a specific industry or municipality. In order to reduce the risk associated with such economic developments, at March 31, 2008, 39.7% of total investments are backed by bond insurance of various financial institutions and financial guaranty assurance agencies. The aggregate percentage insured by an individual financial institution ranged from 2.8% to 17.8% of total investments.
(1) Security (or a portion thereof) has been segregated to cover margin requirements on open financial futures contracts.
(2) Variable rate demand obligation. The stated interest rate represents the rate in effect at March 31, 2008.
See notes to financial statements
30
Eaton Vance New Jersey Limited Maturity Municipals Fund as of March 31, 2008
PORTFOLIO OF INVESTMENTS
Tax-Exempt Investments — 97.5% | | | |
Principal Amount
(000's omitted) | |
Security | |
Value | |
| Electric Utilities — 1.0% | | | |
| $ | 420 | | | New Jersey Economic Development Authority,
Pollution Control Revenue, (PSEG Power), 5.00%, 3/1/12 | | $ | 427,522 | | |
| | | | | | | $ | 427,522 | | |
| Escrowed / Prerefunded — 12.6% | | | |
| $ | 350 | | | New Jersey Economic Development Authority,
(Kapkowski Road Landfill), Prerefunded to 5/15/14,
6.375%, 4/1/18 | | $ | 406,889 | | |
| | 2,030 | | | New Jersey Economic Development Authority,
(Principal Custodial Receipts), Escrowed to Maturity,
0.00%, 12/15/12 | | | 1,753,331 | | |
| | 300 | | | New Jersey Economic Development Authority,
(The Seeing Eye, Inc.), Prerefunded to 12/1/09,
6.20%, 12/1/24 | | | 324,636 | | |
| | 600 | | | New Jersey Educational Facilities Authority,
(Higher Education Capital Improvements),
Prerefunded to 9/1/10, 5.00%, 9/1/15 | | | 637,392 | | |
| | 750 | | | New Jersey Educational Facilities Authority,
(Stevens Institute of Technology), Escrowed to Maturity,
5.00%, 7/1/11 | | | 804,390 | | |
| | 1,420 | | | Puerto Rico Public Improvements, Prerefunded to 7/1/16,
5.00%, 7/1/35 | | | 1,575,178 | | |
| | | | | | | $ | 5,501,816 | | |
| General Obligations — 3.6% | | | |
| $ | 500 | | | Jersey City School District, 6.25%, 10/1/10 | | $ | 544,470 | | |
| | 1,050 | | | Puerto Rico, 0.00%, 7/1/08 | | | 1,043,742 | | |
| | | | | | | $ | 1,588,212 | | |
| Health Care-Miscellaneous — 0.2% | | | |
| $ | 100 | | | Puerto Rico Infrastructure Financing Authority,
(Mepsi Campus Project), 6.25%, 10/1/24 | | $ | 97,148 | | |
| | | | | | | $ | 97,148 | | |
| Hospital — 7.9% | | | |
| $ | 1,000 | | | Camden County Improvement Authority,
(Cooper Health System), 5.25%, 2/15/20 | | $ | 986,910 | | |
| | 500 | | | New Jersey Health Care Facilities Financing Authority,
(Atlantic City Medical Care Center), 6.00%, 7/1/12 | | | 539,665 | | |
| | 425 | | | New Jersey Health Care Facilities Financing Authority,
(Capital Health System), 5.75%, 7/1/23 | | | 431,485 | | |
| | 450 | | | New Jersey Health Care Facilities Financing Authority,
(Hackensack University Medical Center), 6.125%, 1/1/20 | | | 463,689 | | |
Principal Amount
(000's omitted) | |
Security | |
Value | |
| Hospital (continued) | | | |
| $ | 500 | | | New Jersey Health Care Facilities Financing Authority,
(Hunterdon Medical Center), 5.25%, 7/1/25 | | $ | 506,975 | | |
| | 500 | | | New Jersey Health Care Facilities Financing Authority,
(Robert Wood Johnson University Hospital), 5.60%, 7/1/15 | | | 516,580 | | |
| | | | | | | $ | 3,445,304 | | |
| Industrial Development Revenue — 1.6% | | | |
| $ | 350 | | | New Jersey Economic Development Authority,
(American Airlines), (AMT), 7.10%, 11/1/31 | | $ | 283,755 | | |
| | 450 | | | New Jersey Economic Development Authority,
(Continental Airlines), (AMT), 6.25%, 9/15/19 | | | 414,540 | | |
| | | | | | | $ | 698,295 | | |
| Insured-Education — 5.5% | | | |
| $ | 545 | | | New Jersey Educational Facilities Authority,
(Montclair State University), (MBIA), 3.75%, 7/1/24 | | $ | 476,586 | | |
| | 1,000 | | | New Jersey Educational Facilities Authority,
(Ramapo College), (AMBAC), 4.50%, 7/1/21 | | | 998,950 | | |
| | 900 | | | New Jersey Educational Facilities Authority,
(Ramapo College), (AMBAC), 4.60%, 7/1/14 | | | 929,277 | | |
| | | | | | | $ | 2,404,813 | | |
| Insured-Electric Utilities — 1.5% | | | |
| $ | 560 | | | Cape May County Industrial Pollution Control
Financing Authority, (Atlantic City Electric Co.), (MBIA),
6.80%, 3/1/21 | | $ | 663,998 | | |
| | | | | | | $ | 663,998 | | |
| Insured-Escrowed / Prerefunded — 3.4% | | | |
| $ | 1,300 | | | New Jersey Health Care Facilities Financing Authority,
(AHS Hospital Corp.), (AMBAC), Escrowed to Maturity,
6.00%, 7/1/12(1) | | $ | 1,463,579 | | |
| | | | | | | $ | 1,463,579 | | |
| Insured-General Obligations — 20.5% | | | |
| $ | 330 | | | Clearview Regional High School District, (FGIC),
5.375%, 8/1/15 | | $ | 358,552 | | |
| | 750 | | | Freehold Regional High School District, (FGIC),
5.00%, 3/1/18 | | | 808,012 | | |
| | 720 | | | Hillsborough Township School District, (FSA),
5.375%, 10/1/18 | | | 813,967 | | |
| | 1,000 | | | Jackson Township School District, (Baptist Healthcare
Systems), (MBIA), 5.25%, 6/15/23 | | | 1,080,730 | | |
| | 1,320 | | | Manalapan-Englishtown Regional Board of Education,
(FGIC), 5.50%, 12/1/18 | | | 1,482,188 | | |
See notes to financial statements
31
Eaton Vance New Jersey Limited Maturity Municipals Fund as of March 31, 2008
PORTFOLIO OF INVESTMENTS CONT'D
Principal Amount
(000's omitted) | |
Security | |
Value | |
| Insured-General Obligations (continued) | | | |
| $ | 725 | | | Monroe Township Board of Education, (FGIC),
5.20%, 8/1/11 | | $ | 776,301 | | |
| | 825 | | | Monroe Township Board of Education, (FGIC),
5.20%, 8/1/14 | | | 902,789 | | |
| | 875 | | | Monroe Township Board of Education, Middlesex County,
(AGC), 4.75%, 3/1/21 | | | 906,343 | | |
| | 1,620 | | | New Jersey, (AMBAC), 5.25%, 7/15/19 | | | 1,791,380 | | |
| | | | | | | $ | 8,920,262 | | |
Insured-Lease Revenue / Certificates of
Participation — 3.9% | | | |
| $ | 1,000 | | | Hudson County, (MBIA), 6.25%, 6/1/15 | | $ | 1,170,640 | | |
| | 500 | | | Puerto Rico Public Finance Corp., (AMBAC),
5.375%, 6/1/17 | | | 536,845 | | |
| | | | | | | $ | 1,707,485 | | |
| Insured-Transportation — 6.1% | | | |
| $ | 500 | | | Delaware River Port Authority, (FSA), 5.50%, 1/1/10 | | $ | 527,180 | | |
| | 1,000 | | | New Jersey Transportation Trust Fund Authority, (MBIA),
5.50%, 12/15/17 | | | 1,132,690 | | |
| | 770 | | | Port Authority of New York and New Jersey, (FGIC), (AMT),
4.50%, 10/1/20 | | | 745,799 | | |
| | 250 | | | South Jersey Transportation Authority, (AMBAC),
5.00%, 11/1/18 | | | 254,998 | | |
| | | | | | | $ | 2,660,667 | | |
| Insured-Water and Sewer — 11.1% | | | |
| $ | 1,135 | | | Bayonne Municipal Utilities Authority, (XLCA),
5.25%, 4/1/19 | | $ | 1,176,337 | | |
| | 1,000 | | | North Hudson Sewer Authority, (MBIA),
5.125%, 8/1/22 | | | 1,068,710 | | |
| | 1,270 | | | Passaic Valley Water Commission, (FSA),
5.00%, 12/15/17 | | | 1,403,744 | | |
| | 565 | | | Pennsville Sewer Authority, (MBIA), 0.00%, 11/1/16 | | | 411,071 | | |
| | 565 | | | Pennsville Sewer Authority, (MBIA), 0.00%, 11/1/17 | | | 391,969 | | |
| | 565 | | | Pennsville Sewer Authority, (MBIA), 0.00%, 11/1/18 | | | 374,058 | | |
| | | | | | | $ | 4,825,889 | | |
| Lease Revenue / Certificates of Participation — 5.3% | | | |
| $ | 1,100 | | | Bergen County Improvement Authority,
(County Administration Complex), 5.00%, 11/15/24 | | $ | 1,167,815 | | |
| | 1,000 | | | New Jersey Economic Development Authority,
(School Facilities Construction), 5.50%, 9/1/19 | | | 1,123,380 | | |
| | | | | | | $ | 2,291,195 | | |
Principal Amount
(000's omitted) | |
Security | |
Value | |
| Nursing Home — 1.2% | | | |
| $ | 500 | | | New Jersey Economic Development Authority,
(Masonic Charity Foundation), 4.80%, 6/1/11 | | $ | 519,760 | | |
| | | | | | | $ | 519,760 | | |
| Pooled Loans — 2.5% | | | |
| $ | 1,000 | | | New Jersey Economic Environmental Infrastructure Trust,
5.00%, 9/1/20 | | $ | 1,094,310 | | |
| | | | | | | $ | 1,094,310 | | |
| Senior Living / Life Care — 2.3% | | | |
| $ | 300 | | | New Jersey Economic Development Authority,
(Fellowship Village), 5.50%, 1/1/18 | | $ | 300,963 | | |
| | 300 | | | New Jersey Economic Development Authority,
(Fellowship Village), 5.50%, 1/1/25 | | | 290,409 | | |
| | 400 | | | New Jersey Economic Development Authority,
(Seabrook Village, Inc.), 5.00%, 11/15/12 | | | 396,000 | | |
| | | | | | | $ | 987,372 | | |
| Special Tax Revenue — 3.2% | | | |
| $ | 1,000 | | | New Jersey Economic Development Authority,
(Cigarette Tax), 5.50%, 6/15/16 | | $ | 1,017,070 | | |
| | 180 | | | New Jersey Economic Development Authority,
(Newark Downtown Distribution Management Corp.),
4.625%, 6/15/12 | | | 183,571 | | |
| | 190 | | | New Jersey Economic Development Authority,
(Newark Downtown Distribution Management Corp.),
4.625%, 6/15/13 | | | 193,329 | | |
| | | | | | | $ | 1,393,970 | | |
| Transportation — 4.1% | | | |
| $ | 1,000 | | | New Jersey Transportation Trust Fund Authority,
5.25%, 12/15/21 | | $ | 1,074,970 | | |
| | 700 | | | Port Authority of New York and New Jersey, (AMT),
5.50%, 7/15/12 | | | 712,397 | | |
| | | | | | | $ | 1,787,367 | | |
Total Tax-Exempt Investments — 97.5%
(identified cost $41,296,149) | | $ | 42,478,964 | | |
| Other Assets, Less Liabilities — 2.5% | | $ | 1,078,743 | | |
| Net Assets — 100.0% | | $ | 43,557,707 | | |
See notes to financial statements
32
Eaton Vance New Jersey Limited Maturity Municipals Fund as of March 31, 2008
PORTFOLIO OF INVESTMENTS CONT'D
AGC - Assured Guaranty Corp.
AMBAC - AMBAC Financial Group, Inc.
AMT - Interest earned from these securities may be considered a tax preference item for purposes of the Federal Alternative Minimum Tax.
FGIC - Financial Guaranty Insurance Company
FSA - Financial Security Assurance, Inc.
MBIA - Municipal Bond Insurance Association
XLCA - XL Capital Assurance, Inc.
The Fund invests primarily in debt securities issued by New Jersey municipalities. The ability of the issuers of the debt securities to meet their obligations may be affected by economic developments in a specific industry or municipality. In order to reduce the risk associated with such economic developments, at March 31, 2008, 53.3% of total investments are backed by bond insurance of various financial institutions and financial guaranty assurance agencies. The aggregate percentage insured by an individual financial institution ranged from 2.1% to 15.9% of total investments.
(1) Security (or a portion thereof) has been segregated to cover margin requirements on open financial futures contracts.
See notes to financial statements
33
Eaton Vance New York Limited Maturity Municipals Fund as of March 31, 2008
PORTFOLIO OF INVESTMENTS
| Tax-Exempt Investments — 98.4% | | | |
Principal Amount
(000's omitted) | |
Security | |
Value | |
| Cogeneration — 0.5% | | | |
| $ | 600 | | | Suffolk County Industrial Development Agency, (Nissequogue
Cogeneration Partners Facility), (AMT), 5.50%, 1/1/23 | | $ | 530,916 | | |
| | | | | | | $ | 530,916 | | |
| Education — 1.5% | | | |
| $ | 600 | | | New York Dormitory Authority, (State University Educational
Facilities), 5.25%, 5/15/15 | | $ | 657,342 | | |
| | 105 | | | New York Dormitory Authority, (State University Educational
Facilities), 5.25%, 5/15/19 | | | 115,506 | | |
| | 625 | | | Troy Industrial Development Authority, (Rensselaer Polytechnic
Institute), 5.50%, 9/1/15 | | | 683,481 | | |
| | | | | | | $ | 1,456,329 | | |
| Electric Utilities — 2.6% | | | |
| $ | 2,500 | | | New York Energy Research and Development Authority Facility,
(AMT), 4.70%, 6/1/36 | | $ | 2,501,825 | | |
| | | | | | | $ | 2,501,825 | | |
| Escrowed / Prerefunded — 5.7% | | | |
| $ | 350 | | | New York City Transitional Finance Authority, (Future Tax),
Prerefunded to 5/1/08, 5.00%, 5/1/16 | | $ | 354,466 | | |
| | 85 | | | New York City Transitional Finance Authority, (Future Tax),
Prerefunded to 5/15/08, 4.75%, 11/15/23 | | | 86,168 | | |
| | 1,000 | | | New York Dormitory Authority, (Child Care Facility),
Prerefunded to 4/1/12, 5.375%, 4/1/14 | | | 1,095,020 | | |
| | 70 | | | New York Urban Development Corp., (Correctional and
Youth Facilities), Prerefunded to 1/1/11, 5.50%, 1/1/17 | | | 75,613 | | |
| | 475 | | | Suffolk County Industrial Development Agency, (Jefferson's
Ferry Project), Prerefunded to 11/1/09, 7.20%, 11/1/19 | | | 516,434 | | |
| | 1,170 | | | Triborough Bridge and Tunnel Authority, Escrowed to Maturity,
5.00%, 1/1/20 | | | 1,239,194 | | |
| | 1,000 | | | Triborough Bridge and Tunnel Authority, Prerefunded to
7/1/09, 5.25%, 1/1/17 | | | 1,048,400 | | |
| | 1,000 | | | Triborough Bridge and Tunnel Authority, Prerefunded to
1/1/16, 5.375%, 1/1/19 | | | 1,129,510 | | |
| | | | | | | $ | 5,544,805 | | |
| General Obligations — 4.4% | | | |
| $ | 1,200 | | | New York City, 5.00%, 3/1/19 | | $ | 1,250,268 | | |
| | 1,000 | | | New York City, 5.00%, 6/1/22 | | | 1,021,670 | | |
| | 1,000 | | | New York City, Series F, 0.00%, 8/1/08 | | | 993,010 | | |
| | 1,000 | | | New York City, Series G, 0.00%, 8/1/08 | | | 993,010 | | |
| | | | | | | $ | 4,257,958 | | |
Principal Amount
(000's omitted) | |
Security | |
Value | |
| Health Care-Miscellaneous — 0.9% | | | |
| $ | 100 | | | Puerto Rico Infrastructure Financing Authority,(Mepsi Campus
Project), 5.60%, 10/1/14 | | $ | 99,812 | | |
| | 200 | | | Puerto Rico Infrastructure Financing Authority, (Mepsi Campus
Project), 6.25%, 10/1/24 | | | 194,296 | | |
| | 175 | | | Suffolk County Industrial Development Agency, (Alliance of
Long Island Agencies), 7.50%, 9/1/15 | | | 180,495 | | |
| | 400 | | | Westchester County Industrial Development Agency,
(Children's Village), 5.375%, 3/15/19 | | | 380,616 | | |
| | | | | | | $ | 855,219 | | |
| Hospital — 8.5% | | | |
| $ | 400 | | | Chautauqua County Industrial Development Agency,
(Women's Christian Association), 6.35%, 11/15/17 | | $ | 404,064 | | |
| | 250 | | | Fulton County Industrial Development Agency, (Nathan
Littauer Hospital), 5.75%, 11/1/09 | | | 251,805 | | |
| | 390 | | | Nassau County Industrial Development Agency, (North Shore
Health System), 5.625%, 11/1/10 | | | 402,145 | | |
| | 595 | | | Nassau County Industrial Development Agency, (North Shore
Health System), 5.875%, 11/1/11 | | | 621,668 | | |
| | 2,000 | | | New York Dormitory Authority, (Interfaith Medical Center),
5.00%, 2/15/21 | | | 2,094,600 | | |
| | 1,000 | | | New York Dormitory Authority, (Lenox Hill Hospital),
5.75%, 7/1/13 | | | 1,033,910 | | |
| | 200 | | | New York Dormitory Authority, (Lenox Hill Hospital),
5.75%, 7/1/15 | | | 205,546 | | |
| | 500 | | | New York Dormitory Authority, (Lenox Hill Hospital),
5.75%, 7/1/17 | | | 507,180 | | |
| | 415 | | | New York Dormitory Authority, (NYU Hospital Center),
5.25%, 7/1/24 | | | 395,765 | | |
| | 265 | | | Oneida County Industrial Development Agency,
(St. Elizabeth Medical Center), 5.50%, 12/1/10 | | | 265,270 | | |
| | 1,325 | | | Saratoga County Industrial Development Agency,
(Saratoga Hospital Project), 5.00%, 12/1/17 | | | 1,346,240 | | |
| | 750 | | | Suffolk County Industrial Development Agency, (Huntington
Hospital), 6.00%, 11/1/22 | | | 772,305 | | |
| | | | | | | $ | 8,300,498 | | |
| Housing — 3.3% | | | |
| $ | 1,000 | | | New York Housing Finance Agency, (Affordable Housing),
(AMT), 5.05%, 11/1/22 | | $ | 985,050 | | |
| | 2,000 | | | New York State Mortgage Agency, (AMT), 4.95%, 10/1/21 | | | 1,968,680 | | |
| | 250 | | | New York State Mortgage Agency, (AMT), 5.20%, 10/1/08 | | | 252,615 | | |
| | | | | | | $ | 3,206,345 | | |
See notes to financial statements
34
Eaton Vance New York Limited Maturity Municipals Fund as of March 31, 2008
PORTFOLIO OF INVESTMENTS CONT'D
Principal Amount
(000's omitted) | |
Security | |
Value | |
| Industrial Development Revenue — 7.7% | | | |
| $ | 1,000 | | | Dutchess County Industrial Development Agency,
(IBM Corporation), (AMT), Variable Rate,
5.45%, 12/1/29 | | $ | 1,052,510 | | |
| | 1,500 | | | Liberty Development Corp., (Goldman Sachs Group, Inc.),
5.50%, 10/1/37 | | | 1,574,505 | | |
| | 1,250 | | | New York City Industrial Development Agency, (AMT),
5.50%, 1/1/14 | | | 1,323,000 | | |
| | 1,000 | | | New York State Environmental Facilities Corp., Solid Waste
Disposal, (Waste Management Project), (AMT),
4.55%, 5/1/12 | | | 1,009,050 | | |
| | 250 | | | Onondaga County Industrial Development Agency, (Senior
Air Cargo), (AMT), 6.125%, 1/1/32 | | | 244,617 | | |
| | 1,500 | | | Puerto Rico Port Authority, (American Airlines), (AMT),
6.25%, 6/1/26 | | | 1,256,235 | | |
| | 1,250 | | | Virgin Islands Public Financing Authority,
(HOVENSA LLC), (AMT), 4.70%, 7/1/22 | | | 1,064,750 | | |
| | | | | | | $ | 7,524,667 | | |
| Insured-Education — 9.6% | | | |
| $ | 1,000 | | | New York Dormitory Authority, (Canisius College), (MBIA),
5.00%, 7/1/16 | | $ | 1,075,370 | | |
| | 1,000 | | | New York Dormitory Authority, (City University), (AMBAC),
5.625%, 7/1/16 | | | 1,116,070 | | |
| | 1,420 | | | New York Dormitory Authority, (Educational Housing
Services), (AMBAC), 5.25%, 7/1/20 | | | 1,545,201 | | |
| | 1,000 | | | New York Dormitory Authority, (New York University),
(AMBAC), 5.50%, 7/1/19 | | | 1,108,900 | | |
| | 1,085 | | | New York Dormitory Authority, (Rochester Institute of
Technology), (AMBAC), 5.25%, 7/1/21 | | | 1,172,809 | | |
| | 1,000 | | | New York Dormitory Authority, (State University Educational
Facilities), (FSA), 5.75%, 5/15/17 | | | 1,156,780 | | |
| | 1,000 | | | New York Dormitory Authority, (Student Housing), (FGIC),
5.25%, 7/1/15 | | | 1,100,960 | | |
| | 1,000 | | | New York Dormitory Authority, (University Educational
Facilities), (FGIC), 5.25%, 5/15/13 | | | 1,077,090 | | |
| | | | | | | $ | 9,353,180 | | |
| Insured-Electric Utilities — 5.8% | | | |
| $ | 2,500 | | | Long Island Power Authority, Electric Systems Revenue,
(FGIC), 5.00%, 12/1/22 | | $ | 2,556,300 | | |
| | 500 | | | Long Island Power Authority, Electric Systems Revenue,
(FSA), 0.00%, 6/1/15 | | | 376,340 | | |
| | 1,250 | | | Puerto Rico Electric Power Authority, (XLCA), 5.375%, 7/1/17 | | | 1,346,138 | | |
| | 1,250 | | | Puerto Rico Electric Power Authority, (XLCA), 5.375%, 7/1/18 | | | 1,337,875 | | |
| | | | | | | $ | 5,616,653 | | |
Principal Amount
(000's omitted) | |
Security | |
Value | |
| Insured-Escrowed / Prerefunded — 6.1% | | | |
| $ | 500 | | | Long Island Power Authority, Electric Systems Revenue,
(FSA), Prerefunded to 6/1/08, 5.00%, 12/1/18 | | $ | 507,715 | | |
| | 2,240 | | | Metropolitan Transportation Authority, (FGIC), Prerefunded to
7/1/08, 5.70%, 7/1/10 | | | 2,261,638 | | |
| | 1,000 | | | Metropolitan Transportation Authority, (FGIC), Prerefunded to
7/1/09, 5.25%, 7/1/17 | | | 1,043,120 | | |
| | 1,225 | | | New York Dormitory Authority, (Mental Health Services),
(MBIA), Prerefunded to 8/15/11, 5.50%, 8/15/13 | | | 1,340,395 | | |
| | 450 | | | New York Thruway Authority Service Contract, (Local Highway
and Bridge), (MBIA), Prerefunded to 4/1/09,
5.40%, 4/1/15 | | | 470,750 | | |
| | 250 | | | Niagara County Industrial Development Agency, (Niagara
University), (AMBAC), Escrowed to Maturity,
5.25%, 10/1/18 | | | 280,340 | | |
| | | | | | | $ | 5,903,958 | | |
| Insured-General Obligations — 6.9% | | | |
| $ | 1,085 | | | Amityville Union Free School District, (FSA),
5.00%, 12/15/19 | | $ | 1,164,682 | | |
| | 500 | | | Clarence Central School District, (FSA), 5.00%, 5/15/17 | | | 532,870 | | |
| | 1,000 | | | Monroe County, (Public Improvements), (MBIA),
6.00%, 3/1/19 | | | 1,172,280 | | |
| | 1,915 | | | Puerto Rico, (FGIC), 5.50%, 7/1/17 | | | 2,032,390 | | |
| | 1,645 | | | Red Hook Central School District, (FSA), 5.125%, 6/15/16 | | | 1,770,349 | | |
| | | | | | | $ | 6,672,571 | | |
| Insured-Hospital — 2.4% | | | |
| $ | 1,600 | | | New York Dormitory Authority, (Memorial Sloan Kettering
Cancer Center), (MBIA), 5.50%, 7/1/17 | | $ | 1,787,216 | | |
| | 500 | | | New York Dormitory Authority, (New York and Presbyterian
Hospital), (AMBAC), 5.50%, 8/1/11 | | | 539,775 | | |
| | | | | | | $ | 2,326,991 | | |
Insured-Lease Revenue / Certificates of
Participation — 1.1% | | | |
| $ | 1,000 | | | New York Dormitory Authority, (Municipal Health Facilities),
(FSA), 5.50%, 1/15/13 | | $ | 1,075,390 | | |
| | | | | | | $ | 1,075,390 | | |
| Insured-Special Tax Revenue — 5.9% | | | |
| $ | 2,250 | | | New York Local Government Assistance Corp., (MBIA),
0.00%, 4/1/13 | | $ | 1,885,140 | | |
| | 2,000 | | | New York Urban Development Corp., (Personal Income Tax),
(AMBAC), 5.50%, 3/15/19(1) | | | 2,251,860 | | |
See notes to financial statements
35
Eaton Vance New York Limited Maturity Municipals Fund as of March 31, 2008
PORTFOLIO OF INVESTMENTS CONT'D
Principal Amount
(000's omitted) | |
Security | |
Value | |
| Insured-Special Tax Revenue (continued) | | | |
| $ | 1,500 | | | Puerto Rico Infrastructure Financing Authority, (FGIC),
5.50%, 7/1/19 | | $ | 1,573,695 | | |
| | | | | | | $ | 5,710,695 | | |
| Insured-Transportation — 6.8% | | | |
| $ | 1,000 | | | Metropolitan Transportation Authority, (AMBAC),
5.50%, 11/15/18 | | $ | 1,117,520 | | |
| | 1,000 | | | Metropolitan Transportation Authority, (MBIA),
5.50%, 11/15/13 | | | 1,109,740 | | |
| | 1,000 | | | Monroe County Airport Authority, (MBIA), (AMT),
5.875%, 1/1/17 | | | 1,133,260 | | |
| | 1,000 | | | Puerto Rico Highway and Transportation Authority, (FSA),
5.50%, 7/1/17 | | | 1,114,550 | | |
| | 1,920 | | | Triborough Bridge and Tunnel Authority, (MBIA),
5.50%, 11/15/18 | | | 2,155,488 | | |
| | | | | | | $ | 6,630,558 | | |
| Lease Revenue / Certificates of Participation — 2.2% | | | |
| $ | 1,000 | | | New York Urban Development Corp., (Correctional and
Youth Facilities), 5.25%, 1/1/21 | | $ | 1,024,150 | | |
| | 1,025 | | | New York Urban Development Corp., (Correctional and
Youth Facilities), 5.50%, 1/1/17 | | | 1,084,173 | | |
| | | | | | | $ | 2,108,323 | | |
| Other Revenue — 0.8% | | | |
| $ | 750 | | | Albany Industrial Development Agency, (Charitable
Leadership), 6.00%, 7/1/19 | | $ | 752,093 | | |
| | | | | | | $ | 752,093 | | |
| Senior Living / Life Care — 0.4% | | | |
| $ | 400 | | | Mt. Vernon Industrial Development Agency, (Wartburg Senior
Housing, Inc.), 6.15%, 6/1/19 | | $ | 398,204 | | |
| | | | | | | $ | 398,204 | | |
| Solid Waste — 2.8% | | | |
| $ | 750 | | | Hempstead Industrial Development Agency, (American Refuel),
5.00%, 12/1/10 | | $ | 748,200 | | |
| | 2,000 | | | Niagara County Industrial Development Agency, (American
Ref-Fuel Co., LLC), (AMT), Variable Rate, 5.55%, 11/15/24 | | | 1,986,060 | | |
| | | | | | | $ | 2,734,260 | | |
| Special Tax Revenue — 7.7% | | | |
| $ | 1,140 | | | 34th Street Partnership, Inc., 5.00%, 1/1/17 | | $ | 1,218,295 | | |
| | 500 | | | New York City Transitional Finance Authority,
5.375%, 2/15/14 | | | 539,970 | | |
Principal Amount
(000's omitted) | |
Security | |
Value | |
| Special Tax Revenue (continued) | | | |
| $ | 915 | | | New York City Transitional Finance Authority, (Future Tax),
4.75%, 11/15/23 | | $ | 926,419 | | |
| | 480 | | | New York City Transitional Finance Authority, (Future Tax),
5.00%, 5/1/16 | | | 485,707 | | |
| | 1,000 | | | New York City Transitional Finance Authority, (Future Tax),
5.375%, 2/1/13 | | | 1,073,680 | | |
| | 3,000 | | | New York State Local Government Assistance Corp.,
5.25%, 4/1/16 | | | 3,242,010 | | |
| | | | | | | $ | 7,486,081 | | |
| Transportation — 3.2% | | | |
| $ | 1,000 | | | Metropolitan Transportation Authority, 5.00%, 11/15/21 | | $ | 1,030,370 | | |
| | 1,000 | | | Metropolitan Transportation Authority, 5.00%, 11/15/30 | | | 1,064,090 | | |
| | 1,000 | | | Triborough Bridge and Tunnel Authority, 5.00%, 11/15/21 | | | 1,051,480 | | |
| | | | | | | $ | 3,145,940 | | |
| Water and Sewer — 1.6% | | | |
| $ | 1,000 | | | New York State Environmental Facilities Corp., Clean Water,
(Municipal Water Finance), 5.00%, 6/15/20 | | $ | 1,059,610 | | |
| | 500 | | | New York State Environmental Facilities Corp., Clean Water,
(Municipal Water Finance), 5.25%, 6/15/14 | | | 540,950 | | |
| | | | | | | $ | 1,600,560 | | |
Total Tax-Exempt Investments — 98.4%
(identified cost $94,245,416) | | $ | 95,694,019 | | |
| Other Assets, Less Liabilities — 1.6% | | $ | 1,567,938 | | |
| Net Assets — 100.0% | | $ | 97,261,957 | | |
AMBAC - AMBAC Financial Group, Inc.
AMT - Interest earned from these securities may be considered a tax preference item for purposes of the Federal Alternative Minimum Tax.
FGIC - Financial Guaranty Insurance Company
FSA - Financial Security Assurance, Inc.
MBIA - Municipal Bond Insurance Association
XLCA - XL Capital Assurance, Inc.
The Fund invests primarily in debt securities issued by New York municipalities. The ability of the issuers of the debt securities to meet their obligations may be affected by economic developments in a specific industry or municipality. In order to reduce the risk associated with such economic developments, at March 31, 2008, 45.2% of total investments are backed by bond insurance of various financial institutions and financial guaranty assurance agencies. The aggregate percentage insured by an individual financial institution ranged from 2.8% to 12.7% of total investments.
(1) Security (or a portion thereof) has been segregated to cover margin requirements on open financial futures contracts.
See notes to financial statements
36
Eaton Vance Ohio Limited Maturity Municipals Fund as of March 31, 2008
PORTFOLIO OF INVESTMENTS
| Tax-Exempt Investments — 98.7% | | | |
Principal Amount
(000's omitted) | |
Security | |
Value | |
| Cogeneration — 0.5% | | | |
| $ | 95 | | | Ohio Water Development Authority, Solid Waste Disposal,
(Bay Shore Power), (AMT), 6.625%, 9/1/20 | | $ | 95,265 | | |
| | | | | | | $ | 95,265 | | |
| Education — 5.5% | | | |
| $ | 500 | | | Ohio Higher Educational Facilities Commission, (John Carroll
University), 5.00%, 11/15/13 | | $ | 530,435 | | |
| | 500 | | | Ohio State University General Receipts, 5.25%, 12/1/17 | | | 542,095 | | |
| | | | | | | $ | 1,072,530 | | |
| Escrowed / Prerefunded — 3.5% | | | |
| $ | 250 | | | Cuyahoga County, (Rock and Roll Hall of Fame), Escrowed to
Maturity, 5.85%, 12/1/08 | | $ | 256,787 | | |
| | 250 | | | Parma Hospital Improvement, (Parma Community General
Hospital Association), Prerefunded to 11/1/08,
5.25%, 11/1/13 | | | 257,500 | | |
| | 165 | | | Richland County Hospital Facilities, (Medcentral Health
Systems), Prerefunded to 11/15/10, 6.375%, 11/15/22 | | | 182,271 | | |
| | | | | | | $ | 696,558 | | |
| General Obligations — 4.8% | | | |
| $ | 100 | | | Cuyahoga County Sewer Improvement District,
5.45%, 12/1/15 | | $ | 106,354 | | |
| | 500 | | | Hamilton School District, 6.15%, 12/1/15 | | | 586,300 | | |
| | 250 | | | Ohio, 0.00%, 8/1/08 | | | 248,222 | | |
| | | | | | | $ | 940,876 | | |
| Health Care-Miscellaneous — 0.5% | | | |
| $ | 100 | | | Puerto Rico Infrastructure Financing Authority, (Mepsi Campus
Project), 5.60%, 10/1/14 | | $ | 99,812 | | |
| | | | | | | $ | 99,812 | | |
| Hospital — 6.0% | | | |
| $ | 500 | | | Cuyahoga County, (Cleveland Clinic Health System),
6.00%, 1/1/17 | | $ | 561,610 | | |
| | 500 | | | Erie County Hospital Facilities, (Firelands Regional Medical
Center), 5.50%, 8/15/12 | | | 534,960 | | |
| | 85 | | | Richland County Hospital Facilities, (Medcentral Health
Systems), 6.375%, 11/15/22 | | | 88,092 | | |
| | | | | | | $ | 1,184,662 | | |
Principal Amount
(000's omitted) | |
Security | |
Value | |
| Housing — 1.2% | | | |
| $ | 220 | | | Ohio Housing Finance Agency, (AMT), 4.55%, 9/1/11 | | $ | 227,251 | | |
| | | | | | | $ | 227,251 | | |
| Industrial Development Revenue — 7.0% | | | |
| $ | 500 | | | Dayton Special Facilities Revenue, (Emery Air Freight),
5.625%, 2/1/18 | | $ | 510,575 | | |
| | 100 | | | Ohio Water Development Authority, Solid Waste Disposal,
(Allied Waste North America, Inc.), (AMT), 5.15%, 7/15/15 | | | 91,516 | | |
| | 500 | | | Toledo Lucas County Port Authority, (Cargill, Inc.),
4.50%, 12/1/15 | | | 515,010 | | |
| | 310 | | | Virgin Islands Public Financing Authority, (HOVENSA LLC),
(AMT), 4.70%, 7/1/22 | | | 264,058 | | |
| | | | | | | $ | 1,381,159 | | |
| Insured-Education — 3.9% | | | |
| $ | 750 | | | Cleveland-Cuyahoga County Port Authority, (Euclid Avenue
Housing Corp.), (AMBAC), 5.00%, 8/1/21 | | $ | 767,835 | | |
| | | | | | | $ | 767,835 | | |
| Insured-Escrowed / Prerefunded — 5.0% | | | |
| $ | 300 | | | Cleveland Airport System, (FSA), Prerefunded to 1/1/10,
5.25%, 1/1/14 | | $ | 317,301 | | |
| | 600 | | | Springfield City School District, Clark County, (FGIC),
Prerefunded to 12/1/11, 5.00%, 12/1/17 | | | 660,390 | | |
| | | | | | | $ | 977,691 | | |
| Insured-General Obligations — 23.4% | | | |
| $ | 200 | | | Amherst School District, (FGIC), 5.00%, 12/1/11 | | $ | 213,418 | | |
| | 250 | | | Athens City School District, (FSA), 5.45%, 12/1/10 | | | 269,372 | | |
| | 265 | | | Clinton Massie Local School District, (AMBAC),
0.00%, 12/1/09 | | | 254,850 | | |
| | 265 | | | Clinton Massie Local School District, (AMBAC),
0.00%, 12/1/11 | | | 239,435 | | |
| | 225 | | | Finneytown Local School District, (FGIC), 6.15%, 12/1/11 | | | 253,123 | | |
| | 1,000 | | | Hilliard School District, (FGIC), 0.00%, 12/1/14 | | | 760,060 | | |
| | 175 | | | Scioto Valley and Ross County School District, (FGIC),
0.00%, 12/1/11 | | | 158,118 | | |
| | 650 | | | Springfield City School District, Clark County, (AMBAC),
4.30%, 12/1/14 | | | 671,547 | | |
| | 500 | | | Strongsville City School District, (MBIA),
5.375%, 12/1/12(1) | | | 553,930 | | |
| | 670 | | | Upper Arlington City School District, (FSA), 5.00%, 12/1/21 | | | 704,445 | | |
| | 460 | | | Wyoming School District, (FGIC), 5.75%, 12/1/17 | | | 527,326 | | |
| | | | | | | $ | 4,605,624 | | |
See notes to financial statements
37
Eaton Vance Ohio Limited Maturity Municipals Fund as of March 31, 2008
PORTFOLIO OF INVESTMENTS CONT'D
Principal Amount
(000's omitted) | |
Security | |
Value | |
| Insured-Hospital — 2.8% | | | |
| $ | 500 | | | Cuyahoga County, (Metrohealth System), (MBIA),
5.50%, 2/15/12 | | $ | 541,550 | | |
| | | | | | | $ | 541,550 | | |
| Insured-Industrial Development Revenue — 2.8% | | | |
| $ | 500 | | | Akron Economic Development, (MBIA), 6.00%, 12/1/12 | | $ | 543,795 | | |
| | | | | | | $ | 543,795 | | |
Insured-Lease Revenue / Certificates of
Participation — 4.6% | | | |
| $ | 500 | | | Ohio Building Authority, (FSA), 5.50%, 10/1/11 | | $ | 546,985 | | |
| | 350 | | | Ohio Higher Educational Facilities Authority, (Xavier
University), (CIFG), 5.00%, 5/1/22 | | | 350,676 | | |
| | | | | | | $ | 897,661 | | |
| Insured-Other Revenue — 2.8% | | | |
| $ | 500 | | | Cleveland Parking Facilities, (FSA), 5.25%, 9/15/20 | | $ | 552,705 | | |
| | | | | | | $ | 552,705 | | |
| Insured-Special Tax Revenue — 1.3% | | | |
| $ | 250 | | | Puerto Rico Infrastructure Financing Authority, (FGIC),
5.50%, 7/1/19 | | $ | 262,283 | | |
| | | | | | | $ | 262,283 | | |
| Insured-Transportation — 4.3% | | | |
| $ | 750 | | | Ohio Turnpike Commission, (FGIC), 5.50%, 2/15/18 | | $ | 836,183 | | |
| | | | | | | $ | 836,183 | | |
| Insured-Water and Sewer — 2.6% | | | |
| $ | 475 | | | Cleveland Waterworks, (FSA), 5.375%, 1/1/16 | | $ | 511,385 | | |
| | | | | | | $ | 511,385 | | |
| Lease Revenue / Certificates of Participation — 1.0% | | | |
| $ | 190 | | | Union County, (Pleasant Valley Joint Fire District),
6.125%, 12/1/19 | | $ | 193,247 | | |
| | | | | | | $ | 193,247 | | |
| Other Revenue — 3.0% | | | |
| $ | 325 | | | Buckeye Tobacco Settlement Financing Authority,
5.125%, 6/1/24 | | $ | 304,099 | | |
| | 300 | | | Riversouth Authority, (Lazarus Building Redevelopment),
5.75%, 12/1/27 | | | 284,586 | | |
| | | | | | | $ | 588,685 | | |
Principal Amount
(000's omitted) | |
Security | |
Value | |
| Pooled Loans — 6.0% | | | |
| $ | 240 | | | Cuyahoga County Port Authority, (Garfield Heights),
5.25%, 5/15/23 | | $ | 223,949 | | |
| | 295 | | | Ohio Economic Development, (Ohio Enterprise Bond Fund),
(AMT), 4.60%, 6/1/20 | | | 298,540 | | |
| | 250 | | | Ohio Economic Development, (Ohio Enterprise Bond Fund),
(AMT), 5.25%, 12/1/15 | | | 262,368 | | |
| | 330 | | | Summit County Port Authority, (Twinsburg Township),
5.125%, 5/15/25 | | | 296,729 | | |
| | 100 | | | Toledo Lucas County Port Authority, (Northwest
Ohio Bond Fund), (AMT), 6.125%, 11/15/09 | | | 103,090 | | |
| | | | | | | $ | 1,184,676 | | |
| Special Tax Revenue — 1.3% | | | |
| $ | 250 | | | Mahoning County, (Sales Tax), 5.00%, 12/1/10 | | $ | 258,233 | | |
| | | | | | | $ | 258,233 | | |
| Water and Sewer — 4.9% | | | |
| $ | 400 | | | Cincinnati Water System, 4.50%, 12/1/21 | | $ | 404,300 | | |
| | 500 | | | Ohio Water Development Authority, (Drinking Water),
5.50%, 12/1/14 | | | 551,330 | | |
| | | | | | | $ | 955,630 | | |
Total Tax-Exempt Investments — 98.7%
(identified cost $18,674,837) | | $ | 19,375,296 | | |
| Other Assets, Less Liabilities — 1.3% | | $ | 260,165 | | |
| Net Assets — 100.0% | | $ | 19,635,461 | | |
AMBAC - AMBAC Financial Group, Inc.
AMT - Interest earned from these securities may be considered a tax preference item for purposes of the Federal Alternative Minimum Tax.
CIFG - CIFG Assurance North America, Inc.
FGIC - Financial Guaranty Insurance Company
FSA - Financial Security Assurance, Inc.
MBIA - Municipal Bond Insurance Association
The Fund invests primarily in debt securities issued by Ohio municipalities. The ability of the issuers of the debt securities to meet their obligations may be affected by economic developments in a specific industry or municipality. In order to reduce the risk associated with such economic developments, at March 31, 2008, 54.2% of total investments are backed by bond insurance of various financial institutions and financial guaranty assurance agencies. The aggregate percentage insured by an individual financial institution ranged from 1.8% to 18.9% of total investments.
(1) Security (or a portion thereof) has been segregated to cover margin requirements on open financial futures contracts.
See notes to financial statements
38
Eaton Vance Pennsylvania Limited Maturity Municipals Fund as of March 31, 2008
PORTFOLIO OF INVESTMENTS
| Tax-Exempt Investments — 98.9% | | | |
Principal Amount
(000's omitted) | |
Security | |
Value | |
| Cogeneration — 1.4% | | | |
| $ | 435 | | | Carbon County Industrial Development Authority, (Panther
Creek Partners), (AMT), 6.65%, 5/1/10 | | $ | 442,138 | | |
| | 350 | | | Pennsylvania Economic Development Financing Authority,
(Resource Recovery-Colver), (AMT), 5.125%, 12/1/15 | | | 332,916 | | |
| | | | | | | $ | 775,054 | | |
| Education — 4.4% | | | |
| $ | 2,290 | | | Pennsylvania Higher Educational Facilities Authority,
(University of Pennsylvania), 5.00%, 7/15/21 | | $ | 2,381,256 | | |
| | | | | | | $ | 2,381,256 | | |
| Electric Utilities — 1.6% | | | |
| $ | 500 | | | Delaware County Industrial Development Authority Pollution
Control, (Peco Energy Co.), 4.00%, 12/1/12 | | $ | 503,795 | | |
| | 400 | | | York County Industrial Development Authority, Pollution
Control, (Public Service Enterprise Group, Inc.),
5.50%, 9/1/20 | | | 381,568 | | |
| | | | | | | $ | 885,363 | | |
| Escrowed / Prerefunded — 3.0% | | | |
| $ | 250 | | | Allegheny County Industrial Development Authority,
(Residential Resources, Inc.), Prerefunded to 9/1/11,
6.50%, 9/1/21 | | $ | 280,730 | | |
| | 500 | | | Bucks County Industrial Development Authority, (Pennswood),
Prerefunded to 10/1/10, 5.80%, 10/1/20 | | | 548,440 | | |
| | 760 | | | Lehigh County General Purpose Authority, (Muhlenberg
Hospital), Escrowed to Maturity, 5.75%, 7/15/10 | | | 788,204 | | |
| | | | | | | $ | 1,617,374 | | |
| General Obligations — 1.9% | | | |
| $ | 1,000 | | | Delaware County, 5.00%, 10/1/21 | | $ | 1,046,950 | | |
| | | | | | | $ | 1,046,950 | | |
| Health Care-Miscellaneous — 0.4% | | | |
| $ | 200 | | | Puerto Rico Infrastructure Financing Authority, (Mepsi Campus
Project), 6.25%, 10/1/24 | | $ | 194,296 | | |
| | | | | | | $ | 194,296 | | |
| Hospital — 5.7% | | | |
| $ | 500 | | | Allegheny County, Hospital Development Authority,
(University of Pittsburgh Medical Center), 5.00%, 9/1/18 | | $ | 513,885 | | |
| | 200 | | | Lebanon County Health Facility Authority, (Good Samaritan
Hospital), 5.50%, 11/15/18 | | | 202,588 | | |
Principal Amount
(000's omitted) | |
Security | |
Value | |
| Hospital (continued) | | | |
| $ | 1,000 | | | Monroe County Hospital Authority, (Pocono Medical Center),
5.00%, 1/1/17 | | $ | 1,002,740 | | |
| | 500 | | | Pennsylvania Higher Educational Facilities Authority,
(UPMC Health System), 6.25%, 1/15/18 | | | 538,870 | | |
| | 800 | | | Washington County Hospital Authority, (Monongahela
Vineyard Hospital), 5.00%, 6/1/12 | | | 836,096 | | |
| | | | | | | $ | 3,094,179 | | |
| Housing — 2.4% | | | |
| $ | 1,335 | | | Allegheny County Residential Finance Authority, Single Family
Mortgages, (AMT), 4.80%, 11/1/22 | | $ | 1,271,507 | | |
| | | | | | | $ | 1,271,507 | | |
| Industrial Development Revenue — 3.8% | | | |
| $ | 700 | | | Erie Industrial Development Authority, (International Paper),
(AMT), 5.85%, 12/1/20 | | $ | 673,603 | | |
| | 750 | | | Puerto Rico Port Authority, (American Airlines), (AMT),
6.25%, 6/1/26 | | | 628,117 | | |
| | 750 | | | Schuylkill County Industrial Development Authority,
(Pine Grove Landfill, Inc.), (AMT), 5.10%, 10/1/19 | | | 758,865 | | |
| | | | | | | $ | 2,060,585 | | |
| Insured-Cogeneration — 2.3% | | | |
| $ | 1,300 | | | Pennsylvania Economic Development Financing Authority,
(Resource Recovery-Colver), (AMBAC), (AMT),
4.625%, 12/1/18 | | $ | 1,260,519 | | |
| | | | | | | $ | 1,260,519 | | |
| Insured-Education — 6.0% | | | |
| $ | 2,000 | | | Delaware County, (Villanova University), (AMBAC),
5.00%, 8/1/20 | | $ | 2,082,420 | | |
| | 1,100 | | | Lycoming County College Authority, (Pennsylvania
College of Technology), (AMBAC), 5.125%, 5/1/22 | | | 1,122,792 | | |
| | | | | | | $ | 3,205,212 | | |
| Insured-Electric Utilities — 3.0% | | | |
| $ | 1,500 | | | Cambria County Industrial Development Authority,
(Pennsylvania Electric), (MBIA), 5.35%, 11/1/10 | | $ | 1,591,020 | | |
| | | | | | | $ | 1,591,020 | | |
| Insured-Escrowed / Prerefunded — 20.8% | | | |
| $ | 1,000 | | | Council Rock School District, (MBIA), Prerefunded to
11/15/11, 5.00%, 11/15/19 | | $ | 1,081,530 | | |
| | 1,000 | | | Ephrata Area School District, (FGIC), Prerefunded to
10/15/11, 5.25%, 4/15/19 | | | 1,084,970 | | |
See notes to financial statements
39
Eaton Vance Pennsylvania Limited Maturity Municipals Fund as of March 31, 2008
PORTFOLIO OF INVESTMENTS CONT'D
Principal Amount
(000's omitted) | |
Security | |
Value | |
| Insured-Escrowed / Prerefunded (continued) | | | |
| $ | 500 | | | Pennsylvania Public School Building Authority, (Garnet Valley
School District), (AMBAC), Prerefunded to 2/1/11,
5.50%, 2/1/20 | | $ | 539,925 | | |
| | 1,000 | | | Pennsylvania Turnpike Commission, Registration Fee Revenue,
(AMBAC), Prerefunded to 7/15/11, 5.125%, 7/15/22 | | | 1,086,000 | | |
| | 1,000 | | | Philadelphia Gas Works Revenue, (FSA), Prerefunded to
8/1/13, 5.25%, 8/1/17 | | | 1,113,370 | | |
| | 1,000 | | | Philadelphia School District, (FSA), Prerefunded to
2/1/12, 5.50%, 2/1/17 | | | 1,095,620 | | |
| | 1,000 | | | Pittsburgh, (AMBAC), Prerefunded to 3/1/12,
5.25%, 9/1/22 | | | 1,088,250 | | |
| | 1,000 | | | Spring-Ford Area School District, (FSA), Prerefunded to
9/1/11, 5.00%, 9/1/19 | | | 1,077,350 | | |
| | 5,000 | | | Westmoreland Municipal Authority, (FGIC), Escrowed to
Maturity, 0.00%, 8/15/19 | | | 3,044,600 | | |
| | | | | | | $ | 11,211,615 | | |
| Insured-General Obligations — 21.2% | | | |
| $ | 1,280 | | | Allegheny County, (FSA), 5.00%, 11/1/27 | | $ | 1,300,416 | | |
| | 1,020 | | | Cornwall Lebanon School District, (FSA), 0.00%, 3/15/16(1) | | | 727,576 | | |
| | 1,250 | | | Cranberry Township, (FGIC), 5.00%, 12/1/20 | | | 1,287,225 | | |
| | 1,635 | | | Harrisburg, (AMBAC), 0.00%, 9/15/12 | | | 1,399,756 | | |
| | 1,355 | | | McKeesport, (FGIC), 0.00%, 10/1/11 | | | 1,229,893 | | |
| | 1,000 | | | Palmyra Area School District, (FGIC), 5.00%, 5/1/17 | | | 1,060,490 | | |
| | 2,000 | | | Pennsylvania, (MBIA), 5.375%, 7/1/19 | | | 2,241,260 | | |
| | 1,000 | | | Reading School District, (FGIC), 0.00%, 1/15/12 | | | 875,110 | | |
| | 1,250 | | | Sto-Rox School District, (FGIC), 5.125%, 12/15/22 | | | 1,279,088 | | |
| | | | | | | $ | 11,400,814 | | |
| Insured-Hospital — 1.0% | | | |
| $ | 500 | | | Washington County Hospital Authority, (Washington Hospital),
(AMBAC), 5.375%, 7/1/14 | | $ | 548,365 | | |
| | | | | | | $ | 548,365 | | |
| Insured-Other Revenue — 2.8% | | | |
| $ | 1,500 | | | Philadelphia Authority for Industrial Development Revenue,
(FGIC), 5.00%, 12/1/22 | | $ | 1,501,995 | | |
| | | | | | | $ | 1,501,995 | | |
| Insured-Special Tax Revenue — 0.7% | | | |
| $ | 350 | | | Pittsburgh and Allegheny County Public Auditorium Authority,
(AMBAC), 5.00%, 2/1/24 | | $ | 351,582 | | |
| | | | | | | $ | 351,582 | | |
Principal Amount
(000's omitted) | |
Security | |
Value | |
| Insured-Transportation — 10.0% | | | |
| $ | 1,000 | | | Allegheny County Airport, (MBIA), (AMT), 5.75%, 1/1/10 | | $ | 1,035,910 | | |
| | 590 | | | Allegheny County Airport, (MBIA), (AMT), 5.75%, 1/1/12 | | | 624,952 | | |
| | 2,000 | | | Pennsylvania Turnpike Commission, Registration Fee Revenue,
(FSA), 5.25%, 7/15/22 | | | 2,185,460 | | |
| | 1,000 | | | Philadelphia Airport, (FGIC), (AMT), 5.375%, 7/1/14 | | | 1,012,180 | | |
| | 500 | | | Southeastern Pennsylvania Transportation Authority, (FGIC),
5.25%, 3/1/16 | | | 515,395 | | |
| | | | | | | $ | 5,373,897 | | |
| Insured-Water and Sewer — 4.6% | | | |
| $ | 250 | | | Allegheny County Sanitation Authority, (MBIA),
5.00%, 12/1/19 | | $ | 259,598 | | |
| | 2,000 | | | Altoona City Authority Water Revenue, (FSA),
5.25%, 11/1/19 | | | 2,224,580 | | |
| | | | | | | $ | 2,484,178 | | |
| Senior Living / Life Care — 1.5% | | | |
| $ | 390 | | | Cliff House Trust, (AMT), 6.625%, 6/1/27(2) | | $ | 250,622 | | |
| | 335 | | | Crawford County Hospital Authority, (Wesbury United
Methodist Community), 6.00%, 8/15/11 | | | 339,707 | | |
| | 185 | | | Lancaster County Hospital Authority, (Health
Center-Willow Valley Retirement), 5.55%, 6/1/15 | | | 192,246 | | |
| | | | | | | $ | 782,575 | | |
| Transportation — 0.4% | | | |
| $ | 205 | | | Erie Municipal Airport Authority, (AMT), 5.50%, 7/1/09 | | $ | 206,743 | | |
| | | | | | | $ | 206,743 | | |
Total Tax-Exempt Investments — 98.9%
(identified cost $51,724,997) | | $ | 53,245,079 | | |
| Other Assets, Less Liabilities — 1.1% | | $ | 611,829 | | |
| Net Assets — 100.0% | | $ | 53,856,908 | | |
AMBAC - AMBAC Financial Group, Inc.
AMT - Interest earned from these securities may be considered a tax preference item for purposes of the Federal Alternative Minimum Tax.
FGIC - Financial Guaranty Insurance Company
FSA - Financial Security Assurance, Inc.
MBIA - Municipal Bond Insurance Association
See notes to financial statements
40
Eaton Vance Pennsylvania Limited Maturity Municipals Fund as of March 31, 2008
PORTFOLIO OF INVESTMENTS CONT'D
The Fund invests primarily in debt securities issued by Pennsylvania municipalities. The ability of the issuers of the debt securities to meet their obligations may be affected by economic developments in a specific industry or municipality. In order to reduce the risk associated with such economic developments, at March 31, 2008, 73.1% of total investments are backed by bond insurance of various financial institutions and financial guaranty assurance agencies. The aggregate percentage insured by an individual financial institution ranged from 12.8% to 24.2% of total investments.
(1) Security (or a portion thereof) has been segregated to cover margin requirements on open financial futures contracts.
(2) Security is in default with respect to scheduled principal payments.
See notes to financial statements
41
Eaton Vance Limited Maturity Municipals Funds as of March 31, 2008
FINANCIAL STATEMENTS
Statements of Assets and Liabilities
As of March 31, 2008
| | | California
Limited Fund | | Florida Plus
Limited Fund | | Massachusetts
Limited Fund | | New Jersey
Limited Fund | |
| Assets | |
| Investments — | |
| Identified cost | | $ | 37,591,260 | | | $ | 38,388,611 | | | $ | 61,609,453 | | | $ | 41,296,149 | | |
| Unrealized appreciation | | | 530,181 | | | | 172,076 | | | | 1,765,241 | | | | 1,182,815 | | |
| Investments, at value | | $ | 38,121,441 | | | $ | 38,560,687 | | | $ | 63,374,694 | | | $ | 42,478,964 | | |
| Cash | | $ | 213,843 | | | $ | 1,100,353 | | | $ | 222,215 | | | $ | 805,969 | | |
| Receivable for investments sold | | | — | | | | 336,193 | | | | — | | | | — | | |
| Receivable for Fund shares sold | | | 20,173 | | | | 40,148 | | | | 26,411 | | | | — | | |
| Interest receivable | | | 463,306 | | | | 553,384 | | | | 808,827 | | | | 499,414 | | |
| Total assets | | $ | 38,818,763 | | | $ | 40,590,765 | | | $ | 64,432,147 | | | $ | 43,784,347 | | |
| Liabilities | |
| Payable for Fund shares redeemed | | $ | 6,600 | | | $ | 48,062 | | | $ | 80,025 | | | $ | 65,741 | | |
| Payable for daily variation margin on open financial futures contracts | | | 18,063 | | | | 10,625 | | | | 30,969 | | | | 17,797 | | |
| Dividends payable | | | 55,461 | | | | 56,810 | | | | 84,578 | | | | 62,857 | | |
| Payable for when-issued securities | | | — | | | | 1,316,266 | | | | — | | | | — | | |
| Payable to affiliate for investment adviser fee | | | 14,345 | | | | 15,435 | | | | 23,812 | | | | 16,074 | | |
| Payable to affiliate for distribution and service fees | | | 6,170 | | | | 11,206 | | | | 17,730 | | | | 6,178 | | |
| Accrued expenses | | | 47,018 | | | | 57,209 | | | | 58,242 | | | | 57,993 | | |
| Total liabilities | | $ | 147,657 | | | $ | 1,515,613 | | | $ | 295,356 | | | $ | 226,640 | | |
| Net Assets | | $ | 38,671,106 | | | $ | 39,075,152 | | | $ | 64,136,791 | | | $ | 43,557,707 | | |
| Sources of Net Assets | |
| Paid-in capital | | $ | 39,212,685 | | | $ | 40,034,397 | | | $ | 65,409,311 | | | $ | 43,925,021 | | |
| Accumulated net realized loss (computed on the basis of identified cost) | | | (805,554 | ) | | | (983,323 | ) | | | (2,602,550 | ) | | | (1,305,006 | ) | |
| Accumulated undistributed (distributions in excess of) net investment income | | | 1,251 | | | | 21,830 | | | | (23,794 | ) | | | 39,338 | | |
| Net unrealized appreciation (computed on the basis of identified cost) | | | 262,724 | | | | 2,248 | | | | 1,353,824 | | | | 898,354 | | |
| Total | | $ | 38,671,106 | | | $ | 39,075,152 | | | $ | 64,136,791 | | | $ | 43,557,707 | | |
| Class A Shares | |
| Net Assets | | $ | 36,614,919 | | | $ | 29,296,927 | | | $ | 49,513,872 | | | $ | 42,612,056 | | |
| Shares Outstanding | | | 3,651,328 | | | | 2,963,500 | | | | 4,967,621 | | | | 4,303,652 | | |
Net Asset Value and Redemption Price Per Share
(net assets ÷ shares of beneficial interest outstanding) | | $ | 10.03 | | | $ | 9.89 | | | $ | 9.97 | | | $ | 9.90 | | |
Maximum Offering Price Per Share
(100 ÷ 97.75 of net asset value per share) | | $ | 10.26 | | | $ | 10.12 | | | $ | 10.20 | | | $ | 10.13 | | |
| Class B Shares | |
| Net Assets | | $ | 607,306 | | | $ | 1,256,452 | | | $ | 1,627,513 | | | $ | 801,369 | | |
| Shares Outstanding | | | 60,752 | | | | 127,046 | | | | 163,418 | | | | 80,935 | | |
Net Asset Value and Offering Price Per Share*
(net assets ÷ shares of beneficial interest outstanding) | | $ | 10.00 | | | $ | 9.89 | | | $ | 9.96 | | | $ | 9.90 | | |
| Class C Shares | |
| Net Assets | | $ | 1,448,881 | | | $ | 8,521,773 | | | $ | 12,995,406 | | | $ | 144,282 | | |
| Shares Outstanding | | | 149,478 | | | | 912,693 | | | | 1,361,104 | | | | 14,560 | | |
Net Asset Value and Offering Price Per Share*
(net assets ÷ shares of beneficial interest outstanding) | | $ | 9.69 | | | $ | 9.34 | | | $ | 9.55 | | | $ | 9.91 | | |
On sales of $100,000 or more, the offering price of Class A shares is reduced.
* Redemption price per share is equal to the net asset value less any applicable contingent deferred sales charge.
See notes to financial statements
42
Eaton Vance Limited Maturity Municipals Funds as of March 31, 2008
FINANCIAL STATEMENTS CONT'D
Statements of Assets and Liabilities
As of March 31, 2008
| | | New York
Limited Fund | | Ohio
Limited Fund | | Pennsylvania
Limited Fund | |
| Assets | |
| Investments — | |
| Identified cost | | $ | 94,160,144 | | | $ | 18,674,837 | | | $ | 51,724,997 | | |
| Unrealized appreciation | | | 1,533,875 | | | | 700,459 | | | | 1,520,082 | | |
| Investments, at value | | $ | 95,694,019 | | | $ | 19,375,296 | | | $ | 53,245,079 | | |
| Cash | | $ | 243,829 | | | $ | 70,190 | | | $ | 101,251 | | |
| Receivable for investments sold | | | 250,000 | | | | 10,000 | | | | — | | |
| Receivable for Fund shares sold | | | 234,443 | | | | 19,544 | | | | 48,016 | | |
| Interest receivable | | | 1,391,703 | | | | 259,252 | | | | 667,065 | | |
| Total assets | | $ | 97,813,994 | | | $ | 19,734,282 | | | $ | 54,061,411 | | |
| Liabilities | |
| Payable for Fund shares redeemed | | $ | 211,140 | | | $ | 2,300 | | | $ | 8,579 | | |
| Payable for daily variation margin on open financial futures contracts | | | 49,797 | | | | 9,969 | | | | 23,016 | | |
| Dividends payable | | | 137,801 | | | | 29,533 | | | | 76,413 | | |
| Payable to affiliate for investment adviser fee | | | 36,378 | | | | 7,692 | | | | 20,272 | | |
| Payable to affiliate for distribution and service fees | | | 28,621 | | | | 2,759 | | | | 16,240 | | |
| Accrued expenses | | | 88,300 | | | | 46,568 | | | | 59,983 | | |
| Total liabilities | | $ | 552,037 | | | $ | 98,821 | | | $ | 204,503 | | |
| Net Assets | | $ | 97,261,957 | | | $ | 19,635,461 | | | $ | 53,856,908 | | |
| Sources of Net Assets | |
| Paid-in capital | | $ | 99,681,077 | | | $ | 20,231,840 | | | $ | 54,835,941 | | |
| Accumulated net realized loss (computed on the basis of identified cost) | | | (3,300,997 | ) | | | (1,167,223 | ) | | | (2,109,738 | ) | |
| Distributions in excess of net investment income | | | (9,204 | ) | | | (510 | ) | | | (62,135 | ) | |
| Net unrealized appreciation (computed on the basis of identified cost) | | | 891,081 | | | | 571,354 | | | | 1,192,840 | | |
| Total | | $ | 97,261,957 | | | $ | 19,635,461 | | | $ | 53,856,908 | | |
| Class A Shares | |
| Net Assets | | $ | 71,401,211 | | | $ | 19,393,731 | | | $ | 39,271,809 | | |
| Shares Outstanding | | | 7,002,268 | | | | 2,059,069 | | | | 3,916,502 | | |
Net Asset Value and Redemption Price Per Share
(net assets ÷ shares of beneficial interest outstanding) | | $ | 10.20 | | | $ | 9.42 | | | $ | 10.03 | | |
Maximum Offering Price Per Share
(100 ÷ 97.75 of net asset value per share) | | $ | 10.43 | | | $ | 9.64 | | | $ | 10.26 | | |
| Class B Shares | |
| Net Assets | | $ | 2,016,988 | | | $ | 110,769 | | | $ | 1,158,535 | | |
| Shares Outstanding | | | 197,976 | | | | 11,778 | | | | 115,535 | | |
Net Asset Value and Offering Price Per Share*
(net assets ÷ shares of beneficial interest outstanding) | | $ | 10.19 | | | $ | 9.41 | | | $ | 10.03 | | |
| Class C Shares | |
| Net Assets | | $ | 23,843,758 | | | $ | 130,961 | | | $ | 13,426,564 | | |
| Shares Outstanding | | | 2,459,534 | | | | 13,931 | | | | 1,412,084 | | |
Net Asset Value and Offering Price Per Share*
(net assets ÷ shares of beneficial interest outstanding) | | $ | 9.69 | | | $ | 9.40 | | | $ | 9.51 | | |
On sales of $100,000 or more, the offering price of Class A shares is reduced.
* Redemption price per share is equal to the net asset value less any applicable contingent deferred sales charge.
See notes to financial statements
43
Eaton Vance Limited Maturity Municipals Funds as of March 31, 2008
FINANCIAL STATEMENTS CONT'D
Statements of Operations
For the Year Ended March 31, 2008
| | | California
Limited Fund | | Florida Plus
Limited Fund | | Massachusetts
Limited Fund | | New Jersey
Limited Fund | |
| Investment Income | |
| Interest | | $ | 1,807,236 | | | $ | 1,986,053 | | | $ | 2,860,876 | | | $ | 1,846,555 | | |
| Total investment income | | $ | 1,807,236 | | | $ | 1,986,053 | | | $ | 2,860,876 | | | $ | 1,846,555 | | |
| Expenses | |
| Investment adviser fee | | $ | 173,877 | | | $ | 185,879 | | | $ | 273,953 | | | $ | 175,330 | | |
| Trustees' fees and expenses | | | 1,847 | | | | 1,895 | | | | 7,051 | | | | 1,876 | | |
| Distribution and service fees | |
| Class A | | | 57,756 | | | | 47,151 | | | | 71,088 | | | | 57,523 | | |
| Class B | | | 5,759 | | | | 15,014 | | | | 21,983 | | | | 16,054 | | |
| Class C | | | 6,997 | | | | 80,178 | | | | 122,954 | | | | 615 | | |
| Legal and accounting services | | | 44,408 | | | | 42,371 | | | | 41,801 | | | | 42,161 | | |
| Printing and postage | | | 1,422 | | | | 5,181 | | | | 6,852 | | | | 3,890 | | |
| Interest expense and fees | | | — | | | | — | | | | — | | | | 8,288 | | |
| Custodian fee | | | 28,048 | | | | 41,345 | | | | 48,508 | | | | 42,745 | | |
| Transfer and dividend disbursing agent fees | | | 10,443 | | | | 18,764 | | | | 36,337 | | | | 20,645 | | |
| Registration fees | | | 6,228 | | | | 14,655 | | | | 9,570 | | | | 3,065 | | |
| Miscellaneous | | | 14,871 | | | | 13,680 | | | | 16,714 | | | | 13,760 | | |
| Total expenses | | $ | 351,656 | | | $ | 466,113 | | | $ | 656,811 | | | $ | 385,952 | | |
| Deduct — | |
| Reduction of custodian fee | | $ | 11,925 | | | $ | 10,201 | | | $ | 9,478 | | | $ | 9,329 | | |
| Total expense reductions | | $ | 11,925 | | | $ | 10,201 | | | $ | 9,478 | | | $ | 9,329 | | |
| Net expenses | | $ | 339,731 | | | $ | 455,912 | | | $ | 647,333 | | | $ | 376,623 | | |
| Net investment income | | $ | 1,467,505 | | | $ | 1,530,141 | | | $ | 2,213,543 | | | $ | 1,469,932 | | |
| Realized and Unrealized Gain (Loss) | |
| Net realized gain (loss) — | |
| Investment transactions (identified cost basis) | | $ | 118,341 | | | $ | 598,473 | | | $ | 7,687 | | | $ | 244,590 | | |
| Financial futures contracts | | | (219,716 | ) | | | (315,626 | ) | | | (473,555 | ) | | | (375,804 | ) | |
| Net realized gain (loss) | | $ | (101,375 | ) | | $ | 282,847 | | | $ | (465,868 | ) | | $ | (131,214 | ) | |
| Change in unrealized appreciation (depreciation) — | |
| Investments (identified cost basis) | | $ | (938,298 | ) | | $ | (1,650,051 | ) | | $ | (596,481 | ) | | $ | (790,118 | ) | |
| Financial futures contracts | | | (380,907 | ) | | | (203,271 | ) | | | (483,285 | ) | | | (331,134 | ) | |
| Net change in unrealized appreciation (depreciation) | | $ | (1,319,205 | ) | | $ | (1,853,322 | ) | | $ | (1,079,766 | ) | | $ | (1,121,252 | ) | |
| Net realized and unrealized loss | | $ | (1,420,580 | ) | | $ | (1,570,475 | ) | | $ | (1,545,634 | ) | | $ | (1,252,466 | ) | |
| Net increase (decrease) in net assets from operations | | $ | 46,925 | | | $ | (40,334 | ) | | $ | 667,909 | | | $ | 217,466 | | |
See notes to financial statements
44
Eaton Vance Limited Maturity Municipals Funds as of March 31, 2008
FINANCIAL STATEMENTS CONT'D
Statements of Operations
For the Year Ended March 31, 2008
| | | New York
Limited Fund | | Ohio
Limited Fund | | Pennsylvania
Limited Fund | |
| Investment Income | |
| Interest | | $ | 4,479,561 | | | $ | 933,584 | | | $ | 2,496,567 | | |
| Total investment income | | $ | 4,479,561 | | | $ | 933,584 | | | $ | 2,496,567 | | |
| Expenses | |
| Investment adviser fee | | $ | 421,846 | | | $ | 88,265 | | | $ | 234,165 | | |
| Trustees' fees and expenses | | | 7,229 | | | | 189 | | | | 7,177 | | |
| Distribution and service fees | |
| Class A | | | 106,778 | | | | 29,754 | | | | 56,061 | | |
| Class B | | | 23,732 | | | | 1,944 | | | | 19,336 | | |
| Class C | | | 199,410 | | | | 270 | | | | 123,115 | | |
| Legal and accounting services | | | 46,462 | | | | 33,782 | | | | 46,647 | | |
| Printing and postage | | | 12,830 | | | | 3,040 | | | | 6,410 | | |
| Custodian fee | | | 80,165 | | | | 27,032 | | | | 48,441 | | |
| Interest expense and fees | | | 6,951 | | | | — | | | | — | | |
| Transfer and dividend disbursing agent fees | | | 48,920 | | | | 8,799 | | | | 31,616 | | |
| Registration fees | | | 7,728 | | | | 1,126 | | | | 2,190 | | |
| Miscellaneous | | | 18,562 | | | | 12,017 | | | | 11,829 | | |
| Total expenses | | $ | 980,613 | | | $ | 206,218 | | | $ | 586,987 | | |
| Deduct — | |
| Reduction of custodian fee | | $ | 13,499 | | | $ | 4,218 | | | $ | 15,472 | | |
| Total expense reductions | | $ | 13,499 | | | $ | 4,218 | | | $ | 15,472 | | |
| Net expenses | | $ | 967,114 | | | $ | 202,000 | | | $ | 571,515 | | |
| Net investment income | | $ | 3,512,447 | | | $ | 731,584 | | | $ | 1,925,052 | | |
| Realized and Unrealized Gain (Loss) | |
| Net realized gain (loss) — | |
| Investment transactions (identified cost basis) | | $ | (3,279 | ) | | $ | 45,845 | | | $ | 107,688 | | |
| Financial futures contracts | | | (1,043,527 | ) | | | (267,970 | ) | | | (521,338 | ) | |
| Net realized loss | | $ | (1,046,806 | ) | | $ | (222,125 | ) | | $ | (413,650 | ) | |
| Change in unrealized appreciation (depreciation) — | |
| Investments (identified cost basis) | | $ | (2,041,893 | ) | | $ | (199,876 | ) | | $ | (817,498 | ) | |
| Financial futures contracts | | | (717,186 | ) | | | (126,305 | ) | | | (426,187 | ) | |
| Net change in unrealized appreciation (depreciation) | | $ | (2,759,079 | ) | | $ | (326,181 | ) | | $ | (1,243,685 | ) | |
| Net realized and unrealized loss | | $ | (3,805,885 | ) | | $ | (548,306 | ) | | $ | (1,657,335 | ) | |
| Net increase (decrease) in net assets from operations | | $ | (293,438 | ) | | $ | 183,278 | | | $ | 267,717 | | |
See notes to financial statements
45
Eaton Vance Limited Maturity Municipals Funds as of March 31, 2008
FINANCIAL STATEMENTS CONT'D
Statements of Changes in Net Assets
For the Year Ended March 31, 2008
| Increase (Decrease) in Net Assets | | California
Limited Fund | | Florida Plus
Limited Fund | | Massachusetts
Limited Fund | | New Jersey
Limited Fund | |
| From operations — | |
| Net investment income | | $ | 1,467,505 | | | $ | 1,530,141 | | | $ | 2,213,543 | | | $ | 1,469,932 | | |
| Net realized gain (loss) from investment transactions and financial futures contracts | | | (101,375 | ) | | | 282,847 | | | | (465,868 | ) | | | (131,214 | ) | |
Net change in unrealized appreciation (depreciation) from investments and
financial futures contracts | | | (1,319,205 | ) | | | (1,853,322 | ) | | | (1,079,766 | ) | | | (1,121,252 | ) | |
| Net increase (decrease) in net assets from operations | | $ | 46,925 | | | $ | (40,334 | ) | | $ | 667,909 | | | $ | 217,466 | | |
| Distributions to shareholders — | |
| From net investment income | |
| Class A | | $ | (1,426,343 | ) | | $ | (1,228,918 | ) | | $ | (1,721,662 | ) | | $ | (1,458,404 | ) | |
| Class B | | | (18,806 | ) | | | (52,383 | ) | | | (70,611 | ) | | | (54,327 | ) | |
| Class C | | | (22,929 | ) | | | (280,187 | ) | | | (393,990 | ) | | | (2,024 | ) | |
| Total distributions to shareholders | | $ | (1,468,078 | ) | | $ | (1,561,488 | ) | | $ | (2,186,263 | ) | | $ | (1,514,755 | ) | |
| Transactions in shares of beneficial interest — | |
| Proceeds from sale of shares | |
| Class A | | $ | 20,742,539 | | | $ | 3,761,337 | | | $ | 16,293,882 | | | $ | 11,940,718 | | |
| Class B | | | 444,388 | | | | 893,268 | | | | 183,836 | | | | 117,531 | | |
| Class C | | | 1,801,390 | | | | 1,565,531 | | | | 1,411,574 | | | | 143,200 | | |
Net asset value of shares issued to shareholders in payment of
distributions declared | | | |
| Class A | | | 600,333 | | | | 646,118 | | | | 1,106,021 | | | | 935,605 | | |
| Class B | | | 9,381 | | | | 32,577 | | | | 43,685 | | | | 36,344 | | |
| Class C | | | 8,566 | | | | 112,680 | | | | 266,858 | | | | 1,856 | | |
| Cost of shares redeemed | |
| Class A | | | (19,746,067 | ) | | | (9,025,554 | ) | | | (13,725,522 | ) | | | (7,653,821 | ) | |
| Class B | | | (164,557 | ) | | | (691,604 | ) | | | (507,396 | ) | | | (574,169 | ) | |
| Class C | | | (872,889 | ) | | | (2,429,504 | ) | | | (2,505,608 | ) | | | — | | |
| Net asset value of shares exchanged | |
| Class A | | | 431,354 | | | | 1,680,610 | | | | 1,683,508 | | | | 1,605,600 | | |
| Class B | | | (431,354 | ) | | | (1,680,610 | ) | | | (1,683,508 | ) | | | (1,605,600 | ) | |
| Net increase (decrease) in net assets from Fund share transactions | | $ | 2,823,084 | | | $ | (5,135,151 | ) | | $ | 2,567,330 | | | $ | 4,947,264 | | |
| Net increase (decrease) in net assets | | $ | 1,401,931 | | | $ | (6,736,973 | ) | | $ | 1,048,976 | | | $ | 3,649,975 | | |
| Net Assets | |
| At beginning of year | | $ | 37,269,175 | | | $ | 45,812,125 | | | $ | 63,087,815 | | | $ | 39,907,732 | | |
| At end of year | | $ | 38,671,106 | | | $ | 39,075,152 | | | $ | 64,136,791 | | | $ | 43,557,707 | | |
Accumulated undistributed (distributions in
excess of) net investment income included
in net assets | |
| At end of year | | $ | 1,251 | | | $ | 21,830 | | | $ | (23,794 | ) | | $ | 39,338 | | |
See notes to financial statements
46
Eaton Vance Limited Maturity Municipals Funds as of March 31, 2008
FINANCIAL STATEMENTS CONT'D
Statements of Changes in Net Assets
For the Year Ended March 31, 2008
| Increase (Decrease) in Net Assets | | New York
Limited Fund | | Ohio
Limited Fund | | Pennsylvania
Limited Fund | |
| From operations — | |
| Net investment income | | $ | 3,512,447 | | | $ | 731,584 | | | $ | 1,925,052 | | |
| Net realized loss from investment transactions and financial futures contracts | | | (1,046,806 | ) | | | (222,125 | ) | | | (413,650 | ) | |
Net change in unrealized appreciation (depreciation) from investments and
financial futures contracts | | | (2,759,079 | ) | | | (326,181 | ) | | | (1,243,685 | ) | |
| Net increase (decrease) in net assets from operations | | $ | (293,438 | ) | | $ | 183,278 | | | $ | 267,717 | | |
| Distributions to shareholders — | |
| From net investment income | |
| Class A | | $ | (2,705,598 | ) | | $ | (726,581 | ) | | $ | (1,445,100 | ) | |
| Class B | | | (80,066 | ) | | | (6,264 | ) | | | (66,605 | ) | |
| Class C | | | (676,008 | ) | | | (873 | ) | | | (427,188 | ) | |
| Total distributions to shareholders | | $ | (3,461,672 | ) | | $ | (733,718 | ) | | $ | (1,938,893 | ) | |
| Transactions in shares of beneficial interest — | |
| Proceeds from sale of shares | |
| Class A | | $ | 19,329,482 | | | $ | 4,366,922 | | | $ | 10,024,969 | | |
| Class B | | | 636,460 | | | | 36,226 | | | | 34,597 | | |
| Class C | | | 6,974,414 | | | | 174,171 | | | | 2,925,390 | | |
Net asset value of shares issued to shareholders in payment of
distributions declared | | | |
| Class A | | | 2,004,730 | | | | 370,938 | | | | 763,476 | | |
| Class B | | | 52,062 | | | | 4,975 | | | | 41,261 | | |
| Class C | | | 398,652 | | | | 724 | | | | 174,325 | | |
| Cost of shares redeemed | |
| Class A | | | (22,068,992 | ) | | | (4,263,125 | ) | | | (6,340,021 | ) | |
| Class B | | | (322,284 | ) | | | (45,204 | ) | | | (580,890 | ) | |
| Class C | | | (4,799,890 | ) | | | (42,882 | ) | | | (3,436,892 | ) | |
| Net asset value of shares exchanged | |
| Class A | | | 2,706,622 | | | | 318,329 | | | | 1,987,242 | | |
| Class B | | | (2,706,622 | ) | | | (318,329 | ) | | | (1,987,242 | ) | |
| Net increase in net assets from Fund share transactions | | $ | 2,204,634 | | | $ | 602,745 | | | $ | 3,606,215 | | |
| Net increase (decrease) in net assets | | $ | (1,550,476 | ) | | $ | 52,305 | | | $ | 1,935,039 | | |
| Net Assets | |
| At beginning of year | | $ | 98,812,433 | | | $ | 19,583,156 | | | $ | 51,921,869 | | |
| At end of year | | $ | 97,261,957 | | | $ | 19,635,461 | | | $ | 53,856,908 | | |
Distributions in excess of net
investment income included in net assets | |
| At end of year | | $ | (9,204 | ) | | $ | (510 | ) | | $ | (62,135 | ) | |
See notes to financial statements
47
Eaton Vance Limited Maturity Municipals Funds as of March 31, 2008
FINANCIAL STATEMENTS CONT'D
Statements of Changes in Net Assets
For the Year Ended March 31, 2007
| Increase (Decrease) in Net Assets | | California
Limited Fund | | Florida Plus
Limited Fund | | Massachusetts
Limited Fund | | New Jersey
Limited Fund | |
| From operations — | |
| Net investment income | | $ | 1,322,289 | | | $ | 1,828,283 | | | $ | 2,323,566 | | | $ | 1,576,475 | | |
| Net realized gain from investment transactions and financial futures contracts | | | 44,399 | | | | 284,099 | | | | 411,725 | | | | 212,993 | | |
Net change in unrealized appreciation (depreciation) from investments and
financial futures contracts | | | 220,781 | | | | (60,152 | ) | | | 245,636 | | | | 183,382 | | |
| Net increase in net assets from operations | | $ | 1,587,469 | | | $ | 2,052,230 | | | $ | 2,980,927 | | | $ | 1,972,850 | | |
| Distributions to shareholders — | |
| From net investment income | |
| Class A | | $ | (1,261,454 | ) | | $ | (1,301,931 | ) | | $ | (1,692,718 | ) | | $ | (1,375,966 | ) | |
| Class B | | | (54,199 | ) | | | (135,656 | ) | | | (170,060 | ) | | | (131,878 | ) | |
| Class C | | | (10,107 | ) | | | (351,029 | ) | | | (478,095 | ) | | | (20 | ) | |
| Total distributions to shareholders | | $ | (1,325,760 | ) | | $ | (1,788,616 | ) | | $ | (2,340,873 | ) | | $ | (1,507,864 | ) | |
| Transactions in shares of beneficial interest — | |
| Proceeds from sale of shares | |
| Class A | | $ | 9,203,437 | | | $ | 2,549,511 | | | $ | 6,216,998 | | | $ | 1,753,443 | | |
| Class B | | | 229,258 | | | | 106,144 | | | | 276,214 | | | | 259,522 | | |
| Class C | | | 536,376 | | | | 826,848 | | | | 1,113,929 | | | | 1,000 | | |
Net asset value of shares issued to shareholders in payment of
distributions declared | | | |
| Class A | | | 714,915 | | | | 588,008 | | | | 928,779 | | | | 897,252 | | |
| Class B | | | 27,290 | | | | 77,904 | | | | 99,781 | | | | 81,374 | | |
| Class C | | | 821 | | | | 111,834 | | | | 296,895 | | | | 18 | | |
| Cost of shares redeemed | |
| Class A | | | (9,483,245 | ) | | | (8,233,743 | ) | | | (12,503,318 | ) | | | (5,861,020 | ) | |
| Class B | | | (761,318 | ) | | | (1,073,949 | ) | | | (1,191,698 | ) | | | (760,524 | ) | |
| Class C | | | — | | | | (4,859,469 | ) | | | (7,332,027 | ) | | | — | | |
| Net asset value of shares exchanged | |
| Class A | | | 1,431,354 | | | | 2,305,306 | | | | 2,836,369 | | | | 2,753,983 | | |
| Class B | | | (1,431,354 | ) | | | (2,305,306 | ) | | | (2,836,369 | ) | | | (2,753,983 | ) | |
| Net increase (decrease) in net assets from Fund share transactions | | $ | 467,534 | | | $ | (9,906,912 | ) | | $ | (12,094,447 | ) | | $ | (3,628,935 | ) | |
| Net increase (decrease) in net assets | | $ | 729,243 | | | $ | (9,643,298 | ) | | $ | (11,454,393 | ) | | $ | (3,163,949 | ) | |
| Net Assets | |
| At beginning of year | | $ | 36,539,932 | | | $ | 55,455,423 | | | $ | 74,542,208 | | | $ | 43,071,681 | | |
| At end of year | | $ | 37,269,175 | | | $ | 45,812,125 | | | $ | 63,087,815 | | | $ | 39,907,732 | | |
Accumulated undistributed net
investment income included in net assets | |
| At end of year | | $ | 4,161 | | | $ | 38,259 | | | $ | 21,006 | | | $ | 93,414 | | |
See notes to financial statements
48
Eaton Vance Limited Maturity Municipals Funds as of March 31, 2008
FINANCIAL STATEMENTS CONT'D
Statements of Changes in Net Assets
For the Year Ended March 31, 2007
| Increase (Decrease) in Net Assets | | New York
Limited Fund | | Ohio
Limited Fund | | Pennsylvania
Limited Fund | |
| From operations — | |
| Net investment income | | $ | 3,437,982 | | | $ | 688,037 | | | $ | 1,929,973 | | |
| Net realized gain from investment transactions and financial futures contracts | | | 150,119 | | | | 12,359 | | | | 192,060 | | |
Net change in unrealized appreciation (depreciation) from investments and
financial futures contracts | | | 939,601 | | | | 121,315 | | | | 268,536 | | |
| Net increase in net assets from operations | | $ | 4,527,702 | | | $ | 821,711 | | | $ | 2,390,569 | | |
| Distributions to shareholders — | |
| From net investment income | |
| Class A | | $ | (2,488,800 | ) | | $ | (670,838 | ) | | $ | (1,286,463 | ) | |
| Class B | | | (204,945 | ) | | | (19,407 | ) | | | (170,522 | ) | |
| Class C | | | (719,515 | ) | | | (19 | ) | | | (462,156 | ) | |
| Total distributions to shareholders | | $ | (3,413,260 | ) | | $ | (690,264 | ) | | $ | (1,919,141 | ) | |
| Transactions in shares of beneficial interest — | |
| Proceeds from sale of shares | |
| Class A | | $ | 18,487,690 | | | $ | 3,696,670 | | | $ | 1,966,250 | | |
| Class B | | | 492,970 | | | | 31,833 | | | | 212,418 | | |
| Class C | | | 2,485,851 | | | | 1,000 | | | | 2,230,520 | | |
Net asset value of shares issued to shareholders in payment of
distributions declared | | | |
| Class A | | | 1,739,279 | | | | 317,130 | | | | 726,644 | | |
| Class B | | | 129,747 | | | | 14,207 | | | | 89,742 | | |
| Class C | | | 415,277 | | | | 18 | | | | 201,131 | | |
| Cost of shares redeemed | |
| Class A | | | (11,790,972 | ) | | | (2,652,480 | ) | | | (6,188,716 | ) | |
| Class B | | | (1,754,656 | ) | | | (123,000 | ) | | | (987,087 | ) | |
| Class C | | | (7,507,850 | ) | | | — | | | | (4,248,403 | ) | |
| Net asset value of shares exchanged | |
| Class A | | | 3,479,728 | | | | 369,950 | | | | 2,622,812 | | |
| Class B | | | (3,479,728 | ) | | | (369,950 | ) | | | (2,622,812 | ) | |
| Net increase (decrease) in net assets from Fund share transactions | | $ | 2,697,336 | | | $ | 1,285,378 | | | $ | (5,997,501 | ) | |
| Net increase (decrease) in net assets | | $ | 3,811,778 | | | $ | 1,416,825 | | | $ | (5,526,073 | ) | |
| Net Assets | |
| At beginning of year | | $ | 95,000,655 | | | $ | 18,166,331 | | | $ | 57,447,942 | | |
| At end of year | | $ | 98,812,433 | | | $ | 19,583,156 | | | $ | 51,921,869 | | |
Accumulated undistributed
(distributions in excess of) net
investment income included in net assets | |
| At end of year | | $ | (47,049 | ) | | $ | 1,531 | | | $ | (43,724 | ) | |
See notes to financial statements
49
Eaton Vance Limited Maturity Municipals Funds as of March 31, 2008
FINANCIAL STATEMENTS CONT'D
Financial Highlights
| | | California Limited Fund — Class A | |
| | | Year Ended March 31, | |
| | | 2008(1) | | 2007(1) | | 2006(1) | | 2005(1) | | 2004(1) | |
| Net asset value — Beginning of year | | $ | 10.410 | | | $ | 10.330 | | | $ | 10.290 | | | $ | 10.560 | | | $ | 10.540 | | |
| Income (loss) from operations | |
| Net investment income | | $ | 0.381 | | | $ | 0.378 | | | $ | 0.377 | | | $ | 0.377 | | | $ | 0.394 | | |
| Net realized and unrealized gain (loss) | | | (0.380 | ) | | | 0.082 | | | | 0.036 | | | | (0.274 | ) | | | 0.016 | | |
| Total income from operations | | $ | 0.001 | | | $ | 0.460 | | | $ | 0.413 | | | $ | 0.103 | | | $ | 0.410 | | |
| Less distributions | |
| From net investment income | | $ | (0.381 | ) | | $ | (0.380 | ) | | $ | (0.373 | ) | | $ | (0.373 | ) | | $ | (0.390 | ) | |
| Total distributions | | $ | (0.381 | ) | | $ | (0.380 | ) | | $ | (0.373 | ) | | $ | (0.373 | ) | | $ | (0.390 | ) | |
| Net asset value — End of year | | $ | 10.030 | | | $ | 10.410 | | | $ | 10.330 | | | $ | 10.290 | | | $ | 10.560 | | |
| Total Return(2) | | | 0.00 | %(3) | | | 4.52 | % | | | 4.06 | % | | | 0.99 | % | | | 3.92 | % | |
| Ratios/Supplemental Data | |
| Net assets, end of year (000's omitted) | | $ | 36,615 | | | $ | 35,937 | | | $ | 33,830 | | | $ | 31,555 | | | $ | 29,957 | | |
| Ratios (As a percentage of average daily net assets): | |
| Expenses before custodian fee reduction | | | 0.85 | % | | | 0.93 | % | | | 0.86 | % | | | 0.90 | %(4) | | | 0.88 | %(4) | |
| Expenses after custodian fee reduction | | | 0.82 | % | | | 0.90 | % | | | 0.84 | % | | | 0.89 | %(4) | | | 0.88 | %(4) | |
| Net investment income | | | 3.70 | % | | | 3.65 | % | | | 3.64 | % | | | 3.62 | % | | | 3.73 | % | |
| Portfolio Turnover of the Portfolio | | | — | | | | — | | | | — | | | | 13 | %(5) | | | 27 | %(5) | |
| Portfolio Turnover of the Fund | | | 55 | % | | | 32 | % | | | 28 | % | | | 13 | % | | | — | | |
(1) Net investment income per share was computed using average shares outstanding.
(2) Returns are historical and are calculated by determining the percentage change in net asset value with all distributions reinvested.
(3) Represents less than 0.01%.
(4) Includes the Fund's share of its corresponding Portfolio's allocated expenses while the Fund was making investments directly into the Portfolio.
(5) Portfolio turnover represents the rate of portfolio activity for the period while the Fund was making investments directly into the Portfolio.
See notes to financial statements
50
Eaton Vance Limited Maturity Municipals Funds as of March 31, 2008
FINANCIAL STATEMENTS CONT'D
Financial Highlights
| | | California Limited Fund — Class B | |
| | | Year Ended March 31, | |
| | | 2008(1) | | 2007(1) | | 2006(1) | | 2005(1) | | 2004(1) | |
| Net asset value — Beginning of year | | $ | 10.370 | | | $ | 10.300 | | | $ | 10.260 | | | $ | 10.520 | | | $ | 10.500 | | |
| Income (loss) from operations | |
| Net investment income | | $ | 0.304 | | | $ | 0.303 | | | $ | 0.298 | | | $ | 0.301 | | | $ | 0.313 | | |
| Net realized and unrealized gain (loss) | | | (0.372 | ) | | | 0.068 | | | | 0.035 | | | | (0.268 | ) | | | 0.017 | | |
| Total income (loss) from operations | | $ | (0.068 | ) | | $ | 0.371 | | | $ | 0.333 | | | $ | 0.033 | | | $ | 0.330 | | |
| Less distributions | |
| From net investment income | | $ | (0.302 | ) | | $ | (0.301 | ) | | $ | (0.293 | ) | | $ | (0.293 | ) | | $ | (0.310 | ) | |
| Total distributions | | $ | (0.302 | ) | | $ | (0.301 | ) | | $ | (0.293 | ) | | $ | (0.293 | ) | | $ | (0.310 | ) | |
| Net asset value — End of year | | $ | 10.000 | | | $ | 10.370 | | | $ | 10.300 | | | $ | 10.260 | | | $ | 10.520 | | |
| Total Return(2) | | | (0.68 | )% | | | 3.64 | % | | | 3.28 | % | | | 0.31 | % | | | 3.16 | % | |
| Ratios/Supplemental Data | |
| Net assets, end of year (000's omitted) | | $ | 607 | | | $ | 770 | | | $ | 2,687 | | | $ | 3,837 | | | $ | 5,844 | | |
| Ratios (As a percentage of average daily net assets): | |
| Expenses before custodian fee reduction | | | 1.60 | % | | | 1.68 | % | | | 1.61 | % | | | 1.65 | %(3) | | | 1.63 | %(3) | |
| Expenses after custodian fee reduction | | | 1.57 | % | | | 1.65 | % | | | 1.59 | % | | | 1.64 | %(3) | | | 1.63 | %(3) | |
| Net investment income | | | 2.96 | % | | | 2.94 | % | | | 2.89 | % | | | 2.90 | % | | | 2.97 | % | |
| Portfolio Turnover of the Portfolio | | | — | | | | — | | | | — | | | | 13 | %(4) | | | 27 | %(4) | |
| Portfolio Turnover of the Fund | | | 55 | % | | | 32 | % | | | 28 | % | | | 13 | % | | | — | | |
(1) Net investment income per share was computed using average shares outstanding.
(2) Returns are historical and are calculated by determining the percentage change in net asset value with all distributions reinvested.
(3) Includes the Fund's share of its corresponding Portfolio's allocated expenses while the Fund was making investments directly into the Portfolio.
(4) Portfolio turnover represents the rate of portfolio activity for the period while the Fund was making investments directly into the Portfolio.
See notes to financial statements
51
Eaton Vance Limited Maturity Municipals Funds as of March 31, 2008
FINANCIAL STATEMENTS CONT'D
Financial Highlights
| | | California Limited Fund — Class C | |
| | | Year Ended March 31, | | Period Ended | |
| | | 2008(1) | | 2007(1) | | 2006(1) | | March 31, 2005(1)(2) | |
| Net asset value — Beginning of period | | $ | 10.050 | | | $ | 9.980 | | | $ | 9.950 | | | $ | 10.000 | | |
| Income (loss) from operations | |
| Net investment income | | $ | 0.294 | | | $ | 0.280 | | | $ | 0.282 | | | $ | 0.002 | | |
| Net realized and unrealized gain (loss) | | | (0.361 | ) | | | 0.082 | | | | 0.034 | | | | (0.052 | ) | |
| Total income (loss) from operations | | $ | (0.067 | ) | | $ | 0.362 | | | $ | 0.316 | | | $ | (0.050 | ) | |
| Less distributions | |
| From net investment income | | $ | (0.293 | ) | | $ | (0.292 | ) | | $ | (0.286 | ) | | $ | — | | |
| Total distributions | | $ | (0.293 | ) | | $ | (0.292 | ) | | $ | (0.286 | ) | | $ | — | | |
| Net asset value — End of period | | $ | 9.690 | | | $ | 10.050 | | | $ | 9.980 | | | $ | 9.950 | | |
| Total Return(3) | | | (0.69 | )% | | | 3.67 | % | | | 3.15 | % | | | (0.01 | )%(6) | |
| Ratios/Supplemental Data | |
| Net assets, end of period (000's omitted) | | $ | 1,449 | | | $ | 562 | | | $ | 22 | | | $ | 10 | | |
| Ratios (As a percentage of average daily net assets): | |
| Expenses before custodian fee reduction | | | 1.60 | % | | | 1.68 | % | | | 1.61 | % | | | 0.00 | %(4)(5) | |
| Expenses after custodian fee reduction | | | 1.57 | % | | | 1.65 | % | | | 1.59 | % | | | — | | |
| Net investment income | | | 2.96 | % | | | 2.78 | % | | | 2.83 | % | | | 0.00 | %(4)(5) | |
| Portfolio Turnover of the Fund | | | 55 | % | | | 32 | % | | | 28 | % | | | 13 | % | |
(1) Net investment income per share was computed using average shares outstanding.
(2) For the period from the commencement of offering of Class C shares, March 23, 2005, to March 31, 2005.
(3) Returns are historical and are calculated by determining the percentage change in net asset value with all distributions reinvested.
(4) Annualized.
(5) Represents less than 0.01%.
(6) Not annualized.
See notes to financial statements
52
Eaton Vance Limited Maturity Municipals Funds as of March 31, 2008
FINANCIAL STATEMENTS CONT'D
Financial Highlights
| | | Florida Plus Limited Fund — Class A | |
| | | Year Ended March 31, | |
| | | 2008(1) | | 2007(1) | | 2006(1) | | 2005(1) | | 2004(1) | |
| Net asset value — Beginning of year | | $ | 10.280 | | | $ | 10.230 | | | $ | 10.230 | | | $ | 10.500 | | | $ | 10.480 | | |
| Income (loss) from operations | |
| Net investment income | | $ | 0.388 | | | $ | 0.394 | | | $ | 0.385 | | | $ | 0.387 | | | $ | 0.396 | | |
| Net realized and unrealized gain (loss) | | | (0.382 | ) | | | 0.041 | | | | (0.005 | ) | | | (0.277 | ) | | | 0.018 | | |
| Total income from operations | | $ | 0.006 | | | $ | 0.435 | | | $ | 0.380 | | | $ | 0.110 | | | $ | 0.414 | | |
| Less distributions | |
| From net investment income | | $ | (0.396 | ) | | $ | (0.385 | ) | | $ | (0.380 | ) | | $ | (0.380 | ) | | $ | (0.394 | ) | |
| Total distributions | | $ | (0.396 | ) | | $ | (0.385 | ) | | $ | (0.380 | ) | | $ | (0.380 | ) | | $ | (0.394 | ) | |
| Net asset value — End of year | | $ | 9.890 | | | $ | 10.280 | | | $ | 10.230 | | | $ | 10.230 | | | $ | 10.500 | | |
| Total Return(2) | | | 0.05 | % | | | 4.32 | % | | | 3.76 | % | | | 1.06 | % | | | 3.99 | % | |
| Ratios/Supplemental Data | |
| Net assets, end of year (000's omitted) | | $ | 29,297 | | | $ | 33,440 | | | $ | 36,064 | | | $ | 44,720 | | | $ | 45,088 | | |
| Ratios (As a percentage of average daily net assets): | |
| Expenses before custodian fee reduction | | | 0.92 | % | | | 0.89 | % | | | 0.85 | % | | | 0.82 | %(3) | | | 0.82 | %(3) | |
| Expenses after custodian fee reduction | | | 0.90 | % | | | 0.87 | % | | | 0.84 | % | | | 0.81 | %(3) | | | 0.82 | %(3) | |
| Net investment income | | | 3.83 | % | | | 3.83 | % | | | 3.74 | % | | | 3.74 | % | | | 3.76 | % | |
| Portfolio Turnover of the Portfolio | | | — | | | | — | | | | — | | | | 8 | %(4) | | | 13 | %(4) | |
| Portfolio Turnover of the Fund | | | 36 | % | | | 18 | % | | | 23 | % | | | 16 | % | | | — | | |
(1) Net investment income per share was computed using average shares outstanding.
(2) Returns are historical and are calculated by determining the percentage change in net asset value with all distributions reinvested.
(3) Includes the Fund's share of its corresponding Portfolio's allocated expenses while the Fund was making investments directly into the Portfolio.
(4) Portfolio turnover represents the rate of portfolio activity for the period while the Fund was making investments directly into the Portfolio.
See notes to financial statements
53
Eaton Vance Limited Maturity Municipals Funds as of March 31, 2008
FINANCIAL STATEMENTS CONT'D
Financial Highlights
| | | Florida Plus Limited Fund — Class B | |
| | | Year Ended March 31, | |
| | | 2008(1) | | 2007(1) | | 2006(1) | | 2005(1) | | 2004(1) | |
| Net asset value — Beginning of year | | $ | 10.280 | | | $ | 10.230 | | | $ | 10.230 | | | $ | 10.500 | | | $ | 10.480 | | |
| Income (loss) from operations | |
| Net investment income | | $ | 0.314 | | | $ | 0.317 | | | $ | 0.307 | | | $ | 0.310 | | | $ | 0.316 | | |
| Net realized and unrealized gain (loss) | | | (0.385 | ) | | | 0.040 | | | | (0.007 | ) | | | (0.280 | ) | | | 0.018 | | |
| Total income (loss) from operations | | $ | (0.071 | ) | | $ | 0.357 | | | $ | 0.300 | | | $ | 0.030 | | | $ | 0.334 | | |
| Less distributions | |
| From net investment income | | $ | (0.319 | ) | | $ | (0.307 | ) | | $ | (0.300 | ) | | $ | (0.300 | ) | | $ | (0.314 | ) | |
| Total distributions | | $ | (0.319 | ) | | $ | (0.307 | ) | | $ | (0.300 | ) | | $ | (0.300 | ) | | $ | (0.314 | ) | |
| Net asset value — End of year | | $ | 9.890 | | | $ | 10.280 | | | $ | 10.230 | | | $ | 10.230 | | | $ | 10.500 | | |
| Total Return(2) | | | (0.71 | )% | | | 3.54 | % | | | 2.96 | % | | | 0.28 | % | | | 3.22 | % | |
| Ratios/Supplemental Data | |
| Net assets, end of year (000's omitted) | | $ | 1,256 | | | $ | 2,760 | | | $ | 5,925 | | | $ | 8,361 | | | $ | 8,944 | | |
| Ratios (As a percentage of average daily net assets): | |
| Expenses before custodian fee reduction | | | 1.67 | % | | | 1.64 | % | | | 1.60 | % | | | 1.57 | %(3) | | | 1.57 | %(3) | |
| Expenses after custodian fee reduction | | | 1.65 | % | | | 1.62 | % | | | 1.59 | % | | | 1.56 | %(3) | | | 1.57 | %(3) | |
| Net investment income | | | 3.09 | % | | | 3.08 | % | | | 2.98 | % | | | 3.00 | % | | | 3.01 | % | |
| Portfolio Turnover of the Portfolio | | | — | | | | — | | | | — | | | | 8 | %(4) | | | 13 | %(4) | |
| Portfolio Turnover of the Fund | | | 36 | % | | | 18 | % | | | 23 | % | | | 16 | % | | | — | | |
(1) Net investment income per share was computed using average shares outstanding.
(2) Returns are historical and are calculated by determining the percentage change in net asset value with all distributions reinvested.
(3) Includes the Fund's share of its corresponding Portfolio's allocated expenses while the Fund was making investments directly into the Portfolio.
(4) Portfolio turnover represents the rate of portfolio activity for the period while the Fund was making investments directly into the Portfolio.
See notes to financial statements
54
Eaton Vance Limited Maturity Municipals Funds as of March 31, 2008
FINANCIAL STATEMENTS CONT'D
Financial Highlights
| | | Florida Plus Limited Fund — Class C | |
| | | Year Ended March 31, | |
| | | 2008(1) | | 2007(1) | | 2006(1) | | 2005(1) | | 2004(1) | |
| Net asset value — Beginning of year | | $ | 9.700 | | | $ | 9.660 | | | $ | 9.650 | | | $ | 9.910 | | | $ | 9.890 | | |
| Income (loss) from operations | |
| Net investment income | | $ | 0.295 | | | $ | 0.299 | | | $ | 0.291 | | | $ | 0.293 | | | $ | 0.298 | | |
| Net realized and unrealized gain (loss) | | | (0.354 | ) | | | 0.031 | | | | 0.004 | | | | (0.268 | ) | | | 0.021 | | |
| Total income (loss) from operations | | $ | (0.059 | ) | | $ | 0.330 | | | $ | 0.295 | | | $ | 0.025 | | | $ | 0.319 | | |
| Less distributions | |
| From net investment income | | $ | (0.301 | ) | | $ | (0.290 | ) | | $ | (0.285 | ) | | $ | (0.285 | ) | | $ | (0.299 | ) | |
| Total distributions | | $ | (0.301 | ) | | $ | (0.290 | ) | | $ | (0.285 | ) | | $ | (0.285 | ) | | $ | (0.299 | ) | |
| Net asset value — End of year | | $ | 9.340 | | | $ | 9.700 | | | $ | 9.660 | | | $ | 9.650 | | | $ | 9.910 | | |
| Total Return(2) | | | (0.63 | )% | | | 3.46 | % | | | 3.07 | % | | | 0.19 | %(3) | | | 3.24 | % | |
| Ratios/Supplemental Data | |
| Net assets, end of year (000's omitted) | | $ | 8,522 | | | $ | 9,612 | | | $ | 13,466 | | | $ | 17,467 | | | $ | 19,226 | | |
| Ratios (As a percentage of average daily net assets): | |
| Expenses before custodian fee reduction | | | 1.67 | % | | | 1.64 | % | | | 1.60 | % | | | 1.57 | %(4) | | | 1.57 | %(4) | |
| Expenses after custodian fee reduction | | | 1.65 | % | | | 1.62 | % | | | 1.59 | % | | | 1.56 | %(4) | | | 1.57 | %(4) | |
| Net investment income | | | 3.08 | % | | | 3.09 | % | | | 2.99 | % | | | 3.00 | % | | | 3.00 | % | |
| Portfolio Turnover of the Portfolio | | | — | | | | — | | | | — | | | | 8 | %(5) | | | 13 | %(5) | |
| Portfolio Turnover of the Fund | | | 36 | % | | | 18 | % | | | 23 | % | | | 16 | % | | | — | | |
(1) Net investment income per share was computed using average shares outstanding.
(2) Returns are historical and are calculated by determining the percentage change in net asset value with all distributions reinvested.
(3) Total return reflects a decrease of 0.06% due to a change in the timing of the payment and reinvestment of distributions.
(4) Includes the Fund's share of its corresponding Portfolio's allocated expenses while the Fund was making investments directly into the Portfolio.
(5) Portfolio turnover represents the rate of portfolio activity for the period while the Fund was making investments directly into the Portfolio.
See notes to financial statements
55
Eaton Vance Limited Maturity Municipals Funds as of March 31, 2008
FINANCIAL STATEMENTS CONT'D
Financial Highlights
| | | Massachusetts Limited Fund — Class A | |
| | | Year Ended March 31, | |
| | | 2008(1) | | 2007(1) | | 2006(1) | | 2005(1) | | 2004(1) | |
| Net asset value — Beginning of year | | $ | 10.200 | | | $ | 10.110 | | | $ | 10.180 | | | $ | 10.460 | | | $ | 10.450 | | |
| Income (loss) from operations | |
| Net investment income | | $ | 0.371 | | | $ | 0.372 | | | $ | 0.367 | | | $ | 0.370 | | | $ | 0.384 | | |
| Net realized and unrealized gain (loss) | | | (0.231 | ) | | | 0.092 | | | | (0.074 | ) | | | (0.287 | ) | | | 0.013 | | |
| Total income from operations | | $ | 0.140 | | | $ | 0.464 | | | $ | 0.293 | | | $ | 0.083 | | | $ | 0.397 | | |
| Less distributions | |
| From net investment income | | $ | (0.370 | ) | | $ | (0.374 | ) | | $ | (0.363 | ) | | $ | (0.363 | ) | | $ | (0.387 | ) | |
| Total distributions | | $ | (0.370 | ) | | $ | (0.374 | ) | | $ | (0.363 | ) | | $ | (0.363 | ) | | $ | (0.387 | ) | |
| Net asset value — End of year | | $ | 9.970 | | | $ | 10.200 | | | $ | 10.110 | | | $ | 10.180 | | | $ | 10.460 | | |
| Total Return(2) | | | 1.39 | % | | | 4.66 | % | | | 2.90 | % | | | 0.79 | % | | | 3.84 | % | |
| Ratios/Supplemental Data | |
| Net assets, end of year (000's omitted) | | $ | 49,514 | | | $ | 45,300 | | | $ | 47,407 | | | $ | 48,901 | | | $ | 47,567 | | |
| Ratios (As a percentage of average daily net assets): | |
| Expenses before custodian fee reduction | | | 0.84 | % | | | 0.84 | % | | | 0.82 | % | | | 0.82 | %(3) | | | 0.80 | %(3) | |
| Expenses after custodian fee reduction | | | 0.83 | % | | | 0.82 | % | | | 0.81 | % | | | 0.81 | %(3) | | | 0.80 | %(3) | |
| Net investment income | | | 3.67 | % | | | 3.65 | % | | | 3.59 | % | | | 3.59 | % | | | 3.66 | % | |
| Portfolio Turnover of the Portfolio | | | — | | | | — | | | | — | | | | 13 | %(4) | | | 12 | %(4) | |
| Portfolio Turnover of the Fund | | | 14 | % | | | 14 | % | | | 7 | % | | | 7 | % | | | — | | |
(1) Net investment income per share was computed using average shares outstanding.
(2) Returns are historical and are calculated by determining the percentage change in net asset value with all distributions reinvested.
(3) Includes the Fund's share of its corresponding Portfolio's allocated expenses while the Fund was making investments directly into the Portfolio.
(4) Portfolio turnover represents the rate of portfolio activity for the period while the Fund was making investments directly into the Portfolio.
See notes to financial statements
56
Eaton Vance Limited Maturity Municipals Funds as of March 31, 2008
FINANCIAL STATEMENTS CONT'D
Financial Highlights
| | | Massachusetts Limited Fund — Class B | |
| | | Year Ended March 31, | |
| | | 2008(1) | | 2007(1) | | 2006(1) | | 2005(1) | | 2004(1) | |
| Net asset value — Beginning of year | | $ | 10.200 | | | $ | 10.110 | | | $ | 10.170 | | | $ | 10.450 | | | $ | 10.430 | | |
| Income (loss) from operations | |
| Net investment income | | $ | 0.297 | | | $ | 0.295 | | | $ | 0.289 | | | $ | 0.292 | | | $ | 0.304 | | |
| Net realized and unrealized gain (loss) | | | (0.244 | ) | | | 0.092 | | | | (0.066 | ) | | | (0.289 | ) | | | 0.022 | | |
| Total income from operations | | $ | 0.053 | | | $ | 0.387 | | | $ | 0.223 | | | $ | 0.003 | | | $ | 0.326 | | |
| Less distributions | |
| From net investment income | | $ | (0.293 | ) | | $ | (0.297 | ) | | $ | (0.283 | ) | | $ | (0.283 | ) | | $ | (0.306 | ) | |
| Total distributions | | $ | (0.293 | ) | | $ | (0.297 | ) | | $ | (0.283 | ) | | $ | (0.283 | ) | | $ | (0.306 | ) | |
| Net asset value — End of year | | $ | 9.960 | | | $ | 10.200 | | | $ | 10.110 | | | $ | 10.170 | | | $ | 10.450 | | |
| Total Return(2) | | | 0.52 | % | | | 3.87 | % | | | 2.20 | % | | | 0.02 | % | | | 3.16 | % | |
| Ratios/Supplemental Data | |
| Net assets, end of year (000's omitted) | | $ | 1,628 | | | $ | 3,648 | | | $ | 7,234 | | | $ | 10,350 | | | $ | 10,818 | | |
| Ratios (As a percentage of average daily net assets): | |
| Expenses before custodian fee reduction | | | 1.60 | % | | | 1.59 | % | | | 1.57 | % | | | 1.57 | %(3) | | | 1.55 | %(3) | |
| Expenses after custodian fee reduction | | | 1.58 | % | | | 1.57 | % | | | 1.56 | % | | | 1.56 | %(3) | | | 1.55 | %(3) | |
| Net investment income | | | 2.94 | % | | | 2.91 | % | | | 2.83 | % | | | 2.83 | % | | | 2.91 | % | |
| Portfolio Turnover of the Portfolio | | | — | | | | — | | | | — | | | | 13 | %(4) | | | 12 | %(4) | |
| Portfolio Turnover of the Fund | | | 14 | % | | | 14 | % | | | 7 | % | | | 7 | % | | | — | | |
(1) Net investment income per share was computed using average shares outstanding.
(2) Returns are historical and are calculated by determining the percentage change in net asset value with all distributions reinvested.
(3) Includes the Fund's share of its corresponding Portfolio's allocated expenses while the Fund was making investments directly into the Portfolio.
(4) Portfolio turnover represents the rate of portfolio activity for the period while the Fund was making investments directly into the Portfolio.
See notes to financial statements
57
Eaton Vance Limited Maturity Municipals Funds as of March 31, 2008
FINANCIAL STATEMENTS CONT'D
Financial Highlights
| | | Massachusetts Limited Fund — Class C | |
| | | Year Ended March 31, | |
| | | 2008(1) | | 2007(1) | | 2006(1) | | 2005(1) | | 2004(1) | |
| Net asset value — Beginning of year | | $ | 9.770 | | | $ | 9.690 | | | $ | 9.740 | | | $ | 10.020 | | | $ | 10.010 | | |
| Income (loss) from operations | |
| Net investment income | | $ | 0.284 | | | $ | 0.284 | | | $ | 0.278 | | | $ | 0.280 | | | $ | 0.289 | | |
| Net realized and unrealized gain (loss) | | | (0.223 | ) | | | 0.081 | | | | (0.057 | ) | | | (0.287 | ) | | | 0.017 | | |
| Total income (loss) from operations | | $ | 0.061 | | | $ | 0.365 | | | $ | 0.221 | | | $ | (0.007 | ) | | $ | 0.306 | | |
| Less distributions | |
| From net investment income | | $ | (0.281 | ) | | $ | (0.285 | ) | | $ | (0.271 | ) | | $ | (0.273 | ) | | $ | (0.296 | ) | |
| Total distributions | | $ | (0.281 | ) | | $ | (0.285 | ) | | $ | (0.271 | ) | | $ | (0.273 | ) | | $ | (0.296 | ) | |
| Net asset value — End of year | | $ | 9.550 | | | $ | 9.770 | | | $ | 9.690 | | | $ | 9.740 | | | $ | 10.020 | | |
| Total Return(2) | | | 0.63 | % | | | 3.81 | % | | | 2.28 | % | | | (0.14 | )%(3) | | | 3.09 | % | |
| Ratios/Supplemental Data | |
| Net assets, end of year (000's omitted) | | $ | 12,995 | | | $ | 14,139 | | | $ | 19,901 | | | $ | 27,589 | | | $ | 28,195 | | |
| Ratios (As a percentage of average daily net assets): | |
| Expenses before custodian fee reduction | | | 1.60 | % | | | 1.59 | % | | | 1.57 | % | | | 1.57 | %(4) | | | 1.55 | %(4) | |
| Expenses after custodian fee reduction | | | 1.58 | % | | | 1.57 | % | | | 1.56 | % | | | 1.56 | %(4) | | | 1.55 | %(4) | |
| Net investment income | | | 2.93 | % | | | 2.91 | % | | | 2.84 | % | | | 2.83 | % | | | 2.88 | % | |
| Portfolio Turnover of the Portfolio | | | — | | | | — | | | | — | | | | 13 | %(5) | | | 12 | %(5) | |
| Portfolio Turnover of the Fund | | | 14 | % | | | 14 | % | | | 7 | % | | | 7 | % | | | — | | |
(1) Net investment income per share was computed using average shares outstanding.
(2) Returns are historical and are calculated by determining the percentage change in net asset value with all distributions reinvested.
(3) Total return reflects a decrease of 0.05% due to a change in the timing of the payment and reinvestment of distributions.
(4) Includes the Fund's share of its corresponding Portfolio's allocated expenses while the Fund was making investments directly into the Portfolio.
(5) Portfolio turnover represents the rate of portfolio activity for the period while the Fund was making investments directly into the Portfolio.
See notes to financial statements
58
Eaton Vance Limited Maturity Municipals Funds as of March 31, 2008
FINANCIAL STATEMENTS CONT'D
Financial Highlights
| | | New Jersey Limited Fund — Class A | |
| | | Year Ended March 31, | |
| | | 2008(1) | | 2007(1) | | 2006(1) | | 2005(1) | | 2004(1) | |
| Net asset value — Beginning of year | | $ | 10.210 | | | $ | 10.110 | | | $ | 10.100 | | | $ | 10.360 | | | $ | 10.300 | | |
| Income (loss) from operations | |
| Net investment income | | $ | 0.372 | | | $ | 0.392 | | | $ | 0.371 | | | $ | 0.366 | | | $ | 0.379 | | |
| Net realized and unrealized gain (loss) | | | (0.298 | ) | | | 0.083 | | | | 0.001 | | | | (0.266 | ) | | | 0.052 | | |
| Total income from operations | | $ | 0.074 | | | $ | 0.475 | | | $ | 0.372 | | | $ | 0.100 | | | $ | 0.431 | | |
| Less distributions | |
| From net investment income | | $ | (0.384 | ) | | $ | (0.375 | ) | | $ | (0.362 | ) | | $ | (0.360 | ) | | $ | (0.371 | ) | |
| Total distributions | | $ | (0.384 | ) | | $ | (0.375 | ) | | $ | (0.362 | ) | | $ | (0.360 | ) | | $ | (0.371 | ) | |
| Net asset value — End of year | | $ | 9.900 | | | $ | 10.210 | | | $ | 10.110 | | | $ | 10.100 | | | $ | 10.360 | | |
| Total Return(2) | | | 0.74 | % | | | 4.76 | % | | | 3.74 | % | | | 0.98 | % | | | 4.22 | % | |
| Ratios/Supplemental Data | |
| Net assets, end of year (000's omitted) | | $ | 42,612 | | | $ | 37,031 | | | $ | 37,080 | | | $ | 43,424 | | | $ | 46,192 | | |
| Ratios (As a percentage of average daily net assets): | |
| Expenses excluding interest and fees | | | 0.91 | % | | | 0.91 | % | | | 0.88 | % | | | 0.87 | %(3) | | | 0.84 | %(3) | |
| Interest and fee expenses(5) | | | 0.02 | % | | | — | | | | — | | | | — | | | | — | | |
| Total expenses before custodian fee reduction | | | 0.93 | % | | | 0.91 | % | | | 0.88 | % | | | 0.87 | % | | | 0.84 | % | |
| Expenses after custodian fee reduction excluding interest and fees | | | 0.88 | % | | | 0.90 | % | | | 0.87 | % | | | 0.86 | %(3) | | | 0.84 | %(3) | |
| Net investment income | | | 3.69 | % | | | 3.85 | % | | | 3.66 | % | | | 3.59 | % | | | 3.66 | % | |
| Portfolio Turnover of the Portfolio | | | — | | | | — | | | | — | | | | 11 | %(4) | | | 11 | %(4) | |
| Portfolio Turnover of the Fund | | | 12 | % | | | 18 | % | | | 25 | % | | | 14 | % | | | — | | |
(1) Net investment income per share was computed using average shares outstanding.
(2) Returns are historical and are calculated by determining the percentage change in net asset value with all distributions reinvested.
(3) Includes the Fund's share of its corresponding Portfolio's allocated expenses while the Fund was making investments directly into the Portfolio.
(4) Portfolio turnover represents the rate of Portfolio activity for the period while the Fund was making investments directly into the Portfolio.
(5) Interest and fee expense relates to the liability for floating rate notes issued in conjunction with inverse floater securities transactions (See Note 1I).
See notes to financial statements
59
Eaton Vance Limited Maturity Municipals Funds as of March 31, 2008
FINANCIAL STATEMENTS CONT'D
Financial Highlights
| | | New Jersey Limited Fund — Class B | |
| | | Year Ended March 31, | |
| | | 2008(1) | | 2007(1) | | 2006(1) | | 2005(1) | | 2004(1) | |
| Net asset value — Beginning of year | | $ | 10.210 | | | $ | 10.100 | | | $ | 10.100 | | | $ | 10.350 | | | $ | 10.290 | | |
| Income (loss) from operations | |
| Net investment income | | $ | 0.302 | | | $ | 0.316 | | | $ | 0.294 | | | $ | 0.290 | | | $ | 0.302 | | |
| Net realized and unrealized gain (loss) | | | (0.305 | ) | | | 0.093 | | | | (0.009 | ) | | | (0.260 | ) | | | 0.051 | | |
| Total income (loss) from operations | | $ | (0.003 | ) | | $ | 0.409 | | | $ | 0.285 | | | $ | 0.030 | | | $ | 0.353 | | |
| Less distributions | |
| From net investment income | | $ | (0.307 | ) | | $ | (0.299 | ) | | $ | (0.285 | ) | | $ | (0.280 | ) | | $ | (0.293 | ) | |
| Total distributions | | $ | (0.307 | ) | | $ | (0.299 | ) | | $ | (0.285 | ) | | $ | (0.280 | ) | | $ | (0.293 | ) | |
| Net asset value — End of year | | $ | 9.900 | | | $ | 10.210 | | | $ | 10.100 | | | $ | 10.100 | | | $ | 10.350 | | |
| Total Return(2) | | | (0.03 | )% | | | 4.09 | % | | | 2.85 | % | | | 0.30 | % | | | 3.45 | % | |
| Ratios/Supplemental Data | |
| Net assets, end of year (000's omitted) | | $ | 801 | | | $ | 2,875 | | | $ | 5,992 | | | $ | 8,851 | | | $ | 10,211 | | |
| Ratios (As a percentage of average daily net assets): | |
| Expenses excluding interest and fees | | | 1.66 | % | | | 1.66 | % | | | 1.63 | % | | | 1.62 | %(3) | | | 1.59 | %(3) | |
| Interest and fee expense(5) | | | 0.02 | % | | | — | | | | — | | | | — | | | | — | | |
| Total expenses before custodian fee reduction | | | 1.68 | % | | | 1.66 | % | | | 1.63 | % | | | 1.62 | % | | | 1.59 | % | |
| Expenses after custodian fee reduction excluding interest and fees | | | 1.64 | % | | | 1.65 | % | | | 1.62 | % | | | 1.61 | %(3) | | | 1.59 | %(3) | |
| Net investment income | | | 2.99 | % | | | 3.11 | % | | | 2.91 | % | | | 2.84 | % | | | 2.91 | % | |
| Portfolio Turnover of the Portfolio | | | — | | | | — | | | | — | | | | 11 | %(4) | | | 11 | %(4) | |
| Portfolio Turnover of the Fund | | | 12 | % | | | 18 | % | | | 25 | % | | | 14 | % | | | — | | |
(1) Net investment income per share was computed using average shares outstanding.
(2) Returns are historical and are calculated by determining the percentage change in net asset value with all distributions reinvested.
(3) Includes the Fund's share of its corresponding Portfolio's allocated expenses while the Fund was making investments directly into the Portfolio.
(4) Portfolio turnover represents the rate of Portfolio activity for the period while the Fund was making investments directly into the Portfolio.
(5) Interest and fee expense relates to the liability for floating rate notes issued in conjunction with inverse floater securities transactions (See Note 1I).
See notes to financial statements
60
Eaton Vance Limited Maturity Municipals Funds as of March 31, 2008
FINANCIAL STATEMENTS CONT'D
Financial Highlights
| | | New Jersey Limited Fund — Class C | |
| | | Year Ended
March 31, 2008(1) | | Period Ended
March 31, 2007(1)(2) | |
| Net asset value — Beginning of period | | $ | 10.210 | | | $ | 10.110 | | |
| Income (loss) from operations | |
| Net investment income | | $ | 0.289 | | | $ | 0.210 | | |
| Net realized and unrealized gain (loss) | | | (0.282 | ) | | | 0.089 | | |
| Total income from operations | | $ | 0.007 | | | $ | 0.299 | | |
| Less distributions | |
| From net investment income | | $ | (0.307 | ) | | $ | (0.199 | ) | |
| Total distributions | | $ | (0.307 | ) | | $ | (0.199 | ) | |
| Net asset value — End of period | | $ | 9.910 | | | $ | 10.210 | | |
| Total Return(3) | | | 0.08 | % | | | 2.84 | %(6) | |
| Ratios/Supplemental Data | |
| Net assets, end of period (000's omitted) | | $ | 144 | | | $ | 1 | | |
| Ratios (As a percentage of average daily net assets): | |
| Expenses excluding interest and fees | | | 1.64 | % | | | 1.63 | %(4) | |
| Interest and fee expense(7) | | | 0.02 | % | | | — | | |
| Total expenses before custodian fee reduction | | | 1.66 | % | | | 1.63 | % | |
| Expenses after custodian fee reduction excluding interest and fees | | | 1.61 | % | | | 1.62 | %(4) | |
| Net investment income | | | 2.87 | % | | | 3.09 | %(4) | |
| Portfolio Turnover of the Fund | | | 12 | % | | | 18 | %(5) | |
(1) Net investment income per share was computed using average shares outstanding.
(2) For the period from the commencement of offering of Class C shares, August 1, 2006, to March 31, 2007.
(3) Returns are historical and are calculated by determining the percentage change in net asset value with all distributions reinvested.
(4) Annualized.
(5) For the Fund's fiscal year ended March 31, 2007.
(6) Not annualized.
(7) Interest and fee expense relates to the liability for floating rate notes issued in conjunction with inverse floater securities transactions (See Note 1I).
See notes to financial statements
61
Eaton Vance Limited Maturity Municipals Funds as of March 31, 2008
FINANCIAL STATEMENTS CONT'D
Financial Highlights
| | | New York Limited Fund — Class A | |
| | | Year Ended March 31, | |
| | | 2008(1) | | 2007(1) | | 2006(1) | | 2005(1) | | 2004(1) | |
| Net asset value — Beginning of year | | $ | 10.600 | | | $ | 10.480 | | | $ | 10.540 | | | $ | 10.850 | | | $ | 10.770 | | |
| Income (loss) from operations | |
| Net investment income | | $ | 0.402 | | | $ | 0.395 | | | $ | 0.388 | | | $ | 0.394 | | | $ | 0.400 | | |
| Net realized and unrealized gain (loss) | | | (0.405 | ) | | | 0.118 | | | | (0.059 | ) | | | (0.315 | ) | | | 0.081 | | |
| Total income (loss) from operations | | $ | (0.003 | ) | | $ | 0.513 | | | $ | 0.329 | | | $ | 0.079 | | | $ | 0.481 | | |
| Less distributions | |
| From net investment income | | $ | (0.397 | ) | | $ | (0.393 | ) | | $ | (0.389 | ) | | $ | (0.389 | ) | | $ | (0.401 | ) | |
| Total distributions | | $ | (0.397 | ) | | $ | (0.393 | ) | | $ | (0.389 | ) | | $ | (0.389 | ) | | $ | (0.401 | ) | |
| Net asset value — End of year | | $ | 10.200 | | | $ | 10.600 | | | $ | 10.480 | | | $ | 10.540 | | | $ | 10.850 | | |
| Total Return(2) | | | (0.03 | )% | | | 4.97 | % | | | 3.15 | % | | | 0.73 | % | | | 4.51 | % | |
| Ratios/Supplemental Data | |
| Net assets, end of year (000's omitted) | | $ | 71,401 | | | $ | 72,201 | | | $ | 59,546 | | | $ | 62,843 | | | $ | 67,711 | | |
| Ratios (As a percentage of average daily net assets): | |
| Expenses excluding interest and fees | | | 0.82 | % | | | 0.82 | % | | | 0.82 | % | | | 0.80 | %(4) | | | 0.79 | %(4) | |
| Interest and fee expense(3) | | | 0.01 | % | | | 0.02 | % | | | — | | | | — | | | | — | | |
| Total expenses before custodian fee reduction | | | 0.83 | % | | | 0.84 | % | | | 0.82 | % | | | 0.80 | %(4) | | | 0.79 | %(4) | |
| Expenses after custodian fee reduction excluding interest and fees | | | 0.81 | % | | | 0.81 | % | | | 0.81 | % | | | 0.80 | %(4) | | | 0.79 | %(4) | |
| Net investment income | | | 3.85 | % | | | 3.73 | % | | | 3.67 | % | | | 3.69 | % | | | 3.69 | % | |
| Portfolio Turnover of the Portfolio | | | — | | | | — | | | | — | | | | 7 | %(5) | | | 20 | %(5) | |
| Portfolio Turnover of the Fund | | | 14 | % | | | 22 | % | | | 22 | % | | | 12 | % | | | — | | |
(1) Net investment income per share was computed using average shares outstanding.
(2) Returns are historical and are calculated by determining the percentage change in net asset value with all distributions reinvested.
(3) Interest and fee expense relates to the liability for floating rate notes issued in conjunction with inverse floater securities transactions (See Note 1I).
(4) Includes the Fund's share of its corresponding Portfolio's allocated expenses while the Fund was making investments directly into the Portfolio.
(5) Portfolio turnover represents the rate of portfolio activity for the period while the Fund was making investments directly into the Portfolio.
See notes to financial statements
62
Eaton Vance Limited Maturity Municipals Funds as of March 31, 2008
FINANCIAL STATEMENTS CONT'D
Financial Highlights
| | | New York Limited Fund — Class B | |
| | | Year Ended March 31, | |
| | | 2008(1) | | 2007(1) | | 2006(1) | | 2005(1) | | 2004(1) | |
| Net asset value — Beginning of year | | $ | 10.590 | | | $ | 10.470 | | | $ | 10.530 | | | $ | 10.840 | | | $ | 10.760 | | |
| Income (loss) from operations | |
| Net investment income | | $ | 0.324 | | | $ | 0.317 | | | $ | 0.308 | | | $ | 0.314 | | | $ | 0.318 | | |
| Net realized and unrealized gain (loss) | | | (0.406 | ) | | | 0.117 | | | | (0.061 | ) | | | (0.317 | ) | | | 0.081 | | |
| Total income (loss) from operations | | $ | (0.082 | ) | | $ | 0.434 | | | $ | 0.247 | | | $ | (0.003 | ) | | $ | 0.399 | | |
| Less distributions | |
| From net investment income | | $ | (0.318 | ) | | $ | (0.314 | ) | | $ | (0.307 | ) | | $ | (0.307 | ) | | $ | (0.319 | ) | |
| Total distributions | | $ | (0.318 | ) | | $ | (0.314 | ) | | $ | (0.307 | ) | | $ | (0.307 | ) | | $ | (0.319 | ) | |
| Net asset value — End of year | | $ | 10.190 | | | $ | 10.590 | | | $ | 10.470 | | | $ | 10.530 | | | $ | 10.840 | | |
| Total Return(2) | | | (0.79 | )% | | | 4.19 | % | | | 2.36 | % | | | (0.03 | )% | | | 3.73 | % | |
| Ratios/Supplemental Data | |
| Net assets, end of year (000's omitted) | | $ | 2,017 | | | $ | 4,457 | | | $ | 8,978 | | | $ | 12,518 | | | $ | 15,389 | | |
| Ratios (As a percentage of average daily net assets): | |
| Expenses excluding interest and fees | | | 1.57 | % | | | 1.56 | % | | | 1.57 | % | | | 1.55 | %(4) | | | 1.54 | %(4) | |
| Interest and fee expense(3) | | | 0.01 | % | | | 0.02 | % | | | — | | | | — | | | | — | | |
| Total expenses before custodian fee reduction | | | 1.58 | % | | | 1.58 | % | | | 1.57 | % | | | 1.55 | %(4) | | | 1.54 | %(4) | |
| Expenses after custodian fee reduction excluding interest and fees | | | 1.56 | % | | | 1.57 | % | | | 1.56 | % | | | 1.55 | %(4) | | | 1.54 | %(4) | |
| Net investment income | | | 3.10 | % | | | 3.00 | % | | | 2.92 | % | | | 2.94 | % | | | 2.93 | % | |
| Portfolio Turnover of the Portfolio | | | — | | | | — | | | | — | | | | 7 | %(5) | | | 20 | %(5) | |
| Portfolio Turnover of the Fund | | | 14 | % | | | 22 | % | | | 22 | % | | | 12 | % | | | — | | |
(1) Net investment income per share was computed using average shares outstanding.
(2) Returns are historical and are calculated by determining the percentage change in net asset value with all distributions reinvested.
(3) Interest and fee expense relates to the liability for floating rate notes issued in conjunction with inverse floater securities transactions (See Note 1I).
(4) Includes the Fund's share of its corresponding Portfolio's allocated expenses while the Fund was making investments directly into the Portfolio.
(5) Portfolio turnover represents the rate of portfolio activity for the period while the Fund was making investments directly into the Portfolio.
See notes to financial statements
63
Eaton Vance Limited Maturity Municipals Funds as of March 31, 2008
FINANCIAL STATEMENTS CONT'D
Financial Highlights
| | | New York Limited Fund — Class C | |
| | | Year Ended March 31, | |
| | | 2008(1) | | 2007(1) | | 2006(1) | | 2005(1) | | 2004(1) | |
| Net asset value — Beginning of year | | $ | 10.070 | | | $ | 9.960 | | | $ | 10.020 | | | $ | 10.310 | | | $ | 10.230 | | |
| Income (loss) from operations | |
| Net investment income | | $ | 0.308 | | | $ | 0.301 | | | $ | 0.294 | | | $ | 0.299 | | | $ | 0.301 | | |
| Net realized and unrealized gain (loss) | | | (0.385 | ) | | | 0.107 | | | | (0.062 | ) | | | (0.299 | ) | | | 0.081 | | |
| Total income (loss) from operations | | $ | (0.077 | ) | | $ | 0.408 | | | $ | 0.232 | | | $ | — | | | $ | 0.382 | | |
| Less distributions | |
| From net investment income | | $ | (0.303 | ) | | $ | (0.298 | ) | | $ | (0.292 | ) | | $ | (0.290 | ) | | $ | (0.302 | ) | |
| Total distributions | | $ | (0.303 | ) | | $ | (0.298 | ) | | $ | (0.292 | ) | | $ | (0.290 | ) | | $ | (0.302 | ) | |
| Net asset value — End of year | | $ | 9.690 | | | $ | 10.070 | | | $ | 9.960 | | | $ | 10.020 | | | $ | 10.310 | | |
| Total Return(2) | | | (0.78 | )% | | | 4.14 | % | | | 2.32 | % | | | (0.07 | )%(3) | | | 3.76 | % | |
| Ratios/Supplemental Data | |
| Net assets, end of year (000's omitted) | | $ | 23,844 | | | $ | 22,155 | | | $ | 26,477 | | | $ | 36,837 | | | $ | 42,627 | | |
| Ratios (As a percentage of average daily net assets): | |
| Expenses excluding interest and fees | | | 1.57 | % | | | 1.56 | % | | | 1.57 | % | | | 1.55 | %(5) | | | 1.54 | %(5) | |
| Interest and fee expense(4) | | | 0.01 | % | | | 0.02 | % | | | — | | | | — | | | | — | | |
| Total expenses before custodian fee reduction | | | 1.58 | % | | | 1.58 | % | | | 1.57 | % | | | 1.55 | %(5) | | | 1.54 | %(5) | |
| Expenses after custodian fee reduction excluding interest and fees | | | 1.56 | % | | | 1.57 | % | | | 1.56 | % | | | 1.55 | %(5) | | | 1.54 | %(5) | |
| Net investment income | | | 3.10 | % | | | 3.00 | % | | | 2.92 | % | | | 2.94 | % | | | 2.92 | % | |
| Portfolio Turnover of the Portfolio | | | — | | | | — | | | | — | | | | 7 | %(6) | | | 20 | %(6) | |
| Portfolio Turnover of the Fund | | | 14 | % | | | 22 | % | | | 22 | % | | | 12 | % | | | — | | |
(1) Net investment income per share was computed using average shares outstanding.
(2) Returns are historical and are calculated by determining the percentage change in net asset value with all distributions reinvested.
(3) Total return reflects a decrease of 0.06% due to a change in the timing of the payment and reinvestment of distributions.
(4) Interest and fee expense relates to the liability for floating rate notes issued in conjunction with inverse floater securities transactions (See Note 1I).
(5) Includes the Fund's share of its corresponding Portfolio's allocated expenses while the Fund was making investments directly into the Portfolio.
(6) Portfolio turnover represents the rate of portfolio activity for the period while the Fund was making investments directly into the Portfolio.
See notes to financial statements
64
Eaton Vance Limited Maturity Municipals Funds as of March 31, 2008
FINANCIAL STATEMENTS CONT'D
Financial Highlights
| | | Ohio Limited Fund — Class A | |
| | | Year Ended March 31, | |
| | | 2008(1) | | 2007(1) | | 2006(1) | | 2005(1) | | 2004(1) | |
| Net asset value — Beginning of year | | $ | 9.680 | | | $ | 9.620 | | | $ | 9.740 | | | $ | 10.020 | | | $ | 10.010 | | |
| Income (loss) from operations | |
| Net investment income | | $ | 0.350 | | | $ | 0.349 | | | $ | 0.346 | | | $ | 0.363 | | | $ | 0.361 | | |
| Net realized and unrealized gain (loss) | | | (0.259 | ) | | | 0.061 | | | | (0.104 | ) | | | (0.293 | ) | | | 0.014 | | |
| Total income from operations | | $ | 0.091 | | | $ | 0.410 | | | $ | 0.242 | | | $ | 0.070 | | | $ | 0.375 | | |
| Less distributions | |
| From net investment income | | $ | (0.351 | ) | | $ | (0.350 | ) | | $ | (0.362 | ) | | $ | (0.350 | ) | | $ | (0.365 | ) | |
| Total distributions | | $ | (0.351 | ) | | $ | (0.350 | ) | | $ | (0.362 | ) | | $ | (0.350 | ) | | $ | (0.365 | ) | |
| Net asset value — End of year | | $ | 9.420 | | | $ | 9.680 | | | $ | 9.620 | | | $ | 9.740 | | | $ | 10.020 | | |
| Total Return(2) | | | 0.96 | % | | | 4.33 | % | | | 2.50 | % | | | 0.70 | % | | | 3.80 | % | |
| Ratios/Supplemental Data | |
| Net assets, end of year (000's omitted) | | $ | 19,394 | | | $ | 19,144 | | | $ | 17,286 | | | $ | 16,783 | | | $ | 20,404 | | |
| Ratios (As a percentage of average daily net assets): | |
| Expenses before custodian fee reduction | | | 1.02 | % | | | 1.03 | % | | | 1.04 | % | | | 1.05 | %(3) | | | 0.99 | %(3) | |
| Expenses after custodian fee reduction | | | 1.00 | % | | | 0.99 | % | | | 1.02 | % | | | 1.04 | %(3) | | | 0.99 | %(3) | |
| Net investment income | | | 3.65 | % | | | 3.60 | % | | | 3.55 | % | | | 3.68 | % | | | 3.61 | % | |
| Portfolio Turnover of the Portfolio | | | — | | | | — | | | | — | | | | 6 | %(4) | | | 28 | %(4) | |
| Portfolio Turnover of the Fund | | | 13 | % | | | 10 | % | | | 13 | % | | | 7 | % | | | — | | |
(1) Net investment income per share was computed using average shares outstanding.
(2) Returns are historical and are calculated by determining the percentage change in net asset value with all distributions reinvested.
(3) Includes the Fund's share of its corresponding Portfolio's allocated expenses while the Fund was making investments directly into the Portfolio.
(4) Portfolio turnover represents the rate of portfolio activity for the period while the Fund was making investments directly into the Portfolio.
See notes to financial statements
65
Eaton Vance Limited Maturity Municipals Funds as of March 31, 2008
FINANCIAL STATEMENTS CONT'D
Financial Highlights
| | | Ohio Limited Fund — Class B | |
| | | Year Ended March 31, | |
| | | 2008(1) | | 2007(1) | | 2006(1) | | 2005(1) | | 2004(1) | |
| Net asset value — Beginning of year | | $ | 9.670 | | | $ | 9.610 | | | $ | 9.730 | | | $ | 10.010 | | | $ | 10.000 | | |
| Income (loss) from operations | |
| Net investment income | | $ | 0.280 | | | $ | 0.278 | | | $ | 0.274 | | | $ | 0.289 | | | $ | 0.286 | | |
| Net realized and unrealized gain (loss) | | | (0.262 | ) | | | 0.059 | | | | (0.109 | ) | | | (0.294 | ) | | | 0.017 | | |
| Total income (loss) from operations | | $ | 0.018 | | | $ | 0.337 | | | $ | 0.165 | | | $ | (0.005 | ) | | $ | 0.303 | | |
| Less distributions | |
| From net investment income | | $ | (0.278 | ) | | $ | (0.277 | ) | | $ | (0.285 | ) | | $ | (0.275 | ) | | $ | (0.293 | ) | |
| Total distributions | | $ | (0.278 | ) | | $ | (0.277 | ) | | $ | (0.285 | ) | | $ | (0.275 | ) | | $ | (0.293 | ) | |
| Net asset value — End of year | | $ | 9.410 | | | $ | 9.670 | | | $ | 9.610 | | | $ | 9.730 | | | $ | 10.010 | | |
| Total Return(2) | | | 0.19 | % | | | 3.56 | % | | | 1.73 | % | | | (0.05 | )% | | | 3.06 | % | |
| Ratios/Supplemental Data | |
| Net assets, end of year (000's omitted) | | $ | 111 | | | $ | 438 | | | $ | 880 | | | $ | 2,159 | | | $ | 2,623 | | |
| Ratios (As a percentage of average daily net assets): | |
| Expenses before custodian fee reduction | | | 1.77 | % | | | 1.78 | % | | | 1.79 | % | | | 1.80 | %(3) | | | 1.74 | %(3) | |
| Expenses after custodian fee reduction | | | 1.75 | % | | | 1.74 | % | | | 1.77 | % | | | 1.79 | %(3) | | | 1.74 | %(3) | |
| Net investment income | | | 2.92 | % | | | 2.88 | % | | | 2.81 | % | | | 2.94 | % | | | 2.86 | % | |
| Portfolio Turnover of the Portfolio | | | — | | | | — | | | | — | | | | 6 | %(4) | | | 28 | %(4) | |
| Portfolio Turnover of the Fund | | | 13 | % | | | 10 | % | | | 13 | % | | | 7 | % | | | — | | |
(1) Net investment income per share was computed using average shares outstanding.
(2) Returns are historical and are calculated by determining the percentage change in net asset value with all distributions reinvested.
(3) Includes the Fund's share of its corresponding Portfolio's allocated expenses while the Fund was making investments directly into the Portfolio.
(4) Portfolio turnover represents the rate of portfolio activity for the period while the Fund was making investments directly into the Portfolio.
See notes to financial statements
66
Eaton Vance Limited Maturity Municipals Funds as of March 31, 2008
FINANCIAL STATEMENTS CONT'D
Financial Highlights
| | | Ohio Limited Fund — Class C | |
| | | Year Ended
March 31, 2008(1) | | Period Ended
March 31, 2007(1)(2) | |
| Net asset value — Beginning of period | | $ | 9.670 | | | $ | 9.600 | | |
| Income (loss) from operations | |
| Net investment income | | $ | 0.274 | | | $ | 0.182 | | |
| Net realized and unrealized gain (loss) | | | (0.266 | ) | | | 0.072 | | |
| Total income from operations | | $ | 0.008 | | | $ | 0.254 | | |
| Less distributions | |
| From net investment income | | $ | (0.278 | ) | | $ | (0.184 | ) | |
| Total distributions | | $ | (0.278 | ) | | $ | (0.184 | ) | |
| Net asset value — End of period | | $ | 9.400 | | | $ | 9.670 | | |
| Total Return(3) | | | 0.08 | % | | | 2.53 | %(6) | |
| Ratios/Supplemental Data | |
| Net assets, end of period (000's omitted) | | $ | 131 | | | $ | 1 | | |
| Ratios (As a percentage of average daily net assets): | |
| Expenses before custodian fee reduction | | | 1.77 | % | | | 1.78 | %(4) | |
| Expenses after custodian fee reduction | | | 1.75 | % | | | 1.74 | %(4) | |
| Net investment income | | | 2.88 | % | | | 2.81 | %(4) | |
| Portfolio Turnover | | | 13 | % | | | 10 | %(5) | |
(1) Net investment income per share was computed using average shares outstanding.
(2) For the period from the commencement of offering of Class C shares, August 1, 2006, to March 31, 2007.
(3) Returns are historical and are calculated by determining the percentage change in net asset value with all distributions reinvested.
(4) Annualized.
(5) For the Fund's fiscal year ended March 31, 2007.
(6) Not annualized.
See notes to financial statements
67
Eaton Vance Limited Maturity Municipals Funds as of March 31, 2008
FINANCIAL STATEMENTS CONT'D
Financial Highlights
| | | Pennsylvania Limited Fund — Class A | |
| | | Year Ended March 31, | |
| | | 2008(1) | | 2007(1) | | 2006(1) | | 2005(1) | | 2004(1) | |
| Net asset value — Beginning of year | | $ | 10.360 | | | $ | 10.270 | | | $ | 10.280 | | | $ | 10.550 | | | $ | 10.470 | | |
| Income (loss) from operations | |
| Net investment income | | $ | 0.393 | | | $ | 0.396 | | | $ | 0.394 | | | $ | 0.402 | | | $ | 0.406 | | |
| Net realized and unrealized gain (loss) | | | (0.327 | ) | | | 0.087 | | | | (0.004 | ) | | | (0.272 | ) | | | 0.084 | | |
| Total income from operations | | $ | 0.066 | | | $ | 0.483 | | | $ | 0.390 | | | $ | 0.130 | | | $ | 0.490 | | |
| Less distributions | |
| From net investment income | | $ | (0.396 | ) | | $ | (0.393 | ) | | $ | (0.400 | ) | | $ | (0.400 | ) | | $ | (0.410 | ) | |
| Total distributions | | $ | (0.396 | ) | | $ | (0.393 | ) | | $ | (0.400 | ) | | $ | (0.400 | ) | | $ | (0.410 | ) | |
| Net asset value — End of year | | $ | 10.030 | | | $ | 10.360 | | | $ | 10.270 | | | $ | 10.280 | | | $ | 10.550 | | |
| Total Return(2) | | | 0.64 | % | | | 4.78 | % | | | 3.84 | % | | | 1.25 | % | | | 4.72 | % | |
| Ratios/Supplemental Data | |
| Net assets, end of year (000's omitted) | | $ | 39,272 | | | $ | 33,998 | | | $ | 34,592 | | | $ | 33,611 | | | $ | 35,175 | | |
| Ratios (As a percentage of average daily net assets): | |
| Expenses before custodian fee reduction | | | 0.88 | % | | | 0.88 | % | | | 0.87 | % | | | 0.88 | %(3) | | | 0.85 | %(3) | |
| Expenses after custodian fee reduction | | | 0.85 | % | | | 0.86 | % | | | 0.85 | % | | | 0.87 | %(3) | | | 0.85 | %(3) | |
| Net investment income | | | 3.84 | % | | | 3.83 | % | | | 3.82 | % | | | 3.86 | % | | | 3.85 | % | |
| Portfolio Turnover of the Portfolio | | | — | | | | — | | | | — | | | | 0 | %(4) | | | 8 | %(4) | |
| Portfolio Turnover of the Fund | | | 12 | % | | | 11 | % | | | 22 | % | | | 6 | % | | | — | | |
(1) Net investment income per share was computed using average shares outstanding.
(2) Returns are historical and are calculated by determining the percentage change in net asset value with all distributions reinvested.
(3) Includes the Fund's share of its corresponding Portfolio's allocated expenses while the Fund was making investments directly into the Portfolio.
(4) Portfolio turnover represents the rate of portfolio activity for the period while the Fund was making investments directly into the Portfolio.
See notes to financial statements
68
Eaton Vance Limited Maturity Municipals Funds as of March 31, 2008
FINANCIAL STATEMENTS CONT'D
Financial Highlights
| | | Pennsylvania Limited Fund — Class B | |
| | | Year Ended March 31, | |
| | | 2008(1) | | 2007(1) | | 2006(1) | | 2005(1) | | 2004(1) | |
| Net asset value — Beginning of year | | $ | 10.360 | | | $ | 10.270 | | | $ | 10.280 | | | $ | 10.550 | | | $ | 10.460 | | |
| Income (loss) from operations | |
| Net investment income | | $ | 0.318 | | | $ | 0.319 | | | $ | 0.317 | | | $ | 0.323 | | | $ | 0.327 | | |
| Net realized and unrealized gain (loss) | | | (0.329 | ) | | | 0.087 | | | | (0.005 | ) | | | (0.273 | ) | | | 0.093 | | |
| Total income (loss) from operations | | $ | (0.011 | ) | | $ | 0.406 | | | $ | 0.312 | | | $ | 0.050 | | | $ | 0.420 | | |
| Less distributions | |
| From net investment income | | $ | (0.319 | ) | | $ | (0.316 | ) | | $ | (0.322 | ) | | $ | (0.320 | ) | | $ | (0.330 | ) | |
| Total distributions | | $ | (0.319 | ) | | $ | (0.316 | ) | | $ | (0.322 | ) | | $ | (0.320 | ) | | $ | (0.330 | ) | |
| Net asset value — End of year | | $ | 10.030 | | | $ | 10.360 | | | $ | 10.270 | | | $ | 10.280 | | | $ | 10.550 | | |
| Total Return(2) | | | (0.11 | )% | | | 4.01 | % | | | 3.06 | % | | | 0.48 | % | | | 4.04 | % | |
| Ratios/Supplemental Data | |
| Net assets, end of year (000's omitted) | | $ | 1,159 | | | $ | 3,714 | | | $ | 6,962 | | | $ | 8,957 | | | $ | 10,273 | | |
| Ratios (As a percentage of average daily net assets): | |
| Expenses before custodian fee reduction | | | 1.63 | % | | | 1.63 | % | | | 1.62 | % | | | 1.63 | %(3) | | | 1.60 | %(3) | |
| Expenses after custodian fee reduction | | | 1.60 | % | | | 1.61 | % | | | 1.60 | % | | | 1.62 | %(3) | | | 1.60 | %(3) | |
| Net investment income | | | 3.10 | % | | | 3.08 | % | | | 3.07 | % | | | 3.11 | % | | | 3.10 | % | |
| Portfolio Turnover of the Portfolio | | | — | | | | — | | | | — | | | | 0 | %(4) | | | 8 | %(4) | |
| Portfolio Turnover of the Fund | | | 12 | % | | | 11 | % | | | 22 | % | | | 6 | % | | | — | | |
(1) Net investment income per share was computed using average shares outstanding.
(2) Returns are historical and are calculated by determining the percentage change in net asset value with all distributions reinvested.
(3) Includes the Fund's share of its corresponding Portfolio's allocated expenses while the Fund was making investments directly into the Portfolio.
(4) Portfolio turnover represents the rate of portfolio activity for the period while the Fund was making investments directly into the Portfolio.
See notes to financial statements
69
Eaton Vance Limited Maturity Municipals Funds as of March 31, 2008
FINANCIAL STATEMENTS CONT'D
Financial Highlights
| | | Pennsylvania Limited Fund — Class C | |
| | | Year Ended March 31, | |
| | | 2008(1) | | 2007(1) | | 2006(1) | | 2005(1) | | 2004(1) | |
| Net asset value — Beginning of year | | $ | 9.820 | | | $ | 9.740 | | | $ | 9.750 | | | $ | 10.000 | | | $ | 9.910 | | |
| Income (loss) from operations | |
| Net investment income | | $ | 0.301 | | | $ | 0.302 | | | $ | 0.300 | | | $ | 0.307 | | | $ | 0.308 | | |
| Net realized and unrealized gain (loss) | | | (0.308 | ) | | | 0.078 | | | | (0.006 | ) | | | (0.257 | ) | | | 0.091 | | |
| Total income (loss) from operations | | $ | (0.007 | ) | | $ | 0.380 | | | $ | 0.294 | | | $ | 0.050 | | | $ | 0.399 | | |
| Less distributions | |
| From net investment income | | $ | (0.303 | ) | | $ | (0.300 | ) | | $ | (0.304 | ) | | $ | (0.300 | ) | | $ | (0.309 | ) | |
| Total distributions | | $ | (0.303 | ) | | $ | (0.300 | ) | | $ | (0.304 | ) | | $ | (0.300 | ) | | $ | (0.309 | ) | |
| Net asset value — End of year | | $ | 9.510 | | | $ | 9.820 | | | $ | 9.740 | | | $ | 9.750 | | | $ | 10.000 | | |
| Total Return(2) | | | (0.08 | )% | | | 3.95 | % | | | 3.05 | % | | | 0.44 | %(3) | | | 4.06 | % | |
| Ratios/Supplemental Data | |
| Net assets, end of year (000's omitted) | | $ | 13,427 | | | $ | 14,209 | | | $ | 15,894 | | | $ | 16,670 | | | $ | 21,398 | | |
| Ratios (As a percentage of average daily net assets): | |
| Expenses before custodian fee reduction | | | 1.63 | % | | | 1.63 | % | | | 1.62 | % | | | 1.63 | %(4) | | | 1.60 | %(4) | |
| Expenses after custodian fee reduction | | | 1.60 | % | | | 1.61 | % | | | 1.60 | % | | | 1.62 | %(4) | | | 1.60 | %(4) | |
| Net investment income | | | 3.10 | % | | | 3.08 | % | | | 3.07 | % | | | 3.12 | % | | | 3.08 | % | |
| Portfolio Turnover of the Portfolio | | | — | | | | — | | | | — | | | | 0 | %(5) | | | 8 | %(5) | |
| Portfolio Turnover of the Fund | | | 12 | % | | | 11 | % | | | 22 | % | | | 6 | % | | | — | | |
(1) Net investment income per share was computed using average shares outstanding.
(2) Returns are historical and are calculated by determining the percentage change in net asset value with all distributions reinvested.
(3) Total return reflects a decrease of 0.06% due to a change in the timing of the payment and reinvestment of distributions.
(4) Includes the Fund's share of its corresponding Portfolio's allocated expenses while the Fund was making investments directly into the Portfolio.
(5) Portfolio turnover represents the rate of portfolio activity for the period while the Fund was making investments directly into the Portfolio.
See notes to financial statements
70
Eaton Vance Limited Maturity Municipals Funds as of March 31, 2008
NOTES TO FINANCIAL STATEMENTS
1 Significant Accounting Policies
Eaton Vance Investment Trust (the Trust) is a Massachusetts business trust registered under the Investment Company Act of 1940, as amended (the 1940 Act), as an open-end management investment company. The Trust presently consists of eight Funds, seven of which, each non-diversified, are included in these financial statements. They include Eaton Vance California Limited Maturity Municipals Fund (California Limited Fund), Eaton Vance Florida Plus Limited Maturity Municipals Fund (formerly, Eaton Vance Florida Limited Maturity Municipals Fund) (Florida Plus Limited Fund), Eaton Vance Massachusetts Limited Maturity Municipals Fund (Massachusetts Limited Fund), Eaton Vance New Jersey Limited Maturity Municipals Fund (New Jersey Limited Fund), Eaton Vance New York Limited Maturity Municipals Fund (New York Limited Fund), Eaton Vance Ohio Limited Maturity Municipals Fund (Ohio Limited Fund) and Eaton Vance Pennsylvania Limited Maturity Municipals Fund (Pennsylvania Limited Fund), (each individually referred to as the Fund, and collectively, the Funds). The Funds seek to provide a high level of current income exempt from regular federal income tax and from particular state, if applicable, or local income or other taxes with limited principal fluctuation. The Funds offer three classes of shares. Class A shares are generally sold subject to a sales charge imposed at time of purchase. Class B and Class C shares are sold at net asset value and are generally subject to a contingent deferred sales charge (see Note 5). Class B shares of each Fund held for the longer of (i) four years or (ii) the time at which the contingent deferred sales charge applicable to such shares expires will automatically convert to Class A shares as described in each Fund's prospectus. Each class represents a pro-rata interest in the Fund, but votes separately on class-specific matters and (as noted below) is subject to different expenses. Realized and unrealized gains and losses are allocated daily to each class of shares based on the relative net assets of each class to the total net assets of the Fund. Net investment income, other than class-specific expenses, is allocated daily to each class of shares based upon the ratio of the value of each class's paid shares to the total value of all paid shares. Each class of shares differs in its distribution plan and certain other class-specific expenses.
The following is a summary of significant accounting policies of the Funds. The policies are in conformity with accounting principles generally accepted in the United States of America.
A Investment Valuation — Municipal bonds and taxable obligations, if any, are generally valued on the basis of valuations furnished by a pricing service. Financial futures contracts and options on financial futures contracts listed on commodity exchanges are valued at closing settlement prices. Interest rate swaps are generally valued on the basis of valuations furnished by a pricing service. Short-term obligations, maturing in sixty days or less, are valued at amortized cost, which approximates market value. Investments for which valuations or market quotations are not readily available, and investments for which the price of a security is not believed to represent its fair market value, are valued a t fair value using methods determined in good faith by or at the direction of the Trustees.
B Investment Transactions and Related Income — Investment transactions for financial statement purposes are accounted for on a trade date basis. Realized gains and losses on investments sold are determined on the basis of identified cost. Interest income is recorded on the basis of interest accrued, adjusted for amortization of premium or accretion of discount.
C Federal Taxes — Each Fund's policy is to comply with the provisions of the Internal Revenue Code applicable to regulated investment companies and to distribute to shareholders each year substantially all of its taxable, if any, and tax-exempt net investment income, and all or substantially all of its net realized capital gains. Accordingly, no provision for federal income or excise tax is necessary. Each Fund intends to satisfy conditions which will enable it to designate distributions from the interest income generated by its investments in municipal obligations, which are exempt from regular federal income tax when received by each Fund, as exempt-interest dividends. The portion of such interest, if any, earned on private activity bonds issued after August 7, 1986, may be considered a tax preference item to shareholders.
At March 31, 2008, the following Funds, for federal income tax purposes, had capital loss carryforwards which will reduce each Fund's taxable income arising from future net realized gains on investment transactions, if any, to the extent permitted by the Internal Revenue Code, and thus will reduce the amount of distributions to shareholders which would otherwise be necessary to relieve the Funds of any liability for
71
Eaton Vance Limited Maturity Municipals Funds as of March 31, 2008
NOTES TO FINANCIAL STATEMENTS CONT'D
federal income or excise tax. The amounts and expiration dates of the capital loss carryforwards are as follows:
| Fund | | Amount | | Expiration Date | |
| California Limited | | $ | 46,725 | | | March 31, 2011 | |
|
| | | 13,351 | | | March 31, 2012 | |
|
| | | 384,970 | | | March 31, 2013 | |
|
| | | 176,040 | | | March 31, 2015 | |
|
| | | 146,189 | | | March 31, 2016 | |
|
| Florida Plus Limited | | | 175,227 | | | March 31, 2011 | |
|
| | | 995,128 | | | March 31, 2013 | |
|
| | | 25,590 | | | March 31, 2015 | |
|
| Massachusetts Limited | | | 398,029 | | | March 31, 2011 | |
|
| | | | 393,962 | | | March 31, 2012 | |
|
| | | | 1,336,686 | | | March 31, 2013 | |
|
| | | | 25,938 | | | March 31, 2014 | |
|
| | | | 103,860 | | | March 31, 2016 | |
|
| New Jersey Limited | | | 129,576 | | | March 31, 2011 | |
|
| | | | 298,472 | | | March 31, 2012 | |
|
| | | | 728,451 | | | March 31, 2013 | |
|
| New York Limited | | | 144,635 | | | March 31, 2011 | |
|
| | | | 483,774 | | | March 31, 2012 | |
|
| | | | 1,522,094 | | | March 31, 2013 | |
|
| | | | 97,867 | | | March 31, 2015 | |
|
| | | | 394,181 | | | March 31, 2016 | |
|
| Ohio Limited | | | 36,233 | | | March 31, 2009 | |
|
| | | | 69,085 | | | March 31, 2010 | |
|
| | | | 366,442 | | | March 31, 2011 | |
|
| | | | 60,692 | | | March 31, 2012 | |
|
| | | | 358,602 | | | March 31, 2013 | |
|
| | | | 19,117 | | | March 31, 2014 | |
|
| | | | 37,955 | | | March 31, 2015 | |
|
| | | | 67,546 | | | March 31, 2016 | |
|
| Pennsylvania Limited | | | 35,624 | | | March 31, 2009 | |
|
| | | | 59,482 | | | March 31, 2010 | |
|
| | | | 400,339 | | | March 31, 2011 | |
|
| | | | 154,413 | | | March 31, 2012 | |
|
| | | | 954,523 | | | March 31, 2013 | |
|
| | | | 29,139 | | | March 31, 2015 | |
|
| | | | 107,086 | | | March 31, 2016 | |
|
During the year ended March 31, 2008, capital loss carryforwards of $77,739 and $15,353 were utilized to offset net realized gains by the Florida Plus Limited Fund and New Jersey Limited Fund, respectively.
Additionally, at March 31, 2008, the California Limited Fund, Massachusetts Limited Fund, New Jersey Limited Fund, New York Limited Fund, Ohio Limited Fund and Pennsylvania Limited Fund had net capital losses of $336,093, $845,125, $491,143, $1,285,348, $280,884 and $731,982, respectively, attributable to security transactions incurred after October 31, 2007. These capital losses are treated as arising on the first day of the Fund's taxable year ending March 31, 2009.
In June 2006, the Financial Accounting Standards Board (FASB) issued FASB Interpretation No. 48 (FIN 48), "Accounting for Uncertainty in Income Taxes – an interpretation of FASB Statement No. 109". FIN 48 clarifies the accounting for uncertainty in income taxes recognized in accordance with FASB Statement No. 109, "Accounting for Income Taxes". This interpretation prescribes a recognition threshold and measurement attribute for the financial statement recognition and measurement of a tax position taken or expected to be taken in a tax return. It also provides guidance on de-recognition, classification, interest and penalties, accounting in interim periods, disclosure and transition. FIN 48 is effective on the last business day of the first required financial reporting period for fiscal years beginning after December 15, 2006. Management has concluded that as of March 31, 2008, there are no uncertain tax positions that would require financial statement recognition, de-recognition, or disclosure. Each of the Funds' federal tax returns filed in the 3-year period ended March 31, 2008 remains subject to examination by the Internal Revenue Service.
D Expenses — The majority of expenses of the Trust are directly identifiable to an individual fund. Expenses which are not readily identifiable to a specific fund are allocated taking into consideration, among other things, the nature and type of expense and the relative size of the funds.
E Expense Reduction — State Street Bank and Trust Company (SSBT) serves as custodian of the Funds. Pursuant to the respective custodian agreements, SSBT receives a fee reduced by credits, which are determined based on the average daily cash balance each Fund maintains with SSBT. All credit balances, if any, used to reduce each Fund's custodian fees are reported as a reduction of expenses in the Statements of Operations.
F Legal Fees — Legal fees and other related expenses incurred as part of negotiations of the terms and requirement of capital infusions, or that are expected to result in the restructuring of, or a plan of reorganization for, an investment are recorded as realized losses. Ongoing expenditures to protect or enhance an investment are treated as operating expenses.
G Use of Estimates — The preparation of the financial statements in conformity with accounting
72
Eaton Vance Limited Maturity Municipals Funds as of March 31, 2008
NOTES TO FINANCIAL STATEMENTS CONT'D
principles generally accepted in the United States of America requires management to make estimates and assumptions that affect the reported amounts of assets and liabilities at the date of the financial statements and the reported amounts of income and expense during the reporting period. Actual results could differ from those estimates.
H Indemnifications — Under the Trust's organizational documents, its officers and Trustees may be indemnified against certain liabilities and expenses arising out of the performance of their duties to the Funds, and shareholders are indemnified against personal liability for the obligations of the Trust. Additionally, in the normal course of business, each Fund enters into agreements with service providers that may contain indemnification clauses. Each Fund's maximum exposure under these arrangements is unknown as this would involve future claims that may be made against each Fund that have not yet occurred.
I Floating Rate Notes Issued in Conjunction with Securities Held — The Funds may invest in inverse floating rate securities, whereby a Fund may sell a fixed rate bond to a broker for cash. At the same time, the Fund buys a residual interest in the assets and cash flows of a Special-Purpose Vehicle (the SPV), (which is generally organized as a trust), set up by the broker, often referred to as an inverse floating rate obligation (Inverse Floater). The broker deposits a fixed rate bond into the SPV with the same CUSIP number as the fixed rate bond sold to the broker by the Fund, and which may have been, but is not required to be, the fixed rate bond purchased from the Fund (the Fixed Rate Bond). The SPV also issues floating rate notes (Floating Rate Notes) which are sold to third-parties. The Funds may enter into shortfall and forbearance agreements with the broker by which a Fund agrees to reimburse the broker, in certain circumstances, for the difference between the liquidation value of the Fixed Rate Bond held by the SPV and the liquidation value of the Floating Rate Notes, as well as any shortfalls in interest cash flows. The Inverse Floater held by a Fund gives the Fund the right (1) to cause the holders of the Floating Rate Notes to tender their notes at par, and (2) to have the broker transfer the Fixed Rate Bond held by the SPV to the Fund, thereby collapsing the SPV. Pursuant to Financial Accounting Standards Board (FASB) Statement No. 140, "Accounting for Transfers and Servicing of Financial Assets and Extinguishment of Liabilities" (FAS 140), the Funds account for the transaction described above as a secured borrowing by including the Fixed Rate Bond in their Portfolio of Investments and the Flo ating Rate Notes as a liability under the caption "Payable for floating rate notes issued" in their Statement of Assets and Liabilities. The Floating Rate Notes have interest rates that generally reset weekly and their holders have the option to tender their notes to the broker for redemption at par at each reset date. Interest expense related to the Funds' liability with respect to Floating Rate Notes is recorded as incurred. At March 31, 2008, the Funds had no Floating Rate Notes outstanding.
The Funds' investment policies and restrictions expressly permit investments in Inverse Floaters. Inverse floating rate securities typically offer the potential for yields exceeding the yields available on fixed rate bonds with comparable credit quality and maturity. The Funds' investment policies do not allow the Funds to borrow money for purposes of making investments. Management believes that the Funds' restrictions on borrowings do not apply to the secured borrowings deemed to have occurred for accounting purposes pursuant to FAS 140, which is distinct from a legal borrowing of the Funds to which the policies apply. Inverse Floaters held by the Funds are securities exempt from registration under Rule 144A of the Securities Act of 1933.
J Financial Futures Contracts — The Funds may enter into financial futures contracts. The Funds' investment in financial futures contracts is designed for hedging against changes in interest rates or as a substitute for the purchase of securities. Upon entering into a financial futures contract, a Fund is required to deposit with the broker, either in cash or securities an amount equal to a certain percentage of the purchase price (initial margin). Subsequent payments, known as variation margin, are made or received by the Fund each business day, depending on the daily fluctuations in the value of the underlying security, and are recorded as unrealized gains or losses by the Fund. Gains (losses) are r ealized upon the expiration or closing of the financial futures contracts. Should market conditions change unexpectedly, the Fund may not achieve the anticipated benefits of the financial futures contracts and may realize a loss. In entering such contracts, the Fund bears the risk if the counterparties do not perform under the contracts' terms.
K When-Issued Securities and Delayed Delivery Transactions — The Funds may purchase or sell securities on a delayed delivery or when-issued basis. Payment and delivery may take place after the customary settlement period for that security. At the time the transaction is negotiated, the price of the security that will be delivered is fixed. The Funds maintain security positions for these commitments such that sufficient liquid assets will be available to make payments upon
73
Eaton Vance Limited Maturity Municipals Funds as of March 31, 2008
NOTES TO FINANCIAL STATEMENTS CONT'D
settlement. Securities purchased on a delayed delivery or when-issued basis are marked-to-market daily and begin earning interest on settlement date. Losses may arise due to changes in the market value of the underlying securities or if the counterparty does not perform under the contract.
2 Distributions to Shareholders
The net investment income of each Fund is determined daily and substantially all of the net investment income so determined is declared as a dividend to shareholders of record at the time of declaration. Distributions are declared separately for each class of shares. Distributions are paid monthly. Distributions of realized capital gains (reduced by available capital loss carryforwards, if any), are made at least annually. Shareholders may reinvest income and capital gain distributions in additional shares of the same class of a Fund at the net asset value as of the reinvestment date or, at the election of the shareholder, receive distributions in cash. The Funds distinguish between distributions on a tax basis and a financial reporting basis. Accounting principles generally accepted in the United States of America require that only distributions in excess o f tax basis earnings and profits be reported in the financial statements as a return of capital. Permanent differences between book and tax accounting relating to distributions are reclassified to paid-in capital.
The tax character of distributions declared for the years ended March 31, 2008 and March 31, 2007 were as follows:
| Year Ended 3/31/08 | | California
Limited | | Florida Plus
Limited | | Massachusetts
Limited | | New Jersey
Limited | | New York
Limited | | Ohio
Limited | | Pennsylvania
Limited | |
| Distributions declared from: | |
| Tax-exempt income | | $ | 1,468,078 | | | $ | 1,540,593 | | | $ | 2,186,263 | | | $ | 1,514,755 | | | $ | 3,461,672 | | | $ | 733,718 | | | $ | 1,938,893 | | |
| Ordinary income | | $ | — | | | $ | 20,895 | | | $ | — | | | $ | — | | | $ | — | | | $ | — | | | $ | — | | |
| Year Ended 3/31/07 | | California
Limited | | Florida Plus
Limited | | Massachusetts
Limited | | New Jersey
Limited | | New York
Limited | | Ohio
Limited | | Pennsylvania
Limited | |
| Distributions declared from: | |
| Tax-exempt income | | $ | 1,325,760 | | | $ | 1,788,616 | | | $ | 2,335,207 | | | $ | 1,507,864 | | | $ | 3,413,105 | | | $ | 690,264 | | | $ | 1,919,141 | | |
| Ordinary income | | | — | | | | — | | | $ | 5,666 | | | | — | | | $ | 155 | | | | — | | | | — | | |
During the year ended March 31, 2008, the following amounts were reclassified due to differences between book and tax accounting, primarily for accretion of market discount:
| | | California
Limited | | Florida Plus
Limited | | Massachusetts
Limited | | New Jersey
Limited | | New York
Limited | | Ohio
Limited | | Pennsylvania
Limited | |
Increase (decrease):
Accumulated net realized gain (loss) | | $ | 2,337 | | | $ | (14,918 | ) | | $ | 72,080 | | | $ | 9,253 | | | $ | 12,930 | | | $ | (93 | ) | | $ | 4,570 | | |
| Accumulated undistributed net investment income | | $ | (2,337 | ) | | $ | 14,918 | | | $ | (72,080 | ) | | $ | (9,253 | ) | | $ | (12,930 | ) | | $ | 93 | | | $ | (4,570 | ) | |
These reclassifications had no effect on the net assets or net asset value per share of the Funds.
As of March 31, 2008, the components of distributable earnings (accumulated losses) and unrealized appreciation (depreciation) on a tax basis were as follows:
| | | California
Limited | | Florida Plus
Limited | | Massachusetts
Limited | | New Jersey
Limited | | New York
Limited | | Ohio
Limited | | Pennsylvania
Limited | |
| Undistributed income | | $ | 56,712 | | | $ | 78,640 | | | $ | 60,784 | | | $ | 102,195 | | | $ | 128,597 | | | $ | 29,023 | | | $ | 14,277 | | |
| Capital loss carryforward and post October losses | | $ | (1,103,368 | ) | | $ | (1,195,945 | ) | | $ | (3,103,600 | ) | | $ | (1,647,642 | ) | | $ | (3,927,899 | ) | | $ | (1,296,556 | ) | | $ | (2,472,588 | ) | |
| Net unrealized appreciation | | $ | 560,538 | | | $ | 214,870 | | | $ | 1,854,874 | | | $ | 1,240,990 | | | $ | 1,517,983 | | | $ | 700,687 | | | $ | 1,555,691 | | |
| Other temporary differences | | $ | (55,461 | ) | | $ | (56,810 | ) | | $ | (84,578 | ) | | $ | (62,857 | ) | | $ | (137,801 | ) | | $ | (29,533 | ) | | $ | (76,413 | ) | |
74
Eaton Vance Limited Maturity Municipals Funds as of March 31, 2008
NOTES TO FINANCIAL STATEMENTS CONT'D
The differences between components of distributable earnings (accumulated losses) on a tax basis and the amounts reflected in the Statements of Assets and Liabilities are primarily due to accretion of market discount, futures contracts, and the timing of recognizing distributions to shareholders.
3 Investment Adviser Fee and Other Transactions with Affiliates
The investment adviser fee is earned by Boston Management and Research (BMR), a subsidiary of Eaton Vance Management (EVM), as compensation for management and investment advisory services rendered to each Fund. The fee is based upon a percentage of average daily net assets plus a percentage of gross income (i.e., income other than gains from the sale of securities) and is payable monthly. For the year ended March 31, 2008, advisory fees incurred by the Funds and the effective annual rates, as a percentage of average daily net assets, were as follows:
| Fund | | Amount | | Effective Annual Rate | |
| California Limited | | $ | 173,877 | | | | 0.44 | % | |
| Florida Plus Limited | | | 185,879 | | | | 0.44 | % | |
| Massachusetts Limited | | | 273,953 | | | | 0.43 | % | |
| New Jersey Limited | | | 175,330 | | | | 0.44 | % | |
| New York Limited | | | 421,846 | | | | 0.44 | % | |
| Ohio Limited | | | 88,265 | | | | 0.44 | % | |
| Pennsylvania Limited | | | 234,165 | | | | 0.44 | % | |
EVM serves as administrator of each Fund, but receives no compensation. EVM serves as the sub-transfer agent of each Fund and receives from the transfer agent an aggregate fee based upon the actual expenses incurred by EVM in the performance of these services. Eaton Vance Distributors, Inc. (EVD), the Funds' principal underwriter and an affiliate of EVM, receives a portion of the sales charge on sales of Class A shares of the Funds. EVD also receives distribution and service fees from Class A, Class B and Class C shares (see Note 4) and contingent deferred sales charges (see Note 5). Sub-transfer agent fees earned by EVM and Class A sales charges that the Funds were informed were received by EVD for the year ended March 31, 2008 were as follows:
| Fund | | EVM's Sub-Transfer
Agent Fees | | EVD's Class A
Sales Charges | |
| California Limited | | $ | 565 | | | $ | 1,134 | | |
| Florida Plus Limited | | | 909 | | | | 1,161 | | |
| Massachusetts Limited | | | 1,834 | | | | 4,915 | | |
| Fund | | EVM's Sub-Transfer
Agent Fees | | EVD's Class A
Sales Charges | |
| New Jersey Limited | | $ | 1,139 | | | $ | 2,978 | | |
| New York Limited | | | 2,510 | | | | 3,538 | | |
| Ohio Limited | | | 456 | | | | 1,638 | | |
| Pennsylvania Limited | | | 1,511 | | | | 1,470 | | |
Except for Trustees of the Funds who are not members of EVM's or BMR's organizations, officers and Trustees receive remuneration for their services to the Funds out of the investment adviser fee. Trustees of the Funds who are not affiliated with the investment adviser may elect to defer receipt of all or a percentage of their annual fees in accordance with the terms of the Trustees Deferred Compensation Plan. For the year ended March 31, 2008, no significant amounts have been deferred. Certain officers and Trustees of the Funds are officers of the above organizations.
4 Distribution Plans
Each Fund has in effect a distribution plan for Class A shares (Class A Plan) pursuant to Rule 12b-1 under the 1940 Act. The Class A Plan provides that each Fund will pay EVD a distribution and service fee not exceeding 0.25% per annum of its average daily net assets attributable to Class A shares for distribution services and facilities provided to each Fund by EVD, as well as for personal services and/or the maintenance of shareholder accounts. The Trustees approved distribution and service fee payments equal to 0.15% per annum of each Fund's average daily net assets attributable to Class A shares. Distribution and service fees paid or accrued to EVD for the year ended March 31, 2008 for Class A shares amounted to the following:
| Fund | | Class A Distribution
and Service Fees | |
| California Limited | | $ | 57,756 | | |
| Florida Plus Limited | | | 47,151 | | |
| Massachusetts Limited | | | 71,088 | | |
| New Jersey Limited | | | 57,523 | | |
| New York Limited | | | 106,778 | | |
| Ohio Limited | | | 29,754 | | |
| Pennsylvania Limited | | | 56,061 | | |
Each Fund also has in effect distribution plans for Class B shares (Class B Plan) and Class C shares (Class C Plan) pursuant to Rule 12b-1 under the 1940 Act. The Class B and Class C Plans require each Fund to pay EVD amounts equal to 0.75% per annum of its average daily
75
Eaton Vance Limited Maturity Municipals Funds as of March 31, 2008
NOTES TO FINANCIAL STATEMENTS CONT'D
net assets attributable to Class B and Class C shares for providing ongoing distribution services and facilities to the respective Funds. Each Fund will automatically discontinue payments to EVD during any period in which there are no outstanding Uncovered Distribution Charges, which are equivalent to the sum of (i) 3% (3.5% for Ohio Limited Fund) and 6.25% of the aggregate amount received by each Fund for Class B and Class C shares sold, respectively, plus (ii) interest calculated by applying the rate of 1% over the prevailing prime rate to the outstanding balance of Uncovered Distribution Charges of EVD of each respective class, reduced by the aggregate amount of contingent deferred sales charges (see Note 5) and amounts theretofore paid or payable to EVD by each respective class. For the year ended March 31, 2008, the Funds paid or accrued to EVD the following distribution fees, representing 0.75% of the average daily net ass ets of each Fund's Class B and Class C shares:
| Fund | | Class B
Distribution Fees | | Class C
Distribution Fees | |
| California Limited | | $ | 4,799 | | | $ | 5,831 | | |
| Florida Plus Limited | | | 12,512 | | | | 66,815 | | |
| Massachusetts Limited | | | 18,319 | | | | 102,462 | | |
| New Jersey Limited | | | 13,378 | | | | 513 | | |
| New York Limited | | | 19,777 | | | | 166,175 | | |
| Ohio Limited | | | 1,620 | | | | 225 | | |
| Pennsylvania Limited | | | 16,113 | | | | 102,596 | | |
At March 31, 2008, the amounts of Uncovered Distribution Charges of EVD calculated under the Class B and Class C Plans were approximately as follows:
| Fund | | Class B | | Class C | |
| California Limited | | $ | 512,000 | | | $ | 103,000 | | |
| Florida Plus Limited | | | 975,000 | | | | 9,442,000 | | |
| Massachusetts Limited | | | 544,000 | | | | 4,712,000 | | |
| New Jersey Limited | | | 534,000 | | | | 9,000 | | |
| New York Limited | | | 812,000 | | | | 5,810,000 | | |
| Ohio Limited | | | 845,000 | | | | 2,000 | | |
| Pennsylvania Limited | | | 357,000 | | | | 5,741,000 | | |
The Class B and Class C Plans also authorize the Funds to make payments of service fees to EVD, investment dealers and other persons in amounts not exceeding 0.25% per annum of the average daily net assets attributable to that class. The Trustees approved service fee payments equal to 0.15% per annum of each Fund's average daily net assets attributable to Class B and Class C shares. Service fees paid or accrued are for personal services and/or the maintenance of shareholder accounts. They are separate and distinct from the Class B and Class C sales commissions and distribution fees and, as such, are not subject to automatic discontinuance when there are no outstanding Uncovered Distribution Charges of EVD. Service fees paid or accrued for the year ended March 31, 2008 amounted to the following:
| Fund | | Class B
Service Fees | | Class C
Service Fees | |
| California Limited | | $ | 960 | | | $ | 1,166 | | |
| Florida Plus Limited | | | 2,502 | | | | 13,363 | | |
| Massachusetts Limited | | | 3,664 | | | | 20,492 | | |
| New Jersey Limited | | | 2,676 | | | | 102 | | |
| New York Limited | | | 3,955 | | | | 33,235 | | |
| Ohio Limited | | | 324 | | | | 45 | | |
| Pennsylvania Limited | | | 3,223 | | | | 20,519 | | |
5 Contingent Deferred Sales Charges
A contingent deferred sales charge (CDSC) generally is imposed on redemptions of Class B shares made within four years of purchase and on redemptions of Class C shares made within one year of purchase. Class A shares may be subject to a 1% CDSC if redeemed within eighteen months of purchase (depending on the circumstances of purchase) or a 1% or 0.50% CDSC if redeemed within one year or two years, respectively, on purchases through the Eaton Vance Supplemental Retirement Account. Generally, the CDSC is based upon the lower of the net asset value at date of redemption or date of purchase. No charge is levied on shares acquired by reinvestment of dividends or capital gains distributions. The CDSC for Class B shares is imposed at declining rates that begin at 3% in the case of redemptions in the first year after purchase, declining half a percentage point in the second and third year and one percentage point in the fourth year. Cla ss C shares are subject to a 1% CDSC if redeemed within one year of purchase. No CDSC is levied on shares which have been sold to EVM or its affiliates or to their respective employees or clients and may be waived under certain other limited conditions. CDSCs received on Class B and Class C redemptions are paid to EVD to reduce the amount of Uncovered Distribution Charges calculated under each Fund's Class B and Class C Plans. CDSCs received on Class B and Class C redemptions when no Uncovered Distribution Charges exist are credited to each Fund. For the year ended March 31, 2008, the Funds were informed that EVD received approximately
76
Eaton Vance Limited Maturity Municipals Funds as of March 31, 2008
NOTES TO FINANCIAL STATEMENTS CONT'D
the following amounts of CDSCs paid by Class A, Class B and Class C shareholders:
| Fund | | Class A | | Class B | | Class C | |
| California Limited | | $ | 50 | | | $ | 900 | | | $ | 3,000 | | |
| Florida Plus Limited | | | 10,000 | | | | 7,000 | | | | 2,000 | | |
| Massachusetts Limited | | | 5,000 | | | | 3,000 | | | | 20 | | |
| New Jersey Limited | | | 5 | | | | 4,000 | | | | — | | |
| New York Limited | | | 800 | | | | 3,000 | | | | 5,000 | | |
| Ohio Limited | | | 200 | | | | 700 | | | | — | | |
| Pennsylvania Limited | | | 40 | | | | 2,000 | | | | 2,000 | | |
6 Purchases and Sales of Investments
Purchases and sales of investments, other than short-term obligations, for the year ended March 31, 2008 were as follows:
| Fund | | Purchases | | Sales | |
| California Limited | | $ | 22,874,981 | | | $ | 21,193,832 | | |
| Florida Plus Limited | | | 14,804,022 | | | | 20,551,076 | | |
| Massachusetts Limited | | | 8,867,609 | | | | 9,152,209 | | |
| New Jersey Limited | | | 9,229,081 | | | | 4,937,139 | | |
| New York Limited | | | 13,535,555 | | | | 14,107,879 | | |
| Ohio Limited | | | 2,456,370 | | | | 2,553,477 | | |
| Pennsylvania Limited | | | 8,378,155 | | | | 6,113,439 | | |
7 Shares of Beneficial Interest
Each Fund's Declaration of Trust permits the Trustees to issue an unlimited number of full and fractional shares of beneficial interest (without par value). Such shares may be issued in a number of different series (such as the Funds) and classes. Transactions in Fund shares were as follows:
| California Limited Fund | |
| | | Year Ended March 31, | |
| Class A | | 2008 | | 2007 | |
| Sales | | | 2,016,272 | | | | 885,242 | | |
Issued to shareholders electing to
receive payments of distributions
in Fund shares | | | 58,409 | | | | 68,920 | | |
| Redemptions | | | (1,918,785 | ) | | | (913,214 | ) | |
| Exchange from Class B shares | | | 41,894 | | | | 137,628 | | |
| Net increase | | | 197,790 | | | | 178,576 | | |
| | | Year Ended March 31, | |
| Class B | | 2008 | | 2007 | |
| Sales | | | 43,627 | | | | 22,186 | | |
Issued to shareholders electing to
receive payments of distributions
in Fund shares | | | 915 | | | | 2,642 | | |
| Redemptions | | | (16,028 | ) | | | (73,487 | ) | |
| Exchange to Class A shares | | | (42,017 | ) | | | (138,016 | ) | |
| Net decrease | | | (13,503 | ) | | | (186,675 | ) | |
| | | Year Ended March 31, | |
| Class C | | 2008 | | 2007 | |
| Sales | | | 180,673 | | | | 53,588 | | |
Issued to shareholders electing to
receive payments of distributions
in Fund shares | | | 863 | | | | 82 | | |
| Redemptions | | | (87,978 | ) | | | — | | |
| Net increase | | | 93,558 | | | | 53,670 | | |
| Florida Plus Limited Fund | |
| | | Year Ended March 31, | |
| Class A | | 2008 | | 2007 | |
| Sales | | | 370,678 | | | | 247,633 | | |
Issued to shareholders electing to
receive payments of distributions
in Fund shares | | | 63,755 | | | | 57,258 | | |
| Redemptions | | | (890,150 | ) | | | (800,980 | ) | |
| Exchange from Class B shares | | | 165,022 | | | | 224,172 | | |
| Net decrease | | | (290,695 | ) | | | (271,917 | ) | |
| | | Year Ended March 31, | |
| Class B | | 2008 | | 2007 | |
| Sales | | | 88,494 | | | | 10,293 | | |
Issued to shareholders electing to
receive payments of distributions
in Fund shares | | | 3,208 | | | | 7,589 | | |
| Redemptions | | | (68,308 | ) | | | (104,429 | ) | |
| Exchange to Class A shares | | | (164,923 | ) | | | (224,112 | ) | |
| Net decrease | | | (141,529 | ) | | | (310,659 | ) | |
77
Eaton Vance Limited Maturity Municipals Funds as of March 31, 2008
NOTES TO FINANCIAL STATEMENTS CONT'D
| Florida Plus Limited Fund (continued) | |
| | | Year Ended March 31, | |
| Class C | | 2008 | | 2007 | |
| Sales | | | 163,733 | | | | 85,336 | | |
Issued to shareholders electing to
receive payments of distributions
in Fund shares | | | 11,775 | | | | 11,532 | | |
| Redemptions | | | (253,409 | ) | | | (500,722 | ) | |
| Net decrease | | | (77,901 | ) | | | (403,854 | ) | |
| Massachusetts Limited Fund | |
| | | Year Ended March 31, | |
| Class A | | 2008 | | 2007 | |
| Sales | | | 1,610,174 | | | | 609,858 | | |
Issued to shareholders electing to
receive payments of distributions
in Fund shares | | | 109,447 | | | | 91,267 | | |
| Redemptions | | | (1,357,397 | ) | | | (1,226,636 | ) | |
| Exchange from Class B shares | | | 166,127 | | | | 277,608 | | |
| Net increase (decrease) | | | 528,351 | | | | (247,903 | ) | |
| | | Year Ended March 31, | |
| Class B | | 2008 | | 2007 | |
| Sales | | | 18,157 | | | | 27,178 | | |
Issued to shareholders electing to
receive payments of distributions
in Fund shares | | | 4,325 | | | | 9,818 | | |
| Redemptions | | | (50,671 | ) | | | (117,194 | ) | |
| Exchange to Class A shares | | | (166,156 | ) | | | (277,816 | ) | |
| Net decrease | | | (194,345 | ) | | | (358,014 | ) | |
| | | Year Ended March 31, | |
| Class C | | 2008 | | 2007 | |
| Sales | | | 146,203 | | | | 114,101 | | |
Issued to shareholders electing to
receive payments of distributions
in Fund shares | | | 27,564 | | | | 30,463 | | |
| Redemptions | | | (259,219 | ) | | | (752,323 | ) | |
| Net decrease | | | (85,452 | ) | | | (607,759 | ) | |
| New Jersey Limited Fund | |
| | | Year Ended March 31, | |
| Class A | | 2008 | | 2007 | |
| Sales | | | 1,185,717 | | | | 172,350 | | |
Issued to shareholders electing to
receive payments of distributions
in Fund shares | | | 92,752 | | | | 88,084 | | |
| Redemptions | | | (759,245 | ) | | | (574,341 | ) | |
| Exchange from Class B shares | | | 158,879 | | | | 270,340 | | |
| Net increase (decrease) | | | 678,103 | | | | (43,567 | ) | |
| | | Year Ended March 31, | |
| Class B | | 2008 | | 2007 | |
| Sales | | | 11,520 | | | | 25,653 | | |
Issued to shareholders electing to
receive payments of distributions
in Fund shares | | | 3,599 | | | | 7,995 | | |
| Redemptions | | | (56,878 | ) | | | (74,738 | ) | |
| Exchange to Class A shares | | | (158,871 | ) | | | (270,363 | ) | |
| Net decrease | | | (200,630 | ) | | | (311,453 | ) | |
| | | Year Ended March 31, | |
| Class C | | 2008 | | 2007(1) | |
| Sales | | | 14,275 | | | | 99 | | |
Issued to shareholders electing to
receive payments of distributions
in Fund shares | | | 184 | | | | 2 | | |
| Net increase | | | 14,459 | | | | 101 | | |
| New York Limited Fund | |
| | | Year Ended March 31, | |
| Class A | | 2008 | | 2007 | |
| Sales | | | 1,854,466 | | | | 1,754,360 | | |
Issued to shareholders electing to
receive payments of distributions
in Fund shares | | | 192,043 | | | | 164,485 | | |
| Redemptions | | | (2,115,985 | ) | | | (1,116,146 | ) | |
| Exchange from Class B shares | | | 258,119 | | | | 328,644 | | |
| Net increase | | | 188,643 | | | | 1,131,343 | | |
78
Eaton Vance Limited Maturity Municipals Funds as of March 31, 2008
NOTES TO FINANCIAL STATEMENTS CONT'D
| New York Limited Fund (continued) | |
| | | Year Ended March 31, | |
| Class B | | 2008 | | 2007 | |
| Sales | | | 61,091 | | | | 46,875 | | |
Issued to shareholders electing to
receive payments of distributions
in Fund shares | | | 4,984 | | | | 12,301 | | |
| Redemptions | | | (30,769 | ) | | | (166,834 | ) | |
| Exchange to Class A shares | | | (258,235 | ) | | | (328,737 | ) | |
| Net decrease | | | (222,929 | ) | | | (436,395 | ) | |
| | | Year Ended March 31, | |
| Class C | | 2008 | | 2007 | |
| Sales | | | 704,481 | | | | 247,041 | | |
Issued to shareholders electing to
receive payments of distributions
in Fund shares | | | 40,174 | | | | 41,346 | | |
| Redemptions | | | (484,217 | ) | | | (746,861 | ) | |
| Net increase (decrease) | | | 260,438 | | | | (458,474 | ) | |
| Ohio Limited Fund | |
| | | Year Ended March 31, | |
| Class A | | 2008 | | 2007 | |
| Sales | | | 457,764 | | | | 382,699 | | |
Issued to shareholders electing to
receive payments of distributions
in Fund shares | | | 38,746 | | | | 32,780 | | |
| Redemptions | | | (447,253 | ) | | | (273,939 | ) | |
| Exchange from Class B shares | | | 33,096 | | | | 38,263 | | |
| Net increase | | | 82,353 | | | | 179,803 | | |
| | | Year Ended March 31, | |
| Class B | | 2008 | | 2007 | |
| Sales | | | 3,800 | | | | 3,299 | | |
Issued to shareholders electing to
receive payments of distributions
in Fund shares | | | 519 | | | | 1,472 | | |
| Redemptions | | | (4,720 | ) | | | (12,738 | ) | |
| Exchange to Class A shares | | | (33,128 | ) | | | (38,315 | ) | |
| Net decrease | | | (33,529 | ) | | | (46,282 | ) | |
| | | Year Ended March 31, | |
| Class C | | 2008 | | 2007(1) | |
| Sales | | | 18,226 | | | | 104 | | |
Issued to shareholders electing to
receive payments of distributions
in Fund shares | | | 76 | | | | 2 | | |
| Redemptions | | | (4,477 | ) | | | — | | |
| Net increase | | | 13,825 | | | | 106 | | |
| Pennsylvania Limited Fund | |
| | | Year Ended March 31, | |
| Class A | | 2008 | | 2007 | |
| Sales | | | 985,042 | | | | 189,884 | | |
Issued to shareholders electing to
receive payments of distributions
in Fund shares | | | 74,547 | | | | 70,290 | | |
| Redemptions | | | (618,786 | ) | | | (598,714 | ) | |
| Exchange from Class B shares | | | 193,922 | | | | 253,116 | | |
| Net increase (decrease) | | | 634,725 | | | | (85,424 | ) | |
| | | Year Ended March 31, | |
| Class B | | 2008 | | 2007 | |
| Sales | | | 3,389 | | | | 20,630 | | |
Issued to shareholders electing to
receive payments of distributions
in Fund shares | | | 4,024 | | | | 8,684 | | |
| Redemptions | | | (56,469 | ) | | | (95,404 | ) | |
| Exchange to Class A shares | | | (193,901 | ) | | | (253,007 | ) | |
| Net decrease | | | (242,957 | ) | | | (319,097 | ) | |
| | | Year Ended March 31, | |
| Class C | | 2008 | | 2007 | |
| Sales | | | 301,201 | | | | 227,581 | | |
Issued to shareholders electing to
receive payments of distributions
in Fund shares | | | 17,952 | | | | 20,524 | | |
| Redemptions | | | (353,647 | ) | | | (433,177 | ) | |
| Net decrease | | | (34,494 | ) | | | (185,072 | ) | |
(1) Class C of the New Jersey Limited Fund and Ohio Limited Fund commenced operations on August 1, 2006.
79
Eaton Vance Limited Maturity Municipals Funds as of March 31, 2008
NOTES TO FINANCIAL STATEMENTS CONT'D
8 Federal Income Tax Basis of Investments
The cost and unrealized appreciation (depreciation) of investments of each Fund at March 31, 2008, as determined on a federal income tax basis, were as follows:
| California Limited Fund | |
| Aggregate cost | | $ | 37,560,903 | | |
| Gross unrealized appreciation | | $ | 1,066,216 | | |
| Gross unrealized depreciation | | | (505,678 | ) | |
| Net unrealized appreciation | | $ | 560,538 | | |
| Florida Plus Limited Fund | |
| Aggregate cost | | $ | 38,345,817 | | |
| Gross unrealized appreciation | | $ | 713,261 | | |
| Gross unrealized depreciation | | | (498,391 | ) | |
| Net unrealized appreciation | | $ | 214,870 | | |
| Massachusetts Limited Fund | |
| Aggregate cost | | $ | 61,519,820 | | |
| Gross unrealized appreciation | | $ | 2,414,664 | | |
| Gross unrealized depreciation | | | (559,790 | ) | |
| Net unrealized appreciation | | $ | 1,854,874 | | |
| New Jersey Limited Fund | |
| Aggregate cost | | $ | 41,237,974 | | |
| Gross unrealized appreciation | | $ | 1,571,798 | | |
| Gross unrealized depreciation | | | (330,808 | ) | |
| Net unrealized appreciation | | $ | 1,240,990 | | |
| New York Limited Fund | |
| Aggregate cost | | $ | 94,176,036 | | |
| Gross unrealized appreciation | | $ | 2,663,763 | | |
| Gross unrealized depreciation | | | (1,145,780 | ) | |
| Net unrealized appreciation | | $ | 1,517,983 | | |
| Ohio Limited Fund | |
| Aggregate cost | | $ | 18,674,609 | | |
| Gross unrealized appreciation | | $ | 867,736 | | |
| Gross unrealized depreciation | | | (167,049 | ) | |
| Net unrealized appreciation | | $ | 700,687 | | |
| Pennsylvania Limited Fund | |
| Aggregate cost | | $ | 51,689,388 | | |
| Gross unrealized appreciation | | $ | 2,057,707 | | |
| Gross unrealized depreciation | | | (502,016 | ) | |
| Net unrealized appreciation | | $ | 1,555,691 | | |
9 Line of Credit
The Funds participate with other portfolios and funds managed by EVM and its affiliates in a $200 million unsecured line of credit agreement with a group of banks. Borrowings are made by the Funds solely to facilitate the handling of unusual and/or unanticipated short-term cash requirements. Interest is charged to each Fund based on its borrowings at an amount above either the Eurodollar rate or Federal Funds rate. In addition, a fee computed at an annual rate of 0.07% on the daily unused portion of the line of credit is allocated among the participating portfolios and funds at the end of each quarter. The Funds did not have any significant borrowings or allocated fees during the year ended March 31, 2008.
10 Financial Instruments
The Funds may trade in financial instruments with off-balance sheet risk in the normal course of their investing activities to assist in managing exposure to various market risks. These financial instruments may include financial futures contracts, options on financial futures contracts and interest rate swaps and may involve, to a varying degree, elements of risk in excess of the amounts recognized for financial statement purposes. The notional or contractual amounts of these instruments represent the investment a Fund has in particular classes of financial instruments and does not necessarily represent the amounts potentially subject to risk. The measurement of the risks associated with these instruments is meaningful only when all related and
80
Eaton Vance Limited Maturity Municipals Funds as of March 31, 2008
NOTES TO FINANCIAL STATEMENTS CONT'D
offsetting transactions are considered. A summary of obligations under these financial instruments at March 31, 2008 is as follows:
Futures Contracts
Fund | |
Expiration
Dates | |
Contracts | |
Position | |
Aggregate
Cost | |
Value | | Net
Unrealized
Depreciation | |
California
Limited | | 6/08 | | 68 U.S.
Treasury Bond | | Short | | $ | (7,810,731 | ) | | $ | (8,078,188 | ) | | $ | (267,457 | ) | |
Florida Plus
Limited | | 6/08 | | 40 U.S.
Treasury Bond | | Short | | $ | (4,582,047 | ) | | $ | (4,751,875 | ) | | $ | (169,828 | ) | |
Massachusetts
Limited | | 6/08 | | 41 U.S.
Treasury Note | | Short | | $ | (4,739,200 | ) | | $ | (4,877,078 | ) | | $ | (137,878 | ) | |
| | 6/08 | | 78 U.S.
Treasury Bond | | Short | | $ | (8,992,618 | ) | | $ | (9,266,157 | ) | | $ | (273,539 | ) | |
New Jersey
Limited | | 6/08 | | 67 U.S.
Treasury Bond | | Short | | $ | (7,674,930 | ) | | $ | (7,959,391 | ) | | $ | (284,461 | ) | |
New York
Limited | | 6/08 | | 94 U.S.
Treasury Note | | Short | | $ | (10,865,483 | ) | | $ | (11,181,594 | ) | | $ | (316,111 | ) | |
| | | 6/08 | | 99 U.S.
Treasury Bond | | Short | | $ | (11,434,207 | ) | | $ | (11,760,890 | ) | | $ | (326,683 | ) | |
Ohio
Limited | | 6/08 | | 25 U.S.
Treasury Note | | Short | | $ | (2,889,756 | ) | | $ | (2,973,828 | ) | | $ | (84,072 | ) | |
| | | 6/08 | | 14 U.S.
Treasury Bond | | Short | | $ | (1,618,124 | ) | | $ | (1,663,157 | ) | | $ | (45,033 | ) | |
Pennsylvania
Limited | | 6/08 | | 40 U.S.
Treasury Note | | Short | | $ | (4,623,609 | ) | | $ | (4,758,125 | ) | | $ | (134,516 | ) | |
| | | 6/08 | | 49 U.S.
Treasury Bond | | Short | | $ | (5,628,321 | ) | | $ | (5,821,047 | ) | | $ | (192,726 | ) | |
At March 31, 2008, the Funds had sufficient cash and/or securities to cover commitments under these contracts.
11 Recently Issued Accounting Pronouncements
In September 2006, the FASB issued Statement of Financial Accounting Standards No. 157 (FAS 157), "Fair Value Measurements". FAS 157 defines fair value, establishes a framework for measuring fair value in accordance with generally accepted accounting principles and expands disclosure about fair value measurements. FAS 157 is effective for fiscal years beginning after November 15, 2007. As of March 31, 2008, management does not believe the adoption of FAS 157 will impact the amounts reported in the financial statements; however, additional disclosures may be required about the inputs used to develop the measurements of fair value and the effect of certain of the measurements on changes in net assets for the period.
In March 2008, the FASB issued Statement of Financial Accounting Standards No. 161 (FAS 161), "Disclosures about Derivative Instruments and Hedging Activities". FAS 161 requires enhanced disclosures about an entity's derivative and hedging activities, including qualitative disclosures about the objectives and strategies for using derivatives, quantitative disclosures about fair value amounts of and gains and losses on derivative instruments, and disclosures about credit-risk related contingent features in derivative instruments. FAS 161 is effective for fiscal years and interim periods beginning after November 15, 2008. Management is currently evaluating the impact the adoption of FAS 161 will have on the Funds' financial statement disclosures.
12 Name Change
Effective January 1, 2008, the name of the Florida Plus Limited Fund was changed from Eaton Vance Florida Limited Maturity Municipals Fund. In connection with this change, the Fund's investment policy that at least 65% of its total assets normally will be invested in municipal obligations issued by the State of Florida or its political subdivisions, agencies, authorities and instrumentalities was eliminated.
81
Eaton Vance Limited Maturity Municipals Funds as of March 31, 2008
REPORT OF INDEPENDENT REGISTERED PUBLIC ACCOUNTING FIRM
To the Trustees of Eaton Vance Investment Trust and the Shareholders of Eaton Vance California Limited Maturity Municipals Fund, Eaton Vance Florida Plus Limited Maturity Municipals Fund (formerly Eaton Vance Florida Limited Maturity Municipals Fund), Eaton Vance Massachusetts Limited Maturity Municipals Fund, Eaton Vance New Jersey Limited Maturity Municipals Fund, Eaton Vance New York Limited Maturity Municipals Fund, Eaton Vance Ohio Limited Maturity Municipals Fund and Eaton Vance Pennsylvania Limited Maturity Municipals Fund:
We have audited the accompanying statements of assets and liabilities of Eaton Vance California Limited Maturity Municipals Fund, Eaton Vance Florida Plus Limited Maturity Municipals Fund (formerly Eaton Vance Florida Limited Maturity Municipals Fund), Eaton Vance Massachusetts Limited Maturity Municipals Fund, Eaton Vance New Jersey Limited Maturity Municipals Fund, Eaton Vance New York Limited Maturity Municipals Fund, Eaton Vance Ohio Limited Maturity Municipals Fund and Eaton Vance Pennsylvania Limited Maturity Municipals Fund (collectively the "Funds") (certain of the funds constituting Eaton Vance Investment Trust), including the portfolios of investments, as of March 31, 2008, and the related statements of operations for the year then ended, the statements of changes in net assets for each of the two years in the period then ended, and the financial highlights for the periods presented. These financial statements and fina ncial highlights are the responsibility of the Funds' management. Our responsibility is to express an opinion on these financial statements and financial highlights based on our audits.
We conducted our audits in accordance with the standards of the Public Company Accounting Oversight Board (United States). Those standards require that we plan and perform the audit to obtain reasonable assurance about whether the financial statements and financial highlights are free of material misstatement. The Funds are not required to have, nor were we engaged to perform, an audit of their internal control over financial reporting. Our audits included consideration of internal control over financial reporting as a basis for designing audit procedures that are appropriate in the circumstances, but not for the purpose of expressing an opinion on the effectiveness of the Funds' internal control over financial reporting. Accordingly, we express no such opinion. An audit also includes examining, on a test basis, evidence supporting the amounts and disclosures in the financial statements, assessing the accounting principles used and significant estimates made by management, as well as evaluating the overall financial statement presentation. Our procedures included confirmation of securities owned as of March 31, 2008, by correspondence with the custodian and brokers; where replies were not received from brokers, we performed other auditing procedures. We believe that our audits provide a reasonable basis for our opinion.
In our opinion, the financial statements and financial highlights referred to above present fairly, in all material respects, the financial positions of Eaton Vance California Limited Maturity Municipals Fund, Eaton Vance Florida Plus Limited Maturity Municipals Fund, Eaton Vance Massachusetts Limited Maturity Municipals Fund, Eaton Vance New Jersey Limited Maturity Municipals Fund, Eaton Vance New York Limited Maturity Municipals Fund, Eaton Vance Ohio Limited Maturity Municipals Fund and Eaton Vance Pennsylvania Limited Maturity Municipals Fund as of March 31, 2008, the results of their operations for the year then ended, the changes in their net assets for each of the two years in the period then ended, and the financial highlights for the periods presented, in conformity with accounting principles generally accepted in the United States of America.
DELOITTE & TOUCHE LLP
Boston, Massachusetts
May 15, 2008
82
Eaton Vance Limited Maturity Municipals Funds as of March 31, 2008
FEDERAL TAX INFORMATION (Unaudited)
The Form 1099-DIV you receive in January 2009 will show the tax status of all distributions paid to your account in calendar 2008. Shareholders are advised to consult their own tax adviser with respect to the tax consequences of their investment in the Funds. As required by the Internal Revenue Code regulations, shareholders must be notified within 60 days of a Fund's fiscal year end regarding exempt-interest dividends.
Exempt-Interest Dividends — The Funds designate the following amounts of dividends from net investment income as an exempt-interest dividend.
| California Limited Maturity Municipals Fund | | | 100.00 | % | |
| Florida Plus Limited Maturity Municipals Fund | | | 98.66 | % | |
| Massachusetts Limited Maturity Municipals Fund | | | 100.00 | % | |
| New Jersey Limited Maturity Municipals Fund | | | 100.00 | % | |
| New York Limited Maturity Municipals Fund | | | 100.00 | % | |
| Ohio Limited Maturity Municipals Fund | | | 100.00 | % | |
| Pennsylvania Limited Maturity Municipals Fund | | | 100.00 | % | |
83
Eaton Vance Limited Maturity Municipals Funds
BOARD OF TRUSTEES' ANNUAL APPROVAL OF THE INVESTMENT ADVISORY AGREEMENTS
Overview of the Contract Review Process
The Investment Company Act of 1940, as amended (the "1940 Act"), provides, in substance, that each investment advisory agreement between a fund and its investment adviser will continue in effect from year to year only if its continuance is approved at least annually by the fund's board of trustees, including by a vote of a majority of the trustees who are not "interested persons" of the fund ("Independent Trustees"), cast in person at a meeting called for the purpose of considering such approval.
At a meeting of the Boards of Trustees (each a "Board") of the Eaton Vance group of mutual funds (the "Eaton Vance Funds") held on April 23, 2007, the Board, including a majority of the Independent Trustees, voted to approve continuation of existing advisory and sub-advisory agreements for the Eaton Vance Funds for an additional one-year period. In voting its approval, the Board relied upon the affirmative recommendation of the Special Committee of the Board, which is a committee comprised exclusively of Independent Trustees. Prior to making its recommendation, the Special Committee reviewed information furnished for a series of meetings of the Special Committee held in February, March and April 2007. Such information included, among other things, the following:
Information about Fees, Performance and Expenses
• An independent report comparing the advisory and related fees paid by each fund with fees paid by comparable funds;
• An independent report comparing each fund's total expense ratio and its components to comparable funds;
• An independent report comparing the investment performance of each fund to the investment performance of comparable funds over various time periods;
• Data regarding investment performance in comparison to relevant peer groups of funds and appropriate indices;
• Comparative information concerning fees charged by each adviser for managing other mutual funds and institutional accounts using investment strategies and techniques similar to those used in managing the fund;
• Profitability analyses for each adviser with respect to each fund;
Information about Portfolio Management
• Descriptions of the investment management services provided to each fund, including the investment strategies and processes employed;
• Information concerning the allocation of brokerage and the benefits received by each adviser as a result of brokerage allocation, including information concerning the acquisition of research through "soft dollar" benefits received in connection with the funds' brokerage, and the implementation of a soft dollar reimbursement program established with respect to the funds;
• Data relating to portfolio turnover rates of each fund;
• The procedures and processes used to determine the fair value of fund assets and actions taken to monitor and test the effectiveness of such procedures and processes;
Information about each Adviser
• Reports detailing the financial results and condition of each adviser;
• Descriptions of the qualifications, education and experience of the individual investment professionals whose responsibilities include portfolio management and investment research for the funds, and information relating to their compensation and responsibilities with respect to managing other mutual funds and investment accounts;
• Copies of the Codes of Ethics of each adviser and its affiliates, together with information relating to compliance with and the administration of such codes;
• Copies of or descriptions of each adviser's proxy voting policies and procedures;
• Information concerning the resources devoted to compliance efforts undertaken by each adviser and its affiliates on behalf of the funds (including descriptions of various compliance programs) and their record of compliance with investment policies and restrictions, including policies with respect to market-timing, late trading and selective portfolio disclosure, and with policies on personal securities transactions;
• Descriptions of the business continuity and disaster recovery plans of each adviser and its affiliates;
Other Relevant Information
• Information concerning the nature, cost and character of the administrative and other non-investment management services provided by Eaton Vance Management and its affiliates;
• Information concerning management of the relationship with the custodian, subcustodians and fund accountants by each adviser or the funds' administrator; and
• The terms of each advisory agreement.
In addition to the information identified above, the Special Committee considered information provided from time to time by each adviser throughout the year at meetings of the Board and its committees. Over the course of the twelve-month period ended
84
Eaton Vance Limited Maturity Municipals Funds
BOARD OF TRUSTEES' ANNUAL APPROVAL OF THE INVESTMENT ADVISORY AGREEMENTS CONT'D
April 30, 2007, the Board met ten times and the Special Committee, the Audit Committee and the Governance Committee, each of which is a Committee comprised solely of Independent Trustees, met twelve, fourteen and eight times, respectively. At such meetings, the Trustees received, among other things, presentations by the portfolio managers and other investment professionals of each adviser relating to the investment performance of each fund and the investment strategies used in pursuing the fund's investment objective.
For funds that invest through one or more underlying portfolios, the Board considered similar information about the portfolio(s) when considering the approval of advisory agreements. In addition, in cases where the fund's investment adviser has engaged a sub-adviser, the Board considered similar information about the sub-adviser when considering the approval of any sub-advisory agreement.
The Special Committee was assisted throughout the contract review process by Goodwin Procter LLP, legal counsel for the Independent Trustees. The members of the Special Committee relied upon the advice of such counsel and their own business judgment in determining the material factors to be considered in evaluating each advisory and sub-advisory agreement and the weight to be given to each such factor. The conclusions reached with respect to each advisory and sub-advisory agreement were based on a comprehensive evaluation of all the information provided and not any single factor. Moreover, each member of the Special Committee may have placed varying emphasis on particular factors in reaching conclusions with respect to each advisory and sub-advisory agreement.
Results of the Process
Based on its consideration of the foregoing, and such other information as it deemed relevant, including the factors and conclusions described below, the Special Committee concluded that the continuance of the investment advisory agreements of the following funds:
• Eaton Vance California Limited Maturity Municipals Fund
• Eaton Vance Florida Plus Limited Maturity Municipals Fund
• Eaton Vance Massachusetts Limited Maturity Municipals Fund
• Eaton Vance New Jersey Limited Maturity Municipals Fund
• Eaton Vance New York Limited Maturity Municipals Fund
• Eaton Vance Ohio Limited Maturity Municipals Fund
• Eaton Vance Pennsylvania Limited Maturity Municipals Fund
(the "Funds"), each with Boston Management and Research (the "Adviser"), including their fee structures, is in the interests of shareholders and, therefore, the Special Committee recommended to the Board approval of each agreement. The Board accepted the recommendation of the Special Committee as well as the factors considered and conclusions reached by the Special Committee with respect to each agreement. Accordingly, the Board, including a majority of the Independent Trustees, voted to approve continuation of the advisory agreements for each Fund.
Nature, Extent and Quality of Services
In considering whether to approve the investment advisory agreements of the Funds, the Board evaluated the nature, extent and quality of services provided to the Funds by the Adviser.
The Board considered the Adviser's management capabilities and investment process with respect to the types of investments held by each Fund, including the education, experience and number of its investment professionals and other personnel who provide portfolio management, investment research, and similar services to the Funds. In particular, the Board evaluated the abilities and experience of such investment personnel in analyzing factors such as credit risk, tax efficiency, and special considerations relevant to investing in municipal obligations. Specifically, the Board considered the Adviser's 30-person municipal bond team, which includes six portfolio managers and nine credit specialists who provide services to the Funds. The Board also took into account the resources dedicated to portfolio management and other services, including the compensation paid to recruit and retain investment personnel, and the time and attention devoted to each Fund by senior management.
The Board reviewed the compliance programs of the Adviser and relevant affiliates thereof. Among other matters, the Board considered compliance and reporting matters relating to personal trading by investment personnel, selective disclosure of portfolio holdings, late trading, frequent trading, portfolio valuation, business continuity and the allocation of investment opportunities. The Board also evaluated the responses of the Adviser and its affiliates to requests from regulatory authorities such as the Securities and Exchange Commission and the National Association of Securities Dealers.
The Board also considered shareholder and other administrative services provided or managed by Eaton Vance Management and its affiliates, including transfer agency and accounting services. The Board evaluated the benefits to shareholders of investing in a fund that is a part of a large family of funds, including the ability, in many cases, to exchange an investment among different funds without incurring additional sales charges.
85
Eaton Vance Limited Maturity Municipals Funds
BOARD OF TRUSTEES' ANNUAL APPROVAL OF THE INVESTMENT ADVISORY AGREEMENTS CONT'D
After consideration of the foregoing factors, among others, the Board concluded that the nature, extent and quality of services provided by the Adviser, taken as a whole, are appropriate and consistent with the terms of the respective investment advisory agreements.
Fund Performance
The Board compared each Fund's investment performance to a relevant universe of similarly managed funds identified by an independent data provider and appropriate benchmark indices. The Board reviewed comparative performance data for the one-, three-, five- and ten-year periods ended September 30, 2006 for each Fund in operation over such periods. On the basis of the foregoing and other relevant information, the Board concluded that the performance of each Fund was satisfactory.
Management Fees and Expenses
The Board reviewed contractual investment advisory fee rates, including any administrative fee rates, payable by each Fund (referred to collectively as "management fees"). As part of its review, the Board considered each Fund's management fee and total expense ratio for the one year period ended September 30, 2006, as compared to a group of similarly managed funds selected by an independent data provider.
After reviewing the foregoing information, and in light of the nature, extent and quality of the services provided by the Adviser, the Board concluded with respect to each Fund that the management fees charged to the Fund for advisory and related services and the total expense ratio of the Fund are reasonable.
Profitability
The Board reviewed the level of profits realized by the Adviser and, if applicable, its affiliates in providing investment advisory and administrative services to each Fund and to all Eaton Vance Funds as a group. The Board considered the level of profits realized without regard to revenue sharing or other payments by the Adviser and its affiliates to third parties in respect of distribution services. The Board also considered other direct or indirect benefits received by the Adviser and its affiliates in connection with their relationship with the Funds.
The Board concluded that, in light of the foregoing factors and the nature, extent and quality of the services rendered, the profits realized by the Adviser and its affiliates are reasonable.
Economies of Scale
In reviewing management fees and profitability, the Board also considered the extent to which the Adviser and its affiliates, on the one hand, and each Fund, on the other hand, can expect to realize benefits from economies of scale as the assets of the Fund increase. The Board acknowledged the difficulty in accurately measuring the benefits resulting from the economies of scale with respect to the management of any specific fund or group of funds. The Board reviewed data summarizing the increases and decreases in the assets of each Fund and of all Eaton Vance Funds as a group over various time periods, and evaluated the extent to which the total expense ratio of each Fund and the profitability of the Adviser and its affiliates may have been affected by such increases or decreases. Based upon the foregoing, the Board concluded that the benefits from economies of scale are currently being shared equitably by the Adviser and its af filiates and each Fund. The Board also concluded that, assuming reasonably foreseeable increases in the assets of each Fund, the structure of each advisory fee, which includes breakpoints at several asset levels, can be expected to cause the Adviser and its affiliates and the Fund to continue to share such benefits equitably.
86
Eaton Vance Limited Maturity Municipals Funds
MANAGEMENT AND ORGANIZATION
Fund Management. The Trustees of Eaton Vance Investment Trust (the Trust) are responsible for the overall management and supervision of the Trust's affairs. The Trustees and officers of the Trust are listed below. Except as indicated, each individual has held the office shown or other offices in the same company for the last five years. Trustees and officers of the Trust hold indefinite terms of office. The "noninterested Trustees" consist of those Trustees who are not "interested persons" of the Trust, as that term is defined under the 1940 Act. The business address of each Trustee and officer is The Eaton Vance Building, 255 State Street, Boston, Massachusetts 02109. As used below, "EVC" refers to Eaton Vance Corp., "EV" refers to Eaton Vance, Inc., "EVM" refers to Eaton Vance Management, "BMR" refers to Boston Management and Research, and "EVD" refers to Eaton Vance Distributors, Inc. EVC and EV are the corporate parent and trustee, respectively, of EVM and BMR. EVD is the Fund's principal underwriter and a wholly-owned subsidiary of EVC. Each officer affiliated with Eaton Vance may hold a position with other Eaton Vance affiliates that is comparable to his or her position with EVM listed below.
| Date of Birth | | Position(s)
Name and
Trust | | Term of
Office and
with the
Service | | Length of
During Past Five Years | | Number of Portfolios
in Fund Complex
Principal Occupation(s)
Trustee(1) | | Overseen By
Other Directorships Held | |
| Interested Trustee | |
|
Thomas E. Faust Jr.
5/31/58 | | Trustee | | Since 2007 | | Chairman, Chief Executive Officer and President of EVC, President of EV, Chief Executive Officer and President of EVM and BMR, and Director of EVD. Trustee and/or Officer of 177 registered investment companies and 5 private investment companies managed by EVM or BMR. Mr. Faust is an interested person because of his positions with EVM, BMR, EVD, EVC and EV which are affiliates of the Trust | | | 177 | | | Director of EVC | |
|
| Noninterested Trustees | |
|
| Benjamin C. Esty 1/2/63 | | Trustee | | Since 2005 | | Roy and Elizabeth Simmons Professor of Business Administration, Harvard University Graduate School of Business Administration. | | | 177 | | | None | |
|
| Allen R. Freedman 4/3/40 | | Trustee | | Since 2007 | | Former Chairman (2002-2004) and a Director (1983-2004) of Systems & Computer Technology Corp. (provider of software to higher education). Formerly, a Director of Loring Ward International (fund distributor) (2005-2007). Formerly, Chairman and a Director of Indus International, Inc. (provider of enterprise management software to the power generating industry) (2006-2007). | | | 177 | | | Director of Assurant, Inc. (insurance provider) and Stonemor Partners L.P. (owner and operator of cemeteries) | |
|
| William H. Park 9/19/47 | | Trustee | | Since 2003 | | Vice Chairman, Commercial Industrial Finance Corp. (specialty finance company) (since 2006). Formerly, President and Chief Executive Officer, Prizm Capital Management, LLC (investment management firm) (2002-2005). | | | 177 | | | None | |
|
| Ronald A. Pearlman 7/10/40 | | Trustee | | Since 2003 | | Professor of Law, Georgetown University Law Center. | | | 177 | | | None | |
|
| Norton H. Reamer 9/21/35 | | Trustee | | Since 1985 | | Chairman (since 2007) and President, Chief Executive Officer and a Director (since 2003) of Asset Management Finance Corp. (a specialty finance company serving the investment management industry). President, Unicorn Corporation (an investment and financial advisory services company) (since September 2000). Formerly, Chairman and Chief Operating Officer, Hellman, Jordan Management Co., Inc. (an investment management company) (2000-2003). Formerly, Advisory Director of Berkshire Capital Corporation (investment banking firm) (2002-2003). | | | 177 | | | None | |
|
87
Eaton Vance Limited Maturity Municipals Funds
MANAGEMENT AND ORGANIZATION CONT'D
| Date of Birth | | Position(s)
Name and
Trust | | Term of
Office and
with the
Service | | Length of
During Past Five Years | | Number of Portfolios
in Fund Complex
Principal Occupation(s)
Trustee(1) | | Overseen By
Other Directorships Held | |
| Noninterested Trustees (continued) | |
|
| Heidi L. Steiger 7/8/53 | | Trustee | | Since 2007 | | President, Lowenhaupt Global Advisors, LLC (global wealth management firm) (since 2005). Formerly, President and Contributing Editor, Worth Magazine (2004-2005). Formerly, Executive Vice President and Global Head of Private Asset Management (and various other positions), Neuberger Berman (investment firm) (1986-2004). | | | 177 | | | Director of Nuclear Electric Insurance Ltd. (nuclear insurance provider) and Aviva USA (insurance provider) | |
|
| Lynn A. Stout 9/14/57 | | Trustee | | Since 1998 | | Paul Hastings Professor of Corporate and Securities Law (since 2006) and Professor of Law (2001-2006), University of California at Los Angeles School of Law. | | | 177 | | | None | |
|
| Ralph F. Verni 1/26/43 | | Chairman of the Board and Trustee | | Chairman of the Board since 2007 and Trustee since 2005 | | Consultant and private investor. | | | 177 | | | None | |
|
| Principal Officers who are not Trustees | |
|
Name and
Date of Birth | | Position(s)
with the
Trust | | Term of
Office and
Length of
Service | | Principal Occupation(s)
During Past Five Years | |
| Cynthia J. Clemson 3/2/63 | | President | | Since 2005 | | Vice President of EVM and BMR. Officer of 90 registered investment companies managed by EVM or BMR. | |
|
| William H. Ahern, Jr. 7/28/59 | | Vice President | | Since 2004 | | Vice President of EVM and BMR. Officer of 75 registered investment companies managed by EVM or BMR. | |
|
| Craig R. Brandon 12/21/66 | | Vice President | | Since 2004 | | Vice President of EVM and BMR. Officer of 44 registered investment companies managed by EVM or BMR. | |
|
| Robert B. MacIntosh 1/22/57 | | Vice President | | Since 1993 | | Vice President of EVM and BMR. Officer of 90 registered investment companies managed by EVM or BMR. | |
|
| Thomas M. Metzold 8/3/58 | | Vice President | | Since 2004 | | Vice President of EVM and BMR. Officer of 43 registered investment companies managed by EVM or BMR. | |
|
| Adam A. Weigold 3/22/75 | | Vice President | | Since 2007 | | Vice President of EVM and BMR. Officer of 70 registered investment companies managed by EVM or BMR. | |
|
| Barbara E. Campbell 6/19/57 | | Treasurer | | Since 2005 | | Vice President of EVM and BMR. Officer of 177 registered investment companies managed by EVM or BMR. | |
|
| Maureen A. Gemma 5/24/60 | | Secretary | | Since 2007 | | Deputy Chief Legal Officer and Vice President of EVM and BMR. Officer of 177 registered investment companies managed by EVM or BMR. | |
|
| Paul M. O'Neil 7/11/53 | | Chief Compliance Officer | | Since 2004 | | Vice President of EVM and BMR. Officer of 177 registered investment companies managed by EVM or BMR. | |
|
| John E. Pelletier 6/24/64 | | Chief Legal Officer | | Since 2007 | | Vice President and Chief Legal Officer of BMR, EVM, EVD, EV and EVC. Previously, Chief Operating Officer and Executive Vice President (2004-2007) and General Counsel (1997-2004) of Natixis Global Associates. Officer of 177 registered investment companies managed by EVM or BMR. | |
|
(1) Includes both master and feeder funds in a master-feeder structure.
The SAI for the Funds includes additional information about the Trustees and officers of the Funds and can be obtained, without charge, on Eaton Vance's website at www.eatonvance.com, or by calling 1-800-225-6265.
88
Investment Adviser
Boston Management and Research
The Eaton Vance Building
255 State Street
Boston, MA 02109
Fund Administrator
Eaton Vance Management
The Eaton Vance Building
255 State Street
Boston, MA 02109
Principal Underwriter
Eaton Vance Distributors, Inc.
The Eaton Vance Building
255 State Street
Boston, MA 02109
(617) 482-8260
Custodian
State Street Bank and Trust Company
200 Clarendon Street
Boston, MA 02116
Transfer Agent
PFPC Inc.
Attn: Eaton Vance Funds
P.O. Box 9653
Providence, RI 02940-9653
(800) 262-1122
Independent Registered Public Accounting Firm
Deloitte & Touche LLP
200 Berkeley Street
Boston, MA 02116-5022
Eaton Vance Investment Trust
The Eaton Vance Building
255 State Street
Boston, MA 02109
This report must be preceded or accompanied by a current prospectus. Before investing, investors should consider carefully a Fund's investment objective(s), risks, and charges and expenses. The Funds' current prospectus contains this and other information about the Funds and is available through your financial advisor. Please read the prospectus carefully before you invest or send money. For further information please call 1-800-225-6265.
442-5/08 7LTFSRC
Item 2. Code of Ethics
The registrant has adopted a code of ethics applicable to its Principal Executive Officer, Principal Financial Officer and Principal Accounting Officer. The registrant undertakes to provide a copy of such code of ethics to any person upon request, without charge, by calling 1-800-262-1122.
Item 3. Audit Committee Financial Expert
The registrant’s Board has designated William H. Park and Norton H. Reamer, each an independent trustee, as its audit committee financial experts. Mr. Park is a certified public accountant who is the Vice Chairman of Commercial Industrial Finance Corp (specialty finance company). Previously, he served as President and Chief Executive Officer of Prizm Capital Management, LLC (investment management firm) and as Executive Vice President and Chief Financial Officer of United Asset Management Corporation (“UAM”) (a holding company owning institutional investment management firms). Mr. Reamer is the President, Chief Executive Officer and a Director of Asset Management Finance Corp. (a specialty finance company serving the investment management industry) and is President of Unicorn Corporation (an investment and financial advisory services company). Formerly, Mr. Reamer was Chairman and Chief Operating Officer of Hellman, Jordan Management Co., Inc. (an investment management company) and Advisory Director of Berkshire Capital Corporation (an investment banking firm), Chairman of the Board of UAM and Chairman, President and Director of the UAM Funds (mutual funds).
Item 4. Principal Accountant Fees and Services
(a)-(d)
Eaton Vance California Limited Maturity Municipals Fund, Eaton Vance Florida Plus Limited Maturity Municipals Fund, Eaton Vance Massachusetts Limited Maturity Municipals Fund, Eaton Vance National Limited Maturity Municipals Fund, Eaton Vance New Jersey Limited Maturity Municipals Fund, Eaton Vance New York Limited Maturity Municipals Fund, Eaton Vance Ohio Limited Maturity Municipals Fund and Eaton Vance Pennsylvania Limited Maturity Municipals Fund (the “Fund(s)”) are the series of Eaton Vance Investment Trust (the “Trust”), a Massachusetts business trust. The Trust is registered under the Investment Company Act of 1940 as an open-end management investment company.
The following tables present the aggregate fees billed to each Fund for the Funds’ respective fiscal years ended March 31, 2007 and March 31, 2008 by the Funds’ principal accountant for professional services rendered for the audit of the Funds’ annual financial statements and fees billed for other services rendered by the principal accountant during those periods.
Eaton Vance California Limited Maturity Municipals Fund
Fiscal Years Ended | | 03/31/2007 | | 03/31/2008 | |
| | | | | |
Audit Fees | | $ | 23,680 | | $ | 25,320 | |
| | | | | |
Audit-Related Fees(1) | | $ | 0 | | 0 | |
| | | | | |
Tax Fees(2) | | $ | 7,280 | | $ | 7,535 | |
| | | | | |
All Other Fees(3) | | $ | 0 | | $ | 29 | |
| | | | | |
Total | | $ | 30,960 | | $ | 32,884 | |
Eaton Vance Florida Plus Limited Maturity Municipals Fund
Fiscal Years Ended | | 03/31/2007 | | 03/31/2008 | |
| | | | | |
Audit Fees | | $ | 26,310 | | $ | 27,950 | |
| | | | | |
Audit-Related Fees(1) | | $ | 0 | | $ | 0 | |
| | | | | |
Tax Fees(2) | | $ | 7,280 | | $ | 7,535 | |
| | | | | |
All Other Fees(3) | | $ | 0 | | $ | 33 | |
| | | | | |
Total | | $ | 33,590 | | $ | 35,518 | |
Eaton Vance Massachusetts Limited Maturity Municipals Fund
Fiscal Years Ended | | 03/31/2007 | | 03/31/2008 | |
| | | | | |
Audit Fees | | $ | 28,030 | | $ | 29,670 | |
| | | | | |
Audit-Related Fees(1) | | $ | 0 | | $ | 0 | |
| | | | | |
Tax Fees(2) | | $ | 7,280 | | $ | 7,535 | |
| | | | | |
All Other Fees(3) | | $ | 0 | | $ | 48 | |
| | | | | |
Total | | $ | 35,310 | | $ | 37,253 | |
Eaton Vance National Limited Maturity Municipals Fund
Fiscal Years Ended | | 03/31/2007 | | 03/31/2008 | |
| | | | | |
Audit Fees | | $ | 44,000 | | $ | 46,390 | |
| | | | | |
Audit-Related Fees(1) | | $ | 0 | | $ | 0 | |
| | | | | |
Tax Fees(2) | | $ | 7,280 | | $ | 7,535 | |
| | | | | |
All Other Fees(3) | | $ | 0 | | $ | 418 | |
| | | | | |
Total | | $ | 51,280 | | $ | 54,343 | |
Eaton Vance New Jersey Limited Maturity Municipals Fund
Fiscal Years Ended | | 03/31/2007 | | 03/31/2008 | |
| | | | | |
Audit Fees | | $ | 27,110 | | $ | 28,750 | |
| | | | | |
Audit-Related Fees(1) | | $ | 0 | | $ | 0 | |
| | | | | |
Tax Fees(2) | | $ | 7,280 | | $ | 7,535 | |
| | | | | |
All Other Fees(3) | | $ | 0 | | $ | 30 | |
| | | | | |
Total | | $ | 34,390 | | $ | 36,315 | |
Eaton Vance New York Limited Maturity Municipals Fund
Fiscal Years Ended | | 03/31/2007 | | 03/31/2008 | |
| | | | | |
Audit Fees | | $ | 30,810 | | $ | 32,450 | |
| | | | | |
Audit-Related Fees(1) | | $ | 0 | | $ | 0 | |
| | | | | |
Tax Fees(2) | | $ | 7,7280 | | $ | 7,535 | |
| | | | | |
All Other Fees(3) | | $ | 0 | | $ | 74 | |
| | | | | |
Total | | $ | 38,090 | | $ | 40,059 | |
Eaton Vance Ohio Limited Maturity Municipals Fund
Fiscal Years Ended | | 03/31/2007 | | 03/31/2008 | |
| | | | | |
Audit Fees | | $ | 21,780 | | $ | 23,670 | |
| | | | | |
Audit-Related Fees(1) | | $ | 0 | | $ | 0 | |
| | | | | |
Tax Fees(2) | | $ | 7,280 | | $ | 7,535 | |
| | | | | |
All Other Fees(3) | | $ | 0 | | $ | 16 | |
| | | | | |
Total | | $ | 29,060 | | $ | 31,221 | |
Eaton Vance Pennsylvania Limited Maturity Municipals Fund
Fiscal Years Ended | | 03/31/2007 | | 03/31/2008 | |
| | | | | |
Audit Fees | | $ | 26,310 | | $ | 27,950 | |
| | | | | |
Audit-Related Fees(1) | | $ | 0 | | $ | 0 | |
| | | | | |
Tax Fees(2) | | $ | 7,280 | | $ | 7,535 | |
| | | | | |
All Other Fees(3) | | $ | 0 | | $ | 39 | |
| | | | | |
Total | | $ | 33,590 | | $ | 35,524 | |
(1) | Audit-related fees consist of the aggregate fees billed for assurance and related services that are reasonably related to the performance of the audit of financial statements and are not reported under the category of audit fees. |
| |
(2) | Tax fees consist of the aggregate fees billed for professional services rendered by the principal accountant relating to tax compliance, tax advice, and tax planning and specifically include fees for tax return preparation. |
| |
(3) | All other fees consist of the aggregate fees billed for products and services provided by the principal accountant other than audit, audit-related, and tax services. |
The Funds, comprising all of the series of the Trust, have the same fiscal year end (March 31). The following table presents the aggregate audit, audit-related, tax, and other fees billed to all of the series in the Trust by the principal accountant of each series, Deloitte & Touche LLP (“D&T”), for the last two fiscal years of each series.
Fiscal Years
Ended | | 3/31/07 | | 3/31/08 | |
| | | | | |
Audit Fees | | $ | 228,030 | | $ | 242,150 | |
| | | | | |
Audit-Related Fees(1) | | 0 | | 0 | |
| | | | | |
Tax Fees(2) | | $ | 58,240 | | $ | 60,280 | |
| | | | | |
All Other Fees(3) | | 0 | | $ | 686 | |
| | | | | | |
Total | | $ | 286,270 | | $ | 303,116 | |
(1) | Audit-related fees consist of the aggregate fees billed for assurance and related services that are reasonably related to the performance of the audit of financial statements and are not reported under the category of audit fees. |
| |
(2) | Tax fees consist of the aggregate fees billed for professional services rendered by the principal accountant relating to tax compliance, tax advice, and tax planning and specifically include fees for tax return preparation. |
| |
(3) | All other fees consist of the aggregate fees billed for products and services provided by the principal accountant other than audit, audit-related, and tax services. |
During the Funds’ fiscal years ended March 31, 2007 and March 31, 2008, $35,000 was billed for each such fiscal year by D&T, the principal accountant for the Funds, for work done in connection with its Rule 17Ad-13 examination of Eaton Vance Management’s assertion that it has maintained an effective internal control structure over the sub-transfer agent and registrar functions, such services being pre-approved in accordance with Rule 2-01(c) (7) (ii) of Regulation S-X.
(e)(1) The registrant’s audit committee has adopted policies and procedures relating to the pre-approval of services provided by the registrant’s principal accountant (the “Pre-Approval Policies”). The Pre-Approval Policies establish a framework intended to assist the audit committee in the proper discharge of its pre-approval responsibilities. As a general matter, the Pre-Approval Policies (i) specify certain
types of audit, audit-related, tax, and other services determined to be pre-approved by the audit committee; and (ii) delineate specific procedures governing the mechanics of the pre-approval process, including the approval and monitoring of audit and non-audit service fees. Unless a service is specifically pre-approved under the Pre-Approval Policies, it must be separately pre-approved by the audit committee.
The Pre-Approval Policies and the types of audit and non-audit services pre-approved therein must be reviewed and ratified by the registrant’s audit committee at least annually. The registrant’s audit committee maintains full responsibility for the appointment, compensation, and oversight of the work of the registrant’s principal accountant.
(e)(2) No services described in paragraphs (b)-(d) above were approved by the registrant’s audit committee pursuant to the “de minimis exception” set forth in Rule 2-01(c)(7)(i)(C) of Regulation S-X.
(f) Not applicable.
(g) The following table presents (i) the aggregate non-audit fees (i.e., fees for audit-related, tax, and other services) billed for services rendered to all of Funds by their principal accountant for the last two fiscal years of each Fund; and (ii) the aggregate non-audit fees (i.e., fees for audit-related, tax, and other services) billed for services rendered to the Eaton Vance organization by “D&T” for the last two fiscal years of each Fund.
Fiscal Years Ended | | 3/31/07 | | 3/31/08 | |
| | | | | |
Registrant(1) | | $58,240 | | $60,280 | |
| | | | | |
Eaton Vance(2) | | $63,500 | | $295,569 | |
(1) | Includes all of the Series of the Trust. |
| |
(2) | Various subsidiaries of Eaton Vance Corp. act in either an investment advisory and/or service provider capacity with respect to the Series. |
(h) The registrant’s audit committee has considered whether the provision by the registrant’s principal accountant of non-audit services to the registrant’s investment adviser and any entity controlling, controlled by, or under common control with the adviser that provides ongoing services to the registrant that were not pre-approved pursuant to Rule 2-01(c)(7)(ii) of Regulation S-X is compatible with maintaining the principal accountant’s independence.
Item 5. Audit Committee of Listed registrants
Not required in this filing.
Item 6. Schedule of Investments
Please see schedule of investments contained in the Report to Stockholders included under Item 1 of this Form N-CSR.
Item 7. Disclosure of Proxy Voting Policies and Procedures for Closed-End Management Investment Companies
Not required in this filing.
Item 8. Portfolio Managers of Closed-End Management Investment Companies
Not required in this filing.
Item 9. Purchases of Equity Securities by Closed-End Management Investment Company and Affiliated Purchasers.
Not required in this filing.
Item 10. Submission of Matters to a Vote of Security Holders.
No Material Changes.
Item 11. Controls and Procedures
(a) It is the conclusion of the registrant’s principal executive officer and principal financial officer that the effectiveness of the registrant’s current disclosure controls and procedures (such disclosure controls and procedures having been evaluated within 90 days of the date of this filing) provide reasonable assurance that the information required to be disclosed by the registrant has been recorded, processed, summarized and reported within the time period specified in the Commission’s rules and forms and that the information required to be disclosed by the registrant has been accumulated and communicated to the registrant’s principal executive officer and principal financial officer in order to allow timely decisions regarding required disclosure.
(b) There have been no changes in the registrant’s internal controls over financial reporting during the second fiscal quarter of the period covered by this report that has materially affected, or is reasonably likely to materially affect, the registrant’s internal control over financial reporting.
Item 12. Exhibits
(a)(1) | Registrant’s Code of Ethics – Not applicable (please see Item 2). |
(a)(2)(i) | Treasurer’s Section 302 certification. |
(a)(2)(ii) | President’s Section 302 certification. |
(b) | Combined Section 906 certification. |
Signatures
Pursuant to the requirements of the Securities Exchange Act of 1934 and the Investment Company Act of 1940, the registrant has duly caused this report to be signed on its behalf by the undersigned, thereunto duly authorized.
Eaton Vance Investment Trust
By: | | /s/Cynthia J. Clemson | |
| | Cynthia J. Clemson | |
| | President | |
| | | |
| | | |
Date: | | May 12, 2008 | |
Pursuant to the requirements of the Securities Exchange Act of 1934 and the Investment Company Act of 1940, this report has been signed below by the following persons on behalf of the registrant and in the capacities and on the dates indicated.
By: | | /s/Barbara E. Campbell | |
| | Barbara E. Campbell | |
| | Treasurer | |
| | | |
| | | |
Date: | | May 12, 2008 | |
| | | |
| | | |
By: | | /s/Cynthia J. Clemson | |
| | Cynthia J. Clemson | |
| | President | |
| | | |
| | | |
Date: | | May 12, 2008 | |