UNITED STATES
SECURITIES AND EXCHANGE COMMISSION
Washington, D.C. 20549
FORM N-CSR
CERTIFIED SHAREHOLDER REPORT OF REGISTERED
MANAGEMENT INVESTMENT COMPANIES
Investment Company Act file number | 811-04443 |
|
Eaton Vance Investment Trust |
(Exact name of registrant as specified in charter) |
|
The Eaton Vance Building, 255 State Street, Boston, Massachusetts | | 02109 |
(Address of principal executive offices) | | (Zip code) |
|
Alan R. Dynner
The Eaton Vance Building, 255 State Street, Boston, Massachusetts 02109 |
(Name and address of agent for service) |
|
Registrant’s telephone number, including area code: | (617) 482-8260 | |
|
Date of fiscal year end: | March 31 | |
|
Date of reporting period: | March 31, 2005 | |
| | | | | | | | |
Item 1. Reports to Stockholders

| | | | 
|
A n n u a l R e p o r t M a r c h 3 1 , 2 0 0 5 | |
| | | | |

| | EATON VANCE
LIMITED
MATURITY
MUNICIPALS
FUNDS | | California Florida Massachusetts New Jersey New York Ohio
Pennsylvania |

| | |
IMPORTANT NOTICES REGARDING PRIVACY,
DELIVERY OF SHAREHOLDER DOCUMENTS,
PORTFOLIO HOLDINGS AND PROXY VOTING
Privacy. The Eaton Vance organization is committed to ensuring your financial privacy. Each of the financial institutions identified below has in effect the following policy (“Privacy Policy”) with respect to nonpublic personal information about its customers:
• Only such information received from you, through application forms or otherwise, and information about your Eaton Vance fund transactions will be collected. This may include information such as name, address, social security number, tax status, account balances and transactions.
• None of such information about you (or former customers) will be disclosed to anyone, except as permitted by law (which includes disclosure to employees necessary to service your account). In the normal course of servicing a customer’s account, Eaton Vance may share information with unaffiliated third parties that perform various required services such as transfer agents, custodians and broker/dealers.
• Policies and procedures (including physical, electronic and procedural safeguards) are in place that are designed to protect the confidentiality of such information.
• We reserve the right to change our Privacy Policy at any time upon proper notification to you. Customers may want to review our Policy periodically for changes by accessing the link on our homepage: www.eatonvance.com.
Our pledge of privacy applies to the following entities within the Eaton Vance organization: the Eaton Vance Family of Funds, Eaton Vance Management, Eaton Vance Investment Counsel, Boston Management and Research, and Eaton Vance Distributors, Inc.
In addition, our Privacy Policy only applies to those Eaton Vance customers who are individuals and who have a direct relationship with us. If a customer’s account (i.e. fund shares) is held in the name of a third-party financial adviser/broker-dealer, it is likely that only such adviser’s privacy policies apply to the customer. This notice supersedes all previously issued privacy disclosures.
For more information about Eaton Vance’s Privacy Policy, please call 1-800-262-1122.
Delivery of Shareholder Documents. The Securities and Exchange Commission permits funds to deliver only one copy of shareholder documents, including prospectuses, proxy statements and shareholder reports, to fund investors with multiple accounts at the same residential or post office box address. This practice is often called “householding” and it helps eliminate duplicate mailings to shareholders.
Eaton Vance, or your financial adviser, may household the mailing of your documents indefinitely unless you instruct Eaton Vance, or your financial adviser, otherwise.
If you would prefer that your Eaton Vance documents not be householded, please contact Eaton Vance at 1-800-262-1122, or contact your financial adviser.
Your instructions that householding not apply to delivery of your Eaton Vance documents will be effective within 30 days of receipt by Eaton Vance or your financial adviser.
Portfolio Holdings. Each Eaton Vance Fund and it’s underlying Portfolio will file a schedule of its portfolio holdings on Form N-Q with the SEC for the first and third quarters of each fiscal year. The Form N-Q will be available on the Eaton Vance website www.eatonvance.com, by calling Eaton Vance at 1-800-262-1122 or in the EDGAR database on the SEC’s website at www.sec.gov. Form N-Q may also be reviewed and copied at the SEC’s public reference room in Washington, D.C. (call 1-800-732-0330 for information on the operation of the public reference room).
Proxy Voting. From time to time, funds are required to vote proxies related to the securities held by the funds. The Eaton Vance Funds or their underlying Portfolios (if applicable) vote proxies according to a set of policies and procedures approved by the Funds’ and Portfolios’ Boards. You may obtain a description of these policies and procedures and information on how the Funds or Portfolios voted proxies relating to Portfolio securities during the 12 month period ended June 30, without charge, upon request, by calling
1-800-262-1122. This description is also available on the SEC’s website at www.sec.gov.
Eaton Vance Limited Maturity Municipals Funds as of March 31, 2005
T A B L E O F C O N T E N T S
President’s Letter to Shareholders | 2 |
| |
Market Recap | 3 |
| |
Fund Investment Updates | |
California | 4 |
Florida | 6 |
Massachusetts | 8 |
New Jersey | 10 |
New York | 12 |
Ohio | 14 |
Pennsylvania | 16 |
| |
Disclosure of Fund Expenses | 18 |
| |
Financial Statements | 42 |
| |
Management and Organization | 84 |
1
Eaton Vance Limited Maturity Municipals Funds as of March 31, 2005
L E T T E R T O S H A R E H O L D E R S

Thomas J. Fetter
President
The municipal bond market is a center of capital formation for states, municipalities and, in some cases, private economic initiatives. In this edition of our continuing educational series, we will discuss industrial development revenue (IDR) bonds. IDR bonds have long been used as a financing mechanism by local governments to provide assistance to local employers and encourage job retention and creation within their communities.
IDR bonds finance private activities that benefit the public...
IDR bonds are issued by municipal authorities to finance projects and facilities used by private corporations. Historically, IDR bonds have represented a partnership between the private and public sectors – a source of dedicated funding for companies and a source of job creation in projects beneficial to local communities. The “Private-Activities” provision of the Tax Reform Act of 1986 permits issuance of tax-exempt bonds for specific activities, including pollution control; gas and electric service; water distribution; wastewater systems; solid waste disposal; airports and selected transportation projects; and other industrial projects.
The Act also placed a cap on the dollar amount that may be raised for IDR bonds in each state, limiting the amount to $50 per person/per state/per year, with a $150 million maximum. These limitations provide protection against potential abuse and ensure that tax-exempt IDR bonds will indeed be issued for projects that will benefit the public.
IDR bonds finance utility-related projects and other key industrial initiatives...
Typically, IDR bonds provide financing for manufacturing, processing or utility facilities. Historically, about one-half of these bonds have been issued to finance pollution control facilities for manufacturers and electric utilities. As many utilities and manufacturers have been ordered to comply with stricter environmental and fuel standards, pollution control bonds have helped finance the retrofits of existing plants. Other IDR bonds have served as inducements from state and local issuers to locate plants or build new facilities, in the hope that such construction might generate further economic growth for a community.
IDR bonds are secured by corporate revenues – not those of state or local governments...
IDR bond issues are secured by the credit of the underlying corporation. The municipal issuing authority acts solely as a conduit to permit tax-exempt financing. The corporation pledges to makepayments sufficient to meet all debt service obligations. Unlike some revenue issues, IDR bonds are backed by revenues of the entire corporation, not solely by those of the project being financed.
Because IDR bonds are backed by corporate revenues and not by the taxing authority of a state or local jurisdiction, they have historically provided coupon premiums above those of general obligations and other more traditional revenue bonds. Bonds may be either collateralized or unsecured. Collateralized bonds have a lien against the company’s assets, which may provide bond holders enhanced bargaining power in the event of a bankruptcy. Unsecured bonds have no such lien.
While providing new opportunities, IDR bonds require rigorous analysis...
While IDR bonds may provide unusual investment opportunities, they also may entail increased risk and, therefore, demand especially intensive analysis. At Eaton Vance, we have credit analysts and resources dedicated to IDR bond research.
We feel that IDR bonds represent a key segment of the municipal bond market and should remain an important source of capital formation. In our view, the experience and resources needed to evaluate these issues further demonstrates the value of professional management. We will continue to look for opportunities in this sector of the municipal market.
| Sincerely, |
| |
| /s/ Thomas J. Fetter | |
| Thomas J. Fetter |
| President |
| May 11, 2005 |
Fund shares are not insured by the FDIC and are not deposits or other obligations of, or guaranteed by, any depository institution. Shares are subject to investment risks, including possible loss of
2
Eaton Vance Limited Maturity Municipals Funds as of March 31, 2005
M A R K E T R E C A P
The U.S. economy continued to generate moderate growth during the year ended March 31, 2005. While higher gasoline and energy prices pinched consumers, the weak U.S. dollar raised inflationary concerns and helped push interest rates higher.
After a promising recovery in 2004, slower growth in early 2005...
The nation’s Gross Domestic Product grew by 3.1% in the first quarter of 2005, according to preliminary Commerce Department figures, following a 3.8% rise in the fourth quarter of 2004. Manufacturing activity, which had expanded strongly in the second half of 2004, slackened somewhat in the first quarter of 2005, amid slower industrial production and weakening demand for durable goods.
Consumer spending, which helped fuel the economic recovery over the past year, weakened considerably, as higher fuel costs and rising interest rates on loans and mortgages prompted consumers to tighten their belts. Capital spending also slowed, as businesses curtailed new investments in plants and factories, while reducing the pace of investment in productivity-enhancing equipment and software. Residential construction remained relatively strong, although slightly off the torrid pace set in 2004.
After recovering dramatically in 2004, job creation weakened somewhat in early 2005...
The nation’s labor markets strengthened during the year, although the pace of job creation weakened at the close of the period. Hiring picked up during the year in areas that had suffered large technology sector layoffs. Also, manufacturing, financial services, business services, trucking, shipping, construction, energy, health care, and media also generated new jobs. In the first quarter of 2005, however, employers showed some reticence in hiring practices, as they were forced to cope with unpredictable fuel cost hikes.
Intermediate-term municipal bonds yield 80% of Treasury yields
5-Year AAA-rated | Taxable equivalent yield |
General Obligation (GO) Bonds* | in 35.0% tax bracket |
5-Year Treasury Bond
Principal and interest payments of Treasury securities are guaranteed by the U.S. government.
*GO yields are a compilation of a representative variety of general obligations and are not necessarily representative of a Fund’s yield. Statistics are as of March 31, 2005.
Past performance is no guarantee of future results.
Source: Bloomberg, L.P.
The Federal Reserve continued to raise short-term interest rates in 2005...
The Federal Reserve pushed short-term rates higher, suggesting it will continue to raise rates to keep the economy from growing too quickly and, thereby, reviving inflation. Beginning in June 2004, the Fed increased its Federal Funds rate – a key short-term interest rate barometer – on eight occasions, raising that benchmark from 1.00% to 3.00%, including its most recent rate hike in May 2005.
The municipal bond market posted a modest gain for the year, slightly outperforming the Treasury market. For the year ended March 31, 2005, the Lehman Brothers Municipal Bond Index – an unmanaged index of longer-term, investment-grade, municipal debt securities made up of issues larger than $50 million –had a total return of 2.67.%.*
*It is not possible to invest directly in an Index. The Index’s total return does not reflect commissions or expenses that would have been incurred if an investor individually purchased or sold the securities represented in the Index.
The views expressed throughout this report are those of the portfolio managers and are current only through the end of the period of the report as stated on the cover. These views are subject to change at any time based upon market or other conditions, and the investment adviser disclaims any responsibility to update such views. These views may not be relied on as investment advice and, because investment decisions for a fund are based on many factors, may not be relied on as an indication of trading intent on behalf of any Eaton Vance fund.
3
Eaton Vance California Limited Maturity Municipals Fund as of March 31, 2005
I N V E S T M E N T U P D A T E
The Fund
Performance for the Past Year*
• The Fund’s Class A shares had a total return of 0.99% for the year ended March 31, 2005.(1) This return was the result of a decrease in net asset value (NAV) to $10.29 per share on March 31, 2005 from $10.56 on March 31, 2004, and the reinvestment of $0.372 in dividends.(2)
• The Fund’s Class B shares had a total return of 0.31% for the year ended March 31, 2005.(1) This return was the result of a decrease in NAV to $10.26 per share on March 31, 2005 from $10.52 on March 31, 2004, and the reinvestment of $0.293 in dividends.(2)
• The Fund’s Class C shares had a total return of -0.01% for the period from inception on March 23, 2005 through March 31, 2005.(1) This return was the result of a decrease in NAV to $9.95 per share on March 31, 2005 from $10.00 on March 23, 2005.(2)
• For comparison, the Lehman Brothers 7-Year Municipal Bond Index – an unmanaged index of investment-grade, municipal debt securities with an average maturity of 7 years – had a total return of 0.80% for the year ended March 31, 2005.(3)
• Based on the Fund’s most recent dividends annualized and NAVs on March 31, 2005 of $10.29 per share for Class A and $10.26 for Class B, the Fund’s distribution rates were 3.62% and 2.85%, respectively.(4) The distribution rates are equivalent to taxable rates of 6.14% and 4.83%, respectively.(5)
• The SEC 30-day yields for Class A and Class B shares at March 31, 2005 were 3.24% and 2.57%, respectively.(6) The SEC 30-day yields are equivalent to taxable yields of 5.50% and 4.36%, respectively.(5)

Cynthia J. Clemson
Portfolio Manager
Management Discussion
• California’s economy generated good job growth in late 2004 and early 2005. The business services sector added the largest number of jobs, with construction and financial services also making significant contributions. The government sector, subject to budgetary restraints, remained a sore spot in the state economy. The state’s March 2005 jobless rate was 5.8%, down from 6.4% a year ago.
• Insured** general obligations (GOs) constituted the Fund’s largest sector weighting at March 31, 2005. These bonds have continued to perform well as the California economy continued its economic recovery.
• Insured** and uninsured special tax revenue bonds were among the Fund’s prominent holdings. The Fund’s investments included issues that financed transportation projects, watershed improvements and local community development programs.
• Insured** water and sewer bonds are frequent issuers in the California municipal market, as stricter environmental rules have forced communities to upgrade their water and wastewater systems. Management focused on issuers with healthy finances, sound long-term planning and a growing service area.
• Insured** lease revenue/certificates of participation remained large investments for the Fund. These issues provided combined financing for a variety of California jurisdictions, representing a flexible and cost-effective funding source for borrowers at the state and local level.
* Reinvestment amounts per share are based on 366 days from 4/1/04-12/31/04 and 365 days from 1/1/05-3/31/05.
** Private insurance does not decrease the risk of loss of principal associated with this investment.
Formerly, the Fund invested its assets in a corresponding investment company (referred to as the Portfolio) that had the same investment objective and policies as the Fund. Effective October 8, 2004, the Fund began to invest its assets directly in securities. The Fund’s investment objective and other investment policies remain unchanged. In addition, Boston Management and Research, the investment adviser to the Portfolio, acts as investment adviser to the Fund. The investment advisery fee paid remains unchanged.
(1) These returns do not include the 4.75% maximum sales charge for the Fund’s Class A shares or the applicable contingent deferred sales charges (CDSC) for Class B and Class C shares. If the sales charge were deducted, returns would be lower. (2) A portion of the Fund’s income may be subject to federal and state income taxes and/or alternative minimum tax. (3) It is not possible to invest directly in an Index. The Index’s total return does not reflect the commissions or expenses that would have been incurred if an investor individually purchased or sold the securities represented in the Index. (4) The Fund’s distribution rate represents actual distributions paid to shareholders and is calculated by dividing the last distribution per share (annualized) by the net asset value. (5) Taxable-equivalent figures assume a maximum 41.05% federal and state income tax rate. A lower rate would result in lower tax-equivalent figures. (6) The Fund’s SEC yield is calculated by dividing the net investment income per share for the 30-day period by the offering price at the end of the period and annualizing the result.
4
Eaton Vance California Limited Maturity Municipals Fund as of March 31, 2005
F U N D P E R F O R M A N C E
The line graph and table set forth below provide information about the Fund’s performance. The line graph compares the performance of Class B of the Fund with that of the Lehman Brothers 7-Year Municipal Bond Index, a broad-based, unmanaged market index. The lines on the graph represent the total returns of a hypothetical investment of $10,000 in each of Class B and in the Lehman Brothers 7-Year Municipal Bond Index. The table includes the total returns of each Class of the Fund at net asset value and maximum public offering price. The performance presented below does not reflect the deduction of taxes, if any, that a shareholder would pay on Fund distributions or redemptions of Fund shares.
Performance(1) | | Class A | | Class B | | Class C | |
| | | | | | | |
Average Annual Total Returns (at net asset value) | | | | | | | |
One Year | | 0.99 | % | 0.31 | % | N.A. | |
Five Years | | 5.27 | | 4.46 | | N.A. | |
Ten Years | | N.A. | | 3.93 | | N.A. | |
Life of Fund† | | 4.68 | | 4.07 | | -0.50 | |
| | | | | | | |
SEC Average Annual Total Returns (including sales charge or applicable CDSC) | | | | | | | |
One Year | | -1.26 | % | -2.61 | % | N.A. | |
Five Years | | 4.80 | | 4.46 | | N.A. | |
Ten Years | | N.A. | | 3.93 | | N.A. | |
Life of Fund† | | 4.40 | | 4.07 | | -1.49 | |
†Inception Dates – Class A: 6/27/96; Class B: 5/29/92; Class C: 3/23/05
(1) Average annual total returns do not include the 4.75% maximum sales charge for Class A shares or the applicable contingent deferred sales charges (CDSC) for Class B and Class C shares. If sales charges were deducted, returns would be lower. SEC average annual total returns for Class A reflect the maximum 4.75% sales charge. SEC returns for Class B reflect applicable CDSC based on the following schedule: 5% - 1st and 2nd years; 4% - 3rd year; 3% - 4th year; 2% - 5th year; 1% - 6th year. SEC 1-year return for Class C reflects a 1% CDSC.
Past performance is no guarantee of future results. Returns are historical and are calculated by determining the percentage change in net asset value or offering price (as applicable) with all distributions reinvested. Investment return and principal value will fluctuate so that shares, when redeemed, may be worth more or less than their original cost. Performance is for the stated time period only; due to market volatility, the Fund’s current performance may be lower or higher than the quoted return. For performance as of the most recent month end, please refer to www.eatonvance.com.
Comparison of Change in Value of a $10,000 Investment in Eaton Vance
California Limited Maturity Municipals Fund Class B vs. the Lehman
Brothers 7-Year Municipal Bond Index* March 31, 1995 – March 31, 2005
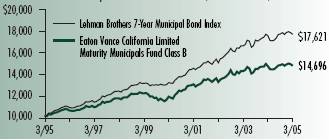
*Sources: Thomson Financial; Lipper, Inc.
Class B of the Fund commenced operations on 5/29/92.
A $10,000 hypothetical investment at net asset value in Class A and Class C on 6/27/96 and 3/23/05, respectively, would have been valued at $14,923 and $9,950, respectively, on March 31, 2005. A $10,000 hypothetical investment in Class A at maximum offering price would have been valued at $14,586. The investment in Class C shares would have been valued at $9,851 after deduction of the applicable CDSC. It is not possible to invest directly in an Index. The Index’s total return does not reflect the commissions or expenses that would have been incurred if an investor individually purchased or sold the securities represented in the Index.
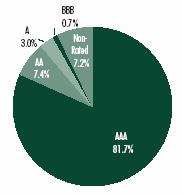
Diversification by Credit Quality(2)
(2)As a percentage of total investments, as of March 31, 2005. Holdings subject to change due to active management.
5
Eaton Vance Florida Limited Maturity Municipals Fund as of March 31, 2005
I N V E S T M E N T U P D A T E
The Fund
Performance for the Past Year*
• The Fund’s Class A shares had a total return of 1.06% for the year ended March 31, 2005.(1) This return was the result of a decrease in net asset value (NAV) to $10.23 per share on March 31, 2005 from $10.50 on March 31, 2004, and the reinvestment of $0.379 in dividends.(2)
• The Fund’s Class B shares had a total return of 0.28% for the year ended March 31, 2005.(1) This return was the result of a decrease in NAV to $10.23 per share on March 31, 2005 from $10.50 on March 31, 2004, and the reinvestment of $0.299 in dividends.(2)
• The Fund’s Class C shares had a total return of 0.19% for the year ended March 31, 2005.(1) This return was the result of a decrease in NAV to $9.65 per share on March 31, 2005 from $9.91 on March 31, 2004, and the reinvestment of $0.279 in dividends.(2)
• For comparison, the Lehman Brothers 7-Year Municipal Bond Index – an unmanaged index of investment-grade, municipal debt securities with an average maturity of 7 years – had a total return of 0.80% for the year ended March 31, 2005.(3)
• Based on the Fund’s most recent dividends annualized and NAVs on March 31, 2005 of $10.23 per share for Class A and Class B and $9.65 for Class C, the Fund’s distribution rates were 3.71%, 2.93% and 2.95%, respectively.(4) The distribution rates are equivalent to taxable rates of 5.71%, 4.51% and 4.54%, respectively.(5)
• The SEC 30-day yields for Class A, Class B and Class C shares at March 31, 2005 were 2.93%, 2.25% and 2.25%, respectively.(6) The SEC 30-day yields are equivalent to taxable yields of 4.51%, 3.46% and 3.46%, respectively.(5)

Craig Brandon
Portfolio Manager
Management Discussion
• Florida’s economy continued to expand during the period. Residential construction and service sectors remained very strong, a result of a population growth rate twice that of the U.S. rate. Boosted by the weak U.S. dollar, even tourism grew in 2004, despite a severe hurricane season. The state’s jobless rate was 4.5% in March 2005, down from 4.8% a year ago.
• Insured** water and sewer bonds were the Fund’s largest sector weighting at March 31, 2005. Population growth, aging infrastructure and new environmental rules have prompted many communities to initiate upgrades to their water systems. Backed by water and sewer bill payments, water and sewer utilities have historically represented a relatively stable revenue source.
• Insured** transportation bonds were significant investments for the Fund. As the demands on Florida’s transportation infrastructure have surged in recent years, these bonds have helped finance improvements and upgrades for local seaports, airport authorities and expressways.
• Insured** general obligations were a significant commitment for the Fund. While some states struggled with a slow recovery and weak revenues, a strong economic rebound bolstered tax receipts for Florida state, county and local issuers.
• Management continued to adjust the Fund’s coupondistribution to reflect a changing interest rate outlook. In addition, management continued to upgrade call structure to protect the Fund against untimely calls.
* Reinvestment amounts per share are based on 366 days from 4/1/04-12/31/04 and 365 days from 1/1/05-3/31/05.
** Private insurance does not decrease the risk of loss of principal associated with this investment.
Formerly, the Fund invested its assets in a corresponding investment company (referred to as the Portfolio) that had the same investment objective and policies as the Fund. Effective October 8, 2004, the Fund began to invest its assets directly in securities. The Fund’s investment objective and other investment policies remain unchanged. In addition, Boston Management and Research, the investment adviser to the Portfolio, acts as investment adviser to the Fund. The investment advisery fee paid remains unchanged.
(1) These returns do not include the 4.75% maximum sales charge for the Fund’s Class A shares or the applicable contingent deferred sales charges (CDSC) for Class B and Class C shares. If the sales charge were deducted, returns would be lower. (2) A portion of the Fund’s income may be subject to federal income and/or alternative minimum tax and state intangibles taxes. (3) It is not possible to invest directly in an Index. The Index’s total return does not reflect the commissions or expenses that would have been incurred if an investor individually purchased or sold the securities represented in the Index. (4) The Fund’s distribution rate represents actual distributions paid to shareholders and is calculated by dividing the last distribution per share (annualized) by the net asset value. (5) Taxable-equivalent figures assume a maximum 35.00% combined federal and state intangibles tax rate. A lower rate would result in lower tax-equivalent figures. (6) The Fund’s SEC yield is calculated by dividing the net investment income per share for the 30-day period by the offering price at the end of the period and annualizing the result.
6
Eaton Vance Florida Limited Maturity Municipals Fund as of March 31, 2005
F U N D P E R F O R M A N C E
The line graph and table set forth below provide information about the Fund’s performance. The line graph compares the performance of Class B of the Fund with that of the Lehman Brothers 7-Year Municipal Bond Index, a broad-based, unmanaged market index. The lines on the graph represent the total returns of a hypothetical investment of $10,000 in each of Class B and in the Lehman Brothers
7-Year Municipal Bond Index. The table includes the total returns of each Class of the Fund at net asset value and maximum public offering price. The performance presented below does not reflect the deduction of taxes, if any, that a shareholder would pay on Fund distributions or redemptions of Fund shares.
Performance(1) | | Class A | | Class B | | Class C | |
| | | | | | | |
Average Annual Total Returns (at net asset value) | | | | | | | |
One Year | | 1.06 | % | 0.28 | % | 0.19 | % |
Five Years | | 5.34 | | 4.57 | | 4.52 | |
Ten Years | | N.A. | | 3.78 | | 3.74 | |
Life of Fund† | | 4.55 | | 4.06 | | 3.35 | |
| | | | | | | |
SEC Average Annual Total Returns (including sales charge or applicable CDSC) | | | | | | | |
One Year | | -1.20 | % | -2.64 | % | -0.78 | % |
Five Years | | 4.86 | | 4.57 | | 4.52 | |
Ten Years | | N.A. | | 3.78 | | 3.74 | |
Life of Fund† | | 4.28 | | 4.06 | | 3.35 | |
†Inception Dates – Class A: 6/27/96; Class B: 5/29/92; Class C: 12/8/93
(1) Average annual total returns do not include the 4.75% maximum sales charge for Class A shares or the applicable contingent deferred sales charges (CDSC) for Class B and Class C shares. If sales charges were deducted, returns would be lower. SEC average annual total returns for Class A reflect the maximum 4.75% sales charge. SEC returns for Class B reflect applicable CDSC based on the following schedule: 5% - 1st and 2nd years; 4% - 3rd year; 3% - 4th year; 2% - 5th year; 1% - 6th year. SEC 1-year return for Class C reflects a 1% CDSC.
Past performance is no guarantee of future results. Returns are historical and are calculated by determining the percentage change in net asset value or offering price (as applicable) with all distributions reinvested. Investment return and principal value will fluctuate so that shares, when redeemed, may be worth more or less than their original cost. Performance is for the stated time period only; due to market volatility, the Fund’s current performance may be lower or higher than the quoted return. For performance as of the most recent month end, please refer to www.eatonvance.com.
Comparison of Change in Value of a $10,000 Investment in Eaton Vance
Florida Limited Maturity Municipals Fund Class B vs. the Lehman
Brothers 7-Year Municipal Bond Index* March 31, 1995 – March 31, 2005
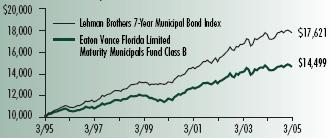
* Sources: Thomson Financial; Lipper, Inc.
Class B of the Fund commenced operations on 5/29/92.
A $10,000 hypothetical investment at net asset value in Class A and Class C on 6/27/96 and 3/31/95, respectively, would have been valued at $14,766 and $14,434, respectively, on March 31, 2005. A $10,000 hypothetical investment in Class A at maximum offering price would have been valued at $14,436. It is not possible to invest directly in an Index. The Index’s total return does not reflect the commissions or expenses that would have been incurred if an investor individually purchased or sold the securities represented in the Index.
Diversification by Credit Quality(2)
(2)As a percentage of total investments, as of March 31, 2005. Holdings subject to change due to active management.
7
Eaton Vance Massachusetts Limited Maturity Municipals Fund as of March 31, 2005
I N V E S T M E N T U P D A T E
The Fund
Performance for the Past Year*
• The Fund’s Class A shares had a total return of 0.79% for the year ended March 31, 2005.(1) This return was the result of a decrease in net asset value (NAV) to $10.18 per share on March 31, 2005 from $10.46 on March 31, 2004, and the reinvestment of $0.362 in dividends.(2)
• The Fund’s Class B shares had a total return of 0.02% for the year ended March 31, 2005.(1) This return was the result of a decrease in NAV to $10.17 per share on March 31, 2005 from $10.45 on March 31, 2004, and the reinvestment of $0.282 in dividends.(2)
• The Fund’s Class C shares had a total return of -0.14% for the year ended March 31, 2005.(1) This return was the result of a decrease in NAV to $9.74 per share on March 31, 2005 from $10.02 on March 31, 2004, and the reinvestment of $0.267 in dividends.(2)
• For comparison, the Lehman Brothers 7-Year Municipal Bond Index – an unmanaged index of investment-grade, municipal debt securities with an average maturity of 7 years – had a total return of 0.80% for the year ended March 31, 2005.(3)
• Based on the Fund’s most recent dividends annualizedand NAVs on March 31, 2005 of $10.18 per share for Class A, $10.17 for Class B and $9.74 for Class C, the Fund’s distribution rates were 3.56%, 2.78% and 2.80%, respectively.(4) The distributionrates are equivalent to taxable rates of 5.78%, 4.52% and 4.55%, respectively.(5)
• The SEC 30-day yields for Class A, Class B and Class C shares at March 31, 2005 were 3.17%, 2.49% and 2.49%, respectively.(6) The SEC 30-day yields are equivalent to taxable yields of 5.15%, 4.05% and 4.05%, respectively.(5)

William H. Ahern
Co-Portfolio Manager
Management Discussion
• The Massachusetts economy made progress in 2004 and 2005, although not yet achieving pre-recession employment levels. Business services, health care, education and residential building remained areas of strong job creation. The manufacturing sector continued to struggle. The state’s March 2005 jobless rate was 4.9%, down from 5.4% a year ago and below the national rate.
• Insured** general obligations (GOs) were the Fund’s largest sector weighting at March 31, 2005. Insured* school district, public improvement and local GOs have been valued by investors in a relatively slow recovery that has continued to pressure some industrial and economically sensitive issuers.
• Education bonds constituted significant holdings for the Fund. Investments included some of the Commonwealth’s leading universities and secondary schools. Historically, these institutions have enjoyed strong applicant demand and the ability to generate annual hikes in tuition and fee income.
• The Fund maintained a significant investment in insured** transportation bonds. The Fund’s investments included issues for mass transit, highways and port authority bonds. Many of these issues are backed, in part, by toll revenues and are considered less vulnerable to economic fluctuations than cyclical issues.
• Selected Puerto Rico bonds have provided the Fund opportunities for additional diversification. The Fund’s Puerto Rico investments included insured** electric utilities, general obligations, transportation and lease revenue bonds.
* Reinvestment amounts per share are based on 366 days from 4/1/04-12/31/04 and 365 days from 1/1/05-3/31/05.
** Private insurance does not decrease the risk of loss of principal associated with this investment.
Formerly, the Fund invested its assets in a corresponding investment company (referred to as the Portfolio) that had the same investment objective and policies as the Fund. Effective October 8, 2004, the Fund began to invest its assets directly in securities. The Fund’s investment objective and other investment policies remain unchanged. In addition, Boston Management and Research, the investment adviser to the Portfolio, acts as investment adviser to the Fund. The investment advisery fee paid remains unchanged.
(1) These returns do not include the 4.75% maximum sales charge for the Fund’s Class A shares or the applicable contingent deferred sales charges (CDSC) for Class B and Class C shares. If the sales charge were deducted, returns would be lower. (2) A portion of the Fund’s income may be subject to federal income and/or alternative minimum tax and state and local income taxes (3) It is not possible to invest directly in an Index. The Index’s total return does not reflect the commissions or expenses that would have been incurred if an investor individually purchased or sold the securities represented in the Index. (4) The Fund’s distribution rate represents actual distributions paid to shareholders and is calculated by dividing the last distribution per share (annualized) by the net asset value. (5) Taxable-equivalent figures assume a maximum 38.45% combined federal and state income tax rate. A lower rate would result in lower tax-equivalent figures. (6) The Fund’s SEC yield is calculated by dividing the net investment income per share for the 30-day period by the offering price at the end of the period and annualizing the result.
8
Eaton Vance Massachusetts Limited Maturity Municipals Fund as of March 31, 2005
F U N D P E R F O R M A N C E
The line graph and table set forth below provide information about the Fund’s performance. The line graph compares the performance of Class B of the Fund with that of the Lehman Brothers 7-year Municipal Bond Index, a broad-based, unmanaged market index. The lines on the graph represent the total returns of a hypothetical investment of $10,000 in each of Class B and in the Lehman Brothers
7-Year Municipal Bond Index. The table includes the total returns of each Class of the Fund at net asset value and maximum public offering price. The performance presented below does not reflect the deduction of taxes, if any, that a shareholder would pay on Fund distributions or redemptions of Fund shares.
Performance(1) | | Class A | | Class B | | Class C | |
| | | | | | | |
Average Annual Total Returns (at net asset value) | | | | | | | |
One Year | | 0.79 | % | 0.02 | % | -0.14 | % |
Five Years | | 5.19 | | 4.36 | | 4.38 | |
Ten Years | | N.A. | | 3.77 | | 3.77 | |
Life of Fund† | | 4.56 | | 3.98 | | 3.42 | |
| | | | | | | |
SEC Average Annual Total Returns (including sales charge or applicable CDSC) | | | | | | | |
One Year | | -1.47 | % | -2.90 | % | -1.11 | % |
Five Years | | 4.72 | | 4.36 | | 4.38 | |
Ten Years | | N.A. | | 3.77 | | 3.77 | |
Life of Fund† | | 4.29 | | 3.98 | | 3.42 | |
†Inception Dates – Class A: 6/27/96; Class B: 6/1/92; Class C: 12/8/93
(1) Average annual total returns do not include the 4.75% maximum sales charge for Class A shares or the applicable contingent deferred sales charges (CDSC) for Class B and Class C shares. If sales charges were deducted, returns would be lower. SEC average annual total returns for Class A reflect the maximum 4.75% sales charge. SEC returns for Class B reflect applicable CDSC based on the following schedule: 5% - 1st and 2nd years; 4% - 3rd year; 3% - 4th year; 2% - 5th year; 1% - 6th year. SEC 1-year return for Class C reflects a 1% CDSC.
Past performance is no guarantee of future results. Returns are historical and are calculated by determining the percentage change in net asset value or offering price (as applicable) with all distributions reinvested. Investment return and principal value will fluctuate so that shares, when redeemed, may be worth more or less than their original cost. Performance is for the stated time period only; due to market volatility, the Fund’s current performance may be lower or higher than the quoted return. For performance as of the most recent month end, please refer to www.eatonvance.com.
Comparison of Change in Value of a $10,000 Investment in Eaton Vance
Massachusetts Limited Maturity Municipals Fund Class B vs. the Lehman
Brothers 7-Year Municipal Bond Index* March 31, 1995 – March 31, 2005
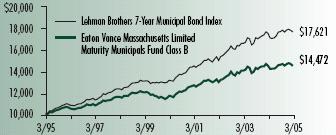
* Sources: Thomson Financial; Lipper, Inc.
Class B of the Fund commenced operations on 6/1/92.
A $10,000 hypothetical investment at net asset value in Class A and Class C on 6/27/96 and 3/31/95, respectively, would have been valued at $14,780 and $14,475, respectively, on March 31, 2005. A $10,000 hypothetical investment in Class A at maximum offering price would have been valued at $14,447. It is not possible to invest directly in an Index. The Index’s total return does not reflect the commissions or expenses that would have been incurred if an investor individually purchased or sold the securities represented in the Index.
Diversification by Credit Quality(2)
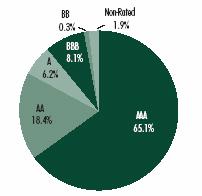
(2)As a percentage of total investments, as of March 31, 2005. Holdings subject to change due to active management.
9
Eaton Vance New Jersey Limited Maturity Municipals Fund as of March 31, 2005
I N V E S T M E N T U P D A T E
The Fund
Performance for the Past Year*
• The Fund’s Class A shares had a total return of 0.98% for the year ended March 31, 2005.(1) This return was the result of a decrease in net asset value (NAV) to $10.10 per share on March 31, 2005 from $10.36 on March 31, 2004, and the reinvestment of $0.360 in dividends.(2)
• The Fund’s Class B shares had a total return of 0.30% for the year ended March 31, 2005.(1) This return was the result of a decrease in NAV to $10.10 per share on March 31, 2005 from $10.35 on March 31, 2004, and the reinvestment of $0.280 in dividends.(2)
• For comparison, the Lehman Brothers 7-Year Municipal Bond Index – an unmanaged index of investment-grade, municipal debt securities with an average maturity of 7 years – had a total return of 0.80% for the year ended March 31, 2005.(3)
• Based on the most recent dividends annualized and NAVs on March 31, 2005 of $10.10 per share for Class A and Class B, the Fund’s distribution rates were 3.56% and 2.77%, respectively.(4) The distribution rates of Class A and Class B are equivalent to taxable rates of 6.02% and 4.68%, respectively.(5)
• The SEC 30-day yields for Class A and B shares at March 31, 2005 were 3.08% and 2.39%, respectively.(6) The SEC 30-day yields of Class A and Class B are equivalent to taxable yields of 5.21% and 4.04%, respectively.(5)

Craig Brandon
Portfolio Manager
Management Discussion
• In late 2004 and early 2005, New Jersey enjoyed good job growth, the state’s strongest since 2000. Leisure, business services, trade, transportation, and utilities generated the fastest job growth. Not surprisingly, manufacturing remained among the state’s weakest sectors. The state’s March 2005 jobless rate was 4.4%, down from 5.2% a year ago.
• Insured** general obligations were the Fund’s largest sector weighting at March 31, 2005, representing a high-quality investment in a rebounding economy. The Fund’s investments were focused on regional and township school district bonds and local board of education issues.
• In the insured** transportation sector, the Fund’s investments constituted primarily a mix of regional transportation authorities and port authorities. The Fund also had investments in the state’s transportation trust fund authority, which – backed by motor fuel tax receipts – finances repairs to bridges, highways and park-ride facilities.
• Insured** water and sewer bonds represented a major investment. Many New Jersey cities and towns needed to upgrade their water infrastructure. Increased issuance of bonds to finance watershed and wastewater projects has provided the Fund with high quality income opportunities.
• Management continues to adjust coupon structure in response to changing market conditions. The Fund maintained a broad diversification according to issuer, sector, coupon and insurer. Retaining good call protection remained another key strategic consideration.
* Reinvestment amounts per share are based on 366 days from 4/1/04-12/31/04 and 365 days from 1/1/05-3/31/05.
** Private insurance does not decrease the risk of loss of principal associated with this investment.
Formerly, the Fund invested its assets in a corresponding investment company (referred to as the Portfolio) that had the same investment objective and policies as the Fund. Effective October 8, 2004, the Fund began to invest its assets directly in securities. The Fund’s investment objective and other investment policies remain unchanged. In addition, Boston Management and Research, the investment adviser to the Portfolio, acts as investment adviser to the Fund. The investment advisery fee paid remains unchanged.
(1) These returns do not include the 4.75% maximum sales charge for the Fund’s Class A shares or the applicable contingent deferred sales charges (CDSC) for Class B shares. If the sales charge were deducted, returns would be lower. (2) A portion of the Fund’s income may be subject to federal and state income taxes and/or alternative minimum tax. (3) It is not possible to invest directly in an Index. The Index’s total return does not reflect the commissions or expenses that would have been incurred if an investor individually purchased or sold the securities represented in the Index. (4) The Fund’s distribution rate represents actual distributions paid to shareholders and is calculated by dividing the last distribution per share (annualized) by the net asset value. (5) Taxable-equivalent figures assume a maximum 40.83% combined federal income and state income tax rate. A lower rate would result in lower tax-equivalent figures. (6) The Fund’s SEC yield is calculated by dividing the net investment income per share for the 30-day period by the offering price at the end of the period and annualizing the result.
10
Eaton Vance New Jersey Limited Maturity Municipals Fund as of March 31, 2005
F U N D P E R F O R M A N C E
The line graph and table set forth below provide information about the Fund’s performance. The line graph compares the performance of Class B of the Fund with that of the Lehman Brothers 7-Year Municipal Bond Index, a broad-based, unmanaged market index. The lines on the graph represent the total returns of a hypothetical investment of $10,000 in each of Class B and in the Lehman Brothers 7-Year Municipal Bond Index. The table includes the total returns of each Class of the Fund at net asset value and maximum public offering price. The performance presented below does not reflect the deduction of taxes, if any, that a shareholder would pay on Fund distributions or redemptions of Fund shares.
Performance(1) | | Class A | | Class B | |
| | | | | |
Average Annual Total Returns (at net asset value) | | | | | |
One Year | | 0.98 | % | 0.30 | % |
Five Years | | 4.86 | | 4.06 | |
Ten Years | | N.A. | | 3.71 | |
Life of Fund† | | 4.50 | | 3.95 | |
| | | | | |
SEC Average Annual Total Returns (including sales charge or applicable CDSC) | | | | | |
One Year | | -1.30 | % | -2.63 | % |
Five Years | | 4.38 | | 4.06 | |
Ten Years | | N.A. | | 3.71 | |
Life of Fund† | | 4.23 | | 3.95 | |
†Inception date: Class A: 6/27/96; Class B: 6/1/92
(1) Average annual total returns do not include the 4.75% maximum sales charge for Class A shares or the applicable contingent deferred sales charges (CDSC) for Class B shares. If sales charges were deducted, returns would be lower. SEC average annual total returns for Class A reflect the maximum 4.75% sales charge. SEC returns for Class B reflect applicable CDSC based on the following schedule: 5% - 1st and 2nd years; 4% - 3rd year; 3% - 4th year; 2% - 5th year; 1% - 6th year.
Past performance is no guarantee of future results. Returns are historical and are calculated by determining the percentage change in net asset value or offering price (as applicable) with all distributions reinvested. Investment return and principal value will fluctuate so that shares, when redeemed, may be worth more or less than their original cost. Performance is for the stated time period only; due to market volatility, the Fund’s current performance may be lower or higher than the quoted return. For performance as of the most recent month end, please refer to www.eatonvance.com.
Comparison of Change in Value of a $10,000 Investment in Eaton Vance
New Jersey Limited Maturity Municipals Fund Class B vs. the Lehman
Brothers 7-Year Municipal Bond Index* March 31, 1995 – March 31, 2005
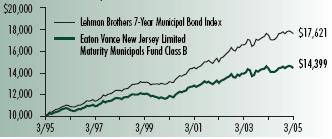
* Sources: Thomson Financial; Lipper, Inc.
Class B of the Fund commenced operations on 6/1/92.
A $10,000 hypothetical investment at net asset value in Class A on 6/27/96 would have been valued at $14,711 on March 31, 2005. A $10,000 hypothetical investment in Class A at maximum offering price would have been valued at $14,379. It is not possible to invest directly in an Index. The Index’s total return does not reflect the commissions or expenses that would have been incurred if an investor individually purchased or sold the securities represented in the Index.
Diversification by Credit Quality(2)
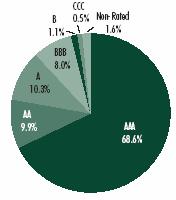
(2)As a percentage of total investments, as of March 31, 2005. Holdings subject to change due to active management.
11
Eaton Vance New York Limited Maturity Municipals Fund as of March 31, 2005
I N V E S T M E N T U P D A T E
The Fund
Performance for the Past Year*
• The Fund’s Class A shares had a total return of 0.73% for the year ended March 31, 2005.(1) This return was the result of a decrease in net asset value (NAV) to $10.54 per share on March 31, 2005 from $10.85 on March 31, 2004, and the reinvestment of $0.388 in dividends.(2)
• The Fund’s Class B shares had a total return of -0.03% for the year ended March 31, 2005.(1) This return was the result of a decrease in NAV to $10.53 per share on March 31, 2005 from $10.84 on March 31, 2004, and the reinvestment of $0.306 in dividends.(2)
• The Fund’s Class C shares had a total return of -0.07% for the year ended March 31, 2005.(1) This return was the result of a decrease in NAV to $10.02 per share on March 31, 2005 from $10.31 on March 31, 2004, and the reinvestment of $0.284 in dividends.(2)
• For comparison, the Lehman Brothers 7-Year Municipal Bond Index – an unmanaged index of investment-grade, municipal debt securities with an average maturity of 7 years – had a total return of 0.80% for the year ended March 31, 2005.(3)
• Based on the Fund’s most recent dividends annualized and NAVs on March 31, 2005 of $10.54 per share for Class A, $10.53 for Class B and $10.02 for Class C, the Fund’s distribution rates were 3.69%, 2.92% and 2.89%, respectively.(4) The distribution rates are equivalent to taxable rates of 6.15%, 4.87% and 4.82%, respectively.(5)
• The SEC 30-day yields for Class A, Class B and Class C shares at March 31, 2005 were 3.11%, 2.43% and 2.43%, respectively.(6) The SEC 30-day yields are equivalent to taxable yields of 5.18%, 4.05% and 4.05%, respectively.(5)

William H. Ahern
Portfolio Manager
Management Discussion
• During 2004 and into early 2005, New York State posted positive job growth for the first time since 2000. Job creation in business services, education, health care and tourism have been the main drivers of growth. Gains in finance have been modest, while the state continued to lose manufacturing jobs at a faster rate than the nation as a whole. The state’s March 2005 jobless rate was 5.1%, down from 6.1% a year ago.
• Escrowed and insured** escrowed bonds were the Fund’s largest sector weighting at March 31, 2005. Escrowed issues have been pre-refunded and backed by Treasury bonds, most often as the result of a refinancing of existing higher-coupon debt. They are valued by investors for their very high quality and relatively stable performance characteristics.
• Insured** general obligations constituted large commitments for the Fund. The Fund’s investments were focused on city and town school district bonds and county public improvement bonds. A stronger state and local economy would likely improve the revenue outlook for these local issuers.
• Insured** transportation bonds were prominent investments in the Fund. Transportation has historically been a key factor in the New York economy, and the demands have become even more acute in recent years. The Fund’s investments included issues for public transit, bridges and tunnels, airports, port authorities and highways.
• The Fund took advantage of its flexibility to own Puerto Rico bonds, adding further diversification. The Fund’s Puerto Rico bonds included transportation bonds, generation obligations and industrial development revenue bonds.
* Reinvestment amounts per share are based on 366 days from 4/1/04-12/31/04 and 365 days from 1/1/05-3/31/05.
** Private insurance does not decrease the risk of loss of principal associated with this investment.
Formerly, the Fund invested its assets in a corresponding investment company (referred to as the Portfolio) that had the same investment objective and policies as the Fund. Effective October 8, 2004, the Fund began to invest its assets directly in securities. The Fund’s investment objective and other investment policies remain unchanged. In addition, Boston Management and Research, the investment adviser to the Portfolio, acts as investment adviser to the Fund. The investment advisery fee paid remains unchanged.
(1) These returns do not include the 4.75% maximum sales charge for the Fund’s Class A shares or the applicable contingent deferred sales charges (CDSC) for Class B and Class C shares. If the sales charge were deducted, returns would be lower. (2) A portion of the Fund’s income may be subject to federal and state income taxes and/or alternative minimum tax. (3) It is not possible to invest directly in an Index. The Index’s total return does not reflect the commissions or expenses that would have been incurred if an investor individually purchased or sold the securities represented in the Index. (4) The Fund’s distribution rate represents actual distributions paid to shareholders and is calculated by dividing the last distribution per share (annualized) by the net asset value. (5) Taxable equivalent figures assume a maximum 40.01% combined federal income and state income tax rate. A lower rate would result in lower tax-equivalent figures. (6) The Fund’s SEC yield is calculated by dividing the net investment income per share for the 30-day period by the offering price at the end of the period and annualizing the result.
12
Eaton Vance New York Limited Maturity Municipals Fund as of March 31, 2005
F U N D P E R F O R M A N C E
The line graph and table set forth below provide information about the Fund’s performance. The line graph compares the performance of Class B of the Fund with that of the Lehman Brothers 7-year Municipal Bond Index, a broad-based, unmanaged market index. The lines on the graph represent the total returns of a hypothetical investment of $10,000 in each of Class B and in the Lehman Brothers 7-Year Municipal Bond Index. The table includes the total returns of each Class of the Fund at net asset value and maximum public offering price. The performance presented below does not reflect the deduction of taxes, if any, that a shareholder would pay on Fund distributions or redemptions of Fund shares.
Performance(1) | | Class A | | Class B | | Class C | |
| | | | | | | |
Average Annual Total Returns (at net asset value) | | | | | | | |
One Year | | 0.73 | % | -0.03 | % | -0.07 | % |
Five Years | | 5.21 | | 4.40 | | 4.42 | |
Ten Years | | N.A. | | 4.12 | | 4.12 | |
Life of Fund† | | 4.94 | | 4.28 | | 3.66 | |
| | | | | | | |
SEC Average Annual Total Returns (including sales charge or applicable CDSC) | | | | | | | |
One Year | | -1.54 | % | -2.95 | % | -1.04 | % |
Five Years | | 4.74 | | 4.40 | | 4.42 | |
Ten Years | | N.A. | | 4.12 | | 4.12 | |
Life of Fund† | | 4.67 | | 4.28 | | 3.66 | |
†Inception Dates – Class A: 6/27/96; Class B: 5/29/92; Class C: 12/8/93
(1) Average annual total returns do not include the 4.75% maximum sales charge for Class A shares or the applicable contingent deferred sales charges (CDSC) for Class B and Class C shares. If sales charges were deducted, returns would be lower. SEC average annual total returns for Class A reflect the maximum 4.75% sales charge. SEC returns for Class B reflect applicable CDSC based on the following schedule: 5% - 1st and 2nd years; 4% - 3rd year; 3% - 4th year; 2% - 5th year; 1% - 6th year. SEC 1-year return for Class C reflects a 1% CDSC.
Past performance is no guarantee of future results. Returns are historical and are calculated by determining the percentage change in net asset value or offering price (as applicable) with all distributions reinvested. Investment return and principal value will fluctuate so that shares, when redeemed, may be worth more or less than their original cost. Performance is for the stated time period only; due to market volatility, the Fund’s current performance may be lower or higher than the quoted return. For performance as of the most recent month end, please refer to www.eatonvance.com.
Comparison of Change in Value of a $10,000 Investment in Eaton Vance
New York Limited Maturity Municipals Fund Class B vs. the Lehman
Brothers 7-Year Municipal Bond Index* March 31, 1995– March 31, 2005
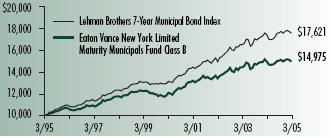
* Sources: Thomson Financial; Lipper, Inc.
Class B of the Fund commenced operations on 5/29/92.
A $10,000 hypothetical investment at net asset value in Class A and Class C on 6/27/96 and 3/31/95, respectively, would have been valued at $15,255 and $14,976, respectively, on March 31, 2005. A $10,000 hypothetical investment in Class A at maximum offering price would have been valued at $14,912. It is not possible to invest directly in an Index. The Index’s total return does not reflect the commissions or expenses that would have been incurred if an investor individually purchased or sold the securities represented in the Index.
Diversification by Credit Quality(2)
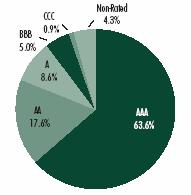
(2)As a percentage of total investments, as of March 31, 2005. Holdings subject to change due to active management.
13
Eaton Vance Ohio Limited Maturity Municipals Fund as of March 31, 2005
I N V E S T M E N T U P D A T E
The Fund
Performance for the Past Year*
• The Fund’s Class A shares had a total return of 0.70% for the year ended March 31, 2005.(1) This return was the result of a decrease in net asset value (NAV) to $9.74 per share on March 31, 2005 from $10.02 on March 31, 2004, and the reinvestment of $0.349 in dividends.(2)
• The Fund’s Class B shares had a total return of -0.05% for the year ended March 31, 2005.(1) This return was the result of a decrease in NAV to $9.73 per share on March 31, 2005 from $10.01 on March 31, 2004, and the reinvestment of $0.274 in dividends.(2)
• For comparison, the Lehman Brothers 7-Year Municipal Bond Index – an unmanaged index of investment-grade, municipal debt securities with an average maturity of 7 years – had a total return of 0.80% for the year ended March 31, 2005.(3)
• Based on the most recent dividends annualized and NAVs on March 31, 2005 of $9.74 per share for Class A and $9.73 per share for Class B, the Fund’s distribution rates were 3.59% and 2.83%, respectively.(4) The distribution rates of Class A and Class B are equivalent to taxable rates of 5.97% and 4.71%, respectively.(5)
• The SEC 30-day yields for Class A and B shares at March 31, 2005 were 2.65% and 1.99%, respectively.(6) The SEC 30-day yields of Class A and Class B are equivalent to taxable yields of 4.41% and 3.31%, respectively.(5)
William H. Ahern
Portfolio Manager
Management Discussion
• Ohio’s economy generated job growth in 2004 and early 2005, benefiting from the strength in the service sector. Business services, education and health care were areas of job growth. However, while losses in the key manufacturing sector slowed, a continuing focus on productivity and restructurings limited the extent of the recovery. The state’s March 2005 jobless rate was 6.4%, up slightly from 6.1% a year ago.
• Insured** and uninsured general obligations (GOs) were among the Fund’s largest sector weightings at March 31, 2005. The Fund’s investments focused on school district GOs of communities with a good local economy and a solid property tax base. Stable revenues are especially important in a state where the industrial economy has been slow to recover.
• The Fund was very selective with respect to its investments in the hospital sector. With the competitive hospital industry under pressure to reduce costs, management emphasized institutions with sound financial structures, good management and the ability to offer attractive health care specialties.
• The Fund maintained significant investments in insured** water and sewer bonds. The need to modernize aging water infrastructure has resulted in increased issuance of water bonds, producing further opportunities in state and local issuers.
• The Fund made structural changes to adjust to shifting market conditions. Management maintained a well-diversified coupon allocation, balancing higher-income housing and utility issues with interest-rate-sensitive, low- and zero-coupon issues for appreciation potential.
* Reinvestment amounts per share are based on 366 days from 4/1/04-12/31/04 and 365 days from 1/1/05-3/31/05.
** Private insurance does not decrease the risk of loss of principal associated with this investment.
Formerly, the Fund invested its assets in a corresponding investment company (referred to as the Portfolio) that had the same investment objective and policies as the Fund. Effective October 8, 2004, the Fund began to invest its assets directly in securities. The Fund’s investment objective and other investment policies remain unchanged. In addition, Boston Management and Research, the investment adviser to the Portfolio, acts as investment adviser to the Fund. The investment advisery fee paid remains unchanged.
(1) These returns do not include the 4.75% maximum sales charge for the Fund’s Class A shares or the applicable contingent deferred sales charges (CDSC) for Class B shares. If the sales charge were deducted, returns would be lower. (2) A portion of the Fund’s income may be subject to federal and state income taxes and/or alternative minimum tax. (3) It is not possible to invest directly in an Index. The Index’s total return does not reflect the commissions or expenses that would have been incurred if an investor individually purchased or sold the securities represented in the Index. (4) The Fund’s distribution rate represents actual distributions paid to shareholders and is calculated by dividing the last distribution per share (annualized) by the net asset value. (5) Taxable-equivalent figures assume a maximum 39.88% combined federal income and state income tax rate. A lower rate would result in lower tax-equivalent figures. (6) The Fund’s SEC yield is calculated by dividing the net investment income per share for the 30-day period by the offering price at the end of the period and annualizing the result.
14
Eaton Vance Ohio Limited Maturity Municipals Fund as of March 31, 2005
F U N D P E R F O R M A N C E
The line graph and table set forth below provide information about the Fund’s performance. The line graph compares the performance of Class B of the Fund with that of the Lehman Brothers 7-Year Municipal Bond Index, a broad-based, unmanaged market index. The lines on the graph represent the total returns of a hypothetical investment of $10,000 in each of Class B and in the Lehman Brothers
7-year Municipal Bond Index. The table includes the total returns of each Class of the Fund at net asset value and maximum public offering price. The performance presented below does not reflect the deduction of taxes, if any, that a shareholder would pay on Fund distributions or redemptions of Fund shares.
Performance(1) | | Class A | | Class B | |
| | | | | |
Average Annual Total Returns (at net asset value) | | | | | |
One Year | | 0.70 | % | -0.05 | % |
Five Years | | 4.76 | | 3.99 | |
Ten Years | | N.A. | | 3.67 | |
Life of Fund† | | 4.20 | | 3.54 | |
| | | | | |
SEC Average Annual Total Returns (including sales charge or applicable CDSC) | | | | | |
One Year | | -1.56 | % | -2.97 | % |
Five Years | | 4.28 | | 3.99 | |
Ten Years | | N.A. | | 3.67 | |
Life of Fund† | | 3.91 | | 3.54 | |
†Inception date: Class A: 10/22/96; Class B: 4/16/93
(1) Average annual total returns do not include the 4.75% maximum sales charge for Class A shares or the applicable contingent deferred sales charges (CDSC) for Class B shares. If sales charges were deducted, returns would be lower. SEC average annual total returns for Class A reflect the maximum 4.75% sales charge. SEC returns for Class B reflect applicable CDSC based on the following schedule: 5% - 1st and 2nd years; 4% - - 3rd year; 3% - 4th year; 2% - 5th year; 1% - 6th year.
Past performance is no guarantee of future results. Returns are historical and are calculated by determining the percentage change in net asset value or offering price (as applicable) with all distributions reinvested. Investment return and principal value will fluctuate so that shares, when redeemed, may be worth more or less than their original cost. Performance is for the stated time period only; due to market volatility, the Fund’s current performance may be lower or higher than the quoted return. For performance as of the most recent month end, please refer to www.eatonvance.com.
Comparison of Change in Value of a $10,000 Investment in Eaton Vance
Ohio Limited Maturity Municipals Fund Class B vs. the Lehman
Brothers 7-Year Municipal Bond Index* March 31, 1995 – March 31, 2005

*Sources: Thomson Financial; Lipper, Inc.
Class B of the Fund commenced operations on 4/16/93.
A $10,000 hypothetical investment at net asset value in Class A on 10/22/96 would have been valued at $14,148 on March 31, 2005. A $10,000 hypothetical investment in Class A at maximum offering price would have been valued at $13,825. It is not possible to invest directly in an Index. The Index’s total return does not reflect the commissions or expenses that would have been incurred if an investor individually purchased or sold the securities represented in the Index.
Diversification by Credit Quality(2)
(2)As a percentage of total investments, as of March 31, 2005. Holdings subject to change due to active management.
15
Eaton Vance Pennsylvania Limited Maturity Municipals Fund as of March 31, 2005
I N V E S T M E N T U P D A T E
The Fund
Performance for the Past Year*
• The Fund’s Class A shares had a total return of 1.25% for the year ended March 31, 2005.(1) This return was the result of a decrease in net asset value (NAV) to $10.28 per share on March 31, 2005 from $10.55 on March 31, 2004, and the reinvestment of $0.400 in dividends.(2)
• The Fund’s Class B shares had a total return of 0.48% for the year ended March 31, 2005.(1) This return was the result of a decrease in NAV to $10.28 per share on March 31, 2005 from $10.55 on March 31, 2004, and the reinvestment of $0.320 in dividends.(2)
• The Fund’s Class C shares had a total return of 0.44% for the year ended March 31, 2005.(1) This return was the result of a decrease in NAV to $9.75 per share on March 31, 2005 from $10.00 on March 31, 2004, and the reinvestment of $0.294 in dividends.(2)
• For comparison, the Lehman Brothers 7-Year Municipal Bond Index – an unmanaged index of investment-grade, municipal debt securities with an average maturity of 7 years – had a total return of 0.80% for the year ended March 31, 2005.(3)
• Based on the Fund’s most recent dividends annualized and NAVs on March 31, 2005 of $10.28 per share for Class A and Class B and $9.75 for Class C, the Fund’s distribution rates were 3.89%, 3.11% and 3.08%, respectively.(4) The distribution rates are equivalent to taxable rates of 6.17%, 4.94% and 4.89%, respectively.(5)
• The SEC 30-day yields for Class A, Class B and Class C shares at March 31, 2005 were 3.22%, 2.54% and 2.54%, respectively.(6) The SEC 30-day yields are equivalent to taxable yields of 5.11%, 4.03% and 4.03%, respectively.(5)
Craig Brandon
Portfolio Manager
Management Discussion
• Pennsylvania saw positive job growth in 2004 for the first time since 2000, although growth was uneven around the state. Business, education, tourism, construction and health care were major contributors. Manufacturing, especially in western Pennsylvania, continued to shed jobs. Pennsylvania’s March 2005 jobless rate was 5.2%, down from 5.5% a year ago.
• Insured** general obligations were the Fund’s largest sector weighting at March 31, 2005. Management focused on issuer of cities, townships, counties and school districts it believes have relatively strong local economies, a sound tax base and reasonable future borrowing needs.
• Insured** transportation bonds were prominent in the Fund. Transportation bonds finance improvements and expansions for the Commonwealth’s highway and port facilities, which are key to moving commercial traffic. The Fund’s investments included issues for highways, turnpikes, transportation and airport authorities.
• Insured** escrowed/prerefunded bonds remained a significant focus of the Fund. Escrowed bonds are those that have been pre-refunded as the result of a refinancing and are backed by Treasuries. The bonds are deemed very high quality by investors and often provide above-average coupons.
• Management continued its efforts, where possible, to upgrade the Fund’s call protection. The Fund sold bonds with approaching call dates in favor of high quality, non-callable bonds and bonds with more attractive call characteristics.
* Reinvestment amounts per share are based on 366 days from 4/1/04-12/31/04 and 365 days from 1/1/05-3/31/05.
** Private insurance does not decrease the risk of loss of principal associated with this investment.
Formerly, the Fund invested its assets in a corresponding investment company (referred to as the Portfolio) that had the same investment objective and policies as the Fund. Effective October 8, 2004, the Fund began to invest its assets directly in securities. The Fund’s investment objective and other investment policies remain unchanged. In addition, Boston Management and Research, the investment adviser to the Portfolio, acts as investment adviser to the Fund. The investment advisery fee paid remains unchanged.
(1) These returns do not include the 4.75% maximum sales charge for the Fund’s Class A shares or the applicable contingent deferred sales charges (CDSC) for Class B and Class C shares. If the sales charge were deducted, returns would be lower. (2) A portion of the Fund’s income may be subject to federal and state income taxes and/or alternative minimum tax. (3) It is not possible to invest directly in an Index. The Index’s total return does not reflect the commissions or expenses that would have been incurred if an investor individually purchased or sold the securities represented in the Index. (4) The Fund’s distribution rate represents actual distributions paid to shareholders and is calculated by dividing the last distribution per share (annualized) by the net asset value. (5) Taxable-equivalent figures assume a maximum 37.00% combined federal income and state income tax rate. A lower rate would result in lower tax-equivalent figures. (6) The Fund’s SEC yield is calculated by dividing the net investment income per share for the 30-day period by the offering price at the end of the period and annualizing the result.
16
Eaton Vance Pennsylvania Limited Maturity Municipals Fund as of March 31, 2005
F U N D P E R F O R M A N C E
The line graph and table set forth below provide information about the Fund’s performance. The line graph compares the performance of Class B of the Fund with that of the Lehman Brothers 7-Year Municipal Bond Index, a broad-based, unmanaged market index. The lines on the graph represent the total returns of a hypothetical investment of $10,000 in each of Class B and in the Lehman Brothers
7-Year Municipal Bond Index. The table includes the total returns of each Class of the Fund at net asset value and maximum public offering price. The performance presented below does not reflect the deduction of taxes, if any, that a shareholder would pay on Fund distributions or redemptions of Fund shares.
Performance(1) | | Class A | | Class B | | Class C | |
| | | | | | | |
Average Annual Total Returns (at net asset value) | | | | | | | |
One Year | | 1.25 | % | 0.48 | % | 0.44 | % |
Five Years | | 5.17 | | 4.36 | | 4.38 | |
Ten Years | | N.A. | | 3.91 | | 3.89 | |
Life of Fund† | | 4.72 | | 4.18 | | 3.52 | |
| | | | | | | |
SEC Average Annual Total Returns (including sales charge or applicable CDSC) | | | | | | | |
One Year | | -1.01 | % | -2.44 | % | -0.53 | % |
Five Years | | 4.69 | | 4.36 | | 4.38 | |
Ten Years | | N.A. | | 3.91 | | 3.89 | |
Life of Fund† | | 4.45 | | 4.18 | | 3.52 | |
†Inception Dates – Class A: 6/27/96; Class B: 6/1/92; Class C: 12/8/93
(1) Average annual total returns do not include the 4.75% maximum sales charge for Class A shares or the applicable contingent deferred sales charges (CDSC) for Class B and Class C shares. If sales charges were deducted, returns would be lower. SEC average annual total returns for Class A reflect the maximum 4.75% sales charge. SEC returns for Class B reflect applicable CDSC based on the following schedule: 5% - 1st and 2nd years; 4% - 3rd year; 3% - 4th year; 2% - 5th year; 1% - 6th year. SEC 1-year return for Class C reflects a 1% CDSC.
Past performance is no guarantee of future results. Returns are historical and are calculated by determining the percentage change in net asset value or offering price (as applicable) with all distributions reinvested. Investment return and principal value will fluctuate so that shares, when redeemed, may be worth more or less than their original cost. Performance is for the stated time period only; due to market volatility, the Fund’s current performance may be lower or higher than the quoted return. This performance is not typical and may not be repeated. For performance as of the most recent month end, please refer to www.eatonvance.com.
Comparison of Change in Value of a $10,000 Investment in Eaton Vance
Pennsylvania Limited Maturity Municipals Fund Class B vs. the Lehman
Brothers 7-Year Municipal Bond Index* March 31, 1995 – March 31, 2005

*Sources: Thomson Financial; Lipper, Inc.
Class B of the Fund commenced operations on 6/1/92.
A $10,000 hypothetical investment at net asset value in Class A and Class C on 6/27/96 and 3/31/95, respectively, would have been valued at $14,980 and $14,644, respectively, on March 31, 2005. A $10,000 hypothetical investment in Class A at maximum offering price would have been valued at $14,645. It is not possible to invest directly in an Index. The Index’s total return does not reflect the commissions or expenses that would have been incurred if an investor individually purchased or sold the securities represented in the Index.
Diversification by Credit Quality(2)

(2)As a percentage of total investments, as of March 31, 2005. Holdings subject to change due to active management.
17
Eaton Vance Limited Maturity Municipals Funds as of March 31, 2005
F U N D E X P E N S E S
Example: As a shareholder of a Fund, you incur two types of costs: (1) transaction costs, including sales charges (loads) on purchases and redemption fees (if applicable); and (2) ongoing costs, including management fees; distribution or service fees; and other Fund expenses. This Example is intended to help you understand your ongoing costs (in dollars) of investing in a Fund and to compare these costs with the ongoing costs of investing in other mutual funds. The Example is based on an investment of $1,000 invested at the beginning of the period and held for the entire period (October 1, 2004 – March 31, 2005).
Actual Expenses: The first section of each table below provides information about actual account values and actual expenses. You may use the information in this line, together with the amount you invested, to estimate the expenses that you paid over the period. Simply divide your account value by $1,000 (for example, an $8,600 account value divided by $1,000 = 8.6), then multiply the result by the number in the first line under the heading entitled “Expenses Paid During Period” to estimate the expenses you paid on your account during this period.
Hypothetical Example for Comparison Purposes: The second section of each table below provides information about hypothetical account values and hypothetical expenses based on a Fund’s actual expense ratios and an assumed rate of return of 5% per year before expenses, which is not the actual return of the Fund. The hypothetical account values and expenses may not be used to estimate the actual ending account balance or expenses you paid for the period. You may use this information to compare the ongoing costs of investing in the Funds and other funds. To do so, compare this 5% hypothetical example with the 5% hypothetical examples that appear in the shareholder reports of other funds.
Please note that the expenses shown in the table are meant to highlight your ongoing costs only and do not reflect any transactional costs, such as sales charges (loads) or redemption fees (if applicable). Therefore, the second section of the table is useful in comparing ongoing costs only, and will not help you determine the relative total costs of owning different funds. In addition, if these transactional costs were included, your costs would have been higher.
Eaton Vance California Limited Maturity Municipals Fund
| | Beginning Account Value | | Ending Account Value | | Expenses Paid During Period* | |
| | (10/1/04) | | (3/31/05) | | (10/1/04-3/31/05) | |
| | | | | | | |
Actual | | | | | | | |
Class A | | $ | 1,000.00 | | $ | 999.30 | | $ | 4.34 | |
Class B | | $ | 1,000.00 | | $ | 995.60 | | $ | 8.01 | |
| | | | | | | |
Hypothetical | | | | | | | |
(5% return per year before expenses) | | | | | | | |
Class A | | $ | 1,000.00 | | $ | 1,020.60 | | $ | 4.38 | |
Class B | | $ | 1,000.00 | | $ | 1,016.90 | | $ | 8.10 | |
* Expenses are equal to the Fund’s annualized expense ratio of 0.87% for Class A shares and 1.61% for Class B shares multiplied by the average account value over the period, multiplied by 182/365 (to reflect the one-half year period). The Example assumes that the $1,000 was invested at the net asset value per share determined at the close of business on September 30, 2004. The example reflects the expenses of both the Fund and the Portfolio. Class C shares commenced operations on March 23, 2005 and are not included in this table.
Eaton Vance Florida Limited Maturity Municipals Fund
| | Beginning Account Value | | Ending Account Value | | Expenses Paid During Period* | |
| | (10/1/04) | | (3/31/05) | | (10/1/04-3/31/05) | |
| | | | | | | |
Actual | | | | | | | |
Class A | | $ | 1,000.00 | | $ | 1,001.60 | | $ | 3.89 | |
Class B | | $ | 1,000.00 | | $ | 997.80 | | $ | 7.62 | |
Class C | | $ | 1,000.00 | | $ | 996.40 | | $ | 7.62 | |
| | | | | | | |
Hypothetical | | | | | | | |
(5% return per year before expenses) | | | | | | | |
Class A | | $ | 1,000.00 | | $ | 1,021.00 | | $ | 3.93 | |
Class B | | $ | 1,000.00 | | $ | 1,017.30 | | $ | 7.70 | |
Class C | | $ | 1,000.00 | | $ | 1,017.30 | | $ | 7.70 | |
* Expenses are equal to the Fund’s annualized expense ratio of 0.78% for Class A shares, 1.53% for Class B shares and 1.53% for Class C shares multiplied by the average account value over the period, multiplied by 182/365 (to reflect the one-half year period). The Example assumes that the $1,000 was invested at the net asset value per share determined at the close of business on September 30, 2004. The example reflects the expenses of both the Fund and the Portfolio.
18
Eaton Vance Massachusetts Limited Maturity Municipals Fund
| | Beginning Account Value | | Ending Account Value | | Expenses Paid During Period* | |
| | (10/1/04) | | (3/31/05) | | (10/1/04-3/31/05) | |
| | | | | | | |
Actual | | | | | | | |
Class A | | $ | 1,000.00 | | $ | 995.90 | | $ | 3.88 | |
Class B | | $ | 1,000.00 | | $ | 993.10 | | $ | 7.60 | |
Class C | | $ | 1,000.00 | | $ | 991.80 | | $ | 7.60 | |
| | | | | | | |
Hypothetical | | | | | | | |
(5% return per year before expenses) | | | | | | | |
Class A | | $ | 1,000.00 | | $ | 1,021.00 | | $ | 3.93 | |
Class B | | $ | 1,000.00 | | $ | 1,017.30 | | $ | 7.70 | |
Class C | | $ | 1,000.00 | | $ | 1,017.30 | | $ | 7.70 | |
* Expenses are equal to the Fund’s annualized expense ratio of 0.78% for Class A shares, 1.53% for Class B shares and 1.53% for Class C shares multiplied by the average account value over the period, multiplied by 182/365 (to reflect the one-half year period). The Example assumes that the $1,000 was invested at the net asset value per share determined at the close of business on September 30, 2004. The example reflects the expenses of both the Fund and the Portfolio.
Eaton Vance New Jersey Limited Maturity Municipals Fund
| | Beginning Account Value | | Ending Account Value | | Expenses Paid During Period* | |
| | (10/1/04) | | (3/31/05) | | (10/1/04-3/31/05) | |
| | | | | | | |
Actual | | | | | | | |
Class A | | $ | 1,000.00 | | $ | 1,001.60 | | $ | 4.24 | |
Class B | | $ | 1,000.00 | | $ | 997.80 | | $ | 7.97 | |
| | | | | | | |
Hypothetical | | | | | | | |
(5% return per year before expenses) | | | | | | | |
Class A | | $ | 1,000.00 | | $ | 1,020.70 | | $ | 4.28 | |
Class B | | $ | 1,000.00 | | $ | 1,017.00 | | $ | 8.05 | |
* Expenses are equal to the Fund’s annualized expense ratio of 0.85% for Class A shares and 1.60% for Class B shares multiplied by the average account value over the period, multiplied by 182/365 (to reflect the one-half year period). The Example assumes that the $1,000 was invested at the net asset value per share determined at the close of business on September 30, 2004. The example reflects the expenses of both the Fund and the Portfolio.
Eaton Vance New York Limited Maturity Municipals Fund
| | Beginning Account Value | | Ending Account Value | | Expenses Paid During Period* | |
| | (10/1/04) | | (3/31/05) | | (10/1/04-3/31/05) | |
| | | | | | | |
Actual | | | | | | | |
Class A | | $ | 1,000.00 | | $ | 997.30 | | $ | 3.93 | |
Class B | | $ | 1,000.00 | | $ | 993.50 | | $ | 7.65 | |
Class C | | $ | 1,000.00 | | $ | 993.80 | | $ | 7.66 | |
| | | | | | | |
Hypothetical | | | | | | | |
(5% return per year before expenses) | | | | | | | |
Class A | | $ | 1,000.00 | | $ | 1,021.00 | | $ | 3.98 | |
Class B | | $ | 1,000.00 | | $ | 1,017.30 | | $ | 7.75 | |
Class C | | $ | 1,000.00 | | $ | 1,017.30 | | $ | 7.75 | |
* Expenses are equal to the Fund’s annualized expense ratio of 0.79% for Class A shares, 1.54% for Class B shares and 1.54% for Class C shares multiplied by the average account value over the period, multiplied by 182/365 (to reflect the one-half year period). The Example assumes that the $1,000 was invested at the net asset value per share determined at the close of business on September 30, 2004. The example reflects the expenses of both the Fund and the Portfolio.
19
Eaton Vance Ohio Limited Maturity Municipals Fund
| | Beginning Account Value | | Ending Account Value | | Expenses Paid During Period* | |
| | (10/1/04) | | (3/31/05) | | (10/1/04-3/31/05) | |
| | | | | | | |
Actual | | | | | | | |
Class A | | $ | 1,000.00 | | $ | 998.20 | | $ | 5.08 | |
Class B | | $ | 1,000.00 | | $ | 995.40 | | $ | 8.81 | |
| | | | | | | |
Hypothetical | | | | | | | |
(5% return per year before expenses) | | | | | | | |
Class A | | $ | 1,000.00 | | $ | 1,019.80 | | $ | 5.14 | |
Class B | | $ | 1,000.00 | | $ | 1,016.10 | | $ | 8.90 | |
* Expenses are equal to the Fund’s annualized expense ratio of 1.02% for Class A shares and 1.77% for Class B shares multiplied by the average account value over the period, multiplied by 182/365 (to reflect the one-half year period). The Example assumes that the $1,000 was invested at the net asset value per share determined at the close of business on September 30, 2004. The example reflects the expenses of both the Fund and the Portfolio.
Eaton Vance Pennsylvania Limited Maturity Municipals Fund
| | Beginning Account Value | | Ending Account Value | | Expenses Paid During Period* | |
| | (10/1/04) | | (3/31/05) | | (10/1/04-3/31/05) | |
| | | | | | | |
Actual | | | | | | | |
Class A | | $ | 1,000.00 | | $ | 1,001.60 | | $ | 4.19 | |
Class B | | $ | 1,000.00 | | $ | 997.80 | | $ | 7.92 | |
Class C | | $ | 1,000.00 | | $ | 998.10 | | $ | 7.92 | |
| | | | | | | |
Hypothetical | | | | | | | |
(5% return per year before expenses) | | | | | | | |
Class A | | $ | 1,000.00 | | $ | 1,020.70 | | $ | 4.23 | |
Class B | | $ | 1,000.00 | | $ | 1,017.00 | | $ | 8.00 | |
Class C | | $ | 1,000.00 | | $ | 1,017.00 | | $ | 8.00 | |
* Expenses are equal to the Fund’s annualized expense ratio of 0.84% for Class A shares, 1.59% for Class B shares and 1.59% for Class C shares multiplied by the average account value over the period, multiplied by 182/365 (to reflect the one-half year period). The Example assumes that the $1,000 was invested at the net asset value per share determined at the close of business on September 30, 2004. The example reflects the expenses of both the Fund and the Portfolio.
20
Eaton Vance California Limited Maturity Municipals Fund as of March 31, 2005
PORTFOLIO OF INVESTMENTS
| |
Tax-Exempt Investments - 99.8% | | | | | | | | |
Principal Amount
(000's omitted) | |
Security | |
Value | |
| | Electric Utilities - 0.7% | | | | | | | | |
| $ | 250 | | | California Department of Water Resource Power Supply,
5.125%, 5/1/18 | | $ | 263,687 | | |
| | | | | | | $ | 263,687 | | |
| | Escrowed / Prerefunded - 1.6% | | | | | | | | |
| $ | 520 | | | California Statewide Communities Development Authority,
(San Gabriel Valley), Escrowed to Maturity, 5.50%, 9/1/14 | | $ | 578,828 | | |
| | | | | | | $ | 578,828 | | |
| | General Obligations - 4.3% | | | | | | | | |
| $ | 400 | | | California, 5.25%, 2/1/14 | | $ | 433,376 | | |
| | 1,000 | | | California, 5.25%, 11/1/16 | | | 1,080,970 | | |
| | | | | | | $ | 1,514,346 | | |
| | Hospital - 5.2% | | | | | | | | |
| $ | 700 | | | California Statewide Communities Development Authority,
(Daughters of Charity Health System California),
5.00%, 7/1/22 | | $ | 708,351 | | |
| | 180 | | | Eastern Plumas Health Care District, 7.50%, 8/1/07 | | | 183,505 | | |
| | 200 | | | San Benito Health Care District, 5.375%, 10/1/12 | | | 204,436 | | |
| | 400 | | | Stockton Health Facilities, (Dameron Hospital),
5.70%, 12/1/14 | | | 418,580 | | |
| | 300 | | | Torrance Hospital, (Torrance Memorial Medical Center),
5.40%, 6/1/15 | | | 319,746 | | |
| | | | | | | $ | 1,834,618 | | |
| | Industrial Development Revenue - 0.5% | | | | | | | | |
| $ | 200 | | | California Pollution Control Financing Authority,
(Browning Ferris Industries), (AMT), 5.80%, 12/1/16 | | $ | 189,434 | | |
| | | | | | | $ | 189,434 | | |
| | Insured-Education - 3.0% | | | | | | | | |
| $ | 475 | | | California Educational Facilities Authority,
(San Diego University), (AMBAC), 0.00%, 10/1/15 | | $ | 297,383 | | |
| | 500 | | | California Educational Facilities Authority,
(Santa Clara University), (MBIA), 5.00%, 2/1/19 | | | 524,155 | | |
| | 210 | | | California University Foundation Revenue,
(Sacramento Auxiliary), (MBIA), 5.50%, 10/1/20 | | | 230,095 | | |
| | | | | | | $ | 1,051,633 | | |
Principal Amount
(000's omitted) | |
Security | |
Value | |
| Insured-Electric Utilities - 6.4% | | | | | |
| $ | 1,000 | | | California Pollution Control Financing Authority,
(San Diego Gas and Electric), (MBIA), 5.90%, 6/1/14(1) | | $ | 1,150,100 | | |
| | 500 | | | California Pollution Control Financing Authority, PCR,
(Pacific Gas and Electric), (MBIA), (AMT),
5.35%, 12/1/16 | | | 531,950 | | |
| | 500 | | | Puerto Rico Electric Power Authority, (MBIA),
5.50%, 7/1/18 | | | 574,020 | | |
| | | | | | | $ | 2,256,070 | | |
| Insured-General Obligations - 29.4% | | | | | |
| $ | 400 | | | Barstow Unified School District, (FGIC),
5.25%, 8/1/18 | | $ | 431,300 | | |
| | 1,000 | | | Burbank Unified School District, (FGIC), 0.00%, 8/1/12 | | | 746,320 | | |
| | 1,080 | | | Fillmore Unified School District, (FGIC), 0.00%, 7/1/15 | | | 684,083 | | |
| | 760 | | | Fresno Unified School District, (MBIA), 5.80%, 2/1/16 | | | 877,169 | | |
| | 750 | | | Los Angeles Unified School District, (Election of 1997),
(MBIA), 5.125%, 7/1/21 | | | 792,975 | | |
| | 500 | | | North Orange County Community College District, (MBIA),
5.25%, 8/1/14 | | | 560,530 | | |
| | 500 | | | Oak Grove School District, (Election of 1995), (FGIC),
5.00%, 8/1/16 | | | 530,895 | | |
| | 1,000 | | | Redwood City Elementary School District, (FGIC),
5.00%, 8/1/15 | | | 1,088,590 | | |
| | 1,000 | | | San Diego Unified School District, (MBIA), 5.00%, 7/1/17 | | | 1,089,460 | | |
| | 1,000 | | | San Juan Unified School District, (FSA), 0.00%, 8/1/17 | | | 563,510 | | |
| | 1,205 | | | Tahoe Truckee Unified School District, (MBIA),
5.50%, 8/1/19 | | | 1,371,639 | | |
| | 705 | | | Ukiah Unified School District, (FGIC), 0.00%, 8/1/10 | | | 582,986 | | |
| | 1,000 | | | Walnut Valley Unified School District, (FGIC),
5.25%, 8/1/18 | | | 1,085,430 | | |
| | | | | | | $ | 10,404,887 | | |
| Insured-Hospital - 1.3% | | | | | |
| $ | 400 | | | California Statewide Communities Development Authority,
(Sutter Health), (FSA), 6.00%, 8/15/13 | | $ | 442,776 | | |
| | | | | | | $ | 442,776 | | |
Insured-Lease Revenue / Certificates of
Participation - 6.3% | | | | | |
| $ | 1,750 | | | Anaheim Public Financing Authority, (Public Improvements),
(FSA), 0.00%, 9/1/19 | | $ | 871,465 | | |
| | 750 | | | California Public Works, (UCLA Replacement Hospital),
(FSA), 5.375%, 10/1/16 | | | 811,455 | | |
| | 505 | | | California State Public Works Board, (Department of
Corrections), (AMBAC), 5.25%, 12/1/13 | | | 558,929 | | |
| | | | | | | $ | 2,241,849 | | |
See notes to financial statements
21
Eaton Vance California Limited Maturity Municipals Fund as of March 31, 2005
PORTFOLIO OF INVESTMENTS CONT'D
Principal Amount
(000's omitted) | |
Security | |
Value | |
| Insured-Special Tax Revenue - 12.8% | | | | | |
| $ | 600 | | | Burbank Public Financing Authority, (Golden State
Redevelopment), (AMBAC), 5.25%, 12/1/22 | | $ | 637,494 | | |
| | 1,050 | | | California Economic Recovery, (FGIC), 5.25%, 7/1/14 | | | 1,162,990 | | |
| | 1,000 | | | Garden Grove Community Development (Tax Allocation),
(AMBAC), 5.25%, 10/1/16 | | | 1,083,850 | | |
| | 500 | | | Napa County Flood Protection and Watershed Improvements
Authority, (FGIC), 5.00%, 6/15/18 | | | 526,180 | | |
| | 1,000 | | | San Mateo County Transportation District, (MBIA),
5.25%, 6/1/17 | | | 1,114,830 | | |
| | | | | | | $ | 4,525,344 | | |
| Insured-Transportation - 5.4% | | | | | |
| $ | 1,000 | | | Puerto Rico Commonwealth Highway and Transportation
Authority, (FSA), 5.50%, 7/1/17 | | $ | 1,145,650 | | |
| | 1,000 | | | San Joaquin Hills, Transportation Corridor Agency Bridge &
Toll Road, (MBIA), 0.00%, 1/15/12 | | | 765,310 | | |
| | | | | | | $ | 1,910,960 | | |
| Insured-Water and Sewer - 7.7% | | | | | |
| $ | 1,000 | | | California Department of Water Resources, (FGIC),
5.50%, 12/1/17 | | $ | 1,138,780 | | |
| | 750 | | | Sacramento County, Sanitation Financing Authority,
(AMBAC), 5.00%, 12/1/35 | | | 777,007 | | |
| | 250 | | | Sacramento County, Sanitation Financing Authority,
(AMBAC), 5.50%, 12/1/19 | | | 283,977 | | |
| | 500 | | | Sunnyvale Financing Authority Water and Wastewater,
(AMBAC), 5.00%, 10/1/22 | | | 519,550 | | |
| | | | | | | $ | 2,719,314 | | |
| Other Revenue - 0.9% | | | | | |
| $ | 300 | | | California Statewide Communities Development Authority,
(East Valley Tourist Development Authority),
8.25%, 10/1/14 | | $ | 305,622 | | |
| | | | | | | $ | 305,622 | | |
| Senior Living / Life Care - 0.7% | | | | | |
| $ | 250 | | | ABAG Finance Authority, (American Baptist Homes),
5.75%, 10/1/17 | | $ | 248,725 | | |
| | | | | | | $ | 248,725 | | |
| Solid Waste - 1.0% | | | | | |
| $ | 350 | | | Napa-Vallejo Waste Management Authority, (Solid Waste
Transfer Facilities), (AMT), 5.10%, 2/15/14 | | $ | 355,705 | | |
| | | | | | | $ | 355,705 | | |
Principal Amount
(000's omitted) | |
Security | |
Value | |
| | Special Tax Revenue - 10.4% | | | | | | | | |
| $ | 300 | | | Alameda Public Financing Authority, 5.45%, 9/2/14 | | $ | 307,620 | | |
| | 250 | | | Brentwood Infrastructure Financing Authority,
5.625%, 9/2/15 | | | 257,600 | | |
| | 200 | | | Capistrano Unified School District, 5.65%, 9/1/15 | | | 215,078 | | |
| | 195 | | | Corona Public Financing Authority, 5.70%, 9/1/13 | | | 195,866 | | |
| | 200 | | | Fontana Redevelopment Agency, (Jurupa Hills),
5.50%, 10/1/17 | | | 210,496 | | |
| | 250 | | | Jurupa Community Services District, 5.00%, 9/1/25 | | | 245,750 | | |
| | 40 | | | Moreno Valley Unified School District,
(Community District No. 2003-2), 5.20%, 9/1/17 | | | 40,580 | | |
| | 80 | | | Moreno Valley Unified School District,
(Community District No. 2003-2), 5.25%, 9/1/18 | | | 80,930 | | |
| | 160 | | | Murrueta Valley Unified School District, 5.70%, 9/1/17 | | | 167,992 | | |
| | 390 | | | Pomona Redevelopment Agency,
(West Holt Avenue Redevelopment), 5.50%, 5/1/13 | | | 422,183 | | |
| | 295 | | | Rancho Cucamonga Public Finance Authority,
5.75%, 9/2/12 | | | 315,128 | | |
| | 290 | | | Roseville Special Tax, 6.00%, 9/1/11 | | | 320,143 | | |
| | 200 | | | Santa Margarita Water District, 6.10%, 9/1/14 | | | 220,182 | | |
| | 200 | | | Santaluz Community Facility District No. 2, 5.80%, 9/1/14 | | | 205,376 | | |
| | 200 | | | Torrance Redevelopment Agency, 5.50%, 9/1/12 | | | 210,576 | | |
| | 250 | | | Whittier Public Financing Authority,
(Greenleaf Avenue Redevelopment), 5.50%, 11/1/16 | | | 264,605 | | |
| | | | | | | $ | 3,680,105 | | |
| | Transportation - 0.8% | | | | | | | | |
| $ | 290 | | | Port Redwood City, (AMT), 5.40%, 6/1/19 | | $ | 300,347 | | |
| | | | | | | $ | 300,347 | | |
| | Water and Sewer - 1.4% | | | | | | | | |
| $ | 500 | | | Metropolitan Water District, (Southern California
Waterworks), 4.75%, 7/1/22 | | $ | 504,940 | | |
| | | | | | | $ | 504,940 | | |
| | Total Tax-Exempt Investments - 99.8%
(identified cost $34,246,898) | | | | | $ | 35,329,190 | | |
| | Other Assets, Less Liabilities - 0.2% | | | | | $ | 71,945 | | |
| | Net Assets - 100.0% | | | | | $ | 35,401,135 | | |
AMBAC - AMBAC Financial Group, Inc.
AMT - Interest earned from these securities may be considered a tax preference item for purposes of the Federal Alternative Minimum Tax.
See notes to financial statements
22
Eaton Vance California Limited Maturity Municipals Fund as of March 31, 2005
PORTFOLIO OF INVESTMENTS CONT'D
FGIC - Financial Guaranty Insurance Company
FSA - Financial Security Assurance, Inc.
MBIA - Municipal Bond Insurance Association
The Fund invests primarily in debt securities issued by California municipalities. The ability of the issuers of the debt securities to meet their obligations may be affected by economic developments in a specific industry or municipality. In order to reduce the risk associated with such economic developments, at March 31, 2005, 72.3% of the securities in the portfolio of investments are backed by bond insurance of various financial institutions and financial guaranty assurance agencies. The aggregate percentage insured by an individual financial institution ranged from 10.9% to 27.1% of total investments.
(1) Security (or a portion thereof) has been segregated to cover margin requirements on open financial futures contracts.
See notes to financial statements
23
Eaton Vance Florida Limited Maturity Municipals Fund as of March 31, 2005
PORTFOLIO OF INVESTMENTS
Tax-Exempt Investments - 99.4% | | | | | |
Principal Amount
(000's omitted) | |
Security | |
Value | |
| Electric Utilities - 0.7% | | | | | |
| $ | 500 | | | Jacksonville Electric Authority, (St. Johns River Power Park),
5.375%, 10/1/16 | | $ | 516,490 | | |
| | | | | | | $ | 516,490 | | |
| Hospital - 3.9% | | | | | |
| $ | 1,000 | | | Highlands County Health Facilities Authority,
(Adventist Health System), 5.25%, 11/15/20 | | $ | 1,032,120 | | |
| | 1,075 | | | Orange County Health Facilities Authority,
(Nemours Foundation), 5.00%, 1/1/17 | | | 1,150,712 | | |
| | 500 | | | West Orange Healthcare District, 5.50%, 2/1/10 | | | 540,320 | | |
| | | | | | | $ | 2,723,152 | | |
| Industrial Development Revenue - 0.8% | | | | | |
| $ | 500 | | | Polk County IDA, (Cargill Fertilizer), (AMT),
5.50%, 11/1/09 | | $ | 532,940 | | |
| | | | | | | $ | 532,940 | | |
| Insured-Electric Utilities - 7.6% | | | | | |
| $ | 1,000 | | | Brevard County Utility Revenue, (FGIC), 5.25%, 3/1/13 | | $ | 1,087,940 | | |
| | 2,000 | | | Escambia County Utilities Authority, (FGIC), 0.00%, 1/1/15 | | | 1,297,820 | | |
| | 1,165 | | | Puerto Rico Electric Power Authority, (MBIA), 5.50%, 7/1/18 | | | 1,337,467 | | |
| | 1,450 | | | Puerto Rico Electric Power Authority, (XLCA), 5.375%, 7/1/18 | | | 1,633,497 | | |
| | | | | | | $ | 5,356,724 | | |
| Insured-Escrowed / Prerefunded - 2.1% | | | | | |
| $ | 750 | | | Palm Beach County Public Improvements, (Convention Center),
(FGIC), Prerefunded to 1/01/11, 5.625%, 11/1/15 | | $ | 836,340 | | |
| | 1,000 | | | Port Saint Lucie Utility, (MBIA), Escrowed to Maturity,
0.00%, 9/1/15 | | | 628,080 | | |
| | | | | | | $ | 1,464,420 | | |
| Insured-General Obligations - 11.8% | | | | | |
| $ | 750 | | | Dade County Local School District, (MBIA),
5.00%, 2/15/15 | | $ | 779,700 | | |
| | 500 | | | Miami, (Homeland Defense), (MBIA), 0.00%, 1/1/12 | | | 379,555 | | |
| | 1,000 | | | Miami, (MBIA), 5.375%, 9/1/15 | | | 1,091,140 | | |
| | 750 | | | Miami-Dade County General Obligation,
(Fire and Rescue Service District), (AMBAC), 5.25%, 4/1/17 | | | 807,937 | | |
| | 2,000 | | | Miami-Dade County School District, (FSA), 5.375%, 8/1/15 | | | 2,233,120 | | |
| | 750 | | | New York, NY, (FGIC), 5.50%, 6/1/12 | | | 833,370 | | |
| | 1,000 | | | Puerto Rico, (MBIA), 5.50%, 7/1/18 | | | 1,148,040 | | |
Principal Amount
(000's omitted) | |
Security | |
Value | |
| Insured-General Obligations (continued) | | | | | |
| $ | 1,000 | | | Reedy Creek Improvements District, (MBIA),
5.00%, 6/1/17 | | $ | 1,064,460 | | |
| | | | | | | $ | 8,337,322 | | |
| Insured-Hospital - 3.5% | | | | | |
| $ | 750 | | | Miami-Dade County, Health Facilities Authority, (Miami
Children's Hospital), (AMBAC), 5.625%, 8/15/16 | | $ | 826,725 | | |
| | 1,000 | | | Saint Petersburg Health Facilities Authority, (All Children's
Hospital), (AMBAC), 5.50%, 11/15/17 | | | 1,080,950 | | |
| | 500 | | | Sarasota County Public Hospital, (MBIA), 5.25%, 7/1/18 | | | 546,770 | | |
| | | | | | | $ | 2,454,445 | | |
| Insured-Housing - 1.9% | | | | | |
| $ | 675 | | | Florida Housing Finance Authority, (Leigh Meadows
Apartments), (AMBAC), (AMT), 5.85%, 9/1/10 | | $ | 698,719 | | |
| | 630 | | | Florida Housing Finance Authority, (Stottert Arms
Apartments), (AMBAC), (AMT), 5.90%, 9/1/10 | | | 652,516 | | |
| | | | | | | $ | 1,351,235 | | |
| Insured-Miscellaneous - 5.4% | | | | | |
| $ | 500 | | | Florida Board of Education Lottery Revenue, (FGIC),
5.00%, 7/1/20 | | $ | 522,900 | | |
| | 1,100 | | | Florida Board of Education Lottery Revenue, (FGIC),
5.25%, 7/1/20 | | | 1,177,011 | | |
| | 1,500 | | | Jacksonville Entitlement Revenue, (Public Improvements),
(FGIC), 5.00%, 10/1/21 | | | 1,564,755 | | |
| | 500 | | | Saint Johns County IDA, (Professional Golf Hall of Fame),
(MBIA), 5.00%, 9/1/20 | | | 523,105 | | |
| | | | | | | $ | 3,787,771 | | |
| Insured-Solid Waste - 3.5% | | | | | |
| $ | 1,750 | | | Dade County, Resource Recovery Facilities, (AMBAC),
(AMT), 5.30%, 10/1/07 | | $ | 1,837,447 | | |
| | 1,100 | | | Palm Beach Solid Waste Authority, (AMBAC),
0.00%, 10/1/16 | | | 651,640 | | |
| | | | | | | $ | 2,489,087 | | |
| Insured-Special Tax Revenue - 10.7% | | | | | |
| $ | 1,755 | | | Julington Creek Plantation Community Development District,
(MBIA), 4.75%, 5/1/19 | | $ | 1,794,540 | | |
| | 2,000 | | | Miami-Dade County Professional Sports Franchise Facilities,
(MBIA), 0.00%, 10/1/13 | | | 1,394,820 | | |
| | 330 | | | Miami-Dade County, (MBIA), 0.00%, 10/1/08 | | | 292,918 | | |
| | 1,760 | | | Osceola County Sales Tax, (FSA), 5.00%, 4/1/19 | | | 1,843,019 | | |
| | 770 | | | Seminole County Sales Tax, (FGIC), 5.375%, 10/1/19 | | | 837,182 | | |
See notes to financial statements
24
Eaton Vance Florida Limited Maturity Municipals Fund as of March 31, 2005
PORTFOLIO OF INVESTMENTS CONT'D
Principal Amount
(000's omitted) | |
Security | |
Value | |
| Insured-Special Tax Revenue (continued) | | | | | |
| $ | 595 | | | St. Cloud, Sales Tax, (FGIC), 5.00%, 9/1/18 | | $ | 626,214 | | |
| | 250 | | | St. Cloud, Sales Tax, (FGIC), 5.00%, 9/1/19 | | | 262,180 | | |
| | 500 | | | Tamarac, Sales Tax, (FGIC), 5.00%, 4/1/18 | | | 525,685 | | |
| | | | | | | $ | 7,576,558 | | |
| Insured-Transportation - 14.5% | | | | | |
| $ | 1,000 | | | Broward County Airport System, (MBIA), (AMT),
5.375%, 10/1/13 | | $ | 1,062,970 | | |
| | 1,000 | | | Canaveral Port Authority Improvements, (FGIC),
5.00%, 6/1/19 | | | 1,048,130 | | |
| | 1,750 | | | Dade County, Seaport, (MBIA), 5.125%, 10/1/16(1) | | | 1,835,628 | | |
| | 1,500 | | | Miami-Dade County, Expressway Toll Authority, (FGIC),
5.25%, 7/1/15 | | | 1,643,085 | | |
| | 4,000 | | | Puerto Rico Highway and Transportation Authority, (MBIA),
5.50%, 7/1/19 | | | 4,606,600 | | |
| | | | | | | $ | 10,196,413 | | |
| Insured-Water and Sewer - 18.6% | | | | | |
| $ | 2,260 | | | Boynton Beach Utility System, (FGIC), 5.50%, 11/1/17 | | $ | 2,574,502 | | |
| | 500 | | | Dade County, Water and Sewer System, (FGIC),
5.25%, 10/1/21 | | | 525,540 | | |
| | 750 | | | Hillsborough County, Capacity Assessment, (FSA),
5.125%, 3/1/20 | | | 794,535 | | |
| | 1,500 | | | Marco Island Utility System, (MBIA), 5.25%, 10/1/16 | | | 1,633,980 | | |
| | 2,000 | | | Seacoast Utilities Authority Water and Sewer, (FGIC),
5.50%, 3/1/16 | | | 2,258,460 | | |
| | 1,320 | | | Sebring Water and Wastewater, (FGIC), 5.25%, 1/1/15 | | | 1,436,279 | | |
| | 1,000 | | | Sunrise Utilities Systems, (AMBAC), 5.20%, 10/1/22 | | | 1,090,700 | | |
| | 1,000 | | | Sunrise Utilities Systems, (AMBAC), 5.50%, 10/1/18 | | | 1,128,070 | | |
| | 1,000 | | | Tallahassee, Consolidated Utilities System, (FGIC),
5.50%, 10/1/18 | | | 1,137,910 | | |
| | 500 | | | Tallahassee, Consolidated Utilities System, (FGIC),
5.50%, 10/1/19 | | | 569,765 | | |
| | | | | | | $ | 13,149,741 | | |
| Nursing Home - 1.2% | | | | | |
| $ | 555 | | | Okaloosa County, Retirement Rental Housing, (Encore
Retirement Partners), 6.125%, 2/1/14 | | $ | 500,305 | | |
| | 385 | | | Orange County, Health Facilities Authority, (Westminister
Community Care Services), 6.50%, 4/1/12 | | | 361,145 | | |
| | | | | | | $ | 861,450 | | |
| Senior Living / Life Care - 1.5% | | | | | |
| $ | 250 | | | Lee County IDA, (Shell Point Village), 5.50%, 11/15/21 | | $ | 252,163 | | |
| | 250 | | | Lee County IDA, (Shell Point Village), 5.75%, 11/15/14 | | | 259,208 | | |
Principal Amount
(000's omitted) | |
Security | |
Value | |
| | Senior Living / Life Care (continued) | | | | | | | | |
| $ | 590 | | | North Miami HFA, (Imperial Club), 6.75%, 1/1/33 | | $ | 543,561 | | |
| | | | | | | $ | 1,054,932 | | |
| | Special Tax Revenue - 6.5% | | | | | | | | |
| $ | 500 | | | Concorde Estates Community Development District,
Capital Improvements, 5.00%, 5/1/11 | | $ | 500,110 | | |
| | 300 | | | Fishhawk Community Development District II, 5.00%, 11/1/07 | | | 304,017 | | |
| | 400 | | | Fishhawk Community Development District ll,
5.125%, 11/1/09 | | | 403,784 | | |
| | 425 | | | Gateway Services Community Development District,
(Stoneybrook), 5.50%, 7/1/08 | | | 432,195 | | |
| | 380 | | | Heritage Harbour South Community Development District,
(Capital Improvements), 5.25%, 11/1/08 | | | 382,421 | | |
| | 210 | | | Heritage Harbour South Community Development District,
(Capital Improvements), 5.40%, 11/1/08 | | | 211,880 | | |
| | 105 | | | Heritage Palms Community Development District,
Capital Improvements, 6.25%, 11/1/07 | | | 105,740 | | |
| | 125 | | | Longleaf Community Development District, 6.20%, 5/1/09 | | | 121,054 | | |
| | 355 | | | North Springs, Improvement District, (Heron Bay),
7.00%, 5/1/19 | | | 367,979 | | |
| | 1,000 | | | Orlando Capital Improvements, 5.00%, 10/1/18 | | | 1,047,910 | | |
| | 650 | | | Sterling Hill Community Development District, Capital
Improvements, 5.50%, 11/1/10 | | | 660,413 | | |
| | 55 | | | Waterlefe Community Development District, Capital
Improvements, 6.25%, 5/1/10 | | | 55,529 | | |
| | | | | | | $ | 4,593,032 | | |
| | Transportation - 2.0% | | | | | | | | |
| $ | 1,340 | | | Florida Turnpike Authority, 5.25%, 7/1/21 | | $ | 1,432,299 | | |
| | | | | | | $ | 1,432,299 | | |
| | Utilities - 3.2% | | | | | | | | |
| $ | 240 | | | Orlando Utilities Commission Water and Electric,
5.00%, 10/1/18 | | $ | 252,636 | | |
| | 750 | | | Orlando Utilities Commission Water and Electric,
5.00%, 10/1/22 | | | 780,428 | | |
| | 1,100 | | | Orlando Water and Electric Utilities Commission,
5.25%, 10/1/20 | | | 1,182,467 | | |
| | | | | | | $ | 2,215,531 | | |
| | Total Tax-Exempt Investments - 99.4%
(identified cost $68,205,577) | | | | | $ | 70,093,542 | | |
| | Other Assets, Less Liabilities - 0.6% | | | | | $ | 454,168 | | |
| | Net Assets - 100.0% | | | | | $ | 70,547,710 | | |
See notes to financial statements
25
Eaton Vance Florida Limited Maturity Municipals Fund as of March 31, 2005
PORTFOLIO OF INVESTMENTS CONT'D
AMBAC - AMBAC Financial Group, Inc.
AMT - Interest earned from these securities may be considered a tax preference item for purposes of the Federal Alternative Minimum Tax.
FGIC - Financial Guaranty Insurance Company
FSA - Financial Security Assurance, Inc.
MBIA - Municipal Bond Insurance Association
XLCA - XL Capital Assurance, Inc.
The Fund invests primarily in debt securities issued by Florida municipalities. The ability of the issuers of the debt securities to meet their obligations may be affected by economic developments in a specific industry or municipality. In order to reduce the risk associated with such economic developments, at March 31, 2005, 80.1% of the securities in the portfolio of investments are backed by bond insurance of various financial institutions and financial guaranty assurance agencies. The aggregate percentage insured by an individual financial institution ranged from 2.3% to 29.6% of total investments.
(1) Security (or a portion thereof) has been segregated to cover margin requirements on open financial futures contracts.
See notes to financial statements
26
Eaton Vance Massachusetts Limited Maturity Municipals Fund as of March 31, 2005
PORTFOLIO OF INVESTMENTS
Tax-Exempt Investments - 99.7% | | | | | |
Principal Amount
(000's omitted) | |
Security | |
Value | |
| Education - 14.7% | | | | | |
| $ | 580 | | | Massachusetts Development Finance Agency,
(Massachusetts College of Pharmacy), 5.00%, 7/1/11 | | $ | 603,299 | | |
| | 1,000 | | | Massachusetts Development Finance Agency,
(Milton Academy), 5.00%, 9/1/19 | | | 1,058,450 | | |
| | 400 | | | Massachusetts Development Finance Agency,
(Xaverian Brothers High School), 5.55%, 7/1/19 | | | 414,868 | | |
| | 1,000 | | | Massachusetts HEFA, (Boston College), 5.00%, 6/1/11 | | | 1,073,610 | | |
| | 1,305 | | | Massachusetts HEFA, (Boston College), 5.25%, 6/1/20 | | | 1,385,388 | | |
| | 1,000 | | | Massachusetts HEFA, (Boston College), 5.375%, 6/1/14 | | | 1,106,860 | | |
| | 1,000 | | | Massachusetts HEFA, (Harvard University), 5.00%, 7/15/22 | | | 1,043,660 | | |
| | 1,000 | | | Massachusetts HEFA, (Massachusetts Institute of Technology),
5.00%, 7/1/18 | | | 1,093,920 | | |
| | 1,000 | | | Massachusetts HEFA, (Massachusetts Institute of Technology),
5.375%, 7/1/17 | | | 1,133,630 | | |
| | 750 | | | Massachusetts HEFA, (Tufts University), 5.50%, 8/15/15 | | | 845,587 | | |
| | 1,125 | | | Massachusetts IFA, (Babson College), 5.375%, 10/1/17 | | | 1,173,330 | | |
| | 500 | | | Massachusetts IFA, (Belmont Hill School), 5.15%, 9/1/13 | | | 519,860 | | |
| | 750 | | | Massachusetts IFA, (St. Johns High School, Inc.),
5.70%, 6/1/18 | | | 778,605 | | |
| | 500 | | | Massachusetts IFA, (Wentworth Institute of Technology),
5.55%, 10/1/13 | | | 527,890 | | |
| | | | | | | $ | 12,758,957 | | |
| Electric Utilities - 0.6% | | | | | |
| $ | 500 | | | Massachusetts Development Finance Agency,
(Devens Electric System), 5.75%, 12/1/20 | | $ | 531,525 | | |
| | | | | | | $ | 531,525 | | |
| Escrowed / Prerefunded - 7.6% | | | | | |
| $ | 500 | | | Massachusetts HEFA, (Dana Farber Cancer Institute),
Escrowed to Maturity, 6.50%, 12/1/05 | | $ | 513,215 | | |
| | 485 | | | Massachusetts IFA, (Dana Hall), Prerefunded to 7/1/07,
5.90%, 7/1/27 | | | 523,819 | | |
| | 1,030 | | | Massachusetts IFA, (Park School), Prerefunded to 9/1/06,
5.50%, 9/1/16 | | | 1,080,377 | | |
| | 1,000 | | | Massachusetts Turnpike Authority, Escrowed to Maturity,
5.00%, 1/1/13 | | | 1,071,180 | | |
| | 2,100 | | | Massachusetts Turnpike Authority, Escrowed to Maturity,
5.00%, 1/1/20(1) | | | 2,252,292 | | |
| | 680 | | | Massachusetts Water Pollution Abatement Trust,
Escrowed to Maturity, 5.25%, 8/1/14 | | | 746,130 | | |
| | 400 | | | Rail Connections, Inc., (Rte. 128 Parking Garage),
Escrowed to Maturity, 5.30%, 7/1/09 | | | 433,192 | | |
| | | | | | | $ | 6,620,205 | | |
Principal Amount
(000's omitted) | |
Security | |
Value | |
| | General Obligations - 8.8% | | | | | | | | |
| $ | 1,000 | | | Boston, 5.00%, 2/1/18 | | $ | 1,050,610 | | |
| | 500 | | | Burlington, 5.00%, 2/1/15 | | | 542,495 | | |
| | 500 | | | Burlington, 5.00%, 2/1/16 | | | 542,435 | | |
| | 750 | | | Falmouth, 5.25%, 2/1/16 | | | 813,682 | | |
| | 2,000 | | | Massachusetts, 5.25%, 8/1/16 | | | 2,192,440 | | |
| | 1,100 | | | Wellesley, 5.00%, 6/1/16 | | | 1,209,164 | | |
| | 1,150 | | | Wellesley, 5.00%, 6/1/17 | | | 1,263,942 | | |
| | | | | | | $ | 7,614,768 | | |
| | Health Care-Miscellaneous - 0.4% | | | | | | | | |
| $ | 165 | | | Massachusetts Development Finance Agency, (MCHSP
Human Services), 6.60%, 8/15/29 | | $ | 159,558 | | |
| | 225 | | | Massachusetts Development Finance Agency,
(New England Center for Children), 5.30%, 11/1/08 | | | 229,268 | | |
| | | | | | | $ | 388,826 | | |
| | Hospital - 4.6% | | | | | | | | |
| $ | 600 | | | Massachusetts HEFA, (Baystate Medical Center),
5.75%, 7/1/14 | | $ | 649,962 | | |
| | 865 | | | Massachusetts HEFA, (Baystate Medical Center),
5.75%, 7/1/15 | | | 932,020 | | |
| | 245 | | | Massachusetts HEFA, (Berkshire Health System),
4.50%, 10/1/05 | | | 245,588 | | |
| | 795 | | | Massachusetts HEFA, (Central New England Health
Systems), 6.125%, 8/1/13 | | | 795,183 | | |
| | 250 | | | Massachusetts HEFA, (Partners Healthcare System),
5.00%, 7/1/09 | | | 264,880 | | |
| | 1,000 | | | Massachusetts HEFA, (Partners Healthcare System),
5.50%, 7/1/10 | | | 1,092,590 | | |
| | | | | | | $ | 3,980,223 | | |
| | Insured-Education - 3.3% | | | | | | | | |
| $ | 1,560 | | | Massachusetts College Building Authority, (XLCA),
5.375%, 5/1/14 | | $ | 1,722,224 | | |
| | 1,000 | | | University of Massachusetts Building Authority, (AMBAC),
5.25%, 11/1/13 | | | 1,101,320 | | |
| | | | | | | $ | 2,823,544 | | |
| | Insured-Electric Utilities - 8.5% | | | | | | | | |
| $ | 2,120 | | | Massachusetts Municipal Wholesale Electric Co., (MBIA),
5.25%, 7/1/12 | | $ | 2,315,188 | | |
| | 1,000 | | | Massachusetts Power Supply System, (Municipal Wholesale
Electric Co.), (MBIA), 5.25%, 7/1/13 | | | 1,088,330 | | |
| | 1,500 | | | Puerto Rico Electric Power Authority, (MBIA), 5.50%, 7/1/16 | | | 1,708,710 | | |
See notes to financial statements
27
Eaton Vance Massachusetts Limited Maturity Municipals Fund as of March 31, 2005
PORTFOLIO OF INVESTMENTS CONT'D
Principal Amount
(000's omitted) | |
Security | |
Value | |
| Insured-Electric Utilities (continued) | | | | | |
| $ | 2,000 | | | Puerto Rico Electric Power Authority, (MBIA), 5.50%, 7/1/18 | | $ | 2,296,080 | | |
| | | | | | | $ | 7,408,308 | | |
| Insured-Escrowed / Prerefunded - 1.6% | | | | | |
| $ | 400 | | | Massachusetts Turnpike Authority, Escrowed to Maturity,
(FGIC), 5.125%, 1/1/23 | | $ | 433,944 | | |
| | 850 | | | Route 3 North Transportation Improvements Association,
(MBIA), Prerefunded to 6/15/10, 5.625%, 6/15/21 | | | 940,856 | | |
| | | | | | | $ | 1,374,800 | | |
| Insured-General Obligations - 17.7% | | | | | |
| $ | 1,000 | | | Boston, (MBIA), 5.00%, 2/1/19 | | $ | 1,053,600 | | |
| | 2,000 | | | Dudley-Charlton Regional School District, (FGIC),
5.125%, 6/15/13 | | | 2,192,440 | | |
| | 1,000 | | | Fall River, (FSA), 5.25%, 2/1/14 | | | 1,104,980 | | |
| | 780 | | | Groton-Dunstable Regional School District, (FSA),
5.00%, 10/15/17 | | | 828,415 | | |
| | 750 | | | Haverhill, (FGIC), 5.00%, 6/15/17 | | | 783,278 | | |
| | 1,035 | | | Lancaster, (AMBAC), 5.375%, 4/15/15 | | | 1,137,051 | | |
| | 750 | | | Lawrence, (MBIA), 5.00%, 3/15/13 | | | 814,583 | | |
| | 1,000 | | | Massachusetts, (AMBAC), 5.00%, 7/1/12 | | | 1,080,300 | | |
| | 1,000 | | | Northampton, (MBIA), 5.125%, 10/15/15 | | | 1,100,260 | | |
| | 1,095 | | | Puerto Rico Public Improvements, (XLCA), 5.25%, 7/1/17 | | | 1,219,162 | | |
| | 1,175 | | | Puerto Rico Public Improvements, (XLCA), 5.50%, 7/1/15 | | | 1,327,750 | | |
| | 1,000 | | | Randolph, (AMBAC), 5.00%, 9/1/15 | | | 1,089,780 | | |
| | 500 | | | Springfield, (MBIA), 5.25%, 1/15/15 | | | 547,045 | | |
| | 1,000 | | | Worcester, (MBIA), 5.25%, 8/15/17 | | | 1,100,040 | | |
| | | | | | | $ | 15,378,684 | | |
| Insured-Hospital - 1.2% | | | | | |
| $ | 1,000 | | | Massachusetts HEFA, (New England Medical Center Hospital),
(FGIC), 5.375%, 5/15/15 | | $ | 1,077,690 | | |
| | | | | | | $ | 1,077,690 | | |
| Insured-Miscellaneous - 0.9% | | | | | |
| $ | 750 | | | Boston Convention Center Act 1997, (AMBAC),
5.00%, 5/1/16 | | $ | 793,230 | | |
| | | | | | | $ | 793,230 | | |
| Insured-Solid Waste - 2.5% | | | | | |
| $ | 1,000 | | | Massachusetts Development Finance Agency, (Semass
System), (MBIA), 5.625%, 1/1/13 | | $ | 1,106,950 | | |
| | 1,000 | | | Massachusetts Development Finance Agency, (Semass
System), (MBIA), 5.625%, 1/1/16 | | | 1,089,560 | | |
| | | | | | | $ | 2,196,510 | | |
Principal Amount
(000's omitted) | |
Security | |
Value | |
| Insured-Special Tax Revenue - 0.5% | | | | | |
| $ | 400 | | | Virgin Islands Public Financing Authority, (FSA),
5.00%, 10/1/13 | | $ | 435,952 | | |
| | | | | | | $ | 435,952 | | |
| Insured-Transportation - 9.4% | | | | | |
| $ | 1,630 | | | Massachusetts Bay Transportation Authority, (General
Transportation System), (MBIA), 5.50%, 3/1/14 | | $ | 1,825,812 | | |
| | 500 | | | Massachusetts Port Authority, (Delta Airlines), (AMBAC),
(AMT), 5.50%, 1/1/15 | | | 531,400 | | |
| | 1,225 | | | Massachusetts Port Authority, (FSA), 5.125%, 7/1/17 | | | 1,294,115 | | |
| | 1,500 | | | Massachusetts State Federal Highway Grant Anticipation Notes,
(FSA), 5.50%, 12/15/13 | | | 1,680,090 | | |
| | 1,000 | | | Puerto Rico Commonwealth Highway and Transportation
Authority, (FSA), 5.50%, 7/1/11 | | | 1,113,420 | | |
| | 500 | | | Puerto Rico Commonwealth Highway and Transportation
Authority, (FSA), 5.50%, 7/1/17 | | | 572,825 | | |
| | 1,000 | | | Puerto Rico Highway and Transportation Authority (CIFG),
5.50%, 7/1/15 | | | 1,130,000 | | |
| | | | | | | $ | 8,147,662 | | |
| Insured-Water Revenue - 1.9% | | | | | |
| $ | 1,500 | | | Massachusetts Water Resource Authority, (FSA),
5.25%, 8/1/11 | | $ | 1,641,375 | | |
| | | | | | | $ | 1,641,375 | | |
| Lease Revenue / Certificates of Participation - 1.3% | | | | | |
| $ | 1,130 | | | Puerto Rico, ITEM & ECFA, (Guaynabo Municipal Government),
5.375%, 7/1/06 | | $ | 1,150,623 | | |
| | | | | | | $ | 1,150,623 | | |
| Miscellaneous - 1.7% | | | | | |
| $ | 1,000 | | | Massachusetts Development Finance Agency,
(Jewish Philanthropies), 5.25%, 2/1/22 | | $ | 1,073,100 | | |
| | 350 | | | Massachusetts Development Finance Agency,
(YMCA of Greater Boston), 5.25%, 11/1/13 | | | 361,512 | | |
| | | | | | | $ | 1,434,612 | | |
| Nursing Home - 1.2% | | | | | |
| $ | 375 | | | Massachusetts Development Finance Agency,
(Odd Fellows Home of Massachusetts), 6.25%, 1/1/15 | | $ | 349,796 | | |
| | 515 | | | Massachusetts HEFA, (Christopher House), 6.25%, 1/1/07 | | | 521,221 | | |
| | 175 | | | Massachusetts IFA, (Age Institute of Massachusetts),
7.60%, 11/1/05 | | | 175,072 | | |
| | | | | | | $ | 1,046,089 | | |
See notes to financial statements
28
Eaton Vance Massachusetts Limited Maturity Municipals Fund as of March 31, 2005
PORTFOLIO OF INVESTMENTS CONT'D
Principal Amount
(000's omitted) | |
Security | |
Value | |
| | Senior Living / Life Care - 1.2% | | | | | | | | |
| $ | 600 | | | Massachusetts Development Finance Agency,
(Berkshire Retirement), 5.60%, 7/1/19 | | $ | 593,736 | | |
| | 485 | | | Massachusetts IFA, (Forge Hill), (AMT), 6.75%, 4/1/30 | | | 457,724 | | |
| | | | | | | $ | 1,051,460 | | |
| | Solid Waste - 1.2% | | | | | | | | |
| $ | 1,000 | | | Massachusetts IFA, (Ogden Haverhill), (AMT),
5.50%, 12/1/13 | | $ | 1,019,790 | | |
| | | | | | | $ | 1,019,790 | | |
| | Special Tax Revenue - 4.2% | | | | | | | | |
| $ | 750 | | | Massachusetts Bay Transportation Authority, Sales Tax,
5.25%, 7/1/16 | | $ | 829,560 | | |
| | 1,000 | | | Massachusetts Bay Transportation Authority, Sales Tax,
5.25%, 7/1/16 | | | 1,106,080 | | |
| | 1,000 | | | Massachusetts Bay Transportation Authority, Sales Tax,
5.50%, 7/1/17 | | | 1,131,120 | | |
| | 500 | | | Massachusetts Special Obligations, 5.00%, 6/1/14 | | | 539,145 | | |
| | | | | | | $ | 3,605,905 | | |
| | Transportation - 2.7% | | | | | | | | |
| $ | 1,000 | | | Massachusetts Port Authority, (AMT), 6.25%, 7/1/17 | | $ | 1,079,660 | | |
| | 2,000 | | | Massachusetts State Federal Highway Grant Anticipation Notes,
0.00%, 6/15/15 | | | 1,276,320 | | |
| | | | | | | $ | 2,355,980 | | |
| | Water and Sewer - 2.0% | | | | | | | | |
| $ | 1,595 | | | Massachusetts Water Pollution Abatement Trust,
0.00%, 8/1/12 | | $ | 1,189,280 | | |
| | 500 | | | Massachusetts Water Pollution Abatement Trust,
5.25%, 2/1/12 | | | 545,615 | | |
| | | | | | | $ | 1,734,895 | | |
| | Total Tax-Exempt Investments - 99.7%
(identified cost $84,177,849) | | | | | $ | 86,571,613 | | |
| | Other Assets, Less Liabilities - 0.3% | | | | | $ | 269,262 | | |
| | Net Assets - 100.0% | | | | | $ | 86,840,875 | | |
AMBAC - AMBAC Financial Group, Inc.
AMT - Interest earned from these securities may be considered a tax preference item for purposes of the Federal Alternative Minimum Tax.
CIFG - CDC IXIS Financial Guaranty North America, Inc.
FGIC - Financial Guaranty Insurance Company
FSA - Financial Security Assurance, Inc.
MBIA - Municipal Bond Insurance Association
XLCA - XL Capital Assurance, Inc.
The Fund invests primarily in debt securities issued by Massachusetts municipalities. The ability of the issuers of the debt securities to meet their obligations may be affected by economic developments in a specific industry or municipality. In order to reduce the risk associated with such economic developments, at March 31, 2005, 47.7% of the securities in the portfolio of investments are backed by bond insurance of various financial institutions and financial guaranty assurance agencies. The aggregate percentage insured by an individual financial institution ranged from 1.3% to 19.6% of total investments.
(1) Security (or a portion thereof) has been segregated to cover margin requirements on open financial futures contracts.
See notes to financial statements
29
Eaton Vance New Jersey Limited Maturity Municipals Fund as of March 31, 2005
PORTFOLIO OF INVESTMENTS
Tax-Exempt Investments - 97.8% | | | | | |
Principal Amount
(000's omitted) | |
Security | |
Value | |
| Education - 2.7% | | | | | |
| $ | 750 | | | New Jersey Educational Facilities Authority,
(Stevens Institute of Technology), 5.00%, 7/1/11 | | $ | 792,982 | | |
| | 600 | | | New Jersey Educational Facility Authority, (Higher Education
Capital Improvements), 5.00%, 9/1/15 | | | 633,576 | | |
| | | | | | | $ | 1,426,558 | | |
| Electric Utilities - 0.8% | | | | | |
| $ | 420 | | | New Jersey Economic Development Authority PCR,
(PSEG Power), 5.00%, 3/1/12 | | $ | 444,520 | | |
| | | | | | | $ | 444,520 | | |
| Escrowed / Prerefunded - 4.3% | | | | | |
| $ | 350 | | | New Jersey EDA, (Kapkowski Road Landfill),
Prerefunded to 5/15/14, 6.375%, 4/1/18 | | $ | 417,571 | | |
| | 2,030 | | | New Jersey EDA, (Principal Custodial Receipts),
Escrowed to Maturity, 0.00%, 12/15/12 | | | 1,491,461 | | |
| | 300 | | | New Jersey EDA, (The Seeing Eye, Inc.),
Prerefunded to 12/1/09, 6.20%, 12/1/24 | | | 329,691 | | |
| | | | | | | $ | 2,238,723 | | |
| General Obligations - 5.9% | | | | | |
| $ | 500 | | | Jersey City School District, 6.25%, 10/1/10 | | $ | 566,515 | | |
| | 500 | | | New Jersey, 4.50%, 2/1/18 | | | 503,210 | | |
| | 1,050 | | | Puerto Rico, 0.00%, 7/1/08 | | | 943,740 | | |
| | 1,000 | | | Union County, (General Improvements), 5.00%, 3/1/17 | | | 1,054,800 | | |
| | | | | | | $ | 3,068,265 | | |
| Hospital - 5.3% | | | | | |
| $ | 500 | | | New Jersey Health Care Facilities Financing Authority,
(Atlantic City Medical Care Center), 6.00%, 7/1/12 | | $ | 556,870 | | |
| | 450 | | | New Jersey Health Care Facilities Financing Authority,
(Hackensack University Medical Center), 6.125%, 1/1/20 | | | 485,267 | | |
| | 500 | | | New Jersey Health Care Facilities Financing Authority,
(Robert Wood Johnson University Hospital),
5.60%, 7/1/15 | | | 534,705 | | |
| | 425 | | | New Jersey Health Care Facilities Financing Authority,
(Saint Peters University Hospital), 6.875%, 7/1/20 | | | 473,267 | | |
| | 680 | | | New Jersey Health Care Facilities Financing Authority,
(St. Elizabeth's Hospital), 5.75%, 7/1/08 | | | 703,718 | | |
| | | | | | | $ | 2,753,827 | | |
Principal Amount
(000's omitted) | |
Security | |
Value | |
| Industrial Development Revenue - 2.1% | | | | | |
| $ | 350 | | | New Jersey EDA, (American Airlines), (AMT),
7.10%, 11/1/31 | | $ | 248,136 | | |
| | 450 | | | New Jersey EDA, (Continental Airlines), (AMT),
6.25%, 9/15/19 | | | 370,346 | | |
| | 500 | | | New Jersey EDA, (Holt Hauling), 7.90%, 3/1/27(1) | | | 477,965 | | |
| | | | | | | $ | 1,096,447 | | |
| Insured-Education - 2.8% | | | | | |
| $ | 900 | | | New Jersey Educational Facilities Authority,
(Ramapo College), (AMBAC), 4.60%, 7/1/14 | | $ | 934,344 | | |
| | 500 | | | University of New Jersey Medicine and Dentistry, (AMBAC),
5.375%, 12/1/13 | | | 548,405 | | |
| | | | | | | $ | 1,482,749 | | |
| Insured-Electric Utilities - 5.0% | | | | | |
| $ | 560 | | | Cape May County Industrial Pollution Control Financing Authority,
(Atlantic City Electric Co,), (MBIA), 6.80%, 3/1/21 | | $ | 717,203 | | |
| | 730 | | | Puerto Rico Electric Power Authority, (XLCA), 5.00%, 7/1/11 | | | 790,313 | | |
| | 1,000 | | | Puerto Rico Electric Power Authority, (XLCA),
5.375%, 7/1/18 | | | 1,126,550 | | |
| | | | | | | $ | 2,634,066 | | |
| Insured-Escrowed / Prerefunded - 4.7% | | | | | |
| $ | 1,000 | | | New Jersey Economic Development Authority, (School Facility),
(AMBAC), Prerefunded to 6/15/11, 5.25%, 6/15/16 | | $ | 1,094,120 | | |
| | 1,300 | | | Washington Township Board of Education, (MBIA),
Prerefunded to 2/01/07, 5.125%, 2/1/15 | | | 1,352,598 | | |
| | | | | | | $ | 2,446,718 | | |
| Insured-General Obligations - 18.5% | | | | | |
| $ | 330 | | | Clearview Regional High School District, (FGIC),
5.375%, 8/1/15 | | $ | 365,396 | | |
| | 320 | | | Egg Harbor Township School District, (FSA), 5.50%, 7/15/19 | | | 364,150 | | |
| | 750 | | | Freehold Regional High School District, (FGIC),
5.00%, 3/1/18 | | | 821,483 | | |
| | 720 | | | Hillsborough Township School District, (FSA),
5.375%, 10/1/18 | | | 818,863 | | |
| | 750 | | | Hunterdon Central Regional High School District, (FSA),
4.75%, 5/1/12 | | | 803,580 | | |
| | 1,065 | | | Manalapan-Englishtown Regional Board of Education, (FGIC),
5.50%, 12/1/16 | | | 1,200,521 | | |
| | 725 | | | Monroe Township Board of Education, (FGIC), 5.20%, 8/1/11 | | | 796,036 | | |
| | 825 | | | Monroe Township Board of Education, (FGIC), 5.20%, 8/1/14 | | | 908,325 | | |
| | 845 | | | Montville Township School District, (FGIC), 5.00%, 7/15/17 | | | 917,366 | | |
| | 700 | | | Montville Township, (AMBAC), 4.20%, 8/1/12 | | | 718,375 | | |
See notes to financial statements
30
Eaton Vance New Jersey Limited Maturity Municipals Fund as of March 31, 2005
PORTFOLIO OF INVESTMENTS CONT'D
Principal Amount
(000's omitted) | |
Security | |
Value | |
| | Insured-General Obligations (continued) | | | | | | | | |
| $ | 255 | | | Ocean Township Board of Education, (FGIC),
4.50%, 8/1/12 | | $ | 270,644 | | |
| | 1,000 | | | Puerto Rico Public Improvements, (CIFG), 5.25%, 7/1/17 | | | 1,113,390 | | |
| | 500 | | | Puerto Rico Public Improvements, (XLCA), 5.25%, 7/1/17 | | | 556,695 | | |
| | | | | | | $ | 9,654,824 | | |
| | Insured-Hospital - 2.8% | | | | | | | | |
| $ | 1,300 | | | New Jersey Health Care Facilities Financing Authority,
(AHS Hospital Corp.), (AMBAC), 6.00%, 7/1/12(2) | | $ | 1,482,767 | | |
| | | | | | | $ | 1,482,767 | | |
| | Insured-Housing - 1.9% | | | | | | | | |
| $ | 1,000 | | | New Jersey Housing and Mortgage Finance Agency,
(FGIC), 4.50%, 11/1/19 | | $ | 985,250 | | |
| | | | | | | $ | 985,250 | | |
| | Insured-Lease Revenue / Certificates of
Participation - 3.8% | | | | | | | | |
| $ | 1,000 | | | Hudson County, (MBIA), 6.25%, 6/1/15 | | $ | 1,169,770 | | |
| | 710 | | | Puerto Rico Public Finance Corp., (AMBAC), 5.375%, 6/1/17 | | | 804,380 | | |
| | | | | | | $ | 1,974,150 | | |
| | Insured-Nursing Home - 0.8% | | | | | | | | |
| $ | 400 | | | Rahway Geriatrics Center Inc., (MBIA), 5.25%, 5/1/15 | | $ | 438,428 | | |
| | | | | | | $ | 438,428 | | |
| | Insured-Other Revenue - 4.2% | | | | | | | | |
| $ | 500 | | | Monmouth County Improvements Authority, (AMBAC),
5.00%, 12/1/11 | | $ | 541,845 | | |
| | 1,000 | | | Monmouth County Improvements Authority, (AMBAC),
5.25%, 12/1/16 | | | 1,092,220 | | |
| | 500 | | | Trenton Parking Authority, (FGIC), 5.125%, 4/1/12 | | | 538,860 | | |
| | | | | | | $ | 2,172,925 | | |
| | Insured-Special Tax Revenue - 2.1% | | | | | | | | |
| $ | 1,000 | | | New Jersey EDA, (Motor Vehicle Surcharges), (MBIA),
5.25%, 7/1/16 | | $ | 1,092,960 | | |
| | | | | | | $ | 1,092,960 | | |
| | Insured-Transportation - 9.4% | | | | | | | | |
| $ | 1,000 | | | Delaware River Port Authority, (AMBAC), 5.00%, 1/1/16 | | $ | 1,084,340 | | |
| | 1,000 | | | Delaware River Port Authority, (FSA), 5.10%, 1/1/20 | | | 1,056,210 | | |
| | 500 | | | Delaware River Port Authority, (FSA), 5.50%, 1/1/10 | | | 547,390 | | |
Principal Amount
(000's omitted) | |
Security | |
Value | |
| Insured-Transportation (continued) | | | | | |
| $ | 1,000 | | | New Jersey Transportation Trust Fund Authority, (MBIA),
5.50%, 12/15/17 | | $ | 1,125,350 | | |
| | 750 | | | New Jersey Transportation Trust Fund Authority,
(Transportation System), (AMBAC), 5.50%, 12/15/13 | | | 836,528 | | |
| | 250 | | | South Jersey Transportation Authority, (AMBAC),
5.00%, 11/1/18 | | | 263,645 | | |
| | | | | | | $ | 4,913,463 | | |
| Insured-Water and Sewer - 7.5% | | | | | |
| $ | 185 | | | Atlantic Highlands Sewer Authority, (FGIC),
4.125%, 1/1/12 | | $ | 190,263 | | |
| | 1,135 | | | Bayonne Municipal Utilities Authority, (XLCA),
5.25%, 4/1/19 | | | 1,212,486 | | |
| | 420 | | | Musconetcong Sewer Authority, (MBIA), 5.25%, 1/1/13 | | | 461,563 | | |
| | 1,000 | | | North Hudson Sewer Authority, (FGIC), 5.25%, 8/1/16 | | | 1,081,680 | | |
| | 565 | | | Pennsville Sewer Authority, (MBIA), 0.00%, 11/1/16 | | | 336,474 | | |
| | 565 | | | Pennsville Sewer Authority, (MBIA), 0.00%, 11/1/17 | | | 318,208 | | |
| | 565 | | | Pennsville Sewer Authority, (MBIA), 0.00%, 11/1/18 | | | 301,202 | | |
| | | | | | | $ | 3,901,876 | | |
| Lease Revenue / Certificates of Participation - 2.1% | | | | | |
| $ | 1,000 | | | New Jersey EDA, (School Facilities Construction),
5.50%, 9/1/19 | | $ | 1,122,740 | | |
| | | | | | | $ | 1,122,740 | | |
| Nursing Home - 1.0% | | | | | |
| $ | 500 | | | New Jersey EDA, (Masonic Charity Foundation),
4.80%, 6/1/11 | | $ | 523,675 | | |
| | | | | | | $ | 523,675 | | |
| Senior Living / Life Care - 1.1% | | | | | |
| $ | 300 | | | New Jersey EDA, (Fellowship Village), 5.50%, 1/1/18 | | $ | 301,902 | | |
| | 300 | | | New Jersey EDA, (Fellowship Village), 5.50%, 1/1/25 | | | 296,592 | | |
| | | | | | | $ | 598,494 | | |
| Solid Waste - 0.3% | | | | | |
| $ | 170 | | | Atlantic County Utilities Authority, Solid Waste System,
7.00%, 3/1/08 | | $ | 171,717 | | |
| | | | | | | $ | 171,717 | | |
| Special Tax Revenue - 2.1% | | | | | |
| $ | 1,000 | | | New Jersey EDA, (Cigarette Tax), 5.50%, 6/15/16 | | $ | 1,084,610 | | |
| | | | | | | $ | 1,084,610 | | |
See notes to financial statements
31
Eaton Vance New Jersey Limited Maturity Municipals Fund as of March 31, 2005
PORTFOLIO OF INVESTMENTS CONT'D
Principal Amount
(000's omitted) | |
Security | |
Value | |
| Transportation - 4.5% | | | | | |
| $ | 450 | | | Delaware River Joint Toll Bridge Commission, PA,
5.25%, 7/1/15 | | $ | 484,907 | | |
| | 1,000 | | | New Jersey Transportation Trust Fund Authority, Variable Rate,
7.49%, 6/15/17(3)(4) | | | 1,127,450 | | |
| | 700 | | | Port Authority of New York and New Jersey, (AMT),
5.50%, 7/15/12 | | | 742,203 | | |
| | | | | | | $ | 2,354,560 | | |
| Water and Sewer - 2.1% | | | | | |
| $ | 1,000 | | | Ocean County Wastewater Utilities Authority,
5.25%, 1/1/17 | | $ | 1,074,770 | | |
| | | | | | | $ | 1,074,770 | | |
| | Total Tax-Exempt Investments - 97.8%
(identified cost $49,119,652) | | | | | $ | 51,139,082 | | |
| | Other Assets, Less Liabilities - 2.2% | | | | | $ | 1,136,122 | | |
| | Net Assets - 100.0% | | | | | $ | 52,275,204 | | |
AMBAC - AMBAC Financial Group, Inc.
AMT - Interest earned from these securities may be considered a tax preference item for purposes of the Federal Alternative Minimum Tax.
CIFG - CDC IXIS Financial Guaranty North America, Inc.
FGIC - Financial Guaranty Insurance Company
FSA - Financial Security Assurance, Inc.
MBIA - Municipal Bond Insurance Association
XLCA - XL Capital Assurance, Inc.
The Fund invests primarily in debt securities issued by New Jersey municipalities. The ability of the issuers of the debt securities to meet their obligations may be affected by economic developments in a specific industry or municipality. In order to reduce the risk associated with such economic developments, at March 31, 2005, 64.9% of the securities in the portfolio of investments are backed by bond insurance of various financial institutions and financial guaranty assurance agencies. The aggregate percentage insured by an individual financial institution ranged from 2.2% to 18.4% of total investments.
(1) Defaulted bond.
(2) Security (or a portion thereof) has been segregated to cover margin requirements on open financial futures contracts.
(3) Security exempt from registration under Rule 144A of the Securities Act of 1933. These securities may be sold in transactions exempt from registration, normally to qualified institutional buyers. At March 31, 2005, the aggregate value of the securities is $1,127,450 or 2.2% of the Fund's net assets.
(4) Security has been issued as an inverse floater bond. The stated interest rate represents the rate in effect at March 31, 2005.
See notes to financial statements
32
Eaton Vance New York Limited Maturity Municipals Fund as of March 31, 2005
PORTFOLIO OF INVESTMENTS
| Tax-Exempt Investments - 100.1% | | | | | |
Principal Amount
(000's omitted) | | Security | | Value | |
| Cogeneration - 0.5% | | | | | |
| $ | 600 | | | Suffolk County IDA, (Nissequogue Cogeneration
Partners Facility), (AMT), 5.50%, 1/1/23 | | $ | 577,260 | | |
| | | | | | | $ | 577,260 | | |
| Education - 2.3% | | | | | |
| $ | 1,000 | | | New York Dormitory Authority, (Columbia University),
5.125%, 7/1/15 | | $ | 1,083,450 | | |
| | 600 | | | New York Dormitory Authority, (State University
Educational Facilities), 5.25%, 5/15/15 | | | 651,018 | | |
| | 105 | | | New York Dormitory Authority, (State University
Educational Facilities), 5.25%, 5/15/19 | | | 114,784 | | |
| | 625 | | | Troy IDA, (Rensselaer Polytechnic Institute), 5.50%, 9/1/15 | | | 690,750 | | |
| | | | | | | $ | 2,540,002 | | |
| Electric Utilities - 2.2% | | | | | |
| $ | 2,500 | | | New York Energy Research and Development Authority
Facility, (AMT), 4.70%, 6/1/36 | | $ | 2,505,500 | | |
| | | | | | | $ | 2,505,500 | | |
| Escrowed / Prerefunded - 11.0% | | | | | |
| $ | 1,750 | | | Metropolitan Transportation Authority,
Prerefunded to 7/1/15, 5.50%, 7/1/17 | | $ | 1,985,392 | | |
| | 155 | | | New York City Transitional Finance Authority,
Prerefunded to 5/1/08, 5.00%, 5/1/16 | | | 165,735 | | |
| | 2,000 | | | New York Dormitory Authority, (Department of Health),
Prerefunded to 7/1/06, 5.375%, 7/1/08 | | | 2,105,060 | | |
| | 745 | | | New York Environmental Facility Corp., Pollution Control,
(New York City Municipal Water), Escrowed to Maturity,
5.75%, 6/15/10 | | | 832,813 | | |
| | 1,000 | | | New York State Urban Development Corp.,
(Youth Facilities), Prerefunded to 4/1/07, 5.75%, 4/1/10 | | | 1,075,200 | | |
| | 1,000 | | | New York Thruway Authority, Prerefunded to 4/1/06,
5.75%, 4/1/16 | | | 1,050,850 | | |
| | 1,000 | | | New York Urban Development Corp., (Personal Income Tax),
Prerefunded to 3/15/12, 5.375%, 3/15/17 | | | 1,105,040 | | |
| | 1,170 | | | Triborough Bridge and Tunnel Authority, Escrowed to Maturity,
5.00%, 1/1/20 | | | 1,264,150 | | |
| | 1,000 | | | Triborough Bridge and Tunnel Authority, Prerefunded to
1/1/16, 5.375%, 1/1/19 | | | 1,119,580 | | |
| | 500 | | | Triborough Bridge and Tunnel Authority, Prerefunded to
1/1/22, 5.25%, 1/1/28 | | | 554,680 | | |
| | 1,000 | | | Triborough Bridge and Tunnel Authority, Prerefunded to
7/1/09, 5.25%, 1/1/17 | | | 1,087,460 | | |
| | | | | | | $ | 12,345,960 | | |
Principal Amount
(000's omitted) | |
Security | |
Value | |
| | General Obligations - 3.4% | | | | | | | | |
| $ | 1,000 | | | New York City, 0.00%, 8/1/08 | | $ | 894,730 | | |
| | 1,000 | | | New York City, 0.00%, 8/1/08 | | | 894,730 | | |
| | 2,000 | | | New York City, 5.00%, 3/1/19 | | | 2,080,020 | | |
| | | | | | | $ | 3,869,480 | | |
| | Health Care-Miscellaneous - 0.7% | | | | | | | | |
| $ | 310 | | | Suffolk County IDA, (Alliance of Long Island Agencies),
7.50%, 9/1/15 | | $ | 337,134 | | |
| | 400 | | | Westchester County IDA, (Children's Village),
5.375%, 3/15/19 | | | 403,228 | | |
| | | | | | | $ | 740,362 | | |
| | Hospital - 4.9% | | | | | | | | |
| $ | 455 | | | Chautauqua County IDA, (Womans Christian Association),
6.35%, 11/15/17 | | $ | 461,329 | | |
| | 580 | | | Fulton County IDA, (Nathan Littauer Hospital),
5.75%, 11/1/09 | | | 576,746 | | |
| | 225 | | | Nassau County Industrial Development Agency,
(North Shore Health System), 5.875%, 11/1/11 | | | 242,476 | | |
| | 1,000 | | | New York Dormitory Authority, (Child Care Facility),
5.375%, 4/1/14 | | | 1,075,330 | | |
| | 1,200 | | | New York Dormitory Authority, (Lenox Hill Hospital),
5.75%, 7/1/15 | | | 1,283,160 | | |
| | 500 | | | New York Dormitory Authority, (Lenox Hill Hospital),
5.75%, 7/1/17 | | | 529,695 | | |
| | 500 | | | Oneida County IDA, (St. Elizabeth Medical Center),
5.50%, 12/1/10 | | | 502,060 | | |
| | 750 | | | Suffolk County Industrial Development Agency,
(Huntington Hospital), 6.00%, 11/1/22 | | | 793,275 | | |
| | | | | | | $ | 5,464,071 | | |
| | Housing - 0.5% | | | | | | | | |
| $ | 500 | | | New York State Mortgage Agency, (AMT),
5.20%, 10/1/08 | | $ | 514,035 | | |
| | | | | | | $ | 514,035 | | |
| | Industrial Development Revenue - 2.1% | | | | | | | | |
| $ | 1,000 | | | Dutchess County IDA, (IBM), (AMT), Variable Rate,
5.45%, 12/1/29 | | $ | 1,074,540 | | |
| | 250 | | | Onondaga County, IDA, (Senior Air Cargo), (AMT),
6.125%, 1/1/32 | | | 254,910 | | |
| | 1,500 | | | Puerto Rico Port Authority, (American Airlines), (AMT),
6.25%, 6/1/26 | | | 1,055,040 | | |
| | | | | | | $ | 2,384,490 | | |
See notes to financial statements
33
Eaton Vance New York Limited Maturity Municipals Fund as of March 31, 2005
PORTFOLIO OF INVESTMENTS CONT'D
Principal Amount
(000's omitted) | |
Security | |
Value | |
| Insured-Education - 7.4% | | | | | |
| $ | 1,000 | | | New York Dormitory Authority Revenue, (State University
Educational Facilities), (FSA), 5.75%, 5/15/17 | | $ | 1,158,930 | | |
| | 1,000 | | | New York Dormitory Authority, (Canisius College), (MBIA),
5.00%, 7/1/16(1) | | | 1,062,250 | | |
| | 1,455 | | | New York Dormitory Authority, (Mt. Sinai School of
Medicine), (MBIA), 5.25%, 7/1/13 | | | 1,587,521 | | |
| | 1,000 | | | New York Dormitory Authority, (New York University),
(AMBAC), 5.50%, 7/1/19 | | | 1,140,000 | | |
| | 1,000 | | | New York Dormitory Authority, (Student Housing), (FGIC),
5.25%, 7/1/15 | | | 1,097,820 | | |
| | 1,000 | | | New York Dormitory Authority, (University Educational
Facilities), (FGIC), 5.25%, 5/15/13 | | | 1,101,570 | | |
| | 1,000 | | | New York Dormitory, (City University), (AMBAC),
5.625%, 7/1/16 | | | 1,128,180 | | |
| | | | | | | $ | 8,276,271 | | |
| Insured-Electric Utilities - 6.7% | | | | | |
| $ | 500 | | | Long Island Power Authority, Electric System Revenue,
(FSA), 0.00%, 6/1/15 | | $ | 325,335 | | |
| | 500 | | | Long Island Power Authority, Electric System Revenue,
(FSA), 5.00%, 12/1/18 | | | 526,675 | | |
| | 1,000 | | | Long Island Power Authority, Electric System Revenue,
(XLCA), 5.25%, 6/1/14 | | | 1,095,730 | | |
| | 3,625 | | | Puerto Rico Electric Power Authority, (MBIA),
5.50%, 7/1/16 | | | 4,129,382 | | |
| | 1,250 | | | Puerto Rico Electric Power Authority, (XLCA),
5.375%, 7/1/18 | | | 1,408,187 | | |
| | | | | | | $ | 7,485,309 | | |
| Insured-Escrowed / Prerefunded - 8.7% | | | | | |
| $ | 1,000 | | | Long Island Power Authority, Electric System Revenue,
(FSA), Escrowed to Maturity, 5.25%, 12/1/14 | | $ | 1,104,240 | | |
| | 2,000 | | | Metropolitan Transportation Authority, (FGIC),
Prerefunded to 10/1/15, 5.00%, 4/1/23 | | | 2,188,980 | | |
| | 2,240 | | | Metropolitan Transportation Authority, (FGIC),
Prerefunded to 7/1/08, 5.70%, 7/1/10(2) | | | 2,426,928 | | |
| | 1,000 | | | Metropolitan Transportation Authority, (FGIC),
Prerefunded to 7/1/09, 5.25%, 7/1/17 | | | 1,083,910 | | |
| | 490 | | | New York Dormitory Authority, (Mental Health Services
Facilities), Prerefunded to 8/15/07, (FSA),
5.125%, 8/15/17 | | | 519,787 | | |
| | 1,225 | | | New York Dormitory Authority, (Mental Health Services),
Prerefunded to 8/15/11, (MBIA), 5.50%, 8/15/13 | | | 1,358,268 | | |
| | 450 | | | New York Thruway Authority Service Contract, (Local
Highway and Bridge), (MBIA), Prerefunded to 4/1/09,
5.40%, 4/1/15 | | | 492,187 | | |
| | 250 | | | New York Urban Development Corp., (Correctional Facilities),
(AMBAC), Prerefunded to 1/01/09, 5.25%, 1/1/15 | | | 271,153 | | |
Principal Amount
(000's omitted) | |
Security | |
Value | |
| Insured-Escrowed / Prerefunded (continued) | | | | | |
| $ | 250 | | | Niagara County IDA, (Niagara University), (AMBAC),
Escrowed to Maturity, 5.25%, 10/1/18 | | $ | 278,618 | | |
| | | | | | | $ | 9,724,071 | | |
| Insured-General Obligations - 9.5% | | | | | |
| $ | 500 | | | Clarence, Central School District, (FSA), 5.00%, 5/15/17 | | $ | 528,005 | | |
| | 1,000 | | | Monroe County, (Public Improvements), (MBIA),
6.00%, 3/1/19 | | | 1,189,950 | | |
| | 1,000 | | | New York City, (MBIA), 5.75%, 8/1/14 | | | 1,112,630 | | |
| | 1,500 | | | New York City, (XLCA), 5.50%, 8/1/12 | | | 1,660,470 | | |
| | 1,915 | | | Puerto Rico, (FGIC), 5.50%, 7/1/17 | | | 2,193,920 | | |
| | 1,965 | | | Puerto Rico, (MBIA), 5.50%, 7/1/16 | | | 2,238,410 | | |
| | 1,645 | | | Red Hook Central School District, (FSA), 5.125%, 6/15/16 | | | 1,758,176 | | |
| | | | | | | $ | 10,681,561 | | |
| Insured-Health Care Miscellaneous - 0.1% | | | | | |
| $ | 5 | | | New York Dormitory Authority, (Mental Health Services
Facilities), (FSA), 5.125%, 8/15/17 | | $ | 5,255 | | |
| | 85 | | | New York Dormitory Authority, (Mental Health Services),
(MBIA), 5.50%, 8/15/13 | | | 93,030 | | |
| | | | | | | $ | 98,285 | | |
| Insured-Hospital - 2.1% | | | | | |
| $ | 1,600 | | | New York Dormitory Authority, (Memorial Sloan Kettering
Cancer Center), (MBIA), 5.50%, 7/1/17 | | $ | 1,798,304 | | |
| | 500 | | | New York Dormitory Authority, (New York and Presbyterian
Hospital), (AMBAC), 5.50%, 8/1/11 | | | 550,285 | | |
| | | | | | | $ | 2,348,589 | | |
Insured-Lease Revenue / Certificates of
Participation - 5.7% | | | | | |
| $ | 3,470 | | | Metropolitan Transportation Authority, Service Contract,
(FSA), 5.50%, 7/1/17 | | $ | 3,942,892 | | |
| | 1,250 | | | Metropolitan Transportation Authority, Service Contract,
(MBIA), 5.50%, 7/1/14 | | | 1,405,525 | | |
| | 1,000 | | | New York Dormitory Authority, (Municipal Health Facilities),
(FSA), 5.50%, 1/15/13 | | | 1,092,370 | | |
| | | | | | | $ | 6,440,787 | | |
| Insured-Special Tax Revenue - 3.5% | | | | | |
| $ | 2,250 | | | New York Local Government Assistance Corp., (MBIA),
0.00%, 4/1/13 | | $ | 1,637,078 | | |
| | 2,000 | | | New York Urban Development Corp., (Personal
Income Tax), (AMBAC), 5.50%, 3/15/19(3) | | | 2,264,480 | | |
| | | | | | | $ | 3,901,558 | | |
See notes to financial statements
34
Eaton Vance New York Limited Maturity Municipals Fund as of March 31, 2005
PORTFOLIO OF INVESTMENTS CONT'D
Principal Amount
(000's omitted) | |
Security | |
Value | |
| Insured-Transportation - 9.4% | | | | | |
| $ | 1,000 | | | Metropolitan Transportation Authority, (MBIA),
5.50%, 11/15/13 | | $ | 1,121,990 | | |
| | 500 | | | Monroe County Airport Authority, (MBIA), (AMT),
Variable Rate, 9.089%, 1/1/17(4)(5) | | | 630,165 | | |
| | 1,500 | | | New York Thruway Authority, (Local Highway & Bridge),
(XLCA), 5.50%, 4/1/13 | | | 1,647,225 | | |
| | 1,000 | | | Puerto Rico Commonwealth Highway and Transportation
Authority, (FSA), 5.50%, 7/1/17 | | | 1,145,650 | | |
| | 1,585 | | | Puerto Rico Highway and Transportation (Finance Authority),
(FSA), 5.50%, 7/1/12 | | | 1,776,103 | | |
| | 1,850 | | | Puerto Rico Highway and Transportation (Finance Authority),
(MBIA), 5.50%, 7/1/15 | | | 2,098,844 | | |
| | 1,920 | | | Triborough Bridge and Tunnel Authority, (MBIA),
5.50%, 11/15/18 | | | 2,190,778 | | |
| | | | | | | $ | 10,610,755 | | |
| Lease Revenue / Certificates of Participation - 2.8% | | | | | |
| $ | 2,000 | | | New York State Energy Research and Development
Authority, (Western NY Nuclear Service Center),
6.00%, 4/1/06 | | $ | 2,063,380 | | |
| | 1,000 | | | New York Urban Development Corp., (Correctional and
Youth Facilities), 5.50%, 1/1/17 | | | 1,084,590 | | |
| | | | | | | $ | 3,147,970 | | |
| Other Revenue - 0.7% | | | | | |
| $ | 750 | | | Albany Industrial Development Agency, (Charitable
Leadership), 6.00%, 7/1/19 | | $ | 805,763 | | |
| | | | | | | $ | 805,763 | | |
| Senior Living / Life Care - 1.1% | | | | | |
| $ | 330 | | | Glen Cove IDA, (Regency at Glen Cove),
9.50%, 7/1/12(6) | | $ | 328,211 | | |
| | 400 | | | Mt. Vernon IDA, (Wartburg Senior Housing, Inc.),
6.15%, 6/1/19 | | | 403,220 | | |
| | 500 | | | Suffolk County IDA, (Jeffersons Ferry), 7.20%, 11/1/19 | | | 531,430 | | |
| | | | | | | $ | 1,262,861 | | |
| Solid Waste - 2.6% | | | | | |
| $ | 750 | | | Hempstead IDA, (American Refuel), 5.00%, 12/1/10 | | $ | 777,038 | | |
| | 2,000 | | | Niagra County, IDA, (American Ref-Fuel Co. LLC), (AMT),
Variable Rate, 5.55%, 11/15/24 | | | 2,132,120 | | |
| | | | | | | $ | 2,909,158 | | |
Principal Amount
(000's omitted) | |
Security | |
Value | |
| Special Tax Revenue - 7.2% | | | | | |
| $ | 1,140 | | | 34th Street Partnership, Inc., 5.00%, 1/1/17 | | $ | 1,201,264 | | |
| | 1,000 | | | New York City Transitional Finance Authority,
4.75%, 11/15/23 | | | 1,014,020 | | |
| | 945 | | | New York City Transitional Finance Authority, (Future Tax),
5.00%, 5/1/16 | | | 978,396 | | |
| | 1,000 | | | New York City Transitional Finance Authority, (Future Tax),
5.375%, 2/1/13 | | | 1,089,580 | | |
| | 500 | | | New York City Transitional Finance Authority, (Future Tax),
5.375%, 2/15/14 | | | 543,435 | | |
| | 3,000 | | | New York Local Government Assistance Corp.,
5.25%, 4/1/16 | | | 3,284,910 | | |
| | | | | | | $ | 8,111,605 | | |
| Transportation - 1.6% | | | | | |
| $ | 1,685 | | | Triborough Bridge and Tunnel Authority, 5.00%, 1/1/15 | | $ | 1,781,163 | | |
| | | | | | | $ | 1,781,163 | | |
| Water and Sewer - 3.4% | | | | | |
| $ | 2,000 | | | New York City Municipal Water Finance Authority,
5.125%, 6/15/21 | | $ | 2,086,180 | | |
| | 1,000 | | | New York Environmental Facilities Corp., Water Finance
Authority, 5.00%, 6/15/17 | | | 1,064,980 | | |
| | 500 | | | New York Environmental Facility Corp., Clean Water,
(Municipal Water Finance), 5.25%, 6/15/14 | | | 544,735 | | |
| | 120 | | | New York Environmental Facility Corp., Pollution Control,
(New York City Municipal Water), 5.75%, 6/15/10 | | | 133,700 | | |
| | | | | | | $ | 3,829,595 | | |
| | Total Tax-Exempt Investments - 100.1%
(identified cost $109,097,961) | | | | | $ | 112,356,461 | | |
| | Other Assets, Less Liabilities - (0.1)% | | | | | $ | (159,459 | ) | |
| | Net Assets - 100.0% | | | | | $ | 112,197,002 | | |
AMBAC - AMBAC Financial Group, Inc.
AMT - Interest earned from these securities may be considered a tax preference item for purposes of the Federal Alternative Minimum Tax.
FGIC - Financial Guaranty Insurance Company
FSA - Financial Security Assurance, Inc.
MBIA - Municipal Bond Insurance Association
XLCA - XL Capital Assurance, Inc.
See notes to financial statements
35
Eaton Vance New York Limited Maturity Municipals Fund as of March 31, 2005
PORTFOLIO OF INVESTMENTS CONT'D
The Fund invests primarily in debt securities issued by New York municipalities. The ability of the issuers of the debt securities to meet their obligations may be affected by economic developments in a specific industry or municipality. In order to reduce the risk associated with such economic developments, at March 31, 2005, 53.0% of the securities in the portfolio of investments are backed by bond insurance of various financial institutions and financial guaranty assurance agencies. The aggregate percentage insured by an individual financial institution ranged from 5.0% to 21.5% of total investments.
(1) When-issued security.
(2) Security (or a portion thereof) has been segregated to cover when-issued securities.
(3) Security (or a portion thereof) has been segregated to cover margin requirements on open financial futures contracts.
(4) Security exempt from registration under Rule 144A of the Securities Act of 1933. These securities may be sold in transactions exempt from registration, normally to qualified institutional buyers. At March 31, 2005, the aggregate value of the securities is $630,165 or 0.6% of the Fund's net assets.
(5) Security has been issued as an inverse floater bond. The stated interest rate represents the rate in effect at March 31, 2005.
(6) Security is in default and making only partial interest payments.
See notes to financial statements
36
Eaton Vance Ohio Limited Maturity Municipals Fund as of March 31, 2005
PORTFOLIO OF INVESTMENTS
| Tax-Exempt Investments - 98.6% | | | | | |
Principal Amount
(000's omitted) | | Security | | Value | |
| Cogeneration - 1.0% | | | | | |
| $ | 195 | | | Ohio Water Development Authority, Solid Waste Disposal,
(Bay Shore Power), (AMT), 6.625%, 9/1/20 | | $ | 201,061 | | |
| | | | | | | $ | 201,061 | | |
| Education - 5.7% | | | | | |
| $ | 500 | | | Ohio Higher Educational Facilities Commission,
(John Carroll University), 5.00%, 11/15/13 | | $ | 537,005 | | |
| | 500 | | | Ohio State University General Receipts, 5.25%, 12/1/17 | | | 540,750 | | |
| | | | | | | $ | 1,077,755 | | |
| Escrowed / Prerefunded - 3.1% | | | | | |
| $ | 250 | | | Cuyahoga County, (Rock and Roll Hall of Fame), Escrowed
to Maturity, 5.85%, 12/1/08 | | $ | 273,325 | | |
| | 300 | | | Kings County Local School District, Prerefunded to 12/1/05,
7.60%, 12/1/10 | | | 309,870 | | |
| | | | | | | $ | 583,195 | | |
| General Obligations - 7.5% | | | | | |
| $ | 100 | | | Cuyahoga County, Sewer Improvement District,
5.45%, 12/1/15 | | $ | 109,214 | | |
| | 500 | | | Hamilton School District, 6.15%, 12/1/15 | | | 589,090 | | |
| | 500 | | | Ohio, 0.00%, 8/1/05 | | | 496,010 | | |
| | 250 | | | Ohio, 0.00%, 8/1/08 | | | 224,065 | | |
| | | | | | | $ | 1,418,379 | | |
| Hospital - 8.6% | | | | | |
| $ | 500 | | | Cuyahoga County, (Cleveland Clinic Health System),
6.00%, 1/1/17 | | $ | 558,660 | | |
| | 500 | | | Erie County Hospital Facility, (Firelands Regional
Medical Center), 5.50%, 8/15/12 | | | 535,515 | | |
| | 250 | | | Parma, Hospital Improvement, (Parma Community
General Hospital Association), 5.25%, 11/1/13 | | | 259,795 | | |
| | 250 | | | Richland County Hospital Facilities, (Medcentral Health
Systems), 6.375%, 11/15/22 | | | 269,130 | | |
| | | | | | | $ | 1,623,100 | | |
| Housing - 1.9% | | | | | |
| $ | 350 | | | Ohio Housing Finance Agency Mortgage, (AMT),
4.55%, 9/1/11 | | $ | 359,751 | | |
| | | | | | | $ | 359,751 | | |
Principal Amount
(000's omitted) | |
Security | |
Value | |
| Industrial Development Revenue - 5.5% | | | | | |
| $ | 500 | | | Dayton, Special Facilities Revenue, (Emery Air Freight),
5.625%, 2/1/18 | | $ | 534,580 | | |
| | 500 | | | Toledo Lucas County Port Authority, (Cargill, Inc.),
4.50%, 12/1/15 | | | 506,190 | | |
| | | | | | | $ | 1,040,770 | | |
| Insured-Escrowed / Prerefunded - 2.8% | | | | | |
| $ | 500 | | | Southwest Licking School Facilities Improvement, (FGIC),
Prerefunded to 12/1/05, 7.10%, 12/1/16(1) | | $ | 525,350 | | |
| | | | | | | $ | 525,350 | | |
| Insured-General Obligations - 22.8% | | | | | |
| $ | 200 | | | Amherst School District, (FGIC), 5.00%, 12/1/11 | | $ | 216,616 | | |
| | 250 | | | Athens City School District, (FSA), 5.45%, 12/1/10 | | | 275,957 | | |
| | 265 | | | Clinton Massie Local School District, (AMBAC),
0.00%, 12/1/11 | | | 204,479 | | |
| | 265 | | | Clinton Massie Local School District, (MBIA), 0.00%, 12/1/09 | | | 224,476 | | |
| | 225 | | | Finneytown Local School District, (FGIC), 6.15%, 12/1/11 | | | 259,344 | | |
| | 1,000 | | | Hilliard School District, (FGIC), 0.00%, 12/1/14 | | | 665,520 | | |
| | 175 | | | Sciota Valley and Ross County School District, (FGIC),
0.00%, 12/1/11 | | | 135,033 | | |
| | 600 | | | Springfield City School District, Clark County, (FGIC),
5.00%, 12/1/17 | | | 638,796 | | |
| | 500 | | | Strongsville City School District, (MBIA), 5.375%, 12/1/12 | | | 554,485 | | |
| | 585 | | | Summit County, (FGIC), 4.75%, 12/1/21 | | | 604,305 | | |
| | 460 | | | Wyoming, School District, (FGIC), 5.75%, 12/1/17 | | | 534,626 | | |
| | | | | | | $ | 4,313,637 | | |
| Insured-Hospital - 2.9% | | | | | |
| $ | 500 | | | Cuyahoga County, (Metrohealth System), (MBIA),
5.50%, 2/15/12 | | $ | 553,925 | | |
| | | | | | | $ | 553,925 | | |
| Insured-Industrial Development Revenue - 3.0% | | | | | |
| $ | 500 | | | Akron Economic Development, (MBIA), 6.00%, 12/1/12 | | $ | 567,765 | | |
| | | | | | | $ | 567,765 | | |
Insured-Lease Revenue / Certificates of
Participation - 2.9% | | | | | |
| $ | 500 | | | Ohio Building Authority, (FSA), 5.50%, 10/1/11 | | $ | 553,705 | | |
| | | | | | | $ | 553,705 | | |
See notes to financial statements
37
Eaton Vance Ohio Limited Maturity Municipals Fund as of March 31, 2005
PORTFOLIO OF INVESTMENTS CONT'D
Principal Amount
(000's omitted) | |
Security | |
Value | |
| | Insured-Special Tax Revenue - 4.2% | | | | | | | | |
| $ | 750 | | | Cleveland-Cuyahoga Port Authority, (AMBAC),
5.00%, 8/1/21 | | $ | 789,225 | | |
| | | | | | | $ | 789,225 | | |
| | Insured-Transportation - 6.2% | | | | | | | | |
| $ | 300 | | | Cleveland Airport System, (FSA), 5.25%, 1/1/14 | | $ | 322,113 | | |
| | 750 | | | Ohio Turnpike Commission, (FGIC), 5.50%, 2/15/18 | | | 849,750 | | |
| | | | | | | $ | 1,171,863 | | |
| | Insured-Water and Sewer - 7.2% | | | | | | | | |
| $ | 475 | | | Cleveland Waterworks, (FSA), 5.375%, 1/1/16 | | $ | 514,586 | | |
| | 750 | | | Ohio Water Development Authority, (FSA), 5.50%, 12/1/17 | | | 854,888 | | |
| | | | | | | $ | 1,369,474 | | |
| | Lease Revenue / Certificates of Participation - 5.5% | | | | | | | | |
| $ | 750 | | | Ohio Parks and Recreational Capital Facilities,
5.50%, 6/1/14 | | $ | 830,580 | | |
| | 200 | | | Union County, (Pleasant Valley Joint Fire District),
6.125%, 12/1/19 | | | 211,794 | | |
| | | | | | | $ | 1,042,374 | | |
| | Pooled Loans - 4.6% | | | | | | | | |
| $ | 250 | | | Cuyahoga County Port Authority, (Garfield Heights),
5.25%, 5/15/23 | | $ | 245,683 | | |
| | 250 | | | Ohio Economic Development, (Ohio Enterprise Bond Fund),
(AMT), 5.25%, 12/1/15 | | | 256,598 | | |
| | 200 | | | Toledo Lucas County Port Authority, (Northwest Ohio
Bond Fund), (Alex Products), (AMT), 6.125%, 11/15/09 | | | 216,246 | | |
| | 150 | | | Toledo Lucas County Port Authority, (Northwest Ohio
Bond Fund), (Superior), 5.10%, 5/15/12 | | | 151,491 | | |
| | | | | | | $ | 870,018 | | |
| | Special Tax Revenue - 0.3% | | | | | | | | |
| $ | 50 | | | Columbus Special Assessment, 6.05%, 9/15/05 | | $ | 50,720 | | |
| | | | | | | $ | 50,720 | | |
Principal Amount
(000's omitted) | |
Security | |
Value | |
| Water and Sewer - 2.9% | | | | | | | |
| $ | 500 | | | Ohio Water Development Authority, (Drinking Water),
5.50%, 12/1/14 | | $ | 555,730 | | |
| | | | | $ | 555,730 | | |
Total Tax-Exempt Investments - 98.6%
(identified cost $17,747,612) | | | | $ | 18,667,797 | | |
| Other Assets, Less Liabilities - 1.4% | | | | $ | 273,911 | | |
| Net Assets - 100.0% | | | | $ | 18,941,708 | | |
AMBAC - AMBAC Financial Group, Inc.
AMT - Interest earned from these securities may be considered a tax preference item for purposes of the Federal Alternative Minimum Tax.
FGIC - Financial Guaranty Insurance Company
FSA - Financial Security Assurance, Inc.
MBIA - Municipal Bond Insurance Association
The Fund invests primarily in debt securities issued by Ohio municipalities. The ability of the issuers of the debt securities to meet their obligations may be affected by economic developments in a specific industry or municipality. In order to reduce the risk associated with such economic developments, at March 31, 2005, 52.7% of the securities in the portfolio of investments are backed by bond insurance of various financial institutions and financial guaranty assurance agencies. The aggregate percentage insured by an individual financial institution ranged from 5.3% to 23.7% of total investments.
(1) Security (or a portion thereof) has been segregated to cover margin requirements on open financial futures contracts.
See notes to financial statements
38
Eaton Vance Pennsylvania Limited Maturity Municipals Fund as of March 31, 2005
PORTFOLIO OF INVESTMENTS
| | Tax-Exempt Investments - 98.9% | | | | | | | | |
Principal Amount
(000's omitted) | | Security | | Value | |
| | Cogeneration - 1.6% | | | | | | | | |
| $ | 295 | | | Carbon County IDA, (Panther Creek Partners), (AMT),
6.65%, 5/1/10 | | $ | 318,559 | | |
| | 600 | | | Pennsylvania EDA, (Resource Recovery-Colver), (AMT),
7.05%, 12/1/10 | | | 614,016 | | |
| | | | | | | $ | 932,575 | | |
| | Electric Utilities - 0.7% | | | | | | | | |
| $ | 400 | | | York County IDA, Pollution Control, (Public Service
Enterprise Group, Inc.), 5.50%, 9/1/20 | | $ | 418,816 | | |
| | | | | | | $ | 418,816 | | |
| | Escrowed / Prerefunded - 2.4% | | | | | | | | |
| $ | 110 | | | Delaware County IDA, (Glen Riddle), (AMT), Escrowed to
Maturity, 8.125%, 9/1/05 | | $ | 111,250 | | |
| | 1,200 | | | Lehigh County, General Purpose Authority, (Muhlenberg
Hospital), Escrowed to Maturity, 5.75%, 7/15/10 | | | 1,282,440 | | |
| | | | | | | $ | 1,393,690 | | |
| | Health Care-Miscellaneous - 0.4% | | | | | | | | |
| $ | 250 | | | Allegheny County IDA, (Residential Resources, Inc.),
6.50%, 9/1/21 | | $ | 263,347 | | |
| | | | | | | $ | 263,347 | | |
| | Hospital - 4.4% | | | | | | | | |
| $ | 500 | | | Allegheny County Hospital Development Authority,
(West Pennsylvania Health System), 8.65%, 11/15/05 | | $ | 508,560 | | |
| | 230 | | | Hazleton Health Services Authority, (Hazleton
General Hospital), 5.50%, 7/1/07 | | | 224,671 | | |
| | 280 | | | Hazleton Health Services Authority, (St. Joseph's Hospital),
5.85%, 7/1/06 | | | 277,421 | | |
| | 200 | | | Lebanon County Health Facility Authority, (Good
Samaritan Hospital), 5.50%, 11/15/18 | | | 206,442 | | |
| | 500 | | | Pennsylvania Higher Educational Facilities Authority,
(UPMC Health System), 6.25%, 1/15/18 | | | 559,775 | | |
| | 800 | | | Washington County Hospital Authority, (Monongahela
Vineyard Hospital), 5.00%, 6/1/12 | | | 835,680 | | |
| | | | | | | $ | 2,612,549 | | |
| | Industrial Development Revenue - 3.4% | | | | | | | | |
| $ | 700 | | | Erie IDA, (International Paper), (AMT), 5.85%, 12/1/20 | | $ | 724,437 | | |
| | 750 | | | Puerto Rico Port Authority, (American Airlines), (AMT),
6.30%, 6/1/23 | | | 527,857 | | |
Principal Amount
(000's omitted) | |
Security | |
Value | |
| Industrial Development Revenue (continued) | | | | | |
| $ | 750 | | | Schuylkill County IDA, (Pine Grove Landfill, Inc.), (AMT),
5.10%, 10/1/19 | | $ | 772,605 | | |
| | | | | | | $ | 2,024,899 | | |
| Insured-Bond Bank - 0.5% | | | | | |
| $ | 250 | | | Puerto Rico Municipal Finance Agency, (FSA),
5.25%, 8/1/21 | | $ | 270,337 | | |
| | | | | | | $ | 270,337 | | |
| Insured-Education - 5.0% | | | | | |
| $ | 1,500 | | | Allegheny County, Higher Education Building Authority,
(Duquesne University), (AMBAC), 5.00%, 3/1/16(1) | | $ | 1,554,255 | | |
| | 1,100 | | | Lycoming County Authority College, (Pennsylvania
College of Technology), (AMBAC), 5.125%, 5/1/22 | | | 1,159,818 | | |
| | 250 | | | University of Pittsburgh, (FGIC), 5.125%, 6/1/22 | | | 262,945 | | |
| | | | | | | $ | 2,977,018 | | |
| Insured-Electric Utilities - 7.8% | | | | | |
| $ | 1,500 | | | Cambria County IDA, (Pennsylvania Electric), (MBIA),
5.35%, 11/1/10 | | $ | 1,641,015 | | |
| | 1,250 | | | Puerto Rico Electric Power Authority, (MBIA), 5.50%, 7/1/16 | | | 1,423,925 | | |
| | 1,370 | | | Puerto Rico Electric Power Authority, (XLCA), 5.375%, 7/1/18 | | | 1,543,374 | | |
| | | | | | | $ | 4,608,314 | | |
| Insured-Escrowed / Prerefunded - 8.7% | | | | | |
| $ | 250 | | | Allegheny County, (FGIC), Prerefunded to 5/1/11,
5.25%, 11/1/21 | | $ | 273,190 | | |
| | 580 | | | Allegheny County, (FGIC), Prerefunded to 5/1/11,
5.40%, 11/1/19 | | | 638,528 | | |
| | 1,000 | | | Philadelphia School District, (FSA), Prerefunded to 2/1/12,
5.50%, 2/1/17 | | | 1,111,450 | | |
| | 500 | | | Philadelphia School District, (FSA), Prerefunded to 2/1/12,
5.50%, 2/1/19 | | | 555,725 | | |
| | 5,000 | | | Westmoreland County, Municipal Authority, Water Utility,
(FGIC), Escrowed to Maturity, 0.00%, 8/15/19 | | | 2,560,900 | | |
| | | | | | | $ | 5,139,793 | | |
| Insured-General Obligations - 33.8% | | | | | |
| $ | 785 | | | Allegheny County, (FGIC), 5.40%, 11/1/19 | | $ | 851,513 | | |
| | 1,540 | | | Centre County, (MBIA), 5.25%, 7/1/18 | | | 1,664,478 | | |
| | 1,020 | | | Cornwall Lebanon School District, (FSA), 0.00%, 3/15/16 | | | 616,437 | | |
| | 1,000 | | | Council Rock School District, (MBIA), 5.00%, 11/15/19 | | | 1,049,090 | | |
| | 1,250 | | | Cranberry Township, (FGIC), 5.00%, 12/1/20 | | | 1,308,213 | | |
| | 2,000 | | | Ephrata Area School District, (FGIC), 5.25%, 4/15/19 | | | 2,146,960 | | |
See notes to financial statements
39
Eaton Vance Pennsylvania Limited Maturity Municipals Fund as of March 31, 2005
PORTFOLIO OF INVESTMENTS CONT'D
Principal Amount
(000's omitted) | |
Security | |
Value | |
| | Insured-General Obligations (continued) | | | | | | | | |
| $ | 1,635 | | | Harrisburg, (AMBAC), 0.00%, 9/15/12 | | $ | 1,202,117 | | |
| | 1,355 | | | McKeesport, (FGIC), 0.00%, 10/1/11 | | | 1,058,878 | | |
| | 1,000 | | | Palmyra Area School District, (FGIC), 5.00%, 5/1/17 | | | 1,054,500 | | |
| | 2,000 | | | Pennsylvania, (MBIA), 5.375%, 7/1/19 | | | 2,251,080 | | |
| | 2,000 | | | Pittsburgh, (AMBAC), 5.125%, 9/1/18 | | | 2,094,080 | | |
| | 1,000 | | | Pittsburgh, (AMBAC), 5.25%, 9/1/22 | | | 1,047,750 | | |
| | 500 | | | Puerto Rico Public Improvements, (XLCA), 5.25%, 7/1/17 | | | 556,695 | | |
| | 1,000 | | | Reading School District, (FGIC), 0.00%, 1/15/12 | | | 758,010 | | |
| | 1,000 | | | Spring-Ford Area School District, (FSA), 5.00%, 9/1/19 | | | 1,079,840 | | |
| | 1,250 | | | Sto-Rox School District, (FGIC), 5.125%, 12/15/22 | | | 1,306,188 | | |
| | | | | | | $ | 20,045,829 | | |
| | Insured-Hospital - 4.5% | | | | | | | | |
| $ | 1,000 | | | Allegheny County Hospital Development Authority,
(South Hills Health), (MBIA), 5.50%, 5/1/08 | | $ | 1,043,480 | | |
| | 1,000 | | | Pennsylvania Higher Educational Facilities Authority,
(University of Pennsylvania Health System), (AMBAC),
5.00%, 8/15/15 | | | 1,075,200 | | |
| | 500 | | | Washington County Hospital Authority, (Washington Hospital),
(AMBAC), 5.375%, 7/1/14 | | | 550,250 | | |
| | | | | | | $ | 2,668,930 | | |
| | Insured-Lease Revenue / Certificates of
Participation - 3.4% | | | | | | | | |
| $ | 500 | | | Pennsylvania Public School Building Authority, (Garnet
Valley School District), (AMBAC), 5.50%, 2/1/20 | | $ | 542,435 | | |
| | 1,355 | | | Philadelphia IDA, Stadium Lease, (FSA), 5.50%, 10/1/21 | | | 1,478,928 | | |
| | | | | | | $ | 2,021,363 | | |
| | Insured-Special Tax Revenue - 1.0% | | | | | | | | |
| $ | 210 | | | Pennsylvania Turnpike Commission, Oil Franchise Tax,
(AMBAC), 5.25%, 12/1/18 | | $ | 224,870 | | |
| | 350 | | | Pittsburgh and Allegheny County, Public Auditorium Authority,
(AMBAC), 5.00%, 2/1/24 | | | 360,689 | | |
| | | | | | | $ | 585,559 | | |
| | Insured-Transportation - 12.2% | | | | | | | | |
| $ | 1,000 | | | Allegheny County Airport, (MBIA), (AMT), 5.75%, 1/1/10 | | $ | 1,073,840 | | |
| | 590 | | | Allegheny County Airport, (MBIA), (AMT), 5.75%, 1/1/12 | | | 642,321 | | |
| | 1,000 | | | Pennsylvania Turnpike Commission, Registration Fee Revenue,
(AMBAC), 5.125%, 7/15/22 | | | 1,054,610 | | |
| | 1,000 | | | Philadelphia Airport, (FGIC), (AMT), 5.375%, 7/1/14 | | | 1,055,100 | | |
| | 1,500 | | | Puerto Rico Highway and Transportation Authority, (MBIA),
5.50%, 7/1/15 | | | 1,701,765 | | |
Principal Amount
(000's omitted) | |
Security | |
Value | |
| | Insured-Transportation (continued) | | | | | | | | |
| $ | 1,000 | | | Puerto Rico Highway and Transportation Authority, (MBIA),
5.50%, 7/1/18 | | $ | 1,148,040 | | |
| | 500 | | | Southeastern Pennsylvania Transportation Authority, (FGIC),
5.25%, 3/1/16 | | | 534,885 | | |
| | | | | | | $ | 7,210,561 | | |
| | Insured-Utility - 1.8% | | | | | | | | |
| $ | 1,000 | | | Philadelphia Gas Works Revenue, (FSA), 5.25%, 8/1/17 | | $ | 1,073,490 | | |
| | | | | | | $ | 1,073,490 | | |
| | Insured-Water and Sewer - 2.7% | | | | | | | | |
| $ | 1,500 | | | Allegheny County, Sanitation Authority, (MBIA),
5.00%, 12/1/19 | | $ | 1,578,195 | | |
| | | | | | | $ | 1,578,195 | | |
| | Senior Living / Life Care - 2.6% | | | | | | | | |
| $ | 500 | | | Bucks County IDA, (Pennswood), 5.80%, 10/1/20 | | $ | 521,305 | | |
| | 170 | | | Chester County IDA, (Kimberton), (AMT), 8.00%, 9/1/05 | | | 170,383 | | |
| | 390 | | | Cliff House Trust, (AMT), 6.625%, 6/1/27 | | | 296,642 | | |
| | 335 | | | Crawford County Hospital Authority, (Wesbury United
Methodist Community), 6.00%, 8/15/11 | | | 349,978 | | |
| | 185 | | | Lancaster County Hospital Authority, (Willow Valley
Retirement), 5.55%, 6/1/15 | | | 194,731 | | |
| | | | | | | $ | 1,533,039 | | |
| | Transportation - 2.0% | | | | | | | | |
| $ | 600 | | | Delaware River Joint Toll Bridge Commission,
5.25%, 7/1/15 | | $ | 646,542 | | |
| | 540 | | | Erie Municipal Airport Authority, (AMT), 5.50%, 7/1/09 | | | 556,740 | | |
| | | | | | | $ | 1,203,282 | | |
| | Total Tax-Exempt Investments - 98.9%
(identified cost $56,486,234) | | | | | $ | 58,561,586 | | |
| | Other Assets, Less Liabilities - 1.1% | | | | | $ | 675,906 | | |
| | Net Assets - 100.0% | | | | | $ | 59,237,492 | | |
AMBAC - AMBAC Financial Group, Inc.
AMT - Interest earned from these securities may be considered a tax preference item for purposes of the Federal Alternative Minimum Tax.
FGIC - Financial Guaranty Insurance Company
FSA - Financial Security Assurance, Inc.
See notes to financial statements
40
Eaton Vance Pennsylvania Limited Maturity Municipals Fund as of March 31, 2005
PORTFOLIO OF INVESTMENTS CONT'D
MBIA - Municipal Bond Insurance Association
XLCA - XL Capital Assurance, Inc.
The Fund invests primarily in debt securities issued by Pennsylvania municipalities. The ability of the issuers of the debt securities to meet their obligations may be affected by economic developments in a specific industry or municipality. In order to reduce the risk associated with such economic developments, at March 31, 2005, 82.3% of the securities in the portfolio of investments are backed by bond insurance of various financial institutions and financial guaranty assurance agencies. The aggregate percentage insured by an individual financial institution ranged from 3.6% to 26.0% of total investments.
(1) Security (or a portion thereof) has been segregated to cover margin requirements on open financial futures contracts.
See notes to financial statements
41
Eaton Vance Limited Maturity Municipals Funds as of March 31, 2005
FINANCIAL STATEMENTS
Statements of Assets and Liabilities
As of March 31, 2005
| | | California
Limited Fund | | Florida
Limited Fund | | Massachusetts
Limited Fund | | New Jersey
Limited Fund | |
| Assets | | | |
| Investments - | | | | | | | | | | | | | | | | | |
| Identified cost | | $ | 34,246,898 | | | $ | 68,205,577 | | | $ | 84,177,849 | | | $ | 49,119,652 | | |
| Unrealized appreciation | | | 1,082,292 | | | | 1,887,965 | | | | 2,393,764 | | | | 2,019,430 | | |
| Investments, at value | | $ | 35,329,190 | | | $ | 70,093,542 | | | $ | 86,571,613 | | | $ | 51,139,082 | | |
| Cash | | $ | - | | | $ | 407,344 | | | $ | 224,981 | | | $ | 658,048 | | |
| Receivable for investments sold | | | 565,441 | | | | 715,854 | | | | 2,261,765 | | | | - | | |
| Receivable for Fund shares sold | | | 51 | | | | 11,822 | | | | 11,200 | | | | 23,132 | | |
| Interest receivable | | | 410,581 | | | | 1,076,069 | | | | 1,079,104 | | | | 699,918 | | |
| Prepaid expenses | | | - | | | | 4,661 | | | | 4,664 | | | | - | | |
| Total assets | | $ | 36,305,263 | | | $ | 72,309,292 | | | $ | 90,153,327 | | | $ | 52,520,180 | | |
| Liabilities | | | |
| Payable for investments purchased | | $ | 578,049 | | | $ | 1,346,855 | | | $ | 2,312,197 | | | $ | - | | |
| Payable for Fund shares redeemed | | | 20,927 | | | | 169,005 | | | | 736,023 | | | | 41,665 | | |
| Payable for daily variation margin on open financial futures contracts | | | 57,062 | | | | 90,407 | | | | 84,391 | | | | 79,578 | | |
| Demand note payable | | | 100,000 | | | | - | | | | - | | | | - | | |
| Dividends payable | | | 54,897 | | | | 106,491 | | | | 123,809 | | | | 78,482 | | |
| Due to bank | | | 55,759 | | | | - | | | | - | | | | - | | |
| Payable to affiliate for Trustees' fees | | | - | | | | - | | | | 32 | | | | - | | |
| Payable to affiliate for service fees | | | - | | | | 3,021 | | | | 4,890 | | | | - | | |
| Accrued expenses | | | 37,434 | | | | 45,803 | | | | 51,110 | | | | 45,251 | | |
| Total liabilities | | $ | 904,128 | | | $ | 1,761,582 | | | $ | 3,312,452 | | | $ | 244,976 | | |
| Net Assets | | $ | 35,401,135 | | | $ | 70,547,710 | | | $ | 86,840,875 | | | $ | 52,275,204 | | |
| Sources of Net Assets | | | |
| Paid-in capital | | $ | 34,904,806 | | | $ | 70,261,175 | | | $ | 87,038,096 | | | $ | 51,849,444 | | |
| Accumulated net realized loss (computed on the basis of identified cost) | | | (726,090 | ) | | | (1,820,253 | ) | | | (2,687,762 | ) | | | (1,787,882 | ) | |
| Distributions in excess of net investment income | | | (2,176 | ) | | | (7,537 | ) | | | (3,623 | ) | | | (5,717 | ) | |
| Net unrealized appreciation (computed on the basis of identified cost) | | | 1,224,595 | | | | 2,114,325 | | | | 2,494,164 | | | | 2,219,359 | | |
| Total | | $ | 35,401,135 | | | $ | 70,547,710 | | | $ | 86,840,875 | | | $ | 52,275,204 | | |
| Class A Shares | | | |
| Net Assets | | $ | 31,554,547 | | | $ | 44,719,852 | | | $ | 48,901,293 | | | $ | 43,424,479 | | |
| Shares Outstanding | | | 3,065,815 | | | | 4,373,050 | | | | 4,805,500 | | | | 4,299,620 | | |
Net Asset Value and Redemption Price Per Share
(net assets ÷ shares of beneficial interest outstanding) | | $ | 10.29 | | | $ | 10.23 | | | $ | 10.18 | | | $ | 10.10 | | |
Maximum Offering Price Per Share
(100 ÷ 97.75 of net assets value per share) | | $ | 10.53 | | | $ | 10.47 | | | $ | 10.41 | | | $ | 10.33 | | |
| Class B Shares | | | |
| Net Assets | | $ | 3,836,635 | | | $ | 8,361,226 | | | $ | 10,350,152 | | | $ | 8,850,725 | | |
| Shares Outstanding | | | 373,967 | | | | 817,633 | | | | 1,018,161 | | | | 876,631 | | |
Net Asset Value, Offering Price and Redemption Price Per Share
(net assets ÷ shares of beneficial interest outstanding) | | $ | 10.26 | | | $ | 10.23 | | | $ | 10.17 | | | $ | 10.10 | | |
| Class C Shares | | | |
| Net Assets | | $ | 9,953 | | | $ | 17,466,632 | | | $ | 27,589,430 | | | $ | - | | |
| Shares Outstanding | | | 1,000 | | | | 1,809,408 | | | | 2,831,628 | | | | - | | |
Net Asset Value, Offering Price and Redemption Price Per Share
(net assets ÷ shares of beneficial interest outstanding) | | $ | 9.95 | | | $ | 9.65 | | | $ | 9.74 | | | $ | - | | |
On sales of $100,000 or more, the offering price of Class A shares is reduced.
See notes to financial statements
42
Eaton Vance Limited Maturity Municipals Funds as of March 31, 2005
FINANCIAL STATEMENTS CONT'D
Statements of Assets and Liabilities
As of March 31, 2005
| | | New York
Limited Fund | | Ohio
Limited Fund | | Pennsylvania
Limited Fund | |
| Assets | | | |
| Investments - | | | | | | | | | | | | | |
| Identified cost | | $ | 109,097,961 | | | $ | 17,747,612 | | | $ | 56,486,234 | | |
| Unrealized appreciation | | | 3,258,500 | | | | 920,185 | | | | 2,075,352 | | |
| Investments, at value | | $ | 112,356,461 | | | $ | 18,667,797 | | | $ | 58,561,586 | | |
| Cash | | $ | - | | | $ | 138,233 | | | $ | 436,930 | | |
| Receivable for investments sold | | | - | | | | - | | | | 35,006 | | |
| Receivable for Fund shares sold | | | 239,512 | | | | - | | | | 18,400 | | |
| Interest receivable | | | 1,581,497 | | | | 243,240 | | | | 742,153 | | |
| Prepaid expenses | | | 3,466 | | | | - | | | | - | | |
| Total assets | | $ | 114,180,936 | | | $ | 19,049,270 | | | $ | 59,794,075 | | |
| Liabilities | | | |
| Payable for Fund shares redeemed | | $ | 184,039 | | | $ | 21,812 | | | $ | 330,992 | | |
| Payable for daily variation margin on open financial futures contracts | | | 135,094 | | | | 21,141 | | | | 81,813 | | |
| Demand note payable | | | 300,000 | | | | - | | | | - | | |
| Dividends payable | | | 163,889 | | | | 28,891 | | | | 92,178 | | |
| Payable for when-issued securities | | | 1,062,250 | | | | - | | | | - | | |
| Due to bank | | | 75,512 | | | | - | | | | - | | |
| Payable to affiliate for Trustees' fees | | | 38 | | | | - | | | | 23 | | |
| Payable to affiliate for service fees | | | 6,367 | | | | - | | | | 2,908 | | |
| Accrued expenses | | | 56,745 | | | | 35,718 | | | | 48,669 | | |
| Total liabilities | | $ | 1,983,934 | | | $ | 107,562 | | | $ | 556,583 | | |
| Net Assets | | $ | 112,197,002 | | | $ | 18,941,708 | | | $ | 59,237,492 | | |
| Sources of Net Assets | | | |
| Paid-in capital | | $ | 111,354,324 | | | $ | 18,877,770 | | | $ | 58,956,544 | | |
| Accumulated net realized loss (computed on the basis of identified cost) | | | (2,530,217 | ) | | | (920,256 | ) | | | (1,989,683 | ) | |
| Accumulated undistributed (distributions in excess of) net investment income | | | (69,905 | ) | | | 34,292 | | | | (11,946 | ) | |
| Net unrealized appreciation (computed on the basis of identified cost) | | | 3,442,800 | | | | 949,902 | | | | 2,282,577 | | |
| Total | | $ | 112,197,002 | | | $ | 18,941,708 | | | $ | 59,237,492 | | |
| Class A Shares | | | |
| Net Assets | | $ | 62,842,601 | | | $ | 16,782,758 | | | $ | 33,610,708 | | |
| Shares Outstanding | | | 5,960,652 | | | | 1,722,645 | | | | 3,268,414 | | |
Net Asset Value and Redemption Price Per Share
(net assets ÷ shares of beneficial interest outstanding) | | $ | 10.54 | | | $ | 9.74 | | | $ | 10.28 | | |
Maximum Offering Price Per Share
(100 ÷ 97.75 of net assets value per share) | | $ | 10.78 | | | $ | 9.96 | | | $ | 10.52 | | |
| Class B Shares | | | |
| Net Assets | | $ | 12,517,879 | | | $ | 2,158,950 | | | $ | 8,957,034 | | |
| Shares Outstanding | | | 1,188,355 | | | | 221,942 | | | | 870,982 | | |
Net Asset Value, Offering Price and Redemption Price Per Share
(net assets ÷ shares of beneficial interest outstanding) | | $ | 10.53 | | | $ | 9.73 | | | $ | 10.28 | | |
| Class C Shares | | | |
| Net Assets | | $ | 36,836,522 | | | $ | - | | | $ | 16,669,750 | | |
| Shares Outstanding | | | 3,676,070 | | | | - | | | | 1,709,937 | | |
Net Asset Value, Offering Price and Redemption Price Per Share
(net assets ÷ shares of beneficial interest outstanding) | | $ | 10.02 | | | $ | - | | | $ | 9.75 | | |
On sales of $100,000 or more, the offering price of Class A shares is reduced.
See notes to financial statements
43
Eaton Vance Limited Maturity Municipals Funds as of March 31, 2005
FINANCIAL STATEMENTS CONT'D
Statements of Operations
For the Year Ended March 31, 2005
| | | California
Limited Fund | | Florida
Limited Fund | | Massachusetts
Limited Fund | | New Jersey
Limited Fund | |
| Investment Income | | | | | | | | | | | | | | | | | |
| Interest | | $ | 757,678 | | | $ | 1,561,745 | | | $ | 1,820,131 | | | $ | 1,127,489 | | |
| Interest allocated from Portfolio | | | 834,418 | | | | 1,685,879 | | | | 1,962,453 | | | | 1,247,150 | | |
| Expenses allocated from Portfolio | | | (111,089 | ) | | | (204,305 | ) | | | (246,221 | ) | | | (161,822 | ) | |
| Total investment income | | $ | 1,481,007 | | | $ | 3,043,319 | | | $ | 3,536,363 | | | $ | 2,212,817 | | |
| Expenses | | | | | | | | | | | | | | | | | |
| Investment adviser fee | | $ | 74,011 | | | $ | 151,841 | | | $ | 181,877 | | | $ | 110,622 | | |
| Trustees fees and expenses | | | 663 | | | | 3,393 | | | | 3,421 | | | | 3,461 | | |
| Distribution and service fees | | | | | | | | | | | | | | | | | |
| Class A | | | 45,474 | | | | 66,938 | | | | 70,853 | | | | 66,058 | | |
| Class B | | | 44,740 | | | | 79,300 | | | | 96,768 | | | | 83,786 | | |
| Class C | | | - | | | | 160,859 | | | | 252,647 | | | | - | | |
| Legal and accounting services | | | 22,793 | | | | 24,626 | | | | 28,026 | | | | 28,018 | | |
| Printing and postage | | | 5,498 | | | | 13,574 | | | | 16,519 | | | | 12,806 | | |
| Custodian fee | | | 22,247 | | | | 35,308 | | | | 41,087 | | | | 29,003 | | |
| Transfer and dividend disbursing agent | | | 13,192 | | | | 30,057 | | | | 38,575 | | | | 28,997 | | |
| Registration fees | | | 4,308 | | | | 6,387 | | | | 10,233 | | | | 1,999 | | |
| Miscellaneous | | | 9,395 | | | | 11,193 | | | | 11,406 | | | | 8,824 | | |
| Total expenses | | $ | 242,321 | | | $ | 583,476 | | | $ | 751,412 | | | $ | 373,574 | | |
| Deduct - | | | | | | | | | | | | | | | | | |
| Reduction of custodian fee | | $ | 3,736 | | | $ | 7,329 | | | $ | 9,185 | | | $ | 4,501 | | |
| Reduction of investment adviser fee | | | - | | | | - | | | | 200 | | | | - | | |
| Total expense reductions | | $ | 3,736 | | | $ | 7,329 | | | $ | 9,385 | | | $ | 4,501 | | |
| Net expenses | | $ | 238,585 | | | $ | 576,147 | | | $ | 742,027 | | | $ | 369,073 | | |
| Net investment income | | $ | 1,242,422 | | | $ | 2,467,172 | | | $ | 2,794,336 | | | $ | 1,843,744 | | |
| Realized and Unrealized Gain (Loss) | | | | | | | | | | | | | | | | | |
| Net realized gain (loss) - | | | | | | | | | | | | | | | | | |
| Investment transactions (identified cost basis) | | $ | 69,747 | | | $ | 428,639 | | | $ | 87,855 | | | $ | 133,923 | | |
| Investment transactions from Portfolio (identified cost basis) | | | 75,431 | | | | (113,865 | ) | | | (226,990 | ) | | | (59,107 | ) | |
| Financial futures contracts | | | (335,638 | ) | | | (392,722 | ) | | | (459,223 | ) | | | (311,414 | ) | |
| Financial futures contracts from Portfolio | | | (292,872 | ) | | | (450,525 | ) | | | (238,578 | ) | | | (157,648 | ) | |
| Net realized loss | | $ | (483,332 | ) | | $ | (528,473 | ) | | $ | (836,936 | ) | | $ | (394,246 | ) | |
| Change in unrealized appreciation (depreciation) - | | | | | | | | | | | | | | | | | |
| Investments (identified cost basis) | | $ | (678,859 | ) | | $ | (1,674,055 | ) | | $ | (1,904,618 | ) | | $ | (1,157,968 | ) | |
| Investments from Portfolio (identified cost basis) | | | (99,083 | ) | | | (298,737 | ) | | | (164,101 | ) | | | (297,558 | ) | |
| Financial futures contracts | | | 256,106 | | | | 414,992 | | | | 323,943 | | | | 372,679 | | |
| Financial futures contracts from Portfolio | | | 45,441 | | | | 91,941 | | | | 13,603 | | | | 17,419 | | |
| Net change in unrealized appreciation (depreciation) | | $ | (476,395 | ) | | $ | (1,465,859 | ) | | $ | (1,731,173 | ) | | $ | (1,065,428 | ) | |
| Net realized and unrealized loss | | $ | (959,727 | ) | | $ | (1,994,332 | ) | | $ | (2,568,109 | ) | | $ | (1,459,674 | ) | |
| Net increase in net assets from operations | | $ | 282,695 | | | $ | 472,840 | | | $ | 226,227 | | | $ | 384,070 | | |
See notes to financial statements
44
Eaton Vance Limited Maturity Municipals Funds as of March 31, 2005
FINANCIAL STATEMENTS CONT'D
Statements of Operations
For the Year Ended March 31, 2005
| | | New York
Limited Fund | | Ohio
Limited Fund | | Pennsylvania
Limited Fund | |
| Investment Income | | | |
| Interest | | $ | 2,489,934 | | | $ | 431,658 | | | $ | 1,359,757 | | |
| Interest allocated from Portfolio | | | 2,811,340 | | | | 523,249 | | | | 1,545,743 | | |
| Expenses allocated from Portfolio | | | (336,078 | ) | | | (76,210 | ) | | | (187,664 | ) | |
| Total investment income | | $ | 4,965,196 | | | $ | 878,697 | | | $ | 2,717,836 | | |
| Expenses | | | |
| Investment adviser fee | | $ | 242,688 | | | $ | 40,833 | | | $ | 128,376 | | |
| Trustees fees and expenses | | | 4,948 | | | | 105 | | | | 3,565 | | |
| Distribution and service fees | | | | | | | | | | | | | |
| Class A | | | 97,041 | | | | 26,854 | | | | 50,872 | | |
| Class B | | | 123,358 | | | | 21,040 | | | | 86,641 | | |
| Class C | | | 356,693 | | | | - | | | | 160,805 | | |
| Legal and accounting services | | | 28,158 | | | | 22,685 | | | | 23,716 | | |
| Printing and postage | | | 22,406 | | | | 4,252 | | | | 15,607 | | |
| Custodian fee | | | 52,417 | | | | 17,486 | | | | 33,319 | | |
| Transfer and dividend disbursing agent | | | 64,702 | | | | 10,532 | | | | 41,298 | | |
| Registration fees | | | 6,509 | | | | 2,058 | | | | 1,734 | | |
| Miscellaneous | | | 13,329 | | | | 6,614 | | | | 10,013 | | |
| Total expenses | | $ | 1,012,249 | | | $ | 152,459 | | | $ | 555,946 | | |
| Deduct - | | | | | | | | | | | | | |
| Reduction of custodian fee | | $ | 4,262 | | | $ | 1,558 | | | $ | 3,868 | | |
| Total expense reductions | | $ | 4,262 | | | $ | 1,558 | | | $ | 3,868 | | |
| Net expenses | | $ | 1,007,987 | | | $ | 150,901 | | | $ | 552,078 | | |
| Net investment income | | $ | 3,957,209 | | | $ | 727,796 | | | $ | 2,165,758 | | |
| Realized and Unrealized Gain (Loss) | | | |
| Net realized gain (loss) - | | | | | | | | | | | | | |
| Investment transactions (identified cost basis) | | $ | 450,538 | | | $ | 23,078 | | | $ | 211,462 | | |
| Investment transactions from Portfolio (identified cost basis) | | | (154,670 | ) | | | (53,609 | ) | | | (44,776 | ) | |
| Financial futures contracts | | | (686,447 | ) | | | (107,804 | ) | | | (486,345 | ) | |
| Financial futures contracts from Portfolio | | | (212,953 | ) | | | (51,853 | ) | | | (340,619 | ) | |
| Net realized loss | | $ | (603,532 | ) | | $ | (190,188 | ) | | $ | (660,278 | ) | |
| Change in unrealized appreciation (depreciation) - | | | | | | | | | | | | | |
| Investments (identified cost basis) | | $ | (2,612,543 | ) | | $ | (386,303 | ) | | $ | (1,118,802 | ) | |
| Investments from Portfolio (identified cost basis) | | | (951,922 | ) | | | (170,281 | ) | | | (374,452 | ) | |
| Financial futures contracts | | | 518,851 | | | | 83,433 | | | | 361,560 | | |
| Financial futures contracts from Portfolio | | | 75,557 | | | | 11,423 | | | | 83,268 | | |
| Net change in unrealized appreciation (depreciation) | | $ | (2,970,057 | ) | | $ | (461,728 | ) | | $ | (1,048,426 | ) | |
| Net realized and unrealized loss | | $ | (3,573,589 | ) | | $ | (651,916 | ) | | $ | (1,708,704 | ) | |
| Net increase in net assets from operations | | $ | 383,620 | | | $ | 75,880 | | | $ | 457,054 | | |
See notes to financial statements
45
Eaton Vance Limited Maturity Municipals Funds as of March 31, 2005
FINANCIAL STATEMENTS CONT'D
Statements of Changes in Net Assets
For the Year Ended March 31, 2005
| Increase (Decrease) in Net Assets | | California
Limited Fund | | Florida
Limited Fund | | Massachusetts
Limited Fund | | New Jersey
Limited Fund | |
| From operations - | | | | | | | | | | | | | | | | | |
| Net investment income | | $ | 1,242,422 | | | $ | 2,467,172 | | | $ | 2,794,336 | | | $ | 1,843,744 | | |
Net realized loss from investment transactions and financial
futures contracts | | | (483,332 | ) | | | (528,473 | ) | | | (836,936 | ) | | | (394,246 | ) | |
Net change in unrealized appreciation (depreciation)
from investments and financial futures contracts | | | (476,395 | ) | | | (1,465,859 | ) | | | (1,731,173 | ) | | | (1,065,428 | ) | |
| Net increase in net assets from operations | | $ | 282,695 | | | $ | 472,840 | | | $ | 226,227 | | | $ | 384,070 | | |
| Distributions to shareholders - | | | | | | | | | | | | | | | | | |
| From net investment income | | | | | | | | | | | | | | | | | |
| Class A | | $ | (1,081,026 | ) | | $ | (1,636,159 | ) | | $ | (1,655,950 | ) | | $ | (1,549,369 | ) | |
| Class B | | | (140,147 | ) | | | (254,856 | ) | | | (293,970 | ) | | | (255,018 | ) | |
| Class C | | | - | | | | (520,724 | ) | | | (772,079 | ) | | | - | | |
| Total distributions to shareholders | | $ | (1,221,173 | ) | | $ | (2,411,739 | ) | | $ | (2,721,999 | ) | | $ | (1,804,387 | ) | |
| Transactions in shares of beneficial interest - | | | | | | | | | | | | | | | | | |
| Proceeds from sale of shares | | | | | | | | | | | | | | | | | |
| Class A | | $ | 9,116,022 | | | $ | 15,587,696 | | | $ | 7,737,121 | | | $ | 6,192,248 | | |
| Class B | | | 869,482 | | | | 1,887,828 | | | | 2,297,970 | | | | 1,122,724 | | |
| Class C | | | 10,000 | | | | 3,484,991 | | | | 6,660,947 | | | | - | | |
Net asset value of shares issued to shareholders in payment of
distributions declared | | | |
| Class A | | | 618,161 | | | | 660,063 | | | | 977,103 | | | | 1,111,428 | | |
| Class B | | | 59,463 | | | | 119,985 | | | | 178,831 | | | | 134,604 | | |
| Class C | | | - | | | | 146,077 | | | | 461,305 | | | | - | | |
| Cost of shares redeemed | | | | | | | | | | | | | | | | | |
| Class A | | | (8,205,022 | ) | | | (15,962,888 | ) | | | (6,810,780 | ) | | | (9,551,199 | ) | |
| Class B | | | (1,930,131 | ) | | | (1,790,219 | ) | | | (1,826,854 | ) | | | (1,717,448 | ) | |
| Class C | | | - | | | | (4,904,569 | ) | | | (6,918,264 | ) | | | - | | |
| Net asset value of shares exchanged | | | | | | | | | | | | | | | | | |
| Class A | | | 879,247 | | | | 568,137 | | | | 822,155 | | | | 654,539 | | |
| Class B | | | (879,247 | ) | | | (568,137 | ) | | | (822,155 | ) | | | (654,539 | ) | |
| Net increase (decrease) in net assets from Fund share transactions | | $ | 537,975 | | | $ | (771,036 | ) | | $ | 2,757,379 | | | $ | (2,707,643 | ) | |
| Net increase (decrease) in net assets | | $ | (400,503 | ) | | $ | (2,709,935 | ) | | $ | 261,607 | | | $ | (4,127,960 | ) | |
| Net Assets | | | | | | | | | | | | | | | | | |
| At beginning of year | | $ | 35,801,638 | | | $ | 73,257,645 | | | $ | 86,579,268 | | | $ | 56,403,164 | | |
| At end of year | | $ | 35,401,135 | | | $ | 70,547,710 | | | $ | 86,840,875 | | | $ | 52,275,204 | | |
Accumulated distributions
in excess of net investment
income included in net assets | | | | | | | | | | | | | | | | | |
| At end of year | | $ | (2,176 | ) | | $ | (7,537 | ) | | $ | (3,623 | ) | | $ | (5,717 | ) | |
See notes to financial statements
46
Eaton Vance Limited Maturity Municipals Funds as of March 31, 2005
FINANCIAL STATEMENTS CONT'D
Statements of Changes in Net Assets
For the Year Ended March 31, 2005
| Increase (Decrease) in Net Assets | | New York
Limited Fund | | Ohio
Limited Fund | | Pennsylvania
Limited Fund | |
| From operations - | | | | | | | | | | | | | |
| Net investment income | | $ | 3,957,209 | | | $ | 727,796 | | | $ | 2,165,758 | | |
Net realized loss from investment transactions and financial
futures contracts | | | (603,532 | ) | | | (190,188 | ) | | | (660,278 | ) | |
Net change in unrealized appreciation (depreciation)
from investments and financial futures contracts | | | (2,970,057 | ) | | | (461,728 | ) | | | (1,048,426 | ) | |
| Net increase in net assets from operations | | $ | 383,620 | | | $ | 75,880 | | | $ | 457,054 | | |
| Distributions to shareholders - | | | | | | | | | | | | | |
| From net investment income | | | | | | | | | | | | | |
| Class A | | $ | (2,350,829 | ) | | $ | (635,174 | ) | | $ | (1,302,522 | ) | |
| Class B | | | (393,409 | ) | | | (65,256 | ) | | | (295,280 | ) | |
| Class C | | | (1,130,081 | ) | | | - | | | | (543,127 | ) | |
| Total distributions to shareholders | | $ | (3,874,319 | ) | | $ | (700,430 | ) | | $ | (2,140,929 | ) | |
| Transactions in shares of beneficial interest - | | | | | | | | | | | | | |
| Proceeds from sale of shares | | | | | | | | | | | | | |
| Class A | | $ | 12,395,821 | | | $ | 2,551,261 | | | $ | 2,893,354 | | |
| Class B | | | 1,254,824 | | | | 155,720 | | | | 1,357,119 | | |
| Class C | | | 6,265,088 | | | | - | | | | 2,982,295 | | |
Net asset value of shares issued to shareholders in payment of
distributions declared | | | |
| Class A | | | 1,598,070 | | | | 376,732 | | | | 681,829 | | |
| Class B | | | 226,310 | | | | 29,705 | | | | 159,192 | | |
| Class C | | | 611,393 | | | | - | | | | 239,536 | | |
| Cost of shares redeemed | | | | | | | | | | | | | |
| Class A | | | (18,456,676 | ) | | | (6,049,639 | ) | | | (5,179,173 | ) | |
| Class B | | | (2,439,848 | ) | | | (524,644 | ) | | | (1,635,297 | ) | |
| Class C | | | (11,493,978 | ) | | | - | | | | (7,422,457 | ) | |
| Net asset value of shares exchanged | | | | | | | | | | | | | |
| Class A | | | 1,505,549 | | | | 56,850 | | | | 943,724 | | |
| Class B | | | (1,505,549 | ) | | | (56,850 | ) | | | (943,724 | ) | |
| Net decrease in net assets from Fund share transactions | | $ | (10,038,996 | ) | | $ | (3,460,865 | ) | | $ | (5,923,602 | ) | |
| Net decrease in net assets | | $ | (13,529,695 | ) | | $ | (4,085,415 | ) | | $ | (7,607,477 | ) | |
| Net Assets | | | |
| At beginning of year | | $ | 125,726,697 | | | $ | 23,027,123 | | | $ | 66,844,969 | | |
| At end of year | | $ | 112,197,002 | | | $ | 18,941,708 | | | $ | 59,237,492 | | |
Accumulated undistributed
(distributions in excess of) net
investment income included in net assets | | | |
| At end of year | | $ | (69,905 | ) | | $ | 34,292 | | | $ | (11,946 | ) | |
See notes to financial statements
47
Eaton Vance Limited Maturity Municipals Funds as of March 31, 2005
FINANCIAL STATEMENTS CONT'D
Statements of Changes in Net Assets
For the Year Ended March 31, 2004
| Increase (Decrease) in Net Assets | | California
Limited Fund | | Florida
Limited Fund | | Massachusetts
Limited Fund | | New Jersey
Limited Fund | |
| From operations - | | | | | | | | | | | | | | | | | |
| Net investment income | | $ | 1,285,258 | | | $ | 2,427,615 | | | $ | 2,720,734 | | | $ | 1,878,863 | | |
Net realized loss from investment transactions and financial
futures contracts | | | (4,357 | ) | | | (321,558 | ) | | | (878,673 | ) | | | (649,859 | ) | |
Net change in unrealized appreciation (depreciation)
from investments and financial futures contracts | | | 10,472 | | | | 441,435 | | | | 869,417 | | | | 865,249 | | |
| Net increase in net assets from operations | | $ | 1,291,373 | | | $ | 2,547,492 | | | $ | 2,711,478 | | | $ | 2,094,253 | | |
| Distributions to shareholders - | | | | | | | | | | | | | | | | | |
| From net investment income | | | | | | | | | | | | | | | | | |
| Class A | | $ | (1,094,862 | ) | | $ | (1,643,837 | ) | | $ | (1,738,510 | ) | | $ | (1,563,437 | ) | |
| Class B | | | (174,749 | ) | | | (270,500 | ) | | | (300,779 | ) | | | (273,175 | ) | |
| Class C | | | - | | | | (502,265 | ) | | | (708,534 | ) | | | - | | |
| Total distributions to shareholders | | $ | (1,269,611 | ) | | $ | (2,416,602 | ) | | $ | (2,747,823 | ) | | $ | (1,836,612 | ) | |
| Transactions in shares of beneficial interest - | | | | | | | | | | | | | | | | | |
| Proceeds from sale of shares | | | | | | | | | | | | | | | | | |
| Class A | | $ | 15,013,282 | | | $ | 10,829,071 | | | $ | 5,996,267 | | | $ | 10,253,686 | | |
| Class B | | | 2,399,276 | | | | 3,483,342 | | | | 3,701,052 | | | | 4,479,575 | | |
| Class C | | | - | | | | 9,303,360 | | | | 17,990,710 | | | | - | | |
Net asset value of shares issued to shareholders in payment of
distributions declared | | | |
| Class A | | | 638,807 | | | | 737,800 | | | | 1,048,256 | | | | 1,078,438 | | |
| Class B | | | 79,996 | | | | 121,742 | | | | 179,698 | | | | 134,610 | | |
| Class C | | | - | | | | 156,821 | | | | 417,686 | | | | - | | |
| Cost of shares redeemed | | | | | | | | | | | | | | | | | |
| Class A | | | (12,976,187 | ) | | | (14,242,089 | ) | | | (7,865,183 | ) | | | (5,221,656 | ) | |
| Class B | | | (1,232,161 | ) | | | (2,307,008 | ) | | | (1,198,091 | ) | | | (2,250,297 | ) | |
| Class C | | | - | | | | (3,089,559 | ) | | | (5,333,049 | ) | | | - | | |
| Net asset value of shares exchanged | | | | | | | | | | | | | | | | | |
| Class A | | | 515,783 | | | | 576,141 | | | | 995,244 | | | | 300,138 | | |
| Class B | | | (515,783 | ) | | | (576,141 | ) | | | (995,244 | ) | | | (300,138 | ) | |
| Net increase in net assets from Fund share transactions | | $ | 3,923,013 | | | $ | 4,993,480 | | | $ | 14,937,346 | | | $ | 8,474,356 | | |
| Net increase in net assets | | $ | 3,944,775 | | | $ | 5,124,370 | | | $ | 14,901,001 | | | $ | 8,731,997 | | |
| Net Assets | | | | | | | | | | | | | | | | | |
| At beginning of year | | $ | 31,856,863 | | | $ | 68,133,275 | | | $ | 71,678,267 | | | $ | 47,671,167 | | |
| At end of year | | $ | 35,801,638 | | | $ | 73,257,645 | | | $ | 86,579,268 | | | $ | 56,403,164 | | |
Accumulated distributions
in excess of net investment
income included in net assets | | | | | | | | | | | | | | | | | |
| At end of year | | $ | (19,259 | ) | | $ | (47,808 | ) | | $ | (77,813 | ) | | $ | (32,816 | ) | |
See notes to financial statements
48
Eaton Vance Limited Maturity Municipals Funds as of March 31, 2005
FINANCIAL STATEMENTS CONT'D
Statements of Changes in Net Assets
For the Year Ended March 31, 2004
| Increase (Decrease) in Net Assets | | New York
Limited Fund | | Ohio
Limited Fund | | Pennsylvania
Limited Fund | |
| From operations - | | | | | | | | | | | | | |
| Net investment income | | $ | 4,052,530 | | | $ | 782,566 | | | $ | 2,271,786 | | |
Net realized loss from investment transactions and financial
futures contracts | | | (1,492,053 | ) | | | (224,978 | ) | | | (512,262 | ) | |
Net change in unrealized appreciation (depreciation)
from investments and financial futures contracts | | | 2,198,307 | | | | 201,895 | | | | 967,020 | | |
| Net increase in net assets from operations | | $ | 4,758,784 | | | $ | 759,483 | | | $ | 2,726,544 | | |
| Distributions to shareholders - | | | | | | | | | | | | | |
| From net investment income | | | | | | | | | | | | | |
| Class A | | $ | (2,404,798 | ) | | $ | (710,894 | ) | | $ | (1,345,880 | ) | |
| Class B | | | (467,325 | ) | | | (80,164 | ) | | | (323,797 | ) | |
| Class C | | | (1,181,481 | ) | | | - | | | | (613,687 | ) | |
| Total distributions to shareholders | | $ | (4,053,604 | ) | | $ | (791,058 | ) | | $ | (2,283,364 | ) | |
| Transactions in shares of beneficial interest - | | | | | | | | | | | | | |
| Proceeds from sale of shares | | | | | | | | | | | | | |
| Class A | | $ | 16,212,619 | | | $ | 7,391,187 | | | $ | 7,672,159 | | |
| Class B | | | 6,099,479 | | | | 1,268,604 | | | | 3,533,243 | | |
| Class C | | | 23,260,586 | | | | - | | | | 9,164,795 | | |
Net asset value of shares issued to shareholders in payment of
distributions declared | | | |
| Class A | | | 1,488,493 | | | | 378,830 | | | | 729,777 | | |
| Class B | | | 264,509 | | | | 26,291 | | | | 186,727 | | |
| Class C | | | 610,334 | | | | - | | | | 302,808 | | |
| Cost of shares redeemed | | | | | | | | | | | | | |
| Class A | | | (12,560,495 | ) | | | (6,141,960 | ) | | | (7,588,238 | ) | |
| Class B | | | (3,832,889 | ) | | | (944,712 | ) | | | (2,312,301 | ) | |
| Class C | | | (9,250,842 | ) | | | - | | | | (3,368,028 | ) | |
| Net asset value of shares exchanged | | | | | | | | | | | | | |
| Class A | | | 1,459,948 | | | | 494,683 | | | | 511,168 | | |
| Class B | | | (1,459,948 | ) | | | (494,683 | ) | | | (511,168 | ) | |
| Net increase in net assets from Fund share transactions | | $ | 22,291,794 | | | $ | 1,978,240 | | | $ | 8,320,942 | | |
| Net increase in net assets | | $ | 22,996,974 | | | $ | 1,946,665 | | | $ | 8,764,122 | | |
| Net Assets | | | |
| At beginning of year | | $ | 102,729,723 | | | $ | 21,080,458 | | | $ | 58,080,847 | | |
| At end of year | | $ | 125,726,697 | | | $ | 23,027,123 | | | $ | 66,844,969 | | |
Accumulated undistributed
(distributions in excess of) net
investment income included in net assets | | | |
| At end of year | | $ | (136,187 | ) | | $ | 6,819 | | | $ | (31,636 | ) | |
See notes to financial statements
49
Eaton Vance Limited Maturity Municipals Funds as of March 31, 2005
FINANCIAL STATEMENTS CONT'D
Financial Highlights
| | | California Limited Fund - Class A | |
| | | Year Ended March 31, | |
| | | 2005(1) | | 2004(1) | | 2003(1) | | 2002(1)(2) | | 2001(1) | |
| Net asset value - Beginning of year | | $ | 10.560 | | | $ | 10.540 | | | $ | 10.100 | | | $ | 10.260 | | | $ | 9.700 | | |
| Income (loss) from operations | | | |
| Net investment income | | $ | 0.377 | | | $ | 0.394 | | | $ | 0.414 | | | $ | 0.430 | | | $ | 0.440 | | |
| Net realized and unrealized gain (loss) | | | (0.274 | ) | | | 0.016 | | | | 0.436 | | | | (0.160 | ) | | | 0.559 | | |
| Total income from operations | | $ | 0.103 | | | $ | 0.410 | | | $ | 0.850 | | | $ | 0.270 | | | $ | 0.999 | | |
| Less distributions | | | |
| From net investment income | | $ | (0.373 | ) | | $ | (0.390 | ) | | $ | (0.410 | ) | | $ | (0.430 | ) | | $ | (0.439 | ) | |
| Total distributions | | $ | (0.373 | ) | | $ | (0.390 | ) | | $ | (0.410 | ) | | $ | (0.430 | ) | | $ | (0.439 | ) | |
| Net asset value - End of year | | $ | 10.290 | | | $ | 10.560 | | | $ | 10.540 | | | $ | 10.100 | | | $ | 10.260 | | |
| Total Return(3) | | | 0.99 | % | | | 3.92 | % | | | 8.56 | % | | | 2.65 | % | | | 10.54 | % | |
| Ratios/Supplemental Data | | | |
| Net assets, end of year (000's omitted) | | $ | 31,555 | | | $ | 29,957 | | | $ | 26,750 | | | $ | 20,747 | | | $ | 19,578 | | |
| Ratios (As a percentage of average daily net assets): | | | | | | | | | | | | | | | | | | | | | |
| Expenses(4) | | | 0.90 | % | | | 0.88 | % | | | 0.96 | % | | | 1.02 | % | | | 1.03 | % | |
| Expenses after custodian fee reduction(4) | | | 0.89 | % | | | 0.88 | % | | | 0.94 | % | | | 1.00 | % | | | 1.00 | % | |
| Net investment income | | | 3.62 | % | | | 3.73 | % | | | 3.97 | % | | | 4.19 | % | | | 4.42 | % | |
| Portfolio Turnover of the Portfolio(5) | | | 13 | % | | | 27 | % | | | 7 | % | | | 9 | % | | | 8 | % | |
| Portfolio Turnover of the Fund | | | 13 | % | | | - | | | | - | | | | - | | | | - | | |
(1) Net investment income per share was computed using average shares outstanding.
(2) The Fund, through its investment in the Portfolio, has adopted the provisions of the revised AICPA Audit and Accounting Guide for Investment Companies and began using the interest method to amortize premiums on fixed-income securities. The effect of this change for the year ended March 31, 2002 was to increase net investment income per share by $0.002, increase net realized and unrealized losses per share by $0.002 and increase the ratio of net investment income to average net assets from 4.17% to 4.19%. Per share data and ratios for the periods prior to April 1, 2001 have not been restated to reflect this change in presentation.
(3) Returns are historical and are calculated by determining the percentage change in net asset value with all distributions reinvested. Total return is not computed on an annualized basis.
(4) Includes the Fund's share of its corresponding Portfolio's allocated expenses while the Fund was making investments directly into the Portfolio.
(5) Portfolio turnover represents the rate of portfolio activity for the period while the Fund was making investments directly into the Portfolio.
See notes to financial statements
50
Eaton Vance Limited Maturity Municipals Funds as of March 31, 2005
FINANCIAL STATEMENTS CONT'D
Financial Highlights
| | | California Limited Fund - Class B | |
| | | Year Ended March 31, | |
| | | 2005 | | 2004(1) | | 2003(1) | | 2002(1)(2) | | 2001(1) | |
| Net asset value - Beginning of year | | $ | 10.520 | | | $ | 10.500 | | | $ | 10.070 | | | $ | 10.260 | | | $ | 9.700 | | |
| Income (loss) from operations | | | | | | | | | | | | | | | | | | | | | |
| Net investment income | | $ | 0.301 | | | $ | 0.313 | | | $ | 0.333 | | | $ | 0.353 | | | $ | 0.365 | | |
| Net realized and unrealized gain (loss) | | | (0.268 | ) | | | 0.017 | | | | 0.432 | | | | (0.185 | ) | | | 0.564 | | |
| Total income from operations | | $ | 0.033 | | | $ | 0.330 | | | $ | 0.765 | | | $ | 0.168 | | | $ | 0.929 | | |
| Less distributions | | | | | | | | | | | | | | | | | | | | | |
| From net investment income | | $ | (0.293 | ) | | $ | (0.310 | ) | | $ | (0.335 | ) | | $ | (0.358 | ) | | $ | (0.369 | ) | |
| Total distributions | | $ | (0.293 | ) | | $ | (0.310 | ) | | $ | (0.335 | ) | | $ | (0.358 | ) | | $ | (0.369 | ) | |
| Net asset value - End of year | | $ | 10.260 | | | $ | 10.520 | | | $ | 10.500 | | | $ | 10.070 | | | $ | 10.260 | | |
| Total Return(3) | | | 0.31 | % | | | 3.16 | % | | | 7.71 | % | | | 1.64 | % | | | 9.77 | % | |
| Ratios/Supplemental Data | | | | | | | | | | | | | | | | | | | | | |
| Net assets, end of year (000's omitted) | | $ | 3,837 | | | $ | 5,844 | | | $ | 5,107 | | | $ | 1,723 | | | $ | 1,890 | | |
| Ratios (As a percentage of average daily net assets): | | | | | | | | | | | | | | | | | | | | | |
| Expenses(4) | | | 1.65 | % | | | 1.63 | % | | | 1.71 | % | | | 1.77 | % | | | 1.78 | % | |
| Expenses after custodian fee reduction(4) | | | 1.64 | % | | | 1.63 | % | | | 1.69 | % | | | 1.75 | % | | | 1.75 | % | |
| Net investment income | | | 2.90 | % | | | 2.97 | % | | | 3.19 | % | | | 3.44 | % | | | 3.68 | % | |
| Portfolio Turnover of the Portfolio(5) | | | 13 | % | | | 27 | % | | | 7 | % | | | 9 | % | | | 8 | % | |
| Portfolio Turnover of the Fund | | | 13 | % | | | - | | | | - | | | | - | | | | - | | |
(1) Net investment income per share was computed using average shares outstanding.
(2) The Fund, through its investment in the Portfolio, has adopted the provisions of the revised AICPA Audit and Accounting Guide for Investment Companies and began using the interest method to amortize premiums on fixed-income securities. The effect of this change for the year ended March 31, 2002 was to increase net investment income per share by $0.002, increase net realized and unrealized losses per share by $0.002 and increase the ratio of net investment income to average net assets from 3.42% to 3.44%. Per share data and ratios for the periods prior to April 1, 2001 have not been restated to reflect this change in presentation.
(3) Returns are historical and are calculated by determining the percentage change in net asset value with all distributions reinvested. Total return is not computed on an annualized basis.
(4) Includes the Fund's share of its corresponding Portfolio's allocated expenses while the Fund was making investments directly into the Portfolio.
(5) Portfolio turnover represents the rate of portfolio activity for the period while the Fund was making investments directly into the Portfolio.
See notes to financial statements
51
Eaton Vance Limited Maturity Municipals Funds as of March 31, 2005
FINANCIAL STATEMENTS CONT'D
Financial Highlights
| | | California Limited Fund - Class C | |
| | | Period Ended
March 31, 2005(1)(2) | |
| Net asset value - Beginning of period | | $ | 10.000 | | |
| Income (loss) from operations | | | | | |
| Net investment income | | $ | 0.002 | | |
| Net realized and unrealized loss | | | (0.052 | ) | |
| Total loss from operations | | $ | (0.050 | ) | |
| Net asset value - End of period | | $ | 9.950 | | |
| Total Return(3) | | | (0.01 | )% | |
| Ratios/Supplemental Data | | | | | |
| Net assets, end of period (000's omitted) | | $ | 10 | | |
| Ratios (As a percentage of average daily net assets): | | | | | |
| Expenses | | | 0.00 | %(4)(5) | |
| Net investment income | | | 0.00 | %(4)(5) | |
| Portfolio Turnover of the Fund | | | 13 | % | |
(1) For the period from the commencement of offering of Class C shares, March 23, 2005 to March 31, 2005.
(2) Net investment income per share was computed using average shares outstanding.
(3) Returns are historical and are calculated by determining the percentage change in net asset value with all distributions reinvested. Total return is not computed on an annualized basis.
(4) Annualized.
(5) Represents less than 0.01%.
See notes to financial statements
52
Eaton Vance Limited Maturity Municipals Funds as of March 31, 2005
FINANCIAL STATEMENTS CONT'D
Financial Highlights
| | | Florida Limited Fund - Class A | |
| | | Year Ended March 31, | |
| | | 2005(1) | | 2004(1) | | 2003(1) | | 2002(1)(2) | | 2001(1) | |
| Net asset value - Beginning of year | | $ | 10.500 | | | $ | 10.480 | | | $ | 10.050 | | | $ | 10.130 | | | $ | 9.670 | | |
| Income (loss) from operations | | | | | | | | | | | | | | | | | | | | | |
| Net investment income | | $ | 0.387 | | | $ | 0.396 | | | $ | 0.420 | | | $ | 0.449 | | | $ | 0.449 | | |
| Net realized and unrealized gain (loss) | | | (0.277 | ) | | | 0.018 | | | | 0.425 | | | | (0.077 | ) | | | 0.455 | | |
| Total income from operations | | $ | 0.110 | | | $ | 0.414 | | | $ | 0.845 | | | $ | 0.372 | | | $ | 0.904 | | |
| Less distributions | | | | | | | | | | | | | | | | | | | | | |
| From net investment income | | $ | (0.380 | ) | | $ | (0.394 | ) | | $ | (0.415 | ) | | $ | (0.452 | ) | | $ | (0.444 | ) | |
| Total distributions | | $ | (0.380 | ) | | $ | (0.394 | ) | | $ | (0.415 | ) | | $ | (0.452 | ) | | $ | (0.444 | ) | |
| Net asset value - End of year | | $ | 10.230 | | | $ | 10.500 | | | $ | 10.480 | | | $ | 10.050 | | | $ | 10.130 | | |
| Total Return(3) | | | 1.06 | % | | | 3.99 | % | | | 8.59 | % | | | 3.71 | % | | | 9.59 | % | |
| Ratios/Supplemental Data | | | | | | | | | | | | | | | | | | | | | |
| Net assets, end of year (000's omitted) | | $ | 44,720 | | | $ | 45,088 | | | $ | 47,033 | | | $ | 33,611 | | | $ | 31,754 | | |
| Ratios (As a percentage of average daily net assets): | | | | | | | | | | | | | | | | | | | | | |
| Expenses(4) | | | 0.82 | % | | | 0.82 | % | | | 0.84 | % | | | 0.94 | % | | | 0.95 | % | |
| Expenses after custodian fee reduction(4) | | | 0.81 | % | | | 0.82 | % | | | 0.81 | % | | | 0.91 | % | | | 0.93 | % | |
| Net investment income | | | 3.74 | % | | | 3.76 | % | | | 4.07 | % | | | 4.42 | % | | | 4.57 | % | |
| Portfolio Turnover of the Portfolio(5) | | | 8 | % | | | 13 | % | | | 23 | % | | | 15 | % | | | 7 | % | |
| Portfolio Turnover of the Fund | | | 16 | % | | | - | | | | - | | | | - | | | | - | | |
(1) Net investment income per share was computed using average shares outstanding.
(2) The Fund, through its investment in the Portfolio, has adopted the provisions of the revised AICPA Audit and Accounting Guide for Investment Companies and began using the interest method to amortize premiums on fixed-income securities. The effect of this change for the year ended March 31, 2002 was to increase net investment income per share by $0.001, increase net realized and unrealized losses per share by $0.001 and increase the ratio net investment income to average net assets from 4.41% to 4.42%. Per share data and ratios for the per iods prior to April 1, 2001 have not been restated to reflect this change in presentation.
(3) Returns are historical and are calculated by determining the percentage change in net asset value with all distributions reinvested. Total return is not computed on an annualized basis.
(4) Includes the Fund's share of its corresponding Portfolio's allocated expenses while the Fund was making investments directly into the Portfolio.
(5) Portfolio turnover represents the rate of portfolio activity for the period while the Fund was making investments directly into the Portfolio.
See notes to financial statements
53
Eaton Vance Limited Maturity Municipals Funds as of March 31, 2005
FINANCIAL STATEMENTS CONT'D
Financial Highlights
| | | Florida Limited Fund - Class B | |
| | | Year Ended March 31, | |
| | | 2005(1) | | 2004(1) | | 2003(1) | | 2002(1)(2) | | 2001(1) | |
| Net asset value - Beginning of year | | $ | 10.500 | | | $ | 10.480 | | | $ | 10.050 | | | $ | 10.130 | | | $ | 9.670 | | |
| Income (loss) from operations | | | |
| Net investment income | | $ | 0.310 | | | $ | 0.316 | | | $ | 0.340 | | | $ | 0.377 | | | $ | 0.369 | | |
| Net realized and unrealized gain (loss) | | | (0.280 | ) | | | 0.018 | | | | 0.433 | | | | (0.077 | ) | | | 0.460 | | |
| Total income from operations | | $ | 0.030 | | | $ | 0.334 | | | $ | 0.773 | | | $ | 0.300 | | | $ | 0.829 | | |
| Less distributions | | | |
| From net investment income | | $ | (0.300 | ) | | $ | (0.314 | ) | | $ | (0.343 | ) | | $ | (0.380 | ) | | $ | (0.369 | ) | |
| Total distributions | | $ | (0.300 | ) | | $ | (0.314 | ) | | $ | (0.343 | ) | | $ | (0.380 | ) | | $ | (0.369 | ) | |
| Net asset value - End of year | | $ | 10.230 | | | $ | 10.500 | | | $ | 10.480 | | | $ | 10.050 | | | $ | 10.130 | | |
| Total Return(3) | | | 0.28 | % | | | 3.22 | % | | | 7.84 | % | | | 2.98 | % | | | 8.76 | % | |
| Ratios/Supplemental Data | | | |
| Net assets, end of year (000's omitted) | | $ | 8,361 | | | $ | 8,944 | | | $ | 8,217 | | | $ | 2,621 | | | $ | 4,905 | | |
| Ratios (As a percentage of average daily net assets): | | | | | | | | | | | | | | | | | | | | | |
| Expenses(4) | | | 1.57 | % | | | 1.57 | % | | | 1.59 | % | | | 1.69 | % | | | 1.70 | % | |
| Expenses after custodian fee reduction(4) | | | 1.56 | % | | | 1.57 | % | | | 1.56 | % | | | 1.66 | % | | | 1.68 | % | |
| Net investment income | | | 3.00 | % | | | 3.01 | % | | | 3.28 | % | | | 3.72 | % | | | 3.81 | % | |
| Portfolio Turnover of the Portfolio(5) | | | 8 | % | | | 13 | % | | | 23 | % | | | 15 | % | | | 7 | % | |
| Portfolio Turnover of the Fund | | | 16 | % | | | - | | | | - | | | | - | | | | - | | |
(1) Net investment income per share was computed using average shares outstanding.
(2) The Fund, through its investment in the Portfolio, has adopted the provisions of the revised AICPA Audit and Accounting Guide for Investment Companies and began using the interest method to amortize premiums on fixed-income securities. The effect of this change for the year ended March 31, 2002 was to increase net investment income per share by $0.001, increase net realized and unrealized losses per share by $0.001 and increase the ratio net investment income to average net assets from 3.71% to 3.72%. Per share data and ratios for the per iods prior to April 1, 2001 have not been restated to reflect this change in presentation.
(3) Returns are historical and are calculated by determining the percentage change in net asset value with all distributions reinvested. Total return is not computed on an annualized basis.
(4) Includes the Fund's share of its corresponding Portfolio's allocated expenses while the Fund was making investments directly into the Portfolio.
(5) Portfolio turnover represents the rate of portfolio activity for the period while the Fund was making investments directly into the Portfolio.
See notes to financial statements
54
Eaton Vance Limited Maturity Municipals Funds as of March 31, 2005
FINANCIAL STATEMENTS CONT'D
Financial Highlights
| | | Florida Limited Fund - Class C | |
| | | Year Ended March 31, | |
| | | 2005(1) | | 2004(1) | | 2003(1) | | 2002(1)(2) | | 2001(1) | |
| Net asset value - Beginning of year | | $ | 9.910 | | | $ | 9.890 | | | $ | 9.490 | | | $ | 9.570 | | | $ | 9.140 | | |
| Income (loss) from operations | | | |
| Net investment income | | $ | 0.293 | | | $ | 0.298 | | | $ | 0.319 | | | $ | 0.348 | | | $ | 0.356 | | |
| Net realized and unrealized gain (loss) | | | (0.268 | ) | | | 0.021 | | | | 0.404 | | | | (0.068 | ) | | | 0.423 | | |
| Total income from operations | | $ | 0.025 | | | $ | 0.319 | | | $ | 0.723 | | | $ | 0.280 | | | $ | 0.779 | | |
| Less distributions | | | |
| From net investment income | | $ | (0.285 | ) | | $ | (0.299 | ) | | $ | (0.323 | ) | | $ | (0.360 | ) | | $ | (0.349 | ) | |
| Total distributions | | $ | (0.285 | ) | | $ | (0.299 | ) | | $ | (0.323 | ) | | $ | (0.360 | ) | | $ | (0.349 | ) | |
| Net asset value - End of year | | $ | 9.650 | | | $ | 9.910 | | | $ | 9.890 | | | $ | 9.490 | | | $ | 9.570 | | |
| Total Return(3) | | | 0.19 | %(6) | | | 3.24 | % | | | 7.76 | % | | | 2.93 | % | | | 8.70 | % | |
| Ratios/Supplemental Data | | | |
| Net assets, end of year (000's omitted) | | $ | 17,467 | | | $ | 19,226 | | | $ | 12,883 | | | $ | 4,322 | | | $ | 2,609 | | |
| Ratios (As a percentage of average daily net assets): | | | | | | | | | | | | | | | | | | | | | |
| Expenses(4) | | | 1.57 | % | | | 1.57 | % | | | 1.59 | % | | | 1.69 | % | | | 1.69 | % | |
| Expenses after custodian fee reduction(4) | | | 1.56 | % | | | 1.57 | % | | | 1.56 | % | | | 1.66 | % | | | 1.67 | % | |
| Net investment income | | | 3.00 | % | | | 3.00 | % | | | 3.26 | % | | | 3.63 | % | | | 3.84 | % | |
| Portfolio Turnover of the Portfolio(5) | | | 8 | % | | | 13 | % | | | 23 | % | | | 15 | % | | | 7 | % | |
| Portfolio Turnover of the Fund | | | 16 | % | | | - | | | | - | | | | - | | | | - | | |
(1) Net investment income per share was computed using average shares outstanding.
(2) The Fund, through its investment in the Portfolio, has adopted the provisions of the revised AICPA Audit and Accounting Guide for Investment Companies and began using the interest method to amortize premiums on fixed-income securities. The effect of this change for the year ended March 31, 2002 was to increase net investment income per share by $0.001, increase net realized and unrealized losses per share by $0.001 and increase the ratio net investment income to average net assets from 3.62% to 3.63%. Per share data and ratios for the per iods prior to April 1, 2001 have not been restated to reflect this change in presentation.
(3) Returns are historical and are calculated by determining the percentage change in net asset value with all distributions reinvested. Total return is not computed on an annualized basis.
(4) Includes the Fund's share of its corresponding Portfolio's allocated expenses while the Fund was making investments directly into the Portfolio.
(5) Portfolio turnover represents the rate of portfolio activity for the period while the Fund was making investments directly into the Portfolio.
(6) Total return reflects a decrease of 0.06% due to a change in the timing of the payment and reinvestment of distributions.
See notes to financial statements
55
Eaton Vance Limited Maturity Municipals Funds as of March 31, 2005
FINANCIAL STATEMENTS CONT'D
Financial Highlights
| | | Massachusetts Limited Fund - Class A | |
| | | Year Ended March 31, | |
| | | 2005(1) | | 2004(1) | | 2003(1) | | 2002(1)(2) | | 2001(1) | |
| Net asset value - Beginning of year | | $ | 10.460 | | | $ | 10.450 | | | $ | 9.980 | | | $ | 10.110 | | | $ | 9.680 | | |
| Income (loss) from operations | | | | | | | | | | | | | | | | | | | | | |
| Net investment income | | $ | 0.370 | | | $ | 0.384 | | | $ | 0.413 | | | $ | 0.443 | | | $ | 0.462 | | |
| Net realized and unrealized gain (loss) | | | (0.287 | ) | | | 0.013 | | | | 0.483 | | | | (0.124 | ) | | | 0.413 | | |
| Total income from operations | | $ | 0.083 | | | $ | 0.397 | | | $ | 0.896 | | | $ | 0.319 | | | $ | 0.875 | | |
| Less distributions | | | | | | | | | | | | | | | | | | | | | |
| From net investment income | | $ | (0.363 | ) | | $ | (0.387 | ) | | $ | (0.426 | ) | | $ | (0.449 | ) | | $ | (0.445 | ) | |
| Total distributions | | $ | (0.363 | ) | | $ | (0.387 | ) | | $ | (0.426 | ) | | $ | (0.449 | ) | | $ | (0.445 | ) | |
| Net asset value - End of year | | $ | 10.180 | | | $ | 10.460 | | | $ | 10.450 | | | $ | 9.980 | | | $ | 10.110 | | |
| Total Return(3) | | | 0.79 | % | | | 3.84 | % | | | 9.17 | % | | | 3.17 | % | | | 9.26 | % | |
| Ratios/Supplemental Data | | | | | | | | | | | | | | | | | | | | | |
| Net assets, end of year (000's omitted) | | $ | 48,901 | | | $ | 47,567 | | | $ | 47,321 | | | $ | 33,848 | | | $ | 32,736 | | |
| Ratios (As a percentage of average daily net assets): | | | | | | | | | | | | | | | | | | | | | |
| Expenses(4) | | | 0.82 | % | | | 0.80 | % | | | 0.85 | % | | | 0.94 | % | | | 0.95 | % | |
| Expenses after custodian fee reduction(4) | | | 0.81 | % | | | 0.80 | % | | | 0.83 | % | | | 0.91 | % | | | 0.92 | % | |
| Net investment income | | | 3.59 | % | | | 3.66 | % | | | 4.01 | % | | | 4.37 | % | | | 4.70 | % | |
| Portfolio Turnover of the Portfolio(5) | | | 13 | % | | | 12 | % | | | 22 | % | | | 8 | % | | | 8 | % | |
| Portfolio Turnover of the Fund | | | 7 | % | | | - | | | | - | | | | - | | | | - | | |
(1) Net investment income per share was computed using average shares outstanding.
(2) The Fund, through its investment in the Portfolio, has adopted the provisions of the revised AICPA Audit and Accounting Guide for Investment Companies and began using the interest method to amortize premiums on fixed-income securities. The effect of this change for the year ended March 31, 2002 was to increase net investment income per share by $0.001, increase net realized and unrealized losses per share by $0.001 and increase the ratio of net investment income to average net assets from 4.36% to 4.37%. Per share data and ratios for the periods prior to April 1, 2001 have not been restated to reflect this change in presentation.
(3) Returns are historical and are calculated by determining the percentage change in net asset value with all distributions reinvested. Total return is not computed on an annualized basis.
(4) Includes the Fund's share of its corresponding Portfolio's allocated expenses while the Fund was making investments directly into the Portfolio.
(5) Portfolio turnover represents the rate of portfolio activity for the period while the Fund was making investments directly into the Portfolio.
See notes to financial statements
56
Eaton Vance Limited Maturity Municipals Funds as of March 31, 2005
FINANCIAL STATEMENTS CONT'D
Financial Highlights
| | | Massachusetts Limited Fund - Class B | |
| | | Year Ended March 31, | |
| | | 2005(1) | | 2004(1) | | 2003(1) | | 2002(1)(2) | | 2001(1) | |
| Net asset value - Beginning of year | | $ | 10.450 | | | $ | 10.430 | | | $ | 9.970 | | | $ | 10.110 | | | $ | 9.680 | | |
| Income (loss) from operations | | | |
| Net investment income | | $ | 0.292 | | | $ | 0.304 | | | $ | 0.331 | | | $ | 0.364 | | | $ | 0.387 | | |
| Net realized and unrealized gain (loss) | | | (0.289 | ) | | | 0.022 | | | | 0.475 | | | | (0.135 | ) | | | 0.410 | | |
| Total income from operations | | $ | 0.003 | | | $ | 0.326 | | | $ | 0.806 | | | $ | 0.229 | | | $ | 0.797 | | |
| Less distributions | | | |
| From net investment income | | $ | (0.283 | ) | | $ | (0.306 | ) | | $ | (0.346 | ) | | $ | (0.369 | ) | | $ | (0.367 | ) | |
| Total distributions | | $ | (0.283 | ) | | $ | (0.306 | ) | | $ | (0.346 | ) | | $ | (0.369 | ) | | $ | (0.367 | ) | |
| Net asset value - End of year | | $ | 10.170 | | | $ | 10.450 | | | $ | 10.430 | | | $ | 9.970 | | | $ | 10.110 | | |
| Total Return(3) | | | 0.02 | % | | | 3.16 | % | | | 8.23 | % | | | 2.27 | % | | | 8.41 | % | |
| Ratios/Supplemental Data | | | |
| Net assets, end of year (000's omitted) | | $ | 10,350 | | | $ | 10,818 | | | $ | 9,127 | | | $ | 3,969 | | | $ | 2,218 | | |
| Ratios (As a percentage of average daily net assets): | | | | | | | | | | | | | | | | | | | | | |
| Expenses(4) | | | 1.57 | % | | | 1.55 | % | | | 1.60 | % | | | 1.69 | % | | | 1.70 | % | |
| Expenses after custodian fee reduction(4) | | | 1.56 | % | | | 1.55 | % | | | 1.58 | % | | | 1.66 | % | | | 1.67 | % | |
| Net investment income | | | 2.83 | % | | | 2.91 | % | | | 3.22 | % | | | 3.59 | % | | | 3.93 | % | |
| Portfolio Turnover of the Portfolio(5) | | | 13 | % | | | 12 | % | | | 22 | % | | | 8 | % | | | 8 | % | |
| Portfolio Turnover of the Fund | | | 7 | % | | | - | | | | - | | | | - | | | | - | | |
(1) Net investment income per share was computed using average shares outstanding.
(2) The Fund, through its investment in the Portfolio, has adopted the provisions of the revised AICPA Audit and Accounting Guide for Investment Companies and began using the interest method to amortize premiums on fixed-income securities. The effect of this change for the year ended March 31, 2002 was to increase net investment income per share by $0.001, increase net realized and unrealized losses per share by $0.001 and increase the ratio of net investment income to average net assets from 3.58% to 3.59%. Per share data and ratios for the periods prior to April 1, 2001 have not been restated to reflect this change in presentation.
(3) Returns are historical and are calculated by determining the percentage change in net asset value with all distributions reinvested. Total return is not computed on an annualized basis.
(4) Includes the Fund's share of its corresponding Portfolio's allocated expenses while the Fund was making investments directly into the Portfolio.
(5) Portfolio turnover represents the rate of portfolio activity for the period while the Fund was making investments directly into the Portfolio.
See notes to financial statements
57
Eaton Vance Limited Maturity Municipals Funds as of March 31, 2005
FINANCIAL STATEMENTS CONT'D
Financial Highlights
| | | Massachusetts Limited Fund - Class C | |
| | | Year Ended March 31, | |
| | | 2005(1) | | 2004(1) | | 2003(1) | | 2002(1)(2) | | 2001(1) | |
| Net asset value - Beginning of year | | $ | 10.020 | | | $ | 10.010 | | | $ | 9.560 | | | $ | 9.680 | | | $ | 9.260 | | |
| Income (loss) from operations | | | |
| Net investment income | | $ | 0.280 | | | $ | 0.289 | | | $ | 0.316 | | | $ | 0.348 | | | $ | 0.375 | | |
| Net realized and unrealized gain (loss) | | | (0.287 | ) | | | 0.017 | | | | 0.465 | | | | (0.114 | ) | | | 0.395 | | |
| Total income (loss) from operations | | $ | (0.007 | ) | | $ | 0.306 | | | $ | 0.781 | | | $ | 0.234 | | | $ | 0.770 | | |
| Less distributions | | | |
| From net investment income | | $ | (0.273 | ) | | $ | (0.296 | ) | | $ | (0.331 | ) | | $ | (0.354 | ) | | $ | (0.350 | ) | |
| Total distributions | | $ | (0.273 | ) | | $ | (0.296 | ) | | $ | (0.331 | ) | | $ | (0.354 | ) | | $ | (0.350 | ) | |
| Net asset value - End of year | | $ | 9.740 | | | $ | 10.020 | | | $ | 10.010 | | | $ | 9.560 | | | $ | 9.680 | | |
| Total Return(3) | | | (0.14 | )%(6) | | | 3.09 | % | | | 8.32 | % | | | 2.40 | % | | | 8.49 | % | |
| Ratios/Supplemental Data | | | |
| Net assets, end of year (000's omitted) | | $ | 27,589 | | | $ | 28,195 | | | $ | 15,231 | | | $ | 5,632 | | | $ | 2,573 | | |
| Ratios (As a percentage of average daily net assets): | | | | | | | | | | | | | | | | | | | | | |
| Expenses(4) | | | 1.57 | % | | | 1.55 | % | | | 1.60 | % | | | 1.69 | % | | | 1.71 | % | |
| Expenses after custodian fee reduction(4) | | | 1.56 | % | | | 1.55 | % | | | 1.58 | % | | | 1.66 | % | | | 1.68 | % | |
| Net investment income | | | 2.83 | % | | | 2.88 | % | | | 3.20 | % | | | 3.58 | % | | | 3.99 | % | |
| Portfolio Turnover of the Portfolio(5) | | | 13 | % | | | 12 | % | | | 22 | % | | | 8 | % | | | 8 | % | |
| Portfolio Turnover of the Fund | | | 7 | % | | | - | | | | - | | | | - | | | | - | | |
(1) Net investment income per share was computed using average shares outstanding.
(2) The Fund, through its investment in the Portfolio, has adopted the provisions of the revised AICPA Audit and Accounting Guide for Investment Companies and began using the interest method to amortize premiums on fixed-income securities. The effect of this change for the year ended March 31, 2002 was to increase net investment income per share by $0.001, increase net realized and unrealized losses per share by $0.001 and increase the ratio of net investment income to average net assets from 3.57% to 3.58%. Per share data and ratios for the periods prior to April 1, 2001 have not been restated to reflect this change in presentation.
(3) Returns are historical and are calculated by determining the percentage change in net asset value with all distributions reinvested. Total return is not computed on an annualized basis.
(4) Includes the Fund's share of its corresponding Portfolio's allocated expenses while the Fund was making investments directly into the Portfolio.
(5) Portfolio turnover represents the rate of portfolio activity for the period while the Fund was making investments directly into the Portfolio.
(6) Total return reflects a decrease of 0.05% due to a change in the timing of the payment and reinvestment of distributions.
See notes to financial statements
58
Eaton Vance Limited Maturity Municipals Funds as of March 31, 2005
FINANCIAL STATEMENTS CONT'D
Financial Highlights
| | | New Jersey Limited Fund - Class A | |
| | | Year Ended March 31, | |
| | | 2005(1) | | 2004(1) | | 2003(1) | | 2002(1)(2) | | 2001 | |
| Net asset value - Beginning of year | | $ | 10.360 | | | $ | 10.300 | | | $ | 10.000 | | | $ | 10.180 | | | $ | 9.780 | | |
| Income (loss) from operations | | | | | | | | | | | | | | | | | | | | | |
| Net investment income | | $ | 0.366 | | | $ | 0.379 | | | $ | 0.427 | | | $ | 0.453 | | | $ | 0.470 | | |
| Net realized and unrealized gain (loss) | | | (0.266 | ) | | | 0.052 | | | | 0.301 | | | | (0.169 | ) | | | 0.392 | | |
| Total income from operations | | $ | 0.100 | | | $ | 0.431 | | | $ | 0.728 | | | $ | 0.284 | | | $ | 0.862 | | |
| Less distributions | | | | | | | | | | | | | | | | | | | | | |
| From net investment income | | $ | (0.360 | ) | | $ | (0.371 | ) | | $ | (0.428 | ) | | $ | (0.464 | ) | | $ | (0.462 | ) | |
| Total distributions | | $ | (0.360 | ) | | $ | (0.371 | ) | | $ | (0.428 | ) | | $ | (0.464 | ) | | $ | (0.462 | ) | |
| Net asset value - End of year | | $ | 10.100 | | | $ | 10.360 | | | $ | 10.300 | | | $ | 10.000 | | | $ | 10.180 | | |
| Total Return(3) | | | 0.98 | % | | | 4.22 | % | | | 7.45 | % | | | 2.82 | % | | | 9.04 | % | |
| Ratios/Supplemental Data | | | | | | | | | | | | | | | | | | | | | |
| Net assets, end of year (000's omitted) | | $ | 43,424 | | | $ | 46,192 | | | $ | 39,572 | | | $ | 34,898 | | | $ | 30,889 | | |
| Ratios (As a percentage of average daily net assets): | | | | | | | | | | | | | | | | | | | | | |
| Expenses(4) | | | 0.87 | % | | | 0.84 | % | | | 0.90 | % | | | 0.96 | % | | | 0.98 | % | |
| Expenses after custodian fee reduction(4) | | | 0.86 | % | | | 0.84 | % | | | 0.89 | % | | | 0.94 | % | | | 0.96 | % | |
| Net investment income | | | 3.59 | % | | | 3.66 | % | | | 4.17 | % | | | 4.47 | % | | | 4.73 | % | |
| Portfolio Turnover of the Portfolio(5) | | | 11 | % | | | 11 | % | | | 25 | % | | | 17 | % | | | 11 | % | |
| Portfolio Turnover of the Fund | | | 14 | % | | | - | | | | - | | | | - | | | | - | | |
(1) Net investment income per share was computed using average shares outstanding.
(2) The Fund, through its investment in the Portfolio, has adopted the provisions of the revised AICPA Audit and Accounting Guide for Investment Companies and began using the interest method to amortize premiums on fixed-income securities. The effect of this change for the year ended March 31, 2002 was to increase net investment income per share by $0.001, increase net realized and unrealized losses per share by $0.001 and increase the ratio of net investment income to average net assets from 4.46% to 4.47%. Per-share data and ratios for the periods prior to April 1, 2001 have not been restated to reflect this change in presentation.
(3) Returns are historical and are calculated by determining the percentage change in net asset value with all distributions reinvested. Total return is not computed on an annualized basis.
(4) Includes the Fund's share of its corresponding Portfolio's allocated expenses while the Fund was making investments directly into the Portfolio.
(5) Portfolio turnover represents the rate of portfolio activity for the period while the Fund was making investments directly into the Portfolio.
See notes to financial statements
59
Eaton Vance Limited Maturity Municipals Funds as of March 31, 2005
FINANCIAL STATEMENTS CONT'D
Financial Highlights
| | | New Jersey Limited Fund - Class B | |
| | | Year Ended March 31, | |
| | | 2005(1) | | 2004(1) | | 2003(1) | | 2002(1)(2) | | 2001 | |
| Net asset value - Beginning of year | | $ | 10.350 | | | $ | 10.290 | | | $ | 9.990 | | | $ | 10.180 | | | $ | 9.780 | | |
| Income (loss) from operations | | | | | | | | | | | | | | | | | | | | | |
| Net investment income | | $ | 0.290 | | | $ | 0.302 | | | $ | 0.343 | | | $ | 0.376 | | | $ | 0.411 | | |
| Net realized and unrealized gain (loss) | | | (0.260 | ) | | | 0.051 | | | | 0.306 | | | | (0.182 | ) | | | 0.373 | | |
| Total income from operations | | $ | 0.030 | | | $ | 0.353 | | | $ | 0.649 | | | $ | 0.194 | | | $ | 0.784 | | |
| Less distributions | | | | | | | | | | | | | | | | | | | | | |
| From net investment income | | $ | (0.280 | ) | | $ | (0.293 | ) | | $ | (0.349 | ) | | $ | (0.384 | ) | | $ | (0.384 | ) | |
| Total distributions | | $ | (0.280 | ) | | $ | (0.293 | ) | | $ | (0.349 | ) | | $ | (0.384 | ) | | $ | (0.384 | ) | |
| Net asset value - End of year | | $ | 10.100 | | | $ | 10.350 | | | $ | 10.290 | | | $ | 9.990 | | | $ | 10.180 | | |
| Total Return(3) | | | 0.30 | % | | | 3.45 | % | | | 6.63 | % | | | 1.92 | % | | | 8.19 | % | |
| Ratios/Supplemental Data | | | | | | | | | | | | | | | | | | | | | |
| Net assets, end of year (000's omitted) | | $ | 8,851 | | | $ | 10,211 | | | $ | 8,099 | | | $ | 3,152 | | | $ | 2,476 | | |
| Ratios (As a percentage of average daily net assets): | | | | | | | | | | | | | | | | | | | | | |
| Expenses(4) | | | 1.62 | % | | | 1.59 | % | | | 1.65 | % | | | 1.71 | % | | | 1.73 | % | |
| Expenses after custodian fee reduction(4) | | | 1.61 | % | | | 1.59 | % | | | 1.64 | % | | | 1.69 | % | | | 1.71 | % | |
| Net investment income | | | 2.84 | % | | | 2.91 | % | | | 3.35 | % | | | 3.70 | % | | | 3.97 | % | |
| Portfolio Turnover of the Portfolio(5) | | | 11 | % | | | 11 | % | | | 25 | % | | | 17 | % | | | 11 | % | |
| Portfolio Turnover of the Fund | | | 14 | % | | | - | | | | - | | | | - | | | | - | | |
(1) Net investment income per share was computed using average shares outstanding.
(2) The Fund, through its investment in the Portfolio, has adopted the provisions of the revised AICPA Audit and Accounting Guide for Investment Companies and began using the interest method to amortize premiums on fixed-income securities. The effect of this change for the year ended March 31, 2002 was to increase net investment income per share by $0.001, increase net realized and unrealized losses per share by $0.001 and increase the ratio of net investment income to average net assets from 3.69% to 3.70%. Per-share data and ratios for the periods prior to April 1, 2001 have not been restated to reflect this change in presentation.
(3) Returns are historical and are calculated by determining the percentage change in net asset value with all distributions reinvested. Total return is not computed on an annualized basis.
(4) Includes the Fund's share of its corresponding Portfolio's allocated expenses while the Fund was making investments directly into the Portfolio.
(5) Portfolio turnover represents the rate of portfolio activity for the period while the Fund was making investments directly into the Portfolio.
See notes to financial statements
60
Eaton Vance Limited Maturity Municipals Funds as of March 31, 2005
FINANCIAL STATEMENTS CONT'D
Financial Highlights
| | | New York Limited Fund - Class A | |
| | | Year Ended March 31, | |
| | | 2005(1) | | 2004(1) | | 2003(1) | | 2002(1)(2) | | 2001 | |
| Net asset value - Beginning of year | | $ | 10.850 | | | $ | 10.770 | | | $ | 10.360 | | | $ | 10.550 | | | $ | 10.030 | | |
| Income (loss) from operations | | | |
| Net investment income | | $ | 0.394 | | | $ | 0.400 | | | $ | 0.430 | | | $ | 0.460 | | | $ | 0.470 | | |
| Net realized and unrealized gain (loss) | | | (0.315 | ) | | | 0.081 | | | | 0.415 | | | | (0.180 | ) | | | 0.519 | | |
| Total income from operations | | $ | 0.079 | | | $ | 0.481 | | | $ | 0.845 | | | $ | 0.280 | | | $ | 0.989 | | |
| Less distributions | | | |
| From net investment income | | $ | (0.389 | ) | | $ | (0.401 | ) | | $ | (0.435 | ) | | $ | (0.470 | ) | | $ | (0.469 | ) | |
| Total distributions | | $ | (0.389 | ) | | $ | (0.401 | ) | | $ | (0.435 | ) | | $ | (0.470 | ) | | $ | (0.469 | ) | |
| Net asset value - End of year | | $ | 10.540 | | | $ | 10.850 | | | $ | 10.770 | | | $ | 10.360 | | | $ | 10.550 | | |
| Total Return(3) | | | 0.73 | % | | | 4.51 | % | | | 8.32 | % | | | 2.67 | % | | | 10.11 | % | |
| Ratios/Supplemental Data | | | |
| Net assets, end of year (000's omitted) | | $ | 62,843 | | | $ | 67,711 | | | $ | 60,721 | | | $ | 44,811 | | | $ | 43,835 | | |
| Ratios (As a percentage of average daily net assets): | | | | | | | | | | | | | | | | | | | | | |
| Expenses(4) | | | 0.80 | % | | | 0.79 | % | | | 0.83 | % | | | 0.92 | % | | | 0.94 | % | |
| Expenses after custodian fee reduction(4) | | | 0.80 | % | | | 0.79 | % | | | 0.81 | % | | | 0.89 | % | | | 0.92 | % | |
| Net investment income | | | 3.69 | % | | | 3.69 | % | | | 4.03 | % | | | 4.37 | % | | | 4.59 | % | |
| Portfolio Turnover of the Portfolio(5) | | | 7 | % | | | 20 | % | | | 18 | % | | | 11 | % | | | 10 | % | |
| Portfolio Turnover of the Fund | | | 12 | % | | | - | | | | - | | | | - | | | | - | | |
(1) Net investment income per share was computed using average shares outstanding.
(2) The Fund, through its investment in the Portfolio, has adopted the provisions of the revised AICPA Audit and Accounting Guide for Investment Companies and began using the interest method to amortize premiums on fixed-income securities. The effect of this change for the year ended March 31, 2002 was to increase net investment income per share by $0.001, increase net realized and unrealized losses per share by $0.001 and increase the ratio of net investment income to average net assets from 4.36% to 4.37%. Per-share data and ratios for the periods prior to April 1, 2001 have not been restated to reflect this change in presentation.
(3) Returns are historical and are calculated by determining the percentage change in net asset value with all distributions reinvested. Total return is not computed on an annualized basis.
(4) Includes the Fund's share of its corresponding Portfolio's allocated expenses while the Fund was making investments directly into the Portfolio.
(5) Portfolio turnover represents the rate of portfolio activity for the period while the Fund was making investments directly into the Portfolio.
See notes to financial statements
61
Eaton Vance Limited Maturity Municipals Funds as of March 31, 2005
FINANCIAL STATEMENTS CONT'D
Financial Highlights
| | | New York Limited Fund - Class B | |
| | | Year Ended March 31, | |
| | | 2005(1) | | 2004(1) | | 2003(1) | | 2002(1)(2) | | 2001 | |
| Net asset value - Beginning of year | | $ | 10.840 | | | $ | 10.760 | | | $ | 10.340 | | | $ | 10.550 | | | $ | 10.030 | | |
| Income (loss) from operations | | | | | | | | | | | | | | | | | | | | | |
| Net investment income | | $ | 0.314 | | | $ | 0.318 | | | $ | 0.346 | | | $ | 0.378 | | | $ | 0.397 | | |
| Net realized and unrealized gain (loss) | | | (0.317 | ) | | | 0.081 | | | | 0.428 | | | | (0.198 | ) | | | 0.512 | | |
| Total income (loss) from operations | | $ | (0.003 | ) | | $ | 0.399 | | | $ | 0.774 | | | $ | 0.180 | | | $ | 0.909 | | |
| Less distributions | | | | | | | | | | | | | | | | | | | | | |
| From net investment income | | $ | (0.307 | ) | | $ | (0.319 | ) | | $ | (0.354 | ) | | $ | (0.390 | ) | | $ | (0.389 | ) | |
| Total distributions | | $ | (0.307 | ) | | $ | (0.319 | ) | | $ | (0.354 | ) | | $ | (0.390 | ) | | $ | (0.389 | ) | |
| Net asset value - End of year | | $ | 10.530 | | | $ | 10.840 | | | $ | 10.760 | | | $ | 10.340 | | | $ | 10.550 | | |
| Total Return(3) | | | (0.03 | )% | | | 3.73 | % | | | 7.61 | % | | | 1.70 | % | | | 9.26 | % | |
| Ratios/Supplemental Data | | | | | | | | | | | | | | | | | | | | | |
| Net assets, end of year (000's omitted) | | $ | 12,518 | | | $ | 15,389 | | | $ | 14,227 | | | $ | 4,822 | | | $ | 4,227 | | |
| Ratios (As a percentage of average daily net assets): | | | | | | | | | | | | | | | | | | | | | |
| Expenses(4) | | | 1.55 | % | | | 1.54 | % | | | 1.58 | % | | | 1.67 | % | | | 1.69 | % | |
| Expenses after custodian fee reduction(4) | | | 1.55 | % | | | 1.54 | % | | | 1.56 | % | | | 1.64 | % | | | 1.67 | % | |
| Net investment income | | | 2.94 | % | | | 2.93 | % | | | 3.24 | % | | | 3.59 | % | | | 3.83 | % | |
| Portfolio Turnover of the Portfolio(5) | | | 7 | % | | | 20 | % | | | 18 | % | | | 11 | % | | | 10 | % | |
| Portfolio Turnover of the Fund | | | 12 | % | | | - | | | | - | | | | - | | | | - | | |
(1) Net investment income per share was computed using average shares outstanding.
(2) The Fund, through its investment in the Portfolio, has adopted the provisions of the revised AICPA Audit and Accounting Guide for Investment Companies and began using the interest method to amortize premiums on fixed-income securities. The effect of this change for the year ended March 31, 2002 was to increase net investment income per share by $0.001, increase net realized and unrealized losses per share by $0.001 and increase the ratio of net investment income to average net assets from 3.58% to 3.59%. Per-share data and ratios for the periods prior to April 1, 2001 have not been restated to reflect this change in presentation.
(3) Returns are historical and are calculated by determining the percentage change in net asset value with all distributions reinvested. Total return is not computed on an annualized basis.
(4) Includes the Fund's share of its corresponding Portfolio's allocated expenses while the Fund was making investments directly into the Portfolio.
(5) Portfolio turnover represents the rate of portfolio activity for the period while the Fund was making investments directly into the Portfolio.
See notes to financial statements
62
Eaton Vance Limited Maturity Municipals Funds as of March 31, 2005
FINANCIAL STATEMENTS CONT'D
Financial Highlights
| | | New York Limited Fund - Class C | |
| | | Year Ended March 31, | |
| | | 2005(1) | | 2004(1) | | 2003(1) | | 2002(1)(2) | | 2001 | |
| Net asset value - Beginning of year | | $ | 10.310 | | | $ | 10.230 | | | $ | 9.840 | | | $ | 10.010 | | | $ | 9.510 | | |
| Income (loss) from operations | | | | | | | | | | | | | | | | | | | | | |
| Net investment income | | $ | 0.299 | | | $ | 0.301 | | | $ | 0.324 | | | $ | 0.356 | | | $ | 0.369 | | |
| Net realized and unrealized gain (loss) | | | (0.299 | ) | | | 0.081 | | | | 0.401 | | | | (0.163 | ) | | | 0.493 | | |
| Total income from operations | | $ | - | | | $ | 0.382 | | | $ | 0.725 | | | $ | 0.193 | | | $ | 0.862 | | |
| Less distributions | | | | | | | | | | | | | | | | | | | | | |
| From net investment income | | $ | (0.290 | ) | | $ | (0.302 | ) | | $ | (0.335 | ) | | $ | (0.363 | ) | | $ | (0.362 | ) | |
| Total distributions | | $ | (0.290 | ) | | $ | (0.302 | ) | | $ | (0.335 | ) | | $ | (0.363 | ) | | $ | (0.362 | ) | |
| Net asset value - End of year | | $ | 10.020 | | | $ | 10.310 | | | $ | 10.230 | | | $ | 9.840 | | | $ | 10.010 | | |
| Total Return(3) | | | (0.07 | )%(6) | | | 3.76 | % | | | 7.49 | % | | | 1.92 | % | | | 9.26 | % | |
| Ratios/Supplemental Data | | | | | | | | | | | | | | | | | | | | | |
| Net assets, end of year (000's omitted) | | $ | 36,837 | | | $ | 42,627 | | | $ | 27,781 | | | $ | 7,408 | | | $ | 2,547 | | |
| Ratios (As a percentage of average daily net assets): | | | | | | | | | | | | | | | | | | | | | |
| Expenses(4) | | | 1.55 | % | | | 1.54 | % | | | 1.58 | % | | | 1.67 | % | | | 1.68 | % | |
| Expenses after custodian fee reduction(4) | | | 1.55 | % | | | 1.54 | % | | | 1.56 | % | | | 1.64 | % | | | 1.66 | % | |
| Net investment income | | | 2.94 | % | | | 2.92 | % | | | 3.19 | % | | | 3.57 | % | | | 3.83 | % | |
| Portfolio Turnover of the Portfolio(5) | | | 7 | % | | | 20 | % | | | 18 | % | | | 11 | % | | | 10 | % | |
| Portfolio Turnover of the Fund | | | 12 | % | | | - | | | | - | | | | - | | | | - | | |
(1) Net investment income per share was computed using average shares outstanding.
(2) The Fund, through its investment in the Portfolio, has adopted the provisions of the revised AICPA Audit and Accounting Guide for Investment Companies and began using the interest method to amortize premiums on fixed-income securities. The effect of this change for the year ended March 31, 2002 was to increase net investment income per share by $0.001, increase net realized and unrealized losses per share by $0.001 and increase the ratio of net investment income to average net assets from 3.56% to 3.57%. Per-share data and ratios for the periods prior to April 1, 2001 have not been restated to reflect this change in presentation.
(3) Returns are historical and are calculated by determining the percentage change in net asset value with all distributions reinvested. Total return is not computed on an annualized basis.
(4) Includes the Fund's share of its corresponding Portfolio's allocated expenses while the Fund was making investments directly into the Portfolio.
(5) Portfolio turnover represents the rate of portfolio activity for the period while the Fund was making investments directly into the Portfolio.
(6) Total return reflects a decrease of 0.06% due to a change in the timing of the payment and reinvestment of distributions.
See notes to financial statements
63
Eaton Vance Limited Maturity Municipals Funds as of March 31, 2005
FINANCIAL STATEMENTS CONT'D
Financial Highlights
| | | Ohio Limited Fund - Class A | |
| | | Year Ended March 31, | |
| | | 2005(1) | | 2004(1) | | 2003(1) | | 2002(1)(2) | | 2001(1) | |
| Net asset value - Beginning of year | | $ | 10.020 | | | $ | 10.010 | | | $ | 9.590 | | | $ | 9.760 | | | $ | 9.430 | | |
| Income (loss) from operations | | | |
| Net investment income | | $ | 0.363 | | | $ | 0.361 | | | $ | 0.392 | | | $ | 0.394 | | | $ | 0.431 | | |
| Net realized and unrealized gain (loss) | | | (0.293 | ) | | | 0.014 | | | | 0.410 | | | | (0.142 | ) | | | 0.343 | | |
| Total income from operations | | $ | 0.070 | | | $ | 0.375 | | | $ | 0.802 | | | $ | 0.252 | | | $ | 0.774 | | |
| Less distributions | | | |
| From net investment income | | $ | (0.350 | ) | | $ | (0.365 | ) | | $ | (0.382 | ) | | $ | (0.422 | ) | | $ | (0.444 | ) | |
| Total distributions | | $ | (0.350 | ) | | $ | (0.365 | ) | | $ | (0.382 | ) | | $ | (0.422 | ) | | $ | (0.444 | ) | |
| Net asset value - End of year | | $ | 9.740 | | | $ | 10.020 | | | $ | 10.010 | | | $ | 9.590 | | | $ | 9.760 | | |
| Total Return(3) | | | 0.70 | % | | | 3.80 | % | | | 8.52 | % | | | 2.62 | % | | | 8.42 | % | |
| Ratios/Supplemental Data | | | |
| Net assets, end of year (000's omitted) | | $ | 16,783 | | | $ | 20,404 | | | $ | 18,313 | | | $ | 16,310 | | | $ | 15,046 | | |
| Ratios (As a percentage of average daily net assets): | | | | | | | | | | | | | | | | | | | | | |
| Expenses(4) | | | 1.05 | % | | | 0.99 | % | | | 1.03 | % | | | 1.14 | % | | | 1.18 | % | |
| Expenses after custodian fee reduction(4) | | | 1.04 | % | | | 0.99 | % | | | 1.02 | % | | | 1.11 | % | | | 1.14 | % | |
| Net investment income | | | 3.68 | % | | | 3.61 | % | | | 3.96 | % | | | 4.05 | % | | | 4.53 | % | |
| Portfolio Turnover of the Portfolio(5) | | | 6 | % | | | 28 | % | | | 12 | % | | | 19 | % | | | 17 | % | |
| Portfolio Turnover of the Fund | | | 7 | % | | | - | | | | - | | | | - | | | | - | | |
(1) Net investment income per share was computed using average shares outstanding.
(2) The Fund, through its investment in the Portfolio, has adopted the provisions of the revised AICPA Audit and Accounting Guide for Investment Companies and began using the interest method to amortize premiums on fixed-income securities. The effect of this change for the year ended March 31, 2002 was to increase net investment income per share by less than $0.001, increase net realized and unrealized losses per share by less than $0.001 and increase the ratio net investment income to average net assets by less than 0.01%. Per share data and ratios for the periods prior to April 1, 2001 have not been restated to reflect this change in presentation.
(3) Returns are historical and are calculated by determining the percentage change in net asset value with all distributions reinvested. Total return is not computed on an annualized basis.
(4) Includes the Fund's share of its corresponding Portfolio's allocated expenses while the Fund was making investments directly into the Portfolio.
(5) Portfolio turnover represents the rate of portfolio activity for the period while the Fund was making investments directly into the Portfolio.
See notes to financial statements
64
Eaton Vance Limited Maturity Municipals Funds as of March 31, 2005
FINANCIAL STATEMENTS CONT'D
Financial Highlights
| | | Ohio Limited Fund - Class B | |
| | | Year Ended March 31, | |
| | | 2005(1) | | 2004(1) | | 2003(1) | | 2002(1)(2) | | 2001(1) | |
| Net asset value - Beginning of year | | $ | 10.010 | | | $ | 10.000 | | | $ | 9.590 | | | $ | 9.760 | | | $ | 9.430 | | |
| Income (loss) from operations | | | | | | | | | | | | | | | | | | | | | |
| Net investment income | | $ | 0.289 | | | $ | 0.286 | | | $ | 0.314 | | | $ | 0.321 | | | $ | 0.361 | | |
| Net realized and unrealized gain (loss) | | | (0.294 | ) | | | 0.017 | | | | 0.407 | | | | (0.139 | ) | | | 0.343 | | |
| Total income (loss) from operations | | $ | (0.005 | ) | | $ | 0.303 | | | $ | 0.721 | | | $ | 0.182 | | | $ | 0.704 | | |
| Less distributions | | | | | | | | | | | | | | | | | | | | | |
| From net investment income | | $ | (0.275 | ) | | $ | (0.293 | ) | | $ | (0.311 | ) | | $ | (0.352 | ) | | $ | (0.374 | ) | |
| Total distributions | | $ | (0.275 | ) | | $ | (0.293 | ) | | $ | (0.311 | ) | | $ | (0.352 | ) | | $ | (0.374 | ) | |
| Net asset value - End of year | | $ | 9.730 | | | $ | 10.010 | | | $ | 10.000 | | | $ | 9.590 | | | $ | 9.760 | | |
| Total Return(3) | | | (0.05 | )% | | | 3.06 | % | | | 7.64 | % | | | 1.89 | % | | | 7.63 | % | |
| Ratios/Supplemental Data | | | | | | | | | | | | | | | | | | | | | |
| Net assets, end of year (000's omitted) | | $ | 2,159 | | | $ | 2,623 | | | $ | 2,768 | | | $ | 1,390 | | | $ | 1,519 | | |
| Ratios (As a percentage of average daily net assets): | | | | | | | | | | | | | | | | | | | | | |
| Expenses(4) | | | 1.80 | % | | | 1.74 | % | | | 1.78 | % | | | 1.89 | % | | | 1.93 | % | |
| Expenses after custodian fee reduction(4) | | | 1.79 | % | | | 1.74 | % | | | 1.77 | % | | | 1.86 | % | | | 1.89 | % | |
| Net investment income | | | 2.94 | % | | | 2.86 | % | | | 3.17 | % | | | 3.30 | % | | | 3.79 | % | |
| Portfolio Turnover of the Portfolio(5) | | | 6 | % | | | 28 | % | | | 12 | % | | | 19 | % | | | 17 | % | |
| Portfolio Turnover of the Fund | | | 7 | % | | | - | | | | - | | | | - | | | | - | | |
(1) Net investment income per share was computed using average shares outstanding.
(2) The Fund, through its investment in the Portfolio, has adopted the provisions of the revised AICPA Audit and Accounting Guide for Investment Companies and began using the interest method to amortize premiums on fixed-income securities. The effect of this change for the year ended March 31, 2002 was to increase net investment income per share by less than $0.001, increase net realized and unrealized losses per share by less than $0.001 and increase the ratio net investment income to average net assets by less than 0.01%. Per share data and ratios for the periods prior to April 1, 2001 have not been restated to reflect this change in presentation.
(3) Returns are historical and are calculated by determining the percentage change in net asset value with all distributions reinvested. Total return is not computed on an annualized basis.
(4) Includes the Fund's share of its corresponding Portfolio's allocated expenses while the Fund was making investments directly into the Portfolio.
(5) Portfolio turnover represents the rate of portfolio activity for the period while the Fund was making investments directly into the Portfolio.
See notes to financial statements
65
Eaton Vance Limited Maturity Municipals Funds as of March 31, 2005
FINANCIAL STATEMENTS CONT'D
Financial Highlights
| | | Pennsylvania Limited Fund - Class A | |
| | | Year Ended March 31, | |
| | | 2005(1) | | 2004(1) | | 2003(1) | | 2002(1)(2) | | 2001(1) | |
| Net asset value - Beginning of year | | $ | 10.550 | | | $ | 10.470 | | | $ | 10.130 | | | $ | 10.270 | | | $ | 9.870 | | |
| Income (loss) from operations | | | | | | | | | | | | | | | | | | | | | |
| Net investment income | | $ | 0.402 | | | $ | 0.406 | | | $ | 0.440 | | | $ | 0.453 | | | $ | 0.472 | | |
| Net realized and unrealized gain (loss) | | | (0.272 | ) | | | 0.084 | | | | 0.349 | | | | (0.130 | ) | | | 0.388 | | |
| Total income from operations | | $ | 0.130 | | | $ | 0.490 | | | $ | 0.789 | | | $ | 0.323 | | | $ | 0.860 | | |
| Less distributions | | | | | | | | | | | | | | | | | | | | | |
| From net investment income | | $ | (0.400 | ) | | $ | (0.410 | ) | | $ | (0.449 | ) | | $ | (0.463 | ) | | $ | (0.460 | ) | |
| Total distributions | | $ | (0.400 | ) | | $ | (0.410 | ) | | $ | (0.449 | ) | | $ | (0.463 | ) | | $ | (0.460 | ) | |
| Net asset value - End of year | | $ | 10.280 | | | $ | 10.550 | | | $ | 10.470 | | | $ | 10.130 | | | $ | 10.270 | | |
| Total Return(3) | | | 1.25 | % | | | 4.72 | % | | | 7.97 | % | | | 3.18 | % | | | 8.94 | % | |
| Ratios/Supplemental Data | | | | | | | | | | | | | | | | | | | | | |
| Net assets, end of year (000's omitted) | | $ | 33,611 | | | $ | 35,175 | | | $ | 33,580 | | | $ | 29,845 | | | $ | 28,840 | | |
| Ratios (As a percentage of average daily net assets): | | | | | | | | | | | | | | | | | | | | | |
| Expenses(4) | | | 0.88 | % | | | 0.85 | % | | | 0.89 | % | | | 0.97 | % | | | 0.99 | % | |
| Expenses after custodian fee reduction(4) | | | 0.87 | % | | | 0.85 | % | | | 0.87 | % | | | 0.92 | % | | | 0.96 | % | |
| Net investment income | | | 3.86 | % | | | 3.85 | % | | | 4.24 | % | | | 4.41 | % | | | 4.72 | % | |
| Portfolio Turnover of the Portfolio(5) | | | 0 | % | | | 8 | % | | | 3 | % | | | 20 | % | | | 6 | % | |
| Portfolio Turnover of the Fund | | | 6 | % | | | - | | | | - | | | | - | | | | - | | |
(1) Net investment income per share was computed using average shares outstanding.
(2) The Fund, through its investment in the Portfolio, has adopted the provisions of the revised AICPA Audit and Accounting Guide for Investment Companies and began using the interest method to amortize premiums on fixed-income securities. The effect of this change for the year ended March 31, 2002 was to increase net investment income per share by $0.001, increase net realized and unrealized losses per share by $0.001 and increase the ratio of net investment income to average net assets from 4.40% to 4.41%. Per-share data and ratios for the periods prior to April 1, 2001 have not been restated to reflect this change in presentation.
(3) Returns are historical and are calculated by determining the percentage change in net asset value with all distributions reinvested. Total return is not computed on an annualized basis.
(4) Includes the Fund's share of its corresponding Portfolio's allocated expenses while the Fund was making investments directly into the Portfolio.
(5) Portfolio turnover represents the rate of portfolio activity for the period while the Fund was making investments directly into the Portfolio.
See notes to financial statements
66
Eaton Vance Limited Maturity Municipals Funds as of March 31, 2005
FINANCIAL STATEMENTS CONT'D
Financial Highlights
| | | Pennsylvania Limited Fund - Class B | |
| | | Year Ended March 31, | |
| | | 2005(1) | | 2004(1) | | 2003(1) | | 2002(1)(2) | | 2001(1) | |
| Net asset value - Beginning of year | | $ | 10.550 | | | $ | 10.460 | | | $ | 10.120 | | | $ | 10.270 | | | $ | 9.870 | | |
| Income (loss) from operations | | | | | | | | | | | | | | | | | | | | | |
| Net investment income | | $ | 0.323 | | | $ | 0.327 | | | $ | 0.355 | | | $ | 0.372 | | | $ | 0.397 | | |
| Net realized and unrealized gain (loss) | | | (0.273 | ) | | | 0.093 | | | | 0.354 | | | | (0.138 | ) | | | 0.384 | | |
| Total income from operations | | $ | 0.050 | | | $ | 0.420 | | | $ | 0.709 | | | $ | 0.234 | | | $ | 0.781 | | |
| Less distributions | | | | | | | | | | | | | | | | | | | | | |
| From net investment income | | $ | (0.320 | ) | | $ | (0.330 | ) | | $ | (0.369 | ) | | $ | (0.384 | ) | | $ | (0.381 | ) | |
| Total distributions | | $ | (0.320 | ) | | $ | (0.330 | ) | | $ | (0.369 | ) | | $ | (0.384 | ) | | $ | (0.381 | ) | |
| Net asset value - End of year | | $ | 10.280 | | | $ | 10.550 | | | $ | 10.460 | | | $ | 10.120 | | | $ | 10.270 | | |
| Total Return(3) | | | 0.48 | % | | | 4.04 | % | | | 7.14 | % | | | 2.28 | % | | | 8.08 | % | |
| Ratios/Supplemental Data | | | | | | | | | | | | | | | | | | | | | |
| Net assets, end of year (000's omitted) | | $ | 8,957 | | | $ | 10,273 | | | $ | 9,313 | | | $ | 2,643 | | | $ | 2,286 | | |
| Ratios (As a percentage of average daily net assets): | | | | | | | | | | | | | | | | | | | | | |
| Expenses(4) | | | 1.63 | % | | | 1.60 | % | | | 1.64 | % | | | 1.72 | % | | | 1.74 | % | |
| Expenses after custodian fee reduction(4) | | | 1.62 | % | | | 1.60 | % | | | 1.62 | % | | | 1.67 | % | | | 1.71 | % | |
| Net investment income | | | 3.11 | % | | | 3.10 | % | | | 3.42 | % | | | 3.63 | % | | | 3.96 | % | |
| Portfolio Turnover of the Portfolio(5) | | | 0 | % | | | 8 | % | | | 3 | % | | | 20 | % | | | 6 | % | |
| Portfolio Turnover of the Fund | | | 6 | % | | | - | | | | - | | | | - | | | | - | | |
(1) Net investment income per share was computed using average shares outstanding.
(2) The Fund, through its investment in the Portfolio, has adopted the provisions of the revised AICPA Audit and Accounting Guide for Investment Companies and began using the interest method to amortize premiums on fixed-income securities. The effect of this change for the year ended March 31, 2002 was to increase net investment income per share by $0.001, increase net realized and unrealized losses per share by $0.001 and increase the ratio of net investment income to average net assets from 3.62% to 3.63%. Per-share data and ratios for the periods prior to April 1, 2001 have not been restated to reflect this change in presentation.
(3) Returns are historical and are calculated by determining the percentage change in net asset value with all distributions reinvested. Total return is not computed on an annualized basis.
(4) Includes the Fund's share of its corresponding Portfolio's allocated expenses while the Fund was making investments directly into the Portfolio.
(5) Portfolio turnover represents the rate of portfolio activity for the period while the Fund was making investments directly into the Portfolio.
See notes to financial statements
67
Eaton Vance Limited Maturity Municipals Funds as of March 31, 2005
FINANCIAL STATEMENTS CONT'D
Financial Highlights
| | | Pennsylvania Limited Fund - Class C | |
| | | Year Ended March 31, | |
| | | 2005(1) | | 2004(1) | | 2003(1) | | 2002(1)(2) | | 2001(1) | |
| Net asset value - Beginning of year | | $ | 10.000 | | | $ | 9.910 | | | $ | 9.590 | | | $ | 9.720 | | | $ | 9.340 | | |
| Income (loss) from operations | | | | | | | | | | | | | | | | | | | | | |
| Net investment income | | $ | 0.307 | | | $ | 0.308 | | | $ | 0.339 | | | $ | 0.354 | | | $ | 0.376 | | |
| Net realized and unrealized gain (loss) | | | (0.257 | ) | | | 0.091 | | | | 0.330 | | | | (0.121 | ) | | | 0.363 | | |
| Total income from operations | | $ | 0.050 | | | $ | 0.399 | | | $ | 0.669 | | | $ | 0.233 | | | $ | 0.739 | | |
| Less distributions | | | | | | | | | | | | | | | | | | | | | |
| From net investment income | | $ | (0.300 | ) | | $ | (0.309 | ) | | $ | (0.349 | ) | | $ | (0.363 | ) | | $ | (0.359 | ) | |
| Total distributions | | $ | (0.300 | ) | | $ | (0.309 | ) | | $ | (0.349 | ) | | $ | (0.363 | ) | | $ | (0.359 | ) | |
| Net asset value - End of year | | $ | 9.750 | | | $ | 10.000 | | | $ | 9.910 | | | $ | 9.590 | | | $ | 9.720 | | |
| Total Return(3) | | | 0.44 | %(6) | | | 4.06 | % | | | 7.11 | % | | | 2.40 | % | | | 8.08 | % | |
| Ratios/Supplemental Data | | | | | | | | | | | | | | | | | | | | | |
| Net assets, end of year (000's omitted) | | $ | 16,670 | | | $ | 21,398 | | | $ | 15,188 | | | $ | 7,262 | | | $ | 4,413 | | |
| Ratios (As a percentage of average daily net assets): | | | | | | | | | | | | | | | | | | | | | |
| Expenses(4) | | | 1.63 | % | | | 1.60 | % | | | 1.64 | % | | | 1.72 | % | | | 1.73 | % | |
| Expenses after custodian fee reduction(4) | | | 1.62 | % | | | 1.60 | % | | | 1.62 | % | | | 1.67 | % | | | 1.70 | % | |
| Net investment income | | | 3.12 | % | | | 3.08 | % | | | 3.44 | % | | | 3.64 | % | | | 3.96 | % | |
| Portfolio Turnover of the Portfolio(5) | | | 0 | % | | | 8 | % | | | 3 | % | | | 20 | % | | | 6 | % | |
| Portfolio Turnover of the Fund | | | 6 | % | | | - | | | | - | | | | - | | | | - | | |
(1) Net investment income per share was computed using average shares outstanding.
(2) The Fund, through its investment in the Portfolio, has adopted the provisions of the revised AICPA Audit and Accounting Guide for Investment Companies and began using the interest method to amortize premiums on fixed-income securities. The effect of this change for the year ended March 31, 2002 was to increase net investment income per share by $0.001, increase net realized and unrealized losses per share by $0.001 and increase the ratio of net investment income to average net assets from 3.63% to 3.64%. Per-share data and ratios for the periods prior to April 1, 2001 have not been restated to reflect this change in presentation.
(3) Returns are historical and are calculated by determining the percentage change in net asset value with all distributions reinvested. Total return is not computed on an annualized basis.
(4) Includes the Fund's share of its corresponding Portfolio's allocated expenses while the Fund was making investments directly into the Portfolio.
(5) Portfolio turnover represents the rate of portfolio activity for the period while the Fund was making investments directly into the Portfolio.
(6) Total return reflects a decrease of 0.06% due to a change in the timing of the payment and reinvestment of distributions.
See notes to financial statements
68
Eaton Vance Limited Maturity Municipals Funds as of March 31, 2005
NOTES TO FINANCIAL STATEMENTS
1 Significant Accounting Policies
Eaton Vance Investment Trust (the Trust) is an entity of the type commonly known as a Massachusetts business trust and is registered under the Investment Company Act of 1940, as amended, as an open-end management investment company. The Trust presently consists of eight Funds, each non-diversified, seven of which are included in these financial statements. They include Eaton Vance California Limited Maturity Municipals Fund (California Limited Fund), Eaton Vance Florida Limited Maturity Municipals Fund (Florida Limited Fund), Eaton Vance Massachusetts Limited Maturity Municipals Fund (Massachusetts Limited Fund), Eaton Vance New Jersey Limited Maturity Municipals Fund (New Jersey Limited Fund), Eaton Vance New York Limited Maturity Municipals Fund (New York Limited Fund), Eaton Vance Ohio Limited Maturity Municipals Fund (Ohio Limited Fund) and Eaton Vance Pennsylvania Limited Maturity Municipal s Fund (Pennsylvania Limited Fund), collectively the "Funds" or individually the "Fund." The Funds seek to achieve current income exempt from regular federal income tax and particular state or local income or other taxes by investing primarily in investment grade municipal obligations. The Funds may offer three classes of shares: Class A, Class B and Class C. Class A shares are generally sold subject to a sales charge imposed at time of purchase. Class B and Class C shares are sold at net asset value and are subject to a contingent deferred sales charge (see Note 6). Class B shares held longer than (i) four years or (ii) the time at which the contingent deferred sales charge applicable to such shares expires will automatically convert to Class A shares. In addition, Class B shares acquired through the reinvestment of distributions will also convert to Class A shares in proportion to shares not acquired through reinvestment. Each class represents a p ro rata interest in the Fund, but votes separately on class-specific matters and (as noted below) is subject to different expenses. Realized and unrealized gains and losses are allocated daily to each class of shares based on the relative net assets of each class to the total net assets of the Fund. Net investment income, other than class-specific expenses, is allocated daily to each class of shares based upon the ratio of the value of each class' paid shares to the total value of all paid shares. Each class of shares differs in its distribution plan and certain other class-specific expenses.
On October 8, 2004, the California Limited Fund, Florida Limited Fund, Massachusetts Limited Fund, New Jersey Limited Fund, New York Limited Fund, Ohio Limited Fund, and Pennsylvania Limited Fund received its pro rata share of cash and securities from the California Limited Maturity Municipals Portfolio (California Limited Portfolio), Florida Limited Maturity Municipals Portfolio (Florida Limited Portfolio), Massachusetts Limited Maturity Municipals Portfolio (Massachusetts Limited Portfolio), New Jersey Limited Maturity Municipals Portfolio (New Jersey Limited Portfolio), New York Limited Maturity Municipals Portfolio (New York Limited Portfolio), Ohio Limited Maturity Municipals Portfolio (Ohio Limited Portfolio) and Pennsylvania Limited Maturity Municipals Portfolio (Pennsylvania Lim ited Portfolio), respectively, in a complete liquidation of its interest in its corresponding Portfolio. Subsequent to October 8, 2004, each Fund invests directly in securities rather than through its corresponding Portfolio and maintains the same investment objectives.
The following is a summary of significant accounting policies consistently followed by the Trust in the preparation of its financial statements. The policies are in conformity with accounting principles generally accepted in the United States of America.
A Investment Valuations - Municipal bonds are normally valued on the basis of valuations furnished by a pricing service. Taxable obligations, if any, for which price quotations are readily available are normally valued at the mean between the latest bid and asked prices. Futures contracts and options on futures contracts listed on commodity exchanges are valued at closing settlement prices. Short-term obligations, maturing in sixty days or less, are valued at amortized cost, which approximates fair value. Investments for which valuations or market quotations are unavailable are valued at fair value using methods determined in good faith by or at the direction of the Tru stees.
B Income - Interest income is determined on the basis of interest accrued, adjusted for amortization of premium or discount.
C Federal Taxes - Each Fund's policy is to comply with the provisions of the Internal Revenue Code applicable to regulated investment companies and to distribute to shareholders each year all of its taxable and tax-exempt income, including any net realized gain on investments. Accordingly, no provision for federal income or excise tax is necessary. At March 31, 2005, the following Funds, for federal income tax purposes, had capital loss carryovers, which will reduce each Fund's taxable income arising from future taxable net realized gain on investments, if any, to the extent permitted by the Internal Revenue Code, and thus will reduce the amount of the distribution s to shareholders which would otherwise be
69
Eaton Vance Limited Maturity Municipals Funds as of March 31, 2005
NOTES TO FINANCIAL STATEMENTS CONT'D
necessary to relieve the Funds of any liability for federal income or excise taxes. A portion of such capital loss carryovers were acquired through a Fund Reorganization and may be subject to certain limitations. The amounts and expiration dates of the capital loss carryovers are as follows:
| Fund | | Amount | | Expires | |
| California Limited Fund | | $ | 83,841 | | | March 31, 2009 | |
|
| | | | 123,502 | | | March 31, 2011 | |
|
| | | | 13,351 | | | March 31, 2012 | |
|
| | | | 384,970 | | | March 31, 2013 | |
|
| Florida Limited Fund | | | 355,608 | | | March 31, 2006 | |
|
| | | | 80,496 | | | March 31, 2009 | |
|
| | | | 200,399 | | | March 31, 2011 | |
|
| | | | 995,128 | | | March 31, 2013 | |
|
| Massachusetts Limited Fund | | | 197,971 | | | March 31, 2006 | |
|
| | | | 136,941 | | | March 31, 2009 | |
|
| | | | 35,096 | | | March 31, 2010 | |
|
| | | | 506,705 | | | March 31, 2011 | |
|
| | | | 393,962 | | | March 31, 2012 | |
|
| | | | 1,336,686 | | | March 31, 2013 | |
|
| New Jersey Limited Fund | | | 213,255 | | | March 31, 2006 | |
|
| | | | 374,246 | | | March 31, 2011 | |
|
| | | | 298,472 | | | March 31, 2012 | |
|
| | | | 728,451 | | | March 31, 2013 | |
|
| New York Limited Fund | | | 411,305 | | | March 31, 2011 | |
|
| | | | 483,774 | | | March 31, 2012 | |
|
| | | | 1,522,094 | | | March 31, 2013 | |
|
| Ohio Limited Fund | | | 36,233 | | | March 31, 2009 | |
|
| | | | 69,085 | | | March 31, 2010 | |
|
| | | | 366,442 | | | March 31, 2011 | |
|
| | | | 60,692 | | | March 31, 2012 | |
|
| | | | 358,602 | | | March 31, 2013 | |
|
| Pennsylvania Limited Fund | | | 245,499 | | | March 31, 2009 | |
|
| | | | 59,482 | | | March 31, 2010 | |
|
| | | | 400,339 | | | March 31, 2011 | |
|
| | | | 154,413 | | | March 31, 2012 | |
|
| | | | 954,523 | | | March 31, 2013 | |
|
Dividends paid by each Fund from net interest on tax-exempt municipal bonds are not includable by shareholders as gross income for federal income tax purposes because each Fund intends to meet certain requirements of the Internal Revenue Code applicable to regulated investment companies which will enable the Funds to pay exempt-interest dividends. The portion of such interest, if any, earned on private activity bonds issued after August 7, 1986, may be considered a tax preference item to shareholders.
D Financial Futures Contracts - Upon the entering of a financial futures contract, a Fund is required to deposit (initial margin) either in cash or securities an amount equal to a certain percentage of the purchase price indicated in the financial futures contract. Subsequent payments are made or received by a Fund (margin maintenance) each day, dependent on the daily fluctuations in the value of the underlying security, and are recorded for book purposes as unrealized gains or losses by a Fund. A Fund's investment in financial futures contracts is designed for both hedging against anticipated future changes in interest rates and investment purposes. Should interest rat es move unexpectedly, a Fund may not achieve the anticipated benefits of the financial futures contracts and may realize a loss.
E Legal Fees - Legal fees and other related expenses incurred as part of negotiations of the terms and requirements of capital infusions, or that are expected to result in the restructuring of or a plan of reorganization for an investment are recorded as realized losses. Ongoing expenditures to protect or enhance an investment are treated as operating expenses.
F Options on Financial Futures Contracts - Upon the purchase of a put option on a financial futures contract by a Fund, the premium paid is recorded as an investment, the value of which is marked-to-market daily. When a purchased option expires, a Fund will realize a loss in the amount of the cost of the option. When a Fund enters into a closing sale transaction, a Fund will realize a gain or loss depending on whether the sales proceeds from the closing sale transaction are greater or less than the cost of the option. When a Fund exercises a put option, settlement is made in cash. The risk associated with purchasing put options is limited to the premium originally paid.
G When-issued and Delayed Delivery Transactions - The Funds may engage in when-issued and delayed delivery transactions. The Funds record when-issued securities on trade date and maintain security positions such that sufficient liquid assets will be available to make payments for the securities purchased. Securities purchased on a when-issued or delayed delivery basis are marked-to-market daily and begin earning interest on settlement date.
H Interest Rate Swaps - A Fund may enter into interest rate swap agreements to enhance return, to hedge against fluctuations in securities prices or interest rates or as substitution for the purchase or sale of securities. Pursuant to these agreements, the Funds make semi-annual payments at
70
Eaton Vance Limited Maturity Municipals Funds as of March 31, 2005
NOTES TO FINANCIAL STATEMENTS CONT'D
a fixed interest rate. In exchange, a Fund receives payments based on the interest rate of a benchmark industry index. During the term of the outstanding swap agreement, changes in the underlying value of the swap are recorded as unrealized gains and losses. The value of the swap is determined by changes in the relationship between two rates of interest. The Fund is exposed to credit loss in the event of non-performance by the swap counterparty. However, the Fund does not anticipate non-performance by the counterparty. Risk may also arise from the unanticipated movements in value of interest rates.
I Expenses - The majority of expenses of the Trust are directly identifiable to an individual fund. Expenses which are not readily identifiable to a specific fund are allocated taking into consideration, among other things, the nature and type of expense and the relative size of the funds.
J Expense Reduction - Investors Bank & Trust Company (IBT) serves as custodian of the Funds. Pursuant to the respective custodian agreements, IBT receives a fee reduced by credits which are determined based on the average daily cash balances the Funds maintain with IBT. All credit balances used to reduce the Funds' custodian fees are reported as a reduction of total expenses on the Statements of Operations.
K Use of Estimates - The preparation of the financial statements in conformity with accounting principles generally accepted in the United States of America requires management to make estimates and assumptions that affect the reported amounts of assets and liabilities at the date of the financial statements and the reported amounts of income and expense during the reporting period. Actual results could differ from those estimates.
L Indemnifications - Under the Trust's organizational documents, its officers and Trustees may be indemnified against certain liabilities and expenses arising out of the performance of their duties to the Funds and shareholders are indemnified against personal liability for obligations of the Trust. Additionally, in the normal course of business, the Funds enter into agreements with service providers that may contain indemnification clauses. The Funds' maximum exposure under these arrangements is unknown as this would involve future claims that may be made against the Funds that have not yet occurred.
M Other - Investment transactions are accounted for on a trade-date basis. Realized gains and losses are computed based on the specific identification of the securities sold.
2 Distributions to Shareholders
The net income of each Fund is determined daily and substantially all of the net income so determined is declared as a dividend to shareholders of record at the time of declaration. Dividends are declared separately for each class of shares. Distributions are paid monthly. Distributions of allocated realized capital gains, if any, are made at least annually. Shareholders may reinvest income and capital gain distributions in additional shares of the same class of a Fund at the net asset value as of the reinvestment date. Distributions are paid in the form of additional shares of the same class or, at the election of the shareholder, in cash. The Funds distinguish between distributions on a tax basis and a financial reporting basis. Accounting principles generally accepted in the United States of America require that only distributions in excess of tax basis earnings and profits be reported in the financial statements as a return of capital. Permanent differences between book and tax accounting relating to distributions are reclassified to paid-in capital.
The tax character of distributions paid for the years ended March 31, 2005 and March 31, 2004 was as follows:
| Year Ended 3/31/05 | | California
Limited | | Florida
Limited | | Massachusetts
Limited | | New Jersey
Limited | |
| Distributions declared from: | | | | | | | | | | | | | | | | | |
| Tax-exempt income | | $ | 1,221,173 | | | $ | 2,408,952 | | | $ | 2,706,746 | | | $ | 1,804,387 | | |
| Ordinary income | | | - | | | $ | 2,787 | | | $ | 15,253 | | | | - | | |
| Year Ended 3/31/04 | | California
Limited | | Florida
Limited | | Massachusetts
Limited | | New Jersey
Limited | |
| Tax-exempt income | | $ | 1,263,770 | | | $ | 2,416,601 | | | $ | 2,747,823 | | | $ | 1,815,793 | | |
| Ordinary income | | $ | 5,841 | | | $ | 1 | | | | - | | | $ | 20,819 | | |
| Year Ended 3/31/05 | | New York
Limited | | Ohio
Limited | | Pennsylvania
Limited | |
| Distributions declared from: | | | | | | | | | | | | | |
| Tax-exempt income | | $ | 3,874,319 | | | $ | 700,048 | | | $ | 2,140,929 | | |
| Ordinary income | | | - | | | $ | 382 | | | | - | | |
| Year Ended 3/31/04 | | New York
Limited | | Ohio
Limited | | Pennsylvania
Limited | |
| Distributions declared from: | | | | | | | | | | | | | |
| Tax-exempt income | | $ | 4,053,604 | | | $ | 790,308 | | | $ | 2,283,364 | | |
| Ordinary income | | | - | | | $ | 750 | | | | - | | |
During the year ended March 31, 2005, the following amounts were reclassified due to differences between book and tax accounting for amortization and accretion on debt
71
Eaton Vance Limited Maturity Municipals Funds as of March 31, 2005
NOTES TO FINANCIAL STATEMENTS CONT'D
securities, market discount on disposal of securities, and capital losses:
| | | California
Limited | | Florida
Limited | | Massachusetts
Limited | | New Jersey
Limited | |
Increase (decrease):
Paid-in capital | | $ | (49,292 | ) | | $ | (133,020 | ) | | $ | (30,087 | ) | | | - | | |
Accumulated net realized
gain/(loss) on investments | | $ | 53,458 | | | $ | 148,182 | | | $ | 28,234 | | | $ | 12,258 | | |
Accumulated
undistributed income | | $ | (4,166 | ) | | $ | (15,162 | ) | | $ | 1,853 | | | $ | (12,258 | ) | |
| | | New York
Limited | | Ohio
Limited | | Pennsylvania
Limited | |
Increase (decrease):
Paid-in capital | | $ | (20,867 | ) | | $ | (4,327 | ) | | $ | (25,741 | ) | |
Accumulated net realized
gain/(loss) on investments | | $ | 37,475 | | | $ | 4,220 | | | $ | 30,880 | | |
Accumulated
undistributed income | | $ | (16,608 | ) | | $ | 107 | | | $ | (5,139 | ) | |
These changes had no effect on the net assets or net asset value per share of the Funds.
As of March 31, 2005, the components of distributable earnings (accumulated losses) on a tax basis were as follows:
| | | California
Limited | | Florida
Limited | | Massachusetts
Limited | | New Jersey
Limited | |
| Undistributed income | | $ | 52,721 | | | $ | 98,954 | | | $ | 120,186 | | | $ | 72,765 | | |
| Capital loss carryforward | | $ | (605,664 | ) | | $ | (1,631,631 | ) | | $ | (2,607,361 | ) | | $ | (1,614,424 | ) | |
| Unrealized gain | | $ | 1,246,472 | | | $ | 2,152,063 | | | $ | 2,514,163 | | | $ | 2,245,830 | | |
| Other temporary differences | | $ | (197,200 | ) | | $ | (332,851 | ) | | $ | (224,209 | ) | | $ | (278,411 | ) | |
| | | New York
Limited | | Ohio
Limited | | Pennsylvania
Limited | |
| Undistributed income | | $ | 98,878 | | | $ | 63,183 | | | $ | 80,232 | | |
| Capital loss carryforward | | $ | (2,417,173 | ) | | $ | (891,054 | ) | | $ | (1,814,256 | ) | |
| Unrealized gain | | $ | 3,509,162 | | | $ | 950,417 | | | $ | 2,314,375 | | |
| Other temporary differences | | $ | (348,189 | ) | | $ | (58,608 | ) | | $ | (299,403 | ) | |
3 Shares of Beneficial Interest
The Funds' Declaration of Trust permits the Trustees to issue an unlimited number of full and fractional shares of beneficial interest (without par value). Such shares may be issued in a number of different series (such as the Funds) and classes. Transactions in Fund shares were as follows:
| | | California Limited Fund | |
| | | Year Ended March 31, | |
| Class A | | 2005 | | 2004 | |
| Sales | | | 873,266 | | | | 1,413,102 | | |
Issued to shareholders electing to
receive payments of distributions
in Fund shares | | | 59,380 | | | | 60,354 | | |
| Redemptions | | | (787,924 | ) | | | (1,223,401 | ) | |
| Exchange from Class B shares | | | 84,485 | | | | 48,849 | | |
| Net increase | | | 229,207 | | | | 298,904 | | |
| | | California Limited Fund | |
| | | Year Ended March 31, | |
| Class B | | 2005 | | 2004 | |
| Sales | | | 83,638 | | | | 228,257 | | |
Issued to shareholders electing to
receive payments of distributions
in Fund shares | | | 5,736 | | | | 7,578 | | |
| Redemptions | | | (185,989 | ) | | | (117,647 | ) | |
| Exchange to Class A shares | | | (84,778 | ) | | | (49,023 | ) | |
| Net increase (decrease) | | | (181,393 | ) | | | 69,165 | | |
| | | California Limited Fund | |
| | | Year Ended March 31, | |
| Class C | | 2005(1) | | 2004 | |
| Sales | | | 1,000 | | | | - | | |
| Net increase | | | 1,000 | | | | - | | |
| | | Florida Limited Fund | |
| | | Year Ended March 31, | |
| Class A | | 2005 | | 2004 | |
| Sales | | | 1,501,353 | | | | 1,032,762 | | |
Issued to shareholders electing to
receive payments of distributions
in Fund shares | | | 63,761 | | | | 69,944 | | |
| Redemptions | | | (1,539,509 | ) | | | (1,351,611 | ) | |
| Exchange from Class B shares | | | 55,116 | | | | 54,947 | | |
| Net increase (decrease) | | | 80,721 | | | | (193,958 | ) | |
72
Eaton Vance Limited Maturity Municipals Funds as of March 31, 2005
NOTES TO FINANCIAL STATEMENTS CONT'D
| | | Florida Limited Fund | |
| | | Year Ended March 31, | |
| Class B | | 2005 | | 2004 | |
| Sales | | | 182,427 | | | | 331,409 | | |
Issued to shareholders electing to
receive payments of distributions
in Fund shares | | | 11,591 | | | | 11,555 | | |
| Redemptions | | | (173,029 | ) | | | (220,629 | ) | |
| Exchange to Class A shares | | | (55,127 | ) | | | (54,974 | ) | |
| Net increase (decrease) | | | (34,138 | ) | | | 67,361 | | |
| | | Florida Limited Fund | |
| | | Year Ended March 31, | |
| Class C | | 2005 | | 2004 | |
| Sales | | | 357,357 | | | | 932,957 | | |
Issued to shareholders electing to
receive payments of distributions
in Fund shares | | | 14,945 | | | | 15,784 | | |
| Redemptions | | | (502,171 | ) | | | (311,781 | ) | |
| Net increase (decrease) | | | (129,869 | ) | | | 636,960 | | |
| | | Massachusetts Limited Fund | |
| | | Year Ended March 31, | |
| Class A | | 2005 | | 2004 | |
| Sales | | | 746,351 | | | | 573,738 | | |
Issued to shareholders electing to
receive payments of distributions
in Fund shares | | | 94,679 | | | | 99,995 | | |
| Redemptions | | | (661,339 | ) | | | (753,152 | ) | |
| Exchange from Class B shares | | | 80,078 | | | | 95,549 | | |
| Net increase | | | 259,769 | | | | 16,130 | | |
| | | Massachusetts Limited Fund | |
| | | Year Ended March 31, | |
| Class B | | 2005 | | 2004 | |
| Sales | | | 222,750 | | | | 353,504 | | |
Issued to shareholders electing to
receive payments of distributions
in Fund shares | | | 17,350 | | | | 17,169 | | |
| Redemptions | | | (176,830 | ) | | | (114,902 | ) | |
| Exchange to Class A shares | | | (80,170 | ) | | | (95,628 | ) | |
| Net increase (decrease) | | | (16,900 | ) | | | 160,143 | | |
| | | Massachusetts Limited Fund | |
| | | Year Ended March 31, | |
| Class C | | 2005 | | 2004 | |
| Sales | | | 672,244 | | | | 1,782,827 | | |
Issued to shareholders electing to
receive payments of distributions
in Fund shares | | | 46,638 | | | | 41,674 | | |
| Redemptions | | | (701,485 | ) | | | (532,424 | ) | |
| Net increase | | | 17,397 | | | | 1,292,077 | | |
| | | New Jersey Limited Fund | |
| | | Year Ended March 31, | |
| Class A | | 2005 | | 2004 | |
| Sales | | | 604,405 | | | | 990,208 | | |
Issued to shareholders electing to
receive payments of distributions
in Fund shares | | | 108,936 | | | | 103,903 | | |
| Redemptions | | | (937,971 | ) | | | (505,898 | ) | |
| Exchange from Class B shares | | | 63,956 | | | | 28,961 | | |
| Net increase (decrease) | | | (160,674 | ) | | | 617,174 | | |
| | | New Jersey Limited Fund | |
| | | Year Ended March 31, | |
| Class B | | 2005 | | 2004 | |
| Sales | | | 110,215 | | | | 433,061 | | |
Issued to shareholders electing to
receive payments of distributions
in Fund shares | | | 13,202 | | | | 12,978 | | |
| Redemptions | | | (169,384 | ) | | | (217,732 | ) | |
| Exchange to Class A shares | | | (63,958 | ) | | | (28,977 | ) | |
| Net increase (decrease) | | | (109,925 | ) | | | 199,330 | | |
| | | New York Limited Fund | |
| | | Year Ended March 31, | |
| Class A | | 2005 | | 2004 | |
| Sales | | | 1,158,541 | | | | 1,487,750 | | |
Issued to shareholders electing to
receive payments of distributions
in Fund shares | | | 149,621 | | | | 137,754 | | |
| Redemptions | | | (1,728,153 | ) | | | (1,155,895 | ) | |
| Exchange from Class B shares | | | 141,018 | | | | 134,497 | | |
| Net increase (decrease) | | | (278,973 | ) | | | 604,106 | | |
73
Eaton Vance Limited Maturity Municipals Funds as of March 31, 2005
NOTES TO FINANCIAL STATEMENTS CONT'D
| | | New York Limited Fund | |
| | | Year Ended March 31, | |
| Class B | | 2005 | | 2004 | |
| Sales | | | 117,562 | | | | 562,112 | | |
Issued to shareholders electing to
receive payments of distributions
in Fund shares | | | 21,214 | | | | 24,360 | | |
| Redemptions | | | (228,944 | ) | | | (354,414 | ) | |
| Exchange to Class A shares | | | (141,133 | ) | | | (134,643 | ) | |
| Net increase (decrease) | | | (231,301 | ) | | | 97,415 | | |
| | | New York Limited Fund | |
| | | Year Ended March 31, | |
| Class C | | 2005 | | 2004 | |
| Sales | | | 616,332 | | | | 2,257,951 | | |
Issued to shareholders electing to
receive payments of distributions
in Fund shares | | | 60,168 | | | | 58,361 | | |
| Redemptions | | | (1,134,879 | ) | | | (897,570 | ) | |
| Net increase (decrease) | | | (458,379 | ) | | | 1,418,742 | | |
| | | Ohio Limited Fund | |
| | | Year Ended March 31, | |
| Class A | | 2005 | | 2004 | |
| Sales | | | 258,944 | | | | 732,892 | | |
Issued to shareholders electing to
receive payments of distributions
in Fund shares | | | 38,212 | | | | 37,817 | | |
| Redemptions | | | (616,382 | ) | | | (612,358 | ) | |
| Exchange from Class B shares | | | 5,781 | | | | 49,059 | | |
| Net increase (decrease) | | | (313,445 | ) | | | 207,410 | | |
| | �� | Ohio Limited Fund | |
| | | Year Ended March 31, | |
| Class B | | 2005 | | 2004 | |
| Sales | | | 15,804 | | | | 127,255 | | |
Issued to shareholders electing to
receive payments of distributions
in Fund shares | | | 3,019 | | | | 2,627 | | |
| Redemptions | | | (53,279 | ) | | | (95,315 | ) | |
| Exchange to Class A shares | | | (5,779 | ) | | | (49,092 | ) | |
| Net decrease | | | (40,235 | ) | | | (14,525 | ) | |
| | | Pennsylvania Limited Fund | |
| | | Year Ended March 31, | |
| Class A | | 2005 | | 2004 | |
| Sales | | | 276,953 | | | | 728,993 | | |
Issued to shareholders electing to
receive payments of distributions
in Fund shares | | | 65,579 | | | | 69,044 | | |
| Redemptions | | | (498,134 | ) | | | (721,219 | ) | |
| Exchange from Class B shares | | | 90,804 | | | | 48,404 | | |
| Net increase (decrease) | | | (64,798 | ) | | | 125,222 | | |
| | | Pennsylvania Limited Fund | |
| | | Year Ended March 31, | |
| Class B | | 2005 | | 2004 | |
| Sales | | | 130,395 | | | | 334,775 | | |
Issued to shareholders electing to
receive payments of distributions
in Fund shares | | | 15,311 | | | | 17,677 | | |
| Redemptions | | | (157,563 | ) | | | (220,439 | ) | |
| Exchange to Class A shares | | | (90,801 | ) | | | (48,412 | ) | |
| Net increase (decrease) | | | (102,658 | ) | | | 83,601 | | |
| | | Pennsylvania Limited Fund | |
| | | Year Ended March 31, | |
| Class C | | 2005 | | 2004 | |
| Sales | | | 301,675 | | | | 915,326 | | |
Issued to shareholders electing to
receive payments of distributions
in Fund shares | | | 24,292 | | | | 30,286 | | |
| Redemptions | | | (756,161 | ) | | | (337,420 | ) | |
| Net increase (decrease) | | | (430,194 | ) | | | 608,192 | | |
(1) Class C shares of the California Limited Fund commenced operations on March 23, 2005.
4 Investment Adviser Fee and Other Transactions with Affiliates
The investment adviser fee is earned by Boston Management and Research (BMR), a wholly-owned subsidiary of Eaton Vance Management (EVM), as compensation for management and investment advisory services rendered to each Fund. The fee is based upon a percentage of average daily net assets plus a percentage of gross income (i.e., income other than gains from the sale of securities).
74
Eaton Vance Limited Maturity Municipals Funds as of March 31, 2005
NOTES TO FINANCIAL STATEMENTS CONT'D
For the period from April 1, 2004 to October 8, 2004, advisory fees allocated from the Portfolios were as follows:
| Portfolio | | Amount | | Effective Rate* | |
| California Limited | | $ | 79,555 | | | | 0.43 | % | |
| Florida Limited | | | 158,438 | | | | 0.43 | % | |
| Massachusetts Limited | | | 189,820 | | | | 0.43 | % | |
| New Jersey Limited | | | 120,245 | | | | 0.43 | % | |
| New York Limited | | | 270,249 | | | | 0.43 | % | |
| Ohio Limited | | | 48,716 | | | | 0.44 | % | |
| Pennsylvania Limited | | | 142,868 | | | | 0.44 | % | |
For the period from October 9, 2004 to March 31, 2005, advisory fees incurred by the Funds were as follows:
| Fund | | Amount | | Effective Rate* | |
| California Limited | | $ | 74,011 | | | | 0.44 | % | |
| Florida Limited | | | 151,841 | | | | 0.44 | % | |
| Massachusetts Limited | | | 181,877 | | | | 0.43 | % | |
| New Jersey Limited | | | 110,622 | | | | 0.43 | % | |
| New York Limited | | | 242,688 | | | | 0.44 | % | |
| Ohio Limited | | | 40,833 | | | | 0.44 | % | |
| Pennsylvania Limited | | | 128,376 | | | | 0.44 | % | |
* As a percentage of average daily net assets (annualized).
EVM has agreed to reduce the investment adviser fee by an amount equal to that portion of commissions paid to broker dealers in execution of portfolio transactions that is consideration for third-party research services. For the period from April 1, 2004, to March 31, 2005, EVM waived $200 of its advisory fee for Massachusetts Limited Fund.
Except as to Trustees of the Funds who are not members of EVM's or BMR's organization, officers and Trustees receive remuneration for their services to the Funds out of such investment adviser fee. EVM serves as the Administrator of each Fund, but receives no compensation. EVM serves as the sub-transfer agent of the Fund and receives from the transfer agent an aggregate fee based upon the actual expenses incurred by EVM in the performance of those services. For the year ended March 31, 2005, EVM earned $880, $1,940, $3,133, $2,307, $4,739, $810 and $3,048 in sub-transfer agent fees from California Limited Fund, Florida Limited Fund, Massachusetts Limited Fund, New Jersey Limited Fund, New York Limited Fund, Ohio Limited Fund and Pennsylvania Limited Fund, respectively. The Funds were informed that Eaton Vance Distributors, Inc. (EVD), a subsidiary of EVM and the Funds' principal underwriter, received approximately $2,000, $2,500, $6,500, $5,000, $6,500, $3,000 and $3,500 as its portion of the sales charge on sales of Class A shares from California Limited Fund, Florida Limited Fund, Massachusetts Limited Fund, New Jersey Limited Fund, New York Limited Fund, Ohio Limited Fund and Pennsylvania Limited Fund, respectively, for the year ended March 31, 2005.
Trustees of the Funds that are not affiliated with the Investment Adviser may elect to defer receipt of all or a percentage of their annual fees in accordance with the terms of the Trustees Deferred Compensation Plan. For the year ended March 31, 2005, no significant amounts have been deferred.
Certain of the officers and Trustees of the Funds are officers of the above organizations.
During the year ended March 31, 2005, certain Funds engaged in purchase and sale transactions with other Funds that also utilize BMR as an investment adviser. These purchase and sale transactions complied with Rule 17a-7 under the Investment Company Act of 1940 and amounted to:
| Fund | | Purchases | | Sales | |
| Florida Limited | | $ | 226,256 | | | | - | | |
| Massachusetts Limited | | $ | 1,133,230 | | | | - | | |
5 Distribution and Service Plans
Each Fund has in effect distribution plans for Class B (Class B Plan) and Class C (Class C Plan) pursuant to Rule 12b-1 under the Investment Company Act of 1940 and a service plan for Class A shares (Class A Plan) (collectively, the Plans). The Plans require the Class B and Class C shares to pay EVD amounts equal to 1/365 of 0.75% of each Fund's daily net assets attributable to Class B and Class C, for providing ongoing distribution services and facilities to the respective Fund. Each Fund will automatically discontinue payments to EVD during any period in which there are no outstanding Uncovered Distribution Charges, which are equivalent to the sum of (i) 3% (3-1/2% for Ohio Limited Fund) of the aggregate amount received by the Fund for Class B shares sold and 6.25% of Class C sales of the amount received by the Fund for each share sold and, (ii) interest calculated by applying the rate of 1% over the prevailing prime rate to the outstanding balance of Uncovered Distribution Charges of EVD reduced by the aggregate amount of contingent deferred sales charges (see Note 6) and daily amounts
75
Eaton Vance Limited Maturity Municipals Funds as of March 31, 2005
NOTES TO FINANCIAL STATEMENTS CONT'D
theretofore paid to EVD. The amount payable to EVD with respect to each day is accrued on such day as a liability of each Fund's Class B and Class C shares and, accordingly, reduces each Fund's Class B and Class C net assets. For the year ended March 31, 2005, the California Limited Fund, Florida Limited Fund, Massachusetts Limited Fund, New Jersey Limited Fund, New York Limited Fund, Ohio Limited Fund, and Pennsylvania Limited Fund paid or accrued $37,283, $66,083, $80,640, $69,822, $102,798, $17,533, and $72,201, respectively, for Class B shares, and California Limited Fund, Florida Limited Fund, Massachusetts Limited Fund, New York Limited Fund and Pennsylvania Limited Fund paid or accrued $0, $134,049, $210,539, $297,244, and $134,004, respectively, for Class C shares, to or payable to EVD representing 0.75% of each Fund's Class B and Class&n bsp;C average daily net assets. At March 31, 2005, the amount of Uncovered Distribution Charges of EVD calculated under the Plans for California Limited Fund, Florida Limited Fund, Massachusetts Limited Fund, New Jersey Limited Fund, New York Limited Fund, Ohio Limited Fund and Pennsylvania Limited Fund were approximately $441,000, $859,000, $559,000, $544,000, $777,000, $681,000 and $401,000, respectively for Class B shares, and for California Limited Fund, Florida Limited Fund, Massachusetts Limited Fund, New York Limited Fund and Pennsylvania Limited Fund the amount of Uncovered Distribution Charges of EVD were approximately $0, $7,374,000, $3,718,000, $4,539,000 and $4,415,000, respectively for Class C shares.
The Plans authorize the Funds to make payments of service fees to EVD, investment dealers and other persons in amounts not exceeding 0.25% of each Fund's average daily net assets for any fiscal year. The Trustees approved service fee payments equal to 0.15% per annum of each Fund's average daily net assets attributable to Class A, Class B and Class C shares for each fiscal year. Service fee payments are made for personal services and/or maintenance of shareholder accounts. Service fees paid to EVD and investment dealers are separate and distinct from the sales commissions and distribution fees payable by each Fund to EVD, and as such are not subject to automatic discontinuance when there are no outstanding Uncovered Distribution Charges of EVD. For the year ended March 31, 2005, the California Limited Fund, Florida Limited Fund, Massachusetts Limited Fund, New Jersey Limited Fund, New York Limited Fund, Ohio Limited Fund and Pennsylvania Limited Fund paid or accrued service fees to or payable to EVD in the amount of $45,474, $66,938, $70,853, $66,058, $97,041, $26,854, and $50,872, respectively, for Class A shares, and $7,457, $13,217, $16,128, $13,964, $20,560, $3,507, and $14,440, respectively, for Class B shares. For the year ended March 31, 2005, California Limited Fund, Florida Limited Fund, Massachusetts Limited Fund, New York Limited Fund and Pennsylvania Limited Fund paid or accrued service fees to or payable to EVD in the amount of $0, $26,810, $42,108, $59,449 and $26,801, respectively, for Class C shares.
Certain officers and Trustees of the Fund are officers or directors of EVD.
6 Contingent Deferred Sales Charge
A contingent deferred sales charge (CDSC) generally is imposed on redemptions of Class B shares made within four years of purchase and on redemptions of Class C shares within one year of purchase. Generally, the CDSC is based upon the lower of the net asset value at date of redemption or date of purchase. No charge is levied on Class B and Class C shares acquired by reinvestment of dividends or capital gains distributions. The CDSC for Class B shares is imposed at declining rates that begin at 3% in the case of redemptions in the first year after purchase declining half a percentage point the second and third year and one percentage point each subsequent year. Class C shares are subject to a 1% CDSC if redeemed within one year of purchase. No CDSC is levied on shares which have been sold to EVM or its affiliates or to their respective employees or clients and may be waived under certain other limited conditions. CDSC charges are paid to EVD to reduce the amount of Uncovered Distribution Charges calculated under each Fund's Distribution Plan. CDSC charges received when no Uncovered Distribution Charges exist will be credited to the Fund. For the year ended March 31, 2005, EVD received approximately $2,000, $12,000, $3,000, $1,000, and $3,000, respectively, for Class A shares, of CDSC paid by shareholders of the California Limited Fund, Florida Limited Fund, Massachusetts Limited Fund, New Jersey Limited Fund, and New York Limited Fund. EVD received approximately $31,000, $22,000, $13,000, $10,000, $26,000, $12,000 and $14,000, respectively, for Class B shares, of CDSC paid by shareholders of California Limited Fund, Florida Limited Fund, Massachusetts Limited Fund, New Jersey Limited Fund, New York Limited Fund, Ohio Limited Fund and Pennsylvania Limited Fund, and CDSC paid by shareholders of the California Limited Fund, Florida Limited Fund, Massachusett s Limited Fund, New York Limited Fund and Pennsylvania Limited Fund were approximately $0, $7,000, $2,000, $6,000 and $6,000, respectively, for Class C shares.
76
Eaton Vance Limited Maturity Municipals Funds as of March 31, 2005
NOTES TO FINANCIAL STATEMENTS CONT'D
7 Investments
Purchases and sales of investments by the Portfolios, other than U.S. Government securities and short-term obligations, for the period from April 1, 2004 to October 8, 2004, were as follows:
| California Limited Portfolio | | | |
| Purchases | | $ | 4,979,476 | | |
| Sales | | | 4,496,176 | | |
| Florida Limited Portfolio | | | |
| Purchases | | $ | 5,560,299 | | |
| Sales | | | 6,826,636 | | |
| Massachusetts Limited Portfolio | | | |
| Purchases | | $ | 11,002,379 | | |
| Sales | | | 10,923,041 | | |
| New Jersey Limited Portfolio | | | |
| Purchases | | $ | 6,018,845 | | |
| Sales | | | 7,009,518 | | |
| New York Limited Portfolio | | | |
| Purchases | | $ | 8,537,407 | | |
| Sales | | | 13,101,431 | | |
| Ohio Limited Portfolio | | | |
| Purchases | | $ | 1,193,550 | | |
| Sales | | | 4,455,711 | | |
| Pennsylvania Limited Portfolio | | | |
| Purchases | | $ | - | | |
| Sales | | | 4,701,105 | | |
Purchases and sales of investments by the Funds, other than U.S. Government securities and short-term obligations, for the period from October 9, 2004 to March 31, 2005, were as follows:
| California Limited Fund | | | |
| Purchases | | $ | 4,535,123 | | |
| Sales | | | 4,990,391 | | |
| Florida Limited Fund | | | |
| Purchases | | $ | 12,958,600 | | |
| Sales | | | 11,437,057 | | |
| Massachusetts Limited Fund | | | |
| Purchases | | $ | 10,351,734 | | |
| Sales | | | 6,389,523 | | |
| New Jersey Limited Fund | | | |
| Purchases | | $ | 7,257,027 | | |
| Sales | | | 8,976,206 | | |
| New York Limited Fund | | | |
| Purchases | | $ | 14,134,676 | | |
| Sales | | | 17,709,822 | | |
| Ohio Limited Fund | | | |
| Purchases | | $ | 1,417,479 | | |
| Sales | | | 1,651,285 | | |
| Pennsylvania Limited Fund | | | |
| Purchases | | $ | 3,395,760 | | |
| Sales | | | 4,399,920 | | |
8 Federal Income Tax Basis of Unrealized Appreciation (Depreciation)
The cost and unrealized appreciation (depreciation) in value of the investments owned by each Fund at March 31, 2005, as computed on a federal income tax basis, are as follows:
| California Limited Fund | | | | | |
| Aggregate cost | | $ | 34,225,021 | | |
| Gross unrealized appreciation | | $ | 1,253,989 | | |
| Gross unrealized depreciation | | | (149,820 | ) | |
| Net unrealized appreciation | | $ | 1,104,169 | | |
77
Eaton Vance Limited Maturity Municipals Funds as of March 31, 2005
NOTES TO FINANCIAL STATEMENTS CONT'D
| Florida Limited Fund | | | | | |
| Aggregate cost | | $ | 68,167,839 | | |
| Gross unrealized appreciation | | $ | 2,200,999 | | |
| Gross unrealized depreciation | | | (275,296 | ) | |
| Net unrealized appreciation | | $ | 1,925,703 | | |
| Massachusetts Limited Fund | | | | | |
| Aggregate cost | | $ | 84,157,850 | | |
| Gross unrealized appreciation | | $ | 2,652,850 | | |
| Gross unrealized depreciation | | | (239,087 | ) | |
| Net unrealized appreciation | | $ | 2,413,763 | | |
| New Jersey Limited Fund | | | | | |
| Aggregate cost | | $ | 49,093,181 | | |
| Gross unrealized appreciation | | $ | 2,352,779 | | |
| Gross unrealized depreciation | | | (306,878 | ) | |
| Net unrealized appreciation | | $ | 2,045,901 | | |
| New York Limited Fund | | | | | |
| Aggregate cost | | $ | 109,031,599 | | |
| Gross unrealized appreciation | | $ | 3,962,392 | | |
| Gross unrealized depreciation | | | (637,530 | ) | |
| Net unrealized appreciation | | $ | 3,324,862 | | |
| Ohio Limited Fund | | | | | |
| Aggregate cost | | $ | 17,747,097 | | |
| Gross unrealized appreciation | | $ | 950,506 | | |
| Gross unrealized depreciation | | | (29,806 | ) | |
| Net unrealized appreciation | | $ | 920,700 | | |
| Pennsylvania Limited Fund | | | | | |
| Aggregate cost | | $ | 56,454,436 | | |
| Gross unrealized appreciation | | $ | 2,527,236 | | |
| Gross unrealized depreciation | | | (420,086 | ) | |
| Net unrealized appreciation | | $ | 2,107,150 | | |
9 Line of Credit
The Funds participate with other portfolios and funds managed by BMR and EVM and their affiliates in a $150 million unsecured line of credit agreement with a group of banks. The Funds may temporarily borrow from the line of credit to satisfy redemption requests or settle investment transactions. Interest is charged to each participating portfolio or fund based on its borrowings at an amount above either the Eurodollar rate or Federal Funds effective rate. In addition, a fee computed at an annual rate of 0.10% on the daily unused portion of the line of credit is allocated among the participating portfolios and funds at the end of each quarter. At March 31, 2005 the California Limited Fund and the New York Limited Fund had a balance outstanding pursuant to this line of credit of $100,000 and $300,000, respectively. The Funds did not have any significant borrowings or allocated fees durin g the year ended March 31, 2005.
10 Overdraft Advances
Pursuant to the custodian agreement between the Funds and Investors Bank & Trust (the Bank), the Bank may in its discretion advance funds to the Funds to make properly authorized payments. When such payments result in an overdraft by the Funds, the Funds are obligated to repay the Bank at the current rate of interest charged by the Bank for secured loans (currently, a rate above the federal funds rate). This obligation is payable on demand to the Bank. At March 31, 2005, the California Limited Fund and New York Limited Fund had payments due to the Bank pursuant to the foregoing arrangement of $55,759 and $75,512, respectively.
11 Financial Instruments
The Funds regularly trade in financial instruments with off-balance sheet risk in the normal course of their investing activities to assist in managing exposure to various market risks. These financial instruments include futures contracts and may involve, to a varying degree, elements of risk in excess of the amounts recognized for financial statement purposes. The notional or contractual amounts of these instruments represent the investment a Fund has in particular classes of financial instruments and does not necessarily represent the amounts potentially subject to risk. The measurement of the risks associated with these instruments is meaningful only when all related and offsetting transactions are considered.
78
Eaton Vance Limited Maturity Municipals Funds as of March 31, 2005
NOTES TO FINANCIAL STATEMENTS CONT'D
A summary of obligations under these financial instruments at March 31, 2005, is as follows:
Futures Contracts
| Fund | | Expiration
Date | | Contracts | | Position | | Aggregate
Cost | | Value | | Net Unrealized
Appreciation | |
| California Limited | | 06/05 | | 83 U.S. Treasury Bond | | Short | | $ | (9,386,428 | ) | | $ | (9,244,125 | ) | | $ | 142,303 | | |
| Florida Limited | | 06/05 | | 91 U.S. Treasury Bond | | Short | | $ | (10,301,809 | ) | | $ | (10,135,125 | ) | | $ | 166,684 | | |
| | | 06/05 | | 54 U.S. Treasury Note | | Short | | | (5,960,020 | ) | | | (5,900,344 | ) | | | 59,676 | | |
| Massachusetts Limited | | 06/05 | | 92 U.S. Treasury Bond | | Short | | $ | (10,301,590 | ) | | $ | (10,246,500 | ) | | $ | 55,090 | | |
| | | 06/05 | | 41 U.S. Treasury Note | | Short | | | (4,525,201 | ) | | | (4,479,891 | ) | | | 45,310 | | |
| New Jersey Limited | | 06/05 | | 82 U.S. Treasury Bond | | Short | | $ | (9,282,949 | ) | | $ | (9,132,750 | ) | | $ | 150,199 | | |
| | | 06/05 | | 45 U.S. Treasury Note | | Short | | | (4,966,683 | ) | | | (4,916,953 | ) | | | 49,730 | | |
| New York Limited | | 06/05 | | 126 U.S. Treasury Bond | | Short | | $ | (14,113,669 | ) | | $ | (14,033,250 | ) | | $ | 80,419 | | |
| | | 06/05 | | 94 U.S. Treasury Note | | Short | | | (10,374,850 | ) | | | (10,270,969 | ) | | | 103,881 | | |
| Ohio Limited | | 06/05 | | 21 U.S. Treasury Bond | | Short | | $ | (2,354,226 | ) | | $ | (2,338,875 | ) | | $ | 15,351 | | |
| | | 06/05 | | 13 U.S. Treasury Note | | Short | | | (1,434,819 | ) | | | (1,420,453 | ) | | | 14,366 | | |
| Pennsylvania Limited | | 06/05 | | 89 U.S. Treasury Bond | | Short | | $ | (10,075,395 | ) | | $ | (9,912,375 | ) | | $ | 163,020 | | |
| | | 06/05 | | 40 U.S. Treasury Note | | Short | | | (4,414,830 | ) | | | (4,370,625 | ) | | | 44,205 | | |
At March 31, 2005, the Funds had sufficient cash and/or securities to cover margin requirements on open future contracts.
79
Eaton Vance Limited Maturity Municipals Funds as of March 31, 2005
REPORT OF INDEPENDENT REGISTERED PUBLIC ACCOUNTING FIRM
To the Trustees of Eaton Vance Investment Trust and Shareholders of Eaton Vance California Limited Maturity Municipals Fund, Eaton Vance Florida Limited Maturity Municipals Fund, Eaton Vance Massachusetts Limited Maturity Municipals Fund, Eaton Vance New Jersey Limited Maturity Municipals Fund, Eaton Vance New York Limited Maturity Municipals Fund, Eaton Vance Ohio Limited Maturity Municipals Fund and Eaton Vance Pennsylvania Limited Maturity Municipals Fund:
We have audited the accompanying statements of assets and liabilities, including the portfolios of investments, of Eaton Vance California Limited Maturity Municipals Fund, Eaton Vance Florida Limited Maturity Municipals Fund, Eaton Vance Massachusetts Limited Maturity Municipals Fund, Eaton Vance New Jersey Limited Maturity Municipals Fund, Eaton Vance New York Limited Maturity Municipals Fund, Eaton Vance Ohio Limited Maturity Municipals Fund and Eaton Vance Pennsylvania Limited Maturity Municipals Fund (collectively, the "Funds") (certain of the Funds of Eaton Vance Investment Trust) as of March 31, 2005, and the related statements of operations for the year then ended, the statements of changes in net assets for each of the two years in the period then ended, and the financial highlights for each of the five years in the period then ended. These financial statements and financial highlig hts are the responsibility of each Fund's management. Our responsibility is to express an opinion on these financial statements and financial highlights based on our audits.
We conducted our audits in accordance with the standards of the Public Company Accounting Oversight Board (United States). Those standards require that we plan and perform the audit to obtain reasonable assurance about whether the financial statements and financial highlights are free of material misstatement. The Funds are not required to have, nor were we engaged to perform, an audit of their internal control over financial reports. Our audits included consideration of internal control over financial reporting as a basis for designing audit procedures that are appropriate in the circumstances, but not for the purpose of expressing an opinion on the effectiveness of the Fund's internal control over financial reporting. Accordingly, we express no such opinion. An audit also includes examining, on a test basis, evidence supporting the amounts and disclosures in the financial statements, assessing the accounting principles used and significant estimates made by management, as well as evaluating the overall financial statement presentation. Our procedures included confirmation of securities owned at March 31, 2005, by correspondence with the custodian and brokers; where replies were not received from brokers, we performed other auditing procedures. We believe that our audits provide a reasonable basis for our opinion.
In our opinion, the financial statements and financial highlights referred to above present fairly, in all material respects, the financial position of each of the aforementioned funds of Eaton Vance Investment Trust as of March 31, 2005, the results of their operations for the year then ended, the changes in their net assets for each of the two years in the period then ended, and their financial highlights for each of the five years in the period then ended, in conformity with accounting principles generally accepted in the United States of America.
DELOITTE & TOUCHE LLP
Boston, Massachusetts
May 13, 2005
80
Eaton Vance Limited Maturity Municipals Funds as of March 31, 2005
FEDERAL TAX INFORMATION (Unaudited)
The Form 1099-DIV you receive in January 2006 will show the tax status of all distributions paid to your account in calendar 2005. Shareholders are advised to consult their own tax adviser with respect to the tax consequences of their investment in the Fund. As required by the Internal Revenue Code regulations, shareholders must be notified within 60 days of the Fund's fiscal year end regarding exempt-interest dividends and capital gains dividends.
Exempt-Interest Dividends - The Funds designate the following amounts of dividends from net investment income as an exempt-interest dividend.
| California Limited Maturity Municipals Fund | | | 100.00 | % | |
| Florida Limited Maturity Municipals Fund | | | 99.88 | % | |
| Massachusetts Limited Maturity Municipals Fund | | | 99.46 | % | |
| New Jersey Limited Maturity Municipals Fund | | | 100.00 | % | |
| New York Limited Maturity Municipals Fund | | | 100.00 | % | |
| Ohio Limited Maturity Municipals Fund | | | 99.95 | % | |
| Pennsylvania Limited Maturity Municipals Fund | | | 100.00 | % | |
81
Eaton Vance Limited Maturity Municipals Funds
BOARD OF TRUSTEES' ANNUAL APPROVAL OF THE INVESTMENT ADVISORY AGREEMENTS
The investment advisory agreements between each of Eaton Vance California Limited Maturity Municipals Fund, Eaton Vance Florida Limited Maturity Municipals Fund, Eaton Vance Massachusetts Limited Maturity Municipals Fund, Eaton Vance New Jersey Limited Maturity Municipals Fund, Eaton Vance New York Limited Maturity Municipals Fund, Eaton Vance Ohio Limited Maturity Municipals Fund and Eaton Vance Pennsylvania Limited Maturity Municipals Fund (collectively the "Funds" or individually the "Fund"), and the investment adviser, Boston Management and Research, each provide that the advisory agreement will continue in effect from year to year so long as its continuance is approved at least annually (i) by a vote of a majority of the noninterested Trustees of the Fund cast in person at a meeting called for the purpose of voting on such approval and (ii) by the Trustees of the Fund or by vote of a majority of the outstanding interests of the Fund.
In considering the annual approval of the investment advisory agreements between each of Fund and the investment adviser, the Special Committee of the Board of Trustees considered information that had been provided throughout the year at regular Board meetings, as well as information furnished to the Special Committee for a series of meetings held in February and March in preparation for a Board meeting held on March 21, 2005 to specifically consider the renewal of the investment advisory agreements. Such information included, among other things, the following:
•An independent report comparing the advisory fees of each Fund with those of comparable funds;
•An independent report comparing the expense ratio of each Fund to those of comparable funds;
•Information regarding Fund investment performance in comparison to a relevant universe of funds and appropriate indices;
•The economic outlook and the general investment outlook in relevant investment markets;
•Eaton Vance Management's ("Eaton Vance") results and financial condition and the overall organization of the investment adviser;
•The procedures and processes used to determine the fair value of Fund assets and action taken to monitor and test the effectiveness of such procedures and processes;
•Eaton Vance's management of the relationship with the custodian, subcustodians and fund accountants;
•The resources devoted to compliance efforts undertaken by Eaton Vance on behalf of the funds it manages and the record of compliance with the investment policies and restrictions and with policies on personal securities transactions;
•The quality, nature, cost and character of the administrative and other non-investment management services provided by Eaton Vance and its affiliates; and
•The terms of the advisory agreements and the reasonableness and appropriateness of the particular fee paid by each Fund for the services described therein.
The Special Committee also considered the investment adviser's municipal bond portfolio management capabilities, including information relating to the education, experience, and number of investment professionals and other personnel who provide services under the investment advisory agreements. Specifically, the Special Committee considered the investment adviser's 30-person municipal bond team, which includes six portfolio managers and nine credit specialists who provide services to the Funds. The Special Committee noted that the investment adviser's municipal bond team affords the investment adviser extensive in-house research capabilities in addition to the other resources available to the investment adviser. The Special Committee also took into account the time and attention to be devoted by senior
82
Eaton Vance Limited Maturity Municipals Funds
BOARD OF TRUSTEES' ANNUAL APPROVAL OF THE INVESTMENT ADVISORY AGREEMENTS CONT'D
management to the Funds and the other funds in the complex. The Special Committee evaluated the level of skill required to manage the Funds and concluded that the human resources available at the investment adviser were appropriate to fulfill effectively its duties on behalf of the Funds.
In its review of comparative information with respect to each Fund's investment performance, the Special Committee concluded that the Fund has performed within a range that the Special Committee deemed competitive. With respect to its review of investment advisory fees, the Special Committee concluded that the fees paid by each Fund are within the range of those paid by comparable funds within the mutual fund industry. In reviewing the information regarding the expense ratio of each Fund, the Special Committee concluded that each Fund's expense ratio is within a range that is competitive with comparable funds.
In addition to the factors mentioned above, the Special Committee reviewed the level of the investment adviser's profits in providing investment management services for each Fund and for all Eaton Vance Funds as a group. The Special Committee also reviewed the level of profits of Eaton Vance and its affiliates in providing administration services for each Fund and for all Eaton Vance Funds as a group. In addition, the Special Committee considered the fiduciary duty assumed by the investment adviser in connection with the services rendered to each Fund and the business reputation of the investment adviser and its financial resources. The Trustees concluded that in light of the services rendered, the profits realized by the investment adviser are not unreasonable. The Special Committee also considered the extent to which the investment adviser appears to be realizing benefits from economies of sc ale in managing the Funds, and concluded that the fee breakpoints which are in place will allow for an equitable sharing of such benefits, when realized, with the shareholders of the Funds.
The Special Committee did not consider any single factor as controlling in determining whether or not to renew the investment advisory agreements. Nor are the items described herein all the matters considered by the Special Committee. In assessing the information provided by Eaton Vance and its affiliates, the Special Committee also took into consideration the benefits to shareholders of investing in a fund that is a part of a large family of funds which provides a large variety of shareholder services.
Based on its consideration of the foregoing factors and conclusions, and such other factors and conclusions as it deemed relevant, and assisted by independent counsel, the Special Committee concluded that the renewal of the investment advisory agreements, including the fee structures (described herein), is in the interests of shareholders.
83
Eaton Vance Limited Maturity Municipals Funds
MANAGEMENT AND ORGANIZATION
Fund Management. The Trustees of Eaton Vance Investment Trust, (the Trust) are responsible for the overall management and supervision of the Trust's affairs. The Trustees and officers of the Trust are listed below. Except as indicated, each individual has held the office shown or other offices in the same company for the last five years. Trustees and officers of the Trust hold indefinite terms of office. The "noninterested Trustees" consist of those Trustees who are not "interested persons" of the Trust, as that term is defined under the 1940 Act. The business address of each Trustee and officer is The Eaton Vance Building, 255 State Street, Boston, Massachusetts 02109. As used below, "EVC" refers to Eaton Vance Corp., "EV" refers to Eaton Vance, Inc., "EVM" refers to Eaton Vance Management , "BMR" refers to Boston Management and Research, and "EVD" refers to Eaton Vance Distributors, Inc. EVC and EV are the corporate parent and trustee, respectively, of EVM and BMR. EVD is the Fund's principal underwriter and a wholly-owned subsidiary of EVM.
Name and
Date of Birth | | Position(s)
with the
Trust | | Term of
Office and
Length of
Service | | Principal Occupation(s)
During Past Five Years | | Number of Portfolios
in Fund Complex
Overseen By
Trustee(1) | | Other Directorships Held | |
| Interested Trustee | |
|
| James B. Hawkes 11/9/41 | | Trustee and Vice President | | Trustee and Vice President of the Trust since 1985 | | Chairman, President and Chief Executive Officer of BMR, EVC, EVM and EV; Director of EV; Vice President and Director of EVD. Trustee and/or officer of 197 registered investment companies in the Eaton Vance Fund Complex. Mr. Hawkes is an interested person because of his positions with BMR, EVM, EVC and EV, which are affiliates of the Trust. | | | 197 | | | Director of EVC | |
|
| Noninterested Trustee(s) | |
|
| Benjamin C. Esty 1/2/63 | | Trustee | | Since 2005 | | Professor, Harvard University Graduate School of Business Administration (since 2003). Formerly, Associate Professor, Harvard University Graduate School of Business Administration (2000-2003). | | | 135 | | | None | |
|
| Samuel L. Hayes, III 2/23/35 | | Chairman of the Board and Trustee | | Trustee of the Trust since 1986 and Chairman of the Board since 2005 | | Jacob H. Schiff Professor of Investment Banking Emeritus, Harvard University Graduate School of Business Administration. | | | 197 | | | Director of Tiffany & Co. (specialty retailer) and Telect, Inc. (telecommunication services company) | |
|
| William H. Park 9/19/47 | | Trustee | | Since 2003 | | President and Chief Executive Officer, Prizm Capital Management, LLC (investment management firm) (since 2002). Executive Vice President and Chief Financial Officer, United Asset Management Corporation (a holding company owning institutional investment management firms) (1982-2001). | | | 197 | | | None | |
|
| Ronald A. Pearlman 7/10/40 | | Trustee | | Since 2003 | | Professor of Law, Georgetown University Law Center (since 1999). Tax Partner, Covington & Burling, Washington , DC (1991-2000). | | | 197 | | | None | |
|
| Norton H. Reamer 9/21/35 | | Trustee | | Since 1985 | | President, Chief Executive Officer and a Director of Asset Management Finance Corp. (a specialty finance company serving the investment management industry) (since October 2003). President, Unicorn Corporation (an investment and financial advisory services company) (since September 2000). Formerly, Chairman and Chief Operating Officer, Hellman, Jordan Management Co., Inc. (an investment management company) (2000-2003). Formerly, Advisory Director of Berkshire Capital Corporation (investment banking firm) (2002-2003). Formerly, Chairman of the Board, United Asset Management Corporation (a holding company owning institutional investment management firms) and Chairman, President and Director, UAM Funds (mutual funds) (1980-2000). | | | 197 | | | None | |
|
84
Eaton Vance Limited Maturity Municipals Funds
MANAGEMENT AND ORGANIZATION CONT'D
Name and
Date of Birth | | Position(s)
with the
Trust | | Term of
Office and
Length of
Service | | Principal Occupation(s)
During Past Five Years | | Number of Portfolios
in Fund Complex
Overseen By
Trustee(1) | | Other Directorships Held | |
Noninterested Trustee(s) (continued)
| Lynn A. Stout 9/14/57 | | Trustee | | Since 1998 | | Professor of Law, University of California at Los Angeles School of Law (since July 2001). Formerly, Professor of Law, Georgetown University Law Center. | | | 197 | | | None | |
|
| Ralph F. Verni 1/26/43 | | Trustee | | Since 2005 | | Consultant and private investor (since 2000). Formerly, President and Chief Executive Officer, Redwood Investment Systems, Inc. (software developer) (2000). Formerly, President and Chief Executive Officer, State Street Research & Management (investment adviser), SSRM Holdings (parent of State Street Research & Management), and SSR Realty (institutional realty manager) (1992-2000). | | | 135 | | | Director of W.P. Carey & Company LLC (manager of real estate investment trusts) | |
|
Principal Officers who are not Trustees
Name and
Date of Birth | | Position(s)
with the
Trust | | Term of
Office and
Length of
Service | | Principal Occupation(s)
During Past Five Years | |
| Thomas J. Fetter 8/20/43 | | President | | Since 1990 | | Vice President of EVM and BMR. Officer of 124 registered investment companies managed by EVM or BMR. | |
|
| William H. Ahern, Jr. 7/28/59 | | Vice President | | Since 2004 | | Vice President of EVM and BMR. Officer of 78 registered investment companies managed by EVM or BMR. | |
|
| Craig R. Brandon 12/21/66 | | Vice President | | Since 2004 | | Vice President of EVM and BMR. Officer of 44 registered investment companies managed by EVM or BMR. | |
|
| Cynthia J. Clemson 3/2/63 | | Vice President | | Since 2004 | | Vice President of EVM and BMR. Officer of 107 registered investment companies managed by EVM or BMR. | |
|
| Robert B. MacIntosh 1/22/57 | | Vice President | | Since 1993 | | Vice President of EVM and BMR. Officer of 124 registered investment companies managed by EVM or BMR. | |
|
| Thomas M. Metzold 8/3/58 | | Vice President | | Since 2004 | | Vice President of EVM and BMR. Officer of 49 registered investment companies managed by EVM or BMR. | |
|
| Alan R. Dynner 10/10/40 | | Secretary | | Since 1997 | | Vice President, Secretary and Chief Legal Officer of BMR, EVM, EVD, EV and EVC. Officer of 197 registered investment companies managed by EVM or BMR. | |
|
| James L. O'Connor 4/1/45 | | Treasurer | | Since 1988 | | Vice President of BMR, EVM and EVD. Officer of 121 registered investment companies managed by EVM or BMR. | |
|
| Paul M. O'Neil 7/11/53 | | Chief Compliance Officer | | Since 2004 | | Vice President of EVM and BMR. Officer of 197 registered investment companies managed by EVM or BMR. | |
|
(1) Includes both master and feeder funds in a master-feeder structure.
The SAI for the Fund includes additional information about the Trustees and officers of the Fund and can be obtained, without charge, by calling 1-800-225-6265.
85
This Page Intentionally Left Blank
This Page Intentionally Left Blank
This Page Intentionally Left Blank
Investment Adviser of the Eaton Vance Limited Maturity Municipals Funds
Boston Management and Research
The Eaton Vance Building
255 State Street
Boston, MA 02109
Administrator of Eaton Vance Limited Maturity Municipals Funds
Eaton Vance Management
The Eaton Vance Building
255 State Street
Boston, MA 02109
Principal Underwriter
Eaton Vance Distributors, Inc.
The Eaton Vance Building
255 State Street
Boston, MA 02109
(617) 482-8260
Custodian
Investors Bank & Trust Company
200 Clarendon Street
Boston, MA 02116
Transfer Agent
PFPC Inc.
Attn: Eaton Vance Funds
P.O. Box 9653
Providence, RI 02940-9653
(800) 262-1122
Independent Registered Public Accounting Firm
Deloitte & Touche LLP
200 Berkeley Street
Boston, MA 02116-5022
Eaton Vance Investment Trust
The Eaton Vance Building
255 State Street
Boston, MA 02109
This report must be preceded or accompanied by a current prospectus. Before investing, investors should consider carefully the Fund s investment objective(s), risks, and charges and expenses. The Fund s current prospectus contains this and other information about the Fund and is available through your financial advisor. Please read the prospectus carefully before you invest or send money. For further information please call 1-800-225-6265.

| | | | 
|
Annual Report March 31, 2005 | |
| | | | |

| | EATON VANCE
NATIONAL
LIMITED
MATURITY
MUNICIPALS
FUND | | |

| | |
IMPORTANT NOTICES REGARDING PRIVACY,
DELIVERY OF SHAREHOLDER DOCUMENTS,
PORTFOLIO HOLDINGS AND PROXY VOTING
Privacy. The Eaton Vance organization is committed to ensuring your financial privacy. Each of the financial institutions identified below has in effect the following policy (“Privacy Policy”) with respect to nonpublic personal information about its customers:
• Only such information received from you, through application forms or otherwise, and information about your Eaton Vance fund transactions will be collected. This may include information such as name, address, social security number, tax status, account balances and transactions.
• None of such information about you (or former customers) will be disclosed to anyone, except as permitted by law (which includes disclosure to employees necessary to service your account). In the normal course of servicing a customer’s account, Eaton Vance may share information with unaffiliated third parties that perform various required services such as transfer agents, custodians and broker/dealers.
• Policies and procedures (including physical, electronic and procedural safeguards) are in place that are designed to protect the confidentiality of such information.
• We reserve the right to change our Privacy Policy at any time upon proper notification to you. Customers may want to review our Policy periodically for changes by accessing the link on our homepage: www.eatonvance.com.
Our pledge of privacy applies to the following entities within the Eaton Vance organization: the Eaton Vance Family of Funds, Eaton Vance Management, Eaton Vance Investment Counsel, Boston Management and Research, and Eaton Vance Distributors, Inc.
In addition, our Privacy Policy only applies to those Eaton Vance customers who are individuals and who have a direct relationship with us. If a customer’s account (i.e. fund shares) is held in the name of a third-party financial adviser/broker-dealer, it is likely that only such adviser’s privacy policies apply to the customer. This notice supersedes all previously issued privacy disclosures.
For more information about Eaton Vance’s Privacy Policy, please call 1-800-262-1122.
Delivery of Shareholder Documents. The Securities and Exchange Commission permits funds to deliver only one copy of shareholder documents, including prospectuses, proxy statements and shareholder reports, to fund investors with multiple accounts at the same residential or post office box address. This practice is often called “householding” and it helps eliminate duplicate mailings to shareholders.
Eaton Vance, or your financial adviser, may household the mailing of your documents indefinitely unless you instruct Eaton Vance, or your financial adviser, otherwise.
If you would prefer that your Eaton Vance documents not be householded, please contact Eaton Vance at 1-800-262-1122, or contact your financial adviser.
Your instructions that householding not apply to delivery of your Eaton Vance documents will be effective within 30 days of receipt by Eaton Vance or your financial adviser.
Portfolio Holdings. Each Eaton Vance Fund and it’s underlying Portfolio will file a schedule of its portfolio holdings on Form N-Q with the SEC for the first and third quarters of each fiscal year. The Form N-Q will be available on the Eaton Vance website www.eatonvance.com, by calling Eaton Vance at 1-800-262-1122 or in the EDGAR database on the SEC’s website at www.sec.gov. Form N-Q may also be reviewed and copied at the SEC’s public reference room in Washington, D.C. (call 1-800-732-0330 for information on the operation of the public reference room).
Proxy Voting. From time to time, funds are required to vote proxies related to the securities held by the funds. The Eaton Vance Funds or their underlying Portfolios (if applicable) vote proxies according to a set of policies and procedures approved by the Funds’ and Portfolios’ Boards. You may obtain a description of these policies and procedures and information on how the Funds or Portfolios voted proxies relating to Portfolio securities during the 12 month period ended June 30, without charge, upon request, by calling
1-800-262-1122. This description is also available on the SEC’s website at www.sec.gov.
Eaton Vance National Limited Maturity Municipals Fund as of March 31, 2005
LETTER TO SHAREHOLDERS

Thomas J. Fetter
President
The municipal bond market is a center of capital formation for states, municipalities and, in some cases, private economic initiatives. In this edition of our continuing educational series, we will discuss industrial development revenue (IDR) bonds. IDR bonds have long been used as a financing mechanism by local governments to provide assistance to local employers and encourage job retention and creation within their communities.
IDR bonds finance private activities that benefit the public...
IDR bonds are issued by municipal authorities to finance projects and facilities used by private corporations. Historically, IDR bonds have represented a partnership between the private and public sectors – a source of dedicated funding for companies and a source of job creation in projects beneficial to local communities. The “Private-Activities” provision of the Tax Reform Act of 1986 permits issuance of tax-exempt bonds for specific activities, including pollution control; gas and electric service; water distribution; wastewater systems; solid waste disposal; airports and selected transportation projects; and other industrial projects.
The Act also placed a cap on the dollar amount that may be raised for IDR bonds in each state, limiting the amount to $50 per person/per state/per year, with a $150 million maximum. These limitations provide protection against potential abuse and ensure that tax-exempt IDR bonds will indeed be issued for projects that will benefit the public.
IDR bonds finance utility-related projects and other key industrial initiatives...
Typically, IDR bonds provide financing for manufacturing, processing or utility facilities. Historically, about one-half of these bonds have been issued to finance pollution control facilities for manufacturers and electric utilities. As many utilities and manufacturers have been ordered to comply with stricter environmental and fuelstandards, pollution control bonds have helped finance the retrofits of existing plants. Other IDR bonds have served as inducements from state and local issuers to locate plants or build new facilities, in the hope that such construction might generate further economic growth for a community.
IDR bonds are secured by corporate revenues – not those of state or local governments...
IDR bond issues are secured by the credit of the underlying corporation. The municipal issuing authority acts solely as a conduit to permit tax-exempt financing. The corporation pledges to make payments sufficient to meet all debt service obligations. Unlike some revenue issues, IDR bonds arebacked by revenues of the entire corporation, not solely by those of the project being financed.
Because IDR bonds are backed by corporate revenues and not by the taxing authority of a state or local jurisdiction, they have historically provided coupon premiums above those of general obligations and other more traditional revenue bonds. Bonds may be either collateralized or unsecured. Collateralized bonds have a lien against the company’s assets, which may provide bond holders enhanced bargaining power in the event of a bankruptcy. Unsecured bonds have no such lien.
While providing new opportunities, IDR bonds require rigorous analysis...
While IDR bonds may provide unusual investment opportunities, they also may entail increased risk and, therefore, demand especially intensive analysis. At Eaton Vance, we have credit analysts and resources dedicated to IDR bond research.
We feel that IDR bonds represent a key segment of the municipal bond market and should remain an important source of capital formation. In our view, the experience and resources needed to evaluate these issues further demonstrates the value of professional management. We will continue to look for opportunities in this sector of the municipal market.
| Sincerely, |
| |
| /s/ Thomas J. Fetter | |
| Thomas J. Fetter |
| President |
| May 11, 2005 |
Fund shares are not insured by the FDIC and are not deposits or other obligations of, or guaranteed by, any depository institution. Shares are subject to investment risks, including possible loss of principal invested.
2
Eaton Vance National Limited Maturity Municipals Fund as of March 31, 2005
MARKET RECAP
The U.S. economy continued to generate moderate growth during the year ended March 31, 2005. While higher gasoline and energy prices pinched consumers, the weak U.S. dollar raised inflationary concerns and helped push interest rates higher.
After a promising recovery in 2004, slower growth in early 2005...
The nation’s Gross Domestic Product grew by 3.1% in the first quarter of 2005, according to preliminary Commerce Department figures, following a 3.8% rise in the fourth quarter of 2004. Manufacturing activity, which had expanded strongly in the second half of 2004, slackened somewhat in the first quarter of 2005, amid slower industrial production and weakening demand for durable goods.
Consumer spending, which helped fuel the economic recovery over the past year, weakened considerably, as higher fuel costs and rising interest rates on loans and mortgages prompted consumers to tighten their belts. Capital spending also slowed, as businesses curtailed new investments in plants and factories, while reducing the pace of investment in productivity-enhancing equipment and software. Residential construction remained relatively strong, although slightly off the torrid pace set in 2004.
After recovering dramatically in 2004, job creation weakened somewhat in early 2005...
The nation’s labor markets strengthened during the year, although the pace of job creation weakened at the close of the period. Hiring picked up during the year in areas that had suffered large technology sector layoffs. Also, manufacturing, financial services, business services, trucking, shipping, construction, energy, health care, and media also generated new jobs. In the first quarter of 2005, however, employers showed some reticencein hiring practices, as they were forced to cope with unpredictable fuel cost hikes.
Intermediate-term municipal bonds yield 80% of Treasury yields

Principal and interest payments of Treasury securities are guaranteed by the U.S. government.
*GO yields are a compilation of a representative variety of general obligations and are not necessarily representative of the Funds’ yields. Statistics as of March 31, 2005.
Past performance is no guarantee of future results.
Source: Bloomberg, L.P.
The Federal Reserve continued to raise short-term interest rates in 2005...
The Federal Reserve pushed short-term rates higher, suggesting it will continue to raise rates to keep the economy from growing too quickly and, thereby, reviving inflation. Beginning in June 2004, the Fed increased its Federal Funds rate – a key short-term interest rate barometer – on eight occasions, raising that benchmark from 1.00% to 3.00%, including its most recent rate hike in May 2005.
The municipal bond market posted a modest gain for the year, slightly outperforming the Treasury market. For the year ended March 31, 2005, the Lehman Brothers Municipal Bond Index – an unmanaged index of longer-term, investment-grade, municipal debt securities made up of issues larger than $50 million – had a total return of 2.67.%.*
* It is not possible to invest directly in an Index. The Index’s total return does not reflect commissions or expenses that would have been incurred if an investor individually purchased or sold the securities represented in the Index.
The views expressed throughout this report are those of the portfolio manager and are current only through the end of the period of the report as stated on the cover. These views are subject to change at any time based upon market or other conditions, and the investment adviser disclaims any responsibility to update such views. These views may not be relied on as investment advice and, because investment decisions for a fund are based on many factors, may not be relied on as an indication of trading intent on behalf of any Eaton Vance fund.
3
Eaton Vance National Limited Maturity Municipals Fund as of March 31, 2005
INVESTMENT UPDATE
The Fund
Performance for the Past Year
• The Fund’s Class A shares had a total return of 2.29% for the year ended March 31, 2005.(1) This return was the result of a decrease in net asset value (NAV) to $10.21 per share on March 31, 2005 from $10.40 on March 31, 2004, and the reinvestment of $0.425 in regular monthly dividends.(2)
• The Fund’s Class B shares had a total return of 1.51% for the year ended March 31, 2005.(1) This return was the result of a decrease in NAV to $10.22 per share on March 31, 2005 from $10.41 on March 31, 2004, and the reinvestment of $0.345 in regular monthly dividends.(2)
• The Fund’s Class C shares had a total return of 1.51% for the year ended March 31, 2005.(1) This return was the result of a decrease in NAV to $9.58 per share on March 31, 2005 from $9.75 on March 31, 2004, and the reinvestment of $0.316 in regular monthly dividends.(2)
• For comparison, the Lehman Brothers 7-Year Municipal Bond Index – an unmanaged index of investment-grade, municipal debt securities with an average maturity of 7 years – had a total return of 0.80% for the year ended March 31, 2005.(3)
• Based on the Fund’s most recent dividend of the period and NAVs on March 31, 2005 of $10.21 per share for Class A, $10.22 for Class B and $9.58 for Class C, the Fund’s distribution rates were 4.16%, 3.38% and 3.37%, respectively.(4) The distribution rates of Class A, Class B and Class C are equivalent to taxable rates of 6.40%, 5.20% and 5.18%, respectively.(5)
• The SEC 30-day yields for Class A, B and C shares at March 31, 2005 were 3.65%, 2.98% and 2.98%, respectively.(6) The SEC 30-day yields of Class A, Class B and Class C are equivalent to taxable yields of 5.62%, 4.58% and 4.58%, respectively.(5)
* Private insurance does not decrease the risk of loss of principal associated with this investment.

William H. Ahern
Portfolio Manager
Management Discussion
• The U.S. economy expanded moderately during the period, despite concerns over rising fuel costs. Manufacturing rebounded somewhat, while financial services, business services, transportation, construction, energy and health care posted strong job growth. The U.S. jobless rate was 5.2% in March 2005, down from 5.7% a year ago.
• Insured* transportation bonds constituted the Fund’s largest sector weighting at March 31, 2005. Investments included issues for major airport authorities, as well as highway and turnpike authorities and a state transportation trust fund. With income drawn from toll collections and airport gate fees, transportation bonds have enjoyed historically stable revenues.
• The Fund maintained a significant investment in the electric utilities sector. As essential services bonds, utilities tend to have a revenue base less impacted by fluctuations in the economy. Management emphasized utilities with established management located in growing service areas.
• Hospital bonds remained major investments in the Fund. With stricter Medicare reimbursement rules and increasingly intense competition, management focused on institutions it believes have sound financial structures, good management and in-demand specialties.
• The Fund had investments in special tax revenue issues, which financed a wide range of infrastructure and capital improvement projects across the nation. The bonds provide communities a financing alternative and are backed by specially-directed tax revenues, such as cigarette, sales or use taxes.
• Management adjusted the Fund’s coupon structure to reflect the upward shift in interest rates. Management also continued to update call protection, paring issues with unfavorable call features in favor of bonds with longer-dated call provisions.
Formerly, the Fund invested its assets in a corresponding investment company (referred to as the Portfolio) that had the same investment objective and policies as the Fund. Effective October 8, 2004, the Fund began to invest its assets directly in securities. The Fund’s investment objective and other investment policies remain unchanged. In addition, Boston Management and Research, the investment adviser to the Portfolio, acts as investment adviser to the Fund. The investment advisery fee paid remains unchanged.
(1) | These returns do not include the 4.75% maximum sales charge for the Fund’s Class A shares or the applicable contingent deferred sales charges (CDSC) for Class B and Class C shares. If sales charges were deducted, returns would be lower. |
(2) | A portion of the Fund’s income may be subject to federal income tax and/or alternative minimum tax. Income may be subject to state and local taxes. |
(3) | It is not possible to invest directly in an Index. The Index’s total return does not reflect the commissions or expenses that would have been incurred if an investor individually purchased or sold the securities represented in the Index. |
(4) | The Fund’s distribution rate represents actual distributions paid to shareholders and is calculated by dividing the last distribution per share (annualized) by the net asset value. |
(5) | Taxable-equivalent figures assume a maximum 35.00% federal income tax rate. A lower rate would result in lower tax-equivalent figures. |
(6) | The Fund’s SEC yield is calculated by dividing the net investment income per share for the 30-day period by the offering price at the end of the period and annualizing the result. |
4
Eaton Vance National Limited Maturity Municipals Fund as of March 31, 2005
FUND PERFORMANCE
The line graph and table set forth below provide information about the Fund’s performance. The line graph compares the performance of Class B of the Fund with that of the Lehman Brothers 7-Year Municipal Bond Index, a broad-based, unmanaged market index. The lines on the graph represent the total returns of a hypothetical investment of $10,000 in each of Class B and the Lehman Brothers 7-Year Municipal Bond Index. The table includes the total returns of each Class of the Fund at net asset value and maximum public offering price. The performance presented below does not reflect the deduction of taxes, if any, that a shareholder would pay on Fund distributions or the redemption of Fund shares.
Performance(1) | | Class A | | Class B | | Class C | |
| | | | | | | |
Average Annual Total Returns (at net asset value) | | | | | | | |
One Year | | 2.29 | % | 1.51 | % | 1.51 | % |
Five Years | | 5.65 | | 4.85 | | 4.85 | |
Ten Years | | N.A. | | 4.21 | | 4.08 | |
Life of Fund† | | 5.09 | | 4.47 | | 3.68 | |
| | | | | | | |
SEC Average Annual Total Returns (including sales charge or applicable CDSC) | | | | | | | |
One Year | | -0.01 | % | -1.44 | % | 0.53 | % |
Five Years | | 5.16 | | 4.85 | | 4.85 | |
Ten Years | | N.A. | | 4.21 | | 4.08 | |
Life of Fund† | | 4.82 | | 4.47 | | 3.68 | |
† Inception Dates – Class A: 6/27/96; Class B: 5/22/92; Class C: 12/8/93
(1) Average annual total returns do not include the 4.75% maximum sales charge for Class A shares or the applicable contingent deferred sales charges (CDSC) for Class B and Class C shares. If sales charges were deducted, returns would be lower. SEC average annual total returns for Class A reflect the maximum 4.75% sales charge. SEC returns for Class B reflect applicable CDSC based on the following schedule: 5% - 1st and 2nd years; 4% - 3rd year; 3% - 4th year; 2% - 5th year; 1% - 6th year. SEC 1-year return for Class C reflects a 1% CDSC.
Past performance is no guarantee of future results. Returns are historical and are calculated by determining the percentage change in net asset value or offering price (as applicable) with all distributions reinvested. Investment return and principal value will fluctuate so that shares, when redeemed, may be worth more or less than their original cost. Performance is for the stated time period only; due to market volatility, the Fund’s current performance may be lower or higher than the quoted return. For performance as of the most recent month-end, please refer to www.eatonvance.com.
Diversification by Credit Quality(2)
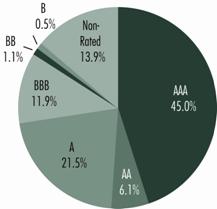
(2) As a percentage of total investments, as of March 31, 2005. Holdings subject to change due to active management.
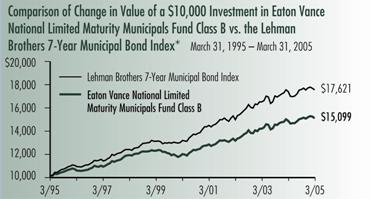
* Sources: Thomson Financial; Lipper, Inc.
Class B of the Fund commenced operations on 5/22/92.
A $10,000 hypothetical investment at net asset value in Class A and Class C on 6/27/96 and 3/31/95, respectively, would have been valued at $15,443 and $14,920, respectively, on March 31, 2005. A $10,000 hypothetical investment in Class A at maximum offering price would have been valued at $15,097. It is not possible to invest directly in an Index. The Index’s total return does not reflect the expenses that would have been incurred if an investor individually purchased or sold the securities represented in the Index.
5
Eaton Vance National Limited Maturity Municipals Fund as of March 31, 2005
FUND EXPENSES
Example: As a shareholder of the Fund, you incur two types of costs: (1) transaction costs, including sales charges (loads) on purchases and redemption fees (if applicable); and (2) ongoing costs, including management fees; distribution or service fees; and other Fund expenses. This Example is intended to help you understand your ongoing costs (in dollars) of investing in the Fund and to compare these costs with the ongoing costs of investing in other mutual funds. The Example is based on an investment of $1,000 invested at the beginning of the period and held for the entire period (October 1, 2004 – March 31, 2005).
Actual Expenses: The first section of the table below provides information about actual account values and actual expenses. You may use the information in this line, together with the amount you invested, to estimate the expenses that you paid over the period. Simply divide your account value by $1,000 (for example, an $8,600 account value divided by $1,000 = 8.6), then multiply the result by the number in the first line under the heading entitled “Expenses Paid During Period” to estimate the expenses you paid on your account during this period.
Hypothetical Example for Comparison Purposes: The second section of the table below provides information about hypothetical account values and hypothetical expenses based on the Fund’s actual expense ratios and an assumed rate of return of 5% per year before expenses, which is not the actual return of the Fund. The hypothetical account values and expenses may not be used to estimate the actual ending account balance or expenses you paid for the period. You may use this information to compare the ongoing costs of investing in the Fund and other funds. To do so, compare this 5% hypothetical example with the 5% hypothetical examples that appear in the shareholder reports of the other funds.
Please note that the expenses shown in the table are meant to highlight your ongoing costs only and do not reflect any transactional costs, such as sales charges (loads) or redemption fees (if applicable). Therefore, the second section of the table is useful in comparing ongoing costs only, and will not help you determine the relative total costs of owning different funds. In addition, if these transactional costs were included, your costs would have been higher.
Eaton Vance National Limited Maturity Municipals Fund
| | Beginning Account Value
(10/1/04) | | Ending Account Value
(3/31/05) | | Expenses Paid During Period*
(10/1/04-3/31/05) | |
| | | | | | | |
Actual | | | | | | | |
Class A | | $ | 1,000.00 | | $ | 1,004.73 | | $ | 3.90 | |
Class B | | $ | 1,000.00 | | $ | 1,001.88 | | $ | 7.64 | |
Class C | | $ | 1,000.00 | | $ | 1,001.27 | | $ | 7.63 | |
Hypothetical | | | | | | | |
(5% return before expenses) | | | | | | | |
Class A | | $ | 1,000.00 | | $ | 1,021.00 | | $ | 3.93 | |
Class B | | $ | 1,000.00 | | $ | 1,017.30 | | $ | 7.70 | |
Class C | | $ | 1,000.00 | | $ | 1,017.30 | | $ | 7.70 | |
* Expenses are equal to the Fund’s annualized expense ratio of 0.78% for Class A shares, 1.53% for Class B shares and 1.53% for Class C shares multiplied by the average account value over the period, multiplied by 182/365 (to reflect the one-half year period). The Example assumes that the $1,000 was invested at the net asset value per share determined at the close of business on September 30, 2004.
6
Eaton Vance National Limited Maturity Municipals Fund as of March 31, 2005
PORTFOLIO OF INVESTMENTS
| | Tax-Exempt Investments - 98.1% | | | | | | | | |
Principal Amount
(000's omitted) | |
Security | |
Value | |
| | Cogeneration - 1.8% | | | | | | | | |
| $ | 1,595 | | | Carbon County, PA, IDA, (Panther Creek Partners), (AMT),
6.65%, 5/1/10 | | $ | 1,722,377 | | |
| | 985 | | | Ohio Water Development Authority, Solid Waste Disposal,
(Bay Shore Power), (AMT), 6.625%, 9/1/20 | | | 1,015,614 | | |
| | 350 | | | Pennsylvania EDA, (Resource Recovery-Northampton),
(AMT), 6.75%, 1/1/07 | | | 360,010 | | |
| | 1,400 | | | Pennsylvania EDA, (Resource Recovery-Colver), (AMT),
7.05%, 12/1/10 | | | 1,432,704 | | |
| | | | | | | $ | 4,530,705 | | |
| | Education - 3.5% | | | | | | | | |
| $ | 2,000 | | | Illinois Educational Facility Authority,
(Art Institute of Chicago), 4.45%, 3/1/34 | | $ | 1,977,500 | | |
| | 2,815 | | | Missouri Health and Educational Facilities Authority,
(St. Louis University), 5.50%, 10/1/16 | | | 3,166,622 | | |
| | 850 | | | New Hampshire HEFA, (Colby-Sawyer College),
7.20%, 6/1/12 | | | 888,301 | | |
| | 1,235 | | | New Jersey Educational Facilities Authority,
(Steven's Institute of Technology), 5.00%, 7/1/12 | | | 1,304,419 | | |
| | 1,700 | | | University of Illinois, 0.00%, 4/1/15 | | | 1,075,624 | | |
| | 1,000 | | | University of Illinois, 0.00%, 4/1/16 | | | 596,670 | | |
| | | | | | | $ | 9,009,136 | | |
| | Electric Utilities - 10.8% | | | | | | | | |
| $ | 1,000 | | | Brazos River Authority, TX, (Reliant Energy, Inc.),
7.75%, 12/1/18 | | $ | 1,112,190 | | |
| | 1,500 | | | California Department of Water Resource Power Supply,
5.125%, 5/1/18 | | | 1,582,125 | | |
| | 3,000 | | | Energy Northwest Washington Electric, (Columbia
Generating), 5.50%, 7/1/15 | | | 3,349,740 | | |
| | 1,000 | | | Illinois Development Finance Authority PCR, (AMT),
5.00%, 6/1/28 | | | 1,025,490 | | |
| | 2,500 | | | New Hampshire Business Finance Authority Pollution Control,
(Central Maine Power Co.), 5.375%, 5/1/14 | | | 2,642,050 | | |
| | 3,050 | | | New York Energy Research and Development
Authority Facility, (AMT), 4.70%, 6/1/36 | | | 3,056,710 | | |
| | 4,100 | | | North Carolina Eastern Municipal Power Agency,
5.375%, 1/1/13 | | | 4,394,585 | | |
| | 4,000 | | | North Carolina Municipal Power Agency, (Catawba),
5.50%, 1/1/13 | | | 4,378,040 | | |
| | 1,000 | | | North Carolina Municipal Power Agency, (Catawba),
6.375%, 1/1/13 | | | 1,107,050 | | |
| | 1,250 | | | Sam Rayburn, TX, Municipal Power Agency, Power
Supply System, 6.00%, 10/1/16 | | | 1,363,675 | | |
| | 1,000 | | | San Antonio, TX, Electric and Natural Gas, 4.50%, 2/1/21 | | | 1,000,120 | | |
Principal Amount
(000's omitted) | |
Security | |
Value | |
| | Electric Utilities (continued) | | | | | | | | |
| $ | 2,500 | | | Wake County, NC, Industrial Facilities and Pollution Control
Financing Authority, (Carolina Power and Light Co.),
5.375%, 2/1/17 | | $ | 2,652,550 | | |
| | | | | | | $ | 27,664,325 | | |
| | Escrowed / Prerefunded - 6.8% | | | | | | | | |
| $ | 1,000 | | | Arkansas State Student Loan Authority, (AMT),
Prerefunded to 6/1/06, 6.25%, 6/1/10 | | $ | 1,036,760 | | |
| | 355 | | | Florence, KY, Housing Facilities, (Bluegrass Housing),
Escrowed to Maturity, 7.25%, 5/1/07 | | | 356,342 | | |
| | 465 | | | Forsyth County, GA, Hospital Authority,
(Georgia Baptist Health Care System),
Escrowed to Maturity, 6.00%, 10/1/08 | | | 490,217 | | |
| | 500 | | | Kershaw County, SC, School District, Prerefunded to 2/1/10,
5.00%, 2/1/18 | | | 525,205 | | |
| | 3,500 | | | Maricopa County, AZ, IDA, Multifamily, Escrowed to Maturity,
6.45%, 1/1/17(1) | | | 3,770,375 | | |
| | 575 | | | Maricopa County, AZ, IDA, Multifamily, Escrowed to Maturity,
7.875%, 1/1/11 | | | 652,493 | | |
| | 3,000 | | | Massachusetts Turnpike Authority, Escrowed to Maturity,
5.00%, 1/1/20 | | | 3,217,560 | | |
| | 2,110 | | | Metropolitan Transportation Authority of New York,
Prerefunded to 7/1/15, 5.50%, 7/1/17 | | | 2,393,816 | | |
| | 395 | | | Michigan Hospital Finance Authority, (Presbyterian Villages),
Escrowed to Maturity, 6.20%, 1/1/06 | | | 401,020 | | |
| | 2,000 | | | New Jersey Transportation Trust Fund Authority,
(Transportation System), Prerefunded to 6/15/13,
5.50%, 6/15/14 | | | 2,247,980 | | |
| | 1,195 | | | North Carolina Eastern Municipal Power Agency,
Escrowed to Maturity, 4.00%, 1/1/18 | | | 1,172,104 | | |
| | 1,000 | | | Northwest Arkansas Regional Airport Authority, (AMT),
Prerefunded to 2/1/08, 7.625%, 2/1/27 | | | 1,124,110 | | |
| | | | | | | $ | 17,387,982 | | |
| | General Obligations - 3.6% | | | | | | | | |
| $ | 1,000 | | | Keller, TX, Independent School District, 0.00%, 8/15/11 | | $ | 777,440 | | |
| | 1,650 | | | McAllen, TX, Independent School District, (PSF),
4.50%, 2/15/18 | | | 1,653,663 | | |
| | 5,000 | | | New York City, NY, 5.00%, 12/1/20 | | | 5,184,000 | | |
| | 1,500 | | | New York City, NY, 5.625%, 12/1/13 | | | 1,631,250 | | |
| | | | | | | $ | 9,246,353 | | |
| | Health Care-Miscellaneous - 1.0% | | | | | | | | |
| $ | 2,000 | | | Illinois HFA, (Lutheran Social Services), 6.125%, 8/15/10 | | $ | 2,000,820 | | |
| | 150 | | | Pittsfield Township, MI, EDC, (Arbor Hospice),
7.875%, 8/15/27 | | | 144,646 | | |
See notes to financial statements
7
Eaton Vance National Limited Maturity Municipals Fund as of March 31, 2005
PORTFOLIO OF INVESTMENTS CONT'D
Principal Amount
(000's omitted) | |
Security | |
Value | |
| Health Care-Miscellaneous (continued) | | | | | |
| $ | 530 | | | Tax Revenue Exempt Securities Trust, Community Health
Provider, (Pooled Loan Program Various States Trust
Certificates), 6.00%, 12/1/36 | | $ | 541,648 | | |
| | | | | | | $ | 2,687,114 | | |
| Hospital - 10.5% | | | | | |
| $ | 550 | | | Colorado Health Facilities Authority, (Parkview Episcopal
Medical Center), 5.75%, 9/1/09 | | $ | 587,494 | | |
| | 165 | | | Colorado Health Facilities Authority, (Parkview Episcopal
Medical Center), 6.125%, 9/1/25 | | | 169,044 | | |
| | 2,500 | | | Cuyahoga County, OH, (Cleveland Clinic Health System),
6.00%, 1/1/17 | | | 2,793,300 | | |
| | 100 | | | Michigan Hospital Finance Authority, (Central Michigan
Community Hospital), 6.00%, 10/1/05 | | | 101,082 | | |
| | 100 | | | Michigan Hospital Finance Authority, (Central Michigan
Community Hospital), 6.10%, 10/1/06 | | | 103,006 | | |
| | 225 | | | Michigan Hospital Finance Authority, (Central Michigan
Community Hospital), 6.20%, 10/1/07 | | | 235,737 | | |
| | 545 | | | Michigan Hospital Finance Authority, (Gratiot Community
Hospital), 6.10%, 10/1/07 | | | 566,446 | | |
| | 2,000 | | | Michigan Hospital Finance Authority, (Henry Ford Health
System), 5.50%, 3/1/14 | | | 2,148,700 | | |
| | 1,000 | | | Michigan Hospital Finance Authority, (Memorial Healthcare
Center), 5.875%, 11/15/21 | | | 1,031,830 | | |
| | 2,490 | | | Michigan Hospital Finance Authority, Variable Rate,
9.935%, 11/1/12(2)(3) | | | 2,972,238 | | |
| | 300 | | | New Hampshire HEFA, (Littleton Hospital Association),
5.45%, 5/1/08 | | | 302,982 | | |
| | 1,800 | | | New York Dormitory Authority, (Methodist Hospital),
5.25%, 7/1/15 | | | 1,924,290 | | |
| | 2,055 | | | New York Dormitory Authority, (Methodist Hospital),
5.25%, 7/1/16 | | | 2,188,842 | | |
| | 2,185 | | | Oklahoma Development Finance Authority, (Hillcrest Medical
Center), Escrowed to Maturity, 5.00%, 8/15/09 | | | 2,318,547 | | |
| | 2,000 | | | Orange County, FL, Health Facilities Authority, (Adventist
Health System), 5.25%, 11/15/18 | | | 2,102,880 | | |
| | 2,000 | | | Orange County, FL, Health Facilities Authority, (Adventist
Health System), 6.375%, 11/15/20 | | | 2,199,480 | | |
| | 1,130 | | | Orange County, FL, Health Facilities Authority, (Nemours
Foundation), 5.00%, 1/1/18 | | | 1,203,043 | | |
| | 1,740 | | | Saginaw, MI, Hospital Finance Authority, 5.125%, 7/1/22 | | | 1,768,710 | | |
| | 2,000 | | | South Carolina Jobs-Economic Development Authority,
(Palmetto Health Alliance), 6.00%, 8/1/12 | | | 2,171,700 | | |
| | | | | | | $ | 26,889,351 | | |
Principal Amount
(000's omitted) | |
Security | |
Value | |
| Housing - 0.5% | | | | | |
| $ | 600 | | | Georgia Private Colleges and Universities Authority,
Student Housing Revenue, (Mercer Housing Corp.),
6.00%, 6/1/31 | | $ | 619,128 | | |
| | 680 | | | Sandoval County, NM, Multifamily, 6.00%, 5/1/32 | | | 666,148 | | |
| | 115 | | | Texas Student Housing Corp., (University of Northern Texas),
9.375%, 7/1/06 | | | 91,823 | | |
| | | | | | | $ | 1,377,099 | | |
| Industrial Development Revenue - 4.9% | | | | | |
| $ | 315 | | | Austin, TX, (Cargoport Development LLC), (AMT),
7.50%, 10/1/07 | | $ | 322,853 | | |
| | 430 | | | Austin, TX, (Cargoport Development LLC), (AMT),
8.30%, 10/1/21 | | | 452,480 | | |
| | 1,320 | | | Denver, CO, City and County Special Facilities,
(United Airlines), (AMT), 6.875%, 10/1/32(4) | | | 1,125,300 | | |
| | 1,630 | | | Houston, TX, Industrial Development Corp., (AMT),
6.375%, 1/1/23 | | | 1,676,911 | | |
| | 1,000 | | | Michigan Job Development Authority, (General Motors
Corp.), PCR, 5.55%, 4/1/09 | | | 1,002,520 | | |
| | 1,435 | | | Mississippi Business Finance Corp., (Air Cargo), (AMT),
7.25%, 7/1/34 | | | 1,456,295 | | |
| | 1,440 | | | New Jersey EDA, (Continental Airlines), (AMT),
6.25%, 9/15/19 | | | 1,185,106 | | |
| | 1,000 | | | New Jersey EDA, (Holt Hauling), 7.90%, 3/1/27(4) | | | 955,930 | | |
| | 1,500 | | | Nez Perce County, ID, PCR, (Potlatch Corp.),
6.125%, 12/1/07 | | | 1,534,530 | | |
| | 2,825 | | | Toledo Lucas County, OH, Port Authority, (Cargill, Inc.),
4.50%, 12/1/15 | | | 2,859,974 | | |
| | | | | | | $ | 12,571,899 | | |
| Insured-Education - 1.0% | | | | | |
| $ | 2,000 | | | New York Dormitory Authority, (SUNY, NY), (XLCA),
5.25%, 7/1/32 | | $ | 2,179,220 | | |
| | 500 | | | Southern Illinois University, Housing and Auxiliary Facilities,
(MBIA), 0.00%, 4/1/17 | | | 283,985 | | |
| | | | | | | $ | 2,463,205 | | |
| Insured-Electric Utilities - 3.4% | | | | | |
| $ | 750 | | | California Pollution Control Financing Authority, PCR,
(Pacific Gas and Electric), (MBIA), (AMT),
5.35%, 12/1/16 | | $ | 797,925 | | |
| | 2,000 | | | Forsyth, MT, PCR, (Avista Corp.), (AMBAC),
5.00%, 10/1/32(5) | | | 2,112,760 | | |
| | 1,975 | | | Long Island Power Authority, NY, Electric System Revenue,
(XLCA), 5.25%, 12/1/13 | | | 2,163,593 | | |
| | 2,000 | | | Long Island Power Authority, NY, Electric System Revenue,
(XLCA), 5.25%, 6/1/14 | | | 2,191,460 | | |
See notes to financial statements
8
Eaton Vance National Limited Maturity Municipals Fund as of March 31, 2005
PORTFOLIO OF INVESTMENTS CONT'D
Principal Amount
(000's omitted) | |
Security | |
Value | |
| Insured-Electric Utilities (continued) | | | | | |
| $ | 400 | | | Piedmont, SC, Municipal Power Agency, (MBIA),
5.00%, 1/1/15 | | $ | 412,244 | | |
| | 1,000 | | | Puerto Rico Electric Power Authority, (XLCA),
5.375%, 7/1/18 | | | 1,126,550 | | |
| | | | | | | $ | 8,804,532 | | |
| Insured-Escrowed / Prerefunded - 1.5% | | | | | |
| $ | 1,000 | | | Long Island Power Authority, NY, Electric System Revenue,
(FSA), Escrowed to Maturity, 5.25%, 12/1/14 | | $ | 1,104,240 | | |
| | 1,000 | | | Metropolitan Transportation Authority, NY, Commuter
Facilities, (AMBAC), Escrowed to Maturity, 5.00%, 7/1/20 | | | 1,047,880 | | |
| | 1,000 | | | Metropolitan Transportation Authority, NY, Transit Facilities,
(FGIC), Prerefunded to 10/1/15, 4.50%, 4/1/18 | | | 1,049,970 | | |
| | 500 | | | Metropolitan Transportation Authority, NY, Transit Facilities,
(MBIA), Escrowed to Maturity, 5.00%, 7/1/17 | | | 526,950 | | |
| | | | | | | $ | 3,729,040 | | |
| Insured-General Obligations - 6.8% | | | | | |
| $ | 1,655 | | | Bridgeport, CT, (MBIA), 5.25%, 8/15/17 | | $ | 1,791,736 | | |
| | 1,000 | | | Egg Harbor Township, NJ, School District, (FSA),
5.50%, 7/15/19 | | | 1,137,970 | | |
| | 1,000 | | | Hillsborough Township, NJ, School District, (FSA),
5.375%, 10/1/18 | | | 1,137,310 | | |
| | 1,000 | | | Jackson County, OR, School District No. 9 Eagle Point,
(MBIA), 5.50%, 6/15/19(6) | | | 1,137,380 | | |
| | 5,000 | | | Minneapolis, MN, Special School District No. 1, (MBIA),
4.50%, 2/1/19 | | | 5,023,250 | | |
| | 1,850 | | | New York, NY, (FGIC), 5.50%, 6/1/12 | | | 2,055,646 | | |
| | 1,400 | | | Springfield, OH, City School District, (FGIC),
5.00%, 12/1/17 | | | 1,490,524 | | |
| | 1,000 | | | St. Louis, MO, Board of Education, (FSA),
0.00%, 4/1/16 | | | 609,640 | | |
| | 500 | | | Summit County, OH, (FGIC), 4.75%, 12/1/21 | | | 516,500 | | |
| | 1,000 | | | Washington County, OR, School District No. 15 Forest Grove,
(FSA), 5.50%, 6/15/19(6) | | | 1,137,380 | | |
| | 1,255 | | | Yamhill County, OR, School District No. 29J, (FGIC),
5.50%, 6/15/19(6) | | | 1,427,412 | | |
| | | | | | | $ | 17,464,748 | | |
| Insured-Hospital - 3.3% | | | | | |
| $ | 775 | | | Akron, Bath and Copley, OH, Township, Hospital District,
(Childrens Hospital Center), (FSA), 5.25%, 11/15/15 | | $ | 834,970 | | |
| | 1,180 | | | Akron, Bath and Copley, OH, Township, Hospital District,
(Childrens Hospital Center), (FSA), 5.25%, 11/15/16 | | | 1,267,745 | | |
| | 2,000 | | | El Paso County, TX, Hospital District, (MBIA),
0.00%, 8/15/06 | | | 1,925,020 | | |
Principal Amount
(000's omitted) | |
Security | |
Value | |
| | Insured-Hospital (continued) | | | | | | | | |
| $ | 3,000 | | | Montgomery, AL, BMC Special Care Facilities Financing
Authority, (Baptist Health Montgomery), (MBIA),
0.00%, 11/15/17 | | $ | 2,730,480 | | |
| | 2,000 | | | Montogmery, AL, BMC Special Care Facilities Financing
Authority, (Baptist Health Montgomery), (MBIA),
0.00%, 11/15/18(7) | | | 1,812,140 | | |
| | | | | | | $ | 8,570,355 | | |
| | Insured-Lease Revenue / Certificates of
Participation - 1.7% | | | | | | | | |
| $ | 1,380 | | | Anaheim, CA, Public Financing Authority,
(Public Improvements), (FSA), 0.00%, 9/1/19 | | $ | 687,212 | | |
| | 1,000 | | | Laredo, TX, Certificates of Obligation, (MBIA),
4.50%, 2/15/17 | | | 1,004,100 | | |
| | 1,000 | | | New Jersey Transportation Trust Fund Authority,
Certificates of Participation, (MBIA), 5.25%, 12/15/14 | | | 1,100,260 | | |
| | 2,100 | | | Texas Public Finance Authority, (MBIA), 0.00%, 2/1/12 | | | 1,586,382 | | |
| | | | | | | $ | 4,377,954 | | |
| | Insured-Miscellaneous - 0.4% | | | | | | | | |
| $ | 1,000 | | | Missouri Development Finance Board Cultural Facility,
(Nelson Gallery Foundation), (MBIA), 5.25%, 12/1/14 | | $ | 1,084,760 | | |
| | | | | | | $ | 1,084,760 | | |
| | Insured-Solid Waste - 0.5% | | | | | | | | |
| $ | 1,175 | | | Massachusetts Development Finance Agency,
(Semass System), (MBIA), 5.625%, 1/1/12 | | $ | 1,298,234 | | |
| | | | | | | $ | 1,298,234 | | |
| | Insured-Special Tax Revenue - 0.8% | | | | | | | | |
| $ | 1,000 | | | Julington Creek Plantation, FL, Community Development
District, (MBIA), 4.75%, 5/1/19 | | $ | 1,022,530 | | |
| | 1,000 | | | Reno, NV, Capital Improvements, (FGIC),
5.625%, 6/1/14 | | | 1,109,920 | | |
| | | | | | | $ | 2,132,450 | | |
| | Insured-Transportation - 13.2% | | | | | | | | |
| $ | 2,295 | | | Chicago, IL, O'Hare International Airport, (MBIA), (AMT),
5.75%, 1/1/17 | | $ | 2,494,596 | | |
| | 1,000 | | | Denver, CO, City and County Airport, (FSA), (AMT),
5.00%, 11/15/11 | | | 1,059,120 | | |
| | 1,640 | | | Denver, CO, City and County Airport, (MBIA),
6.00%, 11/15/11 | | | 1,850,740 | | |
| | 4,000 | | | Hawaii State Highway, (FSA), 5.25%, 7/1/19 | | | 4,444,400 | | |
See notes to financial statements
9
Eaton Vance National Limited Maturity Municipals Fund as of March 31, 2005
PORTFOLIO OF INVESTMENTS CONT'D
Principal Amount
(000's omitted) | |
Security | |
Value | |
| | Insured-Transportation (continued) | | | | | | | | |
| $ | 1,000 | | | Houston, TX, Airport System, (FGIC), (AMT),
5.50%, 7/1/12 | | $ | 1,078,390 | | |
| | 2,000 | | | Kenton County, KY, Airport, (Cincinnati/Northern Kentucky),
(MBIA), (AMT), 5.625%, 3/1/13 | | | 2,167,220 | | |
| | 2,500 | | | Massachusetts Port Authority, (Delta Airlines), (AMBAC),
(AMT), 5.50%, 1/1/15 | | | 2,657,000 | | |
| | 1,000 | | | Miami-Dade County, FL, Aviation, (Miami International
Airport), (FGIC), (AMT), 5.50%, 10/1/13 | | | 1,084,240 | | |
| | 2,000 | | | Minneapolis and St. Paul, MN, Metropolitan Airport
Commission, (FGIC), (AMT), 5.25%, 1/1/11 | | | 2,137,220 | | |
| | 1,430 | | | Minneapolis and St. Paul, MN, Metropolitan Airports
Commission Airport, (FGIC), (AMT), 6.00%, 1/1/11 | | | 1,568,581 | | |
| | 5,000 | | | New Jersey Transportation Trust Fund Authority, (FGIC),
5.50%, 12/15/20 | | | 5,658,200 | | |
| | 2,000 | | | New Jersey Transportation Trust Fund Authority, (FSA),
5.25%, 10/1/14 | | | 2,231,000 | | |
| | 1,000 | | | New Jersey Transportation Trust Fund Authority, (MBIA),
5.50%, 12/15/17 | | | 1,125,350 | | |
| | 1,000 | | | Ohio Turnpike Commission, (FGIC), 5.50%, 2/15/18 | | | 1,133,000 | | |
| | 1,000 | | | Port Seattle, WA, (MBIA), (AMT), 6.00%, 2/1/11 | | | 1,108,890 | | |
| | 2,000 | | | Wayne Charter County, MI, Metropolitan Airport, (FGIC),
(AMT), 5.50%, 12/1/15 | | | 2,164,040 | | |
| | | | | | | $ | 33,961,987 | | |
| | Insured-Water and Sewer - 1.2% | | | | | | | | |
| $ | 2,000 | | | Honolulu, HI, Wastewater System, (FGIC),
0.00%, 7/1/11 | | $ | 1,565,280 | | |
| | 1,250 | | | Washington County, OR, Clean Water Services, (MBIA),
5.25%, 10/1/16 | | | 1,389,863 | | |
| | | | | | | $ | 2,955,143 | | |
| | Lease Revenue / Certificates of Participation - 1.5% | | | | | | | | |
| $ | 3,385 | | | New Jersey EDA, (School Facilities Construction),
5.50%, 9/1/19 | | $ | 3,800,475 | | |
| | | | | | | $ | 3,800,475 | | |
| | Nursing Home - 0.6% | | | | | | | | |
| $ | 810 | | | Clovis, NM, IDR, (Retirement Ranches, Inc.),
7.75%, 4/1/19 | | $ | 840,326 | | |
| | 250 | | | Massachusetts IFA, (Age Institute of Massachusetts),
7.60%, 11/1/05 | | | 250,103 | | |
| | 485 | | | Wisconsin HEFA, (Wisconsin Illinois Senior Housing),
7.00%, 8/1/29 | | | 456,443 | | |
| | | | | | | $ | 1,546,872 | | |
Principal Amount
(000's omitted) | |
Security | |
Value | |
| | Other Revenue - 4.1% | | | | | | | | |
| $ | 1,000 | | | Arizona Health Facilities Authority, (Blood Systems, Inc.),
5.00%, 4/1/21 | | $ | 1,015,940 | | |
| | 890 | | | Barona, CA, (Band of Mission Indians), 8.25%, 1/1/20 | | | 919,886 | | |
| | 2,000 | | | California Statewide Communities Development Authority,
(East Valley Tourist Development Authority),
8.25%, 10/1/14(2) | | | 2,037,480 | | |
| | 1,650 | | | Capital Trust Agency, FL, (Seminole Tribe Convention),
8.95%, 10/1/33 | | | 1,848,000 | | |
| | 2,500 | | | Golden Tobacco Securitization Corp., CA, 5.00%, 6/1/13 | | | 2,504,375 | | |
| | 1,000 | | | Mohegan Tribe, CT, Gaming Authority, 5.375%, 1/1/11(2) | | | 1,056,000 | | |
| | 1,000 | | | Sandoval County, NM, (Santa Ana Pueblo), 7.75%, 7/1/15(2) | | | 1,026,060 | | |
| | 115 | | | Santa Fe, NM, (Crow Hobbs), 8.25%, 9/1/05 | | | 114,762 | | |
| | | | | | | $ | 10,522,503 | | |
| | Pooled Loans - 1.1% | | | | | | | | |
| $ | 1,900 | | | Arizona Educational Loan Marketing Corp., (AMT),
6.25%, 6/1/06 | | $ | 1,949,514 | | |
| | 790 | | | Ohio Economic Development, (Ohio Enterprise Bond Fund),
(AMT), 5.25%, 12/1/15 | | | 810,848 | | |
| | | | | | | $ | 2,760,362 | | |
| | Senior Living / Life Care - 1.3% | | | | | | | | |
| $ | 765 | | | Albuquerque, NM, Retirement Facilities, (La Vida Liena
Retirement Center), 6.60%, 12/15/28 | | $ | 748,767 | | |
| | 1,105 | | | Arizona Health Facilities Authority, (Care Institute, Inc.-Mesa),
7.625%, 1/1/06(8) | | | 1,046,148 | | |
| | 500 | | | Kansas City, MO, IDR, (Kingswood Manor),
5.80%, 11/15/17 | | | 475,075 | | |
| | 240 | | | Massachusetts IFA, (Forge Hill), (AMT), 6.75%, 4/1/30 | | | 226,502 | | |
| | 280 | | | Mesquite, TX, Health Facilities Development, (Christian Care
Centers), 7.00%, 2/15/10 | | | 296,674 | | |
| | 490 | | | North Miami, FL, Health Facilities Authority, (Imperial Club),
6.75%, 1/1/33 | | | 451,432 | | |
| | | | | | | $ | 3,244,598 | | |
| | Solid Waste - 1.2% | | | | | | | | |
| $ | 3,000 | | | Niagra County, NY, IDA, (American Ref-Fuel Co. LLC),
(AMT), 5.55%, 11/15/24 | | $ | 3,198,180 | | |
| | | | | | | $ | 3,198,180 | | |
| | Special Tax Revenue - 9.1% | | | | | | | | |
| $ | 1,500 | | | Brentwood, CA, Infrastructure Financing Authority,
6.375%, 9/2/33 | | $ | 1,545,555 | | |
| | 3,000 | | | California State Economic Recovery, 5.25%, 7/1/13 | | | 3,297,600 | | |
| | 500 | | | Concorde Estates Community Development District, FL,
Capital Improvements, 5.00%, 5/1/11 | | | 500,110 | | |
See notes to financial statements
10
Eaton Vance National Limited Maturity Municipals Fund as of March 31, 2005
PORTFOLIO OF INVESTMENTS CONT'D
Principal Amount
(000's omitted) | |
Security | |
Value | |
| Special Tax Revenue (continued) | | | | | |
| $ | 500 | | | Cottonwood, CO, Water and Sanitation District,
7.75%, 12/1/20 | | $ | 522,805 | | |
| | 2,000 | | | Detroit, MI, Downtown Development Authority Tax
Increment, 0.00%, 7/1/21 | | | 846,720 | | |
| | 300 | | | Fishhawk, FL, Community Development District,
5.00%, 11/1/07 | | | 304,017 | | |
| | 2,100 | | | Fishhawk, FL, Community Development District II,
5.125%, 11/1/09 | | | 2,119,866 | | |
| | 250 | | | Frederick County, MD, Urbana Community Development
Authority, 6.625%, 7/1/25 | | | 259,115 | | |
| | 430 | | | Gateway, FL, Services Community Development District,
(Stoneybrook), 5.50%, 7/1/08 | | | 437,280 | | |
| | 1,895 | | | Heritage Harbour, FL, South Community Development
District, Capital Improvements, 5.25%, 11/1/08 | | | 1,907,071 | | |
| | 135 | | | Heritage Palms Community Development District, FL,
Capital Improvements, 6.25%, 11/1/07 | | | 135,952 | | |
| | 785 | | | Jurupa, CA, Community Services District, 5.00%, 9/1/25 | | | 771,655 | | |
| | 115 | | | Longleaf, FL, Community Development District,
6.20%, 5/1/09 | | | 111,369 | | |
| | 1,000 | | | Massachusetts Bay Transportation Authority,
5.25%, 7/1/18 | | | 1,108,490 | | |
| | 2,000 | | | Massachusetts Bay Transportation Authority, Sales Tax,
5.50%, 7/1/17 | | | 2,262,240 | | |
| | 3,000 | | | New Jersey EDA, (Cigarette Tax), 5.50%, 6/15/16 | | | 3,253,830 | | |
| | 1,000 | | | New York Local Government Assistance Corp.,
5.25%, 4/1/16 | | | 1,094,970 | | |
| | 2,000 | | | Sterling Hill Community Development District, FL, Capital
Improvements, 5.50%, 11/1/10 | | | 2,032,040 | | |
| | 850 | | | Tiverton, RI, Obligation Tax Increment, (Mount Hope Bay
Village), 6.00%, 5/1/09 | | | 870,451 | | |
| | | | | | | $ | 23,381,136 | | |
| Transportation - 2.0% | | | | | |
| $ | 1,170 | | | Delaware River Joint Toll Bridge Commission, PA,
5.25%, 7/1/15 | | $ | 1,260,757 | | |
| | 100 | | | Eagle County, CO, Airport Terminal Corp.,
(American Airlines), (AMT), 6.75%, 5/1/06 | | | 101,194 | | |
| | 2,500 | | | Louisiana Offshore Terminal Authority, Deepwater Port
Revenue, (Loop, LLC), 5.25%, 9/1/15 | | | 2,632,225 | | |
| | 1,000 | | | Port Authority of New York and New Jersey,
5.375%, 3/1/28 | | | 1,114,330 | | |
| | | | | | | $ | 5,108,506 | | |
| | Total Tax-Exempt Investments - 98.1%
(identified cost $244,872,796) | | | | | $ | 251,769,004 | | |
| | Other Assets, Less Liabilities - 1.9% | | | | | $ | 4,823,587 | | |
| | Net Assets - 100.0% | | | | | $ | 256,592,591 | | |
AMBAC - AMBAC Financial Group, Inc.
AMT - Interest earned from these securities may be considered a tax preference item for purposes of the Federal Alternative Minimum Tax.
FGIC - Financial Guaranty Insurance Company
FSA - Financial Security Assurance, Inc.
MBIA - Municipal Bond Insurance Association
XLCA - XL Capital Assurance, Inc.
At March 31, 2005, the concentration of the Fund's investments in the various states, determined as a percentage of net assets, is as follows:
New York 13.3%
Others, representing less than 10% individually 84.8%
The Fund invests primarily in debt securities issued by municipalities. The ability of the issuers of the debt securities to meet their obligations may be affected by economic developments in a specific industry or municipality. In order to reduce the risk associated with such economic developments, at March 31, 2005, 34.5% of the securities in the portfolio of investments are backed by bond insurance of various financial institutions and financial guaranty assurance agencies. The aggregate percentage insured by an individual financial institution ranged from 2.3% to 13.4% of total investments.
(1) Security (or a portion thereof) has been segregated to cover when-issued securities.
(2) Security exempt from registration under Rule 144A of the Securities Act of 1933. These securities may be sold in transactions exempt from registration, normally to qualified institutional buyers. At March 31, 2005, the aggregate value of the securities is $2,972,238 or 1.2% of the Fund's net assets.
(3) Security has been issued as a leveraged inverse floater bond. The stated interest rate represents the rate in effect at March 31, 2005.
(4) Defaulted bond.
(5) Security (or a portion thereof) has been segregated to cover margin requirements on open financial futures contracts.
(6) When-issued security.
(7) Step bond.
(8) Security is in default and making only partial interest payments.
See notes to financial statements
11
Eaton Vance National Limited Maturity Municipals Fund as of March 31, 2005
FINANCIAL STATEMENTS
Statement of Assets and Liabilities
As of March 31, 2005
| Assets | | | |
| Investments, at value (identified cost, $244,872,796) | | $ | 251,769,004 | | |
| Cash | | | 4,674,625 | | |
| Receivable for investments sold | | | 490,424 | | |
| Receivable for Fund shares sold | | | 1,200,833 | | |
| Interest receivable | | | 3,698,710 | | |
| Prepaid expenses | | | 29,096 | | |
| Total assets | | $ | 261,862,692 | | |
| Liabilities | | | |
| Payable for when-issued securities | | $ | 3,697,659 | | |
| Payable for Fund shares redeemed | | | 828,137 | | |
| Dividends payable | | | 427,479 | | |
| Payable for daily variation margin on open financial futures contracts | | | 223,266 | | |
| Payable to affiliate for distribution and service fees | | | 13,410 | | |
| Payable to affiliate for Trustees' fees | | | 36 | | |
| Accrued expenses | | | 80,114 | | |
| Total liabilities | | $ | 5,270,101 | | |
| Net assets | | $ | 256,592,591 | | |
| Sources of Net Assets | | | |
| Paid-in capital | | $ | 254,350,901 | | |
| Accumulated net realized loss (computed on the basis of identified cost) | | | (4,781,354 | ) | |
| Accumulated distributions in excess of net investment income | | | (206,375 | ) | |
| Net unrealized appreciation (computed on the basis of identified cost) | | | 7,229,419 | | |
| Total | | $ | 256,592,591 | | |
| Class A Shares | | | |
| Net Assets | | $ | 152,110,915 | | |
| Shares Outstanding | | | 14,894,656 | | |
Net Asset Value and Redemption Price Per Share
(net assets ÷ shares of beneficial interest outstanding) | | $ | 10.21 | | |
Maximum Offering Price Per Share
(100 ÷ 97.75 of $10.21) | | $ | 10.45 | | |
| Class B Shares | | | |
| Net Assets | | $ | 27,156,706 | | |
| Shares Outstanding | | | 2,656,990 | | |
Net Asset Value, Offering Price and Redemption Price Per Share
(net assets ÷ shares of beneficial interest outstanding) | | $ | 10.22 | | |
| Class C Shares | | | |
| Net Assets | | $ | 77,324,970 | | |
| Shares Outstanding | | | 8,074,753 | | |
Net Asset Value, Offering Price and Redemption Price Per Share
(net assets ÷ shares of beneficial interest outstanding) | | $ | 9.58 | | |
| On sales of $100,000 or more, the offering price of Class A shares is reduced. | | | | | |
Statement of Operations
For the Year Ended
March 31, 2005
| Investment Income | | | |
| Interest | | $ | 5,600,972 | | |
| Interest allocated from Portfolio | | | 6,051,003 | | |
| Expenses allocated from Portfolio | | | (673,572 | ) | |
| Total investment income | | $ | 10,978,403 | | |
| Expenses | | | |
| Investment adviser fee | | $ | 518,620 | | |
| Trustees' fees and expenses | | | 6,489 | | |
Distribution and service fees
Class A | | | 199,038 | | |
| Class B | | | 282,641 | | |
| Class C | | | 667,721 | | |
| Transfer and dividend disbursing agent fees | | | 114,053 | | |
| Custodian fee | | | 98,125 | | |
| Registration fees | | | 63,336 | | |
| Legal and accounting services | | | 38,218 | | |
| Printing and postage | | | 19,087 | | |
| Miscellaneous | | | 20,553 | | |
| Total expenses | | $ | 2,027,881 | | |
Deduct -
Reduction of custodian fee | | $ | 21,418 | | |
| Reduction of investment adviser fee | | | 600 | | |
| Total expense reductions | | $ | 22,018 | | |
| Net expenses | | $ | 2,005,863 | | |
| Net investment income | | $ | 8,972,540 | | |
| Realized and Unrealized Gain (Loss) | | | |
Net realized gain (loss) -
Investment transactions (identified cost basis) | | $ | 1,313,106 | | |
| Investment transactions from Portfolio (identified cost basis) | | | 272,440 | | |
| Financial futures contracts | | | (1,188,367 | ) | |
| Financial futures contracts from Portfolio | | | (662,476 | ) | |
| Net realized loss | | $ | (265,297 | ) | |
Change in unrealized appreciation (depreciation) -
Investments (identified cost basis) | | $ | (4,939,414 | ) | |
| Investments from Portfolio (identified cost basis) | | | (290,088 | ) | |
| Financial futures contracts | | | 878,898 | | |
| Financial futures contracts from Portfolio | | | 35,504 | | |
| Net change in unrealized appreciation (depreciation) | | $ | (4,315,100 | ) | |
| Net realized and unrealized loss | | $ | (4,580,397 | ) | |
| Net increase in net assets from operations | | $ | 4,392,143 | | |
See notes to financial statements
12
Eaton Vance National Limited Maturity Municipals Fund as of March 31, 2005
FINANCIAL STATEMENTS CONT'D
Statements of Changes in Net Assets
Increase (Decrease)
in Net Assets | | Year Ended
March 31, 2005 | | Year Ended
March 31, 2004 | |
From operations -
Net investment income | | $ | 8,972,540 | | | $ | 8,430,805 | | |
Net realized loss from investment
transactions and financial
futures contracts | | | (265,297 | ) | | | (1,067,462 | ) | |
Net change in unrealized
appreciation (depreciation)
from investments and financial
futures contracts | | | (4,315,100 | ) | | | 4,082,295 | | |
| Net increase in net assets from operations | | $ | 4,392,143 | | | $ | 11,445,638 | | |
Distributions to shareholders -
From net investment income
Class A | | $ | (5,454,047 | ) | | $ | (5,132,061 | ) | |
| Class B | | | (1,048,876 | ) | | | (1,168,727 | ) | |
| Class C | | | (2,470,667 | ) | | | (1,947,384 | ) | |
| Total distributions to shareholders | | $ | (8,973,590 | ) | | $ | (8,248,172 | ) | |
Transactions in shares of beneficial interest -
Proceeds from sale of shares | | | | | | | | | |
| Class A | | $ | 64,046,619 | | | $ | 48,454,822 | | |
| Class B | | | 7,250,045 | | | | 17,968,278 | | |
| Class C | | | 25,915,496 | | | | 37,670,041 | | |
Net asset value of shares issued to
shareholders in payment of
distributions declared
Class A | | | 3,133,855 | | | | 2,524,200 | | |
| Class B | | | 558,191 | | | | 562,608 | | |
| Class C | | | 1,076,697 | | | | 930,251 | | |
Cost of shares redeemed
Class A | | | (50,093,129 | ) | | | (45,897,608 | ) | |
| Class B | | | (6,533,382 | ) | | | (13,921,274 | ) | |
| Class C | | | (15,450,266 | ) | | | (18,983,187 | ) | |
Net asset value of shares exchanged
Class A | | | 7,265,517 | | | | 3,909,314 | | |
| Class B | | | (7,265,517 | ) | | | (3,909,314 | ) | |
Net increase in net assets from
Fund share transactions | | $ | 29,904,126 | | | $ | 29,308,131 | | |
| Net increase in net assets | | $ | 25,322,679 | | | $ | 32,505,597 | | |
| Net Assets | | | | | | | | | |
| At beginning of year | | $ | 231,269,912 | | | $ | 198,764,315 | | |
| At end of year | | $ | 256,592,591 | | | $ | 231,269,912 | | |
Accumulated distributions
in excess of net investment
income included in net assets | | | | | | | | | |
| At end of year | | $ | (206,375 | ) | | $ | (115,613 | ) | |
See notes to financial statements
13
Eaton Vance National Limited Maturity Municipals Fund as of March 31, 2005
FINANCIAL STATEMENTS CONT'D
Financial Highlights
| | | Class A | |
| | | Year Ended March 31, | |
| | | 2005(1) | | 2004(1) | | 2003(1) | | 2002(1)(2) | | 2001 | |
| Net asset value - Beginning of year | | $ | 10.400 | | | $ | 10.250 | | | $ | 9.860 | | | $ | 10.040 | | | $ | 9.790 | | |
| Income (loss) from operations | | | |
| Net investment income | | $ | 0.422 | | | $ | 0.437 | | | $ | 0.461 | | | $ | 0.485 | | | $ | 0.531 | | |
| Net realized and unrealized gain (loss) | | | (0.187 | ) | | | 0.138 | | | | 0.395 | | | | (0.152 | ) | | | 0.241 | | |
| Total income from operations | | $ | 0.235 | | | $ | 0.575 | | | $ | 0.856 | | | $ | 0.333 | | | $ | 0.772 | | |
| Less distributions | | | |
| From net investment income | | $ | (0.425 | ) | | $ | (0.425 | ) | | $ | (0.466 | ) | | $ | (0.513 | ) | | $ | (0.522 | ) | |
| Total distributions | | $ | (0.425 | ) | | $ | (0.425 | ) | | $ | (0.466 | ) | | $ | (0.513 | ) | | $ | (0.522 | ) | |
| Net asset value - End of year | | $ | 10.210 | | | $ | 10.400 | | | $ | 10.250 | | | $ | 9.860 | | | $ | 10.040 | | |
| Total Return(3) | | | 2.29 | % | | | 5.70 | % | | | 8.90 | % | | | 3.39 | % | | | 8.12 | % | |
| Ratios/Supplemental Data | | | |
| Net assets, end of year (000's omitted) | | $ | 152,111 | | | $ | 130,466 | | | $ | 119,619 | | | $ | 83,647 | | | $ | 71,365 | | |
| Ratios (As a percentage of average daily net assets): | | | | | | | | | | | | | | | | | | | | | |
| Expenses(4) | | | 0.80 | %† | | | 0.80 | % | | | 0.82 | % | | | 0.91 | % | | | 0.94 | % | |
| Expenses after custodian fee reduction(4) | | | 0.79 | %† | | | 0.80 | % | | | 0.81 | % | | | 0.88 | % | | | 0.93 | % | |
| Net investment income | | | 4.09 | %† | | | 4.22 | % | | | 4.54 | % | | | 4.85 | % | | | 5.37 | % | |
| Portfolio Turnover of the Portfolio(5) | | | 14 | % | | | 27 | % | | | 24 | % | | | 12 | % | | | 13 | % | |
| Portfolio Turnover of the Fund | | | 19 | % | | | - | | | | - | | | | - | | | | - | | |
† The operating expenses of the Fund reflect a reduction of the investment advisor fee. Had such actions not been taken, the ratios would have been the same.
(1) Net investment income per share was computed using the average shares outstanding.
(2) The Fund, through its investment in the Portfolio, has adopted the provisions of the revised AICPA Audit and Accounting Guide for Investment Companies and began using the interest method to amortize premiums on fixed-income securities. The effect of this change for the year ended March 31, 2002 was to increase net investment income per share by $0.002, and increase net realized and unrealized losses per share by $0.002, and increase the ratio of net investment income to average net assets from 4.83% to 4.85%. Per share data and ratios for the periods prior to April 1, 2001 have not been restated to reflect this change in presentation.
(3) Returns are historical and are calculated by determining the percentage change in net asset value with all distributions reinvested. Total return is not computed on an annualized basis.
(4) Includes the Fund's share of the Portfolio's allocated expenses while the Fund was making investments directly into the Portfolio.
(5) Portfolio turnover represents the rate of portfolio activity for the period while the Fund was making investments directly into the Portfolio.
See notes to financial statements
14
Eaton Vance National Limited Maturity Municipals Fund as of March 31, 2005
FINANCIAL STATEMENTS CONT'D
Financial Highlights
| | | Class B | |
| | | Year Ended March 31, | |
| | | 2005(1) | | 2004(1) | | 2003(1) | | 2002(1)(2) | | 2001 | |
| Net asset value - Beginning of year | | $ | 10.410 | | | $ | 10.260 | | | $ | 9.860 | | | $ | 10.040 | | | $ | 9.790 | | |
| Income (loss) from operations | | | |
| Net investment income | | $ | 0.346 | | | $ | 0.360 | | | $ | 0.381 | | | $ | 0.409 | | | $ | 0.461 | | |
| Net realized and unrealized gain (loss) | | | (0.191 | ) | | | 0.142 | | | | 0.405 | | | | (0.155 | ) | | | 0.232 | | |
| Total income from operations | | $ | 0.155 | | | $ | 0.502 | | | $ | 0.786 | | | $ | 0.254 | | | $ | 0.693 | | |
| Less distributions | | | |
| From net investment income | | $ | (0.345 | ) | | $ | (0.352 | ) | | $ | (0.386 | ) | | $ | (0.434 | ) | | $ | (0.443 | ) | |
| Total distributions | | $ | (0.345 | ) | | $ | (0.352 | ) | | $ | (0.386 | ) | | $ | (0.434 | ) | | $ | (0.443 | ) | |
| Net asset value - End of year | | $ | 10.220 | | | $ | 10.410 | | | $ | 10.260 | | | $ | 9.860 | | | $ | 10.040 | | |
| Total Return(3) | | | 1.51 | % | | | 4.94 | % | | | 8.15 | % | | | 2.58 | % | | | 7.26 | % | |
| Ratios/Supplemental Data | | | |
| Net assets, end of year (000's omitted) | | $ | 27,157 | | | $ | 33,731 | | | $ | 32,517 | | | $ | 10,638 | | | $ | 7,840 | | |
| Ratios (As a percentage of average daily net assets): | | | | | | | | | | | | | | | | | | | | | |
| Expenses(4) | | | 1.55 | %† | | | 1.55 | % | | | 1.57 | % | | | 1.66 | % | | | 1.68 | % | |
| Expenses after custodian fee reduction(4) | | | 1.54 | %† | | | 1.55 | % | | | 1.56 | % | | | 1.63 | % | | | 1.67 | % | |
| Net investment income | | | 3.36 | %† | | | 3.48 | % | | | 3.75 | % | | | 4.09 | % | | | 4.61 | % | |
| Portfolio Turnover of the Portfolio(5) | | | 14 | % | | | 27 | % | | | 24 | % | | | 12 | % | | | 13 | % | |
| Portfolio Turnover of the Fund | | | 19 | % | | | - | | | | - | | | | - | | | | - | | |
† The operating expenses of the Fund reflect a reduction of the investment advisor fee. Had such actions not been taken, the ratios would have been the same.
(1) Net investment income per share was computed using the average shares outstanding.
(2) The Fund, through its investment in the Portfolio, has adopted the provisions of the revised AICPA Audit and Accounting Guide for Investment Companies and began using the interest method to amortize premiums on fixed-income securities. The effect of this change for the year ended March 31, 2002 was to increase net investment income per share by $0.002, and increase net realized and unrealized losses per share by $0.002, and increase the ratio of net investment income to average net assets from 4.07% to 4.09%. Per share data and ratios for the periods prior to April 1, 2001 have not been restated to reflect this change in presentation.
(3) Returns are historical and are calculated by determining the percentage change in net asset value with all distributions reinvested. Total return is not computed on an annualized basis.
(4) Includes the Fund's share of the Portfolio's allocated expenses while the Fund was making investments directly into the Portfolio.
(5) Portfolio turnover represents the rate of portfolio activity for the period while the Fund was making investments directly into the Portfolio.
See notes to financial statements
15
Eaton Vance National Limited Maturity Municipals Fund as of March 31, 2005
FINANCIAL STATEMENTS CONT'D
Financial Highlights
| | | Class C | |
| | | Year Ended March 31, | |
| | | 2005(1) | | 2004(1) | | 2003(1) | | 2002(1)(2) | | 2001 | |
| Net asset value - Beginning of year | | $ | 9.750 | | | $ | 9.610 | | | $ | 9.240 | | | $ | 9.400 | | | $ | 9.160 | | |
| Income (loss) from operations | | | |
| Net investment income | | $ | 0.324 | | | $ | 0.335 | | | $ | 0.357 | | | $ | 0.379 | | | $ | 0.423 | | |
| Net realized and unrealized gain (loss) | | | (0.171 | ) | | | 0.133 | | | | 0.379 | | | | (0.138 | ) | | | 0.225 | | |
| Total income from operations | | $ | 0.153 | | | $ | 0.468 | | | $ | 0.736 | | | $ | 0.241 | | | $ | 0.648 | | |
| Less distributions | | | |
| From net investment income | | $ | (0.323 | ) | | $ | (0.328 | ) | | $ | (0.366 | ) | | $ | (0.401 | ) | | $ | (0.408 | ) | |
| Total distributions | | $ | (0.323 | ) | | $ | (0.328 | ) | | $ | (0.366 | ) | | $ | (0.401 | ) | | $ | (0.408 | ) | |
| Net asset value - End of year | | $ | 9.580 | | | $ | 9.750 | | | $ | 9.610 | | | $ | 9.240 | | | $ | 9.400 | | |
| Total Return(3) | | | 1.51 | %(6) | | | 4.93 | % | | | 8.12 | % | | | 2.58 | % | | | 7.25 | % | |
| Ratios/Supplemental Data | | | |
| Net assets, end of year (000's omitted) | | $ | 77,325 | | | $ | 67,073 | | | $ | 46,629 | | | $ | 19,488 | | | $ | 7,517 | | |
| Ratios (As a percentage of average daily net assets): | | | | | | | | | | | | | | | | | | | | | |
| Expenses(4) | | | 1.55 | %† | | | 1.55 | % | | | 1.57 | % | | | 1.66 | % | | | 1.69 | % | |
| Expenses after custodian fee reduction(4) | | | 1.54 | %† | | | 1.55 | % | | | 1.56 | % | | | 1.63 | % | | | 1.68 | % | |
| Net investment income | | | 3.35 | %† | | | 3.45 | % | | | 3.75 | % | | | 4.05 | % | | | 4.61 | % | |
| Portfolio Turnover of the Portfolio(5) | | | 14 | % | | | 27 | % | | | 24 | % | | | 12 | % | | | 13 | % | |
| Portfolio Turnover of the Fund | | | 19 | % | | | - | | | | - | | | | - | | | | - | | |
† The operating expenses of the Fund reflect a reduction of the investment advisor fee. Had such actions not been taken, the ratios would have been the same.
(1) Net investment income per share was computed using the average shares outstanding.
(2) The Fund, through its investment in the Portfolio, has adopted the provisions of the revised AICPA Audit and Accounting Guide for Investment Companies and began using the interest method to amortize premiums on fixed-income securities. The effect of this change for the year ended March 31, 2002 was to increase net investment income per share by $0.002, and increase net realized and unrealized losses per share by $0.002, and increase the ratio of net investment income to average net assets from 4.03% to 4.05%. Per share data and ratios for the periods prior to April 1, 2001 have not been restated to reflect this change in presentation.
(3) Returns are historical and are calculated by determining the percentage change in net asset value with all distributions reinvested. Total return is not computed on an annualized basis.
(4) Includes the Fund's share of the Portfolio's allocated expenses while the Fund was making investments directly into the Portfolio.
(5) Portfolio turnover represents the rate of portfolio activity for the period while the Fund was making investments directly into the Portfolio.
(6) Total return reflects a decrease of 0.07% due to a change in the timing of the payment and reinvestment of distributions.
See notes to financial statements
16
Eaton Vance National Limited Maturity Municipals Fund as of March 31, 2005
NOTES TO FINANCIAL STATEMENTS
1 Significant Accounting Policies
Eaton Vance National Limited Maturity Municipals Fund (the Fund) is a diversified series of Eaton Vance Investment Trust (the Trust). The Trust is an entity of the type commonly known as a Massachusetts business trust and is registered under the Investment Company Act of 1940, as amended, as an open-end management investment company. The Fund seeks to achieve current income exempt from regular federal income tax and particular state or local income or other taxes by investing primarily in investment grade municipal obligations. The Fund offers three classes of shares: Class A, Class B and Class C shares. Class A shares are generally sold subject to a sales charge imposed at time of purchase. Class B and Class C shares are sold at net asset value and are subject to a contingent deferred sales charge (see Note 6). Class B shares held longer than (i) four yea rs or (ii) the time at which the contingent deferred sales charge applicable to such shares expires will automatically convert to Class A shares. In addition, Class B shares acquired through the reinvestment of distributions will also convert to Class A shares in proportion to shares not acquired through reinvestment. Each class represents a pro rata interest in the Fund, but votes separately on class-specific matters and (as noted below) is subject to different expenses. Realized and unrealized gains or losses are allocated daily to each class of shares based on the relative net assets of each class to the total net assets of the Fund. Net investment income, other than class specific expenses, is allocated daily to each class of shares based upon the ratio of the value of paid shares of each class to the total value of all paid shares. Each class of shares differs in its distribution plan and certain other class specific expenses.
On October 8, 2004, the Fund received its pro rata share of cash and securities from the National Limited Maturity Municipals Portfolio (the Portfolio) in a complete liquidation of its interests in the Portfolio. Subsequent to October 8, 2004, the Fund invests directly in securities rather than through the Portfolio and maintains the same investment objective.
The following is a summary of significant accounting policies consistently followed by the Fund in the preparation of its financial statements. The policies are in conformity with accounting principles generally accepted in the United States of America.
A Investment Valuation - Municipal bonds are normally valued on the basis of valuations furnished by a pricing service. Taxable obligations, if any, for which price quotations are readily available are normally valued at the
mean between the latest bid and asked prices. Futures contracts listed on the commodity exchanges are valued at closing settlement prices. Short-term obligations, maturing in sixty days or less, are valued at amortized cost, which approximates value. Investments for which valuations or market quotations are unavailable are valued at fair value using methods determined in good faith by or at the direction of the Trustees.
B Income - Interest income is determined on the basis of interest accrued, adjusted for amortization of premium or discount.
C Expenses - The majority of expenses of the Trust are directly identifiable to an individual fund. Expenses which are not readily identifiable to a specific fund are allocated taking into consideration, among other things, the nature and type of expense and the relative size of the funds.
D Federal Taxes - The Fund's policy is to comply with the provisions of the Internal Revenue Code applicable to regulated investment companies and to distribute to shareholders each year all of its taxable income, if any, and tax-exempt income, including any net realized gain on investments. Accordingly, no provision for federal income or excise tax is necessary. At March 31, 2005, the Fund, for federal income tax purposes, had a capital loss carryover of $4,687,486 which will reduce the taxable income arising from future net realized gain on investments, if any, to the extent permitted by the Internal Revenue Code and thus will reduce the amount of distributions t o shareholders which would otherwise be necessary to relieve the Fund of any liability for federal income tax. Such capital loss carryover will expire as follows on: March 31, 2006, $320,446, March 31, 2007, $60,400, March 31, 2009, $248,691, March 31, 2010, $146,034, March 31, 2011, $1,719,505, March 31, 2012, $779,785 and March 31, 2013, $1,412,625. Dividends paid by the Fund from net interest on tax-exempt municipal bonds are not includable by shareholders as gross income for federal income tax purposes because the Fund intends to meet certain requirements of the Internal Revenue Code applicable to regulated Investment companies which will enable the Fund to pay exempt-interest dividends. The portion of such interest, if any, earned on private activity bonds issued after August 7, 1986, may be considered a tax preference item to shareholders.
E Financial Futures Contracts - Upon the entering of a financial futures contract, the Fund is required to deposit (initial margin) either in cash or securities an amount equal to a certain percentage of the
17
Eaton Vance National Limited Maturity Municipals Fund as of March 31, 2005
NOTES TO FINANCIAL STATEMENTS CONT'D
purchase price indicated in the financial futures contract. Subsequent payments are made or received by the Fund (margin maintenance) each day, dependent on the daily fluctuations in the value of the underlying security, and are recorded for book purposes as unrealized gains or losses by the Fund. The Fund's investment in financial futures contracts is designed only to hedge against anticipated future changes in interest rates and investment purposes. Should interest rates move unexpectedly, the Fund may not achieve the anticipated benefits of the financial futures contracts and may realize a loss.
F Legal Fees - Legal fees and other related expenses incurred as part of negotiations of the terms and requirements of capital infusions, or that are expected to result in the restructuring of or a plan of reorganization for an investment are recorded as realized losses. Ongoing expenditures to protect or enhance an investment are treated as operating expenses.
G Options on Financial Futures Contracts - Upon the purchase of a put option on a financial futures contract by the Fund, the premium paid is recorded as an investment, the value of which is marked-to-market daily. When a purchased option expires, the Fund will realize a loss in the amount of the cost of the option. When the Fund enters into a closing sale transaction, the Fund will realize a gain or loss depending on whether the sales proceeds from the closing sale transaction are greater or less than the cost of the option. When the Fund exercises a put option, settlement is made in cash. The risk associated with purchasing put options is limited to the premium origin ally paid.
H When-issued and Delayed Transactions - The Fund may engage in when-issued and delayed delivery transactions. The Fund records when-issued securities on trade date and maintains security positions such that sufficient liquid assets will be available to make payments for the securities purchased. Securities purchased on a when-issued or delayed delivery basis are marked-to-market daily and begin earning interest on settlement date.
I Expense Reduction - Investors Bank & Trust Company (IBT) serves as custodian of the Fund. Pursuant to the custodian agreement, IBT receives a fee reduced by credits which are determined based on the average daily cash balance the Fund maintains with IBT. All credit balances used to reduce the Fund's custodian fees are reported as a reduction of total expenses on the Statement of Operations.
J Use of Estimates - The preparation of the financial statements in conformity with accounting principles generally accepted in the United States of America requires management to make estimates and assumptions that affect the reported amounts of assets and liabilities at the date of the financial statements and the reported amounts of income and expense during the reporting period. Actual results could differ from those estimates.
K Indemnifications - Under the Trust's organizational documents, its officers and Trustees may be indemnified against certain liabilities and expenses arising out of the performance of their duties to the Fund and shareholders are indemnified against personal liability for obligations of the Trust. Additionally, in the normal course of business, the Fund enters into agreements with service providers that may contain indemnification clauses. The Fund's maximum exposure under these arrangements is unknown as this would involve future claims that may be made against the Fund that have not yet occurred.
L Other - Investment transactions are accounted for on a trade-date basis. Realized gains and losses are computed on the specific identification of securities sold.
2 Distributions to Shareholders
The net income of the Fund is determined daily and substantially all of the net income so determined is declared as a dividend to shareholders of record at the time of declaration. Dividends are declared separately for each class of shares. Distributions are paid monthly. Distributions of allocated realized capital gains, if any, are made at least annually. Shareholders may reinvest income and capital gain distributions in additional shares of the same class of the Fund at the net asset value as of the reinvestment date. Distributions are paid in the form of additional shares of the same class or, at the election of the shareholder, in cash. The Fund distinguishes between distributions on a tax basis and a financial reporting basis. Accounting principles generally accepted in the United States of America require that only distributions in excess of tax basis earnings and profits be reported in t he financial statements as a return of capital. Permanent differences between book and tax accounting relating to distributions are reclassified to paid-in capital. The tax treatment of distributions for the calendar year will be reported to shareholders prior to February 1, 2006 and will be based on tax accounting methods which may differ from amounts determined for financial statement purposes.
18
Eaton Vance National Limited Maturity Municipals Fund as of March 31, 2005
NOTES TO FINANCIAL STATEMENTS CONT'D
The tax character of distributions paid for the years ended March 31, 2005 and March 31, 2004 was as follows:
| | | Year Ended March 31, | |
| | | 2005 | | 2004 | |
| Distributions declared from: | | | | | | | | | |
| Tax-exempt income | | $ | 8,956,195 | | | $ | 8,248,169 | | |
| Ordinary income | | $ | 17,395 | | | $ | 3 | | |
During the year ended March 31, 2005, accumulated paid-in capital was decreased by $1,120,027, distributions in excess of net investment income was increased by $89,712, and accumulated net realized loss was decreased by $1,209,739 primarily due to differences between book and tax policies and capital loss carryovers. This change had no effect on the net assets or the net asset value per share.
As of March 31, 2005, the components of distributable earnings (accumulated losses) on a tax basis were as follows:
| Undistributed income | | $ | 221,104 | | |
| Capital loss carryforwards | | $ | (4,687,486 | ) | |
| Unrealized appreciation | | $ | 7,468,762 | | |
| Other temporary differences | | $ | (760,690 | ) | |
3 Shares of Beneficial Interest
The Fund's Declaration of Trust permits the Trustees to issue an unlimited number of full and fractional shares of beneficial interest (without par value). Such shares may be issued in a number of different series (such as the Fund) and classes. Transactions in Fund shares were as follows:
| | | Year Ended March 31, | |
| Class A | | 2005 | | 2004 | |
| Sales | | | 6,206,100 | | | | 4,677,338 | | |
Issued to shareholders electing to
receive payments of distributions
in Fund shares | | | 304,029 | | | | 243,429 | | |
| Redemptions | | | (4,862,281 | ) | | | (4,429,599 | ) | |
| Exchange from Class B shares | | | 706,919 | | | | 377,655 | | |
| Net increase | | | 2,354,767 | | | | 868,823 | | |
| | | Year Ended March 31, | |
| Class B | | 2005 | | 2004 | |
| Sales | | | 704,599 | | | | 1,745,301 | | |
Issued to shareholders electing to
receive payments of distributions
in Fund shares | | | 54,163 | | | | 54,235 | | |
| Redemptions | | | (635,881 | ) | | | (1,352,076 | ) | |
| Exchange to Class A shares | | | (706,414 | ) | | | (377,421 | ) | |
| Net increase (decrease) | | | (583,533 | ) | | | 70,039 | | |
| | | Year Ended March 31, | |
| Class C | | 2005 | | 2004 | |
| Sales | | | 2,689,404 | | | | 3,888,131 | | |
Issued to shareholders electing to
receive payments of distributions
in Fund shares | | | 111,362 | | | | 95,792 | | |
| Redemptions | | | (1,603,822 | ) | | | (1,958,861 | ) | |
| Net increase | | | 1,196,944 | | | | 2,025,062 | | |
4 Investment Adviser Fee and Other Transactions with Affiliates
The investment adviser fee is earned by Boston Management and Research (BMR), a wholly-owned subsidiary of Eaton Vance Management (EVM), as compensation for management and investment advisory services rendered to the Fund. The fee is based upon a percentage of average daily net assets plus a percentage of gross income (i.e., income other than gains from the sale of securities). For the period from April 1, 2004 to October 8, 2004 the advisory fee allocated from the Portfolio amounted to $544,022, representing 0.45% of the Portfolio's average daily net assets. For the period from October 9, 2004 to March 31, 2005, the Fund's advisory fee amounted to $518,620, representing 0.44% of the Fund's average daily net assets. BMR has also agreed to reduce the investment adviser fee by an amount equal to that portion of commissions paid to broker dealers in execution of portfolio transa ctions attributed to the Fund that is consideration for third-party research services. For the year ended March 31, 2005, EVM waived $600 of its advisory fee for the Fund.
19
Eaton Vance National Limited Maturity Municipals Fund as of March 31, 2005
NOTES TO FINANCIAL STATEMENTS CONT'D
EVM serves as the sub-transfer agent of the Fund and receives from the transfer agent an aggregate fee based upon the actual expenses incurred by EVM in the performance of those activities. For the year ended March 31, 2005, EVM earned $9,007 in sub-transfer agent fees.
The Fund was informed that Eaton Vance Distributors, Inc. (EVD), a subsidiary of EVM and the Fund's principal underwriter, received approximately $15,000 as its portion of the sales charge on sales of Class A shares for the year ended March 31, 2005.
Except as to Trustees of the Fund who are not members of EVM's or BMR's organization, officers and Trustees receive remuneration for their services to the Fund out of such investment adviser fee. Trustees of the Fund that are not affiliated with the Investment Adviser may elect to defer receipt of all or a percentage of their annual fees in accordance with the terms of the Trustees Deferred Compensation Plan. For the year ended March 31, 2005, no significant amounts have been deferred.
Certain officers and Trustees of the Fund are officers of the above organizations.
During the year ended March 31, 2005, the Fund engaged in sale transactions with other Funds that also utilize BMR as an investment advisor. The sales transactions complied with Rule 17a-7 under the Investment Company Act of 1940 and amounted to $1,133,230.
5 Distribution and Service Plans
The Fund has in effect a distribution plan for Class B shares (Class B Plan) and for Class C shares (Class C Plan) pursuant to Rule 12b-1 under the Investment Company Act of 1940 and a service plan for Class A shares (Class A Plan), (collectively, the Plans). The Class B and Class C Plans require the Fund to pay EVD amounts equal to 1/365 of 0.75% of the Fund's daily net assets attributable to Class B and Class C shares for providing ongoing distribution services and facilities to the Fund. The Fund will automatically discontinue payments to EVD during any period in which there are no outstanding Uncovered Distribution Charges, which are equivalent to the sum of (i) 3% of the aggregate amount received by the Fund for Class B shares sold and 6.25% of Class C sales of the amount received by the Fund for each share sold and, (ii) interest calculated by applying the rate of 1% over the prevailing prime rate to the outstanding balance of Uncovered Distribution Charges of EVD of each respective class, reduced by the aggregate amount of contingent deferred sales charges (see Note 6) and amounts theretofore paid to or payable to EVD. The amount payable to EVD with respect to each day is accrued on such day as a liability of the Fund and, accordingly, reduces the Fund's net assets. For the year ended March 31, 2005, the Fund paid or accrued $235,534 and $556,434 for Class B and Class C shares, respectively, to EVD, representing 0.75% of the average daily net assets for Class B and Class C shares. At March 31, 2005, the amount of Uncovered Distribution Charges of EVD calculated under the Plan was approximately $1,410,000 and $10,875,000 for Class B and Class C shares, respectively.
The Plans authorize each class to make payments of service fees to EVD, investment dealers and other persons in amounts not exceeding 0.25% of the Fund's average daily net assets for each fiscal year. The Trustees approved quarterly service fee payments equal to 0.15% per annum of the Fund's average daily net assets attributable to Class A, Class B, and Class C shares for each fiscal year. Service fee payments will be made for personal services and/or the maintenance of shareholder accounts. Service fees are separate and distinct from the sales commissions and distribution fees payable by the Fund to EVD, and, as such are not subject to automatic discontinuance when there are no outstanding Uncovered Distribution Charges of EVD. Service fee payments for the year ended March 31, 2005 amounted to $199,038, $47,107, and $111,287 for Class A, Class B, and Class C s hares, respectively.
Certain officers and Trustees of the Fund are officers or directors of EVD.
6 Contingent Deferred Sales Charge
A contingent deferred sales charge (CDSC) generally is imposed on redemptions of Class A shares made within 18 months of purchase, Class B shares made within four years of purchase and on redemptions of Class C shares made within one year of purchase. Class A shares purchased at net asset value in amounts of $1 million or more (other than shares purchased in a single transaction of $5 million or more) are subject to a 1.00% CDSC if redeemed within 18 months of purchase. Generally, the CDSC is based upon the lower of the net asset value at date of redemption or date of purchase. No charge is levied on Class B and Class C shares acquired by reinvestment of dividends or capital gains distributions. The CDSC for Class B shares is imposed at declining rates that begin at 3% in the case of redemptions in the first year of purchase. Class C shares are s ubject to a 1% CDSC if redeemed within one year of purchase. No CDSC is levied on shares which have been sold to EVM or its affiliates or to their respective employees or clients and may be waived under certain other limited conditions. CDSC
20
Eaton Vance National Limited Maturity Municipals Fund as of March 31, 2005
NOTES TO FINANCIAL STATEMENTS CONT'D
charges are paid to EVD to reduce the amount of Uncovered Distribution Charges calculated under the Fund's Distribution Plan (see Note 5). CDSC charges received when no Uncovered Distribution Charges exist will be credited to the Fund. EVD received approximately $21,000, $67,000 and $12,000 of CDSC paid by shareholders for Class A shares, Class B shares and Class C shares, respectively, for the year ended March 31, 2005.
7 Investment Transactions
Purchases and sales of investments by the Portfolio, other than U.S. Government securities and short-term obligations, aggregated $43,428,570, and $31,574,967 respectively for the period from April 1, 2004 to October 8, 2004. Purchases and sales of investments by the Fund, other than short-term obligations, aggregated $63,506,241 and $45,585,695, respectively, for the period from October 9, 2004 to March 31, 2005.
8 Federal Income Tax Basis of Investments
The cost and unrealized appreciation (depreciation) in value of the investments owned at March 31, 2005, as computed on a federal income tax basis, were as follows:
| Aggregate cost | | $ | 244,633,453 | | |
| Gross unrealized appreciation | | $ | 8,278,154 | | |
| Gross unrealized depreciation | | | (1,142,603 | ) | |
| Net unrealized appreciation | | $ | 7,135,551 | | |
9 Line of Credit
The Fund participates with other portfolios and funds managed by BMR and EVM and their affiliates in a $150 million unsecured line of credit agreement with a group of banks. The Funds may temporarily borrow from the line of credit to satisfy redemption requests or settle investment transactions. Interest is charged to each participating portfolio or fund based on its borrowings at an amount above either the Eurodollar rate or federal funds rate. In addition, a fee computed at an annual rate of 0.10% on the daily unused portion of the line of credit is allocated among the participating portfolios and funds at the end of each quarter. The Fund did not have any significant borrowings or allocated fees during the year ended March 31, 2005.
10 Financial Instruments
The Fund regularly trades in financial instruments with off-balance sheet risk in the normal course of its investing activities to assist in managing exposure to various market risks. These financial instruments include written options and futures contracts and may involve, to a varying degree, elements of risk in excess of the amounts recognized for financial statement purposes. The notional or contractual amounts of these instruments represent the investment the fund has in particular classes of financial instruments and do not necessarily represent the amounts potentially subject to risk. The measurement of the risks associated with these instruments is meaningful only when all related and offsetting transactions are considered.
A summary of obligations under these financial instruments as of March 31, 2005, is as follows:
| Futures Contracts | | | | | | | | | | | | | |
Expiration
Date(s) | | Contracts | | Position | | Aggregate
Cost | | Value | | Net Unrealized
Appreciation | |
| 06/05 | | 249 U.S. Treasury Bond | | Short | | $ | (27,953,968 | ) | | $ | (27,732,375 | ) | | $ | 221,593 | | |
| 06/05 | | 101 U.S. Treasury Note | | Short | | | (11,147,447 | ) | | | (11,035,829 | ) | | | 111,618 | | |
| | | | | | | | | | | $ | 333,211 | | |
At March 31, 2005, the Fund had sufficient cash and/or securities to cover margin requirements on open future contracts.
21
Eaton Vance National Limited Maturity Municipals Fund as of March 31, 2005
REPORT OF INDEPENDENT REGISTERED PUBLIC ACCOUNTING FIRM
To the Trustees of Eaton Vance Investment Trust and Shareholders of Eaton Vance National Limited Maturity Municipals Fund:
We have audited the accompanying statement of assets and liabilities, including the portfolio of investments, of Eaton Vance National Limited Maturity Municipals Fund (one of the series constituting the Eaton Vance Investment Trust) (the "Fund") as of March 31, 2005, the related statement of operations for the year then ended, the statements of changes in net assets for each of the two years in the period then ended, and the financial highlights for each of the five years in the period then ended. These financial statements and financial highlights are the responsibility of the Fund's management. Our responsibility is to express an opinion on these financial statements and financial highlights based on our audits.
We conducted our audits in accordance with the standards of the Public Company Accounting Oversight Board (United States). Those standards require that we plan and perform the audit to obtain reasonable assurance about whether the financial statements and financial highlights are free of material misstatement. The Fund is not required to have, nor were we engaged to perform, an audit of its internal control over financial reporting. Our audits included consideration of internal control over financial reporting as a basis for designing audit procedures that are appropriate in the circumstances, but not for the purpose of expressing an opinion on the effectiveness of the Fund's internal control over financial reporting. Accordingly, we express no such opinion. An audit also includes examining, on a test basis, evidence supporting the amounts and disclosures in the financial statements, assessing t he accounting principles used and significant estimates made by management, as well as evaluating the overall financial statement presentation. Our procedures included confirmation of securities owned as of March 31, 2005, by correspondence with the custodian and brokers; where replies were not received from brokers, we performed other auditing procedures. We believe that our audits provide a reasonable basis for our opinion.
In our opinion, the financial statements and financial highlights referred to above present fairly, in all material respects, the financial position of Eaton Vance National Limited Maturity Municipals Fund as of March 31, 2005, the results of its operations for the year then ended, the changes in its net assets for each of the two years in the period then ended and its financial highlights for each of the five years in the period then ended, in conformity with accounting principles generally accepted in the United States of America.
DELOITTE & TOUCHE LLP
Boston, Massachusetts
May 13, 2005
22
Eaton Vance National Limited Maturity Municipals Fund as of March 31, 2005
FEDERAL TAX INFORMATION (Unaudited)
The Form 1099-DIV you will receive in January 2006 will show the tax status of all distributions paid to your account in calendar 2005. Shareholders are advised to consult their own tax adviser with respect to the tax consequences of their investment in the Fund. As required by the Internal Revenue Code regulations, shareholders must be notified within 60 days of the Fund's fiscal year end regarding exempt-interest dividends.
Exempt-Interest Dividends - 99.81%
23
Eaton Vance National Limited Maturity Municipals Fund
BOARD OF TRUSTEES' ANNUAL APPROVAL OF THE INVESTMENT ADVISORY AGREEMENT
The investment advisory agreement between Eaton Vance National Limited Maturity Municipals Fund (the "Fund") and the investment adviser, Boston Management and Research, provides that the advisory agreement will continue in effect from year to year so long as its continuance is approved at least annually (i) by a vote of a majority of the noninterested Trustees of the Fund cast in person at a meeting called for the purpose of voting on such approval and (ii) by the Trustees of the Fund or by vote of a majority of the outstanding interests of the Fund.
In considering the annual approval of the investment advisory agreement between the Fund and the investment adviser, the Special Committee of the Board of Trustees considered information that had been provided throughout the year at regular Board meetings, as well as information furnished to the Special Committee for a series of meetings held in February and March in preparation for a Board meeting held on March 21, 2005 to specifically consider the renewal of the investment advisory agreement. Such information included, among other things, the following:
•An independent report comparing the advisory fees of the Fund with those of comparable funds;
•An independent report comparing the expense ratio of the Fund to those of comparable funds;
•Information regarding Fund investment performance in comparison to a relevant peer group of funds and appropriate indices;
•The economic outlook and the general investment outlook in relevant investment markets;
•Eaton Vance Management's ("Eaton Vance") results and financial condition and the overall organization of the investment adviser;
•The procedures and processes used to determine the fair value of Fund assets and actions taken to monitor and test the effectiveness of such procedures and processes;
•Eaton Vance's management of the relationship with the custodian, subcustodians and fund accountants;
•The resources devoted to compliance efforts undertaken by Eaton Vance on behalf of the funds it manages and the record of compliance with the investment policies and restrictions and with policies on personal securities transactions;
•The quality, nature, cost and character of the administrative and other non-investment management services provided by Eaton Vance and its affiliates; and
•The terms of the advisory agreement and the reasonableness and appropriateness of the particular fee paid by the Fund for the services described herein.
The Special Committee also considered the investment adviser's municipal bond portfolio management capabilities, including information relating to the education, experience and number of investment professionals and other personnel who provide services under the investment advisory agreement. Specifically, the Special Committee considered the investment adviser's 30-person municipal bond team, which includes six portfolio managers and nine credit specialists who provide services to the Fund. The Special Committee noted that the investment adviser's municipal bond team affords the investment adviser extensive in-house research capabilities in addition to the other resources available to the investment adviser. The Special Committee also took into account the time and attention to be devoted by senior management to the Fund and the other funds in the complex. The Special Committee evaluated the l evel of skill required to manage the Fund and concluded that the human resources available at the investment adviser were appropriate to fulfill effectively its duties on behalf of the Fund.
24
Eaton Vance National Limited Maturity Municipals Fund
BOARD OF TRUSTEES' ANNUAL APPROVAL OF THE INVESTMENT ADVISORY AGREEMENT CONT'D
In its review of comparative information with respect to Fund investment performance, the Special Committee concluded that the Fund has performed within a range that the Special Committee deemed competitive. With respect to its review of investment advisory fees, the Special Committee concluded that the fees paid by the Fund are within the range of those paid by comparable funds within the mutual fund industry. In reviewing the information regarding the expense ratio of the Fund, the Special Committee concluded that the Fund's expense ratio is within a range that is competitive with comparable funds.
In addition to the factors mentioned above, the Special Committee reviewed the level of the investment adviser's profits in providing investment management services for the Fund and for all Eaton Vance Funds as a group. The Special Committee also considered the other benefits realized by Eaton Vance and its affiliates in connection with the operation of the Fund. In addition, the Special Committee considered the fiduciary duty assumed by the investment adviser in connection with the services rendered to the Fund and the business reputation of the investment adviser and its financial resources. The Trustees concluded that in light of the services rendered, the profits realized by the investment adviser are not unreasonable. The Special Committee also considered the extent to which the investment adviser appears to be realizing benefits from economies of scale in managing the Fund, and concluded that the fee breakpoints which are in place will allow for an equitable sharing of such benefits, when realized, with the shareholders of the Fund.
The Special Committee did not consider any single factor as controlling in determining whether or not to renew the investment advisory agreement. Nor are the items described herein all the matters considered by the Special Committee. In assessing the information provided by Eaton Vance and its affiliates, the Special Committee also took into consideration the benefits to shareholders of investing in a fund that is a part of a large family of funds which provides a large variety of shareholder services.
Based on its consideration of the foregoing and conclusions, and such other factors and conclusions as it deemed relevant, and assisted by independent counsel, the Special Committee concluded that the renewal of the investment advisory agreement, including the fee structure (described herein), is in the interests of shareholders.
25
Eaton Vance National Limited Maturity Municipals Fund
MANAGEMENT AND ORGANIZATION
Fund Management. The Trustees of Eaton Vance Investment Trust, (the Trust) are responsible for the overall management and supervision of the Trust's affairs. The Trustees and officers of the Trust are listed below. Except as indicated, each individual has held the office shown or other offices in the same company for the last five years. Trustees and officers of the Trust hold indefinite terms of office. The "noninterested Trustees" consist of those Trustees who are not "interested persons" of the Trust, as that term is defined under the 1940 Act. The business address of each Trustee and officer is The Eaton Vance Building, 255 State Street, Boston, Massachusetts 02109. As used below, "EVC" refers to Eaton Vance Corp., "EV" refers to Eaton Vance, Inc., "EVM" refers to Eaton Vance Management , "BMR" refers to Boston Management and Research, and "EVD" refers to Eaton Vance Distributors, Inc. EVC and EV are the corporate parent and trustee, respectively, of EVM and BMR. EVD is the Fund's principal underwriter and a wholly-owned subsidiary of EVM.
Name and
Date of Birth | | Position(s)
with the
Trust | | Term of
Office and
Length of
Service | |
Principal Occupation(s)
During Past Five Years | | Number of Portfolios
in Fund Complex
Overseen By
Trustee(1) | | Other Directorships Held | |
| Interested Trustee | | | | | | | | | | | | | |
|
| James B. Hawkes 11/9/41 | | Trustee and Vice President | | Trustee and Vice President of the Trust since 1985 | | Chairman, President and Chief Executive Officer of BMR, EVC, EVM and EV; Director of EV; Vice President and Director of EVD. Trustee and/or officer of 197 registered investment companies in the Eaton Vance Fund Complex. Mr. Hawkes is an interested person because of his positions with BMR, EVM, EVC and EV, which are affiliates of the Trust. | | | 197 | | | Director of EVC | |
|
| Noninterested Trustee(s) | | | | | | | | | | | | | |
|
| Benjamin C. Esty 1/2/63 | | Trustee | | Since 2005 | | Professor, Harvard University Graduate School of Business Administration (since 2003). Formerly, Associate Professor, Harvard University Graduate School of Business Administration (2000-2003). | | | 135 | | | None | |
|
| Samuel L. Hayes, III 2/23/35 | | Chairman of the Board and Trustee | | Trustee of the Trust since 1986 and Chairman of the Board since 2005 | | Jacob H. Schiff Professor of Investment Banking Emeritus, Harvard University Graduate School of Business Administration. | | | 197 | | | Director of Tiffany & Co. (specialty retailer) and Telect, Inc. (telecommunication services company) | |
|
| William H. Park 9/19/47 | | Trustee | | Since 2003 | | President and Chief Executive Officer, Prizm Capital Management, LLC (investment management firm) (since 2002). Executive Vice President and Chief Financial Officer, United Asset Management Corporation (a holding company owning institutional investment management firms) (1982-2001). | | | 197 | | | None | |
|
| Ronald A. Pearlman 7/10/40 | | Trustee | | Since 2003 | | Professor of Law, Georgetown University Law Center (since 1999). Tax Partner, Covington & Burling, Washington , DC (1991-2000). | | | 197 | | | None | |
|
| Norton H. Reamer 9/21/35 | | Trustee | | Since 1985 | | President, Chief Executive Officer and a Director of Asset Management Finance Corp. (a specialty finance company serving the investment management industry) (since October 2003). President, Unicorn Corporation (an investment and financial advisory services company) (since September 2000). Formerly, Chairman and Chief Operating Officer, Hellman, Jordan Management Co., Inc. (an investment management company) (2000-2003). Formerly, Advisory Director of Berkshire Capital Corporation (investment banking firm) (2002-2003). Formerly, Chairman of the Board, United Asset Management Corporation (a holding company owning institutional investment management firms) and Chairman, President and Director, UAM Funds (mutual funds) (1980-2000). | | | 197 | | | None | |
|
26
Eaton Vance National Limited Maturity Municipals Fund
MANAGEMENT AND ORGANIZATION CONT'D
Name and
Date of Birth | | Position(s)
with the
Trust | | Term of
Office and
Length of
Service | |
Principal Occupation(s)
During Past Five Years | | Number of Portfolios
in Fund Complex
Overseen By
Trustee(1) | | Other Directorships Held | |
| Noninterested Trustee(s) (continued) | | | | | | | | | | | |
|
| Lynn A. Stout 9/14/57 | | Trustee | | Since 1998 | | Professor of Law, University of California at Los Angeles School of Law (since July 2001). Formerly, Professor of Law, Georgetown University Law Center. | | | 197 | | | None | |
|
| Ralph F. Verni 1/26/43 | | Trustee | | Since 2005 | | Consultant and private investor (since 2000). Formerly, President and Chief Executive Officer, Redwood Investment Systems, Inc. (software developer) (2000). Formerly, President and Chief Executive Officer, State Street Research & Management (investment advisor), SSRM Holdings (parent of State Street Research & Management), and SSR Realty (institutional realty manager) (1992-2000). | | | 135 | | | Director of W.P. Carey & Company LLC (manager of real estate investment trusts) | |
|
| Principal Officers who are not Trustees | | | | | | | |
|
Name and
Date of Birth | | Position(s)
with the
Trust | | Term of
Office and
Length of
Service | | Principal Occupation(s)
During Past Five Years | |
| Thomas J. Fetter 8/20/43 | | President | | Since 1990 | | Vice President of EVM and BMR. Officer of 124 registered investment companies managed by EVM or BMR. | |
|
| William H. Ahern, Jr. 7/28/59 | | Vice President and Portfolio Manager | | Since 2004 | | Vice President of EVM and BMR. Officer of 78 registered investment companies managed by EVM or BMR. | |
|
| Craig R. Brandon 12/21/66 | | Vice President | | Since 2004 | | Vice President of EVM and BMR. Officer of 44 registered investment companies managed by EVM or BMR. | |
|
| Cynthia J. Clemson 3/2/63 | | Vice President | | Since 2004 | | Vice President of EVM and BMR. Officer of 107 registered investment companies managed by EVM or BMR. | |
|
| Robert B. MacIntosh 1/22/57 | | Vice President | | Since 1993 | | Vice President of EVM and BMR. Officer of 124 registered investment companies managed by EVM or BMR. | |
|
| Thomas M. Metzold 8/3/58 | | Vice President | | Since 2004 | | Vice President of EVM and BMR. Officer of 49 registered investment companies managed by EVM or BMR. | |
|
| Alan R. Dynner 10/10/40 | | Secretary | | Since 1997 | | Vice President, Secretary and Chief Legal Officer of BMR, EVM, EVD, EV and EVC. Officer of 197 registered investment companies managed by EVM or BMR. | |
|
| James L. O'Connor 4/1/45 | | Treasurer | | Since 1988 | | Vice President of BMR, EVM and EVD. Officer of 121 registered investment companies managed by EVM or BMR. | |
|
| Paul M. O'Neil 7/11/53 | | Chief Compliance Officer | | Since 2004 | | Vice President of EVM and BMR. Officer of 197 registered investment companies managed by EVM or BMR. | |
|
(1) Includes both master and feeder funds in a master-feeder structure.
The SAI for the Fund includes additional information about the Trustees and officers of the Fund and can be obtained, without charge, by calling 1-800-225-6265.
27
This Page Intentionally Left Blank
This Page Intentionally Left Blank
Investment Adviser of Eaton Vance National Limited Maturity Municipals Fund
Boston Management and Research
The Eaton Vance Building
255 State Street
Boston, MA 02109
Administrator of Eaton Vance National Limited Maturity Municipals Fund
Eaton Vance Management
The Eaton Vance Building
255 State Street
Boston, MA 02109
Principal Underwriter
Eaton Vance Distributors, Inc.
The Eaton Vance Building
255 State Street
Boston, MA 02109
(617) 482-8260
Custodian
Investors Bank & Trust Company
200 Clarendon Street
Boston, MA 02116
Transfer Agent
PFPC Inc.
Attn: Eaton Vance Funds
P.O. Box 9653
Providence, RI 02940-9653
(800) 262-1122
Independent Registered Public Accounting Firm
Deloitte & Touche LLP
200 Berkeley Street
Boston, MA 02116-5022
Eaton Vance National Limited Maturity Municipals Fund
The Eaton Vance Building
255 State Street
Boston, MA 02109
This report must be preceded or accompanied by a current prospectus. Before investing, investors should consider carefully the Fund’s investment objective(s), risks, and charges and expenses. The Fund’s current prospectus contains this and other information about the Fund and is available through your financial advisor. Please read the prospectus carefully before you invest or send money. For further information please call 1-800-225-6265.
Item 2. Code of Ethics
The registrant has adopted a code of ethics applicable to its Principal Executive Officer, Principal Financial Officer and Principal Accounting Officer. The registrant undertakes to provide a copy of such code of ethics to any person upon request, without charge, by calling 1-800-262-1122.
Item 3. Audit Committee Financial Expert
The registrant’s Board has designated William H. Park, Samuel L. Hayes, III and Norton H. Reamer, each an independent trustee, as its audit committee financial experts. Mr. Park is a certified public accountant who is the President and Chief Executive Officer of Prizm Capital Management, LLC (investment management firm). Previously, he served as Executive Vice President and Chief Financial Officer of United Asset Management Corporation (“UAM”) (a holding company owning institutional investment management firms). Mr. Hayes is the Jacob H. Schiff Professor of Investment Banking Emeritus of the Harvard University Graduate School of Business Administration. Mr. Reamer is the President, Chief Executive Officer and a Director of Asset Management Finance Corp. (a specialty finance company serving the investment management industry) and is President of Unicorn Corporation (an investment and financial advisory services company). Formerly, Mr. Reamer was Chairman of Hellman, Jordan Management Co., Inc. (an investment management company) and Advisory Director of Berkshire Capital Corporation (an investment banking firm), Chairman of the Board of UAM and Chairman, President and Director of the UAM Funds (mutual funds).
Item 4. Principal Accountant Fees and Services
(a)-(d)
Each of California Limited Maturity Municipals Fund, Florida Limited Maturity Municipals Fund, Massachusetts Limited Maturity Municipals Fund, National Limited Maturity Municipals Fund, New Jersey Limited Maturity Municipals Fund, New York Limited Maturity Municipals Fund, Ohio Limited Maturity Municipals Fund and Pennsylvania Limited Maturity Municipals Fund (the “Fund(s)” or the “Series”) is a series of Eaton Vance Investment Trust (the “Trust”), a Massachusetts business trust. The Trust is registered under the Investment Company Act of 1940 as an open-end management investment company. This Form N-CSR relates to the Funds’ annual reports.
The following tables represent the aggregate fees billed to each Fund for the Fund’s respective fiscal years ended March 31, 2004 and March 31, 2005 by the Fund’s principal accountant for professional services rendered for the audit of the Fund’s annual financial statements and fees billed for other services rendered by the principal accountant during those periods.
Eaton Vance California Limited Maturity Municipals Fund
Fiscal Years Ended | | 03/31/04 | | 03/31/05 | |
| | | | | |
Audit Fees | | $ | 25,600 | | $ | 21,166 | |
| | | | | |
Audit-Related Fees(1) | | $ | 0 | | $ | 0 | |
| | | | | |
Tax Fees(2) | | $ | 9,200 | | $ | 9,400 | |
| | | | | |
All Other Fees(3) | | $ | 0 | | $ | 0 | |
| | | | | |
Total | | $ | 34,800 | | $ | 30,566 | |
Eaton Vance Florida Limited Maturity Municipals Fund
Fiscal Years Ended | | 03/31/04 | | 03/31/05 | |
| | | | | |
Audit Fees | | $ | 28,700 | | $ | 23,662 | |
| | | | | |
Audit-Related Fees(1) | | $ | 0 | | $ | 0 | |
| | | | | |
Tax Fees(2) | | $ | 9,200 | | $ | 9,400 | |
| | | | | |
All Other Fees(3) | | $ | 0 | | $ | 0 | |
| | | | | |
Total | | $ | 37,900 | | $ | 33,062 | |
Eaton Vance Massachusetts Limited Maturity Municipals Fund
Fiscal Years Ended | | 03/31/04 | | 03/31/05 | |
| | | | | |
Audit Fees | | $ | 28,700 | | $ | 25,300 | |
| | | | | |
Audit-Related Fees(1) | | $ | 0 | | $ | 0 | |
| | | | | |
Tax Fees(2) | | $ | 9,200 | | $ | 9,400 | |
| | | | | |
All Other Fees(3) | | $ | 0 | | $ | 0 | |
| | | | | |
Total | | $ | 37,900 | | $ | 34,700 | |
Eaton Vance National Limited Maturity Municipals Fund
Fiscal Years Ended | | 03/31/04 | | 03/31/05 | |
| | | | | |
Audit Fees | | $ | 40,900 | | $ | 40,510 | |
| | | | | |
Audit-Related Fees(1) | | $ | 0 | | $ | 0 | |
| | | | | |
Tax Fees(2) | | $ | 9,200 | | $ | 9,400 | |
| | | | | |
All Other Fees(3) | | $ | 0 | | $ | 0 | |
| | | | | |
Total | | $ | 50,100 | | $ | 49,910 | |
Eaton Vance New Jersey Limited Maturity Municipals Fund
Fiscal Years Ended | | 03/31/04 | | 03/31/05 | |
| | | | | |
Audit Fees | | $ | 25,600 | | $ | 23,662 | |
| | | | | |
Audit-Related Fees(1) | | $ | 0 | | $ | 0 | |
| | | | | |
Tax Fees(2) | | $ | 9,200 | | $ | 9,400 | |
| | | | | |
All Other Fees(3) | | $ | 0 | | $ | 0 | |
| | | | | |
Total | | $ | 34,800 | | $ | 33,062 | |
Eaton Vance New York Limited Maturity Municipals Fund
Fiscal Years Ended | | 03/31/04 | | 03/31/05 | |
| | | | | |
Audit Fees | | $ | 34,000 | | $ | 27,952 | |
| | | | | |
Audit-Related Fees(1) | | $ | 0 | | $ | 0 | |
| | | | | |
Tax Fees(2) | | $ | 9,200 | | $ | 9,400 | |
| | | | | |
All Other Fees(3) | | $ | 0 | | $ | 0 | |
| | | | | |
Total | | $ | 43,200 | | $ | 37,352 | |
Eaton Vance Ohio Limited Maturity Municipals Fund
Fiscal Years Ended | | 03/31/04 | | 03/31/05 | |
| | | | | |
Audit Fees | | $ | 22,300 | | $ | 18,592 | |
| | | | | |
Audit-Related Fees(1) | | $ | 0 | | $ | 0 | |
| | | | | |
Tax Fees(2) | | $ | 9,200 | | $ | 9,400 | |
| | | | | |
All Other Fees(3) | | $ | 0 | | $ | 0 | |
| | | | | |
Total | | $ | 31,500 | | $ | 27,992 | |
Eaton Vance Pennsylvania Limited Maturity Municipals Fund
Fiscal Years Ended | | 03/31/04 | | 03/31/05 | |
| | | | | |
Audit Fees | | $ | 28,700 | | $ | 23,662 | |
| | | | | |
Audit-Related Fees(1) | | $ | 0 | | $ | 0 | |
| | | | | |
Tax Fees(2) | | $ | 9,200 | | $ | 9,400 | |
| | | | | |
All Other Fees(3) | | $ | 0 | | $ | 0 | |
| | | | | |
Total | | $ | 37,900 | | $ | 33,062 | |
(1) Audit-related fees consist of the aggregate fees billed for assurance and related services that are reasonably related to the performance of the audit of the registrant’s financial statements and are not reported under the category of audit fees.
(2) Tax fees consist of the aggregate fees billed for professional services rendered by the principal accountant relating to tax compliance, tax advice, and tax planning and specifically include fees for tax return preparation.
(3) All other fees consist of the aggregate fees billed for products and services provided by the registrant’s principal accountant other than audit, audit-related, and tax services.
The following table represents the aggregate audit, audit-related, tax, and other fees billed to all of the Series in the Trust by each Series’ respective principal accountant for the last two fiscal years of each Series.
Fiscal Years Ended | | 03/31/04 | | 03/31/05 | |
| | | | | |
Audit Fees | | $ | 234,500 | | $ | 204,506 | |
| | | | | |
Audit-Related Fees(1) | | $ | 0 | | $ | 0 | |
| | | | | |
Tax Fees(2) | | $ | 73,600 | | $ | 75,200 | |
| | | | | |
All Other Fees(3) | | $ | 0 | | $ | 0 | |
| | | | | |
Total | | $ | 308,100 | | $ | 279,706 | |
(1) Audit-related fees consist of the aggregate fees billed for assurance and related services that are reasonable related to the performance of the audit of financial statements and are not reported under the category of audit fees.
(2) Tax fees consist of the aggregate fees billed for professional services rendered by the principal accountant relating to tax compliance, tax advice, and tax planning and specifically include fees for tax return preparation.
(3) All other fees consist of the aggregate fees billed for products and services provided by the principal accountant other than audit, audit-related, and tax services.
During the fiscal year ended March 31, 2004, $35,000 was billed by D&T, the principal accountant for the Series, for work done in connection with its Rule 17Ad-13 examination of Eaton Vance Management’s assertion that it has maintained an effective internal control structure over the sub-transfer agent and registrar functions, such services being pre-approved in accordance with Rule 2-01(c) (7)(ii) of Regulation S-X.
(e)(1) The registrant’s audit committee has adopted policies and procedures relating to the pre-approval of services provided by the registrant’s principal accountant (the “Pre-Approval Policies”). The Pre-Approval Policies establish a framework intended to assist the audit committee in the proper discharge of its pre-approval responsibilities. As a general matter, the Pre-Approval Policies (i) specify certain types of audit, audit-related, tax, and other services determined to be pre-approved by the audit committee; and (ii) delineate specific procedures governing the mechanics of the pre-approval process, including the approval and monitoring of audit and non-audit service fees. Unless a service is specifically pre-approved under the Pre-Approval Policies, it must be separately pre-approved by the audit committee.
The Pre-Approval Policies and the types of audit and non-audit services pre-approved therein must be reviewed and ratified by the registrant’s audit committee at least annually. The registrant’s audit committee maintains full responsibility for the appointment, compensation, and oversight of the work of the registrant’s principal accountant.
(e)(2) No services described in paragraphs (b)-(d) above were approved by the registrant’s audit committee pursuant to the “de minimis exception” set forth in Rule 2-01 (c)(7)(i)(C) of Regulation S-X.
(f) Not applicable.
(g) The following table presents (i) the aggregate non-audit fees (i.e., fees for audit-related, tax, and other services) billed to the registrant by the registrant’s principal accountant for the registrant’s fiscal year ended March 31, 2004 and the fiscal year ended March 31, 2005; and (ii) the aggregate non-audit fees (i.e., fees for audit-related, tax, and other services) billed to the Eaton Vance organization by the registrant’s principal accountant for the same time periods.
Fiscal Years Ended | | 03/31/04 | | 03/31/05 | |
| | | | | |
Registrant(1) | | $ | 73,600 | | $ | 75,200 | |
| | | | | |
Eaton Vance(2) | | $ | 452,358 | | $ | 379,713 | |
(1) Includes all of the Series in the Trust.
(2) The investment adviser to the Funds, as well as any of its affiliates that provide ongoing services to the Funds, are subsidiaries of Eaton Vance Corp.
(h) The registrant’s audit committee has considered whether the provision by the registrant’s principal accountant of non-audit services to the registrant’s investment adviser and any entity controlling, controlled by, or under common control with the adviser that provides ongoing services to the registrant that were not pre-approved pursuant to Rule 2-01(c)(7)(ii) of Regulation S-X is compatible with maintaining the principal accountant’s independence.
Item 5. Audit Committee of Listed registrants
Not required in this filing.
Item 6. Schedule of Investments
Please see schedule of investments contained in the Report to Stockholders included under Item 1 of this Form N-CSR.
Item 7. Disclosure of Proxy Voting Policies and Procedures for Closed-End Management Investment Companies
Not required in this filing.
Item 8. Purchases of Equity Securities by Closed-End Management Investment Company and Affiliated Purchasers.
Not required in this filing.
Item 9. Submission of Matters to a Vote of Security Holders.
Effective February 7, 2005, the Governance Committee of the Board of Trustees revised the procedures by which a Fund’s shareholders may recommend nominees to the registrant’s Board of Trustees to add the following (highlighted):
The Governance Committee shall, when identifying candidates for the position of Independent Trustee, consider any such candidate recommended by a shareholder of a Fund if such recommendation contains (i)sufficient background information concerning the candidate, including evidence the candidate is willing to serve as an Independent Trustee if selected for the position; and (ii) is received in a sufficiently timely manner (and in any event no later than the date specified for receipt of shareholder proposals in any applicable proxy statement with respect to a Fund). Shareholders shall be directed to address any such recommendations in writing to the attention of the Governance Committee, c/o the Secretary of the Fund. The Secretary shall retain
copies of any shareholder recommendations which meet the foregoing requirements for a period of not more than 12 months following receipt. The Secretary shall have no obligation to acknowledge receipt of any shareholder recommendations
Item 10. Controls and Procedures
(a) It is the conclusion of the registrant’s principal executive officer and principal financial officer that the effectiveness of the registrant’s current disclosure controls and procedures (such disclosure controls and procedures having been evaluated within 90 days of the date of this filing) provide reasonable assurance that the information required to be disclosed by the registrant has been recorded, processed, summarized and reported within the time period specified in the Commission’s rules and forms and that the information required to be disclosed by the registrant has been accumulated and communicated to the registrant’s principal executive officer and principal financial officer in order to allow timely decisions regarding required disclosure.
(b) There have been no changes in the registrant’s internal controls over financial reporting during the second fiscal quarter of the period covered by this report that has materially affected, or is reasonably likely to materially affect, the registrant’s internal control over financial reporting.
Item 11. Exhibits
(a)(1) | | Registrant’s Code of Ethics – Not applicable (please see Item 2). |
(a)(2)(i) | | Treasurer’s Section 302 certification. |
(a)(2)(ii) | | President’s Section 302 certification. |
(b) | | Combined Section 906 certification. |
Signatures
Pursuant to the requirements of the Securities Exchange Act of 1934 and the Investment Company Act of 1940, the registrant has duly caused this report to be signed on its behalf by the undersigned, thereunto duly authorized.
Eaton Vance Investment Trust | |
| | |
By: | /s/Thomas J. Fetter | |
| Thomas J. Fetter |
| President |
| |
| |
Date: | | May 11, 2005 | |
| | | | | |
Pursuant to the requirements of the Securities Exchange Act of 1934 and the Investment Company Act of 1940, this report has been signed below by the following persons on behalf of the registrant and in the capacities and on the dates indicated.
By: | /s/James L. O’Connor | |
| James L. O’Connor |
| Treasurer |
| |
| |
Date: | May 11, 2005 | |
| | | |
By: | /s/Thomas J. Fetter | |
| Thomas J. Fetter |
| President |
| |
| |
Date: | | May 11, 2005 | |
| | | | |