UNITED STATES
SECURITIES AND EXCHANGE COMMISSION
Washington, D.C. 20549
FormN-CSR
CERTIFIED SHAREHOLDER REPORT OF REGISTERED
MANAGEMENT INVESTMENT COMPANIES
Investment Company Act File Number:811-04443
Eaton Vance Investment Trust
(Exact Name of Registrant as Specified in Charter)
Two International Place, Boston, Massachusetts 02110
(Address of Principal Executive Offices)
Maureen A. Gemma
Two International Place, Boston, Massachusetts 02110
(Name and Address of Agent for Services)
(617)482-8260
(Registrant’s Telephone Number)
March 31
Date of Fiscal Year End
March 31, 2019
Date of Reporting Period
Item 1. Reports to Stockholders

Eaton Vance
Floating-Rate Municipal Income Fund
Annual Report
March 31, 2019
Important Note. Beginning on January 1, 2021, as permitted by regulations adopted by the Securities and Exchange Commission, paper copies of the Fund’s annual and semi-annual shareholder reports will no longer be sent by mail unless you specifically request paper copies of the reports. Instead, the reports will be made available on the Fund’s website (eatonvance.com/funddocuments), and you will be notified by mail each time a report is posted and provided with a website address to access the report.
If you already elected to receive shareholder reports electronically, you will not be affected by this change and you need not take any action. If you are a direct investor, you may elect to receive shareholder reports and other communications from the Fund electronically by signing up fore-Delivery at eatonvance.com/edelivery. If you own your shares through a financial intermediary (such as a broker-dealer or bank), you must contact your financial intermediary to sign up.
You may elect to receive all future Fund shareholder reports in paper free of charge. If you are a direct investor, you can inform the Fund that you wish to continue receiving paper copies of your shareholder reports by calling1-800-262-1122. If you own these shares through a financial intermediary, you must contact your financial intermediary or follow instructions included with this disclosure, if applicable, to elect to continue to receive paper copies of your shareholder reports. Your election to receive reports in paper will apply to all Eaton Vance funds held directly or to all funds held through your financial intermediary, as applicable.

Commodity Futures Trading Commission Registration. Effective December 31, 2012, the Commodity Futures Trading Commission (“CFTC”) adopted certain regulatory changes that subject registered investment companies and advisers to regulation by the CFTC if a fund invests more than a prescribed level of its assets in certain CFTC-regulated instruments (including futures, certain options and swap agreements) or markets itself as providing investment exposure to such instruments. The Fund has claimed an exclusion from the definition of the term “commodity pool operator” under the Commodity Exchange Act. Accordingly, neither the Fund nor the adviser with respect to the operation of the Fund is subject to CFTC regulation. Because of its management of other strategies, the Fund’s adviser is registered with the CFTC as a commodity pool operator and a commodity trading advisor.
Fund shares are not insured by the FDIC and are not deposits or other obligations of, or guaranteed by, any depository institution. Shares are subject to investment risks, including possible loss of principal invested.
This report must be preceded or accompanied by a current summary prospectus or prospectus. Before investing, investors should consider carefully the investment objective, risks, and charges and expenses of a mutual fund. This and other important information is contained in the summary prospectus and prospectus, which can be obtained from a financial advisor. Prospective investors should read the prospectus carefully before investing. For further information, please call1-800-262-1122.
Annual Report March 31, 2019
Eaton Vance
Floating-Rate Municipal Income Fund
Table of Contents
| | | | |
Management’s Discussion of Fund Performance | | | 2 | |
| |
Performance | | | 3 | |
| |
Fund Profile | | | 4 | |
| |
Endnotes and Additional Disclosures | | | 5 | |
| |
Fund Expenses | | | 6 | |
| |
Financial Statements | | | 7 | |
| |
Report of Independent Registered Public Accounting Firm | | | 21 | |
| |
Federal Tax Information | | | 22 | |
| |
Management and Organization | | | 23 | |
| |
Important Notices | | | 26 | |
Eaton Vance
Floating-Rate Municipal Income Fund
March 31, 2019
Management’s Discussion of Fund Performance1
Economic and Market Conditions
Viewed as a whole, the12-month period that began on April 1, 2018 was positive for the municipal bond market, with the Bloomberg Barclays Municipal Bond Index,2 a broad measure of the asset class, returning 5.38%.
The period was marked by a flattening of the municipal bond yield curve.7 Rates declined across the curve, but declined more for bonds with maturities of 4 years and longer than for bonds with shorter1-3 year maturities. Lower-rated6 bonds generally outperformed higher-rated issues during the period and municipal bonds outperformed comparable U.S. Treasurys. But while the fiscal year overall was positive for municipal bond performance, investors endured considerable volatility during the12-month period.
As the fiscal year began in April 2018, the municipal bond market was at the tail end of a period of rising rates, driven by signs of increasing inflation, higher wage growth and fears that recently-passed tax legislation might overheat the economy. In an effort to blunt upward pressure on inflation, the U.S. Federal Reserve Board (the Fed) announced its second rate hike of 2018 in June. At the long end of the curve, however, fluctuating perceptions of geopolitical risk were a primary driver of rates from April through the end of August 2018. Investors toggled between concern that the U.S. was initiating a global trade war and optimism about economic growth and a potential detente between the U.S. and North Korea.
In September 2018, the Fed hiked rates again and both U.S. Treasury and municipal rates rose across the curve.
In October 2018, a strong U.S. employment report and easing concerns over Italy’s national budget continued the upward pressure on longer-term rates. But as 2018 came to a close, investors became increasingly concerned about a trade war with China, a looming government shutdown and dovish comments by the Fed that led investors to fear weakness in the U.S. economy, driving credit spreads wider and the futures market to project the possibility of no further rate hikes in 2019. The result was a “flight to quality” by bond investors that pushed longer-term bond prices up and rates down in the final month of 2018.
The first two months of the new year, in contrast, were a relatively quiet period for bonds. The final month
of the period, however, saw rates decline across the curve, in a dramatic reversal of the market’s direction at the beginning of the period. Driven initially by an unexpectedly weak February jobs report issued in early March, the rate decline was accelerated by reports of slowing gross domestic product growth in China and Germany as well as Brexit uncertainty. Downward pressure on rates appeared to culminate on March 20, 2019, when the Fed issued comments that were more dovish than the market had expected — leading many investors to conclude that further rate hikes were off the table for the rest of 2019.
Fund Performance
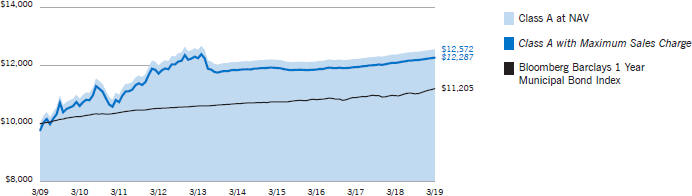
For the12-month period ended March 31, 2019, Eaton Vance Floating-Rate Municipal Income Fund (the Fund) Class A shares at net asset value (NAV) returned 1.49%, underperforming the 2.18% return of the Fund’s benchmark, the Bloomberg Barclays 1 Year Municipal Bond Index (the Index).
The Fund invests primarily in municipal obligations that are exempt from regular federal income tax and municipal floating-rate obligations or fixed-rate municipal obligations with respect to which the Fund enters into agreements to swap the fixed rate for a floating rate. Management did not employ any fixed-rate to floating-rate swaps during the period.
Detractors from Fund performance versus the Index during the period included security selection in the transportation sector, holdings in bonds with less than one year remaining to maturity, which were not represented in the Index and an overweight in municipal variable rate demand obligation securities. In contrast, contributors to results relative to the Index included an overweight in the hospital sector, an overweight inA-rated securities and an underweight in prerefunded, or escrowed, bonds, which were the worst-performing sector in the Index during the period.
See Endnotes and Additional Disclosures in this report.
Past performance is no guarantee of future results. Returns are historical and are calculated by determining the percentage change in net asset value (NAV) or offering price (as applicable) with all distributions reinvested. Investment return and principal value will fluctuate so that shares, when redeemed, may be worth more or less than their original cost. Performance less than or equal to one year is cumulative. Performance is for the stated time period only; due to market volatility, the Fund’s current performance may be lower or higher than quoted. Returns are before taxes unless otherwise noted. For performance as of the most recentmonth-end, please refer to eatonvance.com.
Eaton Vance
Floating-Rate Municipal Income Fund
March 31, 2019
Performance2,3
Portfolio Managers Craig R. Brandon, CFA and Adam A. Weigold, CFA
| | | | | | | | | | | | | | | | | | | | |
| % Average Annual Total Returns | | Class Inception Date | | | Performance
Inception Date | | | One Year | | | Five Years | | | Ten Years | |
Class A at NAV | | | 06/27/1996 | | | | 05/29/1992 | | | | 1.49 | % | | | 0.71 | % | | | 2.31 | % |
Class A with 2.25% Maximum Sales Charge | | | — | | | | — | | | | –0.83 | | | | 0.25 | | | | 2.08 | |
Class I at NAV | | | 08/03/2010 | | | | 05/29/1992 | | | | 1.75 | | | | 0.86 | | | | 2.44 | |
Bloomberg Barclays 1 Year Municipal Bond Index | | | — | | | | — | | | | 2.18 | % | | | 0.94 | % | | | 1.14 | % |
| | | | | |
| | | | | | | | | | | | | | | | | | | | |
| % Total Annual Operating Expense Ratios | | | | | | | | | | | Class A | | | Class I | |
| | | | | | | | | | | | | | | 0.60 | % | | | 0.45 | % |
| | | | | |
| | | | | | | | | | | | | | | | | | | | |
| % Distribution Rates/Yields4 | | | | | | | | | | | Class A | | | Class I | |
Distribution Rate | | | | | | | | | | | | | | | 1.56 | % | | | 1.71 | % |
Taxable-Equivalent Distribution Rate | | | | | | | | | | | | | | | 2.64 | | | | 2.89 | |
SEC30-day Yield | | | | | | | | | | | | | | | 1.36 | | | | 1.53 | |
Taxable-Equivalent SEC30-day Yield | | | | | | | | | | | | | | | 2.30 | | | | 2.59 | |
Growth of $10,000
This graph shows the change in value of a hypothetical investment of $10,000 in Class A of the Fund for the period indicated. For comparison, the same investment is shown in the indicated index.
| | | | | | | | | | | | | | | | |
| Growth of Investment3 | | Amount Invested | | | Period Beginning | | | At NAV | | | With Maximum Sales Charge | |
Class I | | $ | 250,000 | | | | 03/31/2009 | | | $ | 318,263 | | | | N.A. | |
See Endnotes and Additional Disclosures in this report.
Past performance is no guarantee of future results. Returns are historical and are calculated by determining the percentage change in net asset value (NAV) or offering price (as applicable) with all distributions reinvested. Investment return and principal value will fluctuate so that shares, when redeemed, may be worth more or less than their original cost. Performance less than or equal to one year is cumulative. Performance is for the stated time period only; due to market volatility, the Fund’s current performance may be lower or higher than quoted. Returns are before taxes unless otherwise noted. For performance as of the most recentmonth-end, please refer to eatonvance.com.
Eaton Vance
Floating-Rate Municipal Income Fund
March 31, 2019
Fund Profile
Credit Quality (% of total investments)6
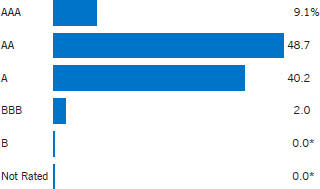
| * | Amount is less than 0.05%. |
See Endnotes and Additional Disclosures in this report.
Eaton Vance
Floating-Rate Municipal Income Fund
March 31, 2019
Endnotes and Additional Disclosures
| 1 | The views expressed in this report are those of the portfolio manager(s) and are current only through the date stated at the top of this page. These views are subject to change at any time based upon market or other conditions, and Eaton Vance and the Fund(s) disclaim any responsibility to update such views. These views may not be relied upon as investment advice and, because investment decisions are based on many factors, may not be relied upon as an indication of trading intent on behalf of any Eaton Vance fund. This commentary may contain statements that are not historical facts, referred to as “forward looking statements.” The Fund’s actual future results may differ significantly from those stated in any forward looking statement, depending on factors such as changes in securities or financial markets or general economic conditions, the volume of sales and purchases of Fund shares, the continuation of investment advisory, administrative and service contracts, and other risks discussed from time to time in the Fund’s filings with the Securities and Exchange Commission. |
| 2 | Bloomberg Barclays Municipal Bond Index is an unmanaged index of municipal bonds traded in the U.S. Bloomberg Barclays 1 Year Municipal Bond Index is an unmanaged index of municipal bonds traded in the U.S. with maturities ranging from1-2 years. Unless otherwise stated, index returns do not reflect the effect of any applicable sales charges, commissions, expenses, taxes or leverage, as applicable. It is not possible to invest directly in an index. |
| 3 | Total Returns at NAV do not include applicable sales charges. If sales charges were deducted, the returns would be lower. Total Returns shown with maximum sales charge reflect the stated maximum sales charge. Unless otherwise stated, performance does not reflect the deduction of taxes on Fund distributions or redemptions of Fund shares. |
| | Performance prior to the inception date of a class may be linked to the performance of an older class of the Fund. This linked performance is adjusted for any applicable sales charge, but is not adjusted for class expense differences. If adjusted for such differences, the performance would be different. The performance of Class I is linked to Class A. Performance since inception for an index, if presented, is the performance since the Fund’s or oldest share class’ inception, as applicable. Performance presented in the Financial Highlights included in the financial statements is not linked. |
| | Effective August 19, 2013, the Fund changed its investment objective and policies. Prior to August 19, 2013, the Fund employed a strategy of investing in fixed-rate bonds with a dollar-weighted average portfolio duration of between three and nine years. Performance prior to August 19, 2013 reflects the Fund’s performance under its former investment objective and policies. |
| 4 | Source: Fund prospectus. The expense ratios for the current reporting period can be found in the Financial Highlights section of this report. |
| 5 | The Distribution Rate is based on the Fund’s last regular distribution per share in the period (annualized) divided by the Fund’s NAV at the end of the period. The Fund’s distributions may be comprised of amounts characterized for federal income tax purposes astax-exempt income, qualified andnon-qualified ordinary dividends, capital gains and nondividend distributions, also known as return of capital. The Fund will determine the federal income tax character of distributions paid to a shareholder after the end of the calendar year. This is reported on the IRS form1099-DIV and provided to the shareholder shortly after eachyear-end. The Fund’s distributions are determined by the investment adviser based on its current assessment of the Fund’s long-term return potential. As portfolio and market conditions change, the rate of distributions paid by the Fund could change. Taxable-equivalent performance is based on the highest combined federal and state income tax rates, where applicable. Lower tax rates would result in lowertax-equivalent performance. Actual tax rates will vary depending on your income, exemptions and deductions. Rates do not include local taxes. The SEC Yield is a standardized measure based on the estimated yield to maturity of a fund’s investments over a30-day period and is based on the maximum offer price at the date specified. The SEC Yield is not based on the distributions made by the Fund, which may differ. |
| 6 | Ratings are based on Moody’s Investors Service, Inc. (“Moody’s”), S&P Global Ratings (“S&P”) or Fitch Ratings (“Fitch”), as applicable. If securities are rated differently by the ratings agencies, the highest rating is applied. Ratings, which are subject to change, apply to the creditworthiness of the issuers of the underlying securities and not to the Fund or its shares. Credit ratings measure the quality of a bond based on the issuer’s creditworthiness, with ratings ranging from AAA, being the highest, to D, being the lowest based on S&P’s measures. Ratings of BBB or higher by S&P or Fitch (Baa or higher by Moody’s) are considered to be investment-grade quality. Credit ratings are based largely on the ratings agency’s analysis at the time of rating. The rating assigned to any particular security is not necessarily a reflection of the issuer’s current financial condition and does not necessarily reflect its assessment of the volatility of a security’s market value or of the liquidity of an investment in the security. Holdings designated as “Not Rated” (if any) are not rated by the national ratings agencies stated above. |
| 7 | Yield curve is a graphical representation of the yields offered by bonds of various maturities. The yield curve flattens when long-term rates fall and/or short-term rates increase, and the yield curve steepens when long-term rates increase and/or short-term rates fall. |
| | Fund profile subject to change due to active management. |
Eaton Vance
Floating-Rate Municipal Income Fund
March 31, 2019
Fund Expenses
Example: As a Fund shareholder, you incur two types of costs: (1) transaction costs, including sales charges (loads) on purchases and redemption fees (if applicable); and (2) ongoing costs, including management fees; distribution and/or service fees; and other Fund expenses. This Example is intended to help you understand your ongoing costs (in dollars) of Fund investing and to compare these costs with the ongoing costs of investing in other mutual funds. The Example is based on an investment of $1,000 invested at the beginning of the period and held for the entire period (October 1, 2018 – March 31, 2019).
Actual Expenses: The first section of the table below provides information about actual account values and actual expenses. You may use the information in this section, together with the amount you invested, to estimate the expenses that you paid over the period. Simply divide your account value by $1,000 (for example, an $8,600 account value divided by $1,000 = 8.6), then multiply the result by the number in the first section under the heading entitled “Expenses Paid During Period” to estimate the expenses you paid on your account during this period.
Hypothetical Example for Comparison Purposes: The second section of the table below provides information about hypothetical account values and hypothetical expenses based on the actual Fund expense ratio and an assumed rate of return of 5% per year (before expenses), which is not the actual Fund return. The hypothetical account values and expenses may not be used to estimate the actual ending account balance or expenses you paid for the period. You may use this information to compare the ongoing costs of investing in your Fund and other funds. To do so, compare this 5% hypothetical example with the 5% hypothetical examples that appear in the shareholder reports of the other funds.
Please note that the expenses shown in the table are meant to highlight your ongoing costs only and do not reflect any transactional costs, such as sales charges (loads) or redemption fees (if applicable). Therefore, the second section of the table is useful in comparing ongoing costs only, and will not help you determine the relative total costs of owning different funds. In addition, if these transactional costs were included, your costs would be higher.
| | | | | | | | | | | | | | | | |
| | | Beginning
Account Value
(10/1/18) | | | Ending
Account Value
(3/31/19) | | | Expenses Paid
During Period*
(10/1/18 – 3/31/19) | | | Annualized
Expense
Ratio | |
| | | | |
Actual | | | | | | | | | | | | | | | | |
Class A | | $ | 1,000.00 | | | $ | 1,006.90 | | | $ | 3.00 | ** | | | 0.60 | % |
Class I | | $ | 1,000.00 | | | $ | 1,008.70 | | | $ | 2.25 | ** | | | 0.45 | % |
| | | | | |
Hypothetical | | | | | | | | | | | | | | | | |
(5% return per year before expenses) | | | | | | | | | | | | | | | | |
Class A | | $ | 1,000.00 | | | $ | 1,021.90 | | | $ | 3.02 | ** | | | 0.60 | % |
Class I | | $ | 1,000.00 | | | $ | 1,022.70 | | | $ | 2.27 | ** | | | 0.45 | % |
| * | Expenses are equal to the Fund’s annualized expense ratio for the indicated Class, multiplied by the average account value over the period, multiplied by 182/365 (to reflect theone-half year period). The Example assumes that the $1,000 was invested at the net asset value per share determined at the close of business on September 30, 2018. |
| ** | Absent an allocation of certain expenses to affiliates, expenses would be higher. |
Eaton Vance
Floating-Rate Municipal Income Fund
March 31, 2019
Portfolio of Investments
| | | | | | | | |
| Tax-Exempt Municipal Securities — 100.1% | |
| Security | | Principal Amount (000’s omitted) | | | Value | |
|
| Education — 11.0% | |
| | |
California Infrastructure and Economic Development Bank, (The Colburn School), 2.50%, (SIFMA + 1.00%), 6/1/20 (Put Date), 8/1/37(1) | | $ | 2,000 | | | $ | 2,009,240 | |
| | |
California Infrastructure and Economic Development Bank, (The Colburn School), 2.70%, (SIFMA + 1.20%), 6/1/22 (Put Date), 8/1/37(1) | | | 20,000 | | | | 20,407,000 | |
| | |
Colorado School of Mines, 2.168%, (67% of 1 mo. USD LIBOR + 0.50%), 2/1/23(1) | | | 2,955 | | | | 2,958,842 | |
| | |
Lehigh County General Purpose Authority, PA, (Muhlenberg College), 2.08%, (SIFMA + 0.58%), 11/1/24 (Put Date), 11/1/37(1) | | | 4,000 | | | | 4,002,800 | |
| | |
Montana State University, 1.95%, (SIFMA + 0.45%), 9/1/23 (Put Date), 11/15/35(1) | | | 1,830 | | | | 1,830,897 | |
| | |
New Hampshire Health and Education Facilities Authority, (University System of New Hampshire), (SPA: State Street Bank and Trust Company), 1.37%, 7/1/33(2) | | | 5,170 | | | | 5,170,000 | |
| | |
New Hampshire Health and Education Facilities Authority, (University System of New Hampshire), (SPA: Wells Fargo Bank, N.A.), 1.48%, 7/1/33(2) | | | 5,000 | | | | 5,000,000 | |
| | |
Ohio Higher Educational Facility Commission, (Case Western Reserve University), 2.169%, (70% of 1 mo. USD LIBOR + 0.42%), 4/1/22 (Put Date), 10/1/44(1) | | | 6,750 | | | | 6,748,852 | |
| | |
Pennsylvania Higher Educational Facilities Authority, (Messiah College), 2.20% to 11/1/21 (Put Date), 11/1/31 | | | 1,850 | | | | 1,839,196 | |
| | |
University of Cincinnati, OH, 2.014%, (67% of 1 mo. USD LIBOR + 0.34%), 6/1/20(1) | | | 3,000 | | | | 2,999,880 | |
| | |
University of Michigan, 1.77%, (SIFMA + 0.27%), 4/1/22 (Put Date), 4/1/33(1) | | | 3,475 | | | | 3,460,683 | |
| | |
University of North Carolina at Chapel Hill, 2.018%, (67% of 1 mo. USD LIBOR + 0.35%), 12/9/21 (Put Date), 12/1/41(1) | | | 5,000 | | | | 5,004,150 | |
| | |
University of North Carolina at Chapel Hill, 2.068%, (67% of 1 mo. USD LIBOR + 0.40%), 11/9/22 (Put Date), 12/1/41(1) | | | 11,400 | | | | 11,373,438 | |
| | |
University of Pittsburgh, 1.74%, (SIFMA + 0.24%), 9/15/21(1) | | | 2,000 | | | | 1,996,600 | |
| | |
West Virginia University, 2.03%, (SIFMA + 0.53%), 10/1/19 (Put Date), 10/1/41(1) | | | 4,500 | | | | 4,500,360 | |
| | |
| | | | | | | $ | 79,301,938 | |
|
| Electric Utilities — 3.1% | |
| | |
California Municipal Finance Authority, (Anaheim System District), 1.85%, (SIFMA + 0.35%), 12/1/20 (Put Date), 10/1/45(1) | | $ | 4,300 | | | $ | 4,296,087 | |
| | |
Long Island Power Authority, NY, Electric System Revenue, 2.493%, (70% of 1 mo. USD LIBOR + 0.75%), 10/1/23 (Put Date), 5/1/33(1) | | | 10,750 | | | | 10,775,155 | |
| | |
Oklahoma Municipal Power Authority, 2.30%, (SIFMA + 0.80%), 1/1/23(1) | | | 6,550 | | | | 6,531,267 | |
| | | | | | | | |
| Security | | Principal Amount (000’s omitted) | | | Value | |
|
| Electric Utilities (continued) | |
| | |
Seattle, WA, Municipal Light and Power Revenue, 1.99%, (SIFMA + 0.49%), 11/1/23 (Put Date), 11/1/46(1) | | $ | 1,000 | | | $ | 1,000,310 | |
| | |
| | | | | | | $ | 22,602,819 | |
|
| General Obligations — 14.5% | |
| | |
Bethlehem Area School District Authority, PA, 2.237%, (70% of 1 mo. USD LIBOR + 0.49%), 11/1/21 (Put Date), 1/1/30(1) | | $ | 7,970 | | | $ | 7,963,544 | |
| | |
Bethlehem Area School District Authority, PA, 2.227%, (70% of 1 mo. USD LIBOR + 0.48%), 11/1/21 (Put Date), 7/1/31(1) | | | 2,000 | | | | 1,997,840 | |
| | |
California, 2.443%, (70% of 1 mo. USD LIBOR + 0.70%), 12/1/20 (Put Date), 12/1/28(1) | | | 3,450 | | | | 3,464,283 | |
| | |
California, 1.93%, (SIFMA + 0.43%), 12/3/18 (Put Date), 12/1/29(1) | | | 6,500 | | | | 6,521,645 | |
| | |
Connecticut, 2.13%, (SIFMA + 0.63%), 3/1/20(1) | | | 1,000 | | | | 1,003,230 | |
| | |
Connecticut, 2.25%, (SIFMA + 0.75%), 3/1/21(1) | | | 275 | | | | 276,356 | |
| | |
Connecticut, 2.35%, (SIFMA + 0.85%), 3/1/22(1) | | | 700 | | | | 705,558 | |
| | |
Connecticut, 2.52%, (SIFMA + 1.02%),
8/15/20(1) | | | 3,000 | | | | 3,028,920 | |
| | |
Delaware Valley Regional Finance Authority, PA, 2.428%, (67% of 1 mo. USD LIBOR + 0.76%), 9/1/24 (Put Date), 9/1/48(1) | | | 13,000 | | | | 12,915,500 | |
| | |
Delaware Valley Regional Finance Authority, PA, 2.03%, (SIFMA + 0.53%), 9/1/23 (Put Date), 9/1/48(1) | | | 9,100 | | | | 9,103,913 | |
| | |
Everett, WA, 1.90%, (SIFMA + 0.40%), 12/1/19 (Put Date), 12/1/34(1) | | | 1,335 | | | | 1,335,067 | |
| | |
Illinois, 5.00%, 8/1/19 | | | 3,000 | | | | 3,029,490 | |
| | |
Illinois, 5.00%, 12/1/19 | | | 1,000 | | | | 1,019,730 | |
| | |
Illinois, 5.00%, 8/1/20 | | | 3,000 | | | | 3,102,240 | |
| | |
Lake County Forest Preserve District, IL, 2.229%, (67% of 3 mo. USD LIBOR + 0.48%), 12/15/20(1) | | | 4,185 | | | | 4,190,608 | |
| | |
Manheim Township School District, PA, 2.163%, (68% of 1 mo. USD LIBOR + 0.47%), 11/1/21 (Put Date), 5/1/25(1) | | | 3,400 | | | | 3,418,428 | |
| | |
Massachusetts, 2.383%, (67% of 3 mo. USD LIBOR + 0.55%), 11/1/25(1) | | | 11,400 | | | | 11,389,854 | |
| | |
Massachusetts, 2.10%, (SIFMA + 0.60%), 2/1/20(1) | | | 7,500 | | | | 7,510,500 | |
| | |
Mississippi, 1.998%, (67% of 1 mo. USD LIBOR + 0.33%), 9/1/20 (Put Date),
9/1/27(1) | | | 2,745 | | | | 2,745,466 | |
| | |
New York, NY, (SPA: JPMorgan Chase Bank, N.A.), 1.50%, 1/1/36(2) | | | 10,585 | | | | 10,585,000 | |
| | |
New York, NY, (SPA: JPMorgan Chase Bank, N.A.), 1.50%, 8/1/38(2) | | | 4,800 | | | | 4,800,000 | |
| | |
Texas, (Texas Transportation Commission), 1.88%, (SIFMA + 0.38%), 10/1/21 (Put Date), 10/1/41(1) | | | 4,500 | | | | 4,488,930 | |
| | |
| | | | | | | $ | 104,596,102 | |
| | | | |
| | 7 | | See Notes to Financial Statements. |
Eaton Vance
Floating-Rate Municipal Income Fund
March 31, 2019
Portfolio of Investments — continued
| | | | | | | | |
| Security | | Principal Amount (000’s omitted) | | | Value | |
|
| Hospital — 20.4% | |
| | |
Allen County, OH, (Mercy Health), 2.25%, (SIFMA + 0.75%), 5/1/20 (Put Date), 11/1/35(1) | | $ | 1,250 | | | $ | 1,251,225 | |
| | |
Arizona Health Facilities Authority, (Phoenix Children’s Hospital), 3.35%, (SIFMA + 1.85%), 2/1/23 (Put Date), 2/1/48(1) | | | 7,500 | | | | 7,814,700 | |
| | |
Charlotte-Mecklenburg Hospital Authority, NC, (Atrium Health), 2.10%, (SIFMA + 0.60%), 12/1/23 (Put Date), 1/15/48(1) | | | 5,000 | | | | 5,000,400 | |
| | |
Charlotte-Mecklenburg Hospital Authority, NC, (Atrium Health), (SPA: JPMorgan Chase Bank, N.A.), 1.43%, 1/15/48(2) | | | 2,800 | | | | 2,800,000 | |
| | |
Charlotte-Mecklenburg Hospital Authority, NC, (Carolinas HealthCare System), (SPA: JPMorgan Chase Bank, N.A.), 1.47%, 1/15/37(2) | | | 5,000 | | | | 5,000,000 | |
| | |
Colorado Health Facilities Authority, (Valley View Hospital Association), 2.80% to 5/15/23 (Put Date), 5/15/42 | | | 3,000 | | | | 3,067,890 | |
| | |
Connecticut Health and Educational Facilities Authority, (Hartford HealthCare Corp.), 2.643%, (68% of 1 mo. USD LIBOR + 0.95%), 7/1/20 (Put Date), 7/1/49(1) | | | 1,000 | | | | 1,001,990 | |
| | |
Connecticut Health and Educational Facilities Authority, (Yale New Haven Health), 2.218%, (67% of 1 mo. USD LIBOR + 0.55%), 7/1/19 (Put Date), 7/1/49(1) | | | 8,435 | | | | 8,435,337 | |
| | |
Gainesville and Hall County Hospital Authority, GA, (Northeast Georgia Health System, Inc.), 2.45%, (SIFMA + 0.95%), 2/18/20 (Put Date), 8/15/35(1) | | | 8,400 | | | | 8,405,040 | |
| | |
Geisinger Authority, PA, (Geisinger Health System Foundation), 2.746%, (67% of 1 mo. USD LIBOR + 1.07%), 6/1/24 (Put Date), 6/1/28(1) | | | 2,000 | | | | 2,037,900 | |
| | |
Harris County Cultural Education Facilities Finance Corp., TX, (Memorial Hermann Health System), 2.08%, (SIFMA + 0.58%), 12/1/19 (Put Date), 12/1/42(1) | | | 5,000 | | | | 5,003,600 | |
| | |
Illinois Finance Authority, (Edward-Elmhurst Healthcare), 2.25%, (SIFMA + 0.75%), 7/1/23 (Put Date), 1/1/46(1) | | | 7,500 | | | | 7,500,000 | |
| | |
Indiana Finance Authority, (Parkview Health), 2.05%, (SIFMA + 0.55%), 11/1/23 (Put Date), 11/1/39(1) | | | 7,000 | | | | 7,003,640 | |
| | |
Iowa Finance Authority, (Iowa Health System), 2.08%, (SIFMA + 0.58%), 1/4/24 (Put Date), 2/15/35(1)(3) | | | 11,420 | | | | 11,420,228 | |
| | |
Irving Hospital Authority, TX, (Baylor Scott & White Medical Center - Irving), 2.60%, (SIFMA + 1.10%), 10/15/23 (Put Date), 10/15/44(1) | | | 1,750 | | | | 1,754,830 | |
| | |
Louisiana Public Facilities Authority, (Louisiana Children’s Medical Center), 2.15%, (SIFMA + 0.65%), 9/1/23 (Put Date), 9/1/57(1) | | | 10,000 | | | | 10,004,900 | |
| | |
Massachusetts Development Finance Agency, (Partners HealthCare System), 1.92%, (SIFMA + 0.42%), 1/27/22 (Put Date), 7/1/44(1) | | | 10,000 | | | | 9,962,100 | |
| | |
Michigan Finance Authority, (McLaren Health Care), 2.097%, (68% of 1 mo. USD LIBOR + 0.40%), 10/15/21 (Put Date), 10/15/30(1) | | | 965 | | | | 964,566 | |
| | | | | | | | |
| Security | | Principal Amount (000’s omitted) | | | Value | |
|
| Hospital (continued) | |
| | |
Michigan Finance Authority, (McLaren Health Care), 2.447%, (68% of 1 mo. USD LIBOR + 0.75%), 10/15/20 (Put Date), 10/15/38(1) | | $ | 4,250 | | | $ | 4,269,763 | |
| | |
Michigan Finance Authority, (Trinity Health Credit Group), 2.212%, (67% of 1 mo. USD LIBOR + 0.54%), 12/1/20 (Put Date), 12/1/39(1) | | | 5,100 | | | | 5,111,628 | |
| | |
Michigan Finance Authority, (Trinity Health Credit Group), 1.98%, (SIFMA + 0.48%), 2/1/22 (Put Date), 3/1/51(1) | | | 5,000 | | | | 4,999,800 | |
| | |
Minneapolis, MN, (Fairview Health Services), (LOC: Wells Fargo Bank, N.A.), 1.48%, 11/15/48(2) | | | 4,300 | | | | 4,300,000 | |
| | |
Montana Facility Finance Authority, (Billings Clinic Obligated Group), 2.05%, (SIFMA + 0.55%), 8/15/23 (Put Date), 8/15/37(1) | | | 4,000 | | | | 3,996,040 | |
| | |
Montgomery County Higher Education and Health Authority, PA, (Thomas Jefferson University), 2.22%, (SIFMA + 0.72%), 9/1/23 (Put Date), 9/1/51(1) | | | 10,500 | | | | 10,505,775 | |
| | |
Northampton County General Purpose Authority, PA, (St. Luke’s University Health Network), 2.783%, (70% of 1 mo. USD LIBOR + 1.04%), 8/15/24 (Put Date), 8/15/48(1) | | | 2,000 | | | | 2,006,940 | |
| | |
Phoenix Industrial Development Authority, AZ, (Mayo Clinic), (SPA: Wells Fargo Bank, N.A.), 1.46%, 11/15/52(2) | | | 1,500 | | | | 1,500,000 | |
| | |
Southcentral Pennsylvania General Authority, (WellSpan Health Obligated Group), (SIFMA + 0.60%), 6/1/24 (Put Date),
6/1/49(4) | | | 7,500 | | | | 7,503,000 | |
| | |
Washington Health Care Facilities Authority, (Catholic Health Initiatives), 2.50%, (SIFMA + 1.00%), 1/1/21 (Put Date), 1/1/35(1) | | | 3,000 | | | | 3,007,080 | |
| | |
Wisconsin Health and Educational Facilities Authority, (Advocate Aurora Health Credit Group), 2.05%, (SIFMA + 0.55%), 7/26/23 (Put Date), 8/15/54(1) | | | 1,000 | | | | 997,710 | |
| | |
| | | | | | | $ | 146,626,082 | |
|
| Housing — 7.1% | |
| | |
Massachusetts Housing Finance Agency, 2.092%, (70% of 1 mo. USD LIBOR + 0.35%), 6/1/21 (Put Date), 12/1/48(1) | | $ | 4,000 | | | $ | 4,002,960 | |
| | |
Massachusetts Housing Finance Agency, (Mill Road Apartments), 2.05%, (SIFMA + 0.55%), 11/1/23 (Put Date), 11/1/48(1) | | | 4,000 | | | | 4,000,000 | |
| | |
Massachusetts Housing Finance Agency, (Single Family Housing), 1.83%, (SIFMA + 0.33%), 12/1/21 (Put Date), 12/1/48(1) | | | 3,775 | | | | 3,774,962 | |
| | |
Minnesota Housing Finance Agency, 1.93%, (SIFMA + 0.43%), 7/3/23 (Put Date), 1/1/45(1) | | | 10,000 | | | | 9,959,900 | |
| | |
Minnesota Housing Finance Agency, (FHLMC), (FNMA), (GNMA), 2.05%, (SIFMA + 0.55%), 12/12/23 (Put Date), 7/1/41(1) | | | 10,000 | | | | 10,001,700 | |
| | |
North Dakota Housing Finance Agency, 1.90%, (SIFMA + 0.40%), 2/1/22 (Put Date), 1/1/43(1) | | | 5,000 | | | | 4,999,800 | |
| | | | |
| | 8 | | See Notes to Financial Statements. |
Eaton Vance
Floating-Rate Municipal Income Fund
March 31, 2019
Portfolio of Investments — continued
| | | | | | | | |
| Security | | Principal Amount (000’s omitted) | | | Value | |
|
| Housing (continued) | |
| | |
Pennsylvania Housing Finance Agency, 2.347%, (70% of 1 mo. USD LIBOR + 0.60%), 6/1/23 (Put Date), 10/1/45(1) | | $ | 5,000 | | | $ | 5,019,450 | |
| | |
Pennsylvania Housing Finance Agency, SFMR, 2.317%, (70% of 1 mo. USD LIBOR + 0.57%), 10/1/23 (Put Date), 10/1/47(1) | | | 2,440 | | | | 2,444,636 | |
| | |
Washington Housing Finance Commission, 2.05%, (SIFMA + 0.55%), 10/1/23 (Put Date), 12/1/48(1) | | | 7,000 | | | | 7,003,780 | |
| | |
| | | | | | | $ | 51,207,188 | |
|
| Industrial Development Revenue — 4.2% | |
| | |
California Pollution Control Financing Authority, (Republic Services, Inc.), (AMT), 2.30% to 4/15/19 (Put Date), 11/1/42(3) | | $ | 4,250 | | | $ | 4,250,255 | |
| | |
Miami-Dade County Industrial Development Authority, FL, (Waste Management, Inc.), (AMT), 2.125% to 11/1/19 (Put Date), 11/1/41 | | | 1,000 | | | | 1,002,110 | |
| | |
Mission Economic Development Corp., TX, (Waste Management, Inc.), (AMT), 2.30%, (SIFMA + 0.80%), 11/1/21 (Put Date), 11/1/48(1) | | | 5,000 | | | | 4,999,950 | |
| | |
National Finance Authority, NH, (Waste Management, Inc.), (AMT), 2.25%, (SIFMA + 0.75%), 10/1/21 (Put Date), 10/1/33(1) | | | 6,750 | | | | 6,733,125 | |
| | |
New Hampshire Business Finance Authority, (Casella Waste Systems, Inc.), (AMT), 4.00% to 10/1/19 (Put Date), 4/1/29(3) | | | 165 | | | | 165,970 | |
| | |
Pennsylvania Economic Development Financing Authority, PA, (Waste Management, Inc.), (AMT), 2.25% to 7/1/19 (Put Date), 7/1/41 | | | 2,500 | | | | 2,500,675 | |
| | |
Sussex County Industrial Development Authority, VA, (Atlantic Waste Disposal, Inc.), (AMT), 2.375% to 5/1/19 (Put Date), 6/1/28 | | | 1,500 | | | | 1,500,810 | |
| | |
Whiting, IN, (BP Products North America, Inc.), (AMT), 2.25%, (SIFMA + 0.75%), 12/2/19 (Put Date), 12/1/44(1) | | | 9,000 | | | | 9,004,680 | |
| | |
| | | | | | | $ | 30,157,575 | |
|
| Insured – General Obligations — 0.8% | |
| | |
Allegheny County, PA, (AGM), 2.383%, (67% of 3 mo. USD LIBOR + 0.55%), 11/1/26(1) | | $ | 5,860 | | | $ | 5,846,346 | |
| | |
| | | | | | | $ | 5,846,346 | |
|
| Insured – Lease Revenue / Certificates of Participation — 1.7% | |
| | |
Kentucky Asset/Liability Commission, (NPFG), 2.353%, (67% of 3 mo. USD LIBOR + 0.52%), 11/1/21(1) | | $ | 12,000 | | | $ | 11,983,320 | |
| | |
| | | | | | | $ | 11,983,320 | |
| | | | | | | | |
| Security | | Principal Amount (000’s omitted) | | | Value | |
|
| Insured – Transportation — 0.4% | |
| | |
Metropolitan Transportation Authority, NY, (AGM), 2.018%, (69% of 1 mo. USD LIBOR + 0.30%), 4/1/21 (Put Date), 11/1/32(1) | | $ | 1,500 | | | $ | 1,496,670 | |
| | |
Metropolitan Transportation Authority, NY, (AGM), 2.398%, (69% of 1 mo. USD LIBOR + 0.68%), 4/6/21 (Put Date), 11/1/32(1) | | | 1,250 | | | | 1,256,463 | |
| | |
| | | | | | | $ | 2,753,133 | |
|
| Insured – Water and Sewer — 0.7% | |
| | |
Pittsburgh Water and Sewer Authority, PA, (AGM), 2.39%, (70% of 1 mo. USD LIBOR + 0.64%), 12/1/20 (Put Date), 9/1/40(1) | | $ | 5,000 | | | $ | 5,002,750 | |
| | |
| | | | | | | $ | 5,002,750 | |
|
| Lease Revenue / Certificates of Participation — 0.3% | |
| | |
New Jersey Economic Development Authority, (School Facilities Construction), 3.05%, (SIFMA + 1.55%), 9/1/27(1) | | $ | 2,000 | | | $ | 1,992,380 | |
| | |
| | | | | | | $ | 1,992,380 | |
|
| Other Revenue — 12.8% | |
| | |
Black Belt Energy Gas District, AL, 2.12%, (SIFMA + 0.62%), 12/1/23 (Put Date), 12/1/48(1) | | $ | 20,000 | | | $ | 20,000,000 | |
| | |
California Infrastructure and Economic Development Bank, (California Academy of Sciences), 2.123%, (70% of 1 mo. USD LIBOR + 0.38%), 8/1/21 (Put Date), 8/1/47(1) | | | 10,000 | | | | 10,002,600 | |
| | |
California Infrastructure and Economic Development Bank, (Museum Associates), 2.399%, (70% of 1 mo. USD LIBOR + 0.65%), 2/1/21 (Put Date), 12/1/50(1) | | | 3,000 | | | | 3,010,290 | |
| | |
California Infrastructure and Economic Development Bank, (The J. Paul Getty Trust), Series 2011A 3, 2.208%, (70% of 3 mo. USD LIBOR + 0.37%), 4/1/20 (Put Date), 4/1/38(1) | | | 5,500 | | | | 5,506,930 | |
| | |
Lancaster Port Authority, OH, Gas Supply Revenue, (SPA: Royal Bank of Canada), 2.288%, (67% of 1 mo. USD LIBOR + 0.62%), 8/1/19(1) | | | 1,700 | | | | 1,700,221 | |
| | |
Lancaster Port Authority, OH, Gas Supply Revenue, (SPA: Royal Bank of Canada), 2.388%, (67% of 1 mo. USD LIBOR + 0.72%), 8/1/19 (Put Date), 5/1/38(1) | | | 4,480 | | | | 4,480,807 | |
| | |
New Mexico Municipal Energy Acquisition Authority, (SPA: Royal Bank of Canada), 2.418%, (67% of 1 mo. USD LIBOR + 0.75%), 8/1/19 (Put Date), 11/1/39(1) | | | 7,000 | | | | 7,001,540 | |
| | |
Northern California Gas Authority No. 1, Gas Project Revenue, 2.594%, (67% of 3 mo. USD LIBOR + 0.72%), 7/1/27(1) | | | 4,000 | | | | 3,891,840 | |
| | |
Patriots Energy Group Financing Agency, SC, Gas Supply Revenue, (Liq: Royal Bank of Canada), 2.528%, (67% of 1 mo. USD LIBOR + 0.86%), 2/1/24 (Put Date),
10/1/48(1) | | | 17,500 | | | | 17,408,650 | |
| | | | |
| | 9 | | See Notes to Financial Statements. |
Eaton Vance
Floating-Rate Municipal Income Fund
March 31, 2019
Portfolio of Investments — continued
| | | | | | | | |
| Security | | Principal Amount (000’s omitted) | | | Value | |
|
| Other Revenue (continued) | |
| | |
Southeast Alabama Gas Supply District, (Project No. 2), 2.518%, (67% of 1 mo. USD LIBOR + 0.85%), 6/1/24 (Put Date), 6/1/49(1) | | $ | 5,000 | | | $ | 4,901,550 | |
| | |
Washington Health Care Facilities Authority, (Fred Hutchinson Cancer Research Center), 2.772%, (67% of 1 mo. USD LIBOR + 1.10%), 7/1/22 (Put Date),
1/1/42(1) | | | 2,000 | | | | 2,022,700 | |
| | |
Washington Health Care Facilities Authority, (Fred Hutchinson Cancer Research Center), 2.55%, (SIFMA + 1.05%), 7/3/23 (Put Date), 1/1/42(1) | | | 12,000 | | | | 12,193,320 | |
| | |
| | | | | | | $ | 92,120,448 | |
|
| Special Tax Revenue — 1.8% | |
| | |
Central Puget Sound Regional Transit Authority, WA, Sales Tax and Motor Vehicle Tax Revenue, Green Bonds, 1.80%, (SIFMA + 0.30%), 11/1/21 (Put Date), 11/1/45(1) | | $ | 3,000 | | | $ | 2,998,980 | |
| | |
Central Puget Sound Regional Transit Authority, WA, Sales Tax and Motor Vehicle Tax Revenue, Green Bonds, 1.95%, (SIFMA + 0.45%), 11/1/23 (Put Date), 11/1/45(1) | | | 5,000 | | | | 5,003,450 | |
| | |
Contra Costa Transportation Authority, CA, Sales Tax Revenue, 1.992%, (70% of 1 mo. USD LIBOR + 0.25%), 9/1/21 (Put Date), 3/1/34(1) | | | 5,000 | | | | 5,003,750 | |
| | |
New River Community Development District, FL, (Capital Improvements), 5.00%,
5/1/13(5) | | | 35 | | | | 0 | |
| | |
New River Community Development District, FL, (Capital Improvements), Series2010A-2, 5.75%, 5/1/38 | | | 60 | | | | 58,840 | |
| | |
Sterling Hill Community Development District, FL, (Capital Improvements), 5.10%,
5/1/11(5) | | | 20 | | | | 2,000 | |
| | |
Sterling Hill Community Development District, FL, (Capital Improvements), 5.50%,
11/1/10(5) | | | 90 | | | | 57,776 | |
| | |
| | | | | | | $ | 13,124,796 | |
|
| Transportation — 15.2% | |
| | |
Bay Area Toll Authority, CA, (San Francisco Bay Area), 1.85%, (SIFMA + 0.35%), 4/1/20 (Put Date), 4/1/47(1) | | $ | 5,000 | | | $ | 5,002,200 | |
| | |
Bay Area Toll Authority, CA, (San Francisco Bay Area), 2.10%, (SIFMA + 0.60%), 4/1/20 (Put Date), 4/1/34(1) | | | 3,500 | | | | 3,505,880 | |
| | |
Bay Area Toll Authority, CA, (San Francisco Bay Area), 2.508%, (70% of 3 mo. USD LIBOR + 0.55%), 4/1/21 (Put Date),
4/1/45(1) | | | 12,000 | | | | 12,021,360 | |
| | |
Bay Area Toll Authority, CA, Toll Bridge Revenue, (San Francisco Bay Area), 2.60%, (SIFMA + 1.10%), 4/1/24 (Put Date), 4/1/45(1) | | | 3,775 | | | | 3,876,397 | |
| | |
Denver City and County, CO, Airport System Revenue, 2.602%, (70% of 1 mo. USD LIBOR + 0.86%), 11/15/19 (Put Date), 11/15/31(1) | | | 7,645 | | | | 7,651,192 | |
| | |
E-470 Public Highway Authority, CO, 2.086%, (67% of 1 mo. USD LIBOR + 0.42%), 9/1/21 (Put Date), 9/1/39(1) | | | 5,000 | | | | 5,001,500 | |
| | | | | | | | |
| Security | | Principal Amount (000’s omitted) | | | Value | |
|
| Transportation (continued) | |
| | |
Kansas Department of Transportation, 2.068%, (67% of 1 mo. USD LIBOR + 0.40%), 9/1/19(1) | | $ | 7,000 | | | $ | 7,005,880 | |
| | |
Kansas Department of Transportation, 2.092%, (70% of 1 mo. USD LIBOR + 0.35%), 9/1/22(1) | | | 3,000 | | | | 3,000,360 | |
| | |
Metropolitan Transportation Authority, NY, 2.08%, (SIFMA + 0.58%), 6/1/20 (Put Date), 11/15/39(1) | | | 3,030 | | | | 3,028,727 | |
| | |
Metropolitan Transportation Authority, NY, 2.368%, (67% of 1 mo. USD LIBOR + 0.70%), 2/1/20 (Put Date), 11/1/31(1) | | | 1,000 | | | | 1,001,870 | |
| | |
New Jersey Transportation Trust Fund Authority, (Transportation Program), 2.50%, (SIFMA + 1.00%), 12/15/19 (Put Date), 6/15/34(1) | | | 7,000 | | | | 7,006,370 | |
| | |
New Jersey Transportation Trust Fund Authority, (Transportation Program), 2.70%, (SIFMA + 1.20%), 12/15/21 (Put Date), 6/15/34(1) | | | 9,000 | | | | 9,072,000 | |
| | |
New Jersey Transportation Trust Fund Authority, (Transportation System), 5.00%, 6/15/19 | | | 500 | | | | 503,320 | |
| | |
New Jersey Turnpike Authority, 2.203%, (70% of 1 mo. USD LIBOR + 0.46%), 1/1/21 (Put Date), 1/1/28(1) | | | 2,000 | | | | 2,004,040 | |
| | |
New Jersey Turnpike Authority, 2.223%, (70% of 1 mo. USD LIBOR + 0.48%), 1/1/22(1) | | | 7,000 | | | | 7,020,930 | |
| | |
New Jersey Turnpike Authority, 2.342%, (70% of 1 mo. USD LIBOR + 0.60%), 1/1/23(1) | | | 3,000 | | | | 3,020,190 | |
| | |
North Texas Tollway Authority, 2.17%, (SIFMA + 0.67%), 1/1/20 (Put Date), 1/1/38(1) | | | 6,600 | | | | 6,597,096 | |
| | |
Pennsylvania Turnpike Commission, 2.10%, (SIFMA + 0.60%), 12/1/23(1) | | | 1,000 | | | | 997,410 | |
| | |
Pennsylvania Turnpike Commission, 2.20%, (SIFMA + 0.70%), 12/1/23(1) | | | 5,000 | | | | 4,992,850 | |
| | |
Pennsylvania Turnpike Commission, 2.38%, (SIFMA + 0.88%), 12/1/20(1) | | | 685 | | | | 688,617 | |
| | |
Pennsylvania Turnpike Commission, 2.48%, (SIFMA+ 0.98%), 12/1/21(1) | | | 1,850 | | | | 1,868,334 | |
| | |
Pennsylvania Turnpike Commission, 2.77%, (SIFMA + 1.27%), 12/1/20(1) | | | 2,450 | | | | 2,473,912 | |
| | |
Triborough Bridge and Tunnel Authority, NY, 2.108%, (67% of SOFR + 0.50%), 10/1/20 (Put Date), 11/15/38(1) | | | 5,000 | | | | 5,009,650 | |
| | |
Triborough Bridge and Tunnel Authority, NY, 2.368%, (67% of 1 mo. USD LIBOR + 0.70%), 2/1/21 (Put Date), 1/1/32(1) | | | 6,670 | | | | 6,723,026 | |
| | |
| | | | | | | $ | 109,073,111 | |
|
| Water and Sewer — 6.1% | |
| | |
California Department of Water Resources, (Central Valley Project), 1.87%, (SIFMA + 0.37%), 12/1/22 (Put Date), 12/1/35(1) | | $ | 11,000 | | | $ | 11,002,750 | |
| | |
Charleston, SC, Waterworks and Sewer System Revenue, 2.119%, (70% of 1 mo. USD LIBOR + 0.37%), 1/1/22 (Put Date), 1/1/35(1) | | | 5,000 | | | | 5,000,150 | |
| | | | |
| | 10 | | See Notes to Financial Statements. |
Eaton Vance
Floating-Rate Municipal Income Fund
March 31, 2019
Portfolio of Investments — continued
| | | | | | | | |
| Security | | Principal Amount (000’s omitted) | | | Value | |
|
| Water and Sewer (continued) | |
| | |
Houston, TX, Combined Utility System Revenue, 2.107%, (70% of 1 mo. USD LIBOR + 0.36%), 8/1/21 (Put Date), 5/15/34(1) | | $ | 14,000 | | | $ | 13,982,080 | |
| | |
Houston, TX, Combined Utility System Revenue, 2.40%, (SIFMA + 0.90%), 5/1/20 (Put Date), 5/15/34(1) | | | 2,500 | | | | 2,507,175 | |
| | |
New York City Municipal Water Finance Authority, NY, (Water and Sewer System), (SPA: JPMorgan Chase Bank, N.A.), 1.50%, 6/15/50(2) | | | 8,000 | | | | 8,000,000 | |
| | |
Riverside, CA, Water System Revenue, 2.13%, (SIFMA + 0.63%), 1/15/20 (Put Date), 10/1/35(1) | | | 3,285 | | | | 3,287,135 | |
| | |
| | | | | | | $ | 43,779,290 | |
| |
TotalTax-Exempt Municipal Securities — 100.1%
(identified cost $719,878,063) | | | $ | 720,167,278 | |
| |
Other Assets, Less Liabilities — (0.1)% | | | $ | (743,835 | ) |
| |
Net Assets — 100.0% | | | $ | 719,423,443 | |
The percentage shown for each investment category in the Portfolio of Investments is based on net assets.
At March 31, 2019, the concentration of the Fund’s investments in the various states, determined as a percentage of total investments, is as follows:
| | | | |
| |
| California | | | 14.9% | |
| |
| Pennsylvania | | | 13.5% | |
| |
| Others, representing less than 10% individually | | | 71.7% | |
The Fund invests primarily in debt securities issued by municipalities. The ability of the issuers of the debt securities to meet their obligations may be affected by economic developments in a specific industry or municipality. In order to reduce the risk associated with such economic developments, at March 31, 2019, 3.6% of total investments are backed by bond insurance of various financial guaranty assurance agencies. The aggregate percentage insured by an individual financial guaranty assurance agency ranged from 1.7% to 1.9% of total investments.
| (1) | Floating rate security. The stated interest rate represents the rate in effect at March 31, 2019. |
| (2) | Variable rate demand obligation that may be tendered at par on any day for payment the same or next business day. The stated interest rate, which generally resets daily, is determined by the remarketing agent and represents the rate in effect at March 31, 2019. |
| (3) | Security exempt from registration pursuant to Rule 144A under the Securities Act of 1933, as amended. These securities may be sold in certain transactions in reliance on an exemption from registration (normally to qualified institutional buyers). At March 31, 2019, the aggregate value of these securities is $15,836,453 or 2.2% of the Fund’s net assets. |
| (4) | When-issued, floating rate security whose rate will be determined after March 31, 2019. |
| (5) | Defaulted security. Issuer has defaulted on the payment of interest and/or principal. |
Abbreviations:
| | | | |
| | |
| AGM | | – | | Assured Guaranty Municipal Corp. |
| | |
| AMT | | – | | Interest earned from these securities may be considered a tax preference item for purposes of the Federal Alternative Minimum Tax. |
| | |
| FHLMC | | – | | Federal Home Loan Mortgage Corp. |
| | |
| FNMA | | – | | Federal National Mortgage Association |
| | |
| GNMA | | – | | Government National Mortgage Association |
| | |
| LIBOR | | – | | London Interbank Offered Rate |
| | |
| Liq | | – | | Liquidity Provider |
| | |
| LOC | | – | | Letter of Credit |
| | |
| NPFG | | – | | National Public Finance Guarantee Corp. |
| | |
| SFMR | | – | | Single Family Mortgage Revenue |
| | |
| SIFMA | | – | | Securities Industry and Financial Markets Association Municipal Swap Index |
| | |
| SOFR | | – | | Secured Overnight Financing Rate |
| | |
| SPA | | – | | Standby Bond Purchase Agreement |
| | |
| USD | | – | | United States Dollar |
| | | | |
| | 11 | | See Notes to Financial Statements. |
Eaton Vance
Floating-Rate Municipal Income Fund
March 31, 2019
Statement of Assets and Liabilities
| | | | |
| Assets | | March 31, 2019 | |
| |
Investments, at value (identified cost, $719,878,063) | | $ | 720,167,278 | |
| |
Cash | | | 3,699,198 | |
| |
Interest receivable | | | 1,751,165 | |
| |
Receivable for investments sold | | | 4,775,908 | |
| |
Receivable for Fund shares sold | | | 2,283,796 | |
| |
Total assets | | $ | 732,677,345 | |
| |
| Liabilities | | | | |
| |
Payable for when-issued securities | | $ | 7,500,908 | |
| |
Payable for Fund shares redeemed | | | 5,189,285 | |
| |
Distributions payable | | | 108,071 | |
| |
Payable to affiliates: | | | | |
| |
Investment adviser fee | | | 217,424 | |
| |
Distribution and service fees | | | 32,753 | |
| |
Other | | | 69,953 | |
| |
Accrued expenses | | | 135,508 | |
| |
Total liabilities | | $ | 13,253,902 | |
| |
Net Assets | | $ | 719,423,443 | |
|
| Sources of Net Assets | |
| |
Paid-in capital | | $ | 719,722,205 | |
| |
Accumulated loss | | | (298,762 | ) |
| |
Net Assets | | $ | 719,423,443 | |
| |
| Class A Shares | | | | |
| |
Net Assets | | $ | 257,118,052 | |
| |
Shares Outstanding | | | 26,154,163 | |
| |
Net Asset Value and Redemption Price Per Share | | | | |
| |
(net assets ÷ shares of beneficial interest outstanding) | | $ | 9.83 | |
| |
Maximum Offering Price Per Share | | | | |
| |
(100 ÷ 97.75 of net asset value per share) | | $ | 10.06 | |
|
| Class I Shares | |
| |
Net Assets | | $ | 462,305,391 | |
| |
Shares Outstanding | | | 47,003,427 | |
| |
Net Asset Value, Offering Price and Redemption Price Per Share | | | | |
| |
(net assets ÷ shares of beneficial interest outstanding) | | $ | 9.84 | |
On sales of $100,000 or more ($50,000 or more for certain financial intermediaries, as disclosed in an appendix to the Fund’s prospectus), the offering price of Class A shares is reduced.
| | | | |
| | 12 | | See Notes to Financial Statements. |
Eaton Vance
Floating-Rate Municipal Income Fund
March 31, 2019
Statement of Operations
| | | | |
| Investment Income | | Year Ended
March 31, 2019 | |
| |
Interest | | $ | 11,842,361 | |
| |
Total investment income | | $ | 11,842,361 | |
| |
| Expenses | | | | |
| |
Investment adviser fee | | $ | 2,021,216 | |
| |
Distribution and service fees | | | | |
| |
Class A | | | 306,720 | |
| |
Trustees’ fees and expenses | | | 29,754 | |
| |
Custodian fee | | | 143,011 | |
| |
Transfer and dividend disbursing agent fees | | | 91,074 | |
| |
Legal and accounting services | | | 45,522 | |
| |
Printing and postage | | | 21,792 | |
| |
Registration fees | | | 154,929 | |
| |
Miscellaneous | | | 44,916 | |
| |
Total expenses | | $ | 2,858,934 | |
| |
Deduct — | | | | |
| |
Allocation of expenses to affiliates | | $ | 7,968 | |
| |
Total expense reductions | | $ | 7,968 | |
| |
Net expenses | | $ | 2,850,966 | |
| |
Net investment income | | $ | 8,991,395 | |
| |
| Realized and Unrealized Gain (Loss) | | | | |
| |
Net realized gain (loss) — | | | | |
| |
Investment transactions | | $ | (13,613 | ) |
| |
Net realized loss | | $ | (13,613 | ) |
| |
Change in unrealized appreciation (depreciation) — | | | | |
| |
Investments | | $ | (78,435 | ) |
| |
Net change in unrealized appreciation (depreciation) | | $ | (78,435 | ) |
| |
Net realized and unrealized loss | | $ | (92,048 | ) |
| |
Net increase in net assets from operations | | $ | 8,899,347 | |
| | | | |
| | 13 | | See Notes to Financial Statements. |
Eaton Vance
Floating-Rate Municipal Income Fund
March 31, 2019
Statements of Changes in Net Assets
| | | | | | | | |
| | | Year Ended March 31, | |
| Increase (Decrease) in Net Assets | | 2019 | | | 2018 | |
| | |
From operations — | | | | | | | | |
| | |
Net investment income | | $ | 8,991,395 | | | $ | 3,090,653 | |
| | |
Net realized gain (loss) | | | (13,613 | ) | | | 14,259 | |
| | |
Net change in unrealized appreciation (depreciation) | | | (78,435 | ) | | | 901,612 | |
| | |
Net increase in net assets from operations | | $ | 8,899,347 | | | $ | 4,006,524 | |
| | |
Distributions to shareholders(1) — | | | | | | | | |
| | |
Class A | | $ | (3,054,326 | ) | | $ | (1,261,123 | ) |
| | |
Class I | | | (5,931,059 | ) | | | (1,799,827 | ) |
| | |
Total distributions to shareholders | | $ | (8,985,385 | ) | | $ | (3,060,950 | ) |
| | |
Transactions in shares of beneficial interest — | | | | | | | | |
| | |
Proceeds from sale of shares | | | | | | | | |
| | |
Class A | | $ | 172,086,367 | | | $ | 114,618,373 | |
| | |
Class I | | | 397,937,660 | | | | 192,156,345 | |
| | |
Net asset value of shares issued to shareholders in payment of distributions declared | | | | | | | | |
| | |
Class A | | | 2,867,329 | | | | 1,113,527 | |
| | |
Class I | | | 5,289,081 | | | | 1,650,689 | |
| | |
Cost of shares redeemed | | | | | | | | |
| | |
Class A | | | (78,336,104 | ) | | | (95,073,437 | ) |
| | |
Class I | | | (183,790,295 | ) | | | (90,673,508 | ) |
| | |
Net increase in net assets from Fund share transactions | | $ | 316,054,038 | | | $ | 123,791,989 | |
| | |
Net increase in net assets | | $ | 315,968,000 | | | $ | 124,737,563 | |
| | |
| Net Assets | | | | | | | | |
| | |
At beginning of year | | $ | 403,455,443 | | | $ | 278,717,880 | |
| | |
At end of year | | $ | 719,423,443 | | | $ | 403,455,443 | (2) |
| (1) | For the year ended March 31, 2018, the source of distributions was from net investment income. The current year presentation of distributions conforms with the Disclosure Update and Simplification Rule issued by the Securities and Exchange commission, effective November 5, 2018. |
| (2) | Includes accumulated distributions in excess of net investment income of $(38,364) at March 31, 2018. The requirement to disclose the corresponding amount as of March 31, 2019 was eliminated. |
| | | | |
| | 14 | | See Notes to Financial Statements. |
Eaton Vance
Floating-Rate Municipal Income Fund
March 31, 2019
Financial Highlights
| | | | | | | | | | | | | | | | | | | | |
| | | Class A | |
| |
| | | Year Ended March 31, | |
| | | 2019 | | | 2018 | | | 2017 | | | 2016 | | | 2015 | |
| | | | | |
Net asset value — Beginning of year | | $ | 9.830 | | | $ | 9.800 | | | $ | 9.800 | | | $ | 9.900 | | | $ | 9.900 | |
| | | | | |
| Income (Loss) From Operations | | | | | | | | | | | | | | | | | | | | |
| | | | | |
Net investment income(1) | | $ | 0.147 | | | $ | 0.090 | | | $ | 0.064 | | | $ | 0.053 | | | $ | 0.039 | |
| | | | | |
Net realized and unrealized gain (loss) | | | (0.001 | ) | | | 0.029 | | | | 0.005 | | | | (0.099 | ) | | | 0.022 | |
| | | | | |
Total income (loss) from operations | | $ | 0.146 | | | $ | 0.119 | | | $ | 0.069 | | | $ | (0.046 | ) | | $ | 0.061 | |
| | | | | |
| Less Distributions | | | | | | | | | | | | | | | | | | | | |
| | | | | |
From net investment income | | $ | (0.146 | ) | | $ | (0.089 | ) | | $ | (0.069 | ) | | $ | (0.053 | ) | | $ | (0.041 | ) |
| | | | | |
From net realized gain | | | — | | | | — | | | | — | | | | (0.001 | ) | | | (0.020 | ) |
| | | | | |
Total distributions | | $ | (0.146 | ) | | $ | (0.089 | ) | | $ | (0.069 | ) | | $ | (0.054 | ) | | $ | (0.061 | ) |
| | | | | |
Net asset value — End of year | | $ | 9.830 | | | $ | 9.830 | | | $ | 9.800 | | | $ | 9.800 | | | $ | 9.900 | |
| | | | | |
Total Return(2) | | | 1.49 | %(3) | | | 1.22 | % | | | 0.71 | % | | | (0.46 | )% | | | 0.62 | %(3) |
| | | | | |
| Ratios/Supplemental Data | | | | | | | | | | | | | | | | | | | | |
| | | | | |
Net assets, end of year (000’s omitted) | | $ | 257,118 | | | $ | 160,528 | | | $ | 139,418 | | | $ | 129,593 | | | $ | 141,537 | |
| | | | | |
Ratios (as a percentage of average daily net assets): | | | | | | | | | | | | | | | | | | | | |
| | | | | |
Expenses(4) | | | 0.60 | %(3) | | | 0.60 | % | | | 0.63 | % | | | 0.61 | % | | | 0.65 | %(3) |
| | | | | |
Net investment income | | | 1.49 | % | | | 0.92 | % | | | 0.65 | % | | | 0.54 | % | | | 0.40 | % |
| | | | | |
Portfolio Turnover | | | 43 | % | | | 78 | % | | | 71 | % | | | 7 | % | | | 103 | % |
| (1) | Computed using average shares outstanding. |
| (2) | Returns are historical and are calculated by determining the percentage change in net asset value with all distributions reinvested and do not reflect the effect of sales charges. |
| (3) | The investment adviser and administrator reimbursed certain operating expenses (equal to less than 0.005% and 0.01% of average daily net assets for the years ended March 31, 2019 and 2015, respectively). Absent this reimbursement, total return would be lower. |
| (4) | Excludes the effect of custody fee credits, if any, of less than 0.005%. Effective September 1, 2015, custody fee credits, which were earned on cash deposit balances, were discontinued by the custodian. |
| | | | |
| | 15 | | See Notes to Financial Statements. |
Eaton Vance
Floating-Rate Municipal Income Fund
March 31, 2019
Financial Highlights — continued
| | | | | | | | | | | | | | | | | | | | |
| | | Class I | |
| |
| | | Year Ended March 31, | |
| | | 2019 | | | 2018 | | | 2017 | | | 2016 | | | 2015 | |
| | | | | |
Net asset value — Beginning of year | | $ | 9.830 | | | $ | 9.800 | | | $ | 9.800 | | | $ | 9.910 | | | $ | 9.910 | |
| | | | | |
| Income (Loss) From Operations | | | | | | | | | | | | | | | | | | | | |
| | | | | |
Net investment income(1) | | $ | 0.162 | | | $ | 0.106 | | | $ | 0.075 | | | $ | 0.067 | | | $ | 0.052 | |
| | | | | |
Net realized and unrealized gain (loss) | | | 0.008 | | | | 0.028 | | | | 0.009 | | | | (0.108 | ) | | | 0.024 | |
| | | | | |
Total income (loss) from operations | | $ | 0.170 | | | $ | 0.134 | | | $ | 0.084 | | | $ | (0.041 | ) | | $ | 0.076 | |
| | | | | |
| Less Distributions | | | | | | | | | | | | | | | | | | | | |
| | | | | |
From net investment income | | $ | (0.160 | ) | | $ | (0.104 | ) | | $ | (0.084 | ) | | $ | (0.068 | ) | | $ | (0.056 | ) |
| | | | | |
From net realized gain | | | — | | | | — | | | | — | | | | (0.001 | ) | | | (0.020 | ) |
| | | | | |
Total distributions | | $ | (0.160 | ) | | $ | (0.104 | ) | | $ | (0.084 | ) | | $ | (0.069 | ) | | $ | (0.076 | ) |
| | | | | |
Net asset value — End of year | | $ | 9.840 | | | $ | 9.830 | | | $ | 9.800 | | | $ | 9.800 | | | $ | 9.910 | |
| | | | | |
Total Return(2) | | | 1.75 | %(3) | | | 1.37 | % | | | 0.86 | % | | | (0.41 | )% | | | 0.77 | %(3) |
| | | | | |
| Ratios/Supplemental Data | | | | | | | | | | | | | | | | | | | | |
| | | | | |
Net assets, end of year (000’s omitted) | | $ | 462,305 | | | $ | 242,928 | | | $ | 139,300 | | | $ | 29,849 | | | $ | 34,258 | |
| | | | | |
Ratios (as a percentage of average daily net assets): | | | | | | | | | | | | | | | | | | | | |
| | | | | |
Expenses(4) | | | 0.45 | %(3) | | | 0.45 | % | | | 0.48 | % | | | 0.46 | % | | | 0.50 | %(3) |
| | | | | |
Net investment income | | | 1.65 | % | | | 1.08 | % | | | 0.77 | % | | | 0.69 | % | | | 0.53 | % |
| | | | | |
Portfolio Turnover | | | 43 | % | | | 78 | % | | | 71 | % | | | 7 | % | | | 103 | % |
| (1) | Computed using average shares outstanding. |
| (2) | Returns are historical and are calculated by determining the percentage change in net asset value with all distributions reinvested. |
| (3) | The investment adviser and administrator reimbursed certain operating expenses (equal to less than 0.005% and 0.01% of average daily net assets for the years ended March 31, 2019 and 2015, respectively). Absent this reimbursement, total return would be lower. |
| (4) | Excludes the effect of custody fee credits, if any, of less than 0.005%. Effective September 1, 2015, custody fee credits, which were earned on cash deposit balances, were discontinued by the custodian. |
| | | | |
| | 16 | | See Notes to Financial Statements. |
Eaton Vance
Floating-Rate Municipal Income Fund
March 31, 2019
Notes to Financial Statements
1 Significant Accounting Policies
Eaton Vance Floating-Rate Municipal Income Fund (the Fund) is a diversified series of Eaton Vance Investment Trust (the Trust). The Trust is a Massachusetts business trust registered under the Investment Company Act of 1940, as amended (the 1940 Act), as anopen-end management investment company. The Fund’s investment objective is to provide current income exempt from regular federal income tax. The Fund offers two classes of shares. Class A shares are generally sold subject to a sales charge imposed at time of purchase. Class I shares are sold at net asset value and are not subject to a sales charge. Each class represents apro-rata interest in the Fund, but votes separately on class-specific matters and (as noted below) is subject to different expenses. Realized and unrealized gains and losses are allocated daily to each class of shares based on the relative net assets of each class to the total net assets of the Fund. Net investment income, other than class-specific expenses, is allocated daily to each class of shares based upon the ratio of the value of each class’s paid shares to the total value of all paid shares. Each class of shares differs in its distribution plan and certain other class-specific expenses.
The following is a summary of significant accounting policies of the Fund. The policies are in conformity with accounting principles generally accepted in the United States of America (U.S. GAAP). The Fund is an investment company and follows accounting and reporting guidance in the Financial Accounting Standards Board (FASB) Accounting Standards Codification Topic 946.
A Investment Valuation — The following methodologies are used to determine the market value or fair value of investments.
Debt Obligations. Debt obligations are generally valued on the basis of valuations provided by third party pricing services, as derived from such services’ pricing models. Inputs to the models may include, but are not limited to, reported trades, executable bid and ask prices, broker/dealer quotations, prices or yields of securities with similar characteristics, interest rates, anticipated prepayments, benchmark curves or information pertaining to the issuer, as well as industry and economic events. The pricing services may use a matrix approach, which considers information regarding securities with similar characteristics to determine the valuation for a security. Short-term debt obligations purchased with a remaining maturity of sixty days or less for which a valuation from a third party pricing service is not readily available may be valued at amortized cost, which approximates fair value.
Fair Valuation. Investments for which valuations or market quotations are not readily available or are deemed unreliable are valued at fair value using methods determined in good faith by or at the direction of the Trustees of the Fund in a manner that fairly reflects the security’s value, or the amount that the Fund might reasonably expect to receive for the security upon its current sale in the ordinary course. Each such determination is based on a consideration of relevant factors, which are likely to vary from one pricing context to another. These factors may include, but are not limited to, the type of security, the existence of any contractual restrictions on the security’s disposition, the price and extent of public trading in similar securities of the issuer or of comparable entities, quotations or relevant information obtained from broker/dealers or other market participants, information obtained from the issuer, analysts, and/or the appropriate stock exchange (for exchange-traded securities), an analysis of the entity’s financial condition, and an evaluation of the forces that influence the issuer and the market(s) in which the security is purchased and sold.
B Investment Transactions and Related Income — Investment transactions for financial statement purposes are accounted for on a trade date basis. Realized gains and losses on investments sold are determined on the basis of identified cost. Interest income is recorded on the basis of interest accrued, adjusted for amortization of premium or accretion of discount.
C Federal Taxes — The Fund��s policy is to comply with the provisions of the Internal Revenue Code applicable to regulated investment companies and to distribute to shareholders each year substantially all of its taxable, if any, andtax-exempt net investment income, and all or substantially all of its net realized capital gains. Accordingly, no provision for federal income or excise tax is necessary. The Fund intends to satisfy conditions which will enable it to designate distributions from the interest and dividend income generated by its investments innon-taxable municipal securities, which are exempt from regular federal income tax when received by the Fund, as exempt-interest dividends.
As of March 31, 2019, the Fund had no uncertain tax positions that would require financial statement recognition,de-recognition, or disclosure. The Fund files a U.S. federal income tax return annually after its fiscalyear-end, which is subject to examination by the Internal Revenue Service for a period of three years from the date of filing.
D Expenses — The majority of expenses of the Trust are directly identifiable to an individual fund. Expenses which are not readily identifiable to a specific fund are allocated taking into consideration, among other things, the nature and type of expense and the relative size of the funds.
E Legal Fees — Legal fees and other related expenses incurred as part of negotiations of the terms and requirement of capital infusions, or that are expected to result in the restructuring of, or a plan of reorganization for, an investment are recorded as realized losses. Ongoing expenditures to protect or enhance an investment are treated as operating expenses.
F Use of Estimates — The preparation of the financial statements in conformity with U.S. GAAP requires management to make estimates and assumptions that affect the reported amounts of assets and liabilities at the date of the financial statements and the reported amounts of income and expense during the reporting period. Actual results could differ from those estimates.
G Indemnifications — Under the Trust’s organizational documents, its officers and Trustees may be indemnified against certain liabilities and expenses arising out of the performance of their duties to the Fund. Under Massachusetts law, if certain conditions prevail, shareholders of a Massachusetts business trust (such as the Trust) could be deemed to have personal liability for the obligations of the Trust. However, the Trust’s Declaration of Trust contains an
Eaton Vance
Floating-Rate Municipal Income Fund
March 31, 2019
Notes to Financial Statements — continued
express disclaimer of liability on the part of Fund shareholders and theBy-laws provide that the Trust shall assume the defense on behalf of any Fund shareholders. Moreover, theBy-laws also provide for indemnification out of Fund property of any shareholder held personally liable solely by reason of being or having been a shareholder for all loss or expense arising from such liability. Additionally, in the normal course of business, the Fund enters into agreements with service providers that may contain indemnification clauses. The Fund’s maximum exposure under these arrangements is unknown as this would involve future claims that may be made against the Fund that have not yet occurred.
H When-Issued Securities and Delayed Delivery Transactions — The Fund may purchase or sell securities on a delayed delivery or when-issued basis. Payment and delivery may take place after the customary settlement period for that security. At the time the transaction is negotiated, the price of the security that will be delivered is fixed. The Fund maintains cash and/or security positions for these commitments such that sufficient liquid assets will be available to make payments upon settlement. Securities purchased on a delayed delivery or when-issued basis aremarked-to-market daily and begin earning interest on settlement date. Losses may arise due to changes in the market value of the underlying securities or if the counterparty does not perform under the contract.
2 Distributions to Shareholders and Income Tax Information
The net investment income of the Fund is determined daily and substantially all of the net investment income so determined is declared as a dividend to shareholders of record at the time of declaration. Distributions are declared separately for each class of shares. Distributions are paid monthly. Distributions of realized capital gains are made at least annually. Shareholders may reinvest income and capital gain distributions in additional shares of the same class of the Fund at the net asset value as of the reinvestment date or, at the election of the shareholder, receive distributions in cash. Distributions to shareholders are determined in accordance with income tax regulations, which may differ from U.S. GAAP. As required by U.S. GAAP, only distributions in excess of tax basis earnings and profits are reported in the financial statements as a return of capital. Permanent differences between book and tax accounting relating to distributions are reclassified topaid-in capital. For tax purposes, distributions from short-term capital gains are considered to be from ordinary income.
The tax character of distributions declared for the years ended March 31, 2019 and March 31, 2018 was as follows:
| | | | | | | | |
| | | Year Ended March 31, | |
| | | 2019 | | | 2018 | |
| | |
Tax-exempt income | | $ | 8,980,835 | | | $ | 3,060,950 | |
| | |
Ordinary income | | $ | 4,550 | | | $ | — | |
As of March 31, 2019, the components of distributable earnings (accumulated loss) on a tax basis were as follows:
| | | | |
| | |
Undistributedtax-exempt income | | $ | 38,976 | |
| |
Deferred capital losses | | $ | (576,786 | ) |
| |
Net unrealized appreciation | | $ | 347,119 | |
| |
Distributions payable | | $ | (108,071 | ) |
At March 31, 2019, the Fund, for federal income tax purposes, had deferred capital losses of $576,786 which would reduce its taxable income arising from future net realized gains on investment transactions, if any, to the extent permitted by the Internal Revenue Code, and thus would reduce the amount of distributions to shareholders, which would otherwise be necessary to relieve the Fund of any liability for federal income or excise tax. The deferred capital losses are treated as arising on the first day of the Fund’s next taxable year and retain the same short-term or long-term character as when originally deferred. Of the deferred capital losses at March 31, 2019, $36,227 are short-term and $540,559 are long-term.
The cost and unrealized appreciation (depreciation) of investments of the Fund at March 31, 2019, as determined on a federal income tax basis, were as follows:
| | | | |
| |
Aggregate cost | | $ | 719,820,159 | |
| |
Gross unrealized appreciation | | $ | 950,227 | |
| |
Gross unrealized depreciation | | | (603,108 | ) |
| |
Net unrealized appreciation | | $ | 347,119 | |
Eaton Vance
Floating-Rate Municipal Income Fund
March 31, 2019
Notes to Financial Statements — continued
3 Investment Adviser Fee and Other Transactions with Affiliates
The investment adviser fee is earned by Boston Management and Research (BMR), a subsidiary of Eaton Vance Management (EVM), as compensation for management and investment advisory services rendered to the Fund. The fee is based upon a percentage of average daily net assets plus a percentage of gross income (i.e., income other than gains from the sale of securities) and is payable monthly. The annual asset rate and daily income rate are 0.30% and 3.00%, respectively, on average daily net assets of up to $500 million, 0.275% and 2.75%, respectively, on average daily net assets of $500 million but less than $1 billion and at reduced rates on daily net assets of $1 billion or more. For the year ended March 31, 2019, the investment adviser fee amounted to $2,021,216 or 0.36% of the Fund’s average daily net assets. EVM and BMR have agreed to reimburse the Fund’s expenses to the extent that total annual operating expenses (relating to ordinary operating expenses only) exceed 0.60% and 0.45% of the Fund’s average daily net assets for Class A and Class I, respectively. This agreement may be changed or terminated after July 31, 2019. Pursuant to this agreement, EVM and BMR were allocated $7,968 in total of the Fund’s operating expenses for the year ended March 31, 2019.
EVM serves as the administrator of the Fund, but receives no compensation. EVM providessub-transfer agency and related services to the Fund pursuant to aSub-Transfer Agency Support Services Agreement. For the year ended March 31, 2019, EVM earned $2,637 from the Fund pursuant to such agreement, which is included in transfer and dividend disbursing agent fees on the Statement of Operations. The Fund was informed that Eaton Vance Distributors, Inc. (EVD), an affiliate of EVM and the Fund’s principal underwriter, received $3,605 as its portion of the sales charge on sales of Class A shares for the year ended March 31, 2019. EVD also received distribution and service fees from Class A shares (see Note 4).
Trustees and officers of the Fund who are members of EVM’s or BMR’s organizations receive remuneration for their services to the Fund out of the investment adviser fee. Trustees of the Fund who are not affiliated with the investment adviser may elect to defer receipt of all or a percentage of their annual fees in accordance with the terms of the Trustees Deferred Compensation Plan. For the year ended March 31, 2019, no significant amounts have been deferred. Certain officers and Trustees of the Fund are officers of the above organizations.
4 Distribution Plan
The Fund has in effect a distribution plan for Class A shares (Class A Plan) pursuant to Rule12b-1 under the 1940 Act. Pursuant to the Class A Plan, the Fund pays EVD a distribution and service fee not exceeding 0.25% per annum of its average daily net assets attributable to Class A shares for distribution services and facilities provided to the Fund by EVD, as well as for personal services and/or the maintenance of shareholder accounts. The Trustees approved distribution and service fee payments equal to 0.15% per annum of the Fund’s average daily net assets attributable to Class A shares. Distribution and service fees paid or accrued to EVD for the year ended March 31, 2019 amounted to $306,720 for Class A shares.
Distribution and service fees are subject to the limitations contained in the Financial Industry Regulatory Authority Rule 2341(d).
5 Purchases and Sales of Investments
Purchases and sales of investments, other than short-term obligations, aggregated $567,400,195 and $240,267,038, respectively, for the year ended March 31, 2019.
6 Shares of Beneficial Interest
The Fund’s Declaration of Trust permits the Trustees to issue an unlimited number of full and fractional shares of beneficial interest (without par value). Such shares may be issued in a number of different series (such as the Fund) and classes. Transactions in Fund shares were as follows:
| | | | | | | | |
| | | Year Ended March 31, | |
| Class A | | 2019 | | | 2018 | |
| | |
Sales | | | 17,496,212 | | | | 11,671,936 | |
| | |
Issued to shareholders electing to receive payments of distributions in Fund shares | | | 291,574 | | | | 113,373 | |
| | |
Redemptions | | | (7,964,003 | ) | | | (9,686,675 | ) |
| | |
Net increase | | | 9,823,783 | | | | 2,098,634 | |
Eaton Vance
Floating-Rate Municipal Income Fund
March 31, 2019
Notes to Financial Statements — continued
| | | | | | | | |
| | | Year Ended March 31, | |
| Class I | | 2019 | | | 2018 | |
| | |
Sales | | | 40,442,178 | | | | 19,549,731 | |
| | |
Issued to shareholders electing to receive payments of distributions in Fund shares | | | 537,451 | | | | 168,018 | |
| | |
Redemptions | | | (18,677,109 | ) | | | (9,230,968 | ) |
| | |
Net increase | | | 22,302,520 | | | | 10,486,781 | |
7 Line of Credit
The Fund participates with other portfolios and funds managed by EVM and its affiliates in a $625 million unsecured line of credit agreement with a group of banks, which is in effect through October 29, 2019. Borrowings are made by the Fund solely to facilitate the handling of unusual and/or unanticipated short-term cash requirements. Interest is charged to the Fund based on its borrowings at an amount above either the Eurodollar rate or Federal Funds rate. In addition, a fee computed at an annual rate of 0.15% on the daily unused portion of the line of credit is allocated among the participating portfolios and funds at the end of each quarter. Because the line of credit is not available exclusively to the Fund, it may be unable to borrow some or all of its requested amounts at any particular time. The Fund did not have any significant borrowings or allocated fees during the year ended March 31, 2019.
8 Fair Value Measurements
Under generally accepted accounting principles for fair value measurements, a three-tier hierarchy to prioritize the assumptions, referred to as inputs, is used in valuation techniques to measure fair value. The three-tier hierarchy of inputs is summarized in the three broad levels listed below.
| • | | Level 1 – quoted prices in active markets for identical investments |
| • | | Level 2 – other significant observable inputs (including quoted prices for similar investments, interest rates, prepayment speeds, credit risk, etc.) |
| • | | Level 3 – significant unobservable inputs (including a fund’s own assumptions in determining the fair value of investments) |
In cases where the inputs used to measure fair value fall in different levels of the fair value hierarchy, the level disclosed is determined based on the lowest level input that is significant to the fair value measurement in its entirety. The inputs or methodology used for valuing securities are not necessarily an indication of the risk associated with investing in those securities.
At March 31, 2019, the hierarchy of inputs used in valuing the Fund’s investments, which are carried at value, were as follows:
| | | | | | | | | | | | | | | | |
| Asset Description | | Level 1 | | | Level 2 | | | Level 3 | | | Total | |
| | | | |
Tax-Exempt Municipal Securities | | $ | — | | | $ | 720,167,278 | | | $ | — | | | $ | 720,167,278 | |
| | | | |
Total Investments | | $ | — | | | $ | 720,167,278 | | | $ | — | | | $ | 720,167,278 | |
Eaton Vance
Floating-Rate Municipal Income Fund
March 31, 2019
Report of Independent Registered Public Accounting Firm
To the Trustees of Eaton Vance Investment Trust and Shareholders of Eaton Vance Floating-Rate Municipal Income Fund:
Opinion on the Financial Statements and Financial Highlights
We have audited the accompanying statement of assets and liabilities of Eaton Vance Floating-Rate Municipal Income Fund (the “Fund”) (one of the funds constituting Eaton Vance Investment Trust), including the portfolio of investments, as of March 31, 2019, the related statement of operations for the year then ended, the statements of changes in net assets for each of the two years in the period then ended, the financial highlights for each of the five years in the period then ended, and the related notes. In our opinion, the financial statements and financial highlights present fairly, in all material respects, the financial position of the Fund as of March 31, 2019, and the results of its operations for the year then ended, the changes in its net assets for each of the two years in the period then ended, and the financial highlights for each of the five years in the period then ended, in conformity with accounting principles generally accepted in the United States of America.
Basis for Opinion
These financial statements and financial highlights are the responsibility of the Fund’s management. Our responsibility is to express an opinion on the Fund’s financial statements and financial highlights based on our audits. We are a public accounting firm registered with the Public Company Accounting Oversight Board (United States) (PCAOB) and are required to be independent with respect to the Fund in accordance with the U.S. federal securities laws and the applicable rules and regulations of the Securities and Exchange Commission and the PCAOB.
We conducted our audits in accordance with the standards of the PCAOB. Those standards require that we plan and perform the audit to obtain reasonable assurance about whether the financial statements and financial highlights are free of material misstatement, whether due to error or fraud. The Fund is not required to have, nor were we engaged to perform, an audit of its internal control over financial reporting. As part of our audits we are required to obtain an understanding of internal control over financial reporting but not for the purpose of expressing an opinion on the effectiveness of the Fund’s internal control over financial reporting. Accordingly, we express no such opinion.
Our audits included performing procedures to assess the risks of material misstatement of the financial statements and financial highlights, whether due to error or fraud, and performing procedures that respond to those risks. Such procedures included examining, on a test basis, evidence regarding the amounts and disclosures in the financial statements and financial highlights. Our audits also included evaluating the accounting principles used and significant estimates made by management, as well as evaluating the overall presentation of the financial statements and financial highlights. Our procedures included confirmation of securities owned as of March 31, 2019, by correspondence with the custodian and brokers; when replies were not received from brokers, we performed other auditing procedures. We believe that our audits provide a reasonable basis for our opinion.
/s/ Deloitte & Touche LLP
Boston, Massachusetts
May 17, 2019
We have served as the auditor of one or more Eaton Vance investment companies since 1959.
Eaton Vance
Floating-Rate Municipal Income Fund
March 31, 2019
Federal Tax Information (Unaudited)
The Form1099-DIV you receive in February 2020 will show the tax status of all distributions paid to your account in calendar year 2019. Shareholders are advised to consult their own tax adviser with respect to the tax consequences of their investment in the Fund. As required by the Internal Revenue Code and/or regulations, shareholders must be notified regarding exempt-interest dividends.
Exempt-Interest Dividends. For the fiscal year ended March 31, 2019, the Fund designates 99.95% of distributions from net investment income as an exempt-interest dividend.
Eaton Vance
Floating-Rate Municipal Income Fund
March 31, 2019
Management and Organization
Fund Management. The Trustees of Eaton Vance Investment Trust (the Trust) are responsible for the overall management and supervision of the Trust’s affairs. The Trustees and officers of the Trust are listed below. Except as indicated, each individual has held the office shown or other offices in the same company for the last five years. Trustees and officers of the Trust hold indefinite terms of office. The “noninterested Trustees” consist of those Trustees who are not “interested persons” of the Trust, as that term is defined under the 1940 Act. The business address of each Trustee and officer is Two International Place, Boston, Massachusetts 02110. As used below, “EVC” refers to Eaton Vance Corp., “EV” refers to Eaton Vance, Inc., “EVM” refers to Eaton Vance Management, “BMR” refers to Boston Management and Research and “EVD” refers to Eaton Vance Distributors, Inc. EVC and EV are the corporate parent and trustee, respectively, of EVM and BMR. EVD is a wholly-owned subsidiary of EVC. Each officer affiliated with Eaton Vance may hold a position with other Eaton Vance affiliates that is comparable to his or her position with EVM listed below. Each Trustee oversees 172 portfolios in the Eaton Vance Complex (including all master and feeder funds in a master feeder structure). Each officer serves as an officer of certain other Eaton Vance funds. Each Trustee and officer serves until his or her successor is elected.
| | | | | | |
| Name and Year of Birth | | Position(s)
with the
Trust | | Trustee
Since(1) | | Principal Occupation(s) and Directorships
During Past Five Years and Other Relevant Experience |
|
| Interested Trustee |
| | | |
Thomas E. Faust Jr. 1958 | | Trustee | | 2007 | | Chairman, Chief Executive Officer and President of EVC, Director and President of EV, Chief Executive Officer and President of EVM and BMR, and Director of EVD. Trustee and/or officer of 172 registered investment companies. Mr. Faust is an interested person because of his positions with EVM, BMR, EVD, EVC and EV, which are affiliates of the Trust. Directorships in the Last Five Years.(2)Director of EVC and Hexavest Inc. (investment management firm). |
|
| Noninterested Trustees |
| | | |
Mark R. Fetting 1954 | | Trustee | | 2016 | | Private investor. Formerly held various positions at Legg Mason, Inc. (investment management firm) (2000-2012), including President, Chief Executive Officer, Director and Chairman (2008-2012), Senior Executive Vice President (2004-2008) and Executive Vice President (2001-2004). Formerly, President of Legg Mason family of funds (2001-2008). Formerly, Division President and Senior Officer of Prudential Financial Group, Inc. and related companies (investment management firm)(1991-2000). Directorships in the Last Five Years. None. |
| | | |
Cynthia E. Frost 1961 | | Trustee | | 2014 | | Private investor. Formerly, Chief Investment Officer of Brown University (university endowment) (2000-2012). Formerly, Portfolio Strategist for Duke Management Company (university endowment manager) (1995-2000). Formerly, Managing Director, Cambridge Associates (investment consulting company) (1989-1995). Formerly, Consultant, Bain and Company (management consulting firm) (1987-1989). Formerly, Senior Equity Analyst, BA Investment Management Company (1983-1985). Directorships in the Last Five Years.None. |
| | | |
George J. Gorman 1952 | | Trustee | | 2014 | | Principal at George J. Gorman LLC (consulting firm). Formerly, Senior Partner at Ernst & Young LLP (a registered public accounting firm) (1974-2009). Directorships in the Last Five Years.Formerly, Trustee of the BofA Funds Series Trust (11 funds) (2011-2014) and of the Ashmore Funds (9 funds) (2010-2014). |
| | | |
Valerie A. Mosley 1960 | | Trustee | | 2014 | | Chairwoman and Chief Executive Officer of Valmo Ventures (a consulting and investment firm). Former Partner and Senior Vice President, Portfolio Manager and Investment Strategist at Wellington Management Company, LLP (investment management firm) (1992-2012). Former Chief Investment Officer, PG Corbin Asset Management (1990-1992). Formerly worked in institutional corporate bond sales at Kidder Peabody (1986-1990). Directorships in the Last Five Years.(2)Director of Envestnet, Inc. (provider of intelligent systems for wealth management and financial wellness) (since 2018). Director of Dynex Capital, Inc. (mortgage REIT) (since 2013). |
Eaton Vance
Floating-Rate Municipal Income Fund
March 31, 2019
Management and Organization — continued
| | | | | | |
| Name and Year of Birth | | Position(s)
with the
Trust | | Trustee
Since(1) | | Principal Occupation(s) and Directorships
During Past Five Years and Other Relevant Experience |
|
| Noninterested Trustees (continued) |
| | | |
William H. Park 1947 | | Chairperson of the Board and Trustee | | 2016 (Chairperson) 2003 (Trustee) | | Private investor. Formerly, Consultant (management and transactional) (2012-2014). Formerly, Chief Financial Officer, Aveon Group L.P. (investment management firm) (2010-2011). Formerly, Vice Chairman, Commercial Industrial Finance Corp. (specialty finance company) (2006-2010). Formerly, President and Chief Executive Officer, Prizm Capital Management, LLC (investment management firm) (2002-2005). Formerly, Executive Vice President and Chief Financial Officer, United Asset Management Corporation (investment management firm) (1982-2001). Formerly, Senior Manager, Price Waterhouse (now PricewaterhouseCoopers) (a registered public accounting firm) (1972-1981). Directorships in the Last Five Years.(2)None. |
| | | |
Helen Frame Peters 1948 | | Trustee | | 2008 | | Professor of Finance, Carroll School of Management, Boston College. Formerly, Dean, Carroll School of Management, Boston College (2000-2002). Formerly, Chief Investment Officer, Fixed Income, Scudder Kemper Investments (investment management firm) (1998-1999). Formerly, Chief Investment Officer, Equity and Fixed Income, Colonial Management Associates (investment management firm)(1991-1998). Directorships in the Last Five Years.(2)None. |
| | | |
Keith Quinton(3) 1958 | | Trustee | | 2018 | | Independent Investment Committee Member at New Hampshire Retirement System (since 2017). Advisory Committee member at Northfield Information Services, Inc. (risk management analytics provider) (since 2016). Formerly, Portfolio Manager and Senior Quantitative Analyst at Fidelity Investments (investment management firm)(2001-2014). Directorships in the Last Five Years. Director of New Hampshire Municipal Bond Bank (since 2016). |
| | | |
Marcus L. Smith(3) 1966 | | Trustee | | 2018 | | Member of Posse Boston Advisory Board (foundation) (since 2015); Trustee at University of Mount Union (since 2008). Formerly, Portfolio Manager at MFS Investment Management (investment management firm) (1994-2017). Directorships in the Last Five Years. Director of MSCI Inc. (global provider of investment decision support tools) (since 2017). Formerly, Director of DCT Industrial Trust Inc. (logistics real estate company) (2017-2018). |
| | | |
Susan J. Sutherland 1957 | | Trustee | | 2015 | | Private investor. Formerly, Associate, Counsel and Partner at Skadden, Arps, Slate, Meagher & Flom LLP (law firm) (1982-2013). Directorships in the Last Five Years. Formerly, Director of Montpelier Re Holdings Ltd. (global provider of customized insurance and reinsurance products)(2013-2015). |
| | | |
Scott E. Wennerholm 1959 | | Trustee | | 2016 | | Formerly, Trustee at Wheelock College (postsecondary institution) (2012-2018). Formerly, Consultant at GF Parish Group (executive recruiting firm) (2016-2017). Formerly, Chief Operating Officer and Executive Vice President at BNY Mellon Asset Management (investment management firm) (2005-2011). Formerly, Chief Operating Officer and Chief Financial Officer at Natixis Global Asset Management (investment management firm) (1997-2004). Formerly, Vice President at Fidelity Investments Institutional Services (investment management firm) (1994-1997). Directorships in the Last Five Years. None. |
| | | | | | |
| Name and Year of Birth | | Position(s)
with the
Trust | | Officer
Since(4) | | Principal Occupation(s)
During Past Five Years |
|
| Principal Officers who are not Trustees |
| | | |
Payson F. Swaffield 1956 | | President | | 2003 | | Vice President and Chief Income Investment Officer of EVM and BMR. Also Vice President of Calvert Research and Management (“CRM”). |
| | | |
Maureen A. Gemma 1960 | | Vice President, Secretary and Chief Legal Officer | | 2005 | | Vice President of EVM and BMR. Also Vice President of CRM. |
| | | |
James F. Kirchner 1967 | | Treasurer | | 2007 | | Vice President of EVM and BMR. Also Vice President of CRM. |
Eaton Vance
Floating-Rate Municipal Income Fund
March 31, 2019
Management and Organization — continued
| | | | | | |
| Name and Year of Birth | | Position(s)
with the
Trust | | Officer
Since(4) | | Principal Occupation(s)
During Past Five Years |
|
| Principal Officers who are not Trustees (continued) |
| | | |
Richard F. Froio 1968 | | Chief Compliance Officer | | 2017 | | Vice President of EVM and BMR since 2017. Formerly Deputy Chief Compliance Officer (Adviser/Funds) and Chief Compliance Officer (Distribution) at PIMCO (2012-2017) and Managing Director at BlackRock/Barclays Global Investors (2009-2012). |
| (1) | Year first appointed to serve as Trustee for a fund in the Eaton Vance family of funds. Each Trustee has served continuously since appointment unless indicated otherwise. |
| (2) | During their respective tenures, the Trustees (except for Mmes. Frost and Sutherland and Messrs. Fetting, Gorman, Quinton, Smith and Wennerholm) also served as Board members of one or more of the following funds (which operated in the years noted): eUnitsTM 2 Year U.S. Market Participation Trust: Upside to Cap / Buffered Downside (launched in 2012 and terminated in 2014); and eUnitsTM 2 Year U.S. Market Participation Trust II: Upside to Cap / Buffered Downside (launched in 2012 and terminated in 2014). However, Ms. Mosley did not serve as a Board member of eUnitsTM 2 Year U.S. Market Participation Trust: Upside to Cap / Buffered Downside (launched in 2012 and terminated in 2014). |
| (3) | Messrs. Quinton and Smith began serving as Trustees effective October 1, 2018. |
| (4) | Year first elected to serve as officer of a fund in the Eaton Vance family of funds when the officer has served continuously. Otherwise, year of most recent election as an officer of a fund in the Eaton Vance family of funds. Titles may have changed since initial election. |
The SAI for the Fund includes additional information about the Trustees and officers of the Fund and can be obtained without charge on Eaton Vance’s website at www.eatonvance.com or by calling1-800-262-1122.
Eaton Vance Funds
IMPORTANT NOTICES
Privacy. The Eaton Vance organization is committed to ensuring your financial privacy. Each of the financial institutions identified below has in effect the following policy (“Privacy Policy”) with respect to nonpublic personal information about its customers:
| • | | Only such information received from you, through application forms or otherwise, and information about your Eaton Vance fund transactions will be collected. This may include information such as name, address, social security number, tax status, account balances and transactions. |
| • | | None of such information about you (or former customers) will be disclosed to anyone, except as permitted by law (which includes disclosure to employees necessary to service your account). In the normal course of servicing a customer’s account, Eaton Vance may share information with unaffiliated third parties that perform various required services such as transfer agents, custodians and broker-dealers. |
| • | | Policies and procedures (including physical, electronic and procedural safeguards) are in place that are designed to protect the confidentiality of such information. |
| • | | We reserve the right to change our Privacy Policy at any time upon proper notification to you. Customers may want to review our Privacy Policy periodically for changes by accessing the link on our homepage: www.eatonvance.com. |
Our pledge of privacy applies to the following entities within the Eaton Vance organization: the Eaton Vance Family of Funds, Eaton Vance Management, Eaton Vance Investment Counsel, Eaton Vance Distributors, Inc., Eaton Vance Trust Company, Eaton Vance Management (International) Limited, Eaton Vance Advisers International Ltd., Eaton Vance Management’s Real Estate Investment Group and Boston Management and Research. In addition, our Privacy Policy applies only to those Eaton Vance customers who are individuals and who have a direct relationship with us. If a customer’s account (i.e., fund shares) is held in the name of a third-party financial advisor/broker-dealer, it is likely that only such advisor’s privacy policies apply to the customer. This notice supersedes all previously issued privacy disclosures. For more information about Eaton Vance’s Privacy Policy, please call1-800-262-1122.
Delivery of Shareholder Documents. The Securities and Exchange Commission (SEC) permits funds to deliver only one copy of shareholder documents, including prospectuses, proxy statements and shareholder reports, to fund investors with multiple accounts at the same residential or post office box address. This practice is often called “householding” and it helps eliminate duplicate mailings to shareholders.Eaton Vance, or your financial advisor, may household the mailing of your documents indefinitely unless you instruct Eaton Vance, or your financial advisor, otherwise.If you would prefer that your Eaton Vance documents not be householded, please contact Eaton Vance at1-800-262-1122, or contact your financial advisor. Your instructions that householding not apply to delivery of your Eaton Vance documents will typically be effective within 30 days of receipt by Eaton Vance or your financial advisor.
Portfolio Holdings. Each Eaton Vance Fund and its underlying Portfolio(s) (if applicable) files a schedule of portfolio holdings on Part F toForm N-PORT with the SEC for the first and third quarters of each fiscal year. The FormN-PORT will be available on the Eaton Vance website at www.eatonvance.com, by calling Eaton Vance at1-800-262-1122 or in the EDGAR database on the SEC’s website at www.sec.gov.
Proxy Voting. From time to time, funds are required to vote proxies related to the securities held by the funds. The Eaton Vance Funds or their underlying Portfolios (if applicable) vote proxies according to a set of policies and procedures approved by the Funds’ and Portfolios’ Boards. You may obtain a description of these policies and procedures and information on how the Funds or Portfolios voted proxies relating to portfolio securities during the most recent12-month period ended June 30, without charge, upon request, by calling1-800-262-1122 and by accessing the SEC’s website at www.sec.gov.
This Page Intentionally Left Blank
This Page Intentionally Left Blank
Investment Adviser
Boston Management and Research
Two International Place
Boston, MA 02110
Administrator
Eaton Vance Management
Two International Place
Boston, MA 02110
Principal Underwriter*
Eaton Vance Distributors, Inc.
Two International Place
Boston, MA 02110
(617)482-8260
Custodian
State Street Bank and Trust Company
State Street Financial Center, One Lincoln Street
Boston, MA 02111
Transfer Agent
BNY Mellon Investment Servicing (US) Inc.
Attn: Eaton Vance Funds
P.O. Box 9653
Providence, RI 02940-9653
(800)262-1122
Independent Registered Public Accounting Firm
Deloitte & Touche LLP
200 Berkeley Street
Boston, MA 02116-5022
Fund Offices
Two International Place
Boston, MA 02110
| * | FINRA BrokerCheck. Investors may check the background of their Investment Professional by contacting the Financial Industry Regulatory Authority (FINRA). FINRA BrokerCheck is a free tool to help investors check the professional background of current and former FINRA-registered securities firms and brokers. FINRA BrokerCheck is available by calling1-800-289-9999 and at www.FINRA.org. The FINRA BrokerCheck brochure describing this program is available to investors at www.FINRA.org. |

14727 3.31.19

Eaton Vance
National Limited Maturity
Municipal Income Fund
Annual Report
March 31, 2019
Important Note. Beginning on January 1, 2021, as permitted by regulations adopted by the Securities and Exchange Commission, paper copies of the Fund’s annual and semi-annual shareholder reports will no longer be sent by mail unless you specifically request paper copies of the reports. Instead, the reports will be made available on the Fund’s website (eatonvance.com/funddocuments), and you will be notified by mail each time a report is posted and provided with a website address to access the report.
If you already elected to receive shareholder reports electronically, you will not be affected by this change and you need not take any action. If you are a direct investor, you may elect to receive shareholder reports and other communications from the Fund electronically by signing up fore-Delivery at eatonvance.com/edelivery. If you own your shares through a financial intermediary (such as a broker-dealer or bank), you must contact your financial intermediary to sign up.
You may elect to receive all future Fund shareholder reports in paper free of charge. If you are a direct investor, you can inform the Fund that you wish to continue receiving paper copies of your shareholder reports by calling1-800-262-1122. If you own these shares through a financial intermediary, you must contact your financial intermediary or follow instructions included with this disclosure, if applicable, to elect to continue to receive paper copies of your shareholder reports. Your election to receive reports in paper will apply to all Eaton Vance funds held directly or to all funds held through your financial intermediary, as applicable.

Commodity Futures Trading Commission Registration. Effective December 31, 2012, the Commodity Futures Trading Commission (“CFTC”) adopted certain regulatory changes that subject registered investment companies and advisers to regulation by the CFTC if a fund invests more than a prescribed level of its assets in certain CFTC-regulated instruments (including futures, certain options and swap agreements) or markets itself as providing investment exposure to such instruments. The Fund has claimed an exclusion from the definition of the term “commodity pool operator” under the Commodity Exchange Act. Accordingly, neither the Fund nor the adviser with respect to the operation of the Fund is subject to CFTC regulation. Because of its management of other strategies, the Fund’s adviser is registered with the CFTC as a commodity pool operator and a commodity trading advisor.
Fund shares are not insured by the FDIC and are not deposits or other obligations of, or guaranteed by, any depository institution. Shares are subject to investment risks, including possible loss of principal invested.
This report must be preceded or accompanied by a current summary prospectus or prospectus. Before investing, investors should consider carefully the investment objective, risks, and charges and expenses of a mutual fund. This and other important information is contained in the summary prospectus and prospectus, which can be obtained from a financial advisor. Prospective investors should read the prospectus carefully before investing. For further information, please call1-800-262-1122.
Annual ReportMarch 31, 2019
Eaton Vance
National Limited Maturity Municipal Income Fund
Table of Contents
| | | | |
Management’s Discussion of Fund Performance | | | 2 | |
| |
Performance | | | 3 | |
| |
Fund Profile | | | 4 | |
| |
Endnotes and Additional Disclosures | | | 5 | |
| |
Fund Expenses | | | 6 | |
| |
Financial Statements | | | 7 | |
| |
Report of Independent Registered Public Accounting Firm | | | 25 | |
| |
Federal Tax Information | | | 26 | |
| |
Management and Organization | | | 27 | |
| |
Important Notices | | | 30 | |
Eaton Vance
National Limited Maturity Municipal Income Fund
March 31, 2019
Management’s Discussion of Fund Performance1
Economic and Market Conditions
Viewed as a whole, the12-month period that began on April 1, 2018 was positive for the municipal bond market, with the Bloomberg Barclays Municipal Bond Index,2 a broad measure of the asset class, returning 5.38%.
The period was marked by a flattening of the municipal bond yield curve.8 Rates declined across the curve, but declined more for bonds with maturities of 4 years and longer than for bonds with shorter1-3 year maturities. Lower-rated7 bonds generally outperformed higher-rated issues during the period and municipal bonds outperformed comparable U.S. Treasurys. But while the fiscal year overall was positive for municipal bond performance, investors endured considerable volatility during the12-month period.
As the fiscal year began in April 2018, the municipal bond market was at the tail end of a period of rising rates, driven by signs of increasing inflation, higher wage growth and fears that recently-passed tax legislation might overheat the economy. In an effort to blunt upward pressure on inflation, the U.S. Federal Reserve Board (the Fed) announced its second rate hike of 2018 in June. At the long end of the curve, however, fluctuating perceptions of geopolitical risk were a primary driver of rates from April through the end of August 2018. Investors toggled between concern that the U.S. was initiating a global trade war and optimism about economic growth and a potential detente between the U.S. and North Korea.
In September 2018, the Fed hiked rates again and both U.S. Treasury and municipal rates rose across the curve. In October 2018, a strong U.S. employment report and easing concerns over Italy’s national budget continued the upward pressure on longer-term rates. But as 2018 came to a close, investors became increasingly concerned about a trade war with China, a looming government shutdown and dovish comments by the Fed that led investors to fear weakness in the U.S. economy, driving credit spreads wider and the futures market to project the possibility of no further rate hikes in 2019. The result was a “flight to quality” by bond investors that pushed longer-term bond prices up and rates down in the final month of 2018.
The first two months of the new year, in contrast, were a relatively quiet period for bonds. The final month of the period, however, saw rates decline across the curve,
in a dramatic reversal of the market’s direction at the beginning of the period. Driven initially by an unexpectedly weak February jobs report issued in early March, the rate decline was accelerated by reports of slowing gross domestic product growth in China and Germany as well as Brexit uncertainty. Downward pressure on rates appeared to culminate on March 20, 2019, when the Fed issued comments that were more dovish than the market had expected — leading many investors to conclude that further rate hikes were off the table for the rest of 2019.
Fund Performance
For the12-month period ended March 31, 2019, Eaton Vance National Limited Maturity Municipal Income Fund (the Fund) Class A shares at net asset value (NAV) returned 3.45%, underperforming the 5.66% return of the Fund’s benchmark, the Bloomberg Barclays 7 Year Municipal Bond Index (the Index).
The Fund’s overall strategy is to invest in municipal obligations that are exempt from regular federal income tax. The Fund seeks to maintain a dollar-weighted average portfolio duration6 between three and nine years.
While the Index includes only bonds with maturities of six to eight years, the Fund may invest in individual municipal obligations of any maturity and thus own bonds with shorter maturities and longer maturities than the holdings in the Index. During the period, the Fund’sout-of-Index holdings in bonds with maturities of one to five years underperformed thesix-to-eight year bonds in the Index and thus detracted from performance versus the Index.
Other detractors from Fund performance versus the Index included an overweight, relative to the Index, in prerefunded, or escrowed, bonds and security selection in the transportation sector.
In contrast, contributors to Fund performance versus the Index during the period included an overweight in Illinois bonds and an overweight in bonds rated BBB and below.
See Endnotes and Additional Disclosures in this report.
Past performance is no guarantee of future results. Returns are historical and are calculated by determining the percentage change in net asset value (NAV) or offering price (as applicable) with all distributions reinvested. Investment return and principal value will fluctuate so that shares, when redeemed, may be worth more or less than their original cost. Performance less than or equal to one year is cumulative. Performance is for the stated time period only; due to market volatility, the Fund’s current performance may be lower or higher than quoted. Returns are before taxes unless otherwise noted. For performance as of the most recentmonth-end, please refer to eatonvance.com.
Eaton Vance
National Limited Maturity Municipal Income Fund
March 31, 2019
Performance2,3
Portfolio ManagerAdam A. Weigold, CFA
| | | | | | | | | | | | | | | | | | | | |
| % Average Annual Total Returns | | Class
Inception Date | | | Performance
Inception Date | | | One Year | | | Five Years | | | Ten Years | |
Class A at NAV | | | 06/27/1996 | | | | 05/22/1992 | | | | 3.45 | % | | | 2.48 | % | | | 3.95 | % |
Class A with 2.25% Maximum Sales Charge | | | — | | | | — | | | | 1.17 | | | | 2.02 | | | | 3.71 | |
Class C at NAV | | | 12/08/1993 | | | | 05/22/1992 | | | | 2.73 | | | | 1.71 | | | | 3.16 | |
Class C with 1% Maximum Sales Charge | | | — | | | | — | | | | 1.73 | | | | 1.71 | | | | 3.16 | |
Class I at NAV | | | 10/01/2009 | | | | 05/22/1992 | | | | 3.61 | | | | 2.63 | | | | 4.08 | |
Bloomberg Barclays 7 Year Municipal Bond Index | | | — | | | | — | | | | 5.66 | % | | | 3.11 | % | | | 4.05 | % |
| | | | | |
| | | | | | | | | | | | | | | | | | | | |
| % Total Annual Operating Expense Ratios4 | | | | | | | | Class A | | | Class C | | | Class I | |
| | | | | | | | | | | 0.67 | % | | | 1.42 | % | | | 0.52 | % |
| | | | | |
| | | | | | | | | | | | | | | | | | | | |
| % Distribution Rates/Yields5 | | | | | | | | Class A | | | Class C | | | Class I | |
Distribution Rate | | | | | | | | | | | 2.67 | % | | | 1.91 | % | | | 2.82 | % |
Taxable-Equivalent Distribution Rate | | | | | | | | | | | 4.51 | | | | 3.23 | | | | 4.76 | |
SEC30-day Yield | | | | | | | | | | | 1.56 | | | | 0.85 | | | | 1.74 | |
Taxable-Equivalent SEC30-day Yield | | | | | | | | | | | 2.63 | | | | 1.44 | | | | 2.94 | |
Growth of $10,000
This graph shows the change in value of a hypothetical investment of $10,000 in Class A of the Fund for the period indicated. For comparison, the same investment is shown in the indicated index.
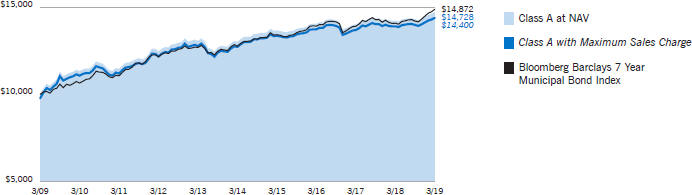
| | | | | | | | | | | | | | | | |
| Growth of Investment3 | | Amount Invested | | | Period Beginning | | | At NAV | | | With Maximum Sales Charge | |
Class C | | $ | 10,000 | | | | 03/31/2009 | | | $ | 13,658 | | | | N.A. | |
Class I | | $ | 250,000 | | | | 03/31/2009 | | | $ | 372,874 | | | | N.A. | |
See Endnotes and Additional Disclosures in this report.
Past performance is no guarantee of future results. Returns are historical and are calculated by determining the percentage change in net asset value (NAV) or offering price (as applicable) with all distributions reinvested. Investment return and principal value will fluctuate so that shares, when redeemed, may be worth more or less than their original cost. Performance less than or equal to one year is cumulative. Performance is for the stated time period only; due to market volatility, the Fund’s current performance may be lower or higher than quoted. Returns are before taxes unless otherwise noted. For performance as of the most recentmonth-end, please refer to eatonvance.com.
Eaton Vance
National Limited Maturity Municipal Income Fund
March 31, 2019
Fund Profile
Credit Quality (% of total investments)7
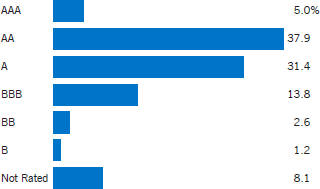
See Endnotes and Additional Disclosures in this report.
Eaton Vance
National Limited Maturity Municipal Income Fund
March 31, 2019
Endnotes and Additional Disclosures
| 1 | The views expressed in this report are those of the portfolio manager(s) and are current only through the date stated at the top of this page. These views are subject to change at any time based upon market or other conditions, and Eaton Vance and the Fund(s) disclaim any responsibility to update such views. These views may not be relied upon as investment advice and, because investment decisions are based on many factors, may not be relied upon as an indication of trading intent on behalf of any Eaton Vance fund. This commentary may contain statements that are not historical facts, referred to as “forward looking statements.” The Fund’s actual future results may differ significantly from those stated in any forward looking statement, depending on factors such as changes in securities or financial markets or general economic conditions, the volume of sales and purchases of Fund shares, the continuation of investment advisory, administrative and service contracts, and other risks discussed from time to time in the Fund’s filings with the Securities and Exchange Commission. |
| 2 | Bloomberg Barclays Municipal Bond Index is an unmanaged index of municipal bonds traded in the U.S. Bloomberg Barclays 7 Year Municipal Bond Index is an unmanaged index of municipal bonds traded in the U.S. with maturities ranging from6-8 years. Unless otherwise stated, index returns do not reflect the effect of any applicable sales charges, commissions, expenses, taxes or leverage, as applicable. It is not possible to invest directly in an index. |
| 3 | Total Returns at NAV do not include applicable sales charges. If sales charges were deducted, the returns would be lower. Total Returns shown with maximum sales charge reflect the stated maximum sales charge. Unless otherwise stated, performance does not reflect the deduction of taxes on Fund distributions or redemptions of Fund shares. |
| | Performance prior to the inception date of a class may be linked to the performance of an older class of the Fund. This linked performance is adjusted for any applicable sales charge, but is not adjusted for class expense differences. If adjusted for such differences, the performance would be different. The performance of Class I is linked to Class A. Performance since inception for an index, if presented, is the performance since the Fund’s or oldest share class’ inception, as applicable. Performance presented in the Financial Highlights included in the financial statements is not linked. |
| 4 | Source: Fund prospectus. The expense ratios for the current reporting period can be found in the Financial Highlights section of this report. |
| 5 | The Distribution Rate is based on the Fund’s last regular distribution per share in the period (annualized) divided by the Fund’s NAV at the end of the period. The Fund’s distributions may be comprised of amounts characterized for federal income tax purposes astax-exempt income, qualified andnon-qualified ordinary dividends, capital gains and nondividend distributions, also known as return of capital. The Fund will determine the federal income tax character of distributions paid to a shareholder after the end of the calendar year. This is reported on the IRS form1099-DIV and provided to the shareholder shortly after eachyear-end. The Fund’s distributions are determined by the investment adviser based on its current assessment of the Fund’s long-term return potential. As portfolio and market conditions change, the rate of distributions paid by the Fund could change. Taxable-equivalent performance is based on the highest combined federal and state income tax rates, where applicable. Lower tax rates would result in lowertax-equivalent performance. Actual tax rates will vary depending on your income, exemptions and deductions. Rates do not include local taxes. The SEC Yield is a standardized measure based on the estimated yield to maturity of a fund’s investments over a30-day period and is based on the maximum offer price at the date specified. The SEC Yield is not based on the distributions made by the Fund, which may differ. |
| 6 | Duration is a measure of the expected change in price of a bond — in percentage terms — given a one percent change in interest rates, all else being constant. Securities with lower durations tend to be less sensitive to interest rate changes. |
| 7 | Ratings are based on Moody’s Investors Service, Inc. (“Moody’s”), S&P Global Ratings (“S&P”) or Fitch Ratings (“Fitch”), as applicable. If securities are rated differently by the ratings agencies, the highest rating is applied. Ratings, which are subject to change, apply to the creditworthiness of the issuers of the underlying securities and not to the Fund or its shares. Credit ratings measure the quality of a bond based on the issuer’s creditworthiness, with ratings ranging from AAA, being the highest, to D, being the lowest based on S&P’s measures. Ratings of BBB or higher by S&P or Fitch (Baa or higher by Moody’s) are considered to be investment-grade quality. Credit ratings are based largely on the ratings agency’s analysis at the time of rating. The rating assigned to any particular security is not necessarily a reflection of the issuer’s current financial condition and does not necessarily reflect its assessment of the volatility of a security’s market value or of the liquidity of an investment in the security. Holdings designated as “Not Rated” (if any) are not rated by the national ratings agencies stated above. |
| 8 | Yield curve is a graphical representation of the yields offered by bonds of various maturities. The yield curve flattens when long-term rates fall and/or short-term rates increase, and the yield curve steepens when long-term rates increase and/or short-term rates fall. |
| | Fund profile subject to change due to active management. |
Eaton Vance
National Limited Maturity Municipal Income Fund
March 31, 2019
Fund Expenses
Example: As a Fund shareholder, you incur two types of costs: (1) transaction costs, including sales charges (loads) on purchases and redemption fees (if applicable); and (2) ongoing costs, including management fees; distribution and/or service fees; and other Fund expenses. This Example is intended to help you understand your ongoing costs (in dollars) of Fund investing and to compare these costs with the ongoing costs of investing in other mutual funds. The Example is based on an investment of $1,000 invested at the beginning of the period and held for the entire period (October 1, 2018 – March 31, 2019).
Actual Expenses: The first section of the table below provides information about actual account values and actual expenses. You may use the information in this section, together with the amount you invested, to estimate the expenses that you paid over the period. Simply divide your account value by $1,000 (for example, an $8,600 account value divided by $1,000 = 8.6), then multiply the result by the number in the first section under the heading entitled “Expenses Paid During Period” to estimate the expenses you paid on your account during this period.
Hypothetical Example for Comparison Purposes: The second section of the table below provides information about hypothetical account values and hypothetical expenses based on the actual Fund expense ratio and an assumed rate of return of 5% per year (before expenses), which is not the actual Fund return. The hypothetical account values and expenses may not be used to estimate the actual ending account balance or expenses you paid for the period. You may use this information to compare the ongoing costs of investing in your Fund and other funds. To do so, compare this 5% hypothetical example with the 5% hypothetical examples that appear in the shareholder reports of the other funds.
Please note that the expenses shown in the table are meant to highlight your ongoing costs only and do not reflect any transactional costs, such as sales charges (loads) or redemption fees (if applicable). Therefore, the second section of the table is useful in comparing ongoing costs only, and will not help you determine the relative total costs of owning different funds. In addition, if these transactional costs were included, your costs would be higher.
| | | | | | | | | | | | | | | | |
| | | Beginning Account Value (10/1/18) | | | Ending Account Value (3/31/19) | | | Expenses Paid During Period* (10/1/18 – 3/31/19) | | | Annualized Expense Ratio | |
| | | | |
Actual | | | | | | | | | | | | | | | | |
Class A | | $ | 1,000.00 | | | $ | 1,028.80 | | | $ | 3.54 | | | | 0.70 | % |
Class C | | $ | 1,000.00 | | | $ | 1,024.80 | | | $ | 7.32 | | | | 1.45 | % |
Class I | | $ | 1,000.00 | | | $ | 1,029.50 | | | $ | 2.78 | | | | 0.55 | % |
| | | | | |
Hypothetical | | | | | | | | | | | | | | | | |
(5% return per year before expenses) | | | | | | | | | | | | | | | | |
Class A | | $ | 1,000.00 | | | $ | 1,021.40 | | | $ | 3.53 | | | | 0.70 | % |
Class C | | $ | 1,000.00 | | | $ | 1,017.70 | | | $ | 7.29 | | | | 1.45 | % |
Class I | | $ | 1,000.00 | | | $ | 1,022.20 | | | $ | 2.77 | | | | 0.55 | % |
| * | Expenses are equal to the Fund’s annualized expense ratio for the indicated Class, multiplied by the average account value over the period, multiplied by 182/365 (to reflect theone-half year period). The Example assumes that the $1,000 was invested at the net asset value per share determined at the close of business on September 30, 2018. |
Eaton Vance
National Limited Maturity Municipal Income Fund
March 31, 2019
Portfolio of Investments
| | | | | | | | |
| Tax-Exempt Municipal Securities — 95.7% | |
| Security | | Principal Amount (000’s omitted) | | | Value | |
|
| Bond Bank — 1.1% | |
| | |
Massachusetts Water Pollution Abatement Trust, 5.00%, 8/1/25 | | $ | 3,000 | | | $ | 3,600,570 | |
| | |
Ohio Water Development Authority, Water Pollution Control Loan Fund, (Water Quality), 5.25%, 6/1/20 | | | 280 | | | | 292,096 | |
| | |
Rhode Island Clean Water Finance Agency, Water Pollution Control, 4.00%, 10/1/20 | | | 1,850 | | | | 1,917,377 | |
| | |
| | | | | | | $ | 5,810,043 | |
|
| Education — 3.9% | |
| | |
Allegheny County Higher Education Building Authority, PA, (Duquesne University), 5.00%, 3/1/25 | | $ | 100 | | | $ | 110,910 | |
| | |
California Educational Facilities Authority, (Claremont McKenna College), 5.00%, 1/1/27 | | | 145 | | | | 145,377 | |
| | |
California Educational Facilities Authority, (Loyola Marymount University), 5.00%, 10/1/25 | | | 500 | | | | 508,260 | |
| | |
Dutchess County Local Development Corp., NY, (Culinary Institute of America), 5.00%, 7/1/21 | | | 250 | | | | 266,925 | |
| | |
Dutchess County Local Development Corp., NY, (Culinary Institute of America), 5.00%, 7/1/22 | | | 330 | | | | 361,416 | |
| | |
Dutchess County Local Development Corp., NY, (Culinary Institute of America), 5.00%, 7/1/23 | | | 300 | | | | 335,889 | |
| | |
Dutchess County Local Development Corp., NY, (Culinary Institute of America), 5.00%, 7/1/24 | | | 665 | | | | 759,669 | |
| | |
Forest Grove, OR, (Pacific University), Series 2015A, 5.00%, 5/1/22 | | | 200 | | | | 215,686 | |
| | |
Forest Grove, OR, (Pacific University), Series 2015A, 5.00%, 5/1/23 | | | 400 | | | | 439,740 | |
| | |
Houston Higher Education Finance Corp., TX, (St. John’s School), 5.00%, 9/1/25 | | | 1,000 | | | | 1,097,140 | |
| | |
Massachusetts Development Finance Agency, (Bentley University), 5.00%, 7/1/24 | | | 1,110 | | | | 1,285,946 | |
| | |
Massachusetts Development Finance Agency, (Tufts University), (SPA: U.S. Bank, N.A.), 1.27%, 8/15/48(1) | | | 3,310 | | | | 3,310,000 | |
| | |
New Jersey Educational Facilities Authority, (University of Medicine and Dentistry of New Jersey), Prerefunded to 6/1/19, 7.125%, 12/1/23 | | | 2,750 | | | | 2,775,162 | |
| | |
New York Dormitory Authority, (Icahn School of Medicine at Mount Sinai), 5.00%, 7/1/23 | | | 4,000 | | | | 4,516,800 | |
| | |
Romeoville, IL, (Lewis University), 5.00%, 10/1/21 | | | 500 | | | | 529,800 | |
| | |
Romeoville, IL, (Lewis University), 5.00%, 10/1/22 | | | 500 | | | | 540,325 | |
| | |
Union County Higher Educational Facilities Financing Authority, PA, (Bucknell University), 5.00%, 4/1/28 | | | 530 | | | | 579,211 | |
| | |
University of California, Series Q, 5.00%, 5/15/21 | | | 20 | | | | 20,057 | |
| | |
Vermont Educational and Health Buildings Financing Agency, (St. Michael’s College), 5.00%, 10/1/23 | | | 1,235 | | | | 1,336,307 | |
| | |
Vermont Educational and Health Buildings Financing Agency, (St. Michael’s College), 5.00%, 10/1/24 | | | 675 | | | | 729,702 | |
| | | | | | | | |
| Security | | Principal Amount (000’s omitted) | | | Value | |
|
| Education (continued) | |
| | |
Vermont Educational and Health Buildings Financing Agency, (St. Michael’s College), 5.00%, 10/1/26 | | $ | 575 | | | $ | 617,079 | |
| | |
| | | | | | | $ | 20,481,401 | |
|
| Electric Utilities — 7.3% | |
| | |
American Municipal Power-Ohio, Inc., (Meldahl Hydroelectric Project), 5.00%, 2/15/21 | | $ | 4,235 | | | $ | 4,493,420 | |
| | |
Apache County Industrial Development Authority, AZ, (Tucson Electric Power Co.), 4.50%, 3/1/30 | | | 2,390 | | | | 2,514,519 | |
| | |
Arkansas River Power Authority, CO, 5.00%, 10/1/28 | | | 1,110 | | | | 1,310,377 | |
| | |
Arkansas River Power Authority, CO, 5.00%, 10/1/30 | | | 1,000 | | | | 1,159,740 | |
| | |
Chesterfield County Economic Development Authority, VA, (Virginia Electric and Power Co.), 5.00%, 5/1/23 | | | 2,000 | | | | 2,004,820 | |
| | |
Hawaii Department of Budget and Finance, (Hawaiian Electric Co.), (AMT), 3.25%, 1/1/25 | | | 3,000 | | | | 3,077,550 | |
| | |
Long Island Power Authority, NY, Electric System Revenue, 2.493%, (70% of 1 mo. USD LIBOR + 0.75%), 10/1/23 (Put Date), 5/1/33(2) | | | 10,000 | | | | 10,023,400 | |
| | |
Montgomery County Industrial Development Authority, PA, (Exelon Generation Co., LLC), 2.55% to 6/1/20 (Put Date), 6/1/29 | | | 1,750 | | | | 1,753,360 | |
| | |
Montgomery County Industrial Development Authority, PA, (Exelon Generation Co., LLC), (AMT), 2.70% to 4/1/20 (Put Date), 10/1/34 | | | 1,500 | | | | 1,502,490 | |
| | |
Municipal Electric Authority of Georgia, 5.25%, 1/1/21 | | | 2,000 | | | | 2,111,360 | |
| | |
Nebraska Public Power District, 5.00%, 1/1/29 | | | 2,000 | | | | 2,373,720 | |
| | |
Pima County Industrial Development Authority, AZ, (Tucson Electric Power Co.), 4.00%, 9/1/29 | | | 2,685 | | | | 2,809,691 | |
| | |
Vernon, Electric System Revenue, CA, 5.125%, 8/1/21 | | | 3,135 | | | | 3,168,419 | |
| | |
| | | | | | | $ | 38,302,866 | |
|
| Escrowed / Prerefunded — 6.0% | |
| | |
Dauphin County General Authority, PA, (Pinnacle Health System), Prerefunded to 6/1/19, 5.75%, 6/1/20 | | $ | 2,225 | | | $ | 2,240,397 | |
| | |
Delaware River Port Authority, Prerefunded to 1/1/20, 5.00%, 1/1/27 | | | 1,105 | | | | 1,133,940 | |
| | |
Georgia State Road and Tollway Authority, (Federal Highway Grant Anticipation Revenue Bonds), Prerefunded to 6/1/19, 5.00%, 6/1/21 | | | 3,000 | | | | 3,017,340 | |
| | |
Massachusetts Development Finance Agency, (Dominion Energy Brayton), Prerefunded to 5/1/19, 5.75%, 12/1/42 | | | 3,200 | | | | 3,211,008 | |
| | |
Massachusetts Health and Educational Facilities Authority, (Partners HealthCare System), Prerefunded to 7/1/19, 5.00%, 7/1/22 | | | 1,250 | | | | 1,260,712 | |
| | |
Massachusetts Turnpike Authority, Escrowed to Maturity, 5.00%, 1/1/20 | | | 495 | | | | 507,964 | |
| | |
Michigan, Prerefunded to 5/1/19, 6.00%, 11/1/22 | | | 2,985 | | | | 2,995,746 | |
| | | | |
| | 7 | | See Notes to Financial Statements. |
Eaton Vance
National Limited Maturity Municipal Income Fund
March 31, 2019
Portfolio of Investments — continued
| | | | | | | | |
| Security | | Principal Amount (000’s omitted) | | | Value | |
|
| Escrowed / Prerefunded (continued) | |
| | |
Norfolk Economic Development Authority, VA, (Bon Secours Health System, Inc.), Prerefunded to 11/1/22, 5.00%, 11/1/27 | | $ | 2,500 | | | $ | 2,778,925 | |
| | |
Oklahoma Development Finance Authority, (St. John Health System), Prerefunded to 2/15/22, 5.00%, 2/15/26 | | | 5,000 | | | | 5,477,800 | |
| | |
Onondaga Civic Development Corp., NY, (St. Joseph’s Hospital Health Center), Prerefunded to 7/1/19, 4.625%, 7/1/22 | | | 1,000 | | | | 1,007,650 | |
| | |
Vernon, Electric System Revenue, CA, Prerefunded to 8/1/19, 5.125%, 8/1/21 | | | 1,440 | | | | 1,457,496 | |
| | |
Virginia Transportation Board, Prerefunded to 3/15/22, 4.00%, 3/15/25 | | | 4,645 | | | | 4,980,555 | |
| | |
Washington County Industrial Development Authority, PA, (Washington & Jefferson College), Prerefunded to 5/1/20, 5.00%, 11/1/23 | | | 1,000 | | | | 1,037,800 | |
| | |
| | | | | | | $ | 31,107,333 | |
|
| General Obligations — 12.7% | |
| | |
Beaverton School District No. 48J, OR, 5.00%, 6/15/25 | | $ | 1,000 | | | $ | 1,194,120 | |
| | |
Beaverton School District No. 48J, OR, 5.00%, 6/15/30 | | | 3,500 | | | | 4,010,930 | |
| | |
Bergen County Improvement Authority, NJ, (County Administration Complex), 5.00%, 11/15/24 | | | 1,100 | | | | 1,300,255 | |
| | |
Bingham and Bonneville Counties Joint School District No. 93, ID, 5.00%, 9/15/25 | | | 630 | | | | 699,584 | |
| | |
Chester County, PA, 5.00%, 7/15/28 | | | 325 | | | | 328,273 | |
| | |
Cook County School District No. 63, IL, 5.00%, 12/1/28 | | | 2,595 | | | | 3,132,139 | |
| | |
Cook County School District No. 63, IL, 5.00%, 12/1/29 | | | 2,725 | | | | 3,267,111 | |
| | |
Delaware Valley Regional Finance Authority, PA, 2.03%, (SIFMA + 0.53%), 9/1/23 (Put Date), 9/1/48(2) | | | 4,900 | | | | 4,902,107 | |
| | |
Franklin Township School District, NJ, 5.00%, 8/15/22 | | | 1,000 | | | | 1,105,130 | |
| | |
Gwinnett County School District, GA, 5.00%, 2/1/26 | | | 2,220 | | | | 2,630,256 | |
| | |
Illinois, 5.00%, 8/1/20 | | | 2,925 | | | | 3,024,684 | |
| | |
Illinois, 5.00%, 10/1/22 | | | 2,000 | | | | 2,153,640 | |
| | |
Illinois, 5.00%, 2/1/23 | | | 5,000 | | | | 5,364,650 | |
| | |
Illinois, 5.00%, 2/1/25 | | | 4,000 | | | | 4,377,560 | |
| | |
Kentwood Public Schools, MI, 4.00%, 5/1/21 | | | 465 | | | | 486,929 | |
| | |
Millcreek Township School District, PA, 5.00%, 9/15/21 | | | 3,730 | | | | 3,988,041 | |
| | |
Millcreek Township School District, PA, 5.00%, 9/15/25 | | | 500 | | | | 563,990 | |
| | |
New York, NY, 5.00%, 8/1/24 | | | 2,000 | | | | 2,313,540 | |
| | |
Oregon, 5.00%, 5/1/28 | | | 500 | | | | 604,235 | |
| | |
Oregon, 5.00%, 8/1/29 | | | 500 | | | | 603,445 | |
| | |
Palo Alto, CA, (Election of 2008), 5.00%, 8/1/28 | | | 1,250 | | | | 1,307,675 | |
| | |
Pittsburgh, PA, 5.00%, 9/1/26 | | | 1,000 | | | | 1,101,910 | |
| | |
Portland Community College District, OR, 5.00%, 6/15/28 | | | 1,000 | | | | 1,209,520 | |
| | |
Portland Community College District, OR, 5.00%, 6/15/29 | | | 2,500 | | | | 3,016,650 | |
| | |
Salem-Keizer School District No. 24J, OR, 0.00%, 6/15/23 | | | 13,010 | | | | 12,024,753 | |
| | |
Salem-Keizer School District No. 24J, OR, 5.00%, 6/15/27 | | | 1,150 | | | | 1,428,070 | |
| | |
| | | | | | | $ | 66,139,197 | |
| | | | | | | | |
| Security | | Principal Amount (000’s omitted) | | | Value | |
|
| Hospital — 8.2% | |
| | |
Boone County, MO, (Boone Hospital Center), 5.00%, 8/1/28 | | $ | 1,000 | | | $ | 1,112,120 | |
| | |
California Municipal Finance Authority, (NorthBay Healthcare Group), Series 2015, 5.00%, 11/1/21 | | | 300 | | | | 320,532 | |
| | |
California Municipal Finance Authority, (NorthBay Healthcare Group), Series 2015, 5.00%, 11/1/22 | | | 185 | | | | 202,235 | |
| | |
California Statewide Communities Development Authority, (Kaiser Permanente), 5.00%, 4/1/19 | | | 500 | | | | 500,000 | |
| | |
Dauphin County General Authority, PA, (Pinnacle Health System), 5.75%, 6/1/20 | | | 2,230 | | | | 2,245,097 | |
| | |
Delaware Health Facilities Authority, (Nanticoke Memorial Hospital, Inc.), 5.00%, 7/1/23 | | | 1,000 | | | | 1,095,280 | |
| | |
Florence County, SC, (McLeod Regional Medical Center), 5.00%, 11/1/22 | | | 665 | | | | 740,285 | |
| | |
Halifax Hospital Medical Center, FL, 5.00%, 6/1/22 | | | 515 | | | | 560,191 | |
| | |
Halifax Hospital Medical Center, FL, 5.00%, 6/1/24 | | | 325 | | | | 368,271 | |
| | |
Halifax Hospital Medical Center, FL, 5.00%, 6/1/25 | | | 1,380 | | | | 1,590,560 | |
| | |
Hamilton County, OH, (Cincinnati Children’s Hospital Medical Center), 5.00%, 5/15/24 | | | 1,250 | | | | 1,444,013 | |
| | |
Hawaii Department of Budget and Finance, (Hawaii Pacific Health Group), 5.00%, 7/1/24 | | | 460 | | | | 520,637 | |
| | |
Illinois Finance Authority, (Presence Health Network), 5.00%, 2/15/23 | | | 1,000 | | | | 1,122,200 | |
| | |
Illinois Finance Authority, (Presence Health Network), 5.00%, 2/15/24 | | | 500 | | | | 574,530 | |
| | |
Illinois Finance Authority, (Silver Cross Hospital and Medical Centers), 5.00%, 8/15/20 | | | 1,000 | | | | 1,036,520 | |
| | |
Lycoming County Authority, PA, (Susquehanna Health System), 5.10%, 7/1/20 | | | 750 | | | | 756,480 | |
| | |
Massachusetts Health and Educational Facilities Authority, (Lowell General Hospital), 4.75%, 7/1/25 | | | 2,715 | | | | 2,812,197 | |
| | |
Michigan Finance Authority, (Beaumont Health), 5.00%, 8/1/22 | | | 1,500 | | | | 1,658,535 | |
| | |
New Jersey Health Care Facilities Financing Authority, (Princeton HealthCare System), 5.00%, 7/1/20 | | | 650 | | | | 677,001 | |
| | |
New Jersey Health Care Facilities Financing Authority, (Princeton HealthCare System), 5.00%, 7/1/21 | | | 760 | | | | 816,673 | |
| | |
New Jersey Health Care Facilities Financing Authority, (Princeton HealthCare System), 5.00%, 7/1/22 | | | 1,000 | | | | 1,106,180 | |
| | |
New Jersey Health Care Facilities Financing Authority, (St. Joseph’s Healthcare System Obligated Group), 4.00%, 7/1/48 | | | 2,000 | | | | 2,021,740 | |
| | |
New York Dormitory Authority, (NYU Hospitals Center), 5.00%, 7/1/21 | | | 1,000 | | | | 1,075,490 | |
| | |
New York Dormitory Authority, (Orange Regional Medical Center), 5.00%, 12/1/27(3) | | | 1,200 | | | | 1,414,488 | |
| | |
New York Dormitory Authority, (Orange Regional Medical Center), Series 2017,
5.00%, 12/1/26(3) | | | 1,500 | | | | 1,766,850 | |
| | |
North Carolina Medical Care Commission, (Vidant Health), 5.00%, 6/1/36 | | | 1,830 | | | | 1,972,502 | |
| | | | |
| | 8 | | See Notes to Financial Statements. |
Eaton Vance
National Limited Maturity Municipal Income Fund
March 31, 2019
Portfolio of Investments — continued
| | | | | | | | |
| Security | | Principal Amount (000’s omitted) | | | Value | |
|
| Hospital (continued) | |
| | |
Orange County Health Facilities Authority, FL, (Orlando Health, Inc.), 5.125%, 10/1/26 | | $ | 955 | | | $ | 972,085 | |
| | |
Orange County Health Facilities Authority, FL, (Orlando Health, Inc.), 5.375%, 10/1/23 | | | 970 | | | | 988,546 | |
| | |
Oregon Facilities Authority, (Providence Health and Services Group), 5.00%, 10/1/24 | | | 1,000 | | | | 1,138,380 | |
| | |
Philadelphia Hospitals and Higher Education Facilities Authority, PA, (The Children’s Hospital of Philadelphia), 5.00%, 7/1/32 | | | 925 | | | | 987,197 | |
| | |
Rhode Island Health and Educational Building Corp., (Care New England Health System), 5.00%, 9/1/31 | | | 2,650 | | | | 2,956,737 | |
| | |
Southeastern Ohio Port Authority, (Memorial Health System Obligated Group), 5.00%, 12/1/19 | | | 350 | | | | 354,715 | |
| | |
Southeastern Ohio Port Authority, (Memorial Health System Obligated Group), 5.00%, 12/1/20 | | | 375 | | | | 387,518 | |
| | |
Southeastern Ohio Port Authority, (Memorial Health System Obligated Group), 5.00%, 12/1/22 | | | 500 | | | | 534,660 | |
| | |
Southeastern Ohio Port Authority, (Memorial Health System Obligated Group), 5.00%, 12/1/23 | | | 250 | | | | 270,685 | |
| | |
Southeastern Ohio Port Authority, (Memorial Health System Obligated Group), 5.00%, 12/1/24 | | | 285 | | | | 312,736 | |
| | |
University of California, (Regents Medical Center), 5.00%, 5/15/22 | | | 890 | | | | 988,131 | |
| | |
Washington Township Health Care District, CA, 5.50%, 7/1/19 | | | 250 | | | | 252,155 | |
| | |
Washington Township Health Care District, CA, 5.75%, 7/1/24 | | | 1,750 | | | | 1,765,855 | |
| | |
Yuma Industrial Development Authority, AZ, (Yuma Regional Medical Center), 5.00%, 8/1/25 | | | 1,230 | | | | 1,410,761 | |
| | |
| | | | | | | $ | 42,830,768 | |
|
| Housing — 0.7% | |
| | |
Allegheny County Residential Finance Authority, PA, SFMR, (AMT), 4.80%, 11/1/22 | | $ | 465 | | | $ | 465,990 | |
| | |
New Hope Cultural Education Facilities Finance Corp., TX,(CHF-Collegiate Housing Corpus Christi II, LLC - Texas A&M University), 4.00%, 4/1/23 | | | 350 | | | | 350,900 | |
| | |
New Hope Cultural Education Facilities Finance Corp., TX,(CHF-Collegiate Housing Corpus Christi II, LLC - Texas A&M University), 4.00%, 4/1/24 | | | 270 | | | | 269,517 | |
| | |
New Hope Cultural Education Facilities Finance Corp., TX,(CHF-Collegiate Housing Corpus Christi II, LLC - Texas A&M University), 4.00%, 4/1/25 | | | 360 | | | | 357,347 | |
| | |
New Hope Cultural Education Facilities Finance Corp., TX,(CHF-Collegiate Housing Corpus Christi II, LLC - Texas A&M University), 4.00%, 4/1/26 | | | 375 | | | | 370,271 | |
| | |
New Hope Cultural Education Facilities Finance Corp., TX,(CHF-Collegiate Housing Corpus Christi II, LLC - Texas A&M University), 5.00%, 4/1/31 | | | 1,330 | | | | 1,363,915 | |
| | |
Sandoval County, NM, MFMR, 6.00%, 5/1/32(3) | | | 535 | | | | 535,203 | |
| | |
Texas Student Housing Corp., (University of North Texas), 9.375%, 7/1/06(4) | | | 95 | | | | 84,075 | |
| | |
| | | | | | | $ | 3,797,218 | |
| | | | | | | | |
| Security | | Principal Amount (000’s omitted) | | | Value | |
|
| Industrial Development Revenue — 5.1% | |
| | |
Amelia County Industrial Development Authority, VA, (Waste Management, Inc.), (AMT), 2.125% to 4/1/20 (Put Date), 4/1/27 | | $ | 1,870 | | | $ | 1,871,159 | |
| | |
Maine Finance Authority, (Casella Waste Systems, Inc.), (AMT), 5.125% to 8/1/25 (Put Date), 8/1/35(3) | | | 1,880 | | | | 1,973,549 | |
| | |
New Hampshire Business Finance Authority, (Casella Waste Systems, Inc.), (AMT), 4.00% to 10/1/19 (Put Date), 4/1/29(3) | | | 2,300 | | | | 2,313,524 | |
| | |
New Jersey Economic Development Authority, (New Jersey-American Water Co., Inc.), (AMT), 5.10%, 6/1/23 | | | 1,780 | | | | 1,836,835 | |
| | |
New York State Environmental Facilities Corp., (Casella Waste Systems, Inc.), (AMT), 3.75% to 12/2/19 (Put Date), 12/1/44(3) | | | 1,880 | | | | 1,892,277 | |
| | |
Public Finance Authority, WI, (Celanese Corp.), (AMT), 5.00%, 1/1/24 | | | 3,000 | | | | 3,298,350 | |
| | |
Public Finance Authority, WI, (Waste Management, Inc.), (AMT), 2.625%, 11/1/25 | | | 1,000 | | | | 1,004,680 | |
| | |
Richland County, SC, (International Paper Co.), (AMT), 3.875%, 4/1/23 | | | 6,165 | | | | 6,491,807 | |
| | |
Rockdale County Development Authority, GA, (Pratt Paper, LLC), (AMT), 4.00%, 1/1/38(3) | | | 420 | | | | 426,182 | |
| | |
Whiting, IN, (BP Products North America, Inc.), (AMT), 5.00% to 3/1/23 (Put Date), 3/1/46 | | | 5,000 | | | | 5,529,700 | |
| | |
| | | | | | | $ | 26,638,063 | |
|
| Insured – Education — 1.6% | |
| | |
California Educational Facilities Authority, (Santa Clara University), (NPFG), 5.00%, 9/1/23 | | $ | 500 | | | $ | 557,665 | |
| | |
New York Dormitory Authority, (Educational Housing Services), (AMBAC), 5.25%, 7/1/21 | | | 2,025 | | | | 2,161,606 | |
| | |
New York Dormitory Authority, (Rochester Institute of Technology), (AMBAC), 5.25%, 7/1/22 | | | 5,150 | | | | 5,744,310 | |
| | |
| | | | | | | $ | 8,463,581 | |
|
| Insured – Electric Utilities — 0.5% | |
| | |
Louisiana Energy & Power Authority, (AGM), 5.25%, 6/1/25 | | $ | 1,125 | | | $ | 1,276,087 | |
| | |
Paducah Electric Plant Board, KY, (AGM), 5.00%, 10/1/26 | | | 1,100 | | | | 1,291,103 | |
| | |
| | | | | | | $ | 2,567,190 | |
|
| Insured – Escrowed / Prerefunded — 0.8% | |
| | |
Cambria County, PA, (BAM), Escrowed to Maturity, 5.00%, 8/1/21 | | $ | 925 | | | $ | 998,195 | |
| | |
North Hudson Sewer Authority, NJ, (NPFG), Escrowed to Maturity, 5.125%, 8/1/22 | | | 1,000 | | | | 1,113,170 | |
| | |
Westmoreland Municipal Authority, PA, (FGIC), Escrowed to Maturity, 0.00%, 8/15/19 | | | 1,900 | | | | 1,888,980 | |
| | |
| | | | | | | $ | 4,000,345 | |
| | | | |
| | 9 | | See Notes to Financial Statements. |
Eaton Vance
National Limited Maturity Municipal Income Fund
March 31, 2019
Portfolio of Investments — continued
| | | | | | | | |
| Security | | Principal Amount (000’s omitted) | | | Value | |
|
| Insured – General Obligations — 11.0% | |
| | |
Atlantic City, NJ, (BAM), 5.00%, 3/1/26 | | $ | 250 | | | $ | 292,525 | |
| | |
Bolingbrook, IL, (AGM), 5.00%, 1/1/23 | | | 1,000 | | | | 1,104,370 | |
| | |
Boston, MA, (NPFG), 0.125%, 3/1/22 | | | 7,855 | | | | 7,497,833 | |
| | |
Cambria County, PA, (BAM), 5.00%, 8/1/21 | | | 1,455 | | | | 1,557,359 | |
| | |
Cambria County, PA, (BAM), 5.00%, 8/1/22 | | | 2,430 | | | | 2,667,775 | |
| | |
Jackson Township Board of Education of Ocean County, NJ, (NPFG), 5.25%, 6/15/23 | | | 6,000 | | | | 6,737,400 | |
| | |
Linn County Community School District No. 9, OR, (Lebanon), (NPFG), 5.25%, 6/15/21 | | | 1,055 | | | | 1,138,092 | |
| | |
Linn County Community School District No. 9, OR, (Lebanon), (NPFG), 5.25%, 6/15/22 | | | 625 | | | | 695,975 | |
| | |
Livonia Public Schools School District, MI, (BAM), 5.00%, 5/1/22 | | | 1,675 | | | | 1,829,871 | |
| | |
Luzerne County, PA, (AGM), 5.00%, 11/15/22 | | | 2,250 | | | | 2,488,950 | |
| | |
McHenry County Community Unit School District No. 12, IL, (AGM), 5.00%, 1/1/23 | | | 940 | | | | 1,030,983 | |
| | |
McHenry County Community Unit School District No. 12, IL, (AGM), 5.00%, 1/1/24 | | | 1,075 | | | | 1,202,517 | |
| | |
New Haven, CT, (AGM), 5.00%, 8/1/22 | | | 5,000 | | | | 5,475,700 | |
| | |
Pennsylvania, (NPFG), 5.375%, 7/1/19 | | | 1,000 | | | | 1,009,320 | |
| | |
Philadelphia School District, PA, (AGM), 5.50%, 6/1/21 | | | 1,000 | | | | 1,077,820 | |
| | |
Pittsburgh School District, PA, (AGM), Prerefunded to 9/1/20, 5.00%, 9/1/22 | | | 15 | | | | 15,740 | |
| | |
Rockland County, NY, (AGM), 4.00%, 5/1/21 | | | 1,820 | | | | 1,910,800 | |
| | |
Rockland County, NY, (AGM), 5.00%, 3/1/21 | | | 3,000 | | | | 3,192,630 | |
| | |
San Mateo County Community College District, CA, (Election of 2005), (NPFG), 0.00%, 9/1/22 | | | 3,000 | | | | 2,836,140 | |
| | |
Washington, (AMBAC), 0.00%, 12/1/22 | | | 10,000 | | | | 9,362,100 | |
| | |
West Virginia, (NPFG), 0.00%, 11/1/21 | | | 4,275 | | | | 4,073,006 | |
| | |
| | | | | | | $ | 57,196,906 | |
|
| Insured – Hospital — 0.2% | |
| | |
Allegheny County Hospital Development Authority, PA, (UPMC Health System), (NPFG), 6.00%, 7/1/24 | | $ | 250 | | | $ | 299,867 | |
| | |
Oregon Health and Science University, (NPFG), 0.00%, 7/1/21 | | | 1,050 | | | | 967,470 | |
| | |
| | | | | | | $ | 1,267,337 | |
|
| Insured – Lease Revenue / Certificates of Participation — 0.4% | |
| | |
Kentucky Asset/Liability Commission, (NPFG), 2.353%, (67% of 3 mo. USD LIBOR + 0.52%), 11/1/21(2) | | $ | 2,060 | | | $ | 2,057,137 | |
| | |
| | | | | | | $ | 2,057,137 | |
|
| Insured – Other Revenue — 0.0%(5) | |
| | |
Cleveland, OH, Parking Facilities, (AGM), Escrowed to Maturity, 5.25%, 9/15/20 | | $ | 160 | | | $ | 168,446 | |
| | |
| | | | | | | $ | 168,446 | |
| | | | | | | | |
| Security | | Principal Amount (000’s omitted) | | | Value | |
|
| Insured – Special Tax Revenue — 3.0% | |
| | |
Garden State Preservation Trust, NJ, (AGM), 5.75%, 11/1/28 | | $ | 1,000 | | | $ | 1,230,300 | |
| | |
Illinois Sports Facilities Authority, (AMBAC), 0.00%, 6/15/22 | | | 7,000 | | | | 6,293,840 | |
| | |
Massachusetts, Special Obligation, (AGM), 5.50%, 6/1/21 | | | 5,000 | | | | 5,420,250 | |
| | |
Pennsylvania Turnpike Commission, Registration Fee Revenue, (AGM), 5.25%, 7/15/22 | | | 1,000 | | | | 1,117,060 | |
| | |
Successor Agency to Burbank Redevelopment Agency, CA, (BAM), 5.00%, 12/1/22 | | | 1,305 | | | | 1,474,337 | |
| | |
| | | | | | | $ | 15,535,787 | |
|
| Insured – Student Loan — 0.2% | |
| | |
Maine Educational Loan Authority, (AGC), 5.625%, 12/1/27 | | $ | 1,175 | | | $ | 1,181,921 | |
| | |
| | | | | | | $ | 1,181,921 | |
|
| Insured – Transportation — 1.0% | |
| | |
New Jersey Transportation Trust Fund Authority, (NPFG), 5.50%, 12/15/20 | | $ | 5,000 | | | $ | 5,295,700 | |
| | |
| | | | | | | $ | 5,295,700 | |
|
| Insured – Water and Sewer — 2.0% | |
| | |
Allegheny County Sanitation Authority, PA, (AGM), 5.00%, 6/1/24 | | $ | 500 | | | $ | 525,950 | |
| | |
Altoona City Authority, PA, Water Revenue, (AGM), 5.25%, 11/1/19 | | | 1,355 | | | | 1,382,886 | |
| | |
Kansas City, MO, Water Revenue, (BHAC), 5.00%, 12/1/23 | | | 3,125 | | | | 3,133,344 | |
| | |
Michigan Finance Authority, (Detroit Water and Sewerage Department), (AGM), 5.00%, 7/1/23 | | | 5,000 | | | | 5,674,500 | |
| | |
| | | | | | | $ | 10,716,680 | |
|
| Lease Revenue / Certificates of Participation — 0.9% | |
| | |
Burke County, NC, Limited Obligation Bonds, 5.00%, 4/1/28 | | $ | 250 | | | $ | 304,797 | |
| | |
Burke County, NC, Limited Obligation Bonds, 5.00%, 4/1/29 | | | 250 | | | | 303,233 | |
| | |
California Public Works, (University of California), Escrowed to Maturity, 5.25%, 6/1/20 | | | 500 | | | | 522,850 | |
| | |
California State Public Works Board, 5.00%, 11/1/26 | | | 2,725 | | | | 3,108,326 | |
| | |
Michigan Strategic Fund, Limited Obligation Revenue, (Facility for Rare Isotope Beams), 5.00%, 3/1/21 | | | 500 | | | | 531,420 | |
| | |
| | | | | | | $ | 4,770,626 | |
|
| Other Revenue — 2.2% | |
| | |
Brooklyn Arena Local Development Corp., NY, (Barclays Center), 5.00%, 7/15/23 | | $ | 1,200 | | | $ | 1,342,116 | |
| | |
Brooklyn Arena Local Development Corp., NY, (Barclays Center), 5.00%, 7/15/24 | | | 1,500 | | | | 1,700,400 | |
| | |
California Infrastructure and Economic Development Bank, (Academy of Motion Picture Arts and Sciences Obligated Group), 5.00%, 11/1/23 | | | 1,000 | | | | 1,156,400 | |
| | | | |
| | 10 | | See Notes to Financial Statements. |
Eaton Vance
National Limited Maturity Municipal Income Fund
March 31, 2019
Portfolio of Investments — continued
| | | | | | | | |
| Security | | Principal Amount (000’s omitted) | | | Value | |
|
| Other Revenue (continued) | |
| | |
Central Falls Detention Facility Corp., RI, 7.25%, 7/15/35(4) | | $ | 1,200 | | | $ | 216,000 | |
| | |
Kalispel Tribe of Indians, WA, Series A, 5.00%, 1/1/32(3) | | | 1,035 | | | | 1,134,712 | |
| | |
New Mexico Municipal Energy Acquisition Authority, (SPA: Royal Bank of Canada), 2.418%, (67% of 1 mo. USD LIBOR + 0.75%), 11/1/39(2) | | | 400 | | | | 400,088 | |
| | |
Patriots Energy Group Financing Agency, SC, Gas Supply Revenue, (Liq: Royal Bank of Canada), 2.528%, (67% of 1 mo. USD LIBOR + 0.86%), 2/1/24
(Put Date), 10/1/48(2) | | | 2,000 | | | | 1,989,560 | |
| | |
Philadelphia Redevelopment Authority, PA, (Transformation Initiative), 5.00%, 4/15/24 | | | 750 | | | | 809,580 | |
| | |
Riversouth Authority, OH, (Lazarus Building Redevelopment), 5.75%, 12/1/27 | | | 260 | | | | 260,562 | |
| | |
Will and Kankakee Counties Community Unit School District No.255-U, IL, 5.00%, 6/1/23 | | | 675 | | | | 743,539 | |
| | |
Will and Kankakee Counties Community Unit School District No.255-U, IL, 5.00%, 6/1/24 | | | 590 | | | | 661,821 | |
| | |
Will and Kankakee Counties Community Unit School District No.255-U, IL, 5.00%, 6/1/25 | | | 1,000 | | | | 1,137,190 | |
| | |
| | | | | | | $ | 11,551,968 | |
|
| Senior Living / Life Care — 4.2% | |
| | |
Hawaii State Department of Budget and Finance, Special Purpose Senior Living Revenue, 5.00%, 11/15/27 | | $ | 1,775 | | | $ | 1,978,610 | |
| | |
Howard County, MD, (Vantage House), 5.00%, 4/1/21 | | | 175 | | | | 178,694 | |
| | |
Illinois Finance Authority, (Presbyterian Homes Obligated Group), 3.092%, (70% of 1 mo. USD LIBOR + 1.35%), 5/1/21 (Put Date), 5/1/36(2) | | | 1,300 | | | | 1,304,264 | |
| | |
Lancaster County Hospital Authority, PA, (Brethren Village), 5.00%, 7/1/20 | | | 1,155 | | | | 1,185,885 | |
| | |
Lancaster Industrial Development Authority, PA, (Garden Spot Village), 5.00%, 5/1/23 | | | 340 | | | | 367,727 | |
| | |
Missouri Health and Educational Facilities Authority, (Bethesda Health Group, Inc.), 5.00%, 8/1/21 | | | 675 | | | | 711,869 | |
| | |
Missouri Health and Educational Facilities Authority, (Bethesda Health Group, Inc.), 5.00%, 8/1/22 | | | 550 | | | | 589,826 | |
| | |
Missouri Health and Educational Facilities Authority, (Bethesda Health Group, Inc.), 5.00%, 8/1/23 | | | 705 | | | | 766,687 | |
| | |
Missouri Health and Educational Facilities Authority, (Bethesda Health Group, Inc.), 5.00%, 8/1/24 | | | 430 | | | | 471,766 | |
| | |
New Hope Cultural Education Facilities Finance Corp., TX, (Longhorn Village), 4.25%, 1/1/33 | | | 2,105 | | | | 2,047,155 | |
| | |
New Hope Cultural Education Facilities Finance Corp., TX, (Longhorn Village), 5.00%, 1/1/30 | | | 1,265 | | | | 1,335,536 | |
| | |
North Oaks, MN, (Waverly Gardens), 4.00%, 10/1/20 | | | 1,230 | | | | 1,266,654 | |
| | |
North Oaks, MN, (Waverly Gardens), 4.00%, 10/1/21 | | | 1,380 | | | | 1,441,410 | |
| | |
North Oaks, MN, (Waverly Gardens), 4.00%, 10/1/22 | | | 1,435 | | | | 1,516,034 | |
| | |
St. Johns County Industrial Development Authority, FL, (Westminster St. Augustine), 4.125% to 8/1/24 (Put Date), 8/1/47 | | | 975 | | | | 974,259 | |
| | | | | | | | |
| Security | | Principal Amount (000’s omitted) | | | Value | |
|
| Senior Living / Life Care (continued) | |
| | |
Tempe Industrial Development Authority, AZ, (Friendship Village of Tempe), 6.00%, 12/1/27 | | $ | 2,140 | | | $ | 2,279,314 | |
| | |
Washington Housing Finance Commission, (Wesley Homes at Lea Hill), 3.75%, 7/1/26(3) | | | 3,420 | | | | 3,434,638 | |
| | |
| | | | | | | $ | 21,850,328 | |
|
| Special Tax Revenue — 6.6% | |
| | |
Detroit Downtown Development Authority, MI, 0.00%, 7/1/21 | | $ | 2,000 | | | $ | 1,813,660 | |
| | |
Garden State Preservation Trust, NJ, 4.00%, 11/1/23 | | | 2,040 | | | | 2,155,097 | |
| | |
Jurupa Public Financing Authority, CA, 5.00%, 9/1/21 | | | 600 | | | | 648,696 | |
| | |
Louisiana, Highway Improvement Revenue, 5.00%, 6/15/25 | | | 750 | | | | 866,003 | |
| | |
Michigan Finance Authority, Detroit Financial Recovery Income Tax Revenue, 4.00%, 10/1/24 | | | 2,500 | | | | 2,656,800 | |
| | |
Michigan Trunk Line, 5.00%, 11/15/23 | | | 600 | | | | 653,646 | |
| | |
Michigan Trunk Line, 5.00%, 11/15/26 | | | 1,100 | | | | 1,195,095 | |
| | |
Michigan Trunk Line, 5.00%, 11/15/28 | | | 2,000 | | | | 2,166,460 | |
| | |
Michigan Trunk Line, 5.00%, 11/15/29 | | | 1,500 | | | | 1,623,240 | |
| | |
New River Community Development District, FL, (Capital Improvements), 5.00%, 5/1/13(4) | | | 280 | | | | 0 | |
| | |
New River Community Development District, FL, (Capital Improvements), Series2010A-2, 5.75%, 5/1/38 | | | 355 | | | | 348,137 | |
| | |
New York Dormitory Authority, Sales Tax Revenue, (AMT), 5.00%, 3/15/24 | | | 1,405 | | | | 1,614,050 | |
| | |
New York Dormitory Authority, Sales Tax Revenue, (AMT), 5.00%, 3/15/25 | | | 1,470 | | | | 1,723,707 | |
| | |
New York Dormitory Authority, Sales Tax Revenue, (AMT), 5.00%, 3/15/26 | | | 1,545 | | | | 1,846,182 | |
| | |
Pennsylvania Turnpike Commission, Oil Franchise Tax, 5.00%, 12/1/25 | | | 6,350 | | | | 7,166,610 | |
| | |
Saint Clair County Highway Revenue, IL, 4.00%, 1/1/22 | | | 555 | | | | 586,069 | |
| | |
Saint Clair County Highway Revenue, IL, 4.00%, 1/1/23 | | | 310 | | | | 333,213 | |
| | |
Saint Clair County Highway Revenue, IL, 4.00%, 1/1/24 | | | 360 | | | | 385,668 | |
| | |
South Orange County Public Financing Authority, CA, 5.00%, 8/15/24 | | | 1,000 | | | | 1,099,590 | |
| | |
Sterling Hill Community Development District, FL, (Capital Improvements), 5.10%, 5/1/11(4) | | | 275 | | | | 27,500 | |
| | |
Sterling Hill Community Development District, FL, (Capital Improvements),
5.50%, 11/1/10(4) | | | 276 | | | | 176,367 | |
| | |
Terrebonne Levee and Conservation District, LA, (Public Improvement Sales Tax), 5.00%, 7/1/25 | | | 2,815 | | | | 3,159,077 | |
| | |
Winter Garden Village at Fowler Groves Community Development District, FL, 3.00%, 5/1/24 | | | 2,260 | | | | 2,257,853 | |
| | |
| | | | | | | $ | 34,502,720 | |
| | | | |
| | 11 | | See Notes to Financial Statements. |
Eaton Vance
National Limited Maturity Municipal Income Fund
March 31, 2019
Portfolio of Investments — continued
| | | | | | | | |
| Security | | Principal Amount (000’s omitted) | | | Value | |
|
| Student Loan — 1.6% | |
| | |
Massachusetts Educational Financing Authority, (AMT), 3.50%, 7/1/33 | | $ | 5,920 | | | $ | 6,027,685 | |
| | |
Massachusetts Educational Financing Authority, (AMT), 5.00%, 7/1/24 | | | 1,000 | | | | 1,143,430 | |
| | |
New Jersey Higher Education Assistance Authority, 5.25%, 6/1/21 | | | 1,000 | | | | 1,005,630 | |
| | |
| | | | | | | $ | 8,176,745 | |
|
| Transportation — 13.6% | |
| | |
Allegheny County Airport Authority, PA, (Pittsburgh International Airport), (AMT), 5.00%, 1/1/26 | | $ | 840 | | | $ | 900,522 | |
| | |
Allegheny County Airport Authority, PA, (Pittsburgh International Airport), (AMT), 5.00%, 1/1/28 | | | 520 | | | | 555,459 | |
| | |
Burbank-Glendale-Pasadena Airport Authority, CA, (AMT), 5.00%, 7/1/20 | | | 2,455 | | | | 2,555,729 | |
| | |
Burbank-Glendale-Pasadena Airport Authority, CA, (AMT), 5.00%, 7/1/21 | | | 3,755 | | | | 4,028,101 | |
| | |
Central Texas Regional Mobility Authority, 5.00%, 1/1/27 | | | 1,285 | | | | 1,506,277 | |
| | |
Chicago, IL, (Midway International Airport), (AMT), 5.00%, 1/1/21 | | | 500 | | | | 527,830 | |
| | |
Chicago, IL, (Midway International Airport), (AMT), 5.00%, 1/1/26 | | | 3,500 | | | | 4,060,140 | |
| | |
Chicago, IL, (O’Hare International Airport), (AMT), 5.00%, 1/1/21 | | | 950 | | | | 1,002,877 | |
| | |
Chicago, IL, (O’Hare International Airport), (AMT), 5.00%, 1/1/22 | | | 825 | | | | 894,548 | |
| | |
Chicago, IL, (O’Hare International Airport), (AMT), 5.00%, 1/1/23 | | | 1,300 | | | | 1,443,117 | |
| | |
Chicago, IL, (O’Hare International Airport), (AMT), 5.00%, 1/1/26 | | | 3,100 | | | | 3,575,819 | |
| | |
Chicago, IL, (O’Hare International Airport), (AMT), 5.00%, 1/1/30 | | | 3,000 | | | | 3,227,790 | |
| | |
Dallas and Fort Worth, TX, (Dallas/Fort Worth International Airport), (AMT), 5.00%, 11/1/26 | | | 4,795 | | | | 5,047,121 | |
| | |
Grand Parkway Transportation Corp., TX, 5.00%, 2/1/23 | | | 2,400 | | | | 2,678,208 | |
| | |
Greater Orlando Aviation Authority, FL, (AMT), 5.00%, 10/1/21 | | | 4,750 | | | | 5,125,297 | |
| | |
Hawaii Airports System, 5.25%, 7/1/28 | | | 3,650 | | | | 3,804,395 | |
| | |
Kentucky Public Transportation Infrastructure Authority, 0.00%, 7/1/21 | | | 550 | | | | 513,607 | |
| | |
Long Beach, CA, Harbor Revenue, 5.00%, 5/15/23 | | | 500 | | | | 520,480 | |
| | |
Los Angeles Department of Airports, CA, (Los Angeles International Airport), (AMT), 5.00%, 5/15/25 | | | 2,500 | | | | 2,955,825 | |
| | |
Metropolitan Nashville Airport Authority, TN, (AMT), 5.00%, 7/1/26 | | | 885 | | | | 1,029,335 | |
| | |
Metropolitan Nashville Airport Authority, TN, (AMT), 5.00%, 7/1/27 | | | 1,250 | | | | 1,446,750 | |
| | |
Metropolitan Transportation Authority, NY, 5.00%, 11/15/21 | | | 3,000 | | | | 3,244,890 | |
| | | | | | | | |
| Security | | Principal Amount (000’s omitted) | | | Value | |
|
| Transportation (continued) | |
| | |
Metropolitan Transportation Authority, NY, Green Bonds, 5.00%, 11/15/26 | | $ | 2,500 | | | $ | 2,998,700 | |
| | |
Metropolitan Washington Airport Authority System, DC, 5.00%, 10/1/22 | | | 5,000 | | | | 5,269,950 | |
| | |
New Jersey Transportation Trust Fund Authority, (Transportation Program), 2.70%, (SIFMA + 1.20%), 12/15/21 (Put Date), 6/15/34(2) | | | 4,000 | | | | 4,032,000 | |
| | |
New Jersey Turnpike Authority, 5.00%, 1/1/20 | | | 975 | | | | 977,476 | |
| | |
North Texas Tollway Authority, (Dallas North Tollway System), 6.00%, 1/1/23 | | | 935 | | | | 938,001 | |
| | |
Pennsylvania Economic Development Financing Authority, (National Railroad Passenger), (AMT), 5.00%, 11/1/25 | | | 1,000 | | | | 1,085,560 | |
| | |
Pennsylvania Economic Development Financing Authority, (National Railroad Passenger), (AMT), 5.00%, 11/1/26 | | | 890 | | | | 965,267 | |
| | |
Pennsylvania Turnpike Commission, Series 2013C, 5.00%, 12/1/22 | | | 1,000 | | | | 1,118,710 | |
| | |
Philadelphia, PA, Airport Revenue, (AMT), 5.00%, 6/15/23 | | | 1,000 | | | | 1,068,870 | |
| | |
South Jersey Transportation Authority, NJ, 5.00%, 11/1/22 | | | 325 | | | | 352,541 | |
| | |
South Jersey Transportation Authority, NJ, 5.00%, 11/1/24 | | | 1,175 | | | | 1,312,169 | |
| | |
| | | | | | | $ | 70,763,361 | |
|
| Water and Sewer — 0.9% | |
| | |
Chicago, IL, Water Revenue, 5.00%, 11/1/22 | | $ | 1,000 | | | $ | 1,103,670 | |
| | |
Jefferson County, AL, Sewer Revenue, 5.00%, 10/1/22 | | | 1,000 | | | | 1,089,740 | |
| | |
New Jersey Economic Environmental Infrastructure Trust, 5.00%, 9/1/20 | | | 1,000 | | | | 1,050,500 | |
| | |
Portland, OR, Sewer System Revenue, 5.00%, 5/1/28 | | | 1,000 | | | | 1,206,990 | |
| | |
| | | | | | | $ | 4,450,900 | |
| |
TotalTax-Exempt Municipal Securities — 95.7%
(identified cost $483,138,328) | | | $ | 499,624,567 | |
|
| Taxable Municipal Securities — 1.3% | |
| Security | | Principal Amount (000’s omitted) | | | Value | |
|
| General Obligations — 0.2% | |
| | |
Chicago, IL, 7.75%, 1/1/42 | | $ | 922 | | | $ | 997,438 | |
| | |
| | | | | | | $ | 997,438 | |
|
| Insured – General Obligations — 0.3% | |
| | |
Detroit, MI, (AMBAC), 4.96%, 4/1/20 | | $ | 1,472 | | | $ | 1,471,510 | |
| | |
| | | | | | | $ | 1,471,510 | |
| | | | |
| | 12 | | See Notes to Financial Statements. |
Eaton Vance
National Limited Maturity Municipal Income Fund
March 31, 2019
Portfolio of Investments — continued
| | | | | | | | |
| Security | | Principal Amount (000’s omitted) | | | Value | |
|
| Senior Living / Life Care — 0.6% | |
| | |
St. Johns County Industrial Development Authority, FL, (Westminster St. Augustine), 5.50% to 8/1/24 (Put Date), 8/1/44 | | $ | 3,295 | | | $ | 3,247,091 | |
| | |
| | | | | | | $ | 3,247,091 | |
|
| Student Loan — 0.2% | |
| | |
Massachusetts Educational Financing Authority, 3.875%, 7/1/23 | | $ | 1,100 | | | $ | 1,142,889 | |
| | |
| | | | | | | $ | 1,142,889 | |
| |
Total Taxable Municipal Securities — 1.3%
(identified cost $6,772,796) | | | $ | 6,858,928 | |
| |
Total Investments — 97.0%
(identified cost $489,911,124) | | | $ | 506,483,495 | |
| |
Other Assets, Less Liabilities — 3.0% | | | $ | 15,635,932 | |
| |
Net Assets — 100.0% | | | $ | 522,119,427 | |
The percentage shown for each investment category in the Portfolio of Investments is based on net assets.
At March 31, 2019, the concentration of the Fund’s investments in the various states, determined as a percentage of net assets, is as follows:
| | | | |
| |
| Illinois | | | 10.9% | |
| |
| Pennsylvania | | | 10.3% | |
| |
| New York | | | 10.2% | |
| |
| Others, representing less than 10% individually | | | 65.6% | |
The Fund invests primarily in debt securities issued by municipalities. The ability of the issuers of the debt securities to meet their obligations may be affected by economic developments in a specific industry or municipality. In order to reduce the risk associated with such economic developments, at March 31, 2019, 21.7% of total investments are backed by bond insurance of various financial institutions and financial guaranty assurance agencies. The aggregate percentage insured by an individual financial institution or financial guaranty assurance agency ranged from 0.2% to 7.0% of total investments.
| (1) | Variable rate demand obligation that may be tendered at par on any day for payment the same or next business day. The stated interest rate, which generally resets daily, is determined by the remarketing agent and represents the rate in effect at March 31, 2019. |
| (2) | Floating rate security. The stated interest rate represents the rate in effect at March 31, 2019. |
| (3) | Security exempt from registration pursuant to Rule 144A under the Securities Act of 1933, as amended. These securities may be sold in certain transactions in reliance on an exemption from registration (normally to qualified institutional buyers). At March 31, 2019, the aggregate value of these securities is $14,891,423 or 2.9% of the Fund’s net assets. |
| (4) | Defaulted security. Issuer has defaulted on the payment of interest and/or principal. |
| (5) | Amount is less than 0.05%. |
Abbreviations:
| | | | |
| | |
| AGC | | – | | Assured Guaranty Corp. |
| | |
| AGM | | – | | Assured Guaranty Municipal Corp. |
| | |
| AMBAC | | – | | AMBAC Financial Group, Inc. |
| | |
| AMT | | – | | Interest earned from these securities may be considered a tax preference item for purposes of the Federal Alternative Minimum Tax. |
| | |
| BAM | | – | | Build America Mutual Assurance Co. |
| | |
| BHAC | | – | | Berkshire Hathaway Assurance Corp. |
| | |
| FGIC | | – | | Financial Guaranty Insurance Company |
| | |
| LIBOR | | – | | London Interbank Offered Rate |
| | |
| Liq | | – | | Liquidity Provider |
| | |
| MFMR | | – | | Multi-Family Mortgage Revenue |
| | |
| NPFG | | – | | National Public Finance Guarantee Corp. |
| | |
| SFMR | | – | | Single Family Mortgage Revenue |
| | |
| SIFMA | | – | | Securities Industry and Financial Markets Association Municipal Swap Index |
| | |
| SPA | | – | | Standby Bond Purchase Agreement |
| | |
| USD | | – | | United States Dollar |
| | | | |
| | 13 | | See Notes to Financial Statements. |
Eaton Vance
National Limited Maturity Municipal Income Fund
March 31, 2019
Statement of Assets and Liabilities
| | | | |
| Assets | | March 31, 2019 | |
| |
Investments, at value (identified cost, $489,911,124) | | $ | 506,483,495 | |
| |
Cash | | | 10,067,080 | |
| |
Interest receivable | | | 5,725,863 | |
| |
Receivable for investments sold | | | 1,040,925 | |
| |
Receivable for Fund shares sold | | | 342,744 | |
| |
Total assets | | $ | 523,660,107 | |
| |
| Liabilities | | | | |
| |
Payable for Fund shares redeemed | | $ | 569,290 | |
| |
Distributions payable | | | 571,420 | |
| |
Payable to affiliates: | | | | |
| |
Investment adviser fee | | | 176,148 | |
| |
Distribution and service fees | | | 52,390 | |
| |
Accrued expenses | | | 171,432 | |
| |
Total liabilities | | $ | 1,540,680 | |
| |
Net Assets | | $ | 522,119,427 | |
|
| Sources of Net Assets | |
| |
Paid-in capital | | $ | 515,188,774 | |
| |
Distributable earnings | | | 6,930,653 | |
| |
Net Assets | | $ | 522,119,427 | |
| |
| Class A Shares | | | | |
| |
Net Assets | | $ | 192,154,798 | |
| |
Shares Outstanding | | | 19,632,239 | |
| |
Net Asset Value and Redemption Price Per Share | | | | |
| |
(net assets ÷ shares of beneficial interest outstanding) | | $ | 9.79 | |
| |
Maximum Offering Price Per Share | | | | |
| |
(100 ÷ 97.75 of net asset value per share) | | $ | 10.02 | |
|
| Class C Shares | |
| |
Net Assets | | $ | 35,667,195 | |
| |
Shares Outstanding | | | 3,884,192 | |
| |
Net Asset Value and Offering Price Per Share* | | | | |
| |
(net assets ÷ shares of beneficial interest outstanding) | | $ | 9.18 | |
|
| Class I Shares | |
| |
Net Assets | | $ | 294,297,434 | |
| |
Shares Outstanding | | | 30,057,040 | |
| |
Net Asset Value, Offering Price and Redemption Price Per Share | | | | |
| |
(net assets ÷ shares of beneficial interest outstanding) | | $ | 9.79 | |
On sales of $100,000 or more ($50,000 or more for certain financial intermediaries, as disclosed in an appendix to the Fund’s prospectus), the offering price of Class A shares is reduced.
| * | Redemption price per share is equal to the net asset value less any applicable contingent deferred sales charge. |
| | | | |
| | 14 | | See Notes to Financial Statements. |
Eaton Vance
National Limited Maturity Municipal Income Fund
March 31, 2019
Statement of Operations
| | | | |
| Investment Income | | Year Ended
March 31, 2019 | |
| |
Interest | | $ | 18,536,467 | |
| |
Total investment income | | $ | 18,536,467 | |
| |
| Expenses | | | | |
| |
Investment adviser fee | | $ | 2,141,240 | |
| |
Distribution and service fees | | | | |
| |
Class A | | | 275,254 | |
| |
Class C | | | 533,898 | |
| |
Trustees’ fees and expenses | | | 26,509 | |
| |
Custodian fee | | | 121,681 | |
| |
Transfer and dividend disbursing agent fees | | | 171,511 | |
| |
Legal and accounting services | | | 66,208 | |
| |
Printing and postage | | | 35,876 | |
| |
Registration fees | | | 153,911 | |
| |
Miscellaneous | | | 112,440 | |
| |
Total expenses | | $ | 3,638,528 | |
| |
Net investment income | | $ | 14,897,939 | |
| |
| Realized and Unrealized Gain (Loss) | | | | |
| |
Net realized gain (loss) — | | | | |
| |
Investment transactions | | $ | 723,933 | |
| |
Net realized gain | | $ | 723,933 | |
| |
Change in unrealized appreciation (depreciation) — | | | | |
| |
Investments | | $ | 2,079,250 | |
| |
Net change in unrealized appreciation (depreciation) | | $ | 2,079,250 | |
| |
Net realized and unrealized gain | | $ | 2,803,183 | |
| |
Net increase in net assets from operations | | $ | 17,701,122 | |
| | | | |
| | 15 | | See Notes to Financial Statements. |
Eaton Vance
National Limited Maturity Municipal Income Fund
March 31, 2019
Statements of Changes in Net Assets
| | | | | | | | |
| | | Year Ended March 31, | |
| Increase (Decrease) in Net Assets | | 2019 | | | 2018 | |
| | |
From operations — | | | | | | | | |
| | |
Net investment income | | $ | 14,897,939 | | | $ | 15,914,608 | |
| | |
Net realized gain | | | 723,933 | | | | 1,262,370 | |
| | |
Net change in unrealized appreciation (depreciation) | | | 2,079,250 | | | | (8,077,960 | ) |
| | |
Net increase in net assets from operations | | $ | 17,701,122 | | | $ | 9,099,018 | |
| | |
Distributions to shareholders(1) — | | | | | | | | |
| | |
Class A | | $ | (5,117,370 | ) | | $ | (5,793,532 | ) |
| | |
Class B | | | — | | | | (1,933 | ) |
| | |
Class C | | | (1,202,628 | ) | | | (1,745,558 | ) |
| | |
Class I | | | (8,502,904 | ) | | | (8,349,773 | ) |
| | |
Total distributions to shareholders | | $ | (14,822,902 | ) | | $ | (15,890,796 | ) |
| | |
Transactions in shares of beneficial interest — | | | | | | | | |
| | |
Proceeds from sale of shares | | | | | | | | |
| | |
Class A | | $ | 19,901,418 | | | $ | 20,568,218 | |
| | |
Class B | | | — | | | | 185 | |
| | |
Class C | | | 3,738,749 | | | | 5,389,399 | |
| | |
Class I | | | 142,374,110 | | | | 113,217,079 | |
| | |
Net asset value of shares issued to shareholders in payment of distributions declared | | | | | | | | |
| | |
Class A | | | 4,175,790 | | | | 4,677,455 | |
| | |
Class B | | | — | | | | 1,553 | |
| | |
Class C | | | 1,009,919 | | | | 1,423,740 | |
| | |
Class I | | | 2,382,091 | | | | 2,655,598 | |
| | |
Cost of shares redeemed | | | | | | | | |
| | |
Class A | | | (42,051,357 | ) | | | (46,088,470 | ) |
| | |
Class B | | | — | | | | (140,095 | ) |
| | |
Class C | | | (23,491,886 | ) | | | (32,866,586 | ) |
| | |
Class I | | | (140,640,187 | ) | | | (110,053,387 | ) |
| | |
Net asset value of shares converted | | | | | | | | |
| | |
Class A | | | 19,142,023 | | | | 66,521 | |
| | |
Class B | | | — | | | | (66,521 | ) |
| | |
Class C | | | (19,142,023 | ) | | | — | |
| | |
Net asset value of shares merged* | | | | | | | | |
| | |
Class A | | | — | | | | 66,131 | |
| | |
Class B | | | — | | | | (66,131 | ) |
| | |
Net decrease in net assets from Fund share transactions | | $ | (32,601,353 | ) | | $ | (41,215,311 | ) |
| | |
Net decrease in net assets | | $ | (29,723,133 | ) | | $ | (48,007,089 | ) |
| | |
| Net Assets | | | | | | | | |
| | |
At beginning of year | | $ | 551,842,560 | | | $ | 599,849,649 | |
| | |
At end of year | | $ | 522,119,427 | | | $ | 551,842,560 | (2) |
| (1) | For the year ended March 31, 2018, the source of distributions was from net investment income. The current year presentation of distributions conforms with the Disclosure Update and Simplification Rule issued by the Securities and Exchange commission, effective November 5, 2018. |
| (2) | Includes accumulated undistributed net investment income of $52,920 at March 31, 2018. The requirement to disclose the corresponding amount as of March 31, 2019 was eliminated. |
| * | At the close of business on September 20, 2017, Class B shares were merged into Class A shares. |
| | | | |
| | 16 | | See Notes to Financial Statements. |
Eaton Vance
National Limited Maturity Municipal Income Fund
March 31, 2019
Financial Highlights
| | | | | | | | | | | | | | | | | | | | |
| | | Class A | |
| |
| | | Year Ended March 31, | |
| | | 2019 | | | 2018 | | | 2017 | | | 2016 | | | 2015 | |
| | | | | |
Net asset value — Beginning of year | | $ | 9.730 | | | $ | 9.850 | | | $ | 10.160 | | | $ | 10.180 | | | $ | 10.000 | |
| | | | | |
| Income (Loss) From Operations | | | | | | | | | | | | | | | | | | | | |
| | | | | |
Net investment income(1) | | $ | 0.272 | | | $ | 0.274 | | | $ | 0.283 | | | $ | 0.298 | | | $ | 0.314 | |
| | | | | |
Net realized and unrealized gain (loss) | | | 0.058 | | | | (0.120 | ) | | | (0.311 | ) | | | (0.020 | ) | | | 0.179 | |
| | | | | |
Total income (loss) from operations | | $ | 0.330 | | | $ | 0.154 | | | $ | (0.028 | ) | | $ | 0.278 | | | $ | 0.493 | |
| | | | | |
| Less Distributions | | | | | | | | | | | | | | | | | | | | |
| | | | | |
From net investment income | | $ | (0.270 | ) | | $ | (0.274 | ) | | $ | (0.282 | ) | | $ | (0.298 | ) | | $ | (0.313 | ) |
| | | | | |
Total distributions | | $ | (0.270 | ) | | $ | (0.274 | ) | | $ | (0.282 | ) | | $ | (0.298 | ) | | $ | (0.313 | ) |
| | | | | |
Net asset value — End of year | | $ | 9.790 | | | $ | 9.730 | | | $ | 9.850 | | | $ | 10.160 | | | $ | 10.180 | |
| | | | | |
Total Return(2) | | | 3.45 | % | | | 1.55 | % | | | (0.29 | )% | | | 2.79 | % | | | 4.98 | % |
| | | | | |
| Ratios/Supplemental Data | | | | | | | | | | | | | | | | | | | | |
| | | | | |
Net assets, end of year (000’s omitted) | | $ | 192,155 | | | $ | 189,734 | | | $ | 212,891 | | | $ | 275,435 | | | $ | 307,562 | |
| | | | | |
Ratios (as a percentage of average daily net assets): | | | | | | | | | | | | | | | | | | | | |
| | | | | |
Expenses(3) | | | 0.68 | % | | | 0.67 | % | | | 0.67 | % | | | 0.66 | % | | | 0.69 | % |
| | | | | |
Net investment income | | | 2.80 | % | | | 2.77 | % | | | 2.82 | % | | | 2.95 | % | | | 3.09 | % |
| | | | | |
Portfolio Turnover | | | 14 | % | | | 13 | % | | | 17 | % | | | 10 | % | | | 7 | % |
| (1) | Computed using average shares outstanding. |
| (2) | Returns are historical and are calculated by determining the percentage change in net asset value with all distributions reinvested and do not reflect the effect of sales charges. |
| (3) | Excludes the effect of custody fee credits, if any, of less than 0.005%. Effective September 1, 2015, custody fee credits, which were earned on cash deposit balances, were discontinued by the custodian. |
| | | | |
| | 17 | | See Notes to Financial Statements. |
Eaton Vance
National Limited Maturity Municipal Income Fund
March 31, 2019
Financial Highlights — continued
| | | | | | | | | | | | | | | | | | | | |
| | | Class C | |
| |
| | | Year Ended March 31, | |
| | | 2019 | | | 2018 | | | 2017 | | | 2016 | | | 2015 | |
| | | | | |
Net asset value — Beginning of year | | $ | 9.120 | | | $ | 9.240 | | | $ | 9.530 | | | $ | 9.550 | | | $ | 9.380 | |
| | | | | |
| Income (Loss) From Operations | | | | | | | | | | | | | | | | | | | | |
| | | | | |
Net investment income(1) | | $ | 0.186 | | | $ | 0.188 | | | $ | 0.195 | | | $ | 0.209 | | | $ | 0.223 | |
| | | | | |
Net realized and unrealized gain (loss) | | | 0.059 | | | | (0.121 | ) | | | (0.291 | ) | | | (0.020 | ) | | | 0.169 | |
| | | | | |
Total income (loss) from operations | | $ | 0.245 | | | $ | 0.067 | | | $ | (0.096 | ) | | $ | 0.189 | | | $ | 0.392 | |
| | | | | |
| Less Distributions | | | | | | | | | | | | | | | | | | | | |
| | | | | |
From net investment income | | $ | (0.185 | ) | | $ | (0.187 | ) | | $ | (0.194 | ) | | $ | (0.209 | ) | | $ | (0.222 | ) |
| | | | | |
Total distributions | | $ | (0.185 | ) | | $ | (0.187 | ) | | $ | (0.194 | ) | | $ | (0.209 | ) | | $ | (0.222 | ) |
| | | | | |
Net asset value — End of year | | $ | 9.180 | | | $ | 9.120 | | | $ | 9.240 | | | $ | 9.530 | | | $ | 9.550 | |
| | | | | |
Total Return(2) | | | 2.73 | % | | | 0.71 | % | | | (1.03 | )% | | | 2.01 | % | | | 4.21 | % |
| | | | | |
| Ratios/Supplemental Data | | | | | | | | | | | | | | | | | | | | |
| | | | | |
Net assets, end of year (000’s omitted) | | $ | 35,667 | | | $ | 73,533 | | | $ | 100,360 | | | $ | 119,453 | | | $ | 124,647 | |
| | | | | |
Ratios (as a percentage of average daily net assets): | | | | | | | | | | | | | | | | | | | | |
| | | | | |
Expenses(3) | | | 1.43 | % | | | 1.42 | % | | | 1.42 | % | | | 1.41 | % | | | 1.44 | % |
| | | | | |
Net investment income | | | 2.05 | % | | | 2.02 | % | | | 2.07 | % | | | 2.21 | % | | | 2.34 | % |
| | | | | |
Portfolio Turnover | | | 14 | % | | | 13 | % | | | 17 | % | | | 10 | % | | | 7 | % |
| (1) | Computed using average shares outstanding. |
| (2) | Returns are historical and are calculated by determining the percentage change in net asset value with all distributions reinvested and do not reflect the effect of sales charges. |
| (3) | Excludes the effect of custody fee credits, if any, of less than 0.005%. Effective September 1, 2015, custody fee credits, which were earned on cash deposit balances, were discontinued by the custodian. |
| | | | |
| | 18 | | See Notes to Financial Statements. |
Eaton Vance
National Limited Maturity Municipal Income Fund
March 31, 2019
Financial Highlights — continued
| | | | | | | | | | | | | | | | | | | | |
| | | Class I | |
| |
| | | Year Ended March 31, | |
| | | 2019 | | | 2018 | | | 2017 | | | 2016 | | | 2015 | |
| | | | | |
Net asset value — Beginning of year | | $ | 9.730 | | | $ | 9.850 | | | $ | 10.170 | | | $ | 10.190 | | | $ | 10.000 | |
| | | | | |
| Income (Loss) From Operations | | | | | | | | | | | | | | | | | | | | |
| | | | | |
Net investment income(1) | | $ | 0.286 | | | $ | 0.289 | | | $ | 0.298 | | | $ | 0.314 | | | $ | 0.328 | |
| | | | | |
Net realized and unrealized gain (loss) | | | 0.059 | | | | (0.120 | ) | | | (0.321 | ) | | | (0.021 | ) | | | 0.191 | |
| | | | | |
Total income (loss) from operations | | $ | 0.345 | | | $ | 0.169 | | | $ | (0.023 | ) | | $ | 0.293 | | | $ | 0.519 | |
| | | | | |
| Less Distributions | | | | | | | | | | | | | | | | | | | | |
| | | | | |
From net investment income | | $ | (0.285 | ) | | $ | (0.289 | ) | | $ | (0.297 | ) | | $ | (0.313 | ) | | $ | (0.329 | ) |
| | | | | |
Total distributions | | $ | (0.285 | ) | | $ | (0.289 | ) | | $ | (0.297 | ) | | $ | (0.313 | ) | | $ | (0.329 | ) |
| | | | | |
Net asset value — End of year | | $ | 9.790 | | | $ | 9.730 | | | $ | 9.850 | | | $ | 10.170 | | | $ | 10.190 | |
| | | | | |
Total Return(2) | | | 3.61 | % | | | 1.70 | % | | | (0.24 | )% | | | 2.94 | % | | | 5.24 | % |
| | | | | |
| Ratios/Supplemental Data | | | | | | | | | | | | | | | | | | | | |
| | | | | |
Net assets, end of year (000’s omitted) | | $ | 294,297 | | | $ | 288,575 | | | $ | 286,331 | | | $ | 297,168 | | | $ | 239,511 | |
| | | | | |
Ratios (as a percentage of average daily net assets): | | | | | | | | | | | | | | | | | | | | |
| | | | | |
Expenses(3) | | | 0.53 | % | | | 0.52 | % | | | 0.52 | % | | | 0.51 | % | | | 0.54 | % |
| | | | | |
Net investment income | | | 2.95 | % | | | 2.92 | % | | | 2.97 | % | | | 3.10 | % | | | 3.23 | % |
| | | | | |
Portfolio Turnover | | | 14 | % | | | 13 | % | | | 17 | % | | | 10 | % | | | 7 | % |
| (1) | Computed using average shares outstanding. |
| (2) | Returns are historical and are calculated by determining the percentage change in net asset value with all distributions reinvested. |
| (3) | Excludes the effect of custody fee credits, if any, of less than 0.005%. Effective September 1, 2015, custody fee credits, which were earned on cash deposit balances, were discontinued by the custodian. |
| | | | |
| | 19 | | See Notes to Financial Statements. |
Eaton Vance
National Limited Maturity Municipal Income Fund
March 31, 2019
Notes to Financial Statements
1 Significant Accounting Policies
Eaton Vance National Limited Maturity Municipal Income Fund (the Fund) is a diversified series of Eaton Vance Investment Trust (the Trust). The Trust is a Massachusetts business trust registered under the Investment Company Act of 1940, as amended (the 1940 Act), as anopen-end management investment company. The Fund’s investment objective is to provide current income exempt from regular federal income tax. The Fund offers three classes of shares. Class A shares are generally sold subject to a sales charge imposed at time of purchase. Class C shares are sold at net asset value and are generally subject to a contingent deferred sales charge (see Note 5). Effective January 25, 2019, Class C shares generally automatically convert to Class A shares ten years after their purchase as described in the Fund’s prospectus. Class I shares are sold at net asset value and are not subject to a sales charge. Each class represents apro-rata interest in the Fund, but votes separately on class-specific matters and (as noted below) is subject to different expenses. Realized and unrealized gains and losses are allocated daily to each class of shares based on the relative net assets of each class to the total net assets of the Fund. Net investment income, other than class-specific expenses, is allocated daily to each class of shares based upon the ratio of the value of each class’s paid shares to the total value of all paid shares. Each class of shares differs in its distribution plan and certain other class-specific expenses.
The following is a summary of significant accounting policies of the Fund. The policies are in conformity with accounting principles generally accepted in the United States of America (U.S. GAAP). The Fund is an investment company and follows accounting and reporting guidance in the Financial Accounting Standards Board (FASB) Accounting Standards Codification Topic 946.
A Investment Valuation — The following methodologies are used to determine the market value or fair value of investments.
Debt Obligations.Debt obligations are generally valued on the basis of valuations provided by third party pricing services, as derived from such services’ pricing models. Inputs to the models may include, but are not limited to, reported trades, executable bid and ask prices, broker/dealer quotations, prices or yields of securities with similar characteristics, interest rates, anticipated prepayments, benchmark curves or information pertaining to the issuer, as well as industry and economic events. The pricing services may use a matrix approach, which considers information regarding securities with similar characteristics to determine the valuation for a security. Short-term debt obligations purchased with a remaining maturity of sixty days or less for which a valuation from a third party pricing service is not readily available may be valued at amortized cost, which approximates fair value.
Fair Valuation. Investments for which valuations or market quotations are not readily available or are deemed unreliable are valued at fair value using methods determined in good faith by or at the direction of the Trustees of the Fund in a manner that fairly reflects the security’s value, or the amount that the Fund might reasonably expect to receive for the security upon its current sale in the ordinary course. Each such determination is based on a consideration of relevant factors, which are likely to vary from one pricing context to another. These factors may include, but are not limited to, the type of security, the existence of any contractual restrictions on the security’s disposition, the price and extent of public trading in similar securities of the issuer or of comparable entities, quotations or relevant information obtained from broker/dealers or other market participants, information obtained from the issuer, analysts, and/or the appropriate stock exchange (for exchange-traded securities), an analysis of the entity’s financial condition, and an evaluation of the forces that influence the issuer and the market(s) in which the security is purchased and sold.
B Investment Transactions and Related Income — Investment transactions for financial statement purposes are accounted for on a trade date basis. Realized gains and losses on investments sold are determined on the basis of identified cost. Interest income is recorded on the basis of interest accrued, adjusted for amortization of premium or accretion of discount.
C Federal Taxes — The Fund’s policy is to comply with the provisions of the Internal Revenue Code applicable to regulated investment companies and to distribute to shareholders each year substantially all of its taxable, if any, andtax-exempt net investment income, and all or substantially all of its net realized capital gains. Accordingly, no provision for federal income or excise tax is necessary. The Fund intends to satisfy conditions which will enable it to designate distributions from the interest income generated by its investments innon-taxable municipal securities, which are exempt from regular federal income tax when received by the Fund, as exempt-interest dividends. The portion of such interest, if any, earned on private activity bonds issued after August 7, 1986, may be considered a tax preference item to shareholders.
As of March 31, 2019, the Fund had no uncertain tax positions that would require financial statement recognition,de-recognition, or disclosure. The Fund files a U.S. federal income tax return annually after its fiscalyear-end, which is subject to examination by the Internal Revenue Service for a period of three years from the date of filing.
D Expenses — The majority of expenses of the Trust are directly identifiable to an individual fund. Expenses which are not readily identifiable to a specific fund are allocated taking into consideration, among other things, the nature and type of expense and the relative size of the funds.
E Legal Fees — Legal fees and other related expenses incurred as part of negotiations of the terms and requirement of capital infusions, or that are expected to result in the restructuring of, or a plan of reorganization for, an investment are recorded as realized losses. Ongoing expenditures to protect or enhance an investment are treated as operating expenses.
F Use of Estimates — The preparation of the financial statements in conformity with U.S. GAAP requires management to make estimates and assumptions that affect the reported amounts of assets and liabilities at the date of the financial statements and the reported amounts of income and expense during the reporting period. Actual results could differ from those estimates.
Eaton Vance
National Limited Maturity Municipal Income Fund
March 31, 2019
Notes to Financial Statements — continued
G Indemnifications — Under the Trust’s organizational documents, its officers and Trustees may be indemnified against certain liabilities and expenses arising out of the performance of their duties to the Fund. Under Massachusetts law, if certain conditions prevail, shareholders of a Massachusetts business trust (such as the Trust) could be deemed to have personal liability for the obligations of the Trust. However, the Trust’s Declaration of Trust contains an express disclaimer of liability on the part of Fund shareholders and theBy-laws provide that the Trust shall assume the defense on behalf of any Fund shareholders. Moreover, theBy-laws also provide for indemnification out of Fund property of any shareholder held personally liable solely by reason of being or having been a shareholder for all loss or expense arising from such liability. Additionally, in the normal course of business, the Fund enters into agreements with service providers that may contain indemnification clauses. The Fund’s maximum exposure under these arrangements is unknown as this would involve future claims that may be made against the Fund that have not yet occurred.
H When-Issued Securities and Delayed Delivery Transactions — The Fund may purchase or sell securities on a delayed delivery or when-issued basis. Payment and delivery may take place after the customary settlement period for that security. At the time the transaction is negotiated, the price of the security that will be delivered is fixed. The Fund maintains cash and/or security positions for these commitments such that sufficient liquid assets will be available to make payments upon settlement. Securities purchased on a delayed delivery or when-issued basis aremarked-to-market daily and begin earning interest on settlement date. Losses may arise due to changes in the market value of the underlying securities or if the counterparty does not perform under the contract.
2 Distributions to Shareholders and Income Tax Information
The net investment income of the Fund is determined daily and substantially all of the net investment income so determined is declared as a dividend to shareholders of record at the time of declaration. Distributions are declared separately for each class of shares. Distributions are paid monthly. Distributions of realized capital gains (reduced by available capital loss carryforwards from prior years) are made at least annually. Shareholders may reinvest income and capital gain distributions in additional shares of the same class of the Fund at the net asset value as of the reinvestment date or, at the election of the shareholder, receive distributions in cash. Distributions to shareholders are determined in accordance with income tax regulations, which may differ from U.S. GAAP. As required by U.S. GAAP, only distributions in excess of tax basis earnings and profits are reported in the financial statements as a return of capital. Permanent differences between book and tax accounting relating to distributions are reclassified topaid-in capital. For tax purposes, distributions from short-term capital gains are considered to be from ordinary income.
The tax character of distributions declared for the years ended March 31, 2019 and March 31, 2018 was as follows:
| | | | | | | | |
| | | Year Ended March 31, | |
| | | 2019 | | | 2018 | |
| | |
Tax-exempt income | | $ | 14,469,194 | | | $ | 15,566,193 | |
| | |
Ordinary income | | $ | 353,708 | | | $ | 324,603 | |
During the year ended March 31, 2019, distributable earnings was increased by $6,473,142 andpaid-in capital was decreased by $6,473,142 due to expired capital loss carryforwards. These reclassifications had no effect on the net assets or net asset value per share of the Fund.
As of March 31, 2019, the components of distributable earnings (accumulated loss) on a tax basis were as follows:
| | | | |
| | |
Undistributedtax-exempt income | | $ | 737,340 | |
| |
Deferred capital losses | | $ | (10,199,331 | ) |
| |
Net unrealized appreciation | | $ | 16,964,064 | |
| |
Distributions payable | | $ | (571,420 | ) |
At March 31, 2019, the Fund, for federal income tax purposes, had deferred capital losses of $10,199,331 which would reduce its taxable income arising from future net realized gains on investment transactions, if any, to the extent permitted by the Internal Revenue Code, and thus would reduce the amount of distributions to shareholders, which would otherwise be necessary to relieve the Fund of any liability for federal income or excise tax. The deferred capital losses are treated as arising on the first day of the Fund’s next taxable year and retain the same short-term or long-term character as when originally deferred. Of the deferred capital losses at March 31, 2019, $10,199,331 are short-term.
Eaton Vance
National Limited Maturity Municipal Income Fund
March 31, 2019
Notes to Financial Statements — continued
The cost and unrealized appreciation (depreciation) of investments of the Fund at March 31, 2019, as determined on a federal income tax basis, were as follows:
| | | | |
| |
Aggregate cost | | $ | 489,519,431 | |
| |
Gross unrealized appreciation | | $ | 18,949,395 | |
| |
Gross unrealized depreciation | | | (1,985,331 | ) |
| |
Net unrealized appreciation | | $ | 16,964,064 | |
3 Investment Adviser Fee and Other Transactions with Affiliates
The investment adviser fee is earned by Boston Management and Research (BMR), a subsidiary of Eaton Vance Management (EVM), as compensation for management and investment advisory services rendered to the Fund. The fee is based upon a percentage of average daily net assets plus a percentage of gross income (i.e., income other than gains from the sale of securities) as presented in the following table and is payable monthly.
| | | | | | | | |
| Daily Net Assets | | Annual Asset
Rate | | | Daily Income
Rate | |
| | |
Up to $500 million | | | 0.300 | % | | | 3.00 | % |
| | |
$500 million up to $1 billion | | | 0.275 | | | | 2.75 | |
On average daily net assets of $1 billion or more, the rates are further reduced.
For the year ended March 31, 2019, the investment adviser fee amounted to $2,141,240 or 0.40% of the Fund’s average daily net assets.
EVM serves as the administrator of the Fund, but receives no compensation. EVM providessub-transfer agency and related services to the Fund pursuant to aSub-Transfer Agency Support Services Agreement. For the year ended March 31, 2019, EVM earned $17,734 from the Fund pursuant to such agreement, which is included in transfer and dividend disbursing agent fees on the Statement of Operations. The Fund was informed that Eaton Vance Distributors, Inc. (EVD), an affiliate of EVM and the Fund’s principal underwriter, received $3,756 as its portion of the sales charge on sales of Class A shares for the year ended March 31, 2019. EVD also received distribution and service fees from Class A and Class C shares (see Note 4).
Trustees and officers of the Fund who are members of EVM’s or BMR’s organizations receive remuneration for their services to the Fund out of the investment adviser fee. Trustees of the Fund who are not affiliated with the investment adviser may elect to defer receipt of all or a percentage of their annual fees in accordance with the terms of the Trustees Deferred Compensation Plan. For the year ended March 31, 2019, no significant amounts have been deferred. Certain officers and Trustees of the Fund are officers of the above organizations.
4 Distribution Plans
The Fund has in effect a distribution plan for Class A shares (Class A Plan) pursuant to Rule12b-1 under the 1940 Act. Pursuant to the Class A Plan, the Fund pays EVD a distribution and service fee not exceeding 0.25% per annum of its average daily net assets attributable to Class A shares for distribution services and facilities provided to the Fund by EVD, as well as for personal services and/or the maintenance of shareholder accounts. The Trustees approved distribution and service fee payments equal to 0.15% per annum of its average daily net assets attributable to Class A shares. Distribution and service fees paid or accrued to EVD for the year ended March 31, 2019 amounted to $275,254 for Class A shares.
The Fund also has in effect distribution plans for Class C shares (Class C Plan) pursuant to Rule12b-1 under the 1940 Act. Pursuant to the Class C Plan, the Fund pays EVD amounts equal to 0.75% per annum of its average daily net assets attributable to Class C shares for providing ongoing distribution services and facilities to the Fund. For the year ended March 31, 2019, the Fund paid or accrued to EVD $444,915 for Class C shares.
Pursuant to the Class C Plan, the Fund also makes payments of service fees to EVD, financial intermediaries and other persons in amounts not exceeding 0.25% per annum of its average daily net assets attributable to that class. The Trustees approved service fee payments equal to 0.15% per annum of its average daily net assets attributable to Class C shares. Service fees paid or accrued are for personal services and/or the maintenance of shareholder accounts. They are separate and distinct from and Class C sales commissions and distribution fees payable to EVD. Service fees paid or accrued for the year ended March 31, 2019 amounted to $88,983 for Class C shares.
Distribution and service fees are subject to the limitations contained in the Financial Industry Regulatory Authority Rule 2341(d).
Eaton Vance
National Limited Maturity Municipal Income Fund
March 31, 2019
Notes to Financial Statements — continued
5 Contingent Deferred Sales Charges
A contingent deferred sales charge (CDSC) generally is imposed on redemptions of Class C shares made within one year of purchase. Class A shares may be subject to a 1% CDSC if redeemed within eighteen months of purchase (depending on the circumstances of purchase). Generally, the CDSC is based upon the lower of the net asset value at date of redemption or date of purchase. No charge is levied on shares acquired by reinvestment of dividends or capital gain distributions. Class C shares are subject to a 1% CDSC if redeemed within one year of purchase. For the year ended March 31, 2019, the Fund was informed that EVD received no CDSCs paid by Class A and Class C shareholders.
6 Purchases and Sales of Investments
Purchases and sales of investments, other than short-term obligations, aggregated $74,336,028 and $111,501,864, respectively, for the year ended March 31, 2019.
7 Shares of Beneficial Interest
The Fund’s Declaration of Trust permits the Trustees to issue an unlimited number of full and fractional shares of beneficial interest (without par value). Such shares may be issued in a number of different series (such as the Fund) and classes. Transactions in Fund shares were as follows:
| | | | | | | | |
| | | Year Ended March 31, | |
| Class A | | 2019 | | | 2018 | |
| | |
Sales | | | 2,064,572 | | | | 2,069,213 | |
| | |
Issued to shareholders electing to receive payments of distributions in Fund shares | | | 430,466 | | | | 472,893 | |
| | |
Redemptions | | | (4,340,820 | ) | | | (4,659,068 | ) |
| | |
Converted from Class B shares | | | — | | | | 6,668 | |
| | |
Converted from Class C shares | | | 1,971,905 | | | | — | |
| | |
Merger from Class B shares | | | — | | | | 6,624 | |
| | |
Net increase (decrease) | | | 126,123 | | | | (2,103,670 | ) |
| |
| | | Year Ended March 31, | |
| Class B | | 2019 | | | 2018(1) | |
| | |
Sales | | | — | | | | 18 | |
| | |
Issued to shareholders electing to receive payments of distributions in Fund shares | | | — | | | | 156 | |
| | |
Redemptions | | | — | | | | (14,075 | ) |
| | |
Converted to Class A shares | | | — | | | | (6,665 | ) |
| | |
Merger to Class A shares | | | — | | | | (6,621 | ) |
| | |
Net increase (decrease) | | | — | | | | (27,187 | ) |
| |
| | | Year Ended March 31, | |
| Class C | | 2019 | | | 2018 | |
| | |
Sales | | | 411,525 | | | | 580,295 | |
| | |
Issued to shareholders electing to receive payments of distributions in Fund shares | | | 111,076 | | | | 153,478 | |
| | |
Redemptions | | | (2,595,723 | ) | | | (3,535,078 | ) |
| | |
Converted to Class A shares | | | (2,101,562 | ) | | | — | |
| | |
Net decrease | | | (4,174,684 | ) | | | (2,801,305 | ) |
Eaton Vance
National Limited Maturity Municipal Income Fund
March 31, 2019
Notes to Financial Statements — continued
| | | | | | | | |
| | | Year Ended March 31, | |
| Class I | | 2019 | | | 2018 | |
| | |
Sales | | | 14,691,924 | | | | 11,468,854 | |
| | |
Issued to shareholders electing to receive payments of distributions in Fund shares | | | 245,579 | | | | 268,462 | |
| | |
Redemptions | | | (14,538,329 | ) | | | (11,134,427 | ) |
| | |
Net increase | | | 399,174 | | | | 602,889 | |
| (1) | At the close of business on September 20, 2017, Class B shares were merged into Class A shares. |
8 Line of Credit
The Fund participates with other portfolios and funds managed by EVM and its affiliates in a $625 million unsecured line of credit agreement with a group of banks, which is in effect through October 29, 2019. Borrowings are made by the Fund solely to facilitate the handling of unusual and/or unanticipated short-term cash requirements. Interest is charged to the Fund based on its borrowings at an amount above either the Eurodollar rate or Federal Funds rate. In addition, a fee computed at an annual rate of 0.15% on the daily unused portion of the line of credit is allocated among the participating portfolios and funds at the end of each quarter. Because the line of credit is not available exclusively to the Fund, it may be unable to borrow some or all of its requested amounts at any particular time. The Fund did not have any significant borrowings or allocated fees during the year ended March 31, 2019.
9 Fair Value Measurements
Under generally accepted accounting principles for fair value measurements, a three-tier hierarchy to prioritize the assumptions, referred to as inputs, is used in valuation techniques to measure fair value. The three-tier hierarchy of inputs is summarized in the three broad levels listed below.
| • | | Level 1 – quoted prices in active markets for identical investments |
| • | | Level 2 – other significant observable inputs (including quoted prices for similar investments, interest rates, prepayment speeds, credit risk, etc.) |
| • | | Level 3 – significant unobservable inputs (including a fund’s own assumptions in determining the fair value of investments) |
In cases where the inputs used to measure fair value fall in different levels of the fair value hierarchy, the level disclosed is determined based on the lowest level input that is significant to the fair value measurement in its entirety. The inputs or methodology used for valuing securities are not necessarily an indication of the risk associated with investing in those securities.
At March 31, 2019, the hierarchy of inputs used in valuing the Fund’s investments, which are carried at value, were as follows:
| | | | | | | | | | | | | | | | |
| Asset Description | | Level 1 | | | Level 2 | | | Level 3 | | | Total | |
| | | | |
Tax-Exempt Municipal Securities | | $ | — | | | $ | 499,624,567 | | | $ | — | | | $ | 499,624,567 | |
| | | | |
Taxable Municipal Securities | | | — | | | | 6,858,928 | | | | — | | | | 6,858,928 | |
| | | | |
Total Investments | | $ | — | | | $ | 506,483,495 | | | $ | — | | | $ | 506,483,495 | |
Eaton Vance
National Limited Maturity Municipal Income Fund
March 31, 2019
Report of Independent Registered Public Accounting Firm
To the Trustees of Eaton Vance Investment Trust and Shareholders of Eaton Vance National Limited Maturity Municipal Income Fund:
Opinion on the Financial Statements and Financial Highlights
We have audited the accompanying statement of assets and liabilities of Eaton Vance National Limited Maturity Municipal Income Fund (the “Fund”) (one of the funds constituting Eaton Vance Investment Trust), including the portfolio of investments, as of March 31, 2019, the related statement of operations for the year then ended, the statements of changes in net assets for each of the two years in the period then ended, the financial highlights for each of the five years in the period then ended, and the related notes. In our opinion, the financial statements and financial highlights present fairly, in all material respects, the financial position of the Fund as of March 31, 2019, and the results of its operations for the year then ended, the changes in its net assets for each of the two years in the period then ended, and the financial highlights for each of the five years in the period then ended, in conformity with accounting principles generally accepted in the United States of America.
Basis for Opinion
These financial statements and financial highlights are the responsibility of the Fund’s management. Our responsibility is to express an opinion on the Fund’s financial statements and financial highlights based on our audits. We are a public accounting firm registered with the Public Company Accounting Oversight Board (United States) (PCAOB) and are required to be independent with respect to the Fund in accordance with the U.S. federal securities laws and the applicable rules and regulations of the Securities and Exchange Commission and the PCAOB.
We conducted our audits in accordance with the standards of the PCAOB. Those standards require that we plan and perform the audit to obtain reasonable assurance about whether the financial statements and financial highlights are free of material misstatement, whether due to error or fraud. The Fund is not required to have, nor were we engaged to perform, an audit of its internal control over financial reporting. As part of our audits we are required to obtain an understanding of internal control over financial reporting but not for the purpose of expressing an opinion on the effectiveness of the Fund’s internal control over financial reporting. Accordingly, we express no such opinion.
Our audits included performing procedures to assess the risks of material misstatement of the financial statements and financial highlights, whether due to error or fraud, and performing procedures that respond to those risks. Such procedures included examining, on a test basis, evidence regarding the amounts and disclosures in the financial statements and financial highlights. Our audits also included evaluating the accounting principles used and significant estimates made by management, as well as evaluating the overall presentation of the financial statements and financial highlights. Our procedures included confirmation of securities owned as of March 31, 2019, by correspondence with the custodian and brokers; when replies were not received from brokers, we performed other auditing procedures. We believe that our audits provide a reasonable basis for our opinion.
/s/ Deloitte & Touche LLP
Boston, Massachusetts
May 17, 2019
We have served as the auditor of one or more Eaton Vance investment companies since 1959.
Eaton Vance
National Limited Maturity Municipal Income Fund
March 31, 2019
Federal Tax Information (Unaudited)
The Form1099-DIV you receive in February 2020 will show the tax status of all distributions paid to your account in calendar year 2019. Shareholders are advised to consult their own tax adviser with respect to the tax consequences of their investment in the Fund. As required by the Internal Revenue Code and/or regulations, shareholders must be notified regarding exempt-interest dividends.
Exempt-Interest Dividends. For the fiscal year ended March 31, 2019, the Fund designates 97.61% of distributions from net investment income as an exempt-interest dividend.
Eaton Vance
National Limited Maturity Municipal Income Fund
March 31, 2019
Management and Organization
Fund Management. The Trustees of Eaton Vance Investment Trust (the Trust) are responsible for the overall management and supervision of the Trust’s affairs. The Trustees and officers of the Trust are listed below. Except as indicated, each individual has held the office shown or other offices in the same company for the last five years. Trustees and officers of the Trust hold indefinite terms of office. The “noninterested Trustees” consist of those Trustees who are not “interested persons” of the Trust, as that term is defined under the 1940 Act. The business address of each Trustee and officer is Two International Place, Boston, Massachusetts 02110. As used below, “EVC” refers to Eaton Vance Corp., “EV” refers to Eaton Vance, Inc., “EVM” refers to Eaton Vance Management, “BMR” refers to Boston Management and Research and “EVD” refers to Eaton Vance Distributors, Inc. EVC and EV are the corporate parent and trustee, respectively, of EVM and BMR. EVD is a wholly-owned subsidiary of EVC. Each officer affiliated with Eaton Vance may hold a position with other Eaton Vance affiliates that is comparable to his or her position with EVM listed below. Each Trustee oversees 172 portfolios in the Eaton Vance Complex (including all master and feeder funds in a master feeder structure). Each officer serves as an officer of certain other Eaton Vance funds. Each Trustee and officer serves until his or her successor is elected.
| | | | | | |
| Name and Year of Birth | | Position(s)
with the
Trust | | Trustee Since(1) | | Principal Occupation(s) and Directorships During Past Five Years and Other Relevant Experience |
|
| Interested Trustee |
| | | |
Thomas E. Faust Jr. 1958 | | Trustee | | 2007 | | Chairman, Chief Executive Officer and President of EVC, Director and President of EV, Chief Executive Officer and President of EVM and BMR, and Director of EVD. Trustee and/or officer of 172 registered investment companies. Mr. Faust is an interested person because of his positions with EVM, BMR, EVD, EVC and EV, which are affiliates of the Trust. Directorships in the Last Five Years.(2)Director of EVC and Hexavest Inc. (investment management firm). |
|
| Noninterested Trustees |
| | | |
Mark R. Fetting 1954 | | Trustee | | 2016 | | Private investor. Formerly held various positions at Legg Mason, Inc. (investment management firm) (2000-2012), including President, Chief Executive Officer, Director and Chairman (2008-2012), Senior Executive Vice President (2004-2008) and Executive Vice President (2001-2004). Formerly, President of Legg Mason family of funds (2001-2008). Formerly, Division President and Senior Officer of Prudential Financial Group, Inc. and related companies (investment management firm)(1991-2000). Directorships in the Last Five Years. None. |
| | | |
Cynthia E. Frost 1961 | | Trustee | | 2014 | | Private investor. Formerly, Chief Investment Officer of Brown University (university endowment) (2000-2012). Formerly, Portfolio Strategist for Duke Management Company (university endowment manager) (1995-2000). Formerly, Managing Director, Cambridge Associates (investment consulting company) (1989-1995). Formerly, Consultant, Bain and Company (management consulting firm) (1987-1989). Formerly, Senior Equity Analyst, BA Investment Management Company (1983-1985). Directorships in the Last Five Years.None. |
| | | |
George J. Gorman 1952 | | Trustee | | 2014 | | Principal at George J. Gorman LLC (consulting firm). Formerly, Senior Partner at Ernst & Young LLP (a registered public accounting firm) (1974-2009). Directorships in the Last Five Years.Formerly, Trustee of the BofA Funds Series Trust (11 funds) (2011-2014) and of the Ashmore Funds (9 funds) (2010-2014). |
| | | |
Valerie A. Mosley 1960 | | Trustee | | 2014 | | Chairwoman and Chief Executive Officer of Valmo Ventures (a consulting and investment firm). Former Partner and Senior Vice President, Portfolio Manager and Investment Strategist at Wellington Management Company, LLP (investment management firm) (1992-2012). Former Chief Investment Officer, PG Corbin Asset Management (1990-1992). Formerly worked in institutional corporate bond sales at Kidder Peabody (1986-1990). Directorships in the Last Five Years.(2)Director of Envestnet, Inc. (provider of intelligent systems for wealth management and financial wellness) (since 2018). Director of Dynex Capital, Inc. (mortgage REIT) (since 2013). |
| | | |
William H. Park 1947 | | Chairperson of the Board and Trustee | | 2016 (Chairperson) 2003 (Trustee) | | Private investor. Formerly, Consultant (management and transactional) (2012-2014). Formerly, Chief Financial Officer, Aveon Group L.P. (investment management firm) (2010-2011). Formerly, Vice Chairman, Commercial Industrial Finance Corp. (specialty finance company) (2006-2010). Formerly, President and Chief Executive Officer, Prizm Capital Management, LLC (investment management firm) (2002-2005). Formerly, Executive Vice President and Chief Financial Officer, United Asset Management Corporation (investment management firm) (1982-2001). Formerly, Senior Manager, Price Waterhouse (now PricewaterhouseCoopers) (a registered public accounting firm) (1972-1981). Directorships in the Last Five Years.(2)None. |
Eaton Vance
National Limited Maturity Municipal Income Fund
March 31, 2019
Management and Organization — continued
| | | | | | |
| Name and Year of Birth | | Position(s)
with the
Trust | | Trustee Since(1) | | Principal Occupation(s) and Directorships During Past Five Years and Other Relevant Experience |
|
| Noninterested Trustees (continued) |
| | | |
Helen Frame Peters 1948 | | Trustee | | 2008 | | Professor of Finance, Carroll School of Management, Boston College. Formerly, Dean, Carroll School of Management, Boston College (2000-2002). Formerly, Chief Investment Officer, Fixed Income, Scudder Kemper Investments (investment management firm) (1998-1999). Formerly, Chief Investment Officer, Equity and Fixed Income, Colonial Management Associates (investment management firm) (1991-1998). Directorships in the Last Five Years.(2) None. |
| | | |
Keith Quinton(3) 1958 | | Trustee | | 2018 | | Independent Investment Committee Member at New Hampshire Retirement System (since 2017). Advisory Committee member at Northfield Information Services, Inc. (risk management analytics provider) (since 2016). Formerly, Portfolio Manager and Senior Quantitative Analyst at Fidelity Investments (investment management firm)(2001-2014). Directorships in the Last Five Years. Director of New Hampshire Municipal Bond Bank (since 2016). |
| | | |
Marcus L. Smith(3) 1966 | | Trustee | | 2018 | | Member of Posse Boston Advisory Board (foundation) (since 2015); Trustee at University of Mount Union (since 2008). Formerly, Portfolio Manager at MFS Investment Management (investment management firm) (1994-2017). Directorships in the Last Five Years. Director of MSCI Inc. (global provider of investment decision support tools) (since 2017). Formerly, Director of DCT Industrial Trust Inc. (logistics real estate company) (2017-2018). |
| | | |
Susan J. Sutherland 1957 | | Trustee | | 2015 | | Private investor. Formerly, Associate, Counsel and Partner at Skadden, Arps, Slate, Meagher & Flom LLP (law firm) (1982-2013). Directorships in the Last Five Years. Formerly, Director of Montpelier Re Holdings Ltd. (global provider of customized insurance and reinsurance products) (2013-2015). |
| | | |
Scott E. Wennerholm 1959 | | Trustee | | 2016 | | Formerly, Trustee at Wheelock College (postsecondary institution) (2012-2018). Formerly, Consultant at GF Parish Group (executive recruiting firm) (2016-2017). Formerly, Chief Operating Officer and Executive Vice President at BNY Mellon Asset Management (investment management firm) (2005-2011). Formerly, Chief Operating Officer and Chief Financial Officer at Natixis Global Asset Management (investment management firm) (1997-2004). Formerly, Vice President at Fidelity Investments Institutional Services (investment management firm) (1994-1997). Directorships in the Last Five Years. None. |
| | | | | | |
| Name and Year of Birth | | Position(s) with the Trust | | Officer Since(4) | | Principal Occupation(s) During Past Five Years |
| |
| Principal Officers who are not Trustees | | |
| | | |
Payson F. Swaffield 1956 | | President | | 2003 | | Vice President and Chief Income Investment Officer of EVM and BMR. Also Vice President of Calvert Research and Management (“CRM”). |
| | | |
Maureen A. Gemma 1960 | | Vice President, Secretary and Chief Legal Officer | | 2005 | | Vice President of EVM and BMR. Also Vice President of CRM. |
| | | |
James F. Kirchner 1967 | | Treasurer | | 2007 | | Vice President of EVM and BMR. Also Vice President of CRM. |
| | | |
Richard F. Froio 1968 | | Chief Compliance Officer | | 2017 | | Vice President of EVM and BMR since 2017. Formerly Deputy Chief Compliance Officer (Adviser/Funds) and Chief Compliance Officer (Distribution) at PIMCO (2012-2017) and Managing Director at BlackRock/Barclays Global Investors (2009-2012). |
| (1) | Year first appointed to serve as Trustee for a fund in the Eaton Vance family of funds. Each Trustee has served continuously since appointment unless indicated otherwise. |
| (2) | During their respective tenures, the Trustees (except for Mmes. Frost and Sutherland and Messrs. Fetting, Gorman, Quinton, Smith and Wennerholm) also served as Board members of one or more of the following funds (which operated in the years noted): eUnitsTM 2 Year U.S. Market Participation Trust: Upside to Cap / Buffered Downside (launched in 2012 and terminated in 2014); and eUnitsTM 2 Year U.S. Market Participation Trust II: Upside to Cap / Buffered Downside (launched in 2012 and terminated in 2014). However, Ms. Mosley did not serve as a Board member of eUnitsTM 2 Year U.S. Market Participation Trust: Upside to Cap / Buffered Downside (launched in 2012 and terminated in 2014). |
| (3) | Messrs. Quinton and Smith began serving as Trustees effective October 1, 2018. |
Eaton Vance
National Limited Maturity Municipal Income Fund
March 31, 2019
Management and Organization — continued
| (4) | Year first elected to serve as officer of a fund in the Eaton Vance family of funds when the officer has served continuously. Otherwise, year of most recent election as an officer of a fund in the Eaton Vance family of funds. Titles may have changed since initial election. |
The SAI for the Fund includes additional information about the Trustees and officers of the Fund and can be obtained without charge on Eaton Vance’s website at www.eatonvance.com or by calling1-800-262-1122.
Eaton Vance Funds
IMPORTANT NOTICES
Privacy. The Eaton Vance organization is committed to ensuring your financial privacy. Each of the financial institutions identified below has in effect the following policy (“Privacy Policy”) with respect to nonpublic personal information about its customers:
| • | | Only such information received from you, through application forms or otherwise, and information about your Eaton Vance fund transactions will be collected. This may include information such as name, address, social security number, tax status, account balances and transactions. |
| • | | None of such information about you (or former customers) will be disclosed to anyone, except as permitted by law (which includes disclosure to employees necessary to service your account). In the normal course of servicing a customer’s account, Eaton Vance may share information with unaffiliated third parties that perform various required services such as transfer agents, custodians and broker-dealers. |
| • | | Policies and procedures (including physical, electronic and procedural safeguards) are in place that are designed to protect the confidentiality of such information. |
| • | | We reserve the right to change our Privacy Policy at any time upon proper notification to you. Customers may want to review our Privacy Policy periodically for changes by accessing the link on our homepage: www.eatonvance.com. |
Our pledge of privacy applies to the following entities within the Eaton Vance organization: the Eaton Vance Family of Funds, Eaton Vance Management, Eaton Vance Investment Counsel, Eaton Vance Distributors, Inc., Eaton Vance Trust Company, Eaton Vance Management (International) Limited, Eaton Vance Advisers International Ltd., Eaton Vance Management’s Real Estate Investment Group and Boston Management and Research. In addition, our Privacy Policy applies only to those Eaton Vance customers who are individuals and who have a direct relationship with us. If a customer’s account (i.e., fund shares) is held in the name of a third-party financial advisor/broker-dealer, it is likely that only such advisor’s privacy policies apply to the customer. This notice supersedes all previously issued privacy disclosures. For more information about Eaton Vance’s Privacy Policy, please call1-800-262-1122.
Delivery of Shareholder Documents. The Securities and Exchange Commission (SEC) permits funds to deliver only one copy of shareholder documents, including prospectuses, proxy statements and shareholder reports, to fund investors with multiple accounts at the same residential or post office box address. This practice is often called “householding” and it helps eliminate duplicate mailings to shareholders.Eaton Vance, or your financial advisor, may household the mailing of your documents indefinitely unless you instruct Eaton Vance, or your financial advisor, otherwise.If you would prefer that your Eaton Vance documents not be householded, please contact Eaton Vance at1-800-262-1122, or contact your financial advisor. Your instructions that householding not apply to delivery of your Eaton Vance documents will typically be effective within 30 days of receipt by Eaton Vance or your financial advisor.
Portfolio Holdings. Each Eaton Vance Fund and its underlying Portfolio(s) (if applicable) files a schedule of portfolio holdings on Part F toForm N-PORT with the SEC for the first and third quarters of each fiscal year. The FormN-PORT will be available on the Eaton Vance website at www.eatonvance.com, by calling Eaton Vance at1-800-262-1122 or in the EDGAR database on the SEC’s website at www.sec.gov.
Proxy Voting. From time to time, funds are required to vote proxies related to the securities held by the funds. The Eaton Vance Funds or their underlying Portfolios (if applicable) vote proxies according to a set of policies and procedures approved by the Funds’ and Portfolios’ Boards. You may obtain a description of these policies and procedures and information on how the Funds or Portfolios voted proxies relating to portfolio securities during the most recent12-month period ended June 30, without charge, upon request, by calling1-800-262-1122 and by accessing the SEC’s website at www.sec.gov.
This Page Intentionally Left Blank
This Page Intentionally Left Blank
Investment Adviser
Boston Management and Research
Two International Place
Boston, MA 02110
Administrator
Eaton Vance Management
Two International Place
Boston, MA 02110
Principal Underwriter*
Eaton Vance Distributors, Inc.
Two International Place
Boston, MA 02110
(617)482-8260
Custodian
State Street Bank and Trust Company
State Street Financial Center, One Lincoln Street
Boston, MA 02111
Transfer Agent
BNY Mellon Investment Servicing (US) Inc.
Attn: Eaton Vance Funds
P.O. Box 9653
Providence, RI 02940-9653
(800)262-1122
Independent Registered Public Accounting Firm
Deloitte & Touche LLP
200 Berkeley Street
Boston, MA 02116-5022
Fund Offices
Two International Place
Boston, MA 02110
| * | FINRA BrokerCheck. Investors may check the background of their Investment Professional by contacting the Financial Industry Regulatory Authority (FINRA). FINRA BrokerCheck is a free tool to help investors check the professional background of current and former FINRA-registered securities firms and brokers. FINRA BrokerCheck is available by calling1-800-289-9999 and at www.FINRA.org. The FINRA BrokerCheck brochure describing this program is available to investors at www.FINRA.org. |

14728 3.31.19

Eaton Vance
New York Municipal Opportunities Fund
Annual Report
March 31, 2019
Important Note. Beginning on January 1, 2021, as permitted by regulations adopted by the Securities and Exchange Commission, paper copies of the Fund’s annual and semi-annual shareholder reports will no longer be sent by mail unless you specifically request paper copies of the reports. Instead, the reports will be made available on the Fund’s website (eatonvance.com/funddocuments), and you will be notified by mail each time a report is posted and provided with a website address to access the report.
If you already elected to receive shareholder reports electronically, you will not be affected by this change and you need not take any action. If you are a direct investor, you may elect to receive shareholder reports and other communications from the Fund electronically by signing up fore-Delivery at eatonvance.com/edelivery. If you own your shares through a financial intermediary (such as a broker-dealer or bank), you must contact your financial intermediary to sign up.
You may elect to receive all future Fund shareholder reports in paper free of charge. If you are a direct investor, you can inform the Fund that you wish to continue receiving paper copies of your shareholder reports by calling1-800-262-1122. If you own these shares through a financial intermediary, you must contact your financial intermediary or follow instructions included with this disclosure, if applicable, to elect to continue to receive paper copies of your shareholder reports. Your election to receive reports in paper will apply to all Eaton Vance funds held directly or to all funds held through your financial intermediary, as applicable.

Commodity Futures Trading Commission Registration. Effective December 31, 2012, the Commodity Futures Trading Commission (“CFTC”) adopted certain regulatory changes that subject registered investment companies and advisers to regulation by the CFTC if a fund invests more than a prescribed level of its assets in certain CFTC-regulated instruments (including futures, certain options and swap agreements) or markets itself as providing investment exposure to such instruments. The Fund has claimed an exclusion from the definition of the term “commodity pool operator” under the Commodity Exchange Act. Accordingly, neither the Fund nor the adviser with respect to the operation of the Fund is subject to CFTC regulation. Because of its management of other strategies, the Fund’s adviser is registered with the CFTC as a commodity pool operator and a commodity trading advisor.
Fund shares are not insured by the FDIC and are not deposits or other obligations of, or guaranteed by, any depository institution. Shares are subject to investment risks, including possible loss of principal invested.
This report must be preceded or accompanied by a current summary prospectus or prospectus. Before investing, investors should consider carefully the investment objective, risks, and charges and expenses of a mutual fund. This and other important information is contained in the summary prospectus and prospectus, which can be obtained from a financial advisor. Prospective investors should read the prospectus carefully before investing. For further information, please call1-800-262-1122.
Annual ReportMarch 31, 2019
Eaton Vance
New York Municipal Opportunities Fund
Table of Contents
| | | | |
Management’s Discussion of Fund Performance | | | 2 | |
| |
Performance | | | 3 | |
| |
Fund Profile | | | 4 | |
| |
Endnotes and Additional Disclosures | | | 5 | |
| |
Fund Expenses | | | 6 | |
| |
Financial Statements | | | 7 | |
| |
Report of Independent Registered Public Accounting Firm | | | 21 | |
| |
Federal Tax Information | | | 22 | |
| |
Management and Organization | | | 23 | |
| |
Important Notices | | | 26 | |
Eaton Vance
New York Municipal Opportunities Fund
March 31, 2019
Management’s Discussion of Fund Performance1
Economic and Market Conditions
Viewed as a whole, the12-month period that began on April 1, 2018 was positive for the municipal bond market, with the Bloomberg Barclays Municipal Bond Index,2 a broad measure of the asset class, returning 5.38%.
The period was marked by a flattening of the municipal bond yield curve.7 Rates declined across the curve, but declined more for bonds with maturities of 4 years and longer than for bonds with shorter1-3 year maturities. Lower-rated6 bonds generally outperformed higher-rated issues during the period and municipal bonds outperformed comparable U.S. Treasurys. But while the fiscal year overall was positive for municipal bond performance, investors endured considerable volatility during the12-month period.
As the fiscal year began in April 2018, the municipal bond market was at the tail end of a period of rising rates, driven by signs of increasing inflation, higher wage growth and fears that recently-passed tax legislation might overheat the economy. In an effort to blunt upward pressure on inflation, the U.S. Federal Reserve Board (the Fed) announced its second rate hike of 2018 in June. At the long end of the curve, however, fluctuating perceptions of geopolitical risk were a primary driver of rates from April through the end of August 2018. Investors toggled between concern that the U.S. was initiating a global trade war and optimism about economic growth and a potential detente between the U.S. and North Korea.
In September 2018, the Fed hiked rates again and both U.S. Treasury and municipal rates rose across the curve. In October 2018, a strong U.S. employment report and easing concerns over Italy’s national budget continued the upward pressure on longer-term rates. But as 2018 came to a close, investors became increasingly concerned about a trade war with China, a looming government shutdown and dovish comments by the Fed that led investors to fear weakness in the U.S. economy, driving credit spreads wider and the futures market to project the possibility of no further rate hikes in 2019. The result was a “flight to quality” by bond investors that pushed longer-term bond prices up and rates down in the final month of 2018.
The first two months of the new year, in contrast, were a relatively quiet period for bonds. The final month of the period, however, saw rates decline across the curve, in a dramatic reversal of the market’s direction at the beginning of the period. Driven initially by an unexpectedly weak February jobs report issued in early March, the rate decline was accelerated by reports of slowing gross domestic product growth in China and Germany as well as Brexit uncertainty. Downward pressure on rates appeared
to culminate on March 20, 2019, when the Fed issued comments that were more dovish than the market had expected — leading many investors to conclude that further rate hikes were off the table for the rest of 2019.
Fund Performance
For the12-month period ended March 31, 2019, Eaton Vance New York Municipal Opportunities Fund (the Fund) Class A shares at net asset value (NAV) returned 4.75%, underperforming the 5.38% return of the Fund’s benchmark, the Bloomberg Barclays Municipal Bond Index (the Index).
In seeking to achieve its primary objective of maximizingafter-tax total return, the Fund employs a flexible investment strategy that allows it to seek opportunities, principally in the New York municipal bond market, virtually anywhere on the yield curve, anywhere on the credit curve and across different sectors. Management has the ability to be opportunistic in pursuing the Fund’safter-tax total return objective, trading holdings whenever opportunities arise, with the ability to invest up to 20% of net assets in debt obligations other thantax-exempt municipal bonds, including (but not limited to) taxable municipal obligations, U.S. Treasury securities and obligations of the U.S. Government, its agencies and instrumentalities. Up to 50% of the Fund’s net assets may be invested in below-investment-grade securities. The Fund may also hedge interest rate risk and hold leveraged investments.
Detractors from Fund performance versus the Index during the period included security selection in the health care sector, an underweight, relative to the Index, inzero-coupon bonds, which were the best-performing coupon structure in the Index during the period and an overweight in bonds with four years or less remaining to maturity.
In contrast, contributors to Fund performance relative to the Index included an overweight inBBB-rated bonds, security selection and an overweight in alternative minimum tax bonds and an insured Puerto Rico bond. This was due to strong performance of Puerto Rico’s debt during the period, as ongoing bankruptcy negotiations led to anticipation that bondholder recoveries could exceed those originally anticipated by the market. It should be noted that most uninsured bonds issued by the Commonwealth of Puerto Rico and its various conduit issuers were no longer included in the Index. As Puerto Rico continued to deal with an ongoing fiscal crisis, bonds issued by its various legal entities were impacted by a number of factors throughout the period, including monetary default. As the period ended, Puerto Rico continued to negotiate with creditors and address its current debt structure under the Puerto Rico Oversight, Management, and Economic Stability Act passed by the U.S. Congress.
See Endnotes and Additional Disclosures in this report.
Past performance is no guarantee of future results. Returns are historical and are calculated by determining the percentage change in net asset value (NAV) or offering price (as applicable) with all distributions reinvested. Investment return and principal value will fluctuate so that shares, when redeemed, may be worth more or less than their original cost. Performance less than or equal to one year is cumulative. Performance is for the stated time period only; due to market volatility, the Fund’s current performance may be lower or higher than quoted. Returns are before taxes unless otherwise noted. For performance as of the most recentmonth-end, please refer to eatonvance.com.
Eaton Vance
New York Municipal Opportunities Fund
March 31, 2019
Performance2,3
Portfolio ManagersAdam A. Weigold, CFA and Craig R. Brandon, CFA
| | | | | | | | | | | | | | | | | | | | |
| % Average Annual Total Returns | | Class
Inception Date | | | Performance
Inception Date | | | One Year | | | Five Years | | | Ten Years | |
Class A at NAV | | | 06/27/1996 | | | | 05/29/1992 | | | | 4.75 | % | | | 2.34 | % | | | 3.38 | % |
Class A with 2.25% Maximum Sales Charge | | | — | | | | — | | | | 2.42 | | | | 1.88 | | | | 3.14 | |
Class C at NAV | | | 12/08/1993 | | | | 05/29/1992 | | | | 4.09 | | | | 1.58 | | | | 2.61 | |
Class C with 1% Maximum Sales Charge | | | — | | | | — | | | | 3.09 | | | | 1.58 | | | | 2.61 | |
Class I at NAV | | | 08/03/2010 | | | | 05/29/1992 | | | | 4.91 | | | | 2.49 | | | | 3.51 | |
Bloomberg Barclays Municipal Bond Index | | | — | | | | — | | | | 5.38 | % | | | 3.73 | % | | | 4.71 | % |
| | | | | | | | | | | | | | | | | | | | |
| % Total Annual Operating Expense Ratios4 | | | | | | | | Class A | | | Class C | | | Class I | |
| | | | | | | | | | | 0.75 | % | | | 1.50 | % | | | 0.60 | % |
| | | | | | | | | | | | | | | | | | | | |
| % Distribution Rates/Yields5 | | | | | | | | Class A | | | Class C | | | Class I | |
Distribution Rate | | | | | | | | | | | 2.24 | % | | | 1.48 | % | | | 2.39 | % |
Taxable-Equivalent Distribution Rate | | | | | | | | | | | 4.15 | | | | 2.74 | | | | 4.43 | |
SEC30-day Yield | | | | | | | | | | | 1.65 | | | | 0.94 | | | | 1.83 | |
Taxable-Equivalent SEC30-day Yield | | | | | | | | | | | 3.05 | | | | 1.75 | | | | 3.39 | |
Growth of $10,000
This graph shows the change in value of a hypothetical investment of $10,000 in Class A of the Fund for the period indicated. For comparison, the same investment is shown in the indicated index.
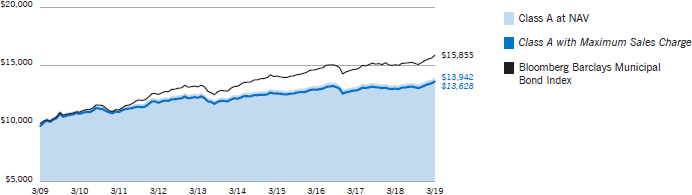
| | | | | | | | | | | | | | | | |
| Growth of Investment3 | | Amount Invested | | | Period Beginning | | | At NAV | | | With Maximum Sales Charge | |
Class C | | $ | 10,000 | | | | 03/31/2009 | | | $ | 12,942 | | | | N.A. | |
Class I | | $ | 250,000 | | | | 03/31/2009 | | | $ | 352,996 | | | | N.A. | |
See Endnotes and Additional Disclosures in this report.
Past performance is no guarantee of future results. Returns are historical and are calculated by determining the percentage change in net asset value (NAV) or offering price (as applicable) with all distributions reinvested. Investment return and principal value will fluctuate so that shares, when redeemed, may be worth more or less than their original cost. Performance less than or equal to one year is cumulative. Performance is for the stated time period only; due to market volatility, the Fund’s current performance may be lower or higher than quoted. Returns are before taxes unless otherwise noted. For performance as of the most recentmonth-end, please refer to eatonvance.com.
Eaton Vance
New York Municipal Opportunities Fund
March 31, 2019
Fund Profile
Credit Quality (% of total investments)6
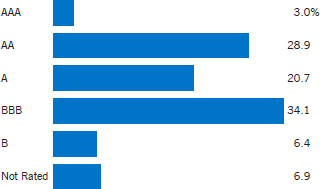
See Endnotes and Additional Disclosures in this report.
Eaton Vance
New York Municipal Opportunities Fund
March 31, 2019
Endnotes and Additional Disclosures
| 1 | The views expressed in this report are those of the portfolio manager(s) and are current only through the date stated at the top of this page. These views are subject to change at any time based upon market or other conditions, and Eaton Vance and the Fund(s) disclaim any responsibility to update such views. These views may not be relied upon as investment advice and, because investment decisions are based on many factors, may not be relied upon as an indication of trading intent on behalf of any Eaton Vance fund. This commentary may contain statements that are not historical facts, referred to as “forward looking statements.” The Fund’s actual future results may differ significantly from those stated in any forward looking statement, depending on factors such as changes in securities or financial markets or general economic conditions, the volume of sales and purchases of Fund shares, the continuation of investment advisory, administrative and service contracts, and other risks discussed from time to time in the Fund’s filings with the Securities and Exchange Commission. |
| 2 | Bloomberg Barclays Municipal Bond Index is an unmanaged index of municipal bonds traded in the U.S. Unless otherwise stated, index returns do not reflect the effect of any applicable sales charges, commissions, expenses, taxes or leverage, as applicable. It is not possible to invest directly in an index. |
| 3 | Total Returns at NAV do not include applicable sales charges. If sales charges were deducted, the returns would be lower. Total Returns shown with maximum sales charge reflect the stated maximum sales charge. Unless otherwise stated, performance does not reflect the deduction of taxes on Fund distributions or redemptions of Fund shares. |
| | Performance prior to the inception date of a class may be linked to the performance of an older class of the Fund. This linked performance is adjusted for any applicable sales charge, but is not adjusted for class expense differences. If adjusted for such differences, the performance would be different. The performance of Class I is linked to Class A. Performance since inception for an index, if presented, is the performance since the Fund’s or oldest share class’ inception, as applicable. Performance presented in the Financial Highlights included in the financial statements is not linked. |
| | Performance prior to April 25, 2016 reflects the Fund’s performance under its former investment objective and policies. |
| 4 | Source: Fund prospectus. The expense ratios for the current reporting period can be found in the Financial Highlights section of this report. |
| 5 | The Distribution Rate is based on the Fund’s last regular distribution per share in the period (annualized) divided by the Fund’s NAV at the end of the period. The Fund’s distributions may be comprised of amounts characterized for federal income tax purposes astax-exempt income, qualified andnon-qualified ordinary dividends, capital gains and nondividend distributions, also known as return of capital. The Fund will determine the federal income tax character of distributions paid to a shareholder after the end of the calendar year. This is reported on the IRS form1099-DIV and provided to the shareholder shortly after eachyear-end. The Fund’s distributions are determined by the investment adviser based on its current assessment of the Fund’s long-term return potential. As portfolio and market conditions change, the rate of distributions paid by the Fund could change. Taxable-equivalent performance is based on the highest combined federal and state income tax rates, where applicable. Lower tax rates would result in lowertax-equivalent performance. Actual tax rates will vary depending on your income, exemptions and deductions. Rates do not include local taxes. The SEC Yield is a standardized measure based on the estimated yield to maturity of a fund’s investments over a30-day period and is based on the maximum offer price at the date specified. The SEC Yield is not based on the distributions made by the Fund, which may differ. |
| 6 | Ratings are based on Moody’s Investors Service, Inc. (“Moody’s”), S&P Global Ratings (“S&P”) or Fitch Ratings (“Fitch”), as applicable. If securities are rated differently by the ratings agencies, the highest rating is applied. Ratings, which are subject to change, apply to the creditworthiness of the issuers of the underlying securities and not to the Fund or its shares. Credit ratings measure the quality of a bond based on the issuer’s creditworthiness, with ratings ranging from AAA, being the highest, to D, being the lowest based on S&P’s measures. Ratings of BBB or higher by S&P or Fitch (Baa or higher by Moody’s) are considered to be investment-grade quality. Credit ratings are based largely on the ratings agency’s analysis at the time of rating. The rating assigned to any particular security is not necessarily a reflection of the issuer’s current financial condition and does not necessarily reflect its assessment of the volatility of a security’s market value or of the liquidity of an investment in the security. Holdings designated as “Not Rated” (if any) are not rated by the national ratings agencies stated above. |
| 7 | Yield curve is a graphical representation of the yields offered by bonds of various maturities. The yield curve flattens when long-term rates fall and/or short-term rates increase, and the yield curve steepens when long-term rates increase and/or short-term rates fall. |
| | Fund profile subject to change due to active management. |
Eaton Vance
New York Municipal Opportunities Fund
March 31, 2019
Fund Expenses
Example: As a Fund shareholder, you incur two types of costs: (1) transaction costs, including sales charges (loads) on purchases and redemption fees (if applicable); and (2) ongoing costs, including management fees; distribution and/or service fees; and other Fund expenses. This Example is intended to help you understand your ongoing costs (in dollars) of Fund investing and to compare these costs with the ongoing costs of investing in other mutual funds. The Example is based on an investment of $1,000 invested at the beginning of the period and held for the entire period (October 1, 2018 – March 31, 2019).
Actual Expenses: The first section of the table below provides information about actual account values and actual expenses. You may use the information in this section, together with the amount you invested, to estimate the expenses that you paid over the period. Simply divide your account value by $1,000 (for example, an $8,600 account value divided by $1,000 = 8.6), then multiply the result by the number in the first section under the heading entitled “Expenses Paid During Period” to estimate the expenses you paid on your account during this period.
Hypothetical Example for Comparison Purposes: The second section of the table below provides information about hypothetical account values and hypothetical expenses based on the actual Fund expense ratio and an assumed rate of return of 5% per year (before expenses), which is not the actual Fund return. The hypothetical account values and expenses may not be used to estimate the actual ending account balance or expenses you paid for the period. You may use this information to compare the ongoing costs of investing in your Fund and other funds. To do so, compare this 5% hypothetical example with the 5% hypothetical examples that appear in the shareholder reports of the other funds.
Please note that the expenses shown in the table are meant to highlight your ongoing costs only and do not reflect any transactional costs, such as sales charges (loads) or redemption fees (if applicable). Therefore, the second section of the table is useful in comparing ongoing costs only, and will not help you determine the relative total costs of owning different funds. In addition, if these transactional costs were included, your costs would be higher.
| | | | | | | | | | | | | | | | |
| | | Beginning
Account Value
(10/1/18) | | | Ending
Account Value
(3/31/19) | | | Expenses Paid
During Period*
(10/1/18 – 3/31/19) | | | Annualized
Expense
Ratio | |
| | | | |
Actual | | | | | | | | | | | | | | | | |
Class A | | $ | 1,000.00 | | | $ | 1,038.70 | | | $ | 4.12 | | | | 0.81 | % |
Class C | | $ | 1,000.00 | | | $ | 1,036.20 | | | $ | 7.92 | | | | 1.56 | % |
Class I | | $ | 1,000.00 | | | $ | 1,039.50 | | | $ | 3.36 | | | | 0.66 | % |
| | | | | |
Hypothetical | | | | | | | | | | | | | | | | |
(5% return per year before expenses) | | | | | | | | | | | | | | | | |
Class A | | $ | 1,000.00 | | | $ | 1,020.90 | | | $ | 4.08 | | | | 0.81 | % |
Class C | | $ | 1,000.00 | | | $ | 1,017.20 | | | $ | 7.85 | | | | 1.56 | % |
Class I | | $ | 1,000.00 | | | $ | 1,021.60 | | | $ | 3.33 | | | | 0.66 | % |
| * | Expenses are equal to the Fund’s annualized expense ratio for the indicated Class, multiplied by the average account value over the period, multiplied by 182/365 (to reflect theone-half year period). The Example assumes that the $1,000 was invested at the net asset value per share determined at the close of business on September 30, 2018. |
Eaton Vance
New York Municipal Opportunities Fund
March 31, 2019
Portfolio of Investments
| | | | | | | | |
| Tax-Exempt Municipal Securities — 90.0% | |
| Security | | Principal Amount (000’s omitted) | | | Value | |
|
| Bond Bank — 1.6% | |
| | |
New York State Environmental Facilities Corp., (New York City Municipal Water Finance Authority), 5.00%, 6/15/36 | | $ | 1,000 | | | $ | 1,213,650 | |
| | |
| | | | | | | $ | 1,213,650 | |
|
| Cogeneration — 0.4% | |
| | |
Suffolk County Industrial Development Agency, (Nissequogue Cogeneration Partners Facility), (AMT), 5.50%, 1/1/23 | | $ | 310 | | | $ | 310,121 | |
| | |
| | | | | | | $ | 310,121 | |
|
| Education — 14.7% | |
| | |
Buffalo and Erie County Industrial Land Development Corp., (Global Concepts Charter School), 5.00%, 10/1/37 | | $ | 405 | | | $ | 466,398 | |
| | |
Dutchess County Local Development Corp., (Culinary Institute of America), 5.00%, 7/1/26 | | | 300 | | | | 353,496 | |
| | |
Dutchess County Local Development Corp., (Culinary Institute of America), 5.00%, 7/1/27 | | | 330 | | | | 386,842 | |
| | |
Dutchess County Local Development Corp., (Culinary Institute of America), 5.00%, 7/1/28 | | | 200 | | | | 233,240 | |
| | |
Dutchess County Local Development Corp., (Marist College), 5.00%, 7/1/28 | | | 110 | | | | 137,628 | |
| | |
Dutchess County Local Development Corp., (Marist College), 5.00%, 7/1/29 | | | 130 | | | | 161,305 | |
| | |
Hempstead Local Development Corp., (Molloy College), 5.00%, 7/1/25 | | | 775 | | | | 896,497 | |
| | |
Monroe County Industrial Development Corp., (Nazareth College of Rochester), 5.00%, 10/1/24 | | | 885 | | | | 1,008,103 | |
| | |
Monroe County Industrial Development Corp., (Nazareth College of Rochester), 5.00%, 10/1/25 | | | 930 | | | | 1,075,071 | |
| | |
Monroe County Industrial Development Corp., (St. John Fisher College), 5.00%, 6/1/21 | | | 930 | | | | 994,812 | |
| | |
New York Dormitory Authority, (Columbia University), 5.00%, 10/1/38 | | | 545 | | | | 659,494 | |
| | |
New York Dormitory Authority, (Culinary Institute of America), 5.00%, 7/1/23 | | | 250 | | | | 279,800 | |
| | |
New York Dormitory Authority, (New York University), 5.00%, 7/1/27 | | | 570 | | | | 713,355 | |
| | |
New York Dormitory Authority, (New York University), 5.00%, 7/1/39 | | | 500 | | | | 609,360 | |
| | |
New York Dormitory Authority, (Pace University), 4.00%, 5/1/22 | | | 500 | | | | 526,350 | |
| | |
New York Dormitory Authority, (Yeshiva University), 5.00%, 11/1/20 | | | 2,265 | | | | 2,357,548 | |
| | |
| | | | | | | $ | 10,859,299 | |
| | | | | | | | |
| Security | | Principal Amount (000’s omitted) | | | Value | |
|
| Electric Utilities — 0.9% | |
| | |
Long Island Power Authority, Electric System Revenue, 5.00%, 9/1/28 | | $ | 500 | | | $ | 626,460 | |
| | |
| | | | | | | $ | 626,460 | |
|
| Escrowed / Prerefunded — 0.6% | |
| | |
Triborough Bridge and Tunnel Authority, Escrowed to Maturity, 5.00%, 1/1/20 | | $ | 410 | | | $ | 420,955 | |
| | |
| | | | | | | $ | 420,955 | |
|
| General Obligations — 7.8% | |
| | |
Albany County, 4.00%, 4/1/29 | | $ | 1,835 | | | $ | 2,094,854 | |
| | |
Dutchess County, 2019 Series A, 4.00%, 3/1/30 | | | 795 | | | | 916,341 | |
| | |
Dutchess County, 2019 Series B, 4.00%, 3/1/30 | | | 435 | | | | 501,394 | |
| | |
Elmira, 3.50%, 5/24/19(1) | | | 725 | | | | 725,609 | |
| | |
New York City, 4.00%, 8/1/34 | | | 460 | | | | 502,352 | |
| | |
New York, 5.00%, 3/1/28 | | | 800 | | | | 1,024,088 | |
| | |
| | | | | | | $ | 5,764,638 | |
|
| Hospital — 13.0% | |
| | |
Jefferson County Civic Facility Development Corp., (Samaritan Medical Center), 4.00%, 11/1/28 | | $ | 1,390 | | | $ | 1,489,177 | |
| | |
Jefferson County Civic Facility Development Corp., (Samaritan Medical Center), 4.00%, 11/1/29 | | | 1,000 | | | | 1,064,200 | |
| | |
Jefferson County Civic Facility Development Corp., (Samaritan Medical Center), 5.00%, 11/1/25 | | | 1,305 | | | | 1,478,343 | |
| | |
Monroe County Industrial Development Corp., (Rochester General Hospital), 4.00%, 12/1/22 | | | 820 | | | | 880,434 | |
| | |
Nassau County Local Economic Assistance and Financing Corp., (Catholic Health Services of Long Island), 5.00%, 7/1/22 | | | 1,000 | | | | 1,068,570 | |
| | |
Nassau County Local Economic Assistance Corp., (Catholic Health Services of Long Island), 5.00%, 7/1/23 | | | 500 | | | | 560,900 | |
| | |
New York Dormitory Authority, (NYU Hospital Center), 5.00%, 7/1/20 | | | 740 | | | | 771,021 | |
| | |
New York Dormitory Authority, (Orange Regional Medical Center), 5.00%, 12/1/23(1) | | | 400 | | | | 447,852 | |
| | |
New York Dormitory Authority, (Orange Regional Medical Center), 5.00%, 12/1/24(1) | | | 600 | | | | 684,468 | |
| | |
New York Dormitory Authority, (Orange Regional Medical Center), 5.00%, 12/1/25(1) | | | 500 | | | | 575,885 | |
| | |
New York Dormitory Authority, (Orange Regional Medical Center), 5.00%, 12/1/26(1) | | | 500 | | | | 588,950 | |
| | |
| | | | | | | $ | 9,609,800 | |
| | | | |
| | 7 | | See Notes to Financial Statements. |
Eaton Vance
New York Municipal Opportunities Fund
March 31, 2019
Portfolio of Investments — continued
| | | | | | | | |
| Security | | Principal Amount (000’s omitted) | | | Value | |
|
| Housing — 1.9% | |
| | |
Albany Capital Resource Corp., (Empire Commons Student Housing, Inc.), 5.00%, 5/1/25 | | $ | 300 | | | $ | 350,457 | |
| | |
Albany Capital Resource Corp., (Empire Commons Student Housing, Inc.), 5.00%, 5/1/26 | | | 300 | | | | 356,484 | |
| | |
Westchester County Local Development Corp., (Purchase Housing Corp. II), 5.00%, 6/1/23 | | | 95 | | | | 105,923 | |
| | |
Westchester County Local Development Corp., (Purchase Housing Corp. II), 5.00%, 6/1/24 | | | 165 | | | | 187,484 | |
| | |
Westchester County Local Development Corp., (Purchase Housing Corp. II), 5.00%, 6/1/25 | | | 170 | | | | 196,466 | |
| | |
Westchester County Local Development Corp., (Purchase Housing Corp. II), 5.00%, 6/1/26 | | | 170 | | | | 199,449 | |
| | |
| | | | | | | $ | 1,396,263 | |
|
| Industrial Development Revenue — 6.5% | |
| | |
New York Energy Research and Development Authority, (New York Electric and Gas Corp.), 2.00% to 5/1/20 (Put Date), 6/1/29 | | $ | 1,500 | | | $ | 1,506,870 | |
| | |
New York Energy Research and Development Authority, (Rochester Gas and Electric Corp.), 2.875% to 7/1/25 (Put Date), 5/15/32 | | | 1,155 | | | | 1,191,486 | |
| | |
New York State Environmental Facilities Corp., (Casella Waste Systems, Inc.), (AMT), 3.125% to 6/1/26 (Put Date), 12/1/44(1) | | | 1,000 | | | | 931,690 | |
| | |
New York State Environmental Facilities Corp., (Casella Waste Systems, Inc.), (AMT), 3.75% to 12/2/19 (Put Date), 12/1/44(1) | | | 535 | | | | 538,494 | |
| | |
Niagara Area Development Corp., (Covanta), 3.50%, 11/1/24(1) | | | 610 | | | | 623,774 | |
| | |
| | | | | | | $ | 4,792,314 | |
|
| Insured – Education — 3.8% | |
| | |
New York Dormitory Authority, (Educational Housing Services), (AMBAC), 5.25%, 7/1/20 | | $ | 1,420 | | | $ | 1,475,806 | |
| | |
New York Dormitory Authority, (St. John’s University), (NPFG), 5.25%, 7/1/21 | | | 1,200 | | | | 1,294,416 | |
| | |
| | | | | | | $ | 2,770,222 | |
|
| Insured – Electric Utilities — 3.0% | |
| | |
Puerto Rico Electric Power Authority, (NPFG), 5.25%, 7/1/29 | | $ | 2,050 | | | $ | 2,214,964 | |
| | |
| | | | | | | $ | 2,214,964 | |
|
| Insured – General Obligations — 2.6% | |
| | |
Clinton County, (AGM), (AMT), 3.50%, 6/1/27 | | $ | 1,000 | | | $ | 1,065,090 | |
| | |
Mount Vernon School District, (AGM), 5.00%, 8/15/24 | | | 735 | | | | 815,843 | |
| | |
| | | | | | | $ | 1,880,933 | |
| | | | | | | | |
| Security | | Principal Amount (000’s omitted) | | | Value | |
|
| Insured – Special Tax Revenue — 3.2% | |
| | |
New York Thruway Authority, Miscellaneous Tax Revenue, (AMBAC), 5.50%, 4/1/20 | | $ | 2,235 | | | $ | 2,324,065 | |
| | |
| | | | | | | $ | 2,324,065 | |
|
| Other Revenue — 3.1% | |
| | |
Albany Parking Authority, 5.00%, 7/15/23 | | $ | 700 | | | $ | 783,818 | |
| | |
Chautauqua County Capital Resource Corp., (Jamestown Center City Development Corp.), 1.70% to 11/1/19 (Put Date), 11/1/31 | | | 1,200 | | | | 1,199,100 | |
| | |
New York City Trust for Cultural Resources, (Alvin Ailey Dance Foundation), 5.00%, 7/1/27 | | | 265 | | | | 317,467 | |
| | |
| | | | | | | $ | 2,300,385 | |
|
| Senior Living / Life Care — 6.5% | |
| | |
Brookhaven Local Development Corp., (Jeffersons Ferry), 5.25%, 11/1/25 | | $ | 750 | | | $ | 858,885 | |
| | |
Buffalo and Erie County Industrial Land Development Corp., (Orchard Park CCRC, Inc.), 5.00%, 11/15/23 | | | 1,455 | | | | 1,594,083 | |
| | |
New York Dormitory Authority, (Miriam Osborn Memorial Home Association), 5.00%, 7/1/24 | | | 750 | | | | 757,665 | |
| | |
Tompkins County Development Corp., (Kendal at Ithaca, Inc.), 3.25%, 7/1/22 | | | 450 | | | | 455,481 | |
| | |
Westchester County Local Development Corp., (Kendal on Hudson), 3.00%, 1/1/20 | | | 625 | | | | 629,000 | |
| | |
Westchester County Local Development Corp., (Kendal on Hudson), 4.00%, 1/1/23 | | | 500 | | | | 527,775 | |
| | |
| | | | | | | $ | 4,822,889 | |
|
| Special Tax Revenue — 7.2% | |
| | |
New York City Transitional Finance Authority, Future Tax Revenue, Prerefunded to 5/1/19, 5.00%, 5/1/24 | | $ | 1,900 | | | $ | 1,905,396 | |
| | |
New York City Transitional Finance Authority, Future Tax Revenue, 4.00%, 5/1/30 | | | 175 | | | | 195,088 | |
| | |
New York Dormitory Authority, Sales Tax Revenue, (AMT), 5.00%, 3/15/30 | | | 1,875 | | | | 2,289,300 | |
| | |
Sales Tax Asset Receivable Corp., 4.00%, 10/15/32 | | | 820 | | | | 905,649 | |
| | |
| | | | | | | $ | 5,295,433 | |
|
| Transportation — 13.2% | |
| | |
New York Transportation Development Corp., (Delta Airlines,Inc. - LaGuardia Airport Terminals C&D Redevelopment), (AMT), 5.00%, 1/1/29 | | $ | 2,000 | | | $ | 2,374,560 | |
| | |
New York Transportation Development Corp., (Terminal One Group Association, L.P.), (AMT), 5.00%, 1/1/22 | | | 605 | | | | 651,107 | |
| | |
Niagara Frontier Transportation Authority, (Buffalo Niagara International Airport), (AMT), 5.00%, 4/1/24 | | | 795 | | | | 900,019 | |
| | | | |
| | 8 | | See Notes to Financial Statements. |
Eaton Vance
New York Municipal Opportunities Fund
March 31, 2019
Portfolio of Investments — continued
| | | | | | | | |
| Security | | Principal Amount (000’s omitted) | | | Value | |
|
| Transportation (continued) | |
| | |
Niagara Frontier Transportation Authority, (Buffalo Niagara International Airport), (AMT), 5.00%, 4/1/28 | | $ | 520 | | | $ | 625,170 | |
| | |
Niagara Frontier Transportation Authority, (Buffalo Niagara International Airport), (AMT), 5.00%, 4/1/29 | | | 275 | | | | 333,737 | |
| | |
Niagara Frontier Transportation Authority, (Buffalo Niagara International Airport), (AMT), 5.00%, 4/1/30 | | | 375 | | | | 450,848 | |
| | |
Port Authority of New York and New Jersey, (AMT), 4.00%, 7/15/31 | | | 600 | | | | 631,092 | |
| | |
Port Authority of New York and New Jersey, (AMT), 5.00%, 9/15/27 | | | 2,250 | | | | 2,765,092 | |
| | |
Port Authority of New York and New Jersey, (AMT), 5.00%, 10/15/28 | | | 130 | | | | 157,265 | |
| | |
Port Authority of New York and New Jersey, (AMT), 5.00%, 10/15/35 | | | 745 | | | | 869,475 | |
| | |
| | | | | | | $ | 9,758,365 | |
| |
TotalTax-Exempt Municipal Securities — 90.0%
(identified cost $64,116,321) | | | $ | 66,360,756 | |
|
| Taxable Municipal Securities — 3.9% | |
| Security | | Principal Amount (000’s omitted) | | | Value | |
|
| Other Revenue — 2.5% | |
| | |
Brooklyn Arena Local Development Corp., (Barclays Center), 4.391%, 7/15/41 | | $ | 2,000 | | | $ | 1,867,660 | |
| | |
| | | | | | | $ | 1,867,660 | |
|
| Transportation — 1.4% | |
| | |
New York Transportation Development Corp., (LaGuardia Airport Terminal B Redevelopment), 3.673%, 7/1/30 | | $ | 1,000 | | | $ | 991,890 | |
| | |
| | | | | | | $ | 991,890 | |
| |
Total Taxable Municipal Securities — 3.9%
(identified cost $3,000,000) | | | $ | 2,859,550 | |
| | | | | | | | |
| Miscellaneous — 0.6% | |
| Security | | Units | | | Value | |
|
| Real Estate — 0.6% | |
| | |
CMS Liquidating Trust(1)(2)(3) | | | 150 | | | $ | 433,481 | |
| |
Total Miscellaneous — 0.6%
(identified cost $480,000) | | | $ | 433,481 | |
| |
Total Investments — 94.5%
(identified cost $67,596,321) | | | $ | 69,653,787 | |
| |
Other Assets, Less Liabilities — 5.5% | | | $ | 4,081,613 | |
| |
Net Assets — 100.0% | | | $ | 73,735,400 | |
The percentage shown for each investment category in the Portfolio of Investments is based on net assets.
The Fund invests primarily in debt securities issued by New York municipalities. The ability of the issuers of the debt securities to meet their obligations may be affected by economic developments in a specific industry or municipality. In order to reduce the risk associated with such economic developments, at March 31, 2019, 13.2% of total investments are backed by bond insurance of various financial institutions and financial guaranty assurance agencies. The aggregate percentage insured by an individual financial institution or financial guaranty assurance agency ranged from 2.7% to 5.5% of total investments.
| (1) | Security exempt from registration pursuant to Rule 144A under the Securities Act of 1933, as amended. These securities may be sold in certain transactions in reliance on an exemption from registration (normally to qualified institutional buyers). At March 31, 2019, the aggregate value of these securities is $5,550,203 or 7.5% of the Fund’s net assets. |
| (2) | Non-income producing security. |
| (3) | For fair value measurement disclosure purposes, security is categorized as Level 3 (see Note 9). |
Abbreviations:
| | | | |
| | |
| AGM | | – | | Assured Guaranty Municipal Corp. |
| | |
| AMBAC | | – | | AMBAC Financial Group, Inc. |
| | |
| AMT | | – | | Interest earned from these securities may be considered a tax preference item for purposes of the Federal Alternative Minimum Tax. |
| | |
| NPFG | | – | | National Public Finance Guarantee Corp. |
| | | | |
| | 9 | | See Notes to Financial Statements. |
Eaton Vance
New York Municipal Opportunities Fund
March 31, 2019
Statement of Assets and Liabilities
| | | | |
| Assets | | March 31, 2019 | |
| |
Investments, at value (identified cost, $67,596,321) | | $ | 69,653,787 | |
| |
Cash | | | 3,519,955 | |
| |
Interest receivable | | | 924,568 | |
| |
Receivable for Fund shares sold | | | 32,321 | |
| |
Total assets | | $ | 74,130,631 | |
| |
| Liabilities | | | | |
| |
Payable for Fund shares redeemed | | $ | 248,381 | |
| |
Distributions payable | | | 32,112 | |
| |
Payable to affiliates: | | | | |
| |
Investment adviser fee | | | 23,686 | |
| |
Distribution and service fees | | | 13,817 | |
| |
Accrued expenses | | | 77,235 | |
| |
Total liabilities | | $ | 395,231 | |
| |
Net Assets | | $ | 73,735,400 | |
|
| Sources of Net Assets | |
| |
Paid-in capital | | $ | 73,287,191 | |
| |
Distributable earnings | | | 448,209 | |
| |
Net Assets | | $ | 73,735,400 | |
| |
| Class A Shares | | | | |
| |
Net Assets | | $ | 42,073,079 | |
| |
Shares Outstanding | | | 4,261,140 | |
| |
Net Asset Value and Redemption Price Per Share | | | | |
| |
(net assets ÷ shares of beneficial interest outstanding) | | $ | 9.87 | |
| |
Maximum Offering Price Per Share | | | | |
| |
(100 ÷ 97.75 of net asset value per share) | | $ | 10.10 | |
|
| Class C Shares | |
| |
Net Assets | | $ | 10,662,754 | |
| |
Shares Outstanding | | | 1,135,947 | |
| |
Net Asset Value and Offering Price Per Share* | | | | |
| |
(net assets ÷ shares of beneficial interest outstanding) | | $ | 9.39 | |
|
| Class I Shares | |
| |
Net Assets | | $ | 20,999,567 | |
| |
Shares Outstanding | | | 2,126,575 | |
| |
Net Asset Value, Offering Price and Redemption Price Per Share | | | | |
| |
(net assets ÷ shares of beneficial interest outstanding) | | $ | 9.87 | |
On sales of $100,000 or more ($50,000 or more for certain financial intermediaries, as disclosed in an appendix to the Fund’s prospectus), the offering price of Class A shares is reduced.
| * | Redemption price per share is equal to the net asset value less any applicable contingent deferred sales charge. |
| | | | |
| | 10 | | See Notes to Financial Statements. |
Eaton Vance
New York Municipal Opportunities Fund
March 31, 2019
Statement of Operations
| | | | |
| Investment Income | | Year Ended March 31, 2019 | |
| |
Interest | | $ | 2,427,534 | |
| |
Total investment income | | $ | 2,427,534 | |
| |
| Expenses | | | | |
| |
Investment adviser fee | | $ | 291,112 | |
| |
Distribution and service fees | | | | |
| |
Class A | | | 63,225 | |
| |
Class C | | | 130,094 | |
| |
Trustees’ fees and expenses | | | 4,012 | |
| |
Custodian fee | | | 35,651 | |
| |
Transfer and dividend disbursing agent fees | | | 33,031 | |
| |
Legal and accounting services | | | 52,892 | |
| |
Printing and postage | | | 16,204 | |
| |
Registration fees | | | 5,513 | |
| |
Miscellaneous | | | 29,383 | |
| |
Total expenses | | $ | 661,117 | |
| |
Net investment income | | $ | 1,766,417 | |
| |
| Realized and Unrealized Gain (Loss) | | | | |
| |
Net realized gain (loss) — | | | | |
| |
Investment transactions | | $ | 16,458 | |
| |
Net realized gain | | $ | 16,458 | |
| |
Change in unrealized appreciation (depreciation) — | | | | |
| |
Investments | | $ | 1,466,802 | |
| |
Net change in unrealized appreciation (depreciation) | | $ | 1,466,802 | |
| |
Net realized and unrealized gain | | $ | 1,483,260 | |
| |
Net increase in net assets from operations | | $ | 3,249,677 | |
| | | | |
| | 11 | | See Notes to Financial Statements. |
Eaton Vance
New York Municipal Opportunities Fund
March 31, 2019
Statements of Changes in Net Assets
| | | | | | | | |
| | | Year Ended March 31, | |
| Increase (Decrease) in Net Assets | | 2019 | | | 2018 | |
| | |
From operations — | | | | | | | | |
| | |
Net investment income | | $ | 1,766,417 | | | $ | 2,017,297 | |
| | |
Net realized gain | | | 16,458 | | | | 18,133 | |
| | |
Net change in unrealized appreciation (depreciation) | | | 1,466,802 | | | | (872,543 | ) |
| | |
Net increase in net assets from operations | | $ | 3,249,677 | | | $ | 1,162,887 | |
| | |
Distributions to shareholders(1) — | | | | | | | | |
| | |
Class A | | $ | (1,053,639 | ) | | $ | (1,202,318 | ) |
| | |
Class C | | | (253,026 | ) | | | (321,944 | ) |
| | |
Class I | | | (434,034 | ) | | | (468,216 | ) |
| | |
Total distributions to shareholders | | $ | (1,740,699 | ) | | $ | (1,992,478 | ) |
| | |
Transactions in shares of beneficial interest — | | | | | | | | |
| | |
Proceeds from sale of shares | | | | | | | | |
| | |
Class A | | $ | 1,414,558 | | | $ | 3,944,375 | |
| | |
Class C | | | 871,596 | | | | 821,113 | |
| | |
Class I | | | 11,048,304 | | | | 4,229,976 | |
| | |
Net asset value of shares issued to shareholders in payment of distributions declared | | | | | | | | |
| | |
Class A | | | 893,454 | | | | 1,024,589 | |
| | |
Class C | | | 187,700 | | | | 230,971 | |
| | |
Class I | | | 245,416 | | | | 254,211 | |
| | |
Cost of shares redeemed | | | | | | | | |
| | |
Class A | | | (9,089,115 | ) | | | (12,138,361 | ) |
| | |
Class C | | | (3,316,590 | ) | | | (7,365,227 | ) |
| | |
Class I | | | (6,965,816 | ) | | | (5,850,641 | ) |
| | |
Net asset value of shares converted | | | | | | | | |
| | |
Class A | | | 3,646,530 | | | | — | |
| | |
Class C | | | (3,646,530 | ) | | | — | |
| | |
Net decrease in net assets from Fund share transactions | | $ | (4,710,493 | ) | | $ | (14,848,994 | ) |
| | |
Net decrease in net assets | | $ | (3,201,515 | ) | | $ | (15,678,585 | ) |
| | |
| Net Assets | | | | | | | | |
| | |
At beginning of year | | $ | 76,936,915 | | | $ | 92,615,500 | |
| | |
At end of year | | $ | 73,735,400 | | | $ | 76,936,915 | (2) |
| (1) | For the year ended March 31, 2018, the source of distributions was from net investment income. The current year presentation of distributions conforms with the Disclosure Update and Simplification Rule issued by the Securities and Exchange commission, effective November 5, 2018. |
| (2) | Includes accumulated undistributed net investment income of $7,339 at March 31, 2018. The requirement to disclose the corresponding amount as of March 31, 2019 was eliminated. |
| | | | |
| | 12 | | See Notes to Financial Statements. |
Eaton Vance
New York Municipal Opportunities Fund
March 31, 2019
Financial Highlights
| | | | | | | | | | | | | | | | | | | | |
| | | Class A | |
| |
| | | Year Ended March 31, | |
| | | 2019 | | | 2018 | | | 2017 | | | 2016 | | | 2015 | |
| | | | | |
Net asset value — Beginning of year | | $ | 9.660 | | | $ | 9.770 | | | $ | 10.090 | | | $ | 10.110 | | | $ | 10.030 | |
| | | | | |
| Income (Loss) From Operations | | | | | | | | | | | | | | | | | | | | |
| | | | | |
Net investment income(1) | | $ | 0.245 | | | $ | 0.241 | | | $ | 0.269 | | | $ | 0.275 | | | $ | 0.295 | |
| | | | | |
Net realized and unrealized gain (loss) | | | 0.207 | | | | (0.113 | ) | | | (0.322 | ) | | | (0.023 | ) | | | 0.077 | |
| | | | | |
Total income (loss) from operations | | $ | 0.452 | | | $ | 0.128 | | | $ | (0.053 | ) | | $ | 0.252 | | | $ | 0.372 | |
| | | | | |
| Less Distributions | | | | | | | | | | | | | | | | | | | | |
| | | | | |
From net investment income | | $ | (0.242 | ) | | $ | (0.238 | ) | | $ | (0.267 | ) | | $ | (0.272 | ) | | $ | (0.292 | ) |
| | | | | |
Total distributions | | $ | (0.242 | ) | | $ | (0.238 | ) | | $ | (0.267 | ) | | $ | (0.272 | ) | | $ | (0.292 | ) |
| | | | | |
Net asset value — End of year | | $ | 9.870 | | | $ | 9.660 | | | $ | 9.770 | | | $ | 10.090 | | | $ | 10.110 | |
| | | | | |
Total Return(2) | | | 4.75 | % | | | 1.30 | % | | | (0.55 | )% | | | 2.54 | % | | | 3.74 | % |
| | | | | |
| Ratios/Supplemental Data | | | | | | | | | | | | | | | | | | | | |
| | | | | |
Net assets, end of year (000’s omitted) | | $ | 42,073 | | | $ | 44,330 | | | $ | 51,983 | | | $ | 47,738 | | | $ | 51,458 | |
| | | | | |
Ratios (as a percentage of average daily net assets): | | | | | | | | | | | | | | | | | | | | |
| | | | | |
Expenses(3) | | | 0.79 | % | | | 0.75 | % | | | 0.74 | % | | | 0.75 | % | | | 0.77 | % |
| | | | | |
Net investment income | | | 2.54 | % | | | 2.45 | % | | | 2.70 | % | | | 2.74 | % | | | 2.91 | % |
| | | | | |
Portfolio Turnover | | | 54 | % | | | 66 | % | | | 68 | % | | | 9 | % | | | 8 | % |
| (1) | Computed using average shares outstanding. |
| (2) | Returns are historical and are calculated by determining the percentage change in net asset value with all distributions reinvested and do not reflect the effect of sales charges. |
| (3) | Excludes the effect of custody fee credits, if any, of less than 0.005%. Effective September 1, 2015, custody fee credits, which were earned on cash deposit balances, were discontinued by the custodian. |
| | | | |
| | 13 | | See Notes to Financial Statements. |
Eaton Vance
New York Municipal Opportunities Fund
March 31, 2019
Financial Highlights — continued
| | | | | | | | | | | | | | | | | | | | |
| | | Class C | |
| |
| | | Year Ended March 31, | |
| | | 2019 | | | 2018 | | | 2017 | | | 2016 | | | 2015 | |
| | | | | |
Net asset value — Beginning of year | | $ | 9.180 | | | $ | 9.290 | | | $ | 9.590 | | | $ | 9.610 | | | $ | 9.540 | |
| | | | | |
| Income (Loss) From Operations | | | | | | | | | | | | | | | | | | | | |
| | | | | |
Net investment income(1) | | $ | 0.164 | | | $ | 0.159 | | | $ | 0.185 | | | $ | 0.190 | | | $ | 0.208 | |
| | | | | |
Net realized and unrealized gain (loss) | | | 0.207 | | | | (0.113 | ) | | | (0.302 | ) | | | (0.023 | ) | | | 0.067 | |
| | | | | |
Total income (loss) from operations | | $ | 0.371 | | | $ | 0.046 | | | $ | (0.117 | ) | | $ | 0.167 | | | $ | 0.275 | |
| | | | | |
| Less Distributions | | | | | | | | | | | | | | | | | | | | |
| | | | | |
From net investment income | | $ | (0.161 | ) | | $ | (0.156 | ) | | $ | (0.183 | ) | | $ | (0.187 | ) | | $ | (0.205 | ) |
| | | | | |
Total distributions | | $ | (0.161 | ) | | $ | (0.156 | ) | | $ | (0.183 | ) | | $ | (0.187 | ) | | $ | (0.205 | ) |
| | | | | |
Net asset value — End of year | | $ | 9.390 | | | $ | 9.180 | | | $ | 9.290 | | | $ | 9.590 | | | $ | 9.610 | |
| | | | | |
Total Return(2) | | | 4.09 | % | | | 0.48 | % | | | (1.24 | )% | | | 1.77 | % | | | 2.90 | % |
| | | | | |
| Ratios/Supplemental Data | | | | | | | | | | | | | | | | | | | | |
| | | | | |
Net assets, end of year (000’s omitted) | | $ | 10,663 | | | $ | 16,306 | | | $ | 22,763 | | | $ | 26,312 | | | $ | 26,342 | |
| | | | | |
Ratios (as a percentage of average daily net assets): | | | | | | | | | | | | | | | | | | | | |
| | | | | |
Expenses(3) | | | 1.54 | % | | | 1.50 | % | | | 1.50 | % | | | 1.50 | % | | | 1.52 | % |
| | | | | |
Net investment income | | | 1.79 | % | | | 1.71 | % | | | 1.95 | % | | | 1.99 | % | | | 2.16 | % |
| | | | | |
Portfolio Turnover | | | 54 | % | | | 66 | % | | | 68 | % | | | 9 | % | | | 8 | % |
| (1) | Computed using average shares outstanding. |
| (2) | Returns are historical and are calculated by determining the percentage change in net asset value with all distributions reinvested and do not reflect the effect of sales charges. |
| (3) | Excludes the effect of custody fee credits, if any, of less than 0.005%. Effective September 1, 2015, custody fee credits, which were earned on cash deposit balances, were discontinued by the custodian. |
| | | | |
| | 14 | | See Notes to Financial Statements. |
Eaton Vance
New York Municipal Opportunities Fund
March 31, 2019
Financial Highlights — continued
| | | | | | | | | | | | | | | | | | | | |
| | | Class I | |
| |
| | | Year Ended March 31, | |
| | | 2019 | | | 2018 | | | 2017 | | | 2016 | | | 2015 | |
| | | | | |
Net asset value — Beginning of year | | $ | 9.660 | | | $ | 9.770 | | | $ | 10.090 | | | $ | 10.110 | | | $ | 10.030 | |
| | | | | |
| Income (Loss) From Operations | | | | | | | | | | | | | | | | | | | | |
| | | | | |
Net investment income(1) | | $ | 0.260 | | | $ | 0.255 | | | $ | 0.284 | | | $ | 0.290 | | | $ | 0.308 | |
| | | | | |
Net realized and unrealized gain (loss) | | | 0.206 | | | | (0.112 | ) | | | (0.322 | ) | | | (0.023 | ) | | | 0.079 | |
| | | | | |
Total income (loss) from operations | | $ | 0.466 | | | $ | 0.143 | | | $ | (0.038 | ) | | $ | 0.267 | | | $ | 0.387 | |
| | | | | |
| Less Distributions | | | | | | | | | | | | | | | | | | | | |
| | | | | |
From net investment income | | $ | (0.256 | ) | | $ | (0.253 | ) | | $ | (0.282 | ) | | $ | (0.287 | ) | | $ | (0.307 | ) |
| | | | | |
Total distributions | | $ | (0.256 | ) | | $ | (0.253 | ) | | $ | (0.282 | ) | | $ | (0.287 | ) | | $ | (0.307 | ) |
| | | | | |
Net asset value — End of year | | $ | 9.870 | | | $ | 9.660 | | | $ | 9.770 | | | $ | 10.090 | | | $ | 10.110 | |
| | | | | |
Total Return(2) | | | 4.91 | % | | | 1.45 | % | | | (0.40 | )% | | | 2.70 | % | | | 3.89 | % |
| | | | | |
| Ratios/Supplemental Data | | | | | | | | | | | | | | | | | | | | |
| | | | | |
Net assets, end of year (000’s omitted) | | $ | 21,000 | | | $ | 16,301 | | | $ | 17,869 | | | $ | 13,601 | | | $ | 12,101 | |
| | | | | |
Ratios (as a percentage of average daily net assets): | | | | | | | | | | | | | | | | | | | | |
| | | | | |
Expenses(3) | | | 0.64 | % | | | 0.60 | % | | | 0.60 | % | | | 0.60 | % | | | 0.62 | % |
| | | | | |
Net investment income | | | 2.68 | % | | | 2.60 | % | | | 2.85 | % | | | 2.89 | % | | | 3.04 | % |
| | | | | |
Portfolio Turnover | | | 54 | % | | | 66 | % | | | 68 | % | | | 9 | % | | | 8 | % |
| (1) | Computed using average shares outstanding. |
| (2) | Returns are historical and are calculated by determining the percentage change in net asset value with all distributions reinvested. |
| (3) | Excludes the effect of custody fee credits, if any, of less than 0.005%. Effective September 1, 2015, custody fee credits, which were earned on cash deposit balances, were discontinued by the custodian. |
| | | | |
| | 15 | | See Notes to Financial Statements. |
Eaton Vance
New York Municipal Opportunities Fund
March 31, 2019
Notes to Financial Statements
1 Significant Accounting Policies
Eaton Vance New York Municipal Opportunities Fund (the Fund) is anon-diversified series of Eaton Vance Investment Trust (the Trust). The Trust is a Massachusetts business trust registered under the Investment Company Act of 1940, as amended (the 1940 Act), as anopen-end management investment company. The Fund’s investment objective is to seek to maximizeafter-tax total return. The Fund offers three classes of shares. Class A shares are generally sold subject to a sales charge imposed at time of purchase. Class C shares are sold at net asset value and are generally subject to a contingent deferred sales charge (see Note 5). Effective January 25, 2019, Class C shares generally automatically convert to Class A shares ten years after their purchase as described in the Fund’s prospectus. Class I shares are sold at net asset value and are not subject to a sales charge. Each class represents apro-rata interest in the Fund, but votes separately on class-specific matters and (as noted below) is subject to different expenses. Realized and unrealized gains and losses are allocated daily to each class of shares based on the relative net assets of each class to the total net assets of the Fund. Net investment income, other than class-specific expenses, is allocated daily to each class of shares based upon the ratio of the value of each class’s paid shares to the total value of all paid shares. Each class of shares differs in its distribution plan and certain other class-specific expenses.
The following is a summary of significant accounting policies of the Fund. The policies are in conformity with accounting principles generally accepted in the United States of America (U.S. GAAP). The Fund is an investment company and follows accounting and reporting guidance in the Financial Accounting Standards Board (FASB) Accounting Standards Codification Topic 946.
A Investment Valuation — The following methodologies are used to determine the market value or fair value of investments.
Debt Obligations. Debt obligations are generally valued on the basis of valuations provided by third party pricing services, as derived from such services’ pricing models. Inputs to the models may include, but are not limited to, reported trades, executable bid and ask prices, broker/dealer quotations, prices or yields of securities with similar characteristics, interest rates, anticipated prepayments, benchmark curves or information pertaining to the issuer, as well as industry and economic events. The pricing services may use a matrix approach, which considers information regarding securities with similar characteristics to determine the valuation for a security. Short-term debt obligations purchased with a remaining maturity of sixty days or less for which a valuation from a third party pricing service is not readily available may be valued at amortized cost, which approximates fair value.
Fair Valuation. Investments for which valuations or market quotations are not readily available or are deemed unreliable are valued at fair value using methods determined in good faith by or at the direction of the Trustees of the Fund in a manner that fairly reflects the security’s value, or the amount that the Fund might reasonably expect to receive for the security upon its current sale in the ordinary course. Each such determination is based on a consideration of relevant factors, which are likely to vary from one pricing context to another. These factors may include, but are not limited to, the type of security, the existence of any contractual restrictions on the security’s disposition, the price and extent of public trading in similar securities of the issuer or of comparable entities, quotations or relevant information obtained from broker/dealers or other market participants, information obtained from the issuer, analysts, and/or the appropriate stock exchange (for exchange-traded securities), an analysis of the entity’s financial condition, and an evaluation of the forces that influence the issuer and the market(s) in which the security is purchased and sold.
B Investment Transactions and Related Income — Investment transactions for financial statement purposes are accounted for on a trade date basis. Realized gains and losses on investments sold are determined on the basis of identified cost. Interest income is recorded on the basis of interest accrued, adjusted for amortization of premium or accretion of discount.
C Federal Taxes — The Fund’s policy is to comply with the provisions of the Internal Revenue Code applicable to regulated investment companies and to distribute to shareholders each year substantially all of its taxable, if any, andtax-exempt net investment income, and all or substantially all of its net realized capital gains. Accordingly, no provision for federal income or excise tax is necessary. The Fund intends to satisfy conditions which will enable it to designate distributions from the interest income generated by its investments innon-taxable municipal securities, which are exempt from regular federal income tax when received by the Fund, as exempt-interest dividends. The portion of such interest, if any, earned on private activity bonds issued after August 7, 1986, may be considered a tax preference item to shareholders.
As of March 31, 2019, the Fund had no uncertain tax positions that would require financial statement recognition,de-recognition, or disclosure. The Fund files a U.S. federal income tax return annually after its fiscalyear-end, which is subject to examination by the Internal Revenue Service for a period of three years from the date of filing.
D Expenses — The majority of expenses of the Trust are directly identifiable to an individual fund. Expenses which are not readily identifiable to a specific fund are allocated taking into consideration, among other things, the nature and type of expense and the relative size of the funds.
E Legal Fees — Legal fees and other related expenses incurred as part of negotiations of the terms and requirement of capital infusions, or that are expected to result in the restructuring of, or a plan of reorganization for, an investment are recorded as realized losses. Ongoing expenditures to protect or enhance an investment are treated as operating expenses.
F Use of Estimates — The preparation of the financial statements in conformity with U.S. GAAP requires management to make estimates and assumptions that affect the reported amounts of assets and liabilities at the date of the financial statements and the reported amounts of income and expense during the reporting period. Actual results could differ from those estimates.
Eaton Vance
New York Municipal Opportunities Fund
March 31, 2019
Notes to Financial Statements — continued
G Indemnifications — Under the Trust’s organizational documents, its officers and Trustees may be indemnified against certain liabilities and expenses arising out of the performance of their duties to the Fund. Under Massachusetts law, if certain conditions prevail, shareholders of a Massachusetts business trust (such as the Trust) could be deemed to have personal liability for the obligations of the Trust. However, the Trust’s Declaration of Trust contains an express disclaimer of liability on the part of Fund shareholders and theBy-laws provide that the Trust shall assume the defense on behalf of any Fund shareholders. Moreover, theBy-laws also provide for indemnification out of Fund property of any shareholder held personally liable solely by reason of being or having been a shareholder for all loss or expense arising from such liability. Additionally, in the normal course of business, the Fund enters into agreements with service providers that may contain indemnification clauses. The Fund’s maximum exposure under these arrangements is unknown as this would involve future claims that may be made against the Fund that have not yet occurred.
H When-Issued Securities and Delayed Delivery Transactions — The Fund may purchase or sell securities on a delayed delivery or when-issued basis. Payment and delivery may take place after the customary settlement period for that security. At the time the transaction is negotiated, the price of the security that will be delivered is fixed. The Fund maintains cash and/or security positions for these commitments such that sufficient liquid assets will be available to make payments upon settlement. Securities purchased on a delayed delivery or when-issued basis aremarked-to-market daily and begin earning interest on settlement date. Losses may arise due to changes in the market value of the underlying securities or if the counterparty does not perform under the contract.
2 Distributions to Shareholders and Income Tax Information
The net investment income of the Fund is determined daily and substantially all of the net investment income so determined is declared as a dividend to shareholders of record at the time of declaration. Distributions are declared separately for each class of shares. Distributions are paid monthly. Distributions of realized capital gains (reduced by available capital loss carryforwards from prior years) are made at least annually. Shareholders may reinvest income and capital gain distributions in additional shares of the same class of the Fund at the net asset value as of the reinvestment date or, at the election of the shareholder, receive distributions in cash. Distributions to shareholders are determined in accordance with income tax regulations, which may differ from U.S. GAAP. As required by U.S. GAAP, only distributions in excess of tax basis earnings and profits are reported in the financial statements as a return of capital. Permanent differences between book and tax accounting relating to distributions are reclassified topaid-in capital. For tax purposes, distributions from short-term capital gains are considered to be from ordinary income.
The tax character of distributions declared for the years ended March 31, 2019 and March 31, 2018 was as follows:
| | | | | | | | |
| | | Year Ended March 31, | |
| | | 2019 | | | 2018 | |
| | |
Tax-exempt income | | $ | 1,642,924 | | | $ | 1,869,897 | |
| | |
Ordinary income | | $ | 97,775 | | | $ | 122,581 | |
During the year ended March 31, 2019, distributable earnings was increased by $1,022,603 andpaid-in capital was decreased by $1,022,603 due to expired capital loss carryforwards. These reclassifications had no effect on the net assets or net asset value per share of the Fund.
As of March 31, 2019, the components of distributable earnings (accumulated loss) on a tax basis were as follows:
| | | | |
| | |
Undistributedtax-exempt income | | $ | 39,451 | |
| |
Deferred capital losses | | $ | (1,721,105 | ) |
| |
Net unrealized appreciation | | $ | 2,161,975 | |
| |
Distributions payable | | $ | (32,112 | ) |
At March 31, 2019, the Fund, for federal income tax purposes, had deferred capital losses of $1,721,105 which would reduce its taxable income arising from future net realized gains on investment transactions, if any, to the extent permitted by the Internal Revenue Code, and thus would reduce the amount of distributions to shareholders, which would otherwise be necessary to relieve the Fund of any liability for federal income or excise tax. The deferred capital losses are treated as arising on the first day of the Fund’s next taxable year and retain the same short-term or long-term character as when originally deferred. Of the deferred capital losses at March 31, 2019, $1,721,105 are short-term.
Eaton Vance
New York Municipal Opportunities Fund
March 31, 2019
Notes to Financial Statements — continued
The cost and unrealized appreciation (depreciation) of investments of the Fund at March 31, 2019, as determined on a federal income tax basis, were as follows:
| | | | |
| |
Aggregate cost | | $ | 67,491,812 | |
| |
Gross unrealized appreciation | | $ | 2,444,846 | |
| |
Gross unrealized depreciation | | | (282,871 | ) |
| |
Net unrealized appreciation | | $ | 2,161,975 | |
3 Investment Adviser Fee and Other Transactions with Affiliates
The investment adviser fee is earned by Boston Management and Research (BMR), a subsidiary of Eaton Vance Management (EVM), as compensation for management and investment advisory services rendered to the Fund. The fee is based upon a percentage of average daily net assets plus a percentage of gross income (i.e., income other than gains from the sale of securities) and is payable monthly. The annual asset rate and daily income rate are 0.30% and 3.00%, respectively, when daily net assets are less than $500 million and at reduced rates when daily net assets are $500 million or more. For the year ended March 31, 2019, the investment adviser fee amounted to $291,112 or 0.40% of the Fund’s average daily net assets.
EVM serves as the administrator of the Fund, but receives no compensation. EVM providessub-transfer agency and related services to the Fund pursuant to aSub-Transfer Agency Support Services Agreement. For the year ended March 31, 2019, EVM earned $8,281 from the Fund pursuant to such agreement, which is included in transfer and dividend disbursing agent fees on the Statement of Operations. The Fund was informed that Eaton Vance Distributors, Inc. (EVD), an affiliate of EVM and the Fund’s principal underwriter, received $731 as its portion of the sales charge on sales of Class A shares for the year ended March 31, 2019. EVD also received distribution and service fees from Class A and Class C shares (see Note 4).
Trustees and officers of the Fund who are members of EVM’s or BMR’s organizations receive remuneration for their services to the Fund out of the investment adviser fee. Trustees of the Fund who are not affiliated with the investment adviser may elect to defer receipt of all or a percentage of their annual fees in accordance with the terms of the Trustees Deferred Compensation Plan. For the year ended March 31, 2019, no significant amounts have been deferred. Certain officers and Trustees of the Fund are officers of the above organizations.
4 Distribution Plans
The Fund has in effect a distribution plan for Class A shares (Class A Plan) pursuant to Rule12b-1 under the 1940 Act. Pursuant to the Class A Plan, the Fund pays EVD a distribution and service fee not exceeding 0.25% per annum of its average daily net assets attributable to Class A shares for distribution services and facilities provided to the Fund by EVD, as well as for personal services and/or the maintenance of shareholder accounts. The Trustees approved distribution and service fee payments equal to 0.15% per annum of the Fund’s average daily net assets attributable to Class A shares. Distribution and service fees paid or accrued to EVD for the year ended March 31, 2019 amounted to $63,225 for Class A shares.
The Fund also has in effect a distribution plan for Class C shares (Class C Plan) pursuant to Rule12b-1 under the 1940 Act. Pursuant to the Class C Plan, the Fund pays EVD amounts equal to 0.75% per annum of its average daily net assets attributable to Class C shares for providing ongoing distribution services and facilities to the Fund. For the year ended March 31, 2019, the Fund paid or accrued to EVD $108,412 for Class C shares.
Pursuant to the Class C Plan, the Fund also makes payments of service fees to EVD, financial intermediaries and other persons in amounts not exceeding 0.25% per annum of its average daily net assets attributable to that class. The Trustees approved service fee payments equal to 0.15% per annum of the Fund’s average daily net assets attributable to Class C shares. Service fees paid or accrued are for personal services and/or the maintenance of shareholder accounts. They are separate and distinct from the Class C sales commissions and distribution fees payable to EVD. Service fees paid or accrued for the year ended March 31, 2019 amounted to $21,682 for Class C shares.
Distribution and service fees are subject to the limitations contained in the Financial Industry Regulatory Authority Rule 2341(d).
5 Contingent Deferred Sales Charges
A contingent deferred sales charge (CDSC) of 1% generally is imposed on redemptions of Class C shares made within one year of purchase. Class A shares may be subject to a 1% CDSC if redeemed within eighteen months of purchase (depending on the circumstances of purchase). Generally, the CDSC is based upon the lower of the net asset value at date of redemption or date of purchase. No charge is levied on shares acquired by reinvestment of dividends or capital gain distributions. For the year ended March 31, 2019, the Fund was informed that EVD received no CDSCs paid by Class A and Class C shareholders.
Eaton Vance
New York Municipal Opportunities Fund
March 31, 2019
Notes to Financial Statements — continued
6 Purchases and Sales of Investments
Purchases and sales of investments, other than short-term obligations, aggregated $39,303,435 and $45,440,402, respectively, for the year ended March 31, 2019.
7 Shares of Beneficial Interest
The Fund’s Declaration of Trust permits the Trustees to issue an unlimited number of full and fractional shares of beneficial interest (without par value). Such shares may be issued in a number of different series (such as the Fund) and classes. Transactions in Fund shares were as follows:
| | | | | | | | |
| | | Year Ended March 31, | |
| Class A | | 2019 | | | 2018 | |
| | |
Sales | | | 146,494 | | | | 401,540 | |
| | |
Issued to shareholders electing to receive payments of distributions in Fund shares | | | 92,321 | | | | 104,426 | |
| | |
Redemptions | | | (941,772 | ) | | | (1,237,253 | ) |
| | |
Converted from Class C shares | | | 374,383 | | | | — | |
| | |
Net decrease | | | (328,574 | ) | | | (731,287 | ) |
| |
| | | Year Ended March 31, | |
| Class C | | 2019 | | | 2018 | |
| | |
Sales | | | 95,675 | | | | 88,190 | �� |
| | |
Issued to shareholders electing to receive payments of distributions in Fund shares | | | 20,419 | | | | 24,766 | |
| | |
Redemptions | | | (362,130 | ) | | | (788,053 | ) |
| | |
Converted to Class A shares | | | (393,704 | ) | | | — | |
| | |
Net decrease | | | (639,740 | ) | | | (675,097 | ) |
| |
| | | Year Ended March 31, | |
| Class I | | 2019 | | | 2018 | |
| | |
Sales | | | 1,135,009 | | | | 430,776 | |
| | |
Issued to shareholders electing to receive payments of distributions in Fund shares | | | 25,358 | | | | 25,919 | |
| | |
Redemptions | | | (721,396 | ) | | | (598,110 | ) |
| | |
Net increase (decrease) | | | 438,971 | | | | (141,415 | ) |
8 Line of Credit
The Fund participates with other portfolios and funds managed by EVM and its affiliates in a $625 million unsecured line of credit agreement with a group of banks, which is in effect through October 29, 2019. Borrowings are made by the Fund solely to facilitate the handling of unusual and/or unanticipated short-term cash requirements. Interest is charged to the Fund based on its borrowings at an amount above either the Eurodollar rate or Federal Funds rate. In addition, a fee computed at an annual rate of 0.15% on the daily unused portion of the line of credit is allocated among the participating portfolios and funds at the end of each quarter. Because the line of credit is not available exclusively to the Fund, it may be unable to borrow some or all of its requested amounts at any particular time. The Fund did not have any significant borrowings or allocated fees during the year ended March 31, 2019.
Eaton Vance
New York Municipal Opportunities Fund
March 31, 2019
Notes to Financial Statements — continued
9 Fair Value Measurements
Under generally accepted accounting principles for fair value measurements, a three-tier hierarchy to prioritize the assumptions, referred to as inputs, is used in valuation techniques to measure fair value. The three-tier hierarchy of inputs is summarized in the three broad levels listed below.
| • | | Level 1 – quoted prices in active markets for identical investments |
| • | | Level 2 – other significant observable inputs (including quoted prices for similar investments, interest rates, prepayment speeds, credit risk, etc.) |
| • | | Level 3 – significant unobservable inputs (including a fund’s own assumptions in determining the fair value of investments) |
In cases where the inputs used to measure fair value fall in different levels of the fair value hierarchy, the level disclosed is determined based on the lowest level input that is significant to the fair value measurement in its entirety. The inputs or methodology used for valuing securities are not necessarily an indication of the risk associated with investing in those securities.
At March 31, 2019, the hierarchy of inputs used in valuing the Fund’s investments, which are carried at value, were as follows:
| | | | | | | | | | | | | | | | |
| Asset Description | | Level 1 | | | Level 2 | | | Level 3* | | | Total | |
| | | | |
Tax-Exempt Municipal Securities | | $ | — | | | $ | 66,360,756 | | | $ | — | | | $ | 66,360,756 | |
| | | | |
Taxable Municipal Securities | | | — | | | | 2,859,550 | | | | — | | | | 2,859,550 | |
| | | | |
Miscellaneous | | | — | | | | — | | | | 433,481 | | | | 433,481 | |
| | | | |
Total Investments | | $ | — | | | $ | 69,220,306 | | | $ | 433,481 | | | $ | 69,653,787 | |
| * | None of the unobservable inputs for Level 3 assets, individually or collectively, had a material impact on the Fund. |
Level 3 investments at the beginning and/or end of the period in relation to net assets were not significant and accordingly, a reconciliation of Level 3 assets for the year ended March 31, 2019 is not presented.
Eaton Vance
New York Municipal Opportunities Fund
March 31, 2019
Report of Independent Registered Public Accounting Firm
To the Trustees of Eaton Vance Investment Trust and Shareholders of Eaton Vance New York Municipal Opportunities Fund:
Opinion on the Financial Statements and Financial Highlights
We have audited the accompanying statement of assets and liabilities of Eaton Vance New York Municipal Opportunities Fund (the “Fund”) (one of the funds constituting Eaton Vance Investment Trust), including the portfolio of investments, as of March 31, 2019, the related statement of operations for the year then ended, the statements of changes in net assets for each of the two years in the period then ended, the financial highlights for each of the five years in the period then ended, and the related notes. In our opinion, the financial statements and financial highlights present fairly, in all material respects, the financial position of the Fund, as of March 31, 2019, and the results of its operations for the year then ended, the changes in its net assets for each of the two years in the period then ended, and the financial highlights for each of the five years in the period then ended in conformity with accounting principles generally accepted in the United States of America.
Basis for Opinion
These financial statements and financial highlights are the responsibility of the Fund’s management. Our responsibility is to express an opinion on the Fund’s financial statements and financial highlights based on our audits. We are a public accounting firm registered with the Public Company Accounting Oversight Board (United States) (PCAOB) and are required to be independent with respect to the Fund in accordance with the U.S. federal securities laws and the applicable rules and regulations of the Securities and Exchange Commission and the PCAOB.
We conducted our audits in accordance with the standards of the PCAOB. Those standards require that we plan and perform the audit to obtain reasonable assurance about whether the financial statements and financial highlights are free of material misstatement, whether due to error or fraud. The Fund is not required to have, nor were we engaged to perform, an audit of its internal control over financial reporting. As part of our audits we are required to obtain an understanding of internal control over financial reporting but not for the purpose of expressing an opinion on the effectiveness of the Fund’s internal control over financial reporting. Accordingly, we express no such opinion.
Our audits included performing procedures to assess the risks of material misstatement of the financial statements and financial highlights, whether due to error or fraud, and performing procedures that respond to those risks. Such procedures included examining, on a test basis, evidence regarding the amounts and disclosures in the financial statements and financial highlights. Our audits also included evaluating the accounting principles used and significant estimates made by management, as well as evaluating the overall presentation of the financial statements and financial highlights. Our procedures included confirmation of securities owned, as of March 31, 2019, by correspondence with the custodian and brokers; when replies were not received from brokers, we performed other auditing procedures. We believe that our audits provide a reasonable basis for our opinion.
Deloitte & Touche LLP
Boston, Massachusetts
May 17, 2019
We have served as the auditor of one or more Eaton Vance investment companies since 1959.
Eaton Vance
New York Municipal Opportunities Fund
March 31, 2019
Federal Tax Information (Unaudited)
The Form1099-DIV you receive in February 2020 will show the tax status of all distributions paid to your account in calendar year 2019. Shareholders are advised to consult their own tax adviser with respect to the tax consequences of their investment in the Fund. As required by the Internal Revenue Code and/or regulations, shareholders must be notified regarding exempt-interest dividends.
Exempt-Interest Dividends. For the fiscal year ended March 31, 2019, the Fund designates 94.38% of distributions from net investment income as an exempt-interest dividend.
Eaton Vance
New York Municipal Opportunities Fund
March 31, 2019
Management and Organization
Fund Management. The Trustees of Eaton Vance Investment Trust (the Trust) are responsible for the overall management and supervision of the Trust’s affairs. The Trustees and officers of the Trust are listed below. Except as indicated, each individual has held the office shown or other offices in the same company for the last five years. Trustees and officers of the Trust hold indefinite terms of office. The “noninterested Trustees” consist of those Trustees who are not “interested persons” of the Trust, as that term is defined under the 1940 Act. The business address of each Trustee and officer is Two International Place, Boston, Massachusetts 02110. As used below, “EVC” refers to Eaton Vance Corp., “EV” refers to Eaton Vance, Inc., “EVM” refers to Eaton Vance Management, “BMR” refers to Boston Management and Research and “EVD” refers to Eaton Vance Distributors, Inc. EVC and EV are the corporate parent and trustee, respectively, of EVM and BMR. EVD is a wholly-owned subsidiary of EVC. Each officer affiliated with Eaton Vance may hold a position with other Eaton Vance affiliates that is comparable to his or her position with EVM listed below. Each Trustee oversees 172 portfolios in the Eaton Vance Complex (including all master and feeder funds in a master feeder structure). Each officer serves as an officer of certain other Eaton Vance funds. Each Trustee and officer serves until his or her successor is elected.
| | | | | | |
| Name and Year of Birth | | Position(s)
with the
Trust | | Trustee
Since(1) | | Principal Occupation(s) and Directorships During Past Five Years and Other Relevant Experience |
|
| Interested Trustee |
| | | |
Thomas E. Faust Jr. 1958 | | Trustee | | 2007 | | Chairman, Chief Executive Officer and President of EVC, Director and President of EV, Chief Executive Officer and President of EVM and BMR, and Director of EVD. Trustee and/or officer of 172 registered investment companies. Mr. Faust is an interested person because of his positions with EVM, BMR, EVD, EVC and EV, which are affiliates of the Trust. Directorships in the Last Five Years.(2)Director of EVC and Hexavest Inc. (investment management firm). |
|
| Noninterested Trustees |
| | | |
Mark R. Fetting 1954 | | Trustee | | 2016 | | Private investor. Formerly held various positions at Legg Mason, Inc. (investment management firm) (2000-2012), including President, Chief Executive Officer, Director and Chairman(2008-2012), Senior Executive Vice President (2004-2008) and Executive Vice President (2001-2004). Formerly, President of Legg Mason family of funds (2001-2008). Formerly, Division President and Senior Officer of Prudential Financial Group, Inc. and related companies (investment management firm)(1991-2000). Directorships in the Last Five Years. None. |
| | | |
Cynthia E. Frost 1961 | | Trustee | | 2014 | | Private investor. Formerly, Chief Investment Officer of Brown University (university endowment) (2000-2012). Formerly, Portfolio Strategist for Duke Management Company (university endowment manager) (1995-2000). Formerly, Managing Director, Cambridge Associates (investment consulting company) (1989-1995). Formerly, Consultant, Bain and Company (management consulting firm)(1987-1989). Formerly, Senior Equity Analyst, BA Investment Management Company(1983-1985). Directorships in the Last Five Years.None. |
| | | |
George J. Gorman 1952 | | Trustee | | 2014 | | Principal at George J. Gorman LLC (consulting firm). Formerly, Senior Partner at Ernst & Young LLP (a registered public accounting firm) (1974-2009). Directorships in the Last Five Years.Formerly, Trustee of the BofA Funds Series Trust (11 funds) (2011-2014) and of the Ashmore Funds (9 funds) (2010-2014). |
| | | |
Valerie A. Mosley 1960 | | Trustee | | 2014 | | Chairwoman and Chief Executive Officer of Valmo Ventures (a consulting and investment firm). Former Partner and Senior Vice President, Portfolio Manager and Investment Strategist at Wellington Management Company, LLP (investment management firm) (1992-2012). Former Chief Investment Officer, PG Corbin Asset Management (1990-1992). Formerly worked in institutional corporate bond sales at Kidder Peabody (1986-1990). Directorships in the Last Five Years.(2)Director of Envestnet, Inc. (provider of intelligent systems for wealth management and financial wellness) (since 2018). Director of Dynex Capital, Inc. (mortgage REIT) (since 2013). |
Eaton Vance
New York Municipal Opportunities Fund
March 31, 2019
Management and Organization — continued
| | | | | | |
| Name and Year of Birth | | Position(s)
with the
Trust | | Trustee
Since(1) | | Principal Occupation(s) and Directorships During Past Five Years and Other Relevant Experience |
|
| Noninterested Trustees (continued) |
| | | |
William H. Park 1947 | | Chairperson of the Board and Trustee | | 2016 (Chairperson); 2003 (Trustee) | | Private investor. Formerly, Consultant (management and transactional) (2012-2014). Formerly, Chief Financial Officer, Aveon Group L.P. (investment management firm) (2010-2011). Formerly, Vice Chairman, Commercial Industrial Finance Corp. (specialty finance company) (2006-2010). Formerly, President and Chief Executive Officer, Prizm Capital Management, LLC (investment management firm) (2002-2005). Formerly, Executive Vice President and Chief Financial Officer, United Asset Management Corporation (investment management firm) (1982-2001). Formerly, Senior Manager, Price Waterhouse (now PricewaterhouseCoopers) (a registered public accounting firm) (1972-1981). Directorships in the Last Five Years.(2)None. |
| | | |
Helen Frame Peters 1948 | | Trustee | | 2008 | | Professor of Finance, Carroll School of Management, Boston College. Formerly, Dean, Carroll School of Management, Boston College (2000-2002). Formerly, Chief Investment Officer, Fixed Income, Scudder Kemper Investments (investment management firm) (1998-1999). Formerly, Chief Investment Officer, Equity and Fixed Income, Colonial Management Associates (investment management firm)(1991-1998). Directorships in the Last Five Years.(2)None. |
| | | |
Keith Quinton(3) 1958 | | Trustee | | 2018 | | Independent Investment Committee Member at New Hampshire Retirement System (since 2017). Advisory Committee member at Northfield Information Services, Inc. (risk management analytics provider) (since 2016). Formerly, Portfolio Manager and Senior Quantitative Analyst at Fidelity Investments (investment management firm)(2001-2014). Directorships in the Last Five Years. Director of New Hampshire Municipal Bond Bank (since 2016). |
| | | |
Marcus L. Smith(3) 1966 | | Trustee | | 2018 | | Member of Posse Boston Advisory Board (foundation) (since 2015); Trustee at University of Mount Union (since 2008). Formerly, Portfolio Manager at MFS Investment Management (investment management firm) (1994-2017). Directorships in the Last Five Years. Director of MSCI Inc. (global provider of investment decision support tools) (since 2017). Formerly, Director of DCT Industrial Trust Inc. (logistics real estate company) (2017-2018). |
| | | |
Susan J. Sutherland 1957 | | Trustee | | 2015 | | Private investor. Formerly, Associate, Counsel and Partner at Skadden, Arps, Slate, Meagher & Flom LLP (law firm) (1982-2013). Directorships in the Last Five Years. Formerly, Director of Montpelier Re Holdings Ltd. (global provider of customized insurance and reinsurance products) (2013-2015). |
| | | |
Scott E. Wennerholm 1959 | | Trustee | | 2016 | | Formerly, Trustee at Wheelock College (postsecondary institution) (2012-2018). Formerly, Consultant at GF Parish Group (executive recruiting firm) (2016-2017). Formerly, Chief Operating Officer and Executive Vice President at BNY Mellon Asset Management (investment management firm) (2005-2011). Formerly, Chief Operating Officer and Chief Financial Officer at Natixis Global Asset Management (investment management firm) (1997-2004). Formerly, Vice President at Fidelity Investments Institutional Services (investment management firm) (1994-1997). Directorships in the Last Five Years. None. |
| | | | | | |
| Name and Year of Birth | | Position(s)
with the
Trust | | Officer
Since(4) | | Principal Occupation(s) During Past Five Years |
|
| Principal Officers who are not Trustees |
| | | |
Payson F. Swaffield 1956 | | President | | 2003 | | Vice President and Chief Income Investment Officer of EVM and BMR. Also Vice President of Calvert Research and Management (“CRM”). |
| | | |
Maureen A. Gemma 1960 | | Vice President, Secretary and Chief Legal Officer | | 2005 | | Vice President of EVM and BMR. Also Vice President of CRM. |
Eaton Vance
New York Municipal Opportunities Fund
March 31, 2019
Management and Organization — continued
| | | | | | |
| Name and Year of Birth | | Position(s)
with the
Trust | | Officer
Since(4) | | Principal Occupation(s) During Past Five Years |
|
| Principal Officers who are not Trustees (continued) |
| | | |
James F. Kirchner 1967 | | Treasurer | | 2007 | | Vice President of EVM and BMR. Also Vice President of CRM. |
| | | |
Richard F. Froio 1968 | | Chief Compliance Officer | | 2017 | | Vice President of EVM and BMR since 2017. Formerly, Deputy Chief Compliance Officer (Adviser/Funds) and Chief Compliance Officer (Distribution) at PIMCO(2012-2017) and Managing Director at BlackRock/Barclays Global Investors(2009-2012). |
| (1) | Year first appointed to serve as Trustee for a fund in the Eaton Vance family of funds. Each Trustee has served continuously since appointment unless indicated otherwise. |
| (2) | During their respective tenures, the Trustees (except for Mmes. Frost and Sutherland and Messrs. Fetting, Gorman, Quinton, Smith and Wennerholm) also served as Board members of one or more of the following funds (which operated in the years noted): eUnitsTM 2 Year U.S. Market Participation Trust: Upside to Cap / Buffered Downside (launched in 2012 and terminated in 2014); and eUnitsTM 2 Year U.S. Market Participation Trust II: Upside to Cap / Buffered Downside (launched in 2012 and terminated in 2014). However, Ms. Mosley did not serve as a Board member of eUnitsTM 2 Year U.S. Market Participation Trust: Upside to Cap / Buffered Downside (launched in 2012 and terminated in 2014). |
| (3) | Messrs. Quinton and Smith began serving as Trustees effective October 1, 2018. |
| (4) | Year first elected to serve as officer of a fund in the Eaton Vance family of funds when the officer has served continuously. Otherwise, year of most recent election as an officer of a fund in the Eaton Vance family of funds. Titles may have changed since initial election. |
The SAI for the Fund includes additional information about the Trustees and officers of the Fund and can be obtained without charge on Eaton Vance’s website at www.eatonvance.com or by calling1-800-262-1122.
Eaton Vance Funds
IMPORTANT NOTICES
Privacy. The Eaton Vance organization is committed to ensuring your financial privacy. Each of the financial institutions identified below has in effect the following policy (“Privacy Policy”) with respect to nonpublic personal information about its customers:
| • | | Only such information received from you, through application forms or otherwise, and information about your Eaton Vance fund transactions will be collected. This may include information such as name, address, social security number, tax status, account balances and transactions. |
| • | | None of such information about you (or former customers) will be disclosed to anyone, except as permitted by law (which includes disclosure to employees necessary to service your account). In the normal course of servicing a customer’s account, Eaton Vance may share information with unaffiliated third parties that perform various required services such as transfer agents, custodians and broker-dealers. |
| • | | Policies and procedures (including physical, electronic and procedural safeguards) are in place that are designed to protect the confidentiality of such information. |
| • | | We reserve the right to change our Privacy Policy at any time upon proper notification to you. Customers may want to review our Privacy Policy periodically for changes by accessing the link on our homepage: www.eatonvance.com. |
Our pledge of privacy applies to the following entities within the Eaton Vance organization: the Eaton Vance Family of Funds, Eaton Vance Management, Eaton Vance Investment Counsel, Eaton Vance Distributors, Inc., Eaton Vance Trust Company, Eaton Vance Management (International) Limited, Eaton Vance Advisers International Ltd., Eaton Vance Management’s Real Estate Investment Group and Boston Management and Research. In addition, our Privacy Policy applies only to those Eaton Vance customers who are individuals and who have a direct relationship with us. If a customer’s account (i.e., fund shares) is held in the name of a third-party financial advisor/broker-dealer, it is likely that only such advisor’s privacy policies apply to the customer. This notice supersedes all previously issued privacy disclosures. For more information about Eaton Vance’s Privacy Policy, please call1-800-262-1122.
Delivery of Shareholder Documents. The Securities and Exchange Commission (SEC) permits funds to deliver only one copy of shareholder documents, including prospectuses, proxy statements and shareholder reports, to fund investors with multiple accounts at the same residential or post office box address. This practice is often called “householding” and it helps eliminate duplicate mailings to shareholders.Eaton Vance, or your financial advisor, may household the mailing of your documents indefinitely unless you instruct Eaton Vance, or your financial advisor, otherwise.If you would prefer that your Eaton Vance documents not be householded, please contact Eaton Vance at1-800-262-1122, or contact your financial advisor. Your instructions that householding not apply to delivery of your Eaton Vance documents will typically be effective within 30 days of receipt by Eaton Vance or your financial advisor.
Portfolio Holdings. Each Eaton Vance Fund and its underlying Portfolio(s) (if applicable) files a schedule of portfolio holdings on Part F toForm N-Port with the SEC for the first and third quarters of each fiscal year. The FormN-PORT will be available on the Eaton Vance website at www.eatonvance.com, by calling Eaton Vance at1-800-262-1122 or in the EDGAR database on the SEC’s website at www.sec.gov.
Proxy Voting. From time to time, funds are required to vote proxies related to the securities held by the funds. The Eaton Vance Funds or their underlying Portfolios (if applicable) vote proxies according to a set of policies and procedures approved by the Funds’ and Portfolios’ Boards. You may obtain a description of these policies and procedures and information on how the Funds or Portfolios voted proxies relating to portfolio securities during the most recent12-month period ended June 30, without charge, upon request, by calling1-800-262-1122 and by accessing the SEC’s website at www.sec.gov.
This Page Intentionally Left Blank
This Page Intentionally Left Blank
Investment Adviser
Boston Management and Research
Two International Place
Boston, MA 02110
Administrator
Eaton Vance Management
Two International Place
Boston, MA 02110
Principal Underwriter*
Eaton Vance Distributors, Inc.
Two International Place
Boston, MA 02110
(617)482-8260
Custodian
State Street Bank and Trust Company
State Street Financial Center, One Lincoln Street
Boston, MA 02111
Transfer Agent
BNY Mellon Investment Servicing (US) Inc.
Attn: Eaton Vance Funds
P.O. Box 9653
Providence, RI 02940-9653
(800)262-1122
Independent Registered Public Accounting Firm
Deloitte & Touche LLP
200 Berkeley Street
Boston, MA 02116-5022
Fund Offices
Two International Place
Boston, MA 02110
| * | FINRA BrokerCheck. Investors may check the background of their Investment Professional by contacting the Financial Industry Regulatory Authority (FINRA). FINRA BrokerCheck is a free tool to help investors check the professional background of current and former FINRA-registered securities firms and brokers. FINRA BrokerCheck is available by calling1-800-289-9999 and at www.FINRA.org. The FINRA BrokerCheck brochure describing this program is available to investors at www.FINRA.org. |

23362 3.31.19

Eaton Vance
Short Duration Municipal Opportunities Fund
Annual Report
March 31, 2019
Important Note. Beginning on January 1, 2021, as permitted by regulations adopted by the Securities and Exchange Commission, paper copies of the Fund’s annual and semi-annual shareholder reports will no longer be sent by mail unless you specifically request paper copies of the reports. Instead, the reports will be made available on the Fund’s website (eatonvance.com/funddocuments), and you will be notified by mail each time a report is posted and provided with a website address to access the report.
If you already elected to receive shareholder reports electronically, you will not be affected by this change and you need not take any action. If you are a direct investor, you may elect to receive shareholder reports and other communications from the Fund electronically by signing up for e-Delivery at eatonvance.com/edelivery. If you own your shares through a financial intermediary (such as a broker-dealer or bank), you must contact your financial intermediary to sign up.
You may elect to receive all future Fund shareholder reports in paper free of charge. If you are a direct investor, you can inform the Fund that you wish to continue receiving paper copies of your shareholder reports by calling 1-800-262-1122. If you own these shares through a financial intermediary, you must contact your financial intermediary or follow instructions included with this disclosure, if applicable, to elect to continue to receive paper copies of your shareholder reports. Your election to receive reports in paper will apply to all Eaton Vance funds held directly or to all funds held through your financial intermediary, as applicable.

Commodity Futures Trading Commission Registration. Effective December 31, 2012, the Commodity Futures Trading Commission (“CFTC”) adopted certain regulatory changes that subject registered investment companies and advisers to regulation by the CFTC if a fund invests more than a prescribed level of its assets in certain CFTC-regulated instruments (including futures, certain options and swap agreements) or markets itself as providing investment exposure to such instruments. The Fund has claimed an exclusion from the definition of the term “commodity pool operator” under the Commodity Exchange Act. Accordingly, neither the Fund nor the adviser with respect to the operation of the Fund is subject to CFTC regulation. Because of its management of other strategies, the Fund’s adviser is registered with the CFTC as a commodity pool operator and a commodity trading advisor.
Fund shares are not insured by the FDIC and are not deposits or other obligations of, or guaranteed by, any depository institution. Shares are subject to investment risks, including possible loss of principal invested.
This report must be preceded or accompanied by a current summary prospectus or prospectus. Before investing, investors should consider carefully the investment objective, risks, and charges and expenses of a mutual fund. This and other important information is contained in the summary prospectus and prospectus, which can be obtained from a financial advisor. Prospective investors should read the prospectus carefully before investing. For further information, please call 1-800-262-1122.
Annual ReportMarch 31, 2019
Eaton Vance
Short Duration Municipal Opportunities Fund
Table of Contents
| | | | |
Management’s Discussion of Fund Performance | | | 2 | |
| |
Performance | | | 3 | |
| |
Fund Profile | | | 4 | |
| |
Endnotes and Additional Disclosures | | | 5 | |
| |
Fund Expenses | | | 6 | |
| |
Financial Statements | | | 7 | |
| |
Report of Independent Registered Public Accounting Firm | | | 27 | |
| |
Federal Tax Information | | | 28 | |
| |
Management and Organization | | | 29 | |
| |
Important Notices | | | 32 | |
Eaton Vance
Short Duration Municipal Opportunities Fund
March 31, 2019
Management’s Discussion of Fund Performance1
Economic and Market Conditions
Viewed as a whole, the12-month period that began on April 1, 2018 was positive for the municipal bond market, with the Bloomberg Barclays Municipal Bond Index,2 a broad measure of the asset class, returning 5.38%.
The period was marked by a flattening of the municipal bond yield curve.7 Rates declined across the curve, but declined more for bonds with maturities of 4 years and longer than for bonds with shorter1-3 year maturities. Lower-rated6 bonds generally outperformed higher-rated issues during the period and municipal bonds outperformed comparable U.S. Treasurys. But while the fiscal year overall was positive for municipal bond performance, investors endured considerable volatility during the12-month period.
As the fiscal year began in April 2018, the municipal bond market was at the tail end of a period of rising rates, driven by signs of increasing inflation, higher wage growth and fears that recently-passed tax legislation might overheat the economy. In an effort to blunt upward pressure on inflation, the U.S. Federal Reserve Board (the Fed) announced its second rate hike of 2018 in June. At the long end of the curve, however, fluctuating perceptions of geopolitical risk were a primary driver of rates from April through the end of August 2018. Investors toggled between concern that the U.S. was initiating a global trade war and optimism about economic growth and a potential detente between the U.S. and North Korea.
In September 2018, the Fed hiked rates again and both U.S. Treasury and municipal rates rose across the curve. In October 2018, a strong U.S. employment report and easing concerns over Italy’s national budget continued the upward pressure on longer-term rates. But as 2018 came to a close, investors became increasingly concerned about a trade war with China, a looming government shutdown and dovish comments by the Fed that led investors to fear weakness in the U.S. economy, driving credit spreads wider and the futures market to project the possibility of no further rate hikes in 2019. The result was a “flight to quality” by bond investors that pushed longer-term bond prices up and rates down in the final month of 2018.
The first two months of the new year, in contrast, were a relatively quiet period for bonds. The final month of the period, however, saw rates decline across the curve, in a dramatic reversal of the market’s direction at the
beginning of the period. Driven initially by an unexpectedly weak February jobs report issued in early March, the rate decline was accelerated by reports of slowing gross domestic product growth in China and Germany as well as Brexit uncertainty. Downward pressure on rates appeared to culminate on March 20, 2019, when the Fed issued comments that were more dovish than the market had expected — leading many investors to conclude that further rate hikes were off the table for the rest of 2019.
Fund Performance
For the12-month period ended March 31, 2019, Eaton Vance Short Duration Municipal Opportunities Fund (the Fund) Class A shares at net asset value (NAV) returned 3.52%, underperforming the 4.35% return of the Fund’s benchmark, the Bloomberg Barclays Short-Intermediate
1–10 Year Municipal Bond Index (the Index).
In seeking to achieve its primary objective of maximizingafter-tax total return, the Fund employs a flexible investment strategy that allows it to seek opportunities virtually anywhere on the credit curve, across different sectors and different state issuers, while maintaining an average weighted duration8 below 4.5 years. Management has the ability to be opportunistic in pursuing the Fund’safter-tax total return objective, trading holdings whenever opportunities arise, with the ability to invest up to 20% of net assets in debt obligations other thantax-exempt municipal bonds, including (but not limited to) taxable municipal obligations, U.S. Treasury securities and obligations of the U.S. Government, its agencies and instrumentalities. Up to 50% of the Fund’s net assets may be invested in below-investment-grade securities. The Fund may also hedge interest rate risk and hold leveraged investments.
Detractors from Fund performance versus the Index during the period included security selection in the health care sector, an overweight, relative to the Index, in floating-rate notes and security selection in bonds rated A or higher.
In contrast, Fund holdings in taxable municipal bonds, which were not represented in the Index, contributed to performance relative to the Index. Additional contributors to relative results versus the Index included an overweight inBBB-rated bonds, holdings rated below-investment-grade, which were not represented in the Index and security selection and an overweight in Illinois bonds, during a period when Illinois was the best-performing state in the Index.
See Endnotes and Additional Disclosures in this report.
Past performance is no guarantee of future results. Returns are historical and are calculated by determining the percentage change in net asset value (NAV) or offering price (as applicable) with all distributions reinvested. Investment return and principal value will fluctuate so that shares, when redeemed, may be worth more or less than their original cost. Performance less than or equal to one year is cumulative. Performance is for the stated time period only; due to market volatility, the Fund’s current performance may be lower or higher than quoted. Returns are before taxes unless otherwise noted. For performance as of the most recentmonth-end, please refer to eatonvance.com.
Eaton Vance
Short Duration Municipal Opportunities Fund
March 31, 2019
Performance2,3
Portfolio ManagerAdam A. Weigold, CFA
| | | | | | | | | | | | | | | | | | | | |
| % Average Annual Total Returns | | Class
Inception Date | | | Performance
Inception Date | | | One Year | | | Five Years | | | Ten Years | |
Class A at NAV | | | 06/27/1996 | | | | 06/01/1992 | | | | 3.52 | % | | | 2.79 | % | | | 3.38 | % |
Class A with 2.25% Maximum Sales Charge | | | — | | | | — | | | | 1.18 | | | | 2.32 | | | | 3.15 | |
Class C at NAV | | | 12/08/1993 | | | | 06/01/1992 | | | | 2.79 | | | | 2.04 | | | | 2.61 | |
Class C with 1% Maximum Sales Charge | | | — | | | | — | | | | 1.79 | | | | 2.04 | | | | 2.61 | |
Class I at NAV | | | 08/03/2010 | | | | 06/01/1992 | | | | 3.78 | | | | 2.96 | | | | 3.51 | |
Bloomberg Barclays Short-Intermediate 1–10 Year Municipal Bond Index | | | — | | | | — | | | | 4.35 | % | | | 2.27 | % | | | 2.97 | % |
| | | | | |
| | | | | | | | | | | | | | | | | | | | |
| % Total Annual Operating Expense Ratios4 | | | | | | | | Class A | | | Class C | | | Class I | |
Gross | | | | | | | | | | | 0.85 | % | | | 1.60 | % | | | 0.70 | % |
Net | | | | | | | | | | | 0.70 | | | | 1.45 | | | | 0.55 | |
| | | | | |
| | | | | | | | | | | | | | | | | | | | |
| % Distribution Rates/Yields5 | | | | | | | | Class A | | | Class C | | | Class I | |
Distribution Rate | | | | | | | | | | | 1.91 | % | | | 1.13 | % | | | 2.08 | % |
Taxable-Equivalent Distribution Rate | | | | | | | | | | | 3.23 | | | | 1.91 | | | | 3.51 | |
SEC30-day Yield | | | | | | | | | | | 1.75 | | | | 1.02 | | | | 1.94 | |
Taxable-Equivalent SEC30-day Yield | | | | | | | | | | | 2.95 | | | | 1.73 | | | | 3.28 | |
Growth of $10,000
This graph shows the change in value of a hypothetical investment of $10,000 in Class A of the Fund for the period indicated. For comparison, the same investment is shown in the indicated index.
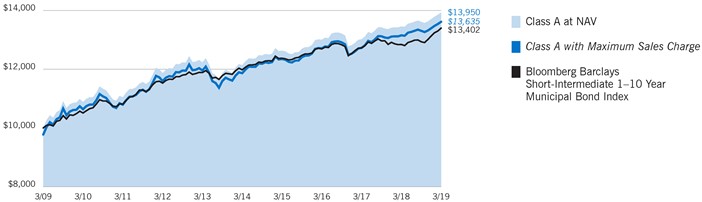
| | | | | | | | | | | | | | | | |
| Growth of Investment3 | | Amount Invested | | | Period Beginning | | | At NAV | | | With Maximum Sales Charge | |
Class C | | $ | 10,000 | | | | 03/31/2009 | | | $ | 12,944 | | | | N.A. | |
Class I | | $ | 250,000 | | | | 03/31/2009 | | | $ | 353,107 | | | | N.A. | |
See Endnotes and Additional Disclosures in this report.
Past performance is no guarantee of future results. Returns are historical and are calculated by determining the percentage change in net asset value (NAV) or offering price (as applicable) with all distributions reinvested. Investment return and principal value will fluctuate so that shares, when redeemed, may be worth more or less than their original cost. Performance less than or equal to one year is cumulative. Performance is for the stated time period only; due to market volatility, the Fund’s current performance may be lower or higher than quoted. Returns are before taxes unless otherwise noted. For performance as of the most recentmonth-end, please refer to eatonvance.com.
Eaton Vance
Short Duration Municipal Opportunities Fund
March 31, 2019
Fund Profile
Credit Quality (% of total investments)6
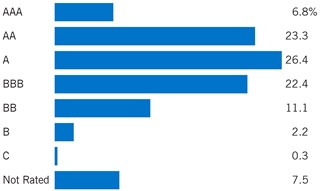
See Endnotes and Additional Disclosures in this report.
Eaton Vance
Short Duration Municipal Opportunities Fund
March 31, 2019
Endnotes and Additional Disclosures
| 1 | The views expressed in this report are those of the portfolio manager(s) and are current only through the date stated at the top of this page. These views are subject to change at any time based upon market or other conditions, and Eaton Vance and the Fund(s) disclaim any responsibility to update such views. These views may not be relied upon as investment advice and, because investment decisions are based on many factors, may not be relied upon as an indication of trading intent on behalf of any Eaton Vance fund. This commentary may contain statements that are not historical facts, referred to as “forward looking statements.” The Fund’s actual future results may differ significantly from those stated in any forward looking statement, depending on factors such as changes in securities or financial markets or general economic conditions, the volume of sales and purchases of Fund shares, the continuation of investment advisory, administrative and service contracts, and other risks discussed from time to time in the Fund’s filings with the Securities and Exchange Commission. |
| 2 | Bloomberg Barclays Municipal Bond Index is an unmanaged index of municipal bonds traded in the U.S. Bloomberg Barclays Short-Intermediate 1–10 Year Municipal Bond Index is an unmanaged index of municipal bonds traded in the U.S. with maturities ranging from 1–10 years. Unless otherwise stated, index returns do not reflect the effect of any applicable sales charges, commissions, expenses, taxes or leverage, as applicable. It is not possible to invest directly in an index. |
| 3 | Total Returns at NAV do not include applicable sales charges. If sales charges were deducted, the returns would be lower. Total Returns shown with maximum sales charge reflect the stated maximum sales charge. Unless otherwise stated, performance does not reflect the deduction of taxes on Fund distributions or redemptions of Fund shares. |
| | Performance prior to the inception date of a class may be linked to the performance of an older class of the Fund. This linked performance is adjusted for any applicable sales charge, but is not adjusted for class expense differences. If adjusted for such differences, the performance would be different. The performance of Class I is linked to Class A. Performance since inception for an index, if presented, is the performance since the Fund’s or oldest share class’ inception, as applicable. Performance presented in the Financial Highlights included in the financial statements is not linked. |
| | Performance prior to November 14, 2016 reflects the Fund’s performance under its former investment objective and policies. |
| 4 | Source: Fund prospectus. Net expense ratios reflect a contractual expense reimbursement that continues through 7/31/19. Without the reimbursement, performance would have been lower. The expense ratios for the current reporting period can be found in the Financial Highlights section of this report. |
| 5 | The Distribution Rate is based on the Fund’s last regular distribution per share in the period (annualized) divided by the Fund’s NAV at the end of the period. The Fund’s distributions may be comprised of amounts characterized for federal income tax purposes astax-exempt income, qualified andnon-qualified ordinary dividends, capital gains and nondividend distributions, also known as return of capital. The Fund will determine the federal income tax character of distributions paid to a shareholder after the end of the calendar year. This is reported on the IRS form1099-DIV and provided to the shareholder shortly after eachyear-end. The Fund’s distributions are determined by the investment adviser based on its current assessment of the Fund’s long-term return potential. As portfolio and market conditions change, the rate of distributions paid by the Fund could change. Taxable-equivalent performance is based on the highest combined federal and state income tax rates, where applicable. Lower tax rates would result in lowertax-equivalent performance. Actual tax rates will vary depending on your income, exemptions and deductions. Rates do not include local taxes. The SEC Yield is a standardized measure based on the estimated yield to maturity of a fund’s investments over a30-day period and is based on the maximum offer price at the date specified. The SEC Yield is not based on the distributions made by the Fund, which may differ. |
| 6 | Ratings are based on Moody’s Investors Service, Inc. (“Moody’s”), S&P Global Ratings (“S&P”) or Fitch Ratings (“Fitch”), as applicable. If securities are rated differently by the ratings agencies, the highest rating is applied. Ratings, which are subject to change, apply to the creditworthiness of the issuers of the underlying securities and not to the Fund or its shares. Credit ratings measure the quality of a bond based on the issuer’s creditworthiness, with ratings ranging from AAA, being the highest, to D, being the lowest based on S&P’s measures. Ratings of BBB or higher by S&P or Fitch (Baa or higher by Moody’s) are considered to be investment-grade quality. Credit ratings are based largely on the ratings agency’s analysis at the time of rating. The rating assigned to any particular security is not necessarily a reflection of the issuer’s current financial condition and does not necessarily reflect its assessment of the volatility of a security’s market value or of the liquidity of an investment in the security. Holdings designated as “Not Rated” (if any) are not rated by the national ratings agencies stated above. |
| 7 | Yield curve is a graphical representation of the yields offered by bonds of various maturities. The yield curve flattens when long-term rates fall and/or short-term rates increase, and the yield curve steepens when long-term rates increase and/or short-term rates fall. |
| 8 | Duration is a measure of the expected change in price of a bond — in percentage terms — given a one percent change in interest rates, all else being constant. Securities with lower durations tend to be less sensitive to interest rate changes. |
| | Fund profile subject to change due to active management. |
Eaton Vance
Short Duration Municipal Opportunities Fund
March 31, 2019
Fund Expenses
Example: As a Fund shareholder, you incur two types of costs: (1) transaction costs, including sales charges (loads) on purchases and redemption fees (if applicable); and (2) ongoing costs, including management fees; distribution and/or service fees; and other Fund expenses. This Example is intended to help you understand your ongoing costs (in dollars) of Fund investing and to compare these costs with the ongoing costs of investing in other mutual funds. The Example is based on an investment of $1,000 invested at the beginning of the period and held for the entire period (October 1, 2018 – March 31, 2019).
Actual Expenses: The first section of the table below provides information about actual account values and actual expenses. You may use the information in this section, together with the amount you invested, to estimate the expenses that you paid over the period. Simply divide your account value by $1,000 (for example, an $8,600 account value divided by $1,000 = 8.6), then multiply the result by the number in the first section under the heading entitled “Expenses Paid During Period” to estimate the expenses you paid on your account during this period.
Hypothetical Example for Comparison Purposes: The second section of the table below provides information about hypothetical account values and hypothetical expenses based on the actual Fund expense ratio and an assumed rate of return of 5% per year (before expenses), which is not the actual Fund return. The hypothetical account values and expenses may not be used to estimate the actual ending account balance or expenses you paid for the period. You may use this information to compare the ongoing costs of investing in your Fund and other funds. To do so, compare this 5% hypothetical example with the 5% hypothetical examples that appear in the shareholder reports of the other funds.
Please note that the expenses shown in the table are meant to highlight your ongoing costs only and do not reflect any transactional costs, such as sales charges (loads) or redemption fees (if applicable). Therefore, the second section of the table is useful in comparing ongoing costs only, and will not help you determine the relative total costs of owning different funds. In addition, if these transactional costs were included, your costs would be higher.
| | | | | | | | | | | | | | | | |
| | | Beginning
Account Value
(10/1/18) | | | Ending
Account Value
(3/31/19) | | | Expenses Paid
During Period*
(10/1/18 – 3/31/19) | | | Annualized
Expense
Ratio | |
| | | | |
Actual | | | | | | | | | | | | | | | | |
Class A | | $ | 1,000.00 | | | $ | 1,023.30 | | | $ | 3.53 | ** | | | 0.70 | % |
Class C | | $ | 1,000.00 | | | $ | 1,020.00 | | | $ | 7.30 | ** | | | 1.45 | % |
Class I | | $ | 1,000.00 | | | $ | 1,025.10 | | | $ | 2.78 | ** | | | 0.55 | % |
| | | | | |
Hypothetical | | | | | | | | | | | | | | | | |
(5% return per year before expenses) | | | | | | | | | | | | | | | | |
Class A | | $ | 1,000.00 | | | $ | 1,021.40 | | | $ | 3.53 | ** | | | 0.70 | % |
Class C | | $ | 1,000.00 | | | $ | 1,017.70 | | | $ | 7.29 | ** | | | 1.45 | % |
Class I | | $ | 1,000.00 | | | $ | 1,022.20 | | | $ | 2.77 | ** | | | 0.55 | % |
| * | Expenses are equal to the Fund’s annualized expense ratio for the indicated Class, multiplied by the average account value over the period, multiplied by 182/365 (to reflect the one-half year period). The Example assumes that the $1,000 was invested at the net asset value per share determined at the close of business on September 30, 2018. |
| ** | Absent an allocation of certain expenses to an affiliate, expenses would be higher. |
Eaton Vance
Short Duration Municipal Opportunities Fund
March 31, 2019
Portfolio of Investments
| | | | | | | | |
| Tax-Exempt Municipal Securities — 96.6% | |
| Security | | Principal
Amount
(000’s omitted) | | | Value | |
|
| Bond Bank — 0.2% | |
| | |
Ohio Water Development Authority, Water Pollution Control Loan Fund, 1.72%, (SIFMA + 0.22%), 12/1/20(1) | | $ | 1,000 | | | $ | 999,630 | |
| | |
| | | | | | | $ | 999,630 | |
|
| Education — 8.5% | |
| | |
California Municipal Finance Authority, (California Lutheran University), 5.00%, 10/1/21 | | $ | 250 | | | $ | 269,625 | |
| | |
California Municipal Finance Authority, (California Lutheran University), 5.00%, 10/1/22 | | | 250 | | | | 276,695 | |
| | |
California Municipal Finance Authority, (California Lutheran University), 5.00%, 10/1/23 | | | 225 | | | | 254,885 | |
| | |
California Municipal Finance Authority, (California Lutheran University), 5.00%, 10/1/24 | | | 275 | | | | 316,627 | |
| | |
California School Finance Authority, (Green Dot Public Schools), 5.00%, 8/1/21(2) | | | 100 | | | | 106,654 | |
| | |
California School Finance Authority, (Green Dot Public Schools), 5.00%, 8/1/22(2) | | | 165 | | | | 179,865 | |
| | |
California School Finance Authority, (Green Dot Public Schools), 5.00%, 8/1/23(2) | | | 175 | | | | 194,593 | |
| | |
California School Finance Authority, (Green Dot Public Schools), 5.00%, 8/1/24(2) | | | 160 | | | | 180,950 | |
| | |
California School Finance Authority, (Green Dot Public Schools), 5.00%, 8/1/25(2) | | | 300 | | | | 344,220 | |
| | |
Massachusetts Development Finance Agency, (Suffolk University), 5.00%, 7/1/23(3) | | | 425 | | | | 476,361 | |
| | |
Massachusetts Development Finance Agency, (Suffolk University), 5.00%, 7/1/24(3) | | | 350 | | | | 399,802 | |
| | |
Massachusetts Development Finance Agency, (Tufts University), (SPA: U.S. Bank, N.A.), 1.42%, 8/15/48(4) | | | 4,750 | | | | 4,750,000 | |
| | |
Massachusetts Development Finance Agency, (Wentworth Institute of Technology), 5.00%, 10/1/21 | | | 355 | | | | 380,347 | |
| | |
Massachusetts Development Finance Agency, (Wentworth Institute of Technology), 5.00%, 10/1/22 | | | 600 | | | | 658,296 | |
| | |
Massachusetts Health and Educational Facilities Authority, (Tufts University), (SPA: Wells Fargo), 1.35%, 2/15/26(4) | | | 1,465 | | | | 1,465,000 | |
| | |
Montana State University, 1.95%, (SIFMA + 0.45%), 9/1/23 (Put Date), 11/15/35(1) | | | 1,830 | | | | 1,830,897 | |
| | |
New Hampshire Health and Education Facilities Authority, (University System of New Hampshire), (SPA: State Street Bank and Trust Co.), 1.48%, 7/1/35(4) | | | 5,200 | | | | 5,200,000 | |
| | |
New Hampshire Health and Education Facilities Authority, (University System of New Hampshire), (SPA: Wells Fargo Bank, N.A.), 1.48%, 7/1/33(4) | | | 3,255 | | | | 3,255,000 | |
| | |
New York Dormitory Authority, (Pace University), 4.00%, 5/1/22 | | | 495 | | | | 521,086 | |
| | |
New York Dormitory Authority, (Yeshiva University), 4.00%, 9/1/23 | | | 1,235 | | | | 1,243,818 | |
| | | | | | | | |
| Security | | Principal
Amount
(000’s omitted) | | | Value | |
|
| Education (continued) | |
| | |
New York Dormitory Authority, (Yeshiva University), 5.00%, 11/1/19 | | $ | 425 | | | $ | 431,694 | |
| | |
Northeastern Pennsylvania Hospital and Education Authority, (Wilkes University), 5.00%, 3/1/25 | | | 1,000 | | | | 1,109,580 | |
| | |
Ohio Higher Educational Facility Commission, (Case Western Reserve University), 2.169%, (70% of 1 mo. USD LIBOR + 0.42%), 4/1/22 (Put Date), 10/1/44(1) | | | 6,750 | | | | 6,748,852 | |
| | |
Pennsylvania Higher Educational Facilities Authority, (Messiah College), 2.20% to 11/1/21 (Put Date), 11/1/31 | | | 750 | | | | 745,620 | |
| | |
Pennsylvania Higher Educational Facilities Authority, (Messiah College), 2.72% to 5/1/21 (Put Date), 11/1/31 | | | 1,845 | | | | 1,845,701 | |
| | |
Pennsylvania Higher Educational Facilities Authority, (York College of Pennsylvania), 2.85% to 5/1/21 (Put Date), 5/1/34 | | | 1,500 | | | | 1,519,380 | |
| | |
Philadelphia Authority for Industrial Development, PA, (La Salle University), 5.00%, 5/1/23 | | | 1,840 | | | | 1,990,052 | |
| | |
Philadelphia Authority for Industrial Development, PA, (La Salle University), 5.00%, 5/1/24 | | | 1,715 | | | | 1,881,492 | |
| | |
Public Finance Authority, WI, (Barton College), 5.00%, 3/1/28 | | | 1,545 | | | | 1,677,932 | |
| | |
South Carolina Educational Facilities Authority for Private Nonprofit Institutions of Higher Learning, (Furman University), (SPA: Wells Fargo Bank, N.A.), 1.51%, 10/1/39(4) | | | 7,570 | | | | 7,570,000 | |
| | |
| | | | | | | $ | 47,825,024 | |
|
| Electric Utilities — 3.7% | |
| | |
Burke County Development Authority, GA, (Oglethorpe Power Corp.), 3.25% to 2/3/25 (Put Date), 11/1/45 | | $ | 4,000 | | | $ | 4,087,200 | |
| | |
Hawaii Department of Budget and Finance, (Hawaiian Electric Co.), (AMT), 3.25%, 1/1/25 | | | 3,250 | | | | 3,334,013 | |
| | |
Long Island Power Authority, NY, Electric System Revenue, 2.493%, (70% of 1 mo. USD LIBOR + 0.75%), 10/1/23 (Put Date), 5/1/33(1) | | | 10,000 | | | | 10,023,400 | |
| | |
Rockport, IN, (Indiana Michigan Power Co.), 3.05%, 6/1/25 | | | 1,600 | | | | 1,636,336 | |
| | |
Vermont Public Power Supply Authority, (Swanton Peaking Facility), 5.00%, 7/1/22 | | | 385 | | | | 417,459 | |
| | |
Vermont Public Power Supply Authority, (Swanton Peaking Facility), 5.00%, 7/1/23 | | | 600 | | | | 664,404 | |
| | |
Vermont Public Power Supply Authority, (Swanton Peaking Facility), 5.00%, 7/1/24 | | | 500 | | | | 564,245 | |
| | |
| | | | | | | $ | 20,727,057 | |
|
| Escrowed / Prerefunded — 0.1% | |
| | |
Massachusetts Turnpike Authority, Escrowed to Maturity, 5.00%, 1/1/20 | | $ | 345 | | | $ | 354,036 | |
| | |
| | | | | | | $ | 354,036 | |
| | | | |
| | 7 | | See Notes to Financial Statements. |
Eaton Vance
Short Duration Municipal Opportunities Fund
March 31, 2019
Portfolio of Investments — continued
| | | | | | | | |
| Security | | Principal
Amount
(000’s omitted) | | | Value | |
|
| General Obligations — 13.6% | |
| | |
American Samoa Economic Development Authority, 6.00%, 9/1/23(2) | | $ | 1,500 | | | $ | 1,520,985 | |
| | |
Beaverton School District No. 48J, Washington and Multnomah Counties, OR, 5.00%, 6/15/24 | | | 1,000 | | | | 1,167,100 | |
| | |
Bensalem Township School District, PA, 3.00%, 2/15/21 | | | 20 | | | | 20,502 | |
| | |
California, 5.00%, 8/1/23 | | | 2,085 | | | | 2,384,406 | |
| | |
Chicago Board of Education, IL, 4.00%, 12/1/20 | | | 250 | | | | 255,425 | |
| | |
Chicago Board of Education, IL, 4.00%, 12/1/22 | | | 700 | | | | 718,263 | |
| | |
Chicago Board of Education, IL, 5.00%, 12/1/20 | | | 945 | | | | 980,787 | |
| | |
Chicago Board of Education, IL, 5.00%, 12/1/22 | | | 1,200 | | | | 1,272,444 | |
| | |
Chicago Board of Education, IL, 5.00%, 12/1/23 | | | 2,000 | | | | 2,138,340 | |
| | |
Chicago Board of Education, IL, 5.00%, 12/1/24 | | | 2,000 | | | | 2,149,760 | |
| | |
Chicago, IL, 5.00%, 12/1/22 | | | 1,000 | | | | 1,033,340 | |
| | |
Chicago, IL, 5.625%, 1/1/29 | | | 1,000 | | | | 1,155,470 | |
| | |
Connecticut, 5.00%, 4/15/23(3) | | | 3,200 | | | | 3,575,360 | |
| | |
Dallas, TX, 5.00%, 2/15/23 | | | 1,000 | | | | 1,089,930 | |
| | |
Dallas, TX, 5.00%, 2/15/26 | | | 1,000 | | | | 1,168,750 | |
| | |
Delaware Valley Regional Finance Authority, PA, 2.428%, (67% of 1 mo. USD LIBOR + 0.76%), 9/1/24 (Put Date), 9/1/48(1) | | | 9,000 | | | | 8,941,500 | |
| | |
Detroit, MI, 5.00%, 4/1/20 | | | 810 | | | | 827,561 | |
| | |
Detroit, MI, 5.00%, 4/1/21 | | | 1,000 | | | | 1,039,060 | |
| | |
Elmira, NY, 3.50%, 5/24/19(2) | | | 2,000 | | | | 2,001,680 | |
| | |
Elmira, NY, 3.75%, 7/16/19(2) | | | 1,000 | | | | 1,002,100 | |
| | |
Elmira, NY, 5.00%, 5/15/26 | | | 115 | | | | 115,066 | |
| | |
Fairfax County, VA, 5.00%, 10/1/21 | | | 2,000 | | | | 2,171,340 | |
| | |
Georgia, 5.00%, 7/1/19 | | | 2,445 | | | | 2,466,198 | |
| | |
Harford County, MD, 5.00%, 9/15/23 | | | 1,000 | | | | 1,146,830 | |
| | |
Honolulu City and County, HI, 1.81%, (SIFMA + 0.31%), 9/1/20 (Put Date), 9/1/24(1) | | | 1,000 | | | | 999,760 | |
| | |
Illinois, 0.00%, 8/1/20 | | | 265 | | | | 253,994 | |
| | |
Illinois, 0.00%, 8/1/21 | | | 200 | | | | 185,274 | |
| | |
Illinois, 5.00%, 12/1/19 | | | 2,500 | | | | 2,549,325 | |
| | |
Illinois, 5.00%, 1/1/20 | | | 750 | | | | 765,510 | |
| | |
Illinois, 5.00%, 8/1/20 | | | 2,000 | | | | 2,068,160 | |
| | |
Illinois, 5.00%, 11/1/21 | | | 10,000 | | | | 10,617,100 | |
| | |
Illinois, 5.00%, 2/1/22 | | | 370 | | | | 393,340 | |
| | |
Illinois, 5.00%, 6/1/22 | | | 495 | | | | 529,640 | |
| | |
Illinois, 5.00%, 10/1/22 | | | 2,000 | | | | 2,153,640 | |
| | |
Illinois, 5.00%, 10/1/23 | | | 285 | | | | 308,886 | |
| | |
Illinois, 5.00%, 2/1/24 | | | 500 | | | | 542,115 | |
| | |
Illinois, 5.00%, 6/1/24 | | | 4,850 | | | | 5,280,680 | |
| | |
Illinois, 5.00%, 8/1/24 | | | 2,085 | | | | 2,211,184 | |
| | |
Illinois, 5.00%, 8/1/25 | | | 1,000 | | | | 1,054,590 | |
| | |
New Haven, CT, 5.00%, 8/1/21 | | | 1,000 | | | | 1,063,040 | |
| | | | | | | | |
| Security | | Principal
Amount
(000’s omitted) | | | Value | |
|
| General Obligations (continued) | |
| | |
North Carolina, 5.00%, 6/1/23 | | $ | 895 | | | $ | 1,019,772 | |
| | |
Union City, NJ, 5.00%, 11/1/23 | | | 1,000 | | | | 1,120,540 | |
| | |
Will and Cook Counties Community High School District No. 210, IL, 5.00%, 1/1/27 | | | 2,000 | | | | 2,101,820 | |
| | |
Will County Community High School District No. 210, IL, 4.00%, 1/1/22 | | | 950 | | | | 950,342 | |
| | |
| | | | | | | $ | 76,510,909 | |
|
| Hospital — 16.2% | |
| | |
Baxter County, AR, (Baxter Regional Medical Center), Series A, 5.00%, 9/1/20 | | $ | 785 | | | $ | 808,817 | |
| | |
California Municipal Finance Authority, (NorthBay Healthcare Group), 5.00%, 11/1/23 | | | 450 | | | | 501,336 | |
| | |
California Public Finance Authority, (Henry Mayo Newhall Hospital), 5.00%, 10/15/22 | | | 150 | | | | 162,801 | |
| | |
California Public Finance Authority, (Henry Mayo Newhall Hospital), 5.00%, 10/15/23 | | | 175 | | | | 193,683 | |
| | |
California Statewide Communities Development Authority, (Loma Linda University Medical Center), 5.50%, 12/1/58(2) | | | 2,000 | | | | 2,265,640 | |
| | |
California Statewide Communities Development Authority, (Methodist Hospital of Southern California), 5.00%, 1/1/22 | | | 500 | | | | 541,170 | |
| | |
California Statewide Communities Development Authority, (Methodist Hospital of Southern California), 5.00%, 1/1/23 | | | 500 | | | | 554,475 | |
| | |
Charlotte-Mecklenburg Hospital Authority, NC, (Atrium Health), 2.10%, (SIFMA + 0.60%), 12/1/23 (Put Date), 1/15/48(1) | | | 3,000 | | | | 3,000,240 | |
| | |
Charlotte-Mecklenburg Hospital Authority, NC, (Atrium Health), (SPA: JPMorgan Chase Bank, N.A.), 1.50%, 1/15/48(4) | | | 4,150 | | | | 4,150,000 | |
| | |
Charlotte-Mecklenburg Hospital Authority, NC, (Carolinas HealthCare System), (SPA: JPMorgan Chase Bank, N.A.), 1.47%, 1/15/38(4) | | | 3,795 | | | | 3,795,000 | |
| | |
Colorado Health Facilities Authority, (Valley View Hospital Association), 2.80% to 5/15/23 (Put Date), 5/15/42 | | | 2,000 | | | | 2,045,260 | |
| | |
Connecticut Health and Educational Facilities Authority, (Hartford HealthCare Corp.), 2.643%, (68% of 1 mo. USD LIBOR + 0.95%), 7/1/20 (Put Date), 7/1/49(1) | | | 1,000 | | | | 1,001,990 | |
| | |
Connecticut Health and Educational Facilities Authority, (Yale New Haven Health), 2.218%, (67% of 1 mo. USD LIBOR + 0.55%), 7/1/19 (Put Date), 7/1/49(1) | | | 1,000 | | | | 1,000,040 | |
| | |
Cuyahoga County, OH, (The MetroHealth System), 5.00%, 2/15/23 | | | 1,000 | | | | 1,090,030 | |
| | |
Decatur Hospital Authority, TX, (Wise Regional Health System), 4.00%, 9/1/20 | | | 255 | | | | 260,725 | |
| | |
Delaware Health Facilities Authority, (Nanticoke Memorial Hospital, Inc.), 5.00%, 7/1/23 | | | 655 | | | | 717,408 | |
| | |
Doylestown Hospital Authority, PA, (Doylestown Hospital), 5.00%, 7/1/20 | | | 1,155 | | | | 1,188,865 | |
| | | | |
| | 8 | | See Notes to Financial Statements. |
Eaton Vance
Short Duration Municipal Opportunities Fund
March 31, 2019
Portfolio of Investments — continued
| | | | | | | | |
| Security | | Principal
Amount
(000’s omitted) | | | Value | |
|
| Hospital (continued) | |
| | |
Idaho Health Facilities Authority, (Madison Memorial Hospital), 5.00%, 9/1/21 | | $ | 1,630 | | | $ | 1,723,643 | |
| | |
Illinois Finance Authority, (Edward-Elmhurst Healthcare), 2.25%, (SIFMA + 0.75%), 7/1/23 (Put Date), 1/1/46(1) | | | 5,000 | | | | 5,000,000 | |
| | |
Illinois Finance Authority, (Presence Health Network), 5.00%, 2/15/23 | | | 1,000 | | | | 1,122,200 | |
| | |
Illinois Finance Authority, (Southern Illinois Healthcare Enterprises, Inc.), 5.00%, 3/1/23 | | | 250 | | | | 276,483 | |
| | |
Indiana Finance Authority, (Parkview Health), 2.05%, (SIFMA + 0.55%), 11/1/23 (Put Date), 11/1/39(1) | | | 3,000 | | | | 3,001,560 | |
| | |
Kanabec County, MN, (FirstLight Health System), 2.75%, 12/1/19 | | | 2,250 | | | | 2,250,382 | |
| | |
Lexington County Health Services District, Inc., SC, (Lexington Medical Center), 5.00%, 11/1/21 | | | 50 | | | | 53,853 | |
| | |
Lexington County Health Services District, Inc., SC, (Lexington Medical Center), 5.00%, 11/1/23 | | | 500 | | | | 564,225 | |
| | |
Lexington County Health Services District, Inc., SC, (Lexington Medical Center), 5.00%, 11/1/25 | | | 80 | | | | 93,668 | |
| | |
Martin County Health Facilities Authority, FL, (Martin Memorial Medical Center), 5.00%, 11/15/24 | | | 100 | | | | 114,840 | |
| | |
Massachusetts Development Finance Agency, (Lawrence General Hospital), 5.00%, 7/1/23 | | | 555 | | | | 605,078 | |
| | |
Massachusetts Development Finance Agency, (Milford Regional Medical Center), 5.00%, 7/15/21 | | | 185 | | | | 194,248 | |
| | |
Massachusetts Development Finance Agency, (Wellforce), 5.00%, 7/1/22 | | | 450 | | | | 493,434 | |
| | |
Massachusetts Development Finance Agency, (Wellforce), 5.00%, 7/1/23 | | | 725 | | | | 812,043 | |
| | |
Massachusetts Development Finance Agency, (Wellforce), 5.00%, 7/1/24 | | | 650 | | | | 741,839 | |
| | |
Massachusetts Health and Educational Facilities Authority, (Lowell General Hospital), 4.75%, 7/1/25 | | | 710 | | | | 735,418 | |
| | |
Michigan Finance Authority, (McLaren Health Care), 2.097%, (68% of 1 mo. USD LIBOR + 0.40%), 10/15/21 (Put Date), 10/15/30(1) | | | 965 | | | | 964,566 | |
| | |
Michigan Finance Authority, (McLaren Health Care), 2.447%, (68% of 1 mo. USD LIBOR + 0.75%), 10/15/20 (Put Date), 10/15/38(1) | | | 5,000 | | | | 5,023,250 | |
| | |
Michigan Finance Authority, (Trinity Health Credit Group), 1.98%, (SIFMA + 0.48%), 2/1/22 (Put Date), 3/1/51(1) | | | 5,000 | | | | 4,999,800 | |
| | |
Montana Facility Finance Authority, (Billings Clinic Obligated Group), 2.05%, (SIFMA + 0.55%), 8/15/23 (Put Date), 8/15/37(1) | | | 4,500 | | | | 4,495,545 | |
| | |
Montgomery County Higher Education and Health Authority, PA, (Holy Redeemer Health System), 5.00%, 10/1/25 | | | 1,050 | | | | 1,169,584 | |
| | |
Montgomery County Higher Education and Health Authority, PA, (Holy Redeemer Health System), 5.00%, 10/1/26 | | | 1,010 | | | | 1,121,979 | |
| | |
Montgomery County Higher Education and Health Authority, PA, (Thomas Jefferson University), 5.00%, 9/1/23 | | | 1,000 | | | | 1,131,510 | |
| | | | | | | | |
| Security | | Principal
Amount
(000’s omitted) | | | Value | |
|
| Hospital (continued) | |
| | |
New Jersey Health Care Facilities Financing Authority, (St. Joseph’s Healthcare System Obligated Group), 5.00%, 7/1/24 | | $ | 540 | | | $ | 610,281 | |
| | |
New Jersey Health Care Facilities Financing Authority, (St. Joseph’s Healthcare System Obligated Group), 5.00%, 7/1/30 | | | 1,595 | | | | 1,811,059 | |
| | |
New Jersey Health Care Facilities Financing Authority, (Trinitas Regional Medical Center), 5.00%, 7/1/20 | | | 1,000 | | | | 1,036,330 | |
| | |
New York Dormitory Authority, (Montefiore Obligated Group), 5.00%, 8/1/24 | | | 1,300 | | | | 1,491,763 | |
| | |
North Carolina Medical Care Commission, (Novant Health Obligated Group), (SPA: JPMorgan Chase Bank, N.A.), 1.52%, 11/1/34(5) | | | 5,000 | | | | 5,000,000 | |
| | |
Northampton County General Purpose Authority, PA, (St. Luke’s University Health Network), 2.783%, (70% of 1 mo. USD LIBOR + 1.04%), 8/15/24 (Put Date), 8/15/48(1) | | | 1,000 | | | | 1,003,470 | |
| | |
Oklahoma Development Finance Authority, (OU Medicine), 5.00%, 8/15/23 | | | 1,250 | | | | 1,384,062 | |
| | |
Oklahoma Development Finance Authority, (OU Medicine), 5.00%, 8/15/24 | | | 720 | | | | 810,461 | |
| | |
Oklahoma Development Finance Authority, (OU Medicine), 5.00%, 8/15/25 | | | 400 | | | | 457,584 | |
| | |
Oroville, CA, (Oroville Hospital), 5.00%, 4/1/25 | | | 1,195 | | | | 1,349,752 | |
| | |
Oroville, CA, (Oroville Hospital), 5.00%, 4/1/28 | | | 1,395 | | | | 1,624,547 | |
| | |
Oroville, CA, (Oroville Hospital), 5.00%, 4/1/29 | | | 1,000 | | | | 1,168,410 | |
| | |
Oroville, CA, (Oroville Hospital), 5.00%, 4/1/30 | | | 1,000 | | | | 1,159,440 | |
| | |
Oroville, CA, (Oroville Hospital), 5.25%, 4/1/54 | | | 3,000 | | | | 3,354,720 | |
| | |
Rhode Island Health and Educational Building Corp., (Care New England Health System), 5.00%, 9/1/19 | | | 1,000 | | | | 1,009,620 | |
| | |
Southcentral Pennsylvania General Authority, (WellSpan Health Obligated Group), 2.10%, (SIFMA + 0.60%), 6/1/24 (Put Date), 6/1/49(1)(3) | | | 7,500 | | | | 7,503,000 | |
| | |
Tallahassee, FL, (Tallahassee Memorial HealthCare, Inc.), 5.00%, 12/1/23 | | | 50 | | | | 56,265 | |
| | |
| | | | | | | $ | 90,797,392 | |
|
| Housing — 3.9% | |
| | |
Massachusetts Development Finance Agency, (UMass Boston Student Housing), 5.00%, 10/1/21 | | $ | 1,000 | | | $ | 1,067,930 | |
| | |
Massachusetts Development Finance Agency, (UMass Boston Student Housing), 5.00%, 10/1/22 | | | 500 | | | | 544,940 | |
| | |
Massachusetts Housing Finance Agency, (Mill Road Apartments), 2.05%, (SIFMA + 0.55%), 11/1/23 (Put Date), 11/1/48(1) | | | 2,675 | | | | 2,675,000 | |
| | |
Minnesota Housing Finance Agency, (FHLMC), (FNMA), (GNMA), 2.05%, (SIFMA + 0.55%), 12/12/23 (Put Date), 7/1/41(1) | | | 10,000 | | | | 10,001,700 | |
| | | | |
| | 9 | | See Notes to Financial Statements. |
Eaton Vance
Short Duration Municipal Opportunities Fund
March 31, 2019
Portfolio of Investments — continued
| | | | | | | | |
| Security | | Principal
Amount
(000’s omitted) | | | Value | |
|
| Housing (continued) | |
| | |
New Hope Cultural Education Facilities Finance Corp., TX, (CHF-Collegiate Housing Island Campus, LLC - Texas A&M University), 4.00%, 4/1/23 | | $ | 1,295 | | | $ | 1,311,239 | |
| | |
North Dakota Housing Finance Agency, 1.90%, (SIFMA + 0.40%), 2/1/22 (Put Date), 1/1/43(1) | | | 2,500 | | | | 2,499,900 | |
| | |
Phoenix Industrial Development Authority, AZ, (Downtown Phoenix Student Housing, LLC - Arizona State University), 5.00%, 7/1/25 | | | 600 | | | | 682,824 | |
| | |
Phoenix Industrial Development Authority, AZ, (Downtown Phoenix Student Housing, LLC - Arizona State University), 5.00%, 7/1/26 | | | 200 | | | | 230,900 | |
| | |
Washington Housing Finance Commission, 2.05%, (SIFMA + 0.55%), 10/1/23 (Put Date), 12/1/48(1) | | | 3,000 | | | | 3,001,620 | |
| | |
| | | | | | | $ | 22,016,053 | |
|
| Industrial Development Revenue — 10.0% | |
| | |
Burke County Development Authority, GA, (Georgia Transmission Corp.), 2.50% to 5/3/21 (Put Date), 1/1/52 | | $ | 2,000 | | | $ | 2,022,640 | |
| | |
California Pollution Control Financing Authority, (Republic Services, Inc.), (AMT), 2.30% to 4/15/19 (Put Date), 11/1/42(2) | | | 4,250 | | | | 4,250,255 | |
| | |
Florida Development Finance Corp., (Waste Pro USA, Inc.), (AMT), 5.00% to 8/1/22 (Put Date), 8/1/29(2) | | | 1,000 | | | | 1,039,700 | |
| | |
Iowa Finance Authority, (Iowa Fertilizer Co.), 3.125%, 12/1/22(3) | | | 4,000 | | | | 4,026,320 | |
| | |
Maine Finance Authority, (Casella Waste Systems, Inc.), (AMT), 4.375% to 8/1/25 (Put Date), 8/1/35(2) | | | 875 | | | | 895,116 | |
| | |
Massachusetts Development Finance Agency, (Waste Management, Inc.), (AMT), 2.25% to 5/1/19 (Put Date), 5/1/27(2) | | | 2,000 | | | | 2,000,180 | |
| | |
Michigan Strategic Fund, (Waste Management, Inc.), (AMT), 2.85% to 8/2/21 (Put Date), 8/1/27 | | | 3,000 | | | | 3,044,010 | |
| | |
Mission Economic Development Corp., TX, (Waste Management, Inc.), (AMT), 2.30%, (SIFMA + 0.80%), 11/1/21 (Put Date), 11/1/48(1) | | | 5,000 | | | | 4,999,950 | |
| | |
Mississippi Business Finance Corp., (Waste Pro USA, Inc.), (AMT), 5.00% to 8/1/22 (Put Date), 2/1/36(2) | | | 1,500 | | | | 1,559,550 | |
| | |
National Finance Authority, NH, (Waste Management, Inc.), (AMT), 2.25%, (SIFMA + 0.75%), 10/1/21 (Put Date), 10/1/33(1) | | | 2,000 | | | | 1,995,000 | |
| | |
New Hampshire Business Finance Authority, (Casella Waste Systems, Inc.), (AMT), 4.00% to 10/1/19 (Put Date), 4/1/29(2) | | | 320 | | | | 321,882 | |
| | |
New Hampshire Business Finance Authority, (United Illuminating Co.), 2.80% to 10/2/23 (Put Date), 10/1/33 | | | 3,500 | | | | 3,587,535 | |
| | |
New York State Environmental Facilities Corp., (Casella Waste Systems, Inc.), (AMT), 3.75% to 12/2/19 (Put Date), 12/1/44(2) | | | 3,055 | | | | 3,074,949 | |
| | | | | | | | |
| Security | | Principal
Amount
(000’s omitted) | | | Value | |
|
| Industrial Development Revenue (continued) | |
| | |
Niagara Area Development Corp., NY, (Covanta), 3.50%, 11/1/24(2) | | $ | 3,930 | | | $ | 4,018,740 | |
| | |
Ohio Air Quality Development Authority, (Ohio Valley Electric Corp.), 5.625%, 10/1/19 | | | 4,150 | | | | 4,194,322 | |
| | |
Ohio Air Quality Development Authority, (Pratt Paper, LLC), (AMT), 3.75%, 1/15/28(2) | | | 800 | | | | 834,688 | |
| | |
Public Finance Authority, WI, (Waste Management, Inc.), (AMT), 2.00% to 6/1/21 (Put Date), 7/1/29 | | | 5,000 | | | | 4,982,250 | |
| | |
Richland County, SC, (International Paper Co.), (AMT), 3.875%, 4/1/23 | | | 1,520 | | | | 1,600,575 | |
| | |
Rockdale County Development Authority, GA, (Pratt Paper, LLC), (AMT), 4.00%, 1/1/38(2) | | | 2,000 | | | | 2,029,440 | |
| | |
Washington Economic Development Finance Authority, (Columbia Pulp I, LLC), (AMT), 7.50%, 1/1/32(2) | | | 500 | | | | 565,300 | |
| | |
West Virginia Economic Development Authority, (Appalachian Power Co.), 2.55% to 4/1/24 (Put Date), 3/1/40(3) | | | 4,000 | | | | 4,056,400 | |
| | |
Whiting, IN, (BP Products North America, Inc.), (AMT), 2.25%, (SIFMA + 0.75%), 12/2/19 (Put Date), 12/1/44(1) | | | 1,000 | | | | 1,000,520 | |
| | |
| | | | | | | $ | 56,099,322 | |
|
| Insured – Electric Utilities — 0.7% | |
| | |
Puerto Rico Electric Power Authority, (AGM), 4.00%, 7/1/23 | | $ | 305 | | | $ | 305,601 | |
| | |
Puerto Rico Electric Power Authority, (NPFG), 5.25%, 7/1/21 | | | 450 | | | | 466,159 | |
| | |
Puerto Rico Electric Power Authority, (NPFG), 5.25%, 7/1/29 | | | 1,740 | | | | 1,880,018 | |
| | |
Puerto Rico Electric Power Authority, Series RR, (NPFG), 5.00%, 7/1/23 | | | 170 | | | | 171,097 | |
| | |
Puerto Rico Electric Power Authority, Series RR, (NPFG), 5.00%, 7/1/24 | | | 500 | | | | 503,030 | |
| | |
Puerto Rico Electric Power Authority, Series SS, (NPFG), 5.00%, 7/1/23 | | | 325 | | | | 327,096 | |
| | |
| | | | | | | $ | 3,653,001 | |
|
| Insured – General Obligations — 1.6% | |
| | |
Atlantic City, NJ, (BAM), 5.00%, 3/1/20 | | $ | 250 | | | $ | 256,570 | |
| | |
Boston, MA, (NPFG), 0.125%, 3/1/22 | | | 2,920 | | | | 2,787,227 | |
| | |
Chicago Board of Education, IL, (AGM), 5.00%, 12/1/23 | | | 100 | | | | 110,934 | |
| | |
Chicago Board of Education, IL, (NPFG), 0.00%, 12/1/20 | | | 1,000 | | | | 952,790 | |
| | |
Chicago Board of Education, IL, (NPFG), 0.00%, 12/1/22 | | | 370 | | | | 329,644 | |
| | |
Matteson, IL, (AGM), 3.60%, 12/1/24 | | | 395 | | | | 403,947 | |
| | |
McHenry and Kane Counties Community Consolidated School District No. 158, IL, (NPFG), 0.00%, 1/1/21 | | | 1,090 | | | | 1,047,512 | |
| | |
Paterson, NJ, (BAM), 5.00%, 1/15/26 | | | 485 | | | | 524,571 | |
| | |
Puerto Rico, (AGC), 5.00%, 7/1/24 | | | 125 | | | | 129,065 | |
| | |
Puerto Rico, (NPFG), 5.25%, 7/1/22 | | | 135 | | | | 136,211 | |
| | |
Stickney, IL, (BAM), 4.00%, 12/1/22 | | | 200 | | | | 212,186 | |
| | |
Stickney, IL, (BAM), 4.00%, 12/1/23 | | | 350 | | | | 375,347 | |
| | | | |
| | 10 | | See Notes to Financial Statements. |
Eaton Vance
Short Duration Municipal Opportunities Fund
March 31, 2019
Portfolio of Investments — continued
| | | | | | | | |
| Security | | Principal
Amount
(000’s omitted) | | | Value | |
|
| Insured – General Obligations (continued) | |
| | |
Will County Community High School District No. 210, IL, (AGM), 0.00%, 1/1/21 | | $ | 1,770 | | | $ | 1,690,474 | |
| | |
| | | | | | | $ | 8,956,478 | |
|
| Insured – Hospital — 1.4% | |
| | |
Charlotte-Mecklenburg Hospital Authority, NC, (Carolinas HealthCare System), (AGM), (LOC: TD Bank, N.A.), 1.45%, 1/15/44(4) | | $ | 7,895 | | | $ | 7,895,000 | |
| | |
| | | | | | | $ | 7,895,000 | |
|
| Insured – Lease Revenue / Certificates of Participation — 1.7% | |
| | |
Kentucky Asset/Liability Commission, (NPFG), 2.353%, (67% of 3 mo. USD LIBOR + 0.52%), 11/1/21(1) | | $ | 7,000 | | | $ | 6,990,270 | |
| | |
Kentucky Asset/Liability Commission, (NPFG), 2.383%, (67% of 3 mo. USD LIBOR + 0.55%), 11/1/25(1) | | | 2,570 | | | | 2,497,372 | |
| | |
| | | | | | | $ | 9,487,642 | |
|
| Insured – Other Revenue — 0.2% | |
| | |
Arborwood Community Development District, FL, (AGM), 2.60%, 5/1/24 | | $ | 1,190 | | | $ | 1,203,637 | |
| | |
| | | | | | | $ | 1,203,637 | |
|
| Insured – Special Tax Revenue — 0.2% | |
| | |
Puerto Rico Convention Center District Authority, (AMBAC), 5.00%, 7/1/31 | | $ | 430 | | | $ | 430,237 | |
| | |
Puerto Rico Infrastructure Financing Authority, (AMBAC), 5.50%, 7/1/24 | | | 410 | | | | 446,449 | |
| | |
Puerto Rico Infrastructure Financing Authority, (AMBAC), 5.50%, 7/1/25 | | | 460 | | | | 505,526 | |
| | |
| | | | | | | $ | 1,382,212 | |
|
| Insured – Transportation — 1.2% | |
| | |
Alabama Port Authority, (AGM), (AMT), 5.00%, 10/1/23 | | $ | 2,075 | | | $ | 2,310,782 | |
| | |
New Jersey Transportation Trust Fund Authority, (NPFG), 5.50%, 12/15/22 | | | 3,000 | | | | 3,345,780 | |
| | |
Puerto Rico Highway and Transportation Authority, (AMBAC), 5.50%, 7/1/29 | | | 315 | | | | 352,913 | |
| | |
Puerto Rico Highway and Transportation Authority, (NPFG), 5.00%, 7/1/29 | | | 645 | | | | 647,664 | |
| | |
| | | | | | | $ | 6,657,139 | |
|
| Lease Revenue / Certificates of Participation — 0.4% | |
| | |
Commonwealth Financing Authority, PA, Tobacco Master Settlement Payment Revenue, 5.00%, 6/1/25 | | $ | 2,000 | | | $ | 2,328,860 | |
| | |
| | | | | | | $ | 2,328,860 | |
| | | | | | | | |
| Security | | Principal
Amount
(000’s omitted) | | | Value | |
|
| Other Revenue — 5.7% | |
| | |
Albany Parking Authority, NY, 5.00%, 7/15/19 | | $ | 160 | | | $ | 161,440 | |
| | |
Albany Parking Authority, NY, 5.00%, 7/15/20 | | | 575 | | | | 597,649 | |
| | |
Albany Parking Authority, NY, 5.00%, 7/15/21 | | | 635 | | | | 679,590 | |
| | |
Albany Parking Authority, NY, 5.00%, 7/15/22 | | | 705 | | | | 772,638 | |
| | |
Allentown Neighborhood Improvement Zone Development Authority, PA, (City Center Project), 5.00%, 5/1/23(2) | | | 750 | | | | 803,910 | |
| | |
Austin Convention Enterprises, Inc., TX, (Convention Center Hotel), 5.00%, 1/1/23 | | | 500 | | | | 553,690 | |
| | |
Austin Convention Enterprises, Inc., TX, (Convention Center Hotel), 5.00%, 1/1/24 | | | 600 | | | | 675,030 | |
| | |
Austin Convention Enterprises, Inc., TX, (Convention Center Hotel), 5.00%, 1/1/25 | | | 500 | | | | 571,985 | |
| | |
Black Belt Energy Gas District, AL, 4.00% to 12/1/23 (Put Date), 12/1/48 | | | 1,000 | | | | 1,065,430 | |
| | |
Kalispel Tribe of Indians, WA, 5.00%, 1/1/32(2) | | | 795 | | | | 871,590 | |
| | |
Kansas City Land Clearance for Redevelopment Authority, MO, (Convention Center Hotel), 4.375%, 2/1/31(2) | | | 1,000 | | | | 1,026,120 | |
| | |
Main Street Natural Gas, Inc., GA, 2.418%, (67% of 1 mo. USD LIBOR + 0.75%), 9/1/23 (Put Date), 4/1/48(1) | | | 2,500 | | | | 2,481,775 | |
| | |
Northern California Gas Authority No. 1, Gas Project Revenue, 2.594%, (67% of 3 mo. USD LIBOR + 0.72%), 7/1/27(1) | | | 1,000 | | | | 972,960 | |
| | |
Patriots Energy Group Financing Agency, SC, Gas Supply Revenue, (Liq: Royal Bank of Canada), 2.528%, (67% of 1 mo. USD LIBOR + 0.86%), 2/1/ 24
(Put Date), 10/1/48(1) | | | 3,000 | | | | 2,984,340 | |
| | |
Southeast Alabama Gas Supply District, (Project No. 1), 2.15%, (SIFMA + 0.65%), 4/1/24 (Put Date), 4/1/49(1) | | | 2,000 | | | | 2,000,540 | |
| | |
Southeast Alabama Gas Supply District, (Project No. 2), 2.518%, (67% of 1 mo. USD LIBOR + 0.85%), 6/1/24 (Put Date), 6/1/49(1) | | | 2,000 | | | | 1,960,620 | |
| | |
Texas Municipal Gas Acquisition and Supply Corp. I, Gas Supply Revenue, 2.449%, (67% of 3 mo. USD LIBOR + 0.70%), 12/15/26(1) | | | 3,680 | | | | 3,659,981 | |
| | |
Washington Health Care Facilities Authority, (Fred Hutchinson Cancer Research Center), 2.772%, (67% of 1 mo. USD LIBOR + 1.10%), 7/1/22 (Put Date), 1/1/42(1) | | | 3,250 | | | | 3,286,887 | |
| | |
Washington Health Care Facilities Authority, (Fred Hutchinson Cancer Research Center), 2.55%, (SIFMA + 1.05%), 7/3/23 (Put Date), 1/1/42(1) | | | 7,000 | | | | 7,112,770 | |
| | |
| | | | | | | $ | 32,238,945 | |
|
| Senior Living / Life Care — 11.3% | |
| | |
Atlantic Beach, FL, (Fleet Landing), 3.25%, 11/15/24 | | $ | 2,155 | | | $ | 2,176,033 | |
| | |
Berks County Industrial Development Authority, PA, (Highlands At Wyomissing), 5.00%, 5/15/28 | | | 300 | | | | 339,228 | |
| | |
Bexar County Health Facilities Development Corp., TX, (Army Retirement Residence Foundation), 5.00%, 7/15/22 | | | 225 | | | | 240,869 | |
| | |
Bexar County Health Facilities Development Corp., TX, (Army Retirement Residence Foundation), 5.00%, 7/15/23 | | | 200 | | | | 217,598 | |
| | | | |
| | 11 | | See Notes to Financial Statements. |
Eaton Vance
Short Duration Municipal Opportunities Fund
March 31, 2019
Portfolio of Investments — continued
| | | | | | | | |
| Security | | Principal
Amount
(000’s omitted) | | | Value | |
|
| Senior Living / Life Care (continued) | |
| | |
Bexar County Health Facilities Development Corp., TX, (Army Retirement Residence Foundation), 5.00%, 7/15/24 | | $ | 250 | | | $ | 275,153 | |
| | |
Bexar County Health Facilities Development Corp., TX, (Army Retirement Residence Foundation), 5.00%, 7/15/25 | | | 250 | | | | 278,385 | |
| | |
Brookhaven Local Development Corp., NY, (Jefferson’s Ferry), 5.00%, 11/1/19 | | | 325 | | | | 330,746 | |
| | |
Bucks County Industrial Development Authority, PA, (Pennswood Village), 5.00%, 10/1/24 | | | 800 | | | | 896,784 | |
| | |
Centerville, OH, (Graceworks Lutheran Services), 5.00%, 11/1/20 | | | 290 | | | | 300,063 | |
| | |
Centerville, OH, (Graceworks Lutheran Services), 5.00%, 11/1/21 | | | 315 | | | | 330,366 | |
| | |
Centerville, OH, (Graceworks Lutheran Services), 5.00%, 11/1/22 | | | 430 | | | | 456,127 | |
| | |
Clackamas County Hospital Facility Authority, OR, (Mary’s Woods at Marylhurst), 3.20%, 5/15/25 | | | 775 | | | | 776,844 | |
| | |
Colorado Health Facilities Authority, (Christian Living Neighborhoods), 4.00%, 1/1/20 | | | 210 | | | | 212,436 | |
| | |
Colorado Health Facilities Authority, (Christian Living Neighborhoods), 4.00%, 1/1/21 | | | 300 | | | | 307,638 | |
| | |
Colorado Health Facilities Authority, (Christian Living Neighborhoods), 4.00%, 1/1/22 | | | 300 | | | | 311,463 | |
| | |
Colorado Health Facilities Authority, (Frasier Meadows Retirement Community), 3.125%, 5/15/27 | | | 500 | | | | 500,620 | |
| | |
Colorado Health Facilities Authority, (Frasier Meadows Retirement Community), 5.00%, 5/15/19 | | | 200 | | | | 200,648 | |
| | |
Colorado Health Facilities Authority, (Frasier Meadows Retirement Community), 5.00%, 5/15/21 | | | 325 | | | | 342,212 | |
| | |
Colorado Health Facilities Authority, (Frasier Meadows Retirement Community), 5.00%, 5/15/22 | | | 850 | | | | 914,158 | |
| | |
District of Columbia, (Ingleside at Rock Creek), 3.875%, 7/1/24 | | | 915 | | | | 915,650 | |
| | |
Franklin County Industrial Development Authority, PA, (Menno-Haven, Inc.), 5.00%, 12/1/21 | | | 250 | | | | 261,910 | |
| | |
Franklin County Industrial Development Authority, PA, (Menno-Haven, Inc.), 5.00%, 12/1/22 | | | 250 | | | | 265,990 | |
| | |
Franklin County Industrial Development Authority, PA, (Menno-Haven, Inc.), 5.00%, 12/1/23 | | | 355 | | | | 383,002 | |
| | |
Franklin County Industrial Development Authority, PA, (Menno-Haven, Inc.), 5.00%, 12/1/24 | | | 425 | | | | 463,594 | |
| | |
Glendale Industrial Development Authority, AZ, (Terraces of Phoenix), 3.60%, 7/1/23 | | | 500 | | | | 503,645 | |
| | |
Hanover County Economic Development Authority, VA, (Covenant Woods), 3.625%, 7/1/28 | | | 720 | | | | 728,431 | |
| | |
Illinois Finance Authority, (Lifespace Communities, Inc.), 5.00%, 5/15/21 | | | 860 | | | | 901,650 | |
| | |
Illinois Finance Authority, (Lifespace Communities, Inc.), 5.00%, 5/15/22 | | | 415 | | | | 441,485 | |
| | |
Iowa Finance Authority, (Northcrest, Inc.), 3.25%, 3/1/23 | | | 3,300 | | | | 3,300,693 | |
| | |
Lancaster County Hospital Authority, PA, (Brethren Village), 5.00%, 7/1/22 | | | 920 | | | | 974,436 | |
| | | | | | | | |
| Security | | Principal
Amount
(000’s omitted) | | | Value | |
|
| Senior Living / Life Care (continued) | |
| | |
Massachusetts Development Finance Agency,(Carleton-Willard Village), 5.25%, 12/1/25 | | $ | 275 | | | $ | 281,465 | |
| | |
Massachusetts Development Finance Agency, (Linden Ponds, Inc.), 4.00%, 11/15/23(2) | | | 2,500 | | | | 2,536,950 | |
| | |
Massachusetts Development Finance Agency, (NewBridge on the Charles, Inc.), 3.50%, 10/1/22(2) | | | 500 | | | | 512,420 | |
| | |
Massachusetts Development Finance Agency, (NewBridge on the Charles, Inc.), 4.00%, 10/1/25(2) | | | 515 | | | | 540,230 | |
| | |
Massachusetts Development Finance Agency, (NewBridge on the Charles, Inc.), 4.00%, 10/1/26(2) | | | 500 | | | | 523,415 | |
| | |
Massachusetts Development Finance Agency, (NewBridge on the Charles, Inc.), 4.00%, 10/1/27(2) | | | 400 | | | | 417,284 | |
| | |
Missouri Health and Educational Facilities Authority, (Lutheran Senior Services), 2.875% to 2/1/22 (Put Date), 2/1/34 | | | 2,000 | | | | 2,009,320 | |
| | |
Montgomery County Industrial Development Authority, PA, (Whitemarsh Continuing Care Retirement Community), 4.00%, 1/1/23 | | | 6,000 | | | | 6,074,160 | |
| | |
New Hope Cultural Education Facilities Finance Corp., TX, (Longhorn Village), 5.00%, 1/1/21 | | | 540 | | | | 555,898 | |
| | |
New Hope Cultural Education Facilities Finance Corp., TX, (Longhorn Village), 5.00%, 1/1/23 | | | 1,795 | | | | 1,889,345 | |
| | |
Norfolk Redevelopment and Housing Authority, VA, (Fort Norfolk Retirement Community, Inc. - Harbor’s Edge), 4.00%, 1/1/25 | | | 1,600 | | | | 1,601,808 | |
| | |
Palm Beach County Health Facilities Authority, FL, (Lifespace Communities, Inc.), 5.00%, 5/15/21 | | | 505 | | | | 529,457 | |
| | |
Public Finance Authority, WI, (Mary’s Woods at Marylhurst), 3.95%, 11/15/24(2) | | | 1,250 | | | | 1,256,812 | |
| | |
Rockville, MD, (Ingleside at King Farm), 3.00%, 11/1/25 | | | 750 | | | | 747,323 | |
| | |
Rockville, MD, (Ingleside at King Farm), 3.50%, 11/1/26 | | | 525 | | | | 526,874 | |
| | |
Salem Hospital Facility Authority, OR, (Capital Manor), 5.00%, 5/15/23 | | | 210 | | | | 233,917 | |
| | |
Sarasota County Health Facilities Authority, FL, (Village on the Isle), 2.70%, 1/1/22 | | | 1,100 | | | | 1,094,203 | |
| | |
Sarasota County Health Facilities Authority, FL, (Village on the Isle), 3.30%, 1/1/23 | | | 1,500 | | | | 1,501,125 | |
| | |
South Carolina Jobs-Economic Development Authority, (South Carolina Episcopal Home at Still Hopes), 5.00%, 4/1/20 | | | 450 | | | | 459,626 | |
| | |
South Carolina Jobs-Economic Development Authority, (South Carolina Episcopal Home at Still Hopes), 5.00%, 4/1/22 | | | 500 | | | | 528,605 | |
| | |
South Carolina Jobs-Economic Development Authority, (South Carolina Episcopal Home at Still Hopes), 5.00%, 4/1/23 | | | 1,365 | | | | 1,461,273 | |
| | |
South Carolina Jobs-Economic Development Authority, (South Carolina Episcopal Home at Still Hopes), 5.00%, 4/1/24 | | | 1,450 | | | | 1,568,262 | |
| | |
South Carolina Jobs-Economic Development Authority, (South Carolina Episcopal Home at Still Hopes), 5.00%, 4/1/25 | | | 1,510 | | | | 1,646,066 | |
| | | | |
| | 12 | | See Notes to Financial Statements. |
Eaton Vance
Short Duration Municipal Opportunities Fund
March 31, 2019
Portfolio of Investments — continued
| | | | | | | | |
| Security | | Principal
Amount
(000’s omitted) | | | Value | |
|
| Senior Living / Life Care (continued) | |
| | |
South Carolina Jobs-Economic Development Authority, (South Carolina Episcopal Home at Still Hopes), 5.00%, 4/1/26 | | $ | 1,595 | | | $ | 1,747,530 | |
| | |
St. Johns County Industrial Development Authority, FL, (Westminster St. Augustine), 4.125% to 8/1/24 (Put Date), 8/1/47 | | | 1,000 | | | | 999,240 | |
| | |
St. Louis County Industrial Development Authority, MO, (Friendship Village St. Louis Obligated Group), 5.00%, 9/1/23 | | | 2,015 | | | | 2,181,258 | |
| | |
St. Louis County Industrial Development Authority, MO, (Friendship Village St. Louis Obligated Group), 5.00%, 9/1/24 | | | 1,490 | | | | 1,630,060 | |
| | |
St. Louis County Industrial Development Authority, MO, (Friendship Village St. Louis Obligated Group), 5.00%, 9/1/25 | | | 1,615 | | | | 1,786,255 | |
| | |
Tarrant County Cultural Education Facilities Finance Corp., TX, (MRC Stevenson Oaks), 10.00%, 3/15/23(2) | | | 520 | | | | 519,901 | |
| | |
Tempe Industrial Development Authority, AZ, (Mirabella at ASU), 4.00%, 10/1/23(2) | | | 2,000 | | | | 2,015,040 | |
| | |
Tulsa County Industrial Authority, OK, (Montereau, Inc.), 5.00%, 11/15/23 | | | 230 | | | | 254,932 | |
| | |
Vermont Economic Development Authority, (Wake Robin Corp.), 4.00%, 5/1/21 | | | 215 | | | | 219,476 | |
| | |
Vermont Economic Development Authority, (Wake Robin Corp.), 5.00%, 5/1/27 | | | 1,000 | | | | 1,092,240 | |
| | |
Washington County, MD, (Diakon Lutheran Social Ministries), 5.00%, 1/1/21 | | | 340 | | | | 356,888 | |
| | |
Washington County, MD, (Diakon Lutheran Social Ministries), 5.00%, 1/1/23 | | | 365 | | | | 401,296 | |
| | |
Washington County, MD, (Diakon Lutheran Social Ministries), 5.00%, 1/1/24 | | | 350 | | | | 391,685 | |
| | |
Washington Housing Finance Commission, (Horizon House), 5.00%, 1/1/25(2) | | | 1,165 | | | | 1,299,068 | |
| | |
Washington Housing Finance Commission, (Judson Park), 3.70%, 7/1/23(2) | | | 440 | | | | 442,702 | |
| | |
Washington Housing Finance Commission, (Wesley Homes at Lea Hill), 3.20%, 7/1/21(2) | | | 395 | | | | 394,222 | |
| | |
Wisconsin Health and Educational Facilities Authority, (Saint John’s Communities, Inc.), 4.00%, 9/15/22 | | | 200 | | | | 208,112 | |
| | |
Wisconsin Health and Educational Facilities Authority, (Saint John’s Communities, Inc.), 4.00%, 9/15/23 | | | 250 | | | | 262,260 | |
| | |
Wisconsin Health and Educational Facilities Authority, (Saint John’s Communities, Inc.), 4.00%, 9/15/24 | | | 365 | | | | 381,034 | |
| | |
| | | | | | | $ | 63,626,894 | |
|
| Special Tax Revenue — 1.4% | |
| | |
Illinois Sports Facilities Authority, 5.00%, 6/15/22 | | $ | 315 | | | $ | 330,860 | |
| | |
Illinois Sports Facilities Authority, 5.00%, 6/15/23 | | | 250 | | | | 266,210 | |
| | | | | | | | |
| Security | | Principal
Amount
(000’s omitted) | | | Value | |
|
| Special Tax Revenue (continued) | |
| | |
Illinois, Sales Tax Revenue, 5.00%, 6/15/22 | | $ | 945 | | | $ | 1,013,550 | |
| | |
New York City Transitional Finance Authority, NY, Future Tax Revenue, (SPA: JPMorgan Chase Bank, N.A.), 1.50%, 8/1/42(4) | | | 5,000 | | | | 5,000,000 | |
| | |
Sales Tax Securitization Corp., IL, 5.00%, 1/1/23 | | | 650 | | | | 711,906 | |
| | |
South Village Community Development District, FL, 2.00%, 5/1/19 | | | 300 | | | | 300,039 | |
| | |
| | | | | | | $ | 7,622,565 | |
|
| Student Loan — 4.9% | |
| | |
Connecticut Higher Education Supplement Loan Authority, (AMT), 5.00%, 11/15/20 | | $ | 550 | | | $ | 575,278 | |
| | |
Connecticut Higher Education Supplement Loan Authority, (AMT), 5.00%, 11/15/22 | | | 750 | | | | 821,663 | |
| | |
Massachusetts Educational Financing Authority, (AMT), 3.50%, 7/1/33 | | | 6,460 | | | | 6,577,507 | |
| | |
Massachusetts Educational Financing Authority, (AMT), 5.00%, 1/1/20 | | | 500 | | | | 511,660 | |
| | |
Massachusetts Educational Financing Authority, (AMT), 5.00%, 7/1/21 | | | 3,900 | | | | 4,162,236 | |
| | |
Massachusetts Educational Financing Authority, (AMT), 5.00%, 7/1/23 | | | 1,000 | | | | 1,119,630 | |
| | |
Massachusetts Educational Financing Authority, Series 2012, (AMT), 5.00%, 7/1/20 | | | 5,000 | | | | 5,192,350 | |
| | |
Massachusetts Educational Financing Authority, Series 2013, (AMT), 5.00%, 7/1/20 | | | 2,000 | | | | 2,076,940 | |
| | |
New Jersey Higher Education Student Assistance Authority, (AMT), 5.00%, 12/1/23 | | | 4,475 | | | | 5,035,673 | |
| | |
Rhode Island Student Loan Authority, (AMT), 5.00%, 12/1/23 | | | 1,250 | | | | 1,408,975 | |
| | |
| | | | | | | $ | 27,481,912 | |
|
| Transportation — 8.7% | |
| | |
Denver City and County, CO, Airport System Revenue, 2.602%, (70% of 1 mo. USD LIBOR + 0.86%), 11/15/19 (Put Date), 11/15/31(1) | | $ | 425 | | | $ | 425,344 | |
| | |
Denver City and County, CO, Airport System Revenue, (AMT), 5.00%, 12/1/24 | | | 5,000 | | | | 5,801,750 | |
| | |
E-470 Public Highway Authority, CO, 2.086%, (67% of 1 mo. USD LIBOR + 0.42%), 9/1/21 (Put Date), 9/1/39(1) | | | 3,500 | | | | 3,501,050 | |
| | |
E-470 Public Highway Authority, CO, 2.722%, (67% of 1 mo. USD LIBOR + 1.05%), 9/1/21 (Put Date), 9/1/39(1) | | | 3,375 | | | | 3,405,341 | |
| | |
Eagle County Air Terminal Corp., CO, (AMT), 4.00%, 5/1/26 | | | 1,000 | | | | 1,090,500 | |
| | |
Grand Parkway Transportation Corp., TX, 5.00%, 2/1/23 | | | 1,600 | | | | 1,785,472 | |
| | |
Maryland Economic Development Corp., (Purple Line Light Rail), (AMT), 5.00%, 3/31/24 | | | 1,000 | | | | 1,074,110 | |
| | |
Maryland Economic Development Corp., (Transportation Facilities), 5.00%, 6/1/23 | | | 1,480 | | | | 1,643,925 | |
| | | | |
| | 13 | | See Notes to Financial Statements. |
Eaton Vance
Short Duration Municipal Opportunities Fund
March 31, 2019
Portfolio of Investments — continued
| | | | | | | | |
| Security | | Principal
Amount
(000’s omitted) | | | Value | |
|
| Transportation (continued) | |
| | |
New Jersey Transportation Trust Fund Authority, 0.00%, 12/15/24 | | $ | 200 | | | $ | 170,060 | |
| | |
New Jersey Transportation Trust Fund Authority, 5.00%, 6/15/23 | | | 1,000 | | | | 1,109,550 | |
| | |
New Jersey Transportation Trust Fund Authority, (Transportation Program), 2.70%, (SIFMA + 1.20%), 12/15/21 (Put Date), 6/15/34(1) | | | 13,000 | | | | 13,104,000 | |
| | |
New Jersey Transportation Trust Fund Authority, (Transportation System), 5.00%, 12/15/23 | | | 1,500 | | | | 1,671,525 | |
| | |
New York Transportation Development Corp., (Delta Airlines, Inc. - LaGuardia Airport Terminals C&D Redevelopment), (AMT), 5.00%, 1/1/23 | | | 3,000 | | | | 3,303,990 | |
| | |
Pennsylvania Turnpike Commission, 2.10%, (SIFMA + 0.60%), 12/1/23(1) | | | 1,000 | | | | 997,410 | |
| | |
Pennsylvania Turnpike Commission, 2.20%, (SIFMA + 0.70%), 12/1/23(1) | | | 2,500 | | | | 2,496,425 | |
| | |
Pennsylvania Turnpike Commission, 2.48%, (SIFMA+ 0.98%), 12/1/21(1) | | | 2,150 | | | | 2,171,306 | |
| | |
Port of Oakland, CA, (AMT), 5.00%, 11/1/24 | | | 2,000 | | | | 2,317,940 | |
| | |
Public Finance Authority, WI, (Denver International Airport Great Hall), (AMT), 5.00%, 9/30/22 | | | 300 | | | | 325,131 | |
| | |
Public Finance Authority, WI, (Denver International Airport Great Hall), (AMT), 5.00%, 9/30/23 | | | 350 | | | | 387,993 | |
| | |
Susquehanna Area Regional Airport Authority, PA, (AMT), 5.00%, 1/1/21 | | | 2,000 | | | | 2,084,940 | |
| | |
| | | | | | | $ | 48,867,762 | |
|
| Water and Sewer — 1.0% | |
| | |
California Department of Water Resources, (Central Valley Project), 1.87%, (SIFMA + 0.37%), 12/1/22 (Put Date), 12/1/35(1) | | $ | 500 | | | $ | 500,125 | |
| | |
Charleston, SC, Waterworks and Sewer System Revenue, 2.119%, (70% of 1 mo. USD LIBOR + 0.37%), 1/1/22 (Put Date), 1/1/35(1) | | | 5,000 | | | | 5,000,150 | |
| | |
Riverside, CA, Water System Revenue, 2.13%, (SIFMA + 0.63%), 1/15/20 (Put Date), 10/1/35(1) | | | 215 | | | | 215,140 | |
| | |
| | | | | | | $ | 5,715,415 | |
| |
Total Tax-Exempt Municipal Securities — 96.6%
(identified cost $536,754,826) | | | $ | 542,446,885 | |
| | | | | | | | |
| Tax-Exempt Mortgage-Backed Securities — 0.1% | | | | | |
| Security | | Principal
Amount
(000’s omitted) | | | Value | |
| | |
FRETE 2017-ML01 Trust, Class A, (Freddie Mac guaranteed), 2.99%, (1 mo. USD LIBOR + 0.50%), 1/25/33(1)(2) | | $ | 484 | | | $ | 484,267 | |
| |
Total Tax-Exempt Mortgage-Backed Securities — 0.1%
(identified cost $483,890) | | | $ | 484,267 | |
| |
| Taxable Municipal Securities — 3.0% | | | | | |
| Security | | Principal
Amount
(000’s omitted) | | | Value | |
|
| Education — 0.7% | |
| | |
Florida Higher Educational Facilities Financing Authority, (Jacksonville University), 5.43%, 6/1/27(2) | | $ | 3,340 | | | $ | 3,396,212 | |
| | |
Public Finance Authority, WI, (Barton College), 5.00%, 3/1/20 | | | 340 | | | | 340,932 | |
| | |
| | | | | | | $ | 3,737,144 | |
|
| General Obligations — 0.2% | |
| | |
Chicago Board of Education, IL, 5.182%, 12/1/21 | | $ | 325 | | | $ | 326,758 | |
| | |
Chicago, IL, 7.75%, 1/1/42 | | | 931 | | | | 1,007,174 | |
| | |
| | | | | | | $ | 1,333,932 | |
|
| Hospital — 1.0% | |
| | |
Doylestown Hospital Authority, PA, (Doylestown Hospital), 2.754%, 7/1/19 | | $ | 500 | | | $ | 499,105 | |
| | |
Doylestown Hospital Authority, PA, (Doylestown Hospital), 3.063%, 7/1/20 | | | 2,020 | | | | 2,008,042 | |
| | |
Doylestown Hospital Authority, PA, (Doylestown Hospital), 3.263%, 7/1/21 | | | 1,000 | | | | 990,850 | |
| | |
Doylestown Hospital Authority, PA, (Doylestown Hospital), 3.489%, 7/1/22 | | | 815 | | | | 807,779 | |
| | |
Oklahoma Development Finance Authority, (OU Medicine), 5.45%, 8/15/28 | | | 1,250 | | | | 1,372,300 | |
| | |
| | | | | | | $ | 5,678,076 | |
|
| Insured – Hospital — 0.2% | |
| | |
Massachusetts Development Finance Agency, (Wellforce), (AGM), 3.522%, 7/1/20 | | $ | 500 | | | $ | 501,385 | |
| | |
Massachusetts Development Finance Agency, (Wellforce), (AGM), 3.653%, 7/1/22 | | | 375 | | | | 379,365 | |
| | |
| | | | | | | $ | 880,750 | |
|
| Senior Living / Life Care — 0.4% | |
| | |
Berks County Industrial Development Authority, PA, (Highlands At Wyomissing), 3.20%, 5/15/21 | | $ | 815 | | | $ | 815,179 | |
| | | | |
| | 14 | | See Notes to Financial Statements. |
Eaton Vance
Short Duration Municipal Opportunities Fund
March 31, 2019
Portfolio of Investments — continued
| | | | | | | | |
| Security | | Principal
Amount
(000’s omitted) | | | Value | |
|
| Senior Living / Life Care (continued) | |
| | |
Clackamas County Hospital Facility Authority, OR, (Mary’s Woods at Marylhurst), 4.00%, 11/15/22 | | $ | 550 | | | $ | 550,720 | |
| | |
Tarrant County Cultural Education Facilities Finance Corp., TX, (Buckner SeniorLiving - Ventana), 4.00%, 11/15/21 | | | 1,060 | | | | 1,060,488 | |
| | |
Tarrant County Cultural Education Facilities Finance Corp., TX, (MRC Stevenson Oaks), 12.50%, 3/15/23(2) | | | 90 | | | | 89,978 | |
| | |
| | | | | | | $ | 2,516,365 | |
|
| Special Tax Revenue — 0.4% | |
| | |
New Jersey Economic Development Authority, (Motor Vehicle Surcharges), 3.29%, 7/1/19 | | $ | 1,290 | | | $ | 1,290,426 | |
| | |
New Jersey Economic Development Authority, (Motor Vehicle Surcharges), 3.52%, 7/1/20 | | | 1,000 | | | | 1,002,390 | |
| | |
| | | | | | | $ | 2,292,816 | |
|
| Transportation — 0.1% | |
| | |
South Jersey Transportation Authority, NJ, 4.20%, 11/1/21 | | $ | 725 | | | $ | 730,118 | |
| | |
| | | | | | | $ | 730,118 | |
| |
Total Taxable Municipal Securities — 3.0%
(identified cost $16,947,895) | | | $ | 17,169,201 | |
|
| Corporate Bonds & Notes — 1.2% | |
| Security | | Principal
Amount
(000’s omitted) | | | Value | |
|
| Hospital — 0.6% | |
| | |
Harnett Health System, Inc., 6.50%, 4/1/32 | | $ | 1,865 | | | $ | 1,942,138 | |
| | |
St. Joseph’s Hospital & Medical Center, 3.926%, 7/1/22 | | | 1,250 | | | | 1,260,525 | |
| | |
| | | | | | | $ | 3,202,663 | |
|
| Other Revenue — 0.6% | |
| | |
Morongo Band of Mission Indians, CA, 7.00%, 10/1/39(2) | | $ | 3,470 | | | $ | 3,631,112 | |
| | |
| | | | | | | $ | 3,631,112 | |
| |
Total Corporate Bonds & Notes — 1.2%
(identified cost $6,585,000) | | | $ | 6,833,775 | |
| |
Total Investments — 100.9%
(identified cost $560,771,611) | | | $ | 566,934,128 | |
| |
Other Assets, Less Liabilities — (0.9)% | | | $ | (5,174,375 | ) |
| |
Net Assets — 100.0% | | | $ | 561,759,753 | |
The percentage shown for each investment category in the Portfolio of Investments is based on net assets.
At March 31, 2019, the concentration of the Fund’s investments in the various states and territories, determined as a percentage of net assets, is as follows:
| | | | |
| |
| Illinois | | | 10.4% | |
| |
| Pennsylvania | | | 10.1% | |
| |
| Others, representing less than 10% individually | | | 80.4% | |
The Fund invests primarily in debt securities issued by municipalities. The ability of the issuers of the debt securities to meet their obligations may be affected by economic developments in a specific industry or municipality. In order to reduce the risk associated with such economic developments, at March 31, 2019, 7.1% of total investments are backed by bond insurance of various financial institutions and financial guaranty assurance agencies. The aggregate percentage insured by an individual financial institution or financial guaranty assurance agency ranged from less than 0.05% to 3.9% of total investments.
| (1) | Floating rate security. The stated interest rate represents the rate in effect at March 31, 2019. |
| (2) | Security exempt from registration pursuant to Rule 144A under the Securities Act of 1933, as amended. These securities may be sold in certain transactions in reliance on an exemption from registration (normally to qualified institutional buyers). At March 31, 2019, the aggregate value of these securities is $49,147,720 or 8.7% of the Fund’s net assets. |
| (3) | When-issued security. |
| (4) | Variable rate demand obligation that may be tendered at par on any day for payment the same or next business day. The stated interest rate, which generally resets daily, is determined by the remarketing agent and represents the rate in effect at March 31, 2019. |
| (5) | Variable rate demand obligation that may be tendered at par on any day for payment the lesser of 5 business days or 7 calendar days. The stated interest rate, which generally resets weekly, is determined by the remarketing agent and represents the rate in effect at March 31, 2019. |
Abbreviations:
| | | | |
| | |
| AGC | | – | | Assured Guaranty Corp. |
| | |
| AGM | | – | | Assured Guaranty Municipal Corp. |
| | |
| AMBAC | | – | | AMBAC Financial Group, Inc. |
| | |
| AMT | | – | | Interest earned from these securities may be considered a tax preference item for purposes of the Federal Alternative Minimum Tax. |
| | |
| BAM | | – | | Build America Mutual Assurance Co. |
| | |
| FHLMC | | – | | Federal Home Loan Mortgage Corp. |
| | |
| FNMA | | – | | Federal National Mortgage Association |
| | |
| GNMA | | – | | Government National Mortgage Association |
| | |
| LIBOR | | – | | London Interbank Offered Rate |
| | |
| Liq | | – | | Liquidity Provider |
| | |
| LOC | | – | | Letter of Credit |
| | |
| NPFG | | – | | National Public Finance Guarantee Corp. |
| | |
| SIFMA | | – | | Securities Industry and Financial Markets Association Municipal Swap Index |
| | |
| SPA | | – | | Standby Bond Purchase Agreement |
Currency Abbreviations:
| | | | |
| | |
| USD | | – | | United States Dollar |
| | | | |
| | 15 | | See Notes to Financial Statements. |
Eaton Vance
Short Duration Municipal Opportunities Fund
March 31, 2019
Statement of Assets and Liabilities
| | | | |
| Assets | | March 31, 2019 | |
| |
Investments, at value (identified cost, $560,771,611) | | $ | 566,934,128 | |
| |
Cash | | | 15,686,053 | |
| |
Interest receivable | | | 4,703,245 | |
| |
Receivable for investments sold | | | 340,000 | |
| |
Receivable for Fund shares sold | | | 2,563,773 | |
| |
Total assets | | $ | 590,227,199 | |
|
| Liabilities | |
| |
Payable for investments purchased | | $ | 7,134,274 | |
| |
Payable for when-issued securities | | | 19,942,327 | |
| |
Payable for Fund shares redeemed | | | 852,139 | |
| |
Distributions payable | | | 165,206 | |
| |
Payable to affiliates: | | | | |
| |
Investment adviser fee | | | 180,416 | |
| |
Distribution and service fees | | | 32,727 | |
| |
Other | | | 37,036 | |
| |
Accrued expenses | | | 123,321 | |
| |
Total liabilities | | $ | 28,467,446 | |
| |
Net Assets | | $ | 561,759,753 | |
|
| Sources of Net Assets | |
| |
Paid-in capital | | $ | 555,106,795 | |
| |
Distributable earnings | | | 6,652,958 | |
| |
Net Assets | | $ | 561,759,753 | |
| |
| Class A Shares | | | | |
| |
Net Assets | | $ | 94,489,220 | |
| |
Shares Outstanding | | | 9,378,932 | |
| |
Net Asset Value and Redemption Price Per Share | | | | |
| |
(net assets ÷ shares of beneficial interest outstanding) | | $ | 10.07 | |
| |
Maximum Offering Price Per Share | | | | |
| |
(100 ÷ 97.75 of net asset value per share) | | $ | 10.30 | |
|
| Class C Shares | |
| |
Net Assets | | $ | 28,258,475 | |
| |
Shares Outstanding | | | 2,928,510 | |
| |
Net Asset Value and Offering Price Per Share* | | | | |
| |
(net assets ÷ shares of beneficial interest outstanding) | | $ | 9.65 | |
|
| Class I Shares | |
| |
Net Assets | | $ | 439,012,058 | |
| |
Shares Outstanding | | | 43,556,803 | |
| |
Net Asset Value, Offering Price and Redemption Price Per Share | | | | |
| |
(net assets ÷ shares of beneficial interest outstanding) | | $ | 10.08 | |
On sales of $100,000 or more ($50,000 or more for certain financial intermediaries, as disclosed in an appendix to the Fund’s prospectus), the offering price of Class A shares is reduced.
| * | Redemption price per share is equal to the net asset value less any applicable contingent deferred sales charge. |
| | | | |
| | 16 | | See Notes to Financial Statements. |
Eaton Vance
Short Duration Municipal Opportunities Fund
March 31, 2019
Statement of Operations
| | | | |
| Investment Income | | Year Ended
March 31, 2019 | |
| |
Interest | | $ | 8,447,330 | |
| |
Total investment income | | $ | 8,447,330 | |
| |
| Expenses | | | | |
| |
Investment adviser and administration fee | | $ | 1,145,721 | |
| |
Distribution and service fees | | | | |
| |
Class A | | | 88,321 | |
| |
Class C | | | 200,843 | |
| |
Trustees’ fees and expenses | | | 15,683 | |
| |
Custodian fee | | | 80,444 | |
| |
Transfer and dividend disbursing agent fees | | | 98,640 | |
| |
Legal and accounting services | | | 48,649 | |
| |
Printing and postage | | | 26,045 | |
| |
Registration fees | | | 138,785 | |
| |
Miscellaneous | | | 53,704 | |
| |
Total expenses | | $ | 1,896,835 | |
| |
Deduct — | | | | |
| |
Allocation of expenses to affiliate | | $ | 19,719 | |
| |
Total expense reductions | | $ | 19,719 | |
| |
Net expenses | | $ | 1,877,116 | |
| |
Net investment income | | $ | 6,570,214 | |
| |
| Realized and Unrealized Gain (Loss) | | | | |
| |
Net realized gain (loss) — | | | | |
| |
Investment transactions | | $ | 850,747 | |
| |
Net realized gain | | $ | 850,747 | |
| |
Change in unrealized appreciation (depreciation) — | | | | |
| |
Investments | | $ | 5,135,439 | |
| |
Net change in unrealized appreciation (depreciation) | | $ | 5,135,439 | |
| |
Net realized and unrealized gain | | $ | 5,986,186 | |
| |
Net increase in net assets from operations | | $ | 12,556,400 | |
| | | | |
| | 17 | | See Notes to Financial Statements. |
Eaton Vance
Short Duration Municipal Opportunities Fund
March 31, 2019
Statements of Changes in Net Assets
| | | | | | | | |
| | | Year Ended March 31, | |
| Increase (Decrease) in Net Assets | | 2019 | | | 2018 | |
| | |
From operations — | | | | | | | | |
| | |
Net investment income | | $ | 6,570,214 | | | $ | 1,476,650 | |
| | |
Net realized gain | | | 850,747 | | | | 217,054 | |
| | |
Net change in unrealized appreciation (depreciation) | | | 5,135,439 | | | | 83,605 | |
| | |
Net increase in net assets from operations | | $ | 12,556,400 | | | $ | 1,777,309 | |
| | |
Distributions to shareholders(1)— | | | | | | | | |
| | |
Class A | | $ | (1,318,352 | ) | | $ | (617,098 | ) |
| | |
Class C | | | (333,353 | ) | | | (147,548 | ) |
| | |
Class I | | | (4,871,566 | ) | | | (691,417 | ) |
| | |
Total distributions to shareholders | | $ | (6,523,271 | ) | | $ | (1,456,063 | ) |
| | |
Transactions in shares of beneficial interest — | | | | | | | | |
| | |
Proceeds from sale of shares | | | | | | | | |
| | |
Class A | | $ | 74,111,564 | | | $ | 15,462,102 | |
| | |
Class C | | | 21,047,540 | | | | 9,630,045 | |
| | |
Class I | | | 422,623,494 | | | | 90,268,161 | |
| | |
Net asset value of shares issued to shareholders in payment of distributions declared | | | | | | | | |
| | |
Class A | | | 1,031,491 | | | | 525,627 | |
| | |
Class C | | | 290,324 | | | | 128,160 | |
| | |
Class I | | | 4,077,176 | | | | 550,030 | |
| | |
Cost of shares redeemed | | | | | | | | |
| | |
Class A | | | (21,422,807 | ) | | | (4,718,853 | ) |
| | |
Class C | | | (6,149,502 | ) | | | (2,779,773 | ) |
| | |
Class I | | | (76,677,890 | ) | | | (14,197,098 | ) |
| | |
Net asset value of shares converted | | | | | | | | |
| | |
Class A | | | 3,685,181 | | | | — | |
| | |
Class C | | | (3,685,181 | ) | | | — | |
| | |
Net increase in net assets from Fund share transactions | | $ | 418,931,390 | | | $ | 94,868,401 | |
| | |
Net increase in net assets | | $ | 424,964,519 | | | $ | 95,189,647 | |
| | |
| Net Assets | | | | | | | | |
| | |
At beginning of year | | $ | 136,795,234 | | | $ | 41,605,587 | |
| | |
At end of year | | $ | 561,759,753 | | | $ | 136,795,234 | (2) |
| (1) | For the year ended March 31, 2018, the source of distributions was from net investment income. The current year presentation of distributions conforms with the Disclosure Update and Simplification Rule issued by the Securities and Exchange commission, effective November 5, 2018. |
| (2) | Includes accumulated distributions in excess of net investment income of $(8,056) at March 31, 2018. The requirement to disclose the corresponding amount as of March 31, 2019 was eliminated. |
| | | | |
| | 18 | | See Notes to Financial Statements. |
Eaton Vance
Short Duration Municipal Opportunities Fund
March 31, 2019
Financial Highlights
| | | | | | | | | | | | | | | | | | | | |
| | | Class A | |
| |
| | | Year Ended March 31, | |
| | | 2019 | | | 2018 | | | 2017 | | | 2016 | | | 2015 | |
| | | | | |
Net asset value — Beginning of year | | $ | 9.950 | | | $ | 9.830 | | | $ | 10.060 | | | $ | 10.030 | | | $ | 9.900 | |
| | | | | |
| Income (Loss) From Operations | | | | | | | | | | | | | | | | | | | | |
| | | | | |
Net investment income(1) | | $ | 0.224 | | | $ | 0.212 | | | $ | 0.248 | | | $ | 0.264 | | | $ | 0.271 | |
| | | | | |
Net realized and unrealized gain (loss) | | | 0.121 | | | | 0.117 | | | | (0.235 | ) | | | 0.027 | | | | 0.128 | |
| | | | | |
Total income from operations | | $ | 0.345 | | | $ | 0.329 | | | $ | 0.013 | | | $ | 0.291 | | | $ | 0.399 | |
| | | | | |
| Less Distributions | | | | | | | | | | | | | | | | | | | | |
| | | | | |
From net investment income | | $ | (0.225 | ) | | $ | (0.209 | ) | | $ | (0.243 | ) | | $ | (0.261 | ) | | $ | (0.269 | ) |
| | | | | |
Total distributions | | $ | (0.225 | ) | | $ | (0.209 | ) | | $ | (0.243 | ) | | $ | (0.261 | ) | | $ | (0.269 | ) |
| | | | | |
Net asset value — End of year | | $ | 10.070 | | | $ | 9.950 | | | $ | 9.830 | | | $ | 10.060 | | | $ | 10.030 | |
| | | | | |
Total Return(2) | | | 3.52 | %(3) | | | 3.36 | %(3) | | | 0.13 | %(3) | | | 2.95 | % | | | 4.06 | % |
| | | | | |
| Ratios/Supplemental Data | | | | | | | | | | | | | | | | | | | | |
| | | | | |
Net assets, end of year (000’s omitted) | | $ | 94,489 | | | $ | 36,045 | | | $ | 24,526 | | | $ | 35,441 | | | $ | 43,069 | |
| | | | | |
Ratios (as a percentage of average daily net assets): | | | | | | | | | | | | | | | | | | | | |
| | | | | |
Expenses(4) | | | 0.70 | %(3) | | | 0.70 | %(3) | | | 0.80 | %(3)(5) | | | 0.77 | % | | | 0.77 | % |
| | | | | |
Net investment income | | | 2.25 | % | | | 2.13 | % | | | 2.48 | % | | | 2.65 | % | | | 2.71 | % |
| | | | | |
Portfolio Turnover | | | 48 | % | | | 55 | % | | | 82 | % | | | 9 | % | | | 4 | % |
| (1) | Computed using average shares outstanding. |
| (2) | Returns are historical and are calculated by determining the percentage change in net asset value with all distributions reinvested and do not reflect the effect of sales charges. |
| (3) | The investment adviser and administrator reimbursed certain operating expenses (equal to 0.01%, 0.15% and 0.22% of average daily net assets for the years ended March 31, 2019, 2018 and 2017, respectively). Absent this reimbursement, total return would be lower. |
| (4) | Excludes the effect of custody fee credits, if any, of less than 0.005%. Effective September 1, 2015, custody fee credits, which were earned on cash deposit balances, were discontinued by the custodian. |
| (5) | Includes interest expense of 0.01%. |
| | | | |
| | 19 | | See Notes to Financial Statements. |
Eaton Vance
Short Duration Municipal Opportunities Fund
March 31, 2019
Financial Highlights — continued
| | | | | | | | | | | | | | | | | | | | |
| | | Class C | |
| |
| | | Year Ended March 31, | |
| | | 2019 | | | 2018 | | | 2017 | | | 2016 | | | 2015 | |
| | | | | |
Net asset value — Beginning of year | | $ | 9.530 | | | $ | 9.410 | | | $ | 9.640 | | | $ | 9.610 | | | $ | 9.480 | |
| | | | | |
| Income (Loss) From Operations | | | | | | | | | | | | | | | | | | | | |
| | | | | |
Net investment income(1) | | $ | 0.144 | | | $ | 0.131 | | | $ | 0.165 | | | $ | 0.181 | | | $ | 0.188 | |
| | | | | |
Net realized and unrealized gain (loss) | | | 0.120 | | | | 0.117 | | | | (0.234 | ) | | | 0.027 | | | | 0.127 | |
| | | | | |
Total income (loss) from operations | | $ | 0.264 | | | $ | 0.248 | | | $ | (0.069 | ) | | $ | 0.208 | | | $ | 0.315 | |
| | | | | |
| Less Distributions | | | | | | | | | | | | | | | | | | | | |
| | | | | |
From net investment income | | $ | (0.144 | ) | | $ | (0.128 | ) | | $ | (0.161 | ) | | $ | (0.178 | ) | | $ | (0.185 | ) |
| | | | | |
Total distributions | | $ | (0.144 | ) | | $ | (0.128 | ) | | $ | (0.161 | ) | | $ | (0.178 | ) | | $ | (0.185 | ) |
| | | | | |
Net asset value — End of year | | $ | 9.650 | | | $ | 9.530 | | | $ | 9.410 | | | $ | 9.640 | | | $ | 9.610 | |
| | | | | |
Total Return(2) | | | 2.79 | %(3) | | | 2.64 | %(3) | | | (0.73 | )%(3) | | | 2.20 | % | | | 3.34 | % |
| | | | | |
| Ratios/Supplemental Data | | | | | | | | | | | | | | | | | | | | |
| | | | | |
Net assets, end of year (000’s omitted) | | $ | 28,258 | | | $ | 16,403 | | | $ | 9,324 | | | $ | 10,396 | | | $ | 11,036 | |
| | | | | |
Ratios (as a percentage of average daily net assets): | | | | | | | | | | | | | | | | | | | | |
| | | | | |
Expenses(4) | | | 1.45 | %(3) | | | 1.45 | %(3) | | | 1.55 | %(3)(5) | | | 1.52 | % | | | 1.52 | % |
| | | | | |
Net investment income | | | 1.51 | % | | | 1.37 | % | | | 1.72 | % | | | 1.89 | % | | | 1.96 | % |
| | | | | |
Portfolio Turnover | | | 48 | % | | | 55 | % | | | 82 | % | | | 9 | % | | | 4 | % |
| (1) | Computed using average shares outstanding. |
| (2) | Returns are historical and are calculated by determining the percentage change in net asset value with all distributions reinvested and do not reflect the effect of sales charges. |
| (3) | The investment adviser and administrator reimbursed certain operating expenses (equal to 0.01%, 0.15% and 0.24% of average daily net assets for the years ended March 31, 2019, 2018 and 2017, respectively). Absent this reimbursement, total return would be lower. |
| (4) | Excludes the effect of custody fee credits, if any, of less than 0.005%. Effective September 1, 2015, custody fee credits, which were earned on cash deposit balances, were discontinued by the custodian. |
| (5) | Includes interest expense of 0.01%. |
| | | | |
| | 20 | | See Notes to Financial Statements. |
Eaton Vance
Short Duration Municipal Opportunities Fund
March 31, 2019
Financial Highlights — continued
| | | | | | | | | | | | | | | | | | | | |
| | | Class I | |
| |
| | | Year Ended March 31, | |
| | | 2019 | | | 2018 | | | 2017 | | | 2016 | | | 2015 | |
| | | | | |
Net asset value — Beginning of year | | $ | 9.950 | | | $ | 9.830 | | | $ | 10.060 | | | $ | 10.030 | | | $ | 9.900 | |
| | | | | |
| Income (Loss) From Operations | | | | | | | | | | | | | | | | | | | | |
| | | | | |
Net investment income(1) | | $ | 0.237 | | | $ | 0.226 | | | $ | 0.269 | | | $ | 0.278 | | | $ | 0.286 | |
| | | | | |
Net realized and unrealized gain (loss) | | | 0.133 | | | | 0.118 | | | | (0.242 | ) | | | 0.027 | | | | 0.128 | |
| | | | | |
Total income from operations | | $ | 0.370 | | | $ | 0.344 | | | $ | 0.027 | | | $ | 0.305 | | | $ | 0.414 | |
| | | | | |
| Less Distributions | | | | | | | | | | | | | | | | | | | | |
| | | | | |
From net investment income | | $ | (0.240 | ) | | $ | (0.224 | ) | | $ | (0.257 | ) | | $ | (0.275 | ) | | $ | (0.284 | ) |
| | | | | |
Total distributions | | $ | (0.240 | ) | | $ | (0.224 | ) | | $ | (0.257 | ) | | $ | (0.275 | ) | | $ | (0.284 | ) |
| | | | | |
Net asset value — End of year | | $ | 10.080 | | | $ | 9.950 | | | $ | 9.830 | | | $ | 10.060 | | | $ | 10.030 | |
| | | | | |
Total Return(2) | | | 3.78 | %(3) | | | 3.51 | %(3) | | | 0.27 | %(3) | | | 3.10 | % | | | 4.21 | % |
| | | | | |
| Ratios/Supplemental Data | | | | | | | | | | | | | | | | | | | | |
| | | | | |
Net assets, end of year (000’s omitted) | | $ | 439,012 | | | $ | 84,347 | | | $ | 7,755 | | | $ | 15,931 | | | $ | 13,677 | |
| | | | | |
Ratios (as a percentage of average daily net assets): | | | | | | | | | | | | | | | | | | | | |
| | | | | |
Expenses(4) | | | 0.55 | %(3) | | | 0.55 | %(3) | | | 0.68 | %(3)(5) | | | 0.62 | % | | | 0.62 | % |
| | | | | |
Net investment income | | | 2.37 | % | | | 2.26 | % | | | 2.68 | % | | | 2.79 | % | | | 2.85 | % |
| | | | | |
Portfolio Turnover | | | 48 | % | | | 55 | % | | | 82 | % | | | 9 | % | | | 4 | % |
| (1) | Computed using average shares outstanding. |
| (2) | Returns are historical and are calculated by determining the percentage change in net asset value with all distributions reinvested. |
| (3) | The investment adviser and administrator reimbursed certain operating expenses (equal to 0.01%, 0.15% and 0.11% of average daily net assets for the years ended March 31, 2019, 2018 and 2017, respectively). Absent this reimbursement, total return would be lower. |
| (4) | Excludes the effect of custody fee credits, if any, of less than 0.005%. Effective September 1, 2015, custody fee credits, which were earned on cash deposit balances, were discontinued by the custodian. |
| (5) | Includes interest expense of 0.01%. |
| | | | |
| | 21 | | See Notes to Financial Statements. |
Eaton Vance
Short Duration Municipal Opportunities Fund
March 31, 2019
Notes to Financial Statements
1 Significant Accounting Policies
Eaton Vance Short Duration Municipal Opportunities Fund (the Fund) is a non-diversified series of Eaton Vance Investment Trust (the Trust). The Trust is a Massachusetts business trust registered under the Investment Company Act of 1940, as amended (the 1940 Act), as an open-end management investment company. The Fund’s investment objective is to seek to maximize after-tax total return. The Fund offers three classes of shares. Class A shares are generally sold subject to a sales charge imposed at time of purchase. Class C shares are sold at net asset value and are generally subject to a contingent deferred sales charge (see Note 5). Effective January 25, 2019, Class C shares generally automatically convert to Class A shares ten years after their purchase as described in the Fund’s prospectus. Class I shares are sold at net asset value and are not subject to a sales charge. Each class represents a pro-rata interest in the Fund, but votes separately on class-specific matters and (as noted below) is subject to different expenses. Realized and unrealized gains and losses are allocated daily to each class of shares based on the relative net assets of each class to the total net assets of the Fund. Net investment income, other than class-specific expenses, is allocated daily to each class of shares based upon the ratio of the value of each class’s paid shares to the total value of all paid shares. Each class of shares differs in its distribution plan and certain other class-specific expenses.
The following is a summary of significant accounting policies of the Fund. The policies are in conformity with accounting principles generally accepted in the United States of America (U.S. GAAP). The Fund is an investment company and follows accounting and reporting guidance in the Financial Accounting Standards Board (FASB) Accounting Standards Codification Topic 946.
A Investment Valuation — The following methodologies are used to determine the market value or fair value of investments.
Debt Obligations. Debt obligations are generally valued on the basis of valuations provided by third party pricing services, as derived from such services’ pricing models. Inputs to the models may include, but are not limited to, reported trades, executable bid and ask prices, broker/dealer quotations, prices or yields of securities with similar characteristics, interest rates, anticipated prepayments, benchmark curves or information pertaining to the issuer, as well as industry and economic events. The pricing services may use a matrix approach, which considers information regarding securities with similar characteristics to determine the valuation for a security. Short-term debt obligations purchased with a remaining maturity of sixty days or less for which a valuation from a third party pricing service is not readily available may be valued at amortized cost, which approximates fair value.
Fair Valuation. Investments for which valuations or market quotations are not readily available or are deemed unreliable are valued at fair value using methods determined in good faith by or at the direction of the Trustees of the Fund in a manner that fairly reflects the security’s value, or the amount that the Fund might reasonably expect to receive for the security upon its current sale in the ordinary course. Each such determination is based on a consideration of relevant factors, which are likely to vary from one pricing context to another. These factors may include, but are not limited to, the type of security, the existence of any contractual restrictions on the security’s disposition, the price and extent of public trading in similar securities of the issuer or of comparable companies or entities, quotations or relevant information obtained from broker/dealers or other market participants, information obtained from the issuer, analysts, and/or the appropriate stock exchange (for exchange-traded securities), an analysis of the company’s or entity’s financial condition, and an evaluation of the forces that influence the issuer and the market(s) in which the security is purchased and sold.
B Investment Transactions and Related Income — Investment transactions for financial statement purposes are accounted for on a trade date basis. Realized gains and losses on investments sold are determined on the basis of identified cost. Interest income is recorded on the basis of interest accrued, adjusted for amortization of premium or accretion of discount.
C Federal Taxes — The Fund’s policy is to comply with the provisions of the Internal Revenue Code applicable to regulated investment companies and to distribute to shareholders each year substantially all of its taxable, if any, and tax-exempt net investment income, and all or substantially all of its net realized capital gains. Accordingly, no provision for federal income or excise tax is necessary. The Fund intends to satisfy conditions which will enable it to designate distributions from the interest income generated by its investments in non-taxable municipal securities, which are exempt from regular federal income tax when received by the Fund, as exempt-interest dividends. The portion of such interest, if any, earned on private activity bonds issued after August 7, 1986, may be considered a tax preference item to shareholders.
As of March 31, 2019, the Fund had no uncertain tax positions that would require financial statement recognition, de-recognition, or disclosure. The Fund files a U.S. federal income tax return annually after its fiscal year-end, which is subject to examination by the Internal Revenue Service for a period of three years from the date of filing.
D Expenses — The majority of expenses of the Trust are directly identifiable to an individual fund. Expenses which are not readily identifiable to a specific fund are allocated taking into consideration, among other things, the nature and type of expense and the relative size of the funds.
E Legal Fees — Legal fees and other related expenses incurred as part of negotiations of the terms and requirement of capital infusions, or that are expected to result in the restructuring of, or a plan of reorganization for, an investment are recorded as realized losses. Ongoing expenditures to protect or enhance an investment are treated as operating expenses.
F Use of Estimates — The preparation of the financial statements in conformity with U.S. GAAP requires management to make estimates and assumptions that affect the reported amounts of assets and liabilities at the date of the financial statements and the reported amounts of income and expense during the reporting period. Actual results could differ from those estimates.
Eaton Vance
Short Duration Municipal Opportunities Fund
March 31, 2019
Notes to Financial Statements — continued
G Indemnifications — Under the Trust’s organizational documents, its officers and Trustees may be indemnified against certain liabilities and expenses arising out of the performance of their duties to the Fund. Under Massachusetts law, if certain conditions prevail, shareholders of a Massachusetts business trust (such as the Trust) could be deemed to have personal liability for the obligations of the Trust. However, the Trust’s Declaration of Trust contains an express disclaimer of liability on the part of Fund shareholders and the By-laws provide that the Trust shall assume the defense on behalf of any Fund shareholders. Moreover, the By-laws also provide for indemnification out of Fund property of any shareholder held personally liable solely by reason of being or having been a shareholder for all loss or expense arising from such liability. Additionally, in the normal course of business, the Fund enters into agreements with service providers that may contain indemnification clauses. The Fund’s maximum exposure under these arrangements is unknown as this would involve future claims that may be made against the Fund that have not yet occurred.
H When-Issued Securities and Delayed Delivery Transactions — The Fund may purchase or sell securities on a delayed delivery or when-issued basis. Payment and delivery may take place after the customary settlement period for that security. At the time the transaction is negotiated, the price of the security that will be delivered is fixed. The Fund maintains cash and/or security positions for these commitments such that sufficient liquid assets will be available to make payments upon settlement. Securities purchased on a delayed delivery or when-issued basis are marked-to-market daily and begin earning interest on settlement date. Losses may arise due to changes in the market value of the underlying securities or if the counterparty does not perform under the contract.
2 Distributions to Shareholders and Income Tax Information
The net investment income of the Fund is determined daily and substantially all of the net investment income so determined is declared as a dividend to shareholders of record at the time of declaration. Distributions are declared separately for each class of shares. Distributions are paid monthly. Distributions of realized capital gains (reduced by available capital loss carryforwards from prior years) are made at least annually. Shareholders may reinvest income and capital gain distributions in additional shares of the same class of the Fund at the net asset value as of the reinvestment date or, at the election of the shareholder, receive distributions in cash. Distributions to shareholders are determined in accordance with income tax regulations, which may differ from U.S. GAAP. As required by U.S. GAAP, only distributions in excess of tax basis earnings and profits are reported in the financial statements as a return of capital. Permanent differences between book and tax accounting relating to distributions are reclassified to paid-in capital. For tax purposes, distributions from short-term capital gains are considered to be from ordinary income.
The tax character of distributions declared for the years ended March 31, 2019 and March 31, 2018 was as follows:
| | | | | | | | |
| | | Year Ended March 31, | |
| | | 2019 | | | 2018 | |
| | |
Tax-exempt income | | $ | 5,816,061 | | | $ | 1,360,267 | |
| | |
Ordinary income | | $ | 707,210 | | | $ | 95,796 | |
During the year ended March 31, 2019, distributable earnings was decreased by $47,127 and paid-in capital was increased by $47,127 due to the Fund’s use of equalization accounting. Tax equalization accounting allows the Fund to treat as a distribution that portion of redemption proceeds representing a redeeming shareholder’s portion of undistributed taxable income and net capital gains. These reclassifications had no effect on the net assets or net asset value per share of the Fund.
As of March 31, 2019, the components of distributable earnings (accumulated loss) on a tax basis were as follows:
| | | | |
| | |
Undistributed ordinary income | | $ | 370,245 | |
| |
Undistributed tax-exempt income | | $ | 157,160 | |
| |
Net unrealized appreciation | | $ | 6,290,759 | |
| |
Distributions payable | | $ | (165,206 | ) |
During the year ended March 31, 2019, capital loss carryforwards of $435,325 were utilized to offset net realized gains by the Fund.
Eaton Vance
Short Duration Municipal Opportunities Fund
March 31, 2019
Notes to Financial Statements — continued
The cost and unrealized appreciation (depreciation) of investments of the Fund at March 31, 2019, as determined on a federal income tax basis, were as follows:
| | | | |
| |
Aggregate cost | | $ | 560,643,367 | |
| |
Gross unrealized appreciation | | $ | 6,595,707 | |
| |
Gross unrealized depreciation | | | (304,946 | ) |
| |
Net unrealized appreciation | | $ | 6,290,761 | |
3 Investment Adviser and Administration Fee and Other Transactions with Affiliates
The investment adviser and administration fee is earned by Eaton Vance Management (EVM), as compensation for investment advisory and administrative services rendered to the Fund. The fee is computed at an annual rate of 0.40% of the Fund’s average daily net assets up to $1 billion, and at a reduced rate on daily net assets of $1 billion or more, and is payable monthly. For the year ended March 31, 2019, the investment adviser fee amounted to $1,145,721 or 0.40% of the Fund’s average daily net assets.
EVM has agreed to reimburse the Fund’s expenses to the extent that total annual operating expenses (relating to ordinary operating expenses only and excluding such expenses as interest, taxes or litigation expenses) exceed 0.70%, 1.45% and 0.55% of the Fund’s average daily net assets for Class A, Class C and Class I, respectively. This agreement may be changed or terminated after July 31, 2019. Pursuant to this agreement, EVM was allocated $19,719 of the Fund’s operating expenses for the year ended March 31, 2019.
EVM provides sub-transfer agency and related services to the Fund pursuant to a Sub-Transfer Agency Support Services Agreement. For the year ended March 31, 2019, EVM earned $5,242 from the Fund pursuant to such agreement, which is included in transfer and dividend disbursing agent fees on the Statement of Operations. The Fund was informed that Eaton Vance Distributors, Inc. (EVD), an affiliate of EVM and the Fund’s principal underwriter, received $14,394 as its portion of the sales charge on sales of Class A shares for the year ended March 31, 2019. EVD also received distribution and service fees from Class A and Class C shares (see Note 4) and contingent deferred sales charges (see Note 5).
Trustees and officers of the Fund who are members of EVM’s organization receive remuneration for their services to the Fund out of the investment adviser fee. Trustees of the Fund who are not affiliated with EVM may elect to defer receipt of all or a percentage of their annual fees in accordance with the terms of the Trustees Deferred Compensation Plan. For the year ended March 31, 2019, no significant amounts have been deferred. Certain officers and Trustees of the Fund are officers of EVM.
4 Distribution Plans
The Fund has in effect a distribution plan for Class A shares (Class A Plan) pursuant to Rule 12b-1 under the 1940 Act. Pursuant to the Class A Plan, the Fund pays EVD a distribution and service fee not exceeding 0.25% per annum of its average daily net assets attributable to Class A shares for distribution services and facilities provided to the Fund by EVD, as well as for personal services and/or the maintenance of shareholder accounts. The Trustees approved distribution and service fee payments equal to 0.15% per annum of the Fund’s average daily net assets attributable to Class A shares. Distribution and service fees paid or accrued to EVD for the year ended March 31, 2019 amounted to $88,321 for Class A shares.
The Fund also has in effect a distribution plan for Class C shares (Class C Plan) pursuant to Rule 12b-1 under the 1940 Act. Pursuant to the Class C Plan, the Fund pays EVD amounts equal to 0.75% per annum of its average daily net assets attributable to Class C shares for providing ongoing distribution services and facilities to the Fund. For the year ended March 31, 2019, the Fund paid or accrued to EVD $167,369 for Class C shares.
Pursuant to the Class C Plan, the Fund also makes payments of service fees to EVD, financial intermediaries and other persons in amounts not exceeding 0.25% per annum of its average daily net assets attributable to that class. The Trustees approved service fee payments equal to 0.15% per annum of the Fund’s average daily net assets attributable to Class C shares. Service fees paid or accrued are for personal services and/or the maintenance of shareholder accounts. They are separate and distinct from the Class C sales commissions and distribution fees payable to EVD. Service fees paid or accrued for the year ended March 31, 2019 amounted to $33,474 for Class C shares.
Distribution and service fees are subject to the limitations contained in the Financial Industry Regulatory Authority Rule 2341(d).
5 Contingent Deferred Sales Charges
A contingent deferred sales charge (CDSC) of 1% generally is imposed on redemptions of Class C shares made within one year of purchase. Class A shares may be subject to a 1% CDSC if redeemed within eighteen months of purchase (depending on the circumstances of purchase). Generally, the CDSC is
Eaton Vance
Short Duration Municipal Opportunities Fund
March 31, 2019
Notes to Financial Statements — continued
based upon the lower of the net asset value at date of redemption or date of purchase. No charge is levied on shares acquired by reinvestment of dividends or capital gain distributions. For the year ended March 31, 2019, the Fund was informed that EVD received approximately $10,000 and $8,000 of CDSCs paid by Class A and Class C shareholders, respectively.
6 Purchases and Sales of Investments
Purchases and sales of investments, other than short-term obligations, aggregated $567,261,230 and $140,043,852, respectively, for the year ended March 31, 2019.
7 Shares of Beneficial Interest
The Fund’s Declaration of Trust permits the Trustees to issue an unlimited number of full and fractional shares of beneficial interest (without par value). Such shares may be issued in a number of different series (such as the Fund) and classes. Transactions in Fund shares were as follows:
| | | | | | | | |
| | | Year Ended March 31, | |
| Class A | | 2019 | | | 2018 | |
| | |
Sales | | | 7,431,485 | | | | 1,548,683 | |
| | |
Issued to shareholders electing to receive payments of distributions in Fund shares | | | 103,365 | | | | 52,742 | |
| | |
Redemptions | | | (2,148,049 | ) | | | (473,733 | ) |
| | |
Converted from Class C shares | | | 369,137 | | | | — | |
| | |
Net increase | | | 5,755,938 | | | | 1,127,692 | |
| |
| | | Year Ended March 31, | |
| Class C | | 2019 | | | 2018 | |
| | |
Sales | | | 2,206,027 | | | | 1,008,770 | |
| | |
Issued to shareholders electing to receive payments of distributions in Fund shares | | | 30,394 | | | | 13,429 | |
| | |
Redemptions | | | (643,940 | ) | | | (291,314 | ) |
| | |
Converted to Class A shares | | | (385,301 | ) | | | — | |
| | |
Net increase | | | 1,207,180 | | | | 730,885 | |
| |
| | | Year Ended March 31, | |
| Class I | | 2019 | | | 2018 | |
| | |
Sales | | | 42,362,188 | | | | 9,054,505 | |
| | |
Issued to shareholders electing to receive payments of distributions in Fund shares | | | 408,081 | | | | 55,206 | |
| | |
Redemptions | | | (7,688,380 | ) | | | (1,423,604 | ) |
| | |
Net increase | | | 35,081,889 | | | | 7,686,107 | |
8 Line of Credit
The Fund participates with other portfolios and funds managed by EVM and its affiliates in a $625 million unsecured line of credit agreement with a group of banks, which is in effect through October 29, 2019. Borrowings are made by the Fund solely to facilitate the handling of unusual and/or unanticipated short-term cash requirements. Interest is charged to the Fund based on its borrowings at an amount above either the Eurodollar rate or Federal Funds rate. In addition, a fee computed at an annual rate of 0.15% on the daily unused portion of the line of credit is allocated among the participating portfolios and funds at the end of each quarter. Because the line of credit is not available exclusively to the Fund, it may be unable to borrow some or all of its requested amounts at any particular time. The Fund did not have any significant borrowings or allocated fees during the year ended March 31, 2019.
Eaton Vance
Short Duration Municipal Opportunities Fund
March 31, 2019
Notes to Financial Statements — continued
9 Fair Value Measurements
Under generally accepted accounting principles for fair value measurements, a three-tier hierarchy to prioritize the assumptions, referred to as inputs, is used in valuation techniques to measure fair value. The three-tier hierarchy of inputs is summarized in the three broad levels listed below.
| • | | Level 1 – quoted prices in active markets for identical investments |
| • | | Level 2 – other significant observable inputs (including quoted prices for similar investments, interest rates, prepayment speeds, credit risk, etc.) |
| • | | Level 3 – significant unobservable inputs (including a fund’s own assumptions in determining the fair value of investments) |
In cases where the inputs used to measure fair value fall in different levels of the fair value hierarchy, the level disclosed is determined based on the lowest level input that is significant to the fair value measurement in its entirety. The inputs or methodology used for valuing securities are not necessarily an indication of the risk associated with investing in those securities.
At March 31, 2019, the hierarchy of inputs used in valuing the Fund’s investments, which are carried at value, were as follows:
| | | | | | | | | | | | | | | | |
| Asset Description | | Level 1 | | | Level 2 | | | Level 3 | | | Total | |
| | | | |
Tax-Exempt Municipal Securities | | $ | — | | | $ | 542,446,885 | | | $ | — | | | $ | 542,446,885 | |
| | | | |
Tax-Exempt Mortgage-Backed Securities | | | — | | | | 484,267 | | | | — | | | | 484,267 | |
| | | | |
Taxable Municipal Securities | | | — | | | | 17,169,201 | | | | — | | | | 17,169,201 | |
| | | | |
Corporate Bonds & Notes | | | — | | | | 6,833,775 | | | | — | | | | 6,833,775 | |
| | | | |
Total Investments | | $ | — | | | $ | 566,934,128 | | | $ | — | | | $ | 566,934,128 | |
Eaton Vance
Short Duration Municipal Opportunities Fund
March 31, 2019
Report of Independent Registered Public Accounting Firm
To the Trustees of Eaton Vance Investment Trust and Shareholders of Eaton Vance Short Duration Municipal Opportunities Fund:
Opinion on the Financial Statements and Financial Highlights
We have audited the accompanying statement of assets and liabilities of Eaton Vance Short Duration Municipal Opportunities Fund (the “Fund”) (one of the funds constituting Eaton Vance Investment Trust), including the portfolio of investments, as of March 31, 2019, the related statement of operations for the year then ended, the statements of changes in net assets for each of the two years in the period then ended, the financial highlights for each of the five years in the period then ended, and the related notes. In our opinion, the financial statements and financial highlights present fairly, in all material respects, the financial position of the Fund, as of March 31, 2019, and the results of its operations for the year then ended, the changes in its net assets for each of the two years in the period then ended, and the financial highlights for each of the five years in the period then ended in conformity with accounting principles generally accepted in the United States of America.
Basis for Opinion
These financial statements and financial highlights are the responsibility of the Fund’s management. Our responsibility is to express an opinion on the Fund’s financial statements and financial highlights based on our audits. We are a public accounting firm registered with the Public Company Accounting Oversight Board (United States) (PCAOB) and are required to be independent with respect to the Fund in accordance with the U.S. federal securities laws and the applicable rules and regulations of the Securities and Exchange Commission and the PCAOB.
We conducted our audits in accordance with the standards of the PCAOB. Those standards require that we plan and perform the audit to obtain reasonable assurance about whether the financial statements and financial highlights are free of material misstatement, whether due to error or fraud. The Fund is not required to have, nor were we engaged to perform, an audit of its internal control over financial reporting. As part of our audits we are required to obtain an understanding of internal control over financial reporting but not for the purpose of expressing an opinion on the effectiveness of the Fund’s internal control over financial reporting. Accordingly, we express no such opinion.
Our audits included performing procedures to assess the risks of material misstatement of the financial statements and financial highlights, whether due to error or fraud, and performing procedures that respond to those risks. Such procedures included examining, on a test basis, evidence regarding the amounts and disclosures in the financial statements and financial highlights. Our audits also included evaluating the accounting principles used and significant estimates made by management, as well as evaluating the overall presentation of the financial statements and financial highlights. Our procedures included confirmation of securities owned, as of March 31, 2019, by correspondence with the custodian and brokers; when replies were not received from brokers, we performed other auditing procedures. We believe that our audits provide a reasonable basis for our opinion.
/s/ Deloitte & Touche LLP
Boston, Massachusetts
May 17, 2019
We have served as the auditor of one or more Eaton Vance investment companies since 1959.
Eaton Vance
Short Duration Municipal Opportunities Fund
March 31, 2019
Federal Tax Information (Unaudited)
The Form 1099-DIV you receive in February 2020 will show the tax status of all distributions paid to your account in calendar year 2019. Shareholders are advised to consult their own tax adviser with respect to the tax consequences of their investment in the Fund. As required by the Internal Revenue Code and/or regulations, shareholders must be notified regarding exempt-interest dividends and capital gains dividends.
Exempt-Interest Dividends. For the fiscal year ended March 31, 2019, the Fund designates 89.16% of distributions from net investment income as an exempt-interest dividend.
Capital Gains Dividends. The Fund hereby designates as a capital gain dividend with respect to the taxable year ended March 31, 2019, $4,372 or, if subsequently determined to be different, the net capital gain of such year.
Eaton Vance
Short Duration Municipal Opportunities Fund
March 31, 2019
Management and Organization
Fund Management. The Trustees of Eaton Vance Investment Trust (the Trust) are responsible for the overall management and supervision of the Trust’s affairs. The Trustees and officers of the Trust are listed below. Except as indicated, each individual has held the office shown or other offices in the same company for the last five years. Trustees and officers of the Trust hold indefinite terms of office. The “noninterested Trustees” consist of those Trustees who are not “interested persons” of the Trust, as that term is defined under the 1940 Act. The business address of each Trustee and officer is Two International Place, Boston, Massachusetts 02110. As used below, “EVC” refers to Eaton Vance Corp., “EV” refers to Eaton Vance, Inc., “EVM” refers to Eaton Vance Management, “BMR” refers to Boston Management and Research and “EVD” refers to Eaton Vance Distributors, Inc. EVC and EV are the corporate parent and trustee, respectively, of EVM and BMR. EVD is a wholly-owned subsidiary of EVC. Each officer affiliated with Eaton Vance may hold a position with other Eaton Vance affiliates that is comparable to his or her position with EVM listed below. Each Trustee oversees 172 portfolios in the Eaton Vance Complex (including all master and feeder funds in a master feeder structure). Each officer serves as an officer of certain other Eaton Vance funds. Each Trustee and officer serves until his or her successor is elected.
| | | | | | |
| Name and Year of Birth | | Position(s)
with the
Trust | | Trustee
Since(1) | | Principal Occupation(s) and Directorships During Past Five Years and Other Relevant Experience |
|
| Interested Trustee |
| | | |
Thomas E. Faust Jr. 1958 | | Trustee | | 2007 | | Chairman, Chief Executive Officer and President of EVC, Director and President of EV, Chief Executive Officer and President of EVM and BMR, and Director of EVD. Trustee and/or officer of 172 registered investment companies. Mr. Faust is an interested person because of his positions with EVM, BMR, EVD, EVC and EV, which are affiliates of the Trust. Directorships in the Last Five Years.(2)Director of EVC and Hexavest Inc. (investment management firm). |
|
| Noninterested Trustees |
| | | |
Mark R. Fetting 1954 | | Trustee | | 2016 | | Private investor. Formerly held various positions at Legg Mason, Inc. (investment management firm) (2000-2012), including President, Chief Executive Officer, Director and Chairman (2008-2012), Senior Executive Vice President (2004-2008) and Executive Vice President (2001-2004). Formerly, President of Legg Mason family of funds (2001-2008). Formerly, Division President and Senior Officer of Prudential Financial Group, Inc. and related companies (investment management firm)(1991-2000). Directorships in the Last Five Years. None. |
| | | |
Cynthia E. Frost 1961 | | Trustee | | 2014 | | Private investor. Formerly, Chief Investment Officer of Brown University (university endowment) (2000-2012). Formerly, Portfolio Strategist for Duke Management Company (university endowment manager) (1995-2000). Formerly, Managing Director, Cambridge Associates (investment consulting company)(1989-1995). Formerly, Consultant, Bain and Company (management consulting firm)(1987-1989). Formerly, Senior Equity Analyst, BA Investment Management Company(1983-1985). Directorships in the Last Five Years. None. |
| | | |
George J. Gorman 1952 | | Trustee | | 2014 | | Principal at George J. Gorman LLC (consulting firm). Formerly, Senior Partner at Ernst & Young LLP (a registered public accounting firm) (1974-2009). Directorships in the Last Five Years. Formerly, Trustee of the BofA Funds Series Trust (11 funds) (2011-2014) and of the Ashmore Funds (9 funds) (2010-2014). |
| | | |
Valerie A. Mosley 1960 | | Trustee | | 2014 | | Chairwoman and Chief Executive Officer of Valmo Ventures (a consulting and investment firm). Former Partner and Senior Vice President, Portfolio Manager and Investment Strategist at Wellington Management Company, LLP (investment management firm) (1992-2012). Former Chief Investment Officer, PG Corbin Asset Management (1990-1992). Formerly worked in institutional corporate bond sales at Kidder Peabody (1986-1990). Directorships in the Last Five Years.(2)Director of Envestnet, Inc. (provider of intelligent systems for wealth management and financial wellness) (since 2018). Director of Dynex Capital, Inc. (mortgage REIT) (since 2013). |
Eaton Vance
Short Duration Municipal Opportunities Fund
March 31, 2019
Management and Organization — continued
| | | | | | |
| Name and Year of Birth | | Position(s)
with the
Trust | | Trustee
Since(1) | | Principal Occupation(s) and Directorships During Past Five Years and Other Relevant Experience |
|
| Noninterested Trustees (continued) |
| | | |
William H. Park 1947 | | Chairperson of the Board and Trustee | | 2016 (Chairperson); 2003 (Trustee) | | Private investor. Formerly, Consultant (management and transactional)(2012-2014). Formerly, Chief Financial Officer, Aveon Group L.P. (investment management firm) (2010-2011). Formerly, Vice Chairman, Commercial Industrial Finance Corp. (specialty finance company) (2006-2010). Formerly, President and Chief Executive Officer, Prizm Capital Management, LLC (investment management firm)(2002-2005). Formerly, Executive Vice President and Chief Financial Officer, United Asset Management Corporation (investment management firm) (1982-2001). Formerly, Senior Manager, Price Waterhouse (now PricewaterhouseCoopers) (a registered public accounting firm)(1972-1981). Directorships in the Last Five Years.(2)None. |
| | | |
Helen Frame Peters 1948 | | Trustee | | 2008 | | Professor of Finance, Carroll School of Management, Boston College. Formerly, Dean, Carroll School of Management, Boston College (2000-2002). Formerly, Chief Investment Officer, Fixed Income, Scudder Kemper Investments (investment management firm) (1998-1999). Formerly, Chief Investment Officer, Equity and Fixed Income, Colonial Management Associates (investment management firm)(1991-1998). Directorships in the Last Five Years.(2)None. |
| | | |
Keith Quinton(3) 1958 | | Trustee | | 2018 | | Independent Investment Committee Member at New Hampshire Retirement System (since 2017). Advisory Committee member at Northfield Information Services, Inc. (risk management analytics provider) (since 2016). Formerly, Portfolio Manager and Senior Quantitative Analyst at Fidelity Investments (investment management firm)(2001-2014). Directorships in the Last Five Years. Director of New Hampshire Municipal Bond Bank (since 2016). |
| | | |
Marcus L. Smith(3) 1966 | | Trustee | | 2018 | | Member of Posse Boston Advisory Board (foundation) (since 2015); Trustee at University of Mount Union (since 2008). Formerly, Portfolio Manager at MFS Investment Management (investment management firm) (1994-2017). Directorships in the Last Five Years. Director of MSCI Inc. (global provider of investment decision support tools) (since 2017). Formerly, Director of DCT Industrial Trust Inc. (logistics real estate company)(2017-2018). |
| | | |
Susan J. Sutherland 1957 | | Trustee | | 2015 | | Private investor. Formerly, Associate, Counsel and Partner at Skadden, Arps, Slate, Meagher & Flom LLP (law firm) (1982-2013). Directorships in the Last Five Years. Formerly, Director of Montpelier Re Holdings Ltd. (global provider of customized insurance and reinsurance products) (2013-2015). |
| | | |
Scott E. Wennerholm 1959 | | Trustee | | 2016 | | Formerly, Trustee at Wheelock College (postsecondary institution) (2012-2018). Formerly, Consultant at GF Parish Group (executive recruiting firm) (2016-2017). Formerly, Chief Operating Officer and Executive Vice President at BNY Mellon Asset Management (investment management firm) (2005-2011). Formerly, Chief Operating Officer and Chief Financial Officer at Natixis Global Asset Management (investment management firm) (1997-2004). Formerly, Vice President at Fidelity Investments Institutional Services (investment management firm) (1994-1997). Directorships in the Last Five Years. None. |
| | | | | | |
| Name and Year of Birth | | Position(s)
with the
Trust | | Officer
Since(4) | | Principal Occupation(s)
During Past Five Years |
| |
| Principal Officers who are not Trustees | | |
| | | |
Payson F. Swaffield 1956 | | President | | 2003 | | Vice President and Chief Income Investment Officer of EVM and BMR. Also Vice President of Calvert Research and Management (“CRM”). |
| | | |
Maureen A. Gemma 1960 | | Vice President, Secretary and Chief Legal Officer | | 2005 | | Vice President of EVM and BMR. Also Vice President of CRM. |
Eaton Vance
Short Duration Municipal Opportunities Fund
March 31, 2019
Management and Organization — continued
| | | | | | |
| Name and Year of Birth | | Position(s)
with the
Trust | | Officer
Since(4) | | Principal Occupation(s)
During Past Five Years |
| |
| Principal Officers who are not Trustees (continued) | | |
| | | |
James F. Kirchner 1967 | | Treasurer | | 2007 | | Vice President of EVM and BMR. Also Vice President of CRM. |
| | | |
Richard F. Froio 1968 | | Chief Compliance Officer | | 2017 | | Vice President of EVM and BMR since 2017. Formerly, Deputy Chief Compliance Officer (Adviser/Funds) and Chief Compliance Officer (Distribution) at PIMCO(2012-2017) and Managing Director at BlackRock/Barclays Global Investors(2009-2012). |
| (1) | Year first appointed to serve as Trustee for a fund in the Eaton Vance family of funds. Each Trustee has served continuously since appointment unless indicated otherwise. |
| (2) | During their respective tenures, the Trustees (except for Mmes. Frost and Sutherland and Messrs. Fetting, Gorman, Quinton, Smith and Wennerholm) also served as Board members of one or more of the following funds (which operated in the years noted): eUnitsTM 2 Year U.S. Market Participation Trust: Upside to Cap / Buffered Downside (launched in 2012 and terminated in 2014); and eUnitsTM 2 Year U.S. Market Participation Trust II: Upside to Cap / Buffered Downside (launched in 2012 and terminated in 2014). However, Ms. Mosley did not serve as a Board member of eUnitsTM 2 Year U.S. Market Participation Trust: Upside to Cap / Buffered Downside (launched in 2012 and terminated in 2014). |
| (3) | Messrs. Quinton and Smith began serving as Trustees effective October 1, 2018. |
| (4) | Year first elected to serve as officer of a fund in the Eaton Vance family of funds when the officer has served continuously. Otherwise, year of most recent election as an officer of a fund in the Eaton Vance family of funds. Titles may have changed since initial election. |
The SAI for the Fund includes additional information about the Trustees and officers of the Fund and can be obtained without charge on Eaton Vance’s website at www.eatonvance.com or by calling 1-800-262-1122.
Eaton Vance Funds
IMPORTANT NOTICES
Privacy. The Eaton Vance organization is committed to ensuring your financial privacy. Each of the financial institutions identified below has in effect the following policy (“Privacy Policy”) with respect to nonpublic personal information about its customers:
| • | | Only such information received from you, through application forms or otherwise, and information about your Eaton Vance fund transactions will be collected. This may include information such as name, address, social security number, tax status, account balances and transactions. |
| • | | None of such information about you (or former customers) will be disclosed to anyone, except as permitted by law (which includes disclosure to employees necessary to service your account). In the normal course of servicing a customer’s account, Eaton Vance may share information with unaffiliated third parties that perform various required services such as transfer agents, custodians and broker-dealers. |
| • | | Policies and procedures (including physical, electronic and procedural safeguards) are in place that are designed to protect the confidentiality of such information. |
| • | | We reserve the right to change our Privacy Policy at any time upon proper notification to you. Customers may want to review our Privacy Policy periodically for changes by accessing the link on our homepage: www.eatonvance.com. |
Our pledge of privacy applies to the following entities within the Eaton Vance organization: the Eaton Vance Family of Funds, Eaton Vance Management, Eaton Vance Investment Counsel, Eaton Vance Distributors, Inc., Eaton Vance Trust Company, Eaton Vance Management (International) Limited, Eaton Vance Advisers International Ltd., Eaton Vance Management’s Real Estate Investment Group and Boston Management and Research. In addition, our Privacy Policy applies only to those Eaton Vance customers who are individuals and who have a direct relationship with us. If a customer’s account (i.e., fund shares) is held in the name of a third-party financial advisor/broker-dealer, it is likely that only such advisor’s privacy policies apply to the customer. This notice supersedes all previously issued privacy disclosures. For more information about Eaton Vance’s Privacy Policy, please call 1-800-262-1122.
Delivery of Shareholder Documents. The Securities and Exchange Commission (SEC) permits funds to deliver only one copy of shareholder documents, including prospectuses, proxy statements and shareholder reports, to fund investors with multiple accounts at the same residential or post office box address. This practice is often called “householding” and it helps eliminate duplicate mailings to shareholders.Eaton Vance, or your financial advisor, may household the mailing of your documents indefinitely unless you instruct Eaton Vance, or your financial advisor, otherwise.If you would prefer that your Eaton Vance documents not be householded, please contact Eaton Vance at 1-800-262-1122, or contact your financial advisor. Your instructions that householding not apply to delivery of your Eaton Vance documents will typically be effective within 30 days of receipt by Eaton Vance or your financial advisor.
Portfolio Holdings. Each Eaton Vance Fund and its underlying Portfolio(s) (if applicable) files a schedule of portfolio holdings on Part F toForm N-PORT with the SEC for the first and third quarters of each fiscal year. The Form N-PORT will be available on the Eaton Vance website at www.eatonvance.com, by calling Eaton Vance at 1-800-262-1122 or in the EDGAR database on the SEC’s website at www.sec.gov.
Proxy Voting. From time to time, funds are required to vote proxies related to the securities held by the funds. The Eaton Vance Funds or their underlying Portfolios (if applicable) vote proxies according to a set of policies and procedures approved by the Funds’ and Portfolios’ Boards. You may obtain a description of these policies and procedures and information on how the Funds or Portfolios voted proxies relating to portfolio securities during the most recent 12-month period ended June 30, without charge, upon request, by calling 1-800-262-1122 and by accessing the SEC’s website at www.sec.gov.
Investment Adviser and Administrator
Eaton Vance Management
Two International Place
Boston, MA 02110
Principal Underwriter*
Eaton Vance Distributors, Inc.
Two International Place
Boston, MA 02110
(617) 482-8260
Custodian
State Street Bank and Trust Company
State Street Financial Center, One Lincoln Street
Boston, MA 02111
Transfer Agent
BNY Mellon Investment Servicing (US) Inc.
Attn: Eaton Vance Funds
P.O. Box 9653
Providence, RI 02940-9653
(800) 262-1122
Independent Registered Public Accounting Firm
Deloitte & Touche LLP
200 Berkeley Street
Boston, MA 02116-5022
Fund Offices
Two International Place
Boston, MA 02110
| * | FINRA BrokerCheck. Investors may check the background of their Investment Professional by contacting the Financial Industry Regulatory Authority (FINRA). FINRA BrokerCheck is a free tool to help investors check the professional background of current and former FINRA-registered securities firms and brokers. FINRA BrokerCheck is available by calling 1-800-289-9999 and at www.FINRA.org. The FINRA BrokerCheck brochure describing this program is available to investors at www.FINRA.org. |

23361 3.31.19
Item 2. Code of Ethics
The registrant has adopted a code of ethics applicable to its Principal Executive Officer, Principal Financial Officer and Principal Accounting Officer. The registrant undertakes to provide a copy of such code of ethics to any person upon request, without charge, by calling1-800-262-1122. The registrant has not amended the code of ethics as described in FormN-CSR during the period. The registrant has not granted any waiver, including an implicit waiver, from a provision of the code of ethics as described in FormN-CSR during the period covered by this report.
Item 3. Audit Committee Financial Expert
The registrant’s Board has designated George J. Gorman and William H. Park, each an independent trustee, as audit committee financial experts. Mr. Gorman is a certified public accountant who is the Principal at George J. Gorman LLC (a consulting firm). Previously, Mr. Gorman served in various capacities at Ernst & Young LLP (a registered public accounting firm), including as Senior Partner. Mr. Gorman also has experience serving as an independent trustee and audit committee financial expert of other mutual fund complexes. Mr. Park is a certified public accountant who is a private investor. Previously, he served as a consultant, as the Chief Financial Officer of Aveon Group, L.P. (an investment management firm), as the Vice Chairman of
Commercial Industrial Finance Corp. (specialty finance company), as President and Chief Executive Officer of Prizm Capital Management, LLC (investment management firm), as Executive Vice President and Chief Financial Officer of United Asset Management Corporation (an institutional investment management firm) and as a Senior Manager at Price Waterhouse (now PricewaterhouseCoopers) (a registered public accounting firm).
Item 4. Principal Accountant Fees and Services
Eaton Vance Floating-Rate Municipal Income Fund, Eaton Vance Short Duration Municipal Opportunities Fund, Eaton Vance National Limited Maturity Municipal Income Fund and Eaton Vance New York Municipal Opportunities Fund (the “Fund(s)”) are the series of Eaton Vance Investment Trust (the “Trust”), a Massachusetts business trust, which, including the Funds, contains a total of 4 series (the “Series”). The Trust is registered under the Investment Company Act of 1940 as anopen-end management investment company.
(a-d)
The following tables present the aggregate fees billed to each Fund for the Fund’s respective fiscal years ended March 31, 2018and March 31, 2019 by the registrant’s principal accountant, Deloitte & Touche LLP (“D&T”), for professional services rendered for the audit of the Fund’s annual financial statements and fees billed for other services rendered by D&T during those periods.
Eaton Vance Floating-Rate Municipal Income Fund
| | | | | | | | |
Fiscal Years Ended | | 03/31/18 | | | 03/31/19 | |
Audit Fees | | $ | 34,400 | | | $ | 33,100 | |
Audit-Related Fees(1) | | $ | 0 | | | $ | 0 | |
Tax Fees(2) | | $ | 9,028 | | | $ | 9,028 | |
All Other Fees(3) | | $ | 0 | | | $ | 0 | |
| | | | | | | | |
Total | | $ | 43,428 | | | $ | 42,128 | |
| | | | | | | | |
Eaton Vance Short Duration Municipal Opportunities Fund
| | | | | | | | |
Fiscal Years Ended | | 03/31/18 | | | 03/31/19 | |
Audit Fees | | $ | 33,930 | | | $ | 33,930 | |
Audit-Related Fees(1) | | $ | 0 | | | $ | 0 | |
Tax Fees(2) | | $ | 9,028 | | | $ | 9,028 | |
All Other Fees(3) | | $ | 0 | | | $ | 0 | |
| | | | | | | | |
Total | | $ | 42,958 | | | $ | 42,958 | |
| | | | | | | | |
Eaton Vance National Limited Maturity Municipal Income Fund
| | | | | | | | |
Fiscal Years Ended | | 03/31/18 | | | 03/31/19 | |
Audit Fees | | $ | 53,550 | | | $ | 54,275 | |
Audit-Related Fees(1) | | $ | 0 | | | $ | 0 | |
Tax Fees(2) | | $ | 11,593 | | | $ | 11,593 | |
All Other Fees(3) | | $ | 0 | | | $ | 0 | |
| | | | | | | | |
Total | | $ | 65,143 | | | $ | 65,868 | |
| | | | | | | | |
Eaton Vance New York Municipal Opportunities Fund
| | | | | | | | |
Fiscal Years Ended | | 03/31/18 | | | 03/31/19 | |
Audit Fees | | $ | 37,680 | | | $ | 37,680 | |
Audit-Related Fees(1) | | $ | 0 | | | $ | 0 | |
Tax Fees(2) | | $ | 9,240 | | | $ | 9,240 | |
All Other Fees(3) | | $ | 0 | | | $ | 0 | |
| | | | | | | | |
Total | | $ | 46,920 | | | $ | 46,920 | |
| | | | | | | | |
| (1) | Audit-related fees consist of the aggregate fees billed for assurance and related services that are reasonably related to the performance of the audit of financial statements and are not reported under the category of audit fees. |
| (2) | Tax fees consist of the aggregate fees billed for professional services rendered by the principal accountant relating to tax compliance, tax advice, and tax planning and specifically include fees for tax return preparation and other related tax compliance/planning matters. |
| (3) | All other fees consist of the aggregate fees billed for products and services provided by the principal accountant other than audit, audit-related, and tax services. |
The Funds comprised all of the series of the Trust at 3/31/2019, and have the same fiscal year end (March 31). The following table presents the aggregate audit, audit-related, tax, and other fees billed to all of the Series in the Trust by D&T for the last two fiscal years of each Series.
| | | | | | | | |
Fiscal Years Ended | | 03/31/18 | | | 03/31/19 | |
Audit Fees | | $ | 159,560 | | | $ | 158,985 | |
Audit-Related Fees(1) | | $ | 0 | | | $ | 0 | |
Tax Fees(2) | | $ | 38,889 | | | $ | 38,889 | |
All Other Fees(3) | | $ | 0 | | | $ | 0 | |
| | | | | | | | |
Total | | $ | 198,449 | | | $ | 197,874 | |
| | | | | | | | |
| (1) | Audit-related fees consist of the aggregate fees billed for assurance and related services that are reasonably related to the performance of the audit of financial statements and are not reported under the category of audit fees. |
| (2) | Tax fees consist of the aggregate fees billed for professional services rendered by the principal accountant relating to tax compliance, tax advice, and tax planning and specifically include fees for tax return preparation. |
| (3) | All other fees consist of the aggregate fees billed for products and services provided by the principal accountant other than audit, audit-related, and tax services. |
(e)(1) The Trust’s audit committee has adopted policies and procedures relating to thepre-approval of services provided by the Trust’s principal accountant (the“Pre-Approval Policies”). ThePre-Approval Policies establish a framework intended to assist the audit committee in the proper discharge of itspre-approval responsibilities. As a general matter, thePre-Approval Policies (i) specify certain types of audit, audit-related, tax, and other services determined to bepre-approved by the audit committee; and (ii) delineate specific procedures governing the mechanics of thepre-approval process, including the approval and monitoring of audit andnon-audit service fees. Unless a service is specificallypre-approved under thePre-Approval Policies, it must be separatelypre-approved by the audit committee.
ThePre-Approval Policies and the types of audit andnon-audit servicespre-approved therein must be reviewed and ratified by the Trust’s audit committee at least annually. The Trust’s audit committee maintains full responsibility for the appointment, compensation, and oversight of the work of the registrant’s principal accountant.
(e)(2) No services described in paragraphs (b)-(d) above were approved by the Trust’s audit committee pursuant to the “de minimis exception” set forth in Rule2-01(c)(7)(i)(C) of RegulationS-X.
(f) Not applicable.
(g)The following table presents (i) the aggregatenon-audit fees (i.e., fees for audit-related, tax, and other services) billed for services rendered to all of the Funds in the Trust by D&T for the last two fiscal years of each Fund; and (ii) the aggregatenon-audit fees (i.e., fees for audit-related, tax, and other services) billed for services rendered to the Eaton Vance organization by D&T for the last two fiscal years of each Fund.
| | | | | | | | |
Fiscal Years Ended | | 03/31/18 | | | 03/31/19 | |
Registrant(1) | | $ | 38,889 | | | $ | 38,889 | |
Eaton Vance(2) | | $ | 155,208 | | | $ | 87,482 | |
| (1) | Includes all of the Funds of the Trust. |
| (2) | The investment adviser to the Funds, as well as any of its affiliates that provide ongoing services to the Funds, are subsidiaries of Eaton Vance Corp. |
(h) The Trust’s audit committee has considered whether the provision by the Trust’s principal accountant ofnon-audit services to the Trust’s investment adviser and any entity controlling, controlled by, or under common control with the adviser that provides ongoing services to the registrant that were notpre-approved pursuant to Rule2-01(c)(7)(ii) of RegulationS-X is compatible with maintaining the principal accountant’s independence.
Item 5. Audit Committee of Listed Registrants
Not applicable.
Item 6. Schedule of Investments
Please see schedule of investments contained in the Report to Stockholders included under Item 1 of this FormN-CSR.
Item 7. Disclosure of Proxy Voting Policies and Procedures forClosed-End Management Investment Companies
Not applicable.
Item 8. Portfolio Managers ofClosed-End Management Investment Companies
Not applicable.
Item 9. Purchases of Equity Securities byClosed-End Management Investment Company and Affiliated Purchasers
Not applicable.
Item 10. Submission of Matters to a Vote of Security Holders
No material changes.
Item 11. Controls and Procedures
(a) It is the conclusion of the registrant’s principal executive officer and principal financial officer that the effectiveness of the registrant’s current disclosure controls and procedures (such disclosure controls and procedures having been evaluated within 90 days of the date of this filing) provide reasonable assurance that the information required to be disclosed by the registrant has been recorded, processed, summarized and reported within the time period specified in the Commission’s rules and forms and that the information required to be disclosed by the registrant has been accumulated and communicated to the registrant’s principal executive officer and principal financial officer in order to allow timely decisions regarding required disclosure.
(b) There have been no changes in the registrant’s internal controls over financial reporting during the second fiscal quarter of the period covered by this report that has materially affected, or is reasonably likely to materially affect, the registrant’s internal control over financial reporting.
Item 12. Disclosure of Securities Lending Activities forClosed-End Management Investment Companies
Not applicable.
Item 13. Exhibits
| | |
| (a)(1) | | Registrant’s Code of Ethics. |
| |
| (a)(2)(i) | | Treasurer’s Section 302 certification. |
| |
| (a)(2)(ii) | | President’s Section 302 certification. |
| |
| (b) | | Combined Section 906 certification. |
Signatures
Pursuant to the requirements of the Securities Exchange Act of 1934 and the Investment Company Act of 1940, the registrant has duly caused this report to be signed on its behalf by the undersigned, thereunto duly authorized.
Eaton Vance Investment Trust
| | |
| By: | | /s/ Payson F. Swaffield |
| | Payson F. Swaffield |
| | President |
| |
| Date: | | May 24, 2019 |
Pursuant to the requirements of the Securities Exchange Act of 1934 and the Investment Company Act of 1940, this report has been signed below by the following persons on behalf of the registrant and in the capacities and on the dates indicated.
| | |
| By: | | /s/ James F. Kirchner |
| | James F. Kirchner |
| | Treasurer |
| |
| Date: | | May 24, 2019 |
| |
| By: | | /s/ Payson F. Swaffield |
| | Payson F. Swaffield |
| | President |
| |
| Date: | | May 24, 2019 |