UNITED STATES
SECURITIES AND EXCHANGE COMMISSION
Washington, D.C. 20549
Form N-CSR
CERTIFIED SHAREHOLDER REPORT OF REGISTERED
MANAGEMENT INVESTMENT COMPANIES
Investment Company Act File Number: 811-04443
Eaton Vance Investment Trust
(Exact Name of Registrant as Specified in Charter)
One Post Office Square, Boston, Massachusetts 02109
(Address of Principal Executive Offices)
Deidre E. Walsh
One Post Office Square, Boston, Massachusetts 02109
(Name and Address of Agent for Services)
(617) 482-8260
(Registrant’s Telephone Number)
March 31
Date of Fiscal Year End
March 31, 2024
Date of Reporting Period
Item 1. Reports to Stockholders
Eaton Vance
National Ultra-Short Municipal
Income Fund
Annual Report
March 31, 2024
Commodity Futures Trading Commission Registration. The Commodity Futures Trading Commission (“CFTC”) has adopted regulations that subject registered investment companies and advisers to regulation by the CFTC if a fund invests more than a prescribed level of its assets in certain CFTC-regulated instruments (including futures, certain options and swap agreements) or markets itself as providing investment exposure to such instruments. The investment adviser has claimed an exclusion from the definition of “commodity pool operator” under the Commodity Exchange Act with respect to its management of the Fund. Accordingly, neither the Fund nor the adviser with respect to the operation of the Fund is subject to CFTC regulation. Because of its management of other strategies, the Fund's adviser is registered with the CFTC as a commodity pool operator. The adviser is also registered as a commodity trading advisor.
Fund shares are not insured by the FDIC and are not deposits or other obligations of, or guaranteed by, any depository institution. Shares are subject to investment risks, including possible loss of principal invested.
This report must be preceded or accompanied by a current summary prospectus or prospectus. Before investing, investors should consider carefully the investment objective, risks, and charges and expenses of a mutual fund. This and other important information is contained in the summary prospectus and prospectus, which can be obtained from a financial intermediary. Prospective investors should read the prospectus carefully before investing. For further information, please call 1-800-262-1122.
Annual Report March 31, 2024
Eaton Vance
National Ultra-Short Municipal Income Fund
Eaton Vance
National Ultra-Short Municipal Income Fund
March 31, 2024
Management’s Discussion of Fund Performance†
Economic and Market Conditions
The 12-month period ended March 31, 2024, began with an April 2023 municipal bond sell-off that continued through much of the period. Although positive technical factors -- particularly municipal bond demand that exceeded supply -- produced brief periods of positive performance, the U.S. Federal Reserve’s (the Fed’s) 10th and 11th interest rate hikes in just over a year -- in May and July 2023 -- contributed to rising municipal yields and falling bond prices.
From August through October 2023, above-average supplies of municipal bonds -- plus an end-of-summer slowdown in coupon reinvestment -- reduced demand for municipal bonds. Although the Fed left the federal funds rate unchanged in September 2023, investors interpreted the central bank’s message to be that rates might stay higher for longer than they had expected just weeks earlier -- adding fuel to the municipal bond sell-off.
However, in November and December 2023, the municipal bond market reversed course. After several months of rising interest rates and negative bond returns, federal tax-free municipal yields approached their 2022 highs, giving investors a compelling reason to buy tax-exempt municipal bonds.
Typical calendar year-end technical factors -- particularly constrained supplies and increased investor demand -- were additional tailwinds for municipal bond prices. Falling inflation and easing employment gains also led many investors to believe the Fed might be done raising interest rates. Such factors contributed to the Bloomberg Municipal Bond Index (the Municipal Index) returning 6.35% in November 2023, its best monthly performance since 1982.
In December 2023, the Municipal Index posted another solid monthly gain as investors began to conclude the Fed might begin lowering interest rates during the first half of 2024.
In the final three months of the period, however, municipal returns turned negative as municipal bonds -- following a strong year-end rally -- appeared overvalued relative to U.S. Treasurys. Fed statements and strong U.S. economic reports in early 2024 led investors to reduce expectations for the number of Fed rate cuts projected for the year and how soon they might begin. As a result, both municipal bonds and U.S. Treasurys delivered negative performance during the first quarter of 2024.
For the period as a whole, the Municipal Index returned 3.13%, as municipal bonds outperformed U.S. Treasurys throughout the yield curve. Although yields rose and prices fell across the municipal bond yield curve, the positive contribution from rising interest income outweighed the negative effect of falling bond prices. During the period, lower-rated bonds generally outperformed higher-rated bonds, while longer-maturity bonds generally outperformed shorter-maturity bonds.
Fund Performance
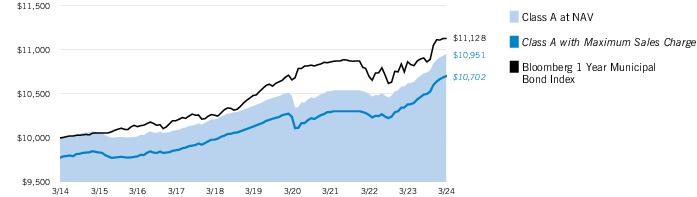
For the 12-month period ended March 31, 2024, Eaton Vance National Ultra-Short Municipal Income Fund (the Fund) returned 3.12% for Class A shares at net asset value (NAV), outperforming its benchmark, the Bloomberg 1 Year Municipal Bond Index (the Index), which returned 2.42%.
The Fund invests primarily in municipal obligations exempt from federal income tax and seeks to maintain an average portfolio effective maturity of less than two years.
Contributors to Fund performance versus the Index during the period included defensive out-of-Index allocations to floating-rate notes and variable-rate demand notes -- whose coupon payments are indexed to short-term interest rates, which rose during the period.
Additional contributors to Index-relative performance included an overweight position in bonds rated BBB and below, during a period when lower-rated bonds generally outperformed higher-rated bonds; and security selections and an overweight position in 4% coupon bonds.
In contrast, detractors from Fund performance relative to the Index during the period included an overweight position in local general obligation bonds and security selections in bonds whose income is subject to the alternative minimum tax (AMT).
See Endnotes and Additional Disclosures in this report.
Past performance is no guarantee of future results. Returns are historical and are calculated by determining the percentage change in net asset value (NAV) or offering price (as applicable) with all distributions reinvested. Furthermore, returns do not reflect the deduction of taxes that shareholders may have to pay on Fund distributions or upon the redemption of Fund shares. Investment return and principal value will fluctuate so that shares, when redeemed, may be worth more or less than their original cost. Performance for periods less than or equal to one year is cumulative. Performance is for the stated time period only; due to market volatility, current Fund performance may be lower or higher than the quoted return. For performance as of the most recent month-end, please refer to eatonvance.com.
Eaton Vance
National Ultra-Short Municipal Income Fund
March 31, 2024
Performance
Portfolio Manager(s) Craig R. Brandon, CFA and Julie Callahan, CFA
| % Average Annual Total Returns1,2 | Class
Inception Date | Performance
Inception Date | One Year | Five Years | Ten Years |
| Advisers Class at NAV | 11/20/2020 | 05/29/1992 | 3.12% | 1.12% | 0.92% |
| Class A at NAV | 06/27/1996 | 05/29/1992 | 3.12 | 1.11 | 0.91 |
| Class A with 2.25% Maximum Sales Charge | — | — | 0.84 | 0.65 | 0.68 |
| Class I at NAV | 08/03/2010 | 05/29/1992 | 3.28 | 1.26 | 1.06 |
|
| Bloomberg 1 Year Municipal Bond Index | — | — | 2.42% | 1.20% | 1.07% |
| % Total Annual Operating Expense Ratios3 | Advisers Class | Class A | Class I |
| Gross | 0.56% | 0.56% | 0.41% |
| Net | 0.50 | 0.50 | 0.35 |
| % Distribution Rates/Yields4 | Advisers Class | Class A | Class I |
| Distribution Rate | 3.23% | 3.23% | 3.38% |
| Taxable-Equivalent Distribution Rate | 5.45 | 5.45 | 5.71 |
| SEC 30-day Yield | 3.26 | 3.19 | 3.41 |
| Taxable-Equivalent SEC 30-day Yield | 5.51 | 5.39 | 5.76 |
Growth of $10,000
This graph shows the change in value of a hypothetical investment of $10,000 in Class A of the Fund for the period indicated. For comparison, the same investment is shown in the indicated index.
| Growth of Investment | Amount Invested | Period Beginning | At NAV | With Maximum Sales Charge |
| Advisers Class | $10,000 | 03/31/2014 | $10,955 | N.A. |
| Class I, at minimum investment | $1,000,000 | 03/31/2014 | $1,111,706 | N.A. |
See Endnotes and Additional Disclosures in this report.
Past performance is no guarantee of future results. Returns are historical and are calculated by determining the percentage change in net asset value (NAV) or offering price (as applicable) with all distributions reinvested. Furthermore, returns do not reflect the deduction of taxes that shareholders may have to pay on Fund distributions or upon the redemption of Fund shares. Investment return and principal value will fluctuate so that shares, when redeemed, may be worth more or less than their original cost. Performance for periods less than or equal to one year is cumulative. Performance is for the stated time period only; due to market volatility, current Fund performance may be lower or higher than the quoted return. For performance as of the most recent month-end, please refer to eatonvance.com.
Eaton Vance
National Ultra-Short Municipal Income Fund
March 31, 2024
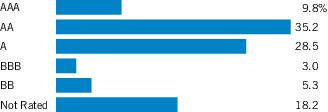
| Credit Quality (% of total investments)1 |
Footnotes:
| 1 | For purposes of the Fund’s rating restrictions, ratings are based on Moody’s Investors Service, Inc. (“Moody’s”), S&P Global Ratings (“S&P”) or Fitch Ratings (“Fitch”), as applicable. If securities are rated differently by the ratings agencies, the highest rating is applied. Ratings, which are subject to change, apply to the creditworthiness of the issuers of the underlying securities and not to the Fund or its shares. Credit ratings measure the quality of a bond based on the issuer’s creditworthiness, with ratings ranging from AAA, being the highest, to D, being the lowest based on S&P’s measures. Ratings of BBB or higher by S&P or Fitch (Baa or higher by Moody’s) are considered to be investment-grade quality. Credit ratings are based largely on the ratings agency’s analysis at the time of rating. The rating assigned to any particular security is not necessarily a reflection of the issuer’s current financial condition and does not necessarily reflect its assessment of the volatility of a security’s market value or of the liquidity of an investment in the security. Holdings designated as “Not Rated” (if any) are not rated by the national ratings agencies stated above. |
Eaton Vance
National Ultra-Short Municipal Income Fund
March 31, 2024
Endnotes and Additional Disclosures
| † | The views expressed in this report are those of the portfolio manager(s) and are current only through the date stated at the top of this page. These views are subject to change at any time based upon market or other conditions, and Eaton Vance and the Fund(s) disclaim any responsibility to update such views. These views may not be relied upon as investment advice and, because investment decisions are based on many factors, may not be relied upon as an indication of trading intent on behalf of any Eaton Vance fund. This commentary may contain statements that are not historical facts, referred to as “forward-looking statements.” The Fund’s actual future results may differ significantly from those stated in any forward-looking statement, depending on factors such as changes in securities or financial markets or general economic conditions, the volume of sales and purchases of Fund shares, the continuation of investment advisory, administrative and service contracts, and other risks discussed from time to time in the Fund’s filings with the Securities and Exchange Commission. |
| | |
| 1 | Bloomberg 1 Year Municipal Bond Index is an unmanaged index of municipal bonds traded in the U.S. with maturities ranging from 1-2 years. Unless otherwise stated, index returns do not reflect the effect of any applicable sales charges, commissions, expenses, taxes or leverage, as applicable. It is not possible to invest directly in an index. |
| 2 | Total Returns at NAV do not include applicable sales charges. If sales charges were deducted, the returns would be lower. Total Returns shown with maximum sales charge reflect the stated maximum sales charge. Unless otherwise stated, performance does not reflect the deduction of taxes on Fund distributions or redemptions of Fund shares.Performance prior to the inception date of a class may be linked to the performance of an older class of the Fund. This linked performance is adjusted for any applicable sales charge, but not adjusted for class expense differences. If adjusted for such differences, the performance would be different. The performance of Advisers Class is linked to Class A. Performance presented in the Financial Highlights included in the financial statements is not linked.Effective August 19, 2013, the Fund changed its investment objective and policies. Prior to August 19, 2013, the Fund employed a strategy of investing in fixed-rate bonds with a dollar-weighted average portfolio duration of between three and nine years. Performance prior to August 19, 2013 reflects the Fund’s performance under its former investment objective and policies. |
| 3 | Source: Fund prospectus. Net expense ratios reflect a contractual expense reimbursement that continues through 7/31/24. The expense ratios for the current reporting period can be found in the Financial Highlights section of this report. Performance reflects expenses waived and/or reimbursed, if applicable. Without such waivers and/or reimbursements, performance would have been lower. |
| 4 | The Distribution Rate is based on the Fund’s last regular distribution per share in the period (annualized) divided by the Fund’s NAV at the end of the period. The Fund’s distributions may be comprised of amounts characterized for federal income tax purposes as tax-exempt income, qualified and non-qualified ordinary dividends, capital gains and nondividend distributions, also known as return of capital. The Fund will determine the federal income tax character of distributions |
| | paid to a shareholder after the end of the calendar year. This is reported on the IRS form 1099-DIV and provided to the shareholder shortly after each year-end. The Fund’s distributions are determined by the investment adviser based on its current assessment of the Fund’s long-term return potential. As portfolio and market conditions change, the rate of distributions paid by the Fund could change. Taxable-equivalent performance is based on the highest combined federal and state income tax rates, where applicable. Lower tax rates would result in lower tax-equivalent performance. Actual tax rates will vary depending on your income, exemptions and deductions. Rates do not include local taxes. The SEC Yield is a standardized measure based on the estimated yield to maturity of a fund’s investments over a 30-day period and is based on the maximum offer price at the date specified. The SEC Yield is not based on the distributions made by the Fund, which may differ. |
| | Fund profile subject to change due to active management. |
| | Additional Information |
| | Yield curve is a graphical representation of the yields offered by bonds of various maturities. The yield curve flattens when long-term interest rates fall and/or short-term interest rates increase, and the yield curve steepens when long-term interest rates increase and/or short-term
interest rates fall. |
| | Bloomberg Municipal Bond Index is an unmanaged index of municipal bonds traded in the U.S. Unless otherwise stated, index returns do not reflect the effect of any applicable sales charges, commissions, expenses, taxes or leverage, as applicable. It is not possible to invest directly in an index. |
Eaton Vance
National Ultra-Short Municipal Income Fund
March 31, 2024
Example
As a Fund shareholder, you incur two types of costs: (1) transaction costs, including sales charges (loads) on purchases; and (2) ongoing costs, including management fees; distribution and/or service fees; and other Fund expenses. This Example is intended to help you understand your ongoing costs (in dollars) of Fund investing and to compare these costs with the ongoing costs of investing in other mutual funds. The Example is based on an investment of $1,000 invested at the beginning of the period and held for the entire period (October 1, 2023 to March 31, 2024).
Actual Expenses
The first section of the table below provides information about actual account values and actual expenses. You may use the information in this section, together with the amount you invested, to estimate the expenses that you paid over the period. Simply divide your account value by $1,000 (for example, an $8,600 account value divided by $1,000 = 8.6), then multiply the result by the number in the first section under the heading entitled “Expenses Paid During Period” to estimate the expenses you paid on your account during this period.
Hypothetical Example for Comparison Purposes
The second section of the table below provides information about hypothetical account values and hypothetical expenses based on the actual Fund expense ratio and an assumed rate of return of 5% per year (before expenses), which is not the actual Fund return. The hypothetical account values and expenses may not be used to estimate the actual ending account balance or expenses you paid for the period. You may use this information to compare the ongoing costs of investing in your Fund and other funds. To do so, compare this 5% hypothetical example with the 5% hypothetical examples that appear in the shareholder reports of the other funds.
Please note that the expenses shown in the table are meant to highlight your ongoing costs only and do not reflect any transactional costs, such as sales charges (loads). Therefore, the second section of the table is useful in comparing ongoing costs only, and will not help you determine the relative total costs of owning different funds. In addition, if these transactional costs were included, your costs would be higher.
| | Beginning
Account Value
(10/1/23) | Ending
Account Value
(3/31/24) | Expenses Paid
During Period*
(10/1/23 – 3/31/24) | Annualized
Expense
Ratio |
| Actual | | | | |
| Advisers Class | $1,000.00 | $1,019.50 | $2.52** | 0.50% |
| Class A | $1,000.00 | $1,019.50 | $2.52** | 0.50% |
| Class I | $1,000.00 | $1,020.30 | $1.77** | 0.35% |
| |
| Hypothetical | | | | |
| (5% return per year before expenses) | | | | |
| Advisers Class | $1,000.00 | $1,022.50 | $2.53** | 0.50% |
| Class A | $1,000.00 | $1,022.50 | $2.53** | 0.50% |
| Class I | $1,000.00 | $1,023.25 | $1.77** | 0.35% |
| * | Expenses are equal to the Fund’s annualized expense ratio for the indicated Class, multiplied by the average account value over the period, multiplied by 183/366 (to reflect the one-half year period). The Example assumes that the $1,000 was invested at the net asset value per share determined at the close of business on September 30, 2023. |
| ** | Absent an allocation of certain expenses to affiliate(s), expenses would be higher. |
Eaton Vance
National Ultra-Short Municipal Income Fund
March 31, 2024
| Security | Principal
Amount
(000's omitted) | Value |
| Education — 0.5% |
| Grand Canyon University, 4.125%, 10/1/24 | $ | 2,000 | $ 1,948,920 |
Total Corporate Bonds
(identified cost $1,903,750) | | | $ 1,948,920 |
| Tax-Exempt Municipal Obligations — 98.2% |
| Security | Principal
Amount
(000's omitted) | Value |
| Bond Bank — 5.4% |
| Delaware Valley Regional Finance Authority, PA, 4.405%, (67% of 1 mo. USD LIBOR + 0.76%), 9/1/24 (Put Date), 9/1/48(1) | $ | 10,000 | $ 10,000,300 |
| Minnesota Rural Water Finance Authority, Inc., 4.375%, 4/1/25 | | 3,500 | 3,502,975 |
| Missouri Public Utilities Commission, 4.00%, 12/1/24 | | 5,000 | 4,995,350 |
| Texas Water Development Board, 5.00%, 10/15/24 | | 300 | 302,352 |
| | | | $ 18,800,977 |
| Education — 5.7% |
| Connecticut Health and Educational Facilities Authority, (Quinnipiac University), 5.00%, 7/1/24 | $ | 3,575 | $ 3,584,724 |
| Lehigh County General Purpose Authority, PA, (Muhlenberg College), 4.03%, (SIFMA + 0.58%), 11/1/37(1) | | 3,130 | 3,122,895 |
| Pennsylvania Higher Educational Facilities Authority, (State System Higher Education): | | | |
| 5.00%, 6/15/24 | | 2,110 | 2,115,127 |
| 5.00%, 6/15/25 | | 2,065 | 2,106,486 |
| Escrowed to Maturity, 5.00%, 6/15/24 | | 405 | 405,903 |
| Tompkins-Seneca-Tioga Board of Cooperative Educational Services, NY, 5.00%, 6/28/24 | | 4,000 | 4,009,120 |
| University of North Carolina at Chapel Hill, 4.208%, (67% of SOFR + 0.65%), 6/1/25 (Put Date), 12/1/41(1) | | 4,500 | 4,503,555 |
| | | | $ 19,847,810 |
| Electric Utilities — 0.7% |
| Missouri Joint Municipal Electric Utility Commission, (Iatan 2 Project), 5.00%, 1/1/25 | $ | 2,400 | $ 2,423,232 |
| | | | $ 2,423,232 |
| Escrowed/Prerefunded — 1.8% |
| Alabama Federal Aid Highway Finance Authority, Escrowed to Maturity, 5.00%, 9/1/25 | $ | 3,525 | $ 3,610,714 |
| Security | Principal
Amount
(000's omitted) | Value |
| Escrowed/Prerefunded (continued) |
| Railsplitter Tobacco Settlement Authority, IL, Escrowed to Maturity, 5.00%, 6/1/24 | $ | 2,750 | $ 2,754,015 |
| | | | $ 6,364,729 |
| General Obligations — 29.0% |
| Alvin Independent School District, TX, (PSF Guaranteed), 5.00%, 2/15/25 | $ | 1,545 | $ 1,566,043 |
| Bergen County Improvement Authority, NJ, 4.50%, 5/31/24 | | 5,000 | 5,006,100 |
| California, 5.00%, 9/1/25(2) | | 5,000 | 5,128,750 |
| Cass County Joint Water Resource District, ND, 3.45%, 4/1/27(2) | | 1,250 | 1,250,000 |
| Chicago Board of Education, IL: | | | |
| 4.00%, 12/1/27 | | 3,215 | 3,221,366 |
| 5.00%, 12/1/25 | | 5,000 | 5,082,650 |
| Comal Independent School District, TX, (PSF Guaranteed), 5.00%, 2/1/25 | | 3,225 | 3,268,086 |
| Connecticut, 5.00%, 4/15/25 | | 4,380 | 4,456,431 |
| Cortland, NY, 5.00%, 11/8/24 | | 4,000 | 4,017,920 |
| Cypress-Fairbanks Independent School District, TX, (PSF Guaranteed), 5.00%, 2/15/25 | | 1,000 | 1,014,130 |
| Dallas Independent School District, TX, (PSF Guaranteed), 5.00%, 2/15/25 | | 1,100 | 1,115,455 |
| Dane County, WI, 4.00%, 6/1/24 | | 3,475 | 3,476,286 |
| Detroit, MI, 5.00%, 4/1/24 | | 1,315 | 1,315,000 |
| Henrico County, VA, 5.00%, 7/15/25 | | 1,480 | 1,513,848 |
| Honolulu City and County, HI, (Honolulu Rail Transit Project), 5.00%, 3/1/25 | | 2,500 | 2,539,025 |
| Hudson County Improvement Authority, NJ, 5.00%, 7/24/24 | | 3,510 | 3,523,443 |
| Illinois: | | | |
| 5.00%, 7/1/24 | | 1,000 | 1,003,180 |
| 5.00%, 7/1/25 | | 1,000 | 1,018,870 |
| 5.00%, 11/1/25 | | 2,000 | 2,049,080 |
| Jackson County School District No. R-IV, MO, 4.00%, 3/1/25 | | 2,685 | 2,700,304 |
| McHenry and Lake Counties Community High School District No. 156, IL, 5.00%, 2/1/25 | | 1,430 | 1,444,772 |
| Miami-Dade County School Board, FL, 5.00%, 6/18/24 | | 5,000 | 5,012,950 |
| Monmouth County Improvement Authority, NJ, 4.00%, 3/14/25 | | 5,000 | 5,027,900 |
| Nantucket, MA, 5.00%, 6/28/24 | | 5,006 | 5,020,605 |
| New York, NY: | | | |
| 5.00%, 8/1/25 | | 2,835 | 2,902,813 |
| (SPA: JPMorgan Chase Bank, N.A.), 4.55%, 3/1/40(3) | | 500 | 500,000 |
| Philadelphia School District, PA, 5.00%, 6/28/24 | | 4,170 | 4,178,965 |
| Philadelphia, PA, 5.00%, 2/1/25 | | 2,105 | 2,131,060 |
7
See Notes to Financial Statements.
Eaton Vance
National Ultra-Short Municipal Income Fund
March 31, 2024
Portfolio of Investments — continued
| Security | Principal
Amount
(000's omitted) | Value |
| General Obligations (continued) |
| Puerto Rico, 5.375%, 7/1/25 | $ | 5,000 | $ 5,101,350 |
| Quincy, MA, 5.00%, 7/5/24 | | 5,000 | 5,016,200 |
| San Antonio, TX, 5.00%, 2/1/25 | | 2,665 | 2,700,818 |
| Somerset County, PA, 5.00%, 10/1/24 | | 1,000 | 1,006,160 |
| South Carolina, (Economic Development), 5.00%, 4/1/25 | | 2,500 | 2,543,000 |
| Toms River Township, NJ, 5.00%, 7/26/24 | | 5,000 | 5,019,500 |
| | | | $101,872,060 |
| Hospital — 8.2% |
| Allen County, OH, (Bon Secours Mercy Health, Inc.), 5.00%, 8/1/25 | $ | 1,030 | $ 1,049,241 |
| California Health Facilities Financing Authority, (Providences St. Joseph Health), 4.00% to 10/1/24 (Put Date), 10/1/36 | | 1,450 | 1,446,839 |
| Charlotte-Mecklenburg Hospital Authority, NC, (Atrium Health), 3.625% to 6/15/27 (Put Date), 1/15/48 | | 1,500 | 1,495,575 |
| Colorado Health Facilities Authority, (CommonSpirit Health), 5.00% to 8/1/26 (Put Date), 8/1/49 | | 4,045 | 4,145,882 |
| Colorado Health Facilities Authority, (Intermountain Healthcare), 4.00%, (SIFMA + 0.55%), 5/15/61(1) | | 3,000 | 2,979,660 |
| Franklin County, OH, (Trinity Health Credit Group), 3.70%, 12/1/46(4) | | 1,335 | 1,334,359 |
| Geisinger Authority, PA, (Geisinger Health System Foundation), 4.717%, (67% of 1 mo. USD LIBOR + 1.07%), 6/1/28(1) | | 2,000 | 2,000,460 |
| Harris County Cultural Education Facilities Finance Corp., TX, (Memorial Hermann Health System), 4.02%, (SIFMA + 0.57%), 12/1/49(1) | | 1,800 | 1,796,202 |
| Harris County Health Facilities Development Corp., TX, (Methodist Hospital), 3.85%, 12/1/41(3) | | 5,300 | 5,300,000 |
| Illinois Finance Authority, (Northshore University Health System), 5.00%, 8/15/25 | | 1,000 | 1,018,550 |
| Kentucky Economic Development Finance Authority, (Catholic Health), 3.75%, 5/1/34(5) | | 4,000 | 4,000,000 |
| Northampton County General Purpose Authority, PA, (St. Luke's University Health Network), 4.848%, (70% of 1 mo. SOFR + 1.04%), 8/15/24 (Put Date), 8/15/48(1) | | 2,000 | 2,000,020 |
| | | | $ 28,566,788 |
| Housing — 1.2% |
| New Mexico Mortgage Finance Authority, 5.00% to 6/1/25 (Put Date), 2/1/42 | $ | 650 | $ 652,684 |
| New York Mortgage Agency: | | | |
| Social Bonds, (AMT), 1.05%, 4/1/26 | | 1,275 | 1,173,625 |
| Social Bonds, (AMT), 1.15%, 10/1/26 | | 1,330 | 1,208,824 |
| Security | Principal
Amount
(000's omitted) | Value |
| Housing (continued) |
| Wisconsin Housing and Economic Development Authority Housing Revenue, 3.875% to 5/1/27 (Put Date), 11/1/54 | $ | 1,250 | $ 1,245,650 |
| | | | $ 4,280,783 |
| Industrial Development Revenue — 6.4% |
| Chandler Industrial Development Authority, AZ, (Intel Corp.), (AMT), 5.00% to 6/3/24 (Put Date), 6/1/49 | $ | 5,000 | $ 5,005,450 |
| Houston, TX, (United Airlines, Inc. Terminal E Project), (AMT), 4.75%, 7/1/24 | | 4,000 | 4,006,960 |
| Indiana Finance Authority, (Republic Services, Inc.), (AMT), 4.20%, 5/1/34(4) | | 2,250 | 2,248,313 |
| Louisiana Offshore Terminal Authority, (Loop, LLC), 4.20% to 10/1/25 (Put Date), 10/1/37 | | 2,000 | 2,003,060 |
| Nevada Department of Business and Industry, (Republic Services, Inc.), (AMT), 4.50%, 12/1/26(6) | | 1,000 | 999,650 |
| New York Transportation Development Corp., (John F. Kennedy International Airport), (AMT), 2.25%, 8/1/26 | | 1,890 | 1,831,032 |
| Pennsylvania Economic Development Financing Authority, (Waste Management, Inc.), (AMT), 4.10%, 8/1/45(4) | | 1,750 | 1,749,265 |
| West Virginia Economic Development Authority, (Appalachian Power Co.), 3.375% to 6/15/28 (Put Date), 3/1/40 | | 1,000 | 996,620 |
| Whiting, IN, (BP Products North America, Inc.), (AMT), 5.00% to 6/5/26 (Put Date), 12/1/44 | | 3,500 | 3,575,670 |
| | | | $ 22,416,020 |
| Insured - General Obligations — 0.7% |
| Allegheny County, PA, (AGM), 4.283%, (67% of SOFR + 0.55%), 11/1/26(1) | $ | 2,425 | $ 2,407,176 |
| | | | $ 2,407,176 |
| Insured - Special Tax Revenue — 0.3% |
| Harris County-Houston Sports Authority, TX, (NPFG), 0.00%, 11/15/24 | $ | 1,000 | $ 973,770 |
| | | | $ 973,770 |
| Insured - Transportation — 0.7% |
| Chicago, IL, (Midway International Airport), (BAM), 5.00%, 1/1/25 | $ | 2,500 | $ 2,528,825 |
| | | | $ 2,528,825 |
| Lease Revenue/Certificates of Participation — 6.6% |
| California Public Works Board, 5.00%, 9/1/25 | $ | 5,000 | $ 5,133,450 |
| Greenville County School District, SC, 5.00%, 12/1/24 | | 5,000 | 5,046,000 |
| Michigan Finance Authority, 5.00%, 7/22/24 | | 2,250 | 2,258,617 |
8
See Notes to Financial Statements.
Eaton Vance
National Ultra-Short Municipal Income Fund
March 31, 2024
Portfolio of Investments — continued
| Security | Principal
Amount
(000's omitted) | Value |
| Lease Revenue/Certificates of Participation (continued) |
| New Jersey Economic Development Authority, (School Facilities Construction), 5.00%, 3/1/25 | $ | 4,000 | $ 4,052,680 |
| New Jersey Transportation Trust Fund Authority, (Transportation Program), 5.00%, 6/15/25 | | 1,250 | 1,272,825 |
| New Jersey Transportation Trust Fund Authority, (Transportation System), 5.00%, 6/15/24 | | 4,000 | 4,008,320 |
| Texas Public Finance Authority, 5.00%, 2/1/25 | | 1,500 | 1,517,940 |
| | | | $ 23,289,832 |
| Other Revenue — 7.5% |
| Black Belt Energy Gas District, AL, 5.408%, (67% of SOFR + 1.85%), 6/1/49(1) | $ | 2,500 | $ 2,528,075 |
| Illinois Finance Authority, (Field Museum of Natural History), 4.917%, (70% of SOFR + 1.20%), 11/1/34(1) | | 4,125 | 4,115,595 |
| Lower Alabama Gas District, AL, 4.00% to 12/1/25 (Put Date), 12/1/50 | | 5,500 | 5,521,450 |
| Main Street Natural Gas, Inc., GA, Gas Supply Revenue: | | | |
| 4.00% to 9/1/27 (Put Date), 7/1/52 | | 675 | 680,562 |
| 5.00%, 3/1/25 | | 540 | 543,434 |
| 5.00%, 9/1/25 | | 500 | 505,860 |
| 5.00%, 9/1/25 | | 325 | 328,809 |
| 5.00%, 3/1/26 | | 350 | 356,013 |
| 5.00%, 9/1/26 | | 275 | 281,537 |
| 5.00%, 3/1/27 | | 400 | 411,416 |
| 5.00%, 9/1/27 | | 425 | 439,973 |
| Northern California Energy Authority: | | | |
| 5.00%, 8/1/25(2) | | 650 | 657,780 |
| 5.00%, 8/1/26(2) | | 940 | 962,015 |
| 5.00%, 8/1/27(2) | | 500 | 518,420 |
| Northern California Gas Authority No. 1, Gas Project Revenue, 4.466%, (67% of 3 mo. SOFR + 0.72%), 7/1/27(1) | | 2,420 | 2,405,577 |
| Tennergy Corp., TN, Gas Supply Revenue, (Liq: Royal Bank of Canada), 5.00% to 10/1/24 (Put Date), 2/1/50 | | 2,050 | 2,060,742 |
| Texas Municipal Gas Acquisition and Supply Corp. I, Gas Supply Revenue, 6.25%, 12/15/26 | | 1,490 | 1,546,650 |
| Texas Municipal Gas Acquisition and Supply Corp. II, Gas Supply Revenue, 4.38%, (66% of 3 mo. SOFR + 0.86%), 9/15/27(1) | | 1,280 | 1,274,765 |
| Tobacco Settlement Financing Corp., NJ, 5.00%, 6/1/25 | | 1,000 | 1,016,900 |
| | | | $ 26,155,573 |
| Senior Living/Life Care — 1.5% |
| Iowa Finance Authority, (Lifespace Communities, Inc.), 4.267%, (70% of SOFR + 0.55%), 5/15/56(1) | $ | 5,500 | $ 5,120,830 |
| | | | $ 5,120,830 |
| Security | Principal
Amount
(000's omitted) | Value |
| Special Tax Revenue — 4.5% |
| Arizona Transportation Board, Highway Revenue, 5.00%, 7/1/24 | $ | 4,000 | $ 4,013,040 |
| Connecticut, Special Tax Obligation, (Transportation Infrastructure), 5.00%, 7/1/25 | | 4,800 | 4,902,912 |
| Illinois, Sales Tax Revenue, 4.00%, 6/15/25 | | 3,250 | 3,280,550 |
| Louisiana Gasoline and Fuels Tax Revenue, (LOC: TD Bank, N.A.), 3.95%, 5/1/43(3) | | 2,000 | 2,000,000 |
| New River Community Development District, FL, (Capital Improvements): | | | |
| 5.00%, 5/1/13(7) | | 35 | 0 |
| 5.75%, 5/1/38 | | 60 | 60,455 |
| New York City Transitional Finance Authority, NY, Future Tax Revenue, 5.00%, 2/1/37 | | 1,600 | 1,600,000 |
| Sterling Hill Community Development District, FL, (Capital Improvements), 5.50%, 11/1/10(7) | | 90 | 42,429 |
| | | | $ 15,899,386 |
| Student Loan — 0.8% |
| New Jersey Higher Education Student Assistance Authority: | | | |
| (AMT), 5.00%, 12/1/24 | $ | 1,400 | $ 1,410,122 |
| (AMT), 5.00%, 12/1/25 | | 1,500 | 1,527,450 |
| | | | $ 2,937,572 |
| Transportation — 14.0% |
| Atlanta, GA, Airport Revenue, Green Bonds, (AMT), 5.00%, 7/1/24 | $ | 1,375 | $ 1,378,080 |
| Broward County, FL, Airport System Revenue, (AMT), 5.00%, 10/1/24 | | 5,000 | 5,016,350 |
| Dallas and Fort Worth, TX, (Dallas/Fort Worth International Airport): | | | |
| 5.00%, 11/1/24 | | 1,500 | 1,510,635 |
| (AMT), 5.00%, 11/1/24 | | 1,000 | 1,004,230 |
| Denver City and County, CO, Airport System Revenue: | | | |
| 5.00%, 11/15/24 | | 275 | 277,464 |
| (AMT), 5.00%, 11/15/24 | | 2,000 | 2,014,620 |
| Metropolitan Transportation Authority, NY, 3.88%, (SIFMA + 0.43%), 11/1/31(1) | | 7,500 | 7,438,950 |
| Metropolitan Washington Airports Authority, D.C., (AMT), 5.00%, 10/1/25 | | 1,750 | 1,785,315 |
| Minneapolis-St. Paul Metropolitan Airports Commission, MN, 5.00%, 1/1/25 | | 4,000 | 4,041,080 |
| New York State Thruway Authority, 5.00%, 1/1/25 | | 2,000 | 2,023,800 |
| North Texas Tollway Authority, 5.00%, 1/1/26 | | 4,000 | 4,126,800 |
| Pennsylvania Turnpike Commission, 4.30%, (SIFMA + 0.85%), 7/15/41(1) | | 5,000 | 5,002,800 |
| Philadelphia, PA, Airport Revenue, (AMT), 5.00%, 7/1/25 | | 2,415 | 2,446,057 |
9
See Notes to Financial Statements.
Eaton Vance
National Ultra-Short Municipal Income Fund
March 31, 2024
Portfolio of Investments — continued
| Security | Principal
Amount
(000's omitted) | Value |
| Transportation (continued) |
| Phoenix Civic Improvement Corp., AZ, Airport Revenue: | | | |
| (AMT), 5.00%, 7/1/24 | $ | 1,000 | $ 1,002,290 |
| (AMT), 5.00%, 7/1/25 | | 1,100 | 1,119,118 |
| Port Authority of New York and New Jersey, (AMT), 5.00%, 12/1/25 | | 2,000 | 2,038,220 |
| Port of Seattle, WA, (AMT), 5.00%, 4/1/25 | | 1,825 | 1,844,582 |
| South Carolina Ports Authority, (AMT), 5.00%, 7/1/25 | | 2,520 | 2,548,123 |
| Texas Transportation Commission, (State Highway Fund), 5.00%, 4/1/25 | | 2,500 | 2,541,775 |
| | | | $ 49,160,289 |
| Water and Sewer — 3.2% |
| Boston Water and Sewer Commission, MA, 4.00%, 11/1/27 | $ | 1,260 | $ 1,278,950 |
| Jefferson County, AL, Sewer Revenue, 5.00%, 10/1/26 | | 1,250 | 1,300,213 |
| Knoxville, TN, Wastewater System Revenue, 4.00%, 4/1/25 | | 4,150 | 4,176,933 |
| New York City Municipal Water Finance Authority, NY, (Water and Sewer System), (SPA: Barclays Bank PLC), 4.00%, 6/15/53(3) | | 1,800 | 1,800,000 |
| North Penn Water Authority, PA, 4.01%, (SIFMA + 0.56%), 11/1/24(1) | | 1,690 | 1,690,017 |
| West Virginia Water Development Authority, 5.00%, 11/1/25 | | 1,025 | 1,049,496 |
| | | | $ 11,295,609 |
Total Tax-Exempt Municipal Obligations
(identified cost $344,868,732) | | | $344,341,261 |
| Taxable Municipal Obligations — 3.1% |
| Security | Principal
Amount
(000's omitted) | Value |
| General Obligations — 1.2% |
| California, 3.00%, 4/1/24 | $ | 4,320 | $ 4,320,000 |
| | | | $ 4,320,000 |
| Hospital — 0.5% |
| California Statewide Communities Development Authority, (Loma Linda University Medical Center), 6.00%, 12/1/24 | $ | 1,690 | $ 1,682,125 |
| | | | $ 1,682,125 |
| Security | Principal
Amount
(000's omitted) | Value |
| Lease Revenue/Certificates of Participation — 1.4% |
| New York City Transitional Finance Authority, NY, (Building Aid), 3.23%, 7/15/24 | $ | 5,000 | $ 4,967,100 |
| | | | $ 4,967,100 |
Total Taxable Municipal Obligations
(identified cost $10,884,102) | | | $ 10,969,225 |
Total Investments — 101.8%
(identified cost $357,656,584) | | | $357,259,406 |
| Other Assets, Less Liabilities — (1.8)% | | | $ (6,448,428) |
| Net Assets — 100.0% | | | $350,810,978 |
| The percentage shown for each investment category in the Portfolio of Investments is based on net assets. |
| (1) | Floating rate security. The stated interest rate represents the rate in effect at March 31, 2024. |
| (2) | When-issued security. |
| (3) | Variable rate demand obligation that may be tendered at par on any day for payment the same or next business day. The stated interest rate, which generally resets daily, is determined by the remarketing agent and represents the rate in effect at March 31, 2024. |
| (4) | Variable rate security that may be tendered at par quarterly. The stated interest rate, which resets quarterly, is determined by the remarketing agent and represents the rate in effect at March 31, 2024. |
| (5) | Variable rate demand obligation that may be tendered at par on any day for payment the lesser of 5 business days or 7 calendar days. The stated interest rate, which generally resets weekly, is determined by the remarketing agent and represents the rate in effect at March 31, 2024. |
| (6) | Security exempt from registration under Rule 144A of the Securities Act of 1933, as amended. These securities may be sold in certain transactions in reliance on an exemption from registration (normally to qualified institutional buyers). At March 31, 2024, the aggregate value of these securities is $999,650 or 0.3% of the Fund's net assets. |
| (7) | Issuer is in default with respect to interest and/or principal payments. |
| At March 31, 2024, the concentration of the Fund’s investments in the various states and territories, determined as a percentage of net assets, is as follows: |
| Pennsylvania | 12.1% |
| Texas | 10.1% |
| New York | 10.1% |
| Others, representing less than 10% individually | 69.0% |
10
See Notes to Financial Statements.
Eaton Vance
National Ultra-Short Municipal Income Fund
March 31, 2024
Portfolio of Investments — continued
| The Fund invests primarily in debt securities issued by municipalities. The ability of the issuers of the debt securities to meet their obligations may be affected by economic developments in a specific industry or municipality. At March 31, 2024, 1.7% of total investments are backed by bond insurance of various financial institutions and financial guaranty assurance agencies. The aggregate percentage insured by an individual financial institution or financial guaranty assurance agency ranged from 0.3% to 0.7% of total investments. |
| Abbreviations: |
| AGM | – Assured Guaranty Municipal Corp. |
| AMT | – Interest earned from these securities may be considered a tax preference item for purposes of the Federal Alternative Minimum Tax. |
| BAM | – Build America Mutual Assurance Co. |
| LIBOR | – London Interbank Offered Rate |
| Liq | – Liquidity Provider |
| LOC | – Letter of Credit |
| NPFG | – National Public Finance Guarantee Corp. |
| PSF | – Permanent School Fund |
| SIFMA | – Securities Industry and Financial Markets Association Municipal Swap Index |
| SOFR | – Secured Overnight Financing Rate |
| SPA | – Standby Bond Purchase Agreement |
| Currency Abbreviations: |
| USD | – United States Dollar |
11
See Notes to Financial Statements.
Eaton Vance
National Ultra-Short Municipal Income Fund
March 31, 2024
Statement of Assets and Liabilities
| | March 31, 2024 |
| Assets | |
| Investments, at value (identified cost $357,656,584) | $ 357,259,406 |
| Cash | 59,693 |
| Interest receivable | 4,653,875 |
| Receivable for investments sold | 6,900,000 |
| Receivable for Fund shares sold | 613,660 |
| Receivable from affiliates | 44,743 |
| Trustees' deferred compensation plan | 30,017 |
| Total assets | $369,561,394 |
| Liabilities | |
| Payable for investments purchased | $ 8,866,494 |
| Payable for when-issued securities | 8,516,243 |
| Payable for Fund shares redeemed | 959,557 |
| Distributions payable | 107,008 |
| Payable to affiliates: | |
| Investment adviser fee | 87,582 |
| Distribution and service fees | 7,720 |
| Trustees' deferred compensation plan | 30,017 |
| Accrued expenses | 175,795 |
| Total liabilities | $ 18,750,416 |
| Net Assets | $350,810,978 |
| Sources of Net Assets | |
| Paid-in capital | $ 358,065,312 |
| Accumulated loss | (7,254,334) |
| Net Assets | $350,810,978 |
| Advisers Class Shares | |
| Net Assets | $ 1,125,336 |
| Shares Outstanding | 115,664 |
Net Asset Value, Offering Price and Redemption Price Per Share
(net assets ÷ shares of beneficial interest outstanding) | $ 9.73 |
| Class A Shares | |
| Net Assets | $ 59,123,491 |
| Shares Outstanding | 6,073,813 |
Net Asset Value and Redemption Price Per Share
(net assets ÷ shares of beneficial interest outstanding) | $ 9.73 |
Maximum Offering Price Per Share
(100 ÷ 97.75 of net asset value per share) | $ 9.95 |
| Class I Shares | |
| Net Assets | $ 290,562,151 |
| Shares Outstanding | 29,828,879 |
Net Asset Value, Offering Price and Redemption Price Per Share
(net assets ÷ shares of beneficial interest outstanding) | $ 9.74 |
| On sales of $100,000 or more, the offering price of Class A shares is reduced. |
12
See Notes to Financial Statements.
Eaton Vance
National Ultra-Short Municipal Income Fund
March 31, 2024
| | Year Ended |
| | March 31, 2024 |
| Investment Income | |
| Interest income | $ 15,014,494 |
| Total investment income | $15,014,494 |
| Expenses | |
| Investment adviser fee | $ 1,210,940 |
| Distribution and service fees: | |
| Advisers Class | 1,300 |
| Class A | 125,078 |
| Trustees’ fees and expenses | 24,801 |
| Custodian fee | 98,695 |
| Transfer and dividend disbursing agent fees | 97,990 |
| Legal and accounting services | 74,040 |
| Printing and postage | 15,853 |
| Registration fees | 86,559 |
| Miscellaneous | 32,698 |
| Total expenses | $ 1,767,954 |
| Deduct: | |
| Waiver and/or reimbursement of expenses by affiliates | $ 228,374 |
| Total expense reductions | $ 228,374 |
| Net expenses | $ 1,539,580 |
| Net investment income | $13,474,914 |
| Realized and Unrealized Gain (Loss) | |
| Net realized gain (loss): | |
| Investment transactions | $ (1,041,369) |
| Net realized loss | $ (1,041,369) |
| Change in unrealized appreciation (depreciation): | |
| Investments | $ 615,329 |
| Net change in unrealized appreciation (depreciation) | $ 615,329 |
| Net realized and unrealized loss | $ (426,040) |
| Net increase in net assets from operations | $13,048,874 |
13
See Notes to Financial Statements.
Eaton Vance
National Ultra-Short Municipal Income Fund
March 31, 2024
Statements of Changes in Net Assets
| | Year Ended March 31, |
| | 2024 | 2023 |
| Increase (Decrease) in Net Assets | | |
| From operations: | | |
| Net investment income | $ 13,474,914 | $ 10,042,083 |
| Net realized loss | (1,041,369) | (2,824,934) |
| Net change in unrealized appreciation (depreciation) | 615,329 | 351,165 |
| Net increase in net assets from operations | $ 13,048,874 | $ 7,568,314 |
| Distributions to shareholders: | | |
| Advisers Class | $ (27,620) | $ (9,753) |
| Class A | (2,641,241) | (2,213,794) |
| Class I | (10,608,416) | (7,860,047) |
| Total distributions to shareholders | $ (13,277,277) | $ (10,083,594) |
| Transactions in shares of beneficial interest: | | |
| Advisers Class | $ 225,834 | $ 640,409 |
| Class A | (48,241,569) | (33,624,841) |
| Class I | (96,821,937) | 32,205,073 |
| Net decrease in net assets from Fund share transactions | $(144,837,672) | $ (779,359) |
| Net decrease in net assets | $(145,066,075) | $ (3,294,639) |
| Net Assets | | |
| At beginning of year | $ 495,877,053 | $ 499,171,692 |
| At end of year | $ 350,810,978 | $495,877,053 |
14
See Notes to Financial Statements.
Eaton Vance
National Ultra-Short Municipal Income Fund
March 31, 2024
| | Advisers Class | |
| | Year Ended March 31, | Period Ended
March 31, 2021(1) | |
| | 2024 | 2023 | 2022 | |
| Net asset value — Beginning of period | $ 9.74 | $ 9.80 | $ 9.84 | $ 9.77 | |
| Income (Loss) From Operations | | | | | |
| Net investment income(2) | $ 0.31 | $ 0.20 | $ 0.01 | $ 0.01 | |
| Net realized and unrealized gain (loss) | (0.01) | (0.09) | (0.05) | 0.07 | |
| Total income (loss) from operations | $ 0.30 | $ 0.11 | $(0.04) | $ 0.08 | |
| Less Distributions | | | | | |
| From net investment income | $ (0.31) | $ (0.17) | $ (0.00)(3) | $ (0.01) | |
| Total distributions | $ (0.31) | $(0.17) | $(0.00) (3) | $(0.01) | |
| Net asset value — End of period | $ 9.73 | $ 9.74 | $ 9.80 | $ 9.84 | |
| Total Return(4) | 3.12% | 1.16% | (0.38)% | 0.76% (5) | |
| Ratios/Supplemental Data | | | | | |
| Net assets, end of period (000’s omitted) | $1,125 | $ 900 | $ 259 | $ 10 | |
| Ratios (as a percentage of average daily net assets):(6) | | | | | |
| Total expenses | 0.56% | 0.56% | 0.55% | 0.56% (7) | |
| Net expenses | 0.50% | 0.50% | 0.51% | 0.56% (7) | |
| Net investment income | 3.23% | 2.11% | 0.14% | 0.11% (7) | |
| Portfolio Turnover | 159% | 128% | 47% | 6% (8) | |
| (1) | For the period from the commencement of operations, November 20, 2020, to March 31, 2021. |
| (2) | Computed using average shares outstanding. |
| (3) | Amount is less than $(0.005). |
| (4) | Returns are historical and are calculated by determining the percentage change in net asset value with all distributions reinvested. |
| (5) | Not annualized. |
| (6) | Total expenses do not reflect amounts reimbursed and/or waived by the adviser and certain of its affiliates, if applicable. Net expenses are net of all reductions and represent the net expenses paid by the Fund. |
| (7) | Annualized. |
| (8) | For the year ended March 31, 2021. |
15
See Notes to Financial Statements.
Eaton Vance
National Ultra-Short Municipal Income Fund
March 31, 2024
Financial Highlights — continued
| | Class A |
| | Year Ended March 31, |
| | 2024 | 2023 | 2022 | 2021 | 2020 |
| Net asset value — Beginning of year | $ 9.74 | $ 9.80 | $ 9.83 | $ 9.80 | $ 9.83 |
| Income (Loss) From Operations | | | | | |
| Net investment income (loss)(1) | $ 0.31 | $ 0.17 | $ (0.00)(2) | $ 0.02 | $ 0.14 |
| Net realized and unrealized gain (loss) | (0.01) | (0.06) | (0.03) | 0.03 | (0.03) |
| Total income (loss) from operations | $ 0.30 | $ 0.11 | $ (0.03) | $ 0.05 | $ 0.11 |
| Less Distributions | | | | | |
| From net investment income | $ (0.31) | $ (0.17) | $ — | $ (0.02) | $ (0.14) |
| Total distributions | $ (0.31) | $ (0.17) | $ — | $ (0.02) | $ (0.14) |
| Net asset value — End of year | $ 9.73 | $ 9.74 | $ 9.80 | $ 9.83 | $ 9.80 |
| Total Return(3) | 3.12% | 1.15% | (0.31)% | 0.50% | 1.12% |
| Ratios/Supplemental Data | | | | | |
| Net assets, end of year (000’s omitted) | $59,123 | $107,575 | $142,014 | $185,881 | $281,709 |
| Ratios (as a percentage of average daily net assets):(4) | | | | | |
| Total expenses | 0.56% | 0.56% | 0.57% | 0.56% | 0.59% |
| Net expenses | 0.50% | 0.50% | 0.56% | 0.56% | 0.59% |
| Net investment income (loss) | 3.22% | 1.71% | (0.01)% | 0.22% | 1.40% |
| Portfolio Turnover | 159% | 128% | 47% | 6% | 49% |
| (1) | Computed using average shares outstanding. |
| (2) | Amount is less than $(0.005). |
| (3) | Returns are historical and are calculated by determining the percentage change in net asset value with all distributions reinvested and do not reflect the effect of sales charges. |
| (4) | Total expenses do not reflect amounts reimbursed and/or waived by the adviser and certain of its affiliates, if applicable. Net expenses are net of all reductions and represent the net expenses paid by the Fund. |
16
See Notes to Financial Statements.
Eaton Vance
National Ultra-Short Municipal Income Fund
March 31, 2024
Financial Highlights — continued
| | Class I |
| | Year Ended March 31, |
| | 2024 | 2023 | 2022 | 2021 | 2020 |
| Net asset value — Beginning of year | $ 9.75 | $ 9.80 | $ 9.84 | $ 9.80 | $ 9.84 |
| Income (Loss) From Operations | | | | | |
| Net investment income(1) | $ 0.33 | $ 0.19 | $ 0.01 | $ 0.03 | $ 0.16 |
| Net realized and unrealized gain (loss) | (0.02) | (0.05) | (0.04) | 0.04 | (0.04) |
| Total income (loss) from operations | $ 0.31 | $ 0.14 | $ (0.03) | $ 0.07 | $ 0.12 |
| Less Distributions | | | | | |
| From net investment income | $ (0.32) | $ (0.19) | $ (0.01) | $ (0.03) | $ (0.16) |
| Total distributions | $ (0.32) | $ (0.19) | $ (0.01) | $ (0.03) | $ (0.16) |
| Net asset value — End of year | $ 9.74 | $ 9.75 | $ 9.80 | $ 9.84 | $ 9.80 |
| Total Return(2) | 3.28% | 1.42% | (0.26)% | 0.76% | 1.17% |
| Ratios/Supplemental Data | | | | | |
| Net assets, end of year (000’s omitted) | $290,562 | $387,402 | $356,899 | $261,123 | $288,716 |
| Ratios (as a percentage of average daily net assets):(3) | | | | | |
| Total expenses | 0.41% | 0.41% | 0.41% | 0.41% | 0.44% |
| Net expenses | 0.35% | 0.35% | 0.40% | 0.41% | 0.44% |
| Net investment income | 3.38% | 1.93% | 0.15% | 0.37% | 1.56% |
| Portfolio Turnover | 159% | 128% | 47% | 6% | 49% |
| (1) | Computed using average shares outstanding. |
| (2) | Returns are historical and are calculated by determining the percentage change in net asset value with all distributions reinvested. |
| (3) | Total expenses do not reflect amounts reimbursed and/or waived by the adviser and certain of its affiliates, if applicable. Net expenses are net of all reductions and represent the net expenses paid by the Fund. |
17
See Notes to Financial Statements.
Eaton Vance
National Ultra-Short Municipal Income Fund
March 31, 2024
Notes to Financial Statements
1 Significant Accounting Policies
Eaton Vance National Ultra-Short Municipal Income Fund (the Fund) is a diversified series of Eaton Vance Investment Trust (the Trust). The Trust is a Massachusetts business trust registered under the Investment Company Act of 1940, as amended (the 1940 Act), as an open-end management investment company. The Fund’s investment objective is to provide current income exempt from regular federal income tax. The Fund offers three classes of shares. Class A shares are generally sold subject to a sales charge imposed at time of purchase. The Advisers Class and Class I shares are sold at net asset value and are not subject to a sales charge. Each class represents a pro rata interest in the Fund, but votes separately on class-specific matters and (as noted below) is subject to different expenses. Realized and unrealized gains and losses are allocated daily to each class of shares based on the relative net assets of each class to the total net assets of the Fund. Net investment income, other than class-specific expenses, is allocated daily to each class of shares based upon the ratio of the value of each class’s paid shares to the total value of all paid shares. Each class of shares differs in its distribution plan and certain other class-specific expenses.
The following is a summary of significant accounting policies of the Fund. The policies are in conformity with accounting principles generally accepted in the United States of America (U.S. GAAP). The Fund is an investment company and follows accounting and reporting guidance in the Financial Accounting Standards Board (FASB) Accounting Standards Codification Topic 946.
A Investment Valuation—The following methodologies are used to determine the market value or fair value of investments.
Debt Obligations. Debt obligations are generally valued on the basis of valuations provided by third party pricing services, as derived from such services’ pricing models. Inputs to the models may include, but are not limited to, reported trades, executable bid and ask prices, broker/dealer quotations, prices or yields of securities with similar characteristics, interest rates, anticipated prepayments, benchmark curves or information pertaining to the issuer, as well as industry and economic events. The pricing services may use a matrix approach, which considers information regarding securities with similar characteristics to determine the valuation for a security. Short-term debt obligations purchased with a remaining maturity of sixty days or less for which a valuation from a third party pricing service is not readily available may be valued at amortized cost, which approximates fair value.
Fair Valuation. In connection with Rule 2a-5 of the 1940 Act, the Trustees have designated the Fund’s investment adviser as its valuation designee. Investments for which valuations or market quotations are not readily available or are deemed unreliable are valued by the investment adviser, as valuation designee, at fair value using methods that most fairly reflect the security’s “fair value”, which is the amount that the Fund might reasonably expect to receive for the security upon its current sale in the ordinary course. Each such determination is based on a consideration of relevant factors, which are likely to vary from one pricing context to another. These factors may include, but are not limited to, the type of security, the existence of any contractual restrictions on the security’s disposition, the price and extent of public trading in similar securities of the issuer or of comparable companies or entities, quotations or relevant information obtained from broker/dealers or other market participants, information obtained from the issuer, analysts, and/or the appropriate stock exchange (for exchange-traded securities), an analysis of the company’s or entity’s financial statements, and an evaluation of the forces that influence the issuer and the market(s) in which the security is purchased and sold.
B Investment Transactions and Related Income—Investment transactions for financial statement purposes are accounted for on a trade date basis. Realized gains and losses on investments sold are determined on the basis of identified cost. Interest income is recorded on the basis of interest accrued, adjusted for amortization of premium or accretion of discount.
C Federal Taxes—The Fund’s policy is to comply with the provisions of the Internal Revenue Code applicable to regulated investment companies and to distribute to shareholders each year substantially all of its taxable, if any, and tax-exempt net investment income, and all or substantially all of its net realized capital gains. Accordingly, no provision for federal income or excise tax is necessary. The Fund intends to satisfy conditions which will enable it to designate distributions from the interest income generated by its investments in non-taxable municipal securities, which are exempt from regular federal income tax when received by the Fund, as exempt-interest dividends.
As of March 31, 2024, the Fund had no uncertain tax positions that would require financial statement recognition, de-recognition, or disclosure. The Fund files a U.S. federal income tax return annually after its fiscal year-end, which is subject to examination by the Internal Revenue Service for a period of three years from the date of filing.
D Expenses—The majority of expenses of the Trust are directly identifiable to an individual fund. Expenses which are not readily identifiable to a specific fund are allocated taking into consideration, among other things, the nature and type of expense and the relative size of the funds.
E Legal Fees— Legal fees and other related expenses incurred as part of negotiations of the terms and requirement of capital infusions, or that are expected to result in the restructuring of, or a plan of reorganization for, an investment are recorded as realized losses. Ongoing expenditures to protect or enhance an investment are treated as operating expenses.
F Use of Estimates—The preparation of the financial statements in conformity with U.S. GAAP requires management to make estimates and assumptions that affect the reported amounts of assets and liabilities at the date of the financial statements and the reported amounts of income and expense during the reporting period. Actual results could differ from those estimates.
Eaton Vance
National Ultra-Short Municipal Income Fund
March 31, 2024
Notes to Financial Statements — continued
G Indemnifications—Under the Trust’s organizational documents, its officers and Trustees may be indemnified against certain liabilities and expenses arising out of the performance of their duties to the Fund. Under Massachusetts law, if certain conditions prevail, shareholders of a Massachusetts business trust (such as the Trust) could be deemed to have personal liability for the obligations of the Trust. However, the Trust’s Declaration of Trust contains an express disclaimer of liability on the part of Fund shareholders and the By-laws provide that the Trust shall assume, upon request by the shareholder, the defense on behalf of any Fund shareholders. Moreover, the By-laws also provide for indemnification out of Fund property of any shareholder held personally liable solely by reason of being or having been a shareholder for all loss or expense arising from such liability. Additionally, in the normal course of business, the Fund enters into agreements with service providers that may contain indemnification clauses. The Fund’s maximum exposure under these arrangements is unknown as this would involve future claims that may be made against the Fund that have not yet occurred.
H When-Issued Securities and Delayed Delivery Transactions—The Fund may purchase securities on a delayed delivery or when-issued basis. Payment and delivery may take place after the customary settlement period for that security. At the time the transaction is negotiated, the price of the security that will be delivered is fixed. The Fund maintains cash and/or security positions for these commitments such that sufficient liquid assets will be available to make payments upon settlement. Securities purchased on a delayed delivery or when-issued basis are marked-to-market daily and begin earning interest on settlement date. Such security purchases are subject to the risk that when delivered they will be worth less than the agreed upon payment price. Losses may also arise if the counterparty does not perform under the contract.
2 Distributions to Shareholders and Income Tax Information
The net investment income of the Fund is determined daily and substantially all of the net investment income so determined is declared as a dividend to shareholders of record at the time of declaration. Distributions are declared separately for each class of shares. Distributions are paid monthly. Distributions of realized capital gains are made at least annually. Shareholders may reinvest income and capital gain distributions in additional shares of the same class of the Fund at the net asset value as of the reinvestment date or, at the election of the shareholder, receive distributions in cash. Distributions to shareholders are determined in accordance with income tax regulations, which may differ from U.S. GAAP. As required by U.S. GAAP, only distributions in excess of tax basis earnings and profits are reported in the financial statements as a return of capital. Permanent differences between book and tax accounting relating to distributions are reclassified to paid-in capital. For tax purposes, distributions from short-term capital gains are considered to be from ordinary income.
The tax character of distributions declared for the years ended March 31, 2024 and March 31, 2023 was as follows:
| | Year Ended March 31, |
| | 2024 | 2023 |
| Tax-exempt income | $12,915,800 | $9,893,744 |
| Ordinary income | $ 361,477 | $ 189,850 |
As of March 31, 2024, the components of distributable earnings (accumulated loss) on a tax basis were as follows:
| Undistributed tax-exempt income | $ 85,799 |
| Deferred capital losses | (7,045,570) |
| Net unrealized depreciation | (187,555) |
| Distributions payable | (107,008) |
| Accumulated loss | $(7,254,334) |
At March 31, 2024, the Fund, for federal income tax purposes, had deferred capital losses of $7,045,570 which would reduce its taxable income arising from future net realized gains on investment transactions, if any, to the extent permitted by the Internal Revenue Code, and thus would reduce the amount of distributions to shareholders, which would otherwise be necessary to relieve the Fund of any liability for federal income or excise tax. The deferred capital losses are treated as arising on the first day of the Fund’s next taxable year and retain the same short-term or long-term character as when originally deferred. Of the deferred capital losses at March 31, 2024, $4,184,290 are short-term and $2,861,280 are long-term.
Eaton Vance
National Ultra-Short Municipal Income Fund
March 31, 2024
Notes to Financial Statements — continued
The cost and unrealized appreciation (depreciation) of investments of the Fund at March 31, 2024, as determined on a federal income tax basis, were as follows:
| Aggregate cost | $357,446,961 |
| Gross unrealized appreciation | $ 845,935 |
| Gross unrealized depreciation | (1,033,490) |
| Net unrealized depreciation | $ (187,555) |
3 Investment Adviser Fee and Other Transactions with Affiliates
The investment adviser fee is earned by Boston Management and Research (BMR), an indirect, wholly-owned subsidiary of Morgan Stanley, as compensation for investment advisory services rendered to the Fund. Pursuant to the amended investment advisory agreement between the Fund and BMR, the fee is based upon a percentage of total daily net assets as indicated below and is payable monthly.
| Total Daily Net Assets | Annual Asset
Rate |
| Up to $500 million | 0.300% |
| $500 million but less than $1 billion | 0.275% |
| $1 billion but less than $1.5 billion | 0.250% |
| $1.5 billion but less than $2 billion | 0.225% |
| $2 billion but less than $3 billion | 0.200% |
| $3 billion and over | 0.175% |
For the year ended March 31, 2024, the investment adviser fee amounted to $1,210,940 or 0.30% of the Fund’s average daily net assets.
Eaton Vance Management (EVM), an affiliate of BMR and an indirect, wholly-owned subsidiary of Morgan Stanley, has agreed to reimburse the Fund’s expenses to the extent that total annual operating expenses (relating to ordinary operating expenses only and excluding expenses such as brokerage commissions, acquired fund fees and expenses of unaffiliated funds, borrowing costs, taxes or litigation expenses) exceed 0.50%, 0.50% and 0.35% of the Fund’s average daily net assets for Advisers Class, Class A and Class I, respectively. This agreement may be changed or terminated after July 31, 2024. Pursuant to this agreement, EVM was allocated $228,374 of the Fund’s operating expenses for the year ended March 31, 2024.
EVM serves as the administrator of the Fund, but receives no compensation. EVM provides sub-transfer agency and related services to the Fund pursuant to a Sub-Transfer Agency Support Services Agreement. For the year ended March 31, 2024, EVM earned $3,514 from the Fund pursuant to such agreement, which is included in transfer and dividend disbursing agent fees on the Statement of Operations. The Fund was informed that Eaton Vance Distributors, Inc. (EVD), an affiliate of EVM and the Fund’s principal underwriter, received $1,932 as its portion of the sales charge on sales of Class A shares for the year ended March 31, 2024. EVD also received distribution and service fees from Advisers Class and Class A shares (see Note 4) and contingent deferred sales charges (see Note 5).
Trustees and officers of the Fund who are members of EVM’s or BMR’s organizations receive remuneration for their services to the Fund out of the investment adviser fee. Trustees of the Fund who are not affiliated with the investment adviser may elect to defer receipt of all or a percentage of their annual fees in accordance with the terms of the Trustees Deferred Compensation Plan. Certain officers and Trustees of the Fund are officers of the above organizations.
4 Distribution Plan
The Fund has in effect a distribution plan for Advisers Class shares and Class A shares (Advisers/Class A Plan) pursuant to Rule 12b-1 under the 1940 Act. Pursuant to the Advisers/Class A Plan, the Fund pays EVD a distribution and service fee not exceeding 0.25% per annum of its average daily net assets attributable to Advisers Class and Class A shares for distribution services and facilities provided to the Fund by EVD, as well as for personal services and/or the maintenance of shareholder accounts. The Trustees approved distribution and service fee payments equal to 0.15% per annum of the Fund’s average daily net assets attributable to Advisers Class shares and Class A shares. Distribution and service fees paid or accrued to EVD for the year ended March 31, 2024 amounted to $1,300 for Advisers Class shares and $125,078 for Class A shares.
Distribution and service fees are subject to the limitations contained in the Financial Industry Regulatory Authority Rule 2341(d).
Eaton Vance
National Ultra-Short Municipal Income Fund
March 31, 2024
Notes to Financial Statements — continued
5 Contingent Deferred Sales Charges
Class A shares may be subject to a 0.25% contingent deferred sales charge (CDSC) if redeemed within 12 months of purchase (depending on the circumstances of purchase). Generally, the CDSC is based upon the lower of the net asset value at date of redemption or date of purchase. No charge is levied on shares acquired by reinvestment of dividends or capital gain distributions. For the year ended March 31, 2024, the Fund was informed that EVD received less than $100 of CDSCs paid by Class A shareholders.
6 Purchases and Sales of Investments
Purchases and sales of investments, other than short-term obligations, aggregated $538,199,022 and $684,405,396, respectively, for the year ended March 31, 2024.
7 Shares of Beneficial Interest
The Fund’s Declaration of Trust permits the Trustees to issue an unlimited number of full and fractional shares of beneficial interest (without par value). Transactions in Fund shares were as follows:
| | Year Ended
March 31, 2024 | | Year Ended
March 31, 2023 |
| | Shares | Amount | | Shares | Amount |
| Advisers Class | | | | | |
| Sales | 49,909 | $ 484,994 | | 91,269 | $ 887,103 |
| Issued to shareholders electing to receive payments of distributions in Fund shares | 2,839 | 27,610 | | 994 | 9,669 |
| Redemptions | (29,498) | (286,770) | | (26,280) | (256,363) |
| Net increase | 23,250 | $ 225,834 | | 65,983 | $ 640,409 |
| Class A | | | | | |
| Sales | 1,233,383 | $ 12,001,306 | | 2,506,225 | $ 24,454,875 |
| Issued to shareholders electing to receive payments of distributions in Fund shares | 260,309 | 2,530,666 | | 220,562 | 2,148,064 |
| Redemptions | (6,462,737) | (62,773,541) | | (6,179,480) | (60,227,780) |
| Net decrease | (4,969,045) | $ (48,241,569) | | (3,452,693) | $ (33,624,841) |
| Class I | | | | | |
| Sales | 30,966,097 | $ 301,238,652 | | 47,232,786 | $ 460,931,319 |
| Issued to shareholders electing to receive payments of distributions in Fund shares | 836,942 | 8,146,359 | | 546,675 | 5,328,532 |
| Redemptions | (41,713,971) | (406,206,948) | | (44,444,058) | (434,054,778) |
| Net increase (decrease) | (9,910,932) | $ (96,821,937) | | 3,335,403 | $ 32,205,073 |
8 Line of Credit
The Fund participates with other portfolios and funds managed by EVM and its affiliates in a $650 million unsecured revolving line of credit agreement with a group of banks, which is in effect through October 22, 2024. In connection with the renewal of the agreement on October 24, 2023, the borrowing limit was decreased from $725 million. Borrowings are made by the Fund solely for temporary purposes related to redemptions and other short-term cash needs. Interest is charged to the Fund based on its borrowings at an amount above either the Secured Overnight Financing Rate (SOFR) or Federal Funds rate. In addition, a fee computed at an annual rate of 0.15% on the daily unused portion of the line of credit is allocated among the participating portfolios and funds at the end of each quarter. In connection with the renewal of the agreement in October 2023, an arrangement fee of $150,000 was incurred that was allocated to the participating portfolios and funds. Because the line of credit is not available exclusively to the Fund, it may be unable to borrow some or all of its requested amounts at any particular time. The Fund did not have any significant borrowings or allocated fees during the year ended March 31, 2024.
Eaton Vance
National Ultra-Short Municipal Income Fund
March 31, 2024
Notes to Financial Statements — continued
9 Fair Value Measurements
Under generally accepted accounting principles for fair value measurements, a three-tier hierarchy to prioritize the assumptions, referred to as inputs, is used in valuation techniques to measure fair value. The three-tier hierarchy of inputs is summarized in the three broad levels listed below.
| • | Level 1 – quoted prices in active markets for identical investments |
| • | Level 2 – other significant observable inputs (including quoted prices for similar investments, interest rates, prepayment speeds, credit risk, etc.) |
| • | Level 3 – significant unobservable inputs (including a fund's own assumptions in determining the fair value of investments) |
In cases where the inputs used to measure fair value fall in different levels of the fair value hierarchy, the level disclosed is determined based on the lowest level input that is significant to the fair value measurement in its entirety. The inputs or methodology used for valuing securities are not necessarily an indication of the risk associated with investing in those securities.
At March 31, 2024, the hierarchy of inputs used in valuing the Fund's investments, which are carried at fair value, were as follows:
| Asset Description | Level 1 | Level 2 | Level 3 | Total |
| Corporate Bonds | $ — | $ 1,948,920 | $ — | $ 1,948,920 |
| Tax-Exempt Municipal Obligations | — | 344,341,261 | — | 344,341,261 |
| Taxable Municipal Obligations | — | 10,969,225 | — | 10,969,225 |
| Total Investments | $ — | $357,259,406 | $ — | $357,259,406 |
Eaton Vance
National Ultra-Short Municipal Income Fund
March 31, 2024
Report of Independent Registered Public Accounting Firm
To the Trustees of Eaton Vance Investment Trust and Shareholders of Eaton Vance National Ultra-Short Municipal Income Fund:
Opinion on the Financial Statements and Financial Highlights
We have audited the accompanying statement of assets and liabilities of Eaton Vance National Ultra-Short Municipal Income Fund (the “Fund”) (one of the funds constituting Eaton Vance Investment Trust), including the portfolio of investments, as of March 31, 2024, the related statement of operations for the year then ended, the statements of changes in net assets for each of the two years in the period then ended, the financial highlights for each of the five years in the period then ended, and the related notes. In our opinion, the financial statements and financial highlights present fairly, in all material respects, the financial position of the Fund as of March 31, 2024, and the results of its operations for the year then ended, the changes in its net assets for each of the two years in the period then ended, and the financial highlights for each of the five years in the period then ended, in conformity with accounting principles generally accepted in the United States of America.
Basis for Opinion
These financial statements and financial highlights are the responsibility of the Fund's management. Our responsibility is to express an opinion on the Fund's financial statements and financial highlights based on our audits. We are a public accounting firm registered with the Public Company Accounting Oversight Board (United States) (PCAOB) and are required to be independent with respect to the Fund in accordance with the U.S. federal securities laws and the applicable rules and regulations of the Securities and Exchange Commission and the PCAOB.
We conducted our audits in accordance with the standards of the PCAOB. Those standards require that we plan and perform the audit to obtain reasonable assurance about whether the financial statements and financial highlights are free of material misstatement, whether due to error or fraud. The Fund is not required to have, nor were we engaged to perform, an audit of its internal control over financial reporting. As part of our audits, we are required to obtain an understanding of internal control over financial reporting but not for the purpose of expressing an opinion on the effectiveness of the Fund’s internal control over financial reporting. Accordingly, we express no such opinion.
Our audits included performing procedures to assess the risks of material misstatement of the financial statements and financial highlights, whether due to error or fraud, and performing procedures that respond to those risks. Such procedures included examining, on a test basis, evidence regarding the amounts and disclosures in the financial statements and financial highlights. Our audits also included evaluating the accounting principles used and significant estimates made by management, as well as evaluating the overall presentation of the financial statements and financial highlights. Our procedures included confirmation of securities owned as of March 31, 2024, by correspondence with the custodian and brokers; when replies were not received from brokers, we performed other auditing procedures. We believe that our audits provide a reasonable basis for our opinion.
/s/ Deloitte & Touche LLP
Boston, Massachusetts
May 17, 2024
We have served as the auditor of one or more Eaton Vance investment companies since 1959.
Eaton Vance
National Ultra-Short Municipal Income Fund
March 31, 2024
Federal Tax Information (Unaudited)
The Form 1099-DIV you receive in February 2025 will show the tax status of all distributions paid to your account in calendar year 2024. Shareholders are advised to consult their own tax adviser with respect to the tax consequences of their investment in the Fund. As required by the Internal Revenue Code and/or regulations, shareholders must be notified regarding the status of exempt-interest dividends.
Exempt-Interest Dividends. For the fiscal year ended March 31, 2024, the Fund designates 97.28% of distributions from net investment income as an exempt-interest dividend.
Eaton Vance
National Ultra-Short Municipal Income Fund
March 31, 2024
Management and Organization
Fund Management. The Trustees of Eaton Vance Investment Trust (the Trust) are responsible for the overall management and supervision of the Trust's affairs. The Board members and officers of the Trust are listed below. Except as indicated, each individual has held the office shown or other offices in the same company for the last five years. Board members hold indefinite terms of office. Each Trustee holds office until his or her successor is elected and qualified, subject to a prior death, resignation, retirement, disqualification or removal. Under the terms of the Fund’s current Trustee retirement policy, an Independent Trustee must retire and resign as a Trustee on the earlier of: (i) the first day of July following his or her 74th birthday; or (ii), with limited exception, December 31st of the 20th year in which he or she has served as a Trustee. However, if such retirement and resignation would cause the Fund to be out of compliance with Section 16 of the 1940 Act or any other regulations or guidance of the SEC, then such retirement and resignation will not become effective until such time as action has been taken for the Fund to be in compliance therewith. The “noninterested Trustees” consist of those Trustees who are not “interested persons” of the Trust, as that term is defined under the 1940 Act. The business address of each Board member and officer is One Post Office Square, Boston, Massachusetts 02109. As used below, “BMR” refers to Boston Management and Research, “EV” refers to EV LLC, “EVM” refers to Eaton Vance Management, “MSIM” refers to Morgan Stanley Investment Management Inc. and “EVD” refers to Eaton Vance Distributors, Inc. EV is the trustee of each of EVM and BMR. Each of EVM, BMR, EVD and EV are indirect, wholly owned subsidiaries of Morgan Stanley. Each officer affiliated with EVM may hold a position with other EVM affiliates that is comparable to his or her position with EVM listed below. Each Trustee oversees 127 funds in the Eaton Vance fund complex (including both funds and portfolios in a hub and spoke structure).
| Name and Year of Birth | Trust
Position(s) | Length of Service | Principal Occupation(s) and Other Directorships
During Past Five Years and Other Relevant Experience |
| Interested Trustee |
Anchal Pachnanda
1980 | Trustee | Since 2023 | Co-Head of Strategy of MSIM (since 2019). Formerly, Head of Strategy of MSIM (2017-2019). Ms. Pachnanda is an interested person because of her position with MSIM, which is an affiliate of the Trust.
Other Directorships. None. |
| Noninterested Trustees |
Alan C. Bowser
1962 | Trustee | Since 2022 | Private investor. Formerly, Chief Diversity Officer, Partner and a member of the Operating Committee, and formerly served as Senior Advisor on Diversity and Inclusion for the firm’s chief executive officer, Co-Head of the Americas Region, and Senior Client Advisor of Bridgewater Associates, an asset management firm (2011- 2023).
Other Directorships. Independent Director of Stout Risius Ross (a middle market professional services advisory firm) (since 2021). |
Mark R. Fetting
1954 | Trustee | Since 2016 | Private investor. Formerly held various positions at Legg Mason, Inc. (investment management firm) (2000-2012), including President, Chief Executive Officer, Director and Chairman (2008-2012), Senior Executive Vice President (2004-2008) and Executive Vice President (2001-2004). Formerly, President of Legg Mason family of funds (2001-2008). Formerly, Division President and Senior Officer of Prudential Financial Group, Inc. and related companies (investment management firm) (1991-2000).
Other Directorships. None. |
Cynthia E. Frost
1961 | Trustee | Since 2014 | Private investor. Formerly, Chief Investment Officer of Brown University (university endowment) (2000-2012). Formerly, Portfolio Strategist for Duke Management Company (university endowment manager) (1995-2000). Formerly, Managing Director, Cambridge Associates (investment consulting company) (1989-1995). Formerly, Consultant, Bain and Company (management consulting firm) (1987-1989). Formerly, Senior Equity Analyst, BA Investment Management Company (1983-1985).
Other Directorships. None. |
George J. Gorman
1952 | Chairperson
of the Board
and Trustee | Since 2021
(Chairperson) and
2014 (Trustee) | Principal at George J. Gorman LLC (consulting firm). Formerly, Senior Partner at Ernst & Young LLP (a registered public accounting firm) (1974-2009).
Other Directorships. None. |
Eaton Vance
National Ultra-Short Municipal Income Fund
March 31, 2024
Management and Organization — continued
| Name and Year of Birth | Trust
Position(s) | Length of Service | Principal Occupation(s) and Other Directorships
During Past Five Years and Other Relevant Experience |
| Noninterested Trustees (continued) |
Valerie A. Mosley
1960 | Trustee | Since 2014 | Chairwoman and Chief Executive Officer of Valmo Ventures (a consulting and investment firm). Founder of Upward Wealth, Inc., dba BrightUp, a fintech platform. Formerly, Partner and Senior Vice President, Portfolio Manager and Investment Strategist at Wellington Management Company, LLP (investment management firm) (1992-2012). Formerly, Chief Investment Officer, PG Corbin Asset Management (1990-1992). Formerly worked in institutional corporate bond sales at Kidder Peabody (1986-1990).
Other Directorships. Director of DraftKings, Inc. (digital sports entertainment and gaming company) (since September 2020). Director of Envestnet, Inc. (provider of intelligent systems for wealth management and financial wellness) (since 2018). Formerly, Director of Dynex Capital, Inc. (mortgage REIT) (2013-2020) and Director of Groupon, Inc. (e-commerce provider) (2020-2022). |
Keith Quinton
1958 | Trustee | Since 2018 | Private investor, researcher and lecturer. Formerly, Independent Investment Committee Member at New Hampshire Retirement System (2017-2021). Formerly, Portfolio Manager and Senior Quantitative Analyst at Fidelity Investments (investment management firm) (2001-2014).
Other Directorships. Formerly, Director (2016-2021) and Chairman (2019-2021) of New Hampshire Municipal Bond Bank. |
Marcus L. Smith
1966 | Trustee | Since 2018 | Private investor and independent corporate director. Formerly, Chief Investment Officer, Canada (2012-2017), Chief Investment Officer, Asia (2010-2012), Director of Asian Research (2004-2010) and portfolio manager (2001-2017) at MFS Investment Management (investment management firm).
Other Directorships. Director of First Industrial Realty Trust, Inc. (an industrial REIT) (since 2021). Director of MSCI Inc. (global provider of investment decision support tools) (since 2017). Formerly, Director of DCT Industrial Trust Inc. (logistics real estate company) (2017-2018). |
Susan J. Sutherland
1957 | Trustee | Since 2015 | Private investor. Director of Ascot Group Limited and certain of its subsidiaries (insurance and reinsurance) (since 2017). Formerly, Director of Hagerty Holding Corp. (insurance) (2015-2018) and Montpelier Re Holdings Ltd. (insurance and reinsurance) (2013-2015). Formerly, Associate, Counsel and Partner at Skadden, Arps, Slate, Meagher & Flom LLP (law firm) (1982-2013).
Other Directorships. Formerly, Director of Kairos Acquisition Corp. (insurance/InsurTech acquisition company) (2021-2023). |
Scott E. Wennerholm
1959 | Trustee | Since 2016 | Private investor. Formerly, Trustee at Wheelock College (postsecondary institution) (2012-2018). Formerly, Consultant at GF Parish Group (executive recruiting firm) (2016-2017). Formerly, Chief Operating Officer and Executive Vice President at BNY Mellon Asset Management (investment management firm) (2005-2011). Formerly, Chief Operating Officer and Chief Financial Officer at Natixis Global Asset Management (investment management firm) (1997-2004). Formerly, Vice President at Fidelity Investments Institutional Services (investment management firm) (1994-1997).
Other Directorships. None. |
Nancy A. Wiser
1967 | Trustee | Since 2022 | Formerly, Executive Vice President and the Global Head of Operations at Wells Fargo Asset Management (2011-2021).
Other Directorships. None. |
| Name and Year of Birth | Trust
Position(s) | Length of Service | Principal Occupation(s)
During Past Five Years |
| Principal Officers who are not Trustees |
Kenneth A. Topping
1966 | President | Since 2023 | Vice President and Chief Administrative Officer of EVM and BMR and Chief Operating Officer for Public Markets at MSIM. Also Vice President of Calvert Research and Management (“CRM”) since 2021. Formerly, Chief Operating Officer for Goldman Sachs Asset Management 'Classic’ (2009-2020). |
Deidre E. Walsh
1971 | Vice President and
Chief Legal Officer | Since 2009 | Vice President of EVM and BMR. Also Vice President of CRM. |
James F. Kirchner
1967 | Treasurer | Since 2007 | Vice President of EVM and BMR. Also Vice President of CRM. |
Eaton Vance
National Ultra-Short Municipal Income Fund
March 31, 2024
Management and Organization — continued
| Name and Year of Birth | Trust
Position(s) | Length of Service | Principal Occupation(s)
During Past Five Years |
| Principal Officers who are not Trustees (continued) |
Nicholas S. Di Lorenzo
1987 | Secretary | Since 2022 | Formerly, associate (2012-2021) and counsel (2022) at Dechert LLP. |
Laura T. Donovan
1976 | Chief Compliance
Officer | Since 2024 | Vice President of EVM and BMR. |
The SAI for the Fund includes additional information about the Trustees and officers of the Fund and can be obtained without charge on Eaton Vance’s website at www.eatonvance.com or by calling 1-800-262-1122.
| U.S. Customer Privacy Notice | March 2024 |
| FACTS | WHAT DOES EATON VANCE DO WITH YOUR PERSONAL INFORMATION? |
| Why? | Financial companies choose how they share your personal information. Federal law gives consumers the right to limit some but not all sharing. Federal law also requires us to tell you how we collect, share, and protect your personal information. Please read this notice carefully to understand what we do. |
| |
| What? | The types of personal information we collect and share depend on the product or service you have with us. This information can include:■ Social Security number and income
■ investment experience and risk tolerance
■ checking account information and wire transfer instructions |
| |
| How? | All financial companies need to share customers’ personal information to run their everyday business. In the section below, we list the reasons financial companies can share their customers’ personal information; the reasons Eaton Vance chooses to share; and whether you can limit this sharing. |
| Reasons we can share your personal information | Does Eaton Vance
share? | Can you limit
this sharing? |
| For our everyday business purposes — such as to process your transactions, maintain your account(s), respond to court orders and legal investigations, or report to credit bureaus | Yes | No |
| For our marketing purposes — to offer our products and services to you | Yes | No |
| For joint marketing with other financial companies | No | We don’t share |
| For our affiliates’ everyday business purposes — information about your transactions and experiences | Yes | No* |
| For our affiliates’ everyday business purposes — information about your creditworthiness | Yes | Yes* |
| For our affiliates to market to you | Yes | Yes* |
| For nonaffiliates to market to you | No | We don’t share |
To limit our
sharing | Call toll-free 1-800-262-1122 or email: EVPrivacy@eatonvance.comPlease note:If you are a new customer, we can begin sharing your information 30 days from the date we sent this notice. When you are no longer our customer, we continue to share your information as described in this notice. However, you can contact us at any time to limit our sharing. |
| Questions? | Call toll-free 1-800-262-1122 or email: EVPrivacy@eatonvance.com |
| U.S. Customer Privacy Notice — continued | March 2024 |
| Who we are |
| Who is providing this notice? | Eaton Vance Management and our investment management affiliates (“Eaton Vance”) (see Affiliates definition below.) |
| What we do |
How does Eaton Vance
protect my personal
information? | To protect your personal information from unauthorized access and use, we use security measures that comply with federal law. These measures include computer safeguards and secured files and buildings. We have policies governing the proper handling of customer information by personnel and requiring third parties that provide support to adhere to appropriate security standards with respect to such information. |
How does Eaton Vance
collect my personal
information? | We collect your personal information, for example, when you■ open an account or make deposits or withdrawals from your account
■ buy securities from us or make a wire transfer
■ give us your contact informationWe also collect your personal information from others, such as credit bureaus, affiliates, or other companies. |
| Why can’t I limit all sharing? | Federal law gives you the right to limit only■ sharing for affiliates’ everyday business purposes — information about your creditworthiness
■ affiliates from using your information to market to you
■ sharing for nonaffiliates to market to youState laws and individual companies may give you additional rights to limit sharing. (See below for more on your rights under state law.) |
What happens when I limit
sharing for an account I hold
jointly with someone else? | Your choices will apply to everyone on your account. |
| Definitions |
| Affiliates | Companies related by common ownership or control. They can be financial and nonfinancial companies.■ Our affiliates include registered investment advisers such as Eaton Vance Management, Eaton Vance Advisers International Ltd., Boston Management and Research, Calvert Research and Management, Parametric Portfolio Associates LLC, Atlanta Capital Management Company LLC, Morgan Stanley Investment Management Inc., Morgan Stanley Investment Management Co.; registered broker-dealers such as Morgan Stanley Distributors Inc. and Eaton Vance Distributors, Inc. (together, the “Investment Management Affiliates”); and companies with a Morgan Stanley name and financial companies such as Morgan Stanley Smith Barney LLC and Morgan Stanley & Co. (the “Morgan Stanley Affiliates”). |
| Nonaffiliates | Companies not related by common ownership or control. They can be financial and nonfinancial companies.■ Eaton Vance does not share with nonaffiliates so they can market to you. |
| Joint marketing | A formal agreement between nonaffiliated financial companies that together market financial products or services to you.■ Eaton Vance does not jointly market. |
| U.S. Customer Privacy Notice — continued | March 2024 |
| Other important information |
| *PLEASE NOTE: Eaton Vance does not share your creditworthiness information or your transactions and experiences information with the Morgan Stanley Affiliates, nor does Eaton Vance enable the Morgan Stanley Affiliates to market to you. Your opt outs will prevent Eaton Vance from sharing your creditworthiness information with the Investment Management Affiliates and will prevent the Investment Management Affiliates from marketing their products to you.Vermont: Except as permitted by law, we will not share personal information we collect about Vermont residents with Nonaffiliates unless you provide us with your written consent to share such information.California: Except as permitted by law, we will not share personal information we collect about California residents with Nonaffiliates and we will limit sharing such personal information with our Affiliates to comply with California privacy laws that apply to us. |
Delivery of Shareholder Documents. The Securities and Exchange Commission (SEC) permits funds to deliver only one copy of shareholder documents, including prospectuses, proxy statements and shareholder reports, to fund investors with multiple accounts at the same residential or post office box address. This practice is often called “householding” and it helps eliminate duplicate mailings to shareholders. Eaton Vance, or your financial intermediary, may household the mailing of your documents indefinitely unless you instruct Eaton Vance, or your financial intermediary, otherwise. If you would prefer that your Eaton Vance documents not be householded, please contact Eaton Vance at 1-800-262-1122, or contact your financial intermediary. Your instructions that householding not apply to delivery of your Eaton Vance documents will typically be effective within 30 days of receipt by Eaton Vance or your financial intermediary.
Portfolio Holdings. Each Eaton Vance Fund and its underlying Portfolio(s) (if applicable) files a schedule of portfolio holdings on Part F to Form N-PORT with the SEC. Certain information filed on Form N-PORT may be viewed on the Eaton Vance website at www.eatonvance.com, by calling Eaton Vance at 1-800-262-1122 or in the EDGAR database on the SEC’s website at www.sec.gov.
Proxy Voting. From time to time, funds are required to vote proxies related to the securities held by the funds. The Eaton Vance Funds or their underlying Portfolios (if applicable) vote proxies according to a set of policies and procedures approved by the Funds’ and Portfolios’ Boards. You may obtain a description of these policies and procedures and information on how the Funds or Portfolios voted proxies relating to portfolio securities during the most recent 12-month period ended June 30, without charge, upon request, by calling 1-800-262-1122 and by accessing the SEC’s website at www.sec.gov.
Tailored Shareholder Reports. Effective January 24, 2023, the SEC adopted rule and form amendments to require open-end mutual funds and ETFs to transmit concise and visually engaging streamlined annual and semiannual reports to shareholders that highlight key information. Other information, including financial statements, will no longer appear in a streamlined shareholder report but must be available online, delivered free of charge upon request, and filed on a semiannual basis on Form N-CSR. The rule and form amendments have a compliance date of July 24, 2024. At this time, management is evaluating the impact of these amendments on the shareholder reports for the Eaton Vance Funds.
This Page Intentionally Left Blank
Investment Adviser
Boston Management and Research
One Post Office Square
Boston, MA 02109
Administrator
Eaton Vance Management
One Post Office Square
Boston, MA 02109
Principal Underwriter*
Eaton Vance Distributors, Inc.
One Post Office Square
Boston, MA 02109
(617) 482-8260
Custodian
State Street Bank and Trust Company
One Congress Street, Suite 1
Boston, MA 02114-2016
Transfer Agent
BNY Mellon Investment Servicing (US) Inc.
Attn: Eaton Vance Funds
P.O. Box 534439
Pittsburgh, PA 15253-4439
(800) 262-1122
Independent Registered Public Accounting Firm
Deloitte & Touche LLP
200 Berkeley Street
Boston, MA 02116-5022
Fund Offices
One Post Office Square
Boston, MA 02109
* FINRA BrokerCheck. Investors may check the background of their Investment Professional by contacting the Financial Industry Regulatory Authority (FINRA). FINRA BrokerCheck is a free tool to help investors check the professional background of current and former FINRA-registered securities firms and brokers. FINRA BrokerCheck is available by calling 1-800-289-9999 and at www.FINRA.org. The FINRA BrokerCheck brochure describing this program is available to investors at www.FINRA.org.
Eaton Vance
National Limited Maturity Municipal Income Fund
Annual Report
March 31, 2024
Commodity Futures Trading Commission Registration. The Commodity Futures Trading Commission (“CFTC”) has adopted regulations that subject registered investment companies and advisers to regulation by the CFTC if a fund invests more than a prescribed level of its assets in certain CFTC-regulated instruments (including futures, certain options and swap agreements) or markets itself as providing investment exposure to such instruments. The investment adviser has claimed an exclusion from the definition of “commodity pool operator” under the Commodity Exchange Act with respect to its management of the Fund. Accordingly, neither the Fund nor the adviser with respect to the operation of the Fund is subject to CFTC regulation. Because of its management of other strategies, the Fund's adviser is registered with the CFTC as a commodity pool operator. The adviser is also registered as a commodity trading advisor.
Fund shares are not insured by the FDIC and are not deposits or other obligations of, or guaranteed by, any depository institution. Shares are subject to investment risks, including possible loss of principal invested.
This report must be preceded or accompanied by a current summary prospectus or prospectus. Before investing, investors should consider carefully the investment objective, risks, and charges and expenses of a mutual fund. This and other important information is contained in the summary prospectus and prospectus, which can be obtained from a financial intermediary. Prospective investors should read the prospectus carefully before investing. For further information, please call 1-800-262-1122.
Annual Report March 31, 2024
Eaton Vance
National Limited Maturity Municipal Income Fund
Eaton Vance
National Limited Maturity Municipal Income Fund
March 31, 2024
Management’s Discussion of Fund Performance†
Economic and Market Conditions
The 12-month period ended March 31, 2024, began with an April 2023 municipal bond sell-off that continued through much of the period. Although positive technical factors -- particularly municipal bond demand that exceeded supply -- produced brief periods of positive performance, the U.S. Federal Reserve’s (the Fed’s) 10th and 11th interest rate hikes in just over a year -- in May and July 2023 -- contributed to rising municipal yields and falling bond prices.
From August through October 2023, above-average supplies of municipal bonds -- plus an end-of-summer slowdown in coupon reinvestment -- reduced demand for municipal bonds. Although the Fed left the federal funds rate unchanged in September 2023, investors interpreted the central bank’s message to be that rates might stay higher for longer than they had expected just weeks earlier -- adding fuel to the municipal bond sell-off.
However, in November and December 2023, the municipal bond market reversed course. After several months of rising interest rates and negative bond returns, federal tax-free municipal yields approached their 2022 highs, giving investors a compelling reason to buy tax-exempt municipal bonds.
Typical calendar year-end technical factors -- particularly constrained supplies and increased investor demand -- were additional tailwinds for municipal bond prices. Falling inflation and easing employment gains also led many investors to believe the Fed might be done raising interest rates. Such factors contributed to the Bloomberg Municipal Bond Index (the Municipal Index) returning 6.35% in November 2023, its best monthly performance since 1982.
In December 2023, the Municipal Index posted another solid monthly gain as investors began to conclude the Fed might begin lowering interest rates during the first half of 2024.
In the final three months of the period, however, municipal returns turned negative as municipal bonds -- following a strong year-end rally -- appeared overvalued relative to U.S. Treasurys. Fed statements and strong U.S. economic reports in early 2024 led investors to reduce expectations for the number of Fed rate cuts projected for the year and how soon they might begin. As a result, both municipal bonds and U.S. Treasurys delivered negative performance during the first quarter of 2024.
For the period as a whole, the Municipal Index returned 3.13%, as municipal bonds outperformed U.S. Treasurys throughout the yield curve. Although yields rose and prices fell across the municipal bond yield curve, the positive contribution from rising interest income outweighed the negative effect of falling bond prices. During the period, lower-rated bonds generally outperformed higher-rated bonds, while longer-maturity bonds generally outperformed shorter-maturity bonds.
Fund Performance
For the 12-month period ended March 31, 2024, Eaton Vance National Limited Maturity Municipal Income Fund (the Fund) returned 3.04% for Class A shares at net asset value (NAV), outperforming its benchmark, the Bloomberg Short-Intermediate 1-10 Year Municipal Bond Index (the Index), which returned 2.07%.
The Fund’s overall strategy is to invest in municipal obligations exempt from federal income tax. The Fund seeks to maintain a dollar-weighted average portfolio duration of less than five years.
Contributors to Fund performance versus the Index included defensive out-of-Index allocations to floating-rate notes and variable-rate demand notes -- whose coupon payments are indexed to short-term interest rates, which rose during the period.
Additional contributors to Index-relative performance included security selections and an overweight position in industrial development revenue bonds -- the best-performing sector within the Index during the period -- and an overweight position in 4% coupon bonds.
In contrast, security selections in Hawaii bonds and an underweight position in the leasing sector detracted from Fund performance versus the Index during the period.
See Endnotes and Additional Disclosures in this report.
Past performance is no guarantee of future results. Returns are historical and are calculated by determining the percentage change in net asset value (NAV) or offering price (as applicable) with all distributions reinvested. Furthermore, returns do not reflect the deduction of taxes that shareholders may have to pay on Fund distributions or upon the redemption of Fund shares. Investment return and principal value will fluctuate so that shares, when redeemed, may be worth more or less than their original cost. Performance for periods less than or equal to one year is cumulative. Performance is for the stated time period only; due to market volatility, current Fund performance may be lower or higher than the quoted return. For performance as of the most recent month-end, please refer to eatonvance.com.
Eaton Vance
National Limited Maturity Municipal Income Fund
March 31, 2024
Performance
Portfolio Manager(s) Christopher J. Eustance, CFA and Trevor G. Smith
| % Average Annual Total Returns1,2 | Class
Inception Date | Performance
Inception Date | One Year | Five Years | Ten Years |
| Class A at NAV | 06/27/1996 | 05/22/1992 | 3.04% | 1.38% | 1.93% |
| Class A with 3.25% Maximum Sales Charge | — | — | (0.28) | 0.71 | 1.59 |
| Class C at NAV | 12/08/1993 | 05/22/1992 | 2.26 | 0.62 | 1.33 |
| Class C with 1% Maximum Deferred Sales Charge | — | — | 1.26 | 0.62 | 1.33 |
| Class I at NAV | 10/01/2009 | 05/22/1992 | 3.19 | 1.53 | 2.08 |
|
| Bloomberg Short-Intermediate 1-10 Year Municipal Bond Index | — | — | 2.07% | 1.34% | 1.80% |
| % Total Annual Operating Expense Ratios3 | Class A | Class C | Class I |
| | 0.66% | 1.41% | 0.51% |
| % Distribution Rates/Yields4 | Class A | Class C | Class I |
| Distribution Rate | 3.17% | 2.42% | 3.32% |
| Taxable-Equivalent Distribution Rate | 5.35 | 4.09 | 5.61 |
| SEC 30-day Yield | 2.95 | 2.30 | 3.20 |
| Taxable-Equivalent SEC 30-day Yield | 4.98 | 3.89 | 5.40 |
Growth of $10,000
This graph shows the change in value of a hypothetical investment of $10,000 in Class A of the Fund for the period indicated. For comparison, the same investment is shown in the indicated index.
| Growth of Investment | Amount Invested | Period Beginning | At NAV | With Maximum Sales Charge |
| Class C | $10,000 | 03/31/2014 | $11,412 | N.A. |
| Class I, at minimum investment | $1,000,000 | 03/31/2014 | $1,228,808 | N.A. |
See Endnotes and Additional Disclosures in this report.
Past performance is no guarantee of future results. Returns are historical and are calculated by determining the percentage change in net asset value (NAV) or offering price (as applicable) with all distributions reinvested. Furthermore, returns do not reflect the deduction of taxes that shareholders may have to pay on Fund distributions or upon the redemption of Fund shares. Investment return and principal value will fluctuate so that shares, when redeemed, may be worth more or less than their original cost. Performance for periods less than or equal to one year is cumulative. Performance is for the stated time period only; due to market volatility, current Fund performance may be lower or higher than the quoted return. For performance as of the most recent month-end, please refer to eatonvance.com.
Eaton Vance
National Limited Maturity Municipal Income Fund
March 31, 2024
| Credit Quality (% of total investments)1 |
Footnotes:
| 1 | For purposes of the Fund’s rating restrictions, ratings are based on Moody’s Investors Service, Inc. (“Moody’s”), S&P Global Ratings (“S&P”) or Fitch Ratings (“Fitch”), as applicable. If securities are rated differently by the ratings agencies, the highest rating is applied. Ratings, which are subject to change, apply to the creditworthiness of the issuers of the underlying securities and not to the Fund or its shares. Credit ratings measure the quality of a bond based on the issuer’s creditworthiness, with ratings ranging from AAA, being the highest, to D, being the lowest based on S&P’s measures. Ratings of BBB or higher by S&P or Fitch (Baa or higher by Moody’s) are considered to be investment-grade quality. Credit ratings are based largely on the ratings agency’s analysis at the time of rating. The rating assigned to any particular security is not necessarily a reflection of the issuer’s current financial condition and does not necessarily reflect its assessment of the volatility of a security’s market value or of the liquidity of an investment in the security. Holdings designated as “Not Rated” (if any) are not rated by the national ratings agencies stated above. |
Eaton Vance
National Limited Maturity Municipal Income Fund
March 31, 2024
Endnotes and Additional Disclosures
| † | The views expressed in this report are those of the portfolio manager(s) and are current only through the date stated at the top of this page. These views are subject to change at any time based upon market or other conditions, and Eaton Vance and the Fund(s) disclaim any responsibility to update such views. These views may not be relied upon as investment advice and, because investment decisions are based on many factors, may not be relied upon as an indication of trading intent on behalf of any Eaton Vance fund. This commentary may contain statements that are not historical facts, referred to as “forward-looking statements.” The Fund’s actual future results may differ significantly from those stated in any forward-looking statement, depending on factors such as changes in securities or financial markets or general economic conditions, the volume of sales and purchases of Fund shares, the continuation of investment advisory, administrative and service contracts, and other risks discussed from time to time in the Fund’s filings with the Securities and Exchange Commission. |
| | |
| 1 | Bloomberg Short-Intermediate 1-10 Year Municipal Bond Index is an unmanaged index of municipal bonds traded in the U.S. with maturities ranging from 1-10 years. Unless otherwise stated, index returns do not reflect the effect of any applicable sales charges, commissions, expenses, taxes or leverage, as applicable. It is not possible to invest directly in an index. |
| 2 | Total Returns at NAV do not include applicable sales charges. If sales charges were deducted, the returns would be lower. Total Returns shown with maximum sales charge reflect the stated maximum sales charge. Unless otherwise stated, performance does not reflect the deduction of taxes on Fund distributions or redemptions of Fund shares.Effective November 5, 2020, Class C shares automatically convert to Class A shares eight years after purchase. The average annual total returns listed for Class C reflect conversion to Class A shares after eight years. Prior to November 5, 2020, Class C shares automatically converted to Class A shares ten years after purchase. |
| 3 | Source: Fund prospectus. The expense ratios for the current reporting period can be found in the Financial Highlights section of this report. Performance reflects expenses waived and/or reimbursed, if applicable. Without such waivers and/or reimbursements, performance would have been lower. |
| 4 | The Distribution Rate is based on the Fund’s last regular distribution per share in the period (annualized) divided by the Fund’s NAV at the end of the period. The Fund’s distributions may be comprised of amounts characterized for federal income tax purposes as tax-exempt income, qualified and non-qualified ordinary dividends, capital gains and nondividend distributions, also known as return of capital. The Fund will determine the federal income tax character of distributions paid to a shareholder after the end of the calendar year. This is reported on the IRS form 1099-DIV and provided to the shareholder shortly after each year-end. The Fund’s distributions are determined by the investment adviser based on its current assessment of the Fund’s long-term return potential. As portfolio and market conditions change, the rate of distributions paid by the Fund could change. Taxable-equivalent performance is based on the highest combined federal and state income tax rates, where applicable. Lower tax rates would result in lower tax-equivalent performance. Actual tax rates will |
| | vary depending on your income, exemptions and deductions. Rates do not include local taxes. The SEC Yield is a standardized measure based on the estimated yield to maturity of a fund’s investments over a 30-day period and is based on the maximum offer price at the date specified. The SEC Yield is not based on the distributions made by the Fund, which may differ. |
| | Fund profile subject to change due to active management. |
| | Additional Information |
| | Yield curve is a graphical representation of the yields offered by bonds of various maturities. The yield curve flattens when long-term interest rates fall and/or short-term interest rates increase, and the yield curve steepens when long-term interest rates increase and/or short-term interest rates fall. |
| | Bloomberg Municipal Bond Index is an unmanaged index of municipal bonds traded in the U.S. Unless otherwise stated, index returns do not reflect the effect of any applicable sales charges, commissions, expenses, taxes or leverage, as applicable. It is not possible to invest directly in an index. |
Eaton Vance
National Limited Maturity Municipal Income Fund
March 31, 2024
Example
As a Fund shareholder, you incur two types of costs: (1) transaction costs, including sales charges (loads) on purchases; and (2) ongoing costs, including management fees; distribution and/or service fees; and other Fund expenses. This Example is intended to help you understand your ongoing costs (in dollars) of Fund investing and to compare these costs with the ongoing costs of investing in other mutual funds. The Example is based on an investment of $1,000 invested at the beginning of the period and held for the entire period (October 1, 2023 to March 31, 2024).
Actual Expenses
The first section of the table below provides information about actual account values and actual expenses. You may use the information in this section, together with the amount you invested, to estimate the expenses that you paid over the period. Simply divide your account value by $1,000 (for example, an $8,600 account value divided by $1,000 = 8.6), then multiply the result by the number in the first section under the heading entitled “Expenses Paid During Period” to estimate the expenses you paid on your account during this period.
Hypothetical Example for Comparison Purposes
The second section of the table below provides information about hypothetical account values and hypothetical expenses based on the actual Fund expense ratio and an assumed rate of return of 5% per year (before expenses), which is not the actual Fund return. The hypothetical account values and expenses may not be used to estimate the actual ending account balance or expenses you paid for the period. You may use this information to compare the ongoing costs of investing in your Fund and other funds. To do so, compare this 5% hypothetical example with the 5% hypothetical examples that appear in the shareholder reports of the other funds.
Please note that the expenses shown in the table are meant to highlight your ongoing costs only and do not reflect any transactional costs, such as sales charges (loads). Therefore, the second section of the table is useful in comparing ongoing costs only, and will not help you determine the relative total costs of owning different funds. In addition, if these transactional costs were included, your costs would be higher.
| | Beginning
Account Value
(10/1/23) | Ending
Account Value
(3/31/24) | Expenses Paid
During Period*
(10/1/23 – 3/31/24) | Annualized
Expense
Ratio |
| Actual | | | | |
| Class A | $1,000.00 | $1,041.90 | $3.52 | 0.69% |
| Class C | $1,000.00 | $1,037.30 | $7.33 | 1.44% |
| Class I | $1,000.00 | $1,041.50 | $2.76 | 0.54% |
| |
| Hypothetical | | | | |
| (5% return per year before expenses) | | | | |
| Class A | $1,000.00 | $1,021.55 | $3.49 | 0.69% |
| Class C | $1,000.00 | $1,017.80 | $7.26 | 1.44% |
| Class I | $1,000.00 | $1,022.30 | $2.73 | 0.54% |
| * | Expenses are equal to the Fund’s annualized expense ratio for the indicated Class, multiplied by the average account value over the period, multiplied by 183/366 (to reflect the one-half year period). The Example assumes that the $1,000 was invested at the net asset value per share determined at the close of business on September 30, 2023. |
Eaton Vance
National Limited Maturity Municipal Income Fund
March 31, 2024
| Security | Principal
Amount
(000's omitted) | Value |
| Education — 1.5% |
| Chapman University, 1.76%, 4/1/28 | $ | 3,070 | $ 2,677,111 |
| Grand Canyon University, 4.125%, 10/1/24 | | 4,750 | 4,628,685 |
| | | | $ 7,305,796 |
| Hospital — 0.9% |
| CommonSpirit Health, 6.073%, 11/1/27 | $ | 3,500 | $ 3,563,551 |
| Little Co. of Mary Hospital of Indiana, Inc.: | | | |
| 1.581%, 11/1/24 | | 360 | 350,523 |
| 1.973%, 11/1/25 | | 325 | 307,254 |
| | | | $ 4,221,328 |
Total Corporate Bonds
(identified cost $11,791,250) | | | $ 11,527,124 |
| Tax-Exempt Municipal Obligations — 89.9% |
| Security | Principal
Amount
(000's omitted) | Value |
| Bond Bank — 1.9% |
| Connecticut, (Revolving Fund), Green Bonds, 5.00%, 5/1/37 | $ | 3,000 | $ 3,155,850 |
| Massachusetts Water Pollution Abatement Trust, 5.00%, 8/1/25 | | 3,000 | 3,071,760 |
| Minnesota Rural Water Finance Authority, Inc., 4.375%, 4/1/25 | | 3,000 | 3,002,550 |
| | | | $ 9,230,160 |
| Education — 6.3% |
| Allegheny County Higher Education Building Authority, PA, (Carnegie Mellon University), 4.007%, (70% of SOFR + 0.29%), 8/1/27 (Put Date), 2/1/33(1) | $ | 2,000 | $ 1,971,720 |
| Colorado State University, 4.375% to 3/1/29 (Put Date), 3/1/48 | | 2,750 | 2,891,157 |
| Curators of the University of Missouri, 4.00%, 11/1/33 | | 3,000 | 2,977,110 |
| Massachusetts Development Finance Agency, (Boston College), 5.00%, 7/1/38 | | 2,500 | 2,499,025 |
| Massachusetts Development Finance Agency, (Harvard University), 4.00%, 7/15/36 | | 3,175 | 3,222,276 |
| Massachusetts Development Finance Agency, (Northeastern University), 5.00%, 3/1/39 | | 3,925 | 3,925,078 |
| New York Dormitory Authority, (School Districts Revenue Bond Financing Program): | | | |
| 5.00%, 10/1/28 | | 1,860 | 1,940,371 |
| Security | Principal
Amount
(000's omitted) | Value |
| Education (continued) |
| New York Dormitory Authority, (School Districts Revenue Bond Financing Program): (continued) | | | |
| 5.00%, 10/1/29 | $ | 3,000 | $ 3,138,090 |
| 5.00%, 10/1/30 | | 2,000 | 2,089,600 |
| University of North Carolina at Chapel Hill, 4.208%, (67% of SOFR + 0.65%), 6/1/25 (Put Date), 12/1/41(1) | | 6,300 | 6,304,977 |
| | | | $ 30,959,404 |
| Electric Utilities — 4.2% |
| Arkansas River Power Authority, CO, 5.00%, 10/1/30 | $ | 1,000 | $ 1,037,390 |
| Halifax County Industrial Development Authority, VA, (Virginia Electric and Power Co.), 1.65% to 5/31/24 (Put Date), 12/1/41 | | 3,335 | 3,316,657 |
| Hawaii Department of Budget and Finance, (Hawaiian Electric Co., Inc.), (AMT), 3.25%, 1/1/25 | | 3,000 | 2,599,740 |
| Long Island Power Authority, NY, Electric System Revenue, 5.00% to 9/1/27 (Put Date), 9/1/52 | | 3,000 | 3,146,460 |
| Mesa, AZ, Utility Systems Revenue, 4.00%, 7/1/37 | | 5,000 | 5,002,800 |
| Monroe County Development Authority, GA, (Georgia Power Co. Plant Scherer), 1.00% to 8/21/26 (Put Date), 7/1/49 | | 1,000 | 908,510 |
| Salt River Project Agricultural Improvement and Power District, AZ, 4.00%, 12/1/34 | | 3,250 | 3,267,843 |
| Utility Debt Securitization Authority, NY, 5.00%, 12/15/35 | | 1,365 | 1,416,556 |
| | | | $ 20,695,956 |
| Escrowed/Prerefunded — 1.2% |
| New Hope Cultural Education Facilities Finance Corp., TX, (CHF-Collegiate Housing Corpus Christi II, LLC - Texas A&M University): | | | |
| Escrowed to Maturity, 4.00%, 4/1/25 | $ | 360 | $ 361,807 |
| Escrowed to Maturity, 4.00%, 4/1/26 | | 375 | 380,576 |
| New Jersey Economic Development Authority, (School Facilities Construction), Prerefunded to 6/15/24, 4.00%, 6/15/28 | | 5,000 | 5,001,200 |
| | | | $ 5,743,583 |
| General Obligations — 14.2% |
| Bergen County Improvement Authority, NJ, (County Administration Complex), 5.00%, 11/15/24 | $ | 1,100 | $ 1,110,461 |
| Bristol, VA, 5.00%, 9/1/27 | | 1,920 | 1,962,682 |
| Chicago Board of Education, IL: | | | |
| 5.00%, 12/1/26 | | 2,000 | 2,057,320 |
| 5.00%, 12/1/30 | | 2,690 | 2,773,740 |
| 5.25%, 12/1/36 | | 1,000 | 1,098,860 |
| Chicago, IL, 5.50%, 1/1/34 | | 1,000 | 1,010,570 |
| Connecticut, 4.00%, 6/15/34 | | 5,000 | 5,011,500 |
7
See Notes to Financial Statements.
Eaton Vance
National Limited Maturity Municipal Income Fund
March 31, 2024
Portfolio of Investments — continued
| Security | Principal
Amount
(000's omitted) | Value |
| General Obligations (continued) |
| Cypress-Fairbanks Independent School District, TX, (PSF Guaranteed), 5.00%, 2/15/27 | $ | 2,000 | $ 2,115,380 |
| Detroit, MI, 5.00%, 4/1/25 | | 150 | 151,258 |
| Fairfield-Suisun Unified School District, CA, 0.00%, 2/1/29(2) | | 2,000 | 1,709,514 |
| Fort Bend Independent School District, TX, (PSF Guaranteed), 2.375% to 8/1/24 (Put Date), 8/1/49 | | 3,920 | 3,894,167 |
| Grand Prairie Independent School District, TX, (PSF Guaranteed), 4.00%, 2/15/35 | | 3,200 | 3,214,176 |
| Gwinnett County School District, GA: | | | |
| 4.00%, 2/1/33 | | 5,000 | 5,042,900 |
| 5.00%, 2/1/26 | | 2,220 | 2,252,989 |
| Illinois: | | | |
| 5.00%, 2/1/25 | | 4,000 | 4,047,880 |
| 5.00%, 3/1/25 | | 3,250 | 3,293,680 |
| 5.00%, 11/1/26 | | 5,000 | 5,215,600 |
| 5.50%, 5/1/30 | | 500 | 547,425 |
| Lubbock, TX, Waterworks System, 4.00%, 2/15/34 | | 6,625 | 6,636,594 |
| Millcreek Township School District, PA, 5.00%, 9/15/25 | | 500 | 500,545 |
| New Jersey, 2.00%, 6/1/27 | | 4,000 | 3,770,800 |
| New York, NY, 5.00%, 3/1/30 | | 5,000 | 5,000,550 |
| Ocean City, NJ, 2.00%, 10/15/31 | | 745 | 655,153 |
| Puerto Rico: | | | |
| 5.625%, 7/1/27 | | 4,200 | 4,470,102 |
| 5.625%, 7/1/29 | | 2,000 | 2,190,940 |
| | | | $ 69,734,786 |
| Hospital — 7.7% |
| Allegheny County Hospital Development Authority, PA, (UPMC), 3.87%, (SIFMA + 0.42%), 11/15/24(1) | $ | 2,000 | $ 1,993,620 |
| Arizona Health Facilities Authority, (Banner Health), (LOC: Bank of America, N.A.), 4.40%, 1/1/46(3) | | 900 | 900,000 |
| Charlotte-Mecklenburg Hospital Authority, NC, (Atrium Health), 3.45% to 10/31/25 (Put Date), 1/15/48 | | 1,500 | 1,498,320 |
| Geisinger Authority, PA, (Geisinger Health System), 5.00% to 2/15/27 (Put Date), 4/1/43 | | 7,500 | 7,766,400 |
| Illinois Finance Authority, (Rush University Medical Center), 5.00%, 11/15/28 | | 4,000 | 4,063,480 |
| Indiana Finance Authority, (Franciscan Alliance, Inc.), 5.00%, 11/1/41 | | 2,065 | 2,093,043 |
| Jefferson County Civic Facility Development Corp., NY, (Samaritan Medical Center), 4.00%, 11/1/29 | | 410 | 393,908 |
| Maryland Health and Higher Educational Facilities Authority, (Frederick Health System): | | | |
| 5.00%, 7/1/24 | | 400 | 400,848 |
| 5.00%, 7/1/25 | | 475 | 482,619 |
| Security | Principal
Amount
(000's omitted) | Value |
| Hospital (continued) |
| Missouri Health and Educational Facilities Authority, (CoxHealth), 5.00%, 11/15/38 | $ | 3,340 | $ 3,341,971 |
| Missouri Health and Educational Facilities Authority, (Mercy Health), 5.00%, 6/1/30 | | 3,500 | 3,779,370 |
| Ohio, (Cleveland Clinic Health System), 4.00%, 1/1/36 | | 2,000 | 2,051,100 |
| Oregon Facilities Authority, (Providence Health and Services Group), 5.00%, 10/1/24 | | 1,000 | 1,000,230 |
| Oregon Health and Science University, 5.00%, 7/1/39 | | 550 | 564,074 |
| Tarrant County Cultural Education Facilities Finance Corp., TX, (Baylor Scott & White Healthcare), 5.00% to 5/15/26 (Put Date), 11/15/52 | | 2,000 | 2,058,120 |
| Washington Health Care Facilities Authority, (Seattle Children's Hospital), 5.00%, 10/1/38 | | 2,500 | 2,523,625 |
| Wisconsin Health and Educational Facilities Authority, (Ascension Health Credit Group), 5.00%, 11/15/39 | | 1,575 | 1,606,783 |
| Yuma Industrial Development Authority, AZ, (Yuma Regional Medical Center), 5.00%, 8/1/25 | | 1,230 | 1,234,895 |
| | | | $ 37,752,406 |
| Housing — 6.7% |
| Connecticut Housing Finance Authority, (Housing Mortgage Finance), 1.10%, 11/15/29 | $ | 1,680 | $ 1,401,221 |
| District of Columbia Housing Finance Agency, 3.00% to 9/1/26 (Put Date), 9/1/28 | | 2,350 | 2,291,297 |
| District of Columbia Housing Finance Agency, (Faircliff Plaza East Apartments), 5.00% to 12/1/25 (Put Date), 12/1/26 | | 2,775 | 2,815,931 |
| EP Tuscany Zaragosa PFC, TX, (Tuscany at Mesa Hills and Villas at Zaragosa), 4.00%, 12/1/33 | | 5,000 | 4,874,550 |
| Massachusetts Housing Finance Agency, Sustainability Bonds, 4.00%, 12/1/25 | | 2,500 | 2,512,400 |
| Michigan Housing Development Authority, 3.75%, 4/1/27 | | 2,250 | 2,250,090 |
| Missouri Housing Development Commission, SFMR: | | | |
| (FHLMC), (FNMA), (GNMA), 3.30%, 12/1/47 | | 1,151 | 1,062,666 |
| (FHLMC), (FNMA), (GNMA), 3.40%, 11/1/46 | | 2,243 | 2,098,687 |
| New York City Housing Development Corp., NY: | | | |
| Green Bonds, (SPA: TD Bank, N.A.), 3.42%, 5/1/63(4) | | 1,950 | 1,950,000 |
| Sustainability Bonds, 0.90% to 1/1/26 (Put Date), 11/1/60 | | 3,000 | 2,812,650 |
| Sustainable Development Bonds, 3.40% to 12/22/26 (Put Date), 11/1/62 | | 2,000 | 1,978,700 |
| Seattle Housing Authority, WA, (Juniper Apartments), 5.00%, 6/1/27 | | 2,800 | 2,884,392 |
| Texas Student Housing Corp., (University of North Texas), 9.375%, 7/1/06(5) | | 95 | 95,000 |
| Virginia Housing Development Authority, 4.10%, 10/1/27 | | 4,000 | 4,011,760 |
| | | | $ 33,039,344 |
8
See Notes to Financial Statements.
Eaton Vance
National Limited Maturity Municipal Income Fund
March 31, 2024
Portfolio of Investments — continued
| Security | Principal
Amount
(000's omitted) | Value |
| Industrial Development Revenue — 6.0% |
| Allegheny County Industrial Development Authority, PA, (United States Steel Corp.), 4.875%, 11/1/24 | $ | 2,500 | $ 2,505,075 |
| California Municipal Finance Authority, (Waste Management, Inc.), (AMT), 4.25% to 12/2/24 (Put Date), 12/1/44 | | 3,000 | 3,007,680 |
| Maine Finance Authority, (Casella Waste Systems, Inc.), (AMT), 5.125% to 8/1/25 (Put Date), 8/1/35(6) | | 1,880 | 1,888,610 |
| Monroe County Development Authority, GA, (Georgia Power Co. Plant Scherer), 3.875% to 3/6/26 (Put Date), 10/1/48 | | 1,000 | 1,007,060 |
| Montgomery County Industrial Development Authority, PA, (Constellation Energy Generation, LLC), 4.10% to 4/3/28 (Put Date), 4/1/53 | | 2,000 | 2,054,240 |
| New Hampshire Business Finance Authority, (Casella Waste Systems, Inc.), 2.95%, 4/1/29(6) | | 860 | 796,197 |
| New York State Environmental Facilities Corp., (Casella Waste Systems, Inc.), (AMT), 2.875% to 12/3/29 (Put Date), 12/1/44(6) | | 435 | 397,294 |
| New York Transportation Development Corp., (Delta Air Lines, Inc. - LaGuardia Airport Terminals C&D Redevelopment), (AMT), 6.00%, 4/1/35 | | 1,705 | 1,936,880 |
| North Carolina Capital Facilities Finance Agency, (Republic Services, Inc.), 3.80%, 7/1/34(7) | | 3,000 | 3,000,000 |
| Oregon Business Development Commission, (Intel Corp.), 3.80% to 6/15/28 (Put Date), 12/1/40 | | 2,000 | 2,025,720 |
| Public Finance Authority, WI, (Waste Management, Inc.), (AMT), 2.625%, 11/1/25 | | 1,000 | 978,820 |
| West Virginia Economic Development Authority, (Appalachian Power Co.), 3.75% to 6/1/25 (Put Date), 12/1/42 | | 4,500 | 4,498,830 |
| Whiting, IN, (BP Products North America, Inc.), (AMT), 5.00% to 6/5/26 (Put Date), 12/1/44 | | 5,000 | 5,108,100 |
| | | | $ 29,204,506 |
| Insured - Electric Utilities — 0.1% |
| Puerto Rico Electric Power Authority: | | | |
| (NPFG), 5.00%, 7/1/24 | $ | 115 | $ 115,023 |
| (NPFG), 5.00%, 7/1/25 | | 300 | 298,962 |
| | | | $ 413,985 |
| Insured - General Obligations — 0.1% |
| Atlantic City, NJ, (BAM), 5.00%, 3/1/26 | $ | 250 | $ 257,503 |
| | | | $ 257,503 |
| Security | Principal
Amount
(000's omitted) | Value |
| Insured - Hospital — 0.1% |
| Allegheny County Hospital Development Authority, PA, (UPMC Health System), (NPFG), 6.00%, 7/1/24 | $ | 250 | $ 251,235 |
| | | | $ 251,235 |
| Insured - Special Tax Revenue — 0.4% |
| Garden State Preservation Trust, NJ, (AGM), 5.75%, 11/1/28 | $ | 1,000 | $ 1,066,630 |
| Illinois Sports Facilities Authority, (AMBAC), 0.00%, 6/15/25 | | 1,140 | 1,082,510 |
| | | | $ 2,149,140 |
| Insured - Transportation — 1.1% |
| Allegheny County Airport Authority, PA, (Pittsburgh International Airport): | | | |
| (AGM), (AMT), 5.00%, 1/1/27 | $ | 815 | $ 847,070 |
| (AGM), (AMT), 5.00%, 1/1/28 | | 1,000 | 1,057,700 |
| Chicago, IL, (Midway International Airport), (BAM), (AMT), 5.00%, 1/1/28 | | 3,250 | 3,437,525 |
| | | | $ 5,342,295 |
| Lease Revenue/Certificates of Participation — 3.0% |
| Avon Community School Building Corp., IN: | | | |
| 5.00%, 1/15/30 | $ | 500 | $ 555,940 |
| 5.00%, 7/15/30 | | 500 | 560,780 |
| California Public Works Board, 5.00%, 9/1/25 | | 4,040 | 4,147,827 |
| New Jersey Economic Development Authority, (Portal N Bridge Project), 5.00%, 11/1/25 | | 600 | 615,078 |
| New Jersey Economic Development Authority, (State House), 4.00%, 6/15/29 | | 3,340 | 3,448,450 |
| New Jersey Transportation Trust Fund Authority, (Transportation Program): | | | |
| 5.00%, 6/15/26 | | 1,000 | 1,037,170 |
| 5.00%, 6/15/27 | | 1,000 | 1,058,020 |
| 5.00%, 6/15/33 | | 2,500 | 2,915,700 |
| Will and Kankakee Counties Community Unit School District No. 255-U, IL, 5.00%, 6/1/24 | | 590 | 590,791 |
| | | | $ 14,929,756 |
| Other Revenue — 7.1% |
| Black Belt Energy Gas District, AL: | | | |
| 3.82%, (SIFMA + 0.37%), 10/1/26 (Put Date), 10/1/49(1) | $ | 5,000 | $ 4,854,500 |
| 5.25% to 10/1/30 (Put Date), 1/1/54 | | 3,500 | 3,754,870 |
| 5.50% to 2/1/29 (Put Date), 6/1/49 | | 2,000 | 2,132,420 |
| California Community Choice Financing Authority, Clean Energy Project Revenue, Green Bonds, 5.50% to 11/1/30 (Put Date), 10/1/54 | | 4,970 | 5,482,457 |
9
See Notes to Financial Statements.
Eaton Vance
National Limited Maturity Municipal Income Fund
March 31, 2024
Portfolio of Investments — continued
| Security | Principal
Amount
(000's omitted) | Value |
| Other Revenue (continued) |
| Central Falls Detention Facility Corp., RI, 7.25%, 7/15/35(5) | $ | 1,200 | $ 480,000 |
| Kalispel Tribe of Indians, WA, Series A, 5.00%, 1/1/32(6) | | 1,025 | 1,059,686 |
| Main Street Natural Gas, Inc., GA, Gas Supply Revenue: | | | |
| 5.00% to 9/1/30 (Put Date), 9/1/53 | | 2,500 | 2,657,025 |
| 5.00% to 12/1/30 (Put Date), 5/1/54 | | 1,800 | 1,892,700 |
| 5.00% to 6/1/31 (Put Date), 12/1/53 | | 2,500 | 2,672,000 |
| Minnesota Municipal Gas Agency, (Liq: Royal Bank of Canada), 4.558%, (67% of SOFR + 1.00%), 12/1/52(1) | | 7,500 | 7,456,050 |
| Northern California Energy Authority, 5.00% to 8/1/30 (Put Date), 12/1/54(2) | | 960 | 1,026,912 |
| Riversouth Authority, OH, (Lazarus Building Redevelopment), 5.75%, 12/1/27 | | 145 | 145,020 |
| Texas Municipal Gas Acquisition and Supply Corp. II, Gas Supply Revenue, 4.38%, (66% of 3 mo. SOFR + 0.86%), 9/15/27(1) | | 1,280 | 1,274,765 |
| | | | $ 34,888,405 |
| Senior Living/Life Care — 2.0% |
| California Public Finance Authority, (Enso Village), Green Bonds, 2.125%, 11/15/27(6) | $ | 35 | $ 35,002 |
| Illinois Finance Authority, (Presbyterian Homes Obligated Group), 4.15%, (SIFMA + 0.70%), 5/1/26 (Put Date), 5/1/42(1) | | 435 | 427,013 |
| Missouri Health and Educational Facilities Authority, (Bethesda Health Group, Inc.), 5.00%, 8/1/24 | | 480 | 479,069 |
| New Hope Cultural Education Facilities Finance Corp., TX, (Longhorn Village): | | | |
| 4.25%, 1/1/33 | | 2,105 | 1,954,514 |
| 5.00%, 1/1/30 | | 1,265 | 1,259,902 |
| New Hope Cultural Education Facilities Finance Corp., TX, (The Outlook at Windhaven): | | | |
| 4.25%, 10/1/26 | | 2,000 | 1,989,700 |
| 4.50%, 10/1/26 | | 2,000 | 1,989,740 |
| Public Finance Authority, WI, (SearStone CCRC), 2.25%, 6/1/27(6) | | 1,500 | 1,425,240 |
| Tempe Industrial Development Authority, AZ, (Friendship Village of Tempe), 4.00%, 12/1/28 | | 220 | 216,132 |
| | | | $ 9,776,312 |
| Special Tax Revenue — 8.6% |
| Baltimore, MD, (Harbor Point), 3.15%, 6/1/29(6) | $ | 200 | $ 186,050 |
| Bullhead, AZ, Excise Taxes Revenue: | | | |
| 0.95%, 7/1/26 | | 350 | 325,122 |
| 1.15%, 7/1/27 | | 750 | 685,763 |
| Security | Principal
Amount
(000's omitted) | Value |
| Special Tax Revenue (continued) |
| Connecticut, Special Tax Obligation, (Transportation Infrastructure), 4.00%, 8/1/35 | $ | 5,720 | $ 5,729,896 |
| Massachusetts School Building Authority, 5.00%, 8/15/37 | | 3,170 | 3,232,227 |
| Metropolitan Pier and Exposition Authority, IL, (McCormick Place Expansion), 5.00%, 12/15/27 | | 1,000 | 1,020,850 |
| Metropolitan Transportation Authority, TN, 5.25%, 11/15/36 | | 5,500 | 5,758,610 |
| Michigan Finance Authority, Detroit Financial Recovery Income Tax Revenue, 4.00%, 10/1/24 | | 2,500 | 2,497,325 |
| New River Community Development District, FL, (Capital Improvements): | | | |
| 5.00%, 5/1/13(5) | | 280 | 0 |
| 5.75%, 5/1/38 | | 295 | 297,239 |
| New York City Transitional Finance Authority, NY, Future Tax Revenue, 4.00%, 2/1/36 | | 5,000 | 5,044,950 |
| Pennsylvania Turnpike Commission, Oil Franchise Tax Revenue, 5.00%, 12/1/25 | | 6,350 | 6,356,921 |
| Puerto Rico Sales Tax Financing Corp.: | | | |
| 0.00%, 7/1/33 | | 4,500 | 3,122,820 |
| 4.50%, 7/1/34 | | 3,585 | 3,605,506 |
| Sterling Hill Community Development District, FL, (Capital Improvements), 5.50%, 11/1/10(5) | | 276 | 129,520 |
| Triborough Bridge and Tunnel Authority, NY, Green Bonds, 5.00%, 11/15/32 | | 3,600 | 4,216,680 |
| | | | $ 42,209,479 |
| Student Loan — 1.1% |
| Iowa Student Loan Liquidity Corp., (AMT), 5.00%, 12/1/29 | $ | 1,575 | $ 1,671,736 |
| Massachusetts Educational Financing Authority: | | | |
| (AMT), 3.50%, 7/1/33 | | 2,520 | 2,418,368 |
| (AMT), 3.625%, 7/1/38 | | 1,305 | 1,214,055 |
| | | | $ 5,304,159 |
| Transportation — 15.4% |
| Denver City and County, CO, Airport System Revenue: | | | |
| (AMT), 5.00%, 11/15/24 | $ | 2,000 | $ 2,014,620 |
| (AMT), 5.00%, 11/15/28 | | 4,920 | 5,299,873 |
| (AMT), 5.25%, 11/15/26 | | 1,000 | 1,045,260 |
| (AMT), 5.25%, 11/15/27 | | 1,100 | 1,173,260 |
| Allegheny County Airport Authority, PA, (AMT), 5.00%, 1/1/28 | | 1,005 | 1,055,753 |
| Bay Area Toll Authority, CA, (San Francisco Bay Area), 3.75%, (SIFMA + 0.30%), 4/1/56(1) | | 5,000 | 4,897,600 |
| Broward County, FL, Airport System Revenue: | | | |
| (AMT), 5.00%, 10/1/29 | | 2,000 | 2,031,540 |
| (AMT), 5.00%, 10/1/30 | | 2,480 | 2,520,325 |
10
See Notes to Financial Statements.
Eaton Vance
National Limited Maturity Municipal Income Fund
March 31, 2024
Portfolio of Investments — continued
| Security | Principal
Amount
(000's omitted) | Value |
| Transportation (continued) |
| Greater Orlando Aviation Authority, FL, (AMT), 5.00%, 10/1/27 | $ | 2,550 | $ 2,692,316 |
| Los Angeles Department of Airports, CA, (Los Angeles International Airport), (AMT), 5.00%, 5/15/30 | | 5,000 | 5,266,250 |
| Massachusetts Port Authority, (AMT), 5.00%, 7/1/34 | | 3,000 | 3,008,040 |
| Metropolitan Nashville Airport Authority, TN, (AMT), 5.00%, 7/1/28 | | 1,000 | 1,063,620 |
| Metropolitan Washington Airports Authority, D.C.: | | | |
| (AMT), 5.00%, 10/1/28 | | 2,265 | 2,434,671 |
| (AMT), 5.00%, 10/1/29 | | 2,000 | 2,099,600 |
| (AMT), 5.00%, 10/1/32 | | 6,360 | 6,573,696 |
| North Texas Tollway Authority, 5.00%, 1/1/27 | | 4,000 | 4,208,880 |
| Pennsylvania Turnpike Commission: | | | |
| 5.00%, 12/1/39 | | 2,850 | 3,081,676 |
| (LOC: TD Bank, N.A.), 3.42%, 12/1/39(4) | | 900 | 900,000 |
| Philadelphia, PA, Airport Revenue: | | | |
| (AMT), 5.00%, 6/15/28 | | 2,630 | 2,662,533 |
| (AMT), 5.00%, 7/1/28 | | 4,800 | 5,082,000 |
| Port Authority of New York and New Jersey, (AMT), 5.00%, 11/15/32 | | 1,500 | 1,536,420 |
| Port of Portland, OR, (Portland International Airport), (AMT), 5.00%, 7/1/34 | | 1,000 | 1,002,310 |
| Port of Seattle, WA: | | | |
| (AMT), 5.00%, 5/1/33 | | 2,000 | 2,058,700 |
| (AMT), 5.00%, 4/1/40 | | 5,000 | 4,964,200 |
| Salt Lake City, UT, (Salt Lake City International Airport): | | | |
| (AMT), 5.00%, 7/1/31 | | 2,460 | 2,604,033 |
| (AMT), 5.00%, 7/1/32 | | 3,500 | 3,654,140 |
| South Jersey Transportation Authority, NJ, 5.00%, 11/1/24 | | 395 | 396,671 |
| | | | $ 75,327,987 |
| Water and Sewer — 2.7% |
| Miami-Dade County, FL, Water and Sewer System Revenue, 4.00%, 10/1/37 | $ | 2,705 | $ 2,723,908 |
| New York City Municipal Water Finance Authority, NY, (Water and Sewer System), 5.00%, 6/15/35 | | 3,050 | 3,130,855 |
| San Antonio, TX, Water System Revenue, 4.00%, 5/15/36 | | 4,135 | 4,138,143 |
| Tacoma, WA, Sewer Revenue, 4.00%, 12/1/33 | | 3,220 | 3,238,418 |
| | | | $ 13,231,324 |
Total Tax-Exempt Municipal Obligations
(identified cost $437,128,204) | | | $440,441,725 |
| Taxable Municipal Obligations — 7.1% |
| Security | Principal
Amount
(000's omitted) | Value |
| Education — 1.5% |
| University of California, 5.35%, 7/1/41(4) | $ | 7,305 | $ 7,305,000 |
| | | | $ 7,305,000 |
| Escrowed/Prerefunded — 0.3% |
| San Diego County Regional Transportation Commission, CA, Escrowed to Maturity, 2.085%, 4/1/25 | $ | 1,500 | $ 1,456,110 |
| | | | $ 1,456,110 |
| General Obligations — 1.7% |
| Beverly Hills Unified School District, CA, 2.06%, 8/1/25 | $ | 1,135 | $ 1,093,561 |
| California, 7.50%, 4/1/34(8) | | 2,500 | 2,942,875 |
| Connecticut, 2.40%, 8/15/24 | | 2,725 | 2,695,543 |
| Detroit, MI, Social Bonds, 2.711%, 4/1/26 | | 700 | 659,981 |
| Homewood, AL, 2.00%, 9/1/26 | | 625 | 587,525 |
| Nashua, NH, 1.40%, 1/15/33 | | 375 | 283,909 |
| | | | $ 8,263,394 |
| Hospital — 0.2% |
| Jefferson County Civic Facility Development Corp., NY, (Samaritan Medical Center), 4.25%, 11/1/28 | $ | 1,025 | $ 968,276 |
| | | | $ 968,276 |
| Housing — 0.9% |
| New York Housing Finance Agency, Social Bonds, (SPA: TD Bank, N.A.), 5.35%, 11/1/55(4) | $ | 4,620 | $ 4,620,000 |
| | | | $ 4,620,000 |
| Insured - General Obligations — 0.1% |
| Valley View School District, PA, (BAM), 1.55%, 5/15/24 | $ | 250 | $ 248,673 |
| Westland, MI, (BAM), 1.734%, 11/1/31 | | 400 | 319,244 |
| | | | $ 567,917 |
| Insured - Transportation — 0.4% |
| Miami-Dade County, FL, Seaport Revenue, (AGM), 1.349%, 10/1/26 | $ | 2,035 | $ 1,867,072 |
| | | | $ 1,867,072 |
| Senior Living/Life Care — 0.9% |
| Butler County Port Authority, OH, (Community First Solutions), 2.25%, 5/15/26 | $ | 145 | $ 140,172 |
11
See Notes to Financial Statements.
Eaton Vance
National Limited Maturity Municipal Income Fund
March 31, 2024
Portfolio of Investments — continued
| Security | Principal
Amount
(000's omitted) | Value |
| Senior Living/Life Care (continued) |
| Indiana Finance Authority, (BHI Senior Living), 2.45%, 11/15/25 | $ | 355 | $ 335,826 |
| Montgomery County Industrial Development Authority, PA, (ACTS Retirement-Life Communities, Inc. Obligated Group), 2.60%, 11/15/24 | | 4,000 | 3,920,880 |
| | | | $ 4,396,878 |
| Special Tax Revenue — 0.7% |
| American Samoa Economic Development Authority, 2.47%, 9/1/24(6) | $ | 250 | $ 245,897 |
| Massachusetts School Building Authority, Social Bonds, 1.753%, 8/15/30 | | 3,500 | 3,023,090 |
| | | | $ 3,268,987 |
| Student Loan — 0.1% |
| Rhode Island Student Loan Authority, 2.373%, 12/1/28 | $ | 400 | $ 358,940 |
| | | | $ 358,940 |
| Water and Sewer — 0.3% |
| Metropolitan Water District of Southern California, (SPA: TD Bank, N.A.), 5.33%, 7/1/37(4) | $ | 1,650 | $ 1,650,000 |
| | | | $ 1,650,000 |
Total Taxable Municipal Obligations
(identified cost $35,287,312) | | | $ 34,722,574 |
Total Investments — 99.4%
(identified cost $484,206,766) | | | $486,691,423 |
| Other Assets, Less Liabilities — 0.6% | | | $ 2,951,654 |
| Net Assets — 100.0% | | | $489,643,077 |
| The percentage shown for each investment category in the Portfolio of Investments is based on net assets. |
| (1) | Floating rate security. The stated interest rate represents the rate in effect at March 31, 2024. |
| (2) | When-issued security. |
| (3) | Variable rate demand obligation that may be tendered at par on any day for payment the same or next business day. The stated interest rate, which generally resets daily, is determined by the remarketing agent and represents the rate in effect at March 31, 2024. |
| (4) | Variable rate demand obligation that may be tendered at par on any day for payment the lesser of 5 business days or 7 calendar days. The stated interest rate, which generally resets weekly, is determined by the remarketing agent and represents the rate in effect at March 31, 2024. |
| (5) | Defaulted security. Issuer has defaulted on the payment of interest and/or principal or has filed bankruptcy. |
| (6) | Security exempt from registration under Rule 144A of the Securities Act of 1933, as amended. These securities may be sold in certain transactions in reliance on an exemption from registration (normally to qualified institutional buyers). At March 31, 2024, the aggregate value of these securities is $6,033,976 or 1.2% of the Fund's net assets. |
| (7) | Variable rate security that may be tendered at par quarterly. The stated interest rate, which resets quarterly, is determined by the remarketing agent and represents the rate in effect at March 31, 2024. |
| (8) | Build America Bond. Represents taxable municipal obligation issued pursuant to the American Recovery and Reinvestment Act of 2009 or other legislation providing for the issuance of taxable municipal debt on which the issuer receives federal support. |
| At March 31, 2024, the concentration of the Fund’s investments in the various states and territories, determined as a percentage of net assets, is as follows: |
| New York | 10.5% |
| Others, representing less than 10% individually | 86.5% |
| The Fund invests primarily in debt securities issued by municipalities. The ability of the issuers of the debt securities to meet their obligations may be affected by economic developments in a specific industry or municipality. At March 31, 2024, 2.2% of total investments are backed by bond insurance of various financial institutions and financial guaranty assurance agencies. The aggregate percentage insured by an individual financial institution or financial guaranty assurance agency ranged from 0.1% to 1.0% of total investments. |
| Abbreviations: |
| AGM | – Assured Guaranty Municipal Corp. |
| AMBAC | – AMBAC Financial Group, Inc. |
| AMT | – Interest earned from these securities may be considered a tax preference item for purposes of the Federal Alternative Minimum Tax. |
| BAM | – Build America Mutual Assurance Co. |
| FHLMC | – Federal Home Loan Mortgage Corp. |
| FNMA | – Federal National Mortgage Association |
| GNMA | – Government National Mortgage Association |
| Liq | – Liquidity Provider |
| LOC | – Letter of Credit |
| NPFG | – National Public Finance Guarantee Corp. |
| PSF | – Permanent School Fund |
| SFMR | – Single Family Mortgage Revenue |
| SIFMA | – Securities Industry and Financial Markets Association Municipal Swap Index |
| SOFR | – Secured Overnight Financing Rate |
| SPA | – Standby Bond Purchase Agreement |
12
See Notes to Financial Statements.
Eaton Vance
National Limited Maturity Municipal Income Fund
March 31, 2024
Statement of Assets and Liabilities
| | March 31, 2024 |
| Assets | |
| Investments, at value (identified cost $484,206,766) | $ 486,691,423 |
| Cash | 10,363 |
| Interest receivable | 6,332,535 |
| Receivable for investments sold | 1,388,556 |
| Receivable for Fund shares sold | 320,280 |
| Trustees' deferred compensation plan | 170,042 |
| Total assets | $494,913,199 |
| Liabilities | |
| Payable for when-issued securities | $ 3,304,635 |
| Payable for Fund shares redeemed | 957,482 |
| Distributions payable | 408,572 |
| Payable to affiliates: | |
| Investment adviser fee | 172,628 |
| Distribution and service fees | 28,493 |
| Trustees' deferred compensation plan | 170,042 |
| Accrued expenses | 228,270 |
| Total liabilities | $ 5,270,122 |
| Net Assets | $489,643,077 |
| Sources of Net Assets | |
| Paid-in capital | $ 518,326,092 |
| Accumulated loss | (28,683,015) |
| Net Assets | $489,643,077 |
| Class A Shares | |
| Net Assets | $ 165,427,271 |
| Shares Outstanding | 17,753,524 |
Net Asset Value and Redemption Price Per Share
(net assets ÷ shares of beneficial interest outstanding) | $ 9.32 |
Maximum Offering Price Per Share
(100 ÷ 96.75 of net asset value per share) | $ 9.63 |
| Class C Shares | |
| Net Assets | $ 9,664,849 |
| Shares Outstanding | 1,105,501 |
Net Asset Value and Offering Price Per Share*
(net assets ÷ shares of beneficial interest outstanding) | $ 8.74 |
| Class I Shares | |
| Net Assets | $ 314,550,957 |
| Shares Outstanding | 33,742,353 |
Net Asset Value, Offering Price and Redemption Price Per Share
(net assets ÷ shares of beneficial interest outstanding) | $ 9.32 |
| On sales of $100,000 or more, the offering price of Class A shares is reduced. |
| * | Redemption price per share is equal to the net asset value less any applicable contingent deferred sales charge. |
13
See Notes to Financial Statements.
Eaton Vance
National Limited Maturity Municipal Income Fund
March 31, 2024
| | Year Ended |
| | March 31, 2024 |
| Investment Income | |
| Interest income | $ 19,384,451 |
| Total investment income | $19,384,451 |
| Expenses | |
| Investment adviser fee | $ 2,094,859 |
| Distribution and service fees: | |
| Class A | 253,674 |
| Class C | 95,972 |
| Trustees’ fees and expenses | 32,676 |
| Custodian fee | 123,388 |
| Transfer and dividend disbursing agent fees | 162,476 |
| Legal and accounting services | 92,609 |
| Printing and postage | 22,109 |
| Registration fees | 82,067 |
| Miscellaneous | 79,965 |
| Total expenses | $ 3,039,795 |
| Net investment income | $16,344,656 |
| Realized and Unrealized Gain (Loss) | |
| Net realized gain (loss): | |
| Investment transactions | $ (2,017,434) |
| Net realized loss | $ (2,017,434) |
| Change in unrealized appreciation (depreciation): | |
| Investments | $ 989,868 |
| Net change in unrealized appreciation (depreciation) | $ 989,868 |
| Net realized and unrealized loss | $ (1,027,566) |
| Net increase in net assets from operations | $15,317,090 |
14
See Notes to Financial Statements.
Eaton Vance
National Limited Maturity Municipal Income Fund
March 31, 2024
Statements of Changes in Net Assets
| | Year Ended March 31, |
| | 2024 | 2023 |
| Increase (Decrease) in Net Assets | | |
| From operations: | | |
| Net investment income | $ 16,344,656 | $ 14,636,849 |
| Net realized loss | (2,017,434) | (17,308,388) |
| Net change in unrealized appreciation (depreciation) | 989,868 | 6,450,062 |
| Net increase in net assets from operations | $ 15,317,090 | $ 3,778,523 |
| Distributions to shareholders: | | |
| Class A | $ (5,240,692) | $ (4,740,968) |
| Class C | (249,786) | (207,941) |
| Class I | (10,628,208) | (9,896,740) |
| Total distributions to shareholders | $ (16,118,686) | $ (14,845,649) |
| Transactions in shares of beneficial interest: | | |
| Class A | $ (14,985,128) | $ (43,320,906) |
| Class C | (2,042,416) | (1,754,610) |
| Class I | (34,460,157) | (25,974,508) |
| Net decrease in net assets from Fund share transactions | $ (51,487,701) | $ (71,050,024) |
| Net decrease in net assets | $ (52,289,297) | $ (82,117,150) |
| Net Assets | | |
| At beginning of year | $ 541,932,374 | $ 624,049,524 |
| At end of year | $489,643,077 | $541,932,374 |
15
See Notes to Financial Statements.
Eaton Vance
National Limited Maturity Municipal Income Fund
March 31, 2024
| | Class A |
| | Year Ended March 31, |
| | 2024 | 2023 | 2022 | 2021 | 2020 |
| Net asset value — Beginning of year | $ 9.33 | $ 9.48 | $ 9.91 | $ 9.70 | $ 9.79 |
| Income (Loss) From Operations | | | | | |
| Net investment income(1) | $ 0.29 | $ 0.22 | $ 0.15 | $ 0.22 | $ 0.25 |
| Net realized and unrealized gain (loss) | (0.01) | (0.15) | (0.43) | 0.21 | (0.09) |
| Total income (loss) from operations | $ 0.28 | $ 0.07 | $ (0.28) | $ 0.43 | $ 0.16 |
| Less Distributions | | | | | |
| From net investment income | $ (0.29) | $ (0.22) | $ (0.15) | $ (0.22) | $ (0.25) |
| Total distributions | $ (0.29) | $ (0.22) | $ (0.15) | $ (0.22) | $ (0.25) |
| Net asset value — End of year | $ 9.32 | $ 9.33 | $ 9.48 | $ 9.91 | $ 9.70 |
| Total Return(2) | 3.04% | 0.77% | (2.89)% | 4.47% | 1.66% |
| Ratios/Supplemental Data | | | | | |
| Net assets, end of year (000’s omitted) | $165,427 | $180,721 | $227,994 | $223,318 | $180,506 |
| Ratios (as a percentage of average daily net assets): | | | | | |
| Total expenses | 0.68% | 0.66% | 0.61% | 0.65% | 0.66% |
| Net expenses | 0.68% | 0.66% | 0.61% | 0.65% | 0.66% |
| Net investment income | 3.14% | 2.31% | 1.50% | 2.18% | 2.55% |
| Portfolio Turnover | 80% | 110% | 70% | 81% | 40% |
| (1) | Computed using average shares outstanding. |
| (2) | Returns are historical and are calculated by determining the percentage change in net asset value with all distributions reinvested and do not reflect the effect of sales charges. |
16
See Notes to Financial Statements.
Eaton Vance
National Limited Maturity Municipal Income Fund
March 31, 2024
Financial Highlights — continued
| | Class C |
| | Year Ended March 31, |
| | 2024 | 2023 | 2022 | 2021 | 2020 |
| Net asset value — Beginning of year | $ 8.75 | $ 8.90 | $ 9.29 | $ 9.10 | $ 9.18 |
| Income (Loss) From Operations | | | | | |
| Net investment income(1) | $ 0.21 | $ 0.14 | $ 0.07 | $ 0.14 | $ 0.17 |
| Net realized and unrealized gain (loss) | (0.02) | (0.15) | (0.39) | 0.19 | (0.08) |
| Total income (loss) from operations | $ 0.19 | $ (0.01) | $ (0.32) | $ 0.33 | $ 0.09 |
| Less Distributions | | | | | |
| From net investment income | $ (0.20) | $ (0.14) | $ (0.07) | $ (0.14) | $ (0.17) |
| Total distributions | $ (0.20) | $ (0.14) | $ (0.07) | $ (0.14) | $ (0.17) |
| Net asset value — End of year | $ 8.74 | $ 8.75 | $ 8.90 | $ 9.29 | $ 9.10 |
| Total Return(2) | 2.26% | (0.08)% | (3.47)% | 3.61% | 0.95% |
| Ratios/Supplemental Data | | | | | |
| Net assets, end of year (000’s omitted) | $9,665 | $11,733 | $13,732 | $14,426 | $24,108 |
| Ratios (as a percentage of average daily net assets): | | | | | |
| Total expenses | 1.43% | 1.41% | 1.36% | 1.40% | 1.41% |
| Net expenses | 1.43% | 1.41% | 1.36% | 1.40% | 1.41% |
| Net investment income | 2.39% | 1.56% | 0.75% | 1.49% | 1.80% |
| Portfolio Turnover | 80% | 110% | 70% | 81% | 40% |
| (1) | Computed using average shares outstanding. |
| (2) | Returns are historical and are calculated by determining the percentage change in net asset value with all distributions reinvested and do not reflect the effect of sales charges. |
17
See Notes to Financial Statements.
Eaton Vance
National Limited Maturity Municipal Income Fund
March 31, 2024
Financial Highlights — continued
| | Class I |
| | Year Ended March 31, |
| | 2024 | 2023 | 2022 | 2021 | 2020 |
| Net asset value — Beginning of year | $ 9.33 | $ 9.49 | $ 9.91 | $ 9.70 | $ 9.79 |
| Income (Loss) From Operations | | | | | |
| Net investment income(1) | $ 0.30 | $ 0.23 | $ 0.16 | $ 0.23 | $ 0.27 |
| Net realized and unrealized gain (loss) | (0.01) | (0.16) | (0.42) | 0.22 | (0.09) |
| Total income (loss) from operations | $ 0.29 | $ 0.07 | $ (0.26) | $ 0.45 | $ 0.18 |
| Less Distributions | | | | | |
| From net investment income | $ (0.30) | $ (0.23) | $ (0.16) | $ (0.24) | $ (0.27) |
| Total distributions | $ (0.30) | $ (0.23) | $ (0.16) | $ (0.24) | $ (0.27) |
| Net asset value — End of year | $ 9.32 | $ 9.33 | $ 9.49 | $ 9.91 | $ 9.70 |
| Total Return(2) | 3.19% | 0.82% | (2.64)% | 4.63% | 1.81% |
| Ratios/Supplemental Data | | | | | |
| Net assets, end of year (000’s omitted) | $314,551 | $349,479 | $382,323 | $369,135 | $292,213 |
| Ratios (as a percentage of average daily net assets): | | | | | |
| Total expenses | 0.53% | 0.51% | 0.46% | 0.50% | 0.51% |
| Net expenses | 0.53% | 0.51% | 0.46% | 0.50% | 0.51% |
| Net investment income | 3.29% | 2.46% | 1.65% | 2.33% | 2.69% |
| Portfolio Turnover | 80% | 110% | 70% | 81% | 40% |
| (1) | Computed using average shares outstanding. |
| (2) | Returns are historical and are calculated by determining the percentage change in net asset value with all distributions reinvested. |
18
See Notes to Financial Statements.
Eaton Vance
National Limited Maturity Municipal Income Fund
March 31, 2024
Notes to Financial Statements
1 Significant Accounting Policies
Eaton Vance National Limited Maturity Municipal Income Fund (the Fund) is a diversified series of Eaton Vance Investment Trust (the Trust). The Trust is a Massachusetts business trust registered under the Investment Company Act of 1940, as amended (the 1940 Act), as an open-end management investment company. The Fund’s investment objective is to provide current income exempt from regular federal income tax. The Fund offers three classes of shares. Class A shares are generally sold subject to a sales charge imposed at time of purchase. Class C shares are sold at net asset value and are generally subject to a contingent deferred sales charge (see Note 5). Effective November 5, 2020, Class C shares automatically convert to Class A shares eight years after their purchase as described in the Fund’s prospectus. Class I shares are sold at net asset value and are not subject to a sales charge. Each class represents a pro rata interest in the Fund, but votes separately on class-specific matters and (as noted below) is subject to different expenses. Realized and unrealized gains and losses are allocated daily to each class of shares based on the relative net assets of each class to the total net assets of the Fund. Net investment income, other than class-specific expenses, is allocated daily to each class of shares based upon the ratio of the value of each class's paid shares to the total value of all paid shares. Each class of shares differs in its distribution plan and certain other class-specific expenses.
The following is a summary of significant accounting policies of the Fund. The policies are in conformity with accounting principles generally accepted in the United States of America (U.S. GAAP). The Fund is an investment company and follows accounting and reporting guidance in the Financial Accounting Standards Board (FASB) Accounting Standards Codification Topic 946.
A Investment Valuation—The following methodologies are used to determine the market value or fair value of investments.
Debt Obligations. Debt obligations are generally valued on the basis of valuations provided by third party pricing services, as derived from such services’ pricing models. Inputs to the models may include, but are not limited to, reported trades, executable bid and ask prices, broker/dealer quotations, prices or yields of securities with similar characteristics, interest rates, anticipated prepayments, benchmark curves or information pertaining to the issuer, as well as industry and economic events. The pricing services may use a matrix approach, which considers information regarding securities with similar characteristics to determine the valuation for a security. Short-term debt obligations purchased with a remaining maturity of sixty days or less for which a valuation from a third party pricing service is not readily available may be valued at amortized cost, which approximates fair value.
Fair Valuation. In connection with Rule 2a-5 of the 1940 Act, the Trustees have designated the Fund’s investment adviser as its valuation designee. Investments for which valuations or market quotations are not readily available or are deemed unreliable are valued by the investment adviser, as valuation designee, at fair value using methods that most fairly reflect the security’s “fair value”, which is the amount that the Fund might reasonably expect to receive for the security upon its current sale in the ordinary course. Each such determination is based on a consideration of relevant factors, which are likely to vary from one pricing context to another. These factors may include, but are not limited to, the type of security, the existence of any contractual restrictions on the security’s disposition, the price and extent of public trading in similar securities of the issuer or of comparable companies or entities, quotations or relevant information obtained from broker/dealers or other market participants, information obtained from the issuer, analysts, and/or the appropriate stock exchange (for exchange-traded securities), an analysis of the company’s or entity’s financial statements, and an evaluation of the forces that influence the issuer and the market(s) in which the security is purchased and sold.
B Investment Transactions and Related Income—Investment transactions for financial statement purposes are accounted for on a trade date basis. Realized gains and losses on investments sold are determined on the basis of identified cost. Interest income is recorded on the basis of interest accrued, adjusted for amortization of premium or accretion of discount.
C Federal Taxes—The Fund’s policy is to comply with the provisions of the Internal Revenue Code applicable to regulated investment companies and to distribute to shareholders each year substantially all of its taxable, if any, and tax-exempt net investment income, and all or substantially all of its net realized capital gains. Accordingly, no provision for federal income or excise tax is necessary. The Fund intends to satisfy conditions which will enable it to designate distributions from the interest income generated by its investments in non-taxable municipal securities, which are exempt from regular federal income tax when received by the Fund, as exempt-interest dividends. The portion of such interest, if any, earned on private activity bonds issued after August 7, 1986, may be considered a tax preference item to shareholders.
As of March 31, 2024, the Fund had no uncertain tax positions that would require financial statement recognition, de-recognition, or disclosure. The Fund files a U.S. federal income tax return annually after its fiscal year-end, which is subject to examination by the Internal Revenue Service for a period of three years from the date of filing.
D Expenses—The majority of expenses of the Trust are directly identifiable to an individual fund. Expenses which are not readily identifiable to a specific fund are allocated taking into consideration, among other things, the nature and type of expense and the relative size of the funds.
E Legal Fees— Legal fees and other related expenses incurred as part of negotiations of the terms and requirement of capital infusions, or that are expected to result in the restructuring of, or a plan of reorganization for, an investment are recorded as realized losses. Ongoing expenditures to protect or enhance an investment are treated as operating expenses.
F Use of Estimates—The preparation of the financial statements in conformity with U.S. GAAP requires management to make estimates and assumptions that affect the reported amounts of assets and liabilities at the date of the financial statements and the reported amounts of income and expense during the reporting period. Actual results could differ from those estimates.
Eaton Vance
National Limited Maturity Municipal Income Fund
March 31, 2024
Notes to Financial Statements — continued
G Indemnifications—Under the Trust’s organizational documents, its officers and Trustees may be indemnified against certain liabilities and expenses arising out of the performance of their duties to the Fund. Under Massachusetts law, if certain conditions prevail, shareholders of a Massachusetts business trust (such as the Trust) could be deemed to have personal liability for the obligations of the Trust. However, the Trust’s Declaration of Trust contains an express disclaimer of liability on the part of Fund shareholders and the By-laws provide that the Trust shall assume, upon request by the shareholder, the defense on behalf of any Fund shareholders. Moreover, the By-laws also provide for indemnification out of Fund property of any shareholder held personally liable solely by reason of being or having been a shareholder for all loss or expense arising from such liability. Additionally, in the normal course of business, the Fund enters into agreements with service providers that may contain indemnification clauses. The Fund’s maximum exposure under these arrangements is unknown as this would involve future claims that may be made against the Fund that have not yet occurred.
H When-Issued Securities and Delayed Delivery Transactions—The Fund may purchase securities on a delayed delivery or when-issued basis. Payment and delivery may take place after the customary settlement period for that security. At the time the transaction is negotiated, the price of the security that will be delivered is fixed. The Fund maintains cash and/or security positions for these commitments such that sufficient liquid assets will be available to make payments upon settlement. Securities purchased on a delayed delivery or when-issued basis are marked-to-market daily and begin earning interest on settlement date. Such security purchases are subject to the risk that when delivered they will be worth less than the agreed upon payment price. Losses may also arise if the counterparty does not perform under the contract.
2 Distributions to Shareholders and Income Tax Information
The net investment income of the Fund is determined daily and substantially all of the net investment income so determined is declared as a dividend to shareholders of record at the time of declaration. Distributions are declared separately for each class of shares. Distributions are paid monthly. Distributions of realized capital gains are made at least annually. Shareholders may reinvest income and capital gain distributions in additional shares of the same class of the Fund at the net asset value as of the reinvestment date or, at the election of the shareholder, receive distributions in cash. Distributions to shareholders are determined in accordance with income tax regulations, which may differ from U.S. GAAP. As required by U.S. GAAP, only distributions in excess of tax basis earnings and profits are reported in the financial statements as a return of capital. Permanent differences between book and tax accounting relating to distributions are reclassified to paid-in capital. For tax purposes, distributions from short-term capital gains are considered to be from ordinary income.
The tax character of distributions declared for the years ended March 31, 2024 and March 31, 2023 was as follows:
| | Year Ended March 31, |
| | 2024 | 2023 |
| Tax-exempt income | $14,660,046 | $13,438,642 |
| Ordinary income | $ 1,458,640 | $ 1,407,007 |
As of March 31, 2024, the components of distributable earnings (accumulated loss) on a tax basis were as follows:
| Undistributed tax-exempt income | $ 409,006 |
| Deferred capital losses | (31,445,726) |
| Net unrealized appreciation | 2,762,277 |
| Distributions payable | (408,572) |
| Accumulated loss | $(28,683,015) |
At March 31, 2024, the Fund, for federal income tax purposes, had deferred capital losses of $31,445,726 which would reduce its taxable income arising from future net realized gains on investment transactions, if any, to the extent permitted by the Internal Revenue Code, and thus would reduce the amount of distributions to shareholders, which would otherwise be necessary to relieve the Fund of any liability for federal income or excise tax. The deferred capital losses are treated as arising on the first day of the Fund’s next taxable year and retain the same short-term or long-term character as when originally deferred. Of the deferred capital losses at March 31, 2024, $22,428,627 are short-term and $9,017,099 are long-term.
Eaton Vance
National Limited Maturity Municipal Income Fund
March 31, 2024
Notes to Financial Statements — continued
The cost and unrealized appreciation (depreciation) of investments of the Fund at March 31, 2024, as determined on a federal income tax basis, were as follows:
| Aggregate cost | $483,929,146 |
| Gross unrealized appreciation | $ 6,792,900 |
| Gross unrealized depreciation | (4,030,623) |
| Net unrealized appreciation | $ 2,762,277 |
3 Investment Adviser Fee and Other Transactions with Affiliates
The investment adviser fee is earned by Boston Management and Research (BMR), an indirect, wholly-owned subsidiary of Morgan Stanley, as compensation for investment advisory services rendered to the Fund. The fee is based upon a percentage of total daily net assets plus a percentage of total daily gross income (i.e., income other than gains from the sale of securities) as follows and is payable monthly:
| Total Daily Net Assets | Annual Asset
Rate | Daily Income
Rate |
| Up to $500 million | 0.300% | 3.000% |
| $500 million but less than $1 billion | 0.275% | 2.750% |
| $1 billion but less than $1.5 billion | 0.250% | 2.500% |
| $1.5 billion but less than $2 billion | 0.225% | 2.250% |
| $2 billion but less than $3 billion | 0.200% | 2.000% |
| $3 billion and over | 0.175% | 1.750% |
For the year ended March 31, 2024, the investment adviser fee amounted to $2,094,859 or 0.41% of the Fund’s average daily net assets. Eaton Vance Management (EVM), an affiliate of BMR and an indirect, wholly-owned subsidiary of Morgan Stanley, serves as the administrator of the Fund, but receives no compensation.
EVM provides sub-transfer agency and related services to the Fund pursuant to a Sub-Transfer Agency Support Services Agreement. For the year ended March 31, 2024, EVM earned $15,771 from the Fund pursuant to such agreement, which is included in transfer and dividend disbursing agent fees on the Statement of Operations. The Fund was informed that Eaton Vance Distributors, Inc. (EVD), an affiliate of EVM and the Fund’s principal underwriter, received $5,494 as its portion of the sales charge on sales of Class A shares for the year ended March 31, 2024. EVD also received distribution and service fees from Class A and Class C shares (see Note 4) and contingent deferred sales charges (see Note 5).
Trustees and officers of the Fund who are members of EVM’s or BMR’s organizations receive remuneration for their services to the Fund out of the investment adviser fee. Trustees of the Fund who are not affiliated with the investment adviser may elect to defer receipt of all or a percentage of their annual fees in accordance with the terms of the Trustees Deferred Compensation Plan. Certain officers and Trustees of the Fund are officers of the above organizations.
4 Distribution Plans
The Fund has in effect a distribution plan for Class A shares (Class A Plan) pursuant to Rule 12b-1 under the 1940 Act. Pursuant to the Class A Plan, the Fund pays EVD a distribution and service fee not exceeding 0.25% per annum of its average daily net assets attributable to Class A shares for distribution services and facilities provided to the Fund by EVD, as well as for personal services and/or the maintenance of shareholder accounts. The Trustees approved distribution and service fee payments equal to 0.15% per annum of its average daily net assets attributable to Class A shares. Distribution and service fees paid or accrued to EVD for the year ended March 31, 2024 amounted to $253,674 for Class A shares.
The Fund also has in effect a distribution plan for Class C shares (Class C Plan) pursuant to Rule 12b-1 under the 1940 Act. Pursuant to the Class C Plan, the Fund pays EVD amounts equal to 0.75% per annum of its average daily net assets attributable to Class C shares for providing ongoing distribution services and facilities to the Fund. For the year ended March 31, 2024, the Fund paid or accrued to EVD $79,977 for Class C shares.
Eaton Vance
National Limited Maturity Municipal Income Fund
March 31, 2024
Notes to Financial Statements — continued
Pursuant to the Class C Plan, the Fund also makes payments of service fees to EVD, financial intermediaries and other persons in amounts not exceeding 0.25% per annum of its average daily net assets attributable to that class. The Trustees approved service payments equal to 0.15% per annum of its average daily net assets attributable to Class C shares. Service fees paid or accrued are for personal services and/or the maintenance of shareholder accounts. They are separate and distinct from the sales commissions and distribution fees payable to EVD. Service fees paid or accrued for the year ended March 31, 2024 amounted to $15,995 for Class C shares.
Distribution and service fees are subject to the limitations contained in the Financial Industry Regulatory Authority Rule 2341(d).
5 Contingent Deferred Sales Charges
A contingent deferred sales charge (CDSC) of 1% generally is imposed on redemptions of Class C shares made within 12 months of purchase. Class A shares may be subject to a 0.75% CDSC if redeemed within 12 months of purchase (depending on the circumstances of purchase). Generally, the CDSC is based upon the lower of the net asset value at date of redemption or date of purchase. No charge is levied on shares acquired by reinvestment of dividends or capital gain distributions. For the year ended March 31, 2024, the Fund was informed that EVD received $11,844 and $117 of CDSCs paid by Class A and Class C shareholders, respectively.
6 Purchases and Sales of Investments
Purchases and sales of investments, other than short-term obligations and including maturities, aggregated $391,909,286 and $410,546,761, respectively, for the year ended March 31, 2024.
7 Shares of Beneficial Interest
The Fund’s Declaration of Trust permits the Trustees to issue an unlimited number of full and fractional shares of beneficial interest (without par value). Such shares may be issued in a number of different series (such as the Fund) and classes. Transactions in Fund shares, including direct exchanges pursuant to share class conversions, were as follows:
| | Year Ended
March 31, 2024 | | Year Ended
March 31, 2023 |
| | Shares | Amount | | Shares | Amount |
| Class A | | | | | |
| Sales | 3,364,242 | $ 31,167,168 | | 4,679,668 | $ 43,514,159 |
| Issued to shareholders electing to receive payments of distributions in Fund shares | 465,203 | 4,303,380 | | 411,962 | 3,827,204 |
| Redemptions | (5,453,371) | (50,455,676) | | (9,759,644) | (90,662,269) |
| Net decrease | (1,623,926) | $ (14,985,128) | | (4,668,014) | $ (43,320,906) |
| Class C | | | | | |
| Sales | 173,886 | $ 1,510,031 | | 429,595 | $ 3,751,287 |
| Issued to shareholders electing to receive payments of distributions in Fund shares | 26,747 | 232,085 | | 22,024 | 191,877 |
| Redemptions | (435,929) | (3,784,532) | | (654,406) | (5,697,774) |
| Net decrease | (235,296) | $ (2,042,416) | | (202,787) | $ (1,754,610) |
| Class I | | | | | |
| Sales | 11,506,017 | $ 106,287,491 | | 34,387,362 | $ 320,251,381 |
| Issued to shareholders electing to receive payments of distributions in Fund shares | 683,010 | 6,321,855 | | 541,289 | 5,029,783 |
| Redemptions | (15,901,653) | (147,069,503) | | (37,776,924) | (351,255,672) |
| Net decrease | (3,712,626) | $ (34,460,157) | | (2,848,273) | $ (25,974,508) |
Eaton Vance
National Limited Maturity Municipal Income Fund
March 31, 2024
Notes to Financial Statements — continued
8 Line of Credit
The Fund participates with other portfolios and funds managed by EVM and its affiliates in a $650 million unsecured revolving line of credit agreement with a group of banks, which is in effect through October 22, 2024. In connection with the renewal of the agreement on October 24, 2023, the borrowing limit was decreased from $725 million. Borrowings are made by the Fund solely for temporary purposes related to redemptions and other short-term cash needs. Interest is charged to the Fund based on its borrowings at an amount above either the Secured Overnight Financing Rate (SOFR) or Federal Funds rate. In addition, a fee computed at an annual rate of 0.15% on the daily unused portion of the line of credit is allocated among the participating portfolios and funds at the end of each quarter. In connection with the renewal of the agreement in October 2023, an arrangement fee of $150,000 was incurred that was allocated to the participating portfolios and funds. Because the line of credit is not available exclusively to the Fund, it may be unable to borrow some or all of its requested amounts at any particular time. The Fund did not have any significant borrowings or allocated fees during the year ended March 31, 2024.
9 Fair Value Measurements
Under generally accepted accounting principles for fair value measurements, a three-tier hierarchy to prioritize the assumptions, referred to as inputs, is used in valuation techniques to measure fair value. The three-tier hierarchy of inputs is summarized in the three broad levels listed below.
| • | Level 1 – quoted prices in active markets for identical investments |
| • | Level 2 – other significant observable inputs (including quoted prices for similar investments, interest rates, prepayment speeds, credit risk, etc.) |
| • | Level 3 – significant unobservable inputs (including a fund's own assumptions in determining the fair value of investments) |
In cases where the inputs used to measure fair value fall in different levels of the fair value hierarchy, the level disclosed is determined based on the lowest level input that is significant to the fair value measurement in its entirety. The inputs or methodology used for valuing securities are not necessarily an indication of the risk associated with investing in those securities.
At March 31, 2024, the hierarchy of inputs used in valuing the Fund's investments, which are carried at fair value, were as follows:
| Asset Description | Level 1 | Level 2 | Level 3 | Total |
| Corporate Bonds | $ — | $ 11,527,124 | $ — | $ 11,527,124 |
| Tax-Exempt Municipal Obligations | — | 440,441,725 | — | 440,441,725 |
| Taxable Municipal Obligations | — | 34,722,574 | — | 34,722,574 |
| Total Investments | $ — | $486,691,423 | $ — | $486,691,423 |
Eaton Vance
National Limited Maturity Municipal Income Fund
March 31, 2024
Report of Independent Registered Public Accounting Firm
To the Trustees of Eaton Vance Investment Trust and Shareholders of Eaton Vance National Limited Maturity Municipal Income Fund:
Opinion on the Financial Statements and Financial Highlights
We have audited the accompanying statement of assets and liabilities of Eaton Vance National Limited Maturity Municipal Income Fund (the “Fund”) (one of the funds constituting Eaton Vance Investment Trust), including the portfolio of investments, as of March 31, 2024, the related statement of operations for the year then ended, the statements of changes in net assets for each of the two years in the period then ended, the financial highlights for each of the five years in the period then ended, and the related notes. In our opinion, the financial statements and financial highlights present fairly, in all material respects, the financial position of the Fund as of March 31, 2024, and the results of its operations for the year then ended, the changes in its net assets for each of the two years in the period then ended, and the financial highlights for each of the five years in the period then ended, in conformity with accounting principles generally accepted in the United States of America.
Basis for Opinion
These financial statements and financial highlights are the responsibility of the Fund's management. Our responsibility is to express an opinion on the Fund's financial statements and financial highlights based on our audits. We are a public accounting firm registered with the Public Company Accounting Oversight Board (United States) (PCAOB) and are required to be independent with respect to the Fund in accordance with the U.S. federal securities laws and the applicable rules and regulations of the Securities and Exchange Commission and the PCAOB.
We conducted our audits in accordance with the standards of the PCAOB. Those standards require that we plan and perform the audit to obtain reasonable assurance about whether the financial statements and financial highlights are free of material misstatement, whether due to error or fraud. The Fund is not required to have, nor were we engaged to perform, an audit of its internal control over financial reporting. As part of our audits, we are required to obtain an understanding of internal control over financial reporting but not for the purpose of expressing an opinion on the effectiveness of the Fund’s internal control over financial reporting. Accordingly, we express no such opinion.
Our audits included performing procedures to assess the risks of material misstatement of the financial statements and financial highlights, whether due to error or fraud, and performing procedures that respond to those risks. Such procedures included examining, on a test basis, evidence regarding the amounts and disclosures in the financial statements and financial highlights. Our audits also included evaluating the accounting principles used and significant estimates made by management, as well as evaluating the overall presentation of the financial statements and financial highlights. Our procedures included confirmation of securities owned as of March 31, 2024, by correspondence with the custodian and brokers; when replies were not received from brokers, we performed other auditing procedures. We believe that our audits provide a reasonable basis for our opinion.
/s/ Deloitte & Touche LLP
Boston, Massachusetts
May 17, 2024
We have served as the auditor of one or more Eaton Vance investment companies since 1959.
Eaton Vance
National Limited Maturity Municipal Income Fund
March 31, 2024
Federal Tax Information (Unaudited)
The Form 1099-DIV you receive in February 2025 will show the tax status of all distributions paid to your account in calendar year 2024. Shareholders are advised to consult their own tax adviser with respect to the tax consequences of their investment in the Fund. As required by the Internal Revenue Code and/or regulations, shareholders must be notified regarding the status of exempt-interest dividends.
Exempt-Interest Dividends. For the fiscal year ended March 31, 2024, the Fund designates 90.95% of distributions from net investment income as an exempt-interest dividend.
Eaton Vance
National Limited Maturity Municipal Income Fund
March 31, 2024
Management and Organization
Fund Management. The Trustees of Eaton Vance Investment Trust (the Trust) are responsible for the overall management and supervision of the Trust's affairs. The Board members and officers of the Trust are listed below. Except as indicated, each individual has held the office shown or other offices in the same company for the last five years. Board members hold indefinite terms of office. Each Trustee holds office until his or her successor is elected and qualified, subject to a prior death, resignation, retirement, disqualification or removal. Under the terms of the Fund’s current Trustee retirement policy, an Independent Trustee must retire and resign as a Trustee on the earlier of: (i) the first day of July following his or her 74th birthday; or (ii), with limited exception, December 31st of the 20th year in which he or she has served as a Trustee. However, if such retirement and resignation would cause the Fund to be out of compliance with Section 16 of the 1940 Act or any other regulations or guidance of the SEC, then such retirement and resignation will not become effective until such time as action has been taken for the Fund to be in compliance therewith. The “noninterested Trustees” consist of those Trustees who are not “interested persons” of the Trust, as that term is defined under the 1940 Act. The business address of each Board member and officer is One Post Office Square, Boston, Massachusetts 02109. As used below, “BMR” refers to Boston Management and Research, “EV” refers to EV LLC, “EVM” refers to Eaton Vance Management, “MSIM” refers to Morgan Stanley Investment Management Inc. and “EVD” refers to Eaton Vance Distributors, Inc. EV is the trustee of each of EVM and BMR. Each of EVM, BMR, EVD and EV are indirect, wholly owned subsidiaries of Morgan Stanley. Each officer affiliated with EVM may hold a position with other EVM affiliates that is comparable to his or her position with EVM listed below. Each Trustee oversees 127 funds in the Eaton Vance fund complex (including both funds and portfolios in a hub and spoke structure).
| Name and Year of Birth | Trust
Position(s) | Length of Service | Principal Occupation(s) and Other Directorships
During Past Five Years and Other Relevant Experience |
| Interested Trustee |
Anchal Pachnanda
1980 | Trustee | Since 2023 | Co-Head of Strategy of MSIM (since 2019). Formerly, Head of Strategy of MSIM (2017-2019). Ms. Pachnanda is an interested person because of her position with MSIM, which is an affiliate of the Trust.
Other Directorships. None. |
| Noninterested Trustees |
Alan C. Bowser
1962 | Trustee | Since 2022 | Private investor. Formerly, Chief Diversity Officer, Partner and a member of the Operating Committee, and formerly served as Senior Advisor on Diversity and Inclusion for the firm’s chief executive officer, Co-Head of the Americas Region, and Senior Client Advisor of Bridgewater Associates, an asset management firm (2011- 2023).
Other Directorships. Independent Director of Stout Risius Ross (a middle market professional services advisory firm) (since 2021). |
Mark R. Fetting
1954 | Trustee | Since 2016 | Private investor. Formerly held various positions at Legg Mason, Inc. (investment management firm) (2000-2012), including President, Chief Executive Officer, Director and Chairman (2008-2012), Senior Executive Vice President (2004-2008) and Executive Vice President (2001-2004). Formerly, President of Legg Mason family of funds (2001-2008). Formerly, Division President and Senior Officer of Prudential Financial Group, Inc. and related companies (investment management firm) (1991-2000).
Other Directorships. None. |
Cynthia E. Frost
1961 | Trustee | Since 2014 | Private investor. Formerly, Chief Investment Officer of Brown University (university endowment) (2000-2012). Formerly, Portfolio Strategist for Duke Management Company (university endowment manager) (1995-2000). Formerly, Managing Director, Cambridge Associates (investment consulting company) (1989-1995). Formerly, Consultant, Bain and Company (management consulting firm) (1987-1989). Formerly, Senior Equity Analyst, BA Investment Management Company (1983-1985).
Other Directorships. None. |
George J. Gorman
1952 | Chairperson
of the Board
and Trustee | Since 2021
(Chairperson) and
2014 (Trustee) | Principal at George J. Gorman LLC (consulting firm). Formerly, Senior Partner at Ernst & Young LLP (a registered public accounting firm) (1974-2009).
Other Directorships. None. |
Eaton Vance
National Limited Maturity Municipal Income Fund
March 31, 2024
Management and Organization — continued
| Name and Year of Birth | Trust
Position(s) | Length of Service | Principal Occupation(s) and Other Directorships
During Past Five Years and Other Relevant Experience |
| Noninterested Trustees (continued) |
Valerie A. Mosley
1960 | Trustee | Since 2014 | Chairwoman and Chief Executive Officer of Valmo Ventures (a consulting and investment firm). Founder of Upward Wealth, Inc., dba BrightUp, a fintech platform. Formerly, Partner and Senior Vice President, Portfolio Manager and Investment Strategist at Wellington Management Company, LLP (investment management firm) (1992-2012). Formerly, Chief Investment Officer, PG Corbin Asset Management (1990-1992). Formerly worked in institutional corporate bond sales at Kidder Peabody (1986-1990).
Other Directorships. Director of DraftKings, Inc. (digital sports entertainment and gaming company) (since September 2020). Director of Envestnet, Inc. (provider of intelligent systems for wealth management and financial wellness) (since 2018). Formerly, Director of Dynex Capital, Inc. (mortgage REIT) (2013-2020) and Director of Groupon, Inc. (e-commerce provider) (2020-2022). |
Keith Quinton
1958 | Trustee | Since 2018 | Private investor, researcher and lecturer. Formerly, Independent Investment Committee Member at New Hampshire Retirement System (2017-2021). Formerly, Portfolio Manager and Senior Quantitative Analyst at Fidelity Investments (investment management firm) (2001-2014).
Other Directorships. Formerly, Director (2016-2021) and Chairman (2019-2021) of New Hampshire Municipal Bond Bank. |
Marcus L. Smith
1966 | Trustee | Since 2018 | Private investor and independent corporate director. Formerly, Chief Investment Officer, Canada (2012-2017), Chief Investment Officer, Asia (2010-2012), Director of Asian Research (2004-2010) and portfolio manager (2001-2017) at MFS Investment Management (investment management firm).
Other Directorships. Director of First Industrial Realty Trust, Inc. (an industrial REIT) (since 2021). Director of MSCI Inc. (global provider of investment decision support tools) (since 2017). Formerly, Director of DCT Industrial Trust Inc. (logistics real estate company) (2017-2018). |
Susan J. Sutherland
1957 | Trustee | Since 2015 | Private investor. Director of Ascot Group Limited and certain of its subsidiaries (insurance and reinsurance) (since 2017). Formerly, Director of Hagerty Holding Corp. (insurance) (2015-2018) and Montpelier Re Holdings Ltd. (insurance and reinsurance) (2013-2015). Formerly, Associate, Counsel and Partner at Skadden, Arps, Slate, Meagher & Flom LLP (law firm) (1982-2013).
Other Directorships. Formerly, Director of Kairos Acquisition Corp. (insurance/InsurTech acquisition company) (2021-2023). |
Scott E. Wennerholm
1959 | Trustee | Since 2016 | Private investor. Formerly, Trustee at Wheelock College (postsecondary institution) (2012-2018). Formerly, Consultant at GF Parish Group (executive recruiting firm) (2016-2017). Formerly, Chief Operating Officer and Executive Vice President at BNY Mellon Asset Management (investment management firm) (2005-2011). Formerly, Chief Operating Officer and Chief Financial Officer at Natixis Global Asset Management (investment management firm) (1997-2004). Formerly, Vice President at Fidelity Investments Institutional Services (investment management firm) (1994-1997).
Other Directorships. None. |
Nancy A. Wiser
1967 | Trustee | Since 2022 | Formerly, Executive Vice President and the Global Head of Operations at Wells Fargo Asset Management (2011-2021).
Other Directorships. None. |
| Name and Year of Birth | Trust
Position(s) | Length of Service | Principal Occupation(s)
During Past Five Years |
| Principal Officers who are not Trustees |
Kenneth A. Topping
1966 | President | Since 2023 | Vice President and Chief Administrative Officer of EVM and BMR and Chief Operating Officer for Public Markets at MSIM. Also Vice President of Calvert Research and Management (“CRM”) since 2021. Formerly, Chief Operating Officer for Goldman Sachs Asset Management ‘Classic' (2009-2020). |
Deidre E. Walsh
1971 | Vice President and
Chief Legal Officer | Since 2009 | Vice President of EVM and BMR. Also Vice President of CRM. |
James F. Kirchner
1967 | Treasurer | Since 2007 | Vice President of EVM and BMR. Also Vice President of CRM. |
Eaton Vance
National Limited Maturity Municipal Income Fund
March 31, 2024
Management and Organization — continued
| Name and Year of Birth | Trust
Position(s) | Length of Service | Principal Occupation(s)
During Past Five Years |
| Principal Officers who are not Trustees (continued) |
Nicholas S. Di Lorenzo
1987 | Secretary | Since 2022 | Formerly, associate (2012-2021) and counsel (2022) at Dechert LLP. |
Laura T. Donovan
1976 | Chief Compliance
Officer | Since 2024 | Vice President of EVM and BMR. |
The SAI for the Fund includes additional information about the Trustees and officers of the Fund and can be obtained without charge on Eaton Vance’s website at www.eatonvance.com or by calling 1-800-262-1122.
| U.S. Customer Privacy Notice | March 2024 |
| FACTS | WHAT DOES EATON VANCE DO WITH YOUR PERSONAL INFORMATION? |
| Why? | Financial companies choose how they share your personal information. Federal law gives consumers the right to limit some but not all sharing. Federal law also requires us to tell you how we collect, share, and protect your personal information. Please read this notice carefully to understand what we do. |
| |
| What? | The types of personal information we collect and share depend on the product or service you have with us. This information can include:■ Social Security number and income
■ investment experience and risk tolerance
■ checking account information and wire transfer instructions |
| |
| How? | All financial companies need to share customers’ personal information to run their everyday business. In the section below, we list the reasons financial companies can share their customers’ personal information; the reasons Eaton Vance chooses to share; and whether you can limit this sharing. |
| Reasons we can share your personal information | Does Eaton Vance
share? | Can you limit
this sharing? |
| For our everyday business purposes — such as to process your transactions, maintain your account(s), respond to court orders and legal investigations, or report to credit bureaus | Yes | No |
| For our marketing purposes — to offer our products and services to you | Yes | No |
| For joint marketing with other financial companies | No | We don’t share |
| For our affiliates’ everyday business purposes — information about your transactions and experiences | Yes | No* |
| For our affiliates’ everyday business purposes — information about your creditworthiness | Yes | Yes* |
| For our affiliates to market to you | Yes | Yes* |
| For nonaffiliates to market to you | No | We don’t share |
To limit our
sharing | Call toll-free 1-800-262-1122 or email: EVPrivacy@eatonvance.comPlease note:If you are a new customer, we can begin sharing your information 30 days from the date we sent this notice. When you are no longer our customer, we continue to share your information as described in this notice. However, you can contact us at any time to limit our sharing. |
| Questions? | Call toll-free 1-800-262-1122 or email: EVPrivacy@eatonvance.com |
| U.S. Customer Privacy Notice — continued | March 2024 |
| Who we are |
| Who is providing this notice? | Eaton Vance Management and our investment management affiliates (“Eaton Vance”) (see Affiliates definition below.) |
| What we do |
How does Eaton Vance
protect my personal
information? | To protect your personal information from unauthorized access and use, we use security measures that comply with federal law. These measures include computer safeguards and secured files and buildings. We have policies governing the proper handling of customer information by personnel and requiring third parties that provide support to adhere to appropriate security standards with respect to such information. |
How does Eaton Vance
collect my personal
information? | We collect your personal information, for example, when you■ open an account or make deposits or withdrawals from your account
■ buy securities from us or make a wire transfer
■ give us your contact informationWe also collect your personal information from others, such as credit bureaus, affiliates, or other companies. |
| Why can’t I limit all sharing? | Federal law gives you the right to limit only■ sharing for affiliates’ everyday business purposes — information about your creditworthiness
■ affiliates from using your information to market to you
■ sharing for nonaffiliates to market to youState laws and individual companies may give you additional rights to limit sharing. (See below for more on your rights under state law.) |
What happens when I limit
sharing for an account I hold
jointly with someone else? | Your choices will apply to everyone on your account. |
| Definitions |
| Affiliates | Companies related by common ownership or control. They can be financial and nonfinancial companies.■ Our affiliates include registered investment advisers such as Eaton Vance Management, Eaton Vance Advisers International Ltd., Boston Management and Research, Calvert Research and Management, Parametric Portfolio Associates LLC, Atlanta Capital Management Company LLC, Morgan Stanley Investment Management Inc., Morgan Stanley Investment Management Co.; registered broker-dealers such as Morgan Stanley Distributors Inc. and Eaton Vance Distributors, Inc. (together, the “Investment Management Affiliates”); and companies with a Morgan Stanley name and financial companies such as Morgan Stanley Smith Barney LLC and Morgan Stanley & Co. (the “Morgan Stanley Affiliates”). |
| Nonaffiliates | Companies not related by common ownership or control. They can be financial and nonfinancial companies.■ Eaton Vance does not share with nonaffiliates so they can market to you. |
| Joint marketing | A formal agreement between nonaffiliated financial companies that together market financial products or services to you.■ Eaton Vance does not jointly market. |
| U.S. Customer Privacy Notice — continued | March 2024 |
| Other important information |
| *PLEASE NOTE: Eaton Vance does not share your creditworthiness information or your transactions and experiences information with the Morgan Stanley Affiliates, nor does Eaton Vance enable the Morgan Stanley Affiliates to market to you. Your opt outs will prevent Eaton Vance from sharing your creditworthiness information with the Investment Management Affiliates and will prevent the Investment Management Affiliates from marketing their products to you.Vermont: Except as permitted by law, we will not share personal information we collect about Vermont residents with Nonaffiliates unless you provide us with your written consent to share such information.California: Except as permitted by law, we will not share personal information we collect about California residents with Nonaffiliates and we will limit sharing such personal information with our Affiliates to comply with California privacy laws that apply to us. |
Delivery of Shareholder Documents. The Securities and Exchange Commission (SEC) permits funds to deliver only one copy of shareholder documents, including prospectuses, proxy statements and shareholder reports, to fund investors with multiple accounts at the same residential or post office box address. This practice is often called “householding” and it helps eliminate duplicate mailings to shareholders. Eaton Vance, or your financial intermediary, may household the mailing of your documents indefinitely unless you instruct Eaton Vance, or your financial intermediary, otherwise. If you would prefer that your Eaton Vance documents not be householded, please contact Eaton Vance at 1-800-262-1122, or contact your financial intermediary. Your instructions that householding not apply to delivery of your Eaton Vance documents will typically be effective within 30 days of receipt by Eaton Vance or your financial intermediary.
Portfolio Holdings. Each Eaton Vance Fund and its underlying Portfolio(s) (if applicable) files a schedule of portfolio holdings on Part F to Form N-PORT with the SEC. Certain information filed on Form N-PORT may be viewed on the Eaton Vance website at www.eatonvance.com, by calling Eaton Vance at 1-800-262-1122 or in the EDGAR database on the SEC’s website at www.sec.gov.
Proxy Voting. From time to time, funds are required to vote proxies related to the securities held by the funds. The Eaton Vance Funds or their underlying Portfolios (if applicable) vote proxies according to a set of policies and procedures approved by the Funds’ and Portfolios’ Boards. You may obtain a description of these policies and procedures and information on how the Funds or Portfolios voted proxies relating to portfolio securities during the most recent 12-month period ended June 30, without charge, upon request, by calling 1-800-262-1122 and by accessing the SEC’s website at www.sec.gov.
Tailored Shareholder Reports. Effective January 24, 2023, the SEC adopted rule and form amendments to require open-end mutual funds and ETFs to transmit concise and visually engaging streamlined annual and semiannual reports to shareholders that highlight key information. Other information, including financial statements, will no longer appear in a streamlined shareholder report but must be available online, delivered free of charge upon request, and filed on a semiannual basis on Form N-CSR. The rule and form amendments have a compliance date of July 24, 2024. At this time, management is evaluating the impact of these amendments on the shareholder reports for the Eaton Vance Funds.
Investment Adviser
Boston Management and Research
One Post Office Square
Boston, MA 02109
Administrator
Eaton Vance Management
One Post Office Square
Boston, MA 02109
Principal Underwriter*
Eaton Vance Distributors, Inc.
One Post Office Square
Boston, MA 02109
(617) 482-8260
Custodian
State Street Bank and Trust Company
One Congress Street, Suite 1
Boston, MA 02114-2016
Transfer Agent
BNY Mellon Investment Servicing (US) Inc.
Attn: Eaton Vance Funds
P.O. Box 534439
Pittsburgh, PA 15253-4439
(800) 262-1122
Independent Registered Public Accounting Firm
Deloitte & Touche LLP
200 Berkeley Street
Boston, MA 02116-5022
Fund Offices
One Post Office Square
Boston, MA 02109
* FINRA BrokerCheck. Investors may check the background of their Investment Professional by contacting the Financial Industry Regulatory Authority (FINRA). FINRA BrokerCheck is a free tool to help investors check the professional background of current and former FINRA-registered securities firms and brokers. FINRA BrokerCheck is available by calling 1-800-289-9999 and at www.FINRA.org. The FINRA BrokerCheck brochure describing this program is available to investors at www.FINRA.org.
Eaton Vance
New York Municipal
Opportunities Fund
Annual Report
March 31, 2024
Commodity Futures Trading Commission Registration. The Commodity Futures Trading Commission (“CFTC”) has adopted regulations that subject registered investment companies and advisers to regulation by the CFTC if a fund invests more than a prescribed level of its assets in certain CFTC-regulated instruments (including futures, certain options and swap agreements) or markets itself as providing investment exposure to such instruments. The investment adviser has claimed an exclusion from the definition of “commodity pool operator” under the Commodity Exchange Act with respect to its management of the Fund. Accordingly, neither the Fund nor the adviser with respect to the operation of the Fund is subject to CFTC regulation. Because of its management of other strategies, the Fund's adviser is registered with the CFTC as a commodity pool operator. The adviser is also registered as a commodity trading advisor.
Fund shares are not insured by the FDIC and are not deposits or other obligations of, or guaranteed by, any depository institution. Shares are subject to investment risks, including possible loss of principal invested.
This report must be preceded or accompanied by a current summary prospectus or prospectus. Before investing, investors should consider carefully the investment objective, risks, and charges and expenses of a mutual fund. This and other important information is contained in the summary prospectus and prospectus, which can be obtained from a financial intermediary. Prospective investors should read the prospectus carefully before investing. For further information, please call 1-800-262-1122.
Annual Report March 31, 2024
Eaton Vance
New York Municipal Opportunities Fund
Eaton Vance
New York Municipal Opportunities Fund
March 31, 2024
Management’s Discussion of Fund Performance†
Economic and Market Conditions
The 12-month period ended March 31, 2024, began with an April 2023 municipal bond sell-off that continued through much of the period. Although positive technical factors -- particularly municipal bond demand that exceeded supply -- produced brief periods of positive performance, the U.S. Federal Reserve’s (the Fed’s) 10th and 11th interest rate hikes in just over a year -- in May and July 2023 -- contributed to rising municipal yields and falling bond prices.
From August through October 2023, above-average supplies of municipal bonds -- plus an end-of-summer slowdown in coupon reinvestment -- reduced demand for municipal bonds. Although the Fed left the federal funds rate unchanged in September 2023, investors interpreted the central bank’s message to be that rates might stay higher for longer than they had expected just weeks earlier -- adding fuel to the municipal bond sell-off.
However, in November and December 2023, the municipal bond market reversed course. After several months of rising interest rates and negative bond returns, federal tax-free municipal yields approached their 2022 highs, giving investors a compelling reason to buy tax-exempt municipal bonds.
Typical calendar year-end technical factors -- particularly constrained supplies and increased investor demand -- were additional tailwinds for municipal bond prices. Falling inflation and easing employment gains also led many investors to believe the Fed might be done raising interest rates. Such factors contributed to the Bloomberg Municipal Bond Index (the Index) returning 6.35% in November 2023, its best monthly performance since 1982.
In December 2023, the Index posted another solid monthly gain as investors began to conclude the Fed might begin lowering interest rates during the first half of 2024.
In the final three months of the period, however, municipal returns turned negative as municipal bonds -- following a strong year-end rally -- appeared overvalued relative to U.S. Treasurys. Fed statements and strong U.S. economic reports in early 2024 led investors to reduce expectations for the number of Fed rate cuts projected for the year and how soon they might begin. As a result, both municipal bonds and U.S. Treasurys delivered negative performance during the first quarter of 2024.
For the period as a whole, the Index returned 3.13%, as municipal bonds outperformed U.S. Treasurys throughout the yield curve. Although yields rose and prices fell across the municipal bond yield curve, the positive contribution from rising interest income outweighed the negative effect of falling bond prices. During the period, lower-rated bonds generally outperformed higher-rated bonds, while longer-maturity bonds generally outperformed shorter-maturity bonds.
Fund Performance
For the 12-month period ended March 31, 2024, Eaton Vance New York Municipal Opportunities Fund (the Fund) returned 4.09% for Class A shares at net asset value (NAV), outperforming its benchmark, the Bloomberg Municipal Bond Index (the Index), which returned 3.13%.
To pursue its primary objective of maximizing after-tax total return, the Fund uses a flexible investment strategy and may invest in obligations of any duration or credit quality. The Fund may invest up to 20% of net assets in debt obligations other than tax-exempt municipal bonds, including -- but not limited to -- taxable municipal obligations, U.S. Treasury securities and obligations of the U.S. government, its agencies and instrumentalities.
Up to 50% of the Fund’s net assets may be invested in obligations rated below investment-grade quality -- Baa/BBB by Moody’s, S&P, or Fitch. The Fund may also seek to hedge interest rate risk and hold leveraged investments.
Contributors to Fund performance relative to the Index included security selections and an overweight position in bonds with 22 years or more remaining to maturity, during a period when longer-maturity bonds generally outperformed shorter-maturity bonds. The Fund also benefited from an overweight position in bonds rated BBB and below, during a period when lower-rated bonds generally outperformed higher-rated bonds; and security selections and an overweight position in the health care sector.
In contrast, detractors from Index-relative performance included an overweight position in bonds with coupons below 4%, excluding zero-coupon bonds; security selections in local general obligation bonds; and security selections in bonds subject to the alternative minimum tax (AMT).
See Endnotes and Additional Disclosures in this report.
Past performance is no guarantee of future results. Returns are historical and are calculated by determining the percentage change in net asset value (NAV) or offering price (as applicable) with all distributions reinvested. Furthermore, returns do not reflect the deduction of taxes that shareholders may have to pay on Fund distributions or upon the redemption of Fund shares. Investment return and principal value will fluctuate so that shares, when redeemed, may be worth more or less than their original cost. Performance for periods less than or equal to one year is cumulative. Performance is for the stated time period only; due to market volatility, current Fund performance may be lower or higher than the quoted return. For performance as of the most recent month-end, please refer to eatonvance.com.
Eaton Vance
New York Municipal Opportunities Fund
March 31, 2024
Performance
Portfolio Manager(s) Craig R. Brandon, CFA and Trevor G. Smith
| % Average Annual Total Returns1,2 | Class
Inception Date | Performance
Inception Date | One Year | Five Years | Ten Years |
| Class A at NAV | 06/27/1996 | 05/29/1992 | 4.09% | 1.44% | 1.89% |
| Class A with 3.25% Maximum Sales Charge | — | — | 0.75 | 0.77 | 1.55 |
| Class C at NAV | 12/08/1993 | 05/29/1992 | 3.26 | 0.67 | 1.27 |
| Class C with 1% Maximum Deferred Sales Charge | — | — | 2.26 | 0.67 | 1.27 |
| Class I at NAV | 08/03/2010 | 05/29/1992 | 4.24 | 1.59 | 2.04 |
|
| Bloomberg Municipal Bond Index | — | — | 3.13% | 1.59% | 2.66% |
| Bloomberg New York Municipal Bond Index | — | — | 3.21 | 1.48 | 2.56 |
| % Total Annual Operating Expense Ratios3 | Class A | Class C | Class I |
| | 0.82% | 1.56% | 0.67% |
| % Distribution Rates/Yields4 | Class A | Class C | Class I |
| Distribution Rate | 2.62% | 1.89% | 2.77% |
| Taxable-Equivalent Distribution Rate | 5.42 | 3.91 | 5.74 |
| SEC 30-day Yield | 2.64 | 1.99 | 2.87 |
| Taxable-Equivalent SEC 30-day Yield | 5.46 | 4.11 | 5.95 |
Growth of $10,000
This graph shows the change in value of a hypothetical investment of $10,000 in Class A of the Fund for the period indicated. For comparison, the same investment is shown in the indicated index.
| Growth of Investment | Amount Invested | Period Beginning | At NAV | With Maximum Sales Charge |
| Class C | $10,000 | 03/31/2014 | $11,348 | N.A. |
| Class I, at minimum investment | $1,000,000 | 03/31/2014 | $1,223,990 | N.A. |
See Endnotes and Additional Disclosures in this report.
Past performance is no guarantee of future results. Returns are historical and are calculated by determining the percentage change in net asset value (NAV) or offering price (as applicable) with all distributions reinvested. Furthermore, returns do not reflect the deduction of taxes that shareholders may have to pay on Fund distributions or upon the redemption of Fund shares. Investment return and principal value will fluctuate so that shares, when redeemed, may be worth more or less than their original cost. Performance for periods less than or equal to one year is cumulative. Performance is for the stated time period only; due to market volatility, current Fund performance may be lower or higher than the quoted return. For performance as of the most recent month-end, please refer to eatonvance.com.
Eaton Vance
New York Municipal Opportunities Fund
March 31, 2024
| Credit Quality (% of total investments)1 |
Footnotes:
| 1 | For purposes of the Fund’s rating restrictions, ratings are based on Moody’s Investors Service, Inc. (“Moody’s”), S&P Global Ratings (“S&P”) or Fitch Ratings (“Fitch”), as applicable. If securities are rated differently by the ratings agencies, the highest rating is applied. Ratings, which are subject to change, apply to the creditworthiness of the issuers of the underlying securities and not to the Fund or its shares. Credit ratings measure the quality of a bond based on the issuer’s creditworthiness, with ratings ranging from AAA, being the highest, to D, being the lowest based on S&P’s measures. Ratings of BBB or higher by S&P or Fitch (Baa or higher by Moody’s) are considered to be investment-grade quality. Credit ratings are based largely on the ratings agency’s analysis at the time of rating. The rating assigned to any particular security is not necessarily a reflection of the issuer’s current financial condition and does not necessarily reflect its assessment of the volatility of a security’s market value or of the liquidity of an investment in the security. Holdings designated as “Not Rated” (if any) are not rated by the national ratings agencies stated above. |
Eaton Vance
New York Municipal Opportunities Fund
March 31, 2024
Endnotes and Additional Disclosures
| † | The views expressed in this report are those of the portfolio manager(s) and are current only through the date stated at the top of this page. These views are subject to change at any time based upon market or other conditions, and Eaton Vance and the Fund(s) disclaim any responsibility to update such views. These views may not be relied upon as investment advice and, because investment decisions are based on many factors, may not be relied upon as an indication of trading intent on behalf of any Eaton Vance fund. This commentary may contain statements that are not historical facts, referred to as “forward-looking statements.” The Fund’s actual future results may differ significantly from those stated in any forward-looking statement, depending on factors such as changes in securities or financial markets or general economic conditions, the volume of sales and purchases of Fund shares, the continuation of investment advisory, administrative and service contracts, and other risks discussed from time to time in the Fund’s filings with the Securities and Exchange Commission. |
| | |
| 1 | Bloomberg Municipal Bond Index is an unmanaged index of municipal bonds traded in the U.S. Bloomberg New York Municipal Bond Index is an unmanaged index of New York municipal bonds. Unless otherwise stated, index returns do not reflect the effect of any applicable sales charges, commissions, expenses, taxes or leverage, as applicable. It is not possible to invest directly in an index. |
| 2 | Total Returns at NAV do not include applicable sales charges. If sales charges were deducted, the returns would be lower. Total Returns shown with maximum sales charge reflect the stated maximum sales charge. Unless otherwise stated, performance does not reflect the deduction of taxes on Fund distributions or redemptions of Fund shares.Effective November 5, 2020, Class C shares automatically convert to Class A shares eight years after purchase. The average annual total returns listed for Class C reflect conversion to Class A shares after eight years. Prior to November 5, 2020, Class C shares automatically converted to Class A shares ten years after purchase.Performance prior to April 25, 2016 reflects the Fund’s performance under its former investment objective and policies. |
| 3 | Source: Fund prospectus. The expense ratios for the current reporting period can be found in the Financial Highlights section of this report. |
| 4 | The Distribution Rate is based on the Fund’s last regular distribution per share in the period (annualized) divided by the Fund’s NAV at the end of the period. The Fund’s distributions may be comprised of amounts characterized for federal income tax purposes as tax-exempt income, qualified and non-qualified ordinary dividends, capital gains and nondividend distributions, also known as return of capital. The Fund will determine the federal income tax character of distributions paid to a shareholder after the end of the calendar year. This is reported on the IRS form 1099-DIV and provided to the shareholder shortly after each year-end. The Fund’s distributions are determined by the investment adviser based on its current assessment of the Fund’s long-term return potential. As portfolio and market conditions change, the rate of distributions paid by the Fund could change. Taxable-equivalent performance is based on the highest combined federal and state income tax rates, where applicable. Lower tax rates would result in lower tax-equivalent performance. Actual tax rates will |
| | vary depending on your income, exemptions and deductions. Rates do not include local taxes. The SEC Yield is a standardized measure based on the estimated yield to maturity of a fund’s investments over a 30-day period and is based on the maximum offer price at the date specified. The SEC Yield is not based on the distributions made by the Fund, which may differ. |
| | Fund profile subject to change due to active management. |
| | Additional Information |
| | Yield curve is a graphical representation of the yields offered by bonds of various maturities. The yield curve flattens when long-term interest rates fall and/or short-term interest rates increase, and the yield curve steepens when long-term interest rates increase and/or short-term interest rates fall. |
| | Duration is a measure of the expected change in price of a bond — in percentage terms — given a one percent change in interest rates, all else being constant. Securities with lower durations tend to be less sensitive to interest rate changes. |
Eaton Vance
New York Municipal Opportunities Fund
March 31, 2024
Example
As a Fund shareholder, you incur two types of costs: (1) transaction costs, including sales charges (loads) on purchases; and (2) ongoing costs, including management fees; distribution and/or service fees; and other Fund expenses. This Example is intended to help you understand your ongoing costs (in dollars) of Fund investing and to compare these costs with the ongoing costs of investing in other mutual funds. The Example is based on an investment of $1,000 invested at the beginning of the period and held for the entire period (October 1, 2023 to March 31, 2024).
Actual Expenses
The first section of the table below provides information about actual account values and actual expenses. You may use the information in this section, together with the amount you invested, to estimate the expenses that you paid over the period. Simply divide your account value by $1,000 (for example, an $8,600 account value divided by $1,000 = 8.6), then multiply the result by the number in the first section under the heading entitled “Expenses Paid During Period” to estimate the expenses you paid on your account during this period.
Hypothetical Example for Comparison Purposes
The second section of the table below provides information about hypothetical account values and hypothetical expenses based on the actual Fund expense ratio and an assumed rate of return of 5% per year (before expenses), which is not the actual Fund return. The hypothetical account values and expenses may not be used to estimate the actual ending account balance or expenses you paid for the period. You may use this information to compare the ongoing costs of investing in your Fund and other funds. To do so, compare this 5% hypothetical example with the 5% hypothetical examples that appear in the shareholder reports of the other funds.
Please note that the expenses shown in the table are meant to highlight your ongoing costs only and do not reflect any transactional costs, such as sales charges (loads). Therefore, the second section of the table is useful in comparing ongoing costs only, and will not help you determine the relative total costs of owning different funds. In addition, if these transactional costs were included, your costs would be higher.
| | Beginning
Account Value
(10/1/23) | Ending
Account Value
(3/31/24) | Expenses Paid
During Period*
(10/1/23 – 3/31/24) | Annualized
Expense
Ratio |
| Actual | | | | |
| Class A | $1,000.00 | $1,074.90 | $4.41 | 0.85% |
| Class C | $1,000.00 | $1,071.80 | $8.24 | 1.59% |
| Class I | $1,000.00 | $1,075.70 | $3.63 | 0.70% |
| |
| Hypothetical | | | | |
| (5% return per year before expenses) | | | | |
| Class A | $1,000.00 | $1,020.75 | $4.29 | 0.85% |
| Class C | $1,000.00 | $1,017.05 | $8.02 | 1.59% |
| Class I | $1,000.00 | $1,021.50 | $3.54 | 0.70% |
| * | Expenses are equal to the Fund’s annualized expense ratio for the indicated Class, multiplied by the average account value over the period, multiplied by 183/366 (to reflect the one-half year period). The Example assumes that the $1,000 was invested at the net asset value per share determined at the close of business on September 30, 2023. |
Eaton Vance
New York Municipal Opportunities Fund
March 31, 2024
| Tax-Exempt Municipal Obligations — 89.9% |
| Security | Principal
Amount
(000's omitted) | Value |
| Education — 5.5% |
| Buffalo and Erie County Industrial Land Development Corp., NY, (Global Concepts Charter School), 5.00%, 10/1/37 | $ | 405 | $ 414,825 |
| Build NYC Resource Corp., NY, (Academic Leadership Charter School), 4.00%, 6/15/29 | | 100 | 96,595 |
| Build NYC Resource Corp., NY, (Grand Concourse Academy Charter School), 5.00%, 7/1/32 | | 300 | 319,320 |
| Dutchess County Local Development Corp., NY, (Culinary Institute of America), 4.00%, 7/1/36 | | 200 | 195,410 |
| Monroe County Industrial Development Corp., NY, (Nazareth College of Rochester): | | | |
| 5.00%, 10/1/24 | | 885 | 887,460 |
| 5.00%, 10/1/25 | | 930 | 942,388 |
| Yonkers Economic Development Corp., NY, (Lamartine/Warburton, LLC - Charter School of Educational Excellence): | | | |
| 4.00%, 10/15/29 | | 330 | 326,925 |
| 4.00%, 10/15/30 | | 410 | 405,117 |
| 5.00%, 10/15/39 | | 80 | 81,078 |
| | | | $ 3,669,118 |
| Electric Utilities — 1.7% |
| Utility Debt Securitization Authority, NY, 5.00%, 12/15/41 | $ | 1,000 | $ 1,159,570 |
| | | | $ 1,159,570 |
| Escrowed/Prerefunded — 2.5% |
| Chautauqua County Capital Resource Corp., NY, (Jamestown Center City Development Corp.), Prerefunded to 11/1/24, 1.75%, 11/1/31 | $ | 1,650 | $ 1,632,708 |
| | | | $ 1,632,708 |
| General Obligations — 6.4% |
| New York, NY: | | | |
| 4.00%, 9/1/46 | $ | 1,000 | $ 976,450 |
| 4.00%, 4/1/50 | | 1,000 | 971,090 |
| 5.00%, 3/15/39 | | 1,500 | 1,729,890 |
| Puerto Rico, 0.00%, 7/1/33 | | 137 | 89,825 |
| Valley Stream, NY: | | | |
| 2.00%, 5/15/25 | | 235 | 227,285 |
| 2.125%, 5/15/26 | | 240 | 226,963 |
| | | | $ 4,221,503 |
| Security | Principal
Amount
(000's omitted) | Value |
| Hospital — 5.0% |
| Jefferson County Civic Facility Development Corp., NY, (Samaritan Medical Center): | | | |
| 4.00%, 11/1/28 | $ | 1,390 | $ 1,340,182 |
| 4.00%, 11/1/29 | | 1,110 | 1,066,433 |
| New York Dormitory Authority, (Montefiore Obligated Group), 4.00%, 9/1/37 | | 400 | 391,432 |
| New York Dormitory Authority, (Northwell Health Obligated Group), 5.00%, 5/1/52 | | 515 | 543,979 |
| | | | $ 3,342,026 |
| Housing — 5.3% |
| New York City Housing Development Corp., NY: | | | |
| 2.85%, 11/1/39 | $ | 990 | $ 820,007 |
| 4.45%, 8/1/43 | | 1,000 | 1,010,160 |
| Sustainability Bonds, 0.90% to 1/1/26 (Put Date), 11/1/60 | | 855 | 801,606 |
| Sustainability Bonds, (SPA: TD Bank, N.A.), 3.42%, 5/1/50(1) | | 350 | 350,000 |
| Westchester County Local Development Corp., NY, (Purchase Housing Corp. II): | | | |
| 5.00%, 6/1/24 | | 165 | 164,982 |
| 5.00%, 6/1/25 | | 170 | 170,656 |
| 5.00%, 6/1/26 | | 170 | 171,710 |
| | | | $ 3,489,121 |
| Industrial Development Revenue — 6.1% |
| Essex County Industrial Development Agency, NY, (International Paper Co.), (AMT), 2.10% to 10/1/24 (Put Date), 3/1/27 | $ | 625 | $ 618,812 |
| New York State Environmental Facilities Corp., (Casella Waste Systems, Inc.): | | | |
| (AMT), 2.875% to 12/3/29 (Put Date), 12/1/44(2) | | 250 | 228,330 |
| (AMT), 3.125% to 6/1/26 (Put Date), 12/1/44(2) | | 1,000 | 967,710 |
| New York Transportation Development Corp., (Delta Air Lines, Inc. - LaGuardia Airport Terminals C&D Redevelopment): | | | |
| (AMT), 4.00%, 10/1/30 | | 1,000 | 1,005,110 |
| (AMT), 6.00%, 4/1/35 | | 550 | 624,800 |
| Niagara Area Development Corp., NY, (Covanta), 3.50%, 11/1/24(2) | | 610 | 607,664 |
| | | | $ 4,052,426 |
| Insured - Electric Utilities — 3.1% |
| Puerto Rico Electric Power Authority, (NPFG), 5.25%, 7/1/29 | $ | 2,050 | $ 2,028,639 |
| | | | $ 2,028,639 |
7
See Notes to Financial Statements.
Eaton Vance
New York Municipal Opportunities Fund
March 31, 2024
Portfolio of Investments — continued
| Security | Principal
Amount
(000's omitted) | Value |
| Insured - General Obligations — 2.0% |
| Clinton County, NY, (AGM), (AMT), 3.50%, 6/1/27 | $ | 1,000 | $ 981,910 |
| Nassau County, NY, (AGM), 4.00%, 4/1/47 | | 375 | 362,374 |
| | | | $ 1,344,284 |
| Insured - Hospital — 2.2% |
| Westchester County Local Development Corp., NY, (Westchester Medical Center Obligated Group), (AGM), 5.00%, 11/1/47 | $ | 1,350 | $ 1,439,883 |
| | | | $ 1,439,883 |
| Insured - Solid Waste — 1.4% |
| Onondaga County Resource Recovery Agency, NY: | | | |
| (AGM), (AMT), 5.00%, 5/1/26 | $ | 150 | $ 154,596 |
| (AGM), (AMT), 5.00%, 5/1/28 | | 740 | 779,627 |
| | | | $ 934,223 |
| Insured - Transportation — 0.7% |
| Metropolitan Transportation Authority, NY, Green Bonds, (BAM), 4.00%, 11/15/48 | $ | 500 | $ 478,800 |
| | | | $ 478,800 |
| Lease Revenue/Certificates of Participation — 5.1% |
| Battery Park City Authority, NY: | | | |
| (SPA: TD Bank, N.A.), 3.42%, 11/1/38(1) | $ | 1,300 | $ 1,300,000 |
| Sustainability Bonds, 5.00%, 11/1/53 | | 1,000 | 1,100,110 |
| New York City Transitional Finance Authority, NY, (Building Aid), 4.00%, 7/15/45 | | 1,000 | 967,420 |
| | | | $ 3,367,530 |
| Other Revenue — 3.8% |
| Hudson Yards Infrastructure Corp., NY: | | | |
| 5.00%, 2/15/42 | $ | 1,475 | $ 1,533,852 |
| Green Bonds, 4.00%, 2/15/41 | | 1,000 | 1,014,320 |
| | | | $ 2,548,172 |
| Senior Living/Life Care — 3.8% |
| Brookhaven Local Development Corp., NY, (Jefferson's Ferry): | | | |
| 4.00%, 11/1/45 | $ | 300 | $ 266,103 |
| 5.25%, 11/1/25 | | 750 | 758,910 |
| Broome County Local Development Corp., NY, (Good Shepherd Village at Endwell, Inc.), 3.50%, 7/1/25 | | 455 | 444,358 |
| Suffolk County Economic Development Corp., NY, (Peconic Landing at Southold, Inc.), 5.00%, 12/1/34 | | 1,000 | 1,040,920 |
| | | | $ 2,510,291 |
| Security | Principal
Amount
(000's omitted) | Value |
| Special Tax Revenue — 18.8% |
| American Samoa Economic Development Authority, 5.00%, 9/1/38(2) | $ | 200 | $ 200,650 |
| New York City Transitional Finance Authority, NY, Future Tax Revenue: | | | |
| 4.00%, 8/1/38 | | 1,000 | 1,034,610 |
| 4.00%, 8/1/48 | | 1,000 | 967,600 |
| 4.375%, 5/1/53 | | 1,000 | 1,001,270 |
| New York Dormitory Authority, Sales Tax Revenue, 5.00%, 3/15/45 | | 1,000 | 1,048,840 |
| New York State Urban Development Corp., Personal Income Tax Revenue: | | | |
| 4.00%, 3/15/45 | | 255 | 247,610 |
| 4.00%, 3/15/48 | | 1,000 | 958,030 |
| Green Bonds, 4.00%, 3/15/50 | | 995 | 951,210 |
| New York State Urban Development Corp., Sales Tax Revenue: | | | |
| 4.00%, 3/15/39 | | 1,330 | 1,356,773 |
| 5.00%, 3/15/49 | | 1,000 | 1,096,620 |
| Triborough Bridge and Tunnel Authority, NY: | | | |
| Series 2021A, 5.00%, 5/15/51 | | 1,000 | 1,059,420 |
| Series 2021C, 5.00%, 5/15/51 | | 1,000 | 1,063,000 |
| Green Bonds, 5.25%, 5/15/47 | | 1,000 | 1,109,550 |
| Triborough Bridge and Tunnel Authority, NY, Sales Tax Revenue, 4.00%, 5/15/54 | | 335 | 321,533 |
| | | | $12,416,716 |
| Transportation — 10.9% |
| Metropolitan Transportation Authority, NY: | | | |
| Green Bonds, 4.00%, 11/15/45 | $ | 415 | $ 398,699 |
| Green Bonds, 4.75%, 11/15/45 | | 95 | 97,888 |
| New York Transportation Development Corp., (LaGuardia Airport Terminal B Redevelopment), (AMT), 5.00%, 7/1/46 | | 1,000 | 986,400 |
| New York Transportation Development Corp., (Terminal 4 John F. Kennedy International Airport), 4.00%, 12/1/42 | | 200 | 191,252 |
| Port Authority of New York and New Jersey: | | | |
| (AMT), 5.00%, 10/15/35 | | 740 | 768,260 |
| (AMT), 5.00%, 8/1/37 | | 1,000 | 1,099,090 |
| Triborough Bridge and Tunnel Authority, NY: | | | |
| 3.00%, 11/15/46 | | 1,000 | 792,270 |
| 4.00%, 11/15/38 | | 1,750 | 1,788,640 |
| 5.00%, 11/15/51 | | 1,000 | 1,067,900 |
| | | | $ 7,190,399 |
8
See Notes to Financial Statements.
Eaton Vance
New York Municipal Opportunities Fund
March 31, 2024
Portfolio of Investments — continued
| Security | Principal
Amount
(000's omitted) | Value |
| Water and Sewer — 5.6% |
| New York City Municipal Water Finance Authority, NY, (Water and Sewer System): | | | |
| 4.00%, 6/15/51 | $ | 1,500 | $ 1,458,045 |
| 5.25%, 6/15/47 | | 1,000 | 1,118,400 |
| (SPA: TD Bank, N.A.), 3.42%, 6/15/36(1) | | 1,100 | 1,100,000 |
| | | | $ 3,676,445 |
Total Tax-Exempt Municipal Obligations
(identified cost $58,655,746) | | | $59,501,854 |
| Taxable Municipal Obligations — 9.1% |
| Security | Principal
Amount
(000's omitted) | Value |
| Education — 0.7% |
| New York Dormitory Authority, (State University of New York), 1.366%, 7/1/25 | $ | 505 | $ 482,507 |
| | | | $ 482,507 |
| General Obligations — 1.5% |
| New York, NY, 1.50%, 8/1/28 | $ | 1,000 | $ 880,460 |
| Puerto Rico, GO Contingent Value Instrument, 0.00%, 11/1/43 | | 131 | 76,067 |
| | | | $ 956,527 |
| Housing — 2.6% |
| New York Housing Finance Agency: | | | |
| (SPA: Barclays Bank PLC), 5.37%, 11/1/45(1) | $ | 600 | $ 600,000 |
| Social Bonds, (SPA: TD Bank, N.A.), 5.35%, 11/1/55(1) | | 1,100 | 1,100,000 |
| | | | $ 1,700,000 |
| Lease Revenue/Certificates of Participation — 1.5% |
| New York City Transitional Finance Authority, NY, (Building Aid), 3.23%, 7/15/24 | $ | 1,000 | $ 993,420 |
| | | | $ 993,420 |
| Special Tax Revenue — 2.8% |
| Metropolitan Transportation Authority, NY, Payroll Mobility Tax Revenue, 5.37%, 12/19/24 | $ | 1,000 | $ 999,590 |
| Security | Principal
Amount
(000's omitted) | Value |
| Special Tax Revenue (continued) |
| New York Dormitory Authority, Personal Income Tax Revenue, Escrowed to Maturity, 1.538%, 3/15/27 | $ | 415 | $ 380,447 |
| Oneida Indian Nation of New York, 7.25%, 9/1/34(2) | | 500 | 493,495 |
| | | | $ 1,873,532 |
Total Taxable Municipal Obligations
(identified cost $6,117,410) | | | $ 6,005,986 |
Total Investments — 99.0%
(identified cost $64,773,156) | | | $65,507,840 |
| Other Assets, Less Liabilities — 1.0% | | | $ 639,314 |
| Net Assets — 100.0% | | | $66,147,154 |
| The percentage shown for each investment category in the Portfolio of Investments is based on net assets. |
| (1) | Variable rate demand obligation that may be tendered at par on any day for payment the lesser of 5 business days or 7 calendar days. The stated interest rate, which generally resets weekly, is determined by the remarketing agent and represents the rate in effect at March 31, 2024. |
| (2) | Security exempt from registration under Rule 144A of the Securities Act of 1933, as amended. These securities may be sold in certain transactions in reliance on an exemption from registration (normally to qualified institutional buyers). At March 31, 2024, the aggregate value of these securities is $2,497,849 or 3.8% of the Fund's net assets. |
| The Fund invests primarily in debt securities issued by New York municipalities. The ability of the issuers of the debt securities to meet their obligations may be affected by economic developments in a specific industry or municipality. At March 31, 2024, 9.5% of total investments are backed by bond insurance of various financial institutions and financial guaranty assurance agencies. The aggregate percentage insured by an individual financial institution or financial guaranty assurance agency ranged from 0.7% to 5.7% of total investments. |
| Abbreviations: |
| AGM | – Assured Guaranty Municipal Corp. |
| AMT | – Interest earned from these securities may be considered a tax preference item for purposes of the Federal Alternative Minimum Tax. |
| BAM | – Build America Mutual Assurance Co. |
| NPFG | – National Public Finance Guarantee Corp. |
| SPA | – Standby Bond Purchase Agreement |
9
See Notes to Financial Statements.
Eaton Vance
New York Municipal Opportunities Fund
March 31, 2024
Statement of Assets and Liabilities
| | March 31, 2024 |
| Assets | |
| Investments, at value (identified cost $64,773,156) | $ 65,507,840 |
| Cash | 44,364 |
| Interest receivable | 754,232 |
| Receivable for investments sold | 9,859 |
| Receivable for Fund shares sold | 86,816 |
| Trustees' deferred compensation plan | 28,315 |
| Total assets | $66,431,426 |
| Liabilities | |
| Payable for Fund shares redeemed | $ 88,539 |
| Distributions payable | 42,807 |
| Payable to affiliates: | |
| Investment adviser fee | 23,302 |
| Distribution and service fees | 5,269 |
| Trustees' deferred compensation plan | 28,315 |
| Accrued expenses | 96,040 |
| Total liabilities | $ 284,272 |
| Net Assets | $66,147,154 |
| Sources of Net Assets | |
| Paid-in capital | $ 69,519,095 |
| Accumulated loss | (3,371,941) |
| Net Assets | $66,147,154 |
| Class A Shares | |
| Net Assets | $ 29,896,173 |
| Shares Outstanding | 3,157,011 |
Net Asset Value and Redemption Price Per Share
(net assets ÷ shares of beneficial interest outstanding) | $ 9.47 |
Maximum Offering Price Per Share
(100 ÷ 96.75 of net asset value per share) | $ 9.79 |
| Class C Shares | |
| Net Assets | $ 1,783,631 |
| Shares Outstanding | 198,208 |
Net Asset Value and Offering Price Per Share*
(net assets ÷ shares of beneficial interest outstanding) | $ 9.00 |
| Class I Shares | |
| Net Assets | $ 34,467,350 |
| Shares Outstanding | 3,639,402 |
Net Asset Value, Offering Price and Redemption Price Per Share
(net assets ÷ shares of beneficial interest outstanding) | $ 9.47 |
| On sales of $100,000 or more, the offering price of Class A shares is reduced. |
| * | Redemption price per share is equal to the net asset value less any applicable contingent deferred sales charge. |
10
See Notes to Financial Statements.
Eaton Vance
New York Municipal Opportunities Fund
March 31, 2024
| | Year Ended |
| | March 31, 2024 |
| Investment Income | |
| Interest income | $ 2,442,029 |
| Total investment income | $2,442,029 |
| Expenses | |
| Investment adviser fee | $ 264,524 |
| Distribution and service fees: | |
| Class A | 46,666 |
| Class C | 21,347 |
| Trustees’ fees and expenses | 4,651 |
| Custodian fee | 24,587 |
| Transfer and dividend disbursing agent fees | 32,848 |
| Legal and accounting services | 65,229 |
| Printing and postage | 7,305 |
| Registration fees | 8,410 |
| Miscellaneous | 23,710 |
| Total expenses | $ 499,277 |
| Net investment income | $1,942,752 |
| Realized and Unrealized Gain (Loss) | |
| Net realized gain (loss): | |
| Investment transactions | $ (801,151) |
| Futures contracts | 52,171 |
| Net realized loss | $ (748,980) |
| Change in unrealized appreciation (depreciation): | |
| Investments | $ 1,334,447 |
| Net change in unrealized appreciation (depreciation) | $1,334,447 |
| Net realized and unrealized gain | $ 585,467 |
| Net increase in net assets from operations | $2,528,219 |
11
See Notes to Financial Statements.
Eaton Vance
New York Municipal Opportunities Fund
March 31, 2024
Statements of Changes in Net Assets
| | Year Ended March 31, |
| | 2024 | 2023 |
| Increase (Decrease) in Net Assets | | |
| From operations: | | |
| Net investment income | $ 1,942,752 | $ 1,598,645 |
| Net realized loss | (748,980) | (3,309,339) |
| Net change in unrealized appreciation (depreciation) | 1,334,447 | 1,040,014 |
| Net increase (decrease) in net assets from operations | $ 2,528,219 | $ (670,680) |
| Distributions to shareholders: | | |
| Class A | $ (883,013) | $ (820,054) |
| Class C | (49,082) | (49,117) |
| Class I | (928,686) | (686,691) |
| Total distributions to shareholders | $ (1,860,781) | $ (1,555,862) |
| Transactions in shares of beneficial interest: | | |
| Class A | $ (2,630,634) | $ (3,785,642) |
| Class C | (1,084,407) | (1,085,543) |
| Class I | 5,949,024 | (7,007,527) |
| Net increase (decrease) in net assets from Fund share transactions | $ 2,233,983 | $(11,878,712) |
| Net increase (decrease) in net assets | $ 2,901,421 | $(14,105,254) |
| Net Assets | | |
| At beginning of year | $ 63,245,733 | $ 77,350,987 |
| At end of year | $66,147,154 | $ 63,245,733 |
12
See Notes to Financial Statements.
Eaton Vance
New York Municipal Opportunities Fund
March 31, 2024
| | Class A |
| | Year Ended March 31, |
| | 2024 | 2023 | 2022 | 2021 | 2020 |
| Net asset value — Beginning of year | $ 9.36 | $ 9.63 | $ 10.30 | $ 9.89 | $ 9.87 |
| Income (Loss) From Operations | | | | | |
| Net investment income(1) | $ 0.28 | $ 0.22 | $ 0.17 | $ 0.19 | $ 0.21 |
| Net realized and unrealized gain (loss) | 0.09 | (0.28) | (0.62) | 0.41 | 0.02 (2) |
| Total income (loss) from operations | $ 0.37 | $ (0.06) | $ (0.45) | $ 0.60 | $ 0.23 |
| Less Distributions | | | | | |
| From net investment income | $ (0.26) | $ (0.21) | $ (0.17) | $ (0.19) | $ (0.21) |
| From net realized gain | — | — | (0.05) | — | — |
| Total distributions | $ (0.26) | $ (0.21) | $ (0.22) | $ (0.19) | $ (0.21) |
| Net asset value — End of year | $ 9.47 | $ 9.36 | $ 9.63 | $ 10.30 | $ 9.89 |
| Total Return(3) | 4.09% | (0.53)% | (4.47)% | 6.11% | 2.33% |
| Ratios/Supplemental Data | | | | | |
| Net assets, end of year (000’s omitted) | $29,896 | $32,205 | $37,054 | $41,461 | $41,504 |
| Ratios (as a percentage of average daily net assets):(4) | | | | | |
| Total expenses | 0.82% | 0.82% | 0.73% | 0.74% | 0.74% |
| Net expenses | 0.82% | 0.82% | 0.73% | 0.74% | 0.74% |
| Net investment income | 2.97% | 2.38% | 1.67% | 1.91% | 2.08% |
| Portfolio Turnover | 76% | 65% | 38% | 77% | 102% |
| (1) | Computed using average shares outstanding. |
| (2) | The per share amount is not in accord with the net realized and unrealized gain (loss) for the period because of the timing of Fund share transactions and the amount of the per share realized and unrealized gains and losses at such time. |
| (3) | Returns are historical and are calculated by determining the percentage change in net asset value with all distributions reinvested and do not reflect the effect of sales charges. |
| (4) | Total expenses do not reflect amounts reimbursed and/or waived by the adviser and certain of its affiliates, if applicable. Net expenses are net of all reductions and represent the net expenses paid by the Fund. |
13
See Notes to Financial Statements.
Eaton Vance
New York Municipal Opportunities Fund
March 31, 2024
Financial Highlights — continued
| | Class C |
| | Year Ended March 31, |
| | 2024 | 2023 | 2022 | 2021 | 2020 |
| Net asset value — Beginning of year | $ 8.90 | $ 9.15 | $ 9.79 | $ 9.41 | $ 9.39 |
| Income (Loss) From Operations | | | | | |
| Net investment income(1) | $ 0.19 | $ 0.14 | $ 0.09 | $ 0.11 | $ 0.13 |
| Net realized and unrealized gain (loss) | 0.09 | (0.25) | (0.59) | 0.38 | 0.02 (2) |
| Total income (loss) from operations | $ 0.28 | $ (0.11) | $ (0.50) | $ 0.49 | $ 0.15 |
| Less Distributions | | | | | |
| From net investment income | $ (0.18) | $ (0.14) | $ (0.09) | $ (0.11) | $ (0.13) |
| From net realized gain | — | — | (0.05) | — | — |
| Total distributions | $ (0.18) | $ (0.14) | $ (0.14) | $ (0.11) | $ (0.13) |
| Net asset value — End of year | $ 9.00 | $ 8.90 | $ 9.15 | $ 9.79 | $ 9.41 |
| Total Return(3) | 3.26% | (1.20)% | (5.19)% | 5.22% | 1.58% |
| Ratios/Supplemental Data | | | | | |
| Net assets, end of year (000’s omitted) | $1,784 | $2,867 | $4,064 | $5,378 | $9,441 |
| Ratios (as a percentage of average daily net assets):(4) | | | | | |
| Total expenses | 1.56% | 1.56% | 1.48% | 1.49% | 1.50% |
| Net expenses | 1.56% | 1.56% | 1.48% | 1.49% | 1.50% |
| Net investment income | 2.20% | 1.61% | 0.91% | 1.18% | 1.33% |
| Portfolio Turnover | 76% | 65% | 38% | 77% | 102% |
| (1) | Computed using average shares outstanding. |
| (2) | The per share amount is not in accord with the net realized and unrealized gain (loss) for the period because of the timing of Fund share transactions and the amount of the per share realized and unrealized gains and losses at such time. |
| (3) | Returns are historical and are calculated by determining the percentage change in net asset value with all distributions reinvested and do not reflect the effect of sales charges. |
| (4) | Total expenses do not reflect amounts reimbursed and/or waived by the adviser and certain of its affiliates, if applicable. Net expenses are net of all reductions and represent the net expenses paid by the Fund. |
14
See Notes to Financial Statements.
Eaton Vance
New York Municipal Opportunities Fund
March 31, 2024
Financial Highlights — continued
| | Class I |
| | Year Ended March 31, |
| | 2024 | 2023 | 2022 | 2021 | 2020 |
| Net asset value — Beginning of year | $ 9.36 | $ 9.63 | $ 10.30 | $ 9.89 | $ 9.87 |
| Income (Loss) From Operations | | | | | |
| Net investment income(1) | $ 0.29 | $ 0.24 | $ 0.19 | $ 0.21 | $ 0.23 |
| Net realized and unrealized gain (loss) | 0.10 | (0.28) | (0.62) | 0.41 | 0.02 (2) |
| Total income (loss) from operations | $ 0.39 | $ (0.04) | $ (0.43) | $ 0.62 | $ 0.25 |
| Less Distributions | | | | | |
| From net investment income | $ (0.28) | $ (0.23) | $ (0.19) | $ (0.21) | $ (0.23) |
| From net realized gain | — | — | (0.05) | — | — |
| Total distributions | $ (0.28) | $ (0.23) | $ (0.24) | $ (0.21) | $ (0.23) |
| Net asset value — End of year | $ 9.47 | $ 9.36 | $ 9.63 | $ 10.30 | $ 9.89 |
| Total Return(3) | 4.24% | (0.38)% | (4.32)% | 6.27% | 2.48% |
| Ratios/Supplemental Data | | | | | |
| Net assets, end of year (000’s omitted) | $34,467 | $28,174 | $36,233 | $34,277 | $25,454 |
| Ratios (as a percentage of average daily net assets):(4) | | | | | |
| Total expenses | 0.67% | 0.67% | 0.58% | 0.59% | 0.59% |
| Net expenses | 0.67% | 0.67% | 0.58% | 0.59% | 0.59% |
| Net investment income | 3.12% | 2.53% | 1.82% | 2.05% | 2.23% |
| Portfolio Turnover | 76% | 65% | 38% | 77% | 102% |
| (1) | Computed using average shares outstanding. |
| (2) | The per share amount is not in accord with the net realized and unrealized gain (loss) for the period because of the timing of Fund share transactions and the amount of the per share realized and unrealized gains and losses at such time. |
| (3) | Returns are historical and are calculated by determining the percentage change in net asset value with all distributions reinvested. |
| (4) | Total expenses do not reflect amounts reimbursed and/or waived by the adviser and certain of its affiliates, if applicable. Net expenses are net of all reductions and represent the net expenses paid by the Fund. |
15
See Notes to Financial Statements.
Eaton Vance
New York Municipal Opportunities Fund
March 31, 2024
Notes to Financial Statements
1 Significant Accounting Policies
Eaton Vance New York Municipal Opportunities Fund (the Fund) is a non-diversified series of Eaton Vance Investment Trust (the Trust). The Trust is a Massachusetts business trust registered under the Investment Company Act of 1940, as amended (the 1940 Act), as an open-end management investment company. The Fund’s investment objective is to seek to maximize after-tax total return. The Fund offers three classes of shares. Class A shares are generally sold subject to a sales charge imposed at time of purchase. Class C shares are sold at net asset value and are generally subject to a contingent deferred sales charge (see Note 5). Effective November 5, 2020, Class C shares automatically convert to Class A shares eight years after their purchase as described in the Fund’s prospectus. Class I shares are sold at net asset value and are not subject to a sales charge. Each class represents a pro rata interest in the Fund, but votes separately on class-specific matters and (as noted below) is subject to different expenses. Realized and unrealized gains and losses are allocated daily to each class of shares based on the relative net assets of each class to the total net assets of the Fund. Net investment income, other than class-specific expenses, is allocated daily to each class of shares based upon the ratio of the value of each class’s paid shares to the total value of all paid shares. Each class of shares differs in its distribution plan and certain other class-specific expenses.
The following is a summary of significant accounting policies of the Fund. The policies are in conformity with accounting principles generally accepted in the United States of America (U.S. GAAP). The Fund is an investment company and follows accounting and reporting guidance in the Financial Accounting Standards Board (FASB) Accounting Standards Codification Topic 946.
A Investment Valuation—The following methodologies are used to determine the market value or fair value of investments.
Debt Obligations. Debt obligations are generally valued on the basis of valuations provided by third party pricing services, as derived from such services’ pricing models. Inputs to the models may include, but are not limited to, reported trades, executable bid and ask prices, broker/dealer quotations, prices or yields of securities with similar characteristics, interest rates, anticipated prepayments, benchmark curves or information pertaining to the issuer, as well as industry and economic events. The pricing services may use a matrix approach, which considers information regarding securities with similar characteristics to determine the valuation for a security. Short-term debt obligations purchased with a remaining maturity of sixty days or less for which a valuation from a third party pricing service is not readily available may be valued at amortized cost, which approximates fair value.
Fair Valuation. In connection with Rule 2a-5 of the 1940 Act, the Trustees have designated the Fund’s investment adviser as its valuation designee. Investments for which valuations or market quotations are not readily available or are deemed unreliable are valued by the investment adviser, as valuation designee, at fair value using methods that most fairly reflect the security’s “fair value”, which is the amount that the Fund might reasonably expect to receive for the security upon its current sale in the ordinary course. Each such determination is based on a consideration of relevant factors, which are likely to vary from one pricing context to another. These factors may include, but are not limited to, the type of security, the existence of any contractual restrictions on the security’s disposition, the price and extent of public trading in similar securities of the issuer or of comparable companies or entities, quotations or relevant information obtained from broker/dealers or other market participants, information obtained from the issuer, analysts, and/or the appropriate stock exchange (for exchange-traded securities), an analysis of the company's or entity’s financial statements, and an evaluation of the forces that influence the issuer and the market(s) in which the security is purchased and sold.
B Investment Transactions and Related Income—Investment transactions for financial statement purposes are accounted for on a trade date basis. Realized gains and losses on investments sold are determined on the basis of identified cost. Interest income is recorded on the basis of interest accrued, adjusted for amortization of premium or accretion of discount.
C Federal Taxes—The Fund’s policy is to comply with the provisions of the Internal Revenue Code applicable to regulated investment companies and to distribute to shareholders each year substantially all of its taxable, if any, and tax-exempt net investment income, and all or substantially all of its net realized capital gains. Accordingly, no provision for federal income or excise tax is necessary. The Fund intends to satisfy conditions which will enable it to designate distributions from the interest income generated by its investments in non-taxable municipal securities, which are exempt from regular federal income tax when received by the Fund, as exempt-interest dividends. The portion of such interest, if any, earned on private activity bonds issued after August 7, 1986, may be considered a tax preference item to shareholders.
As of March 31, 2024, the Fund had no uncertain tax positions that would require financial statement recognition, de-recognition, or disclosure. The Fund files a U.S. federal income tax return annually after its fiscal year-end, which is subject to examination by the Internal Revenue Service for a period of three years from the date of filing.
D Expenses—The majority of expenses of the Trust are directly identifiable to an individual fund. Expenses which are not readily identifiable to a specific fund are allocated taking into consideration, among other things, the nature and type of expense and the relative size of the funds.
E Legal Fees— Legal fees and other related expenses incurred as part of negotiations of the terms and requirement of capital infusions, or that are expected to result in the restructuring of, or a plan of reorganization for, an investment are recorded as realized losses. Ongoing expenditures to protect or enhance an investment are treated as operating expenses.
F Use of Estimates—The preparation of the financial statements in conformity with U.S. GAAP requires management to make estimates and assumptions that affect the reported amounts of assets and liabilities at the date of the financial statements and the reported amounts of income and expense during the reporting period. Actual results could differ from those estimates.
Eaton Vance
New York Municipal Opportunities Fund
March 31, 2024
Notes to Financial Statements — continued
G Indemnifications—Under the Trust’s organizational documents, its officers and Trustees may be indemnified against certain liabilities and expenses arising out of the performance of their duties to the Fund. Under Massachusetts law, if certain conditions prevail, shareholders of a Massachusetts business trust (such as the Trust) could be deemed to have personal liability for the obligations of the Trust. However, the Trust’s Declaration of Trust contains an express disclaimer of liability on the part of Fund shareholders and the By-laws provide that the Trust shall assume, upon request by the shareholder, the defense on behalf of any Fund shareholders. Moreover, the By-laws also provide for indemnification out of Fund property of any shareholder held personally liable solely by reason of being or having been a shareholder for all loss or expense arising from such liability. Additionally, in the normal course of business, the Fund enters into agreements with service providers that may contain indemnification clauses. The Fund's maximum exposure under these arrangements is unknown as this would involve future claims that may be made against the Fund that have not yet occurred.
H Futures Contracts—Upon entering into a futures contract, the Fund is required to deposit with the broker, either in cash or securities, an amount equal to a certain percentage of the contract amount (initial margin). Subsequent payments, known as variation margin, are made or received by the Fund each business day, depending on the daily fluctuations in the value of the underlying security, and are recorded as unrealized gains or losses by the Fund. Gains (losses) are realized upon the expiration or closing of the futures contracts. Should market conditions change unexpectedly, the Fund may not achieve the anticipated benefits of the futures contracts and may realize a loss. Futures contracts have minimal counterparty risk as they are exchange traded and the clearinghouse for the exchange is substituted as the counterparty, guaranteeing counterparty performance.
2 Distributions to Shareholders and Income Tax Information
The net investment income of the Fund is determined daily and substantially all of the net investment income so determined is declared as a dividend to shareholders of record at the time of declaration. Distributions are declared separately for each class of shares. Distributions are paid monthly. Distributions of realized capital gains are made at least annually. Shareholders may reinvest income and capital gain distributions in additional shares of the same class of the Fund at the net asset value as of the reinvestment date or, at the election of the shareholder, receive distributions in cash. Distributions to shareholders are determined in accordance with income tax regulations, which may differ from U.S. GAAP. As required by U.S. GAAP, only distributions in excess of tax basis earnings and profits are reported in the financial statements as a return of capital. Permanent differences between book and tax accounting relating to distributions are reclassified to paid-in capital. For tax purposes, distributions from short-term capital gains are considered to be from ordinary income.
The tax character of distributions declared for the years ended March 31, 2024 and March 31, 2023 was as follows:
| | Year Ended March 31, |
| | 2024 | 2023 |
| Tax-exempt income | $1,728,903 | $1,555,862 |
| Ordinary income | $ 131,878 | $ — |
As of March 31, 2024, the components of distributable earnings (accumulated loss) on a tax basis were as follows:
| Undistributed tax-exempt income | $ 651 |
| Deferred capital losses | (4,323,659) |
| Net unrealized appreciation | 993,874 |
| Distributions payable | (42,807) |
| Accumulated loss | $(3,371,941) |
At March 31, 2024, the Fund, for federal income tax purposes, had deferred capital losses of $4,323,659 which would reduce its taxable income arising from future net realized gains on investment transactions, if any, to the extent permitted by the Internal Revenue Code, and thus would reduce the amount of distributions to shareholders, which would otherwise be necessary to relieve the Fund of any liability for federal income or excise tax. The deferred capital losses are treated as arising on the first day of the Fund’s next taxable year and retain the same short-term or long-term character as when originally deferred. Of the deferred capital losses at March 31, 2024, $1,660,691 are short-term and $2,662,968 are long-term.
Eaton Vance
New York Municipal Opportunities Fund
March 31, 2024
Notes to Financial Statements — continued
The cost and unrealized appreciation (depreciation) of investments of the Fund at March 31, 2024, as determined on a federal income tax basis, were as follows:
| Aggregate cost | $64,513,966 |
| Gross unrealized appreciation | $ 1,873,545 |
| Gross unrealized depreciation | (879,671) |
| Net unrealized appreciation | $ 993,874 |
3 Investment Adviser Fee and Other Transactions with Affiliates
The investment adviser fee is earned by Boston Management and Research (BMR), an indirect, wholly-owned subsidiary of Morgan Stanley, as compensation for investment advisory services rendered to the Fund. The investment adviser fee is based upon a percentage of total daily net assets plus a percentage of total daily gross income (i.e., income other than gains from the sale of securities) as follows and is payable monthly:
| Total Daily Net Assets | Annual Asset
Rate | Daily Income
Rate |
| Up to $500 million | 0.300% | 3.000% |
| $500 million but less than $1 billion | 0.275% | 2.750% |
| $1 billion but less than $1.5 billion | 0.250% | 2.500% |
| $1.5 billion but less than $2 billion | 0.225% | 2.250% |
| $2 billion but less than $3 billion | 0.200% | 2.000% |
| $3 billion and over | 0.175% | 1.750% |
For the year ended March 31, 2024, the Fund's investment adviser fee amounted to $264,524 or 0.41% of the Fund’s average daily net assets.
Eaton Vance Management (EVM), an affiliate of BMR, serves as the administrator of the Fund, but receives no compensation. EVM provides sub-transfer agency and related services to the Fund pursuant to a Sub-Transfer Agency Support Services Agreement. For the year ended March 31, 2024, EVM earned $8,332 from the Fund pursuant to such agreement, which is included in transfer and dividend disbursing agent fees on the Statement of Operations.The Fund was informed that Eaton Vance Distributors, Inc. (EVD), an affiliate of EVM and the Fund's principal underwriter, received $550 as its portion of the sales charge on sales of Class A shares for the year ended March 31, 2024. EVD also received distribution and service fees from Class A and Class C shares (see Note 4).
Trustees and officers of the Fund who are members of EVM’s or BMR’s organizations receive remuneration for their services to the Fund out of the investment adviser fee. Trustees of the Fund who are not affiliated with the investment adviser may elect to defer receipt of all or a percentage of their annual fees in accordance with the terms of the Trustees Deferred Compensation Plan. Certain officers and Trustees of the Fund are officers of the above organizations.
4 Distribution Plans
The Fund has in effect a distribution plan for Class A shares (Class A Plan) pursuant to Rule 12b-1 under the 1940 Act. Pursuant to the Class A Plan, the Fund pays EVD a distribution and service fee not exceeding 0.25% per annum of its average daily net assets attributable to Class A shares for distribution services and facilities provided to the Fund by EVD, as well as for personal services and/or the maintenance of shareholder accounts. The Trustees approved distribution and service fee payments equal to 0.15% per annum of the Fund's average daily net assets attributable to Class A shares. Distribution and service fees paid or accrued to EVD for the year ended March 31, 2024 amounted to $46,666 for Class A shares.
The Fund also has in effect a distribution plan for Class C shares (Class C Plan) pursuant to Rule 12b-1 under the 1940 Act. Pursuant to the Class C Plan, the Fund pays EVD amounts equal to 0.75% per annum of its average daily net assets attributable to Class C shares for providing ongoing distribution services and facilities to the Fund. For the year ended March 31, 2024, the Fund paid or accrued to EVD $17,789 for Class C shares.
Eaton Vance
New York Municipal Opportunities Fund
March 31, 2024
Notes to Financial Statements — continued
Pursuant to the Class C Plan, the Fund also makes payments of service fees to EVD, financial intermediaries and other persons in amounts not exceeding 0.25% per annum of its average daily net assets attributable to Class C shares. The Trustees approved service fee payments equal to 0.15% per annum of the Fund’s average daily net assets attributable to Class C shares. Service fees paid or accrued are for personal services and/or the maintenance of shareholder accounts. They are separate and distinct from the Class C sales commissions and distribution fees payable to EVD. Service fees paid or accrued for the year ended March 31, 2024 amounted to $3,558 for Class C shares.
Distribution and service fees are subject to the limitations contained in the Financial Industry Regulatory Authority Rule 2341(d).
5 Contingent Deferred Sales Charges
A contingent deferred sales charge (CDSC) of 1% generally is imposed on redemptions of Class C shares made within 12 months of purchase. Class A shares may be subject to a 0.75% CDSC if redeemed within 12 months of purchase (depending on the circumstances of purchase). Generally, the CDSC is based upon the lower of the net asset value at date of redemption or date of purchase. No charge is levied on shares acquired by reinvestment of dividends or capital gain distributions. For the year ended March 31, 2024, the Fund was informed that EVD received no CDSCs paid by Class A and Class C shareholders.
6 Purchases and Sales of Investments
Purchases and sales of investments, other than short-term obligations and including maturities, aggregated $49,368,358 and $48,487,279, respectively, for the year ended March 31, 2024.
7 Shares of Beneficial Interest
The Fund’s Declaration of Trust permits the Trustees to issue an unlimited number of full and fractional shares of beneficial interest (without par value). Such shares may be issued in a number of different series (such as the Fund) and classes. Transactions in Fund shares, including direct exchanges pursuant to share class conversions, were as follows:
| | Year Ended
March 31, 2024 | | Year Ended
March 31, 2023 |
| | Shares | Amount | | Shares | Amount |
| Class A | | | | | |
| Sales | 149,769 | $ 1,391,046 | | 355,396 | $ 3,297,209 |
| Issued to shareholders electing to receive payments of distributions in Fund shares | 79,729 | 741,060 | | 74,910 | 691,830 |
| Redemptions | (513,119) | (4,762,740) | | (838,804) | (7,774,681) |
| Net decrease | (283,621) | $ (2,630,634) | | (408,498) | $ (3,785,642) |
| Class C | | | | | |
| Sales | 3,721 | $ 32,876 | | 105,449 | $ 928,915 |
| Issued to shareholders electing to receive payments of distributions in Fund shares | 2,688 | 23,703 | | 2,771 | 24,347 |
| Redemptions | (130,486) | (1,140,986) | | (230,186) | (2,038,805) |
| Net decrease | (124,077) | $ (1,084,407) | | (121,966) | $ (1,085,543) |
| Class I | | | | | |
| Sales | 1,352,823 | $ 12,605,556 | | 1,932,500 | $ 17,820,273 |
| Issued to shareholders electing to receive payments of distributions in Fund shares | 61,132 | 568,512 | | 43,493 | 401,616 |
| Redemptions | (784,135) | (7,225,044) | | (2,729,722) | (25,229,416) |
| Net increase (decrease) | 629,820 | $ 5,949,024 | | (753,729) | $ (7,007,527) |
Eaton Vance
New York Municipal Opportunities Fund
March 31, 2024
Notes to Financial Statements — continued
8 Financial Instruments
The Fund may trade in financial instruments with off-balance sheet risk in the normal course of its investing activities. These financial instruments may include futures contracts and may involve, to a varying degree, elements of risk in excess of the amounts recognized for financial statement purposes. The notional or contractual amounts of these instruments represent the investment the Fund has in particular classes of financial instruments and do not necessarily represent the amounts potentially subject to risk. The measurement of the risks associated with these instruments is meaningful only when all related and offsetting transactions are considered. At March 31, 2024, there were no obligations outstanding under these financial instruments.
The Fund is subject to interest rate risk in the normal course of pursuing its investment objective. Because the Fund holds fixed-rate bonds, the value of these bonds may decrease if interest rates rise. During the year ended March 31, 2024, the Fund entered into U.S. Treasury futures contracts to hedge against changes in interest rates.
The effect of derivative instruments (not considered to be hedging instruments for accounting disclosure purposes) on the Statement of Operations and whose primary underlying risk exposure is interest rate risk for the year ended March 31, 2024 was as follows:
| Derivative | Realized Gain (Loss)
on Derivatives Recognized
in Income | Change in Unrealized
Appreciation (Depreciation) on
Derivatives Recognized in Income |
| Futures contracts | $52,171 (1) | $ — |
| (1) | Statement of Operations location: Net realized gain (loss): Futures contracts. |
The average notional cost of futures contracts (short) outstanding during the year ended March 31, 2024, which is indicative of the volume of this derivative type, was approximately $12,000.
9 Line of Credit
The Fund participates with other portfolios and funds managed by EVM and its affiliates in a $650 million unsecured revolving line of credit agreement with a group of banks, which is in effect through October 22, 2024. In connection with the renewal of the agreement on October 24, 2023, the borrowing limit was decreased from $725 million. Borrowings are made by the Fund solely for temporary purposes related to redemptions and other short-term cash needs. Interest is charged to the Fund based on its borrowings at an amount above either the Secured Overnight Financing Rate (SOFR) or Federal Funds rate. In addition, a fee computed at an annual rate of 0.15% on the daily unused portion of the line of credit is allocated among the participating portfolios and funds at the end of each quarter. In connection with the renewal of the agreement in October 2023, an arrangement fee of $150,000 was incurred that was allocated to the participating portfolios and funds. Because the line of credit is not available exclusively to the Fund, it may be unable to borrow some or all of its requested amounts at any particular time. The Fund did not have any significant borrowings or allocated fees during the year ended March 31, 2024.
10 Fair Value Measurements
Under generally accepted accounting principles for fair value measurements, a three-tier hierarchy to prioritize the assumptions, referred to as inputs, is used in valuation techniques to measure fair value. The three-tier hierarchy of inputs is summarized in the three broad levels listed below.
| • | Level 1 – quoted prices in active markets for identical investments |
| • | Level 2 – other significant observable inputs (including quoted prices for similar investments, interest rates, prepayment speeds, credit risk, etc.) |
| • | Level 3 – significant unobservable inputs (including a fund's own assumptions in determining the fair value of investments) |
In cases where the inputs used to measure fair value fall in different levels of the fair value hierarchy, the level disclosed is determined based on the lowest level input that is significant to the fair value measurement in its entirety. The inputs or methodology used for valuing securities are not necessarily an indication of the risk associated with investing in those securities.
Eaton Vance
New York Municipal Opportunities Fund
March 31, 2024
Notes to Financial Statements — continued
At March 31, 2024, the hierarchy of inputs used in valuing the Fund's investments, which are carried at fair value, were as follows:
| Asset Description | Level 1 | Level 2 | Level 3 | Total |
| Tax-Exempt Municipal Obligations | $ — | $ 59,501,854 | $ — | $ 59,501,854 |
| Taxable Municipal Obligations | — | 6,005,986 | — | 6,005,986 |
| Total Investments | $ — | $65,507,840 | $ — | $65,507,840 |
Eaton Vance
New York Municipal Opportunities Fund
March 31, 2024
Report of Independent Registered Public Accounting Firm
To the Trustees of Eaton Vance Investment Trust and Shareholders of Eaton Vance New York Municipal Opportunities Fund:
Opinion on the Financial Statements and Financial Highlights
We have audited the accompanying statement of assets and liabilities of Eaton Vance New York Municipal Opportunities Fund (the “Fund”) (one of the funds constituting Eaton Vance Investment Trust), including the portfolio of investments, as of March 31, 2024, the related statement of operations for the year then ended, the statements of changes in net assets for each of the two years in the period then ended, the financial highlights for each of the five years in the period then ended, and the related notes. In our opinion, the financial statements and financial highlights present fairly, in all material respects, the financial position of the Fund as of March 31, 2024, and the results of its operations for the year then ended, the changes in its net assets for each of the two years in the period then ended, and the financial highlights for each of the five years in the period then ended, in conformity with accounting principles generally accepted in the United States of America.
Basis for Opinion
These financial statements and financial highlights are the responsibility of the Fund's management. Our responsibility is to express an opinion on the Fund's financial statements and financial highlights based on our audits. We are a public accounting firm registered with the Public Company Accounting Oversight Board (United States) (PCAOB) and are required to be independent with respect to the Fund in accordance with the U.S. federal securities laws and the applicable rules and regulations of the Securities and Exchange Commission and the PCAOB.
We conducted our audits in accordance with the standards of the PCAOB. Those standards require that we plan and perform the audit to obtain reasonable assurance about whether the financial statements and financial highlights are free of material misstatement, whether due to error or fraud. The Fund is not required to have, nor were we engaged to perform, an audit of its internal control over financial reporting. As part of our audits, we are required to obtain an understanding of internal control over financial reporting but not for the purpose of expressing an opinion on the effectiveness of the Fund’s internal control over financial reporting. Accordingly, we express no such opinion.
Our audits included performing procedures to assess the risks of material misstatement of the financial statements and financial highlights, whether due to error or fraud, and performing procedures that respond to those risks. Such procedures included examining, on a test basis, evidence regarding the amounts and disclosures in the financial statements and financial highlights. Our audits also included evaluating the accounting principles used and significant estimates made by management, as well as evaluating the overall presentation of the financial statements and financial highlights. Our procedures included confirmation of securities owned as of March 31, 2024, by correspondence with the custodian and brokers; when replies were not received from brokers, we performed other auditing procedures. We believe that our audits provide a reasonable basis for our opinion.
/s/ Deloitte & Touche LLP
Boston, Massachusetts
May 17, 2024
We have served as the auditor of one or more Eaton Vance investment companies since 1959.
Eaton Vance
New York Municipal Opportunities Fund
March 31, 2024
Federal Tax Information (Unaudited)
The Form 1099-DIV you receive in February 2025 will show the tax status of all distributions paid to your account in calendar year 2024. Shareholders are advised to consult their own tax adviser with respect to the tax consequences of their investment in the Fund. As required by the Internal Revenue Code and/or regulations, shareholders must be notified regarding exempt-interest dividends.
Exempt-Interest Dividends. For the fiscal year ended March 31, 2024, the Fund designates 92.91% of distributions from net investment income as an exempt-interest dividend.
Eaton Vance
New York Municipal Opportunities Fund
March 31, 2024
Management and Organization
Fund Management. The Trustees of Eaton Vance Investment Trust (the Trust) are responsible for the overall management and supervision of the Trust's affairs. The Board members and officers of the Trust are listed below. Except as indicated, each individual has held the office shown or other offices in the same company for the last five years. Board members hold indefinite terms of office. Each Trustee holds office until his or her successor is elected and qualified, subject to a prior death, resignation, retirement, disqualification or removal. Under the terms of the Fund’s current Trustee retirement policy, an Independent Trustee must retire and resign as a Trustee on the earlier of: (i) the first day of July following his or her 74th birthday; or (ii), with limited exception, December 31st of the 20th year in which he or she has served as a Trustee. However, if such retirement and resignation would cause the Fund to be out of compliance with Section 16 of the 1940 Act or any other regulations or guidance of the SEC, then such retirement and resignation will not become effective until such time as action has been taken for the Fund to be in compliance therewith. The “noninterested Trustees” consist of those Trustees who are not “interested persons” of the Trust, as that term is defined under the 1940 Act. The business address of each Board member and officer is One Post Office Square, Boston, Massachusetts 02109. As used below, “BMR” refers to Boston Management and Research, “EV” refers to EV LLC, “EVM” refers to Eaton Vance Management, “MSIM” refers to Morgan Stanley Investment Management Inc. and “EVD” refers to Eaton Vance Distributors, Inc. EV is the trustee of each of EVM and BMR. Each of EVM, BMR, EVD and EV are indirect, wholly owned subsidiaries of Morgan Stanley. Each officer affiliated with EVM may hold a position with other EVM affiliates that is comparable to his or her position with EVM listed below. Each Trustee oversees 127 funds in the Eaton Vance fund complex (including both funds and portfolios in a hub and spoke structure).
| Name and Year of Birth | Trust
Position(s) | Length of Service | Principal Occupation(s) and Other Directorships
During Past Five Years and Other Relevant Experience |
| Interested Trustee |
Anchal Pachnanda
1980 | Trustee | Since 2023 | Co-Head of Strategy of MSIM (since 2019). Formerly, Head of Strategy of MSIM (2017-2019). Ms. Pachnanda is an interested person because of her position with MSIM, which is an affiliate of the Trust.
Other Directorships. None. |
| Noninterested Trustees |
Alan C. Bowser
1962 | Trustee | Since 2022 | Private investor. Formerly, Chief Diversity Officer, Partner and a member of the Operating Committee, and formerly served as Senior Advisor on Diversity and Inclusion for the firm’s chief executive officer, Co-Head of the Americas Region, and Senior Client Advisor of Bridgewater Associates, an asset management firm (2011- 2023).
Other Directorships. Independent Director of Stout Risius Ross (a middle market professional services advisory firm) (since 2021). |
Mark R. Fetting
1954 | Trustee | Since 2016 | Private investor. Formerly held various positions at Legg Mason, Inc. (investment management firm) (2000-2012), including President, Chief Executive Officer, Director and Chairman (2008-2012), Senior Executive Vice President (2004-2008) and Executive Vice President (2001-2004). Formerly, President of Legg Mason family of funds (2001-2008). Formerly, Division President and Senior Officer of Prudential Financial Group, Inc. and related companies (investment management firm) (1991-2000).
Other Directorships. None. |
Cynthia E. Frost
1961 | Trustee | Since 2014 | Private investor. Formerly, Chief Investment Officer of Brown University (university endowment) (2000-2012). Formerly, Portfolio Strategist for Duke Management Company (university endowment manager) (1995-2000). Formerly, Managing Director, Cambridge Associates (investment consulting company) (1989-1995). Formerly, Consultant, Bain and Company (management consulting firm) (1987-1989). Formerly, Senior Equity Analyst, BA Investment Management Company (1983-1985).
Other Directorships. None. |
George J. Gorman
1952 | Chairperson
of the Board
and Trustee | Since 2021
(Chairperson) and
2014 (Trustee) | Principal at George J. Gorman LLC (consulting firm). Formerly, Senior Partner at Ernst & Young LLP (a registered public accounting firm) (1974-2009).
Other Directorships. None. |
Eaton Vance
New York Municipal Opportunities Fund
March 31, 2024
Management and Organization — continued
| Name and Year of Birth | Trust
Position(s) | Length of Service | Principal Occupation(s) and Other Directorships
During Past Five Years and Other Relevant Experience |
| Noninterested Trustees (continued) |
Valerie A. Mosley
1960 | Trustee | Since 2014 | Chairwoman and Chief Executive Officer of Valmo Ventures (a consulting and investment firm). Founder of Upward Wealth, Inc., dba BrightUp, a fintech platform. Formerly, Partner and Senior Vice President, Portfolio Manager and Investment Strategist at Wellington Management Company, LLP (investment management firm) (1992-2012). Formerly, Chief Investment Officer, PG Corbin Asset Management (1990-1992). Formerly worked in institutional corporate bond sales at Kidder Peabody (1986-1990).
Other Directorships. Director of DraftKings, Inc. (digital sports entertainment and gaming company) (since September 2020). Director of Envestnet, Inc. (provider of intelligent systems for wealth management and financial wellness) (since 2018). Formerly, Director of Dynex Capital, Inc. (mortgage REIT) (2013-2020) and Director of Groupon, Inc. (e-commerce provider) (2020-2022). |
Keith Quinton
1958 | Trustee | Since 2018 | Private investor, researcher and lecturer. Formerly, Independent Investment Committee Member at New Hampshire Retirement System (2017-2021). Formerly, Portfolio Manager and Senior Quantitative Analyst at Fidelity Investments (investment management firm) (2001-2014).
Other Directorships. Formerly, Director (2016-2021) and Chairman (2019-2021) of New Hampshire Municipal Bond Bank. |
Marcus L. Smith
1966 | Trustee | Since 2018 | Private investor and independent corporate director. Formerly, Chief Investment Officer, Canada (2012-2017), Chief Investment Officer, Asia (2010-2012), Director of Asian Research (2004-2010) and portfolio manager (2001-2017) at MFS Investment Management (investment management firm).
Other Directorships. Director of First Industrial Realty Trust, Inc. (an industrial REIT) (since 2021). Director of MSCI Inc. (global provider of investment decision support tools) (since 2017). Formerly, Director of DCT Industrial Trust Inc. (logistics real estate company) (2017-2018). |
Susan J. Sutherland
1957 | Trustee | Since 2015 | Private investor. Director of Ascot Group Limited and certain of its subsidiaries (insurance and reinsurance) (since 2017). Formerly, Director of Hagerty Holding Corp. (insurance) (2015-2018) and Montpelier Re Holdings Ltd. (insurance and reinsurance) (2013-2015). Formerly, Associate, Counsel and Partner at Skadden, Arps, Slate, Meagher & Flom LLP (law firm) (1982-2013).
Other Directorships. Formerly, Director of Kairos Acquisition Corp. (insurance/InsurTech acquisition company) (2021-2023). |
Scott E. Wennerholm
1959 | Trustee | Since 2016 | Private investor. Formerly, Trustee at Wheelock College (postsecondary institution) (2012-2018). Formerly, Consultant at GF Parish Group (executive recruiting firm) (2016-2017). Formerly, Chief Operating Officer and Executive Vice President at BNY Mellon Asset Management (investment management firm) (2005-2011). Formerly, Chief Operating Officer and Chief Financial Officer at Natixis Global Asset Management (investment management firm) (1997-2004). Formerly, Vice President at Fidelity Investments Institutional Services (investment management firm) (1994-1997).
Other Directorships. None. |
Nancy A. Wiser
1967 | Trustee | Since 2022 | Formerly, Executive Vice President and the Global Head of Operations at Wells Fargo Asset Management (2011-2021).
Other Directorships. None. |
| Name and Year of Birth | Trust
Position(s) | Length of Service | Principal Occupation(s)
During Past Five Years |
| Principal Officers who are not Trustees |
Kenneth A. Topping
1966 | President | Since 2023 | Vice President and Chief Administrative Officer of EVM and BMR and Chief Operating Officer for Public Markets at MSIM. Also Vice President of Calvert Research and Management (“CRM”) since 2021. Formerly, Chief Operating Officer for Goldman Sachs Asset Management ‘Classic' (2009-2020). |
Deidre E. Walsh
1971 | Vice President and
Chief Legal Officer | Since 2009 | Vice President of EVM and BMR. Also Vice President of CRM. |
James F. Kirchner
1967 | Treasurer | Since 2007 | Vice President of EVM and BMR. Also Vice President of CRM. |
Eaton Vance
New York Municipal Opportunities Fund
March 31, 2024
Management and Organization — continued
| Name and Year of Birth | Trust
Position(s) | Length of Service | Principal Occupation(s)
During Past Five Years |
| Principal Officers who are not Trustees (continued) |
Nicholas S. Di Lorenzo
1987 | Secretary | Since 2022 | Formerly, associate (2012-2021) and counsel (2022) at Dechert LLP. |
Laura T. Donovan
1976 | Chief Compliance
Officer | Since 2024 | Vice President of EVM and BMR. |
The SAI for the Fund includes additional information about the Trustees and officers of the Fund and can be obtained without charge on Eaton Vance’s website at www.eatonvance.com or by calling 1-800-262-1122.
| U.S. Customer Privacy Notice | March 2024 |
| FACTS | WHAT DOES EATON VANCE DO WITH YOUR PERSONAL INFORMATION? |
| Why? | Financial companies choose how they share your personal information. Federal law gives consumers the right to limit some but not all sharing. Federal law also requires us to tell you how we collect, share, and protect your personal information. Please read this notice carefully to understand what we do. |
| |
| What? | The types of personal information we collect and share depend on the product or service you have with us. This information can include:■ Social Security number and income
■ investment experience and risk tolerance
■ checking account information and wire transfer instructions |
| |
| How? | All financial companies need to share customers’ personal information to run their everyday business. In the section below, we list the reasons financial companies can share their customers’ personal information; the reasons Eaton Vance chooses to share; and whether you can limit this sharing. |
| Reasons we can share your personal information | Does Eaton Vance
share? | Can you limit
this sharing? |
| For our everyday business purposes — such as to process your transactions, maintain your account(s), respond to court orders and legal investigations, or report to credit bureaus | Yes | No |
| For our marketing purposes — to offer our products and services to you | Yes | No |
| For joint marketing with other financial companies | No | We don’t share |
| For our affiliates’ everyday business purposes — information about your transactions and experiences | Yes | No* |
| For our affiliates’ everyday business purposes — information about your creditworthiness | Yes | Yes* |
| For our affiliates to market to you | Yes | Yes* |
| For nonaffiliates to market to you | No | We don’t share |
To limit our
sharing | Call toll-free 1-800-262-1122 or email: EVPrivacy@eatonvance.comPlease note:If you are a new customer, we can begin sharing your information 30 days from the date we sent this notice. When you are no longer our customer, we continue to share your information as described in this notice. However, you can contact us at any time to limit our sharing. |
| Questions? | Call toll-free 1-800-262-1122 or email: EVPrivacy@eatonvance.com |
| U.S. Customer Privacy Notice — continued | March 2024 |
| Who we are |
| Who is providing this notice? | Eaton Vance Management and our investment management affiliates (“Eaton Vance”) (see Affiliates definition below.) |
| What we do |
How does Eaton Vance
protect my personal
information? | To protect your personal information from unauthorized access and use, we use security measures that comply with federal law. These measures include computer safeguards and secured files and buildings. We have policies governing the proper handling of customer information by personnel and requiring third parties that provide support to adhere to appropriate security standards with respect to such information. |
How does Eaton Vance
collect my personal
information? | We collect your personal information, for example, when you■ open an account or make deposits or withdrawals from your account
■ buy securities from us or make a wire transfer
■ give us your contact informationWe also collect your personal information from others, such as credit bureaus, affiliates, or other companies. |
| Why can’t I limit all sharing? | Federal law gives you the right to limit only■ sharing for affiliates’ everyday business purposes — information about your creditworthiness
■ affiliates from using your information to market to you
■ sharing for nonaffiliates to market to youState laws and individual companies may give you additional rights to limit sharing. (See below for more on your rights under state law.) |
What happens when I limit
sharing for an account I hold
jointly with someone else? | Your choices will apply to everyone on your account. |
| Definitions |
| Affiliates | Companies related by common ownership or control. They can be financial and nonfinancial companies.■ Our affiliates include registered investment advisers such as Eaton Vance Management, Eaton Vance Advisers International Ltd., Boston Management and Research, Calvert Research and Management, Parametric Portfolio Associates LLC, Atlanta Capital Management Company LLC, Morgan Stanley Investment Management Inc., Morgan Stanley Investment Management Co.; registered broker-dealers such as Morgan Stanley Distributors Inc. and Eaton Vance Distributors, Inc. (together, the “Investment Management Affiliates”); and companies with a Morgan Stanley name and financial companies such as Morgan Stanley Smith Barney LLC and Morgan Stanley & Co. (the “Morgan Stanley Affiliates”). |
| Nonaffiliates | Companies not related by common ownership or control. They can be financial and nonfinancial companies.■ Eaton Vance does not share with nonaffiliates so they can market to you. |
| Joint marketing | A formal agreement between nonaffiliated financial companies that together market financial products or services to you.■ Eaton Vance does not jointly market. |
| U.S. Customer Privacy Notice — continued | March 2024 |
| Other important information |
| *PLEASE NOTE: Eaton Vance does not share your creditworthiness information or your transactions and experiences information with the Morgan Stanley Affiliates, nor does Eaton Vance enable the Morgan Stanley Affiliates to market to you. Your opt outs will prevent Eaton Vance from sharing your creditworthiness information with the Investment Management Affiliates and will prevent the Investment Management Affiliates from marketing their products to you.Vermont: Except as permitted by law, we will not share personal information we collect about Vermont residents with Nonaffiliates unless you provide us with your written consent to share such information.California: Except as permitted by law, we will not share personal information we collect about California residents with Nonaffiliates and we will limit sharing such personal information with our Affiliates to comply with California privacy laws that apply to us. |
Delivery of Shareholder Documents. The Securities and Exchange Commission (SEC) permits funds to deliver only one copy of shareholder documents, including prospectuses, proxy statements and shareholder reports, to fund investors with multiple accounts at the same residential or post office box address. This practice is often called “householding” and it helps eliminate duplicate mailings to shareholders. Eaton Vance, or your financial intermediary, may household the mailing of your documents indefinitely unless you instruct Eaton Vance, or your financial intermediary, otherwise. If you would prefer that your Eaton Vance documents not be householded, please contact Eaton Vance at 1-800-262-1122, or contact your financial intermediary. Your instructions that householding not apply to delivery of your Eaton Vance documents will typically be effective within 30 days of receipt by Eaton Vance or your financial intermediary.
Portfolio Holdings. Each Eaton Vance Fund and its underlying Portfolio(s) (if applicable) files a schedule of portfolio holdings on Part F to Form N-PORT with the SEC. Certain information filed on Form N-PORT may be viewed on the Eaton Vance website at www.eatonvance.com, by calling Eaton Vance at 1-800-262-1122 or in the EDGAR database on the SEC’s website at www.sec.gov.
Proxy Voting. From time to time, funds are required to vote proxies related to the securities held by the funds. The Eaton Vance Funds or their underlying Portfolios (if applicable) vote proxies according to a set of policies and procedures approved by the Funds’ and Portfolios’ Boards. You may obtain a description of these policies and procedures and information on how the Funds or Portfolios voted proxies relating to portfolio securities during the most recent 12-month period ended June 30, without charge, upon request, by calling 1-800-262-1122 and by accessing the SEC’s website at www.sec.gov.
Tailored Shareholder Reports. Effective January 24, 2023, the SEC adopted rule and form amendments to require open-end mutual funds and ETFs to transmit concise and visually engaging streamlined annual and semiannual reports to shareholders that highlight key information. Other information, including financial statements, will no longer appear in a streamlined shareholder report but must be available online, delivered free of charge upon request, and filed on a semiannual basis on Form N-CSR. The rule and form amendments have a compliance date of July 24, 2024. At this time, management is evaluating the impact of these amendments on the shareholder reports for the Eaton Vance Funds.
This Page Intentionally Left Blank
This Page Intentionally Left Blank
Investment Adviser
Boston Management and Research
One Post Office Square
Boston, MA 02109
Administrator
Eaton Vance Management
One Post Office Square
Boston, MA 02109
Principal Underwriter*
Eaton Vance Distributors, Inc.
One Post Office Square
Boston, MA 02109
(617) 482-8260
Custodian
State Street Bank and Trust Company
One Congress Street, Suite 1
Boston, MA 02114-2016
Transfer Agent
BNY Mellon Investment Servicing (US) Inc.
Attn: Eaton Vance Funds
P.O. Box 534439
Pittsburgh, PA 15253-4439
(800) 262-1122
Independent Registered Public Accounting Firm
Deloitte & Touche LLP
200 Berkeley Street
Boston, MA 02116-5022
Fund Offices
One Post Office Square
Boston, MA 02109
* FINRA BrokerCheck. Investors may check the background of their Investment Professional by contacting the Financial Industry Regulatory Authority (FINRA). FINRA BrokerCheck is a free tool to help investors check the professional background of current and former FINRA-registered securities firms and brokers. FINRA BrokerCheck is available by calling 1-800-289-9999 and at www.FINRA.org. The FINRA BrokerCheck brochure describing this program is available to investors at www.FINRA.org.
Eaton Vance
Short Duration Municipal
Opportunities Fund
Annual Report
March 31, 2024
Commodity Futures Trading Commission Registration. The Commodity Futures Trading Commission (“CFTC”) has adopted regulations that subject registered investment companies and advisers to regulation by the CFTC if a fund invests more than a prescribed level of its assets in certain CFTC-regulated instruments (including futures, certain options and swap agreements) or markets itself as providing investment exposure to such instruments. The investment adviser has claimed an exclusion from the definition of “commodity pool operator” under the Commodity Exchange Act with respect to its management of the Fund. Accordingly, neither the Fund nor the adviser with respect to the operation of the Fund is subject to CFTC regulation. Because of its management of other strategies, the Fund's adviser is registered with the CFTC as a commodity pool operator. The adviser is also registered as a commodity trading advisor.
Fund shares are not insured by the FDIC and are not deposits or other obligations of, or guaranteed by, any depository institution. Shares are subject to investment risks, including possible loss of principal invested.
This report must be preceded or accompanied by a current summary prospectus or prospectus. Before investing, investors should consider carefully the investment objective, risks, and charges and expenses of a mutual fund. This and other important information is contained in the summary prospectus and prospectus, which can be obtained from a financial intermediary. Prospective investors should read the prospectus carefully before investing. For further information, please call 1-800-262-1122.
Annual Report March 31, 2024
Eaton Vance
Short Duration Municipal Opportunities Fund
Eaton Vance
Short Duration Municipal Opportunities Fund
March 31, 2024
Management’s Discussion of Fund Performance†
Economic and Market Conditions
The 12-month period ended March 31, 2024, began with an April 2023 municipal bond sell-off that continued through much of the period. Although positive technical factors -- particularly municipal bond demand that exceeded supply -- produced brief periods of positive performance, the U.S. Federal Reserve’s (the Fed’s) 10th and 11th interest rate hikes in just over a year -- in May and July 2023 -- contributed to rising municipal yields and falling bond prices.
From August through October 2023, above-average supplies of municipal bonds -- plus an end-of-summer slowdown in coupon reinvestment -- reduced demand for municipal bonds. Although the Fed left the federal funds rate unchanged in September 2023, investors interpreted the central bank’s message to be that rates might stay higher for longer than they had expected just weeks earlier -- adding fuel to the municipal bond sell-off.
However, in November and December 2023, the municipal bond market reversed course. After several months of rising interest rates and negative bond returns, federal tax-free municipal yields approached their 2022 highs, giving investors a compelling reason to buy tax-exempt municipal bonds.
Typical calendar year-end technical factors -- particularly constrained supplies and increased investor demand -- were additional tailwinds for municipal bond prices. Falling inflation and easing employment gains also led many investors to believe the Fed might be done raising interest rates. Such factors contributed to the Bloomberg Municipal Bond Index (the Index) returning 6.35% in November 2023, its best monthly performance since 1982.
In December 2023, the Index posted another solid monthly gain as investors began to conclude the Fed might begin lowering interest rates during the first half of 2024.
In the final three months of the period, however, municipal returns turned negative as municipal bonds -- following a strong year-end rally -- appeared overvalued relative to U.S. Treasurys. Fed statements and strong U.S. economic reports in early 2024 led investors to reduce expectations for the number of Fed rate cuts projected for the year and how soon they might begin. As a result, both municipal bonds and U.S. Treasurys delivered negative performance during the first quarter of 2024.
For the period as a whole, the Index returned 3.13%, as municipal bonds outperformed U.S. Treasurys throughout the yield curve. Although yields rose and prices fell across the municipal bond yield curve, the positive contribution from rising interest income outweighed the negative effect of falling bond prices. During the period, lower-rated bonds generally outperformed higher-rated bonds, while longer-maturity bonds generally outperformed shorter-maturity bonds.
Fund Performance
For the 12-month period ended March 31, 2024, Eaton Vance Short Duration Municipal Opportunities Fund (the Fund) returned 3.57% for Class A shares at net asset value (NAV), outperforming its benchmark, the Bloomberg Short-Intermediate 1-10 Year Municipal Bond Index (the Index), which returned 2.07%.
To pursue its primary objective of maximizing after-tax total return, the Fund uses a flexible investment strategy and may invest in obligations of any duration or credit quality, while seeking to maintain a dollar-weighted average portfolio duration below 4.5 years. Fund managers may invest up to 20% of net assets in debt obligations other than tax-exempt municipal bonds, including -- but not limited to -- taxable municipal obligations, U.S. Treasury securities and obligations of the U.S. government, its agencies and instrumentalities.
Up to 50% of the Fund’s net assets may be invested in obligations rated below investment-grade quality -- Baa/BBB by Moody’s, S&P, or Fitch. The Fund may also seek to hedge interest rate risk and hold leveraged investments.
Contributors to Fund performance relative to the Index during the period included defensive out-of-Index allocations to floating-rate notes and variable-rate demand notes -- whose coupon payments are indexed to short-term interest rates, which rose during the period.
Additional contributors to Index-relative performance included security selections and an overweight position in bonds rated BBB and below, during a period when lower-rated bonds generally outperformed higher-rated bonds; and security selections and an overweight position in the health care sector.
In contrast, detractors from Index-relative returns included security selections in Hawaii bonds; an overweight position in bonds with coupons below 4%, excluding zero-coupon bonds; and security selections and an overweight position in the electric utilities sector.
See Endnotes and Additional Disclosures in this report.
Past performance is no guarantee of future results. Returns are historical and are calculated by determining the percentage change in net asset value (NAV) or offering price (as applicable) with all distributions reinvested. Furthermore, returns do not reflect the deduction of taxes that shareholders may have to pay on Fund distributions or upon the redemption of Fund shares. Investment return and principal value will fluctuate so that shares, when redeemed, may be worth more or less than their original cost. Performance for periods less than or equal to one year is cumulative. Performance is for the stated time period only; due to market volatility, current Fund performance may be lower or higher than the quoted return. For performance as of the most recent month-end, please refer to eatonvance.com.
Eaton Vance
Short Duration Municipal Opportunities Fund
March 31, 2024
Performance
Portfolio Manager(s) Craig R. Brandon, CFA and Trevor G. Smith
| % Average Annual Total Returns1,2 | Class
Inception Date | Performance
Inception Date | One Year | Five Years | Ten Years |
| Class A at NAV | 06/27/1996 | 06/01/1992 | 3.57% | 1.29% | 2.04% |
| Class A with 3.25% Maximum Sales Charge | — | — | 0.16 | 0.62 | 1.70 |
| Class C at NAV | 12/08/1993 | 06/01/1992 | 2.82 | 0.53 | 1.44 |
| Class C with 1% Maximum Deferred Sales Charge | — | — | 1.82 | 0.53 | 1.44 |
| Class I at NAV | 08/03/2010 | 06/01/1992 | 3.62 | 1.42 | 2.19 |
|
| Bloomberg Short-Intermediate 1-10 Year Municipal Bond Index | — | — | 2.07% | 1.34% | 1.80% |
| % Total Annual Operating Expense Ratios3 | Class A | Class C | Class I |
| | 0.65% | 1.41% | 0.50% |
| % Distribution Rates/Yields4 | Class A | Class C | Class I |
| Distribution Rate | 2.94% | 2.18% | 3.09% |
| Taxable-Equivalent Distribution Rate | 4.96 | 3.69 | 5.21 |
| SEC 30-day Yield | 2.92 | 2.27 | 3.17 |
| Taxable-Equivalent SEC 30-day Yield | 4.93 | 3.83 | 5.35 |
Growth of $10,000
This graph shows the change in value of a hypothetical investment of $10,000 in Class A of the Fund for the period indicated. For comparison, the same investment is shown in the indicated index.
| Growth of Investment | Amount Invested | Period Beginning | At NAV | With Maximum Sales Charge |
| Class C | $10,000 | 03/31/2014 | $11,535 | N.A. |
| Class I, at minimum investment | $1,000,000 | 03/31/2014 | $1,241,832 | N.A. |
See Endnotes and Additional Disclosures in this report.
Past performance is no guarantee of future results. Returns are historical and are calculated by determining the percentage change in net asset value (NAV) or offering price (as applicable) with all distributions reinvested. Furthermore, returns do not reflect the deduction of taxes that shareholders may have to pay on Fund distributions or upon the redemption of Fund shares. Investment return and principal value will fluctuate so that shares, when redeemed, may be worth more or less than their original cost. Performance for periods less than or equal to one year is cumulative. Performance is for the stated time period only; due to market volatility, current Fund performance may be lower or higher than the quoted return. For performance as of the most recent month-end, please refer to eatonvance.com.
Eaton Vance
Short Duration Municipal Opportunities Fund
March 31, 2024
| Credit Quality (% of total investments)1 |
Footnotes:
| 1 | For purposes of the Fund’s rating restrictions, ratings are based on Moody’s Investors Service, Inc. (“Moody’s”), S&P Global Ratings (“S&P”) or Fitch Ratings (“Fitch”), as applicable. If securities are rated differently by the ratings agencies, the highest rating is applied. Ratings, which are subject to change, apply to the creditworthiness of the issuers of the underlying securities and not to the Fund or its shares. Credit ratings measure the quality of a bond based on the issuer’s creditworthiness, with ratings ranging from AAA, being the highest, to D, being the lowest based on S&P’s measures. Ratings of BBB or higher by S&P or Fitch (Baa or higher by Moody’s) are considered to be investment-grade quality. Credit ratings are based largely on the ratings agency’s analysis at the time of rating. The rating assigned to any particular security is not necessarily a reflection of the issuer’s current financial condition and does not necessarily reflect its assessment of the volatility of a security’s market value or of the liquidity of an investment in the security. Holdings designated as “Not Rated” (if any) are not rated by the national ratings agencies stated above. |
Eaton Vance
Short Duration Municipal Opportunities Fund
March 31, 2024
Endnotes and Additional Disclosures
| † | The views expressed in this report are those of the portfolio manager(s) and are current only through the date stated at the top of this page. These views are subject to change at any time based upon market or other conditions, and Eaton Vance and the Fund(s) disclaim any responsibility to update such views. These views may not be relied upon as investment advice and, because investment decisions are based on many factors, may not be relied upon as an indication of trading intent on behalf of any Eaton Vance fund. This commentary may contain statements that are not historical facts, referred to as “forward-looking statements.” The Fund’s actual future results may differ significantly from those stated in any forward-looking statement, depending on factors such as changes in securities or financial markets or general economic conditions, the volume of sales and purchases of Fund shares, the continuation of investment advisory, administrative and service contracts, and other risks discussed from time to time in the Fund’s filings with the Securities and Exchange Commission. |
| | |
| 1 | Bloomberg Short-Intermediate 1-10 Year Municipal Bond Index is an unmanaged index of municipal bonds traded in the U.S. with maturities ranging from 1-10 years. Unless otherwise stated, index returns do not reflect the effect of any applicable sales charges, commissions, expenses, taxes or leverage, as applicable. It is not possible to invest directly in an index. |
| 2 | Total Returns at NAV do not include applicable sales charges. If sales charges were deducted, the returns would be lower. Total Returns shown with maximum sales charge reflect the stated maximum sales charge. Unless otherwise stated, performance does not reflect the deduction of taxes on Fund distributions or redemptions of Fund shares.Performance prior to November 14, 2016 reflects the Fund’s performance under its former investment objective and policies. |
| 3 | Source: Fund prospectus. The expense ratios for the current reporting period can be found in the Financial Highlights section of this report. |
| 4 | The Distribution Rate is based on the Fund’s last regular distribution per share in the period (annualized) divided by the Fund’s NAV at the end of the period. The Fund’s distributions may be comprised of amounts characterized for federal income tax purposes as tax-exempt income, qualified and non-qualified ordinary dividends, capital gains and nondividend distributions, also known as return of capital. The Fund will determine the federal income tax character of distributions paid to a shareholder after the end of the calendar year. This is reported on the IRS form 1099-DIV and provided to the shareholder shortly after each year-end. The Fund’s distributions are determined by the investment adviser based on its current assessment of the Fund’s long-term return potential. As portfolio and market conditions change, the rate of distributions paid by the Fund could change. Taxable-equivalent performance is based on the highest combined federal and state income tax rates, where applicable. Lower tax rates would result in lower tax-equivalent performance. Actual tax rates will vary depending on your income, exemptions and deductions. Rates do not include local taxes. The SEC Yield is a standardized measure based on the estimated yield to maturity of a fund’s investments over |
| | a 30-day period and is based on the maximum offer price at the date specified. The SEC Yield is not based on the distributions made by the Fund, which may differ. |
| | Fund profile subject to change due to active management. |
| | Additional Information |
| | Yield curve is a graphical representation of the yields offered by bonds of various maturities. The yield curve flattens when long-term interest rates fall and/or short-term interest rates increase, and the yield curve steepens when long-term interest rates increase and/or short-term interest rates fall. |
| | Bloomberg Municipal Bond Index is an unmanaged index of municipal bonds traded in the U.S. |
| | Duration is a measure of the expected change in price of a bond — in percentage terms — given a one percent change in interest rates, all else being constant. Securities with lower durations tend to be less sensitive to interest rate changes. |
Eaton Vance
Short Duration Municipal Opportunities Fund
March 31, 2024
Example
As a Fund shareholder, you incur two types of costs: (1) transaction costs, including sales charges (loads) on purchases; and (2) ongoing costs, including management fees; distribution and/or service fees; and other Fund expenses. This Example is intended to help you understand your ongoing costs (in dollars) of Fund investing and to compare these costs with the ongoing costs of investing in other mutual funds. The Example is based on an investment of $1,000 invested at the beginning of the period and held for the entire period (October 1, 2023 to March 31, 2024).
Actual Expenses
The first section of the table below provides information about actual account values and actual expenses. You may use the information in this section, together with the amount you invested, to estimate the expenses that you paid over the period. Simply divide your account value by $1,000 (for example, an $8,600 account value divided by $1,000 = 8.6), then multiply the result by the number in the first section under the heading entitled “Expenses Paid During Period” to estimate the expenses you paid on your account during this period.
Hypothetical Example for Comparison Purposes
The second section of the table below provides information about hypothetical account values and hypothetical expenses based on the actual Fund expense ratio and an assumed rate of return of 5% per year (before expenses), which is not the actual Fund return. The hypothetical account values and expenses may not be used to estimate the actual ending account balance or expenses you paid for the period. You may use this information to compare the ongoing costs of investing in your Fund and other funds. To do so, compare this 5% hypothetical example with the 5% hypothetical examples that appear in the shareholder reports of the other funds.
Please note that the expenses shown in the table are meant to highlight your ongoing costs only and do not reflect any transactional costs, such as sales charges (loads). Therefore, the second section of the table is useful in comparing ongoing costs only, and will not help you determine the relative total costs of owning different funds. In addition, if these transactional costs were included, your costs would be higher.
| | Beginning
Account Value
(10/1/23) | Ending
Account Value
(3/31/24) | Expenses Paid
During Period*
(10/1/23 – 3/31/24) | Annualized
Expense
Ratio |
| Actual | | | | |
| Class A | $1,000.00 | $1,045.10 | $3.32 | 0.65% |
| Class C | $1,000.00 | $1,041.40 | $7.14 | 1.40% |
| Class I | $1,000.00 | $1,044.80 | $2.56 | 0.50% |
| |
| Hypothetical | | | | |
| (5% return per year before expenses) | | | | |
| Class A | $1,000.00 | $1,021.75 | $3.29 | 0.65% |
| Class C | $1,000.00 | $1,018.00 | $7.06 | 1.40% |
| Class I | $1,000.00 | $1,022.50 | $2.53 | 0.50% |
| * | Expenses are equal to the Fund’s annualized expense ratio for the indicated Class, multiplied by the average account value over the period, multiplied by 183/366 (to reflect the one-half year period). The Example assumes that the $1,000 was invested at the net asset value per share determined at the close of business on September 30, 2023. |
Eaton Vance
Short Duration Municipal Opportunities Fund
March 31, 2024
| Security | Principal
Amount
(000's omitted) | Value |
| Education — 1.3% |
| Grand Canyon University, 4.125%, 10/1/24 | $ | 8,000 | $ 7,795,680 |
| Yale University, 0.873%, 4/15/25 | | 2,000 | 1,901,671 |
| | | | $ 9,697,351 |
| Hospital — 1.1% |
| CommonSpirit Health, 6.073%, 11/1/27 | $ | 5,500 | $ 5,599,867 |
| Harnett Health System, Inc., 4.25% to 4/1/25 (Put Date), 4/1/32 | | 2,015 | 1,984,775 |
| | | | $ 7,584,642 |
| Other Revenue — 0.5% |
| Morongo Band of Mission Indians, 7.00%, 10/1/39(1) | $ | 3,470 | $ 3,671,538 |
| | | | $ 3,671,538 |
Total Corporate Bonds
(identified cost $20,689,300) | | | $ 20,953,531 |
| Tax-Exempt Mortgage-Backed Securities — 0.1% |
| Security | Principal
Amount
(000's omitted) | Value |
| Housing — 0.1% |
| FRETE 2017-ML01 Trust, (Freddie Mac guaranteed), 5.936%, (30-day SOFR Average + 0.50%), 1/25/33(1)(2) | $ | 449 | $ 446,469 |
Total Tax-Exempt Mortgage-Backed Securities
(identified cost $448,506) | | | $ 446,469 |
| Tax-Exempt Municipal Obligations — 90.5% |
| Security | Principal
Amount
(000's omitted) | Value |
| Bond Bank — 1.2% |
| Delaware Valley Regional Finance Authority, PA, 4.405%, (67% of 1 mo. SOFR + 0.76%), 9/1/24 (Put Date), 9/1/48(2) | $ | 9,000 | $ 9,000,270 |
| | | | $ 9,000,270 |
| Security | Principal
Amount
(000's omitted) | Value |
| Education — 4.2% |
| Arizona Industrial Development Authority, (Academies of Math & Science), 4.00%, 7/1/29(1) | $ | 380 | $ 372,924 |
| Arizona Industrial Development Authority, (Pinecrest Academy of Nevada), 4.00%, 7/15/30(1) | | 530 | 519,008 |
| Build NYC Resource Corp., NY, (New World Preparatory Charter School), 4.00%, 6/15/31(1) | | 110 | 104,366 |
| California Infrastructure and Economic Development Bank, (The Colburn School), Social Bonds, 4.35%, (SIFMA + 0.90%), 6/1/27 (Put Date), 8/1/72(2) | | 4,000 | 3,943,320 |
| California Municipal Finance Authority, (California Lutheran University), 5.00%, 10/1/24 | | 275 | 275,682 |
| California School Finance Authority, (Green Dot Public Schools): | | | |
| 5.00%, 8/1/24(1) | | 160 | 160,008 |
| 5.00%, 8/1/25(1) | | 300 | 301,911 |
| California School Finance Authority, (KIPP SoCal Public Schools): | | | |
| 5.00%, 7/1/24(1) | | 135 | 135,105 |
| 5.00%, 7/1/25(1) | | 200 | 201,432 |
| 5.00%, 7/1/26(1) | | 105 | 107,075 |
| 5.00%, 7/1/27(1) | | 110 | 113,627 |
| 5.00%, 7/1/28(1) | | 160 | 167,469 |
| 5.00%, 7/1/29(1) | | 165 | 174,715 |
| District of Columbia, (District of Columbia International School): | | | |
| 5.00%, 7/1/25 | | 500 | 502,855 |
| 5.00%, 7/1/29 | | 885 | 935,383 |
| District of Columbia, (KIPP DC): | | | |
| 5.00%, 7/1/25 | | 270 | 271,574 |
| 5.00%, 7/1/27 | | 250 | 258,705 |
| 5.00%, 7/1/28 | | 240 | 251,491 |
| 5.00%, 7/1/29 | | 235 | 249,180 |
| Massachusetts Development Finance Agency, (Boston College), 5.00%, 7/1/38 | | 2,500 | 2,499,025 |
| Massachusetts Development Finance Agency, (Suffolk University), 5.00%, 7/1/24 | | 350 | 350,360 |
| Michigan Finance Authority, (Cesar Chavez Academy), 4.00%, 2/1/29 | | 700 | 667,877 |
| New York Dormitory Authority, (School Districts Revenue Bond Financing Program), 5.00%, 10/1/29 | | 2,250 | 2,346,682 |
| Northeastern Pennsylvania Hospital and Education Authority, (Wilkes University), 5.00%, 3/1/25 | | 510 | 512,560 |
| Philadelphia Industrial Development Authority, PA, (La Salle University), 5.00%, 5/1/24 | | 1,715 | 1,712,119 |
| Public Finance Authority, WI, (North Carolina Leadership Academy), 4.00%, 6/15/29(1) | | 230 | 223,873 |
7
See Notes to Financial Statements.
Eaton Vance
Short Duration Municipal Opportunities Fund
March 31, 2024
Portfolio of Investments — continued
| Security | Principal
Amount
(000's omitted) | Value |
| Education (continued) |
| Public Finance Authority, WI, (Roseman University of Health Sciences): | | | |
| 3.00%, 4/1/25(1) | $ | 125 | $ 123,179 |
| 5.00%, 4/1/30(1) | | 1,470 | 1,531,711 |
| University of California, 5.00%, 5/15/37 | | 5,000 | 5,930,050 |
| University of North Carolina at Chapel Hill, 4.208%, (67% of SOFR + 0.65%), 6/1/25 (Put Date), 12/1/41(2) | | 4,500 | 4,503,555 |
| Washington Housing Finance Commission, (Seattle Academy of Arts and Sciences), 5.00%, 7/1/28(1) | | 360 | 370,433 |
| Wisconsin Health and Educational Facilities Authority, (Hmong American Peace Academy, Ltd.), 4.00%, 3/15/30 | | 400 | 399,264 |
| Yonkers Economic Development Corp., NY, (Lamartine/Warburton, LLC - Charter School of Educational Excellence), 4.00%, 10/15/29 | | 330 | 326,924 |
| | | | $ 30,543,442 |
| Electric Utilities — 7.1% |
| Burke County Development Authority, GA, (Oglethorpe Power Corp.), 3.25% to 2/3/25 (Put Date), 11/1/45 | $ | 4,000 | $ 3,949,480 |
| Halifax County Industrial Development Authority, VA, (Virginia Electric and Power Co.), 1.65% to 5/31/24 (Put Date), 12/1/41 | | 5,000 | 4,972,500 |
| Hawaii Department of Budget and Finance, (Hawaiian Electric Co., Inc.): | | | |
| 3.20%, 7/1/39 | | 3,170 | 2,096,448 |
| (AMT), 3.10%, 5/1/26 | | 4,005 | 3,184,416 |
| (AMT), 3.25%, 1/1/25 | | 3,250 | 2,816,385 |
| (AMT), 4.00%, 3/1/37 | | 2,000 | 1,368,760 |
| Long Island Power Authority, NY, Electric System Revenue, 5.00% to 9/1/27 (Put Date), 9/1/52 | | 4,000 | 4,195,280 |
| Los Angeles Department of Water and Power, CA, Power System Revenue, 5.00%, 7/1/36(3) | | 5,000 | 6,031,800 |
| Louisville/Jefferson County Metro Government, KY, (Louisville Gas and Electric Co.), 1.75% to 7/1/26 (Put Date), 2/1/35 | | 4,000 | 3,841,760 |
| Monroe County Development Authority, GA, (Georgia Power Co. Plant Scherer), 1.00% to 8/21/26 (Put Date), 7/1/49 | | 1,000 | 908,510 |
| Ohio Air Quality Development Authority, (Ohio Valley Electric Corp.): | | | |
| 1.375% to 11/1/24 (Put Date), 2/1/26 | | 2,200 | 2,143,262 |
| 1.50% to 11/4/25 (Put Date), 2/1/26 | | 1,000 | 935,470 |
| Philadelphia, PA, Gas Works Revenue, 5.00%, 8/1/30 | | 1,425 | 1,498,972 |
| Salt River Project Agricultural Improvement and Power District, AZ: | | | |
| 4.00%, 12/1/32 | | 9,675 | 9,742,628 |
| 4.00%, 12/1/34 | | 3,250 | 3,267,842 |
| Security | Principal
Amount
(000's omitted) | Value |
| Electric Utilities (continued) |
| Vermont Public Power Supply Authority, (Swanton Peaking Facility), 5.00%, 7/1/24 | $ | 500 | $ 500,490 |
| | | | $ 51,454,003 |
| Escrowed/Prerefunded — 0.1% |
| Berks County Industrial Development Authority, PA, (Highlands at Wyomissing), Prerefunded to 5/15/25, 5.00%, 5/15/28 | $ | 300 | $ 310,620 |
| Public Finance Authority, WI, (Roseman University of Health Sciences): | | | |
| Escrowed to Maturity, 3.00%, 4/1/25(1) | | 15 | 14,922 |
| Escrowed to Maturity, 5.00%, 4/1/30(1) | | 80 | 86,133 |
| | | | $ 411,675 |
| General Obligations — 16.2% |
| Bristol, VA, 5.00%, 9/1/27 | $ | 1,915 | $ 1,957,570 |
| California, 5.00%, 4/1/42 | | 6,440 | 6,800,060 |
| Champaign County Community Unit School District No. 4, IL, 0.00%, 1/1/26 | | 400 | 372,880 |
| Chicago Board of Education, IL: | | | |
| 0.00%, 12/1/25 | | 500 | 466,585 |
| 4.00%, 12/1/35 | | 1,500 | 1,485,360 |
| 5.00%, 12/1/30 | | 1,650 | 1,768,107 |
| 5.00%, 12/1/33 | | 1,895 | 1,895,038 |
| 5.00%, 12/1/36 | | 2,410 | 2,456,754 |
| 5.25%, 12/1/35 | | 2,750 | 2,752,558 |
| 5.50%, 12/1/38 | | 4,000 | 4,404,720 |
| Chicago, IL: | | | |
| 5.625%, 1/1/29 | | 1,000 | 1,046,850 |
| 5.625%, 1/1/31 | | 5,000 | 5,231,850 |
| Escrowed to Maturity, 0.00%, 1/1/26 | | 160 | 150,152 |
| Connecticut, 4.00%, 6/15/34 | | 6,500 | 6,514,950 |
| Cypress-Fairbanks Independent School District, TX, (PSF Guaranteed), 5.00%, 2/15/26 | | 2,230 | 2,308,518 |
| Detroit, MI: | | | |
| 5.00%, 4/1/25 | | 150 | 151,259 |
| 5.00%, 4/1/26 | | 330 | 337,131 |
| 5.00%, 4/1/27 | | 695 | 717,087 |
| 5.00%, 4/1/28 | | 730 | 761,711 |
| 5.00%, 4/1/29 | | 515 | 544,350 |
| Dripping Springs Independent School District, TX, (PSF Guaranteed): | | | |
| 5.00%, 2/15/41 | | 1,000 | 1,120,140 |
| 5.00%, 2/15/42 | | 1,000 | 1,115,580 |
| Fairfield-Suisun Unified School District, CA, 0.00%, 2/1/29(3) | | 3,000 | 2,564,272 |
8
See Notes to Financial Statements.
Eaton Vance
Short Duration Municipal Opportunities Fund
March 31, 2024
Portfolio of Investments — continued
| Security | Principal
Amount
(000's omitted) | Value |
| General Obligations (continued) |
| Fort Bend Independent School District, TX, (PSF Guaranteed), 2.375% to 8/1/24 (Put Date), 8/1/49 | $ | 3,925 | $ 3,899,134 |
| Grand Prairie Independent School District, TX, (PSF Guaranteed): | | | |
| 4.00%, 2/15/31 | | 5,000 | 5,030,750 |
| 4.00%, 2/15/35 | | 5,000 | 5,022,150 |
| Gwinnett County School District, GA, 4.00%, 2/1/33 | | 8,000 | 8,068,640 |
| Illinois: | | | |
| 3.25%, 11/1/26 | | 1,440 | 1,417,608 |
| 4.00%, 7/1/37 | | 3,000 | 3,031,530 |
| Kenosha, WI: | | | |
| 4.00%, 9/1/26 | | 1,500 | 1,523,910 |
| 4.00%, 9/1/33 | | 2,200 | 2,362,932 |
| Los Angeles Unified School District, CA, Sustainability Bonds, 5.00%, 7/1/36 | | 1,010 | 1,227,029 |
| New Jersey: | | | |
| 2.00%, 6/1/25 | | 2,500 | 2,436,575 |
| 2.00%, 6/1/27 | | 5,000 | 4,713,500 |
| New York, NY, 5.00%, 8/1/29 | | 3,515 | 3,624,387 |
| Plano Independent School District, TX, 5.00%, 2/15/37 | | 3,300 | 3,782,889 |
| Prosper Independent School District, TX, (PSF Guaranteed), 4.00% to 8/15/26 (Put Date), 2/15/50 | | 1,500 | 1,512,630 |
| Puerto Rico, 5.625%, 7/1/27 | | 5,000 | 5,321,550 |
| Rockwall Independent School District, TX, (PSF Guaranteed), 5.00%, 2/15/39 | | 1,000 | 1,129,410 |
| Sarpy County School District 0037, NE, 5.00%, 12/15/27 | | 2,000 | 2,055,020 |
| Texas, 5.00%, 8/1/37 | | 1,665 | 1,696,235 |
| Tolleson Union High School District No. 214, AZ, 5.00%, 7/1/24 | | 1,400 | 1,404,228 |
| Ventura County Community College District, CA, (Election of 2002), 0.00%, 8/1/28 | | 4,205 | 3,704,395 |
| Washington, 5.00%, 2/1/30 | | 5,415 | 5,487,561 |
| Washington Unified School District, CA, (Election of 2020), 4.00%, 8/1/42 | | 2,175 | 2,214,172 |
| | | | $117,589,717 |
| Hospital — 7.4% |
| Arizona Health Facilities Authority, (Scottsdale Lincoln Hospitals), 5.00%, 12/1/42 | $ | 2,965 | $ 2,969,714 |
| Calcasieu Parish Memorial Hospital Service District, LA, (Lake Charles Memorial Hospital), 4.00%, 12/1/24 | | 1,145 | 1,136,550 |
| Charlotte-Mecklenburg Hospital Authority, NC, (Atrium Health), 3.45% to 10/31/25 (Put Date), 1/15/48 | | 1,500 | 1,498,320 |
| Connecticut Health and Educational Facilities Authority, (Griffin Hospital): | | | |
| 5.00%, 7/1/27(1) | | 725 | 722,861 |
| 5.00%, 7/1/30(1) | | 285 | 285,083 |
| Security | Principal
Amount
(000's omitted) | Value |
| Hospital (continued) |
| Conway, AR, (Conway Regional Medical Center): | | | |
| 5.00%, 8/1/25 | $ | 385 | $ 390,136 |
| 5.00%, 8/1/26 | | 445 | 457,558 |
| Crawford County Hospital Authority, PA, (Meadville Medical Center), 6.00%, 6/1/36 | | 740 | 761,815 |
| DuBois Hospital Authority, PA, (Penn Highlands Healthcare), 5.00%, 7/15/28 | | 350 | 368,644 |
| Escambia County Health Facilities Authority, FL, (Baptist Health Care Corp. Obligated Group), 5.00%, 8/15/35 | | 1,290 | 1,352,359 |
| Geisinger Authority, PA, (Geisinger Health System), 5.00% to 2/15/27 (Put Date), 4/1/43 | | 4,000 | 4,142,080 |
| Lancaster County Hospital Authority, PA, (University of Pennsylvania Health System), 5.00%, 8/15/46 | | 6,050 | 6,161,259 |
| Lexington County Health Services District, Inc., SC, (Lexington Medical Center), 5.00%, 11/1/25 | | 80 | 81,886 |
| Maricopa County Industrial Development Authority, AZ, (Banner Health), 4.02%, (SIFMA + 0.57%), 10/18/24 (Put Date), 1/1/35(2) | | 5,935 | 5,927,700 |
| Massachusetts Development Finance Agency, (Milford Regional Medical Center): | | | |
| 5.00%, 7/15/25(1) | | 120 | 119,640 |
| 5.00%, 7/15/26(1) | | 150 | 150,245 |
| Massachusetts Development Finance Agency, (Wellforce), 5.00%, 7/1/24 | | 650 | 651,150 |
| Michigan Finance Authority, (McLaren Health Care), 4.00%, 2/15/47 | | 2,000 | 1,889,520 |
| Missouri Health and Educational Facilities Authority, (Mercy Health), 4.00%, 11/15/47 | | 3,000 | 2,828,550 |
| Montgomery County Higher Education and Health Authority, PA, (Holy Redeemer Health System): | | | |
| 5.00%, 10/1/25 | | 1,050 | 1,041,012 |
| 5.00%, 10/1/26 | | 1,010 | 999,506 |
| New Jersey Health Care Facilities Financing Authority, (St. Joseph's Healthcare System Obligated Group): | | | |
| 5.00%, 7/1/24 | | 540 | 540,157 |
| 5.00%, 7/1/26 | | 800 | 812,712 |
| 5.00%, 7/1/29 | | 300 | 307,068 |
| 5.00%, 7/1/30 | | 1,595 | 1,633,280 |
| New York Dormitory Authority, (Montefiore Obligated Group), 5.00%, 8/1/28 | | 2,300 | 2,361,824 |
| Northampton County General Purpose Authority, PA, (St. Luke's University Health Network), 4.848%, (70% of 1 mo. SOFR + 1.04%), 8/15/24 (Put Date), 8/15/48(2) | | 1,000 | 1,000,010 |
| Oregon Facilities Authority, (Samaritan Health Services): | | | |
| 5.00%, 10/1/25 | | 225 | 227,770 |
| 5.00%, 10/1/26 | | 150 | 153,458 |
| 5.00%, 10/1/27 | | 125 | 129,178 |
| 5.00%, 10/1/28 | | 150 | 156,945 |
9
See Notes to Financial Statements.
Eaton Vance
Short Duration Municipal Opportunities Fund
March 31, 2024
Portfolio of Investments — continued
| Security | Principal
Amount
(000's omitted) | Value |
| Hospital (continued) |
| Oroville, CA, (Oroville Hospital): | | | |
| 5.00%, 4/1/28 | $ | 1,095 | $ 725,755 |
| 5.00%, 4/1/29 | | 1,000 | 651,600 |
| 5.00%, 4/1/30 | | 930 | 607,104 |
| Washington Health Care Facilities Authority, (MultiCare Health), 5.00%, 8/15/37 | | 2,500 | 2,605,100 |
| Washington Health Care Facilities Authority, (Seattle Children's Hospital), 5.00%, 10/1/38 | | 2,500 | 2,523,625 |
| West Virginia Hospital Finance Authority, (Vandalia Health Group), 5.75%, 9/1/41 | | 2,000 | 2,221,200 |
| Wisconsin Health and Educational Facilities Authority, (Ascension Senior Credit Group): | | | |
| 4.00%, 11/15/39 | | 2,000 | 1,967,680 |
| 5.00%, 11/15/34 | | 1,000 | 1,031,480 |
| | | | $ 53,591,534 |
| Housing — 6.9% |
| California Municipal Finance Authority, (CHF-Riverside II, LLC), 5.00%, 5/15/34 | $ | 3,120 | $ 3,361,987 |
| Connecticut Housing Finance Authority, (Housing Mortgage Finance Program): | | | |
| 0.85%, 5/15/28 | | 1,100 | 939,917 |
| 1.35%, 11/15/30 | | 2,500 | 2,059,800 |
| Connecticut Housing Finance Authority, (Housing Mortgage Finance), 1.35%, 11/15/30 | | 1,550 | 1,277,076 |
| EP Tuscany Zaragosa PFC, TX, (Tuscany at Mesa Hills and Villas at Zaragosa), 4.00%, 12/1/33 | | 5,000 | 4,874,550 |
| Honolulu City and County, HI, (Maunakea Tower Apartments), 5.00% to 6/1/26 (Put Date), 6/1/27 | | 1,500 | 1,539,375 |
| Illinois Housing Development Authority, Social Bonds, (FHLMC), (FNMA), (GNMA), 3.00%, 10/1/51 | | 3,080 | 2,970,568 |
| Maryland Economic Development Corp., (Bowie State University), Student Housing Revenue: | | | |
| 4.00%, 7/1/24 | | 175 | 174,748 |
| 4.00%, 7/1/25 | | 300 | 299,559 |
| 4.00%, 7/1/26 | | 320 | 320,339 |
| Massachusetts Housing Finance Agency, Sustainability Bonds, 4.00%, 12/1/25 | | 5,000 | 5,024,800 |
| Michigan Housing Development Authority: | | | |
| 3.75%, 4/1/27 | | 2,250 | 2,250,090 |
| Social Bonds, 5.50%, 12/1/53 | | 1,540 | 1,642,472 |
| New Mexico Mortgage Finance Authority, (FHLMC), (FNMA), (GNMA), 1.875%, 7/1/36 | | 990 | 761,340 |
| New York City Housing Development Corp., NY: | | | |
| 2.10% to 10/1/29 (Put Date), 11/1/46 | | 5,000 | 4,536,000 |
| Sustainability Bonds, 0.90% to 1/1/26 (Put Date), 11/1/60 | | 4,715 | 4,420,548 |
| Security | Principal
Amount
(000's omitted) | Value |
| Housing (continued) |
| Phoenix Industrial Development Authority, AZ, (Downtown Phoenix Student Housing II, LLC - Arizona State University): | | | |
| 5.00%, 7/1/26 | $ | 160 | $ 162,371 |
| 5.00%, 7/1/27 | | 385 | 394,502 |
| 5.00%, 7/1/28 | | 240 | 248,345 |
| 5.00%, 7/1/29 | | 535 | 558,208 |
| 5.00%, 7/1/30 | | 225 | 234,979 |
| 5.00%, 7/1/31 | | 485 | 505,782 |
| Phoenix Industrial Development Authority, AZ, (Downtown Phoenix Student Housing, LLC - Arizona State University): | | | |
| 5.00%, 7/1/24 | | 180 | 180,020 |
| 5.00%, 7/1/25 | | 870 | 875,281 |
| 5.00%, 7/1/26 | | 600 | 608,892 |
| 5.00%, 7/1/27 | | 375 | 384,255 |
| 5.00%, 7/1/28 | | 340 | 351,822 |
| 5.00%, 7/1/29 | | 300 | 310,737 |
| 5.00%, 7/1/30 | | 465 | 482,014 |
| Public Finance Authority, WI, (NC A&T Real Estate Foundation, LLC): | | | |
| 5.00%, 6/1/24 | | 440 | 439,617 |
| 5.00%, 6/1/25 | | 980 | 979,716 |
| 5.00%, 6/1/26 | | 1,090 | 1,096,725 |
| Seattle Housing Authority, WA, (Juniper Apartments), 5.00%, 6/1/27 | | 2,000 | 2,060,280 |
| Virginia Housing Development Authority, 4.10%, 10/1/27 | | 3,955 | 3,966,628 |
| | | | $ 50,293,343 |
| Industrial Development Revenue — 9.7% |
| Allegheny County Industrial Development Authority, PA, (United States Steel Corp.), 4.875%, 11/1/24 | $ | 3,550 | $ 3,557,207 |
| Appling County Development Authority, GA, (Oglethorpe Power Corp.), 1.50% to 2/3/25 (Put Date), 1/1/38 | | 1,500 | 1,447,770 |
| California Municipal Finance Authority, (Waste Management, Inc.), (AMT), 4.25% to 12/2/24 (Put Date), 12/1/44 | | 3,500 | 3,508,960 |
| California Pollution Control Financing Authority, (Waste Management, Inc.), (AMT), 2.50% to 5/1/24 (Put Date), 7/1/31 | | 1,625 | 1,623,180 |
| Chandler Industrial Development Authority, AZ, (Intel Corp.): | | | |
| (AMT), 5.00% to 6/3/24 (Put Date), 6/1/49 | | 3,000 | 3,003,270 |
| (AMT), 5.00% to 9/1/27 (Put Date), 9/1/52 | | 5,000 | 5,153,600 |
| Maine Finance Authority, (Casella Waste Systems, Inc.), (AMT), 4.375% to 8/1/25 (Put Date), 8/1/35(1) | | 875 | 870,651 |
| Matagorda County Navigation District No. 1, TX, (Central Power and Light Co.), 2.60%, 11/1/29 | | 1,000 | 907,150 |
10
See Notes to Financial Statements.
Eaton Vance
Short Duration Municipal Opportunities Fund
March 31, 2024
Portfolio of Investments — continued
| Security | Principal
Amount
(000's omitted) | Value |
| Industrial Development Revenue (continued) |
| Michigan Strategic Fund, (Graphic Packaging International, LLC), Green Bonds, (AMT), 4.00% to 10/1/26 (Put Date), 10/1/61 | $ | 4,000 | $ 3,999,040 |
| New Jersey Economic Development Authority, (New Jersey Natural Gas Co.), (AMT), 2.45% to 4/1/26 (Put Date), 4/1/59 | | 2,500 | 2,431,700 |
| New York State Environmental Facilities Corp., (Casella Waste Systems, Inc.), (AMT), 2.875% to 12/3/29 (Put Date), 12/1/44(1) | | 710 | 648,457 |
| New York Transportation Development Corp., (Delta Air Lines, Inc. - LaGuardia Airport Terminals C&D Redevelopment), (AMT), 6.00%, 4/1/35 | | 1,705 | 1,936,880 |
| Niagara Area Development Corp., NY, (Covanta), 3.50%, 11/1/24(1) | | 4,080 | 4,064,374 |
| Ohio Air Quality Development Authority, (Pratt Paper, LLC), (AMT), 3.75%, 1/15/28(1) | | 680 | 678,776 |
| Pennsylvania Economic Development Financing Authority, (Waste Management, Inc.): | | | |
| 0.95% to 12/1/26 (Put Date), 12/1/33 | | 3,000 | 2,764,470 |
| (AMT), 1.75% to 8/1/24 (Put Date), 8/1/38 | | 5,000 | 4,959,850 |
| Public Finance Authority, WI, (Waste Management, Inc.): | | | |
| (AMT), 1.10% to 6/1/26 (Put Date), 7/1/29 | | 7,750 | 7,289,960 |
| (AMT), 2.625%, 11/1/25 | | 1,500 | 1,468,230 |
| Rockport, IN, (Indiana Michigan Power Co.), 3.05%, 6/1/25 | | 1,600 | 1,580,512 |
| St. John Baptist Parish, LA, (Marathon Oil Corp.), 2.125% to 7/1/24 (Put Date), 6/1/37 | | 10,250 | 10,184,810 |
| Trimble County, KY, (Louisville Gas and Electric Co.), (AMT), 1.30% to 9/1/27 (Put Date), 9/1/44 | | 4,750 | 4,187,172 |
| West Virginia Economic Development Authority, (Appalachian Power Co.), 3.75% to 6/1/25 (Put Date), 12/1/42 | | 4,000 | 3,998,960 |
| | | | $ 70,264,979 |
| Insured - Education — 0.0%(4) |
| Southern Illinois University, (NPFG), 0.00%, 4/1/26 | $ | 200 | $ 182,580 |
| | | | $ 182,580 |
| Insured - Electric Utilities — 0.6% |
| New York Power Authority, Green Transmission Revenue, (AGM), 5.00%, 11/15/27 | $ | 1,500 | $ 1,620,195 |
| Puerto Rico Electric Power Authority: | | | |
| (NPFG), 5.00%, 7/1/24 | | 845 | 845,186 |
| (NPFG), 5.25%, 7/1/29 | | 1,740 | 1,721,869 |
| | | | $ 4,187,250 |
| Security | Principal
Amount
(000's omitted) | Value |
| Insured - General Obligations — 0.4% |
| Chicago Board of Education, IL: | | | |
| (NPFG), 0.00%, 12/1/26 | $ | 1,945 | $ 1,749,372 |
| Series 1998B, (NPFG), 0.00%, 12/1/24 | | 365 | 354,999 |
| Series 1999A, (NPFG), 0.00%, 12/1/24 | | 260 | 252,876 |
| Chicago, IL, (AGM), 0.00%, 1/1/25 | | 250 | 242,287 |
| Paterson, NJ, (BAM), 5.00%, 1/15/26 | | 485 | 485,553 |
| Will County Community High School District No. 210, IL, (AGM), 0.00%, 1/1/25 | | 130 | 126,073 |
| | | | $ 3,211,160 |
| Insured - Special Tax Revenue — 0.2% |
| Arborwood Community Development District, FL, (AGM), 2.60%, 5/1/24 | $ | 1,180 | $ 1,177,994 |
| | | | $ 1,177,994 |
| Lease Revenue/Certificates of Participation — 2.6% |
| California State Public Works Board, 4.50%, 9/1/35 | $ | 4,910 | $ 4,923,502 |
| Commonwealth Financing Authority, PA, Tobacco Master Settlement Payment Revenue, 5.00%, 6/1/25 | | 2,000 | 2,028,120 |
| New Jersey Economic Development Authority, (State House), 4.00%, 6/15/29 | | 3,340 | 3,448,450 |
| New Jersey Transportation Trust Fund Authority, (Transportation Program): | | | |
| 5.00%, 6/15/25 | | 1,250 | 1,272,825 |
| 5.00%, 6/15/26 | | 1,000 | 1,037,170 |
| New Jersey Transportation Trust Fund Authority, (Transportation System), 0.00%, 12/15/24 | | 200 | 194,928 |
| New York City Transitional Finance Authority, NY, (Building Aid), 5.00%, 7/15/37 | | 5,000 | 5,109,100 |
| Virginia Commonwealth Transportation Board, 4.00%, 5/15/31 | | 1,000 | 999,940 |
| | | | $ 19,014,035 |
| Other Revenue — 5.8% |
| Austin Convention Enterprises, Inc., TX, (Convention Center Hotel), 5.00%, 1/1/25 | $ | 500 | $ 499,755 |
| Black Belt Energy Gas District, AL: | | | |
| 3.82%, (SIFMA + 0.37%), 10/1/26 (Put Date), 10/1/49(2) | | 15,000 | 14,563,500 |
| 5.50% to 2/1/29 (Put Date), 6/1/49 | | 2,320 | 2,473,607 |
| California Community Choice Financing Authority, Clean Energy Project Revenue: | | | |
| Green Bonds, 5.00% to 8/1/29 (Put Date), 12/1/53 | | 1,250 | 1,320,825 |
| Green Bonds, 5.50% to 11/1/30 (Put Date), 10/1/54 | | 6,095 | 6,723,456 |
| Kalispel Tribe of Indians, WA, Series A, 5.00%, 1/1/32(1) | | 790 | 816,734 |
| Main Street Natural Gas, Inc., GA, Gas Supply Revenue, 5.00% to 6/1/31 (Put Date), 12/1/53 | | 10,000 | 10,688,000 |
11
See Notes to Financial Statements.
Eaton Vance
Short Duration Municipal Opportunities Fund
March 31, 2024
Portfolio of Investments — continued
| Security | Principal
Amount
(000's omitted) | Value |
| Other Revenue (continued) |
| Northern California Energy Authority, 5.00% to 8/1/30 (Put Date), 12/1/54(3) | $ | 960 | $ 1,026,912 |
| Northern California Gas Authority No. 1, Gas Project Revenue, 4.466%, (67% of 3 mo. SOFR + 0.72%), 7/1/27(2) | | 635 | 631,215 |
| Texas Municipal Gas Acquisition and Supply Corp. I, Gas Supply Revenue, 4.446%, (67% of 3 mo. SOFR + 0.70%), 12/15/26(2) | | 1,620 | 1,613,650 |
| Texas Municipal Gas Acquisition and Supply Corp. II, Gas Supply Revenue, 4.38%, (66% of 3 mo. SOFR + 0.86%), 9/15/27(2) | | 1,795 | 1,787,658 |
| | | | $ 42,145,312 |
| Senior Living/Life Care — 8.1% |
| Bexar County Health Facilities Development Corp., TX, (Army Retirement Residence Foundation): | | | |
| 5.00%, 7/15/24 | $ | 300 | $ 300,063 |
| 5.00%, 7/15/25 | | 250 | 250,228 |
| Brookhaven Local Development Corp., NY, (Jefferson's Ferry), 5.25%, 11/1/26 | | 365 | 373,099 |
| Bucks County Industrial Development Authority, PA, (Pennswood Village), 5.00%, 10/1/24 | | 800 | 802,016 |
| California Public Finance Authority, (Enso Village), Green Bonds, 2.125%, 11/15/27(1) | | 55 | 55,003 |
| Colorado Health Facilities Authority, (Aberdeen Ridge): | | | |
| 2.125%, 5/15/28 | | 1,500 | 1,430,370 |
| 2.625%, 5/15/29 | | 2,000 | 1,876,420 |
| Colorado Health Facilities Authority, (Christian Living Neighborhoods): | | | |
| 4.00%, 1/1/27 | | 200 | 198,194 |
| 4.00%, 1/1/28 | | 240 | 237,029 |
| Florida Development Finance Corp. (The Glenridge on Palmer Ranch): | | | |
| 4.00%, 6/1/24(1) | | 105 | 104,844 |
| 4.00%, 6/1/25(1) | | 110 | 108,887 |
| 4.00%, 6/1/26(1) | | 110 | 107,874 |
| 5.00%, 6/1/31(1) | | 285 | 281,774 |
| 5.00%, 6/1/35(1) | | 225 | 218,612 |
| Franklin County Industrial Development Authority, PA, (Menno-Haven, Inc.): | | | |
| 5.00%, 12/1/24 | | 425 | 423,899 |
| 5.00%, 12/1/30 | | 500 | 484,815 |
| Fulton County Residential Care Facilities for the Elderly Authority, GA, (Canterbury Court), 2.25%, 10/1/28(1) | | 3,665 | 3,282,704 |
| Hanover County Economic Development Authority, VA, (Covenant Woods), 3.625%, 7/1/28 | | 430 | 404,772 |
| Security | Principal
Amount
(000's omitted) | Value |
| Senior Living/Life Care (continued) |
| Illinois Finance Authority, (Presbyterian Homes Obligated Group), 4.15%, (SIFMA + 0.70%), 5/1/26 (Put Date), 5/1/42(2) | $ | 725 | $ 711,689 |
| Iowa Finance Authority, (Lifespace Communities, Inc.), 4.00%, 5/15/27 | | 2,240 | 2,173,405 |
| James City County Economic Development Authority, VA, (Williamsburg Landing), 4.00%, 12/1/24 | | 415 | 415,141 |
| Kentwood Economic Development Corp., MI, (Holland Home Obligated Group), 4.00%, 11/15/31 | | 485 | 460,163 |
| Massachusetts Development Finance Agency, (NewBridge on the Charles, Inc.): | | | |
| 4.00%, 10/1/25(1) | | 515 | 516,555 |
| 4.00%, 10/1/26(1) | | 1,000 | 1,003,770 |
| 4.00%, 10/1/27(1) | | 400 | 401,424 |
| Montgomery County Industrial Development Authority, PA, (Waverly Heights, Ltd.): | | | |
| 4.00%, 12/1/24 | | 150 | 149,499 |
| 4.00%, 12/1/25 | | 100 | 99,565 |
| 4.00%, 12/1/26 | | 150 | 149,472 |
| 4.00%, 12/1/27 | | 200 | 199,874 |
| 4.00%, 12/1/28 | | 200 | 200,454 |
| 4.00%, 12/1/29 | | 250 | 251,533 |
| Multnomah County Hospital Facilities Authority, OR, (Terwilliger Plaza), Green Bonds, 1.20%, 6/1/28 | | 2,000 | 1,770,100 |
| National Finance Authority, NH, (The Vista): | | | |
| 5.25%, 7/1/39(1) | | 705 | 663,313 |
| 5.625%, 7/1/46(1) | | 425 | 395,671 |
| 5.75%, 7/1/54(1) | | 1,130 | 1,046,323 |
| New Hope Cultural Education Facilities Finance Corp., TX, (Longhorn Village), 5.00%, 1/1/30 | | 630 | 627,461 |
| New Hope Cultural Education Facilities Finance Corp., TX, (The Outlook at Windhaven): | | | |
| 4.25%, 10/1/26 | | 3,000 | 2,984,550 |
| 4.50%, 10/1/26 | | 3,000 | 2,984,610 |
| New Mexico Hospital Equipment Loan Council, (Haverland Carter Lifestyle Group): | | | |
| 5.00%, 7/1/30 | | 400 | 394,072 |
| 5.00%, 7/1/31 | | 670 | 656,794 |
| Norfolk Redevelopment and Housing Authority, VA, (Fort Norfolk Retirement Community, Inc. - Harbor's Edge), 4.00%, 1/1/25 | | 1,705 | 1,693,508 |
| North Carolina Medical Care Commission, (Galloway Ridge): | | | |
| 4.00%, 1/1/25 | | 250 | 248,353 |
| 4.00%, 1/1/26 | | 240 | 236,213 |
| 5.00%, 1/1/27 | | 565 | 564,955 |
| Palm Beach County Health Facilities Authority, FL, (Green Cay Life Plan Village), 11.50%, 7/1/27(1) | | 2,500 | 2,943,425 |
12
See Notes to Financial Statements.
Eaton Vance
Short Duration Municipal Opportunities Fund
March 31, 2024
Portfolio of Investments — continued
| Security | Principal
Amount
(000's omitted) | Value |
| Senior Living/Life Care (continued) |
| Palm Beach County Health Facilities Authority, FL, (Lifespace Communities, Inc.): | | | |
| 4.00%, 5/15/27 | $ | 1,240 | $ 1,203,135 |
| 5.00%, 5/15/26 | | 1,000 | 995,580 |
| Palm Beach County Health Facilities Authority, FL, (Toby & Leon Cooperman Sinai Residences of Boca Raton), 4.00%, 6/1/26 | | 300 | 297,411 |
| Polk County Industrial Development Authority, FL, (Carpenter's Home Estates, Inc.), 5.00%, 1/1/29 | | 265 | 269,778 |
| Public Finance Authority, WI, (Penick Village), 4.00%, 9/1/29(1) | | 450 | 422,554 |
| Public Finance Authority, WI, (SearStone CCRC), 2.25%, 6/1/27(1) | | 2,000 | 1,900,320 |
| South Carolina Jobs-Economic Development Authority, (South Carolina Episcopal Home at Still Hopes): | | | |
| 5.00%, 4/1/24 | | 1,450 | 1,450,000 |
| 5.00%, 4/1/25 | | 1,510 | 1,508,112 |
| 5.00%, 4/1/26 | | 1,595 | 1,589,609 |
| South Carolina Jobs-Economic Development Authority, (Woodlands at Furman): | | | |
| 4.00%, 11/15/24 | | 200 | 199,604 |
| 4.00%, 11/15/25 | | 275 | 273,413 |
| 5.00%, 11/15/27 | | 300 | 305,244 |
| 5.00%, 11/15/29 | | 115 | 117,420 |
| 5.00%, 11/15/30 | | 180 | 183,852 |
| St. Johns County Industrial Development Authority, FL, (Vicar's Landing): | | | |
| 4.00%, 12/15/24 | | 145 | 144,327 |
| 4.00%, 12/15/25 | | 180 | 177,892 |
| 4.00%, 12/15/26 | | 375 | 367,736 |
| 4.00%, 12/15/27 | | 215 | 209,072 |
| 4.00%, 12/15/28 | | 200 | 192,752 |
| St. Louis County Industrial Development Authority, MO, (Friendship Village St. Louis Obligated Group): | | | |
| 5.00%, 9/1/24 | | 1,490 | 1,490,954 |
| 5.00%, 9/1/25 | | 1,615 | 1,621,040 |
| Suffolk County Economic Development Corp., NY, (Peconic Landing at Southold, Inc.): | | | |
| 4.00%, 12/1/24 | | 245 | 243,547 |
| 4.00%, 12/1/25 | | 250 | 247,178 |
| Tarrant County Cultural Education Facilities Finance Corp., TX, (MRC Stevenson Oaks), 6.25%, 11/15/31 | | 620 | 608,195 |
| Tempe Industrial Development Authority, AZ, (Friendship Village of Tempe): | | | |
| 1.50%, 12/1/27 | | 715 | 675,174 |
| 4.00%, 12/1/24 | | 225 | 224,667 |
| 4.00%, 12/1/25 | | 275 | 273,807 |
| 4.00%, 12/1/26 | | 240 | 238,075 |
| Security | Principal
Amount
(000's omitted) | Value |
| Senior Living/Life Care (continued) |
| Vermont Economic Development Authority, (Wake Robin Corp.), 5.00%, 5/1/27 | $ | 1,000 | $ 1,024,600 |
| Virginia Beach Development Authority, VA, (Westminster-Canterbury on Chesapeake Bay), 6.25%, 9/1/30 | | 2,000 | 2,080,500 |
| Washington Housing Finance Commission, (Horizon House), 5.00%, 1/1/25(1) | | 1,165 | 1,165,326 |
| Washington Housing Finance Commission, (Transforming Age): | | | |
| 5.00%, 1/1/25(1) | | 385 | 383,575 |
| 5.00%, 1/1/26(1) | | 400 | 396,348 |
| Wayzata, MN, (Folkestone Senior Living Community): | | | |
| 3.00%, 8/1/24 | | 100 | 99,742 |
| 3.00%, 8/1/25 | | 100 | 98,942 |
| 3.00%, 8/1/26 | | 250 | 245,188 |
| Wisconsin Health and Educational Facilities Authority, (Three Pillars Senior Living Communities), 4.40%, 8/15/29(3) | | 1,000 | 1,001,370 |
| | | | $ 58,808,534 |
| Special Tax Revenue — 3.2% |
| Allentown Neighborhood Improvement Zone Development Authority, PA: | | | |
| 5.00%, 5/1/27 | $ | 400 | $ 414,444 |
| 5.00%, 5/1/28 | | 575 | 603,474 |
| 5.00%, 5/1/29 | | 600 | 635,712 |
| Allentown Neighborhood Improvement Zone Development Authority, PA, (City Center Project), 5.00%, 5/1/32(1) | | 3,000 | 3,063,330 |
| Baltimore, MD, (Harbor Point): | | | |
| 2.80%, 6/1/25(1) | | 125 | 122,139 |
| 2.85%, 6/1/26(1) | | 135 | 129,869 |
| 2.95%, 6/1/27(1) | | 175 | 166,245 |
| District of Columbia, Income Tax Revenue, 5.00%, 5/1/38 | | 2,150 | 2,484,024 |
| Massachusetts School Building Authority, 4.00%, 1/15/37 | | 3,650 | 3,659,453 |
| Metropolitan Pier and Exposition Authority, IL, (McCormick Place Expansion), 5.00%, 12/15/27 | | 1,000 | 1,020,850 |
| New York City Transitional Finance Authority, NY, Future Tax Revenue: | | | |
| 5.00%, 2/1/35 | | 2,555 | 2,691,335 |
| 5.00%, 8/1/36 | | 2,500 | 2,540,050 |
| Ohio County Commission, WV, (Fort Henry Economic Opportunity Development District - The Highlands), 4.00%, 3/1/28 | | 225 | 221,175 |
| Puerto Rico Sales Tax Financing Corp., 4.50%, 7/1/34 | | 4,246 | 4,270,287 |
13
See Notes to Financial Statements.
Eaton Vance
Short Duration Municipal Opportunities Fund
March 31, 2024
Portfolio of Investments — continued
| Security | Principal
Amount
(000's omitted) | Value |
| Special Tax Revenue (continued) |
| St. Louis Land Clearance for Redevelopment Authority, MO, (Kiel Opera House Renovation), 3.875%, 10/1/35 | $ | 770 | $ 699,976 |
| Tolomato Community Development District, FL, 2.625%, 5/1/27 | | 745 | 717,107 |
| | | | $ 23,439,470 |
| Student Loan — 0.9% |
| Massachusetts Educational Financing Authority: | | | |
| (AMT), 3.50%, 7/1/33 | $ | 2,745 | $ 2,634,294 |
| (AMT), 3.625%, 7/1/38 | | 1,310 | 1,218,706 |
| New Jersey Higher Education Student Assistance Authority, (AMT), 5.00%, 12/1/25 | | 2,850 | 2,902,155 |
| | | | $ 6,755,155 |
| Transportation — 11.5% |
| Broward County, FL, Airport System Revenue, (AMT), 5.00%, 10/1/30 | $ | 2,500 | $ 2,540,650 |
| California Municipal Finance Authority, (LINXS Automated People Mover), (AMT), 5.00%, 6/30/27 | | 695 | 699,969 |
| Denver City and County, CO, Airport System Revenue: | | | |
| (AMT), 5.00%, 11/15/28 | | 7,680 | 8,272,973 |
| (AMT), 5.00%, 11/15/30 | | 7,170 | 7,893,094 |
| (AMT), 5.00%, 12/1/32 | | 6,350 | 6,775,514 |
| Eagle County Air Terminal Corp., CO, (AMT), 4.00%, 5/1/26 | | 1,000 | 996,830 |
| Los Angeles Department of Airports, CA, (Los Angeles International Airport), (AMT), 5.00%, 5/15/27 | | 5,235 | 5,489,892 |
| Massachusetts Port Authority: | | | |
| (AMT), 5.00%, 7/1/30 | | 1,500 | 1,625,490 |
| (AMT), 5.00%, 7/1/34 | | 2,405 | 2,411,445 |
| Metropolitan Nashville Airport Authority, TN, (AMT), 5.00%, 7/1/27 | | 1,000 | 1,048,520 |
| Metropolitan Washington Airports Authority, D.C.: | | | |
| (AMT), 5.00%, 10/1/29 | | 2,000 | 2,099,600 |
| (AMT), 5.00%, 10/1/33 | | 5,000 | 5,080,100 |
| Philadelphia, PA, Airport Revenue, (AMT), 5.00%, 7/1/42 | | 1,750 | 1,790,688 |
| Port Authority of New York and New Jersey, (AMT), 5.00%, 9/15/32 | | 3,000 | 3,168,090 |
| Port of Seattle, WA: | | | |
| (AMT), 5.00%, 7/1/27 | | 10,000 | 10,002,800 |
| (AMT), 5.00%, 5/1/33 | | 2,045 | 2,105,021 |
| (AMT), 5.00%, 5/1/37 | | 2,100 | 2,141,496 |
| (AMT), 5.00%, 4/1/40 | | 4,000 | 3,971,360 |
| Port of Tacoma, WA, (AMT), 5.00%, 12/1/35 | | 1,000 | 1,023,800 |
| Salt Lake City, UT, (Salt Lake City International Airport), (AMT), 5.00%, 7/1/32 | | 3,500 | 3,654,140 |
| Security | Principal
Amount
(000's omitted) | Value |
| Transportation (continued) |
| South Jersey Transportation Authority, NJ, 5.00%, 11/1/39 | $ | 280 | $ 281,002 |
| Triborough Bridge and Tunnel Authority, NY, 5.00%, 11/15/34 | | 2,100 | 2,220,330 |
| Wayne County Airport Authority, MI, (Detroit Metropolitan Wayne County Airport), (AMT), 5.00%, 12/1/31 | | 8,500 | 8,651,980 |
| | | | $ 83,944,784 |
| Water and Sewer — 4.4% |
| Atlanta, GA, Water and Wastewater Revenue, 5.00%, 11/1/39 | $ | 2,500 | $ 2,627,475 |
| El Paso, TX, Municipal Drainage Utility System Revenue: | | | |
| 5.00%, 3/1/40(3) | | 1,200 | 1,349,148 |
| 5.00%, 3/1/41(3) | | 2,580 | 2,886,401 |
| Great Lakes Water Authority, MI, Sewage Disposal System Revenue, 5.00%, 7/1/31 | | 10,000 | 10,380,600 |
| King County, WA, Sewer Improvement and Refunding Revenue, 4.00%, 7/1/41 | | 2,000 | 1,957,800 |
| New York City Municipal Water Finance Authority, NY, (Water and Sewer System), (SPA: TD Bank, N.A.), 3.42%, 6/15/51(5) | | 5,550 | 5,550,000 |
| Phoenix Civic Improvement Corp., AZ, Wastewater System Revenue, 5.00%, 7/1/28 | | 860 | 862,253 |
| San Antonio, TX, Water System Revenue, 4.00%, 5/15/36 | | 3,000 | 3,002,280 |
| Tacoma, WA, Sewer Revenue, 4.00%, 12/1/33 | | 3,220 | 3,238,419 |
| | | | $ 31,854,376 |
Total Tax-Exempt Municipal Obligations
(identified cost $661,543,520) | | | $657,869,613 |
| Taxable Municipal Obligations — 5.9% |
| Security | Principal
Amount
(000's omitted) | Value |
| Education — 0.5% |
| Florida Higher Educational Facilities Financing Authority, (Jacksonville University), 5.43%, 6/1/27(1) | $ | 2,180 | $ 2,169,035 |
| Forest Grove, OR, (Pacific University), 1.65%, 5/1/24 | | 320 | 318,899 |
| Indiana Finance Authority, (Depauw University), 4.20%, 7/1/24 | | 400 | 398,532 |
| New York Dormitory Authority, (State University of New York), 1.366%, 7/1/25 | | 755 | 721,372 |
| | | | $ 3,607,838 |
14
See Notes to Financial Statements.
Eaton Vance
Short Duration Municipal Opportunities Fund
March 31, 2024
Portfolio of Investments — continued
| Security | Principal
Amount
(000's omitted) | Value |
| Escrowed/Prerefunded — 0.2% |
| San Diego County Regional Transportation Commission, CA, Escrowed to Maturity, 2.085%, 4/1/25 | $ | 1,500 | $ 1,456,110 |
| | | | $ 1,456,110 |
| General Obligations — 1.0% |
| California, 7.50%, 4/1/34(6) | $ | 2,500 | $ 2,942,875 |
| Cecil County, MD, 1.20%, 11/1/27 | | 420 | 374,018 |
| Douglas County School District No. 17, NE, 1.048%, 6/15/26 | | 585 | 539,639 |
| Livermore Valley Joint Unified School District, CA, 1.335%, 8/1/26 | | 3,290 | 3,045,652 |
| | | | $ 6,902,184 |
| Hospital — 0.7% |
| California Statewide Communities Development Authority, (Loma Linda University Medical Center), 6.00%, 12/1/24 | $ | 1,695 | $ 1,687,101 |
| Conway, AR, (Conway Regional Medical Center): | | | |
| 1.15%, 8/1/24 | | 250 | 246,145 |
| 1.75%, 8/1/26 | | 250 | 229,245 |
| Jefferson County Civic Facility Development Corp., NY, (Samaritan Medical Center), 4.25%, 11/1/28 | | 1,025 | 968,277 |
| University of Wisconsin Hospitals and Clinics Authority, 1.69%, 4/1/26 | | 1,750 | 1,638,857 |
| | | | $ 4,769,625 |
| Housing — 0.6% |
| Maine Housing Authority, (SPA: TD Bank, N.A.), 5.35%, 11/15/50(5) | $ | 4,500 | $ 4,500,000 |
| | | | $ 4,500,000 |
| Insured - General Obligations — 0.1% |
| Bureau County Township High School District No. 502, IL, (BAM), 1.356%, 12/1/27 | $ | 620 | $ 545,129 |
| Valley View School District, PA, (BAM), 2.20%, 5/15/26 | | 500 | 467,840 |
| | | | $ 1,012,969 |
| Insured - Special Tax Revenue — 0.4% |
| Bexar County, TX, Venue Project Revenue: | | | |
| (AGM), 1.272%, 8/15/26 | $ | 550 | $ 503,883 |
| (AGM), 1.573%, 8/15/27 | | 500 | 448,515 |
| (AGM), 1.743%, 8/15/28 | | 750 | 659,265 |
| (AGM), 1.924%, 8/15/29 | | 1,535 | 1,324,674 |
| | | | $ 2,936,337 |
| Security | Principal
Amount
(000's omitted) | Value |
| Insured - Transportation — 0.6% |
| Miami-Dade County, FL, Seaport Revenue, (AGM), 1.349%, 10/1/26 | $ | 4,860 | $ 4,458,953 |
| | | | $ 4,458,953 |
| Senior Living/Life Care — 0.1% |
| Indiana Finance Authority, (BHI Senior Living), 2.52%, 11/15/26 | $ | 510 | $ 468,971 |
| | | | $ 468,971 |
| Special Tax Revenue — 1.3% |
| Illinois, Sales Tax Revenue: | | | |
| 1.253%, 6/15/25 | $ | 2,000 | $ 1,909,140 |
| 1.453%, 6/15/26 | | 3,000 | 2,786,520 |
| Los Angeles County Metropolitan Transportation Authority, CA, Sales Tax Revenue, 4.654%, 7/1/28(3) | | 1,640 | 1,649,200 |
| Massachusetts School Building Authority, Social Bonds, 1.753%, 8/15/30 | | 3,500 | 3,023,090 |
| Ohio County Commission, WV, (Fort Henry Economic Opportunity Development District - The Highlands), 5.25%, 3/1/31 | | 330 | 317,041 |
| | | | $ 9,684,991 |
| Transportation — 0.4% |
| Central Texas Regional Mobility Authority, 1.585%, 1/1/26 | $ | 1,150 | $ 1,082,920 |
| Port of Seattle, WA, 3.475%, 8/1/24 | | 2,000 | 1,986,400 |
| | | | $ 3,069,320 |
Total Taxable Municipal Obligations
(identified cost $44,735,772) | | | $ 42,867,298 |
| U.S. Treasury Obligations — 0.9% |
| Security | Principal
Amount
(000's omitted) | Value |
| U.S. Treasury Notes, 5.00%, 8/31/25 | $ | 6,500 | $ 6,514,219 |
Total U.S. Treasury Obligations
(identified cost $6,504,208) | | | $ 6,514,219 |
Total Investments — 100.3%
(identified cost $733,921,306) | | | $728,651,130 |
| Other Assets, Less Liabilities — (0.3)% | | | $ (1,909,522) |
| Net Assets — 100.0% | | | $726,741,608 |
15
See Notes to Financial Statements.
Eaton Vance
Short Duration Municipal Opportunities Fund
March 31, 2024
Portfolio of Investments — continued
| The percentage shown for each investment category in the Portfolio of Investments is based on net assets. |
| (1) | Security exempt from registration under Rule 144A of the Securities Act of 1933, as amended. These securities may be sold in certain transactions in reliance on an exemption from registration (normally to qualified institutional buyers). At March 31, 2024, the aggregate value of these securities is $38,231,639 or 5.3% of the Fund's net assets. |
| (2) | Floating rate security. The stated interest rate represents the rate in effect at March 31, 2024. |
| (3) | When-issued security. |
| (4) | Amount is less than 0.05%. |
| (5) | Variable rate demand obligation that may be tendered at par on any day for payment the lesser of 5 business days or 7 calendar days. The stated interest rate, which generally resets weekly, is determined by the remarketing agent and represents the rate in effect at March 31, 2024. |
| (6) | Build America Bond. Represents taxable municipal obligation issued pursuant to the American Recovery and Reinvestment Act of 2009 or other legislation providing for the issuance of taxable municipal debt on which the issuer receives federal support. |
| At March 31, 2024, the concentration of the Fund's investments in the various states, determined as a percentage of net assets, is as follows: |
| California | 10.5% |
| Others, representing less than 10% individually | 86.0% |
| The Fund invests primarily in debt securities issued by municipalities. The ability of the issuers of the debt securities to meet their obligations may be affected by economic developments in a specific industry or municipality. At March 31, 2024, 2.4% of total investments are backed by bond insurance of various financial institutions and financial guaranty assurance agencies. The aggregate percentage insured by an individual financial institution or financial guaranty assurance agency ranged from 0.2% to 1.4% of total investments. |
| Abbreviations: |
| AGM | – Assured Guaranty Municipal Corp. |
| AMT | – Interest earned from these securities may be considered a tax preference item for purposes of the Federal Alternative Minimum Tax. |
| BAM | – Build America Mutual Assurance Co. |
| FHLMC | – Federal Home Loan Mortgage Corp. |
| FNMA | – Federal National Mortgage Association |
| GNMA | – Government National Mortgage Association |
| NPFG | – National Public Finance Guarantee Corp. |
| PSF | – Permanent School Fund |
| SIFMA | – Securities Industry and Financial Markets Association Municipal Swap Index |
| SOFR | – Secured Overnight Financing Rate |
| SPA | – Standby Bond Purchase Agreement |
16
See Notes to Financial Statements.
Eaton Vance
Short Duration Municipal Opportunities Fund
March 31, 2024
Statement of Assets and Liabilities
| | March 31, 2024 |
| Assets | |
| Investments, at value (identified cost $733,921,306) | $ 728,651,130 |
| Cash | 21,721 |
| Interest receivable | 8,419,594 |
| Receivable for investments sold | 7,607,664 |
| Receivable for Fund shares sold | 2,003,019 |
| Trustees' deferred compensation plan | 34,882 |
| Total assets | $746,738,010 |
| Liabilities | |
| Payable for when-issued securities | $ 17,038,448 |
| Payable for Fund shares redeemed | 1,693,408 |
| Distributions payable | 645,955 |
| Payable to affiliates: | |
| Investment adviser and administration fee | 246,982 |
| Distribution and service fees | 26,118 |
| Trustees' deferred compensation plan | 34,882 |
| Accrued expenses | 310,609 |
| Total liabilities | $ 19,996,402 |
| Net Assets | $726,741,608 |
| Sources of Net Assets | |
| Paid-in capital | $ 771,723,003 |
| Accumulated loss | (44,981,395) |
| Net Assets | $726,741,608 |
| Class A Shares | |
| Net Assets | $ 122,727,305 |
| Shares Outstanding | 12,576,818 |
Net Asset Value and Redemption Price Per Share
(net assets ÷ shares of beneficial interest outstanding) | $ 9.76 |
Maximum Offering Price Per Share
(100 ÷ 96.75 of net asset value per share) | $ 10.09 |
| Class C Shares | |
| Net Assets | $ 13,496,536 |
| Shares Outstanding | 1,443,936 |
Net Asset Value and Offering Price Per Share*
(net assets ÷ shares of beneficial interest outstanding) | $ 9.35 |
| Class I Shares | |
| Net Assets | $ 590,517,767 |
| Shares Outstanding | 60,486,619 |
Net Asset Value, Offering Price and Redemption Price Per Share
(net assets ÷ shares of beneficial interest outstanding) | $ 9.76 |
| On sales of $100,000 or more, the offering price of Class A shares is reduced. |
| * | Redemption price per share is equal to the net asset value less any applicable contingent deferred sales charge. |
17
See Notes to Financial Statements.
Eaton Vance
Short Duration Municipal Opportunities Fund
March 31, 2024
| | Year Ended |
| | March 31, 2024 |
| Investment Income | |
| Interest income | $ 28,126,270 |
| Total investment income | $28,126,270 |
| Expenses | |
| Investment adviser and administration fee | $ 3,132,629 |
| Distribution and service fees: | |
| Class A | 202,811 |
| Class C | 150,947 |
| Trustees’ fees and expenses | 50,411 |
| Custodian fee | 188,808 |
| Transfer and dividend disbursing agent fees | 246,973 |
| Legal and accounting services | 91,459 |
| Printing and postage | 32,460 |
| Registration fees | 82,616 |
| Miscellaneous | 126,492 |
| Total expenses | $ 4,305,606 |
| Net investment income | $23,820,664 |
| Realized and Unrealized Gain (Loss) | |
| Net realized gain (loss): | |
| Investment transactions | $ (4,572,067) |
| Futures contracts | 184,001 |
| Net realized loss | $ (4,388,066) |
| Change in unrealized appreciation (depreciation): | |
| Investments | $ 7,163,797 |
| Net change in unrealized appreciation (depreciation) | $ 7,163,797 |
| Net realized and unrealized gain | $ 2,775,731 |
| Net increase in net assets from operations | $26,596,395 |
18
See Notes to Financial Statements.
Eaton Vance
Short Duration Municipal Opportunities Fund
March 31, 2024
Statements of Changes in Net Assets
| | Year Ended March 31, |
| | 2024 | 2023 |
| Increase (Decrease) in Net Assets | | |
| From operations: | | |
| Net investment income | $ 23,820,664 | $ 20,751,297 |
| Net realized loss | (4,388,066) | (25,473,597) |
| Net change in unrealized appreciation (depreciation) | 7,163,797 | 5,401,730 |
| Net increase in net assets from operations | $ 26,596,395 | $ 679,430 |
| Distributions to shareholders: | | |
| Class A | $ (3,896,475) | $ (3,484,931) |
| Class C | (355,966) | (310,600) |
| Class I | (19,142,586) | (16,799,342) |
| Total distributions to shareholders | $ (23,395,027) | $ (20,594,873) |
| Transactions in shares of beneficial interest: | | |
| Class A | $ (32,216,910) | $ (43,698,645) |
| Class C | (7,356,892) | (9,456,828) |
| Class I | (120,099,001) | (84,101,407) |
| Net decrease in net assets from Fund share transactions | $(159,672,803) | $ (137,256,880) |
| Net decrease in net assets | $(156,471,435) | $ (157,172,323) |
| Net Assets | | |
| At beginning of year | $ 883,213,043 | $1,040,385,366 |
| At end of year | $ 726,741,608 | $ 883,213,043 |
19
See Notes to Financial Statements.
Eaton Vance
Short Duration Municipal Opportunities Fund
March 31, 2024
| | Class A |
| | Year Ended March 31, |
| | 2024 | 2023 | 2022 | 2021 | 2020 |
| Net asset value — Beginning of year | $ 9.70 | $ 9.88 | $ 10.28 | $ 9.90 | $ 10.07 |
| Income (Loss) From Operations | | | | | |
| Net investment income(1) | $ 0.28 | $ 0.20 | $ 0.11 | $ 0.16 | $ 0.19 |
| Net realized and unrealized gain (loss) | 0.06 | (0.18) | (0.40) | 0.38 | (0.16) |
| Total income (loss) from operations | $ 0.34 | $ 0.02 | $ (0.29) | $ 0.54 | $ 0.03 |
| Less Distributions | | | | | |
| From net investment income | $ (0.28) | $ (0.20) | $ (0.11) | $ (0.16) | $ (0.19) |
| From net realized gain | — | — | — | — | (0.01) |
| Total distributions | $ (0.28) | $ (0.20) | $ (0.11) | $ (0.16) | $ (0.20) |
| Net asset value — End of year | $ 9.76 | $ 9.70 | $ 9.88 | $ 10.28 | $ 9.90 |
| Total Return(2) | 3.57% | 0.18% | (2.85)% | 5.46% | 0.29% |
| Ratios/Supplemental Data | | | | | |
| Net assets, end of year (000’s omitted) | $122,727 | $154,478 | $201,964 | $192,676 | $162,846 |
| Ratios (as a percentage of average daily net assets):(3) | | | | | |
| Total expenses | 0.66% | 0.65% | 0.64% | 0.66% | 0.66% |
| Net expenses | 0.66% | 0.65% | 0.64% | 0.66% | 0.66% |
| Net investment income | 2.94% | 2.01% | 1.08% | 1.55% | 1.93% |
| Portfolio Turnover | 70% | 78% | 57% | 14% | 52% |
| (1) | Computed using average shares outstanding. |
| (2) | Returns are historical and are calculated by determining the percentage change in net asset value with all distributions reinvested and do not reflect the effect of sales charges. |
| (3) | Total expenses do not reflect amounts reimbursed and/or waived by the adviser and certain of its affiliates, if applicable. Net expenses are net of all reductions and represent the net expenses paid by the Fund. |
20
See Notes to Financial Statements.
Eaton Vance
Short Duration Municipal Opportunities Fund
March 31, 2024
Financial Highlights — continued
| | Class C |
| | Year Ended March 31, |
| | 2024 | 2023 | 2022 | 2021 | 2020 |
| Net asset value — Beginning of year | $ 9.29 | $ 9.47 | $ 9.85 | $ 9.48 | $ 9.65 |
| Income (Loss) From Operations | | | | | |
| Net investment income(1) | $ 0.20 | $ 0.12 | $ 0.03 | $ 0.08 | $ 0.12 |
| Net realized and unrealized gain (loss) | 0.06 | (0.18) | (0.38) | 0.37 | (0.17) |
| Total income (loss) from operations | $ 0.26 | $ (0.06) | $ (0.35) | $ 0.45 | $ (0.05) |
| Less Distributions | | | | | |
| From net investment income | $ (0.20) | $ (0.12) | $ (0.03) | $ (0.08) | $ (0.11) |
| From net realized gain | — | — | — | — | (0.01) |
| Total distributions | $ (0.20) | $ (0.12) | $ (0.03) | $ (0.08) | $ (0.12) |
| Net asset value — End of year | $ 9.35 | $ 9.29 | $ 9.47 | $ 9.85 | $ 9.48 |
| Total Return(2) | 2.82% | (0.65)% | (3.54)% | 4.74% | (0.53)% |
| Ratios/Supplemental Data | | | | | |
| Net assets, end of year (000’s omitted) | $13,497 | $20,818 | $30,887 | $32,499 | $35,156 |
| Ratios (as a percentage of average daily net assets):(3) | | | | | |
| Total expenses | 1.41% | 1.41% | 1.39% | 1.41% | 1.41% |
| Net expenses | 1.41% | 1.41% | 1.39% | 1.41% | 1.41% |
| Net investment income | 2.18% | 1.24% | 0.34% | 0.81% | 1.20% |
| Portfolio Turnover | 70% | 78% | 57% | 14% | 52% |
| (1) | Computed using average shares outstanding. |
| (2) | Returns are historical and are calculated by determining the percentage change in net asset value with all distributions reinvested and do not reflect the effect of sales charges. |
| (3) | Total expenses do not reflect amounts reimbursed and/or waived by the adviser and certain of its affiliates, if applicable. Net expenses are net of all reductions and represent the net expenses paid by the Fund. |
21
See Notes to Financial Statements.
Eaton Vance
Short Duration Municipal Opportunities Fund
March 31, 2024
Financial Highlights — continued
| | Class I |
| | Year Ended March 31, |
| | 2024 | 2023 | 2022 | 2021 | 2020 |
| Net asset value — Beginning of year | $ 9.71 | $ 9.89 | $ 10.29 | $ 9.90 | $ 10.08 |
| Income (Loss) From Operations | | | | | |
| Net investment income(1) | $ 0.30 | $ 0.21 | $ 0.13 | $ 0.17 | $ 0.21 |
| Net realized and unrealized gain (loss) | 0.04 | (0.18) | (0.40) | 0.39 | (0.17) |
| Total income (loss) from operations | $ 0.34 | $ 0.03 | $ (0.27) | $ 0.56 | $ 0.04 |
| Less Distributions | | | | | |
| From net investment income | $ (0.29) | $ (0.21) | $ (0.13) | $ (0.17) | $ (0.21) |
| From net realized gain | — | — | — | — | (0.01) |
| Total distributions | $ (0.29) | $ (0.21) | $ (0.13) | $ (0.17) | $ (0.22) |
| Net asset value — End of year | $ 9.76 | $ 9.71 | $ 9.89 | $ 10.29 | $ 9.90 |
| Total Return(2) | 3.62% | 0.33% | (2.70)% | 5.72% | 0.34% |
| Ratios/Supplemental Data | | | | | |
| Net assets, end of year (000’s omitted) | $590,518 | $707,917 | $807,534 | $664,004 | $616,381 |
| Ratios (as a percentage of average daily net assets):(3) | | | | | |
| Total expenses | 0.50% | 0.50% | 0.49% | 0.51% | 0.51% |
| Net expenses | 0.50% | 0.50% | 0.49% | 0.51% | 0.51% |
| Net investment income | 3.09% | 2.16% | 1.23% | 1.71% | 2.09% |
| Portfolio Turnover | 70% | 78% | 57% | 14% | 52% |
| (1) | Computed using average shares outstanding. |
| (2) | Returns are historical and are calculated by determining the percentage change in net asset value with all distributions reinvested. |
| (3) | Total expenses do not reflect amounts reimbursed and/or waived by the adviser and certain of its affiliates, if applicable. Net expenses are net of all reductions and represent the net expenses paid by the Fund. |
22
See Notes to Financial Statements.
Eaton Vance
Short Duration Municipal Opportunities Fund
March 31, 2024
Notes to Financial Statements
1 Significant Accounting Policies
Eaton Vance Short Duration Municipal Opportunities Fund (the Fund) is a diversified series of Eaton Vance Investment Trust (the Trust). The Trust is a Massachusetts business trust registered under the Investment Company Act of 1940, as amended (the 1940 Act), as an open-end management investment company. The Fund’s investment objective is to seek to maximize after-tax total return. The Fund offers three classes of shares. Class A shares are generally sold subject to a sales charge imposed at time of purchase. Class C shares are sold at net asset value and are generally subject to a contingent deferred sales charge (see Note 5). Effective November 5, 2020, Class C shares automatically convert to Class A shares eight years after their purchase as described in the Fund’s prospectus. Class I shares are sold at net asset value and are not subject to a sales charge. Each class represents a pro rata interest in the Fund, but votes separately on class-specific matters and (as noted below) is subject to different expenses. Realized and unrealized gains and losses are allocated daily to each class of shares based on the relative net assets of each class to the total net assets of the Fund. Net investment income, other than class-specific expenses, is allocated daily to each class of shares based upon the ratio of the value of each class’s paid shares to the total value of all paid shares. Each class of shares differs in its distribution plan and certain other class-specific expenses.
The following is a summary of significant accounting policies of the Fund. The policies are in conformity with accounting principles generally accepted in the United States of America (U.S. GAAP). The Fund is an investment company and follows accounting and reporting guidance in the Financial Accounting Standards Board (FASB) Accounting Standards Codification Topic 946.
A Investment Valuation—The following methodologies are used to determine the market value or fair value of investments.
Debt Obligations. Debt obligations are generally valued on the basis of valuations provided by third party pricing services, as derived from such services’ pricing models. Inputs to the models may include, but are not limited to, reported trades, executable bid and ask prices, broker/dealer quotations, prices or yields of securities with similar characteristics, interest rates, anticipated prepayments, benchmark curves or information pertaining to the issuer, as well as industry and economic events. The pricing services may use a matrix approach, which considers information regarding securities with similar characteristics to determine the valuation for a security. Short-term debt obligations purchased with a remaining maturity of sixty days or less for which a valuation from a third party pricing service is not readily available may be valued at amortized cost, which approximates fair value.
Fair Valuation. In connection with Rule 2a-5 of the 1940 Act, the Trustees have designated the Fund’s investment adviser as its valuation designee. Investments for which valuations or market quotations are not readily available or are deemed unreliable are valued by the investment adviser, as valuation designee, at fair value using methods that most fairly reflect the security’s “fair value”, which is the amount that the Fund might reasonably expect to receive for the security upon its current sale in the ordinary course. Each such determination is based on a consideration of relevant factors, which are likely to vary from one pricing context to another. These factors may include, but are not limited to, the type of security, the existence of any contractual restrictions on the security’s disposition, the price and extent of public trading in similar securities of the issuer or of comparable companies or entities, quotations or relevant information obtained from broker/dealers or other market participants, information obtained from the issuer, analysts, and/or the appropriate stock exchange (for exchange-traded securities), an analysis of the company’s or entity’s financial statements, and an evaluation of the forces that influence the issuer and the market(s) in which the security is purchased and sold.
B Investment Transactions and Related Income—Investment transactions for financial statement purposes are accounted for on a trade date basis. Realized gains and losses on investments sold are determined on the basis of identified cost. Interest income is recorded on the basis of interest accrued, adjusted for amortization of premium or accretion of discount.
C Federal Taxes—The Fund’s policy is to comply with the provisions of the Internal Revenue Code applicable to regulated investment companies and to distribute to shareholders each year substantially all of its taxable, if any, and tax-exempt net investment income, and all or substantially all of its net realized capital gains. Accordingly, no provision for federal income or excise tax is necessary. The Fund intends to satisfy conditions which will enable it to designate distributions from the interest income generated by its investments in non-taxable municipal securities, which are exempt from regular federal income tax when received by the Fund, as exempt-interest dividends. The portion of such interest, if any, earned on private activity bonds issued after August 7, 1986, may be considered a tax preference item to shareholders.
As of March 31, 2024, the Fund had no uncertain tax positions that would require financial statement recognition, de-recognition, or disclosure. The Fund files a U.S. federal income tax return annually after its fiscal year-end, which is subject to examination by the Internal Revenue Service for a period of three years from the date of filing.
D Expenses—The majority of expenses of the Trust are directly identifiable to an individual fund. Expenses which are not readily identifiable to a specific fund are allocated taking into consideration, among other things, the nature and type of expense and the relative size of the funds.
E Legal Fees— Legal fees and other related expenses incurred as part of negotiations of the terms and requirement of capital infusions, or that are expected to result in the restructuring of, or a plan of reorganization for, an investment are recorded as realized losses. Ongoing expenditures to protect or enhance an investment are treated as operating expenses.
F Use of Estimates—The preparation of the financial statements in conformity with U.S. GAAP requires management to make estimates and assumptions that affect the reported amounts of assets and liabilities at the date of the financial statements and the reported amounts of income and expense during the reporting period. Actual results could differ from those estimates.
Eaton Vance
Short Duration Municipal Opportunities Fund
March 31, 2024
Notes to Financial Statements — continued
G Indemnifications—Under the Trust’s organizational documents, its officers and Trustees may be indemnified against certain liabilities and expenses arising out of the performance of their duties to the Fund. Under Massachusetts law, if certain conditions prevail, shareholders of a Massachusetts business trust (such as the Trust) could be deemed to have personal liability for the obligations of the Trust. However, the Trust’s Declaration of Trust contains an express disclaimer of liability on the part of Fund shareholders and the By-laws provide that the Trust shall assume, upon request by the shareholder, the defense on behalf of any Fund shareholders. Moreover, the By-laws also provide for indemnification out of Fund property of any shareholder held personally liable solely by reason of being or having been a shareholder for all loss or expense arising from such liability. Additionally, in the normal course of business, the Fund enters into agreements with service providers that may contain indemnification clauses. The Fund’s maximum exposure under these arrangements is unknown as this would involve future claims that may be made against the Fund that have not yet occurred.
H When-Issued Securities and Delayed Delivery Transactions—The Fund may purchase securities on a delayed delivery or when-issued basis. Payment and delivery may take place after the customary settlement period for that security. At the time the transaction is negotiated, the price of the security that will be delivered is fixed. The Fund maintains cash and/or security positions for these commitments such that sufficient liquid assets will be available to make payments upon settlement. Securities purchased on a delayed delivery or when-issued basis are marked-to-market daily and begin earning interest on settlement date. Such security purchases are subject to the risk that when delivered they will be worth less than the agreed upon payment price. Losses may also arise if the counterparty does not perform under the contract.
I Futures Contracts—Upon entering into a futures contract, the Fund is required to deposit with the broker, either in cash or securities, an amount equal to a certain percentage of the contract amount (initial margin). Subsequent payments, known as variation margin, are made or received by the Fund each business day, depending on the daily fluctuations in the value of the underlying security, and are recorded as unrealized gains or losses by the Fund. Gains (losses) are realized upon the expiration or closing of the futures contracts. Should market conditions change unexpectedly, the Fund may not achieve the anticipated benefits of the futures contracts and may realize a loss. Futures contracts have minimal counterparty risk as they are exchange traded and the clearinghouse for the exchange is substituted as the counterparty, guaranteeing counterparty performance.
2 Distributions to Shareholders and Income Tax Information
The net investment income of the Fund is determined daily and substantially all of the net investment income so determined is declared as a dividend to shareholders of record at the time of declaration. Distributions are declared separately for each class of shares. Distributions are paid monthly. Distributions of realized capital gains are made at least annually. Shareholders may reinvest income and capital gain distributions in additional shares of the same class of the Fund at the net asset value as of the reinvestment date or, at the election of the shareholder, receive distributions in cash. Distributions to shareholders are determined in accordance with income tax regulations, which may differ from U.S. GAAP. As required by U.S. GAAP, only distributions in excess of tax basis earnings and profits are reported in the financial statements as a return of capital. Permanent differences between book and tax accounting relating to distributions are reclassified to paid-in capital. For tax purposes, distributions from short-term capital gains are considered to be from ordinary income.
The tax character of distributions declared for the years ended March 31, 2024 and March 31, 2023 was as follows:
| | Year Ended March 31, |
| | 2024 | 2023 |
| Tax-exempt income | $21,094,576 | $18,727,591 |
| Ordinary income | $ 2,300,451 | $ 1,867,282 |
As of March 31, 2024, the components of distributable earnings (accumulated loss) on a tax basis were as follows:
| Undistributed tax-exempt income | $ 637,942 |
| Deferred capital losses | (40,576,462) |
| Net unrealized depreciation | (4,396,920) |
| Distributions payable | (645,955) |
| Accumulated loss | $(44,981,395) |
At March 31, 2024, the Fund, for federal income tax purposes, had deferred capital losses of $40,576,462 which would reduce its taxable income arising from future net realized gains on investment transactions, if any, to the extent permitted by the Internal Revenue Code, and thus would reduce the amount of distributions to shareholders, which would otherwise be necessary to relieve the Fund of any liability for federal income or excise tax. The deferred capital losses are treated as arising on the first day of the Fund’s next taxable year and retain the same short-term or long-term character as when originally deferred. Of the deferred capital losses at March 31, 2024, $22,258,992 are short-term and $18,317,470 are long-term.
Eaton Vance
Short Duration Municipal Opportunities Fund
March 31, 2024
Notes to Financial Statements — continued
The cost and unrealized appreciation (depreciation) of investments of the Fund at March 31, 2024, as determined on a federal income tax basis, were as follows:
| Aggregate cost | $ 733,048,050 |
| Gross unrealized appreciation | $ 8,982,584 |
| Gross unrealized depreciation | (13,379,504) |
| Net unrealized depreciation | $ (4,396,920) |
3 Investment Adviser and Administration Fee and Other Transactions with Affiliates
The investment adviser and administration fee is earned by Eaton Vance Management (EVM), an indirect, wholly-owned subsidiary of Morgan Stanley, as compensation for investment advisory and administrative services rendered to the Fund. The investment adviser and administration fee is computed at an annual rate as a percentage of the Fund’s average daily net assets as follows and is payable monthly:
| Average Daily Net Assets | Annual Fee Rate |
| Up to $1 billion | 0.400% |
| $1 billion but less than $2.5 billion | 0.375% |
| $2.5 billion but less than $5 billion | 0.360% |
| $5 billion and over | 0.350% |
For the year ended March 31, 2024, the investment adviser and administration fee amounted to $3,132,629 or 0.40% of the Fund’s average daily net assets.
EVM provides sub-transfer agency and related services to the Fund pursuant to a Sub-Transfer Agency Support Services Agreement. For the year ended March 31, 2024, EVM earned $6,746 from the Fund pursuant to such agreement, which is included in transfer and dividend disbursing agent fees on the Statement of Operations. The Fund was informed that Eaton Vance Distributors, Inc. (EVD), an affiliate of EVM and the Fund’s principal underwriter, received $6,208 as its portion of the sales charge on sales of Class A shares for the year ended March 31, 2024. The Fund was informed that Morgan Stanley affiliated broker-dealers, which may be deemed to be affiliates of EVM and EVD, also received a portion of the sales charge on sales of Class A shares for the year ended March 31, 2024 in the amount of $4,853. EVD also received distribution and service fees from Class A and Class C shares (see Note 4) and contingent deferred sales charges (see Note 5).
Trustees and officers of the Fund who are members of EVM’s organization receive remuneration for their services to the Fund out of the investment adviser and administration fee. Trustees of the Fund who are not affiliated with EVM may elect to defer receipt of all or a percentage of their annual fees in accordance with the terms of the Trustees Deferred Compensation Plan. Certain officers and Trustees of the Fund are officers of EVM.
4 Distribution Plans
The Fund has in effect a distribution plan for Class A shares (Class A Plan) pursuant to Rule 12b-1 under the 1940 Act. Pursuant to the Class A Plan, the Fund pays EVD a distribution and service fee not exceeding 0.25% per annum of its average daily net assets attributable to Class A shares for distribution services and facilities provided to the Fund by EVD, as well as for personal services and/or the maintenance of shareholder accounts. The Trustees approved distribution and service fee payments equal to 0.15% per annum of the Fund's average daily net assets attributable to Class A shares. Distribution and service fees paid or accrued to EVD for the year ended March 31, 2024 amounted to $202,811 for Class A shares.
The Fund also has in effect a distribution plan for Class C shares (Class C Plan) pursuant to Rule 12b-1 under the 1940 Act. Pursuant to the Class C Plan, the Fund pays EVD amounts equal to 0.75% per annum of its average daily net assets attributable to Class C shares for providing ongoing distribution services and facilities to the Fund. For the year ended March 31, 2024, the Fund paid or accrued to EVD $125,789 for Class C shares.
Pursuant to the Class C Plan, the Fund also makes payments of service fees to EVD, financial intermediaries and other persons in amounts not exceeding 0.25% per annum of its average daily net assets attributable to Class C shares. The Trustees approved service fee payments equal to 0.15% per annum of the Fund’s average daily net assets attributable to Class C shares. Service fees paid or accrued are for personal services and/or the maintenance of shareholder accounts. They are separate and distinct from the Class C sales commissions and distribution fees payable to EVD. Service fees paid or accrued for the year ended March 31, 2024 amounted to $25,158 for Class C shares.
Distribution and service fees are subject to the limitations contained in the Financial Industry Regulatory Authority Rule 2341(d).
Eaton Vance
Short Duration Municipal Opportunities Fund
March 31, 2024
Notes to Financial Statements — continued
5 Contingent Deferred Sales Charges
A contingent deferred sales charge (CDSC) of 1% generally is imposed on redemptions of Class C shares made within 12 months of purchase. Class A shares may be subject to a 0.75% CDSC if redeemed within 12 months of purchase (depending on the circumstances of purchase). Generally, the CDSC is based upon the lower of the net asset value at date of redemption or date of purchase. No charge is levied on shares acquired by reinvestment of dividends or capital gain distributions. For the year ended March 31, 2024, the Fund was informed that EVD received $3,750 and $4,425 of CDSCs paid by Class A and Class C shareholders, respectively.
6 Purchases and Sales of Investments
Purchases and sales of investments, other than short-term obligations and including maturities, for the year ended March 31, 2024 were as follows:
| | Purchases | Sales |
| Investments (non-U.S. Government) | $ 535,060,355 | $ 657,025,043 |
| U.S. Government and Agency Securities | 6,505,840 | — |
| | $541,566,195 | $657,025,043 |
7 Shares of Beneficial Interest
The Fund’s Declaration of Trust permits the Trustees to issue an unlimited number of full and fractional shares of beneficial interest (without par value). Such shares may be issued in a number of different series (such as the Fund) and classes. Transactions in Fund shares, including direct exchanges pursuant to share class conversions, were as follows:
| | Year Ended
March 31, 2024 | | Year Ended
March 31, 2023 |
| | Shares | Amount | | Shares | Amount |
| Class A | | | | | |
| Sales | 2,021,951 | $ 19,536,220 | | 4,476,718 | $ 43,253,223 |
| Issued to shareholders electing to receive payments of distributions in Fund shares | 336,882 | 3,250,527 | | 305,040 | 2,946,422 |
| Redemptions | (5,701,285) | (55,003,657) | | (9,296,521) | (89,898,290) |
| Net decrease | (3,342,452) | $ (32,216,910) | | (4,514,763) | $ (43,698,645) |
| Class C | | | | | |
| Sales | 149,631 | $ 1,383,367 | | 482,376 | $ 4,481,022 |
| Issued to shareholders electing to receive payments of distributions in Fund shares | 32,732 | 302,494 | | 28,031 | 259,224 |
| Redemptions | (978,203) | (9,042,753) | | (1,533,095) | (14,197,074) |
| Net decrease | (795,840) | $ (7,356,892) | | (1,022,688) | $ (9,456,828) |
| Class I | | | | | |
| Sales | 19,070,011 | $ 183,765,791 | | 51,064,456 | $ 494,345,285 |
| Issued to shareholders electing to receive payments of distributions in Fund shares | 1,282,649 | 12,383,457 | | 1,197,907 | 11,580,694 |
| Redemptions | (32,783,095) | (316,248,249) | | (61,010,643) | (590,027,386) |
| Net decrease | (12,430,435) | $(120,099,001) | | (8,748,280) | $ (84,101,407) |
Eaton Vance
Short Duration Municipal Opportunities Fund
March 31, 2024
Notes to Financial Statements — continued
8 Financial Instruments
The Fund may trade in financial instruments with off-balance sheet risk in the normal course of its investing activities. These financial instruments may include futures contracts and may involve, to a varying degree, elements of risk in excess of the amounts recognized for financial statement purposes. The notional or contractual amounts of these instruments represent the investment the Fund has in particular classes of financial instruments and do not necessarily represent the amounts potentially subject to risk. The measurement of the risks associated with these instruments is meaningful only when all related and offsetting transactions are considered. At March 31, 2024, there were no obligations outstanding under these financial instruments.
The Fund is subject to interest rate risk in the normal course of pursuing its investment objective. Because the Fund holds fixed-rate bonds, the value of these bonds may decrease if interest rates rise. During the year ended March 31, 2024, the Fund entered into U.S. Treasury futures contracts to hedge against changes in interest rates.
The effect of derivative instruments (not considered to be hedging instruments for accounting disclosure purposes) on the Statement of Operations and whose primary underlying risk exposure is interest rate risk for the year ended March 31, 2024 was as follows:
| Derivative | Realized Gain (Loss)
on Derivatives Recognized
in Income | Change in Unrealized
Appreciation (Depreciation) on
Derivatives Recognized in Income |
| Futures contracts | $184,001 (1) | $ — |
| (1) | Statement of Operations location: Net realized gain (loss): Futures contracts. |
The average notional cost of futures contracts (short) outstanding during the year ended March 31, 2024, which is indicative of the volume of this derivative type, was approximately $61,000.
9 Line of Credit
The Fund participates with other portfolios and funds managed by EVM and its affiliates in a $650 million unsecured revolving line of credit agreement with a group of banks, which is in effect through October 22, 2024. In connection with the renewal of the agreement on October 24, 2023, the borrowing limit was decreased from $725 million. Borrowings are made by the Fund solely for temporary purposes related to redemptions and other short-term cash needs. Interest is charged to the Fund based on its borrowings at an amount above either the Secured Overnight Financing Rate (SOFR) or Federal Funds rate. In addition, a fee computed at an annual rate of 0.15% on the daily unused portion of the line of credit is allocated among the participating portfolios and funds at the end of each quarter. In connection with the renewal of the agreement in October 2023, an arrangement fee of $150,000 was incurred that was allocated to the participating portfolios and funds. Because the line of credit is not available exclusively to the Fund, it may be unable to borrow some or all of its requested amounts at any particular time. The Fund did not have any significant borrowings or allocated fees during the year ended March 31, 2024.
10 Fair Value Measurements
Under generally accepted accounting principles for fair value measurements, a three-tier hierarchy to prioritize the assumptions, referred to as inputs, is used in valuation techniques to measure fair value. The three-tier hierarchy of inputs is summarized in the three broad levels listed below.
| • | Level 1 – quoted prices in active markets for identical investments |
| • | Level 2 – other significant observable inputs (including quoted prices for similar investments, interest rates, prepayment speeds, credit risk, etc.) |
| • | Level 3 – significant unobservable inputs (including a fund's own assumptions in determining the fair value of investments) |
In cases where the inputs used to measure fair value fall in different levels of the fair value hierarchy, the level disclosed is determined based on the lowest level input that is significant to the fair value measurement in its entirety. The inputs or methodology used for valuing securities are not necessarily an indication of the risk associated with investing in those securities.
Eaton Vance
Short Duration Municipal Opportunities Fund
March 31, 2024
Notes to Financial Statements — continued
At March 31, 2024, the hierarchy of inputs used in valuing the Fund's investments, which are carried at fair value, were as follows:
| Asset Description | Level 1 | Level 2 | Level 3 | Total |
| Corporate Bonds | $ — | $ 20,953,531 | $ — | $ 20,953,531 |
| Tax-Exempt Mortgage-Backed Securities | — | 446,469 | — | 446,469 |
| Tax-Exempt Municipal Obligations | — | 657,869,613 | — | 657,869,613 |
| Taxable Municipal Obligations | — | 42,867,298 | — | 42,867,298 |
| U.S. Treasury Obligations | — | 6,514,219 | — | 6,514,219 |
| Total Investments | $ — | $728,651,130 | $ — | $728,651,130 |
Eaton Vance
Short Duration Municipal Opportunities Fund
March 31, 2024
Report of Independent Registered Public Accounting Firm
To the Trustees of Eaton Vance Investment Trust and Shareholders of Eaton Vance Short Duration Municipal Opportunities Fund:
Opinion on the Financial Statements and Financial Highlights
We have audited the accompanying statement of assets and liabilities of Eaton Vance Short Duration Municipal Opportunities Fund (the “Fund”) (one of the funds constituting Eaton Vance Investment Trust), including the portfolio of investments, as of March 31, 2024, the related statement of operations for the year then ended, the statements of changes in net assets for each of the two years in the period then ended, the financial highlights for each of the five years in the period then ended, and the related notes. In our opinion, the financial statements and financial highlights present fairly, in all material respects, the financial position of the Fund as of March 31, 2024, and the results of its operations for the year then ended, the changes in its net assets for each of the two years in the period then ended, and the financial highlights for each of the five years in the period then ended, in conformity with accounting principles generally accepted in the United States of America.
Basis for Opinion
These financial statements and financial highlights are the responsibility of the Fund's management. Our responsibility is to express an opinion on the Fund's financial statements and financial highlights based on our audits. We are a public accounting firm registered with the Public Company Accounting Oversight Board (United States) (PCAOB) and are required to be independent with respect to the Fund in accordance with the U.S. federal securities laws and the applicable rules and regulations of the Securities and Exchange Commission and the PCAOB.
We conducted our audits in accordance with the standards of the PCAOB. Those standards require that we plan and perform the audit to obtain reasonable assurance about whether the financial statements and financial highlights are free of material misstatement, whether due to error or fraud. The Fund is not required to have, nor were we engaged to perform, an audit of its internal control over financial reporting. As part of our audits, we are required to obtain an understanding of internal control over financial reporting but not for the purpose of expressing an opinion on the effectiveness of the Fund’s internal control over financial reporting. Accordingly, we express no such opinion.
Our audits included performing procedures to assess the risks of material misstatement of the financial statements and financial highlights, whether due to error or fraud, and performing procedures that respond to those risks. Such procedures included examining, on a test basis, evidence regarding the amounts and disclosures in the financial statements and financial highlights. Our audits also included evaluating the accounting principles used and significant estimates made by management, as well as evaluating the overall presentation of the financial statements and financial highlights. Our procedures included confirmation of securities owned as of March 31, 2024, by correspondence with the custodian and brokers; when replies were not received from brokers, we performed other auditing procedures. We believe that our audits provide a reasonable basis for our opinion.
/s/ Deloitte & Touche LLP
Boston, Massachusetts
May 17, 2024
We have served as the auditor of one or more Eaton Vance investment companies since 1959.
Eaton Vance
Short Duration Municipal Opportunities Fund
March 31, 2024
Federal Tax Information (Unaudited)
The Form 1099-DIV you receive in February 2025 will show the tax status of all distributions paid to your account in calendar year 2024. Shareholders are advised to consult their own tax adviser with respect to the tax consequences of their investment in the Fund. As required by the Internal Revenue Code and/or regulations, shareholders must be notified regarding exempt-interest dividends.
Exempt-Interest Dividends. For the fiscal year ended March 31, 2024, the Fund designates 90.17% of distributions from net investment income as an exempt-interest dividend.
Eaton Vance
Short Duration Municipal Opportunities Fund
March 31, 2024
Management and Organization
Fund Management. The Trustees of Eaton Vance Investment Trust (the Trust) are responsible for the overall management and supervision of the Trust's affairs. The Board members and officers of the Trust are listed below. Except as indicated, each individual has held the office shown or other offices in the same company for the last five years. Board members hold indefinite terms of office. Each Trustee holds office until his or her successor is elected and qualified, subject to a prior death, resignation, retirement, disqualification or removal. Under the terms of the Fund’s current Trustee retirement policy, an Independent Trustee must retire and resign as a Trustee on the earlier of: (i) the first day of July following his or her 74th birthday; or (ii), with limited exception, December 31st of the 20th year in which he or she has served as a Trustee. However, if such retirement and resignation would cause the Fund to be out of compliance with Section 16 of the 1940 Act or any other regulations or guidance of the SEC, then such retirement and resignation will not become effective until such time as action has been taken for the Fund to be in compliance therewith. The “noninterested Trustees” consist of those Trustees who are not “interested persons” of the Trust, as that term is defined under the 1940 Act. The business address of each Board member and officer is One Post Office Square, Boston, Massachusetts 02109. As used below, “BMR” refers to Boston Management and Research, “EV” refers to EV LLC, “EVM” refers to Eaton Vance Management, “MSIM” refers to Morgan Stanley Investment Management Inc. and “EVD” refers to Eaton Vance Distributors, Inc. EV is the trustee of each of EVM and BMR. Each of EVM, BMR, EVD and EV are indirect, wholly owned subsidiaries of Morgan Stanley. Each officer affiliated with EVM may hold a position with other EVM affiliates that is comparable to his or her position with EVM listed below. Each Trustee oversees 127 funds in the Eaton Vance fund complex (including both funds and portfolios in a hub and spoke structure).
| Name and Year of Birth | Trust
Position(s) | Length of Service | Principal Occupation(s) and Other Directorships
During Past Five Years and Other Relevant Experience |
| Interested Trustee |
Anchal Pachnanda
1980 | Trustee | Since 2023 | Co-Head of Strategy of MSIM (since 2019). Formerly, Head of Strategy of MSIM (2017-2019). Ms. Pachnanda is an interested person because of her position with MSIM, which is an affiliate of the Trust.
Other Directorships. None. |
| Noninterested Trustees |
Alan C. Bowser
1962 | Trustee | Since 2022 | Private investor. Formerly, Chief Diversity Officer, Partner and a member of the Operating Committee, and formerly served as Senior Advisor on Diversity and Inclusion for the firm’s chief executive officer, Co-Head of the Americas Region, and Senior Client Advisor of Bridgewater Associates, an asset management firm (2011- 2023).
Other Directorships. Independent Director of Stout Risius Ross (a middle market professional services advisory firm) (since 2021). |
Mark R. Fetting
1954 | Trustee | Since 2016 | Private investor. Formerly held various positions at Legg Mason, Inc. (investment management firm) (2000-2012), including President, Chief Executive Officer, Director and Chairman (2008-2012), Senior Executive Vice President (2004-2008) and Executive Vice President (2001-2004). Formerly, President of Legg Mason family of funds (2001-2008). Formerly, Division President and Senior Officer of Prudential Financial Group, Inc. and related companies (investment management firm) (1991-2000).
Other Directorships. None. |
Cynthia E. Frost
1961 | Trustee | Since 2014 | Private investor. Formerly, Chief Investment Officer of Brown University (university endowment) (2000-2012). Formerly, Portfolio Strategist for Duke Management Company (university endowment manager) (1995-2000). Formerly, Managing Director, Cambridge Associates (investment consulting company) (1989-1995). Formerly, Consultant, Bain and Company (management consulting firm) (1987-1989). Formerly, Senior Equity Analyst, BA Investment Management Company (1983-1985).
Other Directorships. None. |
George J. Gorman
1952 | Chairperson
of the Board
and Trustee | Since 2021
(Chairperson) and
2014 (Trustee) | Principal at George J. Gorman LLC (consulting firm). Formerly, Senior Partner at Ernst & Young LLP (a registered public accounting firm) (1974-2009).
Other Directorships. None. |
Eaton Vance
Short Duration Municipal Opportunities Fund
March 31, 2024
Management and Organization — continued
| Name and Year of Birth | Trust
Position(s) | Length of Service | Principal Occupation(s) and Other Directorships
During Past Five Years and Other Relevant Experience |
| Noninterested Trustees (continued) |
Valerie A. Mosley
1960 | Trustee | Since 2014 | Chairwoman and Chief Executive Officer of Valmo Ventures (a consulting and investment firm). Founder of Upward Wealth, Inc., dba BrightUp, a fintech platform. Formerly, Partner and Senior Vice President, Portfolio Manager and Investment Strategist at Wellington Management Company, LLP (investment management firm) (1992-2012). Formerly, Chief Investment Officer, PG Corbin Asset Management (1990-1992). Formerly worked in institutional corporate bond sales at Kidder Peabody (1986-1990).
Other Directorships. Director of DraftKings, Inc. (digital sports entertainment and gaming company) (since September 2020). Director of Envestnet, Inc. (provider of intelligent systems for wealth management and financial wellness) (since 2018). Formerly, Director of Dynex Capital, Inc. (mortgage REIT) (2013-2020) and Director of Groupon, Inc. (e-commerce provider) (2020-2022). |
Keith Quinton
1958 | Trustee | Since 2018 | Private investor, researcher and lecturer. Formerly, Independent Investment Committee Member at New Hampshire Retirement System (2017-2021). Formerly, Portfolio Manager and Senior Quantitative Analyst at Fidelity Investments (investment management firm) (2001-2014).
Other Directorships. Formerly, Director (2016-2021) and Chairman (2019-2021) of New Hampshire Municipal Bond Bank. |
Marcus L. Smith
1966 | Trustee | Since 2018 | Private investor and independent corporate director. Formerly, Chief Investment Officer, Canada (2012-2017), Chief Investment Officer, Asia (2010-2012), Director of Asian Research (2004-2010) and portfolio manager (2001-2017) at MFS Investment Management (investment management firm).
Other Directorships. Director of First Industrial Realty Trust, Inc. (an industrial REIT) (since 2021). Director of MSCI Inc. (global provider of investment decision support tools) (since 2017). Formerly, Director of DCT Industrial Trust Inc. (logistics real estate company) (2017-2018). |
Susan J. Sutherland
1957 | Trustee | Since 2015 | Private investor. Director of Ascot Group Limited and certain of its subsidiaries (insurance and reinsurance) (since 2017). Formerly, Director of Hagerty Holding Corp. (insurance) (2015-2018) and Montpelier Re Holdings Ltd. (insurance and reinsurance) (2013-2015). Formerly, Associate, Counsel and Partner at Skadden, Arps, Slate, Meagher & Flom LLP (law firm) (1982-2013).
Other Directorships. Formerly, Director of Kairos Acquisition Corp. (insurance/InsurTech acquisition company) (2021-2023). |
Scott E. Wennerholm
1959 | Trustee | Since 2016 | Private investor. Formerly, Trustee at Wheelock College (postsecondary institution) (2012-2018). Formerly, Consultant at GF Parish Group (executive recruiting firm) (2016-2017). Formerly, Chief Operating Officer and Executive Vice President at BNY Mellon Asset Management (investment management firm) (2005-2011). Formerly, Chief Operating Officer and Chief Financial Officer at Natixis Global Asset Management (investment management firm) (1997-2004). Formerly, Vice President at Fidelity Investments Institutional Services (investment management firm) (1994-1997).
Other Directorships. None. |
Nancy A. Wiser
1967 | Trustee | Since 2022 | Formerly, Executive Vice President and the Global Head of Operations at Wells Fargo Asset Management (2011-2021).
Other Directorships. None. |
| Name and Year of Birth | Trust
Position(s) | Length of Service | Principal Occupation(s)
During Past Five Years |
| Principal Officers who are not Trustees |
Kenneth A. Topping
1966 | President | Since 2023 | Vice President and Chief Administrative Officer of EVM and BMR and Chief Operating Officer for Public Markets at MSIM. Also Vice President of Calvert Research and Management (“CRM”) since 2021. Formerly, Chief Operating Officer for Goldman Sachs Asset Management ‘Classic' (2009-2020). |
Deidre E. Walsh
1971 | Vice President and
Chief Legal Officer | Since 2009 | Vice President of EVM and BMR. Also Vice President of CRM. |
James F. Kirchner
1967 | Treasurer | Since 2007 | Vice President of EVM and BMR. Also Vice President of CRM. |
Eaton Vance
Short Duration Municipal Opportunities Fund
March 31, 2024
Management and Organization — continued
| Name and Year of Birth | Trust
Position(s) | Length of Service | Principal Occupation(s)
During Past Five Years |
| Principal Officers who are not Trustees (continued) |
Nicholas S. Di Lorenzo
1987 | Secretary | Since 2022 | Formerly, associate (2012-2021) and counsel (2022) at Dechert LLP. |
Laura T. Donovan
1976 | Chief Compliance
Officer | Since 2024 | Vice President of EVM and BMR. |
The SAI for the Fund includes additional information about the Trustees and officers of the Fund and can be obtained without charge on Eaton Vance’s website at www.eatonvance.com or by calling 1-800-262-1122.
| U.S. Customer Privacy Notice | March 2024 |
| FACTS | WHAT DOES EATON VANCE DO WITH YOUR PERSONAL INFORMATION? |
| Why? | Financial companies choose how they share your personal information. Federal law gives consumers the right to limit some but not all sharing. Federal law also requires us to tell you how we collect, share, and protect your personal information. Please read this notice carefully to understand what we do. |
| |
| What? | The types of personal information we collect and share depend on the product or service you have with us. This information can include:■ Social Security number and income
■ investment experience and risk tolerance
■ checking account information and wire transfer instructions |
| |
| How? | All financial companies need to share customers’ personal information to run their everyday business. In the section below, we list the reasons financial companies can share their customers’ personal information; the reasons Eaton Vance chooses to share; and whether you can limit this sharing. |
| Reasons we can share your personal information | Does Eaton Vance
share? | Can you limit
this sharing? |
| For our everyday business purposes — such as to process your transactions, maintain your account(s), respond to court orders and legal investigations, or report to credit bureaus | Yes | No |
| For our marketing purposes — to offer our products and services to you | Yes | No |
| For joint marketing with other financial companies | No | We don’t share |
| For our affiliates’ everyday business purposes — information about your transactions and experiences | Yes | No* |
| For our affiliates’ everyday business purposes — information about your creditworthiness | Yes | Yes* |
| For our affiliates to market to you | Yes | Yes* |
| For nonaffiliates to market to you | No | We don’t share |
To limit our
sharing | Call toll-free 1-800-262-1122 or email: EVPrivacy@eatonvance.comPlease note:If you are a new customer, we can begin sharing your information 30 days from the date we sent this notice. When you are no longer our customer, we continue to share your information as described in this notice. However, you can contact us at any time to limit our sharing. |
| Questions? | Call toll-free 1-800-262-1122 or email: EVPrivacy@eatonvance.com |
| U.S. Customer Privacy Notice — continued | March 2024 |
| Who we are |
| Who is providing this notice? | Eaton Vance Management and our investment management affiliates (“Eaton Vance”) (see Affiliates definition below.) |
| What we do |
How does Eaton Vance
protect my personal
information? | To protect your personal information from unauthorized access and use, we use security measures that comply with federal law. These measures include computer safeguards and secured files and buildings. We have policies governing the proper handling of customer information by personnel and requiring third parties that provide support to adhere to appropriate security standards with respect to such information. |
How does Eaton Vance
collect my personal
information? | We collect your personal information, for example, when you■ open an account or make deposits or withdrawals from your account
■ buy securities from us or make a wire transfer
■ give us your contact informationWe also collect your personal information from others, such as credit bureaus, affiliates, or other companies. |
| Why can’t I limit all sharing? | Federal law gives you the right to limit only■ sharing for affiliates’ everyday business purposes — information about your creditworthiness
■ affiliates from using your information to market to you
■ sharing for nonaffiliates to market to youState laws and individual companies may give you additional rights to limit sharing. (See below for more on your rights under state law.) |
What happens when I limit
sharing for an account I hold
jointly with someone else? | Your choices will apply to everyone on your account. |
| Definitions |
| Affiliates | Companies related by common ownership or control. They can be financial and nonfinancial companies.■ Our affiliates include registered investment advisers such as Eaton Vance Management, Eaton Vance Advisers International Ltd., Boston Management and Research, Calvert Research and Management, Parametric Portfolio Associates LLC, Atlanta Capital Management Company LLC, Morgan Stanley Investment Management Inc., Morgan Stanley Investment Management Co.; registered broker-dealers such as Morgan Stanley Distributors Inc. and Eaton Vance Distributors, Inc. (together, the “Investment Management Affiliates”); and companies with a Morgan Stanley name and financial companies such as Morgan Stanley Smith Barney LLC and Morgan Stanley & Co. (the “Morgan Stanley Affiliates”). |
| Nonaffiliates | Companies not related by common ownership or control. They can be financial and nonfinancial companies.■ Eaton Vance does not share with nonaffiliates so they can market to you. |
| Joint marketing | A formal agreement between nonaffiliated financial companies that together market financial products or services to you.■ Eaton Vance does not jointly market. |
| U.S. Customer Privacy Notice — continued | March 2024 |
| Other important information |
| *PLEASE NOTE: Eaton Vance does not share your creditworthiness information or your transactions and experiences information with the Morgan Stanley Affiliates, nor does Eaton Vance enable the Morgan Stanley Affiliates to market to you. Your opt outs will prevent Eaton Vance from sharing your creditworthiness information with the Investment Management Affiliates and will prevent the Investment Management Affiliates from marketing their products to you.Vermont: Except as permitted by law, we will not share personal information we collect about Vermont residents with Nonaffiliates unless you provide us with your written consent to share such information.California: Except as permitted by law, we will not share personal information we collect about California residents with Nonaffiliates and we will limit sharing such personal information with our Affiliates to comply with California privacy laws that apply to us. |
Delivery of Shareholder Documents. The Securities and Exchange Commission (SEC) permits funds to deliver only one copy of shareholder documents, including prospectuses, proxy statements and shareholder reports, to fund investors with multiple accounts at the same residential or post office box address. This practice is often called “householding” and it helps eliminate duplicate mailings to shareholders. Eaton Vance, or your financial intermediary, may household the mailing of your documents indefinitely unless you instruct Eaton Vance, or your financial intermediary, otherwise. If you would prefer that your Eaton Vance documents not be householded, please contact Eaton Vance at 1-800-262-1122, or contact your financial intermediary. Your instructions that householding not apply to delivery of your Eaton Vance documents will typically be effective within 30 days of receipt by Eaton Vance or your financial intermediary.
Portfolio Holdings. Each Eaton Vance Fund and its underlying Portfolio(s) (if applicable) files a schedule of portfolio holdings on Part F to Form N-PORT with the SEC. Certain information filed on Form N-PORT may be viewed on the Eaton Vance website at www.eatonvance.com, by calling Eaton Vance at 1-800-262-1122 or in the EDGAR database on the SEC’s website at www.sec.gov.
Proxy Voting. From time to time, funds are required to vote proxies related to the securities held by the funds. The Eaton Vance Funds or their underlying Portfolios (if applicable) vote proxies according to a set of policies and procedures approved by the Funds’ and Portfolios’ Boards. You may obtain a description of these policies and procedures and information on how the Funds or Portfolios voted proxies relating to portfolio securities during the most recent 12-month period ended June 30, without charge, upon request, by calling 1-800-262-1122 and by accessing the SEC’s website at www.sec.gov.
Tailored Shareholder Reports. Effective January 24, 2023, the SEC adopted rule and form amendments to require open-end mutual funds and ETFs to transmit concise and visually engaging streamlined annual and semiannual reports to shareholders that highlight key information. Other information, including financial statements, will no longer appear in a streamlined shareholder report but must be available online, delivered free of charge upon request, and filed on a semiannual basis on Form N-CSR. The rule and form amendments have a compliance date of July 24, 2024. At this time, management is evaluating the impact of these amendments on the shareholder reports for the Eaton Vance Funds.
This Page Intentionally Left Blank
This Page Intentionally Left Blank
This Page Intentionally Left Blank
Investment Adviser and Administrator
Eaton Vance Management
One Post Office Square
Boston, MA 02109
Principal Underwriter*
Eaton Vance Distributors, Inc.
One Post Office Square
Boston, MA 02109
(617) 482-8260
Custodian
State Street Bank and Trust Company
One Congress Street, Suite 1
Boston, MA 02114-2016
Transfer Agent
BNY Mellon Investment Servicing (US) Inc.
Attn: Eaton Vance Funds
P.O. Box 534439
Pittsburgh, PA 15253-4439
(800) 262-1122
Independent Registered Public Accounting Firm
Deloitte & Touche LLP
200 Berkeley Street
Boston, MA 02116-5022
Fund Offices
One Post Office Square
Boston, MA 02109
* FINRA BrokerCheck. Investors may check the background of their Investment Professional by contacting the Financial Industry Regulatory Authority (FINRA). FINRA BrokerCheck is a free tool to help investors check the professional background of current and former FINRA-registered securities firms and brokers. FINRA BrokerCheck is available by calling 1-800-289-9999 and at www.FINRA.org. The FINRA BrokerCheck brochure describing this program is available to investors at www.FINRA.org.
Item 2. Code of Ethics
The registrant (sometimes referred to as the “Fund”) has adopted a code of ethics applicable to its Principal Executive Officer, Principal Financial Officer and Principal Accounting Officer. The registrant undertakes to provide a copy of such code of ethics to any person upon request, without charge, by calling 1-800-262-1122. The registrant has not amended the code of ethics as described in Form N-CSR during the period. The registrant has not granted any waiver, including an implicit waiver, from a provision of the code of ethics as described in Form N-CSR during the period covered by this report.
Item 3. Audit Committee Financial Expert
The registrant’s Board of Trustees (the “Board”) has designated George J. Gorman and Scott E. Wennerholm, each an independent trustee, as audit committee financial experts. Mr. Gorman is a certified public accountant who is the Principal at George J. Gorman LLC (a consulting firm). Previously, Mr. Gorman served in various capacities at Ernst & Young LLP (a registered public accounting firm), including as Senior Partner. Mr. Gorman also has experience serving as an independent trustee and audit committee financial expert of other mutual fund complexes. Mr. Wennerholm is a private investor. Previously, Mr. Wennerholm served as a
Trustee at Wheelock College (postsecondary institution), as a Consultant at GF Parish Group (executive recruiting firm), Chief Operating Officer and Executive Vice President at BNY Mellon Asset Management (investment management firm), Chief Operating Officer and Chief Financial Officer at Natixis Global Asset Management (investment management firm), and Vice President at Fidelity Investments Institutional Services (investment management firm).
Item 4. Principal Accountant Fees and Services
Eaton Vance National Ultra-Short Municipal Income Fund, Eaton Vance Short Duration Municipal Opportunities Fund, Eaton Vance National Limited Maturity Municipal Income Fund and Eaton Vance New York Municipal Opportunities Fund (the “Fund(s)”) are the series of Eaton Vance Investment Trust (the “Trust”), a Massachusetts business trust, which, including the Funds, contains a total of 4 series (the “Series”). The Trust is registered under the Investment Company Act of 1940 as an open-end management investment company.
(a-d)
The following tables present the aggregate fees billed to each Fund for the Fund’s respective fiscal years ended March 31, 2023 and March 31, 2024 by the registrant’s principal accountant, Deloitte & Touche LLP (“D&T”), for professional services rendered for the audit of the Fund’s annual financial statements and fees billed for other services rendered by D&T during those periods.
Eaton Vance National Ultra-Short Municipal Income Fund
| | | | | | | | |
Fiscal Years Ended | | 03/31/23 | | | 03/31/24 | |
Audit Fees | | $ | 38,950 | | | $ | 44,400 | |
Audit-Related Fees(1) | | $ | 0 | | | $ | 0 | |
Tax Fees(2) | | $ | 0 | | | $ | 0 | |
All Other Fees(3) | | $ | 0 | | | $ | 0 | |
| | | | | | | | |
Total | | $ | 38,950 | | | $ | 44,400 | |
| | | | | | | | |
Eaton Vance Short Duration Municipal Opportunities Fund
| | | | | | | | |
Fiscal Years Ended | | 03/31/23 | | | 03/31/24 | |
Audit Fees | | $ | 40,550 | | | $ | 46,000 | |
Audit-Related Fees(1) | | $ | 0 | | | $ | 0 | |
Tax Fees(2) | | $ | 350 | | | $ | 0 | |
All Other Fees(3) | | $ | 0 | | | $ | 0 | |
| | | | | | | | |
Total | | $ | 40,900 | | | $ | 46,000 | |
| | | | | | | | |
Eaton Vance National Limited Maturity Municipal Income Fund
| | | | | | | | |
Fiscal Years Ended | | 03/31/23 | | | 03/31/24 | |
Audit Fees | | $ | 59,650 | | | $ | 60,100 | |
Audit-Related Fees(1) | | $ | 0 | | | $ | 0 | |
Tax Fees(2) | | $ | 350 | | | $ | 0 | |
All Other Fees(3) | | $ | 0 | | | $ | 0 | |
| | | | | | | | |
Total | | $ | 60,000 | | | $ | 60,100 | |
| | | | | | | | |
Eaton Vance New York Municipal Opportunities Fund
| | | | | | | | |
Fiscal Years Ended | | 03/31/23 | | | 03/31/24 | |
Audit Fees | | $ | 40,250 | | | $ | 40,700 | |
Audit-Related Fees(1) | | $ | 0 | | | $ | 0 | |
Tax Fees(2) | | $ | 875 | | | $ | 0 | |
All Other Fees(3) | | $ | 0 | | | $ | 0 | |
| | | | | | | | |
Total | | $ | 41,125 | | | $ | 40,700 | |
| | | | | | | | |
| (1) | Audit-related fees consist of the aggregate fees billed for assurance and related services that are reasonably related to the performance of the audit of financial statements and are not reported under the category of audit fees. |
| (2) | Tax fees consist of the aggregate fees billed for professional services rendered by the principal accountant relating to tax compliance, tax advice, and tax planning and specifically include fees for tax return preparation and other related tax compliance/planning matters. |
| (3) | All other fees consist of the aggregate fees billed for products and services provided by the principal accountant other than audit, audit-related, and tax services. |
The Funds comprised all of the series of the Trust at March 31, 2024, and have the same fiscal year end (March 31). The following table presents the aggregate audit, audit-related, tax, and other fees billed to all of the Funds in the Trust by D&T for the last two fiscal years of each Fund.
| | | | | | | | |
Fiscal Years Ended | | 03/31/23 | | | 03/31/24 | |
Audit Fees | | $ | 179,400 | | | $ | 191,200 | |
Audit-Related Fees(1) | | $ | 0 | | | $ | 0 | |
Tax Fees(2) | | $ | 1,575 | | | $ | 0 | |
All Other Fees(3) | | $ | 0 | | | $ | 0 | |
| | | | | | | | |
Total | | $ | 180,975 | | | $ | 191,200 | |
| | | | | | | | |
| (1) | Audit-related fees consist of the aggregate fees billed for assurance and related services that are reasonably related to the performance of the audit of financial statements and are not reported under the category of audit fees. |
| (2) | Tax fees consist of the aggregate fees billed for professional services rendered by the principal accountant relating to tax compliance, tax advice, and tax planning and specifically include fees for tax return preparation. |
| (3) | All other fees consist of the aggregate fees billed for products and services provided by the principal accountant other than audit, audit-related, and tax services. |
(e)(1) The Trust’s audit committee has adopted policies and procedures relating to the pre-approval of services provided by the Trust’s principal accountant (the “Pre-Approval Policies”). The Pre-Approval Policies establish a framework intended to assist the audit committee in the proper discharge of its pre-approval responsibilities. As a general matter, the Pre-Approval Policies (i) specify certain types of audit, audit-related, tax, and other services determined to be pre-approved by the audit committee; and (ii) delineate specific procedures governing the mechanics of the pre-approval process, including the approval and monitoring of audit and non-audit service fees. Unless a service is specifically pre-approved under the Pre-Approval Policies, it must be separately pre-approved by the audit committee.
The Pre-Approval Policies and the types of audit and non-audit services pre-approved therein must be reviewed and ratified by the Trust’s audit committee at least annually. The Trust’s audit committee maintains full responsibility for the appointment, compensation, and oversight of the work of the registrant’s principal accountant.
(e)(2) No services described in paragraphs (b)-(d) above were approved by the Trust’s audit committee pursuant to the “de minimis exception” set forth in Rule 2-01(c)(7)(i)(C) of Regulation S-X.
(f) Not applicable.
(g) The following table presents (i) the aggregate non-audit fees (i.e., fees for audit-related, tax, and other services) billed for services rendered to all of the Funds in the Trust by D&T for the last two fiscal years of each Fund; and (ii) the aggregate non-audit fees (i.e., fees for audit-related, tax, and other services) billed for services rendered to the Eaton Vance organization by D&T for the last two fiscal years of each Fund.
| | | | | | | | |
Fiscal Years Ended | | 03/31/23 | | | 03/31/24 | |
Registrant(1) | | $ | 1,575 | | | $ | 0 | |
Eaton Vance(2) | | $ | 52,836 | | | $ | 52,836 | |
| (1) | Includes all of the Funds of the Trust. |
| (2) | The investment adviser to the Funds, as well as any of its affiliates that provide ongoing services to the Funds, are subsidiaries of Morgan Stanley. |
(h) The Trust’s audit committee has considered whether the provision by the Trust’s principal accountant of non-audit services to the Trust’s investment adviser and any entity controlling, controlled by, or under common control with the adviser that provides ongoing services to the registrant that were not pre-approved pursuant to Rule 2-01(c)(7)(ii) of Regulation S-X is compatible with maintaining the principal accountant’s independence.
(i) Not applicable.
(j) Not applicable.
Item 5. Audit Committee of Listed Registrants
Not applicable.
Item 6. Schedule of Investments
Please see schedule of investments contained in the Report to Stockholders included under Item 1 of this Form N-CSR.
Item 7. Disclosure of Proxy Voting Policies and Procedures for Closed-End Management Investment Companies
Not applicable.
Item 8. Portfolio Managers of Closed-End Management Investment Companies
Not applicable.
Item 9. Purchases of Equity Securities by Closed-End Management Investment Company and Affiliated Purchasers
Not applicable.
Item 10. Submission of Matters to a Vote of Security Holders
No material changes.
Item 11. Controls and Procedures
(a) It is the conclusion of the registrant’s principal executive officer and principal financial officer that the effectiveness of the registrant’s current disclosure controls and procedures (such disclosure controls and procedures having been evaluated within 90 days of the date of this filing) provide reasonable assurance that the information required to be disclosed by the registrant has been recorded, processed, summarized and reported within the time period specified in the Commission’s rules and forms and that the information required to be disclosed by the registrant has been accumulated and communicated to the registrant’s principal executive officer and principal financial officer in order to allow timely decisions regarding required disclosure.
(b) There have been no changes in the registrant’s internal controls over financial reporting during the second fiscal quarter of the period covered by this report that has materially affected, or is reasonably likely to materially affect, the registrant’s internal control over financial reporting.
Item 12. Disclosure of Securities Lending Activities for Closed-End Management Investment Companies
Not applicable.
Item 13. Exhibits
Signatures
Pursuant to the requirements of the Securities Exchange Act of 1934 and the Investment Company Act of 1940, the registrant has duly caused this report to be signed on its behalf by the undersigned, thereunto duly authorized.
| | |
| Eaton Vance Investment Trust |
| |
| By: | | /s/ Kenneth A. Topping |
| | Kenneth A. Topping |
| | Principal Executive Officer |
Date: May 17, 2024
Pursuant to the requirements of the Securities Exchange Act of 1934 and the Investment Company Act of 1940, this report has been signed below by the following persons on behalf of the registrant and in the capacities and on the dates indicated.
| | |
| By: | | /s/ James F. Kirchner |
| | James F. Kirchner |
| | Principal Financial Officer |
|
| Date: May 17, 2024 |
| |
| By: | | /s/ Kenneth A. Topping |
| | Kenneth A. Topping |
| | Principal Executive Officer |
|
| Date: May 17, 2024 |