UNITED STATES
SECURITIES AND EXCHANGE COMMISSION
Washington, D.C. 20549
FORM N-CSR
CERTIFIED SHAREHOLDER REPORT OF REGISTERED
MANAGEMENT INVESTMENT COMPANIES
Investment Company Act file number
811-04447
Brandywine Fund, Inc.
(Exact name of registrant as specified in charter)
3711 Kennett Pike
Greenville, DE 19807
(Address of principal executive offices) (Zip code)
William F. D’Alonzo
Friess Associates, LLC
3711 Kennett Pike
Greenville, Delaware 19807
(Name and address of agent for service)
(302) 656-3017
Registrant's telephone number, including area code:
Date of fiscal year end: September 30
Date of reporting period: September 30, 2007
Item 1. Reports to Stockholders.
Managed by Friess Associates, LLC | Annual Report | September 30, 2007 |
Dear Fellow Shareholders:
Major market averages took indirect routes to modest gains in the September quarter as credit-market troubles sent stocks on a treacherous detour. The Brandywine Funds enjoyed better fortune navigating their way to higher ground.
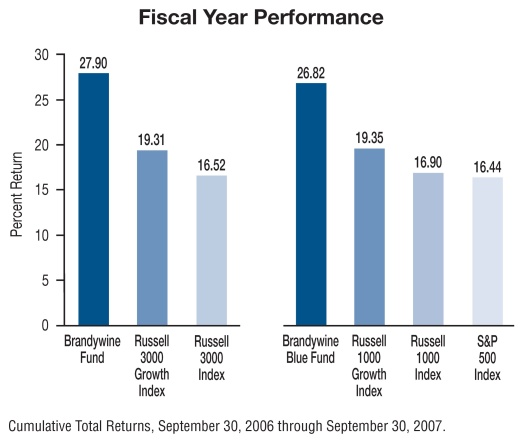
Brandywine Fund grew 5.92 percent in the September quarter, outpacing gains in the Russell 3000 and Russell 3000 Growth Indexes of 1.55 and 3.85 percent. Brandywine Blue Fund posted an 8.13 percent return as the S&P 500, Russell 1000 and Russell 1000 Growth Indexes added 2.03, 1.98 and 4.21 percent.
Recent results bring Brandywine’s return this calendar year through September to 19.51 percent. The Russell 3000 and Russell 3000 Growth Indexes gained 8.77 and 12.39 percent during that time. Brandywine Blue’s 20.44 percent return compares favorably to gains in the S&P 500, Russell 1000 and Russell 1000 Growth of 9.13, 9.30 and 12.68 percent.
Repercussions from mounting defaults on sub-prime mortgage loans weighed on sentiment for a good part of the September quarter. Lack of individual-company earnings strength in the financial sector led the Brandywine Funds to hold few companies even perceived to be exposed to the expanding fallout. We also typically avoid companies that rely heavily on debt, which reduced the risk of the Funds holding companies likely to need financing at a time when credit markets were, to put it mildly, inhospitable.
As those factors worked in the Funds’ favor to limit downside, many holdings made the most of the September quarter’s brighter times. The most significant contributors to quarterly results hailed from the areas where the Brandywine Funds continue to isolate the greatest concentrations of earnings potential, the technology and industrial sectors.
Apple, held in both Funds, climbed as it demonstrated continued earnings strength and gave investors reason to believe there’s more to come. The company exceeded estimates by 28 percent with 70 percent June-quarter earnings growth and introduced new iPod and Mac products. Apple was a leader among a host of technology holdings to report earnings growth that, even with the credit crisis dominating business newscasts, proved hard for investors to ignore.
Cisco Systems, Oracle and Hewlett-Packard all topped expectations in their most recent quarters with year-over-year earnings growth ranging from 20 to 37 percent. All three companies were held by both Funds.
Since a sell-off sparked by a drop in Chinese stocks late in the March quarter, investors have shown a renewed commitment to assessing companies based on individual-company earnings trends, so it wasn’t surprising to see McDermott International and Precision Castparts back among Brandywine’s top contributors in the September quarter. One or the other finished as the Fund’s top contributor to results for the past three quarters in a row.
| | | Brandywine | | Brandywine Blue |
Cumulative Total Return | | % Change | | % Change |
Quarter | 5.92 | | | 8.13 | | |
One Year | 27.90 | | | 26.82 | | |
Five Years | 116.32 | | | 124.74 | | |
Ten Years | 97.14 | | | 107.89 | | |
Inception | 1,632.56 | * | | 844.59 | ** | |
Five Years | 16.69 | | | 17.58 | | |
Ten Years | 7.02 | | | 7.59 | | |
Inception | 14.01 | * | | 14.37 | ** | |
Brandywine | | 1.08% | | |
Brandywine Blue | | 1.10% | | |
***As stated in the Prospectus dated January 31, 2007
Performance data quoted represent past performance; past performance does not guarantee future results. The investment return and principal value of an investment will fluctuate so that an investor’s shares, when redeemed, may be worth more or less than their original cost. Current performance of the Funds may be lower or higher than the performance quoted. Performance data current to the most recent month end may be obtained by visiting www.brandywinefunds.com.
McDermott and Precision Castparts grew June-quarter earnings 85 and 87 percent, topping estimates by 40 and 13 percent, respectively. Matching an earlier accomplishment by Precision Castparts, McDermott’s market value increased so much since our initial purchase that in the September quarter we added the company to Brandywine Blue’s large-cap portfolio. Deere & Co. and Fluor Corp. lent the industrial sector additional strength for Brandywine Blue.
Brandywine experienced declines in the financial and consumer discretionary sectors. The Fund held few companies from the financial sector, mitigating their impact. Consumer-related declines were modest overall, as declines in cable company Comcast Corp. and upscale retailer Saks Inc. were mostly offset by gains in video game retailer Gamestop Corp. and sports apparel maker Under Armour.
Consumer-related holdings benefited Brandywine Blue’s results, while the Fund’s limited number of holdings from the financial sector mirrored Brandywine’s experience. Brandywine Blue’s biggest detractor was the energy sector, where Cameco Corp. declined after disclosing production delays that clouded the company’s near-term outlook.
For more information on holdings that influenced September-quarter performance, please see Roses & Thorns on page 4 for Brandywine and page 6 for Brandywine Blue.
The September-quarter marked the end of a strong fiscal year for the Brandywine Funds. Industrial holdings, including Precision Castparts, McDermott International and Rockwell Collins, contributed substantially to performance throughout the period. Materials holdings played a notable role in the fiscal year’s first half, a period in which technology holdings were mostly muted.
In the year’s final two quarters, however, technology came on strong with standout performances from Hewlett-Packard, Apple, Oracle and NVIDIA, among others.
Brandywine grew 27.90 percent in the fiscal year ended September 30, leading its nearest benchmark by more than 8 percentage points. Brandywine Blue’s 26.82 percent return outpaced its best performing benchmark by more than 7 percentage points.
Stocks rode a wave of positive momentum into the September quarter that suddenly crashed in lockstep with confidence in credit markets. The Brandywine Funds outperformed their benchmarks in the quarter’s upbeat first weeks, during the downturn and in the rollercoaster rally that followed.
We didn’t make any widespread changes or manage to garner exceptionally actionable insight on the credit crisis. Following our standard investment approach, the portfolios proved to be well-positioned for a climate in which investors became increasingly suspect of debt.
While the late-quarter rally celebrating the Fed’s rate cut might seem to indicate otherwise, the credit crisis will persist as an issue for markets to digest. Upcoming earnings reports from big financial institutions will include charges representing billions of dollars of sub-prime-related losses. How the credit markets function in the months ahead will help determine whether these write-downs cover a good part of the damage or simply represent the tip of the iceberg.
From lingering credit-market issues to rising oil prices, threats remain with the potential to reignite jitters. As events in the March and September quarters demonstrated, the market’s mood can turn quickly. Still, each downturn was short-lived and followed by a rebound that showed a strong connection between earnings performance and stock prices.
We can’t control what investors choose to focus on from one day to the next. By consistently employing our time-tested investment approach, however, we can ensure the Brandywine Funds hold attractively priced companies with robust earnings prospects when investors inevitably set their sights on the individual-company level.
Thanks for your continued confidence!
| | |
 | |
| Bill D’Alonzo | |
| Brandywine Funds President | October 12, 2007 |
Brandywine Fund
Percent Change in Top Ten Holdings From Book Cost
| 1. | Oracle Corp. | +24.6% | 6. | | Hewlett-Packard Co. | +47.5% |
| 2. | McDermott International, Inc. | +385.8% | 7. | | Harris Corp. | +46.5% |
| 3. | Apple, Inc. | +26.4% | 8. | | Rockwell Collins, Inc. | +35.9% |
| 4. | Cisco Systems Inc. | +23.7% | 9. | | CVS Caremark Corp. | +5.7% |
| 5. | Thermo Fisher Scientific, Inc. | +50.1% | 10. | | Precision Castparts Corp. | +317.9% |
Brandywine Fund
September Quarter “Roses and Thorns”
| | $ Gain | | |
Biggest $ Winners | (in millions) | % Gain | Reason for Move |
McDermott International, Inc. | $50.1 | 30.1 | June-quarter earnings grew 85 percent, beating estimates by 40 percent. Revenues jumped 35 percent as demand for the company’s engineering and construction services remains elevated, particularly for its J. Ray marine subsidiary. New projects associated with offshore processing plants and undersea pipelines, new power generation plants and government nuclear sites pushed backlogged orders up to $8.9 billion from $7.6 billion at the beginning of the year. |
| Apple, Inc. | $41.4 | 25.8 | June-quarter earnings grew 70 percent, topping estimates by 28 percent. The company benefited from lower component costs, strong demand for new iPod versions and higher-than-expected iPhone sales. Sales of Apple’s newest product introductions also bolstered demand for updated Mac desktop and notebook computers. |
Precision Castparts Corp. | $32.3 | 17.9 | The manufacturer of complex metal castings and forgings for aerospace and industrial applications grew June-quarter earnings 87 percent, marking the seventh consecutive quarter the company topped estimates. Revenues grew 48 percent as the company benefited from robust demand for original equipment and aftermarket parts from customers in the aerospace, industrial gas turbine, oil and gas, chemical processing, pollution control, and power markets. Recent acquisitions are making incremental contributions to sales and margins. |
| Cisco Systems Inc. | $30.5 | 19.0 | The world’s largest provider of networking products for enterprises and service providers grew July-quarter earnings 20 percent, topping estimates. Cisco benefits from the dramatic growth in video traffic over the Internet, which demands new investments in infrastructure. Cisco has numerous growth opportunities over the near-to-intermediate term tied to growth in emerging markets. |
| GameStop Corp. | $24.3 | 41.8 | The specialty retailer of video game hardware, software and accessories more than quadrupled July-quarter earnings, topping estimates by 56 percent. Strong demand trends for the Sony PS3, Microsoft XBOX 360 and Nintendo Wii game consoles coincide with a string of new game title releases. GameStop differentiates itself from competitors through its high-margin used games business. |
| | $ Loss | | |
Biggest $ Losers | (in millions) | % Loss | Reason for Move |
| Comcast Corp. | $26.8 | 14.3 | June-quarter earnings grew 29 percent and revenues increased 24 percent. While the largest cable-TV operator in the U.S. continues to aggressively add voice service to its existing cable and Internet markets, shares retraced on concerns related to increasing competition from regional telephone companies and satellite providers. |
| Copa Holdings SA | $20.6 | 35.7 | The Panama-based hub-and-spoke airline carrier grew June-quarter earnings 13 percent, topping Wall Street estimates. Copa lowered its 2007 capacity growth and operating margin forecasts due to a temporary shortage of pilots and a more competitive fare environment, prompting our decision to sell the company during the quarter. |
| Saks, Inc. | $17.8 | 25.4 | The operator of Saks Fifth Avenue, Off Fifth and Club Libby Lu luxury stores grew July-quarter earnings 42 percent, beating Wall Street’s estimates. Despite impressive same-store sales growth, investors grew concerned that lower Wall Street bonuses following the sub-prime mortgage meltdown would hurt the company’s New York same store sales later this year. The company’s flagship store in Manhattan generates 20 percent of sales. We sold Saks during the quarter. |
Fidelity National Information Services, Inc. | $14.8 | 18.3 | The credit and debit card processor grew June-quarter earnings 16 percent. Cost synergies and cross-selling opportunities related to recent acquisitions drove results. Given the timing of the decline and lack of company-specific reason for it, we believe investors taking gains to cover losses related to disruptions in the credit markets played a role in the downturn. |
Phillips-Van Heusen Corp. | $12.6 | 13.4 | The seller of Calvin Klein, Izod, Bass and other brand-name apparel and footwear grew July-quarter earnings 28 percent, topping estimates by 10 percent. Despite all business segments registering revenue and earnings increases and management raising fiscal 2007 earnings guidance, shares traded lower in sympathy with weakness in the broader retail group. |
All gains/losses are calculated on an average cost basis
Brandywine Blue Fund
Percent Change in Top Ten Holdings From Book Cost
| 1. | Apple, Inc. | +27.6% | 6. | | Costco Wholesale Corp. | +0.1% |
| 2. | Cisco Systems Inc. | +18.0% | 7. | | Teva Pharmaceutical Industry Ltd. SP-ADR | +9.5% |
| 3. | CVS Caremark Corp. | +4.9% | 8. | | Deere & Co. | +34.1% |
| 4. | Thermo Fisher Scientific, Inc. | +43.9% | 9. | | Rockwell Collins, Inc. | +38.2% |
| 5. | Oracle Corp. | +20.7% | 10. | | Fluor Corp. | +64.6% |
Brandywine Blue Fund
September Quarter “Roses and Thorns”
| | $ Gain | | |
Biggest $ Winners | (in millions) | % Gain | Reason for Move |
| Apple, Inc. | $32.5 | 24.9 | June-quarter earnings grew 70 percent, topping estimates by 28 percent. The company benefited from lower component costs, strong demand for new iPod versions and higher-than-expected iPhone sales. Sales of Apple’s newest product introductions also bolstered demand for updated Mac desktop and notebook computers. |
| NVIDIA Corp. | $23.9 | 28.1 | The manufacturer of computer chips that provide high-performance, interactive 3D graphics for personal computers and gaming consoles grew July-quarter earnings 76 percent, topping estimates by 21 percent. Performance was driven by stronger-than-expected orders from Intel following consolidation in the industry. |
| GameStop Corp. | $23.3 | 40.2 | The specialty retailer of video game hardware, software and accessories more than quadrupled July-quarter earnings, topping estimates by 56 percent. Strong demand trends for the Sony PS3, Microsoft XBOX 360 and Nintendo Wii game consoles coincide with a string of new game title releases. GameStop differentiates itself from competitors through its high-margin used games business. |
| Garmin Ltd. | $23.0 | 44.7 | The maker of navigation devices that use Global Positioning System (GPS) to pinpoint a user’s exact location grew June-quarter earnings 82 percent, beating estimates by 35 percent. Booming demand for the company’s Personal Navigation Devices (PNDs) in the U.S. and Europe led to higher earnings guidance for the second half of 2007. We sold Garmin when shares hit our target price. |
| Cisco Systems Inc. | $22.0 | 17.3 | The world’s largest provider of networking products for enterprises and service providers grew July-quarter earnings 20 percent, topping estimates. Cisco benefits from the dramatic growth in video traffic over the Internet, which demands new investments in infrastructure. Cisco has numerous growth opportunities over the near-to-intermediate term tied to growth in emerging markets. |
| | $ Loss | | |
Biggest $ Losers | (in millions) | % Loss | Reason for Move |
| Comcast Corp. | $15.7 | 14.3 | June-quarter earnings grew 29 percent and revenues increased 24 percent. While the largest cable-TV operator in the U.S. continues to aggressively add voice service to its existing cable and Internet markets, shares retraced on concerns related to increasing competition from regional telephone companies and satellite providers. |
Fidelity National Information Services, Inc. | $13.0 | 17.8 | The credit and debit card processor grew June-quarter earnings 16 percent. Cost synergies and cross-selling opportunities related to recent acquisitions drove results. Given the timing of the decline and lack of company-specific reason for it, we believe investors taking gains to cover losses related to disruptions in the credit markets played a role in the downturn. |
| Charles Schwab Corp. | $12.9 | 17.7 | The supplier of a broad range of brokerage and investment services grew June-quarter earnings 21 percent. Concerns about financial-sector companies amid credit-market turmoil overshadowed increased trading, asset inflows and account growth. We sold Charles Schwab to fund an idea with greater near-term earnings visibility. |
| Cameco Corp. | $8.0 | 17.4 | The world’s largest uranium producer grew June-quarter earnings to $0.51 per share from $0.19 a year ago as revenues jumped 82 percent on soaring uranium prices. Shares traded lower on news the company would delay opening a new mine due to an underground flood and would halt output at a plant for at least two months because of a soil remediation project. We sold Cameco during the quarter. |
Companhia Vale do Rio Doce | $7.8 | 20.1 | The world’s leading iron ore pellet producer grew June-quarter earnings 119 percent, topping estimates by 23 percent. Prices for most metals and investments with ties to emerging markets fell as credit-market turmoil sapped investor appetite for risk. With the potential for credit-market illiquidity to threaten industrial projects that played a role in our internal demand projections, we sold the company during the quarter to fund an opportunity with better earnings visibility. |
All gains/losses are calculated on an average cost basis
Management’s Discussion of Results, Brandywine Fund
Volatility spiked in response to macro events at times during the fiscal year, but overall the trend remained positive. Brandywine Fund’s investment strategy emphasizing the relationship between earnings performance and stock prices enabled the Fund to post strong absolute and relative results.
Brandywine gained ground in every one of the fiscal year’s quarters, outperforming the Russell 3000 Index in three out of four instances and the Russell 3000 Growth Index all four times. Brandywine’s 27.90 percent total return in the 12-month period through September 30 outpaced returns in the Russell 3000 and Russell 3000 Growth Indexes of 16.52 and 19.31 percent.
The fiscal year started with relief as a drop in oil prices lessened fears that a summer price surge would exact a heavy toll on the economy. Holdings from the industrial and materials sectors, which in prior months stalled amid the economic uncertainty, rebounded soundly and contributed most to results versus benchmarks in the last three months of 2006. Brandywine led the Russell 3000 Growth Index in the December quarter with a return that slightly trailed the Russell 3000 Index.
Stocks continued to climb in a relatively calm environment into late February, when a steep drop in Chinese stocks jolted markets worldwide. A resulting downturn proved to be short-lived and, by the end of the March quarter, U.S. stocks registered gains. Thanks to continued strength from holdings in the industrial and materials sectors, Brandywine outperformed the Russell 3000 and Russell 3000 Growth Indexes.
Performance accelerated in an upbeat June-quarter environment as stock prices showed a strong correlation to earnings results. Every economic sector represented in the portfolio gained ground. Holdings from the industrial sector led the way for the third consecutive quarter, assisted by a strong showing from technology holdings. Brandywine led both of its benchmarks.
The market faced its most significant challenge in the September quarter as defaults on sub-prime mortgages triggered losses in the financial sector and stoked enough fear to disrupt credit markets. Stock market turmoil gave way to enthusiasm as the Fed acted aggressively to restore order. Holdings from the industrial and technology sectors were top contributors as Brandywine topped its benchmarks again.
| | | |
| | | |
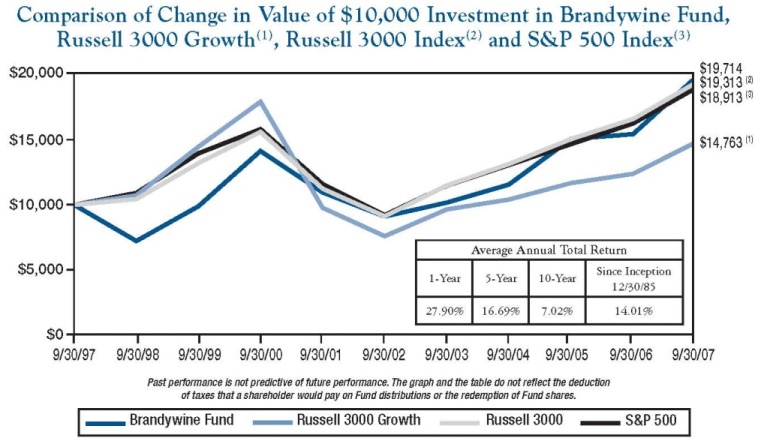
| (1) | The Russell 3000 Growth Index measures the performance of those Russell 3000 Index companies with higher price-to-book ratios and higher forecasted growth values. The stocks in this index are also members of either the Russell 1000 Growth or the Russell 2000 Growth Indexes and includes dividends. | |
| (2) | The Russell 3000 Index, a trademark of the Frank Russell Company, is 3,000 of the largest publicly traded companies in the United States equity market and includes dividends. | |
| (3) | The S&P 500 Index consists of 500 stocks, mostly on the New York Stock Exchange, selected by the Standard & Poor’s Ratings Group. Each stock’s weighting is based on its relative total market value and includes dividends. | |
| | | |
Brandywine Fund, Inc.
Statement of Net Assets
September 30, 2007
Shares | | | | Cost | | | Value | |
| | | | | | | | | |
Common Stocks - 94.9% (a) | | | | | | |
| | | | | | | | | |
CONSUMER DISCRETIONARY | | | | | | |
| | | | | | | | | |
| | | Advertising - 0.1% | | | | | | |
| | 124,800 | | National CineMedia, Inc. | | $ | 2,774,155 | | | $ | 2,795,520 | |
| | | | | | | | | | | | |
| | | | Apparel, Accessories & Luxury Goods - 2.5% | | | | | | | | |
| | 812,500 | | Coach, Inc.* | | | 36,732,082 | | | | 38,406,875 | |
| | 1,562,800 | | Phillips-Van Heusen Corp. | | | 88,408,113 | | | | 82,015,744 | |
| | | | | | | | | | | | |
| | | | Apparel Retail - 4.1% | | | | | | | | |
| | 4,088,900 | | American Eagle Outfitters, Inc. | | | 99,874,303 | | | | 107,578,959 | |
| | 4,191,500 | | Urban Outfitters, Inc.* | | | 105,737,798 | | | | 91,374,700 | |
| | | | | | | | | | | | |
| | | | Broadcasting & Cable TV - 1.9% | | | | | | | | |
| | 3,782,300 | | Comcast Corp.* | | | 80,586,985 | | | | 91,456,014 | |
| | | | | | | | | | | | |
| | | | Computer & Electronics Retail - 1.7% | | | | | | | | |
| | 1,461,500 | | GameStop Corp.* | | | 58,786,350 | | | | 82,355,525 | |
| | | | | | | | | | | | |
| | | | Distributors - 0.2% | | | | | | | | |
| | 232,800 | | LKQ Corp.* | | | 7,254,758 | | | | 8,103,768 | |
| | | | | | | | | | | | |
| | | | Education Services - 0.0% | | | | | | | | |
| | 52,400 | | Corinthian Colleges, Inc.* | | | 823,587 | | | | 833,684 | |
| | | | | | | | | | | | |
| | | | Footwear - 2.7% | | | | | | | | |
| | 1,615,700 | | Crocs, Inc.* | | | 89,474,433 | | | | 108,655,825 | |
| | 571,800 | | Iconix Brand Group, Inc.* | | | 11,178,042 | | | | 13,603,122 | |
| | 341,200 | | Skechers U.S.A., Inc.* | | | 7,702,582 | | | | 7,540,520 | |
| | | | | | | | | | | | |
| | | | Internet Retail - 1.5% | | | | | | | | |
| | 837,500 | | Priceline.com Inc.* | | | 54,232,117 | | | | 74,328,125 | |
| | | | | | | | | | | | |
| | | | Total Consumer Discretionary | | | 643,565,305 | | | | 709,048,381 | |
| | | | | | | | | | | | |
| | | | This sector is 10.2% above your Fund’s cost. | | | | | | | | |
| | | | | | | | | | | |
CONSUMER STAPLES | | | | | | | | |
| | | | | | | | | | | | |
| | | | Drug Retail - 2.9% | | | | | | | | |
| | 3,599,700 | | CVS Caremark Corp. | | | 134,902,980 | | | | 142,656,111 | |
| | | | | | | | | | | | |
| | | | Hypermarkets & Super Centers - 2.2% | | | | | | | | |
| | 1,754,900 | | Costco Wholesale Corp. | | | 106,846,681 | | | | 107,698,213 | |
| | | | | | | | | | | | |
| | | | Total Consumer Staples | | | 241,749,661 | | | | 250,354,324 | |
| | | | | | | | | | | | |
| | | | This sector is 3.6% above your Fund’s cost. | | | | | | | | |
| | | | | | | | | | | |
ENERGY | | | | | | | | | | |
| | | | | | | | | | | | |
| | | | Oil & Gas Equipment & Services - 3.5% | | | | | | | | |
| | 322,100 | | Dril-Quip, Inc.* | | | 15,713,099 | | | | 15,895,635 | |
| | 967,700 | | Oceaneering International, Inc.* | | | 44,801,704 | | | | 73,351,660 | |
| | 642,300 | | Superior Energy Services, Inc.* | | | 24,914,645 | | | | 22,763,112 | |
| | 970,600 | | Tenaris S.A.-ADR | | | 46,278,866 | | | | 51,072,972 | |
| | 113,600 | | W-H Energy Services, Inc.* | | | 7,668,942 | | | | 8,378,000 | |
| | | | | | | | | | | | |
| | | | Oil & Gas Exploration & Production - 1.5% | | | | | | | | |
| | 1,088,900 | | Cabot Oil & Gas Corp. | | | 31,696,552 | | | | 38,285,724 | |
| | 1,960,000 | | Petrohawk Energy Corp.* | | | 29,655,483 | | | | 32,183,200 | |
| | | | | | | | | | | | |
| | | | Total Energy | | | 200,729,291 | | | | 241,930,303 | |
| | | | | | | | | | | | |
| | | | This sector is 20.5% above your Fund’s cost. | | | | | | | | |
| | | | | | | | | | | |
FINANCIALS | | | | | | | | | | |
| | | | | | | | | | | | |
| | | | Investment Banking & Brokerage - 0.4% | | | | | | | | |
| | 237,400 | | GFI Group Inc.* | | | 19,966,041 | | | | 20,444,888 | |
| | | | | | | | | | | | |
| | | | Multi-line Insurance - 0.1% | | | | | | | | |
| | 138,800 | | HCC Insurance Holdings, Inc. | | | 4,257,281 | | | | 3,975,232 | |
| | | | | | | | | | | | |
| | | | Property & Casualty Insurance - 0.0% | | | | | | | | |
| | 20,900 | | ProAssurance Corp.* | | | 1,024,450 | | | | 1,125,883 | |
| | | | | | | | | | | | |
| | | | Thrifts & Mortgage Finance - 1.0% | | | | | | | | |
| | 737,100 | | Astoria Financial Corp. | | | 19,871,532 | | | | 19,555,263 | |
| | 1,481,600 | | New York Community | | | | | | | |
| | | | Bancorp, Inc. | | | 28,449,896 | | | | 28,224,480 | |
| | | | | | | | | | | | |
| | | | Total Financials | | | 73,569,200 | | | | 73,325,746 | |
| | | | | | | | | | | | |
| | | | This sector is 0.3% below your Fund’s cost. | | | | | | | | |
| | | | | | | | | | | |
HEALTH CARE | | | | | | | | | | |
| | | | | | | | | | | | |
| | | | Health Care Equipment - 1.9% | | | | | | | | |
| | 186,200 | | American Medical | | | | | | | |
| | | | Systems Holdings, Inc.* | | | 3,219,053 | | | | 3,156,090 | |
| | 788,600 | | Gen-Probe Inc.* | | | 47,363,728 | | | | 52,504,988 | |
| | 741,300 | | Hospira, Inc.* | | | 29,452,956 | | | | 30,726,885 | |
| | 263,300 | | Thoratec Corp.* | | | 5,047,665 | | | | 5,447,677 | |
| | | | | | | | | | | | |
| | | | Health Care Services - 0.2% | | | | | | | | |
| | 182,400 | | Pediatrix Medical Group, Inc.* | | | 11,573,864 | | | | 11,932,608 | |
| | | | | | | | | | | | |
| | | | Health Care Supplies - 0.4% | | | | | | | | |
| | 145,100 | | Immucor, Inc.* | | | 4,635,868 | | | | 5,187,325 | |
| | 257,200 | | Inverness Medical | | | | | | | |
| | | | Innovations, Inc.* | | | 13,210,266 | | | | 14,228,304 | |
| | | | | | | | | | | | |
| | | | Life Sciences Tools & Services - 5.9% | | | | | | | | |
| | 696,100 | | Covance Inc.* | | | 40,613,130 | | | | 54,226,190 | |
| | 3,254,600 | | Thermo Fisher Scientific, Inc.* | | | 125,176,979 | | | | 187,855,512 | |
| | 651,500 | | Waters Corp.* | | | 39,400,057 | | | | 43,598,380 | |
| | | | | | | | | | | | |
| | | | Pharmaceuticals - 2.7% | | | | | | | | |
| | 407,200 | | Adams Respiratory | | | | | | | |
| | | | Therapeutics, Inc.* | | | 17,603,441 | | | | 15,693,488 | |
| | 133,100 | | K-V Pharmaceutical Co.* | | | 3,185,394 | | | | 3,806,660 | |
| | 471,100 | | Medicis Pharmaceutical Corp. | | | 13,925,853 | | | | 14,373,261 | |
| | 120,500 | | Perrigo Co. | | | 2,300,068 | | | | 2,572,675 | |
| | 2,179,100 | | Teva Pharmaceutical | | | | | | | |
| | | | Industries Ltd. SP-ADR | | | 90,768,428 | | | | 96,904,577 | |
| | | | | | | | | | | | |
| | | | Total Health Care | | | 447,476,750 | | | | 542,214,620 | |
| | | | | | | | | | | | |
| | | | This sector is 21.2% above your Fund’s cost. | | | | | | | | |
Brandywine Fund, Inc.
Statement of Net Assets (Continued)
September 30, 2007
Shares | | | | Cost | | | Value | |
| | | | | | | | | |
Common Stocks - 94.9% (a) (Continued) | | | | | | |
| | | | | | | | | |
INDUSTRIALS | | | | | | |
| | | | | | | | | |
| | | Aerospace & Defense - 8.7% | | | | | | |
| | 566,900 | | AerCap Holdings N.V.* | | $ | 13,429,004 | | | $ | 14,110,141 | |
| | 341,300 | | Ceradyne, Inc.* | | | 25,620,323 | | | | 25,850,062 | |
| | 663,700 | | Goodrich Corp. | | | 27,278,347 | | | | 45,284,251 | |
| | 342,500 | | Hexcel Corp.* | | | 6,741,592 | | | | 7,778,175 | |
| | 531,000 | | Orbital Sciences Corp.* | | | 11,698,055 | | | | 11,809,440 | |
| | 809,700 | | Precision Castparts Corp. | | | 28,671,325 | | | | 119,819,406 | |
| | 2,055,300 | | Rockwell Collins, Inc. | | | 110,468,818 | | | | 150,119,112 | |
| | 1,273,400 | | Spirit Aerosystems Holdings Inc.* | | | 35,658,298 | | | | 49,586,196 | |
| | | | | | | | | | | | |
| | | | Construction & Engineering - 1.1% | | | | | | | | |
| | 700,800 | | Chicago Bridge & Iron | | | | | | | |
| | | | Co. N.V. NYS | | | 17,461,121 | | | | 30,176,448 | |
| | 668,600 | | EMCOR Group, Inc.* | | | 20,151,468 | | | | 20,967,296 | |
| | | | | | | | | | | | |
| | | | Construction & Farm Machinery & Heavy Trucks - 0.8% | | | | | | | | |
| | 624,200 | | Force Protection, Inc.* | | | 12,915,514 | | | | 13,520,172 | |
| | 643,900 | | Wabtec Corp. d/b/a Westinghouse | | | | | | | | |
| | | | Air Brake Technologies Corp. | | | 25,652,271 | | | | 24,120,494 | |
| | | | | | | | | | | | |
| | | | Diversified Commercial & Professional Services - 1.3% | | | | | | | | |
| | 2,140,600 | | Corrections Corporation of America* | | | 57,277,557 | | | | 56,019,502 | |
| | 140,200 | | The Geo Group Inc.* | | | 3,838,115 | | | | 4,151,322 | |
| | 209,800 | | RSC Holdings, Inc.* | | | 4,615,600 | | | | 3,440,720 | |
| | | | | | | | | | | | |
| | | | Electrical Components & Equipment - 1.5% | | | | | | | | |
| | 541,300 | | GrafTech International Ltd.* | | | 8,455,905 | | | | 9,656,792 | |
| | 1,552,100 | | Suntech Power | | | | | | | | |
| | | | Holdings Co., Ltd. ADR* | | | 42,121,609 | | | | 61,928,790 | |
| | | | | | | | | | | | |
| | | | Environmental & Facilities Services - 1.1% | | | | | | | | |
| | 1,159,650 | | Republic Services, Inc. | | | 31,048,141 | | | | 37,932,152 | |
| | 545,250 | | Waste Connections, Inc.* | | | 12,526,446 | | | | 17,317,140 | |
| | | | | | | | | | | | |
| | | | Human Resource & Employment Services - 0.4% | | | | | | | | |
| | 442,200 | | Watson Wyatt Worldwide Inc. | | | 21,503,048 | | | | 19,872,468 | |
| | | | | | | | | | | | |
| | | | Industrial Conglomerates - 4.4% | | | | | | | | |
| | 3,984,500 | | McDermott International, Inc.* | | | 44,358,191 | | | | 215,481,760 | |
| | | | | | | | | | | | |
| | | | Industrial Machinery - 1.3% | | | | | | | | |
| | 293,200 | | Chart Industries, Inc.* | | | 6,230,500 | | | | 9,429,312 | |
| | 704,200 | | Harsco Corp. | | | 33,391,926 | | | | 41,737,934 | |
| | 115,900 | | Valmont Industries, Inc. | | | 8,115,409 | | | | 9,834,115 | |
| | | | | | | | | | | | |
| | | | Marine - 0.7% | | | | | | | | |
| | 364,700 | | Eagle Bulk Shipping Inc. | | | 5,082,250 | | | | 9,387,378 | |
| | 127,700 | | Genco Shipping & Trading Ltd. | | | 6,923,100 | | | | 8,368,181 | |
| | 314,600 | | Kirby Corp.* | | | 11,190,655 | | | | 13,886,444 | |
| | | | | | | | | | | | |
| | | | Office Services & Supplies - 0.1% | | | | | | | | |
| | 353,200 | | Interface, Inc. | | | 5,988,237 | | | | 6,375,260 | |
| | | | | | | | | | | | |
| | | | Total Industrials | | | 638,412,825 | | | | 1,037,960,463 | |
| | | | | | | | | | | | |
| | | | This sector is 62.6% above your Fund’s cost. | | | | | | | | |
| | | | | | | | | | | |
INFORMATION TECHNOLOGY | | | | | | | | |
| | | | | | | | | | | | |
| | | | Application Software - 0.7% | | | | | | | | |
| | 294,200 | | NAVTEQ Corp.* | | | 15,076,832 | | | | 22,938,774 | |
| | 657,600 | | Nuance Communications, Inc.* | | | 5,822,992 | | | | 12,698,256 | |
| | | | | | | | | | | | |
| | | | Communications Equipment - 11.3% | | | | | | | | |
| | 302,600 | | Avocent Corp.* | | | 8,808,051 | | | | 8,811,712 | |
| | 5,784,300 | | Cisco Systems Inc.* | | | 154,884,417 | | | | 191,518,173 | |
| | 654,100 | | Comverse Technology, Inc.* | | | 13,056,371 | | | | 12,951,180 | |
| | 4,535,900 | | Corning Inc. | | | 103,602,065 | | | | 111,809,935 | |
| | 2,624,800 | | Harris Corp. | | | 103,574,334 | | | | 151,687,192 | |
| | 128,200 | | NICE Systems Ltd. SP-ADR* | | | 3,829,156 | | | | 4,594,688 | |
| | 2,454,700 | | Polycom, Inc.* | | | 76,305,359 | | | | 65,933,242 | |
| | | | | | | | | | | | |
| | | | Computer Hardware - 7.9% | | | | | | | | |
| | 1,317,300 | | Apple, Inc.* | | | 160,012,708 | | | | 202,258,242 | |
| | 3,619,300 | | Hewlett-Packard Co. | | | 122,207,842 | | | | 180,204,947 | |
| | | | | | | | | | | | |
| | | | Data Processing & Outsourced Services - 1.4% | | | | | | | | |
| | 1,498,100 | | Fidelity National | | | | | | | |
| | | | Information Services, Inc. | | | 56,943,394 | | | | 66,470,697 | |
| | | | | | | | | | | | |
| | | | Home Entertainment Software - 0.7% | | | | | | | | |
| | 1,484,000 | | Activision, Inc.* | | | 28,071,726 | | | | 32,039,560 | |
| | | | | | | | | | | | |
| | | | IT Consulting & Other Services - 0.5% | | | | | | | | |
| | 2,336,800 | | CGI Group Inc.* | | | 23,635,677 | | | | 26,639,520 | |
| | | | | | | | | | | | |
| | | | Internet Software & Services - 0.1% | | | | | | | | |
| | 125,600 | | Omniture, Inc.* | | | 2,279,640 | | | | 3,808,192 | |
| | | | | | | | | | | | |
| | | | Semiconductor Equipment - 1.8% | | | | | | | | |
| | 963,100 | | FormFactor Inc.* | | | 44,000,664 | | | | 42,732,747 | |
| | 836,850 | | Varian Semiconductor | | | | | | | | |
| | | | Equipment Associates, Inc.* | | | 26,903,468 | | | | 44,788,212 | |
| | | | | | | | | | | | |
| | | | Semiconductors - 1.3% | | | | | | | | |
| | 634,300 | | ANADIGICS, Inc.* | | | 8,021,570 | | | | 11,468,144 | |
| | 34,900 | | Atheros Communications* | | | 1,153,616 | | | | 1,045,953 | |
| | 1,079,500 | | LSI Corp.* | | | 7,999,926 | | | | 8,009,890 | |
| | 182,000 | | NVIDIA Corp.* | | | 3,363,348 | | | | 6,595,680 | |
| | 849,600 | | Silicon Laboratories Inc.* | | | 34,055,029 | | | | 35,479,296 | |
| | | | | | | | | | | | |
| | | | Systems Software - 5.0% | | | | | | | | |
| | 11,241,100 | | Oracle Corp.* | | | 195,286,514 | | | | 243,369,815 | |
| | | | | | | | | | | | |
| | | | Technology Distributors - 0.0% | | | | | | | | |
| | 12,500 | | Brightpoint, Inc.* | | | 178,329 | | | | 187,625 | |
| | | | | | | | | | | | |
| | | | Total Information Technology | | | 1,199,073,028 | | | | 1,488,041,672 | |
| | | | | | | | | | | | |
| | | | This sector is 24.1% above your Fund’s cost. | | | | | | | | |
| | | | | | | | | | | |
MATERIALS | | | | | | | | |
| | | | | | | | | | | | |
| | | | Industrial Gases - 1.3% | | | | | | | | |
| | 1,244,000 | | Airgas, Inc. | | | 54,581,442 | | | | 64,227,720 | |
| | | | | | | | | | | | |
| | | | Total Materials | | | 54,581,442 | | | | 64,227,720 | |
| | | | | | | | | | | | |
| | | | This sector is 17.7% above your Fund’s cost. | | | | | | | | |
Brandywine Fund, Inc.
Statement of Net Assets (Continued)
September 30, 2007
Shares or | | | | | | | | |
Principal | | | | | | | | |
Amount | | | | Cost | | | Value | |
| | | | | | | | | |
Common Stocks - 94.9% (a) (Continued) | | | | | | |
| | | | | | | | | |
TELECOMMUNICATION SERVICES | | | | | | |
| | | | | | | | | |
| | | Integrated Telecommunication Services - 0.7% | | | | | | |
| | 746,600 | | AT&T Inc. | | $ | 27,137,095 | | | $ | 31,588,646 | |
| | | | | | | | | | | | |
| | | | Wireless Telecommunication Services - 3.4% | | | | | | | | |
| | 2,643,200 | | Crown Castle International Corp.* | | | 91,815,821 | | | | 107,393,216 | |
| | 1,627,700 | | SBA Communications Corp.* | | | 49,484,388 | | | | 57,425,256 | |
| | | | | | | | | | | | |
| | | | Total Telecommunication Services | | | 168,437,304 | | | | 196,407,118 | |
| | | | | | | | | | | | |
| | | | This sector is 16.6% above your Fund’s cost. | | | | | | | | |
| | | | | | | | | | | | |
| | | | Total common stocks | | | 3,667,594,806 | | | | 4,603,510,347 | |
| | | | | | | | | | | | |
Short-Term Investments - 4.3% (a) | | | | | | | | |
| | | | | | | | | | | | |
| | | | Federal Agencies - 4.3 % | | | | | | | | |
| $ | 207,500,000 | | Federal Home Loan Bank, | | | | | | | | |
| | | | due 10/01/07, | | | | | | | | |
| | | | discount of 4.00% | | | 207,500,000 | | | | 207,500,000 | |
| | | | | | | | | | | | |
| | | | Variable Rate Demand Note - 0.0% | | | | | | | | |
| | 2,814,871 | | U.S. Bank, N.A., 4.88% | | | 2,814,871 | | | | 2,814,871 | |
| | | | | | | | | | | | |
| | | | Total short-term investments | | | 210,314,871 | | | | 210,314,871 | |
| | | | | | | | | | | | |
| | | | Total investments | | $ | 3,877,909,677 | | | | 4,813,825,218 | |
| | | | | | | | | | | | |
| | | | Cash and receivables, less | | | | | | | | |
| | | | liabilities - 0.8% (a) | | | | | | | 37,442,395 | |
| | | | | | | | | | | | |
| | | | Net Assets | | | | | | $ | 4,851,267,613 | |
| | | | | | | | | | | | |
| | | | Net Asset Value Per Share | | | | | | | | |
| | | | ($0.01 par value, 500,000,000 | | | | | | | | |
| | | | shares authorized), offering | | | | | | | | |
| | | | and redemption price | | | | | | | | |
| | | | ($4,851,267,613 ÷ 118,389,428 | | | | | | | | |
| | | | shares outstanding) | | | | | | $ | 40.98 | |
* Non-dividend paying security.
(a) Percentages for the various classifications relate to net assets.
ADR - American Depositary Receipts
N.V. - Netherlands Antillies Limited Liability Corp.
NYS - New York Registered Shares
The accompanying notes to financial statements are an integral part of this statement.
New Quarterly Investor Statements . . . |
| In response to your requests, we are pleased to introduce Quarterly Investor Statements to our Brandywine Funds’ shareholders. Please note that total cost basis and average cost per share are now provided on taxable accounts. Average cost is not available for fiduciary accounts or accounts established through a transfer of shares in kind. The cost basis figures are being provided for informational purposes only, and are not intended to replace your own tax records. Please consult your tax advisor on how your Brandywine Funds investment affects your personal tax situation. |
Brandywine Fund, Inc.
Statement of Operations
For the Year Ended September 30, 2007
Income: | | | |
| Dividends | | $ | 18,168,215 | |
| Interest | | | 5,523,547 | |
| Total income | | | 23,691,762 | |
| | | | | |
Expenses: | | | | |
| Management fees | | | 43,777,629 | |
| Transfer agent fees | | | 1,893,122 | |
| Administrative and accounting services | | | 580,316 | |
| Printing and postage expense | | | 280,955 | |
| Custodian fees | | | 247,471 | |
| Board of Directors fees and expenses | | | 149,232 | |
| Insurance expense | | | 86,271 | |
| Registration fees | | | 62,993 | |
| Professional fees | | | 58,456 | |
| Other expenses | | | 20,283 | |
| Total expenses | | | 47,156,728 | |
Net Investment Loss | | | (23,464,966 | ) |
Net Realized Gain on Investments | | | 571,371,370 | |
Net Increase in Unrealized Appreciation on Investments | | | 531,009,089 | |
Net Gain on Investments | | | 1,102,380,459 | |
Net Increase in Net Assets Resulting From Operations | | $ | 1,078,915,493 | |
Statements of Changes in Net Assets
For the Years Ended September 30, 2007 and 2006
| | | 2007 | | | 2006 | |
Operations: | | | | | | |
| Net investment loss | | $ | (23,464,966 | ) | | $ | (12,539,911 | ) |
| Net realized gain on investments | | | 571,371,370 | | | | 328,031,774 | |
| Net increase (decrease) in unrealized appreciation on investments | | | 531,009,089 | | | | (219,420,419 | ) |
| Net increase in net assets resulting from operations | | | 1,078,915,493 | | | | 96,071,444 | |
| | | | | | | | | |
Distributions to Shareholders: | | | | | | | | |
| Distributions from net realized gains ($0.24662 per share) | | | (30,419,122 | ) | | — | |
| | | | | | | | | |
Fund Share Activities: | | | | | | | | |
| Proceeds from shares issued (9,363,718 and 15,270,588 shares, respectively) | | | 347,355,401 | | | | 490,003,223 | |
| Net asset value of shares issued in distributions reinvested (840,556 shares) | | | 28,878,771 | | | — | |
| Cost of shares redeemed (17,804,121 and 16,126,696 shares, respectively) | | | (639,755,297 | ) | | | (515,363,981 | ) |
| Net decrease in net assets derived from Fund share activities | | | (263,521,125 | ) | | | (25,360,758 | ) |
Total Increase | | | 784,975,246 | | | | 70,710,686 | |
| | | | | | | | | |
Net Assets at the Beginning of the Year | | | 4,066,292,367 | | | | 3,995,581,681 | |
| | | | | | | | | |
Net Assets at the End of the Year | | | | | | | | |
| (Includes accumulated net investment loss of $0 and $0, respectively) | | $ | 4,851,267,613 | | | $ | 4,066,292,367 | |
The accompanying notes to financial statements are an integral part of these statements.
Brandywine Fund, Inc.
Financial Highlights
(Selected data for each share of the Fund outstanding throughout each year)
| | | Years Ended September 30, | |
| | | 2007 | | | 2006 | | | 2005 | | | 2004 | | | 2003 | |
| PER SHARE OPERATING PERFORMANCE: | | | | | | | | | | | | | | | |
| Net asset value, beginning of year | | $ | 32.27 | | | $ | 31.50 | | | $ | 24.19 | | | $ | 21.30 | | | $ | 19.08 | |
| | | | | | | | | | | | | | | | | | | | | |
| Income from investment operations: | | | | | | | | | | | | | | | | | | | | |
Net investment loss(1) | | | (0.19 | ) | | | (0.10 | ) | | | (0.08 | ) | | | (0.13 | ) | | | (0.10 | ) |
| Net realized and unrealized gains | | | | | | | | | | | | | | | | | | | | |
| on investments | | | 9.15 | | | | 0.87 | | | | 7.39 | | | | 3.02 | | | | 2.32 | |
| Total from investment operations | | | 8.96 | | | | 0.77 | | | | 7.31 | | | | 2.89 | | | | 2.22 | |
| | | | | | | | | | | | | | | | | | | | | |
| Less distributions: | | | | | | | | | | | | | | | | | | | | |
| Dividend from net investment income | | | — | | | | — | | | | — | | | | — | | | | — | |
| Distributions from net realized gains | | | (0.25 | ) | | | — | | | | — | | | | — | | | | — | |
| Total from distributions | | | (0.25 | ) | | | — | | | | — | | | | — | | | | — | |
| Net asset value, end of year | | $ | 40.98 | | | $ | 32.27 | | | $ | 31.50 | | | $ | 24.19 | | | $ | 21.30 | |
| | | | | | | | | | | | | | | | | | | | | |
| TOTAL RETURN | | | 27.90 | % | | | 2.44 | % | | | 30.22 | % | | | 13.57 | % | | | 11.64 | % |
| | | | | | | | | | | | | | | | | | | | | |
| RATIOS/SUPPLEMENTAL DATA: | | | | | | | | | | | | | | | | | | | | |
| Net assets, end of year (in 000’s $) | | | 4,851,268 | | | | 4,066,292 | | | | 3,995,582 | | | | 3,586,793 | | | | 3,385,590 | |
| Ratio of expenses to average net assets | | | 1.08 | % | | | 1.08 | % | | | 1.08 | % | | | 1.08 | % | | | 1.09 | % |
| Ratio of net investment loss | | | | | | | | | | | | | | | | | | | | |
| to average net assets | | | (0.54 | %) | | | (0.31 | %) | | | (0.25 | %) | | | (0.55 | %) | | | (0.53 | %) |
| Portfolio turnover rate | | | 161.5 | % | | | 199.9 | % | | | 183.4 | % | | | 247.0 | % | | | 279.3 | % |
| (1) | Net investment loss per share was calculated using average shares outstanding. |
The accompanying notes to financial statements are an integral part of this statement.
| | Definitions and Disclosures (This section is not part of the audited financial statements.) | |
| | | |
| | Performance data quoted represent past performance; past performance does not guarantee future results. The investment return and principal value of an investment will fluctuate so that an investor’s shares, when redeemed, may be worth more or less than their original cost. Current performanceof the Funds may be lower or higher than the performance quoted. Performance data current to the most recent month end may be obtained by visiting www.brandywinefunds.com. | |
| | | |
| | The Funds’ investment objectives, risks, charges and expenses must be considered carefully before investing. The prospectus contains this and other important information about the investment companies, and it may be obtained by calling 1-800-656-3017, or visiting www.brandywinefunds.com. Read it carefully before investing. | |
| | | |
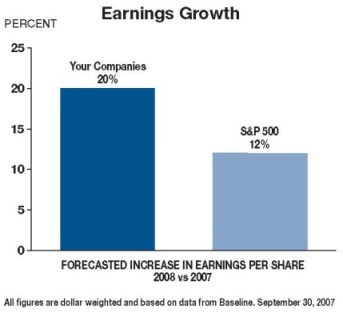
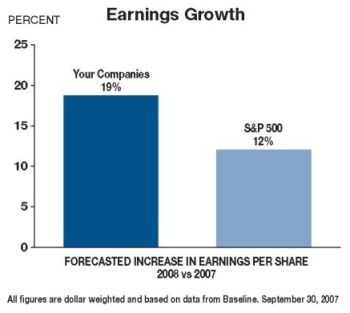
| | Fund holdings and sector weightings are subject to change at any time and are not recommendations to buy or sell any securities. Securities discussed were not held by the Funds as of 9/30/07, unless listed in the accompanying financial statements. References to the earnings growth rates of the Funds refer solely to the estimated earnings growth rates of the average investment holding of the Funds based on consensus estimates from Baseline and not to the actual performance of the Funds themselves. Baseline Financial Services, Inc. (Baseline) provides analytical information and services to the investment community. | |
| | | |
| | The Russell 1000, Russell 1000 Growth, Russell 3000, Russell 3000 Growth and S&P 500 Indexes are unmanaged indexes commonly used to measure the performance of U.S. stocks. You cannot invest directly in an index. As of September 30, 2007, the Russell 1000 Index’s average annual total returns for 1, 5 and 10 years were 16.90, 15.98 and 6.86 percent; the Russell 1000 Growth Index’s were 19.35, 13.84 and 4.06 percent; the Russell 3000 Index’s were 16.52, 16.18 and 6.82 percent; the Russell 3000 Growth Index’s were 19.31, 14.19 and 3.97 percent; and the S&P 500 Index’s were 16.44, 15.46 and 6.57 percent. | |
| | | |
Management’s Discussion of Results, Brandywine Blue Fund
Macro-driven interruptions, although jarring when they occurred, didn’t deter stocks from a solid run in the fiscal year. Investors rewarded individual-company earnings strength throughout most of the period. Brandywine Blue Fund, which employs a strategy emphasizing the relationship between earnings performance and stock prices, generated strong absolute and relative results.
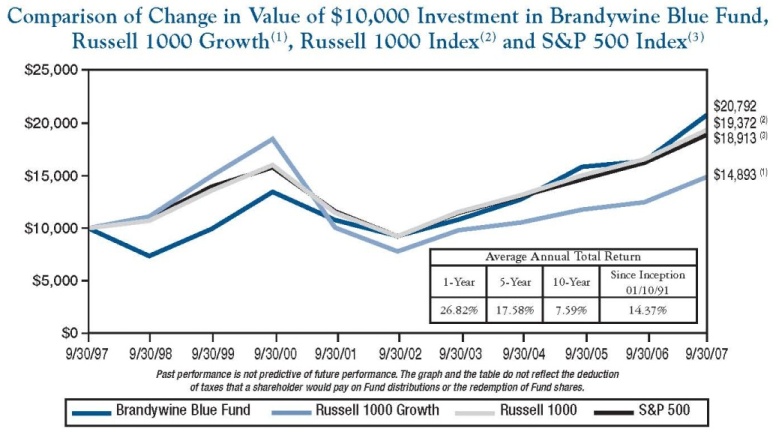
Brandywine Blue gained ground in all of the fiscal year’s four quarters. After starting slightly slower than large-cap indexes in the first three months of the period, the Fund took a lead on benchmarks that expanded in each subsequent quarter. Brandywine Blue’s 26.82 percent total return in the 12 months through September 30 surpassed returns in the S&P 500, Russell 1000 and Russell 1000 Growth Indexes of 16.44, 16.90 and 19.35 percent.
Receding oil prices at the start of the fiscal year tempered lingering economic concerns, resulting in a supportive climate in the December quarter of 2006. Holdings from the industrial and materials sectors, which in prior months stalled amid economic uncertainty, contributed most to results versus indexes. Brandywine Blue slightly trailed large-cap benchmarks in the quarter.
Stocks maintained a steady rise well into the March quarter until a major decline in Chinese stocks sparked volatility in markets around the world. As fears subsided and stocks regained traction, the Fund benefited as investors showed a renewed commitment to individual-company fundamentals. Holdings from the industrial and materials sectors, particularly those with ties to the aerospace market, continued to drive performance. Brandywine Blue led its benchmarks for the quarter.
Stocks continued to show a strong correlation to earnings results in a positive June-quarter environment. Performance contributions were widespread, with holdings from the materials, industrial and technology sectors contributing most. Brandywine Blue outperformed its benchmarks during the quarter.
The market faced its most significant challenge in the September quarter as defaults on sub-prime mortgages triggered losses in the financial sector and stoked enough fear to disrupt credit markets. With very little exposure to the areas most affected by the turmoil, the Fund fared well relative to the broader market. Stocks mustered gains as the Fed acted aggressively to restore order, and Brandywine Blue outpaced benchmarks by the widest margins of the year.
| | | |
| | | |
| (1) | The Russell 1000 Growth Index measures the performance of those Russell 1000 companies with higher price-to-book ratios and higher forecasted growth values and includes dividends. | |
| (2) | The Russell 1000 Index, a trademark of the Frank Russell Company, is the largest 1,000 companies of the 3,000 largest publicly traded companies in the United States equity market and includes dividends. | |
| (3) | The S&P 500 Index consists of 500 stocks, mostly on the New York Stock Exchange, selected by the Standard & Poor’s Ratings Group. Each stock’s weighting is based on its relative total market value and includes dividends. | |
| | | |
Brandywine Blue Fund
Statement of Net Assets
September 30, 2007
Shares | | | | Cost | | | Value | |
| | | | | | | | | |
Common Stocks - 91.0% (a) | | | | | | |
| | | | | | | | | |
CONSUMER DISCRETIONARY | | | | | | |
| | | | | | | | | |
| | | Apparel, Accessories & Luxury Goods - 2.3% | | | | | | |
| | 1,612,200 | | Coach, Inc.* | | $ | 74,289,879 | | | $ | 76,208,694 | |
| | | | | | | | | | | | |
| | | | Broadcasting & Cable TV - 1.6% | | | | | | | | |
| | 2,191,300 | | Comcast Corp.* | | | 46,507,340 | | | | 52,985,634 | |
| | | | | | | | | | | | |
| | | | Computer & Electronics Retail - 2.5% | | | | | | | | |
| | 1,443,400 | | GameStop Corp.* | | | 58,659,930 | | | | 81,335,590 | |
| | | | | | | | | | | | |
| | | | Total Consumer Discretionary | | | 179,457,149 | | | | 210,529,918 | |
| | | | | | | | | | | | |
| | | | This sector is 17.3% above your Fund’s cost. | | | | | | | | |
| | | | | | | | | |
CONSUMER STAPLES | | | | | | | | |
| | | | | | | | | | | | |
| | | | Drug Retail - 4.0% | | | | | | | | |
| | 3,336,000 | | CVS Caremark Corp. | | | 126,025,584 | | | | 132,205,680 | |
| | | | | | | | | | | | |
| | | | Hypermarkets & Super Centers - 3.5% | | | | | | | | |
| | 1,901,500 | | Costco Wholesale Corp. | | | 116,611,321 | | | | 116,695,055 | |
| | | | | | | | | | | | |
| | | | Total Consumer Staples | | | 242,636,905 | | | | 248,900,735 | |
| | | | | | | | | | | | |
| | | | This sector is 2.6% above your Fund’s cost. | | | | | | | | |
| | | | | | | | | |
ENERGY | | | | | | | | |
| | | | | | | | | | | | |
| | | | Oil & Gas Equipment & Services - 3.9% | | | | | | | | |
| | 832,800 | | Tenaris S.A.-ADR | | | 39,670,624 | | | | 43,821,936 | |
| | 1,239,500 | | Weatherford International Ltd.* | | | 82,172,203 | | | | 83,269,610 | |
| | | | | | | | | | | | |
| | | | Total Energy | | | 121,842,827 | | | | 127,091,546 | |
| | | | | | | | | | | | |
| | | | This sector is 4.3% above your Fund’s cost. | | | | | | | | |
| | | | | | | | | |
FINANCIALS | | | | | | | | |
| | | | | | | | | | | | |
| | | | Thrifts & Mortgage Finance - 0.2% | | | | | | | | |
| | 348,600 | | New York Community Bancorp, Inc. | | | 6,660,840 | | | | 6,640,830 | |
| | | | | | | | | | | | |
| | | | Total Financials | | | 6,660,840 | | | | 6,640,830 | |
| | | | | | | | | | | | |
| | | | This sector is 0.3% below your Fund’s cost. | | | | | | | | |
| | | | | | | | | |
HEALTH CARE | | | | | | | | |
| | | | | | | | | | | | |
| | | | Biotechnology - 4.3% | | | | | | | | |
| | 1,114,200 | | Genzyme Corp.* | | | 70,259,707 | | | | 69,035,832 | |
| | 1,748,900 | | Gilead Sciences, Inc.* | | | 59,609,846 | | | | 71,477,543 | |
| | | | | | | | | | | | |
| | | | Health Care Equipment - 3.5% | | | | | | | | |
| | 883,490 | | Hospira, Inc.* | | | 35,240,722 | | | | 36,620,660 | |
| | 972,200 | | Zimmer Holdings, Inc.* | | | 80,168,267 | | | | 78,738,478 | |
| | | | | | | | | | | | |
| | | | Life Sciences Tools & Services - 5.0% | | | | | | | | |
| | 2,154,800 | | Thermo Fisher Scientific, Inc.* | | | 86,436,531 | | | | 124,375,056 | |
| | 592,800 | | Waters Corp.* | | | 35,982,836 | | | | 39,670,176 | |
| | | | | | | | | | | | |
| | | | Pharmaceuticals - 5.9% | | | | | | | | |
| | 1,701,000 | | Abbott Laboratories | | | 94,345,209 | | | | 91,207,620 | |
| | 2,339,500 | | Teva Pharmaceutical | | | | | | | | |
| | | | Industries Ltd. SP-ADR | | | 94,980,171 | | | | 104,037,565 | |
| | | | | | | | | | | | |
| | | | Total Health Care | | | 557,023,289 | | | | 615,162,930 | |
| | | | | | | | | | | | |
| | | | This sector is 10.4% above your Fund’s cost. | | | | | | | | |
| | | | | | | | | | | |
INDUSTRIALS | | | | | | | | |
| | | | | | | | | | | | |
| | | | Aerospace & Defense - 8.1% | | | | | | | | |
| | 362,100 | | Goodrich Corp. | | | 17,751,516 | | | | 24,706,083 | |
| | 213,500 | | L-3 Communications Holdings, Inc. | | | 21,122,296 | | | | 21,806,890 | |
| | 424,700 | | Precision Castparts Corp. | | | 21,546,837 | | | | 62,847,106 | |
| | 1,005,400 | | Raytheon Co. | | | 60,786,588 | | | | 64,164,628 | |
| | 1,285,600 | | Rockwell Collins, Inc. | | | 67,923,304 | | | | 93,900,224 | |
| | | | | | | | | | | | |
| | | | Construction & Engineering - 2.8% | | | | | | | | |
| | 642,800 | | Fluor Corp. | | | 56,215,816 | | | | 92,550,344 | |
| | | | | | | | | | | | |
| | | | Construction & Farm Machinery & Heavy Trucks - 2.9% | | | | | | | | |
| | 652,700 | | Deere & Co. | | | 72,261,644 | | | | 96,873,734 | |
| | | | | | | | | | | | |
| | | | Heavy Electrical Equipment - 2.3% | | | | | | | | |
| | 2,913,700 | | ABB Ltd. SP-ADR | | | 69,817,626 | | | | 76,426,351 | |
| | | | | | | | | | | | |
| | | | Industrial Conglomerates - 0.7% | | | | | | | | |
| | 421,500 | | McDermott International, Inc.* | | | 17,405,998 | | | | 22,794,720 | |
| | | | | | | | | | | | |
| | | | Total Industrials | | | 404,831,625 | | | | 556,070,080 | |
| | | | | | | | | | | | |
| | | | This sector is 37.4% above your Fund’s cost. | | | | | | | | |
| | | | | | | | | |
INFORMATION TECHNOLOGY | | | | | | | | |
| | | | | | | | | | | | |
| | | | Application Software - 2.0% | | | | | | | | |
| | 1,504,900 | | Adobe Systems Inc.* | | | 62,756,687 | | | | 65,703,934 | |
| | | | | | | | | | | | |
| | | | Communications Equipment - 7.0% | | | | | | | | |
| | 4,501,700 | | Cisco Systems Inc.* | | | 126,337,683 | | | | 149,051,287 | |
| | 3,365,700 | | Corning Inc. | | | 77,684,511 | | | | 82,964,505 | |
| | | | | | | | | | | | |
| | | | Computer Hardware - 7.4% | | | | | | | | |
| | 1,061,700 | | Apple, Inc.* | | | 127,799,787 | | | | 163,013,418 | |
| | 1,636,700 | | Hewlett-Packard Co. | | | 54,108,315 | | | | 81,491,293 | |
| | | | | | | | | | | | |
| | | | Computer Storage & Peripherals - 4.2% | | | | | | | | |
| | 3,881,700 | | EMC Corp.* | | | 76,558,005 | | | | 80,739,360 | |
| | 1,069,700 | | SanDisk Corp.* | | | 57,879,247 | | | | 58,940,470 | |
| | | | | | | | | | | | |
| | | | Data Processing & Outsourced Services - 1.8% | | | | | | | | |
| | 1,348,400 | | Fidelity National | | | | | | | | |
| | | | Information Services, Inc. | | | 53,401,562 | | | | 59,828,508 | |
| | | | | | | | | | | | |
| | | | Internet Software & Services - 2.2% | | | | | | | | |
| | 2,191,800 | | VeriSign, Inc.* | | | 71,186,967 | | | | 73,951,332 | |
| | | | | | | | | | | | |
| | | | Semiconductors - 4.1% | | | | | | | | |
| | 3,373,900 | | Intel Corp. | | | 83,590,918 | | | | 87,249,054 | |
| | 1,371,700 | | NVIDIA Corp.* | | | 27,603,916 | | | | 49,710,408 | |
Brandywine Blue Fund
Statement of Net Assets (Continued)
September 30, 2007
Shares or | | | | | | | | |
Principal | | | | | | | | |
Amount | | | | Cost | | | Value | |
| | | | | | | | | |
Common Stocks - 91.0% (a) (Continued) | | | | | | |
| | | | | | | | | |
| | | Systems Software - 3.7% | | | | | | |
| | 5,597,000 | | Oracle Corp.* | | $ | 100,409,462 | | | $ | 121,175,050 | |
| | | | | | | | | | | | |
| | | | Total Information Technology | | | 919,317,060 | | | | 1,073,818,619 | |
| | | | | | | | | | | | |
| | | | This sector is 16.8% above your Fund’s cost. | | | | | | | | |
| | | | | | | | | |
MATERIALS | | | | | | | | |
| | | | | | | | | | | | |
| | | | Fertilizers & Agricultural Chemicals - 1.1% | | | | | | | | |
| | 692,700 | | The Mosaic Co.* | | | 27,540,368 | | | | 37,073,304 | |
| | | | | | | | | | | | |
| | | | Total Materials | | | 27,540,368 | | | | 37,073,304 | |
| | | | | | | | | | | | |
| | | | This sector is 34.6% above your Fund’s cost. | | | | | | | | |
| | | | | | | | | |
TELECOMMUNICATION SERVICES | | | | | | | | |
| | | | | | | | | | | | |
| | | | Integrated Telecommunication Services - 2.4% | | | | | | | | |
| | 1,856,000 | | AT&T Inc. | | | 72,169,212 | | | | 78,527,360 | |
| | | | | | | | | | | | |
| | | | Wireless Telecommunication Services - 1.6% | | | | | | | | |
| | 1,273,000 | | Crown Castle International Corp.* | | | 44,487,524 | | | | 51,721,990 | |
| | | | | | | | | | | | |
| | | | Total Telecommunication Services | | | 116,656,736 | | | | 130,249,350 | |
| | | | | | | | | | | | |
| | | | This sector is 11.7% above your Fund’s cost. | | | | | | | | |
| | | | | | | | | | | | |
| | | | Total common stocks | | | 2,575,966,799 | | | | 3,005,537,312 | |
| | | | | | | | | | | | |
Short-Term Investments - 9.8% (a) | | | | | | | | |
| | | | | | | | | | | | |
| | | | Federal Agencies - 9.7% | | | | | | | | |
| $ | 321,000,000 | | Federal Home Loan Bank, | | | | | | | | |
| | | | due 10/01/07, | | | | | | | | |
| | | | discount of 4.00% | | | 321,000,000 | | | | 321,000,000 | |
| | | | | | | | | | | | |
| | | | Variable Rate Demand Note - 0.1% | | | | | | | | |
| | 3,241,134 | | U.S. Bank, N.A., 4.88% | | | 3,241,134 | | | | 3,241,134 | |
| | | | | | | | | | | | |
| | | | Total short-term investments | | | 324,241,134 | | | | 324,241,134 | |
| | | | | | | | | | | | |
| | | | Total investments | | $ | 2,900,207,933 | | | | 3,329,778,446 | |
| | | | | | | | | | | | |
| | | | Liabilities, less cash and | | | | | | | | |
| | | | receivables (0.8%) (a) | | | | | | | (25,497,584 | ) |
| | | | | | | | | | | | |
| | | | Net Assets | | | | | | $ | 3,304,280,862 | |
| | | | | | | | | | | | |
| | | | Net Asset Value Per Share | | | | | | | | |
| | | | ($0.01 par value, 100,000,000 | | | | | | | | |
| | | | shares authorized), offering | | | | | | | | |
| | | | and redemption price | | | | | | | | |
| | | | ($3,304,280,862 ÷ 86,547,715 | | | | | | | | |
| | | | shares outstanding) | | | | | | $ | 38.18 | |
* Non-dividend paying security.
(a) Percentages for the various classifications relate to net assets.
ADR - American Depositary Receipts
The accompanying notes to financial statements are an integral part of this statement.
Statement of Operations
For the Year Ended September 30, 2007
Income: | | | |
| Dividends | | $ | 18,879,637 | |
| Interest | | | 6,973,004 | |
| Total income | | | 25,852,641 | |
| | | | | |
Expenses: | | | | |
| Management fees | | | 24,462,505 | |
| Transfer agent fees | | | 1,596,391 | |
| Printing and postage expense | | | 542,175 | |
| Registration fees | | | 213,601 | |
| Administrative and accounting services | | | 197,739 | |
| Custodian fees | | | 137,810 | |
| Board of Directors fees and expenses | | | 87,677 | |
| Professional fees | | | 57,745 | |
| Insurance expense | | | 48,690 | |
| Other expenses | | | 9,756 | |
| Total expenses | | | 27,354,089 | |
Net Investment Loss | | | (1,501,448 | ) |
Net Realized Gain on Investments | | | 310,831,452 | |
Net Increase in Unrealized Appreciation on Investments | | | 291,276,771 | |
Net Gain on Investments | | | 602,108,223 | |
Net Increase in Net Assets Resulting From Operations | | $ | 600,606,775 | |
Statements of Changes in Net Assets
For the Years Ended September 30, 2007 and 2006
| | | 2007 | | | 2006 | |
Operations: | | | | | | |
| Net investment loss | | $ | (1,501,448 | ) | | $ | (245,481 | ) |
| Net realized gain on investments | | | 310,831,452 | | | | 63,165,548 | |
| Net increase (decrease) in unrealized appreciation on investments | | | 291,276,771 | | | | (6,301,103 | ) |
| Net increase in net assets resulting from operations | | | 600,606,775 | | | | 56,618,964 | |
| | | | | | | | | |
Distributions to Shareholders: | | | | | | | | |
| Distributions from net realized gains ($1.09995 and $1.13878 per share, respectively) | | | (67,271,293 | ) | | | (46,370,407 | ) |
| | | | | | | | | |
Fund Share Activities: | | | | | | | | |
| Proceeds from shares issued (37,213,824 and 28,256,976 shares, respectively) | | | 1,262,161,344 | | | | 862,455,609 | |
| Net asset value of shares issued in distributions reinvested (1,820,755 and 1,398,550 shares, respectively) | | | 57,780,654 | | | | 38,795,788 | |
| Cost of shares redeemed (12,076,689 and 9,349,252 shares, respectively) | | | (405,492,302 | ) | | | (285,940,533 | ) |
| Net increase in net assets derived from Fund share activities | | | 914,449,696 | | | | 615,310,864 | |
Total Increase | | | 1,447,785,178 | | | | 625,559,421 | |
| | | | | | | | | |
Net Assets at the Beginning of the Year | | | 1,856,495,684 | | | | 1,230,936,263 | |
Net Assets at the End of the Year | | | | | | | | |
| (Includes accumulated net investment loss of $0 and $0, respectively) | | $ | 3,304,280,862 | | | $ | 1,856,495,684 | |
The accompanying notes to financial statements are an integral part of these statements.
Brandywine Blue Fund
Financial Highlights
(Selected data for each share of the Fund outstanding throughout each year)
| | | Years Ended September 30, | |
| | | | | | | | | | | | | | | | |
| | | 2007 | | | 2006 | | | 2005 | | | 2004 | | | 2003 | |
| PER SHARE OPERATING PERFORMANCE: | | | | | | | | | | | | | | | |
| Net asset value, beginning of year | | $ | 31.15 | | | $ | 31.33 | | | $ | 25.21 | | | $ | 21.40 | | | $ | 18.30 | |
| | | | | | | | | | | | | | | | | | | | | |
| Income from investment operations: | | | | | | | | | | | | | | | | | | | | |
Net investment loss(1) | | | (0.02 | ) | | | (0.00 | )* | | | (0.04 | ) | | | (0.08 | ) | | | (0.08 | ) |
| Net realized and unrealized gains | | | | | | | | | | | | | | | | | | | | |
| on investments | | | 8.15 | | | | 0.96 | | | | 6.16 | | | | 3.89 | | | | 3.18 | |
| Total from investment operations | | | 8.13 | | | | 0.96 | | | | 6.12 | | | | 3.81 | | | | 3.10 | |
| | | | | | | | | | | | | | | | | | | | | |
| Less distributions: | | | | | | | | | | | | | | | | | | | | |
| Dividend from net investment income | | | — | | | | — | | | | — | | | | — | | | | — | |
| Distributions from net realized gains | | | (1.10 | ) | | | (1.14 | ) | | | — | | | | — | | | | — | |
| Total from distributions | | | (1.10 | ) | | | (1.14 | ) | | | — | | | | — | | | | — | |
| Net asset value, end of year | | $ | 38.18 | | | $ | 31.15 | | | $ | 31.33 | | | $ | 25.21 | | | $ | 21.40 | |
| | | | | | | | | | | | | | | | | | | | | |
| TOTAL RETURN | | | 26.82 | % | | | 3.47 | % | | | 24.28 | % | | | 17.80 | % | | | 16.94 | % |
| | | | | | | | | | | | | | | | | | | | | |
| RATIOS/SUPPLEMENTAL DATA: | | | | | | | | | | | | | | | | | | | | |
| Net assets, end of year (in 000’s $) | | | 3,304,281 | | | | 1,856,496 | | | | 1,230,936 | | | | 531,516 | | | | 312,726 | |
| Ratio of expenses to average net assets | | | 1.12 | % | | | 1.10 | % | | | 1.12 | % | | | 1.13 | % | | | 1.14 | % |
| Ratio of net investment loss | | | | | | | | | | | | | | | | | | | | |
| to average net assets | | | (0.06 | %) | | | (0.02 | %) | | | (0.13 | %) | | | (0.32 | %) | | | (0.41 | %) |
| Portfolio turnover rate | | | 184.5 | % | | | 207.0 | % | | | 180.5 | % | | | 247.4 | % | | | 300.0 | % |
| (1) | Net investment loss per share was calculated using average shares outstanding. |
| * | Amount less than $0.005 per share. |
The accompanying notes to financial statements are an integral part of this statement.
The Brandywine Funds
Notes to Financial Statements
September 30, 2007
(1) | Summary of Significant Accounting Policies |
| The following is a summary of significant accounting policies of Brandywine Fund, Inc. (the “Brandywine Fund”) and Brandywine Blue Fund (the “Blue Fund,” one of two Funds in a series of the Brandywine Blue Fund, Inc.) (collectively the “Brandywine Funds” or the “Funds”). Each Fund is registered as a diversified open-end management company under the Investment Company Act of 1940, as amended. The assets and liabilities of each Fund are segregated and a shareholder’s interest is limited to the Fund in which the shareholder owns shares. The Brandywine Fund was incorporated under the laws of Maryland on October 9, 1985. The Blue Fund was incorporated under the laws of Maryland on November 13, 1990. The investment objective of each Fund is to produce long-term capital appreciation principally through investing in common stocks. |
| | (a) | Each security, excluding short-term investments, is valued at the last sale price reported by the principal security exchange on which the issue is traded. Securities that are traded on the Nasdaq Markets are valued at the Nasdaq Official Closing Price, or if no sale is reported, the latest bid price. Securities which are traded over-the-counter are valued at the latest bid price. Securities for which quotations are not readily available are valued at fair value as determined by the investment adviser under the supervision of the Board of Directors. The fair value of a security may differ from the last quoted price and the Fund may not be able to sell a security at the fair value. Market quotations may not be available, for example, if trading in particular securities has halted during the day and not resumed prior to the close of trading on the New York Stock Exchange. Short-term investments with maturities of 60 days or less are valued at amortized cost which approximates value. For financial reporting purposes, investment transactions are recorded on the trade date; however, for purposes of executing shareholder transactions, the Funds record changes in holdings of portfolio securities no later than the first business day after the trade date in accordance with Rule 2a-4 of the Investment Company Act. Accordingly, certain differences between net asset value for financial reporting and for executing shareholder transactions may arise. |
| | | |
| | | In September 2006, the Financial Accounting Standards Board (“FASB”) issued Statement of Financial Accounting Standards (“SFAS”) No. 157, “Fair Value Measurements.” This standard establishes a single authoritative definition of fair value, sets out a framework for measuring fair value and requires additional disclosures about fair value measurements. SFAS No. 157 applies to fair value measurements already required or permitted by existing standards. SFAS No. 157 is effective for financial statements issued for fiscal years beginning after November 15, 2007 and interim periods within those fiscal years. The changes to current generally accepted accounting principles from the application of this standard relate to the definition of fair value, the methods |
The Brandywine Funds
Notes to Financial Statements (Continued)
September 30, 2007
(1) | Summary of Significant Accounting Policies (Continued) |
| | | used to measure fair value, and the expanded disclosures about fair value measurements. The Funds do not believe the adoption of SFAS No. 157 will impact the financial statement amounts; however, additional disclosures may be required about the inputs used to develop the measurements and the effect of certain of the measurements included within the Statement of Operations for the period. |
| | | |
| | (b) | Net realized gains and losses on sales of securities are computed on the identified cost basis. |
| | | |
| | (c) | Dividend income is recorded on the ex-dividend date. Interest income is recorded on the accrual basis. |
| | | |
| | (d) | The Funds have investments in short-term variable rate demand notes, which are unsecured instruments. The Funds may be susceptible to credit risk with respect to these notes to the extent the issuer defaults on its payment obligation. The Funds’ policy is to monitor the creditworthiness of the issuer and nonperformance by these counterparties is not anticipated. |
| | | |
| | (e) | Accounting principles generally accepted in the United States of America (“GAAP”) require that permanent differences between income for financial reporting and tax purposes be reclassified in the capital accounts. |
| | | |
| | (f) | The preparation of financial statements in conformity with GAAP requires management to make estimates and assumptions that affect the reported amounts of assets and liabilities and disclosure of contingent assets and liabilities at the date of the financial statements and the reported amounts of revenues and expenses during the reporting period. Actual results could differ from these estimates. |
| | | |
| | (g) | No provision has been made for Federal income taxes since the Funds have elected to be taxed as “regulated investment companies” and intend to distribute substantially all net investment company taxable income and net capital gains to shareholders and otherwise comply with the provisions of the Internal Revenue Code applicable to regulated investment companies. |
| | | |
| | | On July 13, 2006, the FASB released FASB Interpretation No. 48 “Accounting for Uncertainty in Income Taxes” (“FIN 48”). FIN 48 provides guidance for how uncertain tax positions should be recognized, measured, presented and disclosed in the financial statements. FIN 48 requires the evaluation of tax positions taken or expected to be taken in the course of preparing the Funds’ tax returns to determine whether the tax positions are “more-likely-than-not” of being sustained by the applicable tax authority. Tax positions not deemed to meet the more-likely-than-not threshold would be recorded as a tax benefit or expense in the current year. Adoption of FIN 48 is required for fiscal years beginning after December 15, 2006 and is to be applied to all open tax years as of the effective date. Recent SEC guidance allows funds to delay implementing FIN 48 into NAV calculations until the fund’s last NAV calculations in the first required financial statement reporting period. As a result, the Funds must begin to incorporate FIN 48 into their NAV calculations by March 31, 2008. At this time, management is continuing to evaluate the implications of FIN 48 and does not expect the adoption of FIN 48 will have a significant impact on the net assets or results of operations of the Funds. |
(2) | Investment Adviser and Management Agreements and Transactions With Related Parties |
| Each Fund has a management agreement with Friess Associates, LLC (the “Adviser”), with whom certain Officers and Directors of the Funds are affiliated, to serve as investment adviser and manager. Under the terms of the agreements, each Fund will pay the Adviser a monthly management fee at the annual rate of one percent (1%) on the daily net assets of such Fund. Also, the Adviser is reimbursed for administrative services rendered to each Fund by a consultant paid by the Adviser. |
| The Adviser entered into sub-advisory agreements with its affiliate, Friess Associates of Delaware, LLC (the “Sub-Adviser”), to assist it in the day-to-day management of each of the Funds. The Adviser and, if so delegated, the Sub-Adviser supervise the investment portfolios of the Funds, directing the purchase and sale of investment securities in the day-to-day management of the Funds. The Adviser pays the Sub-Adviser a fee equal to 110% of the monthly expenses the Sub-Adviser incurs in performing its services as Sub-Adviser. This relationship does not increase the annual management fee the Funds pay to the Adviser. |
| The Brandywine Fund and Blue Fund pay each of the six independent directors annual fees of $25,000 and $16,000 each, respectively, reinvested in shares of each Fund. The lead independent director and chairman of the audit committee are paid an additional $5,000 annually reinvested in shares of the Funds, divided proportionately among all the Brandwine Funds. The Funds also reimburse directors for travel costs incurred in order to attend meetings of the Board of Directors. For the year ended September 30, 2007, the Funds expensed the following directors fees and costs: |
| | | Brandywine | | | Blue | |
| | | Fund | | | Fund | |
| Directors Fees and Travel Costs Paid during the Period | | $ | 149,232 | | | $ | 87,677 | |
| In the normal course of business the Funds enter into contracts with service providers that contain general indemnification clauses. The Funds’ maximum exposure under these arrangements is unknown as this would involve future claims that may be made against the Funds that have not yet occurred. However, based on experience, the Funds expect the risk of loss to be remote. |
The Brandywine Funds
Notes to Financial Statements (Continued)
September 30, 2007
| U.S. Bank, N.A. has made available to each Fund a credit facility pursuant to Credit Agreements effective July 22, 2004, for the purpose of having cash available to cover incoming redemptions. The Brandywine Fund has a $50,000,000 credit facility and the Blue Fund has a $10,000,000 credit facility. Principal and interest of such loan under the Credit Agreements are due not more than 31 days after the date of the loan. Amounts under the credit facilities bear interest at a rate per annum equal to the current prime rate minus one on the amount borrowed. Advances will be collateralized by securities owned by the respective Fund. During the year ended September 30, 2007, neither Fund borrowed against their Agreement. The Credit Agreements expire on December 18, 2007. |
(4) | Distributions to Shareholders |
| Net investment income and net realized gains, if any, are distributed to shareholders at least annually. The Board of Directors has approved a distribution of net realized gains on October 30, 2007 for the Brandywine Fund and Blue Fund to shareholders of record on October 29, 2007. These distributions, which are subject to change, are expected to be $328,980,521 and $98,277,540 from net long-term gains and $194,746,634 and $206,976,452 from net short-term capital gains, respectively. |
(5) | Investment Transactions and Related Costs |
| For the year ended September 30, 2007, purchases and proceeds of sales of investment securities (excluding short-term investments) for the Funds were as follows: |
| | | | | | Sale | | | Transaction | | | Ratio of Cost to | |
| | | Purchases | | | Proceeds | | | Cost | | | Average Net Assets | |
| Brandywine Fund | | $ | 6,871,627,774 | | | $ | 7,381,545,340 | | | $ | 16,766,669 | | | | 0.38 | % |
| Blue Fund | | | 4,851,259,971 | | | | 4,247,253,746 | | | | 9,990,576 | | | | 0.41 | |
| Transaction cost represents the total commissions paid by each Fund on its respective purchases and sales of investment securities. These costs are added to the cost basis of the securities purchased and are deducted from the proceeds of securities sold, thereby reducing the realized gains or increasing the realized losses upon the sale of the securities. |
(6) | Accounts Payable and Accrued Liabilities |
| As of September 30, 2007, liabilities of each Fund included the following: |
| | | Brandywine | | | Blue | |
| | | Fund | | | Fund | |
| Payable to brokers for investments purchased | | $ | 60,788,809 | | | $ | 96,597,668 | |
| Payable to Adviser for management fees | | | 3,873,036 | | | | 2,562,059 | |
| Payable to shareholders for redemptions | | | 29,760 | | | | 253,979 | |
| Other liabilities | | | 419,266 | | | | 471,552 | |
| As of September 30, 2007, the sources of net assets were as follows: |
| Fund shares issued and outstanding | | $ | 3,394,745,225 | | | $ | 2,569,906,202 | |
| Net unrealized appreciation on investments | | | 935,915,541 | | | | 429,570,513 | |
| Accumulated net realized gains | | | 520,606,847 | | | | 304,804,147 | |
| | | $ | 4,851,267,613 | | | $ | 3,304,280,862 | |
(8) | Income Tax Information |
| The following information for the Funds is presented on an income tax basis as of September 30, 2007: |
| | | | | | Gross | | | Gross | | | Net Unrealized | | | Distributable | | | Distributable | |
| | | Cost of | | | Unrealized | | | Unrealized | | | Appreciation | | | Ordinary | | | Long-Term | |
| | | Investments | | | Appreciation | | | Depreciation | | | on Investments | | | Income | | | Capital Gains | |
| Brandywine Fund | | $ | 3,881,029,985 | | | $ | 979,008,687 | | | $ | 46,213,454 | | | $ | 932,795,233 | | | $ | 194,746,634 | | | $ | 328,980,521 | |
| Blue Fund | | | 2,900,657,778 | | | | 436,756,820 | | | | 7,636,152 | | | | 429,120,668 | | | $ | 206,976,452 | | | $ | 98,277,540 | |
| The difference, if any, between the cost amounts for financial statement and federal income tax purposes is due primarily to timing differences in recognizing certain gains and losses in security transactions. |
The Brandywine Funds
Notes to Financial Statements (Continued)
September 30, 2007
(8) | Income Tax Information (Continued) |
| The tax components of dividends paid during the years ended September 30, 2007 and 2006, capital loss carryovers, which may be used to offset future capital gains, subject to Internal Revenue Code limitations as of September 30, 2007, and tax basis post-October losses as of September 30, 2007, which are not recognized for tax purposes until the first day of the following fiscal year are: |
| | | September 30, 2007 | | | September 30, 2006 | |
| | | Ordinary | | | Long-Term | | | Net Capital | | | | | | Ordinary | | | Long-Term | |
| | | Income | | | Capital Gains | | | Loss | | | Post-October | | | Income | | | Capital Gains | |
| | | Distributions | | | Distributions | | | Carryovers | | | Losses | | | Distributions | | | Distributions | |
| Brandywine Fund | | $ | — | | | $ | 30,419,122 | | | $ | — | | | $ | — | | | $ | — | | | $ | — | |
| Blue Fund | | | 19,042,368 | | | | 48,228,925 | | | $ | — | | | $ | — | | | $ | 35,062,637 | | | $ | 11,307,770 | |
| For corporate shareholders in the Blue Fund, the percentage of dividend income distributed for the year ended September 30, 2007, which is designated as qualifying for the dividends received deduction is 67% (unaudited). |
| For the shareholders in the Blue Fund, the percentage of dividend income distributed for the year ended September 30, 2007, which is designated as qualified dividend income under the Jobs and Growth Tax Relief Act of 2003 is 67% (unaudited). |
| Since there were no ordinary distributions paid for the Brandywine Fund for the year ended September 30, 2007, there were no distributions designated as qualifying for the dividends received deduction for corporate shareholders nor as qualified dividend income under the Jobs and Growth Tax Relief Act of 2003 (unaudited). |
REPORT OF INDEPENDENT REGISTERED PUBLIC ACCOUNTING FIRM
To the Board of Directors and Shareholders
of Brandywine Fund, Inc. and Brandywine Blue Fund
In our opinion, the accompanying statements of net assets and the related statements of operations and of changes in net assets and the financial highlights present fairly, in all material respects, the financial position of Brandywine Fund, Inc. and Brandywine Blue Fund (a series of the Brandywine Blue Fund, Inc.) (the “Funds”) at September 30, 2007, the results of each of their operations for the year then ended, the changes in each of their net assets for each of the two years in the period then ended and the financial highlights for each of the five years in the period then ended, in conformity with accounting principles generally accepted in the United States of America. These financial statements and financial highlights (hereafter referred to as “financial statements”) are the responsibility of the Funds’ management; our responsibility is to express an opinion on these financial statements based on our audits. We conducted our audits of these financial statements in accordance with the standards of the Public Company Accounting Oversight Board (United States). Those standards require that we plan and perform the audit to obtain reasonable assurance about whether the financial statements are free of material misstatement. An audit includes examining, on a test basis, evidence supporting the amounts and disclosures in the financial statements, assessing the accounting principles used and significant estimates made by management, and evaluating the overall financial statement presentation. We believe that our audits, which included confirmation of securities at September 30, 2007 by correspondence with the custodian and brokers, provide a reasonable basis for our opinion.

Milwaukee, Wisconsin
October 12, 2007
Cost Discussion
Mutual fund shareholders incur two types of costs: (1) transaction costs, including sales charges (loads) on purchase payments, reinvested dividends, or other distributions; redemption fees; and exchange fees; and (2) ongoing costs, including management fees; distribution [and/or service] (12b-1) fees; and other fund expenses. Brandywine and Brandywine Blue do not have 12b-1 distribution fees. This example is intended to help you understand your ongoing costs (in dollars) of investing in the Brandywine Funds and to compare these costs with the ongoing costs of investing in other mutual funds.
In addition to the costs highlighted and described below, the only Fund transaction costs you might currently incur would be wire fees ($15 per wire), if you choose to have proceeds from a redemption wired to your bank account instead of receiving a check. Additionally, U.S. Bank charges an annual processing fee ($15) if you maintain an IRA account with the Funds. To determine your total costs of investing in the Funds, you would need to add any applicable wire or IRA processing fees you’ve incurred during the period to the costs provided in the example below.
The example is based on an investment of $1,000 invested at the beginning of the period and held for the entire period from April 1, 2007 through September 30, 2007.
Actual Expenses
The first line of the table below provides information about actual account values and actual expenses. You may use the information in this line, together with the amount you invested, to estimate the expenses that you paid over the period. Simply divide your account value by $1,000 (for example, an $8,600 account value divided by $1,000 = 8.6), then multiply the result by the number in the first line under the heading entitled “Expenses Paid During Period” to estimate the expenses you paid on your account during this period.
Hypothetical Example for Comparison Purposes
The second line of the table below provides information about hypothetical account values and hypothetical expenses based on the Fund’s actual expense ratio and an assumed rate of return of 5% per year before expenses, which is not the Fund’s actual return. The hypothetical account values and expenses may not be used to estimate the actual ending account balance or expenses you paid for the period. You may use this information to compare the ongoing costs of investing in the Fund and other funds. To do so, compare this 5% hypothetical example with the 5% hypothetical examples that appear in the shareholder reports of the other funds.
Please note that the expenses shown in the table are meant to highlight your ongoing costs only and do not reflect any transactional costs. While the Brandywine Funds currently do not assess sales charges, redemption or exchange fees, other funds do, and those costs will not be reflected in their expense example tables. Therefore, the second line of the table is useful in comparing ongoing costs only, and will not help you determine the relative total costs of owning different funds.
| | Beginning | Ending | |
| | Account | Account | Expenses Paid |
| | Value | Value | During Period* |
| | 4/01/07 | 9/30/07 | 4/01/07-9/30/07 |
| Brandywine Actual | $1,000.00 | $1,160.90 | $5.85 |
| Hypothetical (5% return before expenses) | $1,000.00 | $1,019.70 | $5.47 |
| Brandywine Blue Actual | $1,000.00 | $1,176.60 | $6.11 |
| Hypothetical (5% return before expenses) | $1,000.00 | $1,019.50 | $5.67 |
| * | Expenses are equal to the Funds’ annualized expense ratios of 1.08% and 1.12%, multiplied by the average account value over the period, multiplied by 183/365 (to reflect the one-half year period between April 1, 2007 and September 30, 2007). |
Additional Director Information, Proxy Voting Policy
and Quarterly Portfolio Schedules
For additional information about the Directors and Officers or for a description of the policies and procedures that the Funds use to determine how to vote proxies relating to portfolio securities, please call (800) 656-3017 and request a Statement of Additional Information. One will be mailed to you free of charge. The Statement of Additional Information is also available on the website of the Securities and Exchange Commission (the “Commission”) at http://www.sec.gov or the Funds’ website at http://www.brandywinefunds.com. Information on how the Funds voted proxies relating to portfolio securities during the twelve month period ending June 30, 2007 is available on the Funds’ website or the website of the Commission. The Funds file their complete schedule of portfolio holdings with the Commission for the first and third quarters of each fiscal year on Form N-Q. The Funds’ Forms N-Q are available on the Commission’s website. The Funds’ Forms N-Q may be reviewed and copied at the Commission’s Public Reference Room in Washington, DC, and that information on the operation of the Public Reference Room may be obtained by calling 1-800-SEC-0330.
Brandywine Fund and Brandywine Blue Fund Directors and Officers
| | | Name, Age, Address | | Position, Term of Office and Length of Time Served and Number of Portfolios in Fund Complex Overseen by Director | | Principal Occupation During Past Five Years | | Other Directorships Held by Director |
| | | | | | | | | |
 | | Robert F. Birch, 71 c/o Friess Associates P.O. Box 4166 Greenville, DE 19807 | | Director Indefinite Term since October, 2001 3 Portfolios | | Mr. Birch has been President and Director of the New America High Income Fund since 1992, a high-yield bond fund traded on the New York Stock Exchange. | | Hyperion Funds (5 portfolios), New America High Income Fund |
| | | | | | | | | |
 | | C. Quentin S. Jackson, 63 c/o Friess Associates P.O. Box 4166 Greenville, DE 19807 | | Lead Independent Director Indefinite Term since October, 2001 3 Portfolios | | Mr. Jackson is retired. He was the President and Chief Executive Officer of Nuclear Electric Insurance Ltd., a multibillion-dollar company mutually owned by energy companies. | | None |
| | | | | | | | | |
| | Stuart A. McFarland, 60 c/o Friess Associates P.O. Box 4166 Greenville, DE 19807 | | Director Indefinite Term since October, 2001 Audit Committee Chairman, since June 2004 3 Portfolios | | Mr. McFarland is Managing Partner of Federal City Capital Advisors, LLC and Deep Springs Capital Partners, LLC, a merchant bank. He was the Chairman of the Federal City Bancorp, a thrift holding company from April 2004 until June 2007. | | Hyperion Funds (5 portfolios),Newcastle Investment Corporation |
| | | | | | | | | |
 | | W. Richard Scarlett III, 68 c/o Friess Associates P.O. Box 4166 Greenville, DE 19807 | | Director Indefinite Term since October, 2001 3 Portfolios | | Mr. Scarlett is Chairman and Chief Executive Officer of United Bancorporation of Wyoming, Inc., having been with the Bank since 1981. | | United Bancorporation of Wyoming, Inc. |
| | | | | | | | | |
 | | Thomas D. Wren, 55 c/o Friess Associates P.O. Box 4166 Greenville, DE 19807 | | Director Indefinite Term since June, 2006 3 Portfolios | | Mr. Wren is a senior advisor for Promontory Financial Group, LLC. He was the Treasurer of MBNA Corporation and its MBNA America Bank, N.A. subsidiary from 1995 to 2006. | | ACM Financial Trust, Inc. |
| | | | | | | | | |
 | | James W. Zug, 67 c/o Friess Associates P.O. Box 4166 Greenville, DE 19807 | | Director Indefinite Term since October, 2001 3 Portfolios | | Mr. Zug is a retired Partner of PricewaterhouseCoopers LLP. He was employed with PricewaterhouseCoopers and its predecessors from 1964 until 2000. | | Allianz Funds (34 portfolios), Amkor Technology, Inc. and Teleflex Inc. |
Brandywine Fund and Brandywine Blue Fund Directors and Officers
“Interested Persons” of the Funds* | | Name, Age, Address | | Position, Term of Office and Length of Time Served and Number of Portfolios in Fund Complex Overseen by Director or Officer | | Principal Occupation During Past Five Years | | Other Directorships Held by Director or Officer |
| | | | | | | | | |
 | | William F. D’Alonzo*, 52 c/o Friess Associates P.O. Box 4166 Greenville, DE 19807 | | Director Indefinite Term since October, 2001 President since 2003 Chairman since 2004 3 Portfolios | | Mr. D’Alonzo joined Friess Associates in 1981 as part of the research team, became Chief Investment Officer in 1997 and Chief Executive Officer in 2002. | | None |
| | | | | | | | | |
 | | Foster S. Friess*, 67 c/o Friess Associates P.O. Box 576 Jackson, WY 83001 | | Director Indefinite Term since October, 1985 Founder 3 Portfolios | | Mr. Friess founded Friess Associates in 1974 with his wife, Lynnette E. Friess. He serves as Chairman of the Friess Companies. | | None |
| | | | | | | | | |
 | | Lynda J. Campbell*, 61 c/o Friess Associates P.O. Box 4166 Greenville, DE 19807 | | Vice President since 1998 Secretary since 1990 3 Portfolios | | Ms. Campbell joined Friess Associates in 1985, the year of Brandywine Fund’s inception. Ms. Campbell is currently Chief Administrative Officer of the Friess Companies. | | None |
| | | | | | | | | |
 | | Christopher G. Long*, 41 c/o Friess Associates P.O. Box 4166 Greenville, DE 19807 | | Vice President since 2002 Treasurer since 2003 3 Portfolios | | Mr. Long joined Friess Associates in 1996. He is currently Chief Operating Officer and Chief Financial Officer of the Friess Companies. | | None |
| | | | | | | | | |
 | | David D. Marky*, 42 c/o Friess Associates P.O. Box 4166 Greenville, DE 19807 | | Vice President since 2002 Chief Compliance Officer since 2004 3 Portfolios | | Mr. Marky joined Friess Associates in 2000. He currently serves as Chief Compliance Officer for the Friess Companies. | | None |
| | | | | | | | | |
 | | Paul R. Robinson*, 84 c/o Friess Associates P.O. Box 4166 Greenville, DE 19807 | | Vice President since 1990 3 Portfolios | | Mr. Robinson has been a consultant to Friess Associates, LLC since June 1985, just six months before Brandywine Fund’s launch. | | None |
For additional information about the Directors and Officers, please call (800) 656-3017 and request a Statement of Additional Information. One will be mailed to you free of charge.
* | Messrs. D’Alonzo, Friess, Long, Marky and Robinson and Ms. Campbell are “interested persons” of the Funds as that term is defined in the Investment Company Act of 1940 by reason of their being officers of the Funds and employees of Friess Associates, LLC. |
| “It’s a strategy that has paid off in recent years even as large caps have lagged smaller and more value-oriented stocks. The fund has bested both the Standard & Poor’s 500 and its large-cap peers in four of the past five years…Investors hunting for solid returns and diversified large-cap exposure would do well to take a look at Brandywine Blue.” |
Financial Planning, “Happy Hunting: Bill D’Alonzo snares “marge-cap” names for the Brandywine Blue Fund,” October 1, 2007 |
Capital Gains Update . . . |
| The Brandywine Funds will make October capital gains distributions. The distributions are based on gains realized during the fiscal year ended September 30, and will be made October 30 to shareholders of record as of October 29. |
| For Brandywine, gains to be distributed total approximately $4.43 per share, with $2.78 representing long-term gains and $1.65 representing short-term gains. Brandywine Blue will distribute gains totaling approximately $3.45 per share, including $1.11 in long-term gains and $2.34 in short-term gains. |
| Other than shareholders investing through IRAs and other tax-advantaged accounts, the distributions will be taxable to anyone owning shares on the October 29 record date. Please consult your tax adviser if you have questions on how the distributions affects your personal tax situation. |
IRA Investors . . . |
| The annual $15 maintenance fee for shareholders invested through IRA accounts is due on November 9, 2007. For your convenience, US Bancorp will automatically deduct this amount from your IRA on the due date, or if you prefer not to have the fee swept from your account, please send a check to US Bancorp by the due date. |
| P.O. Box 4166, Greenville, DE 19807 |
| (800) 656-3017 | www.brandywinefunds.com | bfunds@friess.com |
Investment Adviser: Friess Associates, LLC | Transfer Agent: U.S. Bancorp Fund Services, LLC |
Investment Sub-Adviser: Friess Associates of Delaware, LLC | Independent Registered Public Accounting Firm: PricewaterhouseCoopers LLP |
Custodian: U.S. Bank, N.A. | Legal Counsel: Foley & Lardner LLP |
Officers: Foster Friess, Founder; William D’Alonzo, Chairman and President;
Lynda Campbell, Vice President and Secretary; Christopher Long, Vice President and Treasurer;
David Marky, Chief Compliance Officer, Vice President and Assistant Secretary; and Paul Robinson, Vice President
Report Editor: Chris Aregood Report Staff: Rebecca Buswell, David Marky, Adam Rieger
Item 2. Code of Ethics.
Registrant has adopted a code of ethics. See attached Exhibit 12 (a).
Item 3. Audit Committee Financial Expert.
Registrant’s Board of Directors has determined that 2 members of its audit committee, Mr. Stuart A. McFarland and Mr. Robert F. Birch, are audit committee financial experts. Messrs. McFarland and Birch are “independent” as such term is defined in Form N-CSR.
Item 4. Principal Accountant Fees and Services.
(a) Audit Fees
$31,698 (FY 2007) and $29,850 (FY 2006) are the aggregate fees billed for each of the last two fiscal years for professional services rendered by the principal accountant to the registrant for the audit of the registrant’s annual financial statements or services that are normally provided by the accountant in connection with statutory and regulatory filings or engagements for those fiscal years.
(b) Audit-Related Fees
There were no fees billed in each of the last two fiscal years for Audit-Related Fees.
$6,150 (FY 2007) and $5,900 (FY 2006) are the aggregate fees billed in each of the last two fiscal years for professional services rendered by the principal accountant to the registrant for tax compliance, tax advice, tax planning and tax return preparation.
(d) All Other Fees
There were no fees billed in each of the last two fiscal years for products and services provided by the principal accountant to the registrant, other than the services reported in paragraphs (a) – (c) of this Item 4.
(e) (1) None
(e) (2) None
(f) Not applicable.
(g) $39,925 (FY 2007) and $67,900 (FY 2006) in non-audit fees were billed to the registrant’s investment adviser for tax return preparation and AIMR performance verification services.
(h) The Audit Committee of the registrant determined that the non-audit fees billed to the registrant’s investment adviser by the principal accountant disclosed in paragraph (g) of this Item 4, was compatible with maintaining the principal accountant’s independence.
Item 5. Audit Committee of Listed Registrants.
Not applicable.
Item 6. Schedule of Investments.
Not applicable
Item 7. Disclosure of Proxy Voting Policies and Procedures for Closed-End Management Investment Companies
Not applicable.
Item 8. Portfolio Managers of Closed-End Management Investment Companies.
Not applicable.
Item 9. Purchases of Equity Securities By Closed-End Management Investment Company and Affiliated Purchasers.
Not applicable.
Item 10. Submission of Matters to a Vote of Security Holders.
None.
Item 11. Controls and Procedures.
| (a) | The disclosure controls and procedures of the Brandywine Fund, Inc. are periodically evaluated. As of October 25, 2007, the date of the last evaluation, we concluded that our disclosure controls and procedures are adequate. |
| (b) | The internal controls of the Brandywine Fund, Inc. are periodically evaluated. There were no changes to Brandywine Fund’s internal control over financial reporting that occurred during the second fiscal quarter of the period covered by this report that have materially affected, or are reasonably likely to materially affect, such controls. |
Item 12. Exhibits.
(a) | Any code of ethics or amendment thereto. Filed herewith. |
(b) | Certifications pursuant to Section 302 of the Sarbanes-Oxley Act of 2002. Filed herewith. |
(c) | Certification pursuant to Section 906 of the Sarbanes-Oxley Act of 2002. Filed herewith. |
SIGNATURES
Pursuant to the requirements of the Securities Exchange Act of 1934 and the Investment Company Act of 1940, the registrant has duly caused this report to be signed on its behalf by the undersigned, thereunto duly authorized.
Brandywine Fund, Inc.
Registrant
By /s/William F. D’Alonzo
William F. D’Alonzo Principal Executive Officer
Date October 26, 2007
Pursuant to the requirements of the Securities Exchange Act of 1934 and the Investment Company Act of 1940, this report has been signed below by the following persons on behalf of the registrant and in the capacities and on the dates indicated.
Brandywine Fund, Inc.
Registrant
By /s/Christopher G. Long
Christopher G. Long, Principal Financial Officer
Date October 26, 2007