UNITED STATES
SECURITIES AND EXCHANGE COMMISSION
Washington, D.C. 20549
FORM N-CSR
CERTIFIED SHAREHOLDER REPORT OF REGISTERED
MANAGEMENT INVESTMENT COMPANIES
Investment Company Act file number 811-04447
Brandywine Fund, Inc.
(Exact name of registrant as specified in charter)
P.O. Box 4166
Greenville, DE 19807
(Address of principal executive offices) (Zip code)
William F. D’Alonzo
P.O. Box 4166
Greenville, Delaware 19807
(Name and address of agent for service)
(302) 656-3017
Registrant's telephone number, including area code:
Date of fiscal year end: September 30
Date of reporting period: September 30, 2010
Item 1. Reports to Stockholders.
| Managed by Friess Associates, LLC | Annual Report | September 30, 2010 |
Dear Fellow Shareholders:
After a seesaw start that left indexes mostly unchanged two months into the quarter, stocks sprang back to life in September. The month’s run helped end what until that point was a September-quarter drought in relative performance terms, with the Brandywine Funds turning the tables on indexes in the wake of the relentlessly macro-directed action of July and August.
Brandywine Fund grew 12.75 percent in the month of September, outpacing gains in the Russell 3000 and Russell 3000 Growth Indexes of 9.44 and 10.92 percent. Brandywine Blue Fund grew 11.07 percent versus gains in the S&P 500, Russell 1000 and Russell 1000 Growth Indexes of 8.92, 9.19 and 10.65 percent.
As for the September quarter as a whole, gains were widespread, but index-beating results proved hard to produce for investors focused on actual earnings trends. Brandywine grew 9.12 percent during the quarter as the Russell 3000 and Russell 3000 Growth Indexes gained 11.53 and 12.98 percent. Brandywine Blue grew 9.83 percent for the quarter. The S&P 500, Russell 1000 and Russell 1000 Growth Indexes gained 11.29, 11.55 and 13.00 percent.
Diverging from the solidly established historical norm, positive earnings surprises during the second-quarter reporting season failed to generate their usual positive reaction relative to the broader market. Stock prices were highly correlated amid cautious economic optimism in July before economic sentiment soured in August, when correlation spiked to levels associated with past panics.
Correlation, which measures the degree to which stocks move together, tends to rise as investors judge stocks as a group based on broad themes. With investors focused on housing stats, unemployment numbers, foreign banks, currencies and other macro factors in the heart of reporting season, strong earnings won little notice.
Apparent in the September quarter was a pattern that has become familiar this year: market leadership passing from high- to low-risk stocks based on the ebb and flow of macro news.
Investors bought index futures on better-than-expected economic data, snapped up gold ETFs on declines in the dollar and undertook other market-moving actions that had little to do with the individual stocks ultimately affected by their broad bets.
While the market’s fickle, top-down action limited relative performance opportunities, the September quarter was a broadly positive period in the end. Brandywine gained ground in eight of nine economic sectors represented in its portfolio. Brandywine Blue went seven for nine.
| | Brandywine | Brandywine Blue |
| Cumulative Total Return | % Change | % Change |
| Quarter | 9.12 | 9.83 |
| One Year | 4.31 | 5.71 |
| Five Years | -19.17 | -16.71 |
| Ten Years | -13.90 | -1.91 |
| Inception | 968.78* | 499.48** |
Annualized Total Return
| Five Years | -4.17 | -3.59 |
| Ten Years | -1.49 | -0.19 |
| Inception | 10.04* | 9.51** |
| Brandywine | 1.10% |
| Brandywine Blue | 1.16% |
***As stated in the Prospectus dated January 29, 2010
Performance data quoted represent past performance; past performance does not guarantee future results. The investment return and principal value of an investment will fluctuate so that an investor’s shares, when redeemed, may be worth more or less than their original cost. Current performance of the Funds may be lower or higher than the performance quoted. Performance data current to the most recent month end may be obtained by visiting www.brandywinefunds.com.
Energy holdings boosted relative performance for Brandywine and Brandywine Blue as investors finished the quarter tipping back toward economic optimism. For Brandywine, energy holdings represented a smaller position than the energy sector within the Russell 3000 Growth Index while notably outperforming the sector as a whole. Brandywine Blue’s energy holdings outperformed energy companies in the Russell 1000 Growth Index while comprising a larger position than the sector within the index. Cameron International and National Oilwell Varco, which both exceeded earnings expectations in their most recently reported quarters, were standout performers in both Funds.
Other noteworthy contributors included consumer discretionary holdings such as Williams-Sonoma (Brandywine) and DIRECTV (both Funds). Strong existing customer relationships, entry-level price points designed to attract new customers and well-targeted merchandise helped Williams-Sonoma grow July-quarter earnings to $0.31 per share from a nickel last year, topping the consensus estimate by $0.09 per share. DIRECTV set a company record for net subscriber gains in its key growth market, Latin America, helping the company grow June-quarter earnings 50 percent.
Health care holdings weighed the most on performance versus benchmarks. Life Technologies (both Funds) exceeded June-quarter earnings estimates, but declined on concerns about the timeliness of future customer payments amid research funding uncertainty. Investors expected more from Thermo Fisher Scientific (both Funds), which matched June-quarter estimates and reiterated previous guidance for future sales and earnings. In Brandywine, we were right about Covance’s June quarter (beat estimates) but wrong about its full year, which management said would be less profitable than previously forecast due to trends in its toxicology business.
Technology holdings, which on average accounted for the largest percentage of assets in both Funds, posted more muted gains than the sector as a whole. Vistaprint, which was approaching its one-year anniversary in Brandywine, declined sharply when the company reduced earnings guidance only weeks after its CEO predicted that growth in the next 12 months would be greater than 20 percent. Announced at a conference, investors took his word as a major confidence boost at the time. An unsatisfying explanation for the subsequently lowered guidance stoked the market’s negative reaction to the news.
For more information on companies that influenced September-quarter performance, please see Roses & Thorns on page 4 for Brandywine and page 7 for Brandywine Blue.
For much of the September quarter, investors appeared to be unsure and certain at the same time. They were unsure whether to believe in good earnings results while being certain that bad earnings results needed to be punished to extremes. While stocks gained significant ground, that atmosphere was frustrating for companies making solid operational progress and the investors who dedicate themselves to isolating them. Distracted by the macro environment, investors showed little interest in the company-level details.
“More and more investors aren’t bothering to pore through corporate reports searching for gems and duds, but are trading big buckets of stocks, bonds and commodities based mainly on macro concerns. As a result, all kinds of stocks – good as well as bad – are moving more in lock step,” wrote the Wall Street Journal on September 24.
While we strongly agree that was the case for a good part of the quarter, we saw reason for optimism in September, when investors began to take greater notice of companies with solid fundamentals. The shift coincided with a lull in economic chatter brought about by a growing belief that the Federal Reserve would pursue another round of quantitative easing if need be. We’re not saying that Fed action would be a good or a bad thing, but we believe investors appeared more attuned to fundamentals as they increasingly viewed the Fed as providing an economic safety net.
Should investors maintain some sort of equilibrium regarding the economic outlook, we expect the December quarter to host the year’s most fundamentals-friendly environment. One of the year’s biggest sources of uncertainty, midterm elections, will finally be settled. Whatever way the election goes, the market will enjoy greater clarity regarding taxes, health care and a range of other policy matters of key importance to the economy.
On the personnel front, Researcher Brandon Elliott realized a long-held career goal by accepting an offer to become an executive at a public company. Brandon recently joined Consol Energy as Vice President – Investor and Public Relations. We wish him success as he embarks on his new career path.
Thanks for your long-term focus and continued confidence. We’re grateful for your support, and we’re committed to generating results that reward you for it.
 |  |
| Bill D’Alonzo | |
| Brandywine Funds President | October 15, 2010 |
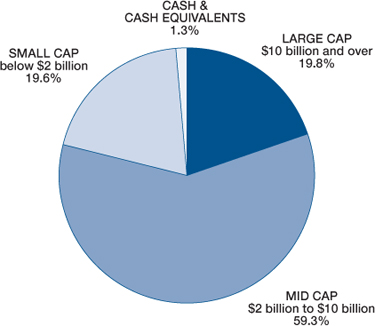
Brandywine Fund
Portfolio Characteristics as of September 30, 2010
% Change in Top Ten Holdings From Book Cost
| 1. | | National Oilwell Varco Inc. | +8.4% | 6. | | Bucyrus International, Inc. | +15.6% |
| 2. | | Williams-Sonoma, Inc. | +43.5% | 7. | | TRW Automotive Holdings Corp. | +15.7% |
| 3. | | Apple Inc. | +31.1% | 8. | | Caterpillar Inc. | +18.3% |
| 4. | | GameStop Corporation | -0.7% | 9. | | Cameron International Corp. | +18.1% |
| 5. | | Albemarle Corp. | +26.4% | 10. | | CarMax, Inc. | +10.8% |
| Estimated Earnings Growth Rate | The Portfolio’s Market Capitalization |
| of the Fund’s Investments | |
| | |
| The Fund’s | S&P 500’s |
| Companies | Companies |
| | |
| 15.7% | 13.7% |
| | |
Forecasted Increase in Earnings Per Share 2011 vs 2010 |
| |
| Source: Consensus estimates from Baseline Financial Services, Inc. |
| |
This is not a forecast of the Fund’s future performance. Earnings growth for a Fund holding does not guarantee a corresponding increase in the market value of the holding or the Fund. As of September 30, 2010, the S&P 500 Index’s average annual total returns for 1, 5 and 10 years were 10.16, 0.64 and -0.43 percent. |
| |
| |
| |
| |
| |
| |
| |
| |
| |
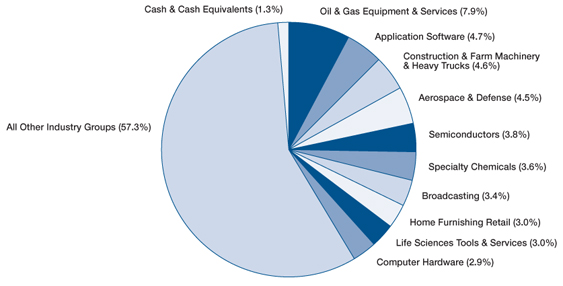
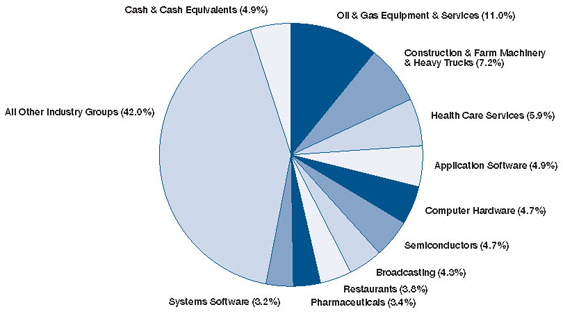
Top Ten Industry Groups
Brandywine Fund
September Quarter “Roses and Thorns”
| | $ Gain | | |
| Biggest $ Winners | (in millions) | % Gain | Reason for Move |
| Williams-Sonoma, Inc. | $11.0 | 24.9 | The retailer operating under the Williams-Sonoma, Pottery Barn and Pottery Barn Kids brands posted a more than five-fold increase in July-quarter earnings, beating estimates by 41 percent. Management raised its October-quarter and full-year guidance. Williams-Sonoma continues to benefit as its extensive customer database, efforts to increase direct-to-consumer sales and favorable merchandise offerings result in market share gains and increased profitability. |
| CarMax, Inc. | $10.8 | 37.2 | The operator of used-car superstores topped August-quarter earnings estimates by 20 percent. Revenues jumped 13 percent. CarMax remains well positioned to benefit as uncertain economic conditions push consumers toward previously owned cars and trucks while carefully managed expenses and disciplined new store growth result in greater profitability. |
Cameron International Corp. | $8.1 | 25.2 | The manufacturer of drilling equipment beat June-quarter earnings estimates as revenues jumped 14 percent. Shares gained ground on news that BP’s Macondo well in the Gulf of Mexico had been permanently sealed. Cameron benefits in the wake of the disaster as new protocol around the world calls for upgraded versions of the company’s blowout preventers. |
| NII Holdings Inc. | $7.8 | 25.5 | The provider of mobile communications to business customers in South America grew June-quarter revenues 28 percent. Net subscriber additions, particularly in markets such as Brazil, and an increase in average revenue per user drove results. Shares gained ground following wireless bandwidth spectrum wins in Mexico at a time when investors are becoming more comfortable with the company’s capital expenditure program aimed at building a 3G network for its services in Mexico and Brazil. |
| Albemarle Corp. | $7.1 | 16.4 | The manufacturer of flame retardants grew June-quarter earnings 117 percent, beating estimates by 17 percent. Shares gained ground as volumes increased for bromine-based products, such as flame retardants and antioxidants, used in automotive, housing, and consumer electronics end markets that increasingly call for greater fire-resistant products. Industry wide price increases for bromine-based products are helping enhance profitability. |
| | $ Loss | | |
| Biggest $ Losers | (in millions) | % Loss | Reason for Move |
| Covance Inc. | $5.5 | 26.6 | The company, which helps pharmaceutical and biotechnology customers looking to drive down costs by outsourcing and optimizing their research-and-development processes, beat June-quarter earnings estimates by 18 percent. Shares fell when management unexpectedly cut profit forecasts for the full year due to declining demand and profitability for toxicology services. We sold Covance during the quarter to fund an idea with greater near-term earnings visibility. |
| Quanta Services, Inc. | $5.1 | 11.8 | The provider of specialized contracting services to the electric power, telecommunications and broadband cable industries grew September-quarter earnings 42 percent, beating estimates by 11 percent. Shares fell following forward guidance that included delays and postponements primarily caused by regulatory requirements. We sold Quanta Services during the quarter to fund an idea with better near-term earnings catalysts. |
| VistaPrint N.V. | $4.8 | 30.6 | The provider of online graphic design services and custom printed products to small businesses and consumers narrowly topped June-quarter earnings estimates. Shares fell after the company’s forecast for September-quarter earnings and for fiscal 2011 came in below expectations, contradicting recent growth predictions from management. We sold VistaPrint during the quarter concerned that execution issues would continue to limit visibility. |
Thermo Fisher Scientific, Inc. | $3.0 | 7.5 | The provider of scientific instruments, specialty diagnostics and biopharmaceutical services grew June-quarter earnings 14 percent, matching consensus estimates. Management’s reiteration of previous top-line growth and earnings guidance disappointed some analysts and created pressure on the stock. We sold Thermo Fisher during the quarter to fund an idea with better near-term earnings visibility. |
Health Management Associates Inc. | $2.3 | 11.2 | The operator of acute-care hospitals grew June-quarter earnings 23 percent, beating estimates by 7 percent. Revenues grew 8 percent. Hospitals as a group traded lower during the quarter as concerns related to government reimbursement levels going forward weighed on the entire sector. We sold Health Management during the quarter to fund an idea with better near-term earnings visibility. |
All gains/losses are calculated on an average cost basis
Management’s Discussion of Results, Brandywine Fund
Throughout much of the fiscal year, stocks moved as a group due to an unusually pronounced emphasis on macro conditions. Economic data points, geopolitical news and other broad developments emerged as primary influences on the market’s direction as investors made top-down assessments as to whether the latest headline was good or bad for stocks.
Brandywine Fund employs an investment strategy that relies on bottom-up research to identify companies with unique earnings growth potential. Given that investors were not discerning regarding individual-company prospects for much of the fiscal year, the Fund’s company-by-company approach was not an effective strategy for generating excess return during this macro-driven period.
When the fiscal year began in October 2009, momentum remained from a rally that began seven months earlier on economic optimism driven by aggressive government intervention designed to relieve a banking crisis. Stocks as a group fared well in the final three months of 2009, though investors tended to favor earnings-challenged companies that might benefit under a best-case economic scenario over companies that demonstrated near-term earnings promise.
The market’s narrow focus on rebound stories broadened as 2010 began. Fund performance improved in the March quarter on strength among consumer discretionary and industrial holdings amid continued economic optimism. Early in the June quarter, however, events emerged to prompt investors to call the prevailing economic outlook into question.
A series of events, including a debt crisis involving Greece and other southern European nations, a huge, unrestrained oil spill in the Gulf of Mexico and a “flash crash” that sent the Dow Jones Industrial Average down 600 points in five minutes, turned sentiment markedly negative. Stock price movements became highly correlated, moving as a group at a rate only rivaled by the credit crisis of late 2008 and early 2009, according to data compiled by Barclays Capital.
Correlation remained elevated through most of the September quarter. In this climate, companies that exceeded earnings estimates did not enjoy the kind of performance benefit historically associated with expectation-beating operating results, limiting Brandywine versus benchmark indexes.
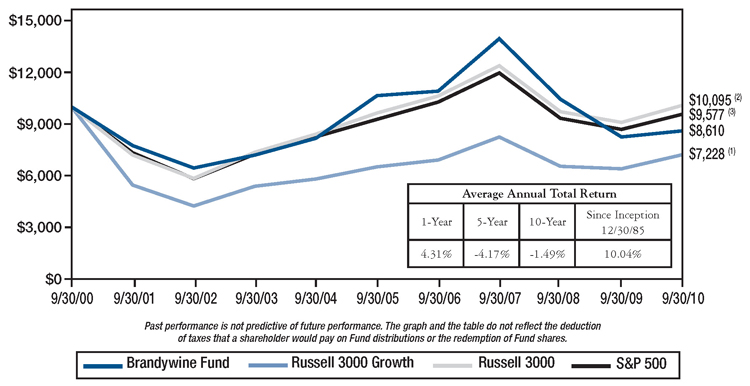
Brandywine grew 4.31 percent in the 12 months through September 30, 2010. The Russell 3000 and Russell 3000 Growth Indexes gained 10.96 and 12.81 percent.
Comparison of Change in Value of $10,000 Investment in Brandywine Fund, Russell 3000 Growth(1), Russell 3000 Index(2) and S&P 500 Index(3) |
| (1) | | The Russell 3000 Growth Index measures the performance of those Russell 3000 Index companies with higher price-to-book ratios and higher forecasted growth values. The stocks in this index are also members of either the Russell 1000 Growth or the Russell 2000 Growth Indexes and includes dividends. | |
| (2) | | The Russell 3000 Index, a trademark of the Frank Russell Company, is 3,000 of the largest publicly traded companies in the United States equity market and includes dividends. | |
| (3) | | The S&P 500 Index consists of 500 stocks, mostly on the New York Stock Exchange, selected by the Standard & Poor’s Ratings Group. Each stock’s weighting is based on its relative total market value and includes dividends. | |
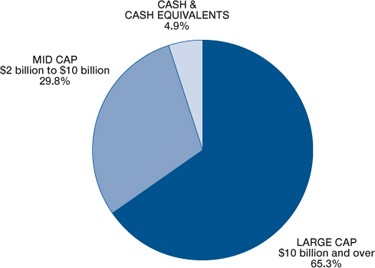
Brandywine Blue Fund
Portfolio Characteristics as of September 30, 2010
% Change in Top Ten Holdings From Book Cost
| 1. | | Apple Inc. | +68.2% | 6. | | Oracle Corporation | +10.9% |
| 2. | | National Oilwell Varco Inc. | +8.1% | 7. | | Medco Health Solutions, Inc. | +12.1% |
| 3. | | Caterpillar Inc. | +12.2% | 8. | | Halliburton Company | +9.7% |
| 4. | | Yum! Brands, Inc. | +9.0% | 9. | | Ford Motor Company | +10.3% |
| 5. | | Cameron International Corp. | +22.1% | 10. | | Deere & Company | +7.5% |
| Estimated Earnings Growth Rate | The Portfolio’s Market Capitalization |
of the Fund’s Investments | |
| The Fund’s | S&P 500’s |
| Companies | Companies |
| | |
| 16.2% | 13.7% |
Forecasted Increase in Earnings Per Share 2011 vs 2010 |
Source: Consensus estimates from Baseline Financial Services, Inc. |
This is not a forecast of the Fund’s future performance. Earnings growth for a Fund holding does not guarantee a corresponding increase in the market value of the holding or the Fund. As of September 30, 2010, the S&P 500 Index’s average annual total returns for 1, 5 and 10 years were 10.16, 0.64 and -0.43 percent. |
| |
| |
| |
| |
| |
| |
| |
Top Ten Industry Groups
Brandywine Blue Fund
September Quarter “Roses and Thorns”
| | $ Gain | | |
| Biggest $ Winners | (in millions) | % Gain | Reason for Move |
Cameron International Corp. | $17.8 | 28.8 | The manufacturer of drilling equipment beat June-quarter earnings estimates as revenues jumped 14 percent. Shares gained ground on news that BP’s Macondo well in the Gulf of Mexico had been permanently sealed. Cameron benefits in the wake of the disaster as new protocol around the world calls for upgraded versions of the company’s blowout preventers. |
| Autodesk, Inc. | $12.5 | 27.1 | The vendor of engineering and design software applications grew July-quarter earnings 50 percent, beating estimates by 33 percent. Leveraged to the build out of developing country infrastructure and eco-friendly construction, Autodesk is taking share as the only construction design firm to offer an integrated suite of design, simulation, visualization and procurement functionality. Additionally, a rise of sophisticated 3-D movies is boosting demand at the company’s media and entertainment division. |
National Oilwell Varco Inc. | $12.0 | 10.8 | June-quarter earnings grew 8 percent, beating estimates. Increased sales of oil-field safety equipment, including the company’s blowout preventers used to seal off oil or natural gas wells in emergency situations, drove results. The company’s recent acquisition of Advanced Production and Loading PLC, which makes turret mooring systems and other products for Floating Production, Storage and Offloading vessels, substantially increases the content National Oilwell provides per ship. |
| NII Holdings Inc. | $11.8 | 23 | The provider of mobile communications to business customers in South America grew June-quarter revenues 28 percent. Net subscriber additions, particularly in markets such as Brazil, and an increase in average revenue per user drove results. Shares gained ground following wireless bandwidth spectrum wins in Mexico at a time when investors are becoming more comfortable with the company’s capital expenditure program aimed at building a 3G network for its services in Mexico and Brazil. |
| DIRECTV | $10.8 | 13.7 | The provider of digital television via satellite grew June-quarter earnings 50 percent. Revenues grew 12 percent as the company’s exclusive TV packages attracted more customers in the U.S. as well as in Latin America where the company benefitted from its recent World Cup coverage. Additionally, strengthening price trends for upfront advertising as well as scatter advertising, which is advertising that is done on an as-needed basis, is helping boost profits. |
| | $ Loss | | |
| Biggest $ Losers | (in millions) | % Loss | Reason for Move |
| $7.9 | 17.2 | We sold Genworth Financial during the quarter following weaker-than-anticipated quarterly results and concerns that the company’s mortgage insurance business was not improving at the pace our research expected. Shares came under additional pressure after the company was subpoenaed by the New York Attorney General as part of a statewide life-insurance fraud probe. |
Thermo Fisher Scientific, Inc. | $4.7 | 7.6 | The provider of scientific instruments, specialty diagnostics and biopharmaceutical services grew June-quarter earnings 14 percent, matching consensus estimates. Management’s reiteration of previous top-line growth and earnings guidance disappointed some analysts and created pressure on the stock. We sold Thermo Fisher during the quarter to fund an idea with better near-term earnings visibility. |
| McKesson Corp. | $4.3 | 8.0 | McKesson, which concentrates on distribution and technology solutions designed to improve the quality and efficiency of health care delivery, topped June-quarter earnings estimates and raised forward guidance. Shares traded lower during the quarter as investors expressed concern that a potential acquisition would be dilutive. Our research shows fundamentals remained intact, particularly in the company’s distribution business where better-than-expected performance reflected strong generic trends, effective cost management and a continuing shift toward high-margin direct sales. |
| Life Technologies Corp. | $2.8 | 2.5 | The manufacturer of biotechnology instruments and consumables grew June-quarter earnings 15 percent, topping estimates by 5 percent. Shares traded lower during the quarter on concerns related to slowing European growth. Research customers in the region experienced delays in the release of funds due to persisting concerns about future funding levels. We believe growth trends remain intact, especially given that the company’s recent acquisition of Ion Torrent propels the company into the forefront of the high-growth gene-sequencing business. |
Marvell Technology Group Ltd. | $2.2 | 5.7 | July-quarter earnings grew 122 percent and revenues increased 40 percent. Shares traded lower during the quarter on near-term concerns related to demand for the company’s hard disk drive controllers from personal computer manufacturers despite more-than-offsetting growth from its mobile and networking segments. We sold Marvell Technology during the quarter to fund an idea with greater earnings visibility. |
All gains/losses are calculated on an average cost basis
Management’s Discussion of Results, Brandywine Blue Fund
Brandywine Blue Fund aims to capitalize on the long-running relationship between individual-company earnings performance and stock prices. While the Fund executed its strategy to isolate rapidly growing companies likely to exceed earnings estimates, its approach was not effective in generating excess return for the fiscal year due to an unusually narrow focus on the macro environment among investors.
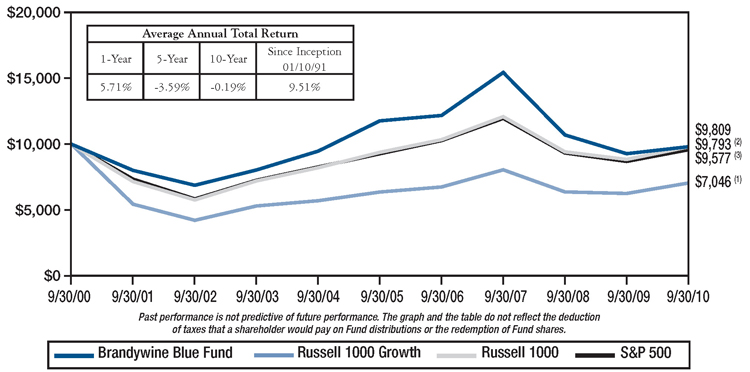
Brandywine Blue grew 5.71 percent in the 12 months through September 30, 2010. The S&P 500, Russell 1000 and Russell 1000 Growth Indexes gained 10.16, 10.75 and 12.65 percent.
The fiscal year began in October 2009 amid broad optimism fueled by government-led efforts to revive credit markets and bolster the economy in the wake of a financial crisis that peaked earlier in 2009. Most stocks benefited in this climate, but investors tended to favor companies with elevated levels of risk in terms of their fundamental outlooks over companies that enjoyed more visible paths to earnings growth.
Relative performance improved in early 2010 as economic optimism persisted and investor focus broadened. The generally upbeat environment of the March quarter would soon stand in contrast with the June quarter. In late April, a series of macro-level events began to unfold that changed investor sentiment for the worse.
The European debt crisis, the BP oil spill and the one-day “flash crash” stock decline triggered by automated trading helped set the tone for investor behavior for the rest of the fiscal year. While investors showed both positive and negative attitudes toward stocks during this time, they began judging stocks as a group to the same degree that they had at the height of the credit crisis in late 2008 and early 2009.
Macro concerns led investors to be overtly negative in the June quarter, leaving the Fund and its benchmarks in negative territory after the first three quarters of the fiscal year. Performance turned positive once again in the September quarter, but investors continued to judge stocks as a group with little regard for individual-company prospects. In this climate, companies that exceeded earnings estimates did not enjoy the kind of performance benefit historically associated with expectation-beating operating results, limiting Brandywine Blue versus benchmark indexes.
Comparison of Change in Value of $10,000 Investment in Brandywine Blue Fund, Russell 1000 Growth(1), Russell 1000 Index(2) and S&P 500 Index(3) |
| (1) | | The Russell 1000 Growth Index measures the performance of those Russell 1000 Index companies with higher price-to-book ratios and higher forecasted growth values and includes dividends. | |
| (2) | | The Russell 1000 Index, a trademark of the Frank Russell Company, is the largest 1,000 companies of the 3,000 largest publicly traded companies in the United States equity market and includes dividends. | |
| (3) | | The S&P 500 Index consists of 500 stocks, mostly on the New York Stock Exchange, selected by the Standard & Poor’s Ratings Group. Each stock’s weighting is based on its relative total market value and includes dividends. | |
| | | | |
REPORT OF INDEPENDENT REGISTERED PUBLIC ACCOUNTING FIRM
To the Board of Directors and Shareholders of
Brandywine Fund, Inc. and Brandywine Blue Fund
In our opinion, the accompanying statements of assets and liabilities, including the schedules of investments, and the related statements of operations and of changes in net assets and the financial highlights present fairly, in all material respects, the financial position of Brandywine Fund, Inc. and Brandywine Blue Fund (a series of the Brandywine Blue Fund, Inc.) (the “Funds”) at September 30, 2010, the results of each of their operations for the year then ended, the changes in each of their net assets for each of the two years in the period then ended and the financial highlights for each of the five years in the period then ended, in conformity with accounting principles generally accepted in the United States of America. These fi nancial statements and financial highlights (hereafter referred to as “financial statements”) are the responsibility of the Funds’ management; our responsibility is to express an opinion on these financial statements based on our audits. We conducted our audits of these financial statements in accordance with the standards of the Public Company Accounting Oversight Board (United States). Those standards require that we plan and perform the audit to obtain reasonable assurance about whether the financial statements are free of material misstatement. An audit includes examining, on a test basis, evidence supporting the amounts and disclosures in the financial statements, assessing the accounting principles used and significant estimates made by management, and evaluating the overall financial statement presentation. We believe that our audits, which included confirmation of securities at September 30, 2010 by correspondence with the custodian and brokers, provide a reasonable basis for our op inion.

Milwaukee, Wisconsin
October 15, 2010
Brandywine Fund, Inc.
Statement of Assets and Liabilities
September 30, 2010
| Assets: | | | |
| Investments in securities, at value (cost $1,589,030,627) | | $ | 1,762,924,715 | |
| Receivable from investments sold | | | 32,434,825 | |
| Dividends and interest receivable | | | 439,469 | |
| Receivable from shareholders for purchases | | | 418,854 | |
| Total assets | | $ | 1,796,217,863 | |
| | | | | |
| Liabilities: | | | | |
| Payable to brokers for investments purchased | | $ | 36,526,369 | |
| Payable to shareholders for redemptions | | | 2,275,609 | |
| Payable to adviser for management fees | | | 1,409,180 | |
| Other liabilities | | | 253,142 | |
| Total liabilities | | | 40,464,300 | |
| | | | | |
| Net Assets: | | | | |
| Capital Stock, $0.01 par value; 500,000,000 shares authorized; 79,749,734 shares outstanding | | | 2,776,009,830 | |
| Net unrealized appreciation on investments | | | 173,894,088 | |
| Accumulated net realized loss on investments | | | (1,194,150,355 | ) |
| Net assets | | | 1,755,753,563 | |
| Total liabilities and net assets | | $ | 1,796,217,863 | |
| | | | | |
| Calculation of net asset value per share: | | | | |
Net asset value, offering and redemption price per share ($1,755,753,563 ÷ 79,749,734 shares outstanding) | | $ | 22.02 | |
The accompanying notes to financial statements are an integral part of this statement.
Brandywine Fund, Inc.
Schedule of Investments
September 30, 2010
| Shares | | | | Cost | | | Value | |
| Common Stocks - 98.7% (a) | | | | | | |
CONSUMER DISCRETIONARY | | | | | | |
| | | Apparel Retail - 2.7% | | | | | | |
| | 342,150 | | The Dress Barn, Inc.* | | $ | 8,667,227 | | | $ | 8,126,062 | |
| | 186,100 | | Genesco Inc.* | | | 6,191,066 | | | | 5,560,668 | |
| | 1,294,700 | | Limited Brands, Inc. | | | 31,964,553 | | | | 34,672,066 | |
| | | | Apparel, Accessories & Luxury Goods - 1.3% | | | | | | | | |
| | 264,900 | | Fossil, Inc.* | | | 13,040,575 | | | | 14,248,971 | |
| | 98,800 | | VF Corp. | | | 8,085,423 | | | | 8,004,776 | |
| | | | Auto Parts & Equipment - 2.3% | | | | | | | | |
| | 958,200 | | TRW Automotive Holdings Corp.* | | | 34,406,230 | | | | 39,822,792 | |
| | | | Automobile Manufacturers - 2.0% | | | | | | | | |
| | 2,851,700 | | Ford Motor Company* | | | 31,313,377 | | | | 34,904,808 | |
| | | | Automotive Retail - 2.4% | | | | | | | | |
| | 1,333,000 | | CarMax, Inc.* | | | 33,504,495 | | | | 37,137,380 | |
| | 119,700 | | Monro Muffler Brake, Inc. | | | 4,408,646 | | | | 5,519,367 | |
| | | | Broadcasting - 3.4% | | | | | | | | |
| | 1,304,900 | | CBS Corporation | | | 18,928,970 | | | | 20,695,714 | |
| | 292,880 | | Discovery Communications, Inc.* | | | 6,373,337 | | | | 12,754,924 | |
| | 413,700 | | Liberty Media-Starz* | | | 26,086,781 | | | | 26,840,856 | |
| | | | Cable & Satellite - 0.8% | | | | | | | | |
| | 343,500 | | DIRECTV* | | | 12,321,492 | | | | 14,299,905 | |
| | | | Computer & Electronics Retail - 2.8% | | | | | | | | |
| | 2,461,400 | | GameStop Corporation* | | | 48,848,924 | | | | 48,514,194 | |
| | | | Footwear - 0.4% | | | | | | | | |
| | 259,600 | | Crocs, Inc.* | | | 3,312,957 | | | | 3,377,396 | |
| | 93,065 | | Steven Madden, Ltd.* | | | 3,191,966 | | | | 3,821,249 | |
| | | | Home Furnishing Retail - 3.0% | | | | | | | | |
| | 1,639,600 | | Williams-Sonoma, Inc. | | | 36,217,874 | | | | 51,975,320 | |
| | | | Home Furnishings - 1.7% | | | | | | | | |
| | 952,500 | | Tempur-Pedic International Inc.* | | | 30,548,178 | | | | 29,527,500 | |
| | | | Leisure Products - 1.6% | | | | | | | | |
| | 1,171,521 | | Mattel, Inc. | | | 20,973,417 | | | | 27,483,883 | |
| | | | Specialty Stores - 0.5% | | | | | | | | |
| | 308,482 | | Ulta Salon, Cosmetics& Fragrance, Inc.* | | | 6,995,347 | | | | 9,007,674 | |
| | | | Total Consumer Discretionary | | | 385,380,835 | | | | 436,295,505 | |
| | | | This sector is 13.2% above your Fund’s cost. | | | | | | | | |
CONSUMER STAPLES | | | | | | | | |
| | | | Food Retail - 1.6% | | | | | | | | |
| | 763,678 | | Whole Foods Market, Inc.* | | | 30,235,457 | | | | 28,340,091 | |
| | | | Household Products - 1.3% | | | | | | | | |
| | 344,900 | | Church & Dwight Co., Inc. | | | 22,559,266 | | | | 22,397,806 | |
| | | | Total Consumer Staples | | | 52,794,723 | | | | 50,737,897 | |
| | | | This sector is 3.9% below your Fund’s cost. | | | | | | | | |
ENERGY | | | | | | | | |
| | | | Oil & Gas Equipment & Services - 7.9% | | | | | | | | |
| | 881,400 | | Cameron International Corp.* | | | 32,063,114 | | | | 37,864,944 | |
| | 2,356,700 | | McDermott International, Inc.* | | | 18,900,152 | | | | 34,832,026 | |
| | 1,453,000 | | National Oilwell Varco Inc. | | | 59,588,607 | | | | 64,614,910 | |
| | 260,900 | | Newpark Resources, Inc.* | | | 2,076,831 | | | | 2,191,560 | |
| | | | Oil & Gas Exploration & Production - 0.9% | | | | | | | | |
| | 87,100 | | Berry Petroleum Co. | | | 2,547,675 | | | | 2,763,683 | |
| | 426,100 | | Rosetta Resources, Inc.* | | | 8,850,625 | | | | 10,009,089 | |
| | 613,500 | | SandRidge Energy Inc.* | | | 3,489,097 | | | | 3,484,680 | |
| | | | Total Energy | | | 127,516,101 | | | | 155,760,892 | |
| | | | This sector is 22.1% above your Fund’s cost. | | | | | | | | |
FINANCIALS | | | | | | | | |
| | | | Asset Management & Custody Banks - 1.4% | | | | | | | | |
| | 1,204,367 | | SEI Investments Co. | | | 21,128,965 | | | | 24,496,825 | |
| | | | Property & Casualty Insurance - 0.6% | | | | | | | | |
| | 663,300 | | Fidelity National Financial, Inc. | | | 9,721,847 | | | | 10,420,443 | |
| | | | Regional Banks - 0.8% | | | | | | | | |
| | 373,800 | | Signature Bank* | | | 13,411,972 | | | | 14,518,392 | |
| | | | Thrifts & Mortgage Finance - 0.0% | | | | | | | | |
| | 39,900 | | New York Community Bancorp, Inc. | | | 610,222 | | | | 648,375 | |
| | | | Total Financials | | | 44,873,006 | | | | 50,084,035 | |
| | | | This sector is 11.6% above your Fund’s cost. | | | | | | | | |
HEALTH CARE | | | | | | | | |
| | | | Biotechnology - 2.3% | | | | | | | | |
| | 216,239 | | Martek Biosciences Corp.* | | | 4,474,362 | | | | 4,893,489 | |
| | 644,031 | | United Therapeutics Corp.* | | | 33,610,735 | | | | 36,072,176 | |
| | | | Health Care Equipment - 1.1% | | | | | | | | |
| | 743,000 | | American Medical Systems Holdings, Inc.* | | | 16,288,567 | | | | 14,547,940 | |
| | 174,608 | | Masimo Corp. | | | 4,487,388 | | | | 4,768,544 | |
| | | | Health Care Technology - 0.9% | | | | | | | | |
| | 857,600 | | Allscripts Healthcare Solutions, Inc.* | | | 14,608,714 | | | | 15,839,872 | |
| | | | Life Sciences Tools & Services - 3.0% | | | | | | | | |
| | 759,200 | | Life Technologies Corporation* | | | 36,106,377 | | | | 35,447,048 | |
| | 559,400 | | PAREXEL International Corporation* | | | 12,114,526 | | | | 12,938,922 | |
| | 204,700 | | Pharmaceutical Product Development, Inc. | | | 4,991,357 | | | | 5,074,513 | |
| | | | Pharmaceuticals - 2.0% | | | | | | | | |
| | 793,788 | | Impax Laboratories, Inc.* | | | 14,537,387 | | | | 15,717,002 | |
| | 156,500 | | Shire PLC | | | 8,591,458 | | | | 10,529,320 | |
| | 211,600 | | Watson Pharmaceuticals, Inc.* | | | 8,906,349 | | | | 8,952,796 | |
| | | | Total Health Care | | | 158,717,220 | | | | 164,781,622 | |
| | | | This sector is 3.8% above your Fund’s cost. | | | | | | | | |
Brandywine Fund, Inc.
Schedule of Investments (Continued)
September 30, 2010
| Shares | | | | Cost | | | Value | |
| Common Stocks - 98.7% (a) (Continued) | | | | | | |
INDUSTRIALS | | | | | | |
| | | Aerospace & Defense - 4.5% | | | | | | |
| | 85,800 | | American Science and Engineering, Inc. | | $ | 6,579,761 | | | $ | 6,319,170 | |
| | 470,798 | | BE Aerospace, Inc.* | | | 12,547,356 | | | | 14,269,887 | |
| | 176,900 | | DigitalGlobe Inc.* | | | 5,365,996 | | | | 5,377,760 | |
| | 178,300 | | Precision Castparts Corp. | | | 19,710,225 | | | | 22,706,505 | |
| | 495,000 | | TransDigm Group, Inc. | | | 28,668,595 | | | | 30,714,750 | |
| | | | Air Freight & Logistics - 0.5% | | | | | | | | |
| | 312,041 | | Hub Group, Inc.* | | | 8,082,273 | | | | 9,130,320 | |
| | | | Building Products - 0.6% | | | | | | | | |
| | 247,100 | | Lennox International Inc. | | | 11,097,460 | | | | 10,301,599 | |
| | | | Construction & Farm Machinery & Heavy Trucks - 4.6% | | | | | | | | |
| | 588,498 | | Bucyrus International, Inc. | | | 35,292,089 | | | | 40,812,336 | |
| | 503,000 | | Caterpillar Inc. | | | 33,460,031 | | | | 39,576,040 | |
| | | | Electrical Components & Equipment - 1.5% | | | | | | | | |
| | 339,800 | | Baldor Electric Co. | | | 12,451,149 | | | | 13,727,920 | |
| | 498,200 | | EnerSys* | | | 11,541,610 | | | | 12,440,054 | |
| | | | Heavy Electrical Equipment - 1.3% | | | | | | | | |
| | 1,086,600 | | Babcock & Wilcox Co.* | | | 15,131,090 | | | | 23,122,848 | |
| | | | Human Resource & Employment Services - 0.1% | | | | | | | | |
| | 46,000 | | Administaff, Inc. | | | 1,081,741 | | | | 1,238,780 | |
| | | | Industrial Machinery - 0.6% | | | | | | | | |
| | 153,283 | | The Middleby Corp.* | | | 9,388,998 | | | | 9,716,609 | |
| | | | Marine Ports & Services - 0.4% | | | | | | | | |
| | 382,900 | | Aegean Marine Petroleum Network Inc. | | | 9,904,089 | | | | 6,371,456 | |
| | | | Railroads - 0.1% | | | | | | | | |
| | 33,900 | | Canadian Pacific Railway Limited | | | 2,008,250 | | | | 2,065,527 | |
| | | | Trading Companies & Distributors - 0.2% | | | | | | | | |
| | 71,200 | | Textainer Group Holdings Limited | | | 1,967,604 | | | | 1,903,888 | |
| | 165,700 | | United Rentals, Inc.* | | | 2,432,632 | | | | 2,458,988 | |
| | | | Trucking - 2.7% | | | | | | | | |
| | 647,900 | | Knight Transportation, Inc. | | | 13,134,676 | | | | 12,523,907 | |
| | 812,900 | | Ryder System, Inc. | | | 35,764,659 | | | | 34,767,733 | |
| | | | Total Industrials | | | 275,610,284 | | | | 299,546,077 | |
| | | | This sector is 8.7% above your Fund’s cost. | | | | | | | | |
INFORMATION TECHNOLOGY | | | | | | | | |
| | | | Application Software - 4.7% | | | | | | | | |
| | 46,532 | | Advent Software, Inc.* | | | 2,161,807 | | | | 2,428,505 | |
| | 1,155,098 | | Autodesk, Inc.* | | | 34,167,196 | | | | 36,928,483 | |
| | 506,113 | | Longtop Financial Technologies Ltd. SP-ADR* | | | 15,637,395 | | | | 19,915,547 | |
| | 1,442,754 | | Nuance Communications, Inc.* | | | 12,525,741 | | | | 22,564,673 | |
| | | | Communications Equipment - 2.3% | | | | | | | | |
| | 179,700 | | Finisar Corporation* | | | 3,056,345 | | | | 3,376,563 | |
| | 346,700 | | NETGEAR, Inc.* | | | 8,047,567 | | | | 9,364,367 | |
| | 183,400 | | Plantronics, Inc. | | | 5,064,300 | | | | 6,195,252 | |
| | 760,000 | | Polycom, Inc.* | | | 22,359,401 | | | | 20,732,800 | |
| | | | Computer Hardware - 2.9% | | | | | | | | |
| | 179,834 | | Apple Inc.* | | | 38,926,935 | | | | 51,027,897 | |
| | | | Data Processing & Outsourced Services - 0.7% | | | | | | | | |
| | 28,320 | | Syntel, Inc. | | | 940,166 | | | | 1,260,240 | |
| | 372,700 | | VeriFone Systems, Inc.* | | | 7,666,721 | | | | 11,579,789 | |
| | | | Electronic Components - 0.7% | | | | | | | | |
| | 1,359,800 | | Power-One, Inc.* | | | 14,099,518 | | | | 12,360,582 | |
| | | | Semiconductor Equipment - 1.6% | | | | | | | | |
| | 1,121,880 | | GT Solar International Inc.* | | | 8,389,536 | | | | 9,390,136 | |
| | 539,228 | | Veeco Instruments Inc.* | | | 20,153,961 | | | | 18,802,880 | |
| | | | Semiconductors - 3.8% | | | | | | | | |
| | 322,000 | | Applied Micro Circuits Corp.* | | | 3,200,634 | | | | 3,220,000 | |
| | 1,620,422 | | Cypress Semiconductor Corp.* | | | 16,146,459 | | | | 20,384,909 | |
| | 791,050 | | Microsemi Corp.* | | | 13,059,404 | | | | 13,566,508 | |
| | 708,934 | | OmniVision Technologies, Inc.* | | | 13,454,917 | | | | 16,333,839 | |
| | 635,030 | | Semtech Corp.* | | | 11,976,845 | | | | 12,821,256 | |
| | | | Systems Software - 1.8% | | | | | | | | |
| | 1,145,100 | | Oracle Corporation | | | 28,813,057 | | | | 30,745,935 | |
| | | | Total Information Technology | | | 279,847,905 | | | | 323,000,161 | |
| | | | This sector is 15.4% above your Fund’s cost. | | | | | | | | |
MATERIALS | | | | | | | | |
| | | | Diversified Chemicals - 1.1% | | | | | | | | |
| | 914,600 | | Olin Corp. | | | 18,710,170 | | | | 18,438,336 | |
| | | | Diversified Metals & Mining - 1.7% | | | | | | | | |
| | 363,700 | | Walter Energy, Inc. | | | 28,753,667 | | | | 29,565,173 | |
| | | | Metal & Glass Containers - 0.9% | | | | | | | | |
| | 260,000 | | Greif Inc. | | | 14,121,753 | | | | 15,298,400 | |
| | | | Precious Metals & Minerals - 1.8% | | | | | | | | |
| | 1,210,900 | | Silver Wheaton Corporation* | | | 31,563,951 | | | | 32,270,485 | |
| | | | Specialty Chemicals - 3.6% | | | | | | | | |
| | 971,700 | | Albemarle Corp. | | | 35,990,765 | | | | 45,485,277 | |
| | 262,000 | | Cytec Industries Inc. | | | 14,610,376 | | | | 14,771,560 | |
| | 196,500 | | PolyOne Corporation* | | | 2,418,786 | | | | 2,375,685 | |
| | | | Steel - 2.5% | | | | | | | | |
| | 646,000 | | Allegheny Technologies, Inc. | | | 27,055,223 | | | | 30,006,700 | |
| | 427,000 | | Carpenter Technology Corp. | | | 15,454,077 | | | | 14,394,170 | |
| | | | Total Materials | | | 188,678,768 | | | | 202,605,786 | |
| | | | This sector is 7.4% above your Fund’s cost. | | | | | | | | |
Brandywine Fund, Inc.
Schedule of Investments (Continued)
September 30, 2010
| Shares or | | | | | | | | |
| Principal | | | | | | | | |
| Amount | | | | Cost | | | Value | |
| Common Stocks - 98.7% (a) (Continued) | | | | | | |
TELECOMMUNICATION SERVICES | | | | | | |
| | | Alternative Carriers - 0.4% | | | | | | |
| | 148,100 | | AboveNet, Inc.* | | $ | 7,648,569 | | | $ | 7,714,529 | |
| | | | Wireless Telecommunication Services - 2.4% | | | | | | | | |
| | 854,006 | | NII Holdings Inc.* | | | 31,115,756 | | | | 35,099,647 | |
| | 344,900 | | Syniverse Holdings Inc.* | | | 7,367,779 | | | | 7,818,883 | |
| | | | Total Telecommunication Services | | | 46,132,104 | | | | 50,633,059 | |
| | | | This sector is 9.8% above your Fund’s cost. | | | | | | | | |
| | | | Total common stocks | | | 1,559,550,946 | | | | 1,733,445,034 | |
Short-Term Investments – 1.7% (a) | | | | | | | | |
| | | | Commercial Paper - 1.6% | | | | | | | | |
| $ | 27,400,000 | | Prudential Funding LLC, due 10/01/10, discount of 0.20% | | | 27,400,000 | | | | 27,400,000 | |
| | | | Variable Rate Demand Note - 0.1% | | | | | | | | |
| | 2,079,681 | | American Family Financial Services, 0.10% | | | 2,079,681 | | | | 2,079,681 | |
| | | | Total short-term investments | | | 29,479,681 | | | | 29,479,681 | |
| | | | Total investments - 100.4% | | $ | 1,589,030,627 | | | | 1,762,924,715 | |
| | | | Liabilities, less other assets - (0.4%) (a) | | | | | | | (7,171,152 | ) |
| | | | TOTAL NET ASSETS - 100.0% | | | | | | $ | 1,755,753,563 | |
| * | Non-dividend paying security. |
| (a) | Percentages for the various classifications relate to net assets. |
SP-ADR - Sponsored American Depositary Receipt
The accompanying notes to financial statements are an integral part of this schedule.
Statement of Operations
For the Year Ended September 30, 2010
| Income: | | | |
| Dividends | | $ | 15,388,406 | |
| Interest | | | 90,719 | |
| Total income | | | 15,479,125 | |
| | | | | |
| Expenses: | | | | |
| Management fees | | | 19,997,202 | |
| Transfer agent fees | | | 1,278,685 | |
| Printing and postage expense | | | 237,500 | |
| Administrative and accounting services | | | 222,354 | |
| Custodian fees | | | 141,900 | |
| Board of Directors fees and expenses | | | 112,730 | |
| Professional fees | | | 64,305 | |
| Insurance expense | | | 49,368 | |
| Registration fees | | | 48,650 | |
| Other expenses | | | 18,020 | |
| Total expenses | | | 22,170,714 | |
| Net Investment Loss | | | (6,691,589 | ) |
| Net Realized Gain on Investments | | | 168,156,155 | |
| Net Decrease in Unrealized Appreciation on Investments | | | (78,682,801 | ) |
| Net Gain on Investments | | | 89,473,354 | |
| Net Increase in Net Assets Resulting From Operations | | $ | 82,781,765 | |
The accompanying notes to financial statements are an integral part of this statement.
Brandywine Fund, Inc.
Statements of Changes in Net Assets
For the Years Ended September 30, 2010 and 2009
| | | 2010 | | | 2009 | |
| Operations: | | | | | | |
| Net investment loss | | $ | (6,691,589 | ) | | $ | (5,851,739 | ) |
| Net realized gain (loss) on investments | | | 168,156,155 | | | | (1,141,417,077 | ) |
| Net (decrease) increase in unrealized appreciation on investments | | | (78,682,801 | ) | | | 399,565,873 | |
| Net increase (decrease) in net assets resulting from operations | | | 82,781,765 | | | | (747,702,943 | ) |
| | | | | | | | | |
| Distributions to Shareholders: | | | | | | | | |
| Distributions from net realized gains ($0.1145 per share) | | | — | | | | (14,327,226 | ) |
| | | | | | | | | |
| Fund Share Activities: | | | | | | | | |
| Proceeds from shares issued (5,907,401 and 8,247,123 shares, respectively) | | | 129,867,845 | | | | 163,040,216 | |
| Net asset value of shares issued in distributions reinvested (655,907 shares) | | | — | | | | 13,715,026 | |
| Cost of shares redeemed (34,266,723 and 28,178,168 shares, respectively) | | | (738,576,591 | ) | | | (554,831,955 | ) |
| Net decrease in net assets derived from Fund share activities | | | (608,708,746 | ) | | | (378,076,713 | ) |
| Total Decrease | | | (525,926,981 | ) | | | (1,140,106,882 | ) |
| | | | | | | | | |
| Net Assets at the Beginning of the Year | | | 2,281,680,544 | | | | 3,421,787,426 | |
| Net Assets at the End of the Year | | $ | 1,755,753,563 | | | $ | 2,281,680,544 | |
| (Includes undistributed net investment income of $0 and $0, respectively) | | | | | | | | |
Financial Highlights
(Selected data for each share of the Fund outstanding throughout each year)
| | | Years Ended September 30, | |
| | | 2010 | | | 2009 | | | 2008 | | | 2007 | | | 2006 | |
| PER SHARE OPERATING PERFORMANCE: | | | | | | | | | | | | | | | |
| Net asset value, beginning of year | | $ | 21.11 | | | $ | 26.86 | | | $ | 40.98 | | | $ | 32.27 | | | $ | 31.50 | |
| | | | | | | | | | | | | | | | | | | | | |
| Income from investment operations: | | | | | | | | | | | | | | | | | | | | |
Net investment loss(1) | | | (0.07 | ) | | | (0.05 | ) | | | (0.18 | ) | | | (0.19 | ) | | | (0.10 | ) |
| Net realized and unrealized gains (losses) on investments | | | 0.98 | | | | (5.59 | ) | | | (8.72 | ) | | | 9.15 | | | | 0.87 | |
| Total from investment operations | | | 0.91 | | | | (5.64 | ) | | | (8.90 | ) | | | 8.96 | | | | 0.77 | |
| | | | | | | | | | | | | | | | | | | | | |
| Less distributions: | | | | | | | | | | | | | | | | | | | | |
| Distributions from net investment income | | | — | | | | — | | | | — | | | | — | | | | — | |
| Distributions from net realized gains | | | — | | | | (0.11 | ) | | | (5.22 | ) | | | (0.25 | ) | | | — | |
| Total from distributions | | | — | | | | (0.11 | ) | | | (5.22 | ) | | | (0.25 | ) | | | — | |
| Net asset value, end of year | | $ | 22.02 | | | $ | 21.11 | | | $ | 26.86 | | | $ | 40.98 | | | $ | 32.27 | |
| TOTAL RETURN | | | 4.31 | % | | | (20.98 | %) | | | (25.16 | %) | | | 27.90 | % | | | 2.44 | % |
| | | | | | | | | | | | | | | | | | | | | |
| RATIOS/SUPPLEMENTAL DATA: | | | | | | | | | | | | | | | | | | | | |
| Net assets, end of year (in 000’s $) | | | 1,755,754 | | | | 2,281,681 | | | | 3,421,787 | | | | 4,851,268 | | | | 4,066,292 | |
| Ratio of expenses to average net assets | | | 1.11 | % | | | 1.10 | % | | | 1.08 | % | | | 1.08 | % | | | 1.08 | % |
| Ratio of net investment loss to average net assets | | | (0.33 | %) | | | (0.25 | %) | | | (0.54 | %) | | | (0.54 | %) | | | (0.31 | %) |
| Portfolio turnover rate | | | 225 | % | | | 239 | % | | | 210 | % | | | 162 | % | | | 200 | % |
| (1) | Net investment loss per share was calculated using average shares outstanding. |
The accompanying notes to financial statements are an integral part of these statements.
Brandywine Blue Fund
Statement of Assets and Liabilities
September 30, 2010
| Assets: | | | |
| Investments in securities, at value (cost $1,871,238,552) | | $ | 2,048,136,760 | |
| Receivable from investments sold | | | 39,631,644 | |
| Receivable from shareholders for purchases | | | 3,121,283 | |
| Dividends and interest receivable | | | 1,050,461 | |
| Total assets | | $ | 2,091,940,148 | |
| | | | | |
| Liabilities: | | | | |
| Payable to brokers for investments purchased | | $ | 30,323,894 | |
| Payable to shareholders for redemptions | | | 1,974,269 | |
| Payable to adviser for management fees | | | 1,620,077 | |
| Other liabilities | | | 430,803 | |
| Total liabilities | | | 34,349,043 | |
| | | | | |
| Net Assets: | | | | |
| Capital Stock, $0.01 par value; 500,000,000 shares authorized; 94,473,580 shares outstanding | | | 3,406,057,973 | |
| Net unrealized appreciation on investments | | | 176,898,208 | |
| Accumulated net realized loss on investments | | | (1,525,365,076 | ) |
| Net assets | | | 2,057,591,105 | |
| Total liabilities and net assets | | $ | 2,091,940,148 | |
| | | | | |
| Calculation of net asset value per share: | | | | |
Net asset value, offering and redemption price per share ($2,057,591,105 ÷ 94,473,580 shares outstanding) | | $ | 21.78 | |
The accompanying notes to financial statements are an integral part of this statement.
Schedule of Investments
September 30, 2010
| Shares | | | | Cost | | | Value | |
| Common Stocks - 95.1% (a) | | | | | | |
CONSUMER DISCRETIONARY | | | | | | |
| | | Apparel Retail - 2.9% | | | | | | |
| | 2,236,600 | | Limited Brands, Inc. | | $ | 54,560,145 | | | $ | 59,896,148 | |
| | | | Apparel, Accessories & Luxury Goods - 1.1% | | | | | | | | |
| | 275,800 | | VF Corp. | | | 22,468,127 | | | | 22,345,316 | |
| | | | Automobile Manufacturers - 3.1% | | | | | | | | |
| | 5,202,800 | | Ford Motor Company* | | | 57,747,600 | | | | 63,682,272 | |
| | | | Automotive Retail - 1.9% | | | | | | | | |
| | 750,800 | | O’Reilly Automotive, Inc.* | | | 35,538,501 | | | | 39,942,560 | |
| | | | Broadcasting - 4.3% | | | | | | | | |
| | 3,121,500 | | CBS Corporation | | | 43,952,180 | | | | 49,506,990 | |
| | 888,600 | | Discovery Communications, Inc.* | | | 21,835,537 | | | | 38,698,530 | |
| | | | Cable & Satellite - 2.8% | | | | | | | | |
| | 1,357,400 | | DIRECTV* | | | 50,127,341 | | | | 56,508,562 | |
| | | | Department Stores - 2.8% | | | | | | | | |
| | 2,515,300 | | Macy’s, Inc. | | | 51,281,998 | | | | 58,078,277 | |
| | | | Leisure Products - 2.1% | | | | | | | | |
| | 1,830,000 | | Mattel, Inc. | | | 33,039,551 | | | | 42,931,800 | |
| | | | Movies & Entertainment - 1.0% | | | | | | | | |
| | 611,400 | | The Walt Disney Company* | | | 20,320,062 | | | | 20,243,454 | |
| | | | Restaurants - 3.8% | | | | | | | | |
| | 1,696,300 | | Yum! Brands, Inc. | | | 71,650,907 | | | | 78,131,578 | |
| | | | Total Consumer Discretionary | | | 462,521,949 | | | | 529,965,487 | |
| | | | This sector is 14.6% above your Fund’s cost. | | | | | | | | |
CONSUMER STAPLES | | | | | | | | |
| | | | Food Retail - 2.6% | | | | | | | | |
| | 1,455,300 | | Whole Foods Market, Inc.* | | | 57,436,437 | | | | 54,006,183 | |
| | | | Total Consumer Staples | | | 57,436,437 | | | | 54,006,183 | |
| | | | This sector is 6.0% below your Fund’s cost. | | | | | | | | |
ENERGY | | | | | | | | |
| | | | Integrated Oil & Gas - 2.8% | | | | | | | | |
| | 739,900 | | Occidental Petroleum Corp. | | | 60,897,605 | | | | 57,934,170 | |
| | | | Oil & Gas Equipment & Services - 11.0% | | | | | | | | |
| | 1,790,400 | | Cameron International Corp.* | | | 63,004,368 | | | | 76,915,584 | |
| | 1,926,000 | | Halliburton Company | | | 58,056,988 | | | | 63,692,820 | |
| | 1,933,500 | | National Oilwell Varco Inc. | | | 79,516,982 | | | | 85,982,745 | |
| | | | Total Energy | | | 261,475,943 | | | | 284,525,319 | |
| | | | This sector is 8.8% above your Fund’s cost. | | | | | | | | |
Brandywine Blue Fund
Schedule of Investments (Continued)
September 30, 2010
| Shares or | | | | | | | | |
| Principal | | | | | | | | |
| Amount | | | | Cost | | | Value | |
| Common Stocks - 95.1% (a) (Continued) | | | | | | |
FINANCIALS | | | | | | |
| | | Thrifts & Mortgage Finance - 0.5% | | | | | | |
| | 674,774 | | New York Community Bancorp, Inc. | | $ | 10,372,246 | | | $ | 10,965,077 | |
| | | | Total Financials | | | 10,372,246 | | | | 10,965,077 | |
| | | | This sector is 5.7% above your Fund’s cost. | | | | | | | | |
HEALTH CARE | | | | | | | | |
| | | | Health Care Distributors - 2.2% | | | | | | | | |
| | 743,698 | | McKesson Corp. | | | 47,546,621 | | | | 45,945,662 | |
| | | | Health Care Services - 5.9% | | | | | | | | |
| | 1,178,600 | | Express Scripts, Inc.* | | | 50,956,252 | | | | 57,397,820 | |
| | 1,235,000 | | Medco Health Solutions, Inc.* | | | 57,375,723 | | | | 64,294,100 | |
| | | | Life Sciences Tools & Services - 3.0% | | | | | | | | |
| | 1,304,800 | | Life Technologies Corporation* | | | 61,238,301 | | | | 60,921,112 | |
| | | | Pharmaceuticals - 3.4% | | | | | | | | |
| | 365,192 | | Shire PLC | | | 21,395,271 | | | | 24,570,118 | |
| | 841,600 | | Teva Pharmaceutical Industries Ltd. SP-ADR | | | 45,362,782 | | | | 44,394,400 | |
| | | | Total Health Care | | | 283,874,950 | | | | 297,523,212 | |
| | | | This sector is 4.8% above your Fund’s cost. | | | | | | | | |
INDUSTRIALS | | | | | | | | |
| | | | Aerospace & Defense - 2.5% | | | | | | | | |
| | 406,700 | | Precision Castparts Corp. | | | 44,406,991 | | | | 51,793,245 | |
| | | | Construction & Farm Machinery & Heavy Trucks - 7.2% | | | | | | | | |
| | 1,090,700 | | Caterpillar Inc. | | | 76,494,902 | | | | 85,816,276 | |
| | 877,600 | | Deere & Company | | | 56,985,194 | | | | 61,238,928 | |
| | | | Railroads - 0.7% | | | | | | | | |
| | 247,700 | | Canadian Pacific Railway Limited | | | 12,836,884 | | | | 15,092,361 | |
| | | | Total Industrials | | | 190,723,971 | | | | 213,940,810 | |
| | | | This sector is 12.2% above your Fund’s cost. | | | | | | | | |
INFORMATION TECHNOLOGY | | | | | | | | |
| | | | Application Software - 4.9% | | | | | | | | |
| | 1,622,300 | | Adobe Systems Inc.* | | | 54,160,819 | | | | 42,423,145 | |
| | 1,809,300 | | Autodesk, Inc.* | | | 55,763,090 | | | | 57,843,321 | |
| | | | Computer Hardware - 4.7% | | | | | | | | |
| | 342,600 | | Apple Inc.* | | | 57,783,497 | | | | 97,212,750 | |
| | | | Computer Storage & Peripherals - 1.9% | | | | | | | | |
| | 1,956,300 | | EMC Corp.* | | | 30,454,064 | | | | 39,732,453 | |
| | | | Semiconductors - 4.7% | | | | | | | | |
| | 376,400 | | First Solar, Inc.* | | | 55,577,884 | | | | 55,462,540 | |
| | 1,334,800 | | Linear Technology Corp. | | | 39,089,051 | | | | 41,018,404 | |
| | | | Systems Software - 3.2% | | | | | | | | |
| | 2,430,500 | | Oracle Corporation | | | 58,855,523 | | | | 65,258,925 | |
| | | | Total Information Technology | | | 351,683,928 | | | | 398,951,538 | |
| | | | This sector is 13.4% above your Fund’s cost. | | | | | | | | |
MATERIALS | | | | | | | | |
| | | | Fertilizers & Agricultural Chemicals - 2.5% | | | | | | | | |
| | 538,400 | | CF Industries Holdings, Inc. | | | 52,888,838 | | | | 51,417,200 | |
| | | | Precious Metals & Minerals - 2.6% | | | | | | | | |
| | 2,017,000 | | Silver Wheaton Corporation* | | | 52,973,735 | | | | 53,753,050 | |
| | | | Total Materials | | | 105,862,573 | | | | 105,170,250 | |
| | | | This sector is 0.7% below your Fund’s cost. | | | | | | | | |
TELECOMMUNICATION SERVICES | | | | | | | | |
| | | | Integrated Telecommunication Services - 0.1% | | | | | | | | |
| | 64,400 | | Verizon Communications Inc. | | | 1,901,223 | | | | 2,098,796 | |
| | | | Wireless Telecommunication Services - 2.9% | | | | | | | | |
| | 1,445,300 | | NII Holdings Inc.* | | | 53,797,074 | | | | 59,401,830 | |
| | | | Total Telecommunication Services | | | 55,698,297 | | | | 61,500,626 | |
| | | | This sector is 10.4% above your Fund’s cost. | | | | | | | | |
| | | | Total common stocks | | | 1,779,650,294 | | | | 1,956,548,502 | |
Short-Term Investments - 4.4% (a) | | | | | | | | |
| | | | Commercial Paper - 4.3% | | | | | | | | |
| $ | 89,100,000 | | Prudential Funding LLC, due 10/01/10 - 10/04/10, discounts of 0.20% - 0.27% | | | 89,098,875 | | | | 89,098,875 | |
| | | | Variable Rate Demand Note - 0.1% | | | | | | | | |
| | 2,489,383 | | American Family FinancialServices, 0.10% | | | 2,489,383 | | | | 2,489,383 | |
| | | | Total short-term investments | | | 91,588,258 | | | | 91,588,258 | |
| | | | Total investments - 99.5% | | $ | 1,871,238,552 | | | | 2,048,136,760 | |
| | | | Other assets lessliabilities - 0.5% (a) | | | | | | | 9,454,345 | |
| | | | TOTAL NET ASSETS - 100.0% | | | | | | $ | 2,057,591,105 | |
| * | Non-dividend paying security. |
| (a) | Percentages for the various classifications relate to net assets. |
SP-ADR - Sponsored American Depositary Receipt
The accompanying notes to financial statements are an integral part of this schedule.
Brandywine Blue Fund
Statement of Operations
For the Year Ended September 30, 2010
| Income: | | | |
| Dividends | | $ | 19,671,021 | |
| Interest | | | 196,273 | |
| Total income | | | 19,867,294 | |
| | | | | |
| Expenses: | | | | |
| Management fees | | | 22,155,759 | |
| Transfer agent fees | | | 2,100,390 | |
| Printing and postage expense | | | 856,966 | |
| Administrative and accounting services | | | 224,766 | |
| Registration fees | | | 156,885 | |
| Custodian fees | | | 123,500 | |
| Board of Directors fees and expenses | | | 111,530 | |
| Professional fees | | | 64,375 | |
| Insurance expense | | | 51,504 | |
| Other expenses | | | 16,160 | |
| Total expenses | | | 25,861,835 | |
| Net Investment Loss | | | (5,994,541 | ) |
| Net Realized Gain on Investments | | | 167,418,597 | |
| Net Decrease in Unrealized Appreciation on Investments | | | (36,891,471 | ) |
| Net Gain on Investments | | | 130,527,126 | |
| Net Increase in Net Assets Resulting From Operations | | $ | 124,532,585 | |
Statements of Changes in Net Assets
For the Years Ended September 30, 2010 and 2009
| | | 2010 | | | 2009 | |
| Operations: | | | | | | |
| Net investment (loss) income | | $ | (5,994,541 | ) | | $ | 5,355,551 | |
| Net realized gain (loss) on investments | | | 167,418,597 | | | | (1,001,698,285 | ) |
| Net (decrease) increase in unrealized appreciation on investments | | | (36,891,471 | ) | | | 514,251,276 | |
| Net increase (decrease) in net assets resulting from operations | | | 124,532,585 | | | | (482,091,458 | ) |
| | | | | | | | | |
| Distributions to Shareholders: | | | | | | | | |
| Distributions from net investment income ($0.06695 per share) | | | (7,553,091 | ) | | | — | |
| | | | | | | | | |
| Fund Share Activities: | | | | | | | | |
| Proceeds from shares issued (28,161,958 and 62,850,433 shares, respectively) | | | 605,605,866 | | | | 1,204,228,339 | |
| Net asset value of shares issued in distributions reinvested (334,201 shares) | | | 6,963,847 | | | | — | |
| Cost of shares redeemed (53,126,826 and 83,039,892 shares, respectively) | | | (1,133,864,678 | ) | | | (1,583,898,339 | ) |
| Net decrease in net assets derived from Fund share activities | | | (521,294,965 | ) | | | (379,670,000 | ) |
| Total Decrease | | | (404,315,471 | ) | | | (861,761,458 | ) |
| | | | | | | | | |
| Net Assets at the Beginning of the Year | | | 2,461,906,576 | | | | 3,323,668,034 | |
| Net Assets at the End of the Year | | $ | 2,057,591,105 | | | $ | 2,461,906,576 | |
| (Includes undistributed net investment income of $0 and $5,355,551, respectively) | | | | | | | | |
The accompanying notes to financial statements are an integral part of these statements.
Brandywine Blue Fund
Financial Highlights
(Selected data for each share of the Fund outstanding throughout each year)
| | | Years Ended September 30, | |
| | | 2010 | | | 2009 | | | 2008 | | | 2007 | | | 2006 | |
| PER SHARE OPERATING PERFORMANCE: | | | | | | | | | | | | | | | |
| Net asset value, beginning of year | | $ | 20.67 | | | $ | 23.86 | | | $ | 38.18 | | | $ | 31.15 | | | $ | 31.33 | |
| Income from investment operations: | | | | | | | | | | | | | | | | | | | | |
Net investment (loss) income(1) | | | (0.06 | ) | | | 0.04 | | | | (0.07 | ) | | | (0.02 | ) | | | (0.00 | )* |
| Net realized and unrealized gains (losses) | | | | | | | | | | | | | | | | | | | | |
| on investments | | | 1.24 | | | | (3.23 | ) | | | (10.38 | ) | | | 8.15 | | | | 0.96 | |
| Total from investment operations | | | 1.18 | | | | (3.19 | ) | | | (10.45 | ) | | | 8.13 | | | | 0.96 | |
| Less distributions: | | | | | | | | | | | | | | | | | | | | |
| Distributions from net investment income | | | (0.07 | ) | | | — | | | | — | | | | — | | | | — | |
| Distributions from net realized gains | | | — | | | | — | | | | (3.87 | ) | | | (1.10 | ) | | | (1.14 | ) |
| Total from distributions | | | (0.07 | ) | | | — | | | | (3.87 | ) | | | (1.10 | ) | | | (1.14 | ) |
| Net asset value, end of year | | $ | 21.78 | | | $ | 20.67 | | | $ | 23.86 | | | $ | 38.18 | | | $ | 31.15 | |
| TOTAL RETURN | | | 5.71 | % | | | (13.37 | %) | | | (30.70 | %) | | | 26.82 | % | | | 3.47 | % |
| | | | | | | | | | | | | | | | | | | | | |
| RATIOS/SUPPLEMENTAL DATA: | | | | | | | | | | | | | | | | | | | | |
| Net assets, end of year (in 000’s $) | | | 2,057,591 | | | | 2,461,907 | | | | 3,323,668 | | | | 3,304,281 | | | | 1,856,496 | |
| Ratio of expenses to average net assets | | | 1.17 | % | | | 1.16 | % | | | 1.13 | % | | | 1.12 | % | | | 1.10 | % |
| Ratio of net investment (loss) income to average net assets | | | (0.27 | %) | | | 0.21 | % | | | (0.23 | %) | | | (0.06 | %) | | | (0.02 | %) |
| Portfolio turnover rate | | | 212 | % | | | 261 | % | | | 267 | % | | | 184 | % | | | 207 | % |
| (1) | Net investment (loss) income per share was calculated using average shares outstanding. |
| * | Amount less than $0.005 per share. |
The accompanying notes to financial statements are an integral part of this statement.
The Brandywine Funds
Notes to Financial Statements
September 30, 2010
| (1) | Summary of Significant Accounting Policies |
| | The following is a summary of significant accounting policies of Brandywine Fund, Inc. (the “Brandywine Fund”) and Brandywine Blue Fund (the “Blue Fund,” one of two Funds in a series of the Brandywine Blue Fund, Inc.) (collectively the “Funds”). Each Fund is registered as a diversified open-end management company under the Investment Company Act of 1940 (the “Act”), as amended. The assets and liabilities of each Fund are segregated and a shareholder’s interest is limited to the Fund in which the shareholder owns shares. The Brandywine Fund was incorporated under the laws of Maryland on October 9, 1985. The Blue Fund was incorporated under the laws of Maryland on November 13, 1990. The investment objective of each Fund is to produce long-term capital appreciation principally thr ough investing in common stocks. |
| | (a) | Each security, excluding short-term investments, is valued at the last sale price reported by the principal security exchange on which the issue is traded. Securities that are traded on the Nasdaq Markets are valued at the Nasdaq Official Closing Price, or if no sale is reported, the latest bid price. Securities which are traded over-the-counter are valued at the latest bid price. Securities for which quotations are not readily available are valued at fair value as determined by the investment adviser under the supervision of the Board of Directors. The fair value of a security may differ from the last quoted price and the Fund may not be able to sell a security at the estimated fair value. Market quotations may not be available, for example, if trading in particular securities has halted during the day and not resumed prior to th e close of trading on the New York Stock Exchange. As of September 30, 2010, there were no securities that were internally fair valued. Short-term investments with maturities of 60 days or less are valued at amortized cost which approximates value. For financial reporting purposes, investment transactions are recorded on the trade date; however, for purposes of executing shareholder transactions, the Funds record changes in holdings of portfolio securities no later than the first business day after the trade date in accordance with Rule 2a-4 of the Act. Accordingly, certain differences between net asset value for financial reporting and for executing shareholder transactions may arise. |
The Brandywine Funds
Notes to Financial Statements (Continued)
September 30, 2010
| (1) | Summary of Significant Accounting Policies (Continued) |
| | The Funds adopted the provisions of the Financial Accounting Standards Board (“FASB”) Accounting Standards Codification “Fair Value Measurements and Disclosures” Topic 820 (“ASC 820”), effective October 1, 2008. Under ASC 820, fair value is defined as the price that would be received to sell an asset or paid to transfer a liability (i.e., the “exit price”) in an orderly transaction between market participants at the measurement date. |
| | In determining fair value, the Funds use various valuation approaches. ASC 820 establishes a fair value hierarchy for inputs used in measuring fair value that maximizes the use of observable inputs and minimizes the use of unobservable inputs by generally requiring that the most observable inputs be used when available. Observable inputs are those that market participants would use in pricing the asset or liability based on market data obtained from sources independent of the Funds. Unobservable inputs reflect the Funds’ assumptions about the inputs market participants would use in pricing the asset or liability developed based on the best information available in the circumstances. The inputs or methodologies used for valuing securities are not necessarily an indication of the risks associated with investing in those securities. |
The fair value hierarchy is categorized into three levels based on the inputs as follows:
Level 1 – Valuations based on unadjusted quoted prices in active markets for identical assets.
Level 2 – Valuations based on quoted prices for similar securities or in markets that are not active or for which all significant inputs are observable, either directly or indirectly.
Level 3 – Valuations based on inputs that are unobservable and significant to the overall fair value measurement.
The following table summarizes the Funds’ investments as of September 30, 2010, based on the inputs used to value them:
| | | Brandywine Fund | | | Blue Fund | |
| Valuation Inputs | | Investments in Securities | | | Investments in Securities | |
| Level 1 – Common Stocks | | $ | 1,733,445,034 | | | $ | 1,956,548,502 | |
| Level 2 – Short Term Commercial Paper | | | 27,400,000 | | | | 89,098,875 | |
| Variable Rate Demand Notes | | | 2,079,681 | | | | 2,489,383 | |
| Total Level 2 | | | 29,479,681 | | | | 91,588,258 | |
| Level 3 – | | | — | | | | — | |
| Total | | $ | 1,762,924,715 | | | $ | 2,048,136,760 | |
See the Schedule of Investments for the investments detailed by industry classification.
| | (b) | New Accounting Pronouncements: |
| | | In January, 2010, FASB issued Accounting Standards Update No. 2010-06, Improving Disclosures about Fair Value Measurements (“ASU 2010-06”). ASU 2010-06 will require new disclosures regarding transfers into and out of Levels 1 and 2 (effective for interim and annual periods beginning after December 15, 2009) as well as additional details regarding Level 3 transaction activity (effective for the interim and annual periods beginning after December 15, 2010). Management is currently evaluating the effect that this additional requirement will have on the Funds’ financial statements. |
| | (c) | Net realized gains and losses on sales of securities are computed on the identified cost basis. |
| | (d) | Dividend income is recorded on the ex-dividend date. Interest income is recorded on the accrual basis. |
| | (e) | The Funds have investments in short-term variable rate demand notes, which are unsecured instruments. The Funds may be susceptible to credit risk with respect to these notes to the extent the issuer defaults on its payment obligation. The Funds’ policy is to monitor the creditworthiness of the issuer and nonperformance by these counterparties is not anticipated. |
| | (f) | Accounting principles generally accepted in the United States of America (“GAAP”) require that permanent differences between income for financial reporting and tax purposes be reclassified in the capital accounts. |
The Brandywine Funds
Notes to Financial Statements (Continued)
September 30, 2010
| (1) | Summary of Significant Accounting Policies (Continued) |
| | (g) | The preparation of financial statements in conformity with GAAP requires management to make estimates and assumptions that affect the reported amounts of assets and liabilities and disclosure of contingent assets and liabilities at the date of the financial statements and the reported amounts of revenues and expenses during the reporting period. Actual results could differ from these estimates. |
| | (h) | No provision has been made for Federal income taxes since the Funds have elected to be taxed as “regulated investment companies” and intend to distribute substantially all net investment company taxable income and net capital gains to shareholders and otherwise comply with the provisions of the Internal Revenue Code applicable to regulated investment companies. |
| | (i) | The Funds have reviewed all open tax years and major jurisdictions, which include Federal and the state of Maryland, and concluded that there are no significant uncertain tax positions that would require recognition in the financial statements. Open tax years are those that are open for exam by taxing authorities and, as of September 30, 2010, open Federal tax years include the tax years ended September 30, 2007 through 2010. The Funds have no examinations in progress and are also not aware of any tax positions for which it is reasonably possible that the total amounts of unrecognized tax benefits will significantly change in the next twelve months. |
| (2) | Investment Adviser and Management Agreements and Transactions With Related Parties |
| | Each Fund has a management agreement with Friess Associates, LLC (the “Adviser”), with whom certain Officers and a Director of the Funds are affiliated, to serve as investment adviser and manager. Under the terms of the agreements, each Fund will pay the Adviser a monthly management fee at the annual rate of one percent (1%) on the daily net assets of such Fund. |
| | | The Adviser entered into sub-advisory agreements with its affiliate, Friess Associates of Delaware, LLC (the “Sub-Adviser”), to assist it in the day-to-day management of each of the Funds. The Adviser and, if so delegated, the Sub-Adviser supervise the investment portfolios of the Funds, directing the purchase and sale of investment securities in the day-to-day management of the Funds. The Adviser pays the Sub-Adviser a fee equal to 110% of the monthly expenses the Sub-Adviser incurs in performing its services as Sub-Adviser. This relationship does not increase the annual management fee the Funds pay to the Adviser. |
| | The Adviser has voluntarily agreed to reimburse each Fund for expenses over 2% of the daily net assets of the Fund. No such reimbursements were required for the year ended September 30, 2010. |
| | Each of the Funds pay the five independent directors annual fees of $20,500 each. The lead independent director and chairman of the audit committee are paid an additional $5,000 annually, divided proportionately among all the Funds. All of the corresponding fees the directors receive are paid quarterly to the directors and then invested on the payment date in shares of the Funds at the net asset value of the Funds on the payment date. The Funds also reimburse directors for travel costs incurred in order to attend meetings of the Board of Directors. For the year ended September 30, 2010, the Funds expensed the following directors fees and costs: |
| | Brandywine | Blue |
| | Fund | Fund |
| Directors Fees and Travel Costs Paid during the Year | $112,730 | $111,530 |
| | | Under the Funds’ organizational documents, each Director, officer, employee or other agent of the Fund (including the Funds’ investment manager) is indemnified, to the extent permitted by the Act, against certain liabilities that may arise out of performance of their duties to the Funds. Additionally, in the normal course of business, the Funds enter into contracts that contain a variety of indemnification clauses. The Funds’ maximum exposure under these arrangements is unknown as this would involve future claims that may be made against the Funds that have not yet occurred. However, the Funds have not had prior claims or losses pursuant to these contracts and believes the risk of loss to be remote. |
| | U.S. Bank, N.A. has made available to each Fund a credit facility pursuant to Credit Agreements effective July 22, 2004, for the purpose of having cash available to cover incoming redemptions. Each of the Funds has a $50,000,000 credit facility. Principal and interest of such loan under the Credit Agreements are due not more than 31 days after the date of the loan. Amounts under the credit facilities bear interest at a rate per annum equal to the current prime rate minus one percent on the amount borrowed. Advances will be collateralized by securities owned by the respective Fund. During the year ended September 30, 2010, neither Fund borrowed against their Agreement. The Credit Agreements are renewable annually on December 18. |
The Brandywine Funds
Notes to Financial Statements (Continued)
September 30, 2010
| (4) | Distributions to Shareholders |
| | | Net investment income and net realized gains, if any, are distributed to shareholders at least annually. |
| (5) | Investment Transactions |
| | For the year ended September 30, 2010, purchases and proceeds of sales of investment securities (excluding short-term investments) for the Funds were as follows: |
| | | | | | Sale | |
| | | Purchases | | | Proceeds | |
| Brandywine Fund | | $ | 4,317,428,089 | | | $ | 4,916,956,850 | |
| Blue Fund | | | 4,462,909,076 | | | | 5,033,020,088 | |
| (6) | Income Tax Information |
| | The following information for the Funds is presented on an income tax basis as of September 30, 2010: |
| | | | | | Gross | | | Gross | | | Net Unrealized | | | Distributable | | | Distributable | |
| | | Cost of | | | Unrealized | | | Unrealized | | | Appreciation | | | Ordinary | | | Long-Term | |
| | | Investments | | | Appreciation | | | Depreciation | | | on Investments | | | Income | | | Capital Gains | |
| Brandywine Fund | | $ | 1,592,853,513 | | | $ | 195,414,627 | | | $ | 25,343,425 | | | $ | 170,071,202 | | | $ | — | | | $ | — | |
| Blue Fund | | | 1,891,286,780 | | | | 206,332,768 | | | | 49,482,788 | | | | 156,849,980 | | | | — | | | | — | |
| | The difference, if any, between the cost amounts for financial statement and federal income tax purposes is due primarily to timing differences in recognizing certain gains and losses in security transactions. |
| | The tax components of dividends paid during the years ended September 30, 2010 and 2009, capital loss carryovers, which may be used to offset future capital gains, subject to Internal Revenue Code limitations (expiring in 2017 and 2018), as of September 30, 2010, and tax basis post-October losses as of September 30, 2010, which are not recognized for tax purposes until the first day of the following fiscal year are: |
| | | Ordinary | | | Long-Term | | | Net Capital | | | Post-October | | | Ordinary | | | Long-Term | |
| | | Income | | | Capital Gains | | | Loss | | | Currency | | | Income | | | | |
| | | Distributions | | | Distributions | | | Carryovers | | | Losses | | | Distributions | | | Distributions | |
| Brandywine Fund | | $ | — | | | $ | — | | | $ | 1,190,327,468 | | | $ | — | | | $ | 14,327,152 | | | $ | — | |
| Blue Fund | | | 7,553,091 | | | | — | | | $ | 1,505,316,850 | | | | 887 | | | | — | | | | — | |
| | | For corporate shareholders in the Blue Fund, the percentage of dividend income distributed for the year ended September 30, 2010, which is designated as qualifying for the dividends received deduction is 100% (unaudited). |
| | | For the shareholders in the Blue Fund, the percentage of dividend income distributed for the year ended September 30, 2010, which is designated as qualified dividend income under the Jobs and Growth Tax Relief Act of 2003 is 100% (unaudited). |
| | | Since there were no ordinary distributions paid for the Brandywine Fund for the year ended September 30, 2010, there were no distributions designated as qualifying for the dividends received deduction for corporate shareholders nor as qualified dividend income under the Jobs and Growth Tax Relief Act of 2003 (unaudited). |
Cost Discussion
Mutual fund shareholders incur two types of costs: (1) transaction costs, including sales charges (loads) on purchase payments, reinvested dividends, or other distributions; redemption fees; and exchange fees; and (2) ongoing costs, including management fees; distribution [and/or service] (12b-1) fees; and other fund expenses. Brandywine and Brandywine Blue do not have 12b-1 distribution fees. This example is intended to help you understand your ongoing costs (in dollars) of investing in the Brandywine Funds and to compare these costs with the ongoing costs of investing in other mutual funds.
In addition to the costs highlighted and described below, the only Fund transaction costs you might currently incur would be wire fees ($15 per wire), if you choose to have proceeds from a redemption wired to your bank account instead of receiving a check. Additionally, U.S. Bank charges an annual processing fee ($15) if you maintain an IRA account with the Funds. To determine your total costs of investing in the Funds, you would need to add any applicable wire or IRA processing fees you’ve incurred during the period to the costs provided in the example below.
The example is based on an investment of $1,000 invested at the beginning of the period and held for the entire period from April 1, 2010 through September 30, 2010.
Actual Expenses
The first line of the table below provides information about actual account values and actual expenses. You may use the information in this line, together with the amount you invested, to estimate the expenses that you paid over the period. Simply divide your account value by $1,000 (for example, an $8,600 account value divided by $1,000 = 8.6), then multiply the result by the number in the first line under the heading entitled “Expenses Paid During Period” to estimate the expenses you paid on your account during this period.
Hypothetical Example for Comparison Purposes
The second line of the table below provides information about hypothetical account values and hypothetical expenses based on the Fund’s actual expense ratio and an assumed rate of return of 5% per year before expenses, which is not the Fund’s actual return. The hypothetical account values and expenses may not be used to estimate the actual ending account balance or expenses you paid for the period. You may use this information to compare the ongoing costs of investing in the Funds and other funds. To do so, compare this 5% hypothetical example with the 5% hypothetical examples that appear in the shareholder reports of the other funds.
Please note that the expenses shown in the table are meant to highlight your ongoing costs only and do not reflect any transactional costs. While the Brandywine Funds currently do not assess sales charges, redemption or exchange fees, other funds do, and those costs will not be reflected in their expense example tables. Therefore, the second line of the table is useful in comparing ongoing costs only, and will not help you determine the relative total costs of owning different funds.
| | Beginning | Ending | |
| | Account | Account | Expenses Paid |
| | Value | Value | During Period* |
| | 4/01/10 | 9/30/10 | 4/01/10-9/30/10 |
| Brandywine Actual | $1,000.00 | $ 953.20 | $5.43 |
| Hypothetical (5% return before expenses) | $1,000.00 | $1,019.50 | $5.62 |
| Brandywine Blue Actual | $1,000.00 | $ 950.30 | $5.72 |
| Hypothetical (5% return before expenses) | $1,000.00 | $1,019.20 | $5.92 |
| * | Expenses are equal to the Funds’ annualized expense ratios of 1.11% and 1.17%, multiplied by the average account value over the period, multiplied by 183/365 (to reflect the one-half year period between April 1, 2010 and September 30, 2010). |
Additional Director Information, Proxy Voting Policyand Quarterly Portfolio Schedules
For additional information about the Directors and Officers or for a description of the policies and procedures that the Funds use to determine how to vote proxies relating to portfolio securities, please call (800) 656-3017 and request a Statement of Additional Information. One will be mailed to you free of charge. The Statement of Additional Information is also available on the website of the Securities and Exchange Commission (the “Commission”) at http://www.sec.gov or the Funds’ website at http://www.brandywinefunds.com. Information on how the Funds voted proxies relating to portfolio securities is available on the Funds’ website or the website of the Commission no later than August 31 for the prior twelve months ending June 30. The Funds file their complete schedule of portfolio holdings with the Commi ssion for the first and third quarters of each fiscal year on Form N-Q. The Funds’ Forms N-Q are available on the Commission’s website. The Funds’ Forms N-Q may be reviewed and copied at the Commission’s Public Reference Room in Washington, D.C. Information on the operation of the Public Reference Room may be obtained by calling 1-800-SEC-0330.
Brandywine Fund and Brandywine Blue Fund Directors and Officers
| | | Name, Age, Address | | Position, Term of Office and Length of Time Served and Number of Portfolios in Fund Complex Overseen by Director | | Principal Occupation During Past Five Years | | Other Directorships Held by Director |
| | | | | | | | | |
 | | C. Quentin S. Jackson, 66c/o Friess AssociatesP.O. Box 4166Greenville, DE 19807 | | | | Mr. Jackson is retired. He wasthe President and Chief ExecutiveOfficer of Nuclear ElectricInsurance Ltd., a multibillion-dollarcompany mutually owned by energycompanies. | | None |
| | | | | | | | | |
 | | Stuart A. McFarland, 63c/o Friess AssociatesP.O. Box 4166Greenville, DE 19807 | | | | Mr. McFarland is Managing Partnerof Federal City Capital Advisors, LLC,a financial advisory firm. He was theChairman of Federal CityBancorp, a thrift holding companyfrom April 2004 until June 2007. | | Helios Funds (8 portfolios)and Newcastle InvestmentCorporation |
| | | | | | | | | |
 | | W. Richard Scarlett III, 71c/o Friess AssociatesP.O. Box 4166Greenville, DE 19807 | | | | Mr. Scarlett is retired. He was thePresident and CEO of Jackson StateBank & Trust. He was the Chairmanand Chief Executive Officer of UnitedBancorporation of Wyoming, Inc.,from 1981 to July 2008. | | None |
| | | | | | | | | |
 | | Thomas D. Wren, 58c/o Friess AssociatesP.O. Box 4166Greenville, DE 19807 | | | | Mr. Wren is a senior advisor forPromontory Financial Group, LLC.He was the Treasurer of MBNACorporation and its MBNAAmerica Bank, N.A. subsidiaryfrom 1995 to 2006. | | ACM Financial Trust, Inc.and Hatteras FinancialCorp. |
| | | | | | | | | |
 | | James W. Zug, 70c/o Friess AssociatesP.O. Box 4166Greenville, DE 19807 | | | | Mr. Zug is a retired Partner ofPricewaterhouseCoopers LLP. Hewas employed with Pricewater-houseCoopers and its predecessorsfrom 1964 until 2000. | | Allianz Funds(29 portfolios),Amkor Technology, Inc.and Teleflex Inc. |
Brandywine Fund and Brandywine Blue Fund Directors and Officers
| "Interested Persons" of the Funds* | | Name, Age, Address | | Position, Term of Office and Length of Time Served and Number of Portfolios in Fund Complex Overseen by Director or Officer | | Principal Occupation During Past Five Years | | Other Directorships Held by Director or Officer |
| | | | | | | | | |
 | | William F. D’Alonzo*, 55c/o Friess AssociatesP.O. Box 4166Greenville, DE 19807 | | DirectorIndefinite Term sinceOctober 2001President since 2003 Chairman since 2004 3 Portfolios | | Mr. D’Alonzo joined FriessAssociates in 1981 as part of theresearch team, became Chief Investment Officer in 1997 andChief Executive Officer in 2002. | | None |
| | | | | | | | | |
 | | Lynda J. Campbell*, 64c/o Friess AssociatesP.O. Box 4166Greenville, DE 19807 | | Vice President since 1998Secretary since 1990Treasurer since 20073 Portfolios | | Ms. Campbell joined Friess Associ- ates in 1985, the year of Brandy- wine Fund's inception. Ms. Campbell is currently Chief Administrative Officer of the Friess Companies. | | None |
| | | | | | | | | |
 | | Joseph J. Fields*, 54c/o Friess AssociatesP.O. Box 4166Greenville, DE 19807 | | Vice President since 2007 3 Portfolios | | Mr. Fields joined Friess Associatesin 1999. He is currently aClient Relationship Managerof the Friess Companies. | | None |
| | | | | | | | | |
 | | Gordon Kaiser*, 51 c/o Friess Associates P.O. Box 4166Greenville, DE 19807 | | Vice President since 2007 3 Portfolios | | Mr. Kaiser joined Friess Associatesin 1999. He is currently aClient Relationship Managerof the Friess Companies. | | None |
| | | | | | | | | |
 | | David D. Marky*, 45 c/o Friess AssociatesP.O. Box 4166Greenville, DE 19807 | | Vice President since 2002 Chief Compliance Officer since 2004 | | Mr. Marky joined Friess Associatesin 2000. He currently serves asChief Compliance Officer for theFriess Companies. | | None |
| | | |
|  | The Brandywine Funds P.O. Box 4166 Greenville, DE 19807(800) 656-3017www.brandywinefunds.combfunds@friess.com |
For additional information about the Directors and Officers, please call (800) 656-3017 and request a Statement of Additional Information. One will be mailed to you free of charge.
| * | Messrs. D’Alonzo, Fields, Kaiser and Marky and Ms. Campbell are “interested persons” of the Funds as that term is defined in the Investment Company Act of 1940 by reason of their being officers of the Funds and employees of Friess Associates, LLC. |
“The reason for our continuing confidence is our view that all of the key elements of their process are being executed, and we have confidence that this process creates an edge that will result in long-term outperformance… We believe at some point Wall Street will recognize the stories Friess is uncovering, and that will translate into better earnings and higher stock prices for the companies they own.” - October 2010 Research Update, Litman/Gregory Analytics, LLC |
Capital Gains Update . . . The Brandywine Funds will not distribute capital gains stemming from fiscal 2010. Whether there are any capital gains distributions made for the calendar year will be determined over the last three months of 2010, but that possibility is very remote. Brandywine Fund finished the fiscal year with a net realized loss of approximately $14.97 per share. Brandywine Blue Fund’s net realized loss was approximately $16.15 per share. The Brandywine Funds will not make capital gains distributions, which are taxable events for shareholders in taxable accounts, until gains are realized in excess of the net loss amounts. Please check upcoming reports for updates. |
IRA Investors . . . The annual $15 maintenance fee for shareholders invested through IRA accounts is due on November 12, 2010. For your convenience, US Bancorp will automatically deduct this amount from your IRA on the due date, or if you prefer not to have the fee swept from your account, please send a check to US Bancorp by the due date. |
Definitions and Disclosures Performance data quoted represent past performance; past performance does not guarantee future results. The investment return and principal value of an investment will fluctuate so that an investor’s shares, when redeemed, may be worth more or less than their original cost. Current performance of the Funds may be lower or higher than the performance quoted. Performance data current to the most recent month end may be obtained by visiting www.brandywinefunds.com. The Funds’ investment objectives, risks, charges and expenses must be considered carefully before investing. The prospectus contains this and other important information about the investment companies, and it may be obtained by calling 1-800-656-3017, or visiting www.brandywinefunds.com. Read it carefully before investing. Fund holdings and sector weightings are subject to change at any time and are not recommendations to buy or sell any securities. Securities discussed were not held by the Funds as of 9/30/10, unless listed in the accompanying schedules of investments. Earnings growth rates quoted for the Funds refer solely to the estimated earnings growth rates of the average investment holding of the Funds based on consensus estimates from Baseline Financial Services, Inc. (Baseline) and not to the actual performance of the Funds themselves. Baseline provides analytical information and services to the investment community. The Russell 1000, Russell 1000 Growth, Russell 3000, Russell 3000 Growth and S&P 500 Indexes are unmanaged indexes commonly used to measure the performance of U.S. stocks. You cannot invest directly in an index. As of September 30, 2010, the Russell 1000 Index’s average annual total returns for 1, 5 and 10 years were 10.75, 0.86 and -0.21 percent; the Russell 1000 Growth Index’s were 12.65, 2.06 and -3.44 percent; the Russell 3000 Index’s were 10.96, 0.92 and 0.09 percent; the Russell 3000 Growth Index’s were 12.81, 2.08 and -3.19 percent; and the S&P 500 Index’s were 10.16, 0.64 and -0.43 percent. |
Investment Adviser: Friess Associates, LLC | Administrator, Accountant & Transfer Agent: U.S. Bancorp Fund Services, LLC |
Investment Sub-Adviser: Friess Associates of Delaware, LLC | Independent Registered Public Accounting Firm: PricewaterhouseCoopers LLP |
Custodian: U.S. Bank, N.A. | Legal Counsel: Foley & Lardner LLP |
| | |
Officers: William D’Alonzo, Chairman and President; Lynda Campbell, Vice President, Secretary and Treasurer; Joseph Fields, Vice President; Gordon Kaiser, Vice President; David Marky, Chief Compliance Officer, Vice President and Assistant Secretary |
| | |
| Report Editor: Chris Aregood | Report Staff: David Marky, Adam Rieger |
24
Item 2. Code of Ethics.
Registrant has adopted a code of ethics. See attached Exhibit 12 (a)(1).
Item 3. Audit Committee Financial Expert.
Registrant’s Board of Directors has determined that Mr. Stuart A. McFarland, a member of the audit committee, is an audit committee financial expert. Mr. McFarland is “independent” as such term is defined in Form N-CSR.
Item 4. Principal Accountant Fees and Services.
(a) Audit Fees
$30,050 (FY 2010) and $31,555 (FY 2009) are the aggregate fees billed for each of the last two fiscal years for professional services rendered by the principal accountant to the registrant for the audit of the registrant’s annual financial statements or services that are normally provided by the accountant in connection with statutory and regulatory filings or engagements for those fiscal years.
(b) Audit-Related Fees
There were no fees billed in the last two fiscal years for Audit-Related Fees.
There were no fees billed in the last two fiscal years for professional services rendered by the principal accountant to the registrant for tax compliance, tax advice, tax planning and tax return preparation.
(d) All Other Fees
There were no other fees billed in the last two fiscal years for products and services provided by the principal accountant to the registrant, other than the services reported in paragraphs (a) – (c) of this Item 4.
(e) (1) None
(e) (2) None
(f) Not applicable.
(g) $70,870 (FY 2010) and $81,472 (FY 2009) in non-audit fees were billed to the registrant’s investment adviser for tax return preparation and GIPS performance verification services.
(h) The Audit Committee of the registrant determined that the provision of non-audit services rendered to the registrant’s investment adviser by the principal accountant disclosed in paragraph (g) of this Item 4, was compatible with maintaining the principal accountant’s independence.
Item 5. Audit Committee of Listed Registrants.
Not applicable to registrants who are not listed issuers (as defined in Rule 10A-3 under the Securities Exchange Act of 1934).
Item 6. Schedule of Investments.
| (a) | The Schedule of Investments in securities of unaffiliated issuers is included as part of the report to shareholders filed under Item 1 of this Form. |
Item 7. Disclosure of Proxy Voting Policies and Procedures for Closed-End Management Investment Companies
Not applicable.
Item 8. Portfolio Managers of Closed-End Management Investment Companies.
Not applicable.
Item 9. Purchases of Equity Securities By Closed-End Management Investment Company and Affiliated Purchasers.
Not applicable.
Item 10. Submission of Matters to a Vote of Security Holders.
None.
Item 11. Controls and Procedures.
| (a) | The Registrant's disclosure controls and procedures are periodically evaluated. As of October 21, 2010, the date of the last evaluation, the Registrant's officers have concluded that the Registrant's disclosure controls and procedures are adequate. |
| (b) | The Registrant's internal controls are periodically evaluated. There were no changes in the Registrant's internal control over financial reporting that occurred during the second fiscal quarter of the period covered by this report that have materially affected, or are reasonably likely to materially affect, such controls. |
Item 12. Exhibits.
| (a) | (1) Any code of ethics or amendment thereto. Filed herewith. |
(2) Certifications pursuant to Section 302 of the Sarbanes-Oxley Act of 2002. Filed herewith.
(3) Any written solicitation to purchase securities under Rule 23c-1 under the Act sent or given during the period covered by the report by or on behalf of the Registrant to 10 or more persons. Not applicable to open-end investment companies.
| (b) | Certification pursuant to Section 906 of the Sarbanes-Oxley Act of 2002. Furnished herewith. |
SIGNATURES
Pursuant to the requirements of the Securities Exchange Act of 1934 and the Investment Company Act of 1940, the registrant has duly caused this report to be signed on its behalf by the undersigned, thereunto duly authorized.
Brandywine Fund, Inc.
Registrant
By /s/William F. D’Alonzo
William F. D’Alonzo Principal Executive Officer
Date October 21, 2010
Pursuant to the requirements of the Securities Exchange Act of 1934 and the Investment Company Act of 1940, this report has been signed below by the following persons on behalf of the registrant and in the capacities and on the dates indicated.
Brandywine Fund, Inc.
Registrant
By /s/Lynda J. Campbell
Lynda J. Campbell, Principal Financial Officer
Date October 21, 2010