UNITED STATES
SECURITIES AND EXCHANGE COMMISSION
Washington, D.C. 20549
FORM N-CSR
CERTIFIED SHAREHOLDER REPORT OF REGISTERED
MANAGEMENT INVESTMENT COMPANIES
Investment Company Act file number 811-04447
Brandywine Fund, Inc.
(Exact name of registrant as specified in charter)
P.O. Box 4166
Greenville, DE 19807
(Address of principal executive offices) (Zip code)
William F. D’Alonzo
P.O. Box 4166
Greenville, Delaware 19807
(Name and address of agent for service)
(302) 656-3017
Registrant's telephone number, including area code:
Date of fiscal year end: September 30
Date of reporting period: September 30, 2011
Item 1. Reports to Stockholders.
| Managed by Friess Associates, LLC | Annual Report | September 30, 2011 |
Dear Fellow Shareholders:
Renewed concerns about one nation’s ability to avoid buckling under its sovereign debt burden snowballed into volatility-stoking fear in the September quarter as investors considered how Greece’s problems could reverberate around the globe. Major indexes suffered their worst quarterly declines since the height of the financial crisis in the December quarter of 2008.
From isolated incident to full-fledged systemic shock, investors in recent months seemed to indicate that, wherever the European debt situation ultimately falls on the range of potential outcomes, people believe the economic outlook is no longer bright enough to warrant the kind of sizable progress stocks made over the first seven of the last 12 months.
Brandywine Fund declined 2.91 percent in its fiscal year through September 30. The Russell 3000 and Russell 3000 Growth Indexes gained 0.55 and 3.39 percent. Brandywine Blue Fund declined 1.29 percent in the 12 months through September as the S&P 500, Russell 1000 and Russell 1000 Growth Indexes gained 1.14, 0.91 and 3.78 percent.
The member states of the European Union, collectively, comprise the largest economy in the world. For China, which is relied upon as a primary engine of global growth, the E.U. represents its largest export market. The U.S. and E.U. economies are symbiotically entwined on too many levels to count. The point is bad news for the E.U. can be bad news for the global economy.
Unable to pinpoint how or quantify the degree to which the E.U.’s sovereign debt issues could become a widely shared concern, investors took a flee-now-seek-facts-later approach during the September quarter. Every economic sector experienced declines. On a relative basis, however, slow-growing, defensive areas such as the utilities and consumer staples sectors fared much better than sectors that are generally considered to be more sensitive to economic shifts.
The Brandywine Funds isolate companies demonstrating near-term earnings strength that also show intermediate-term potential, which put them in a bad spot as the market sought to redefine its vision of the upcoming economic landscape. Generally speaking, the companies we held delivered on the earnings front, but suffered due to skepticism about whether their above-average growth will prove to be sustainable.
We think so, but that’s a debate that can only be settled with time. As for the three months through September, the Brandywine Funds were at the mercy of sentiment that turned sharply against earnings-growth potential. Declines in the September quarter more than erased the leads Brandywine and Brandywine Blue enjoyed over their respective benchmarks through the first nine months of the fiscal year.
The price of a barrel of crude oil fell by 17 percent during the quarter as investors bet that deteriorating economic conditions would lead to reduced energy consumption. Companies from the energy sector were categorically dismissed.
| | | Brandywine | | | Brandywine Blue | |
| Cumulative Total Return | | % Change | | | % Change | |
| Quarter | | | -24.98 | | | | -18.03 | |
| One Year | | | -2.91 | | | | -1.29 | |
| Five Years | | | -23.39 | | | | -20.55 | |
| Ten Years | | | 7.81 | | | | 20.91 | |
| Inception | | | 937.72* | | | | 491.77** | |
| | | | | | | | | |
| Annualized Total Return | | | | | | | | |
| Five Years | | | -5.19 | | | | -4.50 | |
| Ten Years | | | 0.76 | | | | 1.92 | |
| Inception | | | 9.51* | | | | 8.96** | |
| *12/30/85 **1/10/91 | | | | | | | | |
| | | | | | | | | |
| Expense Ratio*** | | | | | | | | |
| Brandywine | | 1.11% | |
Brandywine Blue | | | 1.17% | |
***As stated in the Prospectus dated January 31, 2011
Performance data quoted represent past performance; past performance does not guarantee future results. The investment return and principal value of an investment will fluctuate so that an investor’s shares, when redeemed, may be worth more or less than their original cost. Current performance of the Funds may be lower or higher than the performance quoted. Performance data current to the most recent month end may be
obtained by visiting www.brandywinefunds.com.
Holdings from the energy sector detracted most from performance relative to the benchmarks in the quarter. The impact was more pronounced in the Brandywine portfolio, where energy holdings comprised a larger percentage of assets than the energy sector within the Russell 3000 Growth Index. Brandywine Blue’s commitment to the energy sector was in line with the sector within the Russell 1000 Growth Index.
Patterson-UTI Energy, an onshore contract driller, and Oil States International, which provides everything from undersea tubing to on-site worker accommodations to energy producers, weighed the most on Brandywine’s results. Both companies beat estimates with big June-quarter earnings growth. The consensus 2012 earnings estimate for each company was higher in September than it was in June, yet each company’s share price moved decidedly in the other direction. Halliburton (Brandywine Blue only) and McDermott International (both Funds) were the most notable energy detractors in the Brandywine Blue portfolio.
The technology sector was the next most significant detractor from performance versus benchmarks in both Funds. Like energy, the technology sector was hit hard and broadly. Investors applied their economic thesis in a way that suggested consumer and corporate spending on tech gear and software was about to flop. The technology sector represented the second largest percentage of assets in Brandywine and the largest percentage in Brandywine Blue.
Polycom exceeded June-quarter estimates with 54 percent earnings growth, but the company became a victim of the market’s fears about future corporate expenditures given that it makes conferencing equipment for businesses. Polycom finished the September quarter as one of Brandywine’s costliest holdings. Brandywine Blue had a similar experience with Citrix Systems, which makes application-delivery software used by businesses. Citrix topped estimates with 19 percent June-quarter earnings growth.
Keeping with the slowdown theme, holdings from the industrial sector also detracted from Brandywine’s results. Industrial holdings represented the Fund’s third largest sector and accounted for a greater percentage of assets than the sector within the Russell 3000 Growth Index. WABCO Holdings and Hertz Global Holdings were notable detractors from the industrial group as investors worried conditions would crimp demand for WABCO parts used in commercial vehicles and discourage business travel that might otherwise lead to Hertz car rentals.
Brandywine Blue’s performance gap versus the Russell 1000 Growth Index also stemmed from what the Fund didn’t hold. The strongest performing sector in the index was consumer staples, where Brandywine Blue maintained very limited exposure due to the lack of earnings growth in the space. The sector is traditionally considered to be defensive, which was a popular characteristic amid the volatility of the September quarter. The only company the Fund held from the sector during the period was Costco Wholesale.
For more information on holdings that influenced September-quarter performance, please see Roses & Thorns on page 4 for Brandywine and page 7 for Brandywine Blue.
We’re pleased to announce that the Brandywine Board of Directors at its September meeting unanimously elected Stephen Wynne to serve in the Independent Director position left vacant by Dick Scarlett’s retirement.
Steve brings with him more than three decades of experience in the mutual fund industry. He retired at the end of 2010 as Chief Executive Officer of the U.S. Funds Services business unit of Bank of New York Mellon, a position that arose from BNY Mellon’s acquisition of Steve’s previous company. Steve spent 33 years with PNC Global Investment Servicing, where he was appointed Chief Operating Officer in 2002, President in 2005 and Chief Executive in 2008. We’re confident Steve will be a valuable addition to the Board.
Investors made a lot of forward-looking assumptions about what the world might look like based mainly on their best guesses as to whether a foreign government’s sovereign debt mess will turn out to be containable over a yet-to-be-determined timeline. That doesn’t strike us as a formula for pinpoint forecasting.
We think the market got some things wrong in the months since it peaked on the last day of April. We recognize the potential for fallout from Europe’s sovereign debt problems, and we’re factoring related risk into our investment decisions. At the same time, the research legwork we’re conducting every day is not uncovering evidence of economic concerns that begin to approach the magnitude of what the market appeared to discount in the September quarter.
It seems to us that stocks have some correcting to do to the upside, particularly shares of companies that report earnings that refute the recent dire what-if scenarios for the economy. We believe the Brandywine Funds are full of companies that fit that description.
Thanks for your support in this volatile market environment!
 |  |
| | |
| Bill D’Alonzo | October 14, 2011 |
| Brandywine Funds President | |
| | |
| | |
 | |
Portfolio Characteristics as of September 30, 2011
% Change in Top Ten Holdings From Book Cost
| 1. Apple Inc. | +46.1% | | 6. VF Corp. | -1.4% | |
| 2. VeriFone Systems Inc. | -13.6% | | 7. Jarden Corp. | -14.2% | |
| 3. eBay Inc. | -10.0% | | 8. Jabil Circuit Inc. | +7.3% | |
| 4. Cardinal Health Inc. | -5.8% | | 9. Leggett & Platt Inc. | -20.7% | |
| 5. Harley Davidson Inc. | -13.0% | | 10. Target Corp. | -2.2% | |
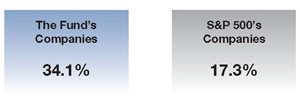
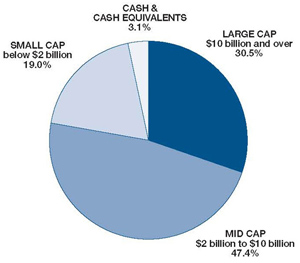
| Estimated Earnings Growth Rate | The Portfolio’s Market Capitalization |
| of the Fund’s Investments | |
| | |
 |  |
| |
| Forecasted Increase in Earnings Per Share |
| 2011 vs 2010 |
| |
| Source: Consensus estimates from Baseline Financial Services, Inc. |
| |
This is not a forecast of the Fund’s future performance. Earnings growth for a Fund holding does not guarantee a corresponding increase in the market value of the holding or the Fund. As of September 30, 2011, the S&P 500 Index’s average annual total returns for 1, 5 and 10 years were 1.14, -1.18 and 2.82 percent. |
| |
| |
| |
| |
| |
| |
| |
| |
| |
| |
| | |
| | |
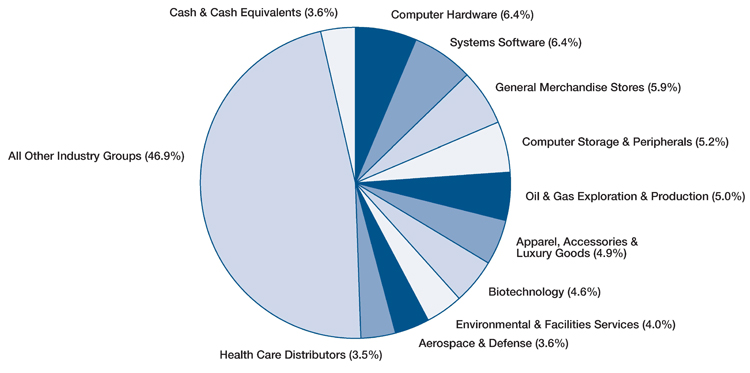
| Top Ten Industry Groups |
| |
 |
| |
| |
| |
| |
| |
|
Brandywine Fund
September Quarter “Roses and Thorns”
| | $ Gain | | | | |
Biggest $ Winners | (in millions) | % Gain | | Reason for Move | |
| | | | | | |
| Apple Inc. | $6.4 | 11.9 | | The maker of personal computers, software and mobile computing devices grew June-quarter earnings 122 percent, beating estimates by 33 percent. Revenue increased 82 percent, reflecting the company’s success in the high-growth markets for smartphones and tablets. Shipments of Apple’s iPhone and iPad increased 142 and 183 percent, respectively, during the quarter. Apple’s new product cycle, which includes an operating system, new versions of its Mac computers and the just-launched iPhone 4S, coincides with rapid expansion of its distribution network. | |
| Deckers Outdoor Corp. | $5.3 | 13.4 | | The owner of the UGG, Teva, TSUBO, Sanuk, Mozo, and Ahnu footwear brands topped June-quarter earnings estimates by 17 percent. New store openings and an expanding international footprint are helping expand sales of the company’s UGG sheepskin boots and other footwear while also opening new merchandising opportunities for accessories and apparel. We sold Deckers during the quarter when it reached our target price. | |
Church & Dwight Co. Inc. | $2.5 | 9.1 | | The maker of a broad range of consumer and specialty products under the Arm & Hammer brand name beat the consensus estimate with 11 percent June-quarter earnings growth. We purchased shares during the quarter as lower-than-expected gross profit margins, resulting from a spike in sales from a small low-margin business segment, caught some investors off guard. We expect strong results as margins normalize and the company continues to leverage the success of its core brands. | |
| Jabil Circuit Inc. | $2.3 | 7.3 | | The provider of electronics manufacturing services to aerospace, automotive, computing and consumer products customers grew August-quarter earnings 19 percent, topping estimates by 11 percent. Jabil raised earnings guidance for its November quarter. Jabil’s diversified manufacturing segment hasn’t shown evidence of economic weakness, with the company capitalizing on new outsourcing opportunities related to growth in health care, clean technology and emerging market demand. | |
| Genesco Inc. | $2.0 | 10.1 | | The mall-based retailer of branded footwear, hats and accessories grew July-quarter earnings to $0.22 per share from a loss of $0.02 a year ago, beating the consensus estimate by 120 percent. Revenue grew 29 percent as the company’s younger customer base responded favorably to merchandising strategies and popular brand offerings. Genesco’s recently announced acquisition of Scottish footwear maker Schuh marks its entrance into the U.K. footwear market and is expected to boost profitability. | |
| | $ Loss | | | | |
Biggest $ Losers | (in millions) | % Loss | | Reason for Move | |
| | | | | | |
Patterson-UTI Energy Inc. | $21.5 | 44.6 | | The provider of onshore contract drilling and pressure pumping services to oil and natural gas producers in North America grew June-quarter earnings to $0.52 per share from $0.11 a year ago, beating Wall Street estimates. While Patterson’s services remain in high demand following efforts to modernize equipment and expand in high-growth areas, shares fell as energy prices retreated during the quarter. | |
| WABCO Holdings Inc. | $18.0 | 36.1 | | The provider of advanced braking, stability, suspension and transmission control systems used in commercial vehicles grew June-quarter earnings 95 percent, beating the consensus estimate by 13 percent. Rising earnings-growth guidance confirmed strong end-market demand in Europe, America and China, but investors focused on Greece’s sovereign-debt crisis and potential for it to impact global economic growth. Given the company’s sizable exposure to Europe and emerging markets, we sold WABCO on concerns that macro-economic issues would create a lingering overhang. | |
Oil States International Inc. | $17.5 | 35.9 | | The provider of equipment and services to the oil and gas industry grew June-quarter earnings 89 percent, beating the consensus estimate by 13 percent. Despite record results and backlogged orders, shares traded lower on concerns that a global economic slowdown and falling energy prices would force energy companies to cancel capital expenditure plans. | |
TRW Automotive Holdings Corp. | $16.5 | 37.2 | | The supplier of braking and steering systems, safety products and other electronic automotive components grew June-quarter earnings 15 percent, beating the consensus estimate. Results continue to reflect strong demand for the company’s broad array of active and passive safety products amid increasing government regulation worldwide. Shares traded lower as deteriorating economic conditions caused investors to question future growth prospects. | |
OmniVision Technologies Inc. | $13.4 | 49.6 | | The maker of semiconductor image sensors for mobile device cameras grew July-quarter earnings 95 percent, beating estimates by 7 percent. Revenue jumped 43 percent. Despite the strong results, shares fell as tempered forward guidance reflected shipping delays and possible market-share losses. We sold OmniVision during the quarter to fund an idea with greater near-term earnings visibility. | |
All gains/losses are calculated on an average cost basis
Management’s Discussion of Results, Brandywine Fund
Sentiment extremes marked the fiscal year as investors focused on macro-level matters throughout much of the period. Investors began the period in celebratory fashion, boosting stocks in what seemed to be confidence in the European Union’s ability to avert crisis stemming from Greece’s sovereign debt problems. Market conditions began deteriorating in the spring, when investors started to view a lack of progress on the Greek situation as a resurgent threat with potentially widespread implications.
Brandywine Fund aims to capitalize on the long-term relationship between individual-company earnings performance and stock prices. Although the Fund executed its strategy to isolate rapidly growing companies likely to exceed earnings estimates, its approach was not effective in generating excess return for the fiscal year.
Appreciation for positive near-term earnings trends waned just past the period’s halfway point as investors worried that fallout from the debt crisis could reshape the global economic outlook.
Brandywine declined 2.91 percent in the 12 months through September 30, 2011. The Russell 3000 and Russell 3000 Growth Indexes gained 0.55 and 3.39 percent.
The Federal Reserve’s announced plan to intervene on the economy’s behalf by buying long-term Treasury bonds helped ignite a positive market environment at the fiscal year’s outset. The Fund posted its strongest quarterly return in 11 years during the final three months of 2010, outperforming its benchmarks. Holdings from the technology, consumer discretionary and energy sectors drove performance.
The environment remained positive in early 2011 despite revolutions in the Middle East, a major earthquake in Japan and a spike in oil prices. Energy and consumer discretionary holdings led the Fund to a second consecutive benchmark-leading quarterly return.
The climate stayed mostly upbeat until the market reached its high for the fiscal year on April 29. Investors fled previously strong sectors and sought refuge in traditionally defensive areas such as consumer staples and health care as concerns about Greece resurfaced and new data raised questions about the strength of the U.S. recovery.
Those worries grew, and the market decline accelerated into the fiscal year’s final quarter. Energy and technology holdings weighed on results as investors questioned the sustainability of their growth against a clouded macro backdrop.
| | | |
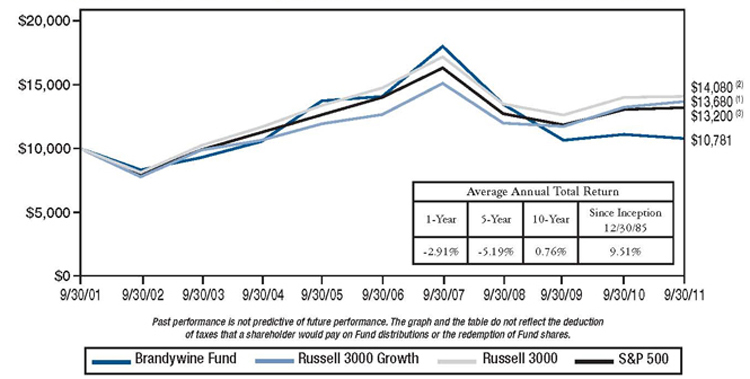
| | Comparison of Change in Value of $10,000 Investment in Brandywine Fund, Russell 3000 Growth(1), Russell 3000 Index(2) and S&P 500 Index(3) | |
| | |
| | | |
| |  | |
| | | |
| | (1) | The Russell 3000 Growth Index measures the performance of those Russell 3000 Index companies with higher price-to-book ratios and higher forecasted growth values. The stocks in this index are also members of either the Russell 1000 Growth or the Russell 2000 Growth Indexes and includes dividends. | |
| | (2) | The Russell 3000 Index, a trademark of the Frank Russell Company, is 3,000 of the largest publicly traded companies in the United States equity market and includes dividends. | |
| | (3) | The S&P 500 Index consists of 500 stocks, mostly on the New York Stock Exchange, selected by the Standard & Poor’s Ratings Group. Each stock’s weighting is based on its relative total market value and includes dividends. | |
Brandywine Blue Fund
Portfolio Characteristics as of September 30, 2011
% Change in Top Ten Holdings From Book Cost
| 1. Apple Inc. | +131.6% | | 6. Cardinal Health Inc. | +7.8% | |
| 2. Celgene Corp. | +13.8% | | 7. NIKE Inc. | +9.2% | |
| 3. Republic Services Inc. | -8.7% | | 8. Target Corp. | +2.6% | |
| 4. Check Point Software Technologies Ltd. | +15.0% | | 9. Teradata Corp. | +8.2% | |
| 5. Precision Castparts Corp. | +29.2% | | 10. eBay Inc. | -8.2% | |
| Estimated Earnings Growth Rate | The Portfolio’s Market Capitalization |
| of the Fund’s Investments | |
| | |
 |  |
| |
| Forecasted Increase in Earnings Per Share |
| 2011 vs 2010 |
| |
| Source: Consensus estimates from Baseline Financial Services, Inc. |
| |
This is not a forecast of the Fund’s future performance. Earnings growth for a Fund holding does not guarantee a corresponding increase in the market value of the holding or the Fund. As of September 30, 2011, the S&P 500 Index’s average annual total returns for 1, 5 and 10 years were 1.14, -1.18 and 2.82 percent. |
| |
| |
| |
| |
| |
| |
| |
| | |
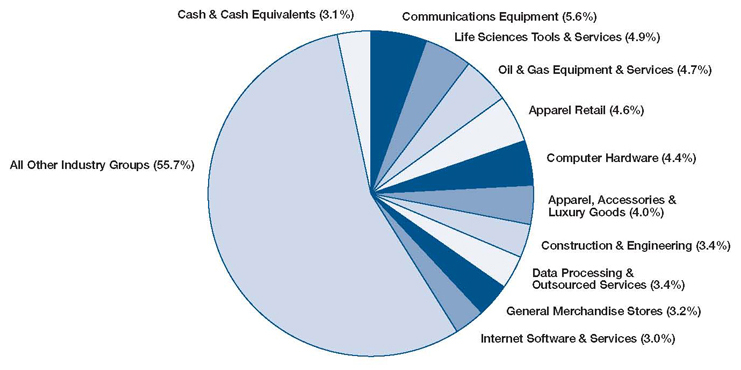
Top Ten Industry Groups
Brandywine Blue Fund
September Quarter “Roses and Thorns”
| | $ Gain | | | | |
Biggest $ Winners | (in millions) | % Gain | | Reason for Move | |
| | | | | | |
| Apple Inc. | $13.0 | 14.3 | | The maker of personal computers, software and mobile computing devices grew June-quarter earnings 122 percent, beating estimates by 33 percent. Revenue increased 82 percent, reflecting the company’s success in the high-growth markets for smartphones and tablets. Shipments of Apple’s iPhone and iPad increased 142 and 183 percent, respectively, during the quarter. Apple’s new product cycle, which includes an operating system, new versions of its Mac computers and the just-launched iPhone 4S, coincides with rapid expansion of its distribution network. | |
CF Industries Holdings Inc. | $10.7 | 23.7 | | The manufacturer of nitrogen and phosphate fertilizer products grew June-quarter earnings 174 percent to $6.87 per share, beating the consensus estimate. Shares gained ground following forecasts of deteriorating yields for the U.S. corn crop amid challenging weather conditions, raising expectations that farmers will require robust fall and spring nitrogen applications. Your team sold CF Industries during the quarter when it reached our target price. | |
| VF Corp. | $5.6 | 13.9 | | The global footwear and apparel manufacturer with a portfolio of more than 30 brands grew June-quarter earnings 12 percent, beating the consensus estimate. The company’s recent acquisition of Timberline adds new firepower to the company’s outdoor/action brands division, where brands such as North Face and Vans are experiencing strong domestic and international order trends. Our research shows improving trends for the company’s jeanswear business amid price increases that coincide with an expected reduction in cotton input costs. | |
| $5.6 | 12.3 | | The aftermarket auto parts retailer grew June-quarter earnings 19 percent. O’Reilly benefits from greater demand of maintenance and repair associated with owning cars for longer periods following a considerable period of depressed new-car sales. Hot summer weather in key markets helped drive higher sales of engine-related parts, while cost savings and other synergies associated with the company’s integration of CSK had a positive impact on profitability. | |
| Costco Wholesale Corp. | $3.1 | 10.2 | | The operator of membership warehouses of bargain-priced food and merchandise grew June-quarter earnings 11 percent. We purchased Costco during the September quarter after our research showed the company taking market share from traditional supermarkets and supercenters as it added new merchandise and expanded its international footprint. Rising membership fees are expected to boost earnings given that membership fees account for roughly 70 percent of profits. | |
| | $ Loss | | | | |
Biggest $ Losers | (in millions) | % Loss | | Reason for Move | |
| | | | | | |
| Halliburton Co. | $29.8 | 34.9 | | The provider of oilfield services grew June-quarter earnings 56 percent, exceeding expectations. Demand for the company’s package offerings of fully integrated drilling solutions remains elevated as oil and gas wells increase in complexity and depth. Still, shares fell amid concerns about Greece’s debt situation and its potential to impact global economic conditions that sent oil prices down 17 percent during the quarter. | |
Holdings Corp. | $24.1 | 34.9 | | The supplier of braking and steering systems, safety products and other electronic automotive components grew June-quarter earnings 15 percent, beating the consensus estimate. Results continue to reflect strong demand for the company’s broad array of active and passive safety products amid increasing government regulation worldwide. Shares traded lower as deteriorating economic conditions caused investors to question future growth prospects. | |
| FedEx Corp. | $23.3 | 26.8 | | The global provider of delivery services topped August-quarter earnings estimates with 22 percent growth. Despite the strong results, shares came under pressure as freight volumes slowed recently, with notably weaker volumes of goods traveling from China to the U.S. We sold FedEx during the quarter to fund an idea with greater near-term upside. | |
Holdings Inc. | $18.9 | 37.1 | | The operator of car and equipment rental centers grew June-quarter earnings 86 percent, beating the consensus estimate by 24 percent. Shares traded lower on general concerns related to macroeconomic weakness and the potential for reduced business and leisure travel. Our research shows that business unit growth, cost initiatives and planned acquisitions should continue to add to profitability even amid uncertain economic conditions. | |
International Inc. | $18.8 | 34.5 | | The engineering and construction company serving the offshore oil and gas industry recorded numerous project wins for its construction services segment, but macro-level threats prompted investors to question the economic recovery and flee economically sensitive sectors. We sold McDermott during the quarter due to the degree to which shares are subject to macroeconomic expectations in the current climate. | |
All gains/losses are calculated on an average cost basis
Management’s Discussion of Results, Brandywine Blue Fund
Brandywine Blue Fund employs an investment strategy that relies on bottom-up research to identify companies with unique earnings growth potential. The strategy is designed to capitalize on the long-running relationship between earnings performance and stock prices. While this approach generated positive absolute and relative results through the fiscal year’s first half, the Fund gave back its progress during the second half of the period amid macro-level threats that prompted investors to reassess their earlier optimism.
Brandywine Blue declined 1.29 percent in the 12 months through September 30, 2011. The S&P 500, Russell 1000 and Russell 1000 Growth Indexes gained 1.14, 0.91 and 3.78 percent.
The fiscal year started on a positive note. Stocks, which trended lower during the preceding summer, gained traction on news that the Federal Reserve would buy long-term Treasury bonds in an effort to spur lending activity. Investors overcame earlier fears regarding Greece’s sovereign debt crisis to bid shares higher.
Brandywine Blue outperformed its benchmarks with its strongest quarterly return in 11 years during the final three months of 2010. Consumer discretionary and energy holdings drove performance as investors rewarded earnings strength amid renewed economic optimism.
Positive momentum carried into early 2011. Revolutions in the Middle East pushed oil prices higher, drawing investor attention to the earnings strength demonstrated by Brandywine Blue’s energy holdings.
The Fund remained well into positive territory and ahead of its benchmarks on a fiscal-year-to-date basis through April. May marked the beginning of significant reversals in investor sentiment and the market’s direction. Investors increasingly grew to view a lack of new action by the European Union to help Greece avoid defaulting on its sovereign debt obligations as a material threat to stability in global markets.
Uncertainty mounted as time passed, and the decline accelerated. Investors favored areas considered defensive, such as the utilities and consumer staples sectors, where the Fund maintained limited exposure due to a lack of earnings strength among consumer staples companies. Oil prices fell as economic expectations were tempered, making the Fund’s energy holdings a drag on results late in the fiscal year as well.
| |
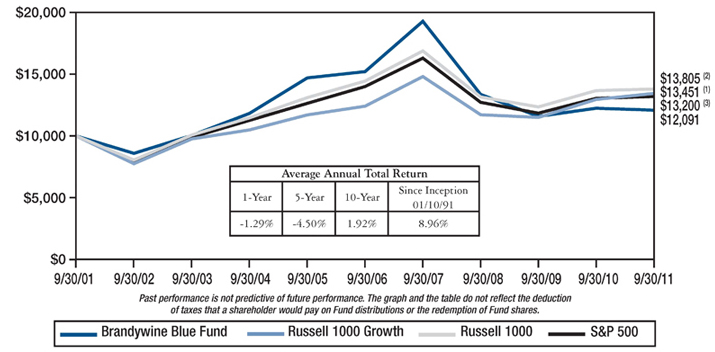
Comparison of Change in Value of $10,000 Investment in Brandywine Blue Fund, Russell 1000 Growth(1), Russell 1000 Index(2) and S&P 500 Index(3) |
| |
 |
| |
| | (1) | The Russell 1000 Growth Index measures the performance of those Russell 1000 Index companies with higher price-to-book ratios and higher forecasted growth values and includes dividends. | |
| | (2) | The Russell 1000 Index, a trademark of the Frank Russell Company, is the largest 1,000 companies of the 3,000 largest publicly traded companies in the United States equity market and includes dividends. | |
| | (3) | The S&P 500 Index consists of 500 stocks, mostly on the New York Stock Exchange, selected by the Standard & Poor’s Ratings Group. Each stock’s weighting is based on its relative total market value and includes dividends. | |
REPORT OF INDEPENDENT REGISTERED PUBLIC ACCOUNTING FIRM
To the Board of Directors and Shareholders of
Brandywine Fund, Inc. and Brandywine Blue Fund:
In our opinion, the accompanying statements of assets and liabilities, including the schedules of investments, and the related statements of operations and of changes in net assets and the financial highlights present fairly, in all material respects, the financial position of Brandywine Fund, Inc. and Brandywine Blue Fund (a series of Brandywine Blue Fund, Inc.) (the “Funds”) at September 30, 2011, the results of each of their operations for the year then ended, the changes in each of their net assets for each of the two years in the period then ended and the financial highlights for each of the five years in the period then ended, in conformity with accounting principles generally accepted in the United States of America. These financial statements and financial highlights (hereafter referred to as “financial statements”) are the responsibility of the Funds’ management; our responsibility is to express an opinion on these financial statements based on our audits. We conducted our audits of these financial statements in accordance with the standards of the Public Company Accounting Oversight Board (United States). Those standards require that we plan and perform the audit to obtain reasonable assurance about whether the financial statements are free of material misstatement. An audit includes examining, on a test basis, evidence supporting the amounts and disclosures in the financial statements, assessing the accounting principles used and significant estimates made by management, and evaluating the overall financial statement presentation. We believe that our audits, which included confirmation of securities at September 30, 2011 by correspondence with the custodian and brokers, provide a reasonable basis for our opinion.
 |
| |
| Milwaukee, Wisconsin |
| October 14, 2011 |
Brandywine Fund, Inc.
Statement of Assets and Liabilities
September 30, 2011
| Assets: | | | |
| Investments in securities, at value (cost $1,424,279,802) | | $ | 1,331,436,014 | |
| Receivable from investments sold | | | 26,661,175 | |
| Dividends and interest receivable | | | 998,112 | |
| Receivable from shareholders for purchases | | | 271,081 | |
| Cash | | | 2,975 | |
| Total assets | | $ | 1,359,369,357 | |
| | | | | |
| Liabilities: | | | | |
| Payable to brokers for investments purchased | | $ | 20,694,091 | |
| Payable to adviser for management fees | | | 1,196,128 | |
| Payable to shareholders for redemptions | | | 404,710 | |
| Other liabilities | | | 203,488 | |
| Total liabilities | | | 22,498,417 | |
| | | | | |
| Net Assets: | | | | |
| Capital Stock, $0.01 par value; 500,000,000 shares authorized; 62,530,853 shares outstanding | | | 2,306,374,383 | |
| Net unrealized depreciation on investments | | | (92,843,788 | ) |
| Accumulated net realized loss on investments | | | (876,659,655 | ) |
| Net assets | | | 1,336,870,940 | |
| Total liabilities and net assets | | $ | 1,359,369,357 | |
| | | | | |
| Calculation of net asset value per share: | | | | |
Net asset value, offering and redemption price per share ($1,336,870,940 ÷ 62,530,853 shares outstanding) | | $ | 21.38 | |
The accompanying notes to financial statements are an integral part of this statement.
Brandywine Fund, Inc.
Schedule of Investments
September 30, 2011
| Shares | | | | Cost | | | Value | |
| Common Stocks - 96.9% (a) | | | | | | |
| | | | | | | |
| CONSUMER DISCRETIONARY | | | | | | |
| | | | | | | | | |
| | | Apparel Retail - 4.6% | | | | | | |
| | 234,100 | | ANN Inc.* | | $ | 6,815,413 | | | $ | 5,346,844 | |
| | 462,738 | | Chico’s FAS Inc. | | | 6,447,223 | | | | 5,289,095 | |
| | 184,800 | | DSW Inc.* | | | 8,352,581 | | | | 8,534,064 | |
| | 144,000 | | Express Inc. | | | 2,233,663 | | | | 2,921,760 | |
| | 256,500 | | The Finish Line Inc. | | | 4,418,909 | | | | 5,127,435 | |
| | 641,300 | | Foot Locker Inc. | | | 9,806,962 | | | | 12,883,717 | |
| | 413,000 | | Genesco Inc.* | | | 19,323,501 | | | | 21,281,890 | |
| | | | | | | | | | | | |
| | | | Apparel, Accessories & Luxury Goods - 4.0% | | | | | | | | |
| | 475,500 | | Vera Bradley Inc.* | | | 17,398,652 | | | | 17,141,775 | |
| | 300,300 | | VF Corp. | | | 37,004,560 | | | | 36,492,456 | |
| | | | | | | | | | | | |
| | | | Auto Parts & Equipment - 1.2% | | | | | | | | |
| | 496,100 | | TRW Automotive Holdings Corp.* | | | 17,555,740 | | | | 16,237,353 | |
| | | | | | | | | | | | |
| | | | Footwear - 2.6% | | | | | | | | |
| | 528,000 | | Crocs Inc.* | | | 14,227,890 | | | | 12,497,760 | |
| | 733,200 | | Steven Madden Ltd.* | | | 26,742,021 | | | | 22,069,320 | |
| | | | | | | | | | | | |
| | | | General Merchandise Stores - 3.2% | | | | | | | | |
| | 128,400 | | Dollar Tree Inc.* | | | 9,102,839 | | | | 9,644,124 | |
| | 674,900 | | Target Corp. | | | 33,834,554 | | | | 33,097,096 | |
| | | | | | | | | | | | |
| | | | Home Furnishing Retail - 1.6% | | | | | | | | |
| | 308,900 | | Select Comfort Corp.* | | | 4,114,145 | | | | 4,315,333 | |
| | 568,600 | | Williams-Sonoma Inc. | | | 18,092,031 | | | | 17,507,194 | |
| | | | | | | | | | | | |
| | | | Home Furnishings - 2.5% | | | | | | | | |
| | 1,693,910 | | Leggett & Platt Inc. | | | 42,272,613 | | | | 33,522,479 | |
| | | | | | | | | | | | |
| | | | Housewares & Specialties - 2.7% | | | | | | | | |
| | 1,269,300 | | Jarden Corp. | | | 41,798,297 | | | | 35,870,418 | |
| | | | | | | | | | | | |
| | | | Internet Retail - 2.1% | | | | | | | | |
| | 62,860 | | Priceline.com Inc.* | | | 33,047,185 | | | | 28,253,055 | |
| | | | | | | | | | | | |
| | | | Motorcycle Manufacturers - 2.8% | | | | | | | | |
| | 1,090,700 | | Harley-Davidson Inc. | | | 43,057,785 | | | | 37,443,731 | |
| | | | | | | | | | | | |
| | | | Restaurants - 1.6% | | | | | | | | |
| | 745,000 | | Dunkin’ Brands Group Inc.* | | | 20,552,078 | | | | 20,636,500 | |
| | | | | | | | | | | | |
| | | | Specialized Consumer Services - 0.3% | | | | | | | | |
| | 111,800 | | Coinstar Inc.* | | | 4,969,748 | | | | 4,472,000 | |
| | | | | | | | | | | | |
| | | | Specialty Stores - 2.0% | | | | | | | | |
| | 480,900 | | Dick’s Sporting Goods Inc.* | | | 16,376,108 | | | | 16,090,914 | |
| | 65,187 | | GNC Acquisition Holdings Inc.* | | | 1,142,416 | | | | 1,311,562 | |
| | 277,500 | | Hibbett Sports Inc.* | | | 10,358,730 | | | | 9,404,475 | |
| | | | Total Consumer Discretionary | | | 449,045,644 | | | | 417,392,350 | |
| | | | | | | | | | | | |
| | | | This sector is 7.0% below your Fund’s cost. | | | | | | | | |
| | | | | | | | | | |
| CONSUMER STAPLES | | | | | | | | |
| | | | Household Products - 2.2% | | | | | | | | |
| | 668,100 | | Church & Dwight Co. Inc. | | | 27,075,945 | | | | 29,530,020 | |
| | | | Total Consumer Staples | | | 27,075,945 | | | | 29,530,020 | |
| | | | | | | | | | | | |
| | | | This sector is 9.1% above your Fund’s cost. | | | | | | | | |
| | | | | | | | | | | |
| ENERGY | | | | | | | | | | |
| | | | Oil & Gas Drilling - 2.0% | | | | | | | | |
| | 1,492,100 | | Patterson-UTI Energy Inc. | | $ | 33,183,620 | | | $ | 25,873,014 | |
| | | | | | | | | | | | |
| | | | Oil & Gas Equipment & Services - 4.7% | | | | | | | | |
| | 161,200 | | C&J Energy Services Inc.* | | | 4,027,548 | | | | 2,650,128 | |
| | 379,224 | | Key Energy Services Inc.* | | | 5,931,868 | | | | 3,598,836 | |
| | 345,800 | | Lufkin Industries Inc. | | | 22,323,457 | | | | 18,400,018 | |
| | 230,980 | | McDermott International Inc.* | | | 1,577,314 | | | | 2,485,345 | |
| | 499,900 | | Oil States International Inc.* | | | 36,106,732 | | | | 25,454,908 | |
| | 396,500 | | Superior Energy Services Inc.* | | | 14,442,357 | | | | 10,404,160 | |
| | | | | | | | | | | | |
| | | | Oil & Gas Exploration & Production - 2.4% | | | | | | | | |
| | 536,600 | | Energy XXI Ltd.* | | | 11,997,476 | | | | 11,510,070 | |
| | 903,100 | | Northern Oil and Gas Inc.* | | | 17,859,952 | | | | 17,511,109 | |
| | 554,000 | | SandRidge Energy Inc.* | | | 3,009,376 | | | | 3,080,240 | |
| | | | Total Energy | | | 150,459,700 | | | | 120,967,828 | |
| | | | | | | | | | | | |
| | | | This sector is 19.6% below your Fund’s cost. | | | | | | | | |
| | | | | | | | | | | |
| FINANCIALS | | | | | | | | | | |
| | | | Property & Casualty Insurance - 1.0% | | | | | | | | |
| | 914,700 | | Fidelity National Financial Inc. | | | 14,669,244 | | | | 13,885,146 | |
| | | | | | | | | | | | |
| | | | Specialized Finance - 0.3% | | | | | | | | |
| | 152,300 | | CBOE Holdings Inc. | | | 3,784,882 | | | | 3,726,781 | |
| | | | Total Financials | | | 18,454,126 | | | | 17,611,927 | |
| | | | | | | | | | | | |
| | | | This sector is 4.6% below your Fund’s cost. | | | | | | | | |
| | | | | | | | | | | |
| HEALTH CARE | | | | | | | | | | |
| | | | Biotechnology - 2.3% | | | | | | | | |
| | 495,600 | | Celgene Corp.* | | | 27,067,422 | | | | 30,687,552 | |
| | | | | | | | | | | | |
| | | | Health Care Distributors - 2.9% | | | | | | | | |
| | 924,000 | | Cardinal Health Inc. | | | 41,070,221 | | | | 38,697,120 | |
| | | | | | | | | | | | |
| | | | Health Care Equipment - 0.5% | | | | | | | | |
| | 186,500 | | Zoll Medical Corp.* | | | 8,032,380 | | | | 7,038,510 | |
| | | | | | | | | | | | |
| | | | Health Care Services - 0.4% | | | | | | | | |
| | 81,100 | | Air Methods Corp.* | | | 4,784,087 | | | | 5,163,637 | |
| | | | | | | | | | | | |
| | | | Life Sciences Tools & Services - 4.9% | | | | | | | | |
| | 826,300 | | Agilent Technologies Inc.* | | | 28,092,353 | | | | 25,821,875 | |
| | 594,100 | | Covance Inc.* | | | 28,664,629 | | | | 27,001,845 | |
| | 318,000 | | Illumina Inc.* | | | 13,349,578 | | | | 13,012,560 | |
| | | | | | | | | | | | |
| | | | Pharmaceuticals - 0.5% | | | | | | | | |
| | 325,100 | | Impax Laboratories Inc.* | | | 5,655,190 | | | | 5,822,541 | |
| | | | Total Health Care | | | 156,715,860 | | | | 153,245,640 | |
| | | | | | | | | | | | |
| | | | This sector is 2.2% below your Fund’s cost. | | | | | | | | |
| | | | | | | | | | | |
| INDUSTRIALS | | | | | | | | | | |
| | | | Aerospace & Defense - 2.8% | | | | | | | | |
| | 246,200 | | Esterline Technologies Corp.* | | | 17,544,526 | | | | 12,763,008 | |
| | 162,300 | | Precision Castparts Corp. | | | 20,452,008 | | | | 25,231,158 | |
| | | | | | | | | | | | |
| | | | Air Freight & Logistics - 0.7% | | | | | | | | |
| | 308,841 | | Hub Group Inc.* | | | 8,583,114 | | | | 8,730,935 | |
Brandywine Fund, Inc.
Schedule of Investments (Continued)
September 30, 2011
| | | | | | | | | |
| | | | | | | | | |
| Shares | | | | Cost | | | Value | |
| | | | | | | | | |
| Common Stocks - 96.9% (a) (Continued) | | | | | | |
| | | | | | | | | |
| | | Construction & Engineering - 3.4% | | | | | | |
| | 1,320,100 | | MasTec Inc.* | | $ | 25,103,270 | | | $ | 23,246,961 | |
| | 1,169,500 | | Quanta Services Inc.* | | | 22,328,246 | | | | 21,974,905 | |
| | | | | | | | | | | | |
| | | | Construction & Farm Machinery & Heavy Trucks - 2.3% | | | | | | | | |
| | 592,200 | | Wabtec Corp. | | | 36,434,086 | | | | 31,309,614 | |
| | | | | | | | | | | | |
| | | | Industrial Conglomerates - 1.7% | | | | | | | | |
| | 551,900 | | Danaher Corp. | | | 24,035,207 | | | | 23,146,686 | |
| | | | | | | | | | | | |
| | | | Industrial Machinery - 0.7% | | | | | | | | |
| | 252,100 | | Robbins & Myers Inc. | | | 10,437,999 | | | | 8,750,391 | |
| | | | | | | | | | | | |
| | | | Marine - 2.3% | | | | | | | | |
| | 578,500 | | Kirby Corp.* | | | 33,429,786 | | | | 30,452,240 | |
| | | | | | | | | | | | |
| | | | Railroads - 2.2% | | | | | | | | |
| | 275,800 | | Kansas City Southern* | | | 15,545,314 | | | | 13,778,968 | |
| | 263,500 | | Norfolk Southern Corp. | | | 19,013,632 | | | | 16,078,770 | |
| | | | | | | | | | | | |
| | | | Trucking - 0.7% | | | | | | | | |
| | 1,081,000 | | Hertz Global Holdings Inc.* | | | 15,509,761 | | | | 9,620,900 | |
| | | | Total Industrials | | | 248,416,949 | | | | 225,084,536 | |
| | | | | | | | | | | | |
| | | | This sector is 9.4% below your Fund’s cost. | | | | | | | | |
| | | | | | | | | | | | |
| INFORMATION TECHNOLOGY | | | | | | | | |
| | | | | | | | | | | | |
| | | | Application Software - 0.9% | | | | | | | | |
| | 567,000 | | Nuance Communications Inc.* | | | 11,714,605 | | | | 11,544,120 | |
| | | | | | | | | | | | |
| | | | Communications Equipment - 5.6% | | | | | | | | |
| | 208,793 | | Acme Packet Inc.* | | | 7,548,312 | | | | 8,892,494 | |
| | 190,900 | | Plantronics Inc. | | | 5,602,440 | | | | 5,431,105 | |
| | 1,550,600 | | Polycom Inc.* | | | 37,013,031 | | | | 28,484,522 | |
| | 657,000 | | Qualcomm Inc. | | | 36,252,249 | | | | 31,949,910 | |
| | | | | | | | | | | | |
| | | | Computer Hardware - 4.4% | | | | | | | | |
| | 156,444 | | Apple Inc.* | | | 40,807,493 | | | | 59,633,324 | |
| | | | | | | | | | | | |
| | | | Data Processing & Outsourced Services - 3.4% | | | | | | | | |
| | 1,304,990 | | VeriFone Systems Inc.* | | | 52,897,204 | | | | 45,700,750 | |
| | | | | | | | | | | | |
| | | | Electronic Manufacturing Services - 2.5% | | | | | | | | |
| | 1,912,200 | | Jabil Circuit Inc. | | | 31,708,905 | | | | 34,018,038 | |
| | | | | | | | | | | | |
| | | | Internet Software & Services - 3.0% | | | | | | | | |
| | 1,353,300 | | eBay Inc.* | | | 44,351,681 | | | | 39,908,817 | |
| | | | | | | | | | | | |
| | | | Semiconductors - 2.3% | | | | | | | | |
| | 1,691,900 | | Skyworks Solutions Inc.* | | | 36,536,895 | | | | 30,352,686 | |
| | | | | | | | | | | | |
| | | | Systems Software - 1.4% | | | | | | | | |
| | 1,158,800 | | Symantec Corp.* | | | 19,926,615 | | | | 18,888,440 | |
| | | | Total Information Technology | | | 324,359,430 | | | | 314,804,206 | |
| | | | | | | | | | | | |
| | | | This sector is 2.9% below your Fund’s cost. | | | | | | | | |
| | | | | | | | | | | | |
| MATERIALS | | | | | | | | | | |
| | | | | | | | | | | | |
| | | | Steel - 1.3% | | | | | | | | |
| | 374,600 | | Carpenter Technology Corp. | | $ | 13,768,435 | | | $ | 16,815,794 | |
| | | | Total Materials | | | 13,768,435 | | | | 16,815,794 | |
| | | | | | | | | | | | |
| | | | This sector is 22.1% above your Fund’s cost. | | | | | | | | |
| | | | | | | | | | | | |
| | | | Total common stocks | | | 1,388,296,089 | | | | 1,295,452,301 | |
| | | | | | | | | | | | |
| | Shares or | | | | | | | | | | |
| | Principal | | | | | | | | | | |
| | Amount | | | | | | | | | | |
| | | | | | | | | |
| Short-Term Investments - 2.7% (a) | | | | | | | | |
| | | | | | | | | | | | |
| | | | Commercial Paper - 2.5% | | | | | | | | |
| $ | 33,800,000 | | Prudential Funding LLC, | | | | | | | | |
| | | | due 10/03/11, | | | | | | | | |
| | | | discount of 0.10% | | | 33,799,812 | | | | 33,799,812 | |
| | | | | | | | | | | | |
| | | | Variable Rate Demand Note - 0.2% | | | | | | | | |
| | 2,183,901 | | American Family Financial | | | | | | | | |
| | | | Services, 0.10% | | | 2,183,901 | | | | 2,183,901 | |
| | | | Total short-term investments | | | 35,983,713 | | | | 35,983,713 | |
| | | | Total investments - 99.6% | | $ | 1,424,279,802 | | | | 1,331,436,014 | |
| | | | Other assets, less | | | | | | | | |
| | | | liabilities - 0.4% (a) | | | | | | | 5,434,926 | |
| | | | TOTAL NET ASSETS - 100.0% | | | | | | $ | 1,336,870,940 | |
| (a) | Percentages for the various classifications relate to net assets. |
| * | Non-dividend paying security. |
The accompanying notes to financial statements are an integral part of this schedule.
Brandywine Fund, Inc.
Statement of Operations
For the Year Ended September 30, 2011
| Income: | | | |
| Dividends | | $ | 13,540,848 | |
| Interest | | | 78,243 | |
| Total income | | | 13,619,091 | |
| | | | | |
| Expenses: | | | | |
| Management fees | | | 18,413,222 | |
| Transfer agent fees | | | 977,840 | |
| Administrative and accounting services | | | 207,141 | |
| Printing and postage expense | | | 167,556 | |
| Board of Directors fees and expenses | | | 124,225 | |
| Custodian fees | | | 119,480 | |
| Professional fees | | | 55,114 | |
| Registration fees | | | 47,185 | |
| Insurance expense | | | 46,889 | |
| Other expenses | | | 1,925 | |
| Total expenses | | | 20,160,577 | |
| | | | | |
| Net Investment Loss | | | (6,541,486 | ) |
| Net Realized Gain on Investments | | | 317,490,769 | |
| Net Decrease in Unrealized Appreciation on Investments | | | (266,737,876 | ) |
| Net Gain on Investments | | | 50,752,893 | |
| Net Increase in Net Assets Resulting From Operations | | $ | 44,211,407 | |
Statements of Changes in Net Assets
For the Years Ended September 30, 2011 and 2010
| | | 2011 | | | 2010 | |
| Operations: | | | | | | |
| Net investment loss | | $ | (6,541,486 | ) | | $ | (6,691,589 | ) |
| Net realized gain on investments | | | 317,490,769 | | | | 168,156,155 | |
| Net decrease in unrealized appreciation on investments | | | (266,737,876 | ) | | | (78,682,801 | ) |
| Net increase in net assets resulting from operations | | | 44,211,407 | | | | 82,781,765 | |
| | | | | | | | | |
| Fund Share Activities: | | | | | | | | |
| Proceeds from shares issued (7,644,065 and 5,907,401 shares, respectively) | | | 196,448,187 | | | | 129,867,845 | |
| Cost of shares redeemed (24,862,946 and 34,266,723 shares, respectively) | | | (659,542,217 | ) | | | (738,576,591 | ) |
| Net decrease in net assets derived from Fund share activities | | | (463,094,030 | ) | | | (608,708,746 | ) |
| Total Decrease | | | (418,882,623 | ) | | | (525,926,981 | ) |
| | | | | | | | | |
| Net Assets at the Beginning of the Year | | | 1,755,753,563 | | | | 2,281,680,544 | |
| Net Assets at the End of the Year | | $ | 1,336,870,940 | | | $ | 1,755,753,563 | |
| (Includes undistributed net investment income of $0 and $0, respectively) | | | | | | | | |
The accompanying notes to financial statements are an integral part of these statements.
Brandywine Fund, Inc.
Financial Highlights
(Selected data for each share of the Fund outstanding throughout each year)
| | | Years Ended September 30, | |
| | | 2011 | | | 2010 | | | 2009 | | | 2008 | | | 2007 | |
| PER SHARE OPERATING PERFORMANCE: | | | | | | | | | | | | | | | |
| Net asset value, beginning of year | | $ | 22.02 | | | $ | 21.11 | | | $ | 26.86 | | | $ | 40.98 | | | $ | 32.27 | |
| | | | | | | | | | | | | | | | | | | | | |
| Income from investment operations: | | | | | | | | | | | | | | | | | | | | |
Net investment loss(1) | | | (0.09 | ) | | | (0.07 | ) | | | (0.05 | ) | | | (0.18 | ) | | | (0.19 | ) |
| Net realized and unrealized (losses) gains | | | | | | | | | | | | | | | | | | | | |
| on investments | | | (0.55 | ) | | | 0.98 | | | | (5.59 | ) | | | (8.72 | ) | | | 9.15 | |
| Total from investment operations | | | (0.64 | ) | | | 0.91 | | | | (5.64 | ) | | | (8.90 | ) | | | 8.96 | |
| | | | | | | | | | | | | | | | | | | | | |
| Less distributions: | | | | | | | | | | | | | | | | | | | | |
| Distributions from net investment income | | | — | | | | — | | | | — | | | | — | | | | — | |
| Distributions from net realized gains | | | — | | | | — | | | | (0.11 | ) | | | (5.22 | ) | | | (0.25 | ) |
| Total from distributions | | | — | | | | — | | | | (0.11 | ) | | | (5.22 | ) | | | (0.25 | ) |
| Net asset value, end of year | | $ | 21.38 | | | $ | 22.02 | | | $ | 21.11 | | | $ | 26.86 | | | $ | 40.98 | |
| TOTAL RETURN | | | (2.91 | %) | | | 4.31 | % | | | (20.98 | %) | | | (25.16 | %) | | | 27.90 | % |
| | | | | | | | | | | | | | | | | | | | | |
| RATIOS/SUPPLEMENTAL DATA: | | | | | | | | | | | | | | | | | | | | |
| Net assets, end of year (in 000’s $) | | | 1,336,871 | | | | 1,755,754 | | | | 2,281,681 | | | | 3,421,787 | | | | 4,851,268 | |
| Ratio of expenses to average net assets | | | 1.09 | % | | | 1.11 | % | | | 1.10 | % | | | 1.08 | % | | | 1.08 | % |
| Ratio of net investment loss | | | | | | | | | | | | | | | | | | | | |
| to average net assets | | | (0.36 | %) | | | (0.33 | %) | | | (0.25 | %) | | | (0.54 | %) | | | (0.54 | %) |
| Portfolio turnover rate | | | 234 | % | | | 225 | % | | | 239 | % | | | 210 | % | | | 162 | % |
(1) Net investment loss per share was calculated using average shares outstanding.
The accompanying notes to financial statements are an integral part of this statement.
Brandywine Blue Fund
Statement of Assets and Liabilities
September 30, 2011
| Assets: | | | |
| Investments in securities, at value (cost $1,534,158,166) | | $ | 1,539,345,634 | |
| Receivable from investments sold | | | 37,039,975 | |
| Dividends and interest receivable | | | 1,358,625 | |
| Receivable from shareholders for purchases | | | 1,082,553 | |
| Total assets | | $ | 1,578,826,787 | |
| | | | | |
| Liabilities: | | | | |
| Payable to brokers for investments purchased | | $ | 65,485,072 | |
| Payable to shareholders for redemptions | | | 24,003,077 | |
| Payable to adviser for management fees | | | 1,383,319 | |
| Other liabilities | | | 438,038 | |
| Total liabilities | | | 91,309,506 | |
| | | | | |
| Net Assets: | | | | |
| Capital Stock, $0.01 par value; 500,000,000 shares authorized; 69,187,693 shares outstanding | | | 2,791,005,471 | |
| Net unrealized appreciation on investments | | | 5,187,468 | |
| Accumulated net realized loss on investments | | | (1,308,675,658 | ) |
| Net assets | | | 1,487,517,281 | |
| Total liabilities and net assets | | $ | 1,578,826,787 | |
| | | | | |
| Calculation of net asset value per share: | | | | |
| Net asset value, offering and redemption price per share ($1,487,517,281 ÷ 69,187,693 shares outstanding) | | $ | 21.50 | |
The accompanying notes to financial statements are an integral part of this statement.
Schedule of Investments
September 30, 2011
| Shares | | | | | | | Value | |
| Common Stocks - 96.4% (a) | | | | | | |
| | | | | | | |
| CONSUMER DISCRETIONARY | | | | | | |
| | | | | | | | | |
| | | Apparel Retail - 2.6% | | | | | | |
| | 685,000 | | The TJX Companies Inc. | | $ | 36,060,596 | | | $ | 37,996,950 | |
| | | | | | | | | | | | |
| | | | Apparel, Accessories & Luxury Goods - 4.9% | | | | | | | | |
| | 342,400 | | Fossil Inc.* | | | 33,640,601 | | | | 27,754,944 | |
| | 376,950 | | VF Corp. | | | 40,205,576 | | | | 45,806,964 | |
| | | | | | | | | | | | |
| | | | Auto Parts & Equipment - 3.2% | | | | | | | | |
| | 435,000 | | BorgWarner Inc.* | | | 26,854,110 | | | | 26,330,550 | |
| | 642,300 | | TRW Automotive Holdings Corp.* | | | 30,618,256 | | | | 21,022,479 | |
| | | | | | | | | | | | |
| | | | Automotive Retail - 2.4% | | | | | | | | |
| | 537,900 | | O’Reilly Automotive Inc.*. | | | 32,070,011 | | | | 35,840,277 | |
| | | | | | | | | | | | |
| | | | Footwear - 3.5% | | | | | | | | |
| | 610,300 | | NIKE Inc. | | | 47,775,117 | | | | 52,186,753 | |
| | | | | | | | | | | | |
| | | | General Merchandise Stores - 5.9% | | | | | | | | |
| | 699,200 | | Dollar General Corp.* | | | 24,297,200 | | | | 26,401,792 | |
| | 142,200 | | Dollar Tree Inc.* | | | 10,097,959 | | | | 10,680,642 | |
| | 1,027,500 | | Target Corp. | | | 49,127,633 | | | | 50,388,600 | |
| | | | | | | | | | | | |
| | | | Internet Retail - 2.8% | | | | | | | | |
| | 94,260 | | Priceline.com Inc.* | | | 49,149,127 | | | | 42,366,099 | |
| | | | | | | | | | | | |
| | | | Motorcycle Manufacturers - 3.3% | | | | | | | | |
| | 1,422,100 | | Harley-Davidson Inc. | | | 55,143,971 | | | | 48,820,693 | |
| | | | Total Consumer Discretionary | | | 435,040,157 | | | | 425,596,743 | |
| | | | | | | | | | | | |
| | | | This sector is 2.2% below your Fund’s cost. | | | | | | | | |
| | | | | | | | | | |
| CONSUMER STAPLES | | | | | | | | |
| | | | Household Products - 0.2% | | | | | | | | |
| | 61,600 | | Church & Dwight Co. Inc. | | | 2,646,666 | | | | 2,722,720 | |
| | | | | | | | | | | | |
| | | | Hypermarkets & Super Centers - 2.1% | | | | | | | | |
| | 382,800 | | Costco Wholesale Corp. | | | 28,558,412 | | | | 31,435,536 | |
| | | | Total Consumer Staples | | | 31,205,078 | | | | 34,158,256 | |
| | | | | | | | | | | | |
| | | | This sector is 9.5% above your Fund’s cost. | | | | | | | | |
| ENERGY | | | | | | | | | | |
| | | | | | | | | | | | |
| | | | Oil & Gas Equipment & Services - 1.0% | | | | | | | | |
| | 500,300 | | Halliburton Co. | | | 14,669,162 | | | | 15,269,156 | |
| | | | | | | | | | | | |
| | | | Oil & Gas Exploration & Production - 5.0% | | | | | | | | |
| | 470,600 | | Concho Resources Inc.* | | | 38,547,665 | | | | 33,478,484 | |
| | 615,100 | | Pioneer Natural Resources Co. | | | 52,145,922 | | | | 40,455,127 | |
| | | | Total Energy | | | 105,362,749 | | | | 89,202,767 | |
| | | | | | | | | | | | |
| | | | This sector is 15.3% below your Fund’s cost. | | | | | | | | |
Brandywine Blue Fund
Schedule of Investments (Continued)
September 30, 2011
| Shares | | | | Cost | | | Value | |
| Common Stocks - 96.4% (a) (Continued) | | | | | | |
| | | | | | | | | |
| HEALTH CARE | | | | | | | | |
| | | | | | | | | |
| | | Biotechnology - 4.6% | | | | | | |
| | 1,091,500 | | Celgene Corp.* | | $ | 59,364,914 | | | $ | 67,585,680 | |
| | | | | | | | | | | | |
| | | | Health Care Distributors - 3.5% | | | | | | | | |
| | 1,259,700 | | Cardinal Health Inc. | | | 48,924,650 | | | | 52,756,236 | |
| | | | | | | | | | | | |
| | | | Health Care Equipment - 2.6% | | | | | | | | |
| | 1,631,900 | | CareFusion Corp.* | | | 45,251,781 | | | | 39,084,005 | |
| | | | | | | | | | | | |
| | | | Life Sciences Tools & Services - 3.2% | | | | | | | | |
| | 1,522,100 | | Agilent Technologies Inc.* | | | 52,086,085 | | | | 47,565,625 | |
| | | | Total Health Care | | | 205,627,430 | | | | 206,991,546 | |
| | | | | | | | | | | | |
| | | | This sector is 0.7% above your Fund’s cost. | | | | | | | | |
| INDUSTRIALS | | | | | | | | | | |
| | | | | | | | | | | | |
| | | | Aerospace & Defense - 3.6% | | | | | | | | |
| | 344,900 | | Precision Castparts Corp. | | | 41,505,961 | | | | 53,618,154 | |
| | | | | | | | | | | | |
| | | | Environmental & Facilities Services - 4.0% | | | | | | | | |
| | 2,102,300 | | Republic Services Inc. | | | 64,581,520 | | | | 58,990,538 | |
| | | | | | | | | | | | |
| | | | Industrial Conglomerates - 2.8% | | | | | | | | |
| | 1,002,400 | | Danaher Corp. | | | 43,780,901 | | | | 42,040,656 | |
| | | | | | | | | | | | |
| | | | Railroads - 2.9% | | | | | | | | |
| | 395,809 | | Kansas City Southern* | | | 21,635,460 | | | | 19,774,618 | |
| | 369,700 | | Norfolk Southern Corp. | | | 26,650,545 | | | | 22,559,094 | |
| | | | | | | | | | | | |
| | | | Trucking - 1.4% | | | | | | | | |
| | 2,402,200 | | Hertz Global Holdings Inc.* | | | 33,104,626 | | | | 21,379,580 | |
| | | | Total Industrials | | | 231,259,013 | | | | 218,362,640 | |
| | | | | | | | | | | | |
| | | | This sector is 5.6% below your Fund’s cost. | | | | | | | | |
| | | | | | | | | |
| INFORMATION TECHNOLOGY | | | | | | | | |
| | | | | | | | | | | | |
| | | | Application Software - 2.9% | | | | | | | | |
| | 466,900 | | Citrix Systems Inc.* | | | 32,786,325 | | | | 25,460,057 | |
| | 877,000 | | Nuance Communications Inc.* | | | 18,149,229 | | | | 17,855,720 | |
| | | | | | | | | | | | |
| | | | Communications Equipment - 3.3% | | | | | | | | |
| | 1,003,800 | | Qualcomm Inc. | | | 56,006,385 | | | | 48,814,794 | |
| | | | | | | | | | | | |
| | | | Computer Hardware - 6.4% | | | | | | | | |
| | 247,900 | | Apple Inc.* | | | 40,808,902 | | | | 94,494,522 | |
| | | | | | | | | | | | |
| | | | Computer Storage & Peripherals - 5.2% | | | | | | | | |
| | 2,083,900 | | EMC Corp.* | | | 46,290,657 | | | | 43,741,061 | |
| | 852,600 | | SanDisk Corp.* | | | 36,553,543 | | | | 34,402,410 | |
| | | | | | | | | | | | |
| | | | Internet Software & Services - 3.3% | | | | | | | | |
| | 1,655,600 | | eBay Inc.* | | | 53,203,820 | | | | 48,823,644 | |
| | | | | | | | | | | | |
| | | | IT Consulting & Other Services - 3.4% | | | | | | | | |
| | 933,800 | | Teradata Corp.* | | | 46,204,045 | | | | 49,986,314 | |
| | | | | | | | | | | | |
| | | | Systems Software - 6.4% | | | | | | | | |
| | 1,021,500 | | Check Point Software | | | | | | | | |
| | | | Technologies Ltd.* | | | 46,860,657 | | | | 53,894,340 | |
| | 2,550,700 | | Symantec Corp.* | | | 42,815,766 | | | | 41,576,410 | |
| | | | Total Information Technology | | | 419,679,329 | | | | 459,049,272 | |
| | | | | | | | | | | | |
| | | | This sector is 9.4% above your Fund’s cost. | | | | | | | | |
| | | | | | | | | | | | |
| | | | Total common stocks | | | 1,428,173,756 | | | | 1,433,361,224 | |
| | Shares or | | | | | | | | | | |
| | Principal | | | | | | | | | | |
| | Amount | | | | | | | | | | |
| | | | | | | | | | | | |
| Short-Term Investments - 7.1% (a) | | | | | | | | |
| | | | Commercial Paper - 7.0% | | | | | | | | |
| | | | | | | | | | | | |
| $ | 104,600,000 | | Prudential Funding LLC, | | | | | | | | |
| | | | due 10/03/11, | | | | | | | | |
| | | | discount of 0.10%........................ | | | 104,599,419 | | | | 104,599,419 | |
| | | | | | | | | | | | |
| | | | Variable Rate Demand Note - 0.1% | | | | | | | | |
| | 1,384,991 | | American Family Financial | | | | | | | | |
| | | | Services, 0.10% | | | 1,384,991 | | | | 1,384,991 | |
| | | | Total short-term investments | | | 105,984,410 | | | | 105,984,410 | |
| | | | Total investments - 103.5% | | $ | 1,534,158,166 | | | | 1,539,345,634 | |
| | | | Liabilities, less | | | | | | | | |
| | | | other assets - (3.5%)(a) | | | | | | | (51,828,353 | ) |
| | | | TOTAL NET ASSETS - 100.0% | | | | | | $ | 1,487,517,281 | |
| (a) | Percentages for the various classifications relate to net assets. |
| * | Non-dividend paying security. |
The accompanying notes to financial statements are an integral part of this schedule.
Brandywine Blue Fund
Statement of Operations
For the Year Ended September 30, 2011
| Income: | | | |
| Dividends | | $ | 16,753,744 | |
| Interest | | | 152,364 | |
| Total income | | | 16,906,108 | |
| Expenses: | | | | |
| Management fees | | | 21,271,021 | |
| Transfer agent fees | | | 2,120,187 | |
| Printing and postage expense | | | 970,775 | |
| Administrative and accounting services | | | 217,433 | |
| Board of Directors fees and expenses | | | 126,702 | |
| Custodian fees | | | 123,800 | |
| Registration fees | | | 85,705 | |
| Professional fees | | | 55,149 | |
| Insurance expense | | | 51,517 | |
| Other expenses. | | | 13,535 | |
| Total expenses | | | 25,035,824 | |
| Net Investment Loss | | | (8,129,716 | ) |
| Net Realized Gain on Investments | | | 216,689,924 | |
| Net Decrease in Unrealized Appreciation on Investments | | | (171,710,740 | ) |
| Net Gain on Investments | | | 44,979,184 | |
| Net Increase in Net Assets Resulting From Operations | | $ | 36,849,468 | |
Statements of Changes in Net Assets
For the Years Ended September 30, 2011 and 2010
| | | 2011 | | | 2010 | |
| Operations: | | | | | | |
| Net investment loss | | $ | (8,129,716 | ) | | $ | (5,994,541 | ) |
| Net realized gain on investments | | | 216,689,924 | | | | 167,418,597 | |
| Net decrease in unrealized appreciation on investments | | | (171,710,740 | ) | | | (36,891,471 | ) |
| Net increase in net assets resulting from operations | | | 36,849,468 | | | | 124,532,585 | |
| | | | | | | | | |
| | | | | | | | | |
| Distributions to Shareholders: | | | | | | | | |
| Distributions from net investment income ($0.06695 per share) | | | — | | | | (7,553,091 | ) |
| | | | | | | | | |
| Fund Share Activities: | | | | | | | | |
| Proceeds from shares issued (15,420,697 and 28,161,958 shares, respectively) | | | 387,493,439 | | | | 605,605,866 | |
| Net asset value of shares issued in distributions reinvested (334,201 shares) | | | — | | | | 6,963,847 | |
| Cost of shares redeemed (40,706,584 and 53,126,826 shares, respectively) | | | (994,416,731 | ) | | | (1,133,864,678 | ) |
| Net decrease in net assets derived from Fund share activities | | | (606,923,292 | ) | | | (521,294,965 | ) |
| Total Decrease | | | (570,073,824 | ) | | | (404,315,471 | ) |
| | | | | | | | | |
| Net Assets at the Beginning of the Year | | | 2,057,591,105 | | | | 2,461,906,576 | |
| Net Assets at the End of the Year | | $ | 1,487,517,281 | | | $ | 2,057,591,105 | |
| (Includes undistributed net investment income of $0 and $0, respectively) | | | | | | | | |
The accompanying notes to financial statements are an integral part of these statements.
Brandywine Blue Fund
Financial Highlights
`(Selected data for each share of the Fund outstanding throughout each year)
| | | Years Ended September 30, | |
| | | 2011 | | | 2010 | | | 2009 | | | 2008 | | | 2007 | |
| PER SHARE OPERATING PERFORMANCE: | | | | | | | | | | | | | | | |
| Net asset value, beginning of year | | $ | 21.78 | | | $ | 20.67 | | | $ | 23.86 | | | $ | 38.18 | | | $ | 31.15 | |
| Income from investment operations: | | | | | | | | | | | | | | | | | | | | |
Net investment (loss) income(1) | | | (0.10 | ) | | | (0.06 | ) | | | 0.04 | | | | (0.07 | ) | | | (0.02 | ) |
| Net realized and unrealized (losses) gains | | | | | | | | | | | | | | | | | | | | |
| on investments | | | (0.18 | ) | | | 1.24 | | | | (3.23 | ) | | | (10.38 | ) | | | 8.15 | |
| Total from investment operations | | | (0.28 | ) | | | 1.18 | | | | (3.19 | ) | | | (10.45 | ) | | | 8.13 | |
| | | | | | | | | | | | | | | | | | | | | |
| Less distributions: | | | | | | | | | | | | | | | | | | | | |
| Distributions from net investment income | | | — | | | | (0.07 | ) | | | — | | | | — | | | | — | |
| Distributions from net realized gains | | | — | | | | — | | | | — | | | | (3.87 | ) | | | (1.10 | ) |
| Total from distributions | | | — | | | | (0.07 | ) | | | — | | | | (3.87 | ) | | | (1.10 | ) |
| Net asset value, end of year | | $ | 21.50 | | | $ | 21.78 | | | $ | 20.67 | | | $ | 23.86 | | | $ | 38.18 | |
| TOTAL RETURN | | | (1.29 | %) | | | 5.71 | % | | | (13.37 | %) | | | (30.70 | %) | | | 26.82 | % |
| | | | | | | | | | | | | | | | | | | | | |
| RATIOS/SUPPLEMENTAL DATA: | | | | | | | | | | | | | | | | | | | | |
| Net assets, end of year (in 000’s $) | | | 1,487,517 | | | | 2,057,591 | | | | 2,461,907 | | | | 3,323,668 | | | | 3,304,281 | |
| Ratio of expenses to average net assets | | | 1.18 | % | | | 1.17 | % | | | 1.16 | % | | | 1.13 | % | | | 1.12 | % |
| Ratio of net investment (loss) income | | | | | | | | | | | | | | | | | | | | |
| to average net assets | | | (0.38 | %) | | | (0.27 | %) | | | 0.21 | % | | | (0.23 | %) | | | (0.06 | %) |
| Portfolio turnover rate | | | 250 | % | | | 212 | % | | | 261 | % | | | 267 | % | | | 184 | % |
(1) Net investment (loss) income per share was calculated using average shares outstanding.
The accompanying notes to financial statements are an integral part of this statement.
The Brandywine Funds
Notes to Financial Statements
September 30, 2011
| (1) | Summary of Significant Accounting Policies |
The following is a summary of significant accounting policies of Brandywine Fund, Inc. (the “Brandywine Fund”) and Brandywine Blue Fund (the “Blue Fund,” one of two Funds in a series of the Brandywine Blue Fund, Inc.) (collectively the “Funds”). Each Fund is registered as a diversified open-end management company under the Investment Company Act of 1940 (the “Act”), as amended. The assets and liabilities of each Fund are segregated and a shareholder’s interest is limited to the Fund in which the shareholder owns shares. The Brandywine Fund was incorporated under the laws of Maryland on October 9, 1985. The Blue Fund was incorporated under the laws of Maryland on November 13, 1990. The investment objective of each Fund is to produce long-term capital appreciation principally through investing in common stocks.
| | (a) | Each security, excluding short-term investments, is valued at the last sale price reported by the principal security exchange on which the issue is traded. Securities that are traded on the Nasdaq Markets are valued at the Nasdaq Official Closing Price, or if no sale is reported, the latest bid price. Securities which are traded over-the-counter are valued at the latest bid price. Securities for which quotations are not readily available are valued at fair value as determined by the investment adviser under the supervision of the Board of Directors. The fair value of a security may differ from the last quoted price and the Fund may not be able to sell a security at the estimated fair value. Market quotations may not be available, for example, if trading in particular securities has halted during the day and not resumed prior to the close of trading on the New York Stock Exchange. As of September 30, 2011, there were no securities that were internally fair valued. Short-term investments with maturities of 60 days or less are valued at amortized cost which approximates value. For financial reporting purposes, investment transactions are recorded on the trade date; however, for purposes of executing shareholder transactions, the Funds record changes in holdings of portfolio securities no later than the first business day after the trade date in accordance with Rule 2a-4 of the Act. Accordingly, certain differences between net asset value for financial reporting and for executing shareholder transactions may arise. |
The Brandywine Funds
Notes to Financial Statements (Continued)
September 30, 2011
| (1) | Summary of Significant Accounting Policies (Continued) |
The Funds adopted the provisions of the Financial Accounting Standards Board (“FASB”) Accounting Standards Codification “Fair Value Measurements and Disclosures” Topic 820 (“ASC 820”), effective October 1, 2008. Under ASC 820, fair value is defined as the price that would be received to sell an asset or paid to transfer a liability (i.e., the “exit price”) in an orderly transaction between market participants at the measurement date.
In determining fair value, the Funds use various valuation approaches. ASC 820 establishes a fair value hierarchy for inputs used in measuring fair value that maximizes the use of observable inputs and minimizes the use of unobservable inputs by generally requiring that the most observable inputs be used when available. Observable inputs are those that market participants would use in pricing the asset or liability based on market data obtained from sources independent of the Funds. Unobservable inputs reflect the Funds’ assumptions about the inputs market participants would use in pricing the asset or liability developed based on the best information available in the circumstances. The inputs or methodologies used for valuing securities are not necessarily an indication of the risks associated with investing in those securities.
The fair value hierarchy is categorized into three levels based on the inputs as follows:
| | Level 1 – | Valuations based on unadjusted quoted prices in active markets for identical assets. |
| | | |
| | Level 2 – | Valuations based on quoted prices for similar securities or in markets that are not active or for which all significant inputs are observable, either directly or indirectly. |
| | |
| | | |
| | Level 3 – | Valuations based on inputs that are unobservable and significant to the overall fair value measurement. |
| | | |
| | | |
The following table summarizes the Funds’ investments as of September 30, 2011, based on the inputs used to value them:
| | | | Brandywine Fund | | | Blue Fund | |
| | Valuation Inputs | | Investments in Securities | | | Investments in Securities | |
| | Level 1 – Common Stocks | | $ | 1,295,452,301 | | | $ | 1,433,361,224 | |
| | Level 2 – Short-Term Commercial Paper | | | 33,799,812 | | | | 104,599,419 | |
| | Variable Rate Demand Notes | | | 2,183,901 | | | | 1,384,991 | |
| | Total Level 2 | | | 35,983,713 | | | | 105,984,410 | |
| | Level 3 – | | | — | | | | — | |
| | Total | | $ | 1,331,436,014 | | | $ | 1,539,345,634 | |
It is the Funds’ policy to recognize transfers between levels at the end of the quarterly reporting period. There were no transfers between levels during the period ended September 30, 2011.
See the Schedules of Investments for the investments detailed by industry classification.
On May 12, 2011, the FASB issued Accounting Standards Update No. 2011-04 (“ASU No. 2011-04”) modifying ACS 820. At the same time, the International Accounting Standards Board (“IASB”) issued International Financial Reporting Standard (“IFRS”) 13, Fair Value Measurement. The objective of the FASB and IASB is convergence of their guidance on fair value measurements and disclosures. Specifically, the ASU requires reporting entities to: i) disclose the amounts of any transfers between Level 1 and Level 2 and the reasons for the transfers; ii) disclose for Level 3 fair value measurements: a) quantitative information about significant unobservable inputs used; b) a description of the valuation processes used by the reporting entity and; c) a narrative description of the sensitivity of the fair value measurement to changes in unobservable inputs if a change in those inputs might result in a significantly higher or lower fair value measurement. The effective date of ASU No. 2011-04 is for interim and annual periods beginning after December 15, 2011. At this time, management is evaluating the implications of this guidance and the impact it will have on the financial statement amounts and footnote disclosures, if any.
| | (b) | Net realized gains and losses on sales of securities are computed on the identified cost basis. |
| | (c) | Dividend income is recorded on the ex-dividend date. Interest income is recorded on the accrual basis. |
| | (d) | The Funds have investments in short-term variable rate demand notes, which are unsecured instruments. The Funds may be susceptible to credit risk with respect to these notes to the extent the issuer defaults on its payment obligation. The Funds’ policy is to monitor the creditworthiness of the issuer and nonperformance by these counterparties is not anticipated. |
The Brandywine Funds
Notes to Financial Statements (Continued)
September 30, 2011
| (1) | Summary of Significant Accounting Policies (Continued) |
| | (e) | The preparation of financial statements in conformity with accounting principles generally accepted in the United States of America (“GAAP”) requires management to make estimates and assumptions that affect the reported amounts of assets and liabilities and disclosure of contingent assets and liabilities at the date of the financial statements and the reported amounts of revenues and expenses during the reporting period. Actual results could differ from these estimates. |
| | (f) | No provision has been made for Federal income taxes since the Funds have elected to be taxed as “regulated investment companies” and intend to distribute substantially all net investment company taxable income and net capital gains to shareholders and otherwise comply with the provisions of the Internal Revenue Code applicable to regulated investment companies. |
| | (g) | The Funds have reviewed all open tax years and major jurisdictions, which include Federal and the state of Maryland, and concluded that there are no significant uncertain tax positions that would require recognition in the financial statements. Open tax years are those that are open for exam by taxing authorities and, as of September 30, 2011, open Federal tax years include the tax years ended September 30, 2008 through 2011. The Funds have no examinations in progress and are also not aware of any tax positions for which it is reasonably possible that the total amounts of unrecognized tax benefits will significantly change in the next twelve months. |
| | (h) | GAAP requires that permanent differences between income for financial reporting and tax purposes be reclassified in the capital accounts. For the year ended September 30, 2011 the reclassifications were as follows: |
| | | | Undistributed | | | Accumulated | | | | |
| | | | Net Investment | | | Net Realized | | | | |
| | | | Income | | | Loss | | | Paid In Capital | |
| | Brandywine Fund | | $ | 6,541,486 | | | $ | (69 | ) | | $ | (6,541,417 | ) |
| | Blue Fund | | | 8,129,716 | | | | (506 | ) | | | (8,129,210 | ) |
| (2) | Investment Adviser and Management Agreements and Transactions With Related Parties |
Each Fund has a management agreement with Friess Associates, LLC (the “Adviser”), with whom certain Officers and a Director of the Funds are affiliated, to serve as investment adviser and manager. Under the terms of the agreements, each Fund will pay the Adviser a monthly management fee at the annual rate of one percent (1%) on the daily net assets of such Fund.
The Adviser entered into sub-advisory agreements with its affiliate, Friess Associates of Delaware, LLC (the “Sub-Adviser”), to assist it in the day-to-day management of each of the Funds. The Adviser and, if so delegated, the Sub-Adviser supervise the investment portfolios of the Funds, directing the purchase and sale of investment securities in the day-to-day management of the Funds. The Adviser pays the Sub-Adviser a fee equal to 110% of the monthly expenses the Sub-Adviser incurs in performing its services as Sub-Adviser. This relationship does not increase the annual management fee the Funds pay to the Adviser.
The Adviser has voluntarily agreed to reimburse each Fund for expenses over 2% of the daily net assets of the Fund. No such reimbursements were required for the year ended September 30, 2011.
Each of the Funds currently pay the five independent directors annual fees of $23,300 each. The lead independent director and chairman of the audit committee are paid an additional $8,000 and $5,000 annually, respectively, divided proportionately among all the Funds. All of the corresponding fees the directors receive are paid quarterly to the directors and then invested on the payment date in shares of the Funds at the net asset value of the Funds on the payment date. The Funds also reimburse directors for travel costs incurred in order to attend meetings of the Board of Directors. For the year ended September 30, 2011, the Funds expensed the following directors fees and costs:
| | | | Brandywine | | | Blue | |
| | | | Fund | | | Fund | |
| | Directors Fees and Travel Costs Paid during the Year | | | $124,225 | | | | $126,702 | |
Under the Funds’ organizational documents, each Director, officer, employee or other agent of the Fund (including the Funds’ investment manager) is indemnified, to the extent permitted by the Act, against certain liabilities that may arise out of performance of their duties to the Funds. Additionally, in the normal course of business, the Funds enter into contracts that contain a variety of indemnification clauses. The Funds’ maximum exposure under these arrangements is unknown as this would involve future claims that may be made against the Funds that have not yet occurred. However, the Funds have not had prior claims or losses pursuant to these contracts and believes the risk of loss to be remote.
The Brandywine Funds
Notes to Financial Statements (Continued)
September 30, 2011
U.S. Bank, N.A. has made available to each Fund a credit facility pursuant to Credit Agreements effective July 22, 2004, for the purpose of having cash available to cover incoming redemptions. Each of the Funds has a $50,000,000 credit facility. Principal and interest of such loan under the Credit Agreements are due not more than 31 days after the date of the loan. Amounts under the credit facilities bear interest at a rate per annum equal to the current prime rate minus one percent on the amount borrowed. Advances will be collateralized by securities owned by the respective Fund. During the year ended September 30, 2011, neither Fund borrowed against their Credit Agreement.
| (4) | Distributions to Shareholders |
Net investment income and net realized gains, if any, are distributed to shareholders at least annually.
| (5) | Investment Transactions |
For the year ended September 30, 2011, purchases and proceeds of sales of investment securities (excluding short-term investments) for the Funds were as follows:
| | | | | | | Sale | |
| | | | Purchases | | | Proceeds | |
| | Brandywine Fund | | $ | 4,172,819,268 | | | $ | 4,660,021,630 | |
| | Blue Fund | | | 5,079,883,864 | | | | 5,647,416,219 | |
| (6) | Income Tax Information |
The following information for the Funds is presented on an income tax basis as of September 30, 2011:
| | | | | | | Gross | | | Gross | | | Net Unrealized | | | Distributable | | | Distributable | |
| | | | Cost of | | | Unrealized | | | Unrealized | | | Depreciation | | | Ordinary | | | Long-Term | |
| | | | Investments | | | Appreciation | | | Depreciation | | | on Investments | | | Income | | | Capital Gains | |
| | Brandywine Fund | | $ | 1,429,423,058 | | | $ | 48,741,257 | | | $ | (146,728,301 | ) | | $ | (97,987,044 | ) | | $ | — | | | $ | — | |
| | Blue Fund | | | 1,544,405,817 | | | | 112,038,542 | | | | (117,098,725 | ) | | | (5,060,183 | ) | | | — | | | | — | |
The difference, if any, between the cost amounts for financial statement and federal income tax purposes is due primarily to timing differences in recognizing certain gains and losses in security transactions.
The tax components of dividends paid during the years ended September 30, 2011 and 2010, capital loss carryovers, which may be used to offset future capital gains, subject to Internal Revenue Code limitations (expiring in 2017 and 2018), as of September 30, 2011, and tax basis post-October losses as of September 30, 2011, which are not recognized for tax purposes until the first day of the following fiscal year are:
| | | | September 30, 2011 | | | September 30, 2010 | |
| | | | Ordinary | | | Long-Term | | | Net Capital | | | | | | Ordinary | | | Long-Term | |
| | | | Income | | | Capital Gains | | | Loss | | | Post-October | | | Income | | | Capital Gains | |
| | | | Distributions | | | Distributions | | | Carryovers | | | Losses | | | Distributions | | | Distributions | |
| | Brandywine Fund | | $ | — | | | $ | — | | | $ | 871,516,398 | | | $ | — | | | $ | — | | | $ | — | |
| | Blue Fund | | | — | | | | — | | | | 1,298,428,007 | | | | — | | | | 7,553,091 | | | | — | |
Since there were no ordinary distributions paid for the Funds’ for the year ended September 30, 2011, there were no distributions designated as qualifying for the dividends received deduction for corporate shareholders nor as qualified dividend income under the Jobs and Growth Tax Relief Act of 2003 (Unaudited).
On October 3, 2011 the Funds entered into a distribution agreement with Quasar Distributors, LLC, a wholly owned subsidiary of U.S. Bank. Concurrent with this agreement, the Funds terminated the existing secured lines of credit and are negotiating the terms of new unsecured lines of credit. The Advisor has agreed to incur the fees related to the distribution services on behalf of the Funds.
Cost Discussion
Mutual fund shareholders incur two types of costs: (1) transaction costs, including sales charges (loads) on purchase payments, reinvested dividends, or other distributions; redemption fees; and exchange fees; and (2) ongoing costs, including management fees; distribution [and/or service] (12b-1) fees; and other fund expenses. Brandywine and Brandywine Blue do not have 12b-1 distribution fees. This example is intended to help you understand your ongoing costs (in dollars) of investing in the Brandywine Funds and to compare these costs with the ongoing costs of investing in other mutual funds.
In addition to the costs highlighted and described below, the only Fund transaction costs you might currently incur would be wire fees ($15 per wire), if you choose to have proceeds from a redemption wired to your bank account instead of receiving a check. Additionally, U.S. Bank charges an annual processing fee ($15) if you maintain an IRA account with the Funds. To determine your total costs of investing in the Funds, you would need to add any applicable wire or IRA processing fees you’ve incurred during the period to the costs provided in the example below.
The example is based on an investment of $1,000 invested at the beginning of the period and held for the entire period from April 1, 2011 through September 30, 2011.
Actual Expenses
The first line of the table below provides information about actual account values and actual expenses. You may use the information in this line, together with the amount you invested, to estimate the expenses that you paid over the period. Simply divide your account value by $1,000 (for example, an $8,600 account value divided by $1,000 = 8.6), then multiply the result by the number in the first line under the heading entitled “Expenses Paid During Period” to estimate the expenses you paid on your account during this period.
Hypothetical Example for Comparison Purposes
The second line of the table below provides information about hypothetical account values and hypothetical expenses based on the Fund’s actual expense ratio and an assumed rate of return of 5% per year before expenses, which is not the Fund’s actual return. The hypothetical account values and expenses may not be used to estimate the actual ending account balance or expenses you paid for the period. You may use this information to compare the ongoing costs of investing in the Funds and other funds. To do so, compare this 5% hypothetical example with the 5% hypothetical examples that appear in the shareholder reports of the other funds.
Please note that the expenses shown in the table are meant to highlight your ongoing costs only and do not reflect any transactional costs. While the Brandywine Funds currently do not assess sales charges, redemption or exchange fees, other funds do, and those costs will not be reflected in their expense example tables. Therefore, the second line of the table is useful in comparing ongoing costs only, and will not help you determine the relative total costs of owning different funds.
| | | | Beginning | | | Ending | | | | |
| | | | Account | | | Account | | | Expenses Paid | |
| | | | Value | | | Value | | | During Period* | |
| | | | 4/01/11 | | | 9/30/11 | | | 4/01/11-9/30/11 | |
| | | | | | | | | | | |
| | Brandywine Actual | | $ | 1,000.00 | | | $ | 737.20 | | | $ | 4.75 | |
| | Hypothetical (5% return before expenses) | | $ | 1,000.00 | | | $ | 1,019.60 | | | $ | 5.52 | |
| | Brandywine Blue Actual | | $ | 1,000.00 | | | $ | 801.00 | | | $ | 5.33 | |
| | Hypothetical (5% return before expenses) | | $ | 1,000.00 | | | $ | 1,019.20 | | | $ | 5.97 | |
| * | Expenses are equal to the Funds’ annualized expense ratios of 1.09% and 1.18%, multiplied by the average account value over the period, multiplied by 183/365 (to reflect the one-half year period between April 1, 2011 and September 30, 2011) |
Additional Director Information, Proxy
Voting Policyand Quarterly Portfolio Schedules
For additional information about the Directors and Officers or for a description of the policies and procedures that the Funds use to determine how to vote proxies relating to portfolio securities, please call (800) 656-3017 and request a Statement of Additional Information. One will be mailed to you free of charge. The Statement of Additional Information is also available on the website of the Securities and Exchange Commission (the “Commission”) at http://www.sec.gov or the Funds’ website at http://www.brandywinefunds.com. Information on how the Funds voted proxies relating to portfolio securities is available on the Funds’ website or the website of the Commission no later than August 31 for the prior twelve months ending June 30. The Funds file their complete schedule of portfolio holdings with the Commission for the first and third quarters of each fiscal year on Form N-Q. The Funds’ Forms N-Q are available on the Commission’s website. The Funds’ Forms N-Q may be reviewed and copied at the Commission’s Public Reference Room in Washington, D.C. Information on the operation of the Public Reference Room may be obtained by calling 1-800-SEC-0330.
Brandywine Fund and Brandywine Blue Fund Directors and Officers
| | | | | Position, Term of Office and Length | | | | |
| | | | | of Time Served and Number of | | | | |
| | | | | Portfolios in Fund Complex | | Principal Occupation | | Other Directorships Held |
| | | Name, Age, Address | | Overseen by Director | | During Past Five Years | | by Director |
| | | | | | | | | |
 | | C. Quentin S. Jackson, 67 | | Lead Independent | | Mr. Jackson is retired. He was the President and Chief Executive Officer of Nuclear Electric Insurance Ltd., a multibillion-dollar company mutually owned by | | None |
| | | | | | | | | |
| | | | | | | | | |
| | | | | | | | | |
| | | | | | | | | |
| | | | | | | | | |
 | | Stuart A. McFarland, 64 | | Director | | Mr. McFarland is Managing Partner of Federal City Capital Advisors, LLC, a financial advisory firm. He was the Chairman of Federal City Bancorp, a thrift holding company from April 2004 until June 2007. | | Helios Funds (8 portfolios) |
| | | | | | | | | |
| | | | | | | | | |
| | | | | | | | | |
| | | | | | | | | |
| | | | | | | | | |
 | | Thomas D. Wren, 59 | | Director | | Mr. Wren is retired. He was a senior adviser for Promontory Financial Group, LLC from 2006 to 2011. He was the Treasurer of MBNA Corporation and its MBNA America Bank, N.A. subsidiary from | | ACM Financial Trust, Inc. |
| | | | | | | | | |
| | | | | | | | | |
| | | | | | | | | |
| | | | | | | | | |
| | | | | | | | | |
 | | Stephen M. Wynne, 56 | | Director | | Mr. Wynne is retired. He was the CEO of the U.S. Funds Services business unit of Bank of New York Mellon, following the acquisition in 2010 of PNC Global Investment Servicing. He was the CEO of PNC Global Investment Servicing where he served in various capacities from | | Copeland Trust |
| | | | | | | | | |
| | | | | | | | | |
| | | | | | | | | |
| | | | | | | | | |
| | | | | | | | | |
 | | James W. Zug, 71 | | Director | | Mr. Zug is a retired Partner of PricewaterhouseCoopers LLP. He was employed with Pricewater- houseCoopers and its predecessors | | Allianz Funds |
| | | | | | | | | |
| | | | | | | | | |
| | | | | | | | | |
| | | | | | | | | |
Brandywine Fund and Brandywine Blue Fund Directors and Officers
| | | | | Position, Term of Office and Length | | | | |
| | | | | of Time Served and Number of | | | | |
| "Interest Persons" | | | | Portfolios in Fund Complex Over- | | Principal Occupation | | Other Directorships Held |
| of the Funds* | | Name, Age, Address | | seen by Director or Officer | | During Past Five Years | | by Director or Officer |
| | | | | | | | | |
 | | William F. D’Alonzo*, 56 | | Director | | Mr. D’Alonzo joined Friess Associates in 1981 as part of the research team, became Chief Investment Officer in 1997 and Chief Executive Officer in 2002. | | None |
| | | | | | | | | |
| | | | | | | | | |
| | | | | | | | | |
| | | | | | | | | |
 | | Lynda J. Campbell*, 65 | | Vice President since 1998 | | Ms. Campbell joined Friess Associ- ates in 1985, the year of Brandy- wine Fund’s inception. Ms. Campbell is currently Chief Administrative Officer of the | | None |
| | | | | | | | | |
| | | | | | | | | |
| | | | | | | | | |
| | | | | | | | | |
 | | Joseph J. Fields*, 55 | | Vice President since 2007 | | Mr. Fields joined Friess Associates in 1999. He is currently a Client Relationship Manager | | None |
| | | | | | | | | |
| | | | | | | | | |
| | | | | | | | | |
| | | | | | | | | |
 | | Gordon Kaiser*, 52 | | Vice President since 2007 | | Mr. Kaiser joined Friess Associates in 1999. He is currently a Client Relationship Manager | | None |
| | | | | | | | | |
| | | | | | | | | |
| | | | | | | | | |
| | | | | | | | | |
 | | David D. Marky*, 46 | | Vice President since 2002 | | Mr. Marky joined Friess Associates in 2000. He currently serves as Chief Compliance Officer and Chief Operating Officer for the Friess | | None |
| | | | | | | | | |
| | | | | | | | | |
| | | |
 |  | The Brandywine Funds |
| Foster S. Friess | | |
| Founder | | |
| | | |
For additional information about the Directors and Officers, please call (800) 656-3017 and request a Statement of Additional Information. One will be mailed to you free of charge.
| * | Messrs. D’Alonzo, Fields, Kaiser and Marky and Ms. Campbell are “interested persons” of the Funds as that term is defined in the Investment Company Act of 1940 by reason of their being officers of the Funds and employees of Friess Associaties, LLC. |
Capital Gains Update... The Brandywine Funds will not distribute capital gains stemming from fiscal 2011. Whether there are any capital gains distributions made for the calendar year will be determined over the last three months of 2011, but that possibility is very remote. Brandywine Fund finished the fiscal year with a net realized loss of approximately $14.02 per share. Brandywine Blue Fund’s net realized loss was approximately $18.91 per share. The Brandywine Funds will not make capital gains distributions, which are taxable events for shareholders in taxable accounts, until gains are realized in excess of the net loss amounts. Please check upcoming reports for updates. |
IRA Investors... The annual $15 maintenance fee for shareholders invested through IRA accounts is due on November 18, 2011. For your convenience, US Bancorp will automatically deduct this amount from your IRA on the due date, or if you prefer not to have the fee swept from your account, please send a check to US Bancorp by the due date. |
Definitions and Disclosures Must be preceded or accompanied by a prospectus. Please refer to the prospectus for important information about the investment company, including investment objectives, risks, charges and expenses. Past performance is not a guarantee of future results. Mutual fund investing involves risk. Principal loss is possible. The Funds invest in mid-cap companies, which involve additional risks such as limited liquidity and greater volatility. Investments in foreign securities, even though publicly traded in the United States, may involve risks which are in addition to those inherent in domestic investments. Current and future portfolio holdings are subject to risk. Fund holdings and sector weightings are subject to change at any time and are not recommendations to buy or sell any securities. Securities discussed were not held by the Funds as of September 30, 2011, unless listed in the accompanying schedules of investments. Book Value is the net asset value of a company, calculated by subtracting total liabilities from total assets. The Price-to-Book (P/B) Ratio compares a stock’s market value to the value of total assets less total liabilities. Earnings growth rates quoted for the Funds refer solely to the estimated earnings growth rates of the average investment holding of the Funds based on consensus estimates from Baseline Financial Services, Inc. (Baseline) and not to the actual performance of the Funds themselves. Baseline provides analytical information and services to the investment community. The Russell 1000, Russell 1000 Growth, Russell 3000, Russell 3000 Growth and S&P 500 Indexes are unmanaged indexes commonly used to measure the performance of U.S. stocks. You cannot invest directly in an index. As of September 30, 2011, the Russell 1000 Index’s average annual total returns for 1, 5 and 10 years were 0.91, -0.91 and 3.28 percent; the Russell 1000 Growth Index’s were 3.78, 1.62 and 3.01 percent; the Russell 3000 Index’s were 0.55, -0.92 and 3.48 percent; the Russell 3000 Growth Index’s were 3.39, 1.56 and 3.18 percent; and the S&P 500 Index’s were 1.14, -1.18 and 2.82 percent. |
| P.O. Box 4166, Greenville, DE 19807 |
| (800) 656-3017 | www.brandywinefunds.com | bfunds@friess.com |
Investment Adviser: Friess Associates, LLC | Administrator, Accountant & Transfer Agent: U.S. Bancorp Fund Services, LLC |
Investment Sub-Adviser: Friess Associates of Delaware, LLC | Independent Registered Public Accounting Firm: PricewaterhouseCoopers LLP |
Custodian: U.S. Bank, N.A. | Distributor: Quasar Distributors, LLC |
Legal Counsel: Foley & Lardner LLP | |
Officers:William D’Alonzo, Chairman and President;
Lynda Campbell, Vice President, Secretary and Treasurer; Joseph Fields, Vice President; Gordon Kaiser,
Vice President; David Marky, Chief Compliance Officer, Vice President and Assistant Secretary
| Report Editor: Chris Aregood | Report Staff: David Marky, Adam Rieger |
Item 2. Code of Ethics.
Registrant has adopted a code of ethics. See attached Exhibit 12 (a)(1).
Item 3. Audit Committee Financial Expert.
Registrant’s Board of Directors has determined that Mr. Stuart A. McFarland, a member of the audit committee, is an audit committee financial expert. Mr. McFarland is “independent” as such term is defined in Form N-CSR.
Item 4. Principal Accountant Fees and Services.
(a) Audit Fees
$30,750 (FY 2011) and $30,008 (FY 2010) are the aggregate fees billed for each of the last two fiscal years for professional services rendered by the principal accountant to the registrant for the audit of the registrant’s annual financial statements or services that are normally provided by the accountant in connection with statutory and regulatory filings or engagements for those fiscal years.
(b) Audit-Related Fees
There were no fees billed in the last two fiscal years for Audit-Related Fees.
There were no fees billed in the last two fiscal years for professional services rendered by the principal accountant to the registrant for tax compliance, tax advice, tax planning and tax return preparation.
(d) All Other Fees
There were no other fees billed in the last two fiscal years for products and services provided by the principal accountant to the registrant, other than the services reported in paragraphs (a) – (c) of this Item 4.
(e) (1) None
(e) (2) None
(f) Not applicable.
(g) $69,548 (FY 2011) and $70,870 (FY 2010) in non-audit fees were billed to the registrant’s investment adviser for tax return preparation and GIPS performance verification services.
(h) The Audit Committee of the registrant determined that the provision of non-audit services rendered to the registrant’s investment adviser by the principal accountant disclosed in paragraph (g) of this Item 4, was compatible with maintaining the principal accountant’s independence.
Item 5. Audit Committee of Listed Registrants.
Not applicable to registrants who are not listed issuers (as defined in Rule 10A-3 under the Securities Exchange Act of 1934).
Item 6. Schedule of Investments.
| (a) | The Schedule of Investments in securities of unaffiliated issuers is included as part of the report to shareholders filed under Item 1 of this Form. |
Item 7. Disclosure of Proxy Voting Policies and Procedures for Closed-End Management Investment Companies
Not applicable to open-end investment companies.
Item 8. Portfolio Managers of Closed-End Management Investment Companies.
Not applicable to open-end investment companies.
Item 9. Purchases of Equity Securities By Closed-End Management Investment Company and Affiliated Purchasers.
Not applicable to open-end investment companies.
Item 10. Submission of Matters to a Vote of Security Holders.
None.
Item 11. Controls and Procedures.
| (a) | The Registrant’s disclosure controls and procedures are periodically evaluated. As of October 26, 2011, the date of the last evaluation, the Registrant’s officers have concluded that the Registrant’s disclosure controls and procedures are adequate. |
| (b) | The Registrant’s internal controls are periodically evaluated. There were no changes in the Registrant’s internal control over financial reporting that occurred during the second fiscal quarter of the period covered by this report that have materially affected, or are reasonably likely to materially affect, such controls. |
Item 12. Exhibits.
| (a) | (1) Any code of ethics or amendment thereto. Filed herewith. |
(2) Certifications pursuant to Section 302 of the Sarbanes-Oxley Act of 2002. Filed herewith.
(3) Any written solicitation to purchase securities under Rule 23c-1 under the Act sent or given during the period covered by the report by or on behalf of the Registrant to 10 or more persons. Not applicable to open-end investment companies.
| (b) | Certification pursuant to Section 906 of the Sarbanes-Oxley Act of 2002. Furnished herewith. |
SIGNATURES
Pursuant to the requirements of the Securities Exchange Act of 1934 and the Investment Company Act of 1940, the registrant has duly caused this report to be signed on its behalf by the undersigned, thereunto duly authorized.
Brandywine Fund, Inc.
Registrant
By /s/ William F. D’Alonzo
William F. D’Alonzo, President, Principal Executive Officer
Date 10/27/2011
Pursuant to the requirements of the Securities Exchange Act of 1934 and the Investment Company Act of 1940, this report has been signed below by the following persons on behalf of the registrant and in the capacities and on the dates indicated.
Brandywine Fund, Inc.
Registrant
By /s/ Lynda J. Campbell
Lynda J. Campbell, Treasurer, Principal Financial Officer
Date 10/27/2011