UNITED STATES
SECURITIES AND EXCHANGE COMMISSION
Washington, D.C. 20549
FORM N-CSR
CERTIFIED SHAREHOLDER REPORT OF REGISTERED
MANAGEMENT INVESTMENT COMPANIES
Investment Company Act file number 811-04447
Brandywine Fund, Inc.
(Exact name of registrant as specified in charter)
P.O. Box 4166
Greenville, DE 19807
(Address of principal executive offices) (Zip code)
William F. D’Alonzo
P.O. Box 4166
Greenville, Delaware 19807
(Name and address of agent for service)
(302) 656-3017
Registrant's telephone number, including area code:
Date of fiscal year end: September 30
Date of reporting period: September 30, 2012
Item 1. Reports to Stockholders.
| Managed by Friess Associates, LLC | Annual Report | September 30, 2012 |
Dear Fellow Shareholders:
Undeterred by fresh signs of economic sluggishness, investors bid stocks higher in the September quarter. Reassuring words out of Europe and the promise of further accommodative action from the Fed kept the market’s mood upbeat through most of the period.
Brandywine Fund grew 6.08 percent in the three months through September versus gains in the Russell 3000 and Russell 3000 Growth Indexes of 6.23 and 6.01 percent. Brandywine Blue Fund grew 6.07 percent as the S&P 500, Russell 1000 and Russell 1000 Growth Indexes gained 6.35, 6.31 and 6.11 percent.
Conditions looked shaky late in July, when economic bellwether United Parcel Service reported second-quarter results below consensus expectations and reduced its profit forecast. But days later the head of the European Central Bank forcefully stated the bank’s commitment to helping avert a debt crisis within the European Union, and sentiment improved markedly.
Other companies, including Applied Materials, FedEx Corp. and Norfolk Southern Corp., followed suit in tempering their outlooks due to a deteriorating climate for their businesses. Wall Street took notice by reducing earnings estimates for the upcoming quarter and full year. According to FactSet, analysts predict companies in the S&P 500 Index for the just-completed third quarter will collectively report their first quarterly earnings decline in nearly three years.
Adding insult to injury, the Commerce Department on the second-to-last day of the September quarter revised second-quarter GDP growth downward to 1.3 percent from 1.7 percent. Still, stocks remained buoyant.
While positive, the market’s action reflected the mixed signals. Second-quarter earnings season saw the fewest companies in the S&P 500 Index to report earnings and sales in excess of expectations since the first quarter of 2009, according to Bank of America Merrill Lynch. Against this backdrop, operational execution was valued for being relatively scarce. Individual-company earnings strength in the Brandywine Funds was well-rewarded versus the broader market through the beginning of September.
The character of the market environment changed on the second Thursday of the month, when the Fed announced it would initiate a third iteration of its quantitative easing effort with an eye toward bringing down unemployment. The trend toward differentiation by fundamentals lost some steam amid a move viewed as a generalized boost for stocks.
The consumer discretionary sector, which was about equal with technology as the largest sectors in the Brandywine portfolio on average during the September quarter, contributed the most to Brandywine’s performance relative to the Russell 3000 Growth Index. Consumer discretionary holdings comprised an overweight position versus the index.
| | | Brandywine | Brandywine Blue |
| | Cumulative Total Return | % Change | % Change |
| | Quarter | 6.08 | 6.07 |
| | One Year | 15.11 | 16.28 |
| | Five Years | -31.06 | -27.15 |
| | Ten Years | 49.14 | 63.72 |
| | Inception | 1094.49* | 588.11** |
| | Five Years | -7.17 | -6.14 |
| | Ten Years | 4.08 | 5.05 |
| | Inception | 9.72* | 9.29** |
*12/30/85 **1/10/91
Expense Ratio***
| | Brandywine | 1.09% |
| | Brandywine Blue | 1.18% |
***As stated in the Prospectus dated January 31, 2012
Performance data quoted represent past performance; past performance does not guarantee future results. The investment return and principal value of an investment will fluctuate so that an investor’s shares, when redeemed, may be worth more or less than their original cost. Current performance of the Funds may be lower or higher than the performance quoted. Performance data current to the most recent month end may be obtained by visiting www.brandywinefunds.com.
Standout contributors from the sector included women’s apparel retailer Chico’s FAS, consumer products maker Jarden Corp. and café operator Panera Bread Co. Despite an earnings season noted as a recent low in forecast-topping results, Chico’s, Jarden, and Panera exceeded consensus earnings estimates in their most recently reported quarters with growth of 28, 28 and 27 percent. All three companies were only held by Brandywine.
Health care holdings were the next most significant contributors to Brandywine’s performance against the Russell 3000 Growth Index. They represented a portfolio position equal to the sector within the index.
Celgene Corp. (both portfolios) was the top contributor from the health care sector. Celgene shares came into the quarter under pressure after the company withdrew an expanded use application regarding one of its drugs in Europe. The company’s stock rebounded soundly as it topped expectations. Celgene grew June-quarter earnings 37 percent. Watson Pharmaceuticals and Express Scripts, which beat consensus estimates with 41 and 24 percent June-quarter earnings growth, respectively, were also notable contributors held by both Funds.
Health care holdings represented Brandywine Blue’s second largest sector and an overweight position versus the sector within the Russell 1000 Growth Index. The sector was the biggest contributor to Brandywine Blue’s relative results.
Financial holdings also helped Brandywine Blue thanks to insurance holdings XL Group PLC and The Allstate Corp., which topped June-quarter earnings estimates by 27 and 71 percent. Brandywine Blue’s financial holdings represented an overweight position relative to the sector within the Russell 1000 Growth Index.
The industrial sector was the only one among all economic sectors represented in the portfolios that detracted from absolute results. The sector was also the most pronounced detractor from relative results. Hertz Global Holdings (both portfolios) was a primary reason. Although the company delivered estimate-beating earnings growth, shares declined amid uncertainty regarding European demand and a drawn-out effort to acquire competitor Dollar Thrifty.
For more information on holdings that influenced September-quarter performance, please see Roses & Thorns on page 4 for Brandywine and page 7 for Brandywine Blue.
We are pleased to announce that Scott Gates is taking an expanded leadership role by becoming Co-Chief Investment Officer. The new title is official recognition of the evolving position Scott has played behind the scenes at Friess Associates in recent years.
Scott joined the company in 2003 and quickly established himself as one of our strongest stock pickers. He became a Research Team Leader in 2008 and, soon after, began serving as my primary backup for portfolio oversight.
Scott’s experience in the investment business spans more than two decades. His ability and vision won him a spot as a portfolio manager where he worked prior to joining Friess Associates nine years ago. Scott earned the opportunity to assume more responsibility here, and we are excited that he will play such an important part in the future of the Friess research effort.
Also, please join us in welcoming Matt Williams to the research team. Matt came on board in July with 17 years of stock-picking experience at firms including Columbia Partners and Rittenhouse Asset Management. For more on Matt, please see the September-quarter edition of Looking Forward.
From its first major action in late November 2008 in response to the financial crisis to the latest round of quantitative easing introduced in September, the Federal Reserve has injected liquidity counted in trillions in about four years time.
The first round of quantitative easing, nicknamed QE1, lifted investor hopes. QE1, along with additional easing announced at the end of March 2009, helped spark a celebratory run in stock prices. The boost following QE2 in late 2010 was less pronounced, as was the response to Operation Twist, which came in its wake in September 2011. Stocks have been flat since the QE3 announcement.
We think the trend toward the most recent muted response to what could be another sizable intervention is evidence that the Fed-dominated phase of the post-crisis rebound is approaching an end. Large-scale risk appears reduced thanks in large part to the Fed.
To us, the market appears poised to look elsewhere for direction. With economic uncertainty and earnings revisions on the rise, we believe investors will pay close attention to individual-company results and, in the process, drive a fundamentals-driven market. That should be a good scenario for investors looking to capitalize on the long-term relationship between earnings and stock prices.
Thank you for your confidence in our earnings-driven strategy and the team that implements it.
 |  |
| Bill D’Alonzo | |
| Brandywine Funds President | October 12, 2012 |
Brandywine Fund
Portfolio Characteristics as of September 30, 2012
% Change in Top Ten Holdings From Book Cost
| 1. | Apple Inc. | +150.7% | | 6. | | Monsanto Co. | +4.8% |
| 2. | Visa Inc. | +15.4% | | 7. | | Red Hat Inc. | -2.6% |
| 3. | Qualcomm Inc. | +15.1% | | 8. | | American Eagle Outfitters Inc. | +19.3% |
| 4. | Omnicare Inc. | +11.6% | | 9. | | Foot Locker Inc. | +6.3% |
| 5. | Nuance Communications Inc. | +9.9% | | 10. | | Celgene Corp. | +46.0% |
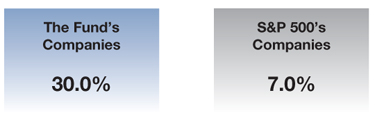
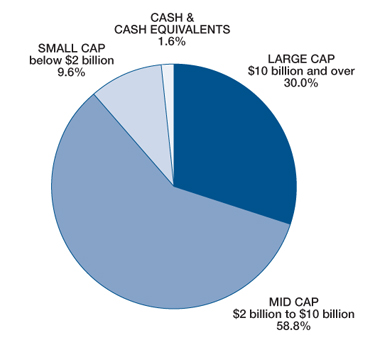
| Estimated Earnings Growth Rate | The Portfolio’s Market Capitalization |
| of the Fund’s Investments | |
 |  |
| |
| Forecasted Increase in Earnings Per Share |
| 2012 vs 2011 |
| |
| Source: Consensus estimates from FactSet Research Systems Inc. |
| |
This is not a forecast of the Fund’s future performance. Earnings growth for a Fund holding does not guarantee a corresponding increase in the market value of the holding or the Fund. As of September 30, 2012, the S&P 500 Index’s average annual total returns for 1, 5 and 10 years were 30.20, 1.05 and 8.01 percent. |
| |
| |
| |
| |
| |
| | |
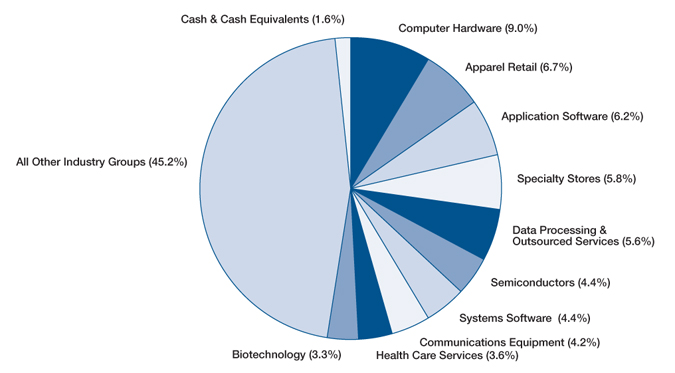
Top Ten Industry Groups
Brandywine Fund
September Quarter “Roses and Thorns”
| Biggest $ Winners | | % Gain | Reason for Move |
| Apple Inc. | $12.3 | 14.2 | The maker of personal computers, software and mobile computing devices grew June-quarter earnings 20 percent. Revenue grew 23 percent, reflecting lower unit growth for the company’s smartphones and tablets. While shares fell on the sales result, they rebounded to new highs following the successful launch of the iPhone 5, which took place earlier and with a broader distribution footprint than some analysts expected. |
| Chico’s FAS Inc. | $5.4 | 25.5 | The specialty retailer of private label women’s clothing and accessories grew July-quarter earnings 23 percent, beating estimates. Revenue grew 16 percent. Higher sales at the company’s Chico’s and White House/Black Market brands and expanding profit margins associated with full-priced selling and lean inventory levels drove results. Chico’s has $2.20 per share in cash and no debt, providing ample liquidity for growth-related investments. We sold Chico’s during the quarter when shares reached our target price. |
| Aruba Networks Inc. | $4.1 | 34.6 | The builder of wireless networks topped July-quarter earnings estimates by a small margin in an environment marked by low expectations for enterprise spending. Revenue grew 22 percent, also ahead of estimates, as newer products such as Aruba Instant and ClearPass gained traction. ClearPass, which protects data when external devices such as smart phones and tablets access corporate networks, exceeded order expectations and is attracting larger customers. |
| Celgene Corp. | $4.1 | 18.5 | The biopharmaceutical manufacturer that develops treatments for cancer and immunological diseases grew June-quarter earnings 37 percent, beating estimates. Shares recovered following a drop in late June related to withdrawing an application in Europe to expand regulatory approval of Revlimid for patients with a deadly blood cancer. Based on our research, we believe Revlimid is still likely to receive approval in Europe. Prospects for the company’s drugs in late-stage trials, including psoriatic arthritis treatment Apremilast, also remain promising. |
| Jarden Corp. | $3.6 | 15.4 | The consumer products conglomerate grew June-quarter earnings 28 percent, beating the consensus estimate. Healthy year-over-year organic sales growth and profit margin expansion stemming from product mix and supply chain efficiencies drove results. Management reiterated its 2012 financial targets during the quarter. We sold Jarden during the quarter when shares reached our target price. |
| Biggest $ Losers | | % Loss | Reason for Move |
| Fairchild Semiconductor International Inc. | $1.68 | 14.4 | We purchased the manufacturer of semiconductors that provide power management for a range of end-market products during the quarter. Shares traded lower as general concerns related to weak global macroeconomic conditions overshadowed accelerating growth related to new mobile design wins. Negative pre-announcements from competitors also contributed to weakness. |
| Zumiez Inc. | $2.30 | 27.1 | The mall-based retailer of apparel and equipment associated with skateboarding, surfing, snowboarding, BMX and motocross grew July-quarter earnings 113 percent, beating estimates by 31 percent. Shares declined on concerns related to a sequential slowdown in weekly same-store sales in August and conservative guidance for the company’s third quarter ending October. We sold Zumiez during the quarter. |
| Clean Harbors Inc. | $2.54 | 9.9 | The provider of environmental and industrial waste management services turned in a weaker-than-anticipated June quarter. Warm spring weather in Canada impacted the company’s tar sands business, and costs related to moving support machinery from gas shale locations to oil shale operations impacted results. We sold Clean Harbors during the quarter to fund an idea with better near-term earnings visibility. |
| ADTRAN Inc. | $2.90 | 23.6 | The manufacturer of high-speed digital transmission products used in telecommunications networks lost ground following June-quarter results that missed estimates. Second- and third-tier providers reined in spending during June, more than offsetting strengthening orders from tier-one customers. We sold ADTRAN during the quarter to fund an idea with better near-term earnings visibility. |
| United Rentals Inc. | $3.87 | 18.7 | The largest equipment rental company in North America grew June-quarter earnings 65 percent, beating the consensus estimate by 16 percent. While slow economic growth and tight credit markets spur greater demand for rental equipment, investors focused on a slight decrease in utilization rates (still running above 65 percent) and higher debt levels following the company’s RSC acquisition and large new-equipment purchases. We sold United Rentals during the quarter to fund an idea with greater near-term earnings promise. |
All gains/losses are calculated on an average cost basis
Management’s Discussion of Results, Brandywine Fund
For the third consecutive fiscal year, Europe’s sovereign debt crisis maintained its status as a prominent influence on stock prices. Although this fiscal year and last were similar in that Europe was the most dominant force, investors saw much more reason for optimism in the most recent period. That optimism translated into enthusiasm for stocks as an asset class, but a lingering sensitivity to risk left its mark on the makeup of the advance.
Brandywine Fund employs a strategy based on the premise that earnings drive stock prices. The Fund was successful throughout the period in isolating companies experiencing rapid earnings growth, with the majority of those companies exceeding consensus earnings estimates. While it generated a positive absolute return, this approach did not produce excess return in a macro-focused environment in which investors questioned the sustainability of the earnings strength demonstrated among portfolio holdings.
The period began with a negative bias until the European Union signaled its intention to bolster existing efforts to support Greece in shoring up its sovereign debt situation. The move resulted in a positive December-quarter finish, but returns showed an inverse relationship between earnings growth and share prices. High-growth companies underperformed.
In the March quarter, a series of positive data points from the U.S. economy amid relative macro-level calm boosted confidence and, in turn, investors rewarded earnings strength. Brandywine outperformed benchmarks with its strongest quarterly return of the fiscal year.
Sentiment soured in May due to developments in Greek parliamentary elections that fueled uncertainty regarding Greece’s willingness to accept austerity measures conditional to broader European cooperation. Domestic economic concerns resurfaced. Companies perceived to be sensitive to the economy led the market lower in a broadly negative June quarter, while traditionally defensive sectors fared better than average.
Conditions improved in the September quarter after the European Central Bank expressed its commitment to doing all within its power to avert crisis going forward. Questions surfaced late in the quarter following the Federal Reserve’s announcement of a third round of quantitative easing, but in the end the quarter represented a positive finish to the fiscal year.
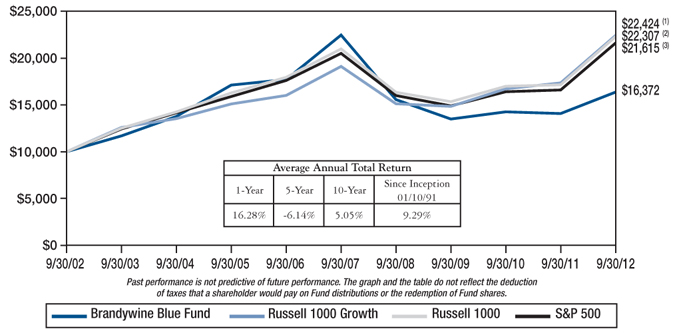
Brandywine grew 15.11 percent in the 12 months through September 30, 2012. The Russell 3000 and Russell 3000 Growth Indexes gained 30.20 and 29.35 percent.
| | | | |
| | Comparison of Change in Value of $10,000 Investment in Brandywine Fund, | |
| | Russell 3000 Growth(1), Russell 3000 Index(2) and S&P 500 Index(3) | |
| | |  | |
| | | | |
| | (1) | The Russell 3000 Growth Index measures the performance of those Russell 3000 Index companies with higher price-to-book ratios and higher forecasted growth values. The stocks in this index are also members of either the Russell 1000 Growth or the Russell 2000 Growth Indexes. Returns include dividends. | |
| | (2) | The Russell 3000 Index, a trademark of the Frank Russell Company, is 3,000 of the largest publicly traded companies in the United States equity market and includes dividends. | |
| | (3) | The S&P 500 Index consists of 500 stocks, mostly on the New York Stock Exchange, selected by the Standard & Poor’s Ratings Group. Each stock’s weighting is based on its relative total market value and includes dividends. | |
| | | | |
Brandywine Blue Fund
Portfolio Characteristics as of September 30, 2012
% Change in Top Ten Holdings From Book Cost
| 1. | Apple Inc. | +308.6% | | 6. | | Visa Inc. | +15.7% |
| 2. | Qualcomm Inc. | +15.1% | | 7. | | Ensco PLC | +12.7% |
| 3. | Watson Pharmaceuticals Inc. | +14.5% | | 8. | | XL Group PLC | +16.6% |
| 4. | Nuance Communications Inc. | +10.0% | | 9. | | UnitedHealth Group Inc. | +0.8% |
| 5. | Monsanto Co. | +4.9% | | 10. | | Limited Brands Inc. | +5.3% |
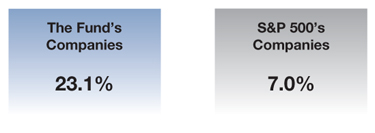
| Estimated Earnings Growth Rate | The Portfolio’s Market Capitalization |
| of the Fund’s Investments | |
 |  |
| |
Forecasted Increase in Earnings Per Share 2012 vs 2011 |
| |
| Source: Consensus estimates from FactSet Research Systems Inc. |
| |
This is not a forecast of the Fund’s future performance. Earnings growth for a Fund holding does not guarantee a corresponding increase in the market value of the holding or the Fund. As of September 30, 2012, the S&P 500 Index’s average annual total returns for 1, 5 and 10 years were 30.20, 1.05 and 8.01 percent. |
| |
| | |
| | |
Top Ten Industry Groups
Brandywine Blue Fund
September Quarter “Roses and Thorns”
| | $ Gain | | |
| Biggest $ Winners | (in millions) | % Gain | Reason for Move |
| Apple Inc. | $9.5 | 13.0 | The maker of personal computers, software and mobile computing devices grew June-quarter earnings 20 percent. Revenue grew 23 percent, reflecting lower unit growth for the company’s smartphones and tablets. While shares fell on the sales result, they rebounded to new highs following the successful launch of the iPhone 5, which took place earlier and with a broader distribution footprint than some analysts expected. |
| Western Digital Corp. | $7.2 | 36.2 | The maker of disk and networking drives grew June-quarter earnings to $3.35 from $0.81 per share a year ago, beating the consensus estimate by 36 percent. Revenue grew 98 percent. The company’s acquisition of Hitachi’s hard-drive business in March allowed it to ship 71 million hard drives during the quarter, compared to 54 million a year ago. Management raised estimates for the September quarter and the fiscal year ending June 2013. We sold Western Digital during the quarter when shares reached our target price. |
| Ensco PLC | $3.1 | 13.2 | The operator of the world’s second-largest offshore drilling fleet grew June-quarter earnings 93 percent to $1.30 per share, beating estimates by 13 percent. Revenue increased 90 percent, boosted by the company’s $7.3 billion acquisition of Pride International last year and strengthening demand for oil rigs. Ensco was also added to the S&P 500 Index during the quarter. |
| Celgene Corp. | $3.0 | 17.6 | The biopharmaceutical manufacturer that develops treatments for cancer and immunological diseases grew June-quarter earnings 37 percent, beating estimates. Shares recovered following a drop in late June related to withdrawing an application in Europe to expand regulatory approval of Revlimid for patients with a deadly blood cancer. Based on our research, we believe Revlimid is still likely to receive approval in Europe. Prospects for the company’s drugs in late-stage trials, including psoriatic arthritis treatment Apremilast, also remain promising. |
| Qualcomm Inc. | $3.0 | 12.0 | The developer of digital wireless communications products and services using CDMA (code division multiple access) technology grew June-quarter earnings 16 percent. Revenue grew 28 percent. Following supply issues that forced management to reduce its forecast in the June quarter, increased capacity at the company’s main foundry partner and alternative sources is now allowing Qualcomm to meet higher demand. |
| | $ Loss | | |
| Biggest $ Losers | (in millions) | % Loss | Reason for Move |
International Business Machines Corp. | $1.3 | 4.0 | The global provider of information technology solutions grew June-quarter earnings 14 percent, topping the consensus estimate. Shares traded lower following preannouncements of weaker results by a group of consulting service competitors. We sold International Business Machines during the quarter to fund an idea with greater near-term earnings visibility. |
| AMETEK Inc. | $1.6 | 6.5 | The manufacturer of electronic instruments and electromechanical devices grew June-quarter earnings 21 percent, beating the consensus estimate. Despite overall solid results, shares traded lower as organic growth was impacted by a considerable decline in demand at the company’s core motors segment. We sold AMETEK during the quarter to fund an idea with greater near-term earnings visibility. |
| UnitedHealth Group Inc. | $1.8 | 6.3 | The diversified health insurer grew June-quarter earnings 9 percent, beating the consensus estimate. Shares traded lower amid poor earnings reports from competitors and political uncertainties related to health-care reform. We believe United’s unique position as a sizable player in all end markets (commercial, Medicare and Medicaid) and its aggressive push into international markets provide solid growth opportunities. |
Starwood Hotels & Resorts Worldwide Inc. | $1.8 | 6.4 | The operator and franchisor of luxury hotels grew June-quarter earnings 40 percent, beating estimates by 13 percent. While the company’s U.S. hotels reported strong growth, shares traded lower on concerns related to slowing revenue per available room in Europe, China and India. We sold Starwood during the quarter to fund an idea with greater near-term earnings upside potential. |
Hertz Global Holdings Inc. | $3.1 | 14.6 | The operator of car and equipment rental centers grew June-quarter earnings 35 percent, beating the consensus estimate. Despite improved fundamentals for rental cars, shares traded lower on concerns related to macroeconomic weakness in Europe. Lack of progress in the company’s plan to acquire competitor Dollar Thrifty also contributed to uncertainty. We sold Hertz Global to fund an idea with better near-term earnings visibility. |
All gains/losses are calculated on an average cost basis
Management’s Discussion of Results, Brandywine Blue Fund
Brandywine Blue Fund aims to capitalize on the relationship between earnings performance and stock prices. Although the Fund executed its earnings-based strategy, earnings played a reduced role in determining prices during the fiscal year as the broader environment, particularly developments in Europe, was the dominant influence on stocks. Brandywine Blue gained ground in a mostly positive environment for stocks in general, but it did not generate excess return.
Greece’s sovereign debt burden was a preoccupying concern coming into the period. But market sentiment improved soon after the start of the fiscal year when members of the European Union agreed to add to existing efforts to stabilize the Greek situation. While the market celebrated the positive news, investors still acted in measured fashion. Concerns about potential fallout from Greece were evident in the character of the gains.
Companies with little to nothing expected on the earnings front were the strongest performers in the December quarter as the market, while appreciating, continued to demonstrate heightened risk sensitivity. Companies considered to be on the global economy’s leading edge – those with the highest projected earnings growth based on consensus estimates – underperformed slower growing companies across the board.
Economic concerns dissipated in the March quarter thanks to continued quiet in Europe and a series of positive data points from the U.S. Investors showed renewed faith in earnings, resulting in a favorable environment for the Fund’s approach. Brandywine Blue outperformed benchmarks with its second strongest quarterly return since the end of the Great Recession in 2009.
The market’s mood deteriorated in May when it looked as if Greece was reluctant to meet E.U. requirements upon which expanded support was contingent. Investors again worried about broader economic implications. Traditionally defensive sectors fared better than sectors perceived to be sensitive to the economy in a negative June-quarter climate.
Conditions improved in the September quarter after the European Central Bank expressed its commitment to doing all within its power to avert crisis going forward. Questions surfaced late in the quarter following the Federal Reserve’s announcement of a third round of quantitative easing, but in the end the quarter represented a positive finish to the fiscal year.
Brandywine Blue grew 16.28 percent in the 12 months through September 30, 2012. The S&P 500, Russell 1000 and Russell 1000 Growth Indexes gained 30.20, 30.06 and 29.19 percent.
| | | | |
| | Comparison of Change in Value of $10,000 Investment in Brandywine Blue Fund, | |
| | Russell 1000 Growth(1), Russell 1000 Index(2) and S&P 500 Index(3) | |
| | |  | |
| | | | |
| | (1) | The Russell 1000 Growth Index measures the performance of those Russell 1000 Index companies with higher price-to-book ratios and higher forecasted growth values and includes dividends. | |
| | (2) | The Russell 1000 Index, a trademark of the Frank Russell Company, is the largest 1,000 companies of the 3,000 largest publicly traded companies in the United States equity market and includes dividends. | |
| | (3) | The S&P 500 Index consists of 500 stocks, mostly on the New York Stock Exchange, selected by the Standard & Poor’s Ratings Group. Each stock’s weighting is based on its relative total market value and includes dividends. | |
| | | | |
REPORT OF INDEPENDENT REGISTERED PUBLIC ACCOUNTING FIRM
To the Board of Directors and Shareholders of
Brandywine Fund, Inc. and Brandywine Blue Fund:
In our opinion, the accompanying statements of assets and liabilities, including the schedules of investments, and the related statements of operations and of changes in net assets and the financial highlights present fairly, in all material respects, the financial position of Brandywine Fund, Inc. and Brandywine Blue Fund (a series of Brandywine Blue Fund, Inc.) (the “Funds”) at September 30, 2012, the results of each of their operations for the year then ended, the changes in each of their net assets for each of the two years in the period then ended and the financial highlights for each of the five years in the period then ended, in conformity with accounting principles generally accepted in the United States of America. These financial statements and financial highlights (hereafter referred to as “financial statements”) are the responsibility of the Funds’ management; our responsibility is to express an opinion on these financial statements based on our audits. We conducted our audits of these financial statements in accordance with the standards of the Public Company Accounting Oversight Board (United States). Those standards require that we plan and perform the audit to obtain reasonable assurance about whether the financial statements are free of material misstatement. An audit includes examining, on a test basis, evidence supporting the amounts and disclosures in the financial statements, assessing the accounting principles used and significant estimates made by management, and evaluating the overall financial statement presentation. We believe that our audits, which included confirmation of securities at September 30, 2012 by correspondence with the custodian and brokers, provide a reasonable basis for our opinion.

Milwaukee, Wisconsin
October 12, 2012
Brandywine Fund, Inc.
Statement of Assets and Liabilities
September 30, 2012
| Assets: | | | |
| Investments in securities, at value (cost $915,783,166) | | $ | 1,065,110,299 | |
| Receivable from investments sold | | | 7,255,485 | |
| Dividends and interest receivable | | | 2,254,945 | |
| Receivable from shareholders for purchases | | | 148,302 | |
| Prepaid expenses | | | 47,745 | |
| Cash | | | 893 | |
| Total assets | | $ | 1,074,817,669 | |
| | | | | |
| Liabilities: | | | | |
| Payable for investments purchased | | $ | 10,181,589 | |
| Payable to shareholders for redemptions | | | 1,094,955 | |
| Payable to adviser for management fees | | | 890,204 | |
| Other liabilities | | | 107,170 | |
| Total liabilities | | | 12,273,918 | |
| | | | | |
| Net Assets: | | | | |
| Capital Stock, $0.01 par value; 500,000,000 shares authorized; 43,165,853 shares outstanding | | | 1,847,101,961 | |
| Net unrealized appreciation on investments | | | 149,327,133 | |
| Accumulated net realized loss on investments | | | (932,823,165 | ) |
| Undistributed net investment loss | | | (1,062,178 | ) |
| Net assets | | | 1,062,543,751 | |
| Total liabilities and net assets | | $ | 1,074,817,669 | |
| | | | | |
| Calculation of net asset value per share: | | | | |
Net asset value, offering and redemption price per share ($1,062,543,751 ÷ 43,165,853 shares outstanding) | | $ | 24.62 | |
The accompanying notes to financial statements are an integral part of this statement.
Brandywine Fund, Inc.
Schedule of Investments
September 30, 2012
| Shares | | | | Cost | | | Value | |
| | | | | | | | | |
| Common Stocks - 98.4% (a) | | | | | | |
| | | | | | | | | |
| CONSUMER DISCRETIONARY | | | | | | |
| | | | | | | | | |
| | | Apparel Retail - 6.7% | | | | | | |
| | 1,211,400 | | American Eagle Outfitters Inc. | | $ | 21,407,877 | | | $ | 25,536,312 | |
| | 112,700 | | The Finish Line Inc. | | | 2,587,931 | | | | 2,562,798 | |
| | 691,900 | | Foot Locker Inc. | | | 23,109,386 | | | | 24,562,450 | |
| | 107,700 | | Ross Stores Inc. | | | 6,761,247 | | | | 6,957,420 | |
| | 247,700 | | The TJX Companies Inc. | | | 10,518,863 | | | | 11,094,483 | |
| | | | | | | | | | | | |
| | | | Apparel, Accessories & Luxury Goods - 2.3% | | | | | | | | |
| | 207,600 | | Hanesbrands Inc.* | | | 6,648,465 | | | | 6,618,288 | |
| | 315,000 | | Under Armour Inc.* | | | 14,707,075 | | | | 17,586,450 | |
| | | | | | | | | | | | |
| | | | Auto Parts & Equipment - 0.0% | | | | | | | | |
| | 16,300 | | Drew Industries Inc.* | | | 492,107 | | | | 492,423 | |
| | | | | | | | | | | | |
| | | | Catalog Retail - 0.9% | | | | | | | | |
| | 193,800 | | HSN Inc. | | | 7,457,256 | | | | 9,505,890 | |
| | | | | | | | | | | | |
| | | | Footwear - 0.9% | | | | | | | | |
| | 487,300 | | Skechers U.S.A. Inc.* | | | 10,131,834 | | | | 9,940,920 | |
| | | | | | | | | | | | |
| | | | General Merchandise Stores - 0.6% | | | | | | | | |
| | 134,100 | | Dollar Tree Inc.* | | | 6,295,212 | | | | 6,473,677 | |
| | | | | | | | | | | | |
| | | | Home Furnishing Retail - 1.1% | | | | | | | | |
| | 269,000 | | Williams-Sonoma Inc. | | | 11,895,323 | | | | 11,827,930 | |
| | | | | | | | | | | | |
| | | | Restaurants - 2.1% | | | | | | | | |
| | 98,300 | | Panera Bread Co.* | | | 14,824,303 | | | | 16,798,487 | |
| | 102,200 | | Starbucks Corp. | | | 5,110,217 | | | | 5,186,650 | |
| | | | | | | | | | | | |
| | | | Specialty Stores - 5.8% | | | | | | | | |
| | 441,500 | | Dick’s Sporting Goods Inc. | | | 14,477,516 | | | | 22,891,775 | |
| | 540,500 | | GNC Holdings Inc. | | | 12,860,142 | | | | 21,063,285 | |
| | 185,800 | | Ulta Salon, Cosmetics & | | | | | | | | |
| | | | Fragrance Inc. | | | 15,875,362 | | | | 17,893,469 | |
| | | | Total Consumer Discretionary | | | 185,160,116 | | | | 216,992,707 | |
| | | | | | | | | | | | |
| | | | This sector is 17.2% above your Fund’s cost. | | | | | | | | |
| | | | | | | | | |
| CONSUMER STAPLES | | | | | | | | |
| | | | | | | | | | | | |
| | | | Household Products - 1.9% | | | | | | | | |
| | 376,900 | | Church & Dwight Co. Inc. | | | 14,955,924 | | | | 20,348,831 | |
| | | | | | | | | | | | |
| | | | Packaged Foods & Meats - 1.4% | | | | | | | | |
| | 227,100 | | The Hain Celestial Group Inc. * | | | 12,188,239 | | | | 14,307,300 | |
| | | | Total Consumer Staples | | | 27,144,163 | | | | 34,656,131 | |
| | | | | | | | | | | | |
| | | | This sector is 27.7% above your Fund’s cost. | | | | | | | | |
| | | | | | | | | |
| ENERGY | | | | | | | | |
| | | | Oil & Gas Drilling - 2.1% | | | | | | | | |
| | 237,600 | | Noble Corp. | | | 8,764,427 | | | | 8,501,328 | |
| | 391,400 | | Rowan Companies plc* | | | 13,735,725 | | | | 13,217,578 | |
| | | | | | | | | | | | |
| | | | Oil & Gas Equipment & Services - 2.9% | | | | | | | | |
| | 1,768,700 | | McDermott International Inc.* | | | 20,141,481 | | | | 21,613,514 | |
| | 169,100 | | Oceaneering International Inc. | | | 9,222,016 | | | | 9,342,775 | |
| | | | | | | | | | | | |
| | | | Oil & Gas Exploration & Production - 0.4% | | | | | | | | |
| | 608,900 | | Halcon Resources Corp.* | | | 4,262,300 | | | | 4,463,237 | |
| | | | | | | | | | | | |
| | | | Oil & Gas Storage & Transportation - 2.1% | | | | | | | | |
| | 588,300 | | Golar LNG Ltd. | | | 23,250,404 | | | | 22,702,497 | |
| | | | Total Energy | | | 79,376,353 | | | | 79,840,929 | |
| | | | | | | | | | | | |
| | | | This sector is 0.6% above your Fund’s cost. | | | | | | | | |
| | | | | | | | | |
| FINANCIALS | | | | | | | | |
| | | | | | | | | | | | |
| | | | Insurance Brokers - 0.4% | | | | | | | | |
| | 179,272 | | Brown & Brown Inc. | | | 4,614,462 | | | | 4,673,621 | |
| | | | | | | | | | | | |
| | | | Property & Casualty Insurance - 1.7% | | | | | | | | |
| | 468,400 | | The Allstate Corp. | | | 15,705,071 | | | | 18,553,324 | |
| | | | | | | | | | | | |
| | | | Regional Banks - 0.6% | | | | | | | | |
| | 830,400 | | Regions Financial Corp. | | | 5,801,825 | | | | 5,987,184 | |
| | | | | | | | | | | | |
| | | | Specialized REITs - 0.4% | | | | | | | | |
| | 199,500 | | Chesapeake Lodging Trust | | | 3,694,874 | | | | 3,964,065 | |
| | | | | | | | | | | | |
| | | | Thrifts & Mortgage Finance - 1.0% | | | | | | | | |
| | 371,500 | | Ocwen Financial Corp.* | | | 6,697,453 | | | | 10,182,815 | |
| | | | Total Financials | | | 36,513,685 | | | | 43,361,009 | |
| | | | | | | | | | | | |
| | | | This sector is 18.8% above your Fund’s cost. | | | | | | | | |
| | | | | | | | | |
| HEALTH CARE | | | | | | | | |
| | | | | | | | | | | | |
| | | | Biotechnology - 3.3% | | | | | | | | |
| | 506,100 | | Alkermes PLC* | | | 9,376,805 | | | | 10,501,575 | |
| | 317,200 | | Celgene Corp.* | | | 16,593,900 | | | | 24,234,080 | |
| | | | | | | | | | | | |
| | | | Health Care Services - 3.6% | | | | | | | | |
| | 780,700 | | Omnicare Inc. | | | 23,767,384 | | | | 26,520,379 | |
| | 427,600 | | Team Health Holdings Inc.* | | | 10,732,735 | | | | 11,600,788 | |
| | | | | | | | | | | | |
| | | | Health Care Technology - 1.0% | | | | | | | | |
| | 622,200 | | MedAssets Inc.* | | | 10,803,846 | | | | 11,075,160 | |
| | | | | | | | | | | | |
| | | | Life Sciences Tools & Services - 0.7% | | | | | | | | |
| | 296,100 | | ICON PLC - SP-ADR* | | | 6,776,653 | | | | 7,215,957 | |
| | | | | | | | | | | | |
| | | | Managed Health Care - 1.0% | | | | | | | | |
| | 191,100 | | UnitedHealth Group Inc. | | | 10,545,261 | | | | 10,588,851 | |
| | | | | | | | | | | | |
| | | | Pharmaceuticals - 2.1% | | | | | | | | |
| | 263,300 | | Watson Pharmaceuticals Inc.* | | | 19,643,047 | | | | 22,422,628 | |
| | | | Total Health Care | | | 108,239,631 | | | | 124,159,418 | |
| | | | | | | | | | | | |
| | | | This sector is 14.7% above your Fund’s cost. | | | | | | | | |
Brandywine Fund, Inc.
Schedule of Investments (Continued)
September 30, 2012
| Shares or | | | | | | | | |
| Principal | | | | | | | | |
| Amount | | | | Cost | | | Value | |
| | | | | | | | | |
| Common Stocks - 98.4% (a) (Continued) | | | | | | |
| | | | | | | | | |
| INDUSTRIALS | | | | | | |
| | | | | | | | | |
| | | Building Products - 1.0% | | | | | | |
| | 478,100 | | USG Corp.* | | $ | 9,755,551 | | | $ | 10,494,295 | |
| | | | | | | | | | | | |
| | | | Construction & Engineering - 0.7% | | | | | | | | |
| | 288,100 | | Quanta Services Inc.* | | | 6,447,431 | | | | 7,116,070 | |
| | | | | | | | | | | | |
| | | | Construction & Farm Machinery & Heavy Trucks - 2.1% | | | | | | | | |
| | 274,800 | | Wabtec Corp. | | | 15,848,307 | | | | 22,063,692 | |
| | | | | | | | | | | | |
| | | | Environmental & Facilities Services - 0.7% | | | | | | | | |
| | 295,300 | | Tetra Tech Inc.* | | | 6,454,840 | | | | 7,754,578 | |
| | | | | | | | | | | | |
| | | | Human Resource & Employment Services - 0.3% | | | | | | | | |
| | 163,700 | | On Assignment Inc.* | | | 2,814,036 | | | | 3,260,904 | |
| | | | | | | | | | | | |
| | | | Industrial Machinery - 2.0% | | | | | | | | |
| | 164,200 | | Valmont Industries Inc. | | | 20,538,119 | | | | 21,592,300 | |
| | | | | | | | | | | | |
| | | | Research & Consulting Services - 1.3% | | | | | | | | |
| | 293,900 | | Verisk Analytics Inc.* | | | 14,332,407 | | | | 13,992,579 | |
| | | | | | | | | | | | |
| | | | Trading Companies & Distributors - 1.0% | | | | | | | | |
| | 526,100 | | Air Lease Corp.* | | | 10,440,521 | | | | 10,732,440 | |
| | | | Total Industrials | | | 86,631,212 | | | | 97,006,858 | |
| | | | | | | | | | | | |
| | | | This sector is 12.0% above your Fund’s cost. | | | | | | | | |
| | | | | | | | | |
| INFORMATION TECHNOLOGY | | | | | | | | |
| | | | | | | | | | | | |
| | | | Application Software - 6.2% | | | | | | | | |
| | 245,200 | | Ellie Mae Inc.* | | | 6,766,077 | | | | 6,676,796 | |
| | 394,700 | | Informatica Corp.* | | | 13,869,560 | | | | 13,739,507 | |
| | 1,055,300 | | Nuance Communications Inc.* | | | 23,900,965 | | | | 26,266,417 | |
| | 350,300 | | SolarWinds Inc.* | | | 20,834,070 | | | | 19,525,722 | |
| | | | | | | | | | | | |
| | | | Communications Equipment - 4.2% | | | | | | | | |
| | 708,000 | | Aruba Networks Inc.* | | | 11,809,610 | | | | 15,919,380 | |
| | 463,300 | | Qualcomm Inc. | | | 25,162,232 | | | | 28,951,617 | |
| | | | | | | | | | | | |
| | | | Computer Hardware - 9.0% | | | | | | | | |
| | 143,414 | | Apple Inc. | | | 38,168,650 | | | | 95,694,426 | |
| | | | | | | | | | | | |
| | | | Data Processing & Outsourced Services - 5.6% | | | | | | | | |
| | 212,700 | | Heartland Payment Systems Inc. | | | 6,208,804 | | | | 6,738,336 | |
| | 1,087,300 | | Vantiv Inc.* | | | 20,681,078 | | | | 23,431,315 | |
| | 216,700 | | Visa Inc. | | | 25,208,706 | | | | 29,098,476 | |
| | | | | | | | | | | | |
| | | | Electronic Components - 1.5% | | | | | | | | |
| | 272,100 | | Amphenol Corp. | | | 15,135,154 | | | | 16,021,248 | |
| | | | | | | | | | | | |
| | | | Semiconductors - 4.4% | | | | | | | | |
| | 77,300 | | Altera Corp. | | | 2,668,737 | | | | 2,627,041 | |
| | 129,200 | | Cavium Inc.* | | | 4,162,569 | | | | 4,306,236 | |
| | 751,100 | | Fairchild Semiconductor | | | | | | | | |
| | | | International Inc.* | | | 11,523,856 | | | | 9,854,432 | |
| | 128,700 | | Mellanox Technologies Ltd.* | | | 13,255,832 | | | | 13,066,911 | |
| | 660,300 | | NXP Semiconductors N.V.* | | | 16,550,118 | | | | 16,514,103 | |
| | | | | | | | | | | | |
| | | | Systems Software - 4.4% | | | | | | | | |
| | 190,597 | | Allot Communications Ltd.* | | | 5,214,173 | | | | 5,054,632 | |
| | 612,000 | | Fortinet Inc.* | | | 15,714,102 | | | | 14,773,680 | |
| | 66,000 | | Qualys Inc.* | | | 792,000 | | | | 947,760 | |
| | 448,500 | | Red Hat Inc.* | | | 26,216,979 | | | | 25,537,590 | |
| | | | Total Information Technology | | | 303,843,272 | | | | 374,745,625 | |
| | | | | | | | | | | | |
| | | | This sector is 23.3% above your Fund’s cost. | | | | | | | | |
| | | | | | | | | |
| MATERIALS | | | | | | | | |
| | | | | | | | | | | | |
| | | | Aluminum - 0.1% | | | | | | | | |
| | 16,902 | | Kaiser Aluminum Corp. | | | 979,490 | | | | 986,908 | |
| | | | | | | | | | | | |
| | | | Fertilizers & Agricultural Chemicals - 2.4% | | | | | | | | |
| | 282,000 | | Monsanto Co. | | | 24,496,020 | | | | 25,667,640 | |
| | | | | | | | | | | | |
| | | | Speciality Chemicals - 2.2% | | | | | | | | |
| | 325,700 | | Ashland Inc. | | | 23,306,267 | | | | 23,320,120 | |
| | | | | | | | | | | | |
| | | | Steel - 2.3% | | | | | | | | |
| | 372,700 | | Carpenter Technology Corp. | | | 15,174,265 | | | | 19,499,664 | |
| | 231,500 | | Worthington Industries Inc. | | | 5,059,692 | | | | 5,014,290 | |
| | | | Total Materials | | | 69,015,734 | | | | 74,488,622 | |
| | | | | | | | | | | | |
| | | | This sector is 7.9% above your Fund’s cost. | | | | | | | | |
| | | | | | | | | | | | |
| | | | Total common stocks | | | 895,924,166 | | | | 1,045,251,299 | |
| | | | | | | | | |
| Short-Term Investment - 1.9%(a) | | | | | | | | |
| | | | | | | | | | | | |
| | | | Commercial Paper - 1.9% | | | | | | | | |
| $ | 19,859,000 | | Prudential Funding LLC, | | | | | | | | |
| | | | due 10/01/12, discount of 0.10% | | | 19,859,000 | | | | 19,859,000 | |
| | | | Total short-term investment | | | 19,859,000 | | | | 19,859,000 | |
| | | | Total investments - 100.3% | | $ | 915,783,166 | | | | 1,065,110,299 | |
| | | | Liabilities, less cash | | | | | | | | |
| | | | and receivables - (0.3%) (a) | | | | | | | (2,566,548 | ) |
| | | | TOTAL NET ASSETS - 100.0% | | | | | | $ | 1,062,543,751 | |
(a) Percentages for the various classifications relate to net assets.
* Non-dividend paying security.
SP-ADR - Sponsored American Depositary Receipt
The accompanying notes to financial statements are an integral part of this schedule.
Brandywine Fund, Inc.
Statement of Operations
For the Year Ended September 30, 2012
| Income: | | | |
| Dividends | | $ | 10,406,251 | |
| Interest | | | 31,132 | |
| Total income | | | 10,437,383 | |
| | | | | |
| Expenses: | | | | |
| Management fees | | | 12,270,565 | |
| Transfer agent fees | | | 283,599 | |
| Administrative and accounting services | | | 148,452 | |
| Printing and postage expense | | | 147,889 | |
| Board of Directors fees and expenses | | | 125,537 | |
| Professional fees | | | 96,518 | |
| Custodian fees | | | 88,033 | |
| Registration fees | | | 22,219 | |
| Insurance expense | | | 18,413 | |
| Other expenses | | | 9,455 | |
| Total expenses | | | 13,210,680 | |
| Net Investment Loss | | | (2,773,297 | ) |
| Net Realized Loss on Investments | | | (56,163,510 | ) |
| Net Increase in Unrealized Appreciation on Investments | | | 242,170,921 | |
| Net Gain on Investments | | | 186,007,411 | |
| Net Increase in Net Assets Resulting From Operations | | $ | 183,234,114 | |
Statements of Changes in Net Assets
For the Years Ended September 30, 2012 and 2011
| | | 2012 | | | 2011 | |
| Operations: | | | | | | |
| Net investment loss | | $ | (2,773,297 | ) | | $ | (6,541,486 | ) |
| Net realized (loss) gain on investments | | | (56,163,510 | ) | | | 317,490,769 | |
| Net increase (decrease) in unrealized appreciation on investments | | | 242,170,921 | | | | (266,737,876 | ) |
| Net increase in net assets resulting from operations | | | 183,234,114 | | | | 44,211,407 | |
| | | | | | | | | |
| Fund Share Activities: | | | | | | | | |
| Proceeds from shares issued (2,238,021 and 7,644,065 shares, respectively) | | | 53,827,129 | | | | 196,448,187 | |
| Cost of shares redeemed (21,603,021 and 24,862,946 shares, respectively) | | | (511,388,432 | ) | | | (659,542,217 | ) |
| Net decrease in net assets derived from Fund share activities | | | (457,561,303 | ) | | | (463,094,030 | ) |
| Total Decrease | | | (274,327,189 | ) | | | (418,882,623 | ) |
| | | | | | | | | |
| Net Assets at the Beginning of the Year | | | 1,336,870,940 | | | | 1,755,753,563 | |
| Net Assets at the End of the Year | | $ | 1,062,543,751 | | | $ | 1,336,870,940 | |
| (Includes undistributed net investment income of $0 and $0, respectively) | | | | | | | | |
The accompanying notes to financial statements are an integral part of these statements.
Brandywine Fund, Inc.
Financial Highlights
(Selected data for each share of the Fund outstanding throughout each year)
| | | Years Ended September 30, | |
| | | 2012 | | | 2011 | | | 2010 | | | 2009 | | | 2008 | |
| | | | | | | | | | | | | | | | |
| PER SHARE OPERATING PERFORMANCE: | | | | | | | | | | | | | | | |
| Net asset value, beginning of year | | $ | 21.38 | | | $ | 22.02 | | | $ | 21.11 | | | $ | 26.86 | | | $ | 40.98 | |
| | | | | | | | | | | | | | | | | | | | | |
| Income from investment operations: | | | | | | | | | | | | | | | | | | | | |
Net investment loss(1) | | | (0.05 | ) | | | (0.09 | ) | | | (0.07 | ) | | | (0.05 | ) | | | (0.18 | ) |
| Net realized and unrealized gains (losses) | | | | | | | | | | | | | | | | | | | | |
| on investments | | | 3.29 | | | | (0.55 | ) | | | 0.98 | | | | (5.59 | ) | | | (8.72 | ) |
| Total from investment operations | | | 3.24 | | | | (0.64 | ) | | | 0.91 | | | | (5.64 | ) | | | (8.90 | ) |
| | | | | | | | | | | | | | | | | | | | | |
| Less distributions: | | | | | | | | | | | | | | | | | | | | |
| Distributions from net investment income | | | — | | | | — | | | | — | | | | — | | | | — | |
| Distributions from net realized gains | | | — | | | | — | | | | — | | | | (0.11 | ) | | | (5.22 | ) |
| Total from distributions | | | — | | | | — | | | | — | | | | (0.11 | ) | | | (5.22 | ) |
| | | | | | | | | | | | | | | | | | | | | |
| Net asset value, end of year | | $ | 24.62 | | | $ | 21.38 | | | $ | 22.02 | | | $ | 21.11 | | | $ | 26.86 | |
| | | | | | | | | | | | | | | | | | | | | |
| Total Return | | | 15.15 | % | | | (2.91 | %) | | | 4.31 | % | | | (20.98 | %) | | | (25.16 | %) |
| | | | | | | | | | | | | | | | | | | | | |
| Ratios/Supplemental Data: | | | | | | | | | | | | | | | | | | | | |
| Net assets, end of year (in 000’s $) | | | 1,062,544 | | | | 1,336,871 | | | | 1,755,754 | | | | 2,281,681 | | | | 3,421,787 | |
| Ratio of expenses to average net assets | | | 1.08 | % | | | 1.09 | % | | | 1.11 | % | | | 1.10 | % | | | 1.08 | % |
| Ratio of net investment loss | | | | | | | | | | | | | | | | | | | | |
| to average net assets | | | (0.23 | %) | | | (0.36 | %) | | | (0.33 | %) | | | (0.25 | %) | | | (0.54 | %) |
| Portfolio turnover rate | | | 256 | % | | | 234 | % | | | 225 | % | | | 239 | % | | | 210 | % |
(1)Net investment loss per share was calculated using average shares outstanding.
The accompanying notes to financial statements are an integral part of this statement.
This information is unaudited.
| Capital Gains Update . . . |
| The Brandywine Funds will not distribute capital gains stemming from fiscal 2012. Whether there are any capital gains distributions made for the calendar year will be determined over the final three months of 2012, but that possibility is very remote. |
| Both Funds finished September in net loss positions mainly consisting of net loss carry-forwards from previous periods. The Brandywine Funds will not make capital gains distributions, which are taxable events for shareholders in taxable accounts, until gains are realized in excess of their accumulated net loss amounts. Please check upcoming reports for updates. |
Brandywine Blue Fund
Statement of Assets and Liabilities
September 30, 2012
| Assets: | | | |
| Investments in securities, at value (cost $543,389,233) | | $ | 629,030,741 | |
| Receivable from investments sold | | | 4,680,357 | |
| Dividends and interest receivable | | | 660,033 | |
| Receivable from shareholders for purchases | | | 477,199 | |
| Prepaid expenses | | | 49,463 | |
| Cash | | | 965 | |
| Total assets | | $ | 634,898,758 | |
| Liabilities: | | | | |
| Payable for investments purchased | | $ | 5,580,898 | |
| Payable to shareholders for redemptions | | | 919,337 | |
| Payable to adviser for management fees | | | 556,119 | |
| Other liabilities | | | 220,472 | |
| Total liabilities | | | 7,276,826 | |
| Net Assets: | | | | |
| Capital Stock, $0.01 par value; 500,000,000 shares authorized; 25,101,800 shares outstanding | | | 1,721,835,064 | |
| Net unrealized appreciation on investments | | | 85,641,508 | |
| Accumulated net realized loss on investments | | | (1,176,962,847 | ) |
| Undistributed net investment loss | | | (2,891,793 | ) |
| Net assets | | | 627,621,932 | |
| Total liabilities and net assets | | $ | 634,898,758 | |
| Calculation of net asset value per share: | | | | |
Net asset value, offering and redemption price per share ($627,621,932 ÷ 25,101,800 shares outstanding) | | $ | 25.00 | |
The accompanying notes to financial statements are an integral part of this statement.
Schedule of Investments
September 30, 2012
| Shares | | | | Cost | | | Value | |
| | | | | | | | | |
| Common Stocks - 96.2% (a) | | | | | | |
| | | | | | | | | |
| CONSUMER DISCRETIONARY | | | | | | |
| | | | | | | | | |
| | | Apparel Retail - 6.5% | | | | | | |
| | 403,400 | | Limited Brands Inc. | | $ | 18,864,103 | | | $ | 19,871,484 | |
| | 172,900 | | Ross Stores Inc. | | | 10,704,825 | | | | 11,169,340 | |
| | 223,300 | | The TJX Companies Inc. | | | 9,488,663 | | | | 10,001,607 | |
| | | | | | | | | | | | |
| | | | Apparel, Accessories & Luxury Goods - 0.8% | | | | | | | | |
| | 55,200 | | PVH Corp. | | | 5,120,674 | | | | 5,173,344 | |
| | | | | | | | | | | | |
| | | | Broadcasting - 2.8% | | | | | | | | |
| | 486,300 | | CBS Corp. Cl B | | | 15,292,672 | | | | 17,667,279 | |
| | | | | | | | | | | | |
| | | | Cable & Satellite - 2.8% | | | | | | | | |
| | 493,500 | | Comcast Corp. | | | 16,800,418 | | | | 17,652,495 | |
| | | | | | | | | | | | |
| | | | General Merchandise Stores - 2.2% | | | | | | | | |
| | 292,000 | | Dollar Tree Inc.* | | | 14,072,610 | | | | 14,096,300 | |
| | | | | | | | | | | | |
| | | | Movies & Entertainment - 3.2% | | | | | | | | |
| | 378,200 | | The Walt Disney Co. | | | 18,584,973 | | | | 19,772,296 | |
| | | | | | | | | | | | |
| | | | Restaurants - 1.1% | | | | | | | | |
| | 131,100 | | Starbucks Corp. | | | 6,627,579 | | | | 6,653,325 | |
| | | | Total Consumer Discretionary | | | 115,556,517 | | | | 122,057,470 | |
| | | | | | | | | | | | |
| | | | This sector is 5.6% above your Fund’s cost. | | | | | | | | |
| | | | | | | | | |
| CONSUMER STAPLES | | | | | | | | |
| | | | | | | | | | | | |
| | | | Food Retail - 3.0% | | | | | | | | |
| | 796,100 | | The Kroger Co. | | | 17,935,455 | | | | 18,740,194 | |
| | | | | | | | | | | | |
| | | | Household Products - 0.7% | | | | | | | | |
| | 82,900 | | Church & Dwight Co. Inc. | | | 3,509,615 | | | | 4,475,771 | |
| | | | Total Consumer Staples | | | 21,445,070 | | | | 23,215,965 | |
| | | | | | | | | | | | |
| | | | This sector is 8.3% above your Fund’s cost. | | | | | | | | |
| | | | | | | | | |
| ENERGY | | | | | | | | |
| | | | Oil & Gas Drilling - 6.1% | | | | | | | | |
| | 367,400 | | Ensco PLC | | | 17,781,747 | | | | 20,045,344 | |
| | 515,100 | | Noble Corp. | | | 17,634,226 | | | | 18,430,278 | |
| | | | | | | | | | | | |
| | | | Oil & Gas Equipment & Services - 1.6% | | | | | | | | |
| | 186,100 | | Oceaneering International Inc. | | | 10,152,730 | | | | 10,282,025 | |
| | | | | | | | | | | | |
| | | | Oil & Gas Refining & Marketing - 2.8% | | | | | | | | |
| | 421,500 | | HollyFrontier Corp. | | | 15,865,260 | | | | 17,395,305 | |
| | | | Total Energy | | | 61,433,963 | | | | 66,152,952 | |
| | | | | | | | | | | | |
| | | | This sector is 7.7% above your Fund’s cost. | | | | | | | | |
Brandywine Blue Fund
Schedule of Investments (Continued)
September 30, 2012
| Shares or | | | | | | | | |
| Principal | | | | | | | | |
| Amount | | | | Cost | | | Value | |
| | | | | | | | | |
| Common Stocks - 96.2% (a) (Continued) | | | | | | |
| | | | | | | | | |
| FINANCIALS | | | | | | |
| | | Insurance Brokers - 2.9% | | | | | | |
| | 536,700 | | Marsh & McLennan Cos. Inc. | | $ | 17,464,099 | | | $ | 18,210,231 | |
| | | | | | | | | | | | |
| | | | Property & Casualty Insurance - 5.8% | | | | | | | | |
| | 417,900 | | The Allstate Corp. | | | 13,876,440 | | | | 16,553,019 | |
| | 832,100 | | XL Group PLC | | | 17,148,180 | | | | 19,995,363 | |
| | | | | | | | | | | | |
| | | | Regional Banks - 1.6% | | | | | | | | |
| | 1,376,000 | | Regions Financial Corp. | | | 9,645,950 | | | | 9,920,960 | |
| | | | Total Financials | | | 58,134,669 | | | | 64,679,573 | |
| | | | | | | | | | | | |
| | | | This sector is 11.3% above your Fund’s cost. | | | | | | | | |
| | | | | | | | | |
| HEALTH CARE | | | | | | | | |
| | | | | | | | | | | | |
| | | | Biotechnology - 2.5% | | | | | | | | |
| | 205,300 | | Celgene Corp.* | | | 10,659,551 | | | | 15,684,920 | |
| | | | | | | | | | | | |
| | | | Managed Health Care - 3.2% | | | | | | | | |
| | 360,200 | | UnitedHealth Group Inc. | | | 19,801,367 | | | | 19,958,682 | |
| | | | | | | | | | | | |
| | | | Pharmaceuticals - 3.5% | | | | | | | | |
| | 255,800 | | Watson Pharmaceuticals Inc.* | | | 19,026,711 | | | | 21,783,928 | |
| | | | Total Health Care | | | 49,487,629 | | | | 57,427,530 | |
| | | | | | | | | | | | |
| | | | This sector is 16.0% above your Fund’s cost. | | | | | | | | |
| | | | | | | | | |
| INDUSTRIALS | | | | | | | | |
| | | | | | | | | | | | |
| | | | Research & Consulting Services - 1.9% | | | | | | | | |
| | 248,600 | | Verisk Analytics Inc.* | | | 12,101,251 | | | | 11,835,846 | |
| | | | Total Industrials | | | 12,101,251 | | | | 11,835,846 | |
| | | | | | | | | | | | |
| | | | This sector is 2.2% below your Fund’s cost. | | | | | | | | |
| | | | | | | | | |
| INFORMATION TECHNOLOGY | | | | | | | | |
| | | | | | | | | | | | |
| | | | Application Software - 5.8% | | | | | | | | |
| | 479,100 | | Autodesk Inc.* | | | 14,990,799 | | | | 15,987,567 | |
| | 832,100 | | Nuance Communications Inc.* | | | 18,823,256 | | | | 20,710,969 | |
| | | | | | | | | | | | |
| | | | Communications Equipment - 3.6% | | | | | | | | |
| | 360,200 | | Qualcomm Inc. | | | 19,561,176 | | | | 22,508,898 | |
| | | | | | | | | | | | |
| | | | Computer Hardware - 10.0% | | | | | | | | |
| | 93,100 | | Apple Inc. | | | 15,203,152 | | | | 62,121,906 | |
| | | | | | | | | | | | |
| | | | Computer Storage & Peripherals - 5.1% | | | | | | | | |
| | 677,200 | | EMC Corp.* | | | 16,561,986 | | | | 18,467,244 | |
| | 446,700 | | Seagate Technology PLC | | | 13,830,542 | | | | 13,847,700 | |
| | | | | | | | | | | | |
| | | | Data Processing & Outsourced Services - 3.2% | | | | | | | | |
| | 149,500 | | Visa Inc. | | | 17,344,487 | | | | 20,074,860 | |
| | | | | | | | | | | | |
| | | | Electronic Components - 2.1% | | | | | | | | |
| | 227,000 | | Amphenol Corp. | | | 12,492,553 | | | | 13,365,760 | |
| | | | | | | | | | | | |
| | | | Semiconductors - 5.6% | | | | | | | | |
| | 212,500 | | Altera Corp. | | | 7,380,210 | | | | 7,221,813 | |
| | 552,100 | | Maxim Integrated Products Inc. | | | 15,051,843 | | | | 14,696,902 | |
| | 517,600 | | NXP Semiconductors N.V.* | | | 12,870,117 | | | | 12,945,176 | |
| | | | | | | | | | | | |
| | | | Systems Software - 2.5% | | | | | | | | |
| | 273,800 | | Red Hat Inc.* | | | 15,966,987 | | | | 15,590,172 | |
| | | | Total Information Technology | | | 180,077,108 | | | | 237,538,967 | |
| | | | | | | | | | | | |
| | | | This sector is 31.9% above your Fund’s cost. | | | | | | | | |
| | | | | | | | | |
| MATERIALS | | | | | | | | |
| | | | | | | | | | | | |
| | | | Fertilizers & Agricultural Chemicals - 3.3% | | | | | | | | |
| | 226,900 | | Monsanto Co. | | | 19,683,026 | | | | 20,652,438 | |
| | | | Total Materials | | | 19,683,026 | | | | 20,652,438 | |
| | | | | | | | | | | | |
| | | | This sector is 4.9% above your Fund’s cost. | | | | | | | | |
| | | | | | | | | | | | |
| | | | Total common stocks | | | 517,919,233 | | | | 603,560,741 | |
| | | | | | | | | |
| Short-Term Investment - 4.0%(a) | | | | | | | | |
| | | | | | | | | | | | |
| | | | Commercial Paper - 4.0% | | | | | | | | |
| $ | 25,470,000 | | Prudential Funding LLC, | | | | | | | | |
| | | | due 10/01/12, discount of 0.10% | | | 25,470,000 | | | | 25,470,000 | |
| | | | Total short-term investment | | | 25,470,000 | | | | 25,470,000 | |
| | | | Total investments - 100.2% | | $ | 543,389,233 | | | | 629,030,741 | |
| | | | Liabilities, less cash | | | | | | | | |
| | | | and receivables - (0.2%) (a) | | | | | | | (1,408,809 | ) |
| | | | TOTAL NET ASSETS - 100.0% | | | | | | $ | 627,621,932 | |
(a) Percentages for the various classifications relate to net assets.
* Non-dividend paying security.
The accompanying notes to financial statements are an integral part of this schedule.
Brandywine Blue Fund
Statement of Operations
For the Year Ended September 30, 2012
| Income: | | | |
| Dividends | | $ | 9,012,168 | |
| Interest | | | 71,210 | |
| Total income | | | 9,083,378 | |
| | | | | |
| Expenses: | | | | |
| Management fees | | | 11,689,825 | |
| Transfer agent fees | | | 1,607,738 | |
| Printing and postage expense | | | 694,135 | |
| Board of Directors fees and expenses | | | 124,486 | |
| Administrative and accounting services | | | 117,776 | |
| Custodian fees | | | 70,261 | |
| Professional fees | | | 63,935 | |
| Registration fees | | | 42,066 | |
| Insurance expense | | | 10,279 | |
| Other expenses | | | 8,840 | |
| Total expenses | | | 14,429,341 | |
| Net Investment Loss | | | (5,345,963 | ) |
| Net Realized Gain on Investments | | | 131,712,811 | |
| Net Increase in Unrealized Appreciation on Investments | | | 80,454,040 | |
| Net Gain on Investments | | | 212,166,851 | |
| Net Increase in Net Assets Resulting From Operations | | $ | 206,820,888 | |
Statements of Changes in Net Assets
For the Years Ended September 30, 2012 and 2011
| | | 2012 | | | 2011 | |
| Operations: | | | | | | |
| Net investment loss | | $ | (5,345,963 | ) | | $ | (8,129,716 | ) |
| Net realized gain on investments | | | 131,712,811 | | | | 216,689,924 | |
| Net increase (decrease) in unrealized appreciation on investments | | | 80,454,040 | | | | (171,710,740 | ) |
| Net increase in net assets resulting from operations | | | 206,820,888 | | | | 36,849,468 | |
| | | | | | | | | |
| Fund Share Activities: | | | | | | | | |
| Proceeds from shares issued (5,382,266 and 15,420,697 shares, respectively) | | | 132,061,615 | | | | 387,493,439 | |
| Cost of shares redeemed (49,468,159 and 40,706,584 shares, respectively) | | | (1,198,777,852 | ) | | | (994,416,731 | ) |
| Net decrease in net assets derived from Fund share activities | | | (1,066,716,237 | ) | | | (606,923,292 | ) |
| Total Decrease | | | (859,895,349 | ) | | | (570,073,824 | ) |
| | | | | | | | | |
| Net Assets at the Beginning of the Year | | | 1,487,517,281 | | | | 2,057,591,105 | |
| Net Assets at the End of the Year | | $ | 627,621,932 | | | $ | 1,487,517,281 | |
| (Includes undistributed net investment income of $0 and $0, respectively) | | | | | | | | |
The accompanying notes to financial statements are an integral part of these statements.
Brandywine Blue Fund
Financial Highlights
(Selected data for each share of the Fund outstanding throughout each year)
| | | Years Ended September 30, | |
| | | 2012 | | | 2011 | | | 2010 | | | 2009 | | | 2008 | |
| PER SHARE OPERATING PERFORMANCE: | | | | | | | | | | | | | | | |
| Net asset value, beginning of year | | $ | 21.50 | | | $ | 21.78 | | | $ | 20.67 | | | $ | 23.86 | | | $ | 38.18 | |
| | | | | | | | | | | | | | | | | | | | | |
| Income from investment operations: | | | | | | | | | | | | | | | | | | | | |
Net investment (loss) income(1) | | | (0.11 | ) | | | (0.10 | ) | | | (0.06 | ) | | | 0.04 | | | | (0.07 | ) |
| Net realized and unrealized gains (losses) | | | | | | | | | | | | | | | | | | | | |
| on investments | | | 3.61 | | | | (0.18 | ) | | | 1.24 | | | | (3.23 | ) | | | (10.38 | ) |
| Total from investment operations | | | 3.50 | | | | (0.28 | ) | | | 1.18 | | | | (3.19 | ) | | | (10.45 | ) |
| | | | | | | | | | | | | | | | | | | | | |
| Less distributions: | | | | | | | | | | | | | | | | | | | | |
| Distributions from net investment income | | | — | | | | — | | | | (0.07 | ) | | | — | | | | — | |
| Distributions from net realized gains | | | — | | | | — | | | | — | | | | — | | | | (3.87 | ) |
| Total from distributions | | | — | | | | — | | | | (0.07 | ) | | | — | | | | (3.87 | ) |
| Net asset value, end of year | | $ | 25.00 | | | $ | 21.50 | | | $ | 21.78 | | | $ | 20.67 | | | $ | 23.86 | |
| TOTAL RETURN | | | 16.28 | % | | | (1.29 | %) | | | 5.71 | % | | | (13.37 | %) | | | (30.70 | %) |
| | | | | | | | | | | | | | | | | | | | | |
| RATIOS/SUPPLEMENTAL DATA: | | | | | | | | | | | | | | | | | | | | |
| Net assets, end of year (in 000’s $) | | | 627,622 | | | | 1,487,517 | | | | 2,057,591 | | | | 2,461,907 | | | | 3,323,668 | |
| Ratio of expenses to average net assets | | | 1.23 | % | | | 1.18 | % | | | 1.17 | % | | | 1.16 | % | | | 1.13 | % |
| Ratio of net investment (loss) income | | | | | | | | | | | | | | | | | | | | |
| to average net assets | | | (0.46 | %) | | | (0.38 | %) | | | (0.27 | %) | | | 0.21 | % | | | (0.23 | %) |
| Portfolio turnover rate | | | 243 | % | | | 250 | % | | | 212 | % | | | 261 | % | | | 267 | % |
(1)Net investment (loss) income per share was calculated using average shares outstanding.
The accompanying notes to financial statements are an integral part of this statement.
The Brandywine Funds
Notes to Financial Statements
September 30, 2012
(1) Summary of Significant Accounting Policies
The following is a summary of significant accounting policies of Brandywine Fund, Inc. (the “Brandywine Fund”) and Brandywine Blue Fund (the “Blue Fund”, one of two Funds in a series of the Brandywine Blue Fund, Inc.) (collectively the “Funds”). Each Fund is registered as a diversified open-end management company under the Investment Company Act of 1940 (the “Act”), as amended. The assets and liabilities of each Fund are segregated and a shareholder’s interest is limited to the Fund in which the shareholder owns shares. The Brandywine Fund was incorporated under the laws of Maryland on October 9, 1985. The Blue Fund was incorporated under the laws of Maryland on November 13, 1990. The investment objective of each Fund is to produce long-term capital appreciation principally through investing in common stocks.
| (a) | Each security, excluding short-term investments, is valued at the last sale price reported by the principal security exchange on which the issue is traded. Securities that are traded on the Nasdaq Markets are valued at the Nasdaq Official Closing Price, or if no sale is reported, the latest bid price. Securities which are traded over-the-counter are valued at the latest bid price. Securities for which quotations are not readily available are valued at fair value as determined by the investment adviser under the supervision of the Board of Directors. The fair value of a security may differ from the last quoted price and the Fund may not be able to sell a security at the estimated fair value. Market quotations may not be available, for example, if trading in particular securities has halted during the day and not resumed prior to the close of trading on the New York Stock Exchange. As of September 30, 2012, there were no securities that were internally fair valued. Short-term investments with maturities of 60 days or less are valued at amortized cost which approximates fair value. For financial reporting purposes, investment transactions are recorded on the trade date; however, for purposes of executing shareholder transactions, the Funds record changes in holdings of portfolio securities no later than the first business day after the trade date in accordance with Rule 2a-4 of the Act. Accordingly, certain differences between net asset value for financial reporting and for executing shareholder transactions may arise. |
| | The Funds adopted the provisions of the Financial Accounting Standards Board (“FASB”) Accounting Standards Codification “Fair Value Measurements and Disclosures” Topic 820 (“ASC 820”), effective October 1, 2008. Under ASC 820, fair value is defined as the price that would be received to sell an asset or paid to transfer a liability (i.e., the “exit price”) in an orderly transaction between market participants at the measurement date. |
The Brandywine Funds
Notes to Financial Statements (Continued)
September 30, 2012
(1) Summary of Significant Accounting Policies (Continued)
| | Fair value is defined as the price that the Funds would receive upon selling an investment or transferring a liability in an orderly transaction to an independent buyer in the principal or most advantageous market for the investment. A three-tier hierarchy is used to maximize the use of observable market data and minimize the use of unobservable inputs and to establish classification of fair value measurements for disclosure purposes. Observable inputs reflect the assumptions market participants would use in pricing the asset or liability. Observable inputs are based on market data obtained from sources independent of the reporting entity. Unobservable inputs reflect the reporting entity’s own assumptions about the assumptions market participants would use in pricing the asset or liability. Unobservable inputs are based on the best information available in the circumstances. The following is a summary of the three-tiered hierarchy of valuation input levels. |
| | | |
| | Level 1 – | Inputs are unadjusted and prices are determined using quoted prices in active markets for identical securities. |
| | | |
| | Level 2 – | Prices are determined using other significant observable inputs (including quoted prices for similar securities, interest rates, prepayment speeds, credit risk, etc.). |
| | | |
| | Level 3 – | Prices are determined using significant unobservable inputs (including management’s assumptions in determining the fair value of investments). |
| | The inputs or methodologies used for valuing securities are not an indication of the risks associated with investing in those securities. The following is a summary of each Fund’s fair value measurements as of the end of the reporting period: |
| | | Brandywine Fund | | Blue Fund |
| | Valuation Inputs | Investments in Securities | | Investments in Securities |
| | Level 1 – Common Stocks | | $ | 1,045,251,299 | | | | $ | 603,560,741 | |
| | Level 2 – Short-Term Commercial Paper | | | 19,859,000 | | | | | 25,470,000 | |
| | Level 3 – | | | — | | | | | — | |
| | Total | | $ | 1,065,110,299 | | | | $ | 629,030,741 | |
It is the Funds’ policy to recognize transfers between levels at the end of the quarterly reporting period. There were no transfers between levels during the period ended September 30, 2012.
See the Schedules of Investments for the investments detailed by industry classification.
On May 12, 2011, the FASB issued Accounting Standards Update No. 2011-04 (“ASU No. 2011-04”) modifying ASC 820. At the same time, the International Accounting Standards Board (“IASB”) issued International Financial Reporting Standard (“IFRS”) 13, Fair Value Measurement. The objective of the FASB and IASB is convergence of their guidance on fair value measurements and disclosures. Specifically, the ASU requires reporting entities to: i) disclose the amounts of any transfers between Level 1 and Level 2 and the reasons for the transfers; ii) disclose for Level 3 fair value measurements: a) quantitative information about significant unobservable inputs used; b) a description of the valuation processes used by the reporting entity and; c) a narrative description of the sensitivity of the fair value measurement to changes in unobservable inputs if a change in those inputs might result in a significantly higher or lower fair value measurement. The effective date of ASU No. 2011-04 is for interim and annual periods beginning after December 15, 2011. ASU No. 2011-04 has been adopted by the Funds and there has been no material impact to the disclosures.
| (b) | Net realized gains and losses on sales of securities are computed on the identified cost basis. |
| (c) | Dividend income is recorded on the ex-dividend date. Interest income is recorded on the accrual basis. |
| (d) | The preparation of financial statements in conformity with accounting principles generally accepted in the United States of America (“GAAP”) requires management to make estimates and assumptions that affect the reported amounts of assets and liabilities and disclosure of contingent assets and liabilities at the date of the financial statements and the reported amounts of revenues and expenses during the reporting period. Actual results could differ from these estimates. |
| (e) | No provision has been made for Federal income taxes since the Funds have elected to be taxed as “regulated investment companies” (“RICs”) and intend to distribute substantially all net investment company taxable income and net capital gains to shareholders and otherwise comply with the provisions of the Internal Revenue Code applicable to regulated investment companies. |
| (f) | The Funds have reviewed all open tax years and major jurisdictions, which include Federal and the state of Maryland, and concluded that there are no significant uncertain tax positions that would require recognition in the financial statements. Open tax years are those that are open for exam by taxing authorities and, as of September 30, 2012, open Federal tax years include the tax years |
The Brandywine Funds
Notes to Financial Statements (Continued)
September 30, 2012
(1)Summary of Significant Accounting Policies (Continued)
ended September 30, 2009 through 2012. The Funds have no examinations in progress and are also not aware of any tax positions for which it is reasonably possible that the total amounts of unrecognized tax benefits will significantly change in the next twelve months.
| (g) | GAAP requires that permanent differences between income for financial reporting and tax purposes be reclassified in the capital accounts. For the year ended September 30, 2012 the reclassifications were as follows: |
| | | Undistributed | Accumulated | |
| | | Net Investment | Net Realized | |
| | | Loss | Loss | Paid In Capital |
| | Brandywine Fund | $1,711,119 | $— | ($1,711,119) |
| | Blue Fund | 2,454,170 | (2) | (2,454,168) |
(2) Investment Adviser and Management Agreements and Transactions With Related Parties
Each Fund has a management agreement with Friess Associates, LLC (the “Adviser”), with whom certain Officers and a Director of the Funds are affiliated, to serve as investment adviser and manager. Under the terms of the agreements, each Fund will pay the Adviser a monthly management fee at the annual rate of one percent (1%) on the daily net assets of such Fund.
The Adviser entered into sub-advisory agreements with its affiliate, Friess Associates of Delaware, LLC (the “Sub-Adviser”), to assist it in the day-to-day management of each of the Funds. The Adviser and, if so delegated, the Sub-Adviser supervise the investment portfolios of the Funds, directing the purchase and sale of investment securities in the day-to-day management of the Funds. The Adviser pays the Sub-Adviser a fee equal to 110% of the monthly expenses the Sub-Adviser incurs in performing its services as Sub-Adviser. This relationship does not increase the annual management fee the Funds pay to the Adviser.
The Adviser has voluntarily agreed to reimburse each Fund for expenses over 2% of the daily net assets of the Fund. No such reimbursements were required for the year ended September 30, 2012.
Each of the Funds currently pay the five independent directors annual fees of $23,300 each. The lead independent director and chairman of the audit committee are paid an additional $8,000 and $5,000 annually, respectively, divided proportionately among all the Funds. All of the corresponding fees the directors receive are paid quarterly to the directors and then invested on the payment date in shares of the Funds at the net asset value of the Funds on the payment date. The Funds also reimburse directors for travel costs incurred in order to attend meetings of the Board of Directors. For the year ended September 30, 2012, the Funds expensed the following directors fees and costs:
| | | Brandywine | Blue |
| | | Fund | Fund |
| | Directors Fees and Travel Costs Paid during the Year | $125,537 | $124,486 |
Under the Funds’ organizational documents, each Director, officer, employee or other agent of the Fund (including the Funds’ investment manager) is indemnified, to the extent permitted by the Act, against certain liabilities that may arise out of performance of their duties to the Funds. Additionally, in the normal course of business, the Funds enter into contracts that contain a variety of indemnification clauses. The Funds’ maximum exposure under these arrangements is unknown as this would involve future claims that may be made against the Funds that have not yet occurred. However, the Funds have not had prior claims or losses pursuant to these contracts and believes the risk of loss to be remote.
At September 30, 2012, one financial intermediary is the record owner of approximately 7% of the Blue Fund’s shares.
(3) Credit Agreements
U.S. Bank, N.A. has made available to each Fund a $50,000,000 unsecured credit facility pursuant to Credit Agreements effective October 28, 2011, for the purpose of having cash available to cover incoming redemptions. Principal and interest of such loan under the Credit Agreements are due not more than 20 days after the date of the loan. Amounts under the credit facilities bear interest at a rate per annum equal to the current prime rate minus one percent on the amount borrowed. During the year ended September 30, 2012, neither Fund borrowed against its Credit Agreement. The Credit Agreements are renewable annually on October 24.
(4) Distributions to Shareholders
Net investment income and net realized gains, if any, are distributed to shareholders at least annually.
The Brandywine Funds
Notes to Financial Statements (Continued)
September 30, 2012
(5) Investment Transactions
For the year ended September 30, 2012, purchases and proceeds of sales of investment securities (excluding short-term investments) for the Funds were as follows:
| | | | Sale |
| | | Purchases | Proceeds |
| | Brandywine Fund | $3,062,665,554 | $3,497,692,360 |
| | Blue Fund | 2,621,752,313 | 3,663,517,262 |
(6) Income Tax Information
The following information for the Funds is presented on an income tax basis as of September 30, 2012:
| | | | Gross | Gross | Net Unrealized | Distributable | Distributable |
| | | Cost of | Unrealized | Unrealized | Appreciation | Ordinary | Long-Term |
| | | Investments | Appreciation | Depreciation | on Investments | Income | Capital Gains |
| | Brandywine Fund | $916,282,843 | $157,652,055 | ($8,837,799) | $148,814,256 | $ — | $ — |
| | Blue Fund | 544,325,559 | 87,297,860 | (2,592,678) | 84,705,182 | — | — |
The difference, if any, between the cost amounts for financial statement and federal income tax purposes is due primarily to timing differences in recognizing certain gains and losses in security transactions.
On December 22, 2010, the Regulated Investment Company Modernization Act of 2010 (the “RIC Act”) was enacted, which changed various technical rules governing the tax treatment of RICs. The changes are generally effective for taxable years beginning after the date of enactment. Capital losses incurred in taxable years beginning after the date of enactment may now be carried forward indefinitely, and retain the character of the original loss. Post-enactment losses must be utilized prior to pre-enactment losses. Under pre-enactment law, capital losses could be carried forward for up to eight years, and carried forward as short-term capital loss, irrespective of the character of the original loss. The RIC Act now allows RICs to elect to “push” to the first day of the next taxable year all or part of any late year ordinary loss, which is defined as the sum of the specified post-October losses and other post-December ordinary losses, over the specified post-October gains and other post-December ordinary gains. This reduces the circumstances under which a RIC might be required to file amended Forms 1099 to restate previously reported distributions.
The tax components of dividends paid during the years ended September 30, 2012 and 2011, capital loss carryovers, which may be used to offset future capital gains, subject to Internal Revenue Code limitations, tax basis post-October losses as of September 30, 2012, which are not recognized for tax purposes until the first day of the following fiscal year, and late year ordinary losses are:
| | | September 30, 2012 | | September 30, 2011 |
| | | Ordinary | Long-Term | Net Capital | | Late Year | | Ordinary | Long-Term |
| | | Income | Capital Gains | Loss | Post-October | Ordinary | | Income | Capital Gains |
| | | Distributions | Distributions | Carryovers | Losses | Losses | | Distributions | Distributions |
| | Brandywine Fund | $ — | $ — | $ 915,525,170 | $16,798,317 | $1,062,178 | | $ — | $ — |
| | Blue Fund | — | — | 1,176,026,522 | — | $2,891,793 | | — | — |
| | | | | Post-Enactment | |
| | | Net Capital Loss Carryovers Expiring | Capital Loss | |
| | | 2017 | 2018 | Carryforwards | |
| | Brandywine Fund | $368,372,189 | $503,144,209 | $44,008,772 | (Short-Term) |
| | Blue Fund | 980,140,290 | 195,886,232 | — | |
Since there were no ordinary distributions paid by the Funds for the year ended September 30, 2012, there were no distributions designated as qualifying for the dividends received deduction for corporate shareholders nor as qualified dividend income under the Jobs and Growth Tax Relief Act of 2003 (Unaudited).
Cost Discussion
Mutual fund shareholders incur two types of costs: (1) transaction costs, including sales charges (loads) on purchase payments, reinvested dividends, or other distributions; redemption fees; and exchange fees; and (2) ongoing costs, including management fees; distribution [and/or service] (12b-1) fees; and other fund expenses. Brandywine and Brandywine Blue do not have 12b-1 distribution fees. This example is intended to help you understand your ongoing costs (in dollars) of investing in the Brandywine Funds and to compare these costs with the ongoing costs of investing in other mutual funds.
In addition to the costs highlighted and described below, the only Fund transaction costs you might currently incur would be wire fees ($15 per wire), if you choose to have proceeds from a redemption wired to your bank account instead of receiving a check. Additionally, U.S. Bank charges an annual processing fee ($15) if you maintain an IRA account with the Funds. To determine your total costs of investing in the Funds, you would need to add any applicable wire or IRA processing fees you have incurred during the period to the costs provided in the example below.
The example is based on an investment of $1,000 invested at the beginning of the period and held for the entire period from April 1, 2012 through September 30, 2012.
Actual Expenses
The first line of the table below provides information about actual account values and actual expenses. You may use the information in this line, together with the amount you invested, to estimate the expenses that you paid over the period. Simply divide your account value by $1,000 (for example, an $8,600 account value divided by $1,000 = 8.6), then multiply the result by the number in the first line under the heading entitled “Expenses Paid During Period” to estimate the expenses you paid on your account during this period.
Hypothetical Example for Comparison Purposes
The second line of the table below provides information about hypothetical account values and hypothetical expenses based on the Fund’s actual expense ratio and an assumed rate of return of 5% per year before expenses, which is not the Fund’s actual return. The hypothetical account values and expenses may not be used to estimate the actual ending account balance or expenses you paid for the period. You may use this information to compare the ongoing costs of investing in the Funds and other funds. To do so, compare this 5% hypothetical example with the 5% hypothetical examples that appear in the shareholder reports of the other funds.
Please note that the expenses shown in the table are meant to highlight your ongoing costs only and do not reflect any transactional costs. While the Brandywine Funds currently do not assess sales charges, redemption or exchange fees, other funds do, and those costs will not be reflected in their expense example tables. Therefore, the second line of the table is useful in comparing ongoing costs only, and will not help you determine the relative total costs of owning different funds.
| | Beginning | Ending | |
| | Account | Account | Expenses Paid |
| | Value | Value | During Period* |
| | 4/01/12 | 9/30/12 | 4/01/12-9/30/12 |
| Brandywine Actual | $1,000.00 | $ 956.80 | $5.09 |
| Hypothetical (5% return before expenses) | $1,000.00 | $1,019.80 | $5.25 |
| Brandywine Blue Actual | $1,000.00 | $ 928.70 | $6.08 |
| Hypothetical (5% return before expenses) | $1,000.00 | $1,018.70 | $6.36 |
| * | Expenses are equal to the Funds’ annualized expense ratios of 1.04% and 1.26%, multiplied by the average account value over the period, multiplied by 183/366 (to reflect the one-half year period between April 1, 2012 and September 30, 2012). |
Additional Director Information, Proxy Voting Policy
and Quarterly Portfolio Schedules
For additional information about the Directors and Officers or for a description of the policies and procedures that the Funds use to determine how to vote proxies relating to portfolio securities, please call (800) 656-3017 and request a Statement of Additional Information. One will be mailed to you free of charge. The Statement of Additional Information is also available on the website of the Securities and Exchange Commission (the “Commission”) at http://www.sec.gov or the Funds’ website at http://www.brandywinefunds.com. Information on how the Funds voted proxies relating to portfolio securities is available on the Funds’ website or the website of the Commission no later than August 31 for the prior twelve months ending June 30. The Funds file their complete schedule of portfolio holdings with the Commission for the first and third quarters of each fiscal year on Form N-Q. The Funds’ Forms N-Q are available on the Commission’s website. The Funds’ Forms N-Q may be reviewed and copied at the Commission’s Public Reference Room in Washington, D.C. Information on the operation of the Public Reference Room may be obtained by calling 1-800-SEC-0330.
Brandywine Fund and Brandywine Blue Fund Directors and Officers
| | | Position, Term of Office and Length | | |
| | | of Time Served and Number of | | |
| | | Portfolios in Fund Complex | Principal Occupation | Other Directorships Held |
| | Name, Age, Address | Overseen by Director | During Past Five Years | by Director |
| | | | | |
 | C. Quentin S. Jackson, 68 | Director | Mr. Jackson is retired. He was | None |
| c/o Friess Associates | Indefinite Term since | the President and Chief Executive | |
| P.O. Box 4166 | October 2001 | Officer of Nuclear Electric | |
| Greenville, DE 19807 | 3 Portfolios | Insurance Ltd., a multibillion-dollar | |
| | | company mutually owned by energy | |
| | | companies. | |
| | | | |
| | | | |
| | | | |
| | | | |
| | | | |
| | | | |
| | | | | |
 | Stuart A. McFarland, 65 | Lead Independent | Mr. McFarland is Managing Partner | Helios Funds (8 portfolios) |
| c/o Friess Associates | Director | of Federal City Capital Advisors, LLC, | and Newcastle Investment |
| P.O. Box 4166 | Indefinite Term since | a financial advisory firm. He was the | Corporation |
| Greenville, DE 19807 | October 2001 | Chairman of Federal City | |
| | 3 Portfolios | Bancorp, a thrift holding company | |
| | | from April 2004 until June 2007. | |
| | | | |
| | | | |
| | | | |
| | | | |
| | | | |
| | | | |
| | | | | |
 | Thomas D. Wren, 60 | Director | Mr. Wren is retired. He was a senior | ACM Financial Trust, Inc. |
| c/o Friess Associates | Indefinite Term since | adviser for Promontory Financial | and Hatteras Financial |
| P.O. Box 4166 | June 2006 | Group, LLC from 2006 to 2011. | Corp. |
| Greenville, DE 19807 | Audit Committee | He was the Treasurer of MBNA | |
| | Chairman, since | Corporation and its MBNA | |
| | December 2011 | America Bank, N.A. subsidiary | |
| | 3 Portfolios | from 1995 to 2006. | |
| | | | |
| | | | |
| | | | |
| | | | |
| | | | |
| | | | | |
 | Stephen M. Wynne, 57 | Director | Mr. Wynne is retired. He was the | Copeland Trust |
| c/o Friess Associates | Indefinite Term since | CEO of the U.S. Funds Services | (1 portfolio), |
| P.O. Box 4166 | September 2011 | business unit of Bank of New York | and FundVantage Trust |
| Greenville, DE 19807 | 3 Portfolios | Mellon, following the acquisition | (21 portfolios) |
| | | in 2010 of PNC Global Investment | |
| | | Servicing. He was the CEO of PNC | |
| | | Global Investment Servicing where | |
| | | he served in various capacities from | |
| | | 1977 until 2010. | |
| | | | |
| | | | |
| | | | |
| | | | | |
 | James W. Zug, 72 | Director | Mr. Zug is retired. He was a Partner | Allianz Funds |
| c/o Friess Associates | Indefinite Term since | at PricewaterhouseCoopers LLP. | (25 portfolios), |
| P.O. Box 4166 | October 2001 | He was employed with Pricewater- | Amkor Technology, Inc. |
| Greenville, DE 19807 | 3 Portfolios | houseCoopers and its predecessors | and Teleflex Inc. |
| | | from 1964 until 2000. | |
| | | | |
| | | | |
| | | | |
| | | | |
| | | | |
| | | | |
| | | | |
| | | | | |
Brandywine Fund and Brandywine Blue Fund Directors and Officers
| | | Position, Term of Office and Length | | |
| | | of Time Served and Number of | | |
| “Interested Persons” | | Portfolios in Fund Complex Over- | Principal Occupation | Other Directorships Held |
| of the Funds* | Name, Age, Address | seen by Director or Officer | During Past Five Years | by Director or Officer |
| | | | | |
| | William F. D’Alonzo*, 57 | Director | Mr. D’Alonzo joined Friess | None |
| c/o Friess Associates | Indefinite Term since | Associates in 1981 as part of the | |
| P.O. Box 4166 | October 2001 | research team, became Chief | |
| Greenville, DE 19807 | President since 2003 | Investment Officer in 1997 and | |
| | Chairman since 2004 | Chief Executive Officer in 2002. | |
| | 3 Portfolios | | |
| | | | |
| | | | |
| | | | |
| | | | |
| | | | |
| | | | |
| | | | | |
 | Joseph J. Fields*, 56 | Vice President since 2007 | Mr. Fields joined Friess Associates | None |
| c/o Friess Associates | 3 Portfolios | in 1999. He is currently a | |
| P.O. Box 4166 | | Client Relationship Manager | |
| Greenville, DE 19807 | | of the Friess Companies. | |
| | | | |
| | | | |
| | | | |
| | | | |
| | | | |
| | | | |
| | | | |
| | | | |
| | | | | |
 | Scott Gates*, 50 | Vice President since 2011 | Mr. Gates joined Friess Associates | None |
| c/o Friess Associates | 3 Portfolios | in 2003 as part of the research team, | |
| P.O. Box 4166 | | became a Research Team Leader | |
| Greenville, DE 19807 | | in 2008 and Co-Chief Investment | |
| | | Officer in 2012. | |
| | | | |
| | | | |
| | | | |
| | | | |
| | | | |
| | | | |
| | | | |
| | | | | |
 | Gordon Kaiser*, 53 | Vice President since 2007 | Mr. Kaiser joined Friess Associates | None |
| c/o Friess Associates | Treasurer since 2011 | in 1999. He is currently a | |
| P.O. Box 4166 | 3 Portfolios | Client Relationship Manager | |
| Greenville, DE 19807 | | of the Friess Companies. | |
| | | | |
| | | | |
| | | | |
| | | | |
| | | | |
| | | | |
| | | | |
| | | | |
| | | | | |
 | David D. Marky*, 47 | Vice President since 2002 | Mr. Marky joined Friess Associates | None |
| c/o Friess Associates | Chief Compliance Officer | in 2000. He currently serves as | |
| P.O. Box 4166 | since 2004 | Chief Compliance Officer and Chief | |
| Greenville, DE 19807 | 3 Portfolios | Operating Officer for the Friess | |
| | | Companies. | |
| | | | |
| | | | |
| | | | |
| | | | |
| | | | |
| | | | |
| | | | |
| | | | | |
 | Colleen Rowley*, 41 | Secretary since 2011 | Mrs. Rowley joined Friess Associates | None |
| c/o Friess Associates | 3 Portfolios | in 1998. She currently serves as Head | |
| P.O. Box 4166 | | of Trading Operations for the Friess | |
| Greenville, DE 19807 | | Companies. | |
| | | | |
| | | | |
| | | | |
| | | | |
| | | | |
| | | | |
| | | | |
| | | | |
| | | | | |
| | | | | |
| |  |  | | |
| | | |
| | | |
| | | |
| | The Brandywine Funds | |
| | P.O. Box 4166 | |
| | Greenville, DE 19807 | |
| | (877) 636-6460 | |
| | www.brandywinefunds.com | |
| | bfunds@friess.com | |
| | | |
| | Foster S. Friess | | | |
| | Founder | | | |
| | | | | |
| | | | | |
For additional information about the Directors and Officers, please call (800) 656-3017 and request a Statement of Additional Information. One will be mailed to you free of charge.
| * | Messrs. D’Alonzo, Fields, Gates, Kaiser and Marky and Ms. Rowley are “interested persons” of the Funds as that term is defined in the Investment Company Act of 1940 by reason of their being officers of the Funds and employees of Friess Associates, LLC. |
| IRA Investors . . . |
| The annual $15 maintenance fee for shareholders invested through IRA accounts is due on November 9, 2012. For your convenience, US Bancorp will automatically deduct this amount from your IRA on the due date, or if you prefer not to have the fee swept from your account, please send a check to US Bancorp by the due date. |
| Definitions and Disclosures |
| Must be preceded or accompanied by a prospectus. Please refer to the prospectus for important information about the investment company, including investment objectives, risks, charges and expenses. |
| Past performance is not a guarantee of future results. |
| Mutual fund investing involves risk. Principal loss is possible. The Funds invest in mid-cap companies, which involve additional risks such as limited liquidity and greater volatility. Investments in foreign securities, even though publicly traded in the United States, may involve risks which are in addition to those inherent in domestic investments. Current and future portfolio holdings are subject to risk. |
| Fund holdings and sector weightings are subject to change at any time and are not recommendations to buy or sell any securities. Securities discussed were not held by the Funds as of September 30, 2012, unless listed in the accompanying schedules of investments. Book Value is the net asset value of a company, calculated by subtracting total liabilities from total assets. The Price-to-Book (P/B) Ratio compares a stock’s market value to the value of total assets less total liabilities. Earnings growth rates quoted for the Funds refer solely to the estimated earnings growth rates of the average investment holding of the Funds based on consensus estimates from FactSet Research Systems Inc. (FactSet) and not to the actual performance of the Funds themselves. FactSet provides analytical information and services to the investment community. |
| The Russell 1000, Russell 1000 Growth, Russell 3000, Russell 3000 Growth and S&P 500 Indexes are unmanaged indexes commonly used to measure the performance of U.S. stocks. You cannot invest directly in an index. As of September 30, 2012, the Russell 1000 Index’s average annual total returns for 1, 5 and 10 years were 30.06, 1.22 and 8.35 percent; the Russell 1000 Growth Index’s were 29.19, 3.24 and 8.41 percent; the Russell 3000 Index’s were 30.20, 1.30 and 8.49 percent; the Russell 3000 Growth Index’s were 29.35, 3.22 and 8.57 percent; and the S&P 500 Index’s were 30.20, 1.05 and 8.01 percent. |
| | P.O. Box 4166, Greenville, DE 19807 | |
| (800) 656-3017 | www.brandywinefunds.com | bfunds@friess.com |
Investment Adviser: Friess Associates, LLC | Administrator, Accountant & Transfer Agent: U.S. Bancorp Fund Services, LLC |
Investment Sub-Adviser: Friess Associates of Delaware, LLC | Independent Registered Public Accounting Firm: PricewaterhouseCoopers LLP |
Custodian: U.S. Bank, N.A. | Distributor: Quasar Distributors, LLC |
Legal Counsel: Foley & Lardner LLP | |
Officers: William D’Alonzo, Chairman and President;
Joseph Fields, Vice President; Scott Gates, Vice President; Gordon Kaiser, Vice President and Treasurer;
David Marky, Chief Compliance Officer and Vice President; Colleen Rowley, Secretary
Report Editor: Chris Aregood Report Staff: David Marky, Adam Rieger
10/12
Item 2. Code of Ethics.
Registrant has adopted a code of ethics. See attached Exhibit 12 (a)(1).
Item 3. Audit Committee Financial Expert.
Registrant’s Board of Directors has determined that Mr. Thomas D. Wren, a member of the audit committee, is an audit committee financial expert. Mr. Wren is “independent” as such term is defined in Form N-CSR.
Item 4. Principal Accountant Fees and Services.
(a) Audit Fees
$31,767 (FY 2012) and $31,454 (FY 2011) are the aggregate fees billed for each of the last two fiscal years for professional services rendered by the principal accountant to the registrant for the audit of the registrant’s annual financial statements or services that are normally provided by the accountant in connection with statutory and regulatory filings or engagements for those fiscal years.
(b) Audit-Related Fees
There were no fees billed in the last two fiscal years for Audit-Related Fees.
There were no fees billed in the last two fiscal years for professional services rendered by the principal accountant to the registrant for tax compliance, tax advice, tax planning and tax return preparation.
(d) All Other Fees
There were no other fees billed in the last two fiscal years for products and services provided by the principal accountant to the registrant, other than the services reported in paragraphs (a) – (c) of this Item 4.
(e) (1) None
(e) (2) None
(f) Not applicable.
(g) $122,650 (FY 2012) and $69,548 (FY 2011) in non-audit fees were billed to the registrant’s investment adviser for tax return preparation and GIPS performance verification services.
(h) The Audit Committee of the registrant determined that the provision of non-audit services rendered to the registrant’s investment adviser by the principal accountant disclosed in paragraph (g) of this Item 4, was compatible with maintaining the principal accountant’s independence.
Item 5. Audit Committee of Listed Registrants.
Not applicable to registrants who are not listed issuers (as defined in Rule 10A-3 under the Securities Exchange Act of 1934).
Item 6. Schedule of Investments.
| (a) | The Schedule of Investments in securities of unaffiliated issuers is included as part of the report to shareholders filed under Item 1 of this Form. |
Item 7. Disclosure of Proxy Voting Policies and Procedures for Closed-End Management Investment Companies
Not applicable to open-end investment companies.
Item 8. Portfolio Managers of Closed-End Management Investment Companies.
Not applicable to open-end investment companies.
Item 9. Purchases of Equity Securities By Closed-End Management Investment Company and Affiliated Purchasers.
Not applicable to open-end investment companies.
Item 10. Submission of Matters to a Vote of Security Holders.
None.
Item 11. Controls and Procedures.
| (a) | The Registrant’s disclosure controls and procedures are periodically evaluated. As of October 24, 2012, the date of the last evaluation, the Registrant’s officers have concluded that the Registrant’s disclosure controls and procedures are adequate. |
| (b) | The Registrant’s internal controls are periodically evaluated. There were no changes in the Registrant’s internal control over financial reporting that occurred during the second fiscal quarter of the period covered by this report that have materially affected, or are reasonably likely to materially affect, such controls. |
Item 12. Exhibits.
| (a) | (1) Any code of ethics or amendment thereto. Filed herewith. |
(2) Certifications pursuant to Section 302 of the Sarbanes-Oxley Act of 2002. Filed herewith.
(3) Any written solicitation to purchase securities under Rule 23c-1 under the Act sent or given during the period covered by the report by or on behalf of the Registrant to 10 or more persons. Not applicable to open-end investment companies.
| (b) | Certification pursuant to Section 906 of the Sarbanes-Oxley Act of 2002. Furnished herewith. |
SIGNATURES
Pursuant to the requirements of the Securities Exchange Act of 1934 and the Investment Company Act of 1940, the registrant has duly caused this report to be signed on its behalf by the undersigned, thereunto duly authorized.
Brandywine Fund, Inc.
Registrant
By /s/William F. D’Alonzo
William F. D’Alonzo, President, Principal Executive Officer
Date October 24, 2012
Pursuant to the requirements of the Securities Exchange Act of 1934 and the Investment Company Act of 1940, this report has been signed below by the following persons on behalf of the registrant and in the capacities and on the dates indicated.
Brandywine Fund, Inc.
Registrant
By /s/J. Gordon Kaiser
J. Gordon Kaiser, Treasurer, Principal Financial Officer