UNITED STATES
SECURITIES AND EXCHANGE COMMISSION
Washington, D.C. 20549
FORM N-CSR
CERTIFIED SHAREHOLDER REPORT OF REGISTERED
MANAGEMENT INVESTMENT COMPANIES
Investment Company Act file number 811-04447
Brandywine Fund, Inc.
(Exact name of registrant as specified in charter)
P.O. Box 4166
Greenville, DE 19807
(Address of principal executive offices) (Zip code)
William F. D’Alonzo
P.O. Box 4166
Greenville, Delaware 19807
(Name and address of agent for service)
(302) 656-3017
Registrant's telephone number, including area code:
Date of fiscal year end: September 30
Date of reporting period: September 30, 2013
Item 1. Reports to Stockholders.
| Managed by Friess Associates, LLC | Annual Report | September 30, 2013 |
Dear Fellow Shareholders:
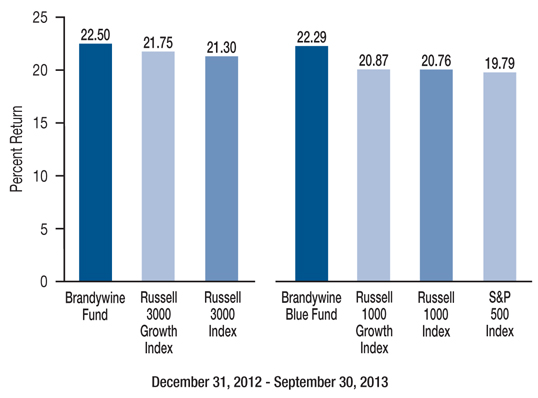
The Brandywine Funds gained ground for the third consecutive quarter, helping the Funds maintain calendar-year-to-date leads on their benchmarks.
Brandywine Fund grew 22.50 percent this year through September, outpacing gains in the Russell 3000 and Russell 3000 Growth Indexes of 21.30 and 21.75 percent. Brandywine Blue Fund grew 22.29 percent in the first nine months of 2013 versus gains in the S&P 500, Russell 1000 and Russell 1000 Growth Indexes of 19.79, 20.76 and 20.87 percent.
Following a first half in which stocks finished higher in four of the previous six months, the September quarter began in line with the year’s dominant trend. Stocks enjoyed a strong July as investors celebrated encouraging data points on housing, jobs and autos. Central banks here and abroad added to the enthusiasm by signaling ongoing commitment to easy monetary policy. The S&P 500 Index finished above 1,700 for the first time on August 1.
The market spent most of the next month retreating from that level as investors grew concerned about when the Federal Reserve might start to wind down its stimulus program. Inspired by new incremental evidence of economic progress, the market set a new high by mid-September, then stalled as political discord threatened a government shutdown at the quarter’s end.
Brandywine grew 7.80 percent in the quarter as the Russell 3000 and Russell 3000 Growth Indexes gained 6.35 and 8.48 percent. Brandywine Blue grew 7.03 percent versus gains in the S&P 500, Russell 1000 and Russell 1000 Growth Indexes of 5.24, 6.02 and 8.11 percent.
Brandywine posted positive returns in seven of the eight economic sectors represented in its portfolio during the quarter. Brandywine Blue delivered positive returns in six of eight sectors.
Health care holdings were among the strongest performers in the Brandywine Funds. Both Funds held Celgene Corp., which was the top contributor to total gains in both portfolios. Celegene beat estimates with 25 percent June-quarter earnings growth. New product traction and encouraging potential in the drug development pipeline added to investor confidence about the company’s future fundamental progress.
Other contributors included holdings in the health care supply chain such as Omnicare (Brandywine) and Cardinal Health (both Funds). The health care sector was among the most pronounced positive influences on results versus growth benchmarks during the quarter.
Given a relative lack of earnings strength in the consumer staples sector, both Funds maintained very limited exposure to the sector during the quarter. That worked in their favor in terms of relative results, as the consumer staples sector posted comparatively muted returns in growth benchmarks.
Brandywine enjoyed an added boost from the rural convenience store chain Casey’s General Stores, which continued to fuel expectation-beating earnings growth through store growth, expanded hours and new services. The company’s 42 percent April-quarter earnings growth topped estimates by 14 percent.
| | | | | | | |
| | | | Brandywine | Brandywine Blue | | |
| | | Cumulative Total Return | % Change | % Change | | |
| | | Quarter | 7.80 | 7.03 | | |
| | | One Year | 16.82 | 20.04 | | |
| | | Five Years | 7.62 | 26.23 | | |
| | | Ten Years | 56.07 | 68.06 | | |
| | | Inception | 1295.43* | 726.00** | | |
| | | | | | | |
| | | Annualized Total Return | | | | |
| | | Five Years | 1.48 | 4.77 | | |
| | | Ten Years | 4.55 | 5.33 | | |
| | | Inception | 9.96* | 9.74** | | |
| | | *12/30/85 **1/10/91 | | | | |
| | | | | | | |
| | | Expense Ratio*** | | | | |
| | | Brandywine | 1.08% | | |
| | | Brandywine Blue | 1.23% | | |
| | | | | | | |
| | | ***As stated in the Prospectus dated January 31, 2013 | | |
| | | | | | | |
| | | Performance data quoted represent past performance; past performance does not guarantee future results. The investment return and principal value of an investment will fluctuate so that an investor’s shares, when redeemed, may be worth more or less than their original cost. Current performance of the Funds may be lower or higher than the performance quoted. Performance data current to the most recent month end may be obtained by visiting www.brandywinefunds.com. | | |
| | | | | |
The consumer staples sector was the biggest contributor to Brandywine’s results versus the Russell 3000 Growth Index and the second biggest contributor to Brandywine Blue’s results versus the Russell 1000 Growth Index.
Technology holdings comprised the largest percentage of Brandywine’s assets. Semiconductor device makers Micron Technology, Integrated Device Technology and Xilinx were standout performers from the sector. All three companies exceeded consensus earnings estimates in their most recently reported quarter. Brandywine Blue also held Micron Technology and Xilinx in its portfolio, where technology as a group represented the Fund’s second largest position.
As the third-highest returning sector for both Funds, the technology sector was a significant contributor to absolute performance. Still, technology holdings modestly underperformed the technology sector within growth benchmarks. Given the sector’s size within the portfolios, technology was the second biggest detractor from performance relative to growth benchmarks.
Holdings such as Wabtec Corp. (Brandywine), Wabash National Corp. (Brandywine) and Verisk Analytics (both Funds) helped make the industrial sector a positive influence on September-quarter results. Industrial sector returns, however, were limited as economic concerns surfaced due to the Federal Reserve’s decision to maintain its stimulus program and political conflict with potential to shut the government down. The industrial sector was the biggest detractor from results relative to growth benchmarks for both Funds.
From a real-time economic perspective, we were encouraged by the earnings strength demonstrated by the companies that the Brandywine Funds held, the variety of companies able to deliver growth and the market’s willingness to recognize growth in virtually all sectors.
Top overall performers included a biopharmaceutical manufacturer in Celgene, technology companies such as Micron Technology, an offshore drilling equipment maker in Dril-Quip (Brandywine) and consumer-sensitive names that included Starbucks (both Funds), Priceline (both funds) and Harley-Davidson (both Funds).
For more information on holdings that influenced September-quarter performance, please see Roses & Thorns on page 4 for Brandywine and page 7 for Brandywine Blue.
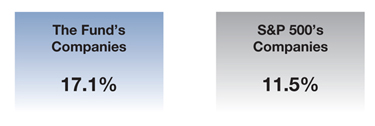
Based on consensus estimates compiled by FactSet, the average 2014 earnings growth rates for the Brandywine and Brandywine Blue portfolios are 17.1 and 16.0 percent, respectively. The average earnings growth rate for the S&P 500 Index is 11.5 percent.
Holdings from the technology, consumer discretionary and industrial sectors represent the largest percentages of Brandywine’s assets as we begin the final quarter of 2013. The portfolio’s exposure to consumer staples is limited. Consumer discretionary, technology and financial holdings account for the largest positions in Brandywine Blue. The portfolio has little exposure to the industrial sector. Neither Fund has exposure to the materials sector as the new quarter begins.
Year-to-Date Returns
We are grateful for the shareholder support we received in order to make it possible for the Brandywine Funds to join the Managers Fund Family. We are excited to begin this new chapter in the history of the Brandywine Funds with you and the rest of the Brandywine Funds shareholder family as Brandywine approaches its 28-year anniversary.
As part of the ongoing evolution of Friess Associates that we began to formalize in this letter one year ago, our Chief Investment Officer, Scott Gates, will assume public-facing responsibilities that better reflect the role he plays in overseeing the Friess Associates research effort. Starting next quarter, Scott will become the voice of our communications, enabling him to share insights from his day-to-day work as leader of the research team. I will continue to serve as a resource to Scott and the rest of the Friess team as Chairman of Friess Associates.
Thank you again for your support. Rest assured that we are working hard to deliver results that earn your continued confidence in the months and years ahead.
| | |
 |  |
| Bill D’Alonzo | |
| Friess Associates Chairman | September 30, 2013 |
Brandywine Fund
Portfolio Characteristics as of September 30, 2013
% Change in Top Ten Holdings From Book Cost
| 1. | Apple Inc. | -3.3% | | 6. | Vantiv Inc. | +51.1% |
| 2. | Micron Technology Inc. | +32.2% | | 7. | Visa Inc. | +64.8% |
| 3. | Jarden Corp. | +13.7% | | 8. | Cisco Systems Inc. | +10.9% |
| 4. | Google Inc. | +10.2% | | 9. | Whirlpool Corp. | +7.4% |
| 5. | Wabash National Corp. | +19.9% | | 10. | Synaptics Inc. | +11.6% |
| Estimated Earnings Growth Rate | The Portfolio’s Market Capitalization |
| of the Fund’s Investments | |
Forecasted Increase in Earnings Per Share 2014 vs 2013 Source: Consensus estimates from FactSet Research Systems Inc. This is not a forecast of the Fund’s future performance. Earnings growth for a Fund holding does not guarantee a corresponding increase in the market value of the holding or the Fund. As of September 30, 2013, the S&P 500 Index’s average annual total returns for 1, 5 and 10 years were 19.34, 10.02 and 7.57 percent. |  |
| |
| | |
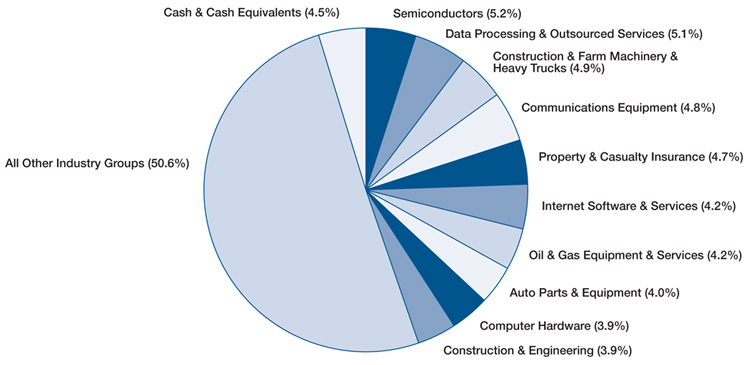
Top Ten Industry Groups
Brandywine Fund
September Quarter “Roses and Thorns”
| | $ Gain | | |
| Biggest $ Winners | (in millions) | % Gain | Reason for Move |
| Celgene Corp. | $6.6 | 25.7 | The biopharmaceutical manufacturer that develops treatments for cancer and immunological diseases grew June-quarter earnings 25 percent, beating the consensus estimate. Shares gained ground during the quarter as expectations grew around new applications for the company’s blockbuster cancer drug Revlimid. We expect new products such as Pomalyst, an oral treatment for patients with multiple myeloma, and those in the pipeline including Apremilist, for use in treating psoriasis, to increasingly contribute to future results. |
| Micron Technology Inc. | $5.9 | 32.2 | The manufacturer of DRAM and NAND memory for semiconductors grew June-quarter earnings to $0.04 per share from a loss of $0.32 a year ago, beating expectations. Better-than-expected pricing and volumes reflected the company’s ability to capitalize on supply disruptions at a competitor in the DRAM market. A recent acquisition added to earnings at a time when consolidation in the industry has fostered a more rational operating environment. |
| Wabtec Corp. | $3.8 | 14.9 | The supplier of railcar equipment grew June-quarter earnings 16 percent, beating estimates. Accelerating international transit offset lower domestic volume while recent acquisitions have enhanced the company’s platforms and market positions. We expect Wabtec to continue to benefit from its ability to help supply Positive Train Control technology required in railway systems to meet federal mandates for 2015. |
| Integrated Device Technology Inc. | $2.9 | 17.4 | The manufacturer of high-performance semiconductors used in mobile devices topped June-quarter earnings estimates by 20 percent. Shares traded higher with increasing demand and expectations for new products associated with supplying wireless power to smartphones and other mobile computing devices. |
| The Priceline Group | $2.8 | 9.7 | The world’s second largest online travel agency grew June-quarter earnings 24 percent, beating estimates. The company’s international and domestic businesses performed well in the quarter with steady hotel room night growth and improving rental car unit growth. We sold The Priceline Group during the June quarter when shares hit our target price. |
| | $ Loss | | |
| Biggest $ Losers | (in millions) | % Loss | Reason for Move |
| Stage Stores Inc. | $2.6 | 15.1 | The department store retailer, which operates under the Bealls, Goody’s, Palais Royal, Peebles, Stage and Steele’s names, came under pressure after July-quarter results missed expectations. Despite a bounce back in sales, greater promotional activity hurt profitability. We sold Stage Stores during the quarter to fund an idea with better near-term earnings potential. |
| Expedia Inc. | $1.9 | 25.0 | Increased competition negatively impacted the online travel agency’s revenue and earnings in the June quarter. Competitors paid a premium to acquire market share, which led to higher acquisition costs for Expedia and lower sales in key markets. Hotel bookings fell 19 percent year over year. We sold Expedia during the quarter to fund an idea with better near-term earnings visibility. |
| HMS Holdings Corp. | $1.9 | 11.6 | HMS’s proprietary data processing and information management services assist health care providers with cost recovery and cost avoidance solutions. Shares declined during the quarter following the loss of a key contract. Our research indicates HMS has an excellent chance of restoring the relationship given its strong reputation in identifying fraud. |
| Lennar Corp. | $1.2 | 6.1 | The builder of homes and retirement communities topped August-quarter earnings estimates by 19 percent. Revenue increased 46 percent due to a combination of strong demand and higher average sale prices. Despite strong results, shares fell on worries the Federal Reserve would curtail its economic stimulus program, causing a spike in interest rates that raised concerns that higher mortgage rates could dampen housing demand. We sold Lennar early in the quarter. |
| Apple Inc. | $1.1 | 3.3 | We purchased shares of the maker of personal computers, software and mobile computing devices ahead of its newest iterations of the iPhone 5. While initial reviews for the 5C and 5S were reserved, the company reported it sold 9 million during the launch and pre-announced that quarterly results would hit the high range of its revenue and profit-margin guidance. Our research shows that Apple’s profitability is improving while it continues to take market share from struggling competitors. |
All gains/losses are calculated on an average cost basis from June 30, 2013 through September 30, 2013.
Management’s Discussion of Results, Brandywine Fund
Fiscal year 2013 ended much like it began, with partisan political conflict dominating the news and threatening to impact the economy’s modest-paced recovery. Investor attention during much of the time in between the bouts of political drama focused on the Federal Reserve Bank, which announced in December 2012 that it would further ease monetary conditions by extending and expanding its monthly bond-buying program. Winding it down became a major topic of stock-market discussion by the period’s end, but the program remained in place at its original pace of $85 billion per month as of the end of September.
While Fed-inspired confidence marked much of the fiscal year, a combative political climate that surfaced in the weeks following the presidential election was the major influence on stocks at the start of the period. During the December quarter of 2012, the Congressional Budget Office predicted that failure to reach compromise in “fiscal cliff” negotiations would invite a recession in the first half of 2013. Brandywine Fund, which isolates companies with above-average earnings growth prospects, declined as confidence in near-term earnings strength waned during the political standoff.
Conditions improved markedly in the wake of partial resolution to the fiscal cliff standoff and the Fed’s stated commitment to loose monetary policy. Brandywine posted positive returns in each of calendar year 2013’s first three quarters, outpacing its growth benchmark, the Russell 3000 Growth Index, in the first two of those quarters as macro-level distractions subsided. Performance in the September quarter of 2013, while solidly positive, modestly trailed the benchmark amid the threat of a government shutdown.
Brandywine grew 16.82 percent in the 12 months ended September 30, 2013. The Russell 3000 and Russell 3000 Growth Indexes gained 21.60 and 20.30 percent.
Brandywine uncovered the largest concentrations of earnings strength in the technology, consumer discretionary and industrial sectors throughout the fiscal year. Those sectors, which all contributed to absolute return, detracted from performance relative to the Russell 3000 Growth Index. Consumer discretionary stocks, including Lennar Corp. and Foot Locker, detracted most from relative results. Holdings from the health care and energy sectors contributed most to results versus the benchmark.
Celgene Corp., Wabtec, Priceline Group and Visa were standout contributors to fiscal-year results. Detractors included Apple, Invensense, Nuance Communications and Mellanox Technologies.
| | | |
| | Comparison of Change in Value of $10,000 Investment in Brandywine Fund, | |
| | Russell 3000 Growth(1), Russell 3000 Index(2) and S&P 500 Index(3) | |
| | | |
| |  | |
| | (1) | The Russell 3000 Growth Index measures the performance of those Russell 3000 Index companies with higher price-to-book ratios and higher forecasted growth values. The stocks in this index are also members of either the Russell 1000 Growth or the Russell 2000 Growth Indexes. Returns include reinvested dividends. | |
| | (2) | The Russell 3000 Index, a trademark of the Frank Russell Company, is 3,000 of the largest publicly traded companies in the United States equity market and includes reinvested dividends. | |
| | (3) | The S&P 500 Index consists of 500 stocks, mostly on the New York Stock Exchange, selected by the Standard & Poor’s Ratings Group. Each stock’s weighting is based on its relative total market value and includes reinvested dividends. | |
| | | | |
Brandywine Blue Fund
Portfolio Characteristics as of September 30, 2013
% Change in Top Ten Holdings From Book Cost
| 1. | Apple Inc. | -3.3% | | 6. | Marsh & McLennan Cos. Inc. | +34.4% |
| 2. | Micron Technology Inc. | +56.1% | | 7. | Twenty-First Century Fox Inc. | +21.5% |
| 3. | Starbucks Corp. | +56.3% | | 8. | Xilinx Inc. | +18.1% |
| 4. | Celgene Corp. | +196.7% | | 9. | Google Inc. | +11.3% |
| 5. | VF Corp. | +27.1% | | 10. | Harley-Davidson Inc. | +20.2% |
| Estimated Earnings Growth Rate | The Portfolio’s Market Capitalization |
| of the Fund’s Investments | |
Forecasted Increase in Earnings Per Share 2014 vs 2013 Source: Consensus estimates from FactSet Research Systems Inc. This is not a forecast of the Fund’s future performance. Earnings growth for a Fund holding does not guarantee a corresponding increase in the market value of the holding or the Fund. As of September 30, 2013, the S&P 500 Index’s average annual total returns for 1, 5 and 10 years were 19.34, 10.02 and 7.57 percent. |  |
| | |
| | |
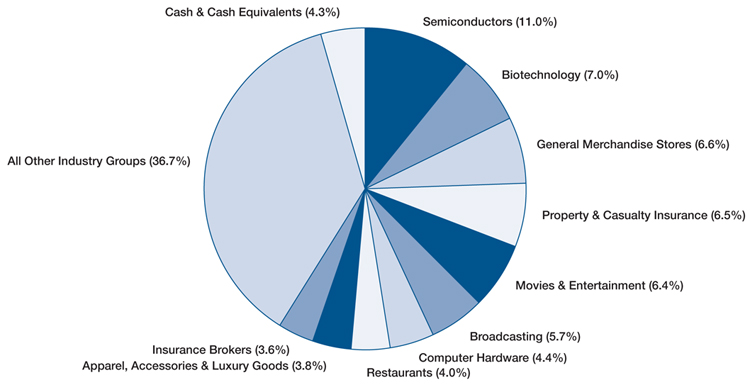
Top Ten Industry Groups
Brandywine Blue Fund
September Quarter “Roses and Thorns”
| | $ Gain | | |
| Biggest $ Winners | (in millions) | % Gain | Reason for Move |
| Celgene Corp. | $2.6 | 31.8 | The biopharmaceutical manufacturer that develops treatments for cancer and immunological diseases grew June-quarter earnings 25 percent, beating the consensus estimate. Shares gained ground during the quarter as expectations grew around new applications for the company’s blockbuster cancer drug Revlimid. We expect new products such as Pomalyst, an oral treatment for patients with multiple myeloma, and those in the pipeline including Apremilist, for use in treating psoriasis, to increasingly contribute to future results. |
| Micron Technology Inc. | $2.2 | 21.9 | The manufacturer of DRAM and NAND memory for semiconductors grew June-quarter earnings to $0.04 per share from a loss of $0.32 a year ago, beating expectations. Better-than-expected pricing and volumes reflected the company’s ability to capitalize on supply disruptions at a competitor in the DRAM market. A recent acquisition added to earnings at a time when consolidation in the industry has fostered a more rational operating environment. |
| Starbucks Corp. | $1.7 | 17.5 | The seller of specialty coffee, tea and other items grew June-quarter earnings 28 percent as revenue jumped 13 percent. Extensions of the company’s beverage platforms, new food items, international expansion and mass merchant sales helped drive higher penetration and traffic trends. |
| Xilinx Inc. | $1.5 | 17.7 | The maker of programmable semiconductors grew June-quarter earnings 19 percent, beating the consensus estimate by 19 percent. Management raised guidance during the quarter on strengthening sales into the defense and aerospace industries as well as higher demand for new products. The company’s Vivado design software tools also help generate sales of new field programmable gate array products. |
| Harley-Davidson Inc. | $1.4 | 17.2 | The motorcycle manufacturer grew June-quarter earnings 13 percent, beating the consensus earnings estimate, despite unfavorable weather conditions in many large markets. The company’s large 2014 model launch and new product innovation, including improved hands free radio and water-cooled exhaust systems, have been helping generate sales. Cost controls in the manufacturing process have been increasing profitability. |
| | $ Loss | | |
| Biggest $ Losers | (in millions) | % Loss | Reason for Move |
| Expedia Inc. | $1.6 | 19.2 | Increased competition negatively impacted the online travel agency’s revenue and earnings in the June quarter. Competitors paid a premium to acquire market share, which led to higher acquisition costs for Expedia and lower sales in key markets. Hotel bookings fell 19 percent year over year. We sold Expedia during the quarter to fund an idea with better near-term earnings visibility. |
Embraer SA SP-ADR | $0.7 | 7.4 | Shares of the Brazilian aircraft manufacturer retraced as Brazil’s financial markets pulled back on concerns that strong growth in the U.S. was not enough to offset lower demand from China and Brazil. Additionally, defense projects in Brazil were negatively impacted by budget pressures. We sold Embraer during the quarter to fund an idea with greater near-term earnings visibility. |
| Lennar Corp. | $0.5 | 5.8 | The builder of homes and retirement communities topped August-quarter earnings estimates by 19 percent. Revenue increased 46 percent due to a combination of strong demand and higher average sale prices. Despite strong results, shares fell on worries the Federal Reserve would curtail its economic stimulus program, causing a spike in interest rates that raised concerns that higher mortgage rates could dampen housing demand. We sold Lennar early in the quarter. |
| Apple Inc. | $0.4 | 3.3 | We purchased shares of the maker of personal computers, software and mobile computing devices ahead of its newest iterations of the iPhone 5. While initial reviews for the 5C and 5S were reserved, the company reported it sold 9 million during the launch and pre-announced that quarterly results would hit the high range of its revenue and profit-margin guidance. Our research shows that Apple’s profitability is improving while it continues to take market share from struggling competitors. |
| Cisco Systems Inc. | $0.4 | 3.6 | The world’s largest provider of networking products for enterprises and service providers tempered expectations for the September quarter due to macro-economic headwinds, creating pressure on shares. We continue to hold shares, as our research shows that the company’s move toward greater service and software sales differentiates it from struggling competitors and should drive profit margins higher. |
All gains/losses are calculated on an average cost basis from June 30, 2013 through September 30, 2013.
Management’s Discussion of Results, Brandywine Blue Fund
Brandywine Blue Fund isolates above-average earnings growth potential among companies at the higher end of the market-capitalization spectrum. Although the Fund’s strategy modestly underperformed the Funds growth benchmark, the Russell 1000 Growth Index, in macro-driven periods at the beginning and end of fiscal 2013, Brandywine Blue’s company-by-company approach generated outperformance versus the benchmark for the full 12-month period.
On average, companies from the consumer discretionary and technology sectors comprised the largest percentages of assets during the fiscal year. Technology holdings, including Micron Technology and Visa, contributed the most to performance versus the benchmark. Consumer discretionary holdings, while outsized contributors to absolute return, detracted from relative results.
The consumer staples and energy sectors represented other areas of relative strength, while the industrial and materials sectors were notable detractors. Holdings gained positive ground in seven out of the eight economic sectors represented during the fiscal year.
Economic uncertainty spiked in the December quarter of 2012 due to a political confrontation with potential fiscal and economic consequences. Concerns grew that a lack of resolution to the so-called “fiscal cliff” would trigger a recession in the first half of 2013. In general, companies with strong near-term earnings forecasts – the kind of companies Brandywine Blue typically holds – underperformed.
Sentiment improved amid compromise that avoided the worst of the fiscal cliff, and optimism grew as the Federal Reserve Bank expanded its monthly asset purchase program meant to contribute to the staying power of the economic recovery.
Brandywine Blue generated positive returns in each of calendar year 2013’s first three quarters, outpacing the Russell 1000 Growth Index in the first two of those quarters as macro-level distractions subsided. Relative performance slowed in the final quarter of the fiscal year amid renewed macro concerns, including the threat of a government shutdown and speculation about the eventual end of the Fed’s bond-buying program.
Brandywine Blue grew 20.04 percent in the 12 months through September 30, 2013. The Russell 1000 and Russell 1000 Growth Indexes gained 20.91 and 19.27 percent.
Standout contributors to the Fund’s fiscal-year results were Celgene Corp., Micron Technology, Starbucks Corp. and Valero Energy Corp. Notable detractors included Apple, Nuance Communications, Expedia and EMC Corp.
| | | |
| | Comparison of Change in Value of $10,000 Investment in Brandywine Blue Fund, | |
| | Russell 1000 Growth(1), Russell 1000 Index(2) and S&P 500 Index(3) | |
| | | |
| |  | |
| | | |
| | (1) | The Russell 1000 Growth Index measures the performance of those Russell 1000 Index companies with higher price-to-book ratios and higher forecasted growth values and includes reinvested dividends. | |
| | (2) | The Russell 1000 Index, a trademark of the Frank Russell Company, is the largest 1,000 companies of the 3,000 largest publicly traded companies in the United States equity market and includes reinvested dividends. | |
| | (3) | The S&P 500 Index consists of 500 stocks, mostly on the New York Stock Exchange, selected by the Standard & Poor’s Ratings Group. Each stock’s weighting is based on its relative total market value and includes reinvested dividends. | |
| | | | |
REPORT OF INDEPENDENT REGISTERED PUBLIC ACCOUNTING FIRM
To the Board of Directors and Shareholders of
Brandywine Fund, Inc. and Brandywine Blue Fund:
In our opinion, the accompanying statements of assets and liabilities, including the schedules of investments, and the related statements of operations and of changes in net assets and the financial highlights present fairly, in all material respects, the financial position of Brandywine Fund, Inc. and Brandywine Blue Fund (a series of Brandywine Blue Fund, Inc.) (the “Funds”) at September 30, 2013, the results of each of their operations for the year then ended, the changes in their net assets for each of the two years in the period then ended and the financial highlights for each of the five years in the period then ended, in conformity with accounting principles generally accepted in the United States of America. These financial statements and financial highlights (hereafter referred to as “financial statements”) are the responsibility of the Funds’ management; our responsibility is to express an opinion on these financial statements based on our audits. We conducted our audits of these financial statements in accordance with the standards of the Public Company Accounting Oversight Board (United States). Those standards require that we plan and perform the audits to obtain reasonable assurance about whether the financial statements are free of material misstatement. An audit includes examining, on a test basis, evidence supporting the amounts and disclosures in the financial statements, assessing the accounting principles used and significant estimates made by management, and evaluating the overall financial statement presentation. We believe that our audits, which included confirmation of securities at September 30, 2013 by correspondence with the custodian and brokers, provide a reasonable basis for our opinion.
As disclosed in Note 7, the Board of Directors and the Funds’ shareholders approved a reorganization which became effective on October 1, 2013, after which date the shareholders of the Funds received a corresponding number of shares of a new Brandywine series of Managers Trust I in exchange for their shares and the Funds liquidated and ceased operations.
Milwaukee, Wisconsin
October 15, 2013
Brandywine Fund, Inc.
Statement of Assets and Liabilities
September 30, 2013
| Assets: | | | |
| Investments in securities, at value (cost $687,053,001) | | $ | 812,508,021 | |
| Receivable from investments sold | | | 15,080,868 | |
| Dividends receivable | | | 169,322 | |
| Cash | | | 86,696 | |
| Receivable from shareholders for purchases | | | 34,870 | |
| Prepaid expenses | | | 12,174 | |
| Total assets | | $ | 827,891,951 | |
| Liabilities: | | | | |
| Payable for investments purchased | | $ | 10,425,564 | |
| Payable to shareholders for redemptions | | | 1,186,712 | |
| Other liabilities | | | 57,352 | |
| Total liabilities | | | 11,669,628 | |
| Net Assets: | | | | |
| Capital Stock, $0.01 par value; 500,000,000 shares authorized; 28,390,477 shares outstanding | | | 1,479,747,508 | |
| Net unrealized appreciation on investments | | | 125,455,020 | |
| Accumulated net realized loss on investments | | | (786,870,619 | ) |
| Undistributed net investment loss | | | (2,109,586 | ) |
| Net assets | | | 816,222,323 | |
| Total liabilities and net assets | | $ | 827,891,951 | |
| Calculation of net asset value per share: | | | | |
| Net asset value, offering and redemption price per share ($816,222,323 ÷ 28,390,477 shares outstanding) | | $ | 28.75 | |
The accompanying notes to financial statements are an integral part of this statement.
Brandywine Fund, Inc.
Schedule of Investments
September 30, 2013
| Shares | | | | | | | Cost | | | Value | |
| | | | | | | | | | |
| Common Stocks - 95.5% (a) | | | | | | | | | |
| | |
| CONSUMER DISCRETIONARY | |
| | | Apparel Retail - 0.5% | |
| | 165,430 | | Express Inc.* | | | | | $ | 3,881,996 | | | $ | 3,902,494 | |
| | | | Apparel, Accessories & Luxury Goods - 2.1% | |
| | 84,705 | | VF Corp. | | | | | | 12,828,155 | | | | 16,860,530 | |
| | | | Auto Parts & Equipment - 4.0% | |
| | 775,320 | | American Axle & Manufacturing | |
| | | | Holdings Inc.* | | | | | | 15,409,594 | | | | 15,289,310 | |
| | 299,890 | | Dorman Products Inc. | | | | | | 14,222,795 | | | | 14,859,550 | |
| | 148,900 | | Fox Factory Holding Corp.* | | | | | | 2,233,500 | | | | 2,869,303 | |
| | | | Cable & Satellite - 1.8% | |
| | 208,630 | | AMC Networks Inc.* | | | | | | 13,873,465 | | | | 14,286,982 | |
| | | | Footwear - 1.8% | |
| | 482,700 | | Skechers U.S.A. Inc.* | | | | | | 13,044,583 | | | | 15,016,797 | |
| | | | General Merchandise Stores - 3.8% | |
| | 282,550 | | Dollar General Corp.* | | | | | | 15,410,323 | | | | 15,952,773 | |
| | 268,000 | | Dollar Tree Inc.* | | | | | | 12,732,307 | | | | 15,318,880 | |
| | | | Home Furnishing Retail - 0.9% | |
| | 175,350 | | Tempur Sealy International Inc.* | | | | | | 7,746,958 | | | | 7,708,386 | |
| | | | Household Appliances - 2.5% | |
| | 141,560 | | Whirlpool Corp. | | | | | | 19,295,023 | | | | 20,730,047 | |
| | | | Housewares & Specialties - 2.8% | |
| | 471,600 | | Jarden Corp.* | | | | | | 20,071,107 | | | | 22,825,440 | |
| | | | Motorcycle Manufacturers - 1.5% | |
| | 184,900 | | Harley-Davidson Inc. | | | | | | 9,988,027 | | | | 11,877,976 | |
| | | | Movies & Entertainment - 1.8% | |
| | 434,740 | | Twenty-First Century Fox Inc. | | | | | | 11,975,737 | | | | 14,563,790 | |
| | | | Restaurants - 2.0% | | | | | | | | | | | |
| | 211,400 | | Starbucks Corp. | | | | | | 10,508,534 | | | | 16,271,458 | |
| | | | Specialty Stores - 0.2% | |
| | 34,740 | | Five Below Inc.* | | | | | | 1,560,506 | | | | 1,519,875 | |
| | | | Total Consumer Discretionary | | | | | | 184,782,610 | | | | 209,853,591 | |
| | | | This sector is 13.6% above your Fund’s cost. | |
| CONSUMER STAPLES | | | | | | | | | | | |
| | | | Food Retail - 1.5% | |
| | 169,230 | | Casey’s General Stores Inc. | | | | | | 11,511,154 | | | | 12,438,405 | |
| | | | Household Products - 2.0% | |
| | 268,700 | | Church & Dwight Co. Inc. | | | | | | 10,562,070 | | | | 16,135,435 | |
| | | | Personal Products - 0.7% | |
| | 145,465 | | Elizabeth Arden Inc.* | | | | | | 5,089,382 | | | | 5,370,568 | |
| | | | Total Consumer Staples | | | | | | 27,162,606 | | | | 33,944,408 | |
| | | | This sector is 25.0% above your Fund’s cost. |
| ENERGY | | | | | | | | | | | |
| | | | Oil & Gas Equipment & Services - 4.2% | |
| | 85,090 | | Dril-Quip Inc.* | | | | | | 6,756,122 | | | | 9,764,078 | |
| | 234,000 | | Helix Energy Solutions Group Inc.* | | | | | | | 5,494,375 | | | | 5,936,580 | |
| | 44,830 | | Hornbeck Offshore Services Inc.* | | | | | | | 2,480,152 | | | | 2,575,035 | |
| | 196,600 | | Oceaneering International Inc. | | | | | | | 10,590,082 | | | | 15,971,784 | |
| | | | Total Energy | | | | | | | 25,320,731 | | | | 34,247,477 | |
| | | | This sector is 35.3% above your Fund’s cost. | | | | | | | | | | | | |
| FINANCIALS | | | | | | | | | | | | |
| | | | Property & Casualty Insurance - 4.7% | | | | | | | | | | | | |
| | 385,100 | | The Allstate Corp. | | | | | | | 12,901,127 | | | | 19,466,805 | |
| | 615,170 | | XL Group PLC | | | | | | | 19,558,515 | | | | 18,959,539 | |
| | | | Total Financials | | | | | | | 32,459,642 | | | | 38,426,344 | |
| | | | This sector is 18.4% above your Fund’s cost. | | | | | | | | | | | | |
| HEALTH CARE | | | | | | | | | | | | |
| | | | Biotechnology - 2.2% | | | | | | | | | | | | |
| | 115,865 | | Celgene Corp.* | | | | | | | 6,012,038 | | | | 17,835,100 | |
| | | | Health Care Facilities - 1.8% | | | | | | | | | | | | |
| | 200,620 | | Universal Health Services Inc. | | | | | | | 13,857,366 | | | | 15,044,494 | |
| | | | Health Care Technology - 1.7% | | | | | | | | | | | | |
| | 662,340 | | HMS Holdings Corp.* | | | | | | | 16,093,513 | | | | 14,246,933 | |
| | | | Life Sciences Tools & Services - 1.2% | | | | | | | | | | | | |
| | 239,300 | | ICON PLC* | | | | | | | 5,459,636 | | | | 9,794,549 | |
| | | | Total Health Care | | | | | | | 41,422,553 | | | | 56,921,076 | |
| | | | This sector is 37.4% above your Fund’s cost. | | | | | | | | | | | | |

Brandywine Fund, Inc.
Schedule of Investments (Continued)
September 30, 2013
Shares or Principal Amount | | | | | | | Cost | | | Value | |
| | | | | | | | | | |
| Common Stocks - 95.5% (a) (Continued) | | | | | | | | | |
| | | | | | | | | | |
| INDUSTRIALS | | | | | | | | | |
| | | Construction & Engineering - 3.9% | | | | | | | | | |
| | 456,380 | | MasTec Inc.* | | | | | $ | 13,107,281 | | | $ | 13,828,314 | |
| | 642,770 | | Quanta Services Inc.* | | | | | | 16,975,331 | | | | 17,682,603 | |
| | | | Construction & Farm Machinery & Heavy Trucks - 4.9% | | | | | | | | | | | |
| | 1,864,208 | | Wabash National Corp.* | | | | | | 18,133,632 | | | | 21,736,665 | |
| | 285,220 | | Wabtec Corp. | | | | | | 7,819,060 | | | | 17,931,781 | |
| | | | Diversified Support Services - 0.4% | | | | | | | | | | | |
| | 95,130 | | Mobile Mini Inc.* | | | | | | 3,070,624 | | | | 3,240,128 | |
| | | | Electrical Components & Equipment - 1.8% | | | | | | | | | | | |
| | 350,295 | | Generac Holdings Inc. | | | | | | 14,833,714 | | | | 14,936,579 | |
| | | | Heavy Electrical Equipment - 0.4% | | | | | | | | | | | |
| | 193,525 | | PowerSecure International Inc.* | | | | | | 3,096,400 | | | | 3,106,076 | |
| | | | Marine - 1.5% | | | | | | | | | | | |
| | 138,400 | | Kirby Corp.* | | | | | | 10,982,008 | | | | 11,978,520 | |
| | | | Railroads - 0.4% | | | | | | | | | | | |
| | 28,870 | | Kansas City Southern | | | | | | 3,131,790 | | | | 3,157,223 | |
| | | | Research & Consulting Services - 2.0% | | | | | | | | | | | |
| | 255,495 | | Verisk Analytics Inc.* | | | | | | 12,301,854 | | | | 16,596,955 | |
| | | | Trading Companies & Distributors - 3.7% | | | | | | | | | | | |
| | 602,500 | | Air Lease Corp. | | | | | | 12,735,999 | | | | 16,665,150 | |
| | 239,590 | | United Rentals Inc.* | | | | | | 12,477,463 | | | | 13,965,701 | |
| | | | Trucking - 1.8% | | | | | | | | | | | |
| | 567,270 | | Arkansas Best Corp. | | | | | | 14,453,713 | | | | 14,561,821 | |
| | | | Total Industrials | | | | | | 143,118,869 | | | | 169,387,516 | |
| | | | This sector is 18.4% above your Fund’s cost. | | | | | | | | | | | |
| INFORMATION TECHNOLOGY | | | | | | | | | | | |
| | | | Application Software - 2.2% | | | | | | | | | | | |
| | 453,300 | | Informatica Corp.* | | | | | | 13,973,326 | | | | 17,665,101 | |
| | | | Communications Equipment - 4.8% | | | | | | | | | | | |
| | 886,900 | | Cisco Systems Inc. | | | | | | 18,729,708 | | | | 20,771,198 | |
| | 438,710 | | Polycom Inc.* | | | | | | 4,445,565 | | | | 4,790,713 | |
| | 415,920 | | Ubiquiti Networks Inc. | | | | | | 13,685,159 | | | | 13,970,753 | |
| | | | Computer Hardware - 3.9% | | | | | | | | | | | |
| | 66,095 | | Apple Inc. | | | | | | 32,577,182 | | | | 31,510,791 | |
| | | | Computer Storage & Peripherals - 2.5% | | | | | | | | | | | |
| | 456,323 | | Synaptics Inc.* | | | | | | 18,100,908 | | | | 20,205,982 | |
| | 19,830 | | Violin Memory Inc.* | | | | | | 178,470 | | | | 145,751 | |
| | | | Data Processing & Outsourced Services - 5.1% | | | | | | | | | | | |
| | 754,390 | | Vantiv Inc.* | | | | | | 13,946,748 | | | | 21,077,657 | |
| | 110,000 | | Visa Inc. | | | | | | 12,754,685 | | | | 21,021,000 | |
| | | | Electronic Manufacturing Services - 1.1% | | | | | | | | | | | |
| | 957,470 | | Neonode Inc.* | | | | | | 6,573,791 | | | | 6,146,957 | |
| | 141,500 | | Uni-Pixel Inc.* | | | | | | 2,256,675 | | | | 2,508,795 | |
| | | | Internet Software & Services - 4.2% | | | | | | | | | | | |
| | 547,200 | | Blucora Inc.* | | | | | | 8,991,483 | | | | 12,574,656 | |
| | 24,836 | | Google Inc.* | | | | | | 19,733,247 | | | | 21,754,101 | |
| | | | Semiconductors - 5.2% | | | | | | | | | | | |
| | 615,550 | | Integrated Device Technology Inc.* | | | | | | | 4,676,266 | | | | 5,798,481 | |
| | 1,378,700 | | Micron Technology Inc.* | | | | | | | 18,225,712 | | | | 24,085,889 | |
| | 261,800 | | Xilinx Inc. | | | | | | | 10,538,164 | | | | 12,267,948 | |
| | | | Systems Software - 0.0% | | | | | | | | | | | | |
| | 8,520 | | FireEye Inc.* | | | | | | | 320,901 | | | | 353,836 | |
| | | | Total Information Technology | | | | | | | 199,707,990 | | | | 236,649,609 | |
| | | | This sector is 18.5% above your Fund’s cost. | | | | | | | | | | | | |
| | | | Total common stocks | | | | | | | 653,975,001 | | | | 779,430,021 | |
| Short-Term Investment - 4.0% (a) | | | | | | | | | | | | |
| | | | Commercial Paper - 4.0% | | | | | | | | | | | | |
| $ | 33,078,000 | | Prudential Funding LLC, | | | | | | | | | | | | |
| | | | due 10/01/13, discount of 0.05% | | | | | | | 33,078,000 | | | | 33,078,000 | |
| | | | Total short-term investment | | | | | | | 33,078,000 | | | | 33,078,000 | |
| | | | Total investments - 99.5% | | | | | | $ | 687,053,001 | | | | 812,508,021 | |
| | | | Cash and receivables | | | | | | | | | | | | |
| | | | less liabilities - 0.5% (a) | | | | | | | | | | | 3,714,302 | |
| | | | TOTAL NET ASSETS - 100.0% | | | | | | | | | | $ | 816,222,323 | |
(a) Percentages for the various classifications relate to net assets.
* Non-dividend paying security.
The accompanying notes to financial statements are an integral part of this schedule.
Brandywine Fund, Inc.
Statement of Operations
For the Year Ended September 30, 2013
| Income: | | | |
| Dividends | | $ | 8,562,506 | |
| Interest | | | 18,741 | |
| Total income | | | 8,581,247 | |
| | | | | |
| Expenses: | | | | |
| Management fees | | | 8,686,369 | |
| Transfer agent fees | | | 427,575 | |
| Board of Directors fees and expenses | | | 120,730 | |
| Administrative and accounting services | | | 98,271 | |
| Professional fees | | | 75,032 | |
| Printing and postage expense | | | 74,113 | |
| Custodian fees | | | 60,641 | |
| Insurance expense | | | 58,997 | |
| Registration fees | | | 42,449 | |
| Other expenses | | | 5,470 | |
| Total expenses | | | 9,649,647 | |
| Net Investment Loss | | | (1,068,400 | ) |
| Net Realized Gain on Investments | | | 145,947,216 | |
| Net Decrease in Unrealized Appreciation on Investments | | | (23,872,113 | ) |
| Net Gain on Investments | | | 122,075,103 | |
| Net Increase in Net Assets Resulting From Operations | | $ | 121,006,703 | |
Statements of Changes in Net Assets
For the Years Ended September 30, 2013 and 2012
| | | 2013 | | | 2012 | |
| Operations: | | | | | | |
| Net investment loss | | $ | (1,068,400 | ) | | $ | (2,773,297 | ) |
| Net realized gain (loss) on investments | | | 145,947,216 | | | | (56,163,510 | ) |
| Net (decrease) increase in unrealized appreciation on investments | | | (23,872,113 | ) | | | 242,170,921 | |
| Net increase in net assets resulting from operations | | | 121,006,703 | | | | 183,234,114 | |
| Fund Share Activities: | | | | | | | | |
| Proceeds from shares issued (370,501 and 2,238,021 shares, respectively) | | | 9,111,537 | | | | 53,827,129 | |
| Cost of shares redeemed (15,145,877 and 21,603,021 shares, respectively) | | | (376,439,668 | ) | | | (511,388,432 | ) |
| Net decrease in net assets derived from Fund share activities | | | (367,328,131 | ) | | | (457,561,303 | ) |
| Total Decrease | | | (246,321,428 | ) | | | (274,327,189 | ) |
| Net Assets at the Beginning of the Year | | | 1,062,543,751 | | | | 1,336,870,940 | |
| Net Assets at the End of the Year | | $ | 816,222,323 | | | $ | 1,062,543,751 | |
| (Includes undistributed net investment income of $0 and $0, respectively) | | | | | | | | |
The accompanying notes to financial statements are an integral part of these statements.
Brandywine Fund, Inc.
Financial Highlights
(Selected data for each share of the Fund outstanding throughout each year)
| | | Years Ended September 30, | |
| | | 2013 | | | 2012 | | | 2011 | | | 2010 | | | 2009 | |
| PER SHARE OPERATING PERFORMANCE: | | | | | | | | | | | | | | | |
| Net asset value, beginning of year | | $ | 24.62 | | | $ | 21.38 | | | $ | 22.02 | | | $ | 21.11 | | | $ | 26.86 | |
| Income from investment operations: | | | | | | | | | | | | | | | | | | | | |
Net investment loss(1) | | | (0.03 | ) | | | (0.05 | ) | | | (0.09 | ) | | | (0.07 | ) | | | (0.05 | ) |
| Net realized and unrealized gains (losses) | | | | | | | | | | | | | | | | | | | | |
| on investments | | | 4.16 | | | | 3.29 | | | | (0.55 | ) | | | 0.98 | | | | (5.59 | ) |
| Total from investment operations | | | 4.13 | | | | 3.24 | | | | (0.64 | ) | | | 0.91 | | | | (5.64 | ) |
Less distributions: | | | | | | | | | | | | | | | | | | | | |
| Distributions from net investment income | | | — | | | | — | | | | — | | | | — | | | | — | |
| Distributions from net realized gains | | | — | | | | — | | | | — | | | | — | | | | (0.11 | ) |
| Total from distributions | | | — | | | | — | | | | — | | | | — | | | | (0.11 | ) |
| Net asset value, end of year | | $ | 28.75 | | | $ | 24.62 | | | $ | 21.38 | | | $ | 22.02 | | | $ | 21.11 | |
| TOTAL RETURN | | | 16.77 | % | | | 15.15 | % | | | (2.91 | %) | | | 4.31 | % | | | (20.98 | %) |
RATIOS/SUPPLEMENTAL DATA: | | | | | | | | | | | | | | | | | | | | |
| Net assets, end of year (in 000’s $) | | | 816,222 | | | | 1,062,544 | | | | 1,336,871 | | | | 1,755,754 | | | | 2,281,681 | |
| Ratio of expenses to average net assets | | | 1.11 | %* | | | 1.08 | % | | | 1.09 | % | | | 1.11 | % | | | 1.10 | % |
| Ratio of net investment loss | | | | | | | | | | | | | | | | | | | | |
| to average net assets | | | (0.12 | %) | | | (0.23 | %) | | | (0.36 | %) | | | (0.33 | %) | | | (0.25 | %) |
| Portfolio turnover rate | | | 214 | % | | | 256 | % | | | 234 | % | | | 225 | % | | | 239 | % |
| (1) | Net investment loss per share was calculated using average shares outstanding. |
| * Interest expense is less than 0.005% of average net assets. |
The accompanying notes to financial statements are an integral part of this statement.
This information is unaudited.
Privacy Policy
Your privacy is important to all of us at the Brandywine Funds.
We do not sell your or former shareholders’ nonpublic personal information to anyone.
| 1. | We collect nonpublic personal information about you from what we receive on applications or other forms and from your transactions with us. |
| 2. | We may disclose your nonpublic personal information to unaffiliated third parties (such as the Funds’ transfer agent) to assist us in providing services to you; to governmental authorities in response to inquiries; or as otherwise permitted by law. |
| 3. | We restrict access to your nonpublic personal information to those employes who need to know that information in order to serve you. We maintain physical, electronic and procedural safeguards to protect your nonpublic personal information. |
Household Delivery of Shareholder Documents
Only one Prospectus, Annual and Semianual Report will be sent to shareholders with the same last name and address on their Brandywine accounts, unless you request multiple copies. If you would like to receive separate copies, please call us at 1-800-656-3017 or 1-414-765-4124. We will begin sending your additional copies free of charge within 30 days. If your shares are held through a financial institution, please contact them directly.
Brandywine Blue Fund
Statement of Assets and Liabilities
September 30, 2013
| Assets: | | | |
| Investments in securities, at value (cost $230,506,922) | | $ | 278,404,564 | |
| Receivable from investments sold | | | 2,057,190 | |
| Dividends receivable | | | 199,108 | |
| Receivable from shareholders for purchases | | | 43,358 | |
| Cash | | | 41,416 | |
| Prepaid expenses | | | 15,798 | |
| Total assets | | $ | 280,761,434 | |
| Liabilities: | | | | |
| Payable to shareholders for redemptions | | $ | 2,079,897 | |
| Other liabilities | | | 61,487 | |
| Total liabilities | | | 2,141,384 | |
| Net Assets: | | | | |
| Capital Stock, $0.01 par value; 500,000,000 shares authorized; 9,283,612 shares outstanding | | | 1,303,386,399 | |
| Net unrealized appreciation on investments | | | 47,897,642 | |
| Accumulated net realized loss on investments | | | (1,072,663,991 | ) |
| Net assets | | | 278,620,050 | |
| Total liabilities and net assets | | $ | 280,761,434 | |
| Calculation of net asset value per share: | | | | |
| Net asset value, offering and redemption price per share ($278,620,050 ÷ 9,283,612 shares outstanding) | | $ | 30.01 | |
The accompanying notes to financial statements are an integral part of this statement.
Schedule of Investments
September 30, 2013
| Shares | | | | Cost | | | Value | |
| | | | | | | |
| Common Stocks - 95.7% (a) | | | | | | |
| | | | | | | |
| CONSUMER DISCRETIONARY | | | | | | |
| | | Apparel, Accessories & Luxury Goods - 3.8% | | | | | | |
| | 53,650 | | VF Corp. | | $ | 8,399,757 | | | $ | 10,679,033 | |
| | | | Automobile Manufacturers - 1.0% | | | | | | | | |
| | 72,776 | | Honda Motor Co. Ltd. - SP-ADR | | | 2,480,523 | | | | 2,775,677 | |
| | | | Broadcasting - 5.7% | | | | | | | | |
| | 151,130 | | CBS Corp. Cl B | | | 7,978,989 | | | | 8,336,331 | |
| | 90,820 | | Discovery Communications Inc.* | | | 7,107,124 | | | | 7,667,024 | |
| | | | Distributors - 2.5% | | | | | | | | |
| | 218,640 | | LKQ Corp.* | | | 6,956,714 | | | | 6,965,870 | |
| | | | General Merchandise Stores - 6.6% | | | | | | | | |
| | 160,000 | | Dollar General Corp.* | | | 8,736,543 | | | | 9,033,600 | |
| | 163,080 | | Dollar Tree Inc.* | | | 7,751,865 | | | | 9,321,653 | |
| | | | Household Appliances - 3.2% | | | | | | | | |
| | 61,255 | | Whirlpool Corp. | | | 8,262,386 | | | | 8,970,182 | |
| | | | Motorcycle Manufacturers - 3.4% | | | | | | | | |
| | 146,000 | | Harley-Davidson Inc. | | | 7,806,063 | | | | 9,379,040 | |
| | | | Movies & Entertainment - 6.4% | | | | | | | | |
| | 116,290 | | Time Warner Inc. | | | 7,492,914 | | | | 7,653,045 | |
| | 299,860 | | Twenty-First Century Fox Inc. | | | 8,270,890 | | | | 10,045,309 | |
| | | | Restaurants - 4.0% | | | | | | | | |
| | 144,100 | | Starbucks Corp. | | | 7,095,747 | | | | 11,091,377 | |
| | | | Total Consumer Discretionary | | | 88,339,515 | | | | 101,918,141 | |
| | | | This sector is 15.4% above your Fund’s cost. | | | | | | | | |
| CONSUMER STAPLES | | | | | | | | |
| | | | Household Products - 2.4% | | | | | | | | |
| | 110,540 | | Church & Dwight Co. Inc. | | | 5,506,698 | | | | 6,637,927 | |
| | | | Total Consumer Staples | | | 5,506,698 | | | | 6,637,927 | |
| | | | This sector is 20.5% above your Fund’s cost. | | | | | | | | |
Brandywine Blue Fund
Schedule of Investments (Continued)
September 30, 2013
| Shares or | | | | | | | | |
| Principal | | | | | | | | |
| Amount | | | | Cost | | | Value | |
| | | | | | | |
| Common Stocks - 95.7% (a) (Continued) | | | | | | |
| | | | | | | |
| ENERGY | | | | | | |
| | | Oil & Gas Equipment & Services - 3.1% | | | | | | |
| | 105,600 | | Oceaneering International Inc. | | $ | 5,657,030 | | | $ | 8,578,944 | |
| | | | Oil & Gas Exploration & Production - 3.1% | | | | | | | | |
| | 82,130 | | Continental Resources Inc.* | | | 8,306,046 | | | | 8,809,264 | |
| | | | Total Energy | | | 13,963,076 | | | | 17,388,208 | |
| | | | This sector is 24.5% above your Fund’s cost. | | | | | | | | |
| FINANCIALS | | | | | | | | |
| | | | Insurance Brokers - 3.6% | | | | | | | | |
| | 233,500 | | Marsh & McLennan Cos. Inc. | | | 7,563,438 | | | | 10,168,925 | |
| | | | Property & Casualty Insurance - 6.5% | | | | | | | | |
| | 183,200 | | The Allstate Corp. | | | 6,170,437 | | | | 9,260,760 | |
| | 290,500 | | XL Group PLC | | | 5,898,313 | | | | 8,953,210 | |
| | | | Total Financials | | | 19,632,188 | | | | 28,382,895 | |
| | | | This sector is 44.6% above your Fund’s cost. | | | | | | | | |
| HEALTH CARE | | | | | | | | |
| | | | Biotechnology - 7.0% | | | | | | | | |
| | 70,000 | | Celgene Corp.* | | | 3,632,181 | | | | 10,775,100 | |
| | 137,490 | | Gilead Sciences Inc.* | | | 8,298,293 | | | | 8,639,872 | |
| | | | Health Care Facilities - 3.1% | | | | | | | | |
| | 115,180 | | Universal Health Services Inc. | | | 7,983,895 | | | | 8,637,348 | |
| | | | Total Health Care | | | 19,914,369 | | | | 28,052,320 | |
| | | | This sector is 40.9% above your Fund’s cost. | | | | | | | | |
| INDUSTRIALS | | | | | | | | |
| | | | Building Products - 0.8% | | | | | | | | |
| | 51,981 | | Fortune Brands Home & | | | | | | | | |
| | | | Security Inc. | | | 2,133,983 | | | | 2,163,969 | |
| | | | Railroads - 1.6% | | | | | | | | |
| | 42,000 | | Kansas City Southern | | | 4,559,963 | | | | 4,593,120 | |
| | | | Research & Consulting Services - 3.2% | | | | | | | | |
| | 135,010 | | Verisk Analytics Inc.* | | | 6,484,751 | | | | 8,770,250 | |
| | | | Total Industrials | | | 13,178,697 | | | | 15,527,339 | |
| | | | This sector is 17.8% above your Fund’s cost. | | | | | | | | |
| INFORMATION TECHNOLOGY | | | | | | | | |
| | | | Communications Equipment - 3.1% | | | | | | | | |
| | 365,950 | | Cisco Systems Inc. | | | 7,705,906 | | | | 8,570,549 | |
| | | | Computer Hardware - 4.4% | | | | | | | | |
| | 25,960 | | Apple Inc. | | | 12,795,245 | | | | 12,376,430 | |
| | | | Data Processing & Outsourced Services - 2.7% | | | | | | | | |
| | 39,400 | | Visa Inc. | | | 4,567,362 | | | | 7,529,340 | |
| | | | Internet Software & Services - 3.5% | | | | | | | | |
| | 11,060 | | Google Inc.* | | | 8,705,871 | | | | 9,687,565 | |
| | | | Semiconductors - 11.0% | | | | | | | | |
| | 213,170 | | Microchip Technology Inc. | | | 8,386,952 | | | | 8,588,619 | |
| | 707,100 | | Micron Technology Inc.* | | | 7,914,806 | | | | 12,353,037 | |
| | 207,900 | | Xilinx Inc. | | | 8,246,237 | | | | 9,742,194 | |
| | | | Total Information Technology | | | 58,322,379 | | | | 68,847,734 | |
| | | | This sector is 18.0% above your Fund’s cost. | | | | | | | | |
| | | | Total common stocks | | | 218,856,922 | | | | 266,754,564 | |
| Short-Term Investment - 4.2% (a) | | | | | |
| | | | Commercial Paper - 4.2% | | | | | | | | |
| $ | 11,650,000 | | Prudential Funding LLC, | | | | | | | | |
| | | | due 10/01/13, discount of 0.05% | | | 11,650,000 | | | | 11,650,000 | |
| | | | Total short-term investment | | | 11,650,000 | | | | 11,650,000 | |
| | | | Total investments - 99.9% | | $ | 230,506,922 | | | | 278,404,564 | |
| | | | Cash and receivables | | | | | | | | |
| | | | less liabilities - 0.1% (a) | | | | | | | 215,486 | |
| | | | TOTAL NET ASSETS - 100.0% | | | | | | $ | 278,620,050 | |
| | | | | | | | | | | | |
| (a) Percentages for the various classifications relate to net assets. | | | | | | | | |
* Non-dividend paying security.
SP-ADR - Sponsored American Depositary Receipt
The accompanying notes to financial statements are an integral part of this schedule.
Brandywine Blue Fund
Statement of Operations
For the Year Ended September 30, 2013
| Income: | | | |
| Dividends | | $ | 7,173,632 | |
| Interest | | | 15,145 | |
| Total income | | | 7,188,777 | |
| Expenses: | | | | |
| Management fees | | | 4,310,914 | |
| Transfer agent fees | | | 416,363 | |
| Printing and postage expense | | | 199,918 | |
| Board of Directors fees and expenses | | | 111,620 | |
| Professional fees | | | 57,556 | |
| Administrative and accounting services | | | 47,410 | |
| Insurance expense | | | 41,353 | |
| Custodian fees | | | 29,244 | |
| Registration fees | | | 25,147 | |
| Other expenses | | | 2,811 | |
| Total expenses | | | 5,242,336 | |
| Net Investment Income | | | 1,946,441 | |
| Net Realized Gain on Investments | | | 104,298,858 | |
| Net Decrease in Unrealized Appreciation on Investments | | | (37,743,866 | ) |
| Net Gain on Investments | | | 66,554,992 | |
| Net Increase in Net Assets Resulting From Operations | | $ | 68,501,433 | |
Statements of Changes in Net Assets
For the Years Ended September 30, 2013 and 2012
| | | 2013 | | | 2012 | |
| Operations: | | | | | | |
| Net investment income (loss) | | $ | 1,946,441 | | | $ | (5,345,963 | ) |
| Net realized gain on investments | | | 104,298,858 | | | | 131,712,811 | |
| Net (decrease) increase in unrealized appreciation on investments | | | (37,743,866 | ) | | | 80,454,040 | |
| Net increase in net assets resulting from operations | | | 68,501,433 | | | | 206,820,888 | |
| | | | | | | | | |
| Fund Share Activities: | | | | | | | | |
| Proceeds from shares issued (1,714,608 and 5,382,266 shares, respectively) | | | 44,927,307 | | | | 132,061,615 | |
| Cost of shares redeemed (17,532,796 and 49,468,159 shares, respectively) | | | (462,430,622 | ) | | | (1,198,777,852 | ) |
| Net decrease in net assets derived from Fund share activities | | | (417,503,315 | ) | | | (1,066,716,237 | ) |
| Total Decrease | | | (349,001,882 | ) | | | (859,895,349 | ) |
| | | | | | | | | |
| Net Assets at the Beginning of the Year | | | 627,621,932 | | | | 1,487,517,281 | |
| Net Assets at the End of the Year | | $ | 278,620,050 | | | $ | 627,621,932 | |
| (Includes undistributed net investment income of $0 and $0, respectively) | | | | | | | | |
The accompanying notes to financial statements are an integral part of these statements.
Brandywine Blue Fund
Financial Highlights
(Selected data for each share of the Fund outstanding throughout each year)
| | | Years Ended September 30, | |
| | | 2013 | | | 2012 | | | 2011 | | | 2010 | | | 2009 | |
| PER SHARE OPERATING PERFORMANCE: | | | | | | | | | | | | | | | |
| Net asset value, beginning of year | | $ | 25.00 | | | $ | 21.50 | | | $ | 21.78 | | | $ | 20.67 | | | $ | 23.86 | |
| Income from investment operations: | | | | | | | | | | | | | | | | | | | | |
Net investment income (loss)(1) | | | 0.12 | | | | (0.11 | ) | | | (0.10 | ) | | | (0.06 | ) | | | 0.04 | |
| Net realized and unrealized gains (losses) | | | | | | | | | | | | | | | | | | | | |
on investments | | | 4.89 | | | | 3.61 | | | | (0.18 | ) | | | 1.24 | | | | (3.23 | ) |
| Total from investment operations | | | 5.01 | | | | 3.50 | | | | (0.28 | ) | | | 1.18 | | | | (3.19 | ) |
Less distributions: | | | | | | | | | | | | | | | | | | | | |
| Distributions from net investment income | | | — | | | | — | | | | — | | | | (0.07 | ) | | | — | |
| Distributions from net realized gains | | | — | | | | — | | | | — | | | | — | | | | — | |
| Total from distributions | | | — | | | | — | | | | — | | | | (0.07 | ) | | | — | |
| Net asset value, end of year | | $ | 30.01 | | | $ | 25.00 | | | $ | 21.50 | | | $ | 21.78 | | | $ | 20.67 | |
| TOTAL RETURN | | | 20.04 | % | | | 16.28 | % | | | (1.29 | %) | | | 5.71 | % | | | (13.37 | %) |
RATIOS/SUPPLEMENTAL DATA: | | | | | | | | | | | | | | | | | | | | |
| Net assets, end of year (in 000’s $) | | | 278,620 | | | | 627,622 | | | | 1,487,517 | | | | 2,057,591 | | | | 2,461,907 | |
| Ratio of expenses to average net assets | | | 1.22 | %* | | | 1.23 | % | | | 1.18 | % | | | 1.17 | % | | | 1.16 | % |
| Ratio of net investment income (loss) | | | | | | | | | | | | | | | | | | | | |
| to average net assets | | | 0.45 | % | | | (0.46 | %) | | | (0.38 | %) | | | (0.27 | %) | | | 0.21 | % |
| Portfolio turnover rate | | | 202 | % | | | 243 | % | | | 250 | % | | | 212 | % | | | 261 | % |
| (1) | Net investment income (loss) per share was calculated using average shares outstanding. |
* Interest expense is less than 0.005% of average net assets.
The accompanying notes to financial statements are an integral part of this statement.
The Brandywine Funds
Notes to Financial Statements
September 30, 2013
| (1) | Summary of Significant Accounting Policies |
| | The following is a summary of significant accounting policies of Brandywine Fund, Inc. (the “Brandywine Fund”) and Brandywine Blue Fund (the “Blue Fund,” one of two Funds in a series of the Brandywine Blue Fund, Inc.) (collectively the “Funds”). Each Fund is registered as a diversified open-end management company under the Investment Company Act of 1940 (the “Act”), as amended. The assets and liabilities of each Fund are segregated and a shareholder’s interest is limited to the Fund in which the shareholder owns shares. The Brandywine Fund was incorporated under the laws of Maryland on October 9, 1985. The Blue Fund was incorporated under the laws of Maryland on November 13, 1990. The investment objective of each Fund is to produce long-term capital appreciation principally through investing in common stocks. |
| | (a) | Each security, excluding short-term investments, is valued at the last sale price reported by the principal security exchange on which the issue is traded. Securities that are traded on the Nasdaq Markets are valued at the Nasdaq Official Closing Price, or if no sale is reported, the latest bid price. Securities which are traded over-the-counter are valued at the latest bid price. Securities for which quotations are not readily available are valued at fair value as determined by the investment adviser under the supervision of the Board of Directors. The fair value of a security may differ from the last quoted price and the Fund may not be able to sell a security at the estimated fair value. Market quotations may not be available, for example, if trading in particular securities has halted during the day and not resumed prior to the close of trading on the New York Stock Exchange. As of September 30, 2013, there were no securities that were internally fair valued. Short-term investments with maturities of 60 days or less are valued at amortized cost which approximates fair value. For financial reporting purposes, investment transactions are recorded on the trade date; however, for purposes of executing shareholder transactions, the Funds record changes in holdings of portfolio securities no later than the first business day after the trade date in accordance with Rule 2a-4 of the Act. Accordingly, certain differences between net asset value for financial reporting and for executing shareholder transactions may arise. |
| | | Fair value is defined as the price that the Funds would receive upon selling an investment at the measurement date or transferring a liability in an orderly transaction to an independent buyer in the principal or most advantageous market for the investment. A three-tier hierarchy is used to maximize the use of observable market data and minimize the use of unobservable inputs and to establish classification of fair value measurements for disclosure purposes. Observable inputs reflect the assumptions market participants would use in pricing the asset or liability. Observable inputs are based on market data obtained from sources independent of the reporting entity. Unobservable inputs reflect the reporting entity’s own assumptions about the assumptions market participants would use in pricing the asset or liability. Unobservable inputs are based on the best information available in the circumstances. The following is a summary of the three-tiered hierarchy of valuation input levels. |
The Brandywine Funds
Notes to Financial Statements (Continued)
September 30, 2013
| (1) | Summary of Significant Accounting Policies (Continued) |
| | Level 1 – | Inputs are unadjusted and prices are determined using quoted prices in active markets for identical securities. |
| | | |
| | Level 2 – | Prices are determined using other significant observable inputs (including quoted prices for similar securities, interest rates, prepayment speeds, credit risk, etc.). |
| | | |
| | Level 3 – | Prices are determined using significant unobservable inputs (including management’s assumptions in determining the fair value of investments). |
| | The inputs or methodologies used for valuing securities are not an indication of the risks associated with investing in those securities. The following is a summary of each Fund’s fair value measurements as of the end of the reporting period: |
| | | | Brandywine Fund | | | Blue Fund | |
| | Valuation Inputs | | Investments in Securities | | | Investments in Securities | |
| | Level 1 – Common Stocks | | $ | 779,430,021 | | | $ | 266,754,564 | |
| | Level 2 – Short-Term Commercial Paper | | | 33,078,000 | | | | 11,650,000 | |
| | Level 3 – | | | — | | | | — | |
| | Total | | $ | 812,508,021 | | | $ | 278,404,564 | |
| | It is the Funds’ policy to recognize transfers between levels at the end of the quarterly reporting period. There were no transfers between levels during the period ended September 30, 2013. |
| | |
| | See the Schedules of Investments for the investments detailed by industry classification. |
| | (b) | Net realized gains and losses on sales of securities are computed on the identified cost basis. |
| | | |
| | (c) | Dividend income is recorded on the ex-dividend date. Interest income is recorded on the accrual basis. |
| | | |
| | (d) | The preparation of financial statements in conformity with accounting principles generally accepted in the United States of America (“GAAP”) requires management to make estimates and assumptions that affect the reported amounts of assets and liabilities and disclosure of contingent assets and liabilities at the date of the financial statements and the reported amounts of revenues and expenses during the reporting period. Actual results could differ from these estimates. |
| | | |
| | (e) | No provision has been made for Federal income taxes since the Funds have elected to be taxed as “regulated investment companies” (“RICs”) and intend to distribute substantially all net investment company taxable income and net capital gains to shareholders and otherwise comply with the provisions of the Internal Revenue Code applicable to regulated investment companies. |
| | | |
| | (f) | The Funds have reviewed all open tax years and major jurisdictions, which include Federal and the state of Maryland, and concluded that there are no significant uncertain tax positions that would require recognition in the financial statements. Open tax years are those that are open for exam by taxing authorities and, as of September 30, 2013, open Federal tax years include the tax years ended September 30, 2010 through 2013. The Funds have no examinations in progress and are also not aware of any tax positions for which it is reasonably possible that the total amounts of unrecognized tax benefits will significantly change in the next twelve months. |
| | | |
| | (g) | GAAP requires that permanent differences between income for financial reporting and tax purposes be reclassified in the capital accounts. For the year ended September 30, 2013 the reclassifications were as follows: |
| | | | Undistributed | | | Accumulated | | | | |
| | | | Net Investment | | | Net Realized | | | | |
| | | | Loss | | | Loss | | | Paid In Capital | |
| | Brandywine Fund | | $ | 20,992 | | | $ | 5,330 | | | $ | (26,322 | ) |
| | Blue Fund | | | 945,352 | | | | — | | | | (945,352 | ) |
| (2) | Investment Adviser and Management Agreements and Transactions With Related Parties |
| | |
| | Each Fund had a management agreement with Friess Associates, LLC (the “Adviser”), with whom certain Officers and a Director of the Funds are affiliated, to serve as investment adviser and manager. Under the terms of the agreements, each Fund paid the Adviser a monthly management fee at the annual rate of one percent (1%) on the daily net assets of such Fund. |
| | |
| | The Adviser entered into sub-advisory agreements with its affiliate, Friess Associates of Delaware, LLC (the “Sub-Adviser”), to assist it in the day-to-day management of each of the Funds. The Adviser and, if so delegated, the Sub-Adviser supervised the investment portfolios of the Funds, directing the purchase and sale of investment securities in the day-to-day management of the Funds. The Adviser paid the Sub-Adviser a fee equal to 110% of the monthly expenses the Sub-Adviser incurred in performing its services as Sub-Adviser. This relationship did not increase the annual management fee the Funds paid to the Adviser. |
| | |
| | The Adviser voluntarily agreed to reimburse each Fund for expenses over 2% of the daily net assets of the Fund. No such reimbursements were required for the year ended September 30, 2013. |
The Brandywine Funds
Notes to Financial Statements (Continued)
September 30, 2013
| (2) | Investment Adviser and Management Agreements and Transactions With Related Parties (Continued) |
| | |
| | Each of the Funds paid the five independent directors annual fees of $23,300 each. The lead independent director and chairman of the audit committee were paid an additional $8,000 and $5,000 annually, respectively, divided proportionately among all the Funds. All of the corresponding fees the directors received were paid quarterly to the directors and then invested on the payment date in shares of the Funds at the net asset value of the Funds on the payment date. The Funds also reimbursed directors for travel costs incurred in order to attend meetings of the Board of Directors. For the year ended September 30, 2013, the Funds expensed the following directors fees and costs: |
| | | Brandywine | Blue |
| | | Fund | Fund |
| | Directors Fees and Travel Costs Expensed during the Year | $120,730 | $111,620 |
| | Under the Funds’ organizational documents, each Director, officer, employee or other agent of the Fund (including the Funds’ investment manager) is indemnified, to the extent permitted by the Act, against certain liabilities that may arise out of performance of their duties to the Funds. Additionally, in the normal course of business, the Funds entered into contracts that contain a variety of indemnification clauses. The Funds’ maximum exposure under these arrangements is unknown as this would involve future claims that may be made against the Funds that have not yet occurred. However, the Funds have not had prior claims or losses pursuant to these contracts and believe the risk of loss to be remote. |
| (3) | Credit Agreements |
| | U.S. Bank, National Association, has made available to each Fund a $50,000,000 unsecured credit facility pursuant to Credit Agreements effective October 28, 2011, for the purpose of having cash available to cover incoming redemptions. Principal and interest of such loan under the Credit Agreements are due not more than 20 days after the date of the loan. Amounts under the credit facilities bear interest at a rate per annum equal to the current prime rate minus one percent on the amount borrowed. During the year ended September 30, 2013, the Brandywine Fund had an outstanding average daily balance of $19,266 under its Credit Agreement and paid an average interest rate of 2.25%. The maximum amount outstanding during the period was $2,344,000. Interest expense amounted to $440 for the year ended September 30, 2013 and is included in Other expenses in the Statement of Operations. The Brandywine Fund did not have a loan outstanding on September 30, 2013. The Blue Fund had an outstanding average daily balance of $33,332 under its Credit Agreement and paid an average interest rate of 2.25%. The maximum amount outstanding during the period was $11,989,000. Interest expense amounted to $760 for the year ended September 30, 2013 and is included in Other expenses in the Statement of Operations. The Blue Fund did not have a loan outstanding on September 30, 2013. The Credit Agreements closed on September 30, 2013. |
| (4) | Distributions to Shareholders |
| | Net investment income and net realized gains, if any, are distributed to shareholders at least annually. |
| (5) | Investment Transactions |
| | For the year ended September 30, 2013, purchases and proceeds of sales of investment securities (excluding short-term investments) for the Funds were as follows: |
| | | | Sale |
| | | Purchases | Proceeds |
| | Brandywine Fund | $1,829,374,580 | $2,215,292,628 |
| | Blue Fund | 846,460,888 | 1,249,298,041 |
| (6) | Income Tax Information |
| | The following information for the Funds is presented on an income tax basis as of September 30, 2013: |
| | | | Gross | Gross | Net Unrealized | Distributable | Distributable |
| | | Cost of | Unrealized | Unrealized | Appreciation | Ordinary | Long-Term |
| | | Investments | Appreciation | Depreciation | on Investments | Income | Capital Gains |
| | Brandywine Fund | $687,075,090 | $130,033,332 | ($4,600,401) | $125,432,931 | $ — | $ — |
| | Blue Fund | 230,670,412 | 48,421,324 | (687,172) | 47,734,152 | — | — |
| | The difference, if any, between the cost amounts for financial statement and federal income tax purposes is due primarily to timing differences in recognizing certain gains and losses in security transactions. |
| | On December 22, 2010, the Regulated Investment Company Modernization Act of 2010 (the “RIC Act”) was enacted, which changed various technical rules governing the tax treatment of RICs. The changes are generally effective for taxable years beginning after the date of enactment. Capital losses incurred in taxable years beginning after the date of enactment may now be carried forward indefinitely, and retain the character of the original loss. Post-enactment losses must be utilized prior to pre-enactment losses. Under pre-enactment law, capital losses could be carried forward for up to eight years, and carried forward as short-term capital loss, irrespective of the character of the original loss. The RIC Act now allows RICs to elect to “push” to the first day of the next taxable year all or part of any late year ordinary loss, which is defined as the sum of the specified post-October losses and other post-December ordinary losses, over the specified post-October gains and other post-December ordinary gains. This reduces the circumstances under which a RIC might be required to file amended Forms 1099 to restate previously reported distributions. |
| | The tax components of dividends paid during the years ended September 30, 2013 and 2012, capital loss carryovers, which may be used to offset future capital gains, subject to Internal Revenue Code limitations, tax basis post-October losses as of September 30, 2013, which are not recognized for tax purposes until the first day of the following fiscal year, and late year ordinary losses are: |
The Brandywine Funds
Notes to Financial Statements (Continued)
September 30, 2013
| (6) | Income Tax Information (Continued) |
| | | September 30, 2013 | | September 30, 2012 |
| | | Ordinary | Long-Term | Net Capital | | Late Year | | Ordinary | Long-Term |
| | | Income | Capital Gains | Loss | Post-October | Ordinary | | Income | Capital Gains |
| | | Distributions | Distributions | Carryovers | Losses | Losses | | Distributions | Distributions |
| | Brandywine Fund | $ — | $ — | $ 786,848,529 | $ — | $2,109,586 | | $ — | $ — |
| | Blue Fund | — | — | 1,072,500,501 | — | — | | — | — |
| | | | Post-Enactment |
| | | Net Capital Loss Carryovers Expiring | Capital Loss |
| | | 2017 | 2018 | Carryforwards |
| | Brandywine Fund | $283,704,320 | $503,144,209 | $ — |
| | Blue Fund | 876,614,269 | 195,886,232 | — |
| | Since there were no ordinary distributions paid by the Funds for the year ended September 30, 2013, there were no distributions designated as qualifying for the dividends received deduction for corporate shareholders nor as qualified dividend income under the Jobs and Growth Tax Relief Act of 2003. (Unaudited) |
| (7) | Subsequent Events Disclosure |
| | The Board of Directors unanimously approved a plan of reorganization (the “Agreement”) pursuant to which the Brandywine Fund, Inc. and the Brandywine Blue Fund, a series of Brandywine Blue Fund, Inc., would transfer all of their assets and liabilities to a new Brandywine series of Managers Trust I (the “Trust” or “Acquiring Fund”). The Agreement was approved by the Funds’ shareholders on September 23, 2013 and the reorganization became effective on October 1, 2013. Upon closing of the reorganization, shareholders of each of the Funds received a corresponding number of shares of the Acquiring Fund in exchange for their shares of such Fund and the Funds liquidated and ceased operations. |
| (8) | Matters Submitted to a Shareholder Vote (Unaudited) |
| | At the Special Meeting of Shareholders of the Brandywine Funds held September 23, 2013, the following votes were recorded. The Proposal, which shareholders were asked to vote on, is explained in further detail in the proxy statement dated July 13, 2013. |
| | Proposal 1 - To approve Agreements and Plans of Reorganization, which provides for the acquisition of the assets and assumption of the liabilities of Brandywine Fund and Brandywine Blue Fund in exchange for shares of the New Brandywine Fund and New Brandywine Blue Fund. A vote in favor of each Agreement and Plan of Reorganization will also constitute a vote in favor of the liquidation and dissolution of Brandywine Fund and Brandywine Blue Fund in connection with the reorganization. The results are as follows: |
| | | | | | | % of Outstanding | | | | |
| | | | No. of Shares | | | Shares | | | % of Share Voted | |
| | Brandywine Fund | | | | | | | | | |
| | Proposal 1 | | | | | | | | | |
| | Affirmative | | | 15,139,217 | | | | 50.262 | % | | | 93.019 | % |
| | Against | | | 691,616 | | | | 2.296 | % | | | 4.249 | % |
| | Abstain | | | 444,571 | | | | 1.476 | % | | | 2.732 | % |
| | Totals | | | 16,275,404 | | | | 54.034 | % | | | 100.000 | % |
| | | | | |
| | | | % of Outstanding | |
| | | | No. of Shares | | | Shares | | | % of Share Voted | |
| | Brandywine Blue Fund | | | | | | | | | | | | |
| | Proposal 1 | | | | | | | | | | | | |
| | Affirmative | | | 5,249,200 | | | | 48.849 | % | | | 93.424 | % |
| | Against | | | 248,684 | | | | 2.314 | % | | | 4.426 | % |
| | Abstain | | | 120,814 | | | | 1.124 | % | | | 2.150 | % |
| | Totals | | | 5,618,698 | | | | 52.287 | % | | | 100.000 | % |
| | Pursuant to the Act, such total votes on the proposals represented a quorum of the outstanding shares of each of the Funds. |
Cost Discussion
Mutual fund shareholders incur two types of costs: (1) transaction costs, including sales charges (loads) on purchase payments, reinvested dividends, or other distributions; redemption fees; and exchange fees; and (2) ongoing costs, including management fees; distribution [and/or service] (12b-1) fees; and other fund expenses. Brandywine and Brandywine Blue do not have 12b-1 distribution fees. This example is intended to help you understand your ongoing costs (in dollars) of investing in the Brandywine Funds and to compare these costs with the ongoing costs of investing in other mutual funds.
In addition to the costs highlighted and described below, the only Fund transaction costs you might currently incur would be wire fees ($15 per wire), if you choose to have proceeds from a redemption wired to your bank account instead of receiving a check. Additionally, U.S. Bank charges an annual processing fee ($15) if you maintain an IRA account with the Funds. To determine your total costs of investing in the Funds, you would need to add any applicable wire or IRA processing fees you have incurred during the period to the costs provided in the example below.
The example is based on an investment of $1,000 invested at the beginning of the period and held for the entire period from April 1, 2013 through September 30, 2013.
Actual Expenses
The first line of the table below provides information about actual account values and actual expenses. You may use the information in this line, together with the amount you invested, to estimate the expenses that you paid over the period. Simply divide your account value by $1,000 (for example, an $8,600 account value divided by $1,000 = 8.6), then multiply the result by the number in the first line under the heading entitled “Expenses Paid During Period” to estimate the expenses you paid on your account during this period.
Hypothetical Example for Comparison Purposes
The second line of the table below provides information about hypothetical account values and hypothetical expenses based on the Fund’s actual expense ratio and an assumed rate of return of 5% per year before expenses, which is not the Fund’s actual return. The hypothetical account values and expenses may not be used to estimate the actual ending account balance or expenses you paid for the period. You may use this information to compare the ongoing costs of investing in the Funds and other funds. To do so, compare this 5% hypothetical example with the 5% hypothetical examples that appear in the shareholder reports of the other funds.
Please note that the expenses shown in the table are meant to highlight your ongoing costs only and do not reflect any transactional costs. While the Brandywine Funds currently do not assess sales charges, redemption or exchange fees, other funds do, and those costs will not be reflected in their expense example tables. Therefore, the second line of the table is useful in comparing ongoing costs only, and will not help you determine the relative total costs of owning different funds.
| | | Beginning | | | Ending | | | | |
| | | Account | | | Account | | | Expenses Paid | |
| | | Value | | | Value | | | During Period* | |
| | | 4/01/13 | | | 9/30/13 | | | 4/01/13-9/30/13 | |
| Brandywine Actual | | $ | 1,000.00 | | | $ | 1,105.80 | | | $ | 5.81 | |
| Hypothetical (5% return before expenses) | | $ | 1,000.00 | | | $ | 1,019.55 | | | $ | 5.57 | |
| Brandywine Blue Actual | | $ | 1,000.00 | | | $ | 1,109.80 | | | $ | 6.45 | |
| Hypothetical (5% return before expenses) | | $ | 1,000.00 | | | $ | 1,018.95 | | | $ | 6.17 | |
| * | Expenses are equal to the Funds’ annualized expense ratios of 1.10% and 1.22%, multiplied by the average account value over the period, multiplied by 183/365 (to reflect the one-half year period between April 1, 2013 and September 30, 2013). |
Additional Director Information, Proxy Voting Policyand Quarterly Portfolio Schedules
For additional information about the Directors and Officers for the New Brandywine Funds or for a description of the policies and procedures that the Funds use to determine how to vote proxies relating to portfolio securities, please call (800) 656-3017 and request a Statement of Additional Information. One will be mailed to you free of charge. The Statement of Additional Information is also available on the website of the Securities and Exchange Commission (the “Commission”) at http://www.sec.gov or the Funds’ website at http://www.brandywinefunds.com. Information on how the Funds voted proxies relating to portfolio securities is available on the Funds’ website or the website of the Commission no later than August 31 for the prior twelve months ending June 30. The Funds file their complete schedule of portfolio holdings with the Commission for the first and third quarters of each fiscal year on Form N-Q. The Funds’ Forms N-Q are available on the Commission’s website. The Funds’ Forms N-Q may be reviewed and copied at the Commission’s Public Reference Room in Washington, D.C. Information on the operation of the Public Reference Room may be obtained by calling 1-800-SEC-0330.
Brandywine Fund and Brandywine Blue Fund Directors and Officers
| | | | Position, Term of Office and Length | | |
| | | | of Time Served and Number of | | |
| | | | Portfolios in Fund Complex Over- | Principal Occupation | Other Directorships Held |
| | | Name, Age, Address | seen by Director | During Past Five Years | by Director |
| | | | | | |
 | | C. Quentin S. Jackson, 69 c/o Friess Associates P.O. Box 4166 Greenville, DE 19807 | Director | Mr. Jackson is retired. He was the President and Chief Executive Officer of Nuclear Electric Insurance Ltd., a multibillion-dollar company mutually owned by energy | None |
| | | | | | |
 | | Stuart A. McFarland, 66 | Lead Independent | Mr. McFarland is Managing Partner of Federal City Capital Advisors, LLC, a financial advisory firm. He was the Chairman of Federal City Bancorp, a thrift holding company from April 2004 until June 2007. | Helios Funds (8 portfolios) |
| | | | | | |
 | | Thomas D. Wren, 61 | Director | Mr. Wren is retired. He was a senior adviser for Promontory Financial Group, LLC from 2006 to 2011. He was the Treasurer of MBNA Corporation and its MBNA 2011America Bank, N.A. subsidiary | ACM Financial Trust, Inc. |
| | | | | | |
 | | Stephen M. Wynne, 58 | Director | Mr. Wynne is retired. He was the CEO of the U.S. Funds Services business unit of Bank of New York Mellon, following the acquisition in 2010 of PNC Global Investment Servicing. He was the CEO of PNC Global Investment Servicing where he served in various capacities from | Copeland Trust |
| | | | | | |
 | | James W. Zug, 73 | Director | Mr. Zug is retired. He was a Partner at PricewaterhouseCoopers LLP. He was employed with Pricewater- houseCoopers and its predecessors | Allianz Funds |
| | | | | | |
Brandywine Fund and Brandywine Blue Fund Directors and Officers
| | | | Position, Term of Office and Length | | |
| | | | of Time Served and Number of | | |
| “Interested Persons” | | | Portfolios in Fund Complex Over- | Principal Occupation | Other Directorships Held |
| of the Funds* | | Name, Age, Address | seen by Director | During Past Five Years | by Director or Officer |
| | | | | | |
 | | William F. D’Alonzo*, 58 | Director Indefinite Term since October 2001 President since 2003 Chairman since 2004 3 Portfolios | Mr. D’Alonzo joined Friess Associates in 1981 as part of the research team, became Chief Investment Officer in 1997, Chief Executive Officer in 2002 and | None |
| | | | | | |
 | | Joseph J. Fields*, 57 c/o Friess Associates P.O. Box 4166 Greenville, DE 19807 | Vice President since 2007 | Mr. Fields joined Friess Associates in 1999. He is currently a Client Relationship Manager of the Friess Companies. | None |
| | | | | | |
 | | Scott Gates*, 51 | Vice President since 2011 3 Portfolios | Mr. Gates joined Friess Associates in 2003 as part of the research team, became a Research Team Leader in2008 and Chief Investment Officerin 2013. | None |
| | | | | | |
 | | Gordon Kaiser*, 54 c/o Friess Associates P.O. Box 4166 Greenville, DE 19807 | Vice President since 2007 | Mr. Kaiser joined Friess Associates in 1999. He is currently a Client Relationship Manager | None |
| | | | | | |
 | | David D. Marky*, 48 c/o Friess Associates P.O. Box 4166 Greenville, DE 19807 | Vice President since 2002 Chief Compliance Officer since 2004 | Mr. Marky joined Friess Associates in 2000. He currently serves as Chief Compliance Officer and Chief Operating Officer for the Friess | None |
| | | | | | |
 | | Colleen Rowley*, 42 | Secretary since 2011 | Mrs. Rowley joined Friess Associates in 1998. She currently serves as Head of Trading Operations for the Friess | None |
| | | | | | |
| | | | | |
| | | | | |
| | | | | |
| |  |  | The Brandywine Funds P.O. Box 701 | |
| | Foster S. Friess | | | |
| | Founder | | | |
| | | | | |
For additional information about the Directors and Officers of the New Brandywine Funds, please call (800) 656-3017 and request a Statement of Additional Information. One will be mailed to you free of charge.
| * | Messrs. D’Alonzo, Fields, Gates, Kaiser and Marky and Ms. Rowley are “interested persons” of the Funds as that term is defined in the Investment Company Act of 1940 by reason of their being officers of the Funds and employees of Friess Associates, LLC. |
IRA Investors . . . One of the first recognizable benefits of the Brandywine Funds becoming part of the Managers Fund Family involves IRA maintenance fees. There are none. Shareholders invested through IRA accounts no longer will be asked to pay $15 each November to maintain their accounts. |
Capital Gains Update . . . The Brandywine Funds will not distribute capital gains stemming from fiscal 2013. Whether there are any capital gains distributions made for the calendar year will be determined over the final three months of 2013, but that possibility is very remote. Both Funds finished September in net tax loss positions mainly consisting of net loss carry-forwards from previous periods. The Brandywine Funds are unlikely to make capital gains distributions, which are taxable events for shareholders in taxable accounts, until either gains are realized in excess of their accumulated net loss amounts or those net loss carry-forwards expire. |
Definitions and Disclosures Must be preceded or accompanied by a prospectus. Please refer to the prospectus for important information about the investment company, including investment objectives, risks, charges and expenses. Past performance is not a guarantee of future results. Mutual fund investing involves risk. Principal loss is possible. The Funds invest in mid-cap companies, which involve additional risks such as limited liquidity and greater volatility. Investments in foreign securities, even though publicly traded in the United States, may involve risks which are in addition to those inherent in domestic investments. Current and future portfolio holdings are subject to risk. Fund holdings and sector weightings are subject to change at any time and are not recommendations to buy or sell any securities. References to other funds should not be interpreted as an offer of these securities. Securities discussed were not held by the Funds as of September 30, 2013, unless listed in the accompanying schedules of investments. Book Value is the net asset value of a company, calculated by subtracting total liabilities from total assets. Earnings growth rates quoted for the Funds refer solely to the estimated earnings growth rates of the average investment holding of the Funds based on consensus estimates from FactSet Research Systems Inc. (FactSet) and not to the actual performance of the Funds themselves. FactSet provides analytical information and services to the investment community. The Russell 1000, Russell 1000 Growth, Russell 3000, Russell 3000 Growth and S&P 500 Indexes are unmanaged indexes commonly used to measure the performance of U.S. stocks. You cannot invest directly in an index. As of September 30, 2013, the Russell 1000 Index’s average annual total returns for 1, 5 and 10 years were 20.91, 10.53 and 7.98 percent; the Russell 1000 Growth Index’s were 19.27, 12.07 and 7.82 percent; the Russell 3000 Index’s were 21.60, 10.58 and 8.11 percent; the Russell 3000 Growth Index’s were 20.30, 12.16 and 7.99 percent; and the S&P 500 Index’s were 19.34, 10.02 and 7.57 percent. |
P.O. Box 701, Milwaukee, WI 53201-0701
(800) 656-3017 www.brandywinefunds.com bfunds@friess.com
Investment Adviser: Friess Associates, LLC | Administrator, Accountant & Transfer Agent: U.S. Bancorp Fund Services, LLC |
Investment Sub-Adviser: Friess Associates of Delaware, LLC | Independent Registered Public Accounting Firm: PricewaterhouseCoopers LLP |
Custodian: U.S. Bank, N.A. | Distributor: Quasar Distributors, LLC |
Legal Counsel: Foley & Lardner LLP | |
Report Editor: Chris Aregood Report Staff: David Marky, Adam Rieger
For information on the Officers and Service providers of the New Brandywine Funds,please call (800) 656-3017 and request a Statement of Additional Information. One will be mailed to you free of charge.
10/13
Item 2. Code of Ethics.
Registrant has adopted a code of ethics. See attached Exhibit 12 (a)(1).
Item 3. Audit Committee Financial Expert.
Registrant’s Board of Directors has determined that Mr. Thomas D. Wren, a member of the audit committee, is an audit committee financial expert. Mr. Wren is “independent” as such term is defined in Form N-CSR.
Item 4. Principal Accountant Fees and Services.
(a) Audit Fees
$35,000 (FY 2013) and $31,372 (FY 2012) are the aggregate fees billed for each of the last two fiscal years for professional services rendered by the principal accountant to the registrant for the audit of the registrant’s annual financial statements or services that are normally provided by the accountant in connection with statutory and regulatory filings or engagements for those fiscal years.
(b) Audit-Related Fees
There were no fees billed in the last two fiscal years for Audit-Related Fees.
There were no fees billed in the last two fiscal years for professional services rendered by the principal accountant to the registrant for tax compliance, tax advice, tax planning and tax return preparation.
(d) All Other Fees
There were no other fees billed in the last two fiscal years for products and services provided by the principal accountant to the registrant, other than the services reported in paragraphs (a) – (c) of this Item 4.
(e) (1) None
(e) (2) None
(f) Not applicable.
(g) $137,611 (FY 2013) and $122,650 (FY 2012) in non-audit fees were billed to the registrant’s investment adviser for tax return preparation and GIPS performance verification services.
(h) The Audit Committee of the registrant determined that the provision of non-audit services rendered to the registrant’s investment adviser by the principal accountant disclosed in paragraph (g) of this Item 4, was compatible with maintaining the principal accountant’s independence.
Item 5. Audit Committee of Listed Registrants.
Not applicable to registrants who are not listed issuers (as defined in Rule 10A-3 under the Securities Exchange Act of 1934).
Item 6. Schedule of Investments.
| (a) | The Schedule of Investments in securities of unaffiliated issuers is included as part of the report to shareholders filed under Item 1 of this Form. |
Item 7. Disclosure of Proxy Voting Policies and Procedures for Closed-End Management Investment Companies
Not applicable to open-end investment companies.
Item 8. Portfolio Managers of Closed-End Management Investment Companies.
Not applicable to open-end investment companies.
Item 9. Purchases of Equity Securities By Closed-End Management Investment Company and Affiliated Purchasers.
Not applicable to open-end investment companies.
Item 10. Submission of Matters to a Vote of Security Holders.
None.
Item 11. Controls and Procedures.
| (a) | The Registrant’s disclosure controls and procedures are periodically evaluated. As of October 25, 2013, the date of the last evaluation, the Registrant’s officers have concluded that the Registrant’s disclosure controls and procedures are adequate. |
| (b) | The Registrant’s internal controls are periodically evaluated. There were no changes in the Registrant’s internal control over financial reporting that occurred during the second fiscal quarter of the period covered by this report that have materially affected, or are reasonably likely to materially affect, such controls. |
Item 12. Exhibits.
| (a) | (1) Any code of ethics or amendment thereto. Filed herewith. |
(2) Certifications pursuant to Section 302 of the Sarbanes-Oxley Act of 2002. Filed herewith.
(3) Any written solicitation to purchase securities under Rule 23c-1 under the Act sent or given during the period covered by the report by or on behalf of the Registrant to 10 or more persons. Not applicable to open-end investment companies.
| (b) | Certification pursuant to Section 906 of the Sarbanes-Oxley Act of 2002. Furnished herewith. |
SIGNATURES
Pursuant to the requirements of the Securities Exchange Act of 1934 and the Investment Company Act of 1940, the registrant has duly caused this report to be signed on its behalf by the undersigned, thereunto duly authorized.
Brandywine Fund, Inc.
Registrant
By /s/William F. D’Alonzo
William F. D’Alonzo, President, Principal Executive Officer
Date October 25, 2013
Pursuant to the requirements of the Securities Exchange Act of 1934 and the Investment Company Act of 1940, this report has been signed below by the following persons on behalf of the registrant and in the capacities and on the dates indicated.
Brandywine Fund, Inc.
Registrant
By /s/J. Gordon Kaiser
J. Gordon Kaiser, Treasurer, Principal Financial Officer