UNITED STATES
SECURITIES AND EXCHANGE COMMISSION
Washington, D.C. 20549
FORM N-CSR
CERTIFIED SHAREHOLDER REPORT
OF
REGISTERED MANAGEMENT INVESTMENT COMPANIES
Investment Company Act file number: 811-4474
Name of Registrant: Vanguard California Tax-Free Funds
| |
| Address of Registrant: | P.O. Box 2600 |
| | Valley Forge, PA 19482 |
| |
| Name and address of agent for service: | Heidi Stam, Esquire |
| | P.O. Box 876 |
| | Valley Forge, PA 19482 |
Registrant’s telephone number, including area code: (610) 669-1000
Date of fiscal year end: November 30
Date of reporting period: December 1, 2009 – May 31, 2010
Item 1: Reports to Shareholders
 |
| Vanguard California Tax-Exempt Funds |
| Semiannual Report |
|
| May 31, 2010 |
 |
|
|
|
| Vanguard California Tax-Exempt Money Market Fund |
| Vanguard California Intermediate-Term Tax-Exempt Fund |
| Vanguard California Long-Term Tax-Exempt Fund |
> In an environment of short-term interest rates just above zero, Vanguard California Tax-Exempt Money Market Fund returned 0.05% for the six months ended May 31, 2010; this result was above the average return of competitive state funds.
> The Investor Shares of Vanguard California Intermediate-Term Tax-Exempt Fund returned 3.40%, ahead of the benchmark index and the average return of peer funds.
> Vanguard California Long-Term Tax-Exempt Fund returned 4.22% for Investor Shares, outpacing the fund’s benchmark but trailing the average return of competitors.
| |
| Contents | |
| Your Fund’s Total Returns. | 1 |
| Chairman’s Letter. | 2 |
| Advisor’s Report. | 9 |
| California Tax-Exempt Money Market Fund. | 12 |
| California Intermediate-Term Tax-Exempt Fund. | 28 |
| California Long-Term Tax-Exempt Fund. | 57 |
| About Your Fund’s Expenses. | 79 |
| Trustees Approve Advisory Arrangement. | 81 |
| Glossary. | 82 |
Please note: The opinions expressed in this report are just that—informed opinions. They should not be considered promises or advice. Also, please keep in mind that the information and opinions cover the period through the date on the front of this report. Of course, the risks of investing in your fund are spelled out in the prospectus.
See the Glossary for definitions of investment terms used in this report.
Cover photograph: Veronica Coia.
| | | | | |
| Your Fund’s Total Returns | | | | | |
| |
| |
| |
| |
| Six Months Ended May 31, 2010 | | | | | |
| | | Taxable- | | | |
| | SEC Equivalent | Income | Capital | Total |
| | Yields | Yields | Returns | Returns | Returns |
| Vanguard California Tax-Exempt Money | | | | | |
| Market Fund | 0.14% | 0.24% | 0.05% | 0.00% | 0.05% |
| California Tax-Exempt Money Market Funds | | | | | |
| Average | | | | | 0.01 |
| California Tax-Exempt Money Market Funds Average: Derived from data provided by Lipper Inc. | | | |
| Vanguard California Intermediate-Term Tax-Exempt Fund | | | | |
| Investor Shares | 3.13% | 5.38% | 1.93% | 1.47% | 3.40% |
| Admiral™ Shares | 3.21 | 5.52 | 1.97 | 1.47 | 3.44 |
| Barclays Capital 7 Year Municipal Bond Index | | | | | 2.66 |
| California Intermediate Municipal Debt Funds | | | | | |
| Average | | | | | 3.17 |
| California Intermediate Municipal Debt Funds Average: Derived from data provided by Lipper Inc. | | | |
| Vanguard California Long-Term Tax-Exempt Fund | | | | | |
| Investor Shares | 3.75% | 6.45% | 2.22% | 2.00% | 4.22% |
| Admiral™ Shares | 3.83 | 6.59 | 2.26 | 2.00 | 4.26 |
| Barclays Capital 10 Year Municipal Bond Index | | | | | 3.46 |
| California Municipal Debt Funds Average | | | | | 4.73 |
| California Municipal Debt Funds Average: Derived from data provided by Lipper Inc. | | | |
7-day SEC yield for the California Tax-Exempt Money Market Fund; 30-day SEC yield for the California Intermediate-Term Tax-Exempt Fund and California Long-Term Tax-Exempt Fund.
The calculation of taxable-equivalent yield assumes a typical itemized tax return and is based on the maximum federal tax rate of 35% and the maximum income tax rate for the state. Local taxes were not considered. Please see the prospectus for a detailed explanation of the calculation.
Admiral Shares are a lower-cost class of shares available to many longtime shareholders and to those with significant investments in the fund.
1

Chairman’s Letter
Dear Shareholder:
Municipal bonds performed well in the six months ended May 31, even as serious budget shortfalls at the state and local levels continued to take center stage nationwide. As you know, California seems to be in the spotlight more often than most.
Confidence in your state’s ability to make it through these difficult times can be seen in investors’ continuing acceptance of California bonds, which have produced solid returns for both the California Intermediate-Term Tax-Exempt Fund and the California Long-Term Tax-Exempt Fund, whose Investor Shares returned 3.40% and 4.22%, respectively, for the half-year. Both funds solidly outperformed their benchmark indexes. The intermediate-term fund also topped the average return of competitor funds, while the long-term fund trailed its peers.
At the short-term end of the interest rate spectrum, Federal Reserve policy—aimed at stimulating the economy—anchored both taxable and tax-exempt money market rates and returns near zero. Vanguard California Tax-Exempt Money Market Fund returned only 0.05%, but the fund’s low expenses helped it stay ahead of the average return of its peer group.
Yields for the Vanguard California bond funds dipped during the six-month period (in fact, many tax-exempt yields hovered near four-decade lows) as investors’ search
2
for higher yields lifted prices for intermediate-term bonds and, for the longest-term bonds, strong demand faced a supply reduction. For Investor Shares, the Intermediate-Term Fund’s yield slid to 3.13% from 3.29%, and the Long-Term Fund’s yield fell to 3.75% from 3.95%. The Tax-Exempt Money Market Fund’s yield was little changed (0.14% versus 0.17%). As shown on page 1, the taxable-equivalent yield of each fund was higher.
Note: The funds are permitted to invest in securities whose income is subject to the alternative minimum tax (AMT). As of May 31, the Money Market Fund had some exposure to these securities, but the Intermediate-Term and Long-Term Funds did not.
Surprising developments, fast-changing sentiment
For most of the past six months, corporate and municipal bonds were the fixed income market’s best performers, although returns were generally tepid compared with last year’s exceptional rally. Municipal bonds again outpaced the broad taxable bond market. Riskier securities delivered the highest returns, while U.S. Treasury prices drifted lower. These dynamics reflected both optimism that the U.S. economic recovery was gaining traction, enhancing the credit-worthiness of borrowers, and investors’ wide-ranging search for yield in response to record-low short-term interest rates.
| | | |
| Market Barometer | | | |
| | | | Total Returns |
| | | Periods Ended May 31, 2010 |
| | Six | One | Five Years |
| | Months | Year | (Annualized) |
| Bonds | | | |
| Barclays Capital U.S. Aggregate Bond Index (Broad | | | |
| taxable market) | 2.08% | 8.42% | 5.33% |
| Barclays Capital Municipal Bond Index | 3.60 | 8.52 | 4.52 |
| Citigroup Three-Month U.S. Treasury Bill Index | 0.05 | 0.12 | 2.67 |
| |
| Stocks | | | |
| Russell 1000 Index (Large-caps) | 1.53% | 22.33% | 0.67% |
| Russell 2000 Index (Small-caps) | 14.84 | 33.62 | 2.77 |
| Dow Jones U.S. Total Stock Market Index | 2.78 | 23.49 | 1.25 |
| MSCI All Country World Index ex USA (International) | -7.74 | 11.08 | 4.49 |
| |
| CPI | | | |
| Consumer Price Index | 0.85% | 2.02% | 2.33% |
3
Toward the end of the period, however, investors—rattled by Europe’s sovereign debt crisis—retreated into U.S. Treasuries. For the full six months, the broad taxable market returned a little more than 2%; municipal securities returned more than 3%.
Amid global stock market turmoil, small-caps were a bright spot
Swift reversals were a theme in the stock market, too. Stock prices rallied at the start of the period, pulled back in January, then surged higher on rapid growth in corporate earnings and pervasive optimism about the strength of the economic recovery. In May, however, as the scope of Europe’s fiscal challenges seemed to expand, stock prices retreated sharply. For the full six months, U.S. stocks returned about 3%. Small-caps, which are less exposed to global turmoil than large-cap multinationals, performed much better than larger stocks.
International stocks posted a weak six-month return. For U.S.-based investors, a strengthening U.S. dollar reduced the value of assets denominated in other currencies.
Firm demand for longer-term munis, less interest in money markets
A variety of market forces worked to the benefit of the municipal bond market during the last six months.
Not surprisingly—given their near-zero return—tax-exempt money market funds continued to experience net cash out-
| | | |
| Expense Ratios | | | |
| Your Fund Compared With Its Peer Group | | | |
| | Investor | Admiral | Peer Group |
| | Shares | Shares | Average |
| California Tax-Exempt Money Market | | | |
| Fund | 0.17% | — | 0.52% |
| California Intermediate-Term | | | |
| Tax-Exempt Fund | 0.20 | 0.12% | 0.87 |
| California Long-Term Tax-Exempt | | | |
| Fund | 0.20 | 0.12 | 1.06 |
The fund expense ratios shown are from the prospectus dated April 22, 2010, and represent estimated costs for the current fiscal year based on the funds’ net assets as of the prospectus date. For the six months ended May 31, 2010, the funds’ annualized expense ratios were: for the California Tax-Exempt Money Market Fund, 0.17%; for the California Intermediate-Term Tax-Exempt Fund, 0.20% for Investor Shares and 0.12% for Admiral Shares; and for the California Long-Term Tax-Exempt Fund, 0.20% for Investor Shares and 0.12% for Admiral Shares. Peer-group expense ratios are derived from data provided by Lipper Inc. and capture information through year-end 2009.
Peer groups: For the California Tax-Exempt Money Market Fund, California Tax-Exempt Money Market Funds; for the California Intermediate-Term Tax-Exempt Fund, California Intermediate Municipal Debt Funds; for the California Long-Term Tax-Exempt Fund, California Municipal Debt Funds.
4
flows. Some of that cash has been reinvested in longer-term funds, helping to support prices.
The unfolding debt crisis in Greece and other European nations also spurred demand as investors became risk-averse, turning to ultrasafe Treasury securities as well as munis. Notwithstanding the fiscal stress faced by state and local governments, munis are still perceived as relatively safe havens, given their historically low default rates and the ability of many issuers to increase taxes to close funding gaps; this, of course, is one of the steps that California has taken.
Another key driver of tax-exempt bond performance has been the remarkable success of taxable Build America Bonds. Created as part of the massive federal stimulus package in early 2009, these bonds provide a federal subsidy to help reduce state and local governments’ borrowing costs. California has been the largest issuer of Build America Bonds, selling $22 billion of them during the 12 months ended April 30, double the amount sold by the second-largest issuer, New York State.
The issuance of more than $100 billion taxable Build America Bonds nationwide in just over a year has crowded out new tax-exempt issues, causing investors—especially those seeking longer-maturity bonds—to bid up tax-exempt prices (thereby lowering yields). The supply shrinkage has been notable: In the first five months of calendar-year 2010, only about two-thirds of muni issuance was tax-exempt, compared with an average of well above 90% for the January–May period in the last five years.
The Vanguard California bond funds’ results reflected these countrywide dynamics as well as individual security selection. The funds’ returns were about three-quarters of a percentage point above the returns of their respective benchmarks. Both funds’ returns were near the average returns of their peer groups: The Intermediate-Term Fund outpaced its peers while the Long-Term Fund lagged. Your funds’ orientation toward higher credit quality served as a headwind during the period, as lower-quality bonds generally outperformed.
Municipal defaults remain rare, despite financial struggles
The health of state and municipal finances often lags that of the national economy, and this appears to be the case in the current economic cycle—the fiscal conditions of state and local governments are likely to remain fragile for at least another year or longer.
In common with most states, California confronts some of the toughest challenges since the Great Depression as it strives to balance its budget during a slow-paced economic recovery that has driven the state unemployment rate above 12%.
Despite such dilemmas in California and other states, municipal default rates across the United States have remained considerably lower than those of corporate debt.
5
For more information on the funds’ positioning and performance during the past six months, please see the Advisor’s Report following this letter.
Tune out the noise, and focus on the long term
It’s hard to pick up a newspaper or go online without reading about state and local furloughs, teacher layoffs, and stopgap funding measures—not to mention concerns that weak European economies may stunt global economic growth. Even though many of these developments hit close to home, and may tempt you to respond, don’t let them distract you. Instead, focus on maintaining a portfolio that is appropriately balanced among asset classes and is consistent with your investment goals.
Also, within asset classes, don’t lose sight of the need to diversify your bond holdings, not just your stocks. Recent Vanguard research underscores the benefits of a broadly diversified bond portfolio—regardless of the possible direction of interest rates.
|
| Investment insight |
| |
| A word about credit ratings |
| You may have noticed recently that some municipal securities appear to have been |
| upgraded, even while state and local authorities struggle to balance their budgets and |
| meet their obligations. |
| |
| This apparent improvement resulted from a nationwide “recalibration” of municipal |
| bond ratings by two major credit-rating agencies, which have stressed that the |
| changes are not upgrades. Both agencies now rate municipal debt by the same |
| standards they use to rate corporate debt, a change intended to make ratings more |
| comparable across categories of taxable and tax-exempt bonds. For many municipal |
| issuers—including California—the result has been a new rating unrelated to any |
| change in the issuer’s financial conditions. The new ratings are reflected in the Fund |
| Profile statistics in this semiannual report. |
| |
| Another consequence of the agencies’ new approach is that their ratings of municipal |
| borrowers are now clustered in a narrower range, making it more difficult for individual |
| investors to discriminate among them. This puts a premium on the type of thorough |
| and independent analysis that Vanguard’s highly experienced team of credit analysts |
| conducts as a matter of course. As they continually monitor all the securities in our |
| funds, and evaluate prospective purchases, our analysts even meet face-to-face with |
| issuers’ representatives to get a solid understanding of creditworthiness. The analysts’ |
| independent judgment provides an exceptionally solid grounding for the high credit |
| quality of our funds. |
6
For higher-tax-bracket investors in the state, Vanguard California Tax-Exempt Bond Funds can help provide diversification with the added advantages of exemption from state income taxes, as well as low costs and the seasoned judgment of Vanguard’s team of portfolio managers and credit analysts.
Thank you for entrusting your assets to Vanguard.
Sincerely,

F. William McNabb III
Chairman and Chief Executive Officer
June 11, 2010
7
| | | | |
| Your Fund’s Performance at a Glance | | | | |
| November 30, 2009 , Through May 31, 2010 | | | | |
| | | | Distributions Per Share |
| | Starting | Ending | Income | Capital |
| | Share Price | Share Price | Dividends | Gains |
| Vanguard California Tax-Exempt Money Market | | | | |
| Fund | $1.00 | $1.00 | $0.001 | $0.000 |
| Vanguard California Intermediate-Term | | | | |
| Tax-Exempt Fund | | | | |
| Investor Shares | $10.86 | $11.02 | $0.206 | $0.000 |
| Admiral Shares | 10.86 | 11.02 | 0.210 | 0.000 |
| Vanguard California Long-Term Tax-Exempt | | | | |
| Fund | | | | |
| Investor Shares | $10.98 | $11.20 | $0.239 | $0.000 |
| Admiral Shares | 10.98 | 11.20 | 0.243 | 0.000 |
8
Advisor’s Report
For the six months ended May 31, 2010, Vanguard California Tax-Exempt Money Market Fund returned 0.05%. This near-zero return was nonetheless greater than the average return of peer-group state funds. The California Intermediate-Term Tax-Exempt Fund returned 3.40% for Investor Shares and 3.44% for Admiral Shares, outpacing both the fund’s national benchmark index and the average return of its peers. The California Long-Term Tax-Exempt Fund, with returns of 4.22% for Investor Shares and 4.26% for Admiral Shares, exceeded its national benchmark but trailed the average return of competing funds.
The investment environment
As shown in the table, at the end of May municipal bond yields were about where they started the new fiscal year for short- and intermediate-term bonds, but lower for longer-term bonds. Overall, yields were close to a four-decade low.
In addition, the spread in yields between lowest-risk and higher-risk municipal bonds continued to narrow from the extremely wide spans that characterized the muni bond market during the worst of the financial crisis in late 2008 and early 2009. The narrowing was only slightly interrupted by investors’ reaction late in the period to the debt crisis in Europe, which started with uncertainty about whether Greece would be able to meet its obligations.
One response to the ratcheted-up uncertainty about the global economic recovery has been a flight to quality. That fueled demand for U.S. Treasury securities, a traditional safe haven. This
| | |
| Yields of Tax-Exempt Municipal Bonds | | |
| (AAA-Rated General-Obligation Issues) | | |
| | November 30, | May 31, |
| Maturity | 2009 | 2010 |
| 2 years | 0.61% | 0.58% |
| 5 years | 1.50 | 1.59 |
| 10 years | 2.78 | 2.80 |
| 30 years | 4.28 | 4.00 |
| Source: Vanguard. | | |
9
dynamic made tax-exempt municipal bonds more attractive, despite the financial stresses imposed on most states and municipalities by the severe recession. Higher demand raises bond prices but reduces yields, because prices and yields move inversely to each other. As the European debt crisis began to dominate financial headlines in April and May, Treasury and tax-exempt bond yields fell.
Other factors leading to lower yields were set in motion from opposite ends of the maturity spectrum. With short-term interest rates held close to zero by the Federal Reserve, money market mutual funds such as the California Tax-Exempt Money Market Fund could offer investors virtually no yield. Many investors moved on to municipal bonds and bond funds in the 1- to 10-year maturity range, such as the California Intermediate-Term Tax-Exempt Bond Fund.
At the longer end of the spectrum, demand for tax-exempt bonds was steady; however, the supply of new tax-exempt issues declined, a result of the growing issuance by state and local governments of taxable Build America Bonds. These “BABs” were created by the American Recovery and Reinvestment Act of 2009, the federal government’s huge economic stimulus package. Through an attractive subsidy, BABs allow states and municipalities to lower their financing costs for a variety of projects, including improvements to highways, schools, and water and sewer systems. Because long-term bonds pay the most interest, the subsidy encourages the issuance of long-term BABs, which in turn reduces the pool of securities available to funds like the California Long-Term Tax-Exempt Fund.
For perspective, before the introduction of BABs, just about all state and municipal bond issuance nationwide consisted of tax-exempt issues. In recent years, total municipal new-issue volume has been running at about $400 billion annually, and BABs have been capturing an increasing share of that supply: More than $100 billion of BABs were issued from April 2009 through May 2010. During the six months ended May 31, California issuers raised about $8 billion through BABs and $20 billion through traditional munis, compared with combined issuance of $32 billion in the first half of fiscal-year 2009. The Vanguard California Tax-Exempt Funds generally do not invest in securities, such as BABs, that generate taxable income.
The end result of these market forces is a yield curve that is anchored at zero at the shortest end, extraordinarily steep in the 1- to 10-year range, and flat at the longest end. In fact, during the past six months the yields of traditional AAA-rated 30-year munis dipped below 4% for a time, a rare event.
Management of the funds
The investment world is now waiting for the Federal Reserve’s next move on interest rates. We believe that the Fed will begin to raise rates when there is consistent month-to-month growth in employment, which is necessary to sustain a recovery from the worst recession since the Great Depression.
10
Our best estimate suggests that the Fed will begin tightening in 2011, although the European debt crisis may now have become a factor influencing the timing of that decision. We have set the durations, or interest rate sensitivity, of our funds accordingly. In other words, our funds are positioned for continued economic recovery, and we are poised to react appropriately when the Fed is ready to take its next steps.
Outlook
As the broad economy continues to bounce back, the condition of stressed-out state and municipal finances is also likely to improve, though slowly and unevenly. We’re sure that you’ll be hearing and reading about the many difficult decisions that California and other states and localities will be making about spending and allocation of resources, especially given the rough-and-tumble political process. Moreover, it may be that federal help will diminish as the U.S. government focuses on its own critical fiscal challenges.
The current state of municipal finances has naturally raised concern among investors about default risk. As a practical matter, there’s a major incentive for a muni-bond issuer not to default: It would mean being shut out of the capital markets for years to come. In fact, municipal defaults have been rare: According to data submitted to Congress about the default experience of bonds rated by Moody’s Investors Service, the ten-year cumulative default rate for muni bonds from 1970 to 2009 was a fraction of 1%, compared with corporate default rates of about 11%. In recent years, muni defaults have often involved nonrated, high-risk projects, such as real estate developments, which we don’t consider suitable for our funds.
Most important, at the heart of the management of our funds is an intimate knowledge of the fiscal conditions of the state and local governments that issue bonds. Such understanding is crucial in evaluating potential purchases and in monitoring bonds already in the portfolio. Our knowledge base—difficult for individual investors to develop on their own, given the complexities of the muni bond market—is constantly refreshed by a team of credit analysts, including sector specialists, who collectively have many decades of experience and work together with portfolio managers and traders to keep on top of municipal conditions. In sum, our credit analyst team is one of the strongest in the business.
We are confident that our analytical insight, our long-term focus, and the portfolios’ low costs will help us deliver competitive returns through both challenging and more normal markets.
Kathryn T. Allen, Principal,
Portfolio Manager
John M. Carbone, Principal,
Portfolio Manager
Christopher W. Alwine, CFA, Principal,
Head of Municipal Money Market and Bond Groups
Vanguard Fixed Income Group
June 15, 2010
11
California Tax-Exempt Money Market Fund
Fund Profile
As of May 31, 2010
| |
| Financial Attributes | |
| Ticker Symbol | VCTXX |
| Expense Ratio1 | 0.17% |
| 7-Day SEC Yield | 0.14% |
| Average Quality | MIG-1 |
| Average Weighted | |
| Maturity | 18 days |
Average quality: Moody’s Investors Service.
| |
| Distribution by Credit Quality (% of portfolio) |
| MIG-1/SP-1+ | 82.9% |
| A-1/P-1 | 17.1 |
Ratings: Moody’s Investors Service, Standard & Poor’s.
1 The expense ratio shown is from the prospectus dated April 22, 2010, and represents estimated costs for the current fiscal year based on the fund’s net assets as of the prospectus date. For the six months ended May 31, 2010, the annualized expense ratio was 0.17%.
12
California Tax-Exempt Money Market Fund
Performance Summary
Investment returns will fluctuate. All of the returns in this report represent past performance, which is not a guarantee of future results that may be achieved by the fund. (Current performance may be lower or higher than the performance data cited. For performance data current to the most recent month-end, visit our website at www.vanguard.com/performance.) The returns shown do not reflect taxes that a shareholder would pay on fund distributions. An investment in a money market fund is not insured or guaranteed by the Federal Deposit Insurance Corporation or any other government agency. Although the fund seeks to preserve the value of your investment at $1 per share, it is possible to lose money by investing in the fund. The fund’s 7-day SEC yield reflects its current earnings more closely than do the average annual returns.
| | |
| Fiscal-Year Total Returns (%): November 30, 1999, Through May 31, 2010 | |
| | | CA Tax-Exempt |
| | | Money Mkt |
| | | Funds Avg |
| Fiscal Year | Total Returns | Total Returns |
| 2000 | 3.44% | 3.06% |
| 2001 | 2.57 | 2.17 |
| 2002 | 1.33 | 0.92 |
| 2003 | 0.91 | 0.54 |
| 2004 | 1.05 | 0.60 |
| 2005 | 2.17 | 1.70 |
| 2006 | 3.24 | 2.78 |
| 2007 | 3.55 | 3.06 |
| 2008 | 2.21 | 1.81 |
| 2009 | 0.37 | 0.17 |
| 2010 | 0.05 | 0.01 |
7-day SEC yield (5/31/2010): 0.14%
California Tax-Exempt Money Market Funds Average: Derived from data provided by Lipper Inc.
Note: For 2010, performance data reflect the six months ended May 31, 2010.
Average Annual Total Returns: Periods Ended March 31, 2010
This table presents average annual total returns through the latest calendar quarter—rather than through the end of the fiscal period. Securities and Exchange Commission rules require that we provide this information.
| | | | |
| | Inception | One | Five | Ten |
| | Date | Year | Years | Years |
| California Tax-Exempt Money | | | | |
| Market Fund | 6/1/1987 | 0.21% | 2.19% | 1.98% |
See Financial Highlights for dividend information.
13
California Tax-Exempt Money Market Fund
Financial Statements (unaudited)
Statement of Net Assets
As of May 31, 2010
The fund reports a complete list of its holdings in regulatory filings four times in each fiscal year, at the quarter-ends. For the second and fourth fiscal quarters, the lists appear in the fund’s semiannual and annual reports to shareholders. For the first and third fiscal quarters, the fund files the lists with the Securities and Exchange Commission on Form N-Q. Shareholders can look up the fund’s Forms N-Q on the SEC’s website at www.sec.gov. Forms N-Q may also be reviewed and copied at the SEC’s Public Reference Room (see the back cover of this report for further information). In addition, the fund publishes its holdings on a monthly basis at www.vanguard.com.
| | | | |
| | | | Face | Market |
| | | Maturity | Amount | Value• |
| | Coupon | Date | ($000) | ($000) |
| Tax-Exempt Municipal Bonds (100.1%) | | | | |
| California (100.1%) | | | | |
| ABAG Finance Auth. for Non-Profit Corp. California | | | | |
| Rev. (Computer History Museum) VRDO | 0.270% | 6/7/10 LOC | 7,000 | 7,000 |
| ABAG Finance Auth. for Non-Profit Corp. California | | | | |
| Rev. (Institute for Defense Analyses) VRDO | 0.250% | 6/7/10 LOC | 11,945 | 11,945 |
| Bay Area Toll Auth. CA Toll Bridge Rev. | | | | |
| (San Francisco Bay Area) VRDO | 0.150% | 6/7/10 | 15,000 | 15,000 |
| Bay Area Toll Auth. CA Toll Bridge Rev. | | | | |
| (San Francisco Bay Area) VRDO | 0.200% | 6/7/10 | 12,500 | 12,500 |
| Bay Area Toll Auth. CA Toll Bridge Rev. | | | | |
| (San Francisco Bay Area) VRDO | 0.250% | 6/7/10 | 99,000 | 99,000 |
| 1 Bay Area Toll Auth. CA Toll Bridge Rev. TOB PUT | 0.450% | 11/4/10 | 9,865 | 9,865 |
| 1 Bay Area Toll Auth. CA Toll Bridge Rev. TOB VRDO | 0.290% | 6/7/10 | 41,910 | 41,910 |
| 1 Bay Area Toll Auth. CA Toll Bridge Rev. TOB VRDO | 0.310% | 6/7/10 | 7,500 | 7,500 |
| Bay Area Toll Auth. CA Toll Bridge Rev. VRDO | 0.250% | 6/7/10 | 18,250 | 18,250 |
| Berkeley CA Rev. (Berkeley-Albany YMCA) VRDO | 0.220% | 6/7/10 LOC | 13,065 | 13,065 |
| California Communities NT Program NT | | | | |
| Participation TRAN | 2.000% | 6/30/10 | 17,500 | 17,522 |
| 1 California Dept. of Veteran Affairs Rev. TOB VRDO | 0.290% | 6/7/10 | 11,140 | 11,140 |
| California Educ. Fac. Auth. Rev. | | | | |
| (California Institute of Technology) VRDO | 0.230% | 6/7/10 | 67,300 | 67,300 |
| 1 California Educ. Fac. Auth. Rev. | | | | |
| (Loyola Marymount Univ.) TOB VRDO | 0.290% | 6/7/10 LOC | 3,998 | 3,998 |
| California Educ. Fac. Auth. Rev. (Stanford Univ.) CP | 0.400% | 7/7/10 | 40,000 | 40,000 |
| California Educ. Fac. Auth. Rev. (Stanford Univ.) CP | 0.400% | 7/14/10 | 33,000 | 33,000 |
| California Educ. Fac. Auth. Rev. (Stanford Univ.) CP | 0.400% | 7/21/10 | 40,000 | 40,000 |
| 1 California Educ. Fac. Auth. Rev. (Stanford Univ.) | | | | |
| TOB VRDO | 0.290% | 6/7/10 | 4,470 | 4,470 |
| California Educ. Fac. Auth. Rev. | | | | |
| (Stanford Univ.) VRDO | 0.140% | 6/7/10 | 5,468 | 5,468 |
| 1 California Educ. Fac. Auth. Rev. | | | | |
| (Stanford Univ.) VRDO | 0.140% | 6/7/10 | 4,580 | 4,580 |
| 1 California Educ. Fac. Auth. Rev. | | | | |
| (Stanford Univ.) VRDO | 0.140% | 6/7/10 | 7,565 | 7,565 |
| 1 California Educ. Fac. Auth. Rev. | | | | |
| (Univ. of Southern California) TOB VRDO | 0.290% | 6/7/10 | 4,860 | 4,860 |
| 1 California Educ. Fac. Auth. Rev. | | | | |
| (Univ. of Southern California) TOB VRDO | 0.290% | 6/7/10 | 5,345 | 5,345 |
| 1 California Educ. Fac. Auth. Rev. TOB VRDO | 0.290% | 6/7/10 | 6,450 | 6,450 |
14
California Tax-Exempt Money Market Fund
| | | | |
| | | | Face | Market |
| | | Maturity | Amount | Value• |
| | Coupon | Date | ($000) | ($000) |
| California GO | 5.250% | 9/1/10 (Prere.) | 5,945 | 6,017 |
| California GO | 5.250% | 10/1/10 (Prere.) | 7,650 | 7,777 |
| 1 California GO TOB VRDO | 0.290% | 6/7/10 | 23,098 | 23,098 |
| California GO VRDO | 0.230% | 6/7/10 LOC | 20,000 | 20,000 |
| California Health Fac. Finance Auth. Rev. | | | | |
| (Adventist Health System) VRDO | 0.230% | 6/1/10 LOC | 8,260 | 8,260 |
| California Health Fac. Finance Auth. Rev. | | | | |
| (Children’s Hosp.) VRDO | 0.170% | 6/7/10 LOC | 42,900 | 42,900 |
| California Health Fac. Finance Auth. Rev. | | | | |
| (Children’s Hosp.) VRDO | 0.170% | 6/7/10 LOC | 7,100 | 7,100 |
| California Health Fac. Finance Auth. Rev. | | | | |
| (Children’s Hosp.) VRDO | 0.170% | 6/7/10 LOC | 3,950 | 3,950 |
| California Health Fac. Finance Auth. Rev. | | | | |
| (Lucile Salter Packard Hosp.) VRDO | 0.180% | 6/7/10 | 5,850 | 5,850 |
| California Health Fac. Finance Auth. Rev. | | | | |
| (Lucile Salter Packard Hosp.) VRDO | 0.180% | 6/7/10 | 10,250 | 10,250 |
| California Health Fac. Finance Auth. Rev. | | | | |
| (Lucile Salter Packard Hosp.) VRDO | 0.240% | 6/7/10 | 18,450 | 18,450 |
| California Health Fac. Finance Auth. Rev. | | | | |
| (Memorial Health Services) VRDO | 0.180% | 6/7/10 | 69,475 | 69,475 |
| California Health Fac. Finance Auth. Rev. | | | | |
| (Scripps Health) VRDO | 0.230% | 6/7/10 LOC | 14,265 | 14,265 |
| California Health Fac. Finance Auth. Rev. | | | | |
| (Stanford Hosp.) PUT | 0.550% | 6/16/10 | 17,000 | 17,000 |
| 1 California Health Fac. Finance Auth. Rev. | | | | |
| (Sutter Health) TOB VRDO | 0.290% | 6/7/10 | 6,700 | 6,700 |
| 1 California Health Fac. Finance Auth. Rev. | | | | |
| TOB VRDO | 0.290% | 6/7/10 | 14,995 | 14,995 |
| 1 California Health Fac. Finance Auth. Rev. | | | | |
| TOB VRDO | 0.290% | 6/7/10 | 10,000 | 10,000 |
| California Housing Finance Agency | | | | |
| Home Mortgage Rev. VRDO | 0.270% | 6/7/10 LOC | 20,000 | 20,000 |
| California Housing Finance Agency | | | | |
| Home Mortgage Rev. VRDO | 0.280% | 6/7/10 LOC | 20,000 | 20,000 |
| California Housing Finance Agency | | | | |
| Home Mortgage Rev. VRDO | 0.290% | 6/7/10 LOC | 9,285 | 9,285 |
| California Housing Finance Agency | | | | |
| Home Mortgage Rev. VRDO | 0.290% | 6/7/10 LOC | 33,545 | 33,545 |
| California Housing Finance Agency | | | | |
| Home Mortgage Rev. VRDO | 0.290% | 6/7/10 LOC | 55,300 | 55,300 |
| California Housing Finance Agency | | | | |
| Home Mortgage Rev. VRDO | 0.310% | 6/7/10 LOC | 14,600 | 14,600 |
| California Housing Finance Agency | | | | |
| Home Mortgage Rev. VRDO | 0.310% | 6/7/10 LOC | 15,800 | 15,800 |
| California Housing Finance Agency | | | | |
| Home Mortgage Rev. VRDO | 0.310% | 6/7/10 LOC | 25,000 | 25,000 |
| California Housing Finance Agency | | | | |
| Single Family Mortgage Rev. VRDO | 0.310% | 6/7/10 LOC | 12,975 | 12,975 |
| California Infrastructure & Econ. Dev. Bank Rev. | | | | |
| (Academy Motion Picture) VRDO | 0.260% | 6/7/10 LOC | 22,400 | 22,400 |
| California Infrastructure & Econ. Dev. Bank Rev. | | | | |
| (American National Red Cross) VRDO | 0.230% | 6/7/10 LOC | 14,575 | 14,575 |
| California Infrastructure & Econ. Dev. Bank Rev. | | | | |
| (Buck Institute) VRDO | 0.170% | 6/7/10 LOC | 34,430 | 34,430 |
| California Infrastructure & Econ. Dev. Bank Rev. | | | | |
| (California Academy of Sciences) VRDO | 0.250% | 6/1/10 LOC | 5,000 | 5,000 |
15
California Tax-Exempt Money Market Fund
| | | | |
| | | | Face | Market |
| | | Maturity | Amount | Value• |
| | Coupon | Date | ($000) | ($000) |
| California Infrastructure & Econ. Dev. Bank Rev. | | | | |
| (California Academy of Sciences) VRDO | 0.250% | 6/1/10 LOC | 14,125 | 14,125 |
| California Infrastructure & Econ. Dev. Bank Rev. | | | | |
| (California IDB SRI Intl.) VRDO | 0.260% | 6/7/10 LOC | 4,585 | 4,585 |
| California Infrastructure & Econ. Dev. Bank Rev. | | | | |
| (J. Paul Getty Trust) VRDO | 0.200% | 6/1/10 | 5,700 | 5,700 |
| California Infrastructure & Econ. Dev. Bank Rev. | | | | |
| (J. Paul Getty Trust) VRDO | 0.200% | 6/1/10 | 18,500 | 18,500 |
| California Infrastructure & Econ. Dev. Bank Rev. | | | | |
| (J. Paul Getty Trust) VRDO | 0.200% | 6/1/10 | 11,225 | 11,225 |
| California Infrastructure & Econ. Dev. Bank Rev. | | | | |
| (JSerra Catholic High School Project) VRDO | 0.220% | 6/7/10 LOC | 3,100 | 3,100 |
| California Infrastructure & Econ. Dev. Bank Rev. | | | | |
| (Pacific Gas & Electric) VRDO | 0.230% | 6/1/10 LOC | 3,100 | 3,100 |
| California Infrastructure & Econ. Dev. Bank Rev. | | | | |
| (Pacific Gas & Electric) VRDO | 0.240% | 6/1/10 LOC | 10,790 | 10,790 |
| California Infrastructure & Econ. Dev. Bank Rev. | | | | |
| (Prinsco Inc. Project) VRDO | 0.350% | 6/7/10 LOC | 8,100 | 8,100 |
| California Infrastructure & Econ. Dev. Bank Rev. | | | | |
| (SRI International) VRDO | 0.260% | 6/7/10 LOC | 5,000 | 5,000 |
| California Muni. Financing Auth. Rev. | | | | |
| (Notre Dame High School) VRDO | 0.340% | 6/7/10 LOC | 6,090 | 6,090 |
| California PCR Financing Auth. | | | | |
| (Atlantic Richfield) CP | 0.330% | 6/11/10 | 24,000 | 24,000 |
| 1 California Public Works Board Lease | | | | |
| Rev. TOB VRDO | 0.290% | 6/7/10 | 11,110 | 11,110 |
| California School Cash Reserve | | | | |
| Program Auth. Pool TRAN | 2.500% | 7/1/10 LOC | 12,000 | 12,019 |
| California State Dept. of Water Resources | | | | |
| Power Supply Rev. VRDO | 0.230% | 6/7/10 LOC | 6,800 | 6,800 |
| California State Dept. of Water Resources | | | | |
| Power Supply Rev. VRDO | 0.250% | 6/7/10 LOC | 5,640 | 5,640 |
| California State Dept. of Water Resources | | | | |
| Power Supply Rev. VRDO | 0.260% | 6/7/10 LOC | 39,400 | 39,400 |
| California State Dept. of Water Resources | | | | |
| Power Supply Rev. VRDO | 0.270% | 6/7/10 (4) | 9,950 | 9,950 |
| California State Dept. of Water Resources | | | | |
| Power Supply Rev. VRDO | 0.350% | 6/7/10 (4) | 32,200 | 32,200 |
| California State Econ. Recovery Bonds | 5.000% | 3/1/11 (Prere.) | 37,220 | 38,547 |
| California State Econ. Recovery Bonds PUT | 5.000% | 7/1/10 (Prere.) | 55,000 | 55,208 |
| 1 California State Univ. Rev. TOB VRDO | 0.310% | 6/7/10 (4) | 20,475 | 20,475 |
| California Statewide Communities Dev. Auth. | | | | |
| Multifamily Housing Rev. | | | | |
| (Ridgeway Apartments) VRDO | 0.240% | 6/7/10 LOC | 7,200 | 7,200 |
| California Statewide Communities Dev. Auth. | | | | |
| Multifamily Rev. (Canyon Springs) VRDO | 0.300% | 6/7/10 LOC | 10,105 | 10,105 |
| California Statewide Communities Dev. Auth. | | | | |
| Multifamily Rev. (Knoll Apartments) VRDO | 0.280% | 6/7/10 LOC | 12,715 | 12,715 |
| California Statewide Communities Dev. Auth. | | | | |
| Multifamily Rev. (Valley Palms Apartments) VRDO | 0.260% | 6/7/10 LOC | 13,500 | 13,500 |
| California Statewide Communities Dev. Auth. | | | | |
| Multifamily Rev. (Village Green Apartments) VRDO | 0.290% | 6/7/10 | 5,800 | 5,800 |
| California Statewide Communities Dev. Auth. | | | | |
| Rev. (Cottage Health Systems) VRDO | 0.170% | 6/7/10 LOC | 37,420 | 37,420 |
| California Statewide Communities Dev. Auth. Rev. | | | | |
| (Cottage Health Systems) VRDO | 0.170% | 6/7/10 LOC | 19,300 | 19,300 |
16
| | | | |
| California Tax-Exempt Money Market Fund | | | | |
| |
| |
| |
| | | | Face | Market |
| | | Maturity | Amount | Value• |
| | Coupon | Date | ($000) | ($000) |
| California Statewide Communities Dev. Auth. | | | | |
| Rev. (Fiorella Investments LLC) VRDO | 1.000% | 6/7/10 LOC | 8,825 | 8,825 |
| California Statewide Communities Dev. Auth. | | | | |
| Rev. (Kaiser Permanente) CP | 0.340% | 7/19/10 | 15,000 | 15,000 |
| California Statewide Communities Dev. Auth. | | | | |
| Rev. (Kaiser Permanente) VRDO | 0.260% | 6/7/10 | 41,800 | 41,800 |
| California Statewide Communities Dev. Auth. | | | | |
| Rev. (Kaiser Permanente) VRDO | 0.270% | 6/7/10 | 21,300 | 21,300 |
| California Statewide Communities Dev. Auth. | | | | |
| Rev. (Los Angeles County Museum) VRDO | 0.240% | 6/7/10 LOC | 20,000 | 20,000 |
| California Statewide Communities Dev. Auth. | | | | |
| Rev. (Motion Picture and Television Fund) VRDO | 0.270% | 6/7/10 LOC | 9,500 | 9,500 |
| California Statewide Communities Dev. Auth. | | | | |
| Rev. (Redlands Community Hosp.) VRDO | 0.290% | 6/7/10 LOC | 14,000 | 14,000 |
| 1 California Statewide Communities Dev. Auth. | | | | |
| Rev. (Sutter Health) TOB VRDO | 0.290% | 6/7/10 | 46,065 | 46,065 |
| California Statewide Communities Dev. Auth. | | | | |
| Rev. (Univ. of San Diego) VRDO | 0.280% | 6/7/10 LOC | 18,415 | 18,415 |
| Castaic Lake CA Water Agency Rev. COP VRDO | 0.230% | 6/7/10 LOC | 20,160 | 20,160 |
| 1 Central Basin Muni. Water Dist. CA COP | | | | |
| TOB VRDO | 0.310% | 6/7/10 (4) | 7,500 | 7,500 |
| 1 Cerritos CA Community College Dist. GO | | | | |
| TOB VRDO | 0.290% | 6/7/10 | 7,845 | 7,845 |
| 1 Chino Basin CA Regional Financing Auth. Rev. | | | | |
| (Inland Empire Util. Agency Sewer) TOB VRDO | 0.310% | 6/7/10 | 10,815 | 10,815 |
| Chula Vista CA Multi-Family Housing Rev. VRDO | 0.290% | 6/7/10 LOC | 18,970 | 18,970 |
| 1 Contra Costa CA Community College Dist. | | | | |
| TOB VRDO | 0.290% | 6/7/10 (4) | 5,110 | 5,110 |
| Contra Costa CA Housing Finance Agency | | | | |
| Home Mortgage Rev. (Park Regency) VRDO | 0.290% | 6/7/10 LOC | 42,200 | 42,200 |
| 1 Contra Costa CA Water Dist. Rev. TOB VRDO | 0.320% | 6/7/10 | 5,200 | 5,200 |
| Contra Costa County CA MFH Pleasant Hill VRDO | 0.290% | 6/7/10 LOC | 58,800 | 58,800 |
| 1 Desert CA Community College Dist. TOB VRDO | 0.290% | 6/7/10 (4) | 12,375 | 12,375 |
| East Bay CA Muni. Util. Dist. | | | | |
| Water System Rev. PUT | 0.290% | 12/1/10 | 24,750 | 24,750 |
| 1 Eastern California Muni. Water. Dist. | | | | |
| Water & Sewer COP TOB VRDO | 0.290% | 6/7/10 | 1,590 | 1,590 |
| 1 Eastern California Muni. Water. Dist. | | | | |
| Water & Sewer Rev. TOB VRDO | 0.310% | 6/7/10 | 3,940 | 3,940 |
| Eastern California Muni. Water. Dist. | | | | |
| Water & Sewer Rev. VRDO | 0.230% | 6/7/10 | 33,000 | 33,000 |
| Eastern California Muni. Water. Dist. | | | | |
| Water & Sewer Rev. VRDO | 0.240% | 6/7/10 | 27,400 | 27,400 |
| Eastern California Muni. Water. Dist. | | | | |
| Water & Sewer Rev. VRDO | 0.260% | 6/7/10 | 7,520 | 7,520 |
| 1 Eastern California Muni. Water. Dist. | | | | |
| Water & Sewer Rev. VRDO | 0.260% | 6/7/10 | 20,000 | 20,000 |
| Escondido CA Community Dev. COP | | | | |
| (Escondido Community Dev.) VRDO | 0.350% | 6/7/10 LOC | 9,400 | 9,400 |
| Fresno County CA TRAN | 2.000% | 6/30/10 | 50,000 | 50,062 |
| Garden Grove CA Housing Auth. | | | | |
| Multifamily Rev. VRDO | 0.300% | 6/7/10 LOC | 9,100 | 9,100 |
| Golden State Tobacco Securitization Corp. California | 5.600% | 6/1/10 (Prere.) | 2,260 | 2,260 |
| Hayward CA Housing Auth. Rev. | | | | |
| (Barrington Hills) VRDO | 0.260% | 6/7/10 LOC | 6,150 | 6,150 |
17
| | | | |
| California Tax-Exempt Money Market Fund | | | | |
| |
| |
| |
| | | | Face | Market |
| | | Maturity | Amount | Value• |
| | Coupon | Date | ($000) | ($000) |
| Irvine CA Assessment Dist. | | | | |
| Improvement Bonds VRDO | 0.250% | 6/1/10 LOC | 31,970 | 31,970 |
| 1 Irvine California USD Special Tax TOB VRDO | 0.390% | 6/7/10 LOC | 22,695 | 22,695 |
| Kern County CA TRAN | 2.500% | 6/30/10 | 35,000 | 35,052 |
| Livermore CA Redev. Agency | | | | |
| Multi-Family Housing Rev. VRDO | 0.240% | 6/7/10 LOC | 6,640 | 6,640 |
| 1 Long Beach CA Harbor Rev. TOB VRDO | 0.460% | 6/7/10 | 16,005 | 16,005 |
| Long Beach CA Water Rev. CP | 0.340% | 8/4/10 | 11,000 | 11,000 |
| Los Angeles CA Community Redev. Agency | | | | |
| Multifamily Housing Rev. | | | | |
| (Hollywood & Vine Apartments) VRDO | 0.260% | 6/7/10 LOC | 25,000 | 25,000 |
| 1 Los Angeles CA Dept. of Airports | | | | |
| International Airport Rev. TOB VRDO | 0.260% | 6/7/10 | 14,000 | 14,000 |
| 1 Los Angeles CA Dept. of Airports | | | | |
| International Airport Rev. TOB VRDO | 0.310% | 6/7/10 | 5,530 | 5,530 |
| 1 Los Angeles CA Dept. of Airports | | | | |
| International Airport Rev. TOB VRDO | 0.370% | 6/7/10 | 18,880 | 18,880 |
| 1 Los Angeles CA Dept. of Airports | | | | |
| International Airport Rev. TOB VRDO | 0.370% | 6/7/10 | 7,975 | 7,975 |
| 1 Los Angeles CA Dept. of Water & Power | | | | |
| Rev. TOB VRDO | 0.290% | 6/7/10 | 7,495 | 7,495 |
| 1 Los Angeles CA Dept. of Water & Power | | | | |
| Rev. TOB VRDO | 0.290% | 6/7/10 LOC | 8,090 | 8,090 |
| 1 Los Angeles CA Dept. of Water & Power | | | | |
| Rev. TOB VRDO | 0.290% | 6/7/10 | 4,440 | 4,440 |
| 1 Los Angeles CA Dept. of Water & Power | | | | |
| Rev. TOB VRDO | 0.290% | 6/7/10 (4) | 14,245 | 14,245 |
| Los Angeles CA Dept. of Water & Power | | | | |
| Rev. VRDO | 0.240% | 6/1/10 | 12,800 | 12,800 |
| Los Angeles CA Dept. of Water & Power | | | | |
| Rev. VRDO | 0.200% | 6/7/10 | 14,400 | 14,400 |
| Los Angeles CA Dept. of Water & Power | | | | |
| Rev. VRDO | 0.240% | 6/7/10 | 51,300 | 51,300 |
| Los Angeles CA Dept. of Water & Power | | | | |
| Rev. VRDO | 0.240% | 6/7/10 | 86,500 | 86,500 |
| Los Angeles CA Dept. of Water & Power | | | | |
| Rev. VRDO | 0.250% | 6/7/10 | 32,400 | 32,400 |
| Los Angeles CA Dept. of Water & Power | | | | |
| Rev. VRDO | 0.260% | 6/7/10 | 55,015 | 55,015 |
| Los Angeles CA Multifamily Housing Rev. | | | | |
| (Beverly Park) VRDO | 0.270% | 6/7/10 LOC | 15,500 | 15,500 |
| Los Angeles CA Multifamily Housing Rev. | | | | |
| (Fountain Park) VRDO | 0.290% | 6/7/10 LOC | 25,500 | 25,500 |
| Los Angeles CA Multifamily Housing Rev. | | | | |
| (Queen Portfolio) VRDO | 0.310% | 6/7/10 LOC | 7,300 | 7,300 |
| Los Angeles CA Multifamily Housing Rev. | | | | |
| (San Regis) VRDO | 0.310% | 6/7/10 LOC | 23,600 | 23,600 |
| Los Angeles CA Regional Airports | | | | |
| Improvement Corp. Rev. VRDO | 0.250% | 6/1/10 LOC | 45,900 | 45,900 |
| 1 Los Angeles CA TOB VRDO | 0.290% | 6/7/10 | 4,020 | 4,020 |
| Los Angeles CA USD GO | 1.500% | 7/1/10 | 18,970 | 18,989 |
| Los Angeles CA USD GO | 2.000% | 7/1/10 | 14,835 | 14,852 |
| 1 Los Angeles CA USD GO TOB VRDO | 0.290% | 6/7/10 | 6,660 | 6,660 |
| 1 Los Angeles CA USD GO TOB VRDO | 0.290% | 6/7/10 | 9,995 | 9,995 |
| 1 Los Angeles CA USD GO TOB VRDO | 0.290% | 6/7/10 (4) | 22,500 | 22,500 |
| 1 Los Angeles CA USD TOB VRDO | 0.330% | 6/7/10 | 8,965 | 8,965 |
18
| | | | |
| California Tax-Exempt Money Market Fund | | | | |
| |
| |
| |
| | | | Face | Market |
| | | Maturity | Amount | Value• |
| | Coupon | Date | ($000) | ($000) |
| Los Angeles CA USD TRAN | 2.000% | 8/12/10 | 25,000 | 25,068 |
| 1 Los Angeles CA Wastewater System | | | | |
| Rev. TOB VRDO | 0.270% | 6/7/10 | 24,475 | 24,475 |
| 1 Los Angeles CA Wastewater System | | | | |
| Rev. TOB VRDO | 0.290% | 6/7/10 | 7,500 | 7,500 |
| 1 Los Angeles CA Wastewater System | | | | |
| Rev. TOB VRDO | 0.300% | 6/7/10 | 25,000 | 25,000 |
| Los Angeles CA Wastewater System | | | | |
| Rev. VRDO | 0.230% | 6/7/10 LOC | 8,600 | 8,600 |
| Los Angeles CA Wastewater System | | | | |
| Rev. VRDO | 0.240% | 6/7/10 LOC | 14,440 | 14,440 |
| Los Angeles CA Wastewater System | | | | |
| Rev. VRDO | 0.250% | 6/7/10 LOC | 11,730 | 11,730 |
| Los Angeles CA Wastewater System | | | | |
| Rev. VRDO | 0.260% | 6/7/10 LOC | 8,640 | 8,640 |
| Los Angeles County CA Capital Asset | | | | |
| Leasing Corp. Rev. | 0.300% | 7/13/10 LOC | 16,000 | 16,000 |
| Los Angeles County CA Housing Auth. | | | | |
| Multifamily Housing Rev. VRDO | 0.370% | 6/7/10 LOC | 6,120 | 6,120 |
| Los Angeles County CA Metro. Transp. | | | | |
| Auth. Sales Tax Rev. | 2.500% | 7/1/10 | 16,015 | 16,043 |
| Los Angeles County CA Metro. Transp. | | | | |
| Auth. Sales Tax Rev. VRDO | 0.280% | 6/1/10 | 60,775 | 60,775 |
| Manteca CA Redev. Agency Tax | | | | |
| Allocation Rev. VRDO | 0.300% | 6/1/10 LOC | 22,025 | 22,025 |
| 1 Metro. Water Dist. of Southern California | | | | |
| Rev. TOB VRDO | 0.290% | 6/7/10 | 8,995 | 8,995 |
| 1 Metro. Water Dist. of Southern California | | | | |
| Rev. TOB VRDO | 0.290% | 6/7/10 | 5,000 | 5,000 |
| Metro. Water Dist. of Southern California | | | | |
| Rev. VRDO | 0.250% | 6/1/10 | 7,000 | 7,000 |
| Metro. Water Dist. of Southern California | | | | |
| Rev. VRDO | 0.230% | 6/7/10 | 16,600 | 16,600 |
| Metro. Water Dist. of Southern California | | | | |
| Rev. VRDO | 0.230% | 6/7/10 | 26,900 | 26,900 |
| Metro. Water Dist. of Southern California | | | | |
| Rev. VRDO | 0.240% | 6/7/10 | 36,000 | 36,000 |
| Mission Viejo CA Community Dev. Financing | | | | |
| Auth. (Mission Viejo Mall Improvement) VRDO | 0.250% | 6/7/10 LOC | 25,800 | 25,800 |
| 1 New Haven CA USD TOB VRDO | 0.290% | 6/7/10 LOC | 11,302 | 11,302 |
| Newport Beach CA Rev. | | | | |
| (Hoag Memorial Hosp.) VRDO | 0.230% | 6/7/10 | 28,795 | 28,795 |
| 1 Nuveen California Municipal Market | | | | |
| Opportunity Fund VRDP VRDO | 0.410% | 6/7/10 LOC | 20,000 | 20,000 |
| 1 Oakland CA Redev. Agency Tax Allocation | | | | |
| (Central Dist.) TOB VRDO | 0.290% | 6/7/10 LOC | 13,710 | 13,710 |
| Oakland-Alameda County CA Coliseum Auth. | | | | |
| Lease Rev. (Oakland Coliseum Project) VRDO | 0.250% | 6/7/10 LOC | 70,300 | 70,300 |
| Orange County CA Apartment Dev. Rev. VRDO | 0.260% | 6/7/10 LOC | 8,150 | 8,150 |
| 1 Orange County CA Sanitation Dist. COP | | | | |
| TOB VRDO | 0.290% | 6/7/10 | 10,925 | 10,925 |
| Orange County CA TRAN | 2.000% | 6/30/10 | 80,000 | 80,102 |
| Orange County CA Water Dist. COP VRDO | 0.240% | 6/7/10 | 37,550 | 37,550 |
| Otay CA Water Dist. (Capital Project) COP VRDO | 0.300% | 6/7/10 LOC | 8,800 | 8,800 |
19
| | | | |
| California Tax-Exempt Money Market Fund | | | | |
| |
| |
| |
| | | | Face | Market |
| | | Maturity | Amount | Value• |
| | Coupon | Date | ($000) | ($000) |
| 1 Palomar Pomerado Health System California GO | | | | |
| TOB VRDO | 0.270% | 6/7/10 (12) | 18,500 | 18,500 |
| 1 Piedmont CA USD TOB VRDO | 0.290% | 6/7/10 | 6,445 | 6,445 |
| Pittsburg CA Redev. Agency Tax Allocation | | | | |
| (Los Medanos Community Dev.) VRDO | 0.300% | 6/1/10 LOC | 112,655 | 112,655 |
| 1 Port of Oakland CA Rev. TOB VRDO | 0.340% | 6/7/10 (13) | 13,665 | 13,665 |
| 1 Rancho Santiago CA Community College | | | | |
| Dist. TOB VRDO | 0.270% | 6/7/10 (4) | 4,765 | 4,765 |
| Riverside CA Electric Rev. VRDO | 0.280% | 6/7/10 LOC | 54,200 | 54,200 |
| Riverside County CA Public Fac. Project VRDO | 0.280% | 6/7/10 LOC | 10,400 | 10,400 |
| Riverside County CA Transp. Commission | | | | |
| Sales Tax Rev. VRDO | 0.270% | 6/7/10 | 4,885 | 4,885 |
| Riverside County CA Transp. Commission | | | | |
| Sales Tax Rev. VRDO | 0.270% | 6/7/10 | 29,975 | 29,975 |
| Sacramento CA Muni. Util. Dist. Rev. CP | 0.300% | 6/10/10 LOC | 7,000 | 7,000 |
| 1 Sacramento CA Muni. Util. Dist. Rev. TOB VRDO | 0.310% | 6/7/10 (4) | 13,510 | 13,510 |
| Sacramento CA Transp. Auth. Sales Tax Rev. VRDO | 0.260% | 6/7/10 | 47,300 | 47,300 |
| Sacramento County CA Sanitation Dist. | | | | |
| Financing Auth. VRDO | 0.260% | 6/7/10 LOC | 5,000 | 5,000 |
| 1 San Bernardino CA Community College | | | | |
| Dist. TOB VRDO | 0.290% | 6/7/10 (4) | 7,500 | 7,500 |
| 1 San Bernardino CA Community College | | | | |
| Dist. TOB VRDO | 0.320% | 6/7/10 | 38,720 | 38,720 |
| San Bernardino County CA TRAN | 2.000% | 6/30/10 | 50,000 | 50,063 |
| 1 San Diego CA Community College | | | | |
| Dist. GO TOB VRDO | 0.290% | 6/7/10 | 3,995 | 3,995 |
| 1 San Diego CA Community College | | | | |
| Dist. GO TOB VRDO | 0.290% | 6/7/10 | 5,000 | 5,000 |
| 1 San Diego CA Community College | | | | |
| Dist. GO TOB VRDO | 0.290% | 6/7/10 | 5,000 | 5,000 |
| San Diego CA County & School Dist. TRAN | 2.000% | 6/30/10 | 80,000 | 80,103 |
| San Diego CA Housing Auth. Multifamily Housing | | | | |
| Rev. (Bay Vista Apartments Projects) VRDO | 0.270% | 6/7/10 LOC | 9,690 | 9,690 |
| San Diego CA Housing Auth. Multifamily | | | | |
| Housing Rev. (Canyon Rim Apartments) VRDO | 0.260% | 6/7/10 LOC | 32,440 | 32,440 |
| San Diego CA Public Fac. Financing | | | | |
| Auth. Water Rev. | 2.500% | 8/1/10 | 5,245 | 5,262 |
| 1 San Diego CA Public Fac. Financing | | | | |
| Auth. Water Rev. TOB VRDO | 0.290% | 6/7/10 | 7,495 | 7,495 |
| San Diego CA USD TRAN | 2.000% | 7/8/10 | 45,000 | 45,067 |
| 1 San Diego CA Water Auth. Rev. COP TOB VRDO | 0.290% | 6/7/10 (4) | 6,840 | 6,840 |
| 1 San Diego CA Water Auth. Rev. COP TOB VRDO | 0.290% | 6/7/10 (4) | 9,500 | 9,500 |
| 1 San Diego CA Water Auth. Rev. COP TOB VRDO | 0.310% | 6/7/10 | 10,100 | 10,100 |
| San Diego County CA COP VRDO | 0.280% | 6/7/10 LOC | 9,760 | 9,760 |
| 1 San Diego County CA Water Auth. Rev. | | | | |
| COP TOB VRDO | 0.270% | 6/7/10 (4) | 16,900 | 16,900 |
| 1 San Diego County CA Water Auth. Rev. | | | | |
| TOB VRDO | 0.290% | 6/7/10 (4) | 9,800 | 9,800 |
| 1 San Diego County CA Water Auth. Rev. | | | | |
| TOB VRDO | 0.290% | 6/7/10 (4) | 6,100 | 6,100 |
| 1 San Francisco CA Bay Area Rapid Transit | | | | |
| Dist. Rev. TOB VRDO | 0.290% | 6/7/10 | 10,000 | 10,000 |
| 1 San Francisco CA Bay Area Rapid Transit | | | | |
| Dist. Sales Tax Rev. TOB VRDO | 0.290% | 6/7/10 | 13,595 | 13,595 |
20
| | | | |
| California Tax-Exempt Money Market Fund | | | | |
| |
| |
| |
| | | | Face | Market |
| | | Maturity | Amount | Value• |
| | Coupon | Date | ($000) | ($000) |
| San Francisco CA Bay Area Rapid Transit Rev. | 6.750% | 7/1/10 | 6,370 | 6,402 |
| San Francisco CA City & County Finance Corp. | | | | |
| Lease Rev. (Moscone Center Expansion) VRDO | 0.230% | 6/7/10 LOC | 7,600 | 7,600 |
| San Francisco CA City & County | | | | |
| International Airport Rev. VRDO | 0.270% | 6/7/10 LOC | 16,000 | 16,000 |
| San Francisco CA City & County Redev. Agency | | | | |
| Multifamily Rev. VRDO | 0.290% | 6/7/10 LOC | 65,200 | 65,200 |
| San Jose CA Financing Auth. Lease Rev. CP | 0.370% | 8/3/10 LOC | 34,302 | 34,302 |
| 1 San Jose CA Financing Auth. Lease Rev. | | | | |
| TOB VRDO | 0.300% | 6/7/10 (13) | 25,960 | 25,960 |
| San Jose CA Financing Auth. Lease Rev. VRDO | 0.260% | 6/7/10 LOC | 28,980 | 28,980 |
| San Jose CA Multifamily Housing Rev. | | | | |
| (Cinnabar Commons) VRDO | 0.260% | 6/7/10 LOC | 16,700 | 16,700 |
| 1 San Jose CA USD Santa Clara County TOB VRDO | 0.290% | 6/7/10 LOC | 5,000 | 5,000 |
| 1 San Jose CA USD Santa Clara County TOB VRDO | 0.290% | 6/7/10 | 5,000 | 5,000 |
| 1 San Marcos CA Public Fac. Auth. Tax Allocation | | | | |
| TOB VRDO | 0.310% | 6/7/10 (13) | 8,690 | 8,690 |
| 1 San Mateo County CA Community College Dist. | | | | |
| TOB VRDO | 0.290% | 6/7/10 | 11,660 | 11,660 |
| Santa Barbara County CA TRAN | 2.500% | 6/30/10 | 25,000 | 25,043 |
| Santa Clara County CA El Camino Hosp. Dist. Fac. | | | | |
| Auth. Rev. (Valley Medical Center Project) VRDO | 0.280% | 6/7/10 LOC | 16,150 | 16,150 |
| Santa Clara County CA El Camino Hosp. Dist. Fac. | | | | |
| Auth. Rev. (Valley Medical Center Project) VRDO | 0.280% | 6/7/10 LOC | 17,000 | 17,000 |
| Santa Clara County CA Financing Auth. Lease Rev. | | | | |
| (VMC Fac. Replacement Project) VRDO | 0.190% | 6/7/10 | 27,430 | 27,430 |
| 1 Semitropic CA Water Storage Dist. Rev. TOB VRDO | 0.290% | 6/7/10 | 9,590 | 9,590 |
| 1 Sequoia CA USD TOB VRDO | 0.290% | 6/7/10 (4) | 5,860 | 5,860 |
| 1 Sonoma County CA (Jr. College Dist.) TOB VRDO | 0.290% | 6/7/10 (4) | 31,030 | 31,030 |
| 1 Sonoma County CA (Jr. College Dist.) TOB VRDO | 0.290% | 6/7/10 (4) | 3,440 | 3,440 |
| Sonoma County CA TRAN | 1.500% | 10/28/10 | 30,000 | 30,136 |
| South Placer CA Wastewater Auth. Rev. VRDO | 0.200% | 6/7/10 LOC | 35,725 | 35,725 |
| Southern California Home Financing Auth. | | | | |
| Single Family Mortgage Rev. VRDO | 0.290% | 6/7/10 LOC | 15,980 | 15,980 |
| Southern California Home Financing Auth. | | | | |
| Single Family Mortgage Rev. VRDO | 0.290% | 6/7/10 LOC | 33,560 | 33,560 |
| Southern California Public Power Auth. | | | | |
| (Linden Windenergy Project) RAN | 2.000% | 10/1/10 | 42,680 | 42,904 |
| Southern California Public Power Auth. | | | | |
| (Tieten Hydropower) RAN | 2.000% | 8/16/10 | 11,180 | 11,217 |
| 1 Sweetwater CA USD GO TOB VRDO | 0.290% | 6/7/10 (13) | 16,445 | 16,445 |
| 1 Univ. of California Barclays TOB VRDO | 0.260% | 6/7/10 | 6,665 | 6,665 |
| Univ. of California Regents VRDO | 0.240% | 6/1/10 | 29,115 | 29,115 |
| Univ. of California Rev. (Multiple Purpose Project) | 5.000% | 9/1/10 (Prere.) | 3,500 | 3,576 |
| Univ. of California Rev. (Multiple Purpose Project) | 5.000% | 9/1/10 (Prere.) | 5,000 | 5,108 |
| 1 Univ. of California Rev. TOB VRDO | 0.290% | 6/7/10 | 29,195 | 29,195 |
| 1 Univ. of California Rev. TOB VRDO | 0.290% | 6/7/10 (13) | 15,280 | 15,280 |
| 1 Univ. of California Rev. TOB VRDO | 0.290% | 6/7/10 | 3,495 | 3,495 |
| 1 Univ. of California Rev. TOB VRDO | 0.290% | 6/7/10 | 6,000 | 6,000 |
| 1 Univ. of California Rev. TOB VRDO | 0.290% | 6/7/10 | 5,995 | 5,995 |
| 1 Univ. of California Rev. TOB VRDO | 0.290% | 6/7/10 | 3,470 | 3,470 |
| 1 Univ. of California Rev. TOB VRDO | 0.290% | 6/7/10 | 10,000 | 10,000 |
| 1 Univ. of California Rev. TOB VRDO | 0.290% | 6/7/10 | 1,890 | 1,890 |
| 1 Univ. of California Rev. TOB VRDO | 0.290% | 6/7/10 (4) | 16,820 | 16,820 |
| Ventura County CA TRAN | 2.500% | 7/1/10 | 32,000 | 32,056 |
21
| | | | |
| California Tax-Exempt Money Market Fund | | | | |
| |
| |
| |
| | | | Face | Market |
| | | Maturity | Amount | Value• |
| | Coupon | Date | ($000) | ($000) |
| 1 Vista CA USD GO TOB VRDO | 0.320% | 6/7/10 (4) | 9,475 | 9,475 |
| Western Municipal Water Dist. Fac. Auth. | | | | |
| California Water Rev. VRDO | 0.220% | 6/7/10 LOC | 8,700 | 8,700 |
| Whittier CA Insured Health Fac. Rev. | | | | |
| (Presbyterian Hosp.) VRDO | 0.240% | 6/7/10 LOC | 15,600 | 15,600 |
| Total Tax-Exempt Municipal Bonds (Cost $4,901,718) | | | | 4,901,718 |
| Other Assets and Liabilities (-0.1%) | | | | |
| Other Assets | | | | 46,039 |
| Liabilities | | | | (51,983) |
| | | | | (5,944) |
| Net Assets (100%) | | | | |
| Applicable to 4,895,248,866 outstanding $.001 par value shares of | | | |
| beneficial interest (unlimited authorization) | | | | 4,895,774 |
| Net Asset Value Per Share | | | | $1.00 |
| |
| |
| At May 31, 2010, net assets consisted of: | | | | |
| | | | | Amount |
| | | | | ($000) |
| Paid-in Capital | | | | 4,895,763 |
| Undistributed Net Investment Income | | | | — |
| Accumulated Net Realized Gains | | | | 11 |
| Net Assets | | | | 4,895,774 |
• See Note A in Notes to Financial Statements.
1 Security exempt from registration under Rule 144A of the Securities Act of 1933. Such securities may be sold in transactions exempt from registration, normally to qualified institutional buyers. At May 31, 2010, the aggregate value of these securities was $1,051,293,000, representing 21.5% of net assets.
See accompanying Notes, which are an integral part of the Financial Statements.
A key to abbreviations and other references follows the Statement of Net Assets.
22
California Tax-Exempt Money Market Fund
Key to Abbreviations
ARS—Auction Rate Security.
BAN—Bond Anticipation Note.
COP—Certificate of Participation.
CP—Commercial Paper.
FR—Floating Rate.
GAN—Grant Anticipation Note.
GO—General Obligation Bond.
IDA—Industrial Development Authority Bond.
IDR—Industrial Development Revenue Bond.
PCR—Pollution Control Revenue Bond.
PUT—Put Option Obligation.
RAN—Revenue Anticipation Note.
TAN—Tax Anticipation Note.
TOB—Tender Option Bond.
TRAN—Tax Revenue Anticipation Note.
UFSD—Union Free School District.
USD—United School District.
VRDO—Variable Rate Demand Obligation.
VRDP—Variable Rate Demand Preferred.
(ETM)—Escrowed to Maturity.
(Prere.)—Prerefunded.
Scheduled principal and interest payments are guaranteed by:
(1) MBIA (Municipal Bond Investors Assurance).
(2) AMBAC (Ambac Assurance Corporation).
(3) FGIC (Financial Guaranty Insurance Company).
(4) AGM (Assured Guaranty Municipal Corporation).
(5) BIGI (Bond Investors Guaranty Insurance).
(6) Connie Lee Inc.
(7) FHA (Federal Housing Authority).
(8) CapMAC (Capital Markets Assurance Corporation).
(9) American Capital Access Financial Guaranty Corporation.
(10) XL Capital Assurance Inc.
(11) CIFG (CDC IXIS Financial Guaranty).
(12) Assured Guaranty Corp.
(13) Berkshire Hathaway Assurance Corp.
(14) National Public Finance Guarantee Corp.
The insurance does not guarantee the market value of the municipal bonds.
LOC—Scheduled principal and interest payments are guaranteed by bank letter of credit.
23
| |
| California Tax-Exempt Money Market Fund | |
| |
| |
| Statement of Operations | |
| |
| | Six Months Ended |
| | May 31, 2010 |
| | ($000) |
| Investment Income | |
| Income | |
| Interest | 7,094 |
| Total Income | 7,094 |
| Expenses | |
| The Vanguard Group—Note B | |
| Investment Advisory Services | 560 |
| Management and Administrative | 2,971 |
| Marketing and Distribution | 803 |
| Custodian Fees | 19 |
| Shareholders’ Reports | 9 |
| Trustees’ Fees and Expenses | 4 |
| Total Expenses | 4,366 |
| Net Investment Income | 2,728 |
| Realized Net Gain (Loss) on Investment Securities Sold | 11 |
| Net Increase (Decrease) in Net Assets Resulting from Operations | 2,739 |
See accompanying Notes, which are an integral part of the Financial Statements.
24
| | |
| California Tax-Exempt Money Market Fund | | |
| |
| |
| Statement of Changes in Net Assets | | |
| |
| | Six Months Ended | Year Ended |
| | May 31, | November 30, |
| | 2010 | 2009 |
| | ($000) | ($000) |
| Increase (Decrease) in Net Assets | | |
| Operations | | |
| Net Investment Income | 2,728 | 23,796 |
| Realized Net Gain (Loss) | 11 | 506 |
| Net Increase (Decrease) in Net Assets Resulting from Operations | 2,739 | 24,302 |
| Distributions | | |
| Net Investment Income | (2,728) | (23,796) |
| Realized Capital Gain | — | — |
| Total Distributions | (2,728) | (23,796) |
| Capital Share Transactions (at $1.00) | | |
| Issued | 1,649,109 | 3,668,931 |
| Issued in Lieu of Cash Distributions | 2,633 | 22,754 |
| Redeemed | (2,111,437) | (5,842,322) |
| Net Increase (Decrease) from Capital Share Transactions | (459,695) | (2,150,637) |
| Total Increase (Decrease) | (459,684) | (2,150,131) |
| Net Assets | | |
| Beginning of Period | 5,355,458 | 7,505,589 |
| End of Period | 4,895,774 | 5,355,458 |
See accompanying Notes, which are an integral part of the Financial Statements.
25
| | | | | | |
| California Tax-Exempt Money Market Fund | | | | | |
| |
| |
| Financial Highlights | | | | | | |
| |
| |
| Six Months | | | | | |
| | Ended | | | | | |
| For a Share Outstanding | May 31, | | | Year Ended November 30, |
| Throughout Each Period | 2010 | 2009 | 2008 | 2007 | 2006 | 2005 |
| Net Asset Value, Beginning of Period | $1.00 | $1.00 | $1.00 | $1.00 | $1.00 | $1.00 |
| Investment Operations | | | | | | |
| Net Investment Income | .0005 | .004 | .022 | .035 | .032 | .021 |
| Net Realized and Unrealized Gain (Loss) | | | | | | |
| on Investments | — | — | — | — | — | — |
| Total from Investment Operations | .0005 | .004 | .022 | .035 | .032 | .021 |
| Distributions | | | | | | |
| Dividends from Net Investment Income | (.0005) | (.004) | (.022) | (.035) | (.032) | (.021) |
| Distributions from Realized Capital Gains | — | — | — | — | — | — |
| Total Distributions | (.0005) | (.004) | (.022) | (.035) | (.032) | (.021) |
| Net Asset Value, End of Period | $1.00 | $1.00 | $1.00 | $1.00 | $1.00 | $1.00 |
| |
| Total Return1 | 0.05% | 0.37% | 2.21% | 3.55% | 3.24% | 2.17% |
| |
| Ratios/Supplemental Data | | | | | | |
| Net Assets, End of Period (Millions) | $4,896 | $5,355 | $7,506 | $8,623 | $7,220 | $6,162 |
| Ratio of Total Expenses to | | | | | | |
| Average Net Assets | 0.17%2 | 0.17%3 | 0.11%3 | 0.10% | 0.13% | 0.13% |
| Ratio of Net Investment Income to | | | | | | |
| Average Net Assets | 0.11%2 | 0.39% | 2.19% | 3.49% | 3.20% | 2.17% |
1 Total returns do not include the account service fee that may be applicable to certain accounts with balances below $10,000.
2 Annualized.
3 Includes fees to participate in the Treasury Temporary Guarantee Program for Money Market Funds of 0.04% for 2009 and 0.01% for 2008.
See accompanying Notes, which are an integral part of the Financial Statements.
26
California Tax-Exempt Money Market Fund
Notes to Financial Statements
Vanguard California Tax-Exempt Money Market Fund is registered under the Investment Company Act of 1940 as an open-end investment company, or mutual fund. The fund invests in debt instruments of municipal issuers whose ability to meet their obligations may be affected by economic and political developments in the state.
A. The following significant accounting policies conform to generally accepted accounting principles for U.S. mutual funds. The fund consistently follows such policies in preparing its financial statements.
1. Security Valuation: Securities are valued at amortized cost, which approximates market value.
2. Federal Income Taxes: The fund intends to continue to qualify as a regulated investment company and distribute all of its income. Management has analyzed the fund’s tax positions taken for all open federal income tax years (November 30, 2006–2009), and for the period ended May 31, 2010, and has concluded that no provision for federal income tax is required in the fund’s financial statements.
3. Distributions: Distributions from net investment income are declared daily and paid on the first business day of the following month.
4. Other: Interest income is accrued daily. Premiums and discounts on debt securities purchased are amortized and accreted, respectively, to interest income over the lives of the respective securities. Security transactions are accounted for on the date securities are bought or sold. Costs used to determine realized gains (losses) on the sale of investment securities are those of the specific securities sold.
B. The Vanguard Group furnishes at cost investment advisory, corporate management, administrative, marketing, and distribution services. The costs of such services are allocated to the fund under methods approved by the board of trustees. The fund has committed to provide up to 0.40% of its net assets in capital contributions to Vanguard. At May 31, 2010, the fund had contributed capital of $916,000 to Vanguard (included in Other Assets), representing 0.02% of the fund’s net assets and 0.37% of Vanguard’s capitalization. The fund’s trustees and officers are also directors and officers of Vanguard.
C. Various inputs may be used to determine the value of the fund’s investments. These inputs are summarized in three broad levels for financial statement purposes. The inputs or methodologies used to value securities are not necessarily an indication of the risk associated with investing in those securities.
Level 1—Quoted prices in active markets for identical securities.
Level 2—Other significant observable inputs (including quoted prices for similar securities, interest rates, prepayment speeds, credit risk, etc.).
Level 3—Significant unobservable inputs (including the fund’s own assumptions used to determine the fair value of investments).
At May 31, 2010, 100% of the fund’s investments were valued using amortized cost, in accordance with rules under the Investment Company Act of 1940. Amortized cost approximates the current fair value of a security, but since the value is not obtained from a quoted price in an active market, securities valued at amortized cost are considered to be valued using Level 2 inputs.
D. In preparing the financial statements as of May 31, 2010, management considered the impact of subsequent events for potential recognition or disclosure in these financial statements.
27
California Intermediate-Term Tax-Exempt Fund
| | | |
| Fund Profile | | |
| As of May 31, 2010 | | | |
| |
| Share-Class Characteristics | | |
| | Investor | Admiral |
| | Shares | Shares |
| Ticker Symbol | VCAIX | VCADX |
| Expense Ratio1 | 0.20% | 0.12% |
| 30-Day SEC Yield | 3.13% | 3.21% |
| |
| Financial Attributes | | | |
| | | Barclays 7 | |
| | | Year | Barclays |
| | | Municipal | Municipal |
| | | Bond | Bond |
| | Fund | Index | Index |
| Number of Bonds | 706 | 4,597 | 46,449 |
| Average Quality | AA- | AA/AA- | AA/AA- |
| Yield to Maturity | | | |
| (before expenses) | 3.3% | 2.7% | 3.4% |
| Average Coupon | 4.4% | 5.0% | 5.0% |
| Average Duration | 5.6 years | 5.1 years | 8.2 years |
| Average Effective | | | |
| Maturity | 6.0 years | 6.9 years | 13.5 years |
| Short-Term | | | |
| Reserves | 6.4% | — | — |
| | |
| Volatility Measures | | |
| | Barclays 7 | Barclays |
| | Year Municipal | Municipal |
| | Bond Index | Bond Index |
| R-Squared | 0.78 | 0.96 |
| Beta | 0.94 | 0.91 |
These measures show the degree and timing of the fund’s fluctuations compared with the indexes over 36 months.
Distribution by Maturity (% of portfolio)
| |
| Under 1 Year | 10.5% |
| 1 - 3 Years | 12.8 |
| 3 - 5 Years | 19.1 |
| 5 - 10 Years | 45.6 |
| 10 - 20 Years | 11.0 |
| 20 - 30 Years | 1.0 |
Distribution by Credit Quality (% of portfolio)
| |
| AAA | 18.6% |
| AA | 38.3 |
| A | 37.5 |
| BBB | 4.2 |
| BB | 0.1 |
| Not Rated | 1.3 |
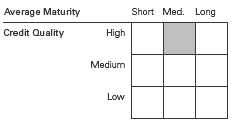
Investment Focus
1 The expense ratios shown are from the prospectus dated April 22, 2010, and represent estimated costs for the current fiscal year based on the fund’s net assets as of the prospectus date. For the six months ended May 31, 2010, the annualized expense ratios were 0.20% for Investor Shares and 0.12% for Admiral Shares.
28
California Intermediate-Term Tax-Exempt Fund
Performance Summary
All of the returns in this report represent past performance, which is not a guarantee of future results that may be achieved by the fund. (Current performance may be lower or higher than the performance data cited. For performance data current to the most recent month-end, visit our website at www.vanguard.com/performance.) Note, too, that both investment returns and principal value can fluctuate widely, so an investor’s shares, when sold, could be worth more or less than their original cost. The returns shown do not reflect taxes that a shareholder would pay on fund distributions or on the sale of fund shares.
| | | | |
| Fiscal-Year Total Returns (%): November 30, 1999, Through May 31, 2010 | |
| | | | | Barclays 7 |
| | | | | Year Municipal |
| | | | Investor Shares | Bond Index |
| Fiscal Year | Income Returns | Capital Returns | Total Returns | Total Returns |
| 2000 | 4.94% | 3.05% | 7.99% | 6.55% |
| 2001 | 4.67 | 2.77 | 7.44 | 8.13 |
| 2002 | 4.35 | 1.53 | 5.88 | 7.02 |
| 2003 | 4.12 | 1.66 | 5.78 | 6.97 |
| 2004 | 3.93 | -1.52 | 2.41 | 2.89 |
| 2005 | 3.90 | -1.79 | 2.11 | 2.16 |
| 2006 | 4.12 | 1.28 | 5.40 | 5.09 |
| 2007 | 3.99 | -1.53 | 2.46 | 4.19 |
| 2008 | 3.79 | -6.50 | -2.71 | 2.91 |
| 2009 | 4.19 | 6.37 | 10.56 | 10.43 |
| 2010 | 1.93 | 1.47 | 3.40 | 2.66 |
| Note: For 2010, performance data reflect the six months ended May 31, 2010. | | |
Average Annual Total Returns: Periods Ended March 31, 2010
This table presents average annual total returns through the latest calendar quarter—rather than through the end of the fiscal period. Securities and Exchange Commission rules require that we provide this information.
| | | | | | |
| | | | | | | Ten Years |
| | Inception Date | One Year | Five Years | Income | Capital | Total |
| Investor Shares | 3/4/1994 | 8.27% | 3.73% | 4.16% | 0.43% | 4.59% |
| Admiral Shares | 11/12/2001 | 8.36 | 3.81 | 4.101 | -0.361 | 3.741 |
| 1 Return since inception. | | | | | | |
See Financial Highlights for dividend and capital gains information.
29
California Intermediate-Term Tax-Exempt Fu nd
Financial Statements (unaudited)
Statement of Net Assets
As of May 31, 2010
The fund reports a complete list of its holdings in regulatory filings four times in each fiscal year, at the quarter-ends. For the second and fourth fiscal quarters, the lists appear in the fund’s semiannual and annual reports to shareholders. For the first and third fiscal quarters, the fund files the lists with the Securities and Exchange Commission on Form N-Q. Shareholders can look up the fund’s Forms N-Q on the SEC’s website at www.sec.gov. Forms N-Q may also be reviewed and copied at the SEC’s Public Reference Room (see the back cover of this report for further information).
| | | | |
| | | | Face | Market |
| | | Maturity | Amount | Value• |
| | Coupon | Date | ($000) | ($000) |
| Tax-Exempt Municipal Bonds (99.8%) | | | | |
| California (97.7%) | | | | |
| ABAG Finance Auth. for Non-Profit Corp. California | | | | |
| (899 Charleston Project) VRDO | 0.280% | 6/1/10 LOC | 21,775 | 21,775 |
| ABAG Finance Auth. for Non-Profit Corp. California | | | | |
| (Acacia Creek at Union City Project) VRDO | 0.280% | 6/1/10 | 30,075 | 30,075 |
| ABAG Finance Auth. for Non-Profit Corp. California | | | | |
| (Valley Christian Schools) VRDO | 0.300% | 6/7/10 LOC | 6,000 | 6,000 |
| Alameda CA Corridor Transp. Auth. Rev. | 5.125% | 10/1/14 (14) | 10,150 | 10,273 |
| Alameda CA Corridor Transp. Auth. Rev. | 0.000% | 10/1/20 (2) | 12,250 | 6,810 |
| Alameda CA Corridor Transp. Auth. Rev. | 0.000% | 10/1/29 (2) | 30,000 | 8,576 |
| Alameda CA Corridor Transp. Auth. Rev. | 0.000% | 10/1/30 (2) | 8,000 | 2,106 |
| Alameda County CA (Medical Center) COP | 5.250% | 6/1/12 (14)(ETM) | 1,595 | 1,669 |
| Alameda County CA (Medical Center) COP | 5.250% | 6/1/13 (14)(ETM) | 1,785 | 1,868 |
| Alameda County CA (Medical Center) COP | 5.375% | 6/1/14 (14)(ETM) | 1,880 | 1,982 |
| Alameda County CA (Medical Center) COP | 5.375% | 6/1/15 (14)(ETM) | 3,960 | 4,175 |
| Alameda County CA COP | 5.375% | 12/1/10 (14) | 2,000 | 2,036 |
| Alameda County CA COP | 5.375% | 12/1/12 (14) | 11,000 | 11,741 |
| Alameda County CA COP | 5.375% | 12/1/13 (14) | 13,930 | 14,746 |
| Alameda County CA COP | 5.375% | 12/1/14 (14) | 4,790 | 5,047 |
| Alameda County CA COP | 5.375% | 12/1/15 (14) | 1,500 | 1,570 |
| Alvord CA USD GO | 5.900% | 2/1/24 (4) | 3,865 | 4,354 |
| Anaheim CA Public Finance Auth. | | | | |
| Electric System Rev. | 5.000% | 10/1/20 (14) | 4,210 | 4,610 |
| Anaheim CA Public Finance Auth. | | | | |
| Electric System Rev. | 5.000% | 10/1/21 (14) | 4,425 | 4,807 |
| Anaheim CA Public Finance Auth. | | | | |
| Electric System Rev. | 5.000% | 10/1/22 (14) | 4,660 | 5,024 |
| Anaheim CA Public Finance Auth. | | | | |
| Electric System Rev. | 5.000% | 10/1/24 (14) | 5,175 | 5,509 |
| Anaheim CA Public Finance Auth. | | | | |
| Electric System Rev. | 5.000% | 10/1/25 (14) | 5,450 | 5,766 |
| Anaheim CA Union High School Dist. GO | 5.375% | 8/1/12 (4)(Prere.) | 1,250 | 1,374 |
| Antioch CA Public Finance Auth. | | | | |
| Reassessment Rev. | 5.000% | 9/2/13 (2) | 8,705 | 8,721 |
| Bakersfield CA WasteWater Rev. | 5.000% | 9/15/24 (4) | 7,600 | 8,065 |
| Bay Area CA Infrastructure Financing Auth. Rev. | 5.000% | 8/1/17 (2) | 32,610 | 33,325 |
| Bay Area CA Infrastructure Financing Auth. Rev. | 5.000% | 8/1/17 (14) | 50,000 | 51,680 |
| Bay Area CA Infrastructure Financing Auth. Rev. | 5.000% | 8/1/17 (10) | 5,000 | 5,224 |
| Bay Area Toll Auth. CA Toll Bridge Rev. | 5.000% | 4/1/17 | 9,500 | 11,022 |
| Bay Area Toll Auth. CA Toll Bridge Rev. | 5.000% | 4/1/18 | 5,665 | 6,457 |
30
| | | | |
| California Intermediate-Term Tax-Exempt Fund | | | | |
| |
| |
| |
| | | | Face | Market |
| | | Maturity | Amount | Value• |
| | Coupon | Date | ($000) | ($000) |
| Bay Area Toll Auth. CA Toll Bridge Rev. | 5.000% | 4/1/23 | 11,625 | 12,496 |
| Bay Area Toll Auth. CA Toll Bridge Rev. | 5.000% | 4/1/25 | 3,000 | 3,187 |
| Bay Area Toll Auth. CA Toll Bridge Rev. | 5.000% | 4/1/26 | 10,000 | 10,558 |
| Bay Area Toll Auth. CA Toll Bridge Rev. | 5.250% | 4/1/29 | 11,080 | 11,940 |
| Bay Area Toll Auth. CA Toll Bridge Rev. | 5.000% | 4/1/31 | 5,000 | 5,155 |
| Bay Area Toll Auth. CA Toll Bridge Rev. | | | | |
| (San Francisco Bay Area) VRDO | 0.250% | 6/7/10 | 13,000 | 13,000 |
| Burbank CA Public Finance Auth. | 5.250% | 12/1/12 (2) | 3,540 | 3,784 |
| Burbank CA Public Finance Auth. | 5.250% | 12/1/13 (2) | 4,615 | 4,986 |
| Cabrillo CA Community College Dist. Rev. | 0.000% | 8/1/11 (14) | 2,465 | 2,424 |
| Cabrillo CA Community College Dist. Rev. | 0.000% | 8/1/12 (14) | 2,525 | 2,425 |
| Cabrillo CA Community College Dist. Rev. | 0.000% | 8/1/13 (14) | 2,590 | 2,408 |
| Cabrillo CA Community College Dist. Rev. | 0.000% | 8/1/14 (14) | 2,655 | 2,382 |
| Cabrillo CA Community College Dist. Rev. | 5.000% | 8/1/27 (14) | 8,710 | 9,046 |
| California County CA Tobacco | | | | |
| Securitization Agency | 0.000% | 6/1/21 | 15,000 | 12,940 |
| California Dept. of Water Resources | | | | |
| Water System Rev. (Central Valley) | 5.000% | 12/1/12 (3)(ETM) | 90 | 99 |
| California Dept. of Water Resources | | | | |
| Water System Rev. (Central Valley) | 5.000% | 12/1/12 (14) | 3,550 | 3,932 |
| California Dept. of Water Resources | | | | |
| Water System Rev. (Central Valley) | 5.000% | 12/1/24 | 5,000 | 5,532 |
| California Dept. of Water Resources | | | | |
| Water System Rev. (Central Valley) | 5.000% | 12/1/26 | 8,465 | 9,265 |
| California Dept. of Water Resources | | | | |
| Water System Rev. (Central Valley) | 5.000% | 12/1/26 (14) | 3,535 | 3,724 |
| California Dept. of Water Resources | | | | |
| Water System Rev. (Central Valley) | 5.000% | 12/1/27 | 8,300 | 9,151 |
| California Educ. Fac. Auth. Rev. | | | | |
| (College of Arts & Crafts) | 6.875% | 6/1/14 | 360 | 391 |
| California Educ. Fac. Auth. Rev. | | | | |
| (College of Arts & Crafts) | 6.875% | 6/1/15 | 380 | 417 |
| California Educ. Fac. Auth. Rev. | | | | |
| (College of Arts & Crafts) | 6.875% | 6/1/16 | 400 | 442 |
| California Educ. Fac. Auth. Rev. | | | | |
| (St. Mary’s College of California) VRDO | 0.280% | 6/7/10 LOC | 7,000 | 7,000 |
| California Educ. Fac. Auth. Rev. (Stanford Univ.) | 5.000% | 3/15/26 | 20,000 | 23,885 |
| 1 California Educ. Fac. Auth. Rev. | | | | |
| (Stanford Univ.) TOB VRDO | 0.290% | 6/7/10 | 8,910 | 8,910 |
| California GO | 5.750% | 2/1/11 (14) | 6,500 | 6,723 |
| California GO | 5.000% | 2/1/12 (Prere.) | 9,400 | 10,088 |
| California GO | 5.000% | 4/1/12 | 2,000 | 2,141 |
| California GO | 5.000% | 3/1/13 | 20,640 | 22,556 |
| California GO | 5.000% | 3/1/14 | 5,000 | 5,549 |
| California GO | 5.000% | 10/1/14 | 2,000 | 2,238 |
| California GO | 5.000% | 11/1/14 | 1,390 | 1,557 |
| California GO | 5.000% | 3/1/15 | 1,000 | 1,115 |
| California GO | 5.375% | 4/1/15 | 125 | 132 |
| California GO | 5.000% | 12/1/15 | 1,470 | 1,598 |
| California GO | 5.000% | 4/1/17 | 11,000 | 12,183 |
| California GO | 5.000% | 4/1/17 | 4,520 | 5,006 |
| California GO | 5.250% | 2/1/18 (14) | 8,000 | 8,976 |
| California GO | 6.000% | 2/1/18 (2) | 6,240 | 7,297 |
| California GO | 5.000% | 3/1/18 | 1,850 | 2,045 |
| California GO | 5.000% | 4/1/18 | 10,000 | 11,050 |
| California GO | 5.500% | 4/1/18 | 31,500 | 35,858 |
31
| | | | |
| California Intermediate-Term Tax-Exempt Fund | | | | |
| |
| |
| |
| | | | Face | Market |
| | | Maturity | Amount | Value• |
| | Coupon | Date | ($000) | ($000) |
| California GO | 5.000% | 8/1/18 | 1,895 | 2,060 |
| California GO | 5.000% | 10/1/18 | 20,000 | 22,062 |
| California GO | 5.500% | 4/1/19 | 11,245 | 12,745 |
| California GO | 5.000% | 5/1/19 | 10,000 | 10,574 |
| California GO | 5.000% | 8/1/19 | 30,000 | 31,765 |
| California GO | 5.000% | 10/1/19 (14) | 14,800 | 15,831 |
| California GO | 5.250% | 2/1/20 | 7,500 | 8,314 |
| California GO | 5.000% | 3/1/20 | 55,385 | 57,992 |
| California GO | 5.000% | 8/1/20 | 10,000 | 10,599 |
| California GO | 5.000% | 6/1/22 | 12,000 | 12,380 |
| California GO | 5.000% | 9/1/23 | 12,120 | 12,506 |
| California GO | 5.000% | 10/1/23 | 12,500 | 12,901 |
| California GO | 5.000% | 12/1/23 | 7,500 | 7,776 |
| California GO | 5.000% | 3/1/24 | 3,000 | 3,123 |
| California GO | 5.000% | 8/1/24 (4) | 37,225 | 38,337 |
| California GO | 5.000% | 8/1/24 | 10,000 | 10,289 |
| California GO | 5.000% | 10/1/24 | 16,940 | 17,402 |
| California GO | 5.000% | 11/1/24 | 10,000 | 10,310 |
| California GO | 5.000% | 12/1/24 | 2,000 | 2,062 |
| California GO | 5.000% | 8/1/25 | 10,000 | 10,256 |
| California GO | 5.000% | 12/1/25 | 21,015 | 21,611 |
| California GO | 5.000% | 3/1/26 | 5,000 | 5,087 |
| California GO | 5.000% | 3/1/26 | 8,500 | 8,731 |
| California GO | 5.000% | 4/1/26 | 37,480 | 38,332 |
| California GO | 5.000% | 4/1/27 | 24,285 | 24,709 |
| California GO | 5.750% | 4/1/27 | 31,455 | 33,891 |
| California GO | 4.500% | 8/1/27 | 6,000 | 5,676 |
| California GO | 5.000% | 3/1/28 | 10,855 | 10,933 |
| California GO | 5.750% | 4/1/28 | 30,000 | 32,504 |
| California GO | 5.000% | 6/1/28 | 10,005 | 10,089 |
| California GO | 5.250% | 3/1/30 | 20,000 | 20,427 |
| California GO | 5.750% | 4/1/31 | 41,000 | 43,594 |
| California GO | 6.000% | 3/1/33 | 12,000 | 13,143 |
| California GO | 6.500% | 4/1/33 | 20,000 | 22,597 |
| 1 California GO TOB VRDO | 0.290% | 6/1/10 LOC | 14,200 | 14,200 |
| 1 California GO TOB VRDO | 0.340% | 6/1/10 | 8,600 | 8,600 |
| California Health Fac. Finance Auth. Rev. | | | | |
| (Adventist Health System) | 5.000% | 3/1/16 | 2,170 | 2,257 |
| California Health Fac. Finance Auth. Rev. | | | | |
| (Adventist Health System) | 5.000% | 3/1/19 | 1,025 | 1,047 |
| California Health Fac. Finance Auth. Rev. | | | | |
| (Adventist Health System) | 5.000% | 3/1/33 | 2,000 | 1,944 |
| California Health Fac. Finance Auth. Rev. | | | | |
| (California-Nevada Methodist) | 5.000% | 7/1/26 | 1,740 | 1,708 |
| California Health Fac. Finance Auth. Rev. | | | | |
| (Catholic Healthcare West) | 5.500% | 7/1/10 (14) | 2,080 | 2,087 |
| California Health Fac. Finance Auth. Rev. | | | | |
| (Catholic Healthcare West) | 5.500% | 7/1/11 (14) | 2,675 | 2,684 |
| California Health Fac. Finance Auth. Rev. | | | | |
| (Catholic Healthcare West) | 5.500% | 7/1/12 (14) | 2,465 | 2,472 |
| California Health Fac. Finance Auth. Rev. | | | | |
| (Catholic Healthcare West) | 5.000% | 7/1/19 | 1,000 | 1,073 |
| California Health Fac. Finance Auth. Rev. | | | | |
| (Catholic Healthcare West) | 5.500% | 7/1/25 | 5,000 | 5,280 |
| California Health Fac. Finance Auth. Rev. | | | | |
| (Catholic Healthcare West) | 5.625% | 7/1/25 | 19,820 | 21,223 |
32
| | | | |
| California Intermediate-Term Tax-Exempt Fund | | | | |
| |
| |
| |
| | | | Face | Market |
| | | Maturity | Amount | Value• |
| | Coupon | Date | ($000) | ($000) |
| California Health Fac. Finance Auth. Rev. | | | | |
| (Catholic Healthcare West) | 6.000% | 7/1/29 | 3,000 | 3,244 |
| California Health Fac. Finance Auth. Rev. | | | | |
| (Catholic Healthcare West) PUT | 5.000% | 7/2/12 | 8,000 | 8,490 |
| California Health Fac. Finance Auth. Rev. | | | | |
| (Catholic Healthcare West) PUT | 5.000% | 7/1/14 | 39,000 | 43,169 |
| California Health Fac. Finance Auth. Rev. | | | | |
| (Catholic Healthcare West) PUT | 5.000% | 7/1/14 | 9,000 | 9,793 |
| California Health Fac. Finance Auth. Rev. | | | | |
| (Cedars-Sinai Medical Center) | 5.000% | 11/15/14 | 4,000 | 4,375 |
| California Health Fac. Finance Auth. Rev. | | | | |
| (Cedars-Sinai Medical Center) | 5.000% | 11/15/16 | 2,000 | 2,140 |
| California Health Fac. Finance Auth. Rev. | | | | |
| (Cedars-Sinai Medical Center) | 5.000% | 11/15/17 | 4,585 | 4,861 |
| California Health Fac. Finance Auth. Rev. | | | | |
| (Children’s Hosp. of Orange County) | 6.250% | 11/1/29 | 5,000 | 5,292 |
| California Health Fac. Finance Auth. Rev. | | | | |
| (Kaiser Permanente) | 5.250% | 6/1/10 (4)(ETM) | 5,310 | 5,312 |
| California Health Fac. Finance Auth. Rev. | | | | |
| (Kaiser Permanente) | 5.250% | 6/1/11 (4)(ETM) | 7,250 | 7,279 |
| California Health Fac. Finance Auth. Rev. | | | | |
| (Lucile Salter Packard Hosp.) | 5.000% | 8/15/14 (2) | 2,280 | 2,459 |
| California Health Fac. Finance Auth. Rev. | | | | |
| (Lucile Salter Packard Hosp.) | 5.000% | 8/15/15 (2) | 2,245 | 2,396 |
| California Health Fac. Finance Auth. Rev. | | | | |
| (Lucile Salter Packard Hosp.) | 5.000% | 8/15/16 (2) | 2,515 | 2,658 |
| California Health Fac. Finance Auth. Rev. | | | | |
| (Lucile Salter Packard Hosp.) | 5.000% | 8/15/17 (2) | 2,630 | 2,750 |
| California Health Fac. Finance Auth. Rev. | | | | |
| (Memorial Health Services) VRDO | 0.180% | 6/7/10 | 3,025 | 3,025 |
| California Health Fac. Finance Auth. Rev. | | | | |
| (Pomona Valley Hosp.) | 5.500% | 7/1/10 (14) | 3,570 | 3,578 |
| California Health Fac. Finance Auth. Rev. | | | | |
| (Providence Health & Services) | 6.250% | 10/1/24 | 3,000 | 3,440 |
| California Health Fac. Finance Auth. Rev. | | | | |
| (Providence Health & Services) | 6.250% | 10/1/28 | 4,000 | 4,542 |
| California Health Fac. Finance Auth. Rev. | | �� | | |
| (Scripps Health) | 5.000% | 10/1/17 | 2,515 | 2,759 |
| California Health Fac. Finance Auth. Rev. | | | | |
| (Scripps Health) | 5.000% | 10/1/18 | 3,000 | 3,282 |
| California Health Fac. Finance Auth. Rev. | | | | |
| (St. Joseph Health System) | 5.500% | 7/1/29 | 10,000 | 10,421 |
| California Health Fac. Finance Auth. Rev. | | | | |
| (St. Joseph Health System) PUT | 5.000% | 10/16/14 | 15,000 | 16,431 |
| 1 California Health Fac. Finance Auth. Rev. | | | | |
| (St. Joseph Health System) TOB VRDO | 0.290% | 6/7/10 | 15,000 | 15,000 |
| California Health Fac. Finance Auth. Rev. | | | | |
| (Stanford Hosp.) | 5.000% | 11/15/14 | 2,715 | 2,941 |
| California Health Fac. Finance Auth. Rev. | | | | |
| (Stanford Hosp.) | 5.000% | 11/15/15 | 3,000 | 3,213 |
| California Health Fac. Finance Auth. Rev. | | | | |
| (Stanford Hosp.) | 5.000% | 11/15/16 | 6,275 | 6,649 |
| California Health Fac. Finance Auth. Rev. | | | | |
| (Stanford Hosp.) PUT | 3.450% | 6/15/11 | 10,000 | 10,231 |
| California Health Fac. Finance Auth. Rev. | | | | |
| (Sutter Health) | 5.500% | 8/15/12 (4) | 5,410 | 5,427 |
33
| | | | |
| California Intermediate-Term Tax-Exempt Fund | | | | |
| |
| |
| |
| | | | Face | Market |
| | | Maturity | Amount | Value• |
| | Coupon | Date | ($000) | ($000) |
| 1 California Health Fac. Finance Auth. Rev. | | | | |
| TOB VRDO | 0.290% | 6/7/10 | 17,500 | 17,500 |
| California Infrastructure & Econ. Dev. Bank Rev. | 5.000% | 2/1/13 | 8,325 | 8,956 |
| California Infrastructure & Econ. Dev. Bank Rev. | | | | |
| (Asian Art Museum) | 5.500% | 6/1/10 (14)(Prere.) | 2,435 | 2,460 |
| California Infrastructure & Econ. Dev. Bank Rev. | | | | |
| (Asian Art Museum) | 5.500% | 6/1/10 (14)(Prere.) | 2,245 | 2,268 |
| California Infrastructure & Econ. Dev. Bank Rev. | | | | |
| (California Science Center) | 5.000% | 5/1/18 (14) | 1,785 | 1,827 |
| California Infrastructure & Econ. Dev. Bank Rev. | | | | |
| (California Science Center) | 5.000% | 5/1/19 (14) | 1,040 | 1,055 |
| California Infrastructure & Econ. Dev. Bank Rev. | | | | |
| (California Science Center) | 5.000% | 5/1/21 (14) | 1,145 | 1,148 |
| California Infrastructure & Econ. Dev. Bank Rev. | | | | |
| (Clean Water State Revolving Fund) | 5.000% | 10/1/14 | 2,500 | 2,736 |
| California Infrastructure & Econ. Dev. Bank Rev. | | | | |
| (Independent System Operator) | 5.000% | 2/1/11 | 10,000 | 10,251 |
| California Infrastructure & Econ. Dev. Bank Rev. | | | | |
| (J. David Gladstone Institute) | 5.000% | 10/1/10 | 1,325 | 1,338 |
| California Infrastructure & Econ. Dev. Bank Rev. | | | | |
| (J. David Gladstone Institute) | 5.000% | 10/1/11 | 1,275 | 1,322 |
| California Infrastructure & Econ. Dev. Bank Rev. | | | | |
| (J. David Gladstone Institute) | 5.000% | 10/1/12 | 2,950 | 3,082 |
| California Infrastructure & Econ. Dev. Bank Rev. | | | | |
| (J. David Gladstone Institute) | 5.000% | 10/1/13 | 2,350 | 2,444 |
| California Infrastructure & Econ. Dev. Bank Rev. | | | | |
| (J. David Gladstone Institute) | 5.500% | 10/1/14 | 2,250 | 2,339 |
| California Infrastructure & Econ. Dev. Bank Rev. | | | | |
| (J. David Gladstone Institute) | 5.500% | 10/1/15 | 2,430 | 2,517 |
| California Infrastructure & Econ. Dev. Bank Rev. | | | | |
| (J. David Gladstone Institute) | 5.500% | 10/1/16 | 3,620 | 3,730 |
| California Infrastructure & Econ. Dev. Bank Rev. | | | | |
| (J. David Gladstone Institute) | 5.500% | 10/1/17 | 3,820 | 3,921 |
| 2 California Infrastructure & Econ. Dev. Bank Rev. | | | | |
| (J. Paul Getty Trust) PUT | 3.900% | 12/1/11 | 9,000 | 9,389 |
| California Infrastructure & Econ. Dev. Bank Rev. | | | | |
| (J. Paul Getty Trust) PUT | 4.000% | 12/1/11 | 16,665 | 17,410 |
| California Infrastructure & Econ. Dev. Bank Rev. | | | | |
| (J. Paul Getty Trust) VRDO | 0.200% | 6/1/10 | 2,800 | 2,800 |
| California Infrastructure & Econ. Dev. Bank Rev. | | | | |
| (J. Paul Getty Trust) VRDO | 0.200% | 6/1/10 | 21,500 | 21,500 |
| California Infrastructure & Econ. Dev. Bank Rev. | | | | |
| (J. Paul Getty Trust) VRDO | 0.200% | 6/1/10 | 8,300 | 8,300 |
| California Infrastructure & Econ. Dev. Bank Rev. | | | | |
| (Pacific Gas & Electric) VRDO | 0.230% | 6/1/10 LOC | 3,500 | 3,500 |
| California Infrastructure & Econ. Dev. Bank Rev. | | | | |
| (Workers’ Compensation) | 5.250% | 10/1/13 (2) | 18,000 | 20,222 |
| California Infrastructure & Econ. Dev. Bank Rev. | | | | |
| (Workers’ Compensation) | 5.250% | 10/1/14 (2) | 25,815 | 28,586 |
| California PCR Financing Auth. COP | 5.375% | 2/1/29 | 16,600 | 15,710 |
| California PCR Financing Auth. Rev. | | | | |
| (Pacific Gas & Electric Co.) VRDO | 0.230% | 6/1/10 LOC | 21,700 | 21,700 |
| California PCR Financing Auth. Rev. | | | | |
| (San Diego Gas & Electric) | 5.900% | 6/1/14 (14) | 17,135 | 19,304 |
| California PCR Financing Auth. Solid Waste | | | | |
| Disposal Rev. (USA Waste Services) PUT | 4.000% | 6/1/10 | 1,000 | 1,000 |
34
| | | | |
| California Intermediate-Term Tax-Exempt Fund | | | | |
| |
| |
| |
| | | | Face | Market |
| | | Maturity | Amount | Value• |
| | Coupon | Date | ($000) | ($000) |
| California Pollution Control Finance Auth. | | | | |
| Environmental Improvement Rev. | | | | |
| (BP West Coast Products) PUT | 2.600% | 9/2/14 | 14,550 | 14,594 |
| California Public Works Board Lease Rev. | 5.000% | 11/1/13 | 2,000 | 2,178 |
| California Public Works Board Lease Rev. | 5.000% | 11/1/14 | 4,745 | 5,074 |
| California Public Works Board Lease Rev. | 5.000% | 11/1/16 | 6,395 | 6,897 |
| California Public Works Board Lease Rev. | 5.000% | 11/1/18 | 4,000 | 4,260 |
| California Public Works Board Lease Rev. | 5.250% | 11/1/20 | 5,000 | 5,292 |
| California Public Works Board Lease Rev. | | | | |
| (Butterfield) | 5.000% | 6/1/20 | 3,895 | 3,988 |
| California Public Works Board Lease Rev. | | | | |
| (California State Univ.) | 5.300% | 10/1/15 (2) | 6,655 | 6,665 |
| California Public Works Board Lease Rev. | | | | |
| (Dept. of Corrections) | 5.000% | 6/1/11 | 3,500 | 3,641 |
| California Public Works Board Lease Rev. | | | | |
| (Dept. of Corrections) | 5.000% | 6/1/12 | 5,000 | 5,338 |
| California Public Works Board Lease Rev. | | | | |
| (Dept. of Corrections) | 5.000% | 12/1/12 (14) | 10,625 | 11,455 |
| California Public Works Board Lease Rev. | | | | |
| (Dept. of Corrections) | 5.000% | 1/1/18 (2) | 27,790 | 29,212 |
| California Public Works Board Lease Rev. | | | | |
| (Dept. of Corrections) | 5.000% | 1/1/21 | 3,975 | 4,050 |
| California Public Works Board Lease Rev. | | | | |
| (Dept. of Corrections) | 5.500% | 6/1/21 | 10,000 | 10,278 |
| California Public Works Board Lease Rev. | | | | |
| (Dept. of Corrections) | 5.500% | 6/1/22 | 10,000 | 10,256 |
| California Public Works Board Lease Rev. | | | | |
| (Dept. of General Services) | 6.000% | 4/1/27 | 5,000 | 5,328 |
| California Public Works Board Lease Rev. | | | | |
| (Dept. of Mental Health) | 5.500% | 6/1/15 | 1,500 | 1,625 |
| California Public Works Board Lease Rev. | | | | |
| (Dept. of Mental Health) | 5.500% | 6/1/17 | 8,000 | 8,460 |
| California Public Works Board Lease Rev. | | | | |
| (Dept. of Mental Health) | 5.500% | 6/1/18 | 5,000 | 5,249 |
| California Public Works Board Lease Rev. | | | | |
| (Regents of the Univ. of California) | 5.000% | 6/1/18 (14) | 10,310 | 11,463 |
| California Public Works Board Lease Rev. | | | | |
| (Regents of the Univ. of California) | 5.000% | 6/1/20 (14) | 7,670 | 8,490 |
| California Public Works Board Lease Rev. | | | | |
| (Univ. of California) | 5.500% | 6/1/14 | 9,750 | 10,542 |
| California Public Works Board Lease Rev. | | | | |
| (Univ. of California) | 5.375% | 10/1/16 (14) | 4,750 | 4,767 |
| California Public Works Board Lease Rev. | | | | |
| (Univ. of California) | 5.000% | 4/1/25 | 5,765 | 5,914 |
| California Public Works Board Lease Rev. | | | | |
| (Univ. of California) | 5.250% | 11/1/26 (14) | 9,010 | 9,451 |
| California State Dept. of Water Resources | | | | |
| Power Supply Rev. | 5.500% | 5/1/11 | 7,000 | 7,315 |
| California State Dept. of Water Resources | | | | |
| Power Supply Rev. | 6.000% | 5/1/12 (Prere.) | 12,500 | 13,912 |
| California State Dept. of Water Resources | | | | |
| Power Supply Rev. | 5.500% | 5/1/13 (2) | 18,335 | 20,094 |
| California State Dept. of Water Resources | | | | |
| Power Supply Rev. | 6.000% | 5/1/13 | 13,970 | 15,480 |
| California State Dept. of Water Resources | | | | |
| Power Supply Rev. | 5.000% | 5/1/16 | 5,000 | 5,660 |
35
| | | | |
| California Intermediate-Term Tax-Exempt Fund | | | | |
| |
| |
| |
| | | | Face | Market |
| | | Maturity | Amount | Value• |
| | Coupon | Date | ($000) | ($000) |
| California State Dept. of Water Resources | | | | |
| Power Supply Rev. | 5.000% | 5/1/17 | 25,000 | 28,312 |
| California State Dept. of Water Resources | | | | |
| Power Supply Rev. | 5.000% | 5/1/18 | 4,400 | 4,996 |
| California State Dept. of Water Resources | | | | |
| Power Supply Rev. | 5.000% | 5/1/18 | 10,000 | 11,354 |
| California State Dept. of Water Resources | | | | |
| Power Supply Rev. | 5.000% | 5/1/19 | 15,000 | 17,003 |
| California State Dept. of Water Resources | | | | |
| Power Supply Rev. | 5.000% | 5/1/20 | 10,000 | 11,317 |
| California State Dept. of Water Resources | | | | |
| Power Supply Rev. | 5.000% | 5/1/21 | 5,000 | 5,590 |
| California State Dept. of Water Resources | | | | |
| Power Supply Rev. | 5.000% | 5/1/21 | 50,000 | 54,874 |
| California State Dept. of Water Resources | | | | |
| Power Supply Rev. | 5.000% | 5/1/21 | 20,000 | 21,950 |
| California State Dept. of Water Resources | | | | |
| Power Supply Rev. | 5.000% | 5/1/22 | 14,675 | 16,006 |
| California State Econ. Recovery Bonds | 5.250% | 7/1/13 | 74,420 | 83,035 |
| California State Econ. Recovery Bonds | 5.250% | 7/1/14 (ETM) | 3,385 | 3,928 |
| California State Econ. Recovery Bonds | 5.250% | 7/1/14 | 11,615 | 13,179 |
| California State Econ. Recovery Bonds | 5.250% | 7/1/14 (14) | 5,155 | 5,849 |
| California State Econ. Recovery Bonds | 5.000% | 7/1/17 (14) | 28,000 | 29,080 |
| California State Econ. Recovery Bonds | 5.000% | 7/1/18 | 27,090 | 30,738 |
| California State Econ. Recovery Bonds | 5.000% | 7/1/19 | 28,530 | 32,145 |
| California State Econ. Recovery Bonds | 5.000% | 7/1/20 | 32,600 | 36,325 |
| California State Econ. Recovery Bonds | 5.250% | 7/1/21 | 45,385 | 50,866 |
| California State Econ. Recovery Bonds | 5.000% | 7/1/22 | 16,280 | 17,283 |
| California State Univ. Rev. Systemwide | 5.375% | 11/1/14 (14) | 5,390 | 5,951 |
| California State Univ. Rev. Systemwide | 5.000% | 11/1/22 (2) | 18,440 | 19,488 |
| California State Univ. Rev. Systemwide | 5.000% | 11/1/24 | 8,690 | 9,287 |
| California State Univ. Rev. Systemwide | 5.000% | 11/1/25 | 11,820 | 12,566 |
| California State Univ. Rev. Systemwide | 5.000% | 11/1/26 | 12,530 | 13,225 |
| California State Univ. Rev. Systemwide | 5.000% | 11/1/27 | 5,000 | 5,233 |
| California Statewide Communities Dev. Auth. | | | | |
| PCR (Southern California Edison) PUT | 4.250% | 11/1/16 (3) | 15,000 | 15,114 |
| California Statewide Communities Dev. Auth. | | | | |
| PCR (Southern California Edison) PUT | 4.250% | 11/1/16 (3) | 25,000 | 25,373 |
| California Statewide Communities Dev. Auth. Rev. | 5.000% | 6/15/13 | 28,000 | 30,454 |
| California Statewide Communities Dev. Auth. Rev. | 4.500% | 7/1/18 (4) | 14,670 | 15,320 |
| California Statewide Communities Dev. Auth. Rev. | | | | |
| (Adventist Health) | 5.000% | 3/1/25 | 14,975 | 15,085 |
| California Statewide Communities Dev. Auth. Rev. | | | | |
| (Children’s Hosp. of Los Angeles) COP | 6.000% | 6/1/11 (14) | 2,365 | 2,455 |
| California Statewide Communities Dev. Auth. Rev. | | | | |
| (Daughters of Charity Health) | 5.250% | 7/1/11 | 1,885 | 1,936 |
| California Statewide Communities Dev. Auth. Rev. | | | | |
| (Daughters of Charity Health) | 5.250% | 7/1/12 | 1,500 | 1,569 |
| California Statewide Communities Dev. Auth. Rev. | | | | |
| (Daughters of Charity Health) | 5.250% | 7/1/13 | 1,250 | 1,312 |
| California Statewide Communities Dev. Auth. Rev. | | | | |
| (Daughters of Charity Health) | 5.000% | 7/1/22 | 5,155 | 4,956 |
| California Statewide Communities Dev. Auth. Rev. | | | | |
| (Daughters of Charity Health) | 5.250% | 7/1/24 | 5,000 | 4,751 |
| California Statewide Communities Dev. Auth. Rev. | | | | |
| (Daughters of Charity Health) | 5.250% | 7/1/25 | 2,200 | 2,071 |
36
| | | | |
| California Intermediate-Term Tax-Exempt Fund | | | | |
| |
| |
| |
| | | | Face | Market |
| | | Maturity | Amount | Value• |
| | Coupon | Date | ($000) | ($000) |
| California Statewide Communities Dev. Auth. | | | | |
| Rev. (Huntington Memorial Hosp.) | 5.000% | 7/1/18 | 6,190 | 6,389 |
| California Statewide Communities Dev. Auth. | | | | |
| Rev. (Irvine Univ. of California East LLC) | 5.500% | 5/15/26 | 5,000 | 5,093 |
| California Statewide Communities Dev. Auth. | | | | |
| Rev. (Kaiser Permanente) | 5.000% | 4/1/16 | 6,970 | 7,696 |
| California Statewide Communities Dev. Auth. | | | | |
| Rev. (Kaiser Permanente) | 5.000% | 4/1/19 | 3,900 | 4,228 |
| California Statewide Communities Dev. Auth. | | | | |
| Rev. (Kaiser Permanente) PUT | 3.450% | 5/1/11 | 8,750 | 8,959 |
| California Statewide Communities Dev. Auth. | | | | |
| Rev. (Lodi Memorial Hosp.) | 5.000% | 12/1/22 | 8,000 | 7,993 |
| California Statewide Communities Dev. Auth. | | | | |
| Rev. (Los Angeles County Museum) VRDO | 0.240% | 6/7/10 LOC | 15,500 | 15,500 |
| California Statewide Communities Dev. Auth. | | | | |
| Rev. (Los Angeles Orthopedic Hosp. Foundation) | 5.125% | 6/1/13 (2) | 1,530 | 1,532 |
| California Statewide Communities Dev. Auth. | | | | |
| Rev. (Los Angeles Orthopedic Hosp. Foundation) | 5.250% | 6/1/14 (2) | 1,610 | 1,612 |
| California Statewide Communities Dev. Auth. | | | | |
| Rev. (Memorial Health Services) | 6.000% | 10/1/13 | 6,920 | 7,674 |
| California Statewide Communities Dev. Auth. | | | | |
| Rev. (Memorial Health Services) | 6.000% | 10/1/14 | 5,335 | 5,854 |
| California Statewide Communities Dev. Auth. | | | | |
| Rev. (Memorial Health Services) | 6.000% | 10/1/15 | 7,780 | 8,452 |
| California Statewide Communities Dev. Auth. | | | | |
| Rev. (Memorial Health Services) | 6.000% | 10/1/23 | 10,000 | 10,440 |
| California Statewide Communities Dev. Auth. | | | | |
| Rev. (Presbyterian Homes) | 7.000% | 11/15/29 | 2,000 | 2,155 |
| California Statewide Communities Dev. Auth. | | | | |
| Rev. (Redlands Community Hosp.) VRDO | 0.290% | 6/7/10 LOC | 5,500 | 5,500 |
| California Statewide Communities Dev. Auth. | | | | |
| Rev. (Sherman Oaks Foundation) | 5.500% | 8/1/15 (2) | 4,685 | 5,115 |
| 1 California Statewide Communities Dev. Auth. Rev. | | | | |
| (Sutter Health) TOB VRDO | 0.290% | 6/7/10 | 14,140 | 14,140 |
| Central CA USD GO | 5.500% | 8/1/29 (12) | 3,000 | 3,275 |
| Central Valley CA Financing Auth. Cogeneration | | | | |
| Project Rev. (Carson Ice) | 5.000% | 7/1/17 | 1,000 | 1,108 |
| Central Valley CA Financing Auth. Cogeneration | | | | |
| Project Rev. (Carson Ice) | 5.000% | 7/1/19 | 765 | 844 |
| Central Valley CA Financing Auth. Cogeneration | | | | |
| Project Rev. (Carson Ice) | 5.250% | 7/1/20 | 1,025 | 1,146 |
| Chabot-Las Positas CA Community College Dist. | 5.000% | 8/1/29 (2) | 5,335 | 5,466 |
| Chino Basin CA Regional Financing Auth. Rev. | | | | |
| (Muni. Water Dist. Sewer System) | 6.500% | 8/1/10 (2) | 3,095 | 3,128 |
| Clovis CA USD GO | 0.000% | 8/1/12 (14) | 4,715 | 4,537 |
| Clovis CA USD GO | 0.000% | 8/1/18 (14) | 3,645 | 2,580 |
| Compton CA USD GO | 5.250% | 9/1/13 (14)(Prere.) | 1,645 | 1,870 |
| Compton CA USD GO | 5.250% | 9/1/13 (14)(Prere.) | 1,295 | 1,472 |
| Compton CA USD GO | 5.250% | 9/1/13 (14)(Prere.) | 1,460 | 1,659 |
| Contra Costa County CA Public Financing | | | | |
| Lease Rev. | 5.000% | 6/1/22 (14) | 15,300 | 15,903 |
| Corona-Norco CA USD | 0.000% | 8/1/20 (12) | 1,825 | 1,126 |
| Corona-Norco CA USD | 0.000% | 8/1/21 (12) | 2,010 | 1,156 |
| Corona-Norco CA USD | 0.000% | 8/1/22 (12) | 1,700 | 884 |
| Corona-Norco CA USD | 0.000% | 8/1/23 (12) | 1,000 | 487 |
| Corona-Norco CA USD | 0.000% | 8/1/25 (12) | 1,325 | 564 |
37
| | | | |
| California Intermediate-Term Tax-Exempt Fund | | | | |
| |
| |
| |
| | | | Face | Market |
| | | Maturity | Amount | Value• |
| | Coupon | Date | ($000) | ($000) |
| Corona-Norco CA USD | 0.000% | 8/1/26 (12) | 1,530 | 606 |
| Corona-Norco CA USD | 0.000% | 8/1/27 (12) | 1,500 | 552 |
| Corona-Norco CA USD | 0.000% | 8/1/28 (12) | 1,290 | 443 |
| Culver City CA Redev. Financing Auth. | 5.375% | 11/1/16 (4) | 3,260 | 3,336 |
| East Bay CA Regional Park Dist. Rev. | 5.000% | 9/1/28 | 4,415 | 4,861 |
| Eastern California Muni. Water. Dist. Water & | | | | |
| Sewer COP | 5.000% | 7/1/26 | 5,245 | 5,575 |
| Eastern California Muni. Water. Dist. Water & | | | | |
| Sewer COP | 5.000% | 7/1/27 | 6,220 | 6,567 |
| Eastern California Muni. Water. Dist. Water & | | | | |
| Sewer COP | 5.000% | 7/1/28 | 1,000 | 1,048 |
| Fontana CA Public Finance Auth. Subordinate | | | | |
| Lien Tax Allocation Rev. Bonds | 5.000% | 10/1/21 (2) | 3,335 | 3,354 |
| Fontana CA Public Finance Auth. Subordinate | | | | |
| Lien Tax Allocation Rev. Bonds | 5.000% | 10/1/23 (2) | 2,875 | 2,846 |
| Fontana CA Public Finance Auth. Subordinate | | | | |
| Lien Tax Allocation Rev. Bonds | 5.000% | 10/1/24 (2) | 3,475 | 3,412 |
| Fontana CA Public Finance Auth. Subordinate | | | | |
| Lien Tax Allocation Rev. Bonds | 5.000% | 10/1/26 (2) | 4,480 | 4,334 |
| Fontana CA USD | 5.250% | 8/1/26 (4) | 4,350 | 4,682 |
| Foothill-De Anza CA Community College Dist. GO | 6.000% | 8/1/11 | 1,330 | 1,356 |
| Foothill/Eastern Corridor Agency California | | | | |
| Toll Road Rev. | 5.250% | 1/15/13 (14) | 5,000 | 5,052 |
| Foothill/Eastern Corridor Agency California | | | | |
| Toll Road Rev. | 5.375% | 1/15/15 (14) | 5,000 | 5,005 |
| Foothill/Eastern Corridor Agency California | | | | |
| Toll Road Rev. | 0.000% | 1/1/27 (ETM) | 10,000 | 4,969 |
| Foothill/Eastern Corridor Agency California | | | | |
| Toll Road Rev. | 0.000% | 1/1/28 (ETM) | 7,655 | 3,609 |
| Fresno CA Sewer Rev. | 5.000% | 9/1/24 (12) | 830 | 902 |
| Golden State Tobacco | | | | |
| Securitization Corp. California | 5.000% | 6/1/13 (2)(Prere.) | 1,930 | 2,141 |
| Golden State Tobacco | | | | |
| Securitization Corp. California | 5.500% | 6/1/13 (Prere.) | 3,550 | 3,991 |
| Golden State Tobacco | | | | |
| Securitization Corp. California | 5.500% | 6/1/13 (3)(Prere.) | 5,000 | 5,621 |
| Golden State Tobacco | | | | |
| Securitization Corp. California | 6.250% | 6/1/13 (Prere.) | 78,395 | 87,316 |
| Golden State Tobacco | | | | |
| Securitization Corp. California | 7.800% | 6/1/13 (Prere.) | 25,170 | 29,914 |
| Golden State Tobacco | | | | |
| Securitization Corp. California | 4.500% | 6/1/27 | 54,435 | 49,028 |
| Golden State Tobacco | | | | |
| Securitization Corp. California | 5.000% | 6/1/33 | 17,500 | 13,862 |
| Golden State Tobacco | | | | |
| Securitization Corp. California | 0.000% | 6/1/37 | 30,000 | 19,213 |
| Grossmont CA Union High School Dist. GO | 0.000% | 8/1/28 | 3,210 | 1,124 |
| Grossmont CA Union High School Dist. GO | 0.000% | 8/1/29 | 6,965 | 2,280 |
| Grossmont-Cuyamaca CA Community College | | | | |
| Dist. Capital Appreciation | 0.000% | 8/1/25 (12) | 14,010 | 6,328 |
| Grossmont-Cuyamaca CA Community College | | | | |
| Dist. Capital Appreciation | 0.000% | 8/1/28 (12) | 21,875 | 7,943 |
| Huntington Beach CA Union High School Dist. GO | 5.000% | 8/1/27 (4) | 3,530 | 3,658 |
| Inland Empire Tobacco Securitization Auth. | | | | |
| California Rev. | 4.625% | 6/1/21 | 9,240 | 7,422 |
38
| | | | |
| California Intermediate-Term Tax-Exempt Fund | | | | |
| |
| |
| |
| | | | Face | Market |
| | | Maturity | Amount | Value• |
| | Coupon | Date | ($000) | ($000) |
| Intermodal Container Transfer Fac. Joint | | | | |
| Power Auth. California Rev. | 5.000% | 11/1/10 (2) | 1,470 | 1,496 |
| Intermodal Container Transfer Fac. Joint | | | | |
| Power Auth. California Rev. | 5.000% | 11/1/11 (2) | 1,665 | 1,761 |
| Intermodal Container Transfer Fac. Joint | | | | |
| Power Auth. California Rev. | 5.125% | 11/1/12 (2) | 2,540 | 2,784 |
| Intermodal Container Transfer Fac. Joint | | | | |
| Power Auth. California Rev. | 5.125% | 11/1/13 (2) | 1,870 | 2,097 |
| Irvine CA Public Fac. & Infrastructure Auth. | | | | |
| Assessment Rev. | 4.600% | 9/2/15 (2) | 2,925 | 2,969 |
| Irvine CA Public Fac. & Infrastructure Auth. | | | | |
| Assessment Rev. | 4.700% | 9/2/16 (2) | 3,045 | 3,075 |
| Irvine CA USD Financing Auth. Special Tax | 5.000% | 9/1/25 (2) | 8,645 | 8,517 |
| Kings River Conservation Dist. California COP | 5.000% | 5/1/12 | 2,715 | 2,854 |
| Kings River Conservation Dist. California COP | 5.000% | 5/1/13 | 2,315 | 2,475 |
| Kings River Conservation Dist. California COP | 5.000% | 5/1/14 | 3,500 | 3,779 |
| Kings River Conservation Dist. California COP | 5.000% | 5/1/15 (ETM) | 2,590 | 2,995 |
| Kings River Conservation Dist. California COP | 5.000% | 5/1/15 | 1,755 | 1,901 |
| Loma Linda CA Hosp. Rev. (Loma Linda Univ.) | 5.000% | 12/1/18 | 8,665 | 8,710 |
| Long Beach CA Community College Dist. GO | 0.000% | 6/1/29 (4) | 6,380 | 2,180 |
| Long Beach CA Finance Auth. Lease Rev. | 6.000% | 11/1/10 (2) | 3,860 | 3,938 |
| Long Beach CA Finance Auth. Lease Rev. | 6.000% | 11/1/17 (2) | 3,670 | 4,013 |
| Long Beach CA Finance Auth. Lease Rev. | | | | |
| (Aquarium of the South Pacific) | 5.500% | 11/1/14 (2) | 3,435 | 3,529 |
| Long Beach CA Finance Auth. Natural Gas | | | | |
| Purchase Rev. | 5.250% | 11/15/20 | 3,000 | 3,038 |
| Long Beach CA Finance Auth. Rev. | 1.702% | 11/15/25 | 16,845 | 13,476 |
| Long Beach CA Finance Auth. Rev. | 1.722% | 11/15/26 | 22,025 | 17,262 |
| Los Angeles CA Community College Dist. GO | 5.000% | 8/1/21 (4) | 10,000 | 10,718 |
| Los Angeles CA Community College Dist. GO | 5.000% | 8/1/24 | 6,500 | 7,033 |
| Los Angeles CA Community College Dist. GO | 5.000% | 8/1/25 | 5,000 | 5,371 |
| Los Angeles CA Community College Dist. GO | 5.500% | 8/1/25 | 5,000 | 5,608 |
| Los Angeles CA Community College Dist. GO | 5.000% | 8/1/26 | 6,630 | 7,064 |
| Los Angeles CA Community College Dist. GO | 5.000% | 8/1/27 | 4,250 | 4,498 |
| Los Angeles CA Community College Dist. GO | 5.000% | 8/1/27 | 6,960 | 7,407 |
| Los Angeles CA Convention & Exhibit Center | | | | |
| Auth. Lease Rev. | 6.000% | 8/15/10 (14) | 10,975 | 11,102 |
| Los Angeles CA Convention & Exhibit Center | | | | |
| Auth. Lease Rev. | 6.125% | 8/15/11 (14) | 1,300 | 1,385 |
| Los Angeles CA COP | 5.000% | 4/1/14 (2) | 1,435 | 1,507 |
| Los Angeles CA COP | 5.000% | 4/1/15 (2) | 1,560 | 1,625 |
| Los Angeles CA COP | 5.000% | 4/1/16 (2) | 1,725 | 1,785 |
| Los Angeles CA COP | 5.000% | 4/1/18 (2) | 1,950 | 2,002 |
| Los Angeles CA Dept. of Airports International | | | | |
| Airport Rev. | 5.000% | 5/15/13 (14) | 10,500 | 11,709 |
| Los Angeles CA Dept. of Airports International | | | | |
| Airport Rev. | 5.000% | 5/15/24 | 4,000 | 4,276 |
| Los Angeles CA Dept. of Airports International | | | | |
| Airport Rev. | 5.250% | 5/15/25 | 3,000 | 3,232 |
| Los Angeles CA Dept. of Airports International | | | | |
| Airport Rev. | 5.000% | 5/15/30 | 10,000 | 10,504 |
| Los Angeles CA Dept. of Water & Power Rev. | 5.000% | 7/1/23 (4) | 20,605 | 22,425 |
| Los Angeles CA Dept. of Water & Power Rev. | 5.000% | 7/1/23 | 1,335 | 1,495 |
| Los Angeles CA Dept. of Water & Power Rev. | 5.000% | 7/1/24 | 2,770 | 3,052 |
| Los Angeles CA Dept. of Water & Power Rev. | 5.000% | 7/1/26 | 2,000 | 2,151 |
| Los Angeles CA Dept. of Water & Power Rev. | 5.000% | 7/1/26 | 2,350 | 2,559 |
39
| | | | |
| California Intermediate-Term Tax-Exempt Fund | | | | |
| |
| |
| |
| | | | Face | Market |
| | | Maturity | Amount | Value• |
| | Coupon | Date | ($000) | ($000) |
| Los Angeles CA Dept. of Water & Power Rev. | 5.000% | 7/1/27 | 5,000 | 5,360 |
| Los Angeles CA Dept. of Water & Power Rev. | 5.000% | 7/1/27 | 1,655 | 1,807 |
| Los Angeles CA Dept. of Water & Power Rev. | 5.000% | 7/1/28 | 2,000 | 2,173 |
| Los Angeles CA Dept. of Water & Power Rev. | 5.000% | 7/1/29 | 1,670 | 1,804 |
| Los Angeles CA GO | 5.250% | 9/1/12 (3) | 2,000 | 2,194 |
| Los Angeles CA GO | 5.000% | 9/1/19 (14) | 4,055 | 4,472 |
| Los Angeles CA Muni. Improvement Corp. | | | | |
| Lease Rev. | 5.000% | 9/1/12 (14) | 7,480 | 8,096 |
| Los Angeles CA Muni. Improvement Corp. | | | | |
| Lease Rev. | 5.000% | 8/1/25 (14) | 7,725 | 7,811 |
| Los Angeles CA Muni. Improvement Corp. | | | | |
| Lease Rev. | 5.000% | 8/1/28 (14) | 8,980 | 9,091 |
| Los Angeles CA Muni. Improvement Corp. | | | | |
| Lease Rev. (Police Headquarters Fac.) | 5.000% | 1/1/21 (14) | 10,830 | 11,305 |
| Los Angeles CA Muni. Improvement Corp. | | | | |
| Lease Rev. (Police Headquarters Fac.) | 5.000% | 1/1/22 (14) | 6,500 | 6,740 |
| Los Angeles CA Muni. Improvement Corp. | | | | |
| Lease Rev. (Police Headquarters Fac.) | 5.000% | 1/1/23 (14) | 14,700 | 15,123 |
| Los Angeles CA USD GO | 5.500% | 7/1/12 (14) | 5,240 | 5,733 |
| Los Angeles CA USD GO | 6.000% | 7/1/12 (3) | 1,470 | 1,621 |
| Los Angeles CA USD GO | 5.000% | 7/1/13 (4) | 4,650 | 5,179 |
| Los Angeles CA USD GO | 5.000% | 7/1/13 | 5,000 | 5,560 |
| Los Angeles CA USD GO | 5.000% | 7/1/13 (4)(Prere.) | 3,900 | 4,383 |
| Los Angeles CA USD GO | 6.000% | 7/1/13 (3) | 3,745 | 4,266 |
| Los Angeles CA USD GO | 5.000% | 7/1/14 (4)(ETM) | 5,000 | 5,743 |
| Los Angeles CA USD GO | 5.000% | 7/1/14 | 5,000 | 5,620 |
| Los Angeles CA USD GO | 6.000% | 7/1/14 (3) | 1,440 | 1,669 |
| Los Angeles CA USD GO | 5.000% | 7/1/15 | 6,350 | 7,186 |
| Los Angeles CA USD GO | 5.000% | 7/1/16 (3) | 2,000 | 2,263 |
| Los Angeles CA USD GO | 5.000% | 7/1/16 (4) | 3,000 | 3,284 |
| Los Angeles CA USD GO | 5.000% | 7/1/17 (4) | 5,000 | 5,454 |
| Los Angeles CA USD GO | 5.000% | 7/1/17 (4) | 3,765 | 4,327 |
| Los Angeles CA USD GO | 5.000% | 7/1/17 | 19,090 | 21,715 |
| Los Angeles CA USD GO | 5.500% | 7/1/17 (3) | 5,000 | 5,833 |
| Los Angeles CA USD GO | 5.000% | 7/1/18 (2) | 5,000 | 5,638 |
| Los Angeles CA USD GO | 5.000% | 7/1/18 (2) | 4,000 | 4,421 |
| Los Angeles CA USD GO | 5.000% | 7/1/18 | 8,360 | 9,495 |
| Los Angeles CA USD GO | 5.000% | 7/1/19 (3) | 5,000 | 5,464 |
| Los Angeles CA USD GO | 5.000% | 7/1/19 (3) | 5,000 | 5,437 |
| Los Angeles CA USD GO | 5.000% | 7/1/20 (2) | 14,135 | 15,313 |
| Los Angeles CA USD GO | 5.000% | 7/1/20 (3) | 5,000 | 5,411 |
| Los Angeles CA USD GO | 5.000% | 7/1/20 (3) | 10,000 | 10,822 |
| Los Angeles CA USD GO | 5.000% | 7/1/21 (2) | 15,940 | 17,214 |
| Los Angeles CA USD GO | 5.000% | 7/1/22 (2) | 16,760 | 17,976 |
| Los Angeles CA USD GO | 4.500% | 7/1/23 (4) | 30,825 | 31,605 |
| Los Angeles CA USD GO | 5.000% | 7/1/23 (2) | 6,000 | 6,457 |
| Los Angeles CA USD GO | 5.000% | 7/1/23 (4) | 12,975 | 13,964 |
| Los Angeles CA USD GO | 5.000% | 7/1/24 (4) | 17,210 | 18,394 |
| Los Angeles CA USD GO | 5.000% | 7/1/25 (2) | 10,235 | 10,789 |
| Los Angeles CA USD GO | 5.250% | 7/1/25 | 1,600 | 1,752 |
| Los Angeles CA USD GO | 4.500% | 7/1/26 (2) | 10,000 | 9,977 |
| Los Angeles CA USD GO | 5.000% | 7/1/26 | 5,710 | 6,056 |
| Los Angeles CA USD GO | 4.500% | 1/1/28 (14) | 7,725 | 7,496 |
| Los Angeles CA USD GO | 5.000% | 7/1/28 (2) | 7,845 | 8,098 |
| Los Angeles CA USD GO | 5.250% | 7/1/28 | 5,000 | 5,377 |
| Los Angeles CA USD GO | 5.000% | 7/1/30 (2) | 6,485 | 6,645 |
40
| | | | |
| California Intermediate-Term Tax-Exempt Fund | | | | |
| |
| |
| |
| | | | Face | Market |
| | | Maturity | Amount | Value• |
| | Coupon | Date | ($000) | ($000) |
| Los Angeles CA Wastewater System Rev. | 5.000% | 6/1/26 (14) | 26,785 | 28,155 |
| Los Angeles County CA Capital Asset | | | | |
| Leasing Corp. Rev. | 6.000% | 12/1/11 (2) | 2,360 | 2,492 |
| Los Angeles County CA Capital Asset | | | | |
| Leasing Corp. Rev. | 6.000% | 12/1/13 (2) | 2,760 | 3,029 |
| Los Angeles County CA Metro. Transp. | | | | |
| Auth. Sales Tax Rev. | 6.000% | 7/1/11 (2) | 2,745 | 2,910 |
| Los Angeles County CA Metro. Transp. | | | | |
| Auth. Sales Tax Rev. | 5.000% | 7/1/13 (12) | 1,450 | 1,624 |
| Los Angeles County CA Metro. Transp. | | | | |
| Auth. Sales Tax Rev. | 5.000% | 7/1/17 (4) | 10,000 | 10,956 |
| Los Angeles County CA Public Works | | | | |
| Financing Auth. Rev. | 5.000% | 12/1/14 (14) | 24,180 | 26,307 |
| Los Angeles County CA Public Works | | | | |
| Financing Auth. Rev. | 5.000% | 12/1/15 (14) | 8,540 | 9,274 |
| Los Angeles County CA Public Works | | | | |
| Financing Auth. Rev. | 5.250% | 10/1/17 (4) | 1,000 | 1,168 |
| Los Angeles County CA Public Works | | | | |
| Financing Auth. Rev. | 5.000% | 12/1/19 (14) | 4,860 | 5,032 |
| Los Angeles County CA Public Works | | | | |
| Financing Auth. Rev. | 5.000% | 12/1/20 (14) | 6,155 | 6,334 |
| Los Angeles County CA Public Works | | | | |
| Financing Auth. Rev. | 5.000% | 12/1/21 (14) | 6,460 | 6,623 |
| Los Angeles County CA Public Works | | | | |
| Financing Auth. Rev. | 5.000% | 12/1/22 (14) | 6,790 | 6,908 |
| Los Angeles County CA Public Works | | | | |
| Financing Auth. Rev. | 5.000% | 12/1/23 (14) | 2,175 | 2,204 |
| Los Angeles County CA Public Works | | | | |
| Financing Auth. Rev. | 5.000% | 12/1/24 (14) | 3,095 | 3,119 |
| Los Angeles County CA Schools COP | 0.000% | 8/1/11 (2)(ETM) | 1,945 | 1,889 |
| Los Angeles County CA Schools COP | 0.000% | 8/1/13 (2)(ETM) | 2,010 | 1,803 |
| M-S-R California Energy Auth. Rev. | 7.000% | 11/1/34 | 7,000 | 8,181 |
| M-S-R California Public Power Agency Rev. | | | | |
| (San Juan Project) | 5.000% | 7/1/13 (14) | 1,500 | 1,555 |
| M-S-R California Public Power Agency Rev. | | | | |
| (San Juan Project) | 6.750% | 7/1/20 (14)(ETM) | 2,075 | 2,531 |
| Metro. Water Dist. of Southern California | | | | |
| Waterworks Rev. | 5.000% | 1/1/31 | 1,150 | 1,235 |
| Modesto CA Irrigation Dist. COP | 5.000% | 7/1/17 (14) | 3,165 | 3,324 |
| Modesto CA Irrigation Dist. COP | 5.000% | 10/1/21 (2) | 2,030 | 2,150 |
| Modesto CA Irrigation Dist. COP | 5.000% | 10/1/22 (2) | 2,515 | 2,646 |
| Modesto CA Irrigation Dist. COP | 5.000% | 10/1/23 (2) | 2,645 | 2,764 |
| Modesto CA Irrigation Dist. COP | 5.000% | 7/1/27 | 3,855 | 3,984 |
| Modesto CA Irrigation Dist. Finance Auth. Rev. | 5.125% | 9/1/15 (2) | 4,365 | 4,386 |
| New Haven CA USD GO | 12.000% | 8/1/12 (4)(ETM) | 600 | 741 |
| New Haven CA USD GO | 12.000% | 8/1/12 (4) | 2,840 | 3,511 |
| New Haven CA USD GO | 12.000% | 8/1/15 (4) | 2,905 | 4,315 |
| Newark CA USD GO | 0.000% | 8/1/10 (4) | 1,000 | 999 |
| Newport Beach CA Rev. | | | | |
| (Hoag Memorial Hosp.) PUT | 5.000% | 2/7/13 | 5,000 | 5,412 |
| Northern California Gas Auth. No. 1 Rev. | 0.645% | 7/1/13 | 19,770 | 18,633 |
| Northern California Gas Auth. No. 1 Rev. | 0.795% | 7/1/17 | 23,385 | 20,140 |
| Northern California Power Agency Rev. | 5.000% | 7/1/16 | 1,745 | 1,956 |
| Northern California Power Agency Rev. | 5.000% | 7/1/17 | 3,290 | 3,670 |
| Northern California Power Agency Rev. | 5.000% | 8/1/17 | 1,500 | 1,668 |
| Northern California Power Agency Rev. | 5.000% | 8/1/18 | 2,140 | 2,369 |
41
| | | | |
| California Intermediate-Term Tax-Exempt Fund | | | | |
| |
| |
| |
| | | | Face | Market |
| | | Maturity | Amount | Value• |
| | Coupon | Date | ($000) | ($000) |
| Northern California Power Agency Rev. | 5.000% | 7/1/19 | 1,500 | 1,654 |
| Northern California Power Agency Rev. | 5.000% | 8/1/19 | 1,195 | 1,311 |
| Northern California Power Agency Rev. | 5.000% | 7/1/20 | 3,500 | 3,813 |
| Northern California Power Agency Rev. | 5.000% | 8/1/20 | 1,000 | 1,089 |
| Northern California Power Agency Rev. | 5.000% | 7/1/21 | 2,500 | 2,701 |
| Northern California Power Agency Rev. | 5.000% | 7/1/22 | 3,395 | 3,626 |
| Oakland CA COP | 5.000% | 4/1/11 (2) | 1,855 | 1,889 |
| Oakland CA Joint Powers Financing Auth. | | | | |
| Lease Rev. (Oakland Admin. Bldgs.) | 5.000% | 8/1/23 (12) | 5,000 | 5,238 |
| Oakland CA Joint Powers Financing Auth. | | | | |
| Lease Rev. (Oakland Admin. Bldgs.) | 5.000% | 8/1/24 (12) | 3,695 | 3,866 |
| Oakland CA Joint Powers Financing Auth. | | | | |
| Lease Rev. (Oakland Admin. Bldgs.) | 5.000% | 8/1/25 (12) | 5,405 | 5,625 |
| Oakland CA Joint Powers Financing Auth. | | | | |
| Lease Rev. (Oakland Admin. Bldgs.) | 5.000% | 8/1/26 (12) | 4,190 | 4,340 |
| Oakland CA Joint Powers Financing Auth. | | | | |
| Lease Rev. (Oakland Convention Center) | 5.500% | 10/1/12 (2) | 3,000 | 3,200 |
| Oakland CA Joint Powers Financing Auth. | | | | |
| Lease Rev. (Oakland Convention Center) | 5.500% | 10/1/13 (2) | 1,500 | 1,618 |
| Oakland CA Redev. Agency (Central Dist.) | 5.500% | 9/1/13 (14) | 3,990 | 4,230 |
| Oakland CA Redev. Agency (Central Dist.) | 5.500% | 9/1/15 (14) | 3,790 | 3,998 |
| Oakland CA Redev. Agency (Central Dist.) | 5.500% | 9/1/16 (14) | 6,210 | 6,484 |
| Oakland CA Redev. Agency (Central Dist.) | 5.000% | 9/1/20 (2) | 12,870 | 12,517 |
| Oakland CA USD GO | 5.000% | 8/1/19 (4) | 13,425 | 14,543 |
| Orange County CA Airport Rev. | 5.000% | 7/1/11 (4) | 3,165 | 3,309 |
| Orange County CA Airport Rev. | 5.000% | 7/1/17 (4) | 1,725 | 1,901 |
| Orange County CA Dev. Agency Tax Allocation | 5.250% | 9/1/14 (14) | 1,415 | 1,467 |
| Orange County CA Dev. Agency Tax Allocation | 5.250% | 9/1/15 (14) | 1,485 | 1,534 |
| Orange County CA Dev. Agency Tax Allocation | 5.375% | 9/1/16 (14) | 1,570 | 1,616 |
| Orange County CA Recovery COP | 6.000% | 6/1/10 (14)(ETM) | 3,800 | 3,802 |
| Palo Alto CA USD GO | 0.000% | 8/1/24 | 15,890 | 8,356 |
| Palomar Pomerado Health System California COP | 6.625% | 11/1/29 | 5,000 | 5,417 |
| Palomar Pomerado Health System California Rev. | 5.375% | 11/1/10 (14) | 2,670 | 2,675 |
| Palomar Pomerado Health System California Rev. | 5.375% | 11/1/12 (14) | 7,080 | 7,092 |
| Pasadena CA Electric Rev. | 5.000% | 6/1/17 (14) | 2,320 | 2,400 |
| Pasadena CA Electric Rev. | 5.000% | 6/1/18 (14) | 2,535 | 2,612 |
| Pomona CA Single Family Mortgage Rev. | 7.600% | 5/1/23 (ETM) | 11,065 | 14,514 |
| Port of Oakland CA Rev. | 5.000% | 11/1/11 (14) | 5,160 | 5,427 |
| Port of Oakland CA Rev. | 5.000% | 11/1/12 (14) | 2,650 | 2,866 |
| Port of Oakland CA Rev. | 5.000% | 11/1/19 (14) | 7,750 | 8,409 |
| Port of Oakland CA Rev. | 5.000% | 11/1/19 (14) | 8,000 | 8,680 |
| Port of Oakland CA Rev. | 5.000% | 11/1/20 (14) | 6,400 | 6,875 |
| Port of Oakland CA Rev. | 5.000% | 11/1/26 (14) | 9,700 | 10,034 |
| Poway CA USD GO | 0.000% | 8/1/17 | 2,000 | 1,528 |
| Poway CA USD GO | 0.000% | 8/1/18 | 4,565 | 3,281 |
| Poway CA USD GO | 0.000% | 8/1/19 | 5,425 | 3,684 |
| Poway CA USD GO | 0.000% | 8/1/20 | 3,280 | 1,959 |
| Poway CA USD GO | 0.000% | 8/1/28 | 9,070 | 3,175 |
| Rancho CA Water Dist. Finance Auth. Rev. | 5.500% | 11/1/16 (10) | 5,480 | 6,396 |
| Rancho CA Water Dist. Finance Auth. Rev. | 5.500% | 11/1/17 (10) | 5,855 | 6,836 |
| Rancho Cucamonga CA Redev. Agency | | | | |
| Tax Allocation (Rancho Redev.) | 5.000% | 9/1/10 (2) | 3,820 | 3,852 |
| Rancho Cucamonga CA Redev. Agency | | | | |
| Tax Allocation (Rancho Redev.) | 5.000% | 9/1/15 (2) | 2,835 | 3,022 |
| Rancho Cucamonga CA Redev. Agency | | | | |
| Tax Allocation (Rancho Redev.) | 5.000% | 9/1/16 (2) | 5,100 | 5,353 |
42
| | | | |
| California Intermediate-Term Tax-Exempt Fund | | | | |
| |
| |
| |
| | | | Face | Market |
| | | Maturity | Amount | Value• |
| | Coupon | Date | ($000) | ($000) |
| Rancho Mirage CA Joint Powers Financing | | | | |
| Auth. Rev. (Eisenhower Medical Center) | 5.000% | 7/1/27 | 12,000 | 11,442 |
| Riverside CA Electric Rev. | 5.000% | 10/1/24 (4) | 1,000 | 1,067 |
| Riverside CA Electric Rev. | 5.000% | 10/1/25 (4) | 2,000 | 2,119 |
| Riverside CA Electric Rev. | 5.000% | 10/1/26 (4) | 2,500 | 2,629 |
| Riverside CA Electric Rev. | 5.000% | 10/1/27 (4) | 3,570 | 3,728 |
| Riverside County CA IDA (Guy Evans Inc. | | | | |
| Project) VRDO | 0.270% | 6/7/10 LOC | 5,555 | 5,555 |
| 3 Riverside County CA Transp. Commission | | | | |
| Sales Tax Rev. VRDO | 0.270% | 6/7/10 | 38,230 | 38,230 |
| Rocklin CA USD | 0.000% | 8/1/23 (14) | 7,030 | 3,425 |
| Rocklin CA USD | 0.000% | 8/1/24 (14) | 2,965 | 1,349 |
| Roseville CA Natural Gas Financing Auth. | 5.000% | 2/15/18 | 3,180 | 3,249 |
| Roseville CA Natural Gas Financing Auth. | 5.000% | 2/15/19 | 10,000 | 10,123 |
| Roseville CA Natural Gas Financing Auth. | 5.000% | 2/15/20 | 2,000 | 2,000 |
| Sacramento CA Cogeneration Auth. Rev. | 5.000% | 7/1/17 | 1,250 | 1,398 |
| Sacramento CA Cogeneration Auth. Rev. | 5.000% | 7/1/18 | 725 | 811 |
| Sacramento CA Cogeneration Auth. Rev. | 5.000% | 7/1/19 | 900 | 1,004 |
| Sacramento CA Cogeneration Auth. Rev. | 5.250% | 7/1/20 | 1,250 | 1,417 |
| Sacramento CA Cogeneration Auth. Rev. | 5.250% | 7/1/21 | 1,000 | 1,133 |
| Sacramento CA Financing Auth. Lease Rev. | 5.375% | 12/1/12 (4)(Prere.) | 4,395 | 4,895 |
| Sacramento CA Financing Auth. Lease Rev. | 5.000% | 11/1/14 (14) | 3,555 | 3,736 |
| Sacramento CA Financing Auth. Lease Rev. | 5.375% | 12/1/14 (4) | 1,630 | 1,785 |
| Sacramento CA Financing Auth. Lease Rev. | 5.000% | 12/1/19 (14) | 12,860 | 13,467 |
| Sacramento CA Financing Auth. Lease Rev. | 5.000% | 12/1/20 (14) | 13,670 | 14,207 |
| Sacramento CA Muni. Util. Dist. | | | | |
| Financing Auth. Rev. | 5.000% | 7/1/21 (14) | 7,710 | 7,963 |
| Sacramento CA Muni. Util. Dist. Rev. | 6.250% | 8/15/10 (14)(ETM) | 10,030 | 10,155 |
| Sacramento CA Muni. Util. Dist. Rev. | 5.000% | 11/15/12 (14) | 2,185 | 2,383 |
| Sacramento CA Muni. Util. Dist. Rev. | 5.250% | 8/15/13 (4) | 1,000 | 1,049 |
| Sacramento CA Muni. Util. Dist. Rev. | 5.250% | 8/15/14 (4) | 2,500 | 2,610 |
| Sacramento CA Muni. Util. Dist. Rev. | 5.000% | 8/15/16 (4) | 7,800 | 9,062 |
| Sacramento CA Muni. Util. Dist. Rev. | 5.000% | 7/1/17 (14) | 4,000 | 4,270 |
| Sacramento CA Muni. Util. Dist. Rev. | 5.250% | 7/1/24 (2) | 10,000 | 10,957 |
| Sacramento County CA Airport Rev. | 5.000% | 7/1/23 (4) | 2,000 | 2,151 |
| Sacramento County CA Airport Rev. | 5.000% | 7/1/24 (4) | 2,500 | 2,664 |
| Sacramento County CA Airport Rev. | 5.000% | 7/1/24 (4) | 1,785 | 1,902 |
| Sacramento County CA Public Fac. | | | | |
| Finance Corp. COP (Main Detention Fac.) | 5.500% | 6/1/10 (14)(ETM) | 1,255 | 1,256 |
| Sacramento County CA Sanitation Dist. | | | | |
| Financing Auth. | 6.000% | 12/1/13 | 2,500 | 2,594 |
| Sacramento County CA Sanitation Dist. | | | | |
| Financing Auth. | 6.000% | 12/1/15 | 2,500 | 2,590 |
| Sacramento County CA Sanitation Dist. | | | | |
| Financing Auth. | 5.000% | 12/1/21 (14) | 1,850 | 2,003 |
| Sacramento County CA Sanitation Dist. | | | | |
| Financing Auth. | 5.000% | 12/1/22 (14) | 5,495 | 5,908 |
| Sacramento County CA Sanitation Dist. | | | | |
| Financing Auth. | 5.000% | 12/1/23 (14) | 7,030 | 7,515 |
| Sacramento County CA Sanitation Dist. | | | | |
| Financing Auth. | 5.000% | 12/1/36 (14) | 2,000 | 2,046 |
| Sacramento County CA Water Financing Auth. | | | | |
| Rev. Agency Zones | 5.000% | 6/1/13 (2)(Prere.) | 1,235 | 1,382 |
| San Bernardino CA Community College Dist. | 5.000% | 8/1/27 (4) | 11,580 | 12,111 |
| San Bernardino County CA Justice Center and | | | | |
| Airport COP | 5.000% | 7/1/14 (14) | 5,585 | 5,991 |
43
| | | | |
| California Intermediate-Term Tax-Exempt Fund | | | | |
| |
| |
| |
| | | | Face | Market |
| | | Maturity | Amount | Value• |
| | Coupon | Date | ($000) | ($000) |
| San Bernardino County CA Medical Center COP | 5.500% | 8/1/17 (14) | 5,250 | 5,415 |
| San Bernardino County CA Medical Center COP | 6.500% | 8/1/17 (14) | 5,000 | 5,346 |
| San Bernardino County CA Medical Center COP | 5.500% | 8/1/22 (14) | 8,940 | 9,511 |
| San Bernardino County CA Trans. Auth. | | | | |
| Sales Tax Rev. | 5.000% | 5/1/12 | 5,000 | 5,329 |
| San Diego CA Financing Auth. Lease Rev. | 5.250% | 4/1/12 (2) | 3,000 | 3,025 |
| San Diego CA Financing Auth. Lease Rev. | 5.250% | 4/1/14 (2) | 5,680 | 5,722 |
| San Diego CA Public Fac. Financing Auth. | | | | |
| Sewer Rev. | 5.000% | 5/15/19 | 5,000 | 5,698 |
| San Diego CA Public Fac. Financing Auth. | | | | |
| Sewer Rev. | 5.000% | 5/15/24 | 3,000 | 3,262 |
| San Diego CA Public Fac. Financing Auth. | | | | |
| Sewer Rev. | 5.250% | 5/15/25 | 2,000 | 2,198 |
| San Diego CA Public Fac. Financing Auth. | | | | |
| Sewer Rev. | 5.000% | 5/15/27 | 6,000 | 6,411 |
| San Diego CA Public Fac. Financing Auth. | | | | |
| Sewer Rev. | 5.000% | 5/15/28 | 1,825 | 1,943 |
| San Diego CA Public Fac. Financing Auth. | | | | |
| Water Rev. | 5.000% | 8/1/27 | 4,215 | 4,512 |
| San Diego CA Public Fac. Financing Auth. | | | | |
| Water Rev. | 5.125% | 8/1/28 | 5,000 | 5,357 |
| 1 San Diego CA Public Fac. Financing Auth. | | | | |
| Water Rev. TOB VRDO | 0.290% | 6/7/10 | 10,310 | 10,310 |
| San Diego CA USD GO | 0.000% | 7/1/14 (14) | 3,400 | 3,080 |
| San Diego CA USD GO | 5.500% | 7/1/17 (14) | 2,595 | 3,080 |
| San Diego CA USD GO | 0.000% | 7/1/18 (14) | 9,500 | 6,978 |
| San Diego CA USD GO | 5.500% | 7/1/20 (14) | 11,390 | 13,526 |
| San Diego CA USD GO | 5.500% | 7/1/20 (4) | 9,490 | 11,332 |
| San Diego CA USD GO | 5.500% | 7/1/21 (4) | 11,470 | 13,266 |
| San Diego CA USD GO | 5.500% | 7/1/22 (4) | 12,790 | 14,781 |
| San Diego CA USD GO | 5.500% | 7/1/23 (4) | 9,210 | 10,653 |
| San Diego CA USD GO | 0.000% | 7/1/26 | 8,425 | 3,700 |
| San Diego CA USD GO | 5.500% | 7/1/26 (4) | 7,490 | 8,678 |
| San Diego CA USD GO | 0.000% | 7/1/27 | 8,500 | 3,500 |
| San Diego CA USD GO | 0.000% | 7/1/28 | 8,000 | 3,100 |
| San Diego CA Water Auth. Rev. COP | 5.250% | 5/1/15 (14) | 6,215 | 7,193 |
| San Diego CA Water Auth. Rev. COP | 5.250% | 5/1/16 (14) | 7,880 | 9,192 |
| San Diego CA Water Auth. Rev. COP | 5.250% | 5/1/21 (14) | 6,725 | 7,748 |
| San Diego CA Water Auth. Rev. COP | 5.250% | 5/1/22 (14) | 7,075 | 8,147 |
| San Diego County CA COP | 5.000% | 2/1/22 (2) | 2,000 | 2,084 |
| San Diego County CA COP | 5.000% | 2/1/24 (2) | 1,500 | 1,549 |
| San Diego County CA COP | 5.000% | 2/1/26 (2) | 1,000 | 1,023 |
| San Diego County CA COP VRDO | 0.300% | 6/7/10 LOC | 15,920 | 15,920 |
| San Diego County CA Regional Building Auth. | 5.000% | 2/1/23 | 4,285 | 4,677 |
| San Diego County CA Regional Building Auth. | 5.000% | 2/1/25 | 4,820 | 5,174 |
| San Diego County CA Regional Building Auth. | 5.250% | 2/1/26 | 1,140 | 1,234 |
| San Diego County CA Regional Building Auth. | 5.000% | 2/1/27 | 2,420 | 2,558 |
| San Diego County CA Regional Building Auth. | 5.500% | 2/1/28 | 5,780 | 6,277 |
| San Francisco CA City & County COP | | | | |
| (San Bruno Jail) | 5.250% | 10/1/14 (2) | 2,860 | 2,898 |
| San Francisco CA City & County COP | | | | |
| (San Bruno Jail) | 5.125% | 10/1/17 (2) | 1,000 | 1,012 |
| San Francisco CA City & County GO | | | | |
| (Laguna Honda Hosp.) | 5.000% | 6/15/16 (2) | 8,000 | 8,772 |
| San Francisco CA City & County | | | | |
| International Airport Rev. | 5.250% | 5/1/12 (14)(Prere.) | 2,430 | 2,620 |
44
| | | | |
| California Intermediate-Term Tax-Exempt Fund | | | | |
| |
| |
| |
| | | | Face | Market |
| | | Maturity | Amount | Value• |
| | Coupon | Date | ($000) | ($000) |
| San Francisco CA City & County | | | | |
| International Airport Rev. | 5.250% | 5/1/12 (14)(Prere.) | 3,185 | 3,434 |
| San Francisco CA City & County | | | | |
| International Airport Rev. | 5.250% | 5/1/12 (14)(Prere.) | 4,015 | 4,369 |
| San Francisco CA City & County | | | | |
| International Airport Rev. | 5.000% | 5/1/18 | 15,000 | 16,840 |
| San Francisco CA City & County | | | | |
| International Airport Rev. | 5.250% | 5/1/20 (14) | 12,620 | 14,359 |
| San Francisco CA City & County | | | | |
| International Airport Rev. | 5.250% | 5/1/26 | 25,000 | 26,666 |
| San Francisco CA City & County | | | | |
| International Airport Rev. | 5.000% | 5/1/27 (14) | 13,075 | 13,514 |
| San Francisco CA City & County | | | | |
| Public Util. Comm. Rev. | 5.000% | 11/1/29 | 10,000 | 10,625 |
| San Francisco CA City & County | | | | |
| Redev. Agency Lease Rev. (Moscone Center) | 5.000% | 7/1/16 (4) | 3,270 | 3,444 |
| San Francisco CA City & County Water Rev. | 5.000% | 11/1/17 (14) | 4,865 | 5,262 |
| San Joaquin County CA Delta Community | | | | |
| College Dist. Election GO | 0.000% | 8/1/26 (4) | 15,500 | 5,911 |
| San Joaquin County CA Delta Community | | | | |
| College Dist. Election GO | 0.000% | 8/1/27 (4) | 15,500 | 5,495 |
| San Joaquin Hills CA Transp. Corridor | | | | |
| Agency Toll Road Rev. | 0.000% | 1/15/11 (14) | 7,140 | 6,909 |
| San Joaquin Hills CA Transp. Corridor | | | | |
| Agency Toll Road Rev. | 0.000% | 1/15/14 (14) | 5,500 | 4,372 |
| San Joaquin Hills CA Transp. Corridor | | | | |
| Agency Toll Road Rev. | 0.000% | 1/1/20 (ETM) | 2,500 | 1,813 |
| San Joaquin Hills CA Transp. Corridor | | | | |
| Agency Toll Road Rev. | 0.000% | 1/1/23 (ETM) | 16,000 | 9,838 |
| San Joaquin Hills CA Transp. Corridor | | | | |
| Agency Toll Road Rev. | 0.000% | 1/1/25 (ETM) | 17,750 | 9,803 |
| San Joaquin Hills CA Transp. Corridor | | | | |
| Agency Toll Road Rev. | 0.000% | 1/1/26 (ETM) | 14,350 | 7,517 |
| San Jose CA Airport Rev. | 5.375% | 3/1/13 (4) | 4,945 | 5,372 |
| San Jose CA Airport Rev. | 5.375% | 3/1/14 (4) | 7,550 | 8,137 |
| San Jose CA Airport Rev. | 5.375% | 3/1/15 (4) | 7,950 | 8,503 |
| San Jose CA Airport Rev. | 5.000% | 3/1/24 (2) | 2,035 | 2,085 |
| San Jose CA Airport Rev. | 5.000% | 3/1/25 (2) | 3,385 | 3,453 |
| San Jose CA Airport Rev. | 5.000% | 3/1/26 (2) | 3,850 | 3,909 |
| San Jose CA Financing Auth. Lease Rev. | 5.000% | 9/1/13 (14) | 9,570 | 10,000 |
| San Jose CA Redev. Agency | 5.250% | 8/1/13 (14) | 5,000 | 5,365 |
| San Jose CA Redev. Agency | 5.250% | 8/1/14 (14) | 5,000 | 5,406 |
| San Jose CA Redev. Agency | 5.000% | 8/1/21 | 1,270 | 1,302 |
| San Jose CA Redev. Agency | 5.000% | 8/1/23 | 1,140 | 1,152 |
| San Jose CA Redev. Agency | 5.000% | 8/1/24 (14) | 19,860 | 19,882 |
| San Jose CA Redev. Agency | 5.000% | 8/1/25 (14) | 18,505 | 18,426 |
| San Jose CA Redev. Agency | 5.125% | 8/1/25 | 570 | 574 |
| San Jose CA Redev. Agency | 5.250% | 8/1/26 | 800 | 820 |
| San Jose CA Redev. Agency | 5.375% | 8/1/29 | 1,355 | 1,385 |
| San Mateo CA Redev. Auth. Tax Allocation | 5.000% | 8/1/11 (Prere.) | 1,000 | 1,054 |
| San Mateo CA Redev. Auth. Tax Allocation | 5.200% | 8/1/11 (Prere.) | 2,045 | 2,160 |
| San Mateo CA Union High School Dist. GO | 0.000% | 9/1/10 (14) | 1,200 | 1,197 |
| San Mateo CA Union High School Dist. GO | 0.000% | 9/1/12 (14) | 1,180 | 1,133 |
| San Mateo CA Union High School Dist. GO | 0.000% | 9/1/13 (14) | 1,715 | 1,597 |
| San Mateo CA Union High School Dist. GO | 0.000% | 9/1/14 (14) | 1,500 | 1,347 |
45
| | | | |
| California Intermediate-Term Tax-Exempt Fund | | | | |
| |
| |
| |
| | | | Face | Market |
| | | Maturity | Amount | Value• |
| | Coupon | Date | ($000) | ($000) |
| San Mateo County CA Community | | | | |
| College Dist. GO | 5.375% | 9/1/15 (14) | 1,300 | 1,413 |
| San Mateo County CA Community | | | | |
| College Dist. GO | 0.000% | 9/1/21 (14) | 4,645 | 2,726 |
| San Mateo County CA Community | | | | |
| College Dist. GO | 0.000% | 9/1/22 (14) | 5,675 | 3,120 |
| San Mateo County CA Community | | | | |
| College Dist. GO | 0.000% | 9/1/24 (14) | 2,825 | 1,307 |
| San Mateo County CA Community | | | | |
| College Dist. GO | 0.000% | 9/1/25 (14) | 4,000 | 1,728 |
| San Mateo County CA Community | | | | |
| College Dist. GO | 5.000% | 9/1/26 | 3,170 | 3,400 |
| San Mateo County CA Joint Powers Auth. | | | | |
| Lease Rev. | 4.625% | 7/15/25 | 2,455 | 2,527 |
| San Mateo County CA Joint Powers Auth. | | | | |
| Lease Rev. | 5.250% | 7/15/28 | 2,000 | 2,125 |
| Santa Ana CA Community Redev. Agency | | | | |
| Tax Allocation (South Main Street) | 5.000% | 9/1/18 (14) | 2,685 | 2,703 |
| Santa Ana CA Finance Auth. Rev. | 5.375% | 9/1/10 (14) | 1,600 | 1,615 |
| Santa Barbara County CA COP | 5.250% | 12/1/12 (2) | 1,000 | 1,083 |
| Santa Barbara County CA COP | 5.250% | 12/1/13 (2) | 2,355 | 2,551 |
| Santa Barbara County CA COP | 5.250% | 12/1/15 (2) | 1,065 | 1,153 |
| Santa Barbara County CA COP | 5.250% | 12/1/16 (2) | 1,760 | 1,906 |
| Santa Clara CA Electric Rev. | 5.250% | 7/1/18 (14) | 1,720 | 1,811 |
| Santa Clara County CA Financing Auth. Lease Rev. | 7.750% | 11/15/10 (2) | 4,500 | 4,650 |
| Santa Clara County CA Financing Auth. Lease Rev. | 7.750% | 11/15/11 (2) | 1,000 | 1,102 |
| Santa Clara County CA Financing Auth. Lease Rev. | 5.000% | 11/15/17 | 11,540 | 13,136 |
| Santa Clara County CA Financing Auth. Lease Rev. | 5.000% | 11/15/18 | 7,920 | 8,984 |
| Santa Clara County CA Financing Auth. Lease Rev. | 5.000% | 5/15/28 | 10,000 | 10,352 |
| 1 Santa Clara County CA Financing Auth. Lease Rev. | | | | |
| TOB VRDO | 0.290% | 6/7/10 | 6,915 | 6,915 |
| Santa Margarita/Dana Point CA Auth. Rev. | 7.250% | 8/1/10 (14) | 4,630 | 4,677 |
| Santa Monica CA Community College Dist. | 5.000% | 8/1/20 | 1,000 | 1,157 |
| Santa Monica CA Community College Dist. | 0.000% | 8/1/26 | 11,025 | 4,584 |
| Santa Rosa CA Waste Water Rev. | 0.000% | 9/1/28 (4) | 11,095 | 3,790 |
| Simi Valley CA USD | 0.000% | 8/1/26 (4) | 3,030 | 1,157 |
| Simi Valley CA USD | 0.000% | 8/1/27 (4) | 2,900 | 1,022 |
| Solano County CA COP | 5.000% | 11/1/17 (14) | 4,110 | 4,657 |
| Solano County CA COP | 5.000% | 11/1/18 (14) | 3,810 | 4,240 |
| Solano County CA COP | 5.000% | 11/1/19 (14) | 3,995 | 4,388 |
| Solano County CA COP | 5.000% | 11/1/20 (14) | 4,195 | 4,557 |
| Solano County CA COP | 5.000% | 11/1/21 (14) | 4,405 | 4,748 |
| South Orange County CA Public Finance Auth. Rev. | 7.000% | 9/1/10 (14) | 3,300 | 3,348 |
| South Orange County CA Public Finance Auth. Rev. | 7.000% | 9/1/11 (14) | 3,490 | 3,726 |
| South Orange County CA Public Finance Auth. Rev. | 5.375% | 8/15/12 (4) | 5,605 | 5,656 |
| South Orange County CA Public Finance Auth. Rev. | 5.250% | 8/15/13 (2) | 2,290 | 2,302 |
| South San Francisco CA Redev. Agency | | | | |
| Tax Allocation | 5.000% | 9/1/31 (14) | 7,255 | 6,743 |
| Southern California Public Power Auth. Rev. | | | | |
| (Mead–Adelanto Project) VRDO | 0.250% | 6/1/10 | 5,695 | 5,695 |
| Southern California Public Power Auth. Rev. | | | | |
| (Milford Wind Corridor) | 5.000% | 7/1/29 | 5,000 | 5,189 |
| Southern California Public Power Auth. Rev. | | | | |
| (Natural Gas Project) | 5.000% | 11/1/18 | 1,040 | 1,045 |
| Southern California Public Power Auth. Rev. | | | | |
| (Natural Gas Project) | 5.250% | 11/1/23 | 5,250 | 5,223 |
46
| | | | |
| California Intermediate-Term Tax-Exempt Fund | | | | |
| |
| |
| |
| | | | Face | Market |
| | | Maturity | Amount | Value• |
| | Coupon | Date | ($000) | ($000) |
| Southern California Public Power Auth. Rev. | | | | |
| (Natural Gas Project) | 5.250% | 11/1/24 | 5,000 | 4,956 |
| Southern California Public Power Auth. Rev. | | | | |
| (Natural Gas Project) | 5.250% | 11/1/25 | 10,280 | 10,109 |
| Southern California Public Power Auth. Rev. | | | | |
| (Natural Gas Project) | 5.250% | 11/1/26 | 2,500 | 2,451 |
| 3 Southern California Public Power Auth. Rev. | | | | |
| (Palo Verde Project) VRDO | 0.270% | 6/7/10 LOC | 23,000 | 23,000 |
| Southern California Public Power Auth. Rev. | | | | |
| (San Juan Unit) | 5.500% | 1/1/13 (4) | 3,500 | 3,890 |
| Southern California Public Power Auth. Rev. | | | | |
| (Transmission Project) | 5.000% | 7/1/23 | 5,000 | 5,427 |
| Tobacco Securitization Auth. Rev. (Southern | | | | |
| California Tobacco Settlement) | 4.750% | 6/1/25 | 8,790 | 8,372 |
| Tulare County CA COP | 5.000% | 8/15/15 (14) | 6,460 | 7,031 |
| 3 Turlock CA IRR Dist. Rev. | 5.000% | 1/1/21 | 3,805 | 4,188 |
| 3 Turlock CA IRR Dist. Rev. | 5.000% | 1/1/22 | 5,415 | 5,910 |
| Univ. of California Regents | 5.000% | 5/15/19 (14) | 5,075 | 5,513 |
| Univ. of California Regents | 5.000% | 5/15/20 (14) | 5,065 | 5,464 |
| Univ. of California Regents | 5.000% | 5/15/25 | 19,385 | 20,565 |
| Univ. of California Regents | 5.000% | 5/15/26 | 14,095 | 14,865 |
| Univ. of California Rev. | 3.000% | 5/15/11 | 1,235 | 1,266 |
| Univ. of California Rev. | 3.000% | 5/15/12 | 2,000 | 2,092 |
| Univ. of California Rev. | 5.000% | 5/15/17 (4) | 20,620 | 23,430 |
| Univ. of California Rev. | 5.000% | 5/15/18 (4) | 10,000 | 11,295 |
| Univ. of California Rev. | 5.000% | 5/15/19 (4) | 4,275 | 4,767 |
| Univ. of California Rev. | 5.000% | 5/15/20 (4) | 30,900 | 34,064 |
| Univ. of California Rev. | 5.000% | 5/15/21 (4) | 14,915 | 16,347 |
| Univ. of California Rev. | 5.750% | 5/15/25 | 3,000 | 3,478 |
| Univ. of California Rev. | 5.000% | 5/15/26 (14) | 10,000 | 10,687 |
| Univ. of California Rev. (Multiple Purpose Project) | 5.000% | 9/1/11 (4)(Prere.) | 4,820 | 5,142 |
| Univ. of California Rev. (San Diego Medical Center) | 5.125% | 12/1/14 (4) | 4,290 | 4,408 |
| Univ. of California Rev. (San Diego Medical Center) | 5.125% | 12/1/15 (4) | 4,515 | 4,634 |
| Ventura County CA Community College Dist. GO | 5.000% | 8/1/16 (14) | 3,100 | 3,367 |
| Ventura County CA Community College Dist. GO | 5.000% | 8/1/17 (14) | 2,300 | 2,498 |
| Ventura County CA Community College Dist. GO | 0.000% | 8/1/28 | 15,000 | 5,334 |
| Vista CA USD GO | 5.375% | 8/1/12 (4)(Prere.) | 1,695 | 1,867 |
| Vista CA USD GO | 5.375% | 8/1/12 (4)(Prere.) | 1,455 | 1,603 |
| Vista CA USD GO | 5.375% | 8/1/15 (4) | 150 | 163 |
| Vista CA USD GO | 5.375% | 8/1/16 (4) | 190 | 206 |
| Vista CA USD GO | 5.375% | 8/1/17 (4) | 160 | 173 |
| Washington Township CA Health Care Dist. Rev. | 6.000% | 7/1/29 | 1,000 | 1,087 |
| West Contra Costa CA USD | 6.000% | 8/1/26 | 5,000 | 5,509 |
| | | | | 5,281,126 |
| Puerto Rico (2.1%) | | | | |
| Puerto Rico Aqueduct & Sewer Auth. Rev. | 6.250% | 7/1/12 (14)(ETM) | 1,000 | 1,114 |
| Puerto Rico Electric Power Auth. Rev. | 5.000% | 7/1/10 | 7,500 | 7,532 |
| Puerto Rico Electric Power Auth. Rev. | 5.000% | 7/1/11 | 12,500 | 13,053 |
| Puerto Rico Electric Power Auth. Rev. | 5.500% | 7/1/11 (4) | 6,050 | 6,139 |
| Puerto Rico Electric Power Auth. Rev. | 6.000% | 7/1/12 (14) | 8,235 | 9,035 |
| Puerto Rico GO | 6.500% | 7/1/11 (14) | 2,500 | 2,634 |
| Puerto Rico Highway & Transp. Auth. Rev. | 5.500% | 7/1/13 (14) | 2,250 | 2,388 |
| Puerto Rico Infrastructure Financing Auth. | | | | |
| Special Tax Rev. | 5.500% | 7/1/21 (3) | 5,000 | 5,408 |
| Puerto Rico Infrastructure Financing Auth. | | | | |
| Special Tax Rev. | 5.500% | 7/1/23 (3) | 1,585 | 1,697 |
47
| | | | |
| California Intermediate-Term Tax-Exempt Fund | | | | |
| |
| |
| |
| | | | Face | Market |
| | | Maturity | Amount | Value• |
| | Coupon | Date | ($000) | ($000) |
| Puerto Rico Muni. Finance Agency | 5.625% | 8/1/10 (4) | 17,775 | 17,916 |
| Puerto Rico Muni. Finance Agency | 5.750% | 8/1/11 (4) | 13,560 | 13,742 |
| Puerto Rico Muni. Finance Agency | 5.750% | 8/1/11 (4) | 7,750 | 7,854 |
| Puerto Rico Muni. Finance Agency | 5.000% | 7/1/14 (11) | 1,360 | 1,468 |
| Puerto Rico Muni. Finance Agency | 5.250% | 7/1/16 (11) | 1,400 | 1,519 |
| Puerto Rico Muni. Finance Agency | 5.250% | 7/1/18 (11) | 1,000 | 1,064 |
| Puerto Rico Public Finance Corp. PUT | 5.750% | 2/1/12 LOC | 20,000 | 20,784 |
| | | | | 113,347 |
| Virgin Islands (0.0%) | | | | |
| Virgin Islands Public Finance Auth. Rev. | 5.250% | 10/1/15 | 2,200 | 2,369 |
| Total Tax-Exempt Municipal Bonds (Cost $5,270,429) | | | | 5,396,842 |
| Other Assets and Liabilities (0.2%) | | | | |
| Other Assets | | | | 84,437 |
| Liabilities | | | | (73,205) |
| | | | | 11,232 |
| Net Assets (100%) | | | | 5,408,074 |
| |
| |
| At May 31, 2010, net assets consisted of: | | | | |
| | | | | Amount |
| | | | | ($000) |
| Paid-in Capital | | | | 5,376,051 |
| Undistributed Net Investment Income | | | | — |
| Accumulated Net Realized Losses | | | | (94,759) |
| Unrealized Appreciation (Depreciation) | | | | |
| Investment Securities | | | | 126,413 |
| Futures Contracts | | | | 369 |
| Net Assets | | | | 5,408,074 |
| |
| |
| Investor Shares—Net Assets | | | | |
| Applicable to 136,192,011 outstanding $. 001 par value shares of | | | |
| beneficial interest (unlimited authorization) | | | | 1,501,182 |
| Net Asset Value Per Share—Investor Shares | | | | $11.02 |
| |
| |
| Admiral Shares—Net Assets | | | | |
| Applicable to 354,445,790 outstanding $. 001 par value shares of | | | |
| beneficial interest (unlimited authorization) | | | | 3,906,892 |
| Net Asset Value Per Share—Admiral Shares | | | | $11.02 |
• See Note A in Notes to Financial Statements.
1 Security exempt from registration under Rule 144A of the Securities Act of 1933. Such securities may be sold in transactions exempt from registration, normally to qualified institutional buyers. At May 31, 2010, the aggregate value of these securities was $95,575,000, representing 1.8% of net assets.
2 Securities with a value of $2,921,000 have been segregated as initial margin for open futures contracts.
3 Security purchased on a when-issued or delayed-delivery basis for which the fund has not taken delivery as of May 31, 2010.
See accompanying Notes, which are an integral part of the Financial Statements.
A key to abbreviations and other references follows the Statement of Net Assets.
48
California Intermediate-Term Tax-Exempt Fund
Key to Abbreviations
ARS—Auction Rate Security.
BAN—Bond Anticipation Note.
COP—Certificate of Participation.
CP—Commercial Paper.
FR—Floating Rate.
GAN—Grant Anticipation Note.
GO—General Obligation Bond.
IDA—Industrial Development Authority Bond.
IDR—Industrial Development Revenue Bond.
PCR—Pollution Control Revenue Bond.
PUT—Put Option Obligation.
RAN—Revenue Anticipation Note.
TAN—Tax Anticipation Note.
TOB—Tender Option Bond.
TRAN—Tax Revenue Anticipation Note.
UFSD—Union Free School District.
USD—United School District.
VRDO—Variable Rate Demand Obligation.
VRDP—Variable Rate Demand Preferred.
(ETM)—Escrowed to Maturity.
(Prere.)—Prerefunded.
Scheduled principal and interest payments are guaranteed by:
(1) MBIA (Municipal Bond Insurance Association).
(2) AMBAC (Ambac Assurance Corporation).
(3) FGIC (Financial Guaranty Insurance Company).
(4) AGM (Assured Guaranty Municipal Corporation).
(5) BIGI (Bond Investors Guaranty Insurance).
(6) Connie Lee Inc.
(7) FHA (Federal Housing Authority).
(8) CapMAC (Capital Markets Assurance Corporation).
(9) American Capital Access Financial Guaranty Corporation.
(10) XL Capital Assurance Inc.
(11) CIFG (CDC IXIS Financial Guaranty).
(12) Assured Guaranty Corp.
(13) Berkshire Hathaway Assurance Corp.
(14) National Public Finance Guarantee Corp.
The insurance does not guarantee the market value of the municipal bonds.
LOC—Scheduled principal and interest payments are guaranteed by bank letter of credit.
49
| |
| California Intermediate-Term Tax-Exempt Fund | |
| |
| |
| Statement of Operations | |
| |
| | Six Months Ended |
| | May 31, 2010 |
| | ($000) |
| Investment Income | |
| Income | |
| Interest | 103,995 |
| Total Income | 103,995 |
| Expenses | |
| The Vanguard Group—Note B | |
| Investment Advisory Services | 246 |
| Management and Administrative—Investor Shares | 1,161 |
| Management and Administrative—Admiral Shares | 1,624 |
| Marketing and Distribution—Investor Shares | 214 |
| Marketing and Distribution—Admiral Shares | 435 |
| Custodian Fees | 19 |
| Shareholders’ Reports—Investor Shares | 12 |
| Shareholders’ Reports—Admiral Shares | 4 |
| Trustees’ Fees and Expenses | 4 |
| Total Expenses | 3,719 |
| Net Investment Income | 100,276 |
| Realized Net Gain (Loss) | |
| Investment Securities Sold | 4,628 |
| Futures Contracts | (1,807) |
| Realized Net Gain (Loss) | 2,821 |
| Change in Unrealized Appreciation (Depreciation) | |
| Investment Securities | 77,439 |
| Futures Contracts | 578 |
| Change in Unrealized Appreciation (Depreciation) | 78,017 |
| Net Increase (Decrease) in Net Assets Resulting from Operations | 181,114 |
See accompanying Notes, which are an integral part of the Financial Statements.
50
| | |
| California Intermediate-Term Tax-Exempt Fund | | |
| |
| |
| Statement of Changes in Net Assets | | |
| |
| | Six Months Ended | Year Ended |
| | May 31, | November 30, |
| | 2010 | 2009 |
| | ($000) | ($000) |
| Increase (Decrease) in Net Assets | | |
| Operations | | |
| Net Investment Income | 100,276 | 184,035 |
| Realized Net Gain (Loss) | 2,821 | (43,677) |
| Change in Unrealized Appreciation (Depreciation) | 78,017 | 316,607 |
| Net Increase (Decrease) in Net Assets Resulting from Operations | 181,114 | 456,965 |
| Distributions | | |
| Net Investment Income | | |
| Investor Shares | (27,693) | (52,260) |
| Admiral Shares | (72,583) | (131,775) |
| Realized Capital Gain | | |
| Investor Shares | — | �� |
| Admiral Shares | — | — |
| Total Distributions | (100,276) | (184,035) |
| Capital Share Transactions | | |
| Investor Shares | 43,130 | 36,291 |
| Admiral Shares | 222,949 | 221,926 |
| Net Increase (Decrease) from Capital Share Transactions | 266,079 | 258,217 |
| Total Increase (Decrease) | 346,917 | 531,147 |
| Net Assets | | |
| Beginning of Period | 5,061,157 | 4,530,010 |
| End of Period | 5,408,074 | 5,061,157 |
See accompanying Notes, which are an integral part of the Financial Statements.
51
| | | | | | |
| California Intermediate-Term Tax-Exempt Fund | | | | | |
| |
| |
| Financial Highlights | | | | | | |
| |
| |
| Investor Shares | | | | | | |
| Six Months | | | | | |
| | Ended | | | | | |
| For a Share Outstanding | May 31, | | | Year Ended November 30, |
| Throughout Each Period | 2010 | 2009 | 2008 | 2007 | 2006 | 2005 |
| Net Asset Value, Beginning of Period | $10.86 | $10.21 | $10.92 | $11.09 | $10.95 | $11.15 |
| Investment Operations | | | | | | |
| Net Investment Income | .206 | .412 | .425 | .435 | .438 | .434 |
| Net Realized and Unrealized Gain (Loss) | | | | | | |
| on Investments | .160 | .650 | (.710) | (.170) | .140 | (.200) |
| Total from Investment Operations | .366 | 1.062 | (.285) | .265 | .578 | .234 |
| Distributions | | | | | | |
| Dividends from Net Investment Income | (.206) | (.412) | (.425) | (.435) | (.438) | (.434) |
| Distributions from Realized Capital Gains | — | — | — | — | — | — |
| Total Distributions | (.206) | (.412) | (.425) | (.435) | (.438) | (.434) |
| Net Asset Value, End of Period | $11.02 | $10.86 | $10.21 | $10.92 | $11.09 | $10.95 |
| |
| Total Return1 | 3.40% | 10.56% | -2.71% | 2.46% | 5.40% | 2.11% |
| |
| Ratios/Supplemental Data | | | | | | |
| Net Assets, End of Period (Millions) | $1,501 | $1,435 | $1,320 | $1,243 | $1,068 | $1,002 |
| Ratio of Total Expenses to | | | | | | |
| Average Net Assets | 0.20%2 | 0.20% | 0.15% | 0.15% | 0.16% | 0.16% |
| Ratio of Net Investment Income to | | | | | | |
| Average Net Assets | 3.78%2 | 3.88% | 3.96% | 3.97% | 4.00% | 3.90% |
| Portfolio Turnover Rate | 13%2 | 17% | 25% | 11% | 7% | 12% |
1 Total returns do not include the account service fee that may be applicable to certain accounts with balances below $10,000.
2 Annualized.
See accompanying Notes, which are an integral part of the Financial Statements.
52
| | | | | | |
| California Intermediate-Term Tax-Exempt Fund | | | | | |
| |
| |
| Financial Highlights | | | | | | |
| |
| |
| Admiral Shares | | | | | | |
| Six Months | | | | | |
| | Ended | | | | | |
| For a Share Outstanding | May 31, | | | Year Ended November 30, |
| Throughout Each Period | 2010 | 2009 | 2008 | 2007 | 2006 | 2005 |
| Net Asset Value, Beginning of Period | $10.86 | $10.21 | $10.92 | $11.09 | $10.95 | $11.15 |
| Investment Operations | | | | | | |
| Net Investment Income | .210 | .421 | .432 | .443 | .446 | .442 |
| Net Realized and Unrealized Gain (Loss) | | | | | | |
| on Investments | .160 | .650 | (.710) | (.170) | .140 | (.200) |
| Total from Investment Operations | .370 | 1.071 | (.278) | .273 | .586 | .242 |
| Distributions | | | | | | |
| Dividends from Net Investment Income | (.210) | (.421) | (.432) | (.443) | (.446) | (.442) |
| Distributions from Realized Capital Gains | — | — | — | — | — | — |
| Total Distributions | (.210) | (.421) | (.432) | (.443) | (.446) | (.442) |
| Net Asset Value, End of Period | $11.02 | $10.86 | $10.21 | $10.92 | $11.09 | $10.95 |
| |
| Total Return | 3.44% | 10.65% | -2.64% | 2.53% | 5.48% | 2.18% |
| |
| Ratios/Supplemental Data | | | | | | |
| Net Assets, End of Period (Millions) | $3,907 | $3,626 | $3,210 | $3,116 | $2,388 | $1,847 |
| Ratio of Total Expenses to | | | | | | |
| Average Net Assets | 0.12%1 | 0.12% | 0.08% | 0.08% | 0.09% | 0.09% |
| Ratio of Net Investment Income to | | | | | | |
| Average Net Assets | 3.86%1 | 3.96% | 4.03% | 4.04% | 4.07% | 3.98% |
| Portfolio Turnover Rate | 13%1 | 17% | 25% | 11% | 7% | 12% |
| 1 Annualized. | | | | | | |
See accompanying Notes, which are an integral part of the Financial Statements.
53
California Intermediate-Term Tax-Exempt Fu nd
Notes to Financial Statements
Vanguard California Intermediate-Term Tax-Exempt Fund is registered unde r the Investment Company Act of 1940 as an open-end investment company, or mutual fund. The fund invests in debt instruments of municipal issuers whose ability to meet their obligations may be affected by economic and political developments in the state. The fund offers two classes of shares, Investor Shares and Admiral Shares. Investor Shares are available to any investor who meets the fund’s minimum purchase requirements. Admiral Shares are designed for investors who meet certain administrative, service, tenure, and account-size criteria.
A. The following significant accounting policies conform to gener ally accepted accounting principles for U.S. mutual funds. The fund consistently follows such policies in preparing its financial statements.
1. Security Valuation: Bonds, and temporary cash investments acquired over 60 days to maturity, are valued using the latest bid prices or using valuations based on a matrix system (which considers such factors as security price s, yields, maturities, and ratings), both as furnished by independent pricing services. Other temporary cash investments are valued at amortized cost, which approximates market value. Securities for which market quota tions are not readily available, or whose values have been affected by events occurring befor e the fund’s pricing time but after the close of the securities’ primary markets, a re valued by methods deemed by the board of trustees to represent fair value.
2. Futures Contracts: The fund uses futures contracts to invest in fixed income asset classes with greater efficiency and lower cost than is possible through direct investment, to add value when these instruments are attractively priced, or to adjust sensitivity to changes in interest rates. The primary risks associated with the use of futures contracts are imperfect correlation between changes in market values of bonds held by the fund and the prices of futures contracts, and the possibility of an illiquid market.
Futures contracts are valued based upon their quoted daily settlement prices. The aggregate principal amounts of the contracts are not recorded in the Statement of Net Assets. Fluctuations in the value of the contracts a re recorded in the Statement of Net Assets as an asset (liability) and in the Statement of Operations as unrealized appreciation (depreciation) until the contracts are closed, when they are recorded as realized futures gains (losses).
3. Federal Income Taxes: The fund intends to continue to qualify as a regulated investment company and distribute all of its income. Management has analyzed the fund’s tax positions taken for all open federal income tax years (November 30, 2006–2009), and for the period ended May 31, 2010, and has concluded that no provision for federal income tax is required in the fund’s financial statements.
4. Distributions: Distributions from net investment income are declared daily and paid on the first business day of the following month. Annual distributions from realized capital gains, if any, are recorded on the ex-dividend date.
5. Other: Interest income is accrued daily. Premiums and discounts on debt securities purchased are amortized and accreted, respective ly, to interest income over the lives of the respective securities. Security transactions are accounted for on the date securities are bought or sold. Costs used to determine realized gains (losses) on the sale of investment securities are those of the specific securities sold.
Each class of shares has equal rights as to assets and earnings, except that each class separately bears certain class-specific expenses related to maintenance of shareholder accounts (included in Management and Administrative expenses) and shareholder reporting. Marketing and distribution
54
California Intermediate-Term Tax-Exempt Fu nd
expenses are allocated to each class of shares based on a method approved by the board of trustees. Income, other non-class-specific expenses, and gains and losses on investments are allocated to each class of shares based on its relative net assets.
B. The Vanguard Group furnishes at cost investment advisory, corporate management, administrative, marketing, and distribution services. The costs of such services are allocated to the fund under methods approved by the board of trustees. The fund has committed to provide up to 0.40% of its net assets in capital contributions to Vanguard. At May 31, 2010, the fund had contributed capital of $992,000 to Vanguard (included in Other Assets), representing 0.02% of the fund&# 146;s net assets and 0.40% of Vanguard’s capitalization. The fund’s trustees and officers are also directors and officers of Vanguard.
C. Various inputs may be used to determine the value of the fund’s investments. These inputs are summarized in three broad levels for financial statement purposes. The inputs or methodologies used to value securities are not necessarily an indication of the risk associated with investing in those securities.
Level 1—Quoted prices in active markets for identical securities.
Level 2—Other significant observable inputs (including quoted prices for similar securities, interest rates, prepayment speeds, credit risk, etc.).
Level 3—Significant unobservable inputs (including the fund’s own assumptions used to determine the fair value of investments).
The following table summarizes the fund’s investments as of May 31, 2010, based on the inputs used to value them:
| | | |
| | Level 1 | Level 2 | Level 3 |
| Investments | ($000) | ($000) | ($000) |
| Tax-Exempt Municipal Bonds | — | 5,396,842 | — |
| Futures Contracts—Liabilities1 | (78) | — | — |
| Total | (78) | 5,396,842 | — |
| 1 Represents variation margin on the last day of the reporting period. | | | |
D. At May 31, 2010, the aggregate settlement value of open futures contracts and the related unrealized appreciation (depreciation) were:
| | | | |
| | | | | ($000) |
| | | | Aggregate | |
| | | Number of | Settlement | Unrealized |
| | | Long (Short) | Value | Appreciation |
| Futures Contracts | Expiration | Contracts | Long (Short) | (Depreciation) |
| 30-Year United States Treasury Bond | September 2010 | (267) | (33,099) | 349 |
| 10-Year United States Treasury Note | September 2010 | (51) | (6,133) | 20 |
Unrealized appreciation (depreciation) on open futures contracts is required t o be treated as realized gain (loss) for tax purposes.
55
California Intermediate-Term Tax-Exempt Fu nd
E. Capital gain distributions are determined on a tax basis and may differ from realized capital gains for financial reporting purposes. Differences may be permanent or temporary. Permanent differences are reclassified among capital accounts in the financial statements to reflect their tax character. Temporary differen ces arise when gains or losses are recognized in different periods for financial statement and tax purposes; these differences will reverse at some time in the future.
The fund’s tax-basis capital gains and losses are determined only at the end of each fiscal year. For tax purposes, at November 30, 2009, the fund had available capital loss carryforwards tot aling $94,147,000 to offset future net capital gains of $4,253,000 through November 30, 2012, $2,524,000 through November 30, 2013, $6,523,000 through November 30, 2014, $3,936,000 through November 30, 2015, $38,505,000 through November 30, 2016, and $38,406,000 through November 30, 2017. The fund will use these capital losses to offset net taxable capital gains, if any, realized during the year ending November 30, 2010; should the fund realize net capital losses for the year, the losses will be added to the loss carryforward balance above.
The fund had realized losses totaling $3,642,000 through November 30, 2009, which are deferred for tax purposes and reduce the amount of tax-basis unrealized appreciation on investment securities.
At May 31, 2010, the cost of investment securities for tax purposes was $5,274,071,000. Net unrealized appreciation of investment securities for tax purposes was $122,771,000, consisting of unreal ized gains of $165,006,000 on securities that had risen in value since their purchase and $42,235,000 in unrealized losses on securities that had fallen in value since their purchase.
F. During the six months ended May 31, 2010, the fund purchased $486,371,000 of investment securities and sold $326,643,000 of investment securities, other than temporary cash investments.
| | | | |
| G. Capital share transactions for each class of shares were: | | | |
| | Six Months Ended | | Year Ended |
| | May 31, 2010 | November 30, 2009 |
| | Amount | Shares | Amount | Shares |
| | ($000) | (000) | ($000) | (000) |
| Investor Shares | | | | |
| Issued | 276,894 | 25,379 | 589,941 | 55,526 |
| Issued in Lieu of Cash Distributions | 24,580 | 2,251 | 46,196 | 4,343 |
| Redeemed | (258,344) | (23,669) | (599,846) | (56,887) |
| Net Increase (Decrease)—Investor Shares | 43,130 | 3,961 | 36,291 | 2,982 |
| Admiral Shares | | | | |
| Issued | 600,881 | 55,063 | 1,170,338 | 110,060 |
| Issued in Lieu of Cash Distributions | 55,991 | 5,127 | 99,608 | 9,362 |
| Redeemed | (433,923) | (39,751) | (1,048,020) | (99,670) |
| Net Increase (Decrease)—Admiral Shares | 222,949 | 20,439 | 221,926 | 19,752 |
H. In preparing the financial statements as of May 31, 2010, management considered the impact of subsequent events for potential recog nition or disclosure in these financial statements.
56
California Long-Term Tax-Exempt Fund
| | | |
| Fund Profile | | |
| As of May 31, 2010 | | | |
| |
| Share-Class Characteristics | | |
| | Investor | Admiral |
| | Shares | Shares |
| Ticker Symbol | VCITX | VCLAX |
| Expense Ratio1 | 0.20% | 0.12% |
| 30-Day SEC Yield | 3.75% | 3.83% |
| |
| Financial Attributes | | | |
| | | Barclays | |
| | | Capital | |
| | | 10 Year | Barclays |
| | | Municipal Municipal |
| | | Bond | Bond |
| | Fund | Index | Index |
| Number of Bonds | 444 | 8,565 | 46,449 |
| Average Quality | A+ | AA/AA- | AA/AA- |
| Yield to Maturity | | | |
| (before expenses) | 3.9% | 3.3% | 3.4% |
| Average Coupon | 4.5% | 4.9% | 5.0% |
| Average Duration | 7.1 years | 7.0 years | 8.2 years |
| Average Effective | | | |
| Maturity | 9.5 years | 9.9 years 13.5 years |
| Short-Term | | | |
| Reserves | 4.5% | — | — |
| | |
| Volatility Measures | |
| Barclays Capital | |
| | 10 Year | Barclays |
| | Municipal | Municipal |
| | Bond Index | Bond Index |
| R-Squared | 0.79 | 0.94 |
| Beta | 1.04 | 1.14 |
These measures show the degree and timing of the fund’s fluctuations compared with the indexes over 36 months.
Distribution by Maturity (% of portfolio)
| |
| Under 1 Year | 6.7% |
| 1 - 3 Years | 11.8 |
| 3 - 5 Years | 15.5 |
| 5 - 10 Years | 38.4 |
| 10 - 20 Years | 10.9 |
| 20 - 30 Years | 13.1 |
| Over 30 Years | 3.6 |
Distribution by Credit Quality (% of portfolio)
| |
| AAA | 15.2% |
| AA | 33.6 |
| A | 43.3 |
| BBB | 6.7 |
| Not Rated | 1.2 |
Investment Focus
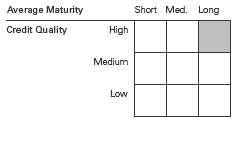
1 The expense ratios shown are from the prospectus dated April 22, 2010, and represent estimated costs for the current fiscal year based on the fund’s net assets as of the prospectus date. For the six months ended May 31, 2010, the annualized expense ratios were 0.20% for Investor Shares and 0.12% for Admiral Shares.
57
California Long-Term Tax-Exempt Fund
Performance Summary
All of the returns in this report represent past performance, which is not a guarantee of future results that may be achieved by the fund. (Current performance may be lower or higher than the performance data cited. For performance data current to the most recent month-end, visit our website at www.vanguard.com/performance.) Note, too, that both investment returns and principal value can fluctuate widely, so an investor’s shares, when sold, could be worth more or less than their original cost. The returns shown do not reflect taxes that a shareholder would pay on fund distributions or on the sale of fund shares.
| | | | |
| Fiscal-Year Total Returns (%): November 30, 1999, Through May 31, 2010 | |
| | | | | Barclays Capital |
| | | | | 10 Year Municipal |
| | | | Investor Shares | Bond Index |
| Fiscal Year | Income Returns | Capital Returns | Total Returns | Total Returns |
| 2000 | 5.65% | 5.46% | 11.11% | 7.65% |
| 2001 | 5.12 | 2.63 | 7.75 | 8.22 |
| 2002 | 4.85 | 0.51 | 5.36 | 6.67 |
| 2003 | 4.73 | 2.22 | 6.95 | 6.88 |
| 2004 | 4.65 | -1.33 | 3.32 | 4.03 |
| 2005 | 4.54 | -0.32 | 4.22 | 3.01 |
| 2006 | 4.71 | 1.99 | 6.70 | 6.17 |
| 2007 | 4.52 | -3.37 | 1.15 | 3.51 |
| 2008 | 4.13 | -11.08 | -6.95 | -0.42 |
| 2009 | 4.96 | 7.75 | 12.71 | 12.67 |
| 2010 | 2.22 | 2.00 | 4.22 | 3.46 |
| Note: For 2010, performance data reflect the six months ended May 31, 2010. | | |
Average Annual Total Returns: Periods Ended March 31, 2010
This table presents average annual total returns through the latest calendar quarter—rather than through the end of the fiscal period. Securities and Exchange Commission rules require that we provide this information.
| | | | | | |
| | | | | | | Ten Years |
| | Inception Date | One Year | Five Years | Income | Capital | Total |
| Investor Shares | 4/7/1986 | 10.72% | 3.49% | 4.74% | 0.19% | 4.93% |
| Admiral Shares | 11/12/2001 | 10.80 | 3.57 | 4.681 | -0.791 | 3.891 |
| 1 Return since inception. | | | | | | |
See Financial Highlights for dividend and capital gains information.
58
California Long-Term Tax-Exempt Fund
Financial Statements (unaudited)
Statement of Net Assets
As of May 31, 2010
The fund reports a complete list of its holdings in regulatory filings four times in each fiscal year, at the quarter-ends. For the second and fourth fiscal quarters, the lists appear in the fund’s semiannual and annual reports to shareholders. For the first and third fiscal quarters, the fund files the lists with the Securities and Exchange Commission on Form N-Q. Shareholders can look up the fund’s Forms N-Q on the SEC’s website at www.sec.gov. Forms N-Q may also be reviewed and copied at the SEC’s Public Reference Room (see the back cover of this report for further information).
| | | | |
| | | | Face | Market |
| | | Maturity | Amount | Value• |
| | Coupon | Date | ($000) | ($000) |
| Tax-Exempt Municipal Bonds (99.4%) | | | | |
| California (98.5%) | | | | |
| ABAG Finance Auth. for Non-Profit Corp. California | | | | |
| (Acacia Creek at Union City Project) VRDO | 0.280% | 6/1/10 | 18,050 | 18,050 |
| ABAG Finance Auth. for Non-Profit Corp. California | | | | |
| (School of the Mechanical Arts) | 5.250% | 10/1/26 | 1,000 | 1,005 |
| ABAG Finance Auth. for Non-Profit Corp. California | | | | |
| (School of the Mechanical Arts) | 5.300% | 10/1/32 | 3,180 | 3,182 |
| ABAG Finance Auth. for Non-Profit Corp. California | | | | |
| (Valley Christian Schools) VRDO | 0.300% | 6/7/10 LOC | 14,000 | 14,000 |
| Alameda CA Corridor Transp. Auth. Rev. | 5.125% | 10/1/17 (14) | 5,000 | 5,056 |
| Alameda CA Corridor Transp. Auth. Rev. | 5.125% | 10/1/18 (14) | 2,000 | 2,022 |
| Alameda CA Corridor Transp. Auth. Rev. | 0.000% | 10/1/30 (2) | 30,375 | 7,996 |
| Alameda County CA USD | 0.000% | 8/1/24 (4) | 3,510 | 1,596 |
| Alameda County CA USD | 0.000% | 8/1/29 (4) | 5,000 | 1,603 |
| Anaheim CA Public Finance Auth. Distribution | | | | |
| System Rev. | 5.000% | 10/1/21 (14) | 3,390 | 3,626 |
| Bay Area CA Infrastructure Financing Auth. Rev. | 5.000% | 8/1/17 (14) | 4,000 | 4,189 |
| Bay Area Toll Auth. CA Toll Bridge Rev. | 5.000% | 4/1/31 | 10,000 | 10,311 |
| Bay Area Toll Auth. CA Toll Bridge Rev. | 5.000% | 4/1/31 | 2,395 | 2,480 |
| Bay Area Toll Auth. CA Toll Bridge Rev. | 5.000% | 4/1/34 | 7,000 | 7,215 |
| Bay Area Toll Auth. CA Toll Bridge Rev. | 5.000% | 4/1/39 | 18,285 | 18,761 |
| Bay Area Toll Auth. CA Toll Bridge Rev. | 5.625% | 4/1/44 | 10,000 | 10,935 |
| Cabrillo CA Community College Dist. Rev. | 0.000% | 5/1/26 (2) | 9,000 | 3,538 |
| Cabrillo CA Community College Dist. Rev. | 0.000% | 8/1/28 (14) | 2,250 | 800 |
| California County CA Tobacco Securitization Agency | 0.000% | 6/1/28 | 7,500 | 5,889 |
| California County CA Tobacco Securitization Agency | 0.000% | 6/1/36 | 7,500 | 5,509 |
| California Dept. of Water Resources Water | | | | |
| System Rev. (Central Valley) | 5.000% | 12/1/25 | 8,810 | 9,789 |
| California Educ. Fac. Auth. Rev. | | | | |
| (California Institute of Technology) | 5.000% | 10/1/39 | 1,500 | 1,578 |
| California Educ. Fac. Auth. Rev. | | | | |
| (California Institute of Technology) | 5.000% | 11/1/39 | 3,000 | 3,195 |
| California Educ. Fac. Auth. Rev. | | | | |
| (College of Arts & Crafts) | 6.875% | 6/1/19 | 1,615 | 1,790 |
| California Educ. Fac. Auth. Rev. | | | | |
| (College of Arts & Crafts) | 5.750% | 6/1/25 | 2,000 | 1,992 |
| California Educ. Fac. Auth. Rev. (Pomona College) | 0.000% | 7/1/34 | 3,155 | 901 |
| California Educ. Fac. Auth. Rev. (Pomona College) | 0.000% | 7/1/35 | 3,155 | 828 |
| 1 California Educ. Fac. Auth. Rev. (Pomona College) | 0.000% | 7/1/36 | 3,155 | 782 |
| 1 California Educ. Fac. Auth. Rev. (Pomona College) | 0.000% | 7/1/37 | 3,155 | 738 |
59
| | | | |
| California Long-Term Tax-Exempt Fund | | | | |
| |
| |
| |
| | | | Face | Market |
| | | Maturity | Amount | Value• |
| | Coupon | Date | ($000) | ($000) |
| 1 California Educ. Fac. Auth. Rev. (Pomona College) | 0.000% | 7/1/39 | 2,805 | 584 |
| California Educ. Fac. Auth. Rev. (Pomona College) | 0.000% | 7/1/40 | 1,580 | 309 |
| California Educ. Fac. Auth. Rev. | | | | |
| (St. Mary’s College of California) VRDO | 0.280% | 6/7/10 LOC | 6,095 | 6,095 |
| California Educ. Fac. Auth. Rev. (Stanford Univ.) | 5.000% | 3/15/26 | 5,330 | 6,365 |
| California Educ. Fac. Auth. Rev. | | | | |
| (Univ. of Southern California) | 4.750% | 10/1/37 | 1,650 | 1,663 |
| California Educ. Fac. Auth. Rev. | | | | |
| (Univ. of Southern California) | 5.250% | 10/1/38 | 3,250 | 3,495 |
| 2 California Educ. Fac. Auth. Rev. | | | | |
| (Univ. of Southern California) TOB VRDO | 0.280% | 6/1/10 | 4,750 | 4,750 |
| California Educ. Fac. Auth. Rev. | | | | |
| (Univ. of The Pacific) | 5.000% | 11/1/25 | 2,000 | 2,046 |
| California GO | 6.250% | 9/1/12 (3) | 9,000 | 9,466 |
| California GO | 7.000% | 11/1/13 (14) | 65 | 66 |
| California GO | 5.000% | 10/1/14 | 1,900 | 2,126 |
| California GO | 5.250% | 10/1/14 (3)(14) | 1,955 | 1,976 |
| California GO | 5.000% | 11/1/14 | 32,840 | 36,789 |
| California GO | 5.000% | 3/1/19 | 1,250 | 1,371 |
| California GO | 6.000% | 4/1/19 | 1,690 | 1,974 |
| California GO | 6.000% | 8/1/19 (3) | 210 | 212 |
| California GO | 5.000% | 11/1/22 | 1,000 | 1,045 |
| California GO | 5.000% | 3/1/25 | 7,000 | 7,245 |
| California GO | 5.000% | 9/1/25 | 16,950 | 17,360 |
| California GO | 5.125% | 2/1/26 | 15,325 | 15,661 |
| California GO | 5.000% | 6/1/26 (14) | 30,000 | 30,622 |
| California GO | 5.000% | 9/1/28 | 11,650 | 11,768 |
| California GO | 5.000% | 10/1/29 | 3,000 | 3,029 |
| California GO | 5.250% | 10/1/29 | 4,700 | 4,840 |
| California GO | 5.750% | 4/1/31 | 15,000 | 15,949 |
| California GO | 5.000% | 6/1/32 | 35,000 | 34,268 |
| California GO | 6.000% | 3/1/33 | 7,000 | 7,667 |
| California GO | 6.500% | 4/1/33 | 30,000 | 33,895 |
| California GO | 5.000% | 6/1/34 | 32,500 | 31,614 |
| California GO | 6.000% | 11/1/35 | 10,000 | 10,932 |
| California GO | 5.250% | 3/1/38 | 18,565 | 18,536 |
| California GO | 6.000% | 4/1/38 | 36,840 | 40,103 |
| California GO | 5.250% | 8/1/38 | 10,000 | 9,985 |
| California GO | 5.500% | 3/1/40 | 7,000 | 7,175 |
| 2 California GO TOB VRDO | 0.340% | 6/1/10 | 6,555 | 6,555 |
| California GO VRDO | 0.310% | 6/1/10 LOC | 13,350 | 13,350 |
| California Health Fac. Finance Auth. Rev. | | | | |
| (Adventist Health System) | 5.000% | 3/1/33 | 7,950 | 7,728 |
| California Health Fac. Finance Auth. Rev. | | | | |
| (California-Nevada Methodist) | 5.000% | 7/1/36 | 2,075 | 1,889 |
| California Health Fac. Finance Auth. Rev. | | | | |
| (Casa Colina) | 6.125% | 4/1/32 | 10,000 | 10,020 |
| California Health Fac. Finance Auth. Rev. | | | | |
| (Catholic Healthcare West) | 4.750% | 7/1/19 (14) | 765 | 765 |
| California Health Fac. Finance Auth. Rev. | | | | |
| (Catholic Healthcare West) | 5.625% | 7/1/25 | 5,000 | 5,354 |
| California Health Fac. Finance Auth. Rev. | | | | |
| (Catholic Healthcare West) | 6.000% | 7/1/39 | 5,000 | 5,377 |
| California Health Fac. Finance Auth. Rev. | | | | |
| (Catholic Healthcare West) PUT | 5.000% | 7/1/14 | 10,000 | 11,069 |
| California Health Fac. Finance Auth. Rev. | | | | |
| (Cedars-Sinai Medical Center) | 5.000% | 11/15/27 | 7,000 | 6,952 |
60
| | | | |
| California Long-Term Tax-Exempt Fund | | | | |
| |
| |
| |
| | | | Face | Market |
| | | Maturity | Amount | Value• |
| | Coupon | Date | ($000) | ($000) |
| California Health Fac. Finance Auth. Rev. | | | | |
| (Children’s Hosp. of Orange County) | 6.500% | 11/1/38 | 3,000 | 3,184 |
| California Health Fac. Finance Auth. Rev. | | | | |
| (Providence Health & Services) | 6.500% | 10/1/33 | 2,000 | 2,277 |
| California Health Fac. Finance Auth. Rev. | | | | |
| (Providence Health & Services) | 5.500% | 10/1/39 | 5,500 | 5,770 |
| California Health Fac. Finance Auth. Rev. | | | | |
| (St. Joseph Health System) | 5.750% | 7/1/39 | 5,000 | 5,215 |
| California Health Fac. Finance Auth. Rev. | | | | |
| (Stanford Hosp.) PUT | 3.450% | 6/15/11 | 5,000 | 5,116 |
| California Health Fac. Finance Auth. Rev. | | | | |
| (Sutter Health) | 5.250% | 8/15/22 | 5,000 | 5,361 |
| California Health Fac. Finance Auth. Rev. | | | | |
| (Sutter Health) | 5.250% | 11/15/46 | 37,500 | 37,054 |
| California Infrastructure & Econ. Dev. Bank Rev. | 5.000% | 2/1/12 | 6,030 | 6,396 |
| California Infrastructure & Econ. Dev. Bank Rev. | 5.000% | 2/1/13 | 8,000 | 8,607 |
| California Infrastructure & Econ. Dev. Bank Rev. | | | | |
| (Academy Motion Picture) VRDO | 0.260% | 6/7/10 LOC | 12,600 | 12,600 |
| California Infrastructure & Econ. Dev. Bank Rev. | | | | |
| (Bay Area Toll) | 5.000% | 1/1/28 (3)(Prere.) | 7,500 | 8,892 |
| California Infrastructure & Econ. Dev. Bank Rev. | | | | |
| (California Science Center) | 5.000% | 5/1/31 (14) | 7,635 | 7,128 |
| California Infrastructure & Econ. Dev. Bank Rev. | | | | |
| (J. David Gladstone Institute) | 5.500% | 10/1/18 | 3,905 | 3,998 |
| California Infrastructure & Econ. Dev. Bank Rev. | | | | |
| (J. David Gladstone Institute) | 5.500% | 10/1/20 | 1,500 | 1,526 |
| California Infrastructure & Econ. Dev. Bank Rev. | | | | |
| (J. David Gladstone Institute) | 5.250% | 10/1/34 | 20,040 | 19,554 |
| California Infrastructure & Econ. Dev. Bank Rev. | | | | |
| (Kaiser Hosp. Assn.) | 5.500% | 8/1/31 | 7,610 | 7,651 |
| California Infrastructure & Econ. Dev. Bank Rev. | | | | |
| (Kaiser Hosp. Assn.) | 5.550% | 8/1/31 | 5,500 | 5,562 |
| California Infrastructure & Econ. Dev. Bank Rev. | | | | |
| (Pacific Gas & Electric) VRDO | 0.230% | 6/1/10 LOC | 2,500 | 2,500 |
| California Infrastructure & Econ. Dev. Bank Rev. | | | | |
| (Pacific Gas & Electric) VRDO | 0.240% | 6/1/10 LOC | 16,280 | 16,280 |
| California Infrastructure & Econ. Dev. Bank Rev. | | | | |
| (Workers’ Compensation) | 5.250% | 10/1/13 (2) | 30,000 | 33,703 |
| California Infrastructure & Econ. Dev. Bank Rev. | | | | |
| (YMCA of Metro. LA) | 5.250% | 2/1/26 (2) | 4,750 | 4,786 |
| California PCR Financing Auth. COP | 5.500% | 2/1/39 | 11,000 | 10,137 |
| California Public Works Board Lease Rev. | 5.000% | 11/1/17 | 5,000 | 5,364 |
| California Public Works Board Lease Rev. | 6.250% | 11/1/24 | 5,000 | 5,580 |
| California Public Works Board Lease Rev. | | | | |
| (California Community College) | 5.000% | 3/1/27 (14) | 6,220 | 6,095 |
| California Public Works Board Lease Rev. | | | | |
| (Dept. of Corrections) | 5.000% | 1/1/15 (2) | 4,000 | 4,282 |
| California Public Works Board Lease Rev. | | | | |
| (Dept. of Corrections) | 5.000% | 1/1/17 | 6,000 | 6,369 |
| California Public Works Board Lease Rev. | | | | |
| (Dept. of Corrections) | 6.500% | 9/1/17 (2) | 30,000 | 33,123 |
| California Public Works Board Lease Rev. | | | | |
| (Dept. of Corrections) | 5.000% | 12/1/17 (14) | 13,835 | 14,475 |
| California Public Works Board Lease Rev. | | | | |
| (Dept. of Corrections) | 5.000% | 12/1/19 (14) | 15,230 | 15,668 |
61
| | | | |
| California Long-Term Tax-Exempt Fund | | | | |
| |
| |
| |
| | | | Face | Market |
| | | Maturity | Amount | Value• |
| | Coupon | Date | ($000) | ($000) |
| California Public Works Board Lease Rev. | | | | |
| (Dept. of Forestry & Fire Services) | 5.000% | 11/1/32 | 13,850 | 12,946 |
| California Public Works Board Lease Rev. | | | | |
| (Dept. of General Services) | 6.000% | 4/1/25 | 6,000 | 6,519 |
| California Public Works Board Lease Rev. | | | | |
| (Dept. of General Services) | 6.250% | 4/1/34 | 6,975 | 7,332 |
| California Public Works Board Lease Rev. | | | | |
| (Office of Emergency Services) | 5.000% | 3/1/27 (14) | 8,950 | 8,770 |
| California Public Works Board Lease Rev. | | | | |
| (Univ. of California) | 5.250% | 11/1/27 (14) | 9,045 | 9,457 |
| California Public Works Board Lease Rev. | | | | |
| (Univ. of California) | 5.000% | 5/1/30 | 17,000 | 17,259 |
| California State Dept. of Water Resources | | | | |
| Power Supply Rev. | 6.000% | 5/1/13 | 13,000 | 14,405 |
| California State Dept. of Water Resources | | | | |
| Power Supply Rev. | 5.000% | 5/1/18 | 8,000 | 9,083 |
| California State Dept. of Water Resources | | | | |
| Power Supply Rev. | 5.000% | 5/1/19 | 10,000 | 11,335 |
| California State Dept. of Water Resources | | | | |
| Power Supply Rev. | 5.000% | 5/1/20 | 5,000 | 5,659 |
| California State Dept. of Water Resources | | | | |
| Power Supply Rev. | 5.000% | 5/1/21 | 5,000 | 5,590 |
| California State Dept. of Water Resources | | | | |
| Power Supply Rev. | 5.000% | 5/1/22 | 30,000 | 32,721 |
| California State Dept. of Water Resources | | | | |
| Power Supply Rev. VRDO | 0.250% | 6/1/10 LOC | 100 | 100 |
| California State Econ. Recovery Bonds | 5.250% | 7/1/13 | 7,750 | 8,647 |
| California State Econ. Recovery Bonds | 5.000% | 7/1/17 (14) | 25,000 | 25,964 |
| California State Econ. Recovery Bonds | 5.000% | 7/1/18 | 1,500 | 1,702 |
| California State Econ. Recovery Bonds | 5.000% | 7/1/19 | 9,290 | 10,467 |
| California State Econ. Recovery Bonds | 5.000% | 7/1/20 | 7,855 | 8,753 |
| California State Econ. Recovery Bonds | 5.250% | 7/1/21 | 16,985 | 19,036 |
| California State Econ. Recovery Bonds | 5.000% | 7/1/22 | 5,000 | 5,308 |
| California State Econ. Recovery Bonds PUT | 5.000% | 7/1/11 (Prere.) | 32,000 | 33,616 |
| California State Univ. Rev. Systemwide | 5.250% | 11/1/19 (4) | 5,000 | 5,579 |
| California State Univ. Rev. Systemwide | 5.250% | 11/1/20 (4) | 4,745 | 5,295 |
| California State Univ. Rev. Systemwide | 5.000% | 11/1/21 (2) | 17,215 | 18,336 |
| California State Univ. Rev. Systemwide | 5.750% | 11/1/27 | 4,500 | 4,997 |
| California State Univ. Rev. Systemwide | 5.250% | 11/1/34 | 5,000 | 5,247 |
| California Statewide Communities Dev. Auth. Rev. | 5.000% | 6/15/13 | 9,000 | 9,789 |
| California Statewide Communities Dev. Auth. Rev. | | | | |
| (Adventist Health) | 5.000% | 3/1/35 | 14,500 | 14,019 |
| California Statewide Communities Dev. Auth. Rev. | | | | |
| (Cottage Health Systems) VRDO | 0.170% | 6/7/10 LOC | 2,700 | 2,700 |
| California Statewide Communities Dev. Auth. Rev. | | | | |
| (Daughters of Charity Health) | 5.250% | 7/1/30 | 5,000 | 4,549 |
| California Statewide Communities Dev. Auth. Rev. | | | | |
| (Daughters of Charity Health) | 5.250% | 7/1/35 | 5,250 | 4,625 |
| California Statewide Communities Dev. Auth. Rev. | | | | |
| (Daughters of Charity Health) | 5.000% | 7/1/39 | 5,000 | 4,202 |
| California Statewide Communities Dev. Auth. Rev. | | | | |
| (Henry Mayo Newhall Memorial Hosp.) | 5.000% | 10/1/18 | 5,875 | 5,891 |
| California Statewide Communities Dev. Auth. Rev. | | | | |
| (Irvine Univ. of California East LLC) | 5.000% | 5/15/38 | 18,000 | 16,602 |
| California Statewide Communities Dev. Auth. Rev. | | | | |
| (John Muir Health Services) | 5.000% | 8/15/34 | 7,390 | 7,148 |
62
| | | | |
| California Long-Term Tax-Exempt Fund | | | | |
| |
| |
| |
| | | | Face | Market |
| | | Maturity | Amount | Value• |
| | Coupon | Date | ($000) | ($000) |
| California Statewide Communities Dev. Auth. Rev. | | | | |
| (Kaiser Permanente) | 5.500% | 11/1/32 | 18,250 | 18,493 |
| California Statewide Communities Dev. Auth. Rev. | | | | |
| (Kaiser Permanente) | 5.250% | 3/1/45 | 24,000 | 23,510 |
| California Statewide Communities Dev. Auth. Rev. | | | | |
| (Los Angeles Orthopedic Hosp. Foundation) | 5.750% | 6/1/30 (2) | 6,680 | 6,579 |
| California Statewide Communities Dev. Auth. Rev. | | | | |
| (Memorial Health Services) | 6.000% | 10/1/23 | 8,500 | 8,874 |
| California Statewide Communities Dev. Auth. Rev. | | | | |
| (Presbyterian Homes) | 4.875% | 11/15/36 | 7,230 | 6,107 |
| California Statewide Communities Dev. Auth. Rev. | | | | |
| (Presbyterian Homes) | 7.250% | 11/15/41 | 3,000 | 3,263 |
| California Statewide Communities Dev. Auth. Rev. | | | | |
| (Sutter Health) | 5.500% | 8/15/34 | 10,885 | 10,949 |
| Chabot-Las Positas CA Community College Dist. | 5.000% | 8/1/29 (2) | 12,605 | 12,913 |
| Chino Basin CA Regional Financing Auth. Rev. | | | | |
| (Muni. Water Dist. Sewer System) | 6.000% | 8/1/16 (2) | 5,500 | 5,523 |
| Clovis CA USD GO | 0.000% | 8/1/13 (14) | 4,935 | 4,606 |
| Clovis CA USD GO | 0.000% | 8/1/15 (14) | 2,770 | 2,358 |
| Clovis CA USD GO | 0.000% | 8/1/16 (14) | 2,865 | 2,308 |
| East Bay CA Muni. Util. Dist. Water System Rev. | 5.000% | 6/1/32 (14) | 15,765 | 16,661 |
| East Bay CA Muni. Util. Dist. Water System Rev. | 5.000% | 6/1/36 | 10,000 | 10,631 |
| East Bay CA Regional Park Dist. Rev. | 5.000% | 9/1/25 | 2,000 | 2,247 |
| East Bay CA Regional Park Dist. Rev. | 5.000% | 9/1/27 | 4,070 | 4,508 |
| Eastern California Muni. Water. Dist. Water & | | | | |
| Sewer Rev. | 6.750% | 7/1/12 (14) | 6,580 | 6,939 |
| Escondido CA Union High School Dist. | 0.000% | 11/1/20 (14) | 4,000 | 2,306 |
| Fontana CA Public Finance Auth. Subordinate | | | | |
| Lien Tax Allocation Rev. Bonds | 5.000% | 10/1/29 (2) | 9,450 | 8,912 |
| Fontana CA Public Finance Auth. Subordinate | | | | |
| Lien Tax Allocation Rev. Bonds | 5.000% | 10/1/32 (2) | 12,825 | 11,881 |
| Fontana CA USD | 5.250% | 8/1/27 (4) | 6,700 | 7,139 |
| Fontana CA USD | 5.250% | 8/1/31 (4) | 6,115 | 6,411 |
| Foothill-De Anza CA Community College Dist. GO | 0.000% | 8/1/17 (14) | 3,000 | 2,322 |
| Foothill-De Anza CA Community College Dist. GO | 0.000% | 8/1/22 (14) | 3,850 | 2,236 |
| Foothill-De Anza CA Community College Dist. GO | 0.000% | 8/1/23 (14) | 3,590 | 1,946 |
| Foothill-De Anza CA Community College Dist. GO | 0.000% | 8/1/25 (14) | 2,390 | 1,148 |
| Foothill/Eastern Corridor Agency California | | | | |
| Toll Road Rev. | 5.875% | 1/15/26 | 10,000 | 10,164 |
| Foothill/Eastern Corridor Agency California | | | | |
| Toll Road Rev. | 0.000% | 1/1/29 (ETM) | 7,460 | 3,364 |
| Foothill/Eastern Corridor Agency California | | | | |
| Toll Road Rev. | 0.000% | 1/15/33 | 10,000 | 2,085 |
| Foothill/Eastern Corridor Agency California | | | | |
| Toll Road Rev. | 0.000% | 1/15/34 | 10,000 | 1,945 |
| Fresno CA Airport Rev. | 5.500% | 7/1/30 (4) | 1,500 | 1,510 |
| Fullerton Univ. California Rev. | 5.700% | 7/1/10 (14)(Prere.) | 2,165 | 2,197 |
| Galivan CA Joint Community College Dist. | 5.500% | 8/1/28 (2) | 3,405 | 3,559 |
| Glendora CA USD GO | 0.000% | 8/1/37 (12) | 5,900 | 1,032 |
| Glendora CA USD GO | 0.000% | 8/1/38 (12) | 5,900 | 960 |
| Glendora CA USD GO | 0.000% | 8/1/39 (12) | 5,175 | 787 |
| Golden State Tobacco Securitization Corp. California | 5.500% | 6/1/13 (10)(Prere.) | 4,000 | 4,497 |
| Golden State Tobacco Securitization Corp. California | 6.250% | 6/1/13 (Prere.) | 35,105 | 39,100 |
| Golden State Tobacco Securitization Corp. California | 4.500% | 6/1/27 | 13,455 | 12,119 |
| Golden State Tobacco Securitization Corp. California | 5.000% | 6/1/30 (2) | 20,000 | 19,005 |
| Golden State Tobacco Securitization Corp. California | 5.000% | 6/1/33 | 8,525 | 6,753 |
63
| | | | |
| California Long-Term Tax-Exempt Fund | | | | |
| |
| |
| |
| | | | Face | Market |
| | | Maturity | Amount | Value• |
| | Coupon | Date | ($000) | ($000) |
| Golden State Tobacco Securitization Corp. California | 0.000% | 6/1/37 | 20,000 | 12,809 |
| Golden State Tobacco Securitization Corp. California | 5.125% | 6/1/47 | 8,000 | 5,250 |
| Golden State Tobacco Securitization Corp. California | 5.750% | 6/1/47 | 4,000 | 2,919 |
| Hartnell CA Community College Dist. GO | 5.000% | 8/1/13 (14)(Prere.) | 1,735 | 1,955 |
| Hartnell CA Community College Dist. GO | 5.000% | 8/1/13 (14)(Prere.) | 2,370 | 2,670 |
| Hartnell CA Community College Dist. GO | 5.000% | 8/1/13 (14)(Prere.) | 1,550 | 1,746 |
| 3 Irvine CA Ranch Water Dist. Rev. VRDO | 0.220% | 6/7/10 LOC | 5,000 | 5,000 |
| Irvine CA USD Financing Auth. Special Tax | 5.000% | 9/1/30 (2) | 8,000 | 7,684 |
| Kern CA High School Dist. GO | 6.400% | 8/1/14 (14)(ETM) | 1,490 | 1,802 |
| Kern CA High School Dist. GO | 6.400% | 8/1/15 (14)(ETM) | 1,645 | 2,036 |
| Kern CA High School Dist. GO | 6.400% | 8/1/16 (14)(ETM) | 1,815 | 2,271 |
| Kern County CA GO | 5.750% | 8/1/35 (12) | 2,000 | 2,126 |
| La Mesa-Spring Valley CA School Dist. GO | 5.375% | 8/1/12 (3)(Prere.) | 1,775 | 1,955 |
| La Mesa-Spring Valley CA School Dist. GO | 5.375% | 8/1/12 (3)(Prere.) | 1,570 | 1,730 |
| La Mesa-Spring Valley CA School Dist. GO | 5.375% | 8/1/12 (3)(Prere.) | 2,000 | 2,203 |
| La Mesa-Spring Valley CA School Dist. GO | 5.375% | 8/1/12 (3)(Prere.) | 1,890 | 2,082 |
| Loma Linda CA Hosp. Rev. (Loma Linda Univ.) | 5.000% | 12/1/20 | 6,155 | 6,071 |
| Loma Linda CA Hosp. Rev. (Loma Linda Univ.) | 5.000% | 12/1/21 | 2,500 | 2,438 |
| Long Beach CA Finance Auth. Lease Rev. | | | | |
| (Aquarium of the South Pacific) | 5.500% | 11/1/13 (2) | 3,680 | 3,798 |
| Long Beach CA Finance Auth. Lease Rev. | | | | |
| (Aquarium of the South Pacific) | 5.500% | 11/1/18 (2) | 4,675 | 4,728 |
| Long Beach CA Finance Auth. Lease Rev. | | | | |
| (Temple & Willis Fac.) | 5.500% | 10/1/18 (14) | 5,030 | 5,064 |
| Long Beach CA Finance Auth. Natural Gas | | | | |
| Purchase Rev. | 5.500% | 11/15/37 | 5,500 | 5,370 |
| Long Beach CA Finance Auth. Rev. | 1.742% | 11/15/27 | 21,130 | 16,297 |
| Long Beach CA Finance Auth. Tax Rev. | 5.500% | 8/1/26 (2) | 7,570 | 7,545 |
| Long Beach CA Finance Auth. Tax Rev. | 5.500% | 8/1/31 (2) | 4,015 | 3,845 |
| Long Beach CA Harbor Rev. | 5.000% | 5/15/17 (14) | 3,655 | 4,066 |
| Los Angeles CA Community College Dist. GO | 5.500% | 8/1/25 | 3,980 | 4,464 |
| Los Angeles CA Community College Dist. GO | 5.000% | 8/1/32 (14) | 7,340 | 7,544 |
| Los Angeles CA Community College Dist. GO | 5.000% | 8/1/33 | 10,000 | 10,283 |
| Los Angeles CA Community College Dist. GO | 6.000% | 8/1/33 | 5,000 | 5,634 |
| Los Angeles CA Dept. of Airports International | | | | |
| Airport Rev. | 5.250% | 5/15/17 (14) | 6,800 | 7,329 |
| Los Angeles CA Dept. of Airports International | | | | |
| Airport Rev. | 5.000% | 5/15/29 | 15,000 | 15,732 |
| Los Angeles CA Dept. of Airports International | | | | |
| Airport Rev. | 5.000% | 5/15/40 | 2,215 | 2,262 |
| Los Angeles CA Dept. of Water & Power Rev. | 5.000% | 7/1/25 (4) | 10,000 | 10,541 |
| Los Angeles CA Dept. of Water & Power Rev. | 5.000% | 7/1/25 | 4,070 | 4,456 |
| Los Angeles CA Dept. of Water & Power Rev. | 5.000% | 7/1/29 (2) | 10,000 | 10,580 |
| Los Angeles CA Dept. of Water & Power Rev. | 5.000% | 7/1/30 (2) | 16,000 | 16,817 |
| Los Angeles CA Dept. of Water & Power Rev. | 5.000% | 7/1/32 (2) | 5,000 | 5,206 |
| Los Angeles CA Dept. of Water & Power Rev. | 5.250% | 7/1/32 | 7,000 | 7,569 |
| Los Angeles CA Dept. of Water & Power Rev. | 5.000% | 7/1/36 (14) | 2,000 | 2,020 |
| Los Angeles CA Dept. of Water & Power Rev. | 5.250% | 7/1/38 | 1,890 | 1,997 |
| Los Angeles CA Dept. of Water & Power Rev. | 5.000% | 7/1/39 (2) | 8,875 | 9,136 |
| Los Angeles CA Dept. of Water & Power Rev. | | | | |
| VRDO | 0.240% | 6/1/10 | 10,000 | 10,000 |
| Los Angeles CA Harbor Dept. Rev. | 5.250% | 8/1/39 | 4,000 | 4,193 |
| Los Angeles CA USD GO | 5.000% | 7/1/13 (4)(Prere.) | 10,000 | 11,237 |
| Los Angeles CA USD GO | 5.000% | 7/1/13 | 5,000 | 5,560 |
| Los Angeles CA USD GO | 5.000% | 7/1/14 | 5,000 | 5,620 |
| Los Angeles CA USD GO | 5.500% | 7/1/17 (3) | 5,000 | 5,833 |
64
| | | | |
| California Long-Term Tax-Exempt Fund | | | | |
| |
| |
| |
| | | | Face | Market |
| | | Maturity | Amount | Value• |
| | Coupon | Date | ($000) | ($000) |
| Los Angeles CA USD GO | 5.000% | 7/1/19 | 3,950 | 4,489 |
| Los Angeles CA USD GO | 5.000% | 7/1/20 (3) | 6,655 | 7,202 |
| Los Angeles CA USD GO | 5.000% | 7/1/21 | 3,500 | 3,897 |
| Los Angeles CA USD GO | 5.000% | 7/1/24 (2) | 7,500 | 7,952 |
| Los Angeles CA USD GO | 5.000% | 7/1/24 (2) | 9,745 | 10,332 |
| Los Angeles CA USD GO | 5.250% | 7/1/24 | 6,275 | 6,928 |
| Los Angeles CA USD GO | 5.250% | 7/1/25 | 5,000 | 5,476 |
| Los Angeles CA USD GO | 5.250% | 7/1/28 | 7,000 | 7,528 |
| Los Angeles CA USD GO | 5.000% | 7/1/30 (3) | 7,500 | 7,678 |
| Los Angeles CA USD GO | 5.000% | 7/1/30 (2) | 10,875 | 11,105 |
| Los Angeles CA USD GO | 5.000% | 7/1/32 (4) | 8,000 | 8,158 |
| Los Angeles CA USD GO | 5.000% | 1/1/34 | 5,000 | 5,087 |
| Los Angeles CA USD GO | 5.250% | 7/1/34 | 10,000 | 10,569 |
| Los Angeles CA Wastewater System Rev. | 4.750% | 6/1/30 (4) | 4,645 | 4,658 |
| Los Angeles County CA Public Works | | | | |
| Financing Auth. Rev. | 5.500% | 10/1/18 (4) | 2,315 | 2,627 |
| Los Angeles County CA Public Works | | | | |
| Financing Auth. Rev. | 5.000% | 12/1/23 (14) | 4,000 | 4,054 |
| Los Angeles County CA Public Works | | | | |
| Financing Auth. Rev. | 5.000% | 12/1/24 (14) | 4,000 | 4,031 |
| Los Angeles County CA Public Works | | | | |
| Financing Auth. Rev. | 5.000% | 12/1/25 (14) | 2,165 | 2,173 |
| Los Angeles County CA Sanitation Dist. | | | | |
| Financing Auth Rev. | 4.500% | 10/1/42 (2) | 15,000 | 13,152 |
| Los Angeles County CA Schools COP | 0.000% | 8/1/14 (2)(ETM) | 1,000 | 856 |
| Los Angeles County CA Schools COP | 0.000% | 8/1/20 (2) | 2,095 | 1,177 |
| M-S-R California Energy Auth. Rev. | 7.000% | 11/1/34 | 7,000 | 8,181 |
| M-S-R California Energy Auth. Rev. | 6.500% | 11/1/39 | 7,000 | 7,730 |
| M-S-R California Public Power Agency Rev. | | | | |
| (San Juan Project) | 6.125% | 7/1/13 (2) | 6,585 | 6,924 |
| M-S-R California Public Power Agency Rev. | | | | |
| (San Juan Project) | 6.750% | 7/1/20 (14)(ETM) | 29,155 | 35,569 |
| Metro. Water Dist. of Southern California Rev. | 5.000% | 7/1/25 | 3,410 | 3,740 |
| Metro. Water Dist. of Southern California Rev. | 5.000% | 7/1/28 | 4,235 | 4,514 |
| Metro. Water Dist. of Southern California Rev. | 5.000% | 7/1/31 | 6,000 | 6,444 |
| Modesto CA High School Dist. GO | 0.000% | 8/1/15 (14) | 5,000 | 4,196 |
| Modesto CA High School Dist. GO | 0.000% | 8/1/17 (14) | 3,000 | 2,198 |
| Modesto CA High School Dist. GO | 0.000% | 8/1/18 (14) | 3,225 | 2,190 |
| Modesto CA Irrigation Dist. COP | 5.500% | 7/1/35 | 3,000 | 3,181 |
| Modesto CA Irrigation Dist. COP | 5.000% | 10/1/36 (2) | 4,795 | 4,767 |
| Modesto CA Irrigation Dist. Finance Auth. Rev. | | | | |
| (Woodland Project) | 6.500% | 10/1/11 (2)(ETM) | 3,060 | 3,205 |
| Modesto CA Irrigation Dist. Finance Auth. Rev. | | | | |
| (Woodland Project) | 6.500% | 10/1/22 (2)(ETM) | 9,750 | 12,104 |
| Monterey Park CA Redev. Agency Tax Allocation | 5.000% | 9/1/16 (4) | 1,010 | 1,052 |
| Monterey Park CA Redev. Agency Tax Allocation | 5.000% | 9/1/17 (4) | 1,060 | 1,098 |
| Monterey Park CA Redev. Agency Tax Allocation | 5.000% | 9/1/18 (4) | 1,115 | 1,150 |
| Monterey Park CA Redev. Agency Tax Allocation | 5.000% | 9/1/19 (4) | 1,120 | 1,151 |
| Monterey Park CA Redev. Agency Tax Allocation | 5.000% | 9/1/20 (4) | 1,180 | 1,208 |
| Mount San Antonio California Community | | | | |
| College Dist. | 5.250% | 8/1/14 (14)(Prere.) | 3,010 | 3,494 |
| Mount San Antonio California Community | | | | |
| College Dist. | 5.250% | 8/1/14 (14)(Prere.) | 3,170 | 3,679 |
| Mount San Antonio California Community | | | | |
| College Dist. | 5.250% | 8/1/14 (14)(Prere.) | 3,335 | 3,871 |
| Napa Valley CA USD Election GO | 4.500% | 8/1/42 (4) | 10,290 | 9,706 |
65
| | | | |
| California Long-Term Tax-Exempt Fund | | | | |
| |
| |
| |
| | | | Face | Market |
| | | Maturity | Amount | Value• |
| | Coupon | Date | ($000) | ($000) |
| New Haven CA USD GO | 12.000% | 8/1/16 (4) | 2,480 | 3,842 |
| New Haven CA USD GO | 12.000% | 8/1/17 (4) | 1,500 | 2,405 |
| Newark CA USD GO | 0.000% | 8/1/11 (4) | 1,670 | 1,649 |
| Newark CA USD GO | 0.000% | 8/1/12 (4) | 1,820 | 1,764 |
| Newark CA USD GO | 0.000% | 8/1/13 (4) | 2,050 | 1,913 |
| North Orange County CA Community | | | | |
| College Dist. GO | 5.375% | 8/1/12 (14)(Prere.) | 5,080 | 5,626 |
| Northern California Gas Auth. No. 1 Rev. | 0.644% | 7/1/13 | 14,000 | 13,195 |
| Northern California Gas Auth. No. 1 Rev. | 0.795% | 7/1/17 | 17,000 | 14,641 |
| Northern California Power Agency | | | | |
| (Hydroelectric Project) | 5.000% | 7/1/11 | 2,000 | 2,084 |
| Northern California Power Agency | | | | |
| (Hydroelectric Project) | 5.000% | 7/1/12 | 2,935 | 3,150 |
| Northern California Power Agency | | | | |
| (Hydroelectric Project) | 6.300% | 7/1/18 (14) | 10,000 | 11,490 |
| Northern California Power Agency | | | | |
| (Hydroelectric Project) | 7.500% | 7/1/21 (2)(Prere.) | 1,810 | 2,452 |
| Northern California Power Agency | | | | |
| (Hydroelectric Project) | 5.000% | 7/1/28 (14) | 11,140 | 11,140 |
| Northern California Power Agency Rev. | 5.000% | 7/1/18 | 3,500 | 3,871 |
| Oakland CA Redev. Agency (Central Dist.) | 5.500% | 2/1/14 (2) | 3,745 | 3,811 |
| Oakland CA Redev. Agency Tax Allocation | | | | |
| (Coliseum Area) | 5.250% | 3/1/13 (Prere.) | 2,380 | 2,659 |
| Oakland CA Redev. Agency Tax Allocation | | | | |
| (Coliseum Area) | 5.250% | 3/1/13 (Prere.) | 3,730 | 4,167 |
| Oceanside CA Community Dev. Comm. | | | | |
| Multifamily Rental Housing Rev. PUT | 4.450% | 4/1/11 | 4,260 | 4,273 |
| Oceanside CA USD GO | 0.000% | 8/1/25 (12) | 6,865 | 2,921 |
| Orange County CA Water Dist. Rev. | 5.000% | 8/15/41 | 6,855 | 7,093 |
| Palmdale CA COP | 5.250% | 9/1/19 (14) | 1,310 | 1,434 |
| Palmdale CA COP | 5.250% | 9/1/20 (14) | 1,450 | 1,583 |
| Palmdale CA COP | 5.250% | 9/1/21 (14) | 1,605 | 1,737 |
| Palmdale CA COP | 5.250% | 9/1/22 (14) | 1,765 | 1,866 |
| Palo Alto CA Improvement Rev. | | | | |
| (Univ. Avenue Area Parking) | 5.700% | 9/2/18 | 890 | 910 |
| Palo Alto CA Improvement Rev. | | | | |
| (Univ. Avenue Area Parking) | 5.700% | 9/2/19 | 895 | 915 |
| Palo Alto CA Improvement Rev. | | | | |
| (Univ. Avenue Area Parking) | 5.750% | 9/2/20 | 890 | 909 |
| Palo Alto CA Improvement Rev. | | | | |
| (Univ. Avenue Area Parking) | 5.750% | 9/2/26 | 4,460 | 4,530 |
| Palomar Pomerado Health System California GO | 4.500% | 8/1/32 (14) | 12,500 | 11,448 |
| Palomar Pomerado Health System California Rev. | 5.375% | 11/1/11 (14) | 3,865 | 3,873 |
| Palomar Pomerado Health System California Rev. | 5.375% | 11/1/13 (14) | 6,730 | 6,739 |
| Peralta CA Community College Dist. Rev. | 5.000% | 8/1/39 | 5,000 | 5,122 |
| Pittsburg CA Redev. Agency Tax Allocation | | | | |
| (Los Medanos Community Dev.) | 5.700% | 8/1/13 (4)(Prere.) | 7,000 | 8,176 |
| Pittsburg CA Redev. Agency Tax Allocation | | | | |
| (Los Medanos Community Dev.) | 0.000% | 8/1/19 (2) | 1,150 | 667 |
| Pittsburg CA Redev. Agency Tax Allocation | | | | |
| (Los Medanos Community Dev.) | 0.000% | 8/1/21 (2) | 2,575 | 1,299 |
| Pittsburg CA Redev. Agency Tax Allocation | | | | |
| (Los Medanos Community Dev.) | 0.000% | 8/1/22 (2) | 3,755 | 1,775 |
| Pittsburg CA Redev. Agency Tax Allocation | | | | |
| (Los Medanos Community Dev.) | 0.000% | 8/1/24 (2) | 1,000 | 408 |
| Pomona CA USD GO | 5.600% | 8/1/14 (14)(ETM) | 1,585 | 1,865 |
66
| | | | |
| California Long-Term Tax-Exempt Fund | | | | |
| |
| |
| |
| | | | Face | Market |
| | | Maturity | Amount | Value• |
| | Coupon | Date | ($000) | ($000) |
| Pomona CA USD GO | 5.600% | 8/1/15 (14)(ETM) | 2,000 | 2,396 |
| Pomona CA USD GO | 5.600% | 8/1/16 (14)(ETM) | 1,000 | 1,206 |
| Pomona CA USD GO | 7.500% | 8/1/17 (14)(ETM) | 2,540 | 3,385 |
| Port of Oakland CA Rev. | 5.000% | 11/1/16 (14) | 8,160 | 8,960 |
| Port of Oakland CA Rev. | 5.000% | 11/1/17 (14) | 5,000 | 5,498 |
| Port of Oakland CA Rev. | 5.000% | 11/1/18 (14) | 12,000 | 13,109 |
| Rancho Mirage CA Joint Powers Financing | | | | |
| Auth. Rev. (Eisenhower Medical Center) | 5.625% | 7/1/14 (Prere.) | 12,000 | 14,040 |
| Rancho Mirage CA Joint Powers Financing | | | | |
| Auth. Rev. (Eisenhower Medical Center) | 5.000% | 7/1/47 | 15,900 | 14,286 |
| Rancho Mirage CA Redev. Agency Tax Allocation | 5.125% | 4/1/21 (14) | 2,650 | 2,674 |
| Rancho Mirage CA Redev. Agency Tax Allocation | 5.250% | 4/1/26 (14) | 2,905 | 2,908 |
| Rancho Mirage CA Redev. Agency Tax Allocation | 5.250% | 4/1/33 (14) | 3,000 | 2,854 |
| Rio Hondo CA Community College | 5.000% | 8/1/30 | 6,655 | 6,928 |
| 2 Riverside CA Electric Rev. TOB VRDO | 0.300% | 6/1/10 (4) | 6,750 | 6,750 |
| Riverside CA USD GO | 5.250% | 8/1/38 (12) | 10,000 | 10,314 |
| Riverside CA USD Special Tax | | | | |
| (Community Fac. Dist. 7–Victoria Grove) | 5.000% | 9/1/31 (2) | 7,295 | 6,780 |
| Riverside County CA Asset Leasing Corp. | | | | |
| Leasehold Rev. (Riverside County Hosp.) | 0.000% | 6/1/13 (14) | 5,000 | 4,516 |
| Riverside County CA Asset Leasing Corp. | | | | |
| Leasehold Rev. (Riverside County Hosp.) | 0.000% | 6/1/14 (14) | 2,000 | 1,725 |
| Riverside County CA Asset Leasing Corp. | | | | |
| Leasehold Rev. (Riverside County Hosp.) | 0.000% | 6/1/15 (14) | 2,000 | 1,630 |
| Sacramento CA Financing Auth. Lease Rev. | 5.375% | 11/1/14 (2) | 8,330 | 8,830 |
| Sacramento CA Financing Auth. Lease Rev. | 5.400% | 11/1/20 (2) | 6,785 | 7,247 |
| Sacramento CA Muni. Util. Dist. Rev. | 5.900% | 7/1/20 (2) | 15,850 | 18,789 |
| Sacramento County CA Airport Rev. | 5.250% | 7/1/12 (4)(Prere.) | 2,305 | 2,526 |
| Sacramento County CA Public Fac. Finance Corp. | | | | |
| COP (Main Detention Fac.) | 5.500% | 6/1/10 (14)(ETM) | 1,315 | 1,316 |
| Sacramento County CA Sanitation Dist. | | | | |
| Financing Auth. | 5.000% | 12/1/26 (14) | 5,000 | 5,254 |
| Sacramento County CA Sanitation Dist. | | | | |
| Financing Auth. | 5.000% | 12/1/30 (14) | 5,650 | 5,836 |
| Sacramento County CA Water Financing | | | | |
| Auth. Rev. Agency Zones | 5.000% | 6/1/21 (14) | 2,000 | 2,108 |
| San Bernardino County CA Medical Center COP | 6.500% | 8/1/17 (14) | 17,915 | 19,156 |
| San Diego CA Community College Dist. GO | 5.250% | 8/1/33 | 2,500 | 2,659 |
| San Diego CA Public Fac. Financing | | | | |
| Auth. Sewer Rev. | 5.250% | 5/15/34 | 6,000 | 6,388 |
| San Diego CA Public Fac. Financing | | | | |
| Auth. Sewer Rev. | 5.250% | 5/15/39 | 2,000 | 2,120 |
| San Diego CA Public Fac. Financing | | | | |
| Auth. Water Rev. | 5.750% | 8/1/35 | 2,500 | 2,762 |
| San Diego CA Public Fac. Financing | | | | |
| Auth. Water Rev. | 5.500% | 8/1/39 | 5,000 | 5,392 |
| San Diego CA USD GO | 0.000% | 7/1/15 (14) | 2,770 | 2,400 |
| San Diego CA USD GO | 5.500% | 7/1/24 (14) | 10,000 | 11,877 |
| San Diego CA USD GO | 5.500% | 7/1/24 (4) | 14,015 | 16,246 |
| San Diego CA USD GO | 5.500% | 7/1/25 (14) | 9,000 | 10,653 |
| San Diego CA Water Auth. Rev. COP | 5.000% | 5/1/26 (4) | 7,275 | 7,770 |
| San Diego County CA COP | 5.250% | 10/1/21 | 1,485 | 1,502 |
| San Diego County CA COP | 5.000% | 2/1/28 (2) | 2,000 | 2,028 |
| San Diego County CA COP | 5.250% | 10/1/28 | 2,745 | 2,754 |
| San Diego County CA COP | 5.000% | 2/1/30 (2) | 2,345 | 2,365 |
| San Diego County CA COP | 5.375% | 10/1/41 | 8,545 | 8,549 |
67
| | | | |
| California Long-Term Tax-Exempt Fund | | | | |
| |
| |
| |
| | | | Face | Market |
| | | Maturity | Amount | Value• |
| | Coupon | Date | ($000) | ($000) |
| San Francisco CA Bay Area Rapid Transit Rev. | 5.000% | 8/1/35 | 10,000 | 10,548 |
| San Francisco CA City & County International | | | | |
| Airport Rev. | 5.250% | 5/1/12 (14)(Prere.) | 4,305 | 4,684 |
| San Francisco CA City & County International | | | | |
| Airport Rev. | 5.250% | 5/1/12 (14)(Prere.) | 4,770 | 5,190 |
| San Francisco CA City & County International | | | | |
| Airport Rev. | 5.250% | 5/1/12 (14)(Prere.) | 5,020 | 5,462 |
| San Francisco CA City & County International | | | | |
| Airport Rev. | 5.000% | 5/1/18 | 6,300 | 7,073 |
| San Francisco CA City & County International | | | | |
| Airport Rev. | 5.000% | 5/1/19 | 12,000 | 13,444 |
| San Francisco CA City & County International | | | | |
| Airport Rev. | 5.000% | 5/1/20 | 5,150 | 5,753 |
| San Francisco CA City & County Public Util. | | | | |
| Comm. Rev. | 5.000% | 11/1/35 | 2,605 | 2,706 |
| San Francisco CA City & County Public Util. | | | | |
| Comm. Rev. | 4.750% | 11/1/36 (4) | 5,000 | 5,041 |
| San Francisco CA City & County Redev. Financing | | | | |
| Auth. Tax Allocation (Mission Bay North) | 6.500% | 8/1/39 | 2,000 | 2,157 |
| San Francisco CA City & County USD | 5.250% | 6/15/24 | 4,000 | 4,415 |
| San Joaquin Hills CA Transp. Corridor Agency | | | | |
| Toll Road Rev. | 0.000% | 1/15/24 (14) | 15,000 | 5,217 |
| San Joaquin Hills CA Transp. Corridor Agency | | | | |
| Toll Road Rev. | 0.000% | 1/15/25 (14) | 18,250 | 5,833 |
| San Joaquin Hills CA Transp. Corridor Agency | | | | |
| Toll Road Rev. | 0.000% | 1/15/30 (14) | 7,000 | 1,487 |
| San Joaquin Hills CA Transp. Corridor Agency | | | | |
| Toll Road Rev. | 0.000% | 1/15/31 (14) | 11,950 | 2,272 |
| San Jose CA Airport Rev. | 5.000% | 3/1/33 (2) | 13,000 | 12,877 |
| San Jose CA Redev. Agency | 6.000% | 8/1/11 (14)(ETM) | 2,915 | 3,104 |
| San Jose CA Redev. Agency | 6.000% | 8/1/11 (14) | 5,930 | 6,202 |
| San Jose CA Redev. Agency | 5.000% | 8/1/26 (14) | 5,000 | 4,989 |
| San Jose CA Redev. Agency | 5.500% | 8/1/30 | 850 | 873 |
| San Jose CA Redev. Agency | 5.500% | 8/1/35 | 2,750 | 2,771 |
| San Juan CA USD GO | 0.000% | 8/1/13 (4) | 2,220 | 2,072 |
| San Juan CA USD GO | 0.000% | 8/1/14 (4) | 2,610 | 2,341 |
| San Juan CA USD GO | 0.000% | 8/1/16 (4) | 2,000 | 1,611 |
| San Juan CA USD GO | 0.000% | 8/1/18 (4) | 1,785 | 1,264 |
| San Juan CA USD GO | 0.000% | 8/1/19 (4) | 2,210 | 1,475 |
| San Juan CA USD GO | 0.000% | 8/1/20 (4) | 4,930 | 3,010 |
| San Juan CA USD GO | 0.000% | 8/1/23 (4) | 4,540 | 2,244 |
| San Mateo CA Redev. Auth. Tax Allocation | 5.400% | 8/1/11 (Prere.) | 2,575 | 2,726 |
| San Mateo CA Redev. Auth. Tax Allocation | 5.400% | 8/1/11 (Prere.) | 1,000 | 1,059 |
| San Mateo CA Redev. Auth. Tax Allocation | 5.500% | 8/1/11 (Prere.) | 2,635 | 2,792 |
| San Mateo County CA Community College | | | | |
| Dist. GO | 5.000% | 9/1/31 | 5,000 | 5,154 |
| San Mateo County CA Finance Auth. Rev. | 6.500% | 7/1/13 (14) | 12,000 | 12,913 |
| San Mateo County CA Joint Powers Auth. | | | | |
| Lease Rev. | 5.000% | 7/1/21 (14) | 3,500 | 3,706 |
| San Ramon Valley CA USD GO | 0.000% | 7/1/10 (14) | 7,050 | 7,044 |
| San Ramon Valley CA USD GO | 0.000% | 7/1/12 (14) | 6,645 | 6,407 |
| San Ramon Valley CA USD GO | 0.000% | 7/1/13 (14) | 3,680 | 3,491 |
| San Ramon Valley CA USD GO | 0.000% | 7/1/14 (14) | 8,290 | 7,459 |
| San Ramon Valley CA USD GO | 0.000% | 7/1/15 (14) | 2,005 | 1,722 |
| Santa Ana CA Finance Auth. Rev. | 6.250% | 7/1/16 (14) | 5,345 | 6,058 |
| Santa Ana CA Finance Auth. Rev. | 6.250% | 7/1/17 (14) | 2,000 | 2,265 |
68
| | | | |
| California Long-Term Tax-Exempt Fund | | | | |
| |
| |
| |
| | | | Face | Market |
| | | Maturity | Amount | Value• |
| | Coupon | Date | ($000) | ($000) |
| Santa Clara CA Electric Rev. | 5.000% | 7/1/21 (14) | 4,895 | 5,056 |
| Santa Clara CA Redev. Agency (Bayshore North) | 7.000% | 7/1/10 (2) | 1,595 | 1,603 |
| Santa Clara County CA Financing Auth. Lease Rev. | 5.250% | 5/15/36 | 5,000 | 5,252 |
| Santa Rosa CA Waste Water Rev. | 6.000% | 7/2/15 (2) | 5,995 | 6,582 |
| Santa Rosa CA Waste Water Rev. | 6.000% | 9/1/15 (4) | 5,580 | 6,115 |
| Solano County CA COP | 5.250% | 11/1/12 (14)(Prere.) | 3,785 | 4,176 |
| Solano County CA COP | 5.250% | 11/1/12 (14)(Prere.) | 3,770 | 4,159 |
| South San Francisco CA Redev. Agency | | | | |
| Tax Allocation | 5.000% | 9/1/35 (14) | 8,610 | 7,702 |
| Southern California Public Power Auth. Rev. | | | | |
| (Mead–Adelanto Project) VRDO | 0.250% | 6/1/10 | 13,400 | 13,400 |
| Southern California Public Power Auth. Rev. | | | | |
| (Milford Wind Corridor) | 5.000% | 7/1/30 | 5,000 | 5,157 |
| Southern California Public Power Auth. Rev. | | | | |
| (Natural Gas Project) | 5.000% | 11/1/17 | 1,865 | 1,890 |
| Southern California Public Power Auth. Rev. | | | | |
| (Natural Gas Project) | 5.000% | 11/1/33 | 5,400 | 4,934 |
| Southern California Public Power Auth. Rev. | | | | |
| (Transmission Project) | 5.750% | 7/1/21 (14) | 220 | 221 |
| Southern California Public Power Auth. Rev. | | | | |
| (Transmission Project) | 5.000% | 7/1/23 | 5,000 | 5,427 |
| Tobacco Securitization Auth. Rev. | | | | |
| (Northern California Tobacco Settlement) | 5.375% | 6/1/38 | 2,000 | 1,593 |
| Tobacco Securitization Auth. Rev. | | | | |
| (Southern California Tobacco Settlement) | 4.750% | 6/1/25 | 9,790 | 9,324 |
| 3 Turlock CA IRR Dist. Rev. | 5.000% | 1/1/35 | 3,000 | 3,057 |
| Ukiah CA Electric Rev. | 6.250% | 6/1/18 (14) | 5,085 | 5,473 |
| Union CA Elementary School Dist. GO | 0.000% | 9/1/15 (14) | 3,860 | 3,293 |
| Union CA Elementary School Dist. GO | 0.000% | 9/1/16 (14) | 1,500 | 1,211 |
| Union CA Elementary School Dist. GO | 0.000% | 9/1/17 (14) | 2,295 | 1,747 |
| Union CA Elementary School Dist. GO | 0.000% | 9/1/18 (14) | 1,630 | 1,158 |
| Union CA Elementary School Dist. GO | 0.000% | 9/1/19 (14) | 1,750 | 1,163 |
| Union CA Elementary School Dist. GO | 0.000% | 9/1/20 (14) | 2,300 | 1,413 |
| Union CA Elementary School Dist. GO | 0.000% | 9/1/21 (14) | 2,000 | 1,159 |
| Univ. of California Rev. | 5.750% | 5/15/25 | 7,000 | 8,115 |
| Univ. of California Rev. | 4.750% | 5/15/33 | 12,425 | 12,432 |
| Univ. of California Rev. | 5.000% | 5/15/33 (2) | 30,790 | 31,443 |
| Univ. of California Rev. | 5.000% | 5/15/34 | 3,220 | 3,355 |
| Univ. of California Rev. | 5.000% | 5/15/40 | 1,905 | 1,966 |
| Univ. of California Rev. (San Diego Medical Center) | 5.125% | 12/1/18 (4) | 3,695 | 3,781 |
| Univ. of California Rev. (San Diego Medical Center) | 5.125% | 12/1/19 (4) | 3,000 | 3,057 |
| Vallejo CA Sanitation & Flood Control COP | 5.000% | 7/1/19 (14) | 4,648 | 4,820 |
| Ventura County CA Community College Dist. GO | 5.500% | 8/1/33 | 8,000 | 8,485 |
| 3 Walnut CA Energy Center Auth. Rev. | 5.000% | 1/1/35 | 2,000 | 2,038 |
| 3 Walnut CA Energy Center Auth. Rev. | 5.000% | 1/1/40 | 5,000 | 5,080 |
| Walnut Valley CA USD | 6.000% | 8/1/12 (2)(ETM) | 1,790 | 1,996 |
| Walnut Valley CA USD | 6.000% | 8/1/13 (2)(ETM) | 1,980 | 2,293 |
| Walnut Valley CA USD | 6.000% | 8/1/14 (2)(ETM) | 2,205 | 2,630 |
| Walnut Valley CA USD | 6.000% | 8/1/15 (2)(ETM) | 2,470 | 3,008 |
| Walnut Valley CA USD | 6.000% | 8/1/16 (2)(ETM) | 2,690 | 3,305 |
| Washington Township CA Health Care Dist. Rev. | 5.000% | 7/1/32 | 3,000 | 2,872 |
| Washington Township CA Health Care Dist. Rev. | 5.000% | 7/1/37 | 3,500 | 3,302 |
| Yuba City CA USD | 0.000% | 9/1/15 (14) | 1,870 | 1,541 |
| Yuba City CA USD | 0.000% | 9/1/17 (14) | 2,060 | 1,464 |
| Yuba City CA USD | 0.000% | 9/1/19 (14) | 2,270 | 1,406 |
| | | | | 2,932,551 |
69
| | | | |
| California Long-Term Tax-Exempt Fund | | | | |
| |
| |
| |
| | | | Face | Market |
| | | Maturity | Amount | Value• |
| | Coupon | Date | ($000) | ($000) |
| Puerto Rico (0.9%) | | | | |
| Puerto Rico Highway & Transp. Auth. Rev. | 5.250% | 7/1/10 | 5,000 | 5,019 |
| Puerto Rico Muni. Finance Agency | 5.250% | 7/1/19 (11) | 2,250 | 2,386 |
| Puerto Rico Muni. Finance Agency | 5.250% | 7/1/20 (11) | 1,300 | 1,378 |
| Puerto Rico Muni. Finance Agency | 5.250% | 8/1/20 (11) | 2,255 | 2,390 |
| Puerto Rico Public Buildings Auth. Govt. Fac. Rev. | 5.250% | 7/1/14 (Prere.) | 75 | 86 |
| Puerto Rico Public Finance Corp. PUT | 5.750% | 2/1/12 LOC | 16,000 | 16,627 |
| | | | | 27,886 |
| Total Tax-Exempt Municipal Bonds (Cost $2,896,697) | | | | 2,960,437 |
| Other Assets and Liabilities (0.6%) | | | | |
| Other Assets | | | | 46,986 |
| Liabilities | | | | (28,531) |
| | | | | 18,455 |
| Net Assets (100%) | | | | 2,978,892 |
| |
| |
| At May 31, 2010, net assets consisted of: | | | | |
| | | | | Amount |
| | | | | ($000) |
| Paid-in Capital | | | | 3,014,038 |
| Undistributed Net Investment Income | | | | — |
| Accumulated Net Realized Losses | | | | (99,088) |
| Unrealized Appreciation (Depreciation) | | | | |
| Investment Securities | | | | 63,740 |
| Futures Contracts | | | | 202 |
| Net Assets | | | | 2,978,892 |
| |
| |
| Investor Shares—Net Assets | | | | |
| Applicable to 61,262,960 outstanding $.0 01 par value shares of | | | |
| beneficial interest (unlimited authorization) | | | | 686,006 |
| Net Asset Value Per Share—Investor Shares | | | | $11.20 |
| |
| |
| Admiral Shares—Net Assets | | | | |
| Applicable to 204,763,721 outstanding $. 001 par value shares of | | | |
| beneficial interest (unlimited authorization) | | | | 2,292,886 |
| Net Asset Value Per Share—Admiral Shares | | | | $11.20 |
• See Note A in Notes to Financial Statements.
1 Securities with a value of $1,867,000 have been segregated as initial margin for open futures contracts.
2 Security exempt from registration under Rule 144A of the Securities Act of 1933. Such securities may be sold in transactions exempt from registration, normally to qualified institutional buyers. At May 31, 2010, the aggregate value of these securities was $18,055,000, representing 0.6% of net assets.
3 Security purchased on a when-issued or delayed-delivery basis for which the fund has not taken delivery as of May 31, 2010.
See accompanying Notes, which are an integral part of the Financial Statements.
A key to abbreviations and other references follows the Statement of Net Assets.
70
California Long-Term Tax-Exempt Fund
Key to Abbreviations
ARS—Auction Rate Security.
BAN—Bond Anticipation Note.
COP—Certificate of Participation.
CP—Commercial Paper.
FR—Floating Rate.
GAN—Grant Anticipation Note.
GO—General Obligation Bond.
IDA—Industrial Development Authorit y Bond.
IDR—Industrial Development Revenue Bond.
PCR—Pollution Control Revenue Bond.
PUT—Put Option Obligation.
RAN—Revenue Anticipation Note.
TAN—Tax Anticipation Note.
TOB—Tender Option Bond.
TRAN—Tax Revenue Anticipation Note.
UFSD—Union Free School District.
USD—United School District.
VRDO—Variable Rate Demand Obligation.
VRDP—Variable Rate Demand Preferred.
(ETM)—Escrowed to Maturity.
(Prere.)—Prerefunded.
Scheduled principal and interest payments are guaranteed by:
(1) MBIA (Municipal Bond Insurance Assoc iation).
(2) AMBAC (Ambac Assurance Corporation).
(3) FGIC (Financial Guaranty Insurance Company).
(4) AGM (Assured Guaranty Municipal Corporation).
(5) BIGI (Bond Investors Guaranty Insurance).
(6) Connie Lee Inc.
(7) FHA (Federal Housing Authority).
(8) CapMAC (Capital Markets Assurance Corporation).
(9) American Capital Access Financial Guaranty Corporation.
(10) XL Capital Assurance Inc.
(11) CIFG (CDC IXIS Financial Guaranty).
(12) Assured Guaranty Corp.
(13) Berkshire Hathaway Assurance Corp.
(14) National Public Finance Guarantee Corp.
The insurance does not guarantee the market value of the municipal bonds.
LOC—Scheduled principal and interest payments are guaranteed by bank letter of credit.
71
| |
| California Long-Term Tax-Exempt Fund | |
| |
| |
| Statement of Operations | |
| |
| | Six Months Ended |
| | May 31, 2010 |
| | ($000) |
| Investment Income | |
| Income | |
| Interest | 65,354 |
| Total Income | 65,354 |
| Expenses | |
| The Vanguard Group—Note B | |
| Investment Advisory Services | 137 |
| Management and Administrative—Investor Shares | 554 |
| Management and Administrative—Admiral Shares | 983 |
| Marketing and Distribution—Investor Shares | 94 |
| Marketing and Distribution—Admiral Shares | 219 |
| Custodian Fees | 11 |
| Shareholders’ Reports—Investor Shares | 6 |
| Shareholders’ Reports—Admiral Shares | 2 |
| Trustees’ Fees and Expenses | 2 |
| Total Expenses | 2,008 |
| Net Investment Income | 63,346 |
| Realized Net Gain (Loss) | |
| Investment Securities Sold | (6,833) |
| Futures Contracts | (974) |
| Realized Net Gain (Loss) | (7,807) |
| Change in Unrealized Appreciation (Depreciation) | |
| Investment Securities | 63,428 |
| Futures Contracts | 348 |
| Change in Unrealized Appreciation (Depreciation) | 63,776 |
| Net Increase (Decrease) in Net Assets Resulting from Operations | 119,315 |
See accompanying Notes, which are an integral part of the Financial Statements.
72
| | |
| California Long-Term Tax-Exempt Fund | | |
| |
| |
| Statement of Changes in Net Assets | | |
| |
| | Six Months Ended | Year Ended |
| | May 31, | November 30, |
| | 2010 | 2009 |
| | ($000) | ($000) |
| Increase (Decrease) in Net Assets | | |
| Operations | | |
| Net Investment Income | 63,346 | 128,250 |
| Realized Net Gain (Loss) | (7,807) | (43,646) |
| Change in Unrealized Appreciation (Depreciation) | 63,776 | 250,592 |
| Net Increase (Decrease) in Net Assets Resulting from Operations | 119,315 | 335,196 |
| Distributions | | |
| Net Investment Income | | |
| Investor Shares | (14,901) | (31,296) |
| Admiral Shares | (48,445) | (96,954) |
| Realized Capital Gain | | |
| Investor Shares | — | — |
| Admiral Shares | — | — |
| Total Distributions | (63,346) | (128,250) |
| Capital Share Transactions | | |
| Investor Shares | (18,361) | (30,482) |
| Admiral Shares | 67,623 | (51,025) |
| Net Increase (Decrease) from Capital Share Transactions | 49,262 | (81,507) |
| Total Increase (Decrease) | 105,231 | 125,439 |
| Net Assets | | |
| Beginning of Period | 2,873,661 | 2,748,222 |
| End of Period | 2,978,892 | 2,873,661 |
See accompanying Notes, which are an integral part of the Financial Statements.
73
| | | | | | |
| California Long-Term Tax-Exempt Fund | | | | | | |
| |
| |
| Financial Highlights | | | | | | |
| |
| |
| Investor Shares | | | | | | |
| Six Months | | | | | |
| | Ended | | | | | |
| For a Share Outstanding | May 31, | | | Year Ended November 30, |
| Throughout Each Period | 2010 | 2009 | 2008 | 2007 | 2006 | 2005 |
| Net Asset Value, Beginning of Period | $10.98 | $10.19 | $11.46 | $11.86 | $11.65 | $11.74 |
| Investment Operations | | | | | | |
| Net Investment Income | .239 | .481 | .499 | .531 | .528 | .527 |
| Net Realized and Unrealized Gain (Loss) | | | | | | |
| on Investments | .220 | .790 | (1.270) | (.400) | .232 | (.037) |
| Total from Investment Operations | .459 | 1.271 | (.771) | .131 | .760 | .490 |
| Distributions | | | | | | |
| Dividends from Net Investment Income | (.239) | (.481) | (.499) | (.531) | (.528) | (.527) |
| Distributions from Realized Capital Gains | — | — | — | — | (.022) | (.053) |
| Total Distributions | (.239) | (.481) | (.499) | (.531) | (.550) | (.580) |
| Net Asset Value, End of Period | $11.20 | $10.98 | $10.19 | $11.46 | $11.86 | $11.65 |
| |
| Total Return1 | 4.22% | 12.71% | -6.95% | 1.15% | 6.70% | 4.22% |
| |
| Ratios/Supplemental Data | | | | | | |
| Net Assets, End of Period (Millions) | $686 | $691 | $670 | $732 | $678 | $645 |
| Ratio of Total Expenses to | | | | | | |
| Average Net Assets | 0.20%2 | 0.20% | 0.15% | 0.15% | 0.16% | 0.16% |
| Ratio of Net Investment Income to | | | | | | |
| Average Net Assets | 4.33%2 | 4.51% | 4.51% | 4.58% | 4.52% | 4.47% |
| Portfolio Turnover Rate | 17%2 | 18% | 27% | 23% | 13% | 10% |
1 Total returns do not include the account service fee that may be applicable to certain accounts with balances below $10,000.
2 Annualized.
See accompanying Notes, which are an integral part of the Financial Statements.
74
| | | | | | |
| California Long-Term Tax-Exempt Fund | | | | | | |
| |
| |
| Financial Highlights | | | | | | |
| |
| |
| Admiral Shares | | | | | | |
| Six Months | | | | | |
| | Ended | | | | | |
| For a Share Outstanding | May 31, | | | Year Ended November 30, |
| Throughout Each Period | 2010 | 2009 | 2008 | 2007 | 2006 | 2005 |
| Net Asset Value, Beginning of Period | $10.98 | $10.19 | $11.46 | $11.86 | $11.65 | $11.74 |
| Investment Operations | | | | | | |
| Net Investment Income | .243 | .490 | .507 | .540 | .536 | .535 |
| Net Realized and Unrealized Gain (Loss) | | | | | | |
| on Investments | .220 | .790 | (1.270) | (.400) | .232 | (.037) |
| Total from Investment Operations | .463 | 1.280 | (.763) | .140 | .768 | .498 |
| Distributions | | | | | | |
| Dividends from Net Investment Income | (.243) | (.490) | (.507) | (.540) | (.536) | (.535) |
| Distributions from Realized Capital Gains | — | — | — | — | (.022) | (.053) |
| Total Distributions | (.243) | (.490) | (.507) | (.540) | (.558) | (.588) |
| Net Asset Value, End of Period | $11.20 | $10.98 | $10.19 | $11.46 | $11.86 | $11.65 |
| |
| Total Return | 4.26% | 12.80% | -6.88% | 1.22% | 6.78% | 4.29% |
| |
| Ratios/Supplemental Data | | | | | | |
| Net Assets, End of Period (Millions) | $2,293 | $2,183 | $2,078 | $2,251 | $1,972 | $1,614 |
| Ratio of Total Expenses to | | | | | | |
| Average Net Assets | 0.12%1 | 0.12% | 0.08% | 0.08% | 0.09% | 0.09% |
| Ratio of Net Investment Income to | | | | | | |
| Average Net Assets | 4.41%1 | 4.59% | 4.58% | 4.65% | 4.59% | 4.53% |
| Portfolio Turnover Rate | 17%1 | 18% | 27% | 23% | 13% | 10% |
| 1 Annualized. | | | | | | |
See accompanying Notes, which are an integral part of the Financial Statements.
75
California Long-Term Tax-Exempt Fund
Notes to Financial Statements
Vanguard California Long-Term Tax-Exempt Fund is registered under the Investment Company Act of 1940 as an open-end investment company, or mutual fund. The fund invests in debt instruments of municipal issuers whose ability to meet their obligations may be affected by economic and political developments in the state. The fund offers two classes of shares, Investor Shares and Admiral Shares. Investor Shares are available to any investor who meets the fund’s minimum purchase requirements. Admiral Shares are designed for investors who meet certain administrative, service, tenure, and account-size criteria.
A. The following significant accounting policies conform to gener ally accepted accounting principles for U.S. mutual funds. The fund consistently follows such policies in preparing its financial statements.
1. Security Valuation: Bonds, and temporary cash investments acquired over 60 days to maturity, are valued using the latest bid prices or using valuations based on a matrix system (which considers such factors as security price s, yields, maturities, and ratings), both as furnished by independent pricing services. Other temporary cash investments are valued at amortized cost, which approximates market value. Securities for which market quota tions are not readily available, or whose values have been affected by events occurring befor e the fund’s pricing time but after the close of the securities’ primary markets, a re valued by methods deemed by the board of trustees to represent fair value.
2. Futures Contracts: The fund uses futures contracts to invest in fixed income asset classes with greater efficiency and lower cost than is possible through direct investment, to add value when these instruments are attractively priced, or to adjust sensitivity to changes in interest rates. The primary risks associated with the use of futures contracts are imperfect correlation between changes in market values of bonds held by the fund and the prices of futures contracts, and the possibility of an illiquid market.
Futures contracts are valued based upon their quoted daily settlement prices. The aggregate principal amounts of the contracts are not recorded in the Statement of Net Assets. Fluctuations in the value of the contracts a re recorded in the Statement of Net Assets as an asset (liability) and in the Statement of Operations as unrealized appreciation (depreciation) until the contracts are closed, when they are recorded as realized futures gains (losses).
3. Federal Income Taxes: The fund intends to continue to qualify as a regulated investment company and distribute all of its income. Management has analyzed the fund’s tax positions taken for all open federal income tax years (November 30, 2006–2009), and for the period ended May 31, 2010, and has concluded that no provision for federal income tax is required in the fund’s financial statements.
4. Distributions: Distributions from net investment income are declared daily and paid on the first business day of the following month. Annual distributions from realized capital gains, if any, are recorded on the ex-dividend date.
5. Other: Interest income is accrued daily. Premiums and discounts on debt securities purchased are amortized and accreted, respective ly, to interest income over the lives of the respective securities. Security transactions are accounted for on the date securities are bought or sold. Costs used to determine realized gains (losses) on the sale of investment securities are those of the specific securities sold.
Each class of shares has equal rights as to assets and earnings, except that each class separately bears certain class-specific expenses related to maintenance of shareholder accounts (included in Management and Administrative expenses) and shareholder reporting. Marketing and distribution
76
California Long-Term Tax-Exempt Fund
expenses are allocated to each class of shares based on a method approved by the board of trustees. Income, other non-class-specific expenses, and gains and losses on investments are allocated to each class of shares based on its relative net assets.
B. The Vanguard Group furnishes at cost investment advisory, corporate management, administrative, marketing, and distribution services. The costs of such services are allocated to the fund under methods approved by the board of trustees. The fund has committed to provide up to 0.40% of its net assets in capital contributions to Vanguard. At May 31, 2010, the fund had contributed capital of $541,000 to Vanguard (included in Other Assets), representing 0.02% of the fund&# 146;s net assets and 0.22% of Vanguard’s capitalization. The fund’s trustees and officers are also directors and officers of Vanguard.
C. Various inputs may be used to determine the value of the fund’s investments. These inputs are summarized in three broad levels for financial statement purposes. The inputs or methodologies used to value securities are not necessarily an indication of the risk associated with investing in those securities.
Level 1—Quoted prices in active markets for identical securities.
Level 2—Other significant observable inputs (including quoted prices for similar securities, interest rates, prepayment speeds, credit risk, etc.).
Level 3—Significant unobservable inputs (including the fund’s own assumptions used to determine the fair value of investments).
The following table summarizes the fund’s investments as of May 31, 2010, based on the inputs used to value them:
| | | |
| | Level 1 | Level 2 | Level 3 |
| Investments | ($000) | ($000) | ($000) |
| Tax-Exempt Municipal Bonds | — | 2,960,437 | — |
| Futures Contracts—Liabilities1 | (42) | — | — |
| Total | (42) | 2,960,437 | — |
1 Represents variation margin on the last day of the reporting period.
D. At May 31, 2010, the aggregate settlement value of open futures contracts and the related unrealized appreciation (depreciation) were:
| | | | |
| | | | | ($000) |
| | | | Aggregate | |
| | | Number of | Settlement | Unrealized |
| | | Long (Short) | Value | Appreciation |
| Futures Contracts | Expiration | Contracts | Long (Short) | (Depreciation) |
| 30-Year United States Treasury Bond | September 2010 | (145) | (17,785) | 192 |
| 10-Year United States Treasury Note | September 2010 | (28) | (3,357) | 10 |
Unrealized appreciation (depreciation) on open futures contracts is required t o be treated as realized gain (loss) for tax purposes.
77
California Long-Term Tax-Exempt Fund
E. Capital gain distributions are determined on a tax basis and may differ from realized capital gains for financial reporting purposes. Differences may be permanent or temporary. Permanent differences are reclassified among capital accounts in the financial statements to reflect their tax character. Temporary differen ces arise when gains or losses are recognized in different periods for financial statement and tax purposes; these differences will reverse at some time in the future.
The fund’s tax-basis capital gains and losses are determined only at the end of each fiscal year. For tax purposes, at November 30, 2009, the fund had available capital loss carryforwards tot aling $82,485,000 to offset future net capital gains of $971,000 through November 30, 2014, $18,323,000 through November 30, 2015, $22,521,000 through November 30, 2016, and $40,670,000 through November 30, 2017. The fund will use these capital los ses to offset net taxable capital gains, if any, realized during the year ending November 30, 2010; should the fund realize net capital losses for the year, the losses will be added to the loss carryforward balance above.
The fund had realized losses totaling $8,942,000 through November 30, 2009, which are deferred for tax purposes and reduce the amount of tax-basis unrealized appreciation on investment securities.
At May 31, 2010, the cost of investment securities for tax purposes was $2,905,639,000. Net unrealized appreciation of investment securities for tax purposes was $54,798,000, consisting of unrealized gains of $108,056,000 on securities that had risen in value since their purchase and $53,258,000 in unrealized losses on securities that had fallen in value since their purchase.
F. During the six months ended May 31, 2010, the fund purchased $292,352,000 of investment securities and sold $232,717,000 of investment securities, other than temporary cash investments.
| | | | |
| G. Capital share transactions for each class of shares were: | | | |
| | Six Months Ended | | Year Ended |
| | May 31, 2010 | November 30, 2009 |
| | Amount | Shares | Amount | Shares |
| | ($000) | (000) | ($000) | (000) |
| Investor Shares | | | | |
| Issued | 79,689 | 7,202 | 213,322 | 20,082 |
| Issued in Lieu of Cash Distributions | 11,807 | 1,066 | 24,680 | 2,309 |
| Redeemed | (109,857) | (9,924) | (268,484) | (25,247) |
| Net Increase (Decrease)—Investor Shares | (18,361) | (1,656) | (30,482) | (2,856) |
| Admiral Shares | | | | |
| Issued | 245,616 | 22,149 | 444,783 | 41,585 |
| Issued in Lieu of Cash Distributions | 32,236 | 2,911 | 64,828 | 6,062 |
| Redeemed | (210,229) | (18,999) | (560,636) | (52,828) |
| Net Increase (Decrease)—Admiral Shares | 67,623 | 6,061 | (51,025) | (5,181) |
H. In preparing the financial statements as of May 31, 2010, management considered the impact of subsequent events for potential recog nition or disclosure in these financial statements.
78
About Your Fund’s Expenses
As a shareholder of the fund, you incur ongoing costs, which include costs for portfolio management, administrative services, and shareholder reports (like this one), among others. Operating expenses, which are deducted from a fund’s gross income, directly reduce the investment return of the fund.
A fund’s expenses are expressed as a percentage of its average net assets. This figure is known as the expense ratio. The following examples are intended to help you understand the ongoing costs (in dollars) of investing in your fund and to compare these costs with those of other mutual funds. The examples are based on an investment of $1,000 made at the beginning of the period shown and held for the entire period.
The accompanying table illustrates your fund’s costs in two ways:
• Based on actual fund return. This section helps you to estimate the actual expenses that you paid over the period. The ”Ending Account Value“ shown is derived from the fund‘s actual return, and the third column shows the dollar amount that would have been paid by an investor who started with $1,000 in the fund. You may use the information here, together with the amount you invested, to estimate the expenses that you paid over the period.
To do so, simply divide your account value by $1,000 (for example, an $8,600 account value divided by $1,000 = 8.6), then multiply the result by the number given for your fund under the heading ”Expenses Paid During Period.“
• Based on hypothetical 5% yearly return. This section is intended to help you compare your fund‘s costs with those of other mutual funds. It assumes that the fund had a yearly return of 5% before expenses, but that the expense ratio is unchanged. In this case—because the return used is not the fund’s actual return—the results do not apply to your investment. The example is useful in making comparisons because the Securities and Exchange Commission requires all mutual funds to calculate expenses based on a 5% return. You can assess your fund’s costs by comparing this hypothetical example with the hypothetical examples that appear in shareholder reports of other funds.
Note that the expenses shown in the table are meant to highlight and help you compare ongoing costs only and do not reflect transaction costs incurred by the fund for buying and selling securities. Further, the expenses do not include the account service fee described in the prospectus. If such a fee were applied to your account, your costs would be higher. Your fund does not charge transaction fees, such as purchase or redemption fees, nor does it carry a “sales load.” The calculations assume no shares were bought or sold during the period. Your actual costs may have been higher or lower, depending on the amount of your investment and the timing of any purchases or redemptions.
You can find more information about the fund’s expenses, including annual expense ratios, in the Financial Statements section of this report. For additional information on operating expenses and other shareholder costs, please refer to your fund’s current prospectus.
79
| | | |
| Six Months Ended May 31, 2010 | | | |
| | Beginning | Ending | Expenses |
| | Account Value | Account Value | Paid During |
| | 11/30/2009 | 5/31/2010 | Period |
| Based on Actual Fund Return | | | |
| California Tax-Exempt Money Market Fund | $1,000.00 | $1,000.53 | $0.85 |
| California Intermediate-Term Tax-Exempt Fund | | | |
| Investor Shares | $1,000.00 | $1,034.02 | $1.01 |
| Admiral Shares | 1,000.00 | 1,034.43 | 0.61 |
| California Long-Term Tax-Exempt Fund | | | |
| Investor Shares | $1,000.00 | $1,042.24 | $1.02 |
| Admiral Shares | 1,000.00 | 1,042.65 | 0.61 |
| Based on Hypothetical 5% Yearly Return | | | |
| California Tax-Exempt Money Market Fund | $1,000.00 | $1,024.08 | $0.86 |
| California Intermediate-Term Tax-Exempt Fund | | | |
| Investor Shares | $1,000.00 | $1,023.93 | $1.01 |
| Admiral Shares | 1,000.00 | 1,024.33 | 0.61 |
| California Long-Term Tax-Exempt Fund | | | |
| Investor Shares | $1,000.00 | $1,023.93 | $1.01 |
| Admiral Shares | 1,000.00 | 1,024.33 | 0.61 |
The calculations are based on expenses incurred in the most recent six-month period. The fund’s annualized six-month expense ratios for that period are: for the California Tax-Exempt Money Market Fund, 0.17%; for the California Intermediate-Term Tax-Exempt Fund, 0.20% for Investor Shares and 0.12% for Admiral Shares; and for the California Long-Term Tax-Exempt Fund, 0.20% for Investor Shares and 0.12% for Admiral Shares. The dollar amounts shown as “Expenses Paid” are equal to the annualized expense ratio multiplied by the average account value over the period, multiplied by the number of days in the most recent six-month period, then divided by the number of days in the most recent 12-month period.
80
Trustees Approve Advisory Arrangement
The board of trustees of Vanguard California Tax-Exempt Money Market Fund, Vanguard California Intermediate-Term Tax-Exempt Fund, and Vanguard California Long -Term Tax-Exempt Fund has renewed the funds’ investment advisory arrangement with The Vanguard Group, Inc. Vanguard—throu gh its Fixed Income Group—serves as the investment advisor for the funds. The board determined that continuing the funds’ internalized management structure was in the best interests of the funds and their shareholders.
The board based its decision upon an evaluation of the advisor’s investment staff, portfolio management process, and performance. The trustees considered the factors discussed below, among ot hers.
However, no single factor determined whether the board approved the arrangement. Rather, it was the totality of the circumstances that drove the board’s decision.
Nature, extent, and quality of services
The board considered the quality of the funds’ investment management over both the short and long term, and took into account the organizational depth and stability of the advisor. The board noted that Vanguard has been managing investments for more than three decades. The Fixed Income Group adheres to a sound, disciplined investment management process; the team has considerable experience, stab ility, and depth.
The board concluded that Vanguard’s experience, stability, depth, a nd performance, among other factors, warranted continuation of the advisory arrangement.
Investment performance
The board considered the short- and long-term performance of t he funds, including any periods of outperformance or underperformance of relevant benchmarks and peer groups. The board concluded that the funds have performed in line with expectations and that their results have been consistent with their investment strategies. Information about the funds’ most recent performance can be found in the Performance Summary sections of this report.
Cost
The board concluded that the funds’ expense ratios were well below the average expense ratios charged by funds in their respective peer groups. The board noted that the funds’ advisory expense ratios were also well below their peer-group averages. Information about the funds’ expense ratios appears in the About Your Fund’s Expenses section of this report as well as in the Financial Statements sections.
The board does not conduct a profitability analysis of Vanguard, because of Vanguard’s unique “at-cost” structure. Unlike most other mutual fund management companies, Vanguard is owned by the funds it oversees, and produces “profits” only in the form of reduced expenses for fund shareholders.
The benefit of economies of scale
The board concluded that the funds’ low-cost arrangement with Va nguard ensures that the funds will realize economies of scale as they grow, with the cost to shareholders declining as fund assets increase.
The board will consider whether to renew the advisory arrangement again after a one-year period.
81
Glossary
7-Day SEC Yield and 30-Day SEC Yield. A money market fund’s 7-day SEC yield is calculated by annualizing its income distributions for the previous seven days, as required by the U.S. Securities and Exchange Commission. For other funds, 30-day SEC yield is derived using a formula specified by the commission. Under the formula, data related to the fund’s security holdings in the previous 30 days are used to calculate the fund’s hypothetical net income for that period, which is then annualized and divided by the fund’s estimated average net assets over the calculation period. For the purposes of this calculation, a security’s income is based on its current market yield to maturity (in the case of bonds) or its projected dividend yield (for stocks). Because the SEC yield represents hypothetical annualized income, it will differ—at times significantly—from the fund’s actual experience. As a result, the fund’s income distributions may be higher or lower than implied by the SEC yield.
Average Coupon. The average interest rate paid on the fixed income securities held by a fund. It is expressed as a percentage of face value.
Average Duration. An estimate of how much the value of the bonds held by a fund will fluctuate in response to a change in interest rates. To see how the value could change, multiply the average duration by the change in rates. If interest rates rise by 1 percentage point, the value of the bonds in a fund with an average duration of five years would decline by about 5%. If rates decrease by a percentage point, the value would rise by 5%.
Average Effective Maturity. The average length of time until fixed income securities held by a fund reach maturity and are repaid, taking into consideration the possibility that the issuer may call the bond before its maturity date. The figure reflects the proportion of fund assets represented by each security; it also reflects any futures contracts held. In general, the longer the average effective maturity, the more a fund’s share price will fluctuate in response to changes in market interest rates.
Average Quality. An indicator of credit risk, this figure is the average of the ratings assigned to a fund’s holdings by credit-rating agencies. The agencies make their judgment after appraising an issuer’s ability to meet its obligations. Quality is graded on a scale, with AAA indicating the most creditworthy bond issuers and MIG-1, A-1+, SP-1+, and F-1+ indicating the most creditworthy issuers of money market securities.
Average Weighted Maturity. The average length of time until fixed income securities held by a fund reach maturity and are repaid. The figure reflects the proportion of fund assets represented by each security.
Beta. A measure of the magnitude of a fund’s past share-price fluctuations in relation to the ups and downs of a given market index. The index is assigned a beta of 1.00. Compared with a given index, a fund with a beta of 1.20 typically would have seen its share price rise or fall by 12% when the index rose or fell by 10%. For this report, beta is based on returns over the past 36 months for both the fund and the index. Note that a fund’s beta should be reviewed in conjunction with its R-squared (see definition). The lower the R-squared, the less correlation there is between the fund and the index, and the less reliable beta is as an indicator of volatility.
Expense Ratio. The percentage of a fund’s average net assets used to pay its annual administrative and advisory expenses. These expenses directly reduce returns to investors.
82
Inception Date. The date on which the assets of a fund (or one of its share classes) are first invested in accordance with the fund’s investment objective. For funds with a subscription period, the inception date is the day after that period ends. Investment performance is measured from the inception date.
R-Squared. A measure of how much of a fund’s past returns can be explained by the returns from the market in general, as measured by a given index. If a fund’s total returns were precisely synchronized with an index’s returns, its R-squared would be 1.00. If the fund’s returns bore no relationship to the index’s returns, its R-squared would be 0. For this report, R-squared is based on returns over the past 36 months for both the fund and the index.
Short-Term Reserves. The percentage of a fund invested in highly liquid, short-term securities that can be readily converted to cash.
Yield to Maturity. The rate of return an investor would receive if the fixed income securities held by a fund were held to their maturity dates.
83
The People Who Govern Your Fund
The trustees of your mutual fund are there to see that the fund is operated and managed in your best interests since, as a shareholder, you are a part owner of the fund. Your fund’s trustees also serve on the board of directors of The Vanguard Group, Inc., which is owned by the Vanguard funds and provid es services to them on an at-cost basis.
A majority of Vanguard’s board members are independent, meaning that they have no affiliation with Vanguard or the funds they oversee, apart from the sizable personal investments they have made as private individuals. The independent board members have distinguished backgrounds in business, academia, and public service. Each of the trustees and executive officers oversees 162 Vanguard funds.
The following table provides information for each trustee and executive officer of the fund. More information about the trustees is in the Statement of Additional Information, which can be obtained, without charge, by contacting Vanguard at 800-662-7447, or online at www.vanguard.com.
| |
| Interested Trustee1 | Rajiv L. Gupta |
| | Born 1945. Trustee Since December 2001.2 |
| F. William McNabb III | Principal Occupation(s) During the Past Five Years: |
| Born 1957. Trustee Since July 2009. Chairman of the | Chairman and Chief Executive Officer (retired 2009) |
| Board. Principal Occupation(s) During the Past Five | and President (2006–2008) of Rohm and Haas Co. |
| Years: Chairman of the Board of The Vanguard Group, | (chemicals); Director of Tyco International, Ltd. |
| Inc., and of each of the investment companies served | (diversified manufacturing and services) and Hewlett- |
| by The Vanguard Group, since January 2010; Director | Packard Co. (electronic computer manufacturing); |
| of The Vanguard Group since 2008; Chief Executive | Trustee of The Conference Board; Member of the |
| Officer and President of The Vanguard Group and of | Board of Managers of Delphi Automotive LLP |
| each of the investment companies served by The | (automotive components). |
| Vanguard Group since 2008; Director of Vanguard | |
| Marketing Corporation; Managing Director of The | Amy Gutmann |
| Vanguard Group (1995–2008). | Born 1949. Trustee Since June 2006. Principal |
| | Occupation(s) During the Past Five Years: President |
| | of the University of Pennsylvania; Christopher H. |
| Independent Trustees | Browne Distinguished Professor of Political Science |
| | in the School of Arts and Sciences with secondary |
| Emerson U. Fullwood | appointments at the Annenberg School for Commu- |
| Born 1948. Trustee Since January 2008. Principal | nication and the Graduate School of Education of |
| Occupation(s) During the Past Five Years: Executive | the University of Pennsylvania; Director of Carnegie |
| Chief Staff and Marketing Officer for North America | Corporation of New York, Schuylkill River Development |
| and Corporate Vice President (retired 2008) of Xerox | Corporation, and Greater Philadelphia Chamber of |
| Corporation (documen t management products and | Commerce; Trustee of the National Constitution Center; |
| services); Director of SPX Corporation (multi-industry | Chair of the Presidential Commission for the Study of |
| manufacturing), the United Way of Rochester, | Bioethical Issues. |
| Amerigroup Corporation (managed health care), | |
| the University of Rochester Medical Center, and | |
| Monroe Community College Foundation. | |
| | |
| JoAnn Heffernan Heisen | Executive Officers | |
| Born 1950. Trustee Since July 1998. Principal | | |
| Occupation(s) During the Past Five Years: Corporate | Thomas J. Higgins | |
| Vice President and Chief Global Diversity Officer since | Born 1957. Chief Financial Officer Since September |
| 2006 (retired 2008) and Member of the Executive | 2008. Principal Occupation(s) During the Past Five |
| Committee (retired 2008) of Johnson & Johnson | Years: Principal of The Vanguard Group, Inc.; Chief |
| (pharmaceuticals/consumer products); Vice President | Financial Officer of each of the investment companies |
| and Chief Information Officer of Johnson & Johnson | served by The Vanguard Group since 2008; Treasurer |
| (1997–2005); Director of the University Medical Center | of each of the investment companies served by The |
| at Princeton and Women’s Research and Education | Vanguard Group (1998–2008). |
| Institute; Member of the Advisory Board of the | | |
| Maxwell School of Citizenship and Public Affairs | Kathryn J. Hyatt | |
| at Syracuse University. | Born 1955. Treasurer Since November 2008. Principal |
| | Occupation(s) During the Past Five Years: Principal |
| F. Joseph Loughrey | of The Vanguard Group, Inc.; Treasurer of each of |
| Born 1949. Trustee Since October 2009. Principal | the investment companies served by The Vanguard |
| Occupation(s) During the Past Five Years: President | Group since 2008; Assistant Treasurer of each of the |
| and Chief Operating Officer since 2005 (retired 2009) | investment companies served by The Vanguard Group |
| and Vice Chairman of the Board (2008–2009) of | (1988–2008). | |
| Cummins Inc. (industrial machinery); Director of | | |
| SKF AB (industrial machinery), Hillenbrand, Inc. | Heidi Stam | |
| (specialized consumer services), Sauer-Danfoss Inc. | Born 1956. Secretary Since July 2005. Principal |
| (machinery), the Lumina Foundation for Education, | Occupation(s) During the Past Five Years: Managing |
| and Oxfam America; Chairman of the Advisory Council | Director of The Vanguard Group, Inc., since 2006; |
| for the College of Arts and Letters at the University of | General Counsel of The Vanguard Group since 2005; |
| Notre Dame. | Secretary of The Vanguard Group and of each of the |
| | investment companies served by The Vanguard Group |
| André F. Perold | since 2005; Director and Senior Vice President of |
| Born 1952. Trustee Since December 2004. Principal | Vanguard Marketing Corporation since 2005; |
| Occupation(s) During the Past Five Years: George | Principal of The Vanguard Group (1997–2006). |
| Gund Professor of Finance and Banking at the Harvard | | |
| Business School; Chair of the Investment Committee | | |
| of HighVista Strategies LLC (private investment firm). | Vanguard Senior Management Team |
| |
| Alfred M. Rankin, Jr. | R. Gregory Barton | Michael S. Miller |
| Born 1941. Trustee Since January 1993. Principal | Mortimer J. Buckley | James M. Norris |
| Occupation(s) During the Past Five Years: Chairman, | Kathleen C. Gubanich | Glenn W. Reed |
| President, and Chief Executive Officer of NACCO | Paul A. Heller | George U. Sauter |
| Industries, Inc. (forklift trucks/housewares/lignite); | | |
| Director of Goodrich Corporation (industrial products/ | | |
| aircraft systems and services); Chairman of the Federal | Chairman Emeritus and Senior Advisor |
| Reserve Bank of Cleveland; Trustee of The Cleveland | | |
| Museum of Art. | John J. Brennan | |
| | Chairman, 1996–2009 | |
| Peter F. Volanakis | Chief Executive Officer and President, 1996–2008 |
| Born 1955. Trustee Since July 2009. Principal | | |
| Occupation(s) During the Past Five Years: President | | |
| since 2007 and Chief Operating Officer since 2005 | Founder | |
| of Corning Incorporated (communications equipment); | | |
| President of Corning Technologies (2001–2005); | John C. Bogle | |
| Director of Corning Incorporated and Dow Corning; | Chairman and Chief Executive Officer, 1974–1996 |
| Trustee of the Corning Incorporated Foundation and | | |
| the Corning Museum of Glass; Overseer of the | | |
| Amos Tuck School of Business Administration at | | |
| Dartmouth College. | | |
1 Mr. McNabb is considered an “interested person,” as defined in the Investment Company Act of 1940, because he is an officer of the Vanguard funds.
2 December 2002 for Vanguard Equity Income Fund, Vanguard Growth Equity Fund, the Vanguard Municipal Bond Funds, and the Vanguard State Tax-Exempt Funds.
|  |
| | P.O. Box 2600 |
| | Valley Forge, PA 19482-2600 |
| |
| |
| |
| Connect with Vanguard® >www.vanguard.com | |
| |
| |
| |
| Fund Information > 800-662-7447 | CFA® is a trademark owned by CFA Institute. |
| Direct Investor Account Services > 800-662-2739 |
| Institutional Investor Services > 800-523-1036 |
| Text Telephone for People | |
| With Hearing Impairment > 800-749-7273 |
| |
| This material may be used in conjunction |
| with the offering of shares of any Vanguard |
| fund only if preceded or accompanied by |
| the fund’s current prospectus. |
| |
| All comparative mutual fund data are from Lipper Inc. or |
| Morningstar, Inc., unless otherwise noted. |
| |
| You can obtain a free copy of Vanguard’s proxy voting |
| guidelines by visiting our website, www.vanguard.com, |
| and searching for “proxy voting guidelines,” or by calling |
| Vanguard at 800-662-2739. The guidelines are also |
| available from the SEC’s website, www.sec.gov. In |
| addition, you may obtain a free report on how your fund |
| voted the proxies for securities it owned during the 12 |
| months ended June 30. To get the report, visit either |
| www.vanguard.com or www.sec.gov. | |
| |
| You can review and copy information about your fund at |
| the SEC’s Public Reference Room in Washington, D.C. To |
| find out more about this public service, call the SEC at |
| 202-551-8090. Information about your fund is also |
| available on the SEC’s website, and you can receive |
| copies of this information, for a fee, by sending a |
| request in either of two ways: via e-mail addressed to |
| publicinfo@sec.gov or via regular mail addressed to the |
| Public Reference Section, Securities and Exchange |
| Commission, Washington, DC 20549-1520. |
| |
| | ©0 2010 The Vanguard Group, Inc. |
| | All rights reserved. |
| | Vanguard Marketing Corporation, Distributor. |
| |
| | Q752 072010 |
Item 2: Not Applicable.
Item 3: Not Applicable.
Item 4: Not Applicable.
Item 5: Not Applicable.
Item 6: Not Applicable.
Item 7: Not Applicable.
Item 8: Not Applicable.
Item 9: Not Applicable.
Item 10: Not Applicable.
Item 11: Controls and Procedures.
(a) Disclosure Controls and Procedures. The Principal Executive and Financial Officers concluded that the Registrant's Disclosure Controls and Procedures are effective based on their evaluation of the Disclosure Controls and Procedures as of a date within 90 days of the filing date of this report.
(b) Internal Control Over Financial Reporting. There were no significant changes in Registrant’s Internal Control Over Financial Reporting or in other factors that could significantly affect this control subsequent to the date of the evaluation, including any corrective actions with regard to significant deficiencies and material weaknesses.
Item 12: Exhibits.
(a) Code of Ethics.
(b) Certifications.
Pursuant to the requirements of the Securities Exchange Act of 1934 and the Investment Company Act of 1940, the registrant has duly caused this report to be signed on its behalf by the undersigned, thereunto duly authorized.
| |
| | VANGUARD CALIFORNIA TAX-FREE FUNDS |
| |
| By: | /s/ F. WILLIAM MCNABB III* |
| | F. WILLIAM MCNABB III |
| | CHIEF EXECUTIVE OFFICER |
| |
| Date: July 23, 2010 |
Pursuant to the requirements of the Securities Exchange Act of 1934 and the Investment Company Act of 1940, this report has been signed below by the following persons on behalf of the registrant and in the capacities and on the dates indicated.
| |
| | VANGUARD CALIFORNIA TAX-FREE FUNDS |
| |
| By: | /s/ F. WILLIAM MCNABB III* |
| | F. WILLIAM MCNABB III |
| | CHIEF EXECUTIVE OFFICER |
| |
| Date: July 23, 2010 |
| |
| | VANGUARD CALIFORNIA TAX-FREE FUNDS |
| |
| By: | /s/ THOMAS J. HIGGINS* |
| | THOMAS J. HIGGINS |
| | CHIEF FINANCIAL OFFICER |
| |
| Date: July 23, 2010 |
* By: /s/ Heidi Stam
Heidi Stam, pursuant to a Power of Attorney filed on April 26, 2010, see file Number 33-53683, is Incorporated by Reference.