UNITED STATES
SECURITIES AND EXCHANGE COMMISSION
Washington, D.C. 20549
FORM N-CSR
CERTIFIED SHAREHOLDER REPORT
OF
REGISTERED MANAGEMENT INVESTMENT COMPANIES
Investment Company Act file number: 811-4474
Name of Registrant: Vanguard California Tax-Free Funds
Address of Registrant:
P.O. Box 2600
Valley Forge, PA 19482
Name and address of agent for service:
Heidi Stam, Esquire
P.O. Box 876
Valley Forge, PA 19482
Registrant’s telephone number, including area code: (610) 669-1000
Date of fiscal year end: November 30
Date of reporting period: December 1, 2011 – May 31, 2012
Item 1: Reports to Shareholders
Semiannual Report | May 31, 2012
Vanguard California Tax-Exempt Funds
Vanguard California Tax-Exempt Money Market Fund
Vanguard California Intermediate-Term Tax-Exempt Fund
Vanguard California Long-Term Tax-Exempt Fund
> For the six months ended May 31, 2012, Vanguard California Tax-Exempt Money Market Fund returned 0.02%, reflecting the Federal Reserve’s policy of low interest rates.
> Investor Shares of Vanguard California Intermediate-Term Tax-Exempt Fund returned 5.79%, while the Admiral Shares returned 5.83%, well ahead of the return of the fund’s benchmark and the average return of its peers.
> For the Vanguard California Long-Term Tax-Exempt Fund, Investor Shares returned 7.25% and Admiral Shares returned 7.29%. These results were better than the return of the fund’s benchmark but lagged the average return of its peer group.
| |
| Contents | |
| Your Fund’s Total Returns. | 1 |
| Chairman’s Letter. | 2 |
| Advisor’s Report. | 9 |
| California Tax-Exempt Money Market Fund. | 12 |
| California Intermediate-Term Tax-Exempt Fund. | 31 |
| California Long-Term Tax-Exempt Fund. | 69 |
| About Your Fund’s Expenses. | 95 |
| Trustees Approve Advisory Agreement. | 97 |
| Glossary. | 98 |
Please note: The opinions expressed in this report are just that—informed opinions. They should not be considered promises or advice.
Also, please keep in mind that the information and opinions cover the period through the date on the front of this report. Of course, the risks of investing in your fund are spelled out in the prospectus.
See the Glossary for definitions of investment terms used in this report.
About the cover: Vanguard was named for the HMS Vanguard, flagship of British Admiral Horatio Nelson. A ship—whose performance and safety depend on the work of all hands—has served as a fitting metaphor for the Vanguard crew as we strive to help clients reach their financial goals.
Your Fund’s Total Returns
| | | | | |
| Six Months Ended May 31, 2012 | | | | | |
| | | Taxable- | | | |
| | SEC Equivalent | Income | Capital | Total |
| | Yields | Yields | Returns | Returns | Returns |
| Vanguard California Tax-Exempt Money Market | | | | | |
| Fund | 0.05% | 0.09% | 0.02% | 0.00% | 0.02% |
| California Tax-Exempt Money Market Funds | | | | | |
| Average | | | | | 0.00 |
| California Tax-Exempt Money Market Funds Average: Derived from data provided by Lipper Inc. |
| Vanguard California Intermediate-Term Tax-Exempt Fund | | | | |
| Investor Shares | 1.79% | 3.07% | 1.76% | 4.03% | 5.79% |
| Admiral™ Shares | 1.87 | 3.21 | 1.80 | 4.03 | 5.83 |
| Barclays Municipal California Intermediate Bond | | | | | |
| Index | | | | | 5.13 |
| California Intermediate Municipal Debt Funds | | | | | |
| Average | | | | | 4.79 |
| California Intermediate Municipal Debt Funds Average: Derived from data provided by Lipper Inc. |
| Vanguard California Long-Term Tax-Exempt Fund | | | | | |
| Investor Shares | 2.55% | 4.37% | 2.09% | 5.16% | 7.25% |
| Admiral Shares | 2.63 | 4.51 | 2.13 | 5.16 | 7.29 |
| Barclays CA Municipal Bond Index | | | | | 6.48 |
| California Municipal Debt Funds Average | | | | | 8.38 |
California Municipal Debt Funds Average: Derived from data provided by Lipper Inc.
7-day SEC yield for the California Tax-Exempt Money Market Fund; 30-day SEC yield for the California Intermediate-Term Tax-Exempt Fund and California Long-Term Tax-Exempt Fund.
The calculation of taxable-equivalent yield assumes a typical itemized tax return and is based on the maximum federal tax rate of 35% and the maximum income tax rate for the state. Local taxes were not considered. Please see the prospectus for a detailed explanation of the calculation.
Admiral Shares carry lower expenses and are available to investors who meet certain account-balance requirements.
1

Chairman’s Letter
Dear Shareholder,
The California municipal bond market turned in a strong performance for the six months ended May 31, 2012, outpacing the broad U.S. taxable bond market by around 3 percentage points even as the fiscal situation of the state and local governments remained challenging.
For the half-year, Vanguard California Intermediate-Term Tax-Exempt Fund returned 5.79% for Investor Shares and 5.83% for Admiral Shares. Over the same period, Vanguard California Long-Term Tax-Exempt Fund returned 7.25% for Investor Shares and 7.29% for Admiral Shares. Both funds’ holdings in longer bonds, where investor demand was especially strong, helped them outpace their benchmarks, which returned 5.13% and 6.48%, respectively. While the intermediate fund outpaced the 4.79% average return of its peer group as well, the long-term fund’s focus on higher-quality bonds led it to underperform its peer group’s average return of 8.38%.
Because of the Federal Reserve’s efforts to keep short-term interest rates anchored near zero, returns were far more modest for shorter-term securities, especially money market instruments. Vanguard California Tax-Exempt Money Market Fund returned 0.02%, compared with the 0.00% average return of its state peer group for the half-year.
2
Lower-quality and longer-maturity bonds performed best, as many investors were willing to take on greater credit and interest rate risk for more potential yield. As a result of the solid demand for munis, capital appreciation accounted for more than two-thirds of the Intermediate- and Long-Term Funds’ total returns.
As bond prices rose, the 30-day SEC yield for the Intermediate-Term Fund’s Investor Shares fell to 1.79% by May 31, from 2.63% six months earlier. The figures were 2.55% versus 3.42% for the Long-Term Fund’s Investor Shares. (Bond yields and prices move in opposite directions.) The Money Market Fund’s 7-day SEC yield of 0.05% on May 31 was a bit higher than the 0.01% yield of a half-year earlier.
Please note that in March we replaced the benchmark indexes for the California Intermediate-Term Tax-Exempt Fund and the California Long-Term Tax-Exempt Fund. The new indexes are better gauges for the funds because, unlike the prior benchmarks, they are limited to tax-exempt bonds from California issuers. There are no changes to the funds’ objectives, investment strategies, or policies.
All three funds are permitted to invest in securities whose income is subject to the alternative minimum tax (AMT). As of May 31, neither the Intermediate-Term nor the Long-Term Fund owned securities that would generate income distributions subject to the AMT, but the Money Market Fund did.
| | | |
| Market Barometer | | | |
| | | | Total Returns |
| | | Periods Ended May 31, 2012 |
| | Six | One | Five Years |
| | Months | Year | (Annualized) |
| Bonds | | | |
| Barclays U.S. Aggregate Bond Index (Broad taxable | | | |
| market) | 3.46% | 7.12% | 6.72% |
| Barclays Municipal Bond Index (Broad tax-exempt market) | 5.75 | 10.40 | 5.87 |
| Citigroup Three-Month U.S. Treasury Bill Index | 0.02 | 0.04 | 0.95 |
| |
| Stocks | | | |
| Russell 1000 Index (Large-caps) | 6.23% | -1.23% | -0.75% |
| Russell 2000 Index (Small-caps) | 4.06 | -8.88 | -0.73 |
| Dow Jones U.S. Total Stock Market Index | 6.06 | -1.88 | -0.45 |
| MSCI All Country World Index ex USA (International) | -4.04 | -20.49 | -5.55 |
| |
| CPI | | | |
| Consumer Price Index | 1.58% | 1.70% | 2.02% |
3
Bonds benefited from investors
seeking safety and yields
California municipal bonds’ return of more than 6% was well ahead of the broad U.S. taxable bond market’s return of about 3.5% for the half-year.
The yields of U.S. Treasury bonds, which flirted with higher levels early in the period, reached record lows by the end of the six months as some investors fled to the perceived safety of government-issued securities, helping them post a solid return of just under 3%. At the same time, corporate bonds, which found favor with investors seeking higher yields, returned well over 6%.
U.S. stocks significantly outpaced
their international counterparts
The six months ended May 31 were marked by volatility in a pattern that has become all too familiar. At the start of the period, global stock markets rose as the U.S. economy seemed to be strengthening and Europe experienced a temporary lull in its debt crisis.
Stocks later reversed course amid news of dwindling economic growth at home and trouble abroad as Europe’s debt drama once again intensified, causing renewed concern among investors. Despite erasing some earlier gains, U.S. stocks returned more than 6% for the six months.
Expense Ratios
Your Fund Compared With Its Peer Group
| | | |
| | Investor | Admiral | Peer Group |
| | Shares | Shares | Average |
| California Tax-Exempt Money Market | | | |
| Fund | 0.17% | — | 0.29% |
| California Intermediate-Term | | | |
| Tax-Exempt Fund | 0.20 | 0.12% | 0.82 |
| California Long-Term Tax-Exempt Fund | 0.20 | 0.12 | 0.98 |
The fund expense ratios shown are from the prospectus dated March 28, 2012, and represent estimated costs for the current fiscal year. For the six months ended May 31, 2012, the funds’ annualized expense ratios were: for the California Tax-Exempt Money Market Fund, 0.15%; for the California Intermediate-Term Tax-Exempt Fund, 0.20% for Investor Shares and 0.12% for Admiral Shares; and for the California Long-Term Tax-Exempt Fund, 0.20% for Investor Shares and 0.12% for Admiral Shares. The six-month expense ratio for California Tax-Exempt Money Market Fund reflects a temporary reduction in operating expenses (described in Note B of the Notes to Financial Statements). Before this reduction, the fund’s annualized six-month expense ratio was 0.16%. Peer-group expense ratios are derived from data provided by Lipper Inc. and capture information through year-end 2011.
Peer groups: For the California Tax-Exempt Money Market Fund, California Tax-Exempt Money Market Funds; for the California Intermediate-Term Tax-Exempt Fund, California Intermediate Municipal Debt Funds; for the California Long-Term Tax-Exempt Fund, California Municipal Debt Funds.
4
International stocks didn’t fare as well, returning about –4% for the half-year. European companies were the worst performers. Concerns focused on Greece and Spain, but healthier markets throughout Europe felt the effects of resurgent investor worries about indebtedness. Emerging markets and the developed markets of the Pacific region were also hurt by signs of slowing growth.
For municipal bonds, rising supply
was matched by increased demand
The severity of the Great Recession has left the finances of many state and local governments in disarray. The sharp drop in tax revenues had these entities scrambling to make similar cuts to their expenditures, ratcheting up uncertainty in some quarters about their creditworthiness. The situation has remained strained, especially for local governments, because they depend heavily on property tax revenues. Such revenues have continued to fall as they respond with a lag to the declines seen in property values. Many states are also cutting back on their aid to local governments as they try to get their own financial houses in order.
However, overall tax revenues have continued the upward, if uneven, trend that began in 2010 for most states, according to data from The Nelson A. Rockefeller Institute of Government. During the past six months, the U.S. economy inched forward, the employment situation showed some improvement, and consumer spending ticked up, all of which helped drive tax revenues higher for many states, including the Golden State (see the accompanying chart).
At the same time, California state and local governments have shied away from initiating significant new spending projects. Although issuance of municipal bonds increased significantly from a year earlier, much of this issuance refinanced existing debt at lower rates of interest. States and municipalities benefit from refinancing because it reduces their debt servicing costs.
While overall supply rose in the California municipal bond market, so too did demand. The hunt for yield spurred many investors to move into bonds with longer maturities (despite the potential for sharp declines in price should interest rates rise) and lower credit ratings.
California tax revenues are recovering
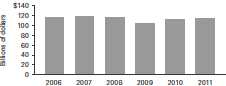
Sources: Vanguard and The Nelson A. Rockefeller Institute of Government.
5
Yields—particularly for long-term issues—hit levels that made municipal bonds attractive even to unconventional investors such as banks.
The outperformance of longer-maturity bonds supported the Intermediate- and Long-Term Funds relative to their benchmarks during the period. Demand for the substantially higher yields offered by these bonds drove their prices up, which translated into capital appreciation for the funds.
Another contributor to the funds’ relative performance was their exposure to essential-service bonds, such as those that finance water and sewer treatment facilities, which benefit from a consistent income stream dedicated to servicing the debt. (Their general-obligation counterparts, which depend on general tax revenues, are more affected by economic cycles.) The funds also benefited from their holdings in the health care sector, especially hospital bonds, where the funds’ advisor saw attractive returns for the level of risk involved.
As I mentioned earlier, the Long-Term Fund’s performance for the period was held back somewhat by its orientation toward higher-quality securities.
During the six months under review, the advisor maintained its systematic and rigorous approach to assessing the credit quality of each security considered for purchase. With hundreds of issuers in this fragmented market, such fundamental credit analysis remained critical in determining where the best opportunities might be for the advisor to add value to the funds.
With yields so low for so long,
what’s a bond investor to do?
Bond yields sure aren’t what they used to be. Those of some Treasuries hit all-time lows during the past six months, and municipal bond yields fell to levels not seen since the 1960s. This is unhappy news for investors who count on bond income for their spending needs.
An alternative approach to the income question is based on “total return.” With this approach, you rely not only on income from your holdings but on cash realized by selling some of them according to a careful plan. The goal is to maintain your preferred asset mix and, thus, a more diversified and stable risk profile. An income-only spending strategy, by contrast, can lead you to tilt your asset mix away from your target in favor of bonds and narrow segments of the stock market, such as stocks with high dividend yields.
For more information on this topic, you may want to read the Vanguard research paper Spending From a Portfolio: Implications of a Total-Return Approach Versus an Income Approach for Taxable Investors. It is available at vanguard.com/ research.
6
Whether yields are high or low, rising or falling, we believe that holding bonds in a portfolio is always useful. They are there to help cushion volatility when, not if, more risky assets such as stocks happen to perform poorly.
As always, thank you for entrusting your assets to Vanguard.
Sincerely,

F. William McNabb III
Chairman and Chief Executive Officer
June 15, 2012
7
Your Fund’s Performance at a Glance
November 30, 2011, Through May 31, 2012
| | | | |
| | | | Distributions Per Share |
| | Starting | Ending | Income | Capital |
| | Share Price | Share Price | Dividends | Gains |
| Vanguard California Tax-Exempt Money Market | | | | |
| Fund | $1.00 | $1.00 | $0.000 | $0.000 |
| Vanguard California Intermediate-Term | | | | |
| Tax-Exempt Fund | | | | |
| Investor Shares | $11.18 | $11.63 | $0.194 | $0.000 |
| Admiral Shares | 11.18 | 11.63 | 0.199 | 0.000 |
| Vanguard California Long-Term Tax-Exempt | | | | |
| Fund | | | | |
| Investor Shares | $11.24 | $11.82 | $0.231 | $0.000 |
| Admiral Shares | 11.24 | 11.82 | 0.235 | 0.000 |
8
Advisor’s Report
For the six months ended May 31, 2012, Vanguard California Tax-Exempt Money Market Fund returned 0.02%. Vanguard California Long-Term Tax-Exempt Fund returned 7.25% for Investor Shares and 7.29% for Admiral Shares. The Long-Term Fund outpaced its new benchmark index, which returned 6.48%, but lagged the 8.38% average return of peer-group funds. Vanguard California Intermediate-Term Tax-Exempt Fund returned 5.79% for Investor Shares and 5.83% for Admiral Shares, ahead of both the 5.13% return of its new benchmark index and the 4.79% average return of peer-group funds. (The new benchmarks are discussed in the Chairman’s Letter.)
The investment environment
The half-year saw generally declining yields in the municipal bond market. The Federal Reserve continued to anchor the shortest-term yields near zero and reiterated its view that rates would remain very low through late 2014. The most direct impact of this policy, of course, has been on money market funds, including the California Tax-Exempt Money Market Fund. At the opposite end of the maturity spectrum, the Fed continued to execute a bond-buying program aimed at lowering longer-term yields. (Yields fall as demand for bonds rises, boosting prices.)
Economic concerns also contributed to the slide in yields. Investors nervous about the uneven pace of U.S. economic growth and the further unraveling of Europe’s fiscal
Yields of Tax-Exempt Municipal Securities
(AAA-Rated General-Obligation Issues)
| | |
| | November 30, | May 31, |
| Maturity | 2011 | 2012 |
| 2 years | 0.42% | 0.33% |
| 5 years | 1.12 | 0.75 |
| 10 years | 2.22 | 1.79 |
| 30 years | 3.84 | 3.08 |
| Source: Vanguard. |
9
situation fled to the perceived safety of U.S. Treasury securities and municipal bonds. Moreover, demand for municipal bonds has been robust since early 2011, when the muni market recovered from a five-month slide in prices and a wave of fund withdrawals accompanied by overblown fears of systemic defaults.
Patient investors in the California Long-Term and Intermediate-Term Tax-Exempt Funds have done well since then: From January 31, 2011, to May 31, 2012, the Long-Term Fund returned about 18% and the Intermediate-Term Fund 15%, compared with about 10% for taxable bonds and not quite 4% for stocks (based on the Barclays U.S. Aggregate Bond Index and the Dow Jones U.S. Total Stock Market Index).
Municipal bonds’ strong performance took place as most state and local governments continued to wrestle with finances tattered by the Great Recession. Although the state passed its fiscal 2012 budget (ended June 30) on time—a first in many years because of new legislative powers—budgeted revenues have failed to materialize. Overly optimistic assumptions were a factor, even as California’s economy appears to be recovering at about the same pace as the nation’s. According to a gauge of current economic conditions for each state that is published by the Federal Reserve Bank of Philadelphia, the California economy improved by 6% from its low point in November 2009 through May 2012, a figure almost identical to that for the national economy. (The index combines data on jobs, manufacturing, and wages and salaries.)
An extra element of uncertainty surrounds the fiscal 2013 budget: In November Californians must decide whether to vote for a temporary tax increase aimed at closing the budget gap; if rejected, automatic spending cuts, mostly in school funding, will be triggered. (A rejection won’t impair the payment streams for school-district general obligation bonds, although there may be negative rating implications.)
Like many other issuers nationwide, California state and local governments are taking advantage of low interest rates to call in (redeem early) and replace higher-interest bonds; at the same time, they are limiting outlays for new projects, resulting in lighter bond issuance than in previous years. Nationally, during the six months ended May 31, about two-thirds of the $160 billion in new issues were refin-ancings, compared with an average of one-third over the 15 years through 2010.
Management of the funds
As the Federal Reserve’s operations at both ends of the maturity spectrum lowered yields, many muni investors grew willing to accept greater risk to obtain higher yields. Many have turned to high-yield municipal bonds, exposing themselves to greater credit risk, while others have moved to longer-maturity munis, which would respond with greater price declines should interest rates rise. It’s a phenomenon we
10
would normally look for in the later stages of an economic recovery, when the typical pace of expansion would be stronger, state and local finances healthier, and confidence higher.
Nonetheless, the Long-Term and Intermediate-Term Funds have benefited from this market environment. The demand for longer-term bonds has boosted the prices of holdings in our portfolio. We have also taken advantage of the steep yield curve—that is, the wide difference between shorter- and longer-term yields that has resulted from the Fed’s policies—by underweighting bonds with maturities of 1–5 years and overweighting bonds with maturities of 10–15 years. A steep yield curve can produce price gains as bonds move closer to their maturity.
In all market conditions, of course, in-depth credit analysis is a key aspect of our process. In selecting bonds to add to or sell from our portfolios, we combine our traders’ focus on finding value with our credit analysts’ prudent views about the financial structure and economic environment of issuers.
Two broad themes in the current market are an emphasis on essential-service bonds and a move away from local-government general-obligation issues, although there are always exceptions. For example, our analysts have identified highly rated general obligation bonds issued by local governments that, while under stress, have been minimally affected by the decline in property tax revenue and cutbacks in state aid. In addition, we have focused on attractively valued issues in health care, with an emphasis on hospitals.
The offerings in which we’ve participated during the reporting period have included those of the Sutter, Stanford, and Kaiser Permanente health care systems. Among other performance drivers was an emphasis on premium bonds with call features. These bonds can provide added income given the level of risk, and can be less vulnerable to volatility should interest rates rise.
As we noted earlier, the Fed has tamped down short-term interest rates to an unprecedented degree, a policy that has understandably concerned shareholders in the California Tax-Exempt Money Market Fund. Despite the difficulties presented by near-zero yields, we have not altered our strategy of emphasizing investment in high-quality money market assets. At the same time, the low short-term rates have provided another source of debt-service savings to fiscally stressed state and local governments.
James M. D’Arcy, Portfolio Manager
Pamela Wisehaupt Tynan, Principal, Head of Municipal Money Market Funds
Christopher W. Alwine, CFA, Principal, Head of Municipal Bond Funds
Vanguard Fixed Income Group
June 20, 2012
11
California Tax-Exempt Money Market Fund
Fund Profile
As of May 31, 2012
| |
| Financial Attributes | |
| Ticker Symbol | VCTXX |
| Expense Ratio1 | 0.17% |
| 7-Day SEC Yield | 0.05% |
| Average Weighted | |
| Maturity | 26 days |
| |
| Distribution by Credit Quality (% of portfolio) | |
| First Tier | 100.0% |
| For information about these ratings, see the Glossary entry for Credit Quality. |
| |
1 The expense ratio shown is from the prospectus dated March 28, 2012, and represents estimated costs for the current fiscal year. For the six months ended May 31, 2012, the annualized expense ratio was 0.15%. For the six months ended May 31, 2012, the annualized expense ratio was 0.15%, reflecting a temporary reduction in operating expenses (described in Note B of the Notes to Financial Statements). Before this reduction, the expense ratio was 0.16%.
12
California Tax-Exempt Money Market Fund
Performance Summary
Investment returns will fluctuate. All of the returns in this report represent past performance, which is not a guarantee of future results that may be achieved by the fund. (Current performance may be lower or higher than the performance data cited. For performance data current to the most recent month-end, visit our website at vanguard.com/performance.) The returns shown do not reflect taxes that a shareholder would pay on fund distributions. An investment in a money market fund is not insured or guaranteed by the Federal Deposit Insurance Corporation or any other government agency. Although the fund seeks to preserve the value of your investment at $1 per share, it is possible to lose money by investing in the fund. The fund’s 7-day SEC yield reflects its current earnings more closely than do the average annual returns.
| | |
| Fiscal-Year Total Returns (%): November 30, 2001, Through May 31, 2012 | |
| | | CA Tax-Exempt |
| | | Money Mkt |
| | | Funds Avg |
| Fiscal Year | Total Returns | Total Returns |
| 2002 | 1.33% | 0.92% |
| 2003 | 0.91 | 0.54 |
| 2004 | 1.05 | 0.60 |
| 2005 | 2.17 | 1.70 |
| 2006 | 3.24 | 2.78 |
| 2007 | 3.55 | 3.06 |
| 2008 | 2.21 | 1.81 |
| 2009 | 0.37 | 0.17 |
| 2010 | 0.11 | 0.01 |
| 2011 | 0.07 | 0.01 |
| 2012 | 0.02 | 0.00 |
7-day SEC yield (5/31/2012): 0.05% California Tax-Exempt Money Market Funds Average: Derived from data provided by Lipper Inc.
Note: For 2012, performance data reflect the six months ended May 31, 2012.
Average Annual Total Returns: Periods Ended March 31, 2012
This table presents returns through the latest calendar quarter—rather than through the end of the fiscal period.
Securities and Exchange Commission rules require that we provide this information.
| | | | |
| | Inception | One | Five | Ten |
| | Date | Year | Years | Years |
| California Tax-Exempt Money | | | | |
| Market Fund | 6/1/1987 | 0.03% | 1.02% | 1.45% |
See Financial Highlights for dividend information.
13
California Tax-Exempt Money Market Fund
Financial Statements (unaudited)
Statement of Net Assets
As of May 31, 2012
The fund reports a complete list of its holdings in various monthly and quarterly regulatory filings. The fund publishes its holdings on a monthly basis at vanguard.com and files them with the Securities and Exchange Commission on Form N-MFP. The fund’s Form N-MFP filings become public 60 days after the relevant month-end, and may be viewed at sec.gov or via a link on the “Portfolio Holdings” page on vanguard.com. For the second and fourth fiscal quarters, the lists appear in the fund’s semiannual and annual reports to shareholders. For the first and third fiscal quarters, the fund files the lists with the SEC on Form N-Q. Shareholders can look up the fund’s Forms N-Q on the SEC’s website at sec.gov. Forms N-Q may also be reviewed and copied at the SEC’s Public Reference Room (see the back cover of this report for further information).
| | | | |
| | | | Face | Market |
| | | Maturity | Amount | Value |
| | Coupon | Date | ($000) | ($000) |
| Tax-Exempt Municipal Bonds (103.1%) | | | | |
| California (103.1%) | | | | |
| ABAG Finance Authority for | | | | |
| Nonprofit Corps. California Revenue | | | | |
| (Francis Parker School Project) | | | | |
| VRDO | 0.170% | 6/7/12 LOC | 17,315 | 17,315 |
| ABAG Finance Authority for | | | | |
| Nonprofit Corps. California Revenue | | | | |
| (Institute for Defense Analyses) VRDO | 0.160% | 6/7/12 LOC | 11,945 | 11,945 |
| ABAG Finance Authority for | | | | |
| Nonprofit Corps. California Revenue | | | | |
| (Lakeside Village Apartments) VRDO | 0.140% | 6/7/12 LOC | 12,000 | 12,000 |
| ABAG Finance Authority for | | | | |
| Nonprofit Corps. California Revenue | | | | |
| (Public Policy Institute) VRDO | 0.180% | 6/7/12 LOC | 12,705 | 12,705 |
| Anaheim CA Housing Finance Agency | | | | |
| Home Mortgage Revenue VRDO | 0.180% | 6/7/12 LOC | 5,485 | 5,485 |
| 1 Anaheim CA Public Financing Authority | | | | |
| Lease Revenue (Anaheim Public | | | | |
| Improvements Project) TOB VRDO | 0.170% | 6/7/12 LOC | 47,115 | 47,115 |
| 1 Bay Area Toll Authority California Toll Bridge | | | | |
| Revenue (San Francisco Bay Area) TOB PUT | 0.300% | 1/23/13 | 9,865 | 9,865 |
| 1 Bay Area Toll Authority California Toll Bridge | | | | |
| Revenue (San Francisco Bay Area) TOB VRDO | 0.180% | 6/7/12 | 43,340 | 43,340 |
| 1 Bay Area Toll Authority California Toll Bridge | | | | |
| Revenue (San Francisco Bay Area) TOB VRDO | 0.250% | 6/7/12 | 5,000 | 5,000 |
| Bay Area Toll Authority California Toll Bridge | | | | |
| Revenue (San Francisco Bay Area) VRDO | 0.130% | 6/7/12 LOC | 17,280 | 17,280 |
| Bay Area Toll Authority California Toll Bridge | | | | |
| Revenue (San Francisco Bay Area) VRDO | 0.140% | 6/7/12 LOC | 87,500 | 87,500 |
| Bay Area Toll Authority California Toll Bridge | | | | |
| Revenue (San Francisco Bay Area) VRDO | 0.150% | 6/7/12 LOC | 8,000 | 8,000 |
| Berkeley CA TRAN | 2.000% | 7/5/12 | 48,000 | 48,078 |
| 1 BlackRock MuniYield California Fund, Inc. | | | | |
| VRDP VRDO | 0.300% | 6/7/12 LOC | 15,000 | 15,000 |
14
| | | | | |
| California Tax-Exempt Money Market Fund | | | | |
| |
| |
| |
| | | | | Face | Market |
| | | | Maturity | Amount | Value |
| | | Coupon | Date | ($000) | ($000) |
| 1 | BlackRock MuniYield California Quality Fund, Inc. | | | | |
| | VRDP VRDO | 0.300% | 6/7/12 LOC | 30,000 | 30,000 |
| | Butte County CA TRAN | 2.000% | 6/29/12 | 5,000 | 5,006 |
| 1 | California Department of Water Resources | | | | |
| | Water System Revenue (Central Valley Project) | | | | |
| | TOB VRDO | 0.180% | 6/7/12 | 4,100 | 4,100 |
| | California Educational Facilities Authority Revenue | | | | |
| | (California Institute of Technology) VRDO | 0.140% | 6/7/12 | 55,800 | 55,800 |
| | California Educational Facilities Authority Revenue | | | | |
| | (Stanford Hospital) CP | 0.130% | 7/18/12 | 10,000 | 10,000 |
| 1 | California Educational Facilities Authority Revenue | | | | |
| | (Stanford Hospital) TOB VRDO | 0.200% | 6/7/12 LOC | 5,800 | 5,800 |
| | California Educational Facilities Authority Revenue | | | | |
| | (Stanford University) CP | 0.240% | 7/17/12 | 40,000 | 40,000 |
| | California Educational Facilities Authority Revenue | | | | |
| | (Stanford University) CP | 0.250% | 7/17/12 | 1,200 | 1,200 |
| | California Educational Facilities Authority Revenue | | | | |
| | (Stanford University) CP | 0.250% | 8/9/12 | 40,000 | 40,000 |
| 1 | California Educational Facilities Authority Revenue | | | | |
| | (Stanford University) TOB PUT | 0.270% | 11/8/12 | 37,185 | 37,185 |
| 1 | California Educational Facilities Authority Revenue | | | | |
| | (Stanford University) TOB VRDO | 0.160% | 6/7/12 | 4,450 | 4,450 |
| 1 | California Educational Facilities Authority Revenue | | | | |
| | (Stanford University) TOB VRDO | 0.200% | 6/7/12 | 7,645 | 7,645 |
| 1 | California Educational Facilities Authority Revenue | | | | |
| | (University of Southern California) TOB PUT | 0.310% | 8/16/12 | 15,035 | 15,035 |
| 1 | California Educational Facilities Authority Revenue | | | | |
| | (University of Southern California) TOB VRDO | 0.180% | 6/7/12 | 4,135 | 4,135 |
| | California GO VRDO | 0.140% | 6/1/12 LOC | 6,525 | 6,525 |
| | California Health Facilities Financing Authority | | | | |
| | Revenue (Catholic Healthcare West) VRDO | 0.160% | 6/7/12 LOC | 6,725 | 6,725 |
| | California Health Facilities Financing Authority | | | | |
| | Revenue (Children’s Hospital of Orange County) | | | | |
| | VRDO | 0.150% | 6/7/12 LOC | 21,700 | 21,700 |
| | California Health Facilities Financing Authority | | | | |
| | Revenue (Children’s Hospital of Orange County) | | | | |
| | VRDO | 0.150% | 6/7/12 LOC | 16,900 | 16,900 |
| | California Health Facilities Financing Authority | | | | |
| | Revenue (Children’s Hospital of Orange County) | | | | |
| | VRDO | 0.150% | 6/7/12 LOC | 50,000 | 50,000 |
| 1,2 | California Health Facilities Financing Authority | | | | |
| | Revenue (Kaiser Foundation Hospitals) TOB PUT | 0.220% | 9/4/12 LOC | 35,000 | 35,000 |
| | California Health Facilities Financing Authority | | | | |
| | Revenue (Memorial Health Services) VRDO | 0.170% | 6/7/12 | 64,400 | 64,400 |
| | California Health Facilities Financing Authority | | | | |
| | Revenue (Scripps Health) VRDO | 0.110% | 6/7/12 LOC | 4,200 | 4,200 |
| | California Health Facilities Financing Authority | | | | |
| | Revenue (Scripps Health) VRDO | 0.120% | 6/7/12 LOC | 12,715 | 12,715 |
| | California Health Facilities Financing Authority | | | | |
| | Revenue (Scripps Health) VRDO | 0.140% | 6/7/12 | 5,000 | 5,000 |
| 1 | California Health Facilities Financing Authority | | | | |
| | Revenue (Sutter Health) TOB VRDO | 0.150% | 6/7/12 | 12,210 | 12,210 |
| 1 | California Health Facilities Financing Authority | | | | |
| | Revenue (Sutter Health) TOB VRDO | 0.180% | 6/7/12 | 6,700 | 6,700 |
15
| | | | |
| California Tax-Exempt Money Market Fund | | | | |
| |
| |
| |
| | | | Face | Market |
| | | Maturity | Amount | Value |
| | Coupon | Date | ($000) | ($000) |
| California Housing Finance Agency Home | | | | |
| Mortgage Revenue VRDO | 0.160% | 6/7/12 LOC | 5,030 | 5,030 |
| California Housing Finance Agency Home | | | | |
| Mortgage Revenue VRDO | 0.160% | 6/7/12 LOC | 12,000 | 12,000 |
| California Housing Finance Agency Home | | | | |
| Mortgage Revenue VRDO | 0.170% | 6/7/12 LOC | 24,500 | 24,500 |
| California Housing Finance Agency Home | | | | |
| Mortgage Revenue VRDO | 0.170% | 6/7/12 LOC | 38,230 | 38,230 |
| California Housing Finance Agency Home | | | | |
| Mortgage Revenue VRDO | 0.170% | 6/7/12 LOC | 6,895 | 6,895 |
| California Housing Finance Agency Multifamily | | | | |
| Housing Revenue VRDO | 0.160% | 6/7/12 LOC | 8,600 | 8,600 |
| California Infrastructure & Economic Development | | | | |
| Bank Revenue (Academy of Motion Picture Arts | | | | |
| & Sciences Obligated Group) VRDO | 0.150% | 6/7/12 LOC | 35,000 | 35,000 |
| California Infrastructure & Economic Development | | | | |
| Bank Revenue (Academy of Sciences) VRDO | 0.160% | 6/1/12 LOC | 10,325 | 10,325 |
| California Infrastructure & Economic Development | | | | |
| Bank Revenue (American National Red Cross) | | | | |
| VRDO | 0.150% | 6/7/12 LOC | 11,075 | 11,075 |
| 1 California Infrastructure & Economic Development | | | | |
| Bank Revenue (Bay Area Toll Bridges Seismic | | | | |
| Retrofit) TOB VRDO | 0.200% | 6/1/12 (ETM) | 16,865 | 16,865 |
| California Infrastructure & Economic Development | | | | |
| Bank Revenue (Buck Institute for Age Research) | | | | |
| VRDO | 0.150% | 6/7/12 LOC | 28,100 | 28,100 |
| California Infrastructure & Economic Development | | | | |
| Bank Revenue (JSerra Catholic High School | | | | |
| Project) VRDO | 0.130% | 6/7/12 LOC | 22,860 | 22,860 |
| California Infrastructure & Economic Development | | | | |
| Bank Revenue (Prinsco Inc. Project) VRDO | 0.350% | 6/7/12 LOC | 6,200 | 6,200 |
| California Municipal Finance Authority Revenue | | | | |
| (Notre Dame High School, San Jose) VRDO | 0.220% | 6/7/12 LOC | 5,425 | 5,425 |
| California Municipal Finance Authority Revenue | | | | |
| (Westmont College) VRDO | 0.170% | 6/7/12 LOC | 13,500 | 13,500 |
| California Pollution Control Financing Authority | | | | |
| Revenue (Pacific Gas & Electric Co.) VRDO | 0.160% | 6/1/12 LOC | 7,000 | 7,000 |
| 1 California Public Works Board Lease Revenue | | | | |
| (University of California) TOB VRDO | 0.240% | 6/7/12 | 6,655 | 6,655 |
| California School Cash Reserve Program | | | | |
| Authority Pool TRAN | 2.000% | 6/1/12 | 20,000 | 20,000 |
| California Statewide Communities Development | | | | |
| Authority Gas Supply Revenue VRDO | 0.170% | 6/7/12 | 79,245 | 79,245 |
| California Statewide Communities Development | | | | |
| Authority Multifamily Housing Revenue | | | | |
| (Canyon Springs Apartments Project) VRDO | 0.310% | 6/7/12 LOC | 10,105 | 10,105 |
| California Statewide Communities Development | | | | |
| Authority Multifamily Housing Revenue | | | | |
| (Knolls Apartments) VRDO | 0.160% | 6/7/12 LOC | 12,715 | 12,715 |
| California Statewide Communities Development | | | | |
| Authority Multifamily Housing Revenue | | | | |
| (Ridgeway Apartments) VRDO | 0.160% | 6/7/12 LOC | 8,585 | 8,585 |
16
| | | | |
| California Tax-Exempt Money Market Fund | | | | |
| |
| |
| |
| | | | Face | Market |
| | | Maturity | Amount | Value |
| | Coupon | Date | ($000) | ($000) |
| California Statewide Communities Development | | | | |
| Authority Multifamily Housing Revenue | | | | |
| (Village Green Apartments) VRDO | 0.170% | 6/7/12 LOC | 5,800 | 5,800 |
| California Statewide Communities Development | | | | |
| Authority Revenue (Community Hospital of the | | | | |
| Monterey Peninsula) VRDO | 0.150% | 6/7/12 LOC | 12,750 | 12,750 |
| California Statewide Communities Development | | | | |
| Authority Revenue (Kaiser Permanente) PUT | 0.480% | 6/1/12 | 12,500 | 12,500 |
| California Statewide Communities Development | | | | |
| Authority Revenue (Kaiser Permanente) PUT | 0.480% | 6/1/12 | 12,500 | 12,500 |
| California Statewide Communities Development | | | | |
| Authority Revenue (Kaiser Permanente) VRDO | 0.170% | 6/7/12 | 13,700 | 13,700 |
| California Statewide Communities Development | | | | |
| Authority Revenue (Rady Children’s Hospital - | | | | |
| San Diego) VRDO | 0.140% | 6/1/12 LOC | 33,180 | 33,180 |
| California Statewide Communities Development | | | | |
| Authority Revenue (Rady Children’s Hospital - | | | | |
| San Diego) VRDO | 0.150% | 6/7/12 LOC | 25,000 | 25,000 |
| California Statewide Communities Development | | | | |
| Authority Revenue (Redlands Community | | | | |
| Hospital) VRDO | 0.160% | 6/7/12 LOC | 2,000 | 2,000 |
| 1 California Statewide Communities Development | | | | |
| Authority Revenue (Sutter Health) TOB VRDO | 0.250% | 6/7/12 | 13,200 | 13,200 |
| 1 California Statewide Communities Development | | | | |
| Authority Revenue (Sutter Health) TOB VRDO | 0.250% | 6/7/12 | 5,500 | 5,500 |
| 1 California Statewide Communities Development | | | | |
| Authority Revenue (Trinity Health) TOB VRDO | 0.180% | 6/7/12 | 2,175 | 2,175 |
| 1 Central Basin Municipal Water District California | | | | |
| COP TOB VRDO | 0.250% | 6/7/12 (4) | 7,500 | 7,500 |
| 1 Cerritos CA Community College District GO | | | | |
| TOB VRDO | 0.180% | 6/7/12 | 7,845 | 7,845 |
| 1 Cerritos CA Community College District GO | | | | |
| TOB VRDO | 0.200% | 6/7/12 | 13,000 | 13,000 |
| 1 Chabot-Las Positas CA Community College | | | | |
| District GO TOB VRDO | 0.200% | 6/7/12 | 6,000 | 6,000 |
| 1 Chabot-Las Positas CA Community College | | | | |
| District GO TOB VRDO | 0.310% | 6/7/12 | 8,725 | 8,725 |
| Chula Vista CA Multifamily Housing Revenue | | | | |
| (Teresina Apartments) VRDO | 0.170% | 6/7/12 LOC | 18,970 | 18,970 |
| 1 Contra Costa CA Community College District | | | | |
| GO TOB VRDO | 0.180% | 6/7/12 | 5,110 | 5,110 |
| 1 Contra Costa CA Community College District | | | | |
| GO TOB VRDO | 0.310% | 6/7/12 | 5,200 | 5,200 |
| 1 Contra Costa CA Transportation Authority | | | | |
| Sales Tax Revenue TOB VRDO | 0.180% | 6/7/12 | 20,000 | 20,000 |
| Contra Costa County CA Multifamily Housing | | | | |
| Revenue (Park Regency) VRDO | 0.170% | 6/7/12 LOC | 47,200 | 47,200 |
| 1 Desert CA Community College District GO | | | | |
| TOB VRDO | 0.250% | 6/7/12 | 11,000 | 11,000 |
| 2 East Bay CA Municipal Utility District Waste | | | | |
| Water System Revenue PUT | 0.180% | 2/1/13 | 23,435 | 23,435 |
| East Bay CA Municipal Utility District Water | | | | |
| System Revenue (Extendible) CP | 0.180% | 6/1/12 | 12,200 | 12,200 |
17
| | | | |
| California Tax-Exempt Money Market Fund | | | | |
| |
| |
| |
| | | | Face | Market |
| | | Maturity | Amount | Value |
| | Coupon | Date | ($000) | ($000) |
| East Bay CA Municipal Utility District Water | | | | |
| System Revenue (Extendible) CP | 0.230% | 7/5/12 | 13,500 | 13,500 |
| East Bay CA Municipal Utility District Water | | | | |
| System Revenue (Extendible) CP | 0.220% | 7/9/12 | 26,300 | 26,300 |
| East Bay CA Municipal Utility District Water | | | | |
| System Revenue (Extendible) CP | 0.230% | 7/17/12 | 20,000 | 20,000 |
| East Bay CA Municipal Utility District Water | | | | |
| System Revenue (Extendible) CP | 0.250% | 7/23/12 | 20,800 | 20,800 |
| East Bay CA Municipal Utility District Water | | | | |
| System Revenue (Extendible) CP | 0.250% | 8/7/12 | 16,600 | 16,600 |
| East Bay CA Municipal Utility District Water | | | | |
| System Revenue (Extendible) CP | 0.260% | 9/12/12 | 20,000 | 20,000 |
| 2 East Bay CA Municipal Utility District Water | | | | |
| System Revenue PUT | 0.180% | 12/3/12 | 44,800 | 44,800 |
| 2 East Bay CA Municipal Utility District Water | | | | |
| System Revenue PUT | 0.190% | 3/1/13 | 49,200 | 49,200 |
| 1 Eastern California Municipal Water District | | | | |
| Water & Sewer COP TOB VRDO | 0.180% | 6/7/12 | 1,590 | 1,590 |
| Eastern California Municipal Water District | | | | |
| Water & Sewer Revenue | 2.000% | 7/1/12 | 7,485 | 7,496 |
| Eastern California Municipal Water District | | | | |
| Water & Sewer Revenue VRDO | 0.170% | 6/7/12 | 11,600 | 11,600 |
| Escondido CA Community Development | | | | |
| (Escondido Promenade Project) COP VRDO | 0.170% | 6/7/12 LOC | 9,400 | 9,400 |
| Escondido CA Community Development | | | | |
| Multifamily Revenue (Heritage Park | | | | |
| Apartments) VRDO | 0.180% | 6/7/12 LOC | 4,250 | 4,250 |
| Freemont CA Union High School District TRAN | 3.000% | 6/29/12 | 15,000 | 15,032 |
| Fremont CA COP VRDO | 0.150% | 6/7/12 LOC | 5,000 | 5,000 |
| Fremont CA COP VRDO | 0.150% | 6/7/12 LOC | 9,305 | 9,305 |
| Fremont CA COP VRDO | 0.150% | 6/7/12 LOC | 29,500 | 29,500 |
| 1 Fresno CA Unified School District Revenue | | | | |
| TOB VRDO | 0.200% | 6/7/12 LOC | 8,380 | 8,380 |
| Fresno County CA TRAN | 3.000% | 6/29/12 | 8,000 | 8,017 |
| Garden Grove CA Housing Authority Multifamily | | | | |
| Housing Revenue (Valley View Senior | | | | |
| Villas Project) VRDO | 0.180% | 6/7/12 LOC | 9,100 | 9,100 |
| 1 Grossmont CA Healthcare District Revenue | | | | |
| TOB VRDO | 0.200% | 6/7/12 | 8,600 | 8,600 |
| Irvine CA Assessment District No. 05-21 | | | | |
| Improvement Revenue VRDO | 0.180% | 6/1/12 LOC | 37,645 | 37,645 |
| Irvine CA Assessment District No. 89-10 | | | | |
| Improvement Revenue (Northwest Irvine) | | | | |
| VRDO | 0.180% | 6/1/12 LOC | 6,199 | 6,199 |
| Irvine CA Assessment District No. 97-17 | | | | |
| Improvement Revenue VRDO | 0.180% | 6/1/12 LOC | 19,104 | 19,104 |
| Irvine CA Public Facilities & Infrastructure | | | | |
| Authority Assessment Revenue VRDO | 0.180% | 6/1/12 LOC | 2,900 | 2,900 |
| Irvine CA Public Facilities & Infrastructure | | | | |
| Authority Assessment Revenue VRDO | 0.180% | 6/1/12 LOC | 5,200 | 5,200 |
| 2 Irvine CA Ranch Water District Revenue PUT | 0.170% | 3/1/13 | 10,000 | 10,000 |
| Irvine CA Reassessment District No. 85-7A | | | | |
| Improvement Revenue VRDO | 0.160% | 6/1/12 LOC | 11,755 | 11,755 |
| Livermore CA COP VRDO | 0.150% | 6/7/12 LOC | 13,990 | 13,990 |
18
| | | | |
| California Tax-Exempt Money Market Fund | | | | |
| |
| |
| |
| | | | Face | Market |
| | | Maturity | Amount | Value |
| | Coupon | Date | ($000) | ($000) |
| Livermore CA Redevelopment Agency | | | | |
| Multi-Family Housing Revenue | | | | |
| (Richards Manor) VRDO | 0.180% | 6/7/12 LOC | 4,770 | 4,770 |
| 1 Long Beach CA Harbor Revenue TOB VRDO | 0.380% | 6/7/12 | 15,740 | 15,740 |
| Long Beach CA Water Revenue CP | 0.140% | 6/5/12 | 11,000 | 11,000 |
| 1 Los Angeles CA Community College District | | | | |
| GO TOB VRDO | 0.150% | 6/7/12 | 3,500 | 3,500 |
| 1 Los Angeles CA Community College District | | | | |
| GO TOB VRDO | 0.200% | 6/7/12 | 5,200 | 5,200 |
| 1 Los Angeles CA Community College District | | | | |
| GO TOB VRDO | 0.240% | 6/7/12 | 9,575 | 9,575 |
| 1 Los Angeles CA Community College District | | | | |
| GO TOB VRDO | 0.250% | 6/7/12 | 16,130 | 16,130 |
| Los Angeles CA Community Redevelopment | | | | |
| Agency Multifamily Housing Revenue | | | | |
| (Academy Village Apartments) VRDO | 0.170% | 6/7/12 LOC | 3,300 | 3,300 |
| Los Angeles CA Community Redevelopment | | | | |
| Agency Multifamily Housing Revenue | | | | |
| (Hollywood & Vine Apartments) VRDO | 0.160% | 6/7/12 LOC | 19,200 | 19,200 |
| 1 Los Angeles CA Department of Airports | | | | |
| International Airport Revenue TOB VRDO | 0.150% | 6/7/12 | 8,750 | 8,750 |
| 1 Los Angeles CA Department of Airports | | | | |
| International Airport Revenue TOB VRDO | 0.180% | 6/7/12 | 5,000 | 5,000 |
| 1 Los Angeles CA Department of Airports | | | | |
| International Airport Revenue TOB VRDO | 0.200% | 6/7/12 | 6,000 | 6,000 |
| 1 Los Angeles CA Department of Airports | | | | |
| International Airport Revenue TOB VRDO | 0.240% | 6/7/12 | 7,975 | 7,975 |
| 1 Los Angeles CA Department of Airports | | | | |
| International Airport Revenue TOB VRDO | 0.240% | 6/7/12 | 18,880 | 18,880 |
| 1 Los Angeles CA Department of Water & | | | | |
| Power Revenue TOB VRDO | 0.170% | 6/7/12 LOC | 10,255 | 10,255 |
| 1 Los Angeles CA Department of Water & | | | | |
| Power Revenue TOB VRDO | 0.180% | 6/7/12 | 7,495 | 7,495 |
| 1 Los Angeles CA Department of Water & | | | | |
| Power Revenue TOB VRDO | 0.240% | 6/7/12 | 5,450 | 5,450 |
| 1 Los Angeles CA Department of Water & | | | | |
| Power Revenue TOB VRDO | 0.240% | 6/7/12 | 4,360 | 4,360 |
| Los Angeles CA Department of Water & | | | | |
| Power Revenue VRDO | 0.150% | 6/1/12 | 23,200 | 23,200 |
| Los Angeles CA Department of Water & | | | | |
| Power Revenue VRDO | 0.160% | 6/1/12 | 33,000 | 33,000 |
| Los Angeles CA Department of Water & | | | | |
| Power Revenue VRDO | 0.120% | 6/7/12 | 40,500 | 40,500 |
| Los Angeles CA Department of Water & | | | | |
| Power Revenue VRDO | 0.130% | 6/7/12 | 21,175 | 21,175 |
| Los Angeles CA Department of Water & | | | | |
| Power Revenue VRDO | 0.140% | 6/7/12 | 55,000 | 55,000 |
| Los Angeles CA Department of Water & | | | | |
| Power Revenue VRDO | 0.140% | 6/7/12 | 32,400 | 32,400 |
| Los Angeles CA Department of Water & | | | | |
| Power Revenue VRDO | 0.140% | 6/7/12 | 12,000 | 12,000 |
| Los Angeles CA Department of Water & | | | | |
| Power Revenue VRDO | 0.150% | 6/7/12 | 12,750 | 12,750 |
| Los Angeles CA Harbor Department Revenue CP | 0.220% | 7/19/12 | 10,000 | 10,000 |
19
| | | | | |
| California Tax-Exempt Money Market Fund | | | | |
| |
| |
| |
| | | | | Face | Market |
| | | | Maturity | Amount | Value |
| | | Coupon | Date | ($000) | ($000) |
| 1 | Los Angeles CA Harbor Department Revenue | | | | |
| | TOB VRDO | 0.180% | 6/7/12 | 2,680 | 2,680 |
| 1 | Los Angeles CA Harbor Department Revenue | | | | |
| | TOB VRDO | 0.200% | 6/7/12 | 5,395 | 5,395 |
| | Los Angeles CA Multifamily Housing Revenue | | | | |
| | (Beverly Park Apartments) VRDO | 0.160% | 6/7/12 LOC | 15,500 | 15,500 |
| | Los Angeles CA Multifamily Housing Revenue | | | | |
| | (Fountain Park Project) VRDO | 0.180% | 6/7/12 LOC | 40,000 | 40,000 |
| | Los Angeles CA Multifamily Housing Revenue | | | | |
| | (Queen Portfolio Apartments Project) VRDO | 0.170% | 6/7/12 LOC | 6,895 | 6,895 |
| | Los Angeles CA Multifamily Housing Revenue | | | | |
| | (San Regis Project) VRDO | 0.190% | 6/7/12 LOC | 23,600 | 23,600 |
| 1 | Los Angeles CA Unified School District GO | | | | |
| | TOB VRDO | 0.160% | 6/7/12 | 9,040 | 9,040 |
| 1 | Los Angeles CA Unified School District GO | | | | |
| | TOB VRDO | 0.180% | 6/7/12 | 9,995 | 9,995 |
| 1 | Los Angeles CA Unified School District GO | | | | |
| | TOB VRDO | 0.180% | 6/7/12 | 6,660 | 6,660 |
| 1 | Los Angeles CA Wastewater System Revenue | | | | |
| | TOB VRDO | 0.180% | 6/7/12 | 25,000 | 25,000 |
| 1 | Los Angeles CA Wastewater System Revenue | | | | |
| | TOB VRDO | 0.180% | 6/7/12 | 7,500 | 7,500 |
| | Los Angeles CA Wastewater System Revenue | | | | |
| | VRDO | 0.170% | 6/7/12 LOC | 1,390 | 1,390 |
| 1,2 | Los Angeles County CA Metropolitan | | | | |
| | Transportation Authority Sales Tax Revenue | | | | |
| | TOB PUT | 0.220% | 8/1/12 LOC | 30,000 | 30,000 |
| 1 | Los Angeles County CA Sanitation Districts | | | | |
| | Financing Authority Capital Projects Revenue | | | | |
| | TOB VRDO | 0.170% | 6/7/12 LOC | 10,465 | 10,465 |
| 1 | Los Angeles County CA Unified School District | | | | |
| | GO TOB VRDO | 0.180% | 6/7/12 | 5,000 | 5,000 |
| | Manteca CA Redevelopment Agency Tax | | | | |
| | Allocation Revenue VRDO | 0.210% | 6/1/12 LOC | 22,745 | 22,745 |
| 2 | Metropolitan Water District of Southern | | | | |
| | California Revenue PUT | 0.180% | 7/9/12 | 15,000 | 15,000 |
| 1 | Metropolitan Water District of Southern | | | | |
| | California Revenue TOB VRDO | 0.180% | 6/7/12 | 6,435 | 6,435 |
| 1 | Metropolitan Water District of Southern | | | | |
| | California Revenue TOB VRDO | 0.180% | 6/7/12 | 5,000 | 5,000 |
| | Metropolitan Water District of Southern | | | | |
| | California Revenue VRDO | 0.160% | 6/7/12 | 11,700 | 11,700 |
| | Metropolitan Water District of Southern | | | | |
| | California Revenue VRDO | 0.170% | 6/7/12 | 26,900 | 26,900 |
| | Mission Viejo CA Community Development | | | | |
| | Financing Authority Revenue (Mission Viejo | | | | |
| | Mall Improvement) VRDO | 0.160% | 6/7/12 LOC | 23,900 | 23,900 |
| | Newport Beach CA Revenue (Hoag Memorial | | | | |
| | Hospital Presbyterian) VRDO | 0.160% | 6/7/12 LOC | 12,500 | 12,500 |
| 1 | Nuveen California Investment Quality | | | | |
| | Municipal Fund VRDP VRDO | 0.300% | 6/7/12 LOC | 18,000 | 18,000 |
| 1 | Nuveen California Performance Plus | | | | |
| | Municipal Fund VRDP VRDO | 0.300% | 6/7/12 LOC | 15,000 | 15,000 |
20
| | | | |
| California Tax-Exempt Money Market Fund | | | | |
| |
| |
| |
| | | | Face | Market |
| | | Maturity | Amount | Value |
| | Coupon | Date | ($000) | ($000) |
| 1 Nuveen California Quality Income | | | | |
| Municipal Fund VRDP VRDO | 0.300% | 6/7/12 LOC | 26,000 | 26,000 |
| Nuveen Insured California AMT-Free | | | | |
| Municipal Income Fund VRDP VRDO | 0.300% | 6/7/12 LOC | 27,000 | 27,000 |
| 1 Oakland CA Redevelopment Agency Tax | | | | |
| Allocation Revenue (Central District Project) | | | | |
| TOB VRDO | 0.170% | 6/7/12 LOC | 13,710 | 13,710 |
| Oakland-Alameda County CA Coliseum Authority | | | | |
| Lease Revenue (Oakland Coliseum Project) | | | | |
| VRDO | 0.160% | 6/7/12 LOC | 64,100 | 64,100 |
| Orange County CA Apartment Development | | | | |
| Revenue VRDO | 0.140% | 6/7/12 LOC | 41,300 | 41,300 |
| Orange County CA Apartment Development | | | | |
| Revenue VRDO | 0.180% | 6/7/12 LOC | 9,550 | 9,550 |
| 1 Orange County CA Sanitation District COP | | | | |
| TOB VRDO | 0.200% | 6/7/12 | 10,925 | 10,925 |
| Orange County CA Sanitation District COP VRDO | 2.000% | 11/9/12 | 71,605 | 72,163 |
| Orange County CA Teeter Plan CP | 0.190% | 7/10/12 LOC | 20,000 | 20,000 |
| Pittsburg CA Redevelopment Agency Tax | | | | |
| Allocation Revenue (Los Medanos Community | | | | |
| Development Project) VRDO | 0.210% | 6/1/12 LOC | 38,255 | 38,255 |
| Riverside County CA Industrial Development | | | | |
| Authority Empowerment Zone Facility Revenue | | | | |
| (Guy Evans Inc. Project) VRDO | 0.170% | 6/7/12 LOC | 5,135 | 5,135 |
| Riverside County CA Public Facility Project | | | | |
| COP VRDO | 0.170% | 6/7/12 LOC | 9,200 | 9,200 |
| Riverside County CA Transportation | | | | |
| Commission Sales Tax Revenue VRDO | 0.160% | 6/7/12 | 9,275 | 9,275 |
| Riverside County CA Transportation | | | | |
| Commission Sales Tax Revenue VRDO | 0.160% | 6/7/12 | 10,225 | 10,225 |
| Sacramento CA Municipal Utility District | | | | |
| Revenue VRDO | 0.150% | 6/7/12 LOC | 1,200 | 1,200 |
| Sacramento CA Municipal Utility District | | | | |
| Revenue VRDO | 0.150% | 6/7/12 LOC | 16,400 | 16,400 |
| Sacramento County CA Multifamily Housing | | | | |
| Revenue (River Pointe Apartments) VRDO | 0.170% | 6/7/12 LOC | 12,300 | 12,300 |
| Sacramento County CA Multifamily Housing | | | | |
| Revenue (River Pointe Apartments) VRDO | 0.170% | 6/7/12 LOC | 10,200 | 10,200 |
| Sacramento County CA Sanitation Districts | | | | |
| Financing Authority Revenue VRDO | 0.160% | 6/7/12 LOC | 5,000 | 5,000 |
| 1 San Bernardino CA Community College | | | | |
| District GO TOB VRDO | 0.190% | 6/7/12 | 7,500 | 7,500 |
| 1 San Bernardino CA Community College | | | | |
| District GO TOB VRDO | 0.250% | 6/7/12 | 44,345 | 44,345 |
| San Bernardino County CA TRAN | 2.000% | 6/29/12 | 25,000 | 25,033 |
| San Diego CA Community College District GO | 1.500% | 8/1/12 | 6,050 | 6,062 |
| 1 San Diego CA Community College District GO | | | | |
| TOB VRDO | 0.150% | 6/7/12 | 5,710 | 5,710 |
| 1 San Diego CA Community College District GO | | | | |
| TOB VRDO | 0.180% | 6/7/12 | 5,000 | 5,000 |
| 1 San Diego CA Community College District GO | | | | |
| TOB VRDO | 0.180% | 6/7/12 | 5,000 | 5,000 |
| 1 San Diego CA Community College District GO | | | | |
| TOB VRDO | 0.200% | 6/7/12 | 4,100 | 4,100 |
21
| | | | |
| California Tax-Exempt Money Market Fund | | | | |
| |
| |
| |
| | | | Face | Market |
| | | Maturity | Amount | Value |
| | Coupon | Date | ($000) | ($000) |
| San Diego CA County TRAN | 2.000% | 6/29/12 | 15,000 | 15,020 |
| San Diego CA Housing Authority Multifamily | | | | |
| Housing Revenue (Bay Vista Apartments Project) | | | | |
| VRDO | 0.160% | 6/7/12 LOC | 9,690 | 9,690 |
| San Diego CA Housing Authority Multifamily | | | | |
| Housing Revenue (Canyon Rim Apartments) | | | | |
| VRDO | 0.160% | 6/7/12 LOC | 32,440 | 32,440 |
| 1 San Diego CA Public Facilities Financing | | | | |
| Authority Water Revenue TOB VRDO | 0.180% | 6/7/12 | 10,310 | 10,310 |
| 1 San Diego CA Public Facilities Financing | | | | |
| Authority Water Revenue TOB VRDO | 0.180% | 6/7/12 | 7,495 | 7,495 |
| 1 San Diego CA Unified School District GO | | | | |
| TOB PUT | 0.360% | 8/16/12 | 26,190 | 26,190 |
| San Diego County CA Regional Transportation | | | | |
| Authority Sales Tax Revenue VRDO | 0.150% | 6/7/12 | 8,925 | 8,925 |
| 1 San Diego County CA Water Authority | | | | |
| Revenue COP TOB VRDO | 0.180% | 6/7/12 | 9,500 | 9,500 |
| 1 San Diego County CA Water Authority | | | | |
| Revenue COP TOB VRDO | 0.180% | 6/7/12 | 6,840 | 6,840 |
| 1 San Diego County CA Water Authority | | | | |
| Revenue COP TOB VRDO | 0.180% | 6/7/12 | 4,825 | 4,825 |
| 1 San Diego County CA Water Authority | | | | |
| Revenue COP TOB VRDO | 0.180% | 6/7/12 | 10,100 | 10,100 |
| 1 San Diego County CA Water Authority | | | | |
| Revenue COP TOB VRDO | 0.280% | 6/7/12 | 6,500 | 6,500 |
| 1 San Diego County CA Water Authority | | | | |
| Revenue COP TOB VRDO | 0.280% | 6/7/12 | 6,100 | 6,100 |
| 1 San Diego County CA Water Authority | | | | |
| Revenue COP TOB VRDO | 0.280% | 6/7/12 | 9,800 | 9,800 |
| San Diego County CA Water Authority | | | | |
| Revenue CP | 0.190% | 7/5/12 | 14,000 | 14,000 |
| San Diego County CA Water Authority | | | | |
| Revenue CP | 0.180% | 7/9/12 | 15,900 | 15,900 |
| San Diego County CA Water Authority | | | | |
| Revenue CP | 0.220% | 9/6/12 | 14,000 | 14,000 |
| 1 San Francisco CA Bay Area Rapid Transit | | | | |
| District Sales Tax Revenue TOB VRDO | 0.180% | 6/7/12 | 13,595 | 13,595 |
| 1 San Francisco CA City & County | | | | |
| (Laguna Honda Hospital) GO TOB VRDO | 0.240% | 6/7/12 | 6,700 | 6,700 |
| San Francisco CA City & County Airport | | | | |
| Commission International Airport Revenue | | | | |
| VRDO | 0.170% | 6/7/12 LOC | 8,000 | 8,000 |
| San Francisco CA City & County Finance Corp. | | | | |
| Lease Revenue (Moscone Center Expansion) | | | | |
| VRDO | 0.150% | 6/7/12 LOC | 46,145 | 46,145 |
| San Francisco CA City & County GO | 2.000% | 6/15/12 | 7,250 | 7,255 |
| San Francisco CA City & County International | | | | |
| Airport Revenue VRDO | 0.170% | 6/7/12 LOC | 5,000 | 5,000 |
| 1 San Francisco CA City & County Public Utilities | | | | |
| Commission Water Revenue TOB VRDO | 0.180% | 6/7/12 | 6,900 | 6,900 |
| San Francisco CA City & County Redevelopment | | | | |
| Agency Multifamily Housing Revenue | | | | |
| (Third & Mission Streets) VRDO | 0.170% | 6/7/12 LOC | 40,000 | 40,000 |
22
| | | | |
| California Tax-Exempt Money Market Fund | | | | |
| |
| |
| |
| | | | Face | Market |
| | | Maturity | Amount | Value |
| | Coupon | Date | ($000) | ($000) |
| San Francisco CA City & County Unified | | | | |
| School District TRAN | 2.000% | 6/29/12 | 10,000 | 10,013 |
| San Jose CA Financing Authority Lease | | | | |
| Revenue CP | 0.160% | 6/13/12 LOC | 27,068 | 27,068 |
| 1 San Jose CA Financing Authority Lease | | | | |
| Revenue TOB VRDO | 0.190% | 6/7/12 (13) | 21,360 | 21,360 |
| San Jose CA Multifamily Housing Revenue | | | | |
| (Cinnabar Commons) VRDO | 0.160% | 6/7/12 LOC | 16,400 | 16,400 |
| San Jose CA Multifamily Housing Revenue | | | | |
| (Raintree Apartments) VRDO | 0.190% | 6/7/12 LOC | 10,000 | 10,000 |
| 1 San Jose CA Unified School District Santa | | | | |
| Clara County GO TOB VRDO | 0.180% | 6/7/12 | 7,310 | 7,310 |
| 1 San Marcos CA Public Facilities Authority | | | | |
| Tax Allocation Revenue TOB VRDO | 0.170% | 6/1/12 LOC | 3,100 | 3,100 |
| 1 San Mateo County CA Community College | | | | |
| District GO TOB VRDO | 0.180% | 6/7/12 | 4,315 | 4,315 |
| Santa Barbara County CA TRAN | 2.000% | 6/29/12 | 11,000 | 11,015 |
| Santa Clara County CA El Camino Hospital | | | | |
| District Facilities Authority Revenue | | | | |
| (Valley Medical Center Project) VRDO | 0.170% | 6/7/12 LOC | 12,600 | 12,600 |
| Santa Clara County CA El Camino Hospital | | | | |
| District Facilities Authority Revenue | | | | |
| (Valley Medical Center Project) VRDO | 0.170% | 6/7/12 LOC | 11,850 | 11,850 |
| Santa Clara Valley CA Transportation Authority | | | | |
| Sales Tax Revenue VRDO | 0.130% | 6/7/12 | 6,285 | 6,285 |
| 1 Sequoia CA Unified School District GO TOB | | | | |
| VRDO | 0.180% | 6/7/12 | 5,860 | 5,860 |
| Sequoia CA Union High School District TRAN | 3.000% | 7/5/12 | 13,000 | 13,033 |
| 1 Sonoma County CA Junior College District GO | | | | |
| TOB VRDO | 0.170% | 6/7/12 | 30,675 | 30,675 |
| South Placer CA Wastewater Authority Revenue | | | | |
| VRDO | 0.130% | 6/7/12 LOC | 8,000 | 8,000 |
| Southern California Public Power Authority | | | | |
| Revenue (Mead-Adelanto Project) VRDO | 0.180% | 6/1/12 | 30,100 | 30,100 |
| 1 Sunnyvale CA Wastewater Revenue TOB VRDO | 0.200% | 6/7/12 | 4,220 | 4,220 |
| Tobacco Securitization Authority Revenue | | | | |
| (Southern California Tobacco Settlement) | 5.500% | 6/1/12 (Prere.) | 4,900 | 4,900 |
| 1 Torrance CA Hospital Revenue (Torrance | | | | |
| Memorial Medical Center) TOB VRDO | 0.200% | 6/7/12 LOC | 5,200 | 5,200 |
| Torrance CA Hospital Revenue (Torrance | | | | |
| Memorial Medical Center) VRDO | 0.160% | 6/7/12 LOC | 9,100 | 9,100 |
| University of California Regents CP | 0.130% | 6/6/12 | 10,000 | 10,000 |
| University of California Regents CP | 0.200% | 6/7/12 | 24,000 | 24,000 |
| University of California Regents Medical | | | | |
| Center Revenue VRDO | 0.150% | 6/1/12 | 25,305 | 25,305 |
| University of California Revenue | 5.000% | 5/15/13 (14) | 5,460 | 5,710 |
| 1 University of California Revenue TOB VRDO | 0.200% | 6/1/12 | 5,200 | 5,200 |
| 1 University of California Revenue TOB VRDO | 0.150% | 6/7/12 | 10,875 | 10,875 |
| 1 University of California Revenue TOB VRDO | 0.180% | 6/7/12 | 1,890 | 1,890 |
| 1 University of California Revenue TOB VRDO | 0.180% | 6/7/12 | 3,470 | 3,470 |
| 1 University of California Revenue TOB VRDO | 0.180% | 6/7/12 | 6,000 | 6,000 |
| 1 University of California Revenue TOB VRDO | 0.180% | 6/7/12 | 3,495 | 3,495 |
| 1 University of California Revenue TOB VRDO | 0.180% | 6/7/12 | 15,195 | 15,195 |
| 1 University of California Revenue TOB VRDO | 0.240% | 6/7/12 | 7,300 | 7,300 |
23
| | | | | |
| California Tax-Exempt Money Market Fund | | | | |
| |
| |
| |
| | | | | Face | Market |
| | | | Maturity | Amount | Value |
| | | Coupon | Date | ($000) | ($000) |
| 1 | University of California Revenue TOB VRDO | 0.240% | 6/7/12 | 6,655 | 6,655 |
| 1 | University of California Revenue TOB VRDO | 0.240% | 6/7/12 | 12,010 | 12,010 |
| 1 | University of California Revenue TOB VRDO | 0.250% | 6/7/12 | 5,000 | 5,000 |
| | Ventura CA Public Financing Authority | | | | |
| | Lease Revenue CP | 0.210% | 8/10/12 LOC | 5,000 | 5,000 |
| | Ventura County CA Community College | | | | |
| | District GO | 5.000% | 8/1/12 (Prere.) | 8,835 | 8,994 |
| | Ventura County CA TRAN | 2.250% | 6/29/12 | 35,315 | 35,368 |
| | Westlands CA Water District COP VRDO | 0.150% | 6/7/12 LOC | 25,700 | 25,700 |
| | Whittier CA Health Facility Revenue | | | | |
| | (Presbyterian Intercommunity Hospital) VRDO | 0.140% | 6/7/12 LOC | 4,900 | 4,900 |
| | Whittier CA Health Facility Revenue | | | | |
| | (Presbyterian Intercommunity Hospital) VRDO | 0.150% | 6/7/12 LOC | 9,200 | 9,200 |
| | | | | | 4,090,216 |
| Total Tax-Exempt Municipal Bonds (Cost $4,090,216) | | | | 4,090,216 |
| Other Assets and Liabilities (-3.1%) | | | | |
| Other Assets | | | | 30,394 |
| Liabilities | | | | (155,246) |
| | | | | | (124,852) |
| Net Assets (100%) | | | | |
| Applicable to 3,964,820,464 outstanding $.001 par value shares of | | | |
| beneficial interest (unlimited authorization) | | | | 3,965,364 |
| Net Asset Value Per Share | | | | $1.00 |
| |
| |
| At May 31, 2012, net assets consisted of: | | | | |
| | | | | | Amount |
| | | | | | ($000) |
| Paid-in Capital | | | | 3,965,360 |
| Undistributed Net Investment Income | | | | — |
| Accumulated Net Realized Gains | | | | 4 |
| Net Assets | | | | 3,965,364 |
See Note A in Notes to Financial Statements.
1 Security exempt from registration under Rule 144A of the Securities Act of 1933. Such securities may be sold in transactions exempt from registration, normally to qualified institutional buyers. At May 31, 2012, the aggregate value of these securities was $1,116,680,000, representing 28.2% of net assets.
2 Adjustable-rate security.
A key to abbreviations and other references follows the Statement of Net Assets.
See accompanying Notes, which are an integral part of the Financial Statements.
24
California Tax-Exempt Money Market Fund
Key to Abbreviations
ARS—Auction Rate Security.
BAN—Bond Anticipation Note.
COP—Certificate of Participation.
CP—Commercial Paper.
FR—Floating Rate.
GAN—Grant Anticipation Note.
GO—General Obligation Bond.
PUT—Put Option Obligation.
RAN—Revenue Anticipation Note.
TAN—Tax Anticipation Note.
TOB—Tender Option Bond.
TRAN—Tax Revenue Anticipation Note.
VRDO—Variable Rate Demand Obligation.
VRDP—Variable Rate Demand Preferred.
(ETM)—Escrowed to Maturity.
(Prere.)—Prerefunded.
Scheduled principal and interest payments are guaranteed by:
(1) MBIA (Municipal Bond Investors Assurance).
(2) AMBAC (Ambac Assurance Corporation).
(3) FGIC (Financial Guaranty Insurance Company).
(4) AGM (Assured Guaranty Municipal Corporation).
(5) BIGI (Bond Investors Guaranty Insurance).
(6) Connie Lee Inc.
(7) FHA (Federal Housing Authority).
(8) CapMAC (Capital Markets Assurance Corporation).
(9) American Capital Access Financial Guaranty Corporation.
(10) XL Capital Assurance Inc.
(11) CIFG (CDC IXIS Financial Guaranty).
(12) Assured Guaranty Corporation.
(13) Berkshire Hathaway Assurance Corporation.
(14) National Public Finance Guarantee Corporation.
The insurance does not guarantee the market value of the municipal bonds.
LOC—Scheduled principal and interest payments are guaranteed by bank letter of credit.
25
California Tax-Exempt Money Market Fund
Statement of Operations
| |
| | Six Months Ended |
| | May 31, 2012 |
| | ($000) |
| Investment Income | |
| Income | |
| Interest | 3,642 |
| Total Income | 3,642 |
| Expenses | |
| The Vanguard Group—Note B | |
| Investment Advisory Services | 352 |
| Management and Administrative | 2,237 |
| Marketing and Distribution | 647 |
| Custodian Fees | 24 |
| Shareholders’ Reports | 11 |
| Trustees’ Fees and Expenses | 2 |
| Total Expenses | 3,273 |
| Expense Reduction—Note B | (287) |
| Net Expenses | 2,986 |
| Net Investment Income | 656 |
| Realized Net Gain (Loss) on Investment Securities Sold | (2) |
| Net Increase (Decrease) in Net Assets Resulting from Operations | 654 |
See accompanying Notes, which are an integral part of the Financial Statements.
26
California Tax-Exempt Money Market Fund
Statement of Changes in Net Assets
| | |
| | Six Months Ended | Year Ended |
| | May 31, | November 30, |
| | 2012 | 2011 |
| | ($000) | ($000) |
| Increase (Decrease) in Net Assets | | |
| Operations | | |
| Net Investment Income | 656 | 2,969 |
| Realized Net Gain (Loss) | (2) | 26 |
| Net Increase (Decrease) in Net Assets Resulting from Operations | 654 | 2,995 |
| Distributions | | |
| Net Investment Income | (656) | (2,969) |
| Realized Capital Gain | — | — |
| Total Distributions | (656) | (2,969) |
| Capital Share Transactions (at $1.00) | | |
| Issued | 1,330,596 | 2,863,192 |
| Issued in Lieu of Cash Distributions | 625 | 2,862 |
| Redeemed | (1,497,099) | (3,344,624) |
| Net Increase (Decrease) from Capital Share Transactions | (165,878) | (478,570) |
| Total Increase (Decrease) | (165,880) | (478,544) |
| Net Assets | | |
| Beginning of Period | 4,131,244 | 4,609,788 |
| End of Period | 3,965,364 | 4,131,244 |
See accompanying Notes, which are an integral part of the Financial Statements.
27
California Tax-Exempt Money Market Fund
Financial Highlights
| | | | | | |
| Six Months | | | | | |
| | Ended | | | | | |
| For a Share Outstanding | May 31, | | | Year Ended November 30, |
| Throughout Each Period | 2012 | 2011 | 2010 | 2009 | 2008 | 2007 |
| Net Asset Value, Beginning of Period | $1.00 | $1.00 | $1.00 | $1.00 | $1.00 | $1.00 |
| Investment Operations | | | | | | |
| Net Investment Income | .0002 | .001 | .001 | .004 | .022 | .035 |
| Net Realized and Unrealized Gain (Loss) | | | | | | |
| on Investments | — | — | — | — | — | — |
| Total from Investment Operations | .0002 | .001 | .001 | .004 | .022 | .035 |
| Distributions | | | | | | |
| Dividends from Net Investment Income | (.0002) | (.001) | (.001) | (.004) | (.022) | (.035) |
| Distributions from Realized Capital Gains | — | — | — | — | — | — |
| Total Distributions | (.0002) | (.001) | (.001) | (.004) | (.022) | (.035) |
| Net Asset Value, End of Period | $1.00 | $1.00 | $1.00 | $1.00 | $1.00 | $1.00 |
| |
| Total Return1 | 0.02% | 0.07% | 0.11% | 0.37% | 2.21% | 3.55% |
| |
| Ratios/Supplemental Data | | | | | | |
| Net Assets, End of Period (Millions) | $3,965 | $4,131 | $4,610 | $5,355 | $7,506 | $8,623 |
| Ratio of Expenses to | | | | | | |
| Average Net Assets | 0.15%2 | 0.16%2 | 0.17% | 0.17%3 | 0.11%3 | 0.10% |
| Ratio of Net Investment Income to | | | | | | |
| Average Net Assets | 0.03% | 0.07% | 0.11% | 0.39% | 2.19% | 3.49% |
The expense ratio and net income ratio for the current period have been annualized.
1 Total returns do not include account service fees that may have applied in the periods shown. Fund prospectuses provide information about any applicable account service fees.
2 The ratio of total expenses to average net assets before an expense reduction was 0.16% for 2012 and 0.17% for 2011. See Note B in Notes to Financial Statements.
3 Includes fees to participate in the Treasury Temporary Guarantee Program for Money Market Funds of 0.04% for 2009 and 0.01% for 2008.
See accompanying Notes, which are an integral part of the Financial Statements.
28
California Tax-Exempt Money Market Fund
Notes to Financial Statements
Vanguard California Tax-Exempt Money Market Fund is registered under the Investment Company Act of 1940 as an open-end investment company, or mutual fund. The fund invests in debt instruments of municipal issuers whose ability to meet their obligations may be affected by economic and political developments in the state.
A. The following significant accounting policies conform to generally accepted accounting principles for U.S. mutual funds. The fund consistently follows such policies in preparing its financial statements.
1. Security Valuation: Securities are valued at amortized cost, which approximates market value.
2. Federal Income Taxes: The fund intends to continue to qualify as a regulated investment company and distribute all of its income. Management has analyzed the fund’s tax positions taken for all open federal income tax years (November 30, 2008–2011), and for the period ended May 31, 2012, and has concluded that no provision for federal income tax is required in the fund’s financial statements.
3. Distributions: Distributions from net investment income are declared daily and paid on the first business day of the following month.
4. Other: Interest income is accrued daily. Premiums and discounts on debt securities purchased are amortized and accreted, respectively, to interest income over the lives of the respective securities. Security transactions are accounted for on the date securities are bought or sold. Costs used to determine realized gains (losses) on the sale of investment securities are those of the specific securities sold.
B. The Vanguard Group furnishes at cost investment advisory, corporate management, administrative, marketing, and distribution services. The costs of such services are allocated to the fund under methods approved by the board of trustees. The fund has committed to provide up to 0.40% of its net assets in capital contributions to Vanguard. At May 31, 2012, the fund had contributed capital of $580,000 to Vanguard (included in Other Assets), representing 0.01% of the fund’s net assets and 0.23% of Vanguard’s capitalization. The fund’s trustees and officers are also directors and officers of Vanguard. Vanguard and the board of trustees have agreed to temporarily limit certain net operating expenses in excess of the fund’s daily yield so as to maintain a zero or positive yield for the fund. Vanguard and the board of trustees may terminate the temporary expense limitation at any time.
For the period ended May 31, 2012, Vanguard’s management and administrative expenses were reduced by $287,000 (an effective annual rate of 0.01% of the fund’s average net assets).
C. Various inputs may be used to determine the value of the fund’s investments. These inputs are summarized in three broad levels for financial statement purposes. The inputs or methodologies used to value securities are not necessarily an indication of the risk associated with investing in those securities.
Level 1—Quoted prices in active markets for identical securities.
Level 2—Other significant observable inputs (including quoted prices for similar securities, interest rates, prepayment speeds, credit risk, etc.).
Level 3—Significant unobservable inputs (including the fund’s own assumptions used to determine the fair value of investments).
29
California Tax-Exempt Money Market Fund
At May 31, 2012, 100% of the market value of the fund’s investments was determined using amortized cost, in accordance with rules under the Investment Company Act of 1940. Amortized cost approximates the current fair value of a security, but since the value is not obtained from a quoted price in an active market, securities valued at amortized cost are considered to be valued using Level 2 inputs.
D. In preparing the financial statements as of May 31, 2012, management considered the impact of subsequent events for potential recognition or disclosure in these financial statements.
30
California Intermediate-Term Tax-Exempt Fund
Fund Profile
As of May 31, 2012
| | | |
| Share-Class Characteristics | | |
| | Investor | Admiral |
| | Shares | Shares |
| Ticker Symbol | VCAIX | VCADX |
| Expense Ratio1 | 0.20% | 0.12% |
| 30-Day SEC Yield | 1.79% | 1.87% |
| |
| Financial Attributes | | | |
| |
| | | Barclays | |
| | | Muni | Barclays |
| | | CA IT | Municipal |
| | | Bond | Bond |
| | Fund | Index | Index |
| Number of Bonds | 871 | 1,506 | 46,824 |
| Yield to Maturity | | | |
| (before expenses) | 2.0% | 2.6% | 2.4% |
| Average Coupon | 4.2% | 4.8% | 4.9% |
| Average Duration | 5.1 years | 4.9 years | 7.3 years |
| Average Effective | | | |
| Maturity | 5.4 years | 5.5 years | 5.7 years |
| Short-Term | | | |
| Reserves | 9.2% | — | — |
| | |
| Volatility Measures | | |
| | | Barclays |
| | Barclays Muni | Municipal |
| | CA IT | Bond |
| | Bond Index | Index |
| R-Squared | 0.88 | 0.98 |
| Beta | 0.90 | 1.02 |
| These measures show the degree and timing of the fund’s fluctuations compared with the indexes over 36 months. |
|
| |
| Distribution by Maturity (% of portfolio) | |
| Under 1 Year | | 14.8% |
| 1 - 3 Years | | 15.1 |
| 3 - 5 Years | | 16.5 |
| 5 - 10 Years | | 45.0 |
| 10 - 20 Years | | 8.1 |
| 20 - 30 Years | | 0.5 |
| |
| Distribution by Credit Quality (% of portfolio) |
| AAA | | 9.5% |
| AA | | 52.0 |
| A | | 32.5 |
| BBB | | 4.4 |
| BB | | 0.2 |
| B | | 0.8 |
| Not Rated | | 0.6 |
| For information about these ratings, see the Glossary entry for Credit Quality. |
| | |
Investment Focus
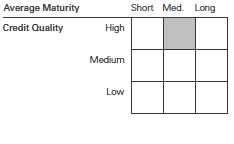
1 The expense ratios shown are from the prospectus dated March 28, 2012, and represent estimated costs for the current fiscal year. For the six months ended May 31, 2012, the annualized expense ratios were 0.20% for Investor Shares and 0.12% for Admiral Shares.
31
California Intermediate-Term Tax-Exempt Fund
Performance Summary
All of the returns in this report represent past performance, which is not a guarantee of future results that may be achieved by the fund. (Current performance may be lower or higher than the performance data cited. For performance data current to the most recent month-end, visit our website at vanguard.com/performance.) Note, too, that both investment returns and principal value can fluctuate widely, so an investor’s shares, when sold, could be worth more or less than their original cost. The returns shown do not reflect taxes that a shareholder would pay on fund distributions or on the sale of fund shares.
| | | | |
| Fiscal-Year Total Returns (%): November 30, 2001, Through May 31, 2012 | |
| | | | | Barclays Muni |
| | | | | CA IT |
| | | | Investor Shares | Bond Index |
| Fiscal Year | Income Returns | Capital Returns | Total Returns | Total Returns |
| 2002 | 4.35% | 1.53% | 5.88% | 6.30% |
| 2003 | 4.12 | 1.66 | 5.78 | 5.62 |
| 2004 | 3.93 | -1.52 | 2.41 | 4.05 |
| 2005 | 3.90 | -1.79 | 2.11 | 2.37 |
| 2006 | 4.12 | 1.28 | 5.40 | 5.07 |
| 2007 | 3.99 | -1.53 | 2.46 | 3.84 |
| 2008 | 3.79 | -6.50 | -2.71 | 1.84 |
| 2009 | 4.19 | 6.37 | 10.56 | 9.03 |
| 2010 | 3.79 | 0.64 | 4.43 | 6.89 |
| 2011 | 3.88 | 2.29 | 6.17 | 6.79 |
| 2012 | 1.76 | 4.03 | 5.79 | 5.13 |
| Note: For 2012, performance data reflect the six months ended May 31, 2012. |
Average Annual Total Returns: Periods Ended March 31, 2012
This table presents returns through the latest calendar quarter—rather than through the end of the fiscal period.
Securities and Exchange Commission rules require that we provide this information.
| | | | | | |
| | | | | | | Ten Years |
| | Inception Date | One Year | Five Years | Income | Capital | Total |
| Investor Shares | 3/4/1994 | 11.30% | 4.80% | 3.99% | 0.66% | 4.65% |
| Admiral Shares | 11/12/2001 | 11.39 | 4.88 | 4.06 | 0.66 | 4.72 |
See Financial Highlights for dividend and capital gains information.
32
California Intermediate-Term Tax-Exempt Fund
Financial Statements (unaudited)
Statement of Net Assets
As of May 31, 2012
The fund reports a complete list of its holdings in regulatory filings four times in each fiscal year, at the quarter-ends. For the second and fourth fiscal quarters, the lists appear in the fund’s semiannual and annual reports to shareholders. For the first and third fiscal quarters, the fund files the lists with the Securities and Exchange Commission on Form N-Q. Shareholders can look up the fund’s Forms N-Q on the SEC’s website at sec.gov. Forms N-Q may also be reviewed and copied at the SEC’s Public Reference Room (see the back cover of this report for further information).
| | | | |
| | | | Face | Market |
| | | Maturity | Amount | Value |
| | Coupon | Date | ($000) | ($000) |
| Tax-Exempt Municipal Bonds (100.3%) | | | | |
| California (100.1%) | | | | |
| ABAG Finance Authority for Nonprofit Corps. | | | | |
| California Revenue (899 Charleston Project) | | | | |
| VRDO | 0.270% | 6/1/12 LOC | 8,770 | 8,770 |
| ABAG Finance Authority for Nonprofit Corps. | | | | |
| California Revenue (Episcopal Senior | | | | |
| Communities) | 6.000% | 7/1/31 | 2,750 | 2,993 |
| ABAG Finance Authority for Nonprofit Corps. | | | | |
| California Revenue (San Francisco Friends) | | | | |
| VRDO | 0.250% | 6/7/12 LOC | 2,800 | 2,800 |
| ABAG Finance Authority for Nonprofit Corps. | | | | |
| California Revenue (Sharp Healthcare) | 5.000% | 8/1/24 | 960 | 1,098 |
| ABAG Finance Authority for Nonprofit Corps. | | | | |
| California Revenue (Sharp Healthcare) | 5.000% | 8/1/26 | 1,000 | 1,121 |
| ABAG Finance Authority for Nonprofit Corps. | | | | |
| California Revenue (Sharp Healthcare) | 5.000% | 8/1/28 | 400 | 443 |
| ABAG Finance Authority for Nonprofit Corps. | | | | |
| California Revenue (Sharp Healthcare) | 6.000% | 8/1/30 | 1,120 | 1,359 |
| Alameda CA Corridor Transportation | | | | |
| Authority Revenue | 0.000% | 10/1/14 (2) | 325 | 306 |
| Alameda CA Corridor Transportation | | | | |
| Authority Revenue | 5.125% | 10/1/14 (14) | 10,150 | 10,188 |
| Alameda CA Corridor Transportation | | | | |
| Authority Revenue | 0.000% | 10/1/16 (2) | 4,305 | 3,798 |
| Alameda CA Corridor Transportation | | | | |
| Authority Revenue | 0.000% | 10/1/20 (2) | 12,250 | 8,549 |
| Alameda CA Corridor Transportation | | | | |
| Authority Revenue | 0.000% | 10/1/29 (2) | 30,000 | 11,230 |
| Alameda CA Corridor Transportation | | | | |
| Authority Revenue | 0.000% | 10/1/30 (2) | 8,000 | 2,810 |
| Alameda County CA (Medical Center Project) COP | 5.250% | 6/1/12 (ETM) | 1,595 | 1,595 |
| Alameda County CA (Medical Center Project) COP | 5.250% | 6/1/13 (ETM) | 1,785 | 1,865 |
| Alameda County CA (Medical Center Project) COP | 5.375% | 6/1/14 (ETM) | 1,880 | 1,985 |
| Alameda County CA (Medical Center Project) COP | 5.375% | 6/1/15 (ETM) | 3,960 | 4,181 |
| Alameda County CA COP | 5.375% | 12/1/12 (14) | 11,000 | 11,117 |
| Alameda County CA COP | 5.375% | 12/1/13 (14) | 13,930 | 14,079 |
| Alameda County CA COP | 5.375% | 12/1/14 (14) | 4,790 | 4,841 |
| Alameda County CA COP | 5.375% | 12/1/15 (14) | 1,500 | 1,516 |
| Alvord CA Unified School District GO | 5.900% | 2/1/24 (4) | 3,865 | 4,749 |
33
| | | | |
| California Intermediate-Term Tax-Exempt Fund | | | | |
| |
| |
| |
| | | | Face | Market |
| | | Maturity | Amount | Value |
| | Coupon | Date | ($000) | ($000) |
| Anaheim CA Public Financing Authority | | | | |
| Revenue (Electric System) | 5.000% | 10/1/21 (14) | 4,425 | 5,063 |
| Anaheim CA Public Financing Authority | | | | |
| Revenue (Electric System) | 5.000% | 10/1/22 (14) | 4,660 | 5,286 |
| Anaheim CA Public Financing Authority | | | | |
| Revenue (Electric System) | 5.000% | 10/1/24 (14) | 5,175 | 5,762 |
| Anaheim CA Public Financing Authority | | | | |
| Revenue (Electric System) | 5.000% | 10/1/25 (14) | 5,450 | 6,026 |
| Anaheim CA Public Financing Authority | | | | |
| Revenue (Electric System) | 5.250% | 10/1/30 | 5,585 | 6,506 |
| Anaheim CA Union High School District GO | 5.375% | 8/1/12 (Prere.) | 1,250 | 1,261 |
| Antioch CA Public Financing Authority | | | | |
| Reassessment Revenue | 5.000% | 9/2/13 (2) | 4,445 | 4,454 |
| Bakersfield CA Wastewater Revenue | 5.000% | 9/15/24 (4) | 7,600 | 8,496 |
| Bakersfield CA Wastewater Revenue VRDO | 0.170% | 6/7/12 | 5,600 | 5,600 |
| Bay Area CA Infrastructure Financing | | | | |
| Authority Revenue | 5.000% | 8/1/17 (14) | 50,000 | 50,310 |
| Bay Area CA Infrastructure Financing | | | | |
| Authority Revenue | 5.000% | 8/1/17 (10) | 5,000 | 5,214 |
| Bay Area Toll Authority California Toll Bridge | | | | |
| Revenue (San Francisco Bay Area) | 5.000% | 4/1/18 | 5,665 | 6,729 |
| Bay Area Toll Authority California Toll Bridge | | | | |
| Revenue (San Francisco Bay Area) | 5.000% | 4/1/23 | 11,625 | 13,241 |
| Bay Area Toll Authority California Toll Bridge | | | | |
| Revenue (San Francisco Bay Area) | 5.000% | 4/1/25 | 3,000 | 3,402 |
| Bay Area Toll Authority California Toll Bridge | | | | |
| Revenue (San Francisco Bay Area) | 5.000% | 4/1/26 | 10,000 | 11,327 |
| Bay Area Toll Authority California Toll Bridge | | | | |
| Revenue (San Francisco Bay Area) | 5.250% | 4/1/29 | 11,280 | 13,300 |
| Bay Area Toll Authority California Toll Bridge | | | | |
| Revenue (San Francisco Bay Area) | 5.000% | 4/1/31 | 3,000 | 3,408 |
| Bay Area Toll Authority California Toll Bridge | | | | |
| Revenue (San Francisco Bay Area) VRDO | 0.150% | 6/7/12 LOC | 7,100 | 7,100 |
| Burbank CA Public Financing Authority Revenue | | | | |
| (Golden State Redevelopment Project) | 5.250% | 12/1/12 (2) | 3,540 | 3,599 |
| Burbank CA Public Financing Authority Revenue | | | | |
| (Golden State Redevelopment Project) | 5.250% | 12/1/13 (2) | 4,615 | 4,819 |
| Cabrillo CA Community College District Revenue | 0.000% | 8/1/13 (14) | 2,590 | 2,576 |
| Cabrillo CA Community College District Revenue | 0.000% | 8/1/14 (14) | 2,655 | 2,602 |
| 1 Cabrillo CA Community College District Revenue | | | | |
| TOB VRDO | 0.200% | 6/7/12 | 5,305 | 5,305 |
| California County CA Tobacco Securitization | | | | |
| Agency Revenue | 5.250% | 6/1/21 | 13,390 | 12,481 |
| California Department of Water Resources | | | | |
| Power Supply Revenue | 5.000% | 5/1/13 | 1,185 | 1,237 |
| California Department of Water Resources | | | | |
| Power Supply Revenue | 5.000% | 5/1/15 | 15,000 | 16,955 |
| California Department of Water Resources | | | | |
| Power Supply Revenue | 5.000% | 5/1/16 | 5,000 | 5,835 |
| California Department of Water Resources | | | | |
| Power Supply Revenue | 5.000% | 5/1/16 | 17,000 | 19,839 |
| California Department of Water Resources | | | | |
| Power Supply Revenue | 5.000% | 5/1/17 | 25,000 | 29,865 |
| California Department of Water Resources | | | | |
| Power Supply Revenue | 5.000% | 5/1/17 | 14,600 | 17,441 |
34
| | | | |
| California Intermediate-Term Tax-Exempt Fund | | | | |
| |
| |
| |
| | | | Face | Market |
| | | Maturity | Amount | Value |
| | Coupon | Date | ($000) | ($000) |
| California Department of Water Resources | | | | |
| Power Supply Revenue | 5.000% | 5/1/18 | 5,475 | 6,668 |
| California Department of Water Resources | | | | |
| Power Supply Revenue | 5.000% | 5/1/18 | 2,525 | 3,075 |
| California Department of Water Resources | | | | |
| Power Supply Revenue | 5.000% | 5/1/18 | 17,950 | 21,862 |
| California Department of Water Resources | | | | |
| Power Supply Revenue | 5.000% | 5/1/19 | 1,215 | 1,508 |
| California Department of Water Resources | | | | |
| Power Supply Revenue | 5.000% | 5/1/19 | 19,590 | 24,307 |
| California Department of Water Resources | | | | |
| Power Supply Revenue | 5.000% | 5/1/20 | 18,000 | 22,524 |
| California Department of Water Resources | | | | |
| Power Supply Revenue | 5.000% | 5/1/20 | 3,660 | 4,580 |
| California Department of Water Resources | | | | |
| Power Supply Revenue | 5.000% | 5/1/20 | 22,890 | 28,643 |
| California Department of Water Resources | | | | |
| Power Supply Revenue | 5.000% | 5/1/21 | 20,000 | 23,499 |
| California Department of Water Resources | | | | |
| Power Supply Revenue | 5.000% | 5/1/21 | 50,000 | 58,748 |
| California Department of Water Resources | | | | |
| Power Supply Revenue | 5.000% | 5/1/21 | 6,500 | 8,168 |
| California Department of Water Resources | | | | |
| Power Supply Revenue | 5.000% | 5/1/21 | 5,000 | 6,149 |
| California Department of Water Resources | | | | |
| Power Supply Revenue | 5.000% | 5/1/22 | 14,675 | 17,144 |
| California Department of Water Resources | | | | |
| Power Supply Revenue | 5.000% | 5/1/22 | 10,825 | 13,216 |
| California Department of Water Resources Water | | | | |
| System Revenue (Central Valley Project) | 5.000% | 12/1/12 (ETM) | 90 | 92 |
| 2 California Department of Water Resources Water | | | | |
| System Revenue (Central Valley Project) | 5.000% | 12/1/13 | 7,000 | 7,391 |
| California Department of Water Resources Water | | | | |
| System Revenue (Central Valley Project) | 5.000% | 12/1/14 (Prere.) | 180 | 201 |
| 2 California Department of Water Resources Water | | | | |
| System Revenue (Central Valley Project) | 5.000% | 12/1/20 | 1,250 | 1,562 |
| 2 California Department of Water Resources Water | | | | |
| System Revenue (Central Valley Project) | 5.000% | 12/1/21 | 5,645 | 7,118 |
| 2 California Department of Water Resources Water | | | | |
| System Revenue (Central Valley Project) | 5.000% | 12/1/22 | 6,000 | 7,616 |
| California Department of Water Resources Water | | | | |
| System Revenue (Central Valley Project) | 5.000% | 12/1/24 | 5,000 | 5,925 |
| California Department of Water Resources Water | | | | |
| System Revenue (Central Valley Project) | 5.000% | 12/1/26 | 8,565 | 10,230 |
| California Department of Water Resources Water | | | | |
| System Revenue (Central Valley Project) | 5.000% | 12/1/26 (14) | 3,355 | 3,670 |
| California Department of Water Resources Water | | | | |
| System Revenue (Central Valley Project) | 5.000% | 12/1/27 | 8,800 | 10,396 |
| California Department of Water Resources Water | | | | |
| System Revenue (Central Valley Project) | 5.250% | 12/1/27 | 3,900 | 4,757 |
| California Department of Water Resources Water | | | | |
| System Revenue (Central Valley Project) | 5.000% | 12/1/28 | 3,350 | 4,051 |
| California Department of Water Resources Water | | | | |
| System Revenue (Central Valley Project) | 5.250% | 12/1/28 | 4,505 | 5,475 |
| California Department of Water Resources Water | | | | |
| System Revenue (Central Valley Project) | 5.000% | 12/1/29 | 3,530 | 4,249 |
35
| | | | |
| California Intermediate-Term Tax-Exempt Fund | | | | |
| |
| |
| |
| | | | Face | Market |
| | | Maturity | Amount | Value |
| | Coupon | Date | ($000) | ($000) |
| California Department of Water Resources Water | | | | |
| System Revenue (Central Valley Project) | 5.250% | 12/1/29 | 4,640 | 5,616 |
| California Department of Water Resources Water | | | | |
| System Revenue (Central Valley Project) | 5.000% | 12/1/30 | 2,720 | 3,261 |
| California Department of Water Resources Water | | | | |
| System Revenue (Central Valley Project) | 5.250% | 12/1/30 | 1,850 | 2,231 |
| California Department of Water Resources Water | | | | |
| System Revenue (Central Valley Project) | 5.000% | 12/1/31 | 3,910 | 4,666 |
| California Economic Recovery Bonds GO | 5.250% | 7/1/13 | 20,000 | 21,047 |
| California Economic Recovery Bonds GO | 5.250% | 7/1/14 (ETM) | 3,385 | 3,734 |
| California Economic Recovery Bonds GO | 5.250% | 7/1/14 | 11,615 | 12,742 |
| California Economic Recovery Bonds GO | 5.000% | 7/1/18 | 29,770 | 36,153 |
| California Economic Recovery Bonds GO | 5.000% | 7/1/19 | 32,330 | 39,821 |
| California Economic Recovery Bonds GO | 5.000% | 7/1/20 | 43,810 | 53,029 |
| California Economic Recovery Bonds GO | 5.250% | 7/1/21 | 45,385 | 55,114 |
| California Economic Recovery Bonds GO | 5.000% | 7/1/22 | 16,280 | 18,631 |
| California Educational Facilities Authority | | | | |
| Revenue (Chapman University) VRDO | 0.220% | 6/1/12 LOC | 8,410 | 8,410 |
| California Educational Facilities Authority | | | | |
| Revenue (College of Arts & Crafts) | 6.875% | 6/1/14 | 360 | 384 |
| California Educational Facilities Authority | | | | |
| Revenue (College of Arts & Crafts) | 6.875% | 6/1/15 | 380 | 415 |
| California Educational Facilities Authority | | | | |
| Revenue (College of Arts & Crafts) | 6.875% | 6/1/16 | 400 | 446 |
| California Educational Facilities Authority | | | | |
| Revenue (Stanford University) | 5.000% | 3/15/26 | 10,000 | 13,111 |
| California GO | 5.000% | 3/1/13 | 20,640 | 21,374 |
| California GO | 5.000% | 10/1/14 | 2,000 | 2,199 |
| California GO | 5.000% | 11/1/14 | 1,390 | 1,532 |
| California GO | 5.000% | 3/1/15 | 1,000 | 1,108 |
| California GO | 5.000% | 4/1/15 | 15,400 | 17,103 |
| California GO | 5.000% | 12/1/15 | 1,470 | 1,582 |
| California GO | 5.000% | 4/1/17 | 11,000 | 12,863 |
| California GO | 5.250% | 2/1/18 (14) | 8,000 | 9,567 |
| California GO | 6.000% | 2/1/18 (2) | 6,240 | 7,730 |
| California GO | 5.000% | 3/1/18 | 1,850 | 2,191 |
| California GO | 5.500% | 4/1/18 | 20,000 | 24,284 |
| 3 California GO | 1.080% | 5/1/18 | 9,000 | 9,000 |
| California GO | 5.000% | 8/1/18 | 1,895 | 2,177 |
| California GO | 5.000% | 10/1/18 | 20,000 | 23,966 |
| California GO | 5.000% | 10/1/18 | 14,095 | 16,890 |
| California GO | 5.500% | 4/1/19 | 11,245 | 13,870 |
| California GO | 5.000% | 5/1/19 | 10,000 | 11,180 |
| California GO | 5.000% | 8/1/19 | 30,000 | 33,805 |
| California GO | 5.000% | 10/1/19 (14) | 14,800 | 16,685 |
| California GO | 5.000% | 10/1/19 | 21,000 | 25,401 |
| California GO | 5.250% | 2/1/20 | 7,500 | 9,124 |
| California GO | 5.000% | 3/1/20 | 55,285 | 61,109 |
| California GO | 5.000% | 8/1/20 | 14,890 | 17,192 |
| California GO | 5.000% | 9/1/20 | 9,970 | 12,043 |
| California GO | 5.000% | 3/1/21 | 2,250 | 2,655 |
| California GO | 5.000% | 4/1/21 | 2,240 | 2,692 |
| California GO | 5.500% | 4/1/21 | 2,000 | 2,431 |
| California GO | 5.000% | 10/1/21 | 2,575 | 3,107 |
| California GO | 5.000% | 2/1/22 | 8,125 | 9,791 |
| California GO | 5.000% | 6/1/22 | 12,000 | 13,294 |
36
| | | | |
| California Intermediate-Term Tax-Exempt Fund | | | | |
| |
| |
| |
| | | | Face | Market |
| | | Maturity | Amount | Value |
| | Coupon | Date | ($000) | ($000) |
| California GO | 5.250% | 9/1/22 | 10,000 | 12,333 |
| California GO | 5.000% | 9/1/23 | 12,120 | 13,632 |
| California GO | 5.000% | 10/1/23 | 12,500 | 14,085 |
| California GO | 5.000% | 12/1/23 | 7,500 | 8,687 |
| California GO | 5.000% | 3/1/24 | 3,000 | 3,442 |
| California GO | 5.000% | 8/1/24 | 10,100 | 11,365 |
| California GO | 5.000% | 8/1/24 (4) | 31,275 | 34,551 |
| California GO | 5.000% | 10/1/24 | 13,440 | 15,000 |
| California GO | 5.000% | 11/1/24 | 5,000 | 5,778 |
| California GO | 5.000% | 11/1/24 | 6,000 | 6,858 |
| California GO | 5.000% | 12/1/24 | 2,000 | 2,289 |
| California GO | 5.125% | 3/1/25 | 2,000 | 2,281 |
| California GO | 5.000% | 8/1/25 | 10,000 | 11,184 |
| California GO | 5.000% | 11/1/25 | 1,500 | 1,722 |
| California GO | 5.000% | 12/1/25 | 21,015 | 23,882 |
| California GO | 5.000% | 3/1/26 | 5,000 | 5,451 |
| California GO | 5.000% | 3/1/26 | 5,000 | 5,645 |
| California GO | 5.000% | 4/1/26 | 27,480 | 31,056 |
| California GO | 5.000% | 11/1/26 | 7,500 | 8,538 |
| California GO | 5.000% | 4/1/27 | 24,285 | 27,263 |
| California GO | 5.750% | 4/1/27 | 31,455 | 36,996 |
| California GO | 4.500% | 8/1/27 | 6,000 | 6,419 |
| California GO | 5.250% | 10/1/27 | 5,000 | 5,812 |
| California GO | 5.000% | 3/1/28 | 10,855 | 11,499 |
| California GO | 5.750% | 4/1/28 | 30,000 | 35,082 |
| California GO | 5.000% | 6/1/28 | 10,005 | 10,790 |
| California GO | 5.250% | 9/1/28 | 6,000 | 6,926 |
| California GO | 5.000% | 9/1/29 | 6,000 | 6,736 |
| California GO | 5.250% | 3/1/30 | 20,000 | 23,031 |
| California GO | 4.500% | 8/1/30 | 11,000 | 11,615 |
| California GO | 5.000% | 9/1/30 | 10,000 | 11,184 |
| California GO | 5.000% | 3/1/31 | 5,535 | 5,908 |
| California GO | 5.750% | 4/1/31 | 30,000 | 35,001 |
| California GO | 6.000% | 3/1/33 | 12,000 | 14,454 |
| California GO | 5.125% | 4/1/33 | 6,550 | 7,028 |
| California GO | 6.500% | 4/1/33 | 20,000 | 24,322 |
| 1 California GO TOB VRDO | 0.230% | 6/1/12 | 16,245 | 16,245 |
| California GO VRDO | 0.150% | 6/7/12 LOC | 2,400 | 2,400 |
| California GO VRDO | 0.170% | 6/7/12 LOC | 30,000 | 30,000 |
| California Health Facilities Financing Authority | | | | |
| Revenue (Adventist Health System/West) | 5.000% | 3/1/16 | 2,170 | 2,223 |
| California Health Facilities Financing Authority | | | | |
| Revenue (Adventist Health System/West) | 5.000% | 3/1/19 | 1,025 | 1,045 |
| California Health Facilities Financing Authority | | | | |
| Revenue (California-Nevada Methodist Homes) | 5.000% | 7/1/26 | 1,740 | 1,816 |
| California Health Facilities Financing Authority | | | | |
| Revenue (Catholic Healthcare West) | 5.000% | 7/1/19 | 1,000 | 1,175 |
| California Health Facilities Financing Authority | | | | |
| Revenue (Catholic Healthcare West) | 5.000% | 3/1/20 | 4,750 | 5,604 |
| California Health Facilities Financing Authority | | | | |
| Revenue (Catholic Healthcare West) | 5.000% | 3/1/21 | 3,810 | 4,460 |
| California Health Facilities Financing Authority | | | | |
| Revenue (Catholic Healthcare West) | 5.250% | 3/1/22 | 8,000 | 9,424 |
| California Health Facilities Financing Authority | | | | |
| Revenue (Catholic Healthcare West) | 5.500% | 7/1/25 | 5,000 | 5,600 |
37
| | | | |
| California Intermediate-Term Tax-Exempt Fund | | | | |
| |
| |
| |
| | | | Face | Market |
| | | Maturity | Amount | Value |
| | Coupon | Date | ($000) | ($000) |
| California Health Facilities Financing Authority | | | | |
| Revenue (Catholic Healthcare West) | 5.625% | 7/1/25 | 19,820 | 22,662 |
| California Health Facilities Financing Authority | | | | |
| Revenue (Catholic Healthcare West) | 5.250% | 3/1/27 | 7,500 | 8,414 |
| California Health Facilities Financing Authority | | | | |
| Revenue (Catholic Healthcare West) | 6.000% | 7/1/29 | 4,250 | 5,005 |
| California Health Facilities Financing Authority | | | | |
| Revenue (Catholic Healthcare West) PUT | 5.000% | 7/2/12 | 8,000 | 8,032 |
| California Health Facilities Financing Authority | | | | |
| Revenue (Catholic Healthcare West) PUT | 5.000% | 7/1/14 | 9,000 | 9,680 |
| California Health Facilities Financing Authority | | | | |
| Revenue (Catholic Healthcare West) PUT | 5.000% | 7/1/14 | 39,000 | 42,547 |
| California Health Facilities Financing Authority | | | | |
| Revenue (Cedars-Sinai Medical Center) | 5.000% | 11/15/14 | 4,000 | 4,406 |
| California Health Facilities Financing Authority | | | | |
| Revenue (Cedars-Sinai Medical Center) | 5.000% | 11/15/16 | 2,000 | 2,254 |
| California Health Facilities Financing Authority | | | | |
| Revenue (Cedars-Sinai Medical Center) | 5.000% | 11/15/17 | 4,585 | 5,108 |
| California Health Facilities Financing Authority | | | | |
| Revenue (Cedars-Sinai Medical Center) | 5.000% | 8/15/19 | 1,000 | 1,208 |
| California Health Facilities Financing Authority | | | | |
| Revenue (Cedars-Sinai Medical Center) | 5.000% | 8/15/20 | 2,100 | 2,543 |
| California Health Facilities Financing Authority | | | | |
| Revenue (Cedars-Sinai Medical Center) | 5.000% | 8/15/21 | 2,000 | 2,396 |
| California Health Facilities Financing Authority | | | | |
| Revenue (Children’s Hospital of Orange County) | 6.250% | 11/1/29 | 5,000 | 5,970 |
| California Health Facilities Financing Authority | | | | |
| Revenue (Children’s Hospital of Orange County) | 5.000% | 11/1/31 | 2,000 | 2,193 |
| California Health Facilities Financing Authority | | | | |
| Revenue (Children’s Hospital of Orange County) | | | | |
| VRDO | 0.150% | 6/7/12 LOC | 5,200 | 5,200 |
| California Health Facilities Financing Authority | | | | |
| Revenue (Lucile Salter Packard Children’s | | | | |
| Hospital at Stanford) | 5.000% | 8/15/13 (Prere.) | 2,630 | 2,779 |
| California Health Facilities Financing Authority | | | | |
| Revenue (Lucile Salter Packard Children’s | | | | |
| Hospital at Stanford) | 5.000% | 8/15/13 (Prere.) | 2,515 | 2,657 |
| California Health Facilities Financing Authority | | | | |
| Revenue (Lucile Salter Packard Children’s | | | | |
| Hospital at Stanford) | 5.000% | 8/15/13 (Prere.) | 2,245 | 2,372 |
| California Health Facilities Financing Authority | | | | |
| Revenue (Lucile Salter Packard Children’s | | | | |
| Hospital at Stanford) | 5.000% | 8/15/13 (Prere.) | 2,280 | 2,409 |
| California Health Facilities Financing Authority | | | | |
| Revenue (Lucile Salter Packard Children’s | | | | |
| Hospital at Stanford) | 4.000% | 8/15/19 | 500 | 573 |
| California Health Facilities Financing Authority | | | | |
| Revenue (Lucile Salter Packard Children’s | | | | |
| Hospital at Stanford) | 5.000% | 8/15/21 | 800 | 971 |
| California Health Facilities Financing Authority | | | | |
| Revenue (Lucile Salter Packard Children’s | | | | |
| Hospital at Stanford) | 5.000% | 8/15/22 | 500 | 607 |
| California Health Facilities Financing Authority | | | | |
| Revenue (Memorial Health Services) | 3.000% | 10/1/14 | 550 | 582 |
| California Health Facilities Financing Authority | | | | |
| Revenue (Memorial Health Services) | 5.000% | 10/1/18 | 1,320 | 1,591 |
38
| | | | |
| California Intermediate-Term Tax-Exempt Fund | | | | |
| |
| |
| |
| | | | Face | Market |
| | | Maturity | Amount | Value |
| | Coupon | Date | ($000) | ($000) |
| California Health Facilities Financing Authority | | | | |
| Revenue (Memorial Health Services) | 4.000% | 10/1/19 | 1,500 | 1,719 |
| California Health Facilities Financing Authority | | | | |
| Revenue (Memorial Health Services) | 5.000% | 10/1/19 | 1,000 | 1,216 |
| California Health Facilities Financing Authority | | | | |
| Revenue (Memorial Health Services) | 4.000% | 10/1/20 | 1,800 | 2,063 |
| California Health Facilities Financing Authority | | | | |
| Revenue (Memorial Health Services) | 5.000% | 10/1/20 | 1,000 | 1,215 |
| California Health Facilities Financing Authority | | | | |
| Revenue (Memorial Health Services) | 4.000% | 10/1/21 | 1,000 | 1,142 |
| California Health Facilities Financing Authority | | | | |
| Revenue (Memorial Health Services) | 5.000% | 10/1/21 | 1,000 | 1,216 |
| California Health Facilities Financing Authority | | | | |
| Revenue (Memorial Health Services) | 4.000% | 10/1/22 | 2,250 | 2,526 |
| California Health Facilities Financing Authority | | | | |
| Revenue (Memorial Health Services) | 5.000% | 10/1/22 | 2,000 | 2,431 |
| California Health Facilities Financing Authority | | | | |
| Revenue (Memorial Health Services) | 5.000% | 10/1/24 | 5,000 | 5,892 |
| California Health Facilities Financing Authority | | | | |
| Revenue (Memorial Health Services) | 5.000% | 10/1/25 | 5,000 | 5,834 |
| California Health Facilities Financing Authority | | | | |
| Revenue (Providence Health & Services) | 6.250% | 10/1/24 | 3,000 | 3,618 |
| California Health Facilities Financing Authority | | | | |
| Revenue (Providence Health & Services) | 6.250% | 10/1/28 | 4,000 | 4,734 |
| California Health Facilities Financing Authority | | | | |
| Revenue (Rady Children’s Hospital) | 5.500% | 8/15/26 | 6,000 | 6,830 |
| California Health Facilities Financing Authority | | | | |
| Revenue (Rady Children’s Hospital) | 5.000% | 8/15/31 | 2,115 | 2,255 |
| California Health Facilities Financing Authority | | | | |
| Revenue (Scripps Health) | 5.000% | 10/1/17 | 2,515 | 2,982 |
| California Health Facilities Financing Authority | | | | |
| Revenue (Scripps Health) | 5.000% | 10/1/18 | 3,000 | 3,622 |
| California Health Facilities Financing Authority | | | | |
| Revenue (Scripps Health) | 5.000% | 11/15/25 | 750 | 882 |
| California Health Facilities Financing Authority | | | | |
| Revenue (Scripps Health) | 5.000% | 11/15/27 | 850 | 980 |
| California Health Facilities Financing Authority | | | | |
| Revenue (Scripps Health) | 5.000% | 11/15/28 | 1,175 | 1,349 |
| California Health Facilities Financing Authority | | | | |
| Revenue (Scripps Health) | 5.000% | 11/15/32 | 1,000 | 1,122 |
| California Health Facilities Financing Authority | | | | |
| Revenue (Scripps Health) VRDO | 0.110% | 6/7/12 LOC | 3,800 | 3,800 |
| California Health Facilities Financing Authority | | | | |
| Revenue (St. Joseph Health System) | 5.500% | 7/1/29 | 10,000 | 11,550 |
| California Health Facilities Financing Authority | | | | |
| Revenue (St. Joseph Health System) PUT | 5.000% | 10/16/14 | 15,000 | 16,287 |
| 1 California Health Facilities Financing Authority | | | | |
| Revenue (St. Joseph Health System) TOB VRDO | 0.250% | 6/7/12 | 15,000 | 15,000 |
| California Health Facilities Financing Authority | | | | |
| Revenue (Stanford Hospital) | 5.000% | 11/15/13 (Prere.) | 6,275 | 6,702 |
| California Health Facilities Financing Authority | | | | |
| Revenue (Stanford Hospital) | 5.000% | 11/15/13 (Prere.) | 3,000 | 3,204 |
| California Health Facilities Financing Authority | | | | |
| Revenue (Stanford Hospital) | 5.000% | 11/15/13 (Prere.) | 2,715 | 2,900 |
| California Health Facilities Financing Authority | | | | |
| Revenue (Stanford Hospital) | 5.000% | 8/15/19 | 2,000 | 2,434 |
39
| | | | |
| California Intermediate-Term Tax-Exempt Fund | | | | |
| |
| |
| |
| | | | Face | Market |
| | | Maturity | Amount | Value |
| | Coupon | Date | ($000) | ($000) |
| California Health Facilities Financing Authority | | | | |
| Revenue (Stanford Hospital) | 4.000% | 8/15/21 | 2,250 | 2,566 |
| California Health Facilities Financing Authority | | | | |
| Revenue (Stanford Hospital) | 5.000% | 8/15/23 | 1,830 | 2,226 |
| California Health Facilities Financing Authority | | | | |
| Revenue (Sutter Health) | 5.000% | 8/15/20 | 2,200 | 2,682 |
| California Health Facilities Financing Authority | | | | |
| Revenue (Sutter Health) | 5.000% | 8/15/21 | 1,275 | 1,568 |
| California Health Facilities Financing Authority | | | | |
| Revenue (Sutter Health) | 5.000% | 8/15/22 | 1,090 | 1,319 |
| California Health Facilities Financing Authority | | | | |
| Revenue (Sutter Health) | 5.500% | 8/15/26 | 4,750 | 5,621 |
| California Health Facilities Financing Authority | | | | |
| Revenue (Sutter Health) | 5.250% | 8/15/31 | 4,500 | 5,188 |
| California Health Facilities Financing Authority | | | | |
| Revenue (Sutter Health) | 5.875% | 8/15/31 | 5,000 | 5,994 |
| 1 California Health Facilities Financing Authority | | | | |
| Revenue (Sutter Health) TOB VRDO | 0.180% | 6/7/12 | 17,660 | 17,660 |
| California Infrastructure & Economic | | | | |
| Development Bank Revenue | | | | |
| (American National Red Cross) VRDO | 0.150% | 6/7/12 LOC | 3,500 | 3,500 |
| 1 California Infrastructure & Economic | | | | |
| Development Bank Revenue | | | | |
| (Bay Area Toll Bridges Seismic Retrofit) | | | | |
| TOB VRDO | 0.200% | 6/1/12 (ETM) | 61,730 | 61,730 |
| California Infrastructure & Economic | | | | |
| Development Bank Revenue | | | | |
| (Buck Institute for Age Research) VRDO | 0.150% | 6/7/12 LOC | 3,700 | 3,700 |
| California Infrastructure & Economic | | | | |
| Development Bank Revenue | | | | |
| (Clean Water State Revolving Fund) | 5.000% | 10/1/14 | 2,500 | 2,540 |
| California Infrastructure & Economic | | | | |
| Development Bank Revenue | | | | |
| (J. Paul Getty Trust) | 4.000% | 10/1/15 | 1,400 | 1,563 |
| 3 California Infrastructure & Economic | | | | |
| Development Bank Revenue | | | | |
| (J. Paul Getty Trust) PUT | 0.680% | 4/1/14 | 5,000 | 5,000 |
| California Infrastructure & Economic | | | | |
| Development Bank Revenue | | | | |
| (Science Center Phase II Project) | 5.000% | 5/1/18 (14) | 1,785 | 1,887 |
| California Infrastructure & Economic | | | | |
| Development Bank Revenue | | | | |
| (Science Center Phase II Project) | 5.000% | 5/1/19 (14) | 1,040 | 1,089 |
| California Infrastructure & Economic | | | | |
| Development Bank Revenue | | | | |
| (Science Center Phase II Project) | 5.000% | 5/1/21 (14) | 1,145 | 1,181 |
| California Infrastructure & Economic | | | | |
| Development Bank Revenue | | | | |
| (SRI International) VRDO | 0.170% | 6/7/12 LOC | 4,280 | 4,280 |
| California Infrastructure & Economic | | | | |
| Development Bank Revenue | | | | |
| (SRI International) VRDO | 0.170% | 6/7/12 LOC | 4,900 | 4,900 |
| California Infrastructure & Economic | | | | |
| Development Bank Revenue | | | | |
| (State Revolving Fund) | 5.000% | 10/1/29 | 7,000 | 7,448 |
40
| | | | |
| California Intermediate-Term Tax-Exempt Fund | | | | |
| |
| |
| |
| | | | Face | Market |
| | | Maturity | Amount | Value |
| | Coupon | Date | ($000) | ($000) |
| California Infrastructure & Economic | | | | |
| Development Bank Revenue | | | | |
| (Workers’ Compensation Relief) | 5.250% | 10/1/13 (2) | 18,000 | 19,092 |
| California Infrastructure & Economic | | | | |
| Development Bank Revenue | | | | |
| (Workers’ Compensation Relief) | 5.250% | 10/1/14 (2) | 25,815 | 27,408 |
| California Municipal Finance Authority | | | | |
| (Community Hospitals of Central | | | | |
| California Obligated Group) COP | 5.375% | 2/1/29 | 16,600 | 17,418 |
| California Municipal Finance Authority | | | | |
| Revenue (University of La Verne) | 5.000% | 6/1/16 | 1,000 | 1,099 |
| California Municipal Finance Authority | | | | |
| Revenue (University of La Verne) | 4.750% | 6/1/18 | 2,325 | 2,540 |
| California Municipal Finance Authority | | | | |
| Revenue (University of La Verne) | 5.000% | 6/1/19 | 2,375 | 2,630 |
| California Pollution Control Financing | | | | |
| Authority Environmental Improvement | | | | |
| Revenue (BP West Coast Products | | | | |
| LLC Project) PUT | 2.600% | 9/2/14 | 13,550 | 14,101 |
| California Pollution Control Financing | | | | |
| Authority Revenue (Pacific Gas & | | | | |
| Electric Co.) VRDO | 0.160% | 6/1/12 LOC | 10,400 | 10,400 |
| California Pollution Control Financing | | | | |
| Authority Revenue (San Diego Gas & | | | | |
| Electric Co.) | 5.900% | 6/1/14 (14) | 17,135 | 18,870 |
| California Public Works Board Lease Revenue | | | | |
| (Butterfield State Office Complex) | 5.000% | 6/1/20 | 3,895 | 4,208 |
| California Public Works Board Lease Revenue | | | | |
| (Department of Corrections) | 5.000% | 12/1/12 (14) | 10,625 | 10,870 |
| California Public Works Board Lease Revenue | | | | |
| (Department of Corrections) | 5.500% | 12/1/13 (Prere.) | 10,000 | 10,775 |
| California Public Works Board Lease Revenue | | | | |
| (Department of Corrections) | 5.500% | 12/1/13 (Prere.) | 10,000 | 10,775 |
| California Public Works Board Lease Revenue | | | | |
| (Department of Corrections) | 5.000% | 10/1/16 | 3,785 | 4,321 |
| California Public Works Board Lease Revenue | | | | |
| (Department of Corrections) | 5.000% | 1/1/18 (2) | 27,790 | 30,883 |
| California Public Works Board Lease Revenue | | | | |
| (Department of Corrections) | 5.000% | 1/1/21 | 3,975 | 4,316 |
| California Public Works Board Lease Revenue | | | | |
| (Department of Corrections) | 5.000% | 6/1/21 | 5,000 | 5,852 |
| California Public Works Board Lease Revenue | | | | |
| (Department of Corrections) | 5.000% | 6/1/22 | 5,210 | 6,097 |
| California Public Works Board Lease Revenue | | | | |
| (Department of Corrections) | 5.750% | 10/1/31 | 6,000 | 6,846 |
| California Public Works Board Lease Revenue | | | | |
| (Department of General Services) | 6.000% | 4/1/27 | 5,000 | 5,870 |
| California Public Works Board Lease Revenue | | | | |
| (Department of Mental Health) | 5.500% | 6/1/15 | 1,500 | 1,638 |
| California Public Works Board Lease Revenue | | | | |
| (Department of Mental Health) | 5.500% | 6/1/17 | 8,000 | 8,687 |
| California Public Works Board Lease Revenue | | | | |
| (Department of Mental Health) | 5.500% | 6/1/18 | 5,000 | 5,419 |
| California Public Works Board Lease Revenue | | | | |
| (Judicial Council Projects) | 5.000% | 12/1/27 | 7,000 | 7,661 |
41
| | | | |
| California Intermediate-Term Tax-Exempt Fund | | | | |
| |
| |
| |
| | | | Face | Market |
| | | Maturity | Amount | Value |
| | Coupon | Date | ($000) | ($000) |
| California Public Works Board Lease Revenue | | | | |
| (Judicial Council Projects) | 5.000% | 12/1/28 | 4,980 | 5,432 |
| California Public Works Board Lease Revenue | | | | |
| (Judicial Council Projects) | 5.000% | 12/1/29 | 5,000 | 5,433 |
| California Public Works Board Lease Revenue | | | | |
| (Regents of The University of California) | 5.500% | 6/1/14 | 5,140 | 5,355 |
| California Public Works Board Lease Revenue | | | | |
| (Regents of The University of California) | 5.000% | 6/1/18 (14) | 10,310 | 12,327 |
| California Public Works Board Lease Revenue | | | | |
| (Regents of The University of California) | 5.000% | 6/1/20 (14) | 7,670 | 9,362 |
| California Public Works Board Lease Revenue | | | | |
| (Regents of The University of California) | 5.000% | 4/1/25 | 5,765 | 6,264 |
| California Public Works Board Lease Revenue | | | | |
| (Regents of The University of California) | 5.250% | 11/1/26 (14) | 9,010 | 10,070 |
| California Public Works Board Lease Revenue | | | | |
| (Trustees of The California State University) | 5.300% | 10/1/15 (2) | 6,655 | 6,677 |
| California Public Works Board Lease Revenue | | | | |
| (Trustees of The California State University) | 5.375% | 10/1/16 (14) | 4,750 | 4,765 |
| California Public Works Board Lease Revenue | | | | |
| (Various Capital Projects) | 5.000% | 11/1/13 | 2,000 | 2,124 |
| California Public Works Board Lease Revenue | | | | |
| (Various Capital Projects) | 5.000% | 11/1/14 | 4,745 | 5,197 |
| California Public Works Board Lease Revenue | | | | |
| (Various Capital Projects) | 5.000% | 11/1/16 | 6,395 | 7,314 |
| California Public Works Board Lease Revenue | | | | |
| (Various Capital Projects) | 5.000% | 11/1/18 | 4,000 | 4,668 |
| California Public Works Board Lease Revenue | | | | |
| (Various Capital Projects) | 5.250% | 11/1/20 | 5,000 | 5,865 |
| California Public Works Board Lease Revenue | | | | |
| (Various Capital Projects) | 5.000% | 12/1/21 | 5,400 | 6,659 |
| California Public Works Board Lease Revenue | | | | |
| (Various Capital Projects) | 5.000% | 12/1/22 | 2,645 | 3,223 |
| California Public Works Board Lease Revenue | | | | |
| (Various Capital Projects) | 5.000% | 4/1/23 | 4,180 | 4,805 |
| California Public Works Board Lease Revenue | | | | |
| (Various Capital Projects) | 5.000% | 12/1/31 | 5,000 | 5,636 |
| California State University Revenue Systemwide | 5.375% | 5/1/13 (Prere.) | 5,390 | 5,642 |
| California State University Revenue Systemwide | 5.000% | 11/1/20 | 5,000 | 6,167 |
| California State University Revenue Systemwide | 5.000% | 11/1/22 (2) | 18,440 | 20,542 |
| California State University Revenue Systemwide | 5.000% | 11/1/24 | 8,690 | 9,797 |
| California State University Revenue Systemwide | 5.000% | 11/1/24 | 2,915 | 3,480 |
| California State University Revenue Systemwide | 5.000% | 11/1/25 | 11,820 | 13,227 |
| California State University Revenue Systemwide | 5.000% | 11/1/26 | 12,530 | 13,955 |
| California State University Revenue Systemwide | 5.000% | 11/1/27 | 5,000 | 5,541 |
| California State University Revenue Systemwide | 5.000% | 11/1/27 | 5,740 | 6,681 |
| 1 California State University Revenue | | | | |
| Systemwide TOB VRDO | 0.280% | 6/7/12 (12) | 5,000 | 5,000 |
| California Statewide Communities Development | | | | |
| Authority Health Facility Revenue | | | | |
| (Adventist Health System/West) | 5.000% | 3/1/25 | 14,975 | 16,273 |
| California Statewide Communities Development | | | | |
| Authority Health Facility Revenue | | | | |
| (Memorial Health Services) | 6.000% | 4/1/13 (Prere.) | 7,780 | 8,154 |
| California Statewide Communities Development | | | | |
| Authority Health Facility Revenue | | | | |
| (Memorial Health Services) | 6.000% | 4/1/13 (Prere.) | 5,335 | 5,592 |
42
| | | | |
| California Intermediate-Term Tax-Exempt Fund | | | | |
| |
| |
| |
| | | | Face | Market |
| | | Maturity | Amount | Value |
| | Coupon | Date | ($000) | ($000) |
| California Statewide Communities Development | | | | |
| Authority Health Facility Revenue | | | | |
| (Memorial Health Services) | 6.000% | 4/1/13 (Prere.) | 6,920 | 7,253 |
| California Statewide Communities Development | | | | |
| Authority Health Facility Revenue | | | | |
| (Memorial Health Services) | 6.000% | 4/1/13 (Prere.) | 10,000 | 10,481 |
| California Statewide Communities Development | | | | |
| Authority Pollution Control Revenue | | | | |
| (Southern California Edison Co.) PUT | 4.250% | 11/1/16 (3) | 25,000 | 27,789 |
| California Statewide Communities Development | | | | |
| Authority Pollution Control Revenue | | | | |
| (Southern California Edison Co.) PUT | 4.250% | 11/1/16 (3) | 15,000 | 16,673 |
| California Statewide Communities Development | | | | |
| Authority Revenue (Cottage Health System | | | | |
| Obligated Group) | 5.250% | 11/1/30 | 10,000 | 11,227 |
| California Statewide Communities Development | | | | |
| Authority Revenue (Daughters of Charity | | | | |
| Health System - St. Francis Medical Center) | 5.250% | 7/1/13 | 1,250 | 1,296 |
| California Statewide Communities Development | | | | |
| Authority Revenue (Daughters of Charity | | | | |
| Health System - St. Francis Medical Center) | 5.000% | 7/1/22 | 5,155 | 5,400 |
| California Statewide Communities Development | | | | |
| Authority Revenue (Daughters of Charity | | | | |
| Health System - St. Francis Medical Center) | 5.250% | 7/1/25 | 1,995 | 2,079 |
| California Statewide Communities Development | | | | |
| Authority Revenue (Huntington Memorial | | | | |
| Hospital) | 5.000% | 7/1/18 | 6,190 | 6,754 |
| California Statewide Communities Development | | | | |
| Authority Revenue (Institute for Defense | | | | |
| Analyses) VRDO | 0.190% | 6/7/12 (2)LOC | 3,365 | 3,365 |
| California Statewide Communities Development | | | | |
| Authority Revenue (Kaiser Permanente) | 5.250% | 8/1/31 | 3,200 | 3,546 |
| 2 California Statewide Communities Development | | | | |
| Authority Revenue (Kaiser Permanente) PUT | 5.000% | 5/1/17 | 6,000 | 6,971 |
| California Statewide Communities Development | | | | |
| Authority Revenue (Lodi Memorial Hospital) | 5.000% | 12/1/22 | 8,000 | 8,645 |
| California Statewide Communities Development | | | | |
| Authority Revenue (Los Angeles Orthopaedic | | | | |
| Hospital Foundation & Orthopaedic Hospital) | 5.125% | 6/1/13 (2) | 1,530 | 1,533 |
| California Statewide Communities Development | | | | |
| Authority Revenue (Los Angeles Orthopaedic | | | | |
| Hospital Foundation & Orthopaedic Hospital) | 5.250% | 6/1/14 (2) | 1,610 | 1,614 |
| California Statewide Communities Development | | | | |
| Authority Revenue (Proposition 1A Receivables | | | | |
| Program) | 5.000% | 6/15/13 | 28,000 | 29,352 |
| California Statewide Communities Development | | | | |
| Authority Revenue (Rady Children’s Hospital - | | | | |
| San Diego) | 5.000% | 8/15/20 (14) | 2,440 | 2,651 |
| California Statewide Communities Development | | | | |
| Authority Revenue (Rady Children’s Hospital - | | | | |
| San Diego) | 5.000% | 8/15/23 (14) | 5,285 | 5,869 |
| California Statewide Communities Development | | | | |
| Authority Revenue (Redlands Community | | | | |
| Hospital) VRDO | 0.160% | 6/7/12 LOC | 7,100 | 7,100 |
| California Statewide Communities Development | | | | |
| Authority Revenue (Sherman Oaks Project) | 5.500% | 8/1/15 (2) | 4,685 | 5,168 |
43
| | | | |
| California Intermediate-Term Tax-Exempt Fund | | | | |
| |
| |
| |
| | | | Face | Market |
| | | Maturity | Amount | Value |
| | Coupon | Date | ($000) | ($000) |
| California Statewide Communities Development | | | | |
| Authority Revenue (St. Joseph Health System) | 4.500% | 7/1/18 (4) | 12,045 | 12,976 |
| California Statewide Communities Development | | | | |
| Authority Revenue (Sutter Health) | 5.250% | 8/15/31 | 7,500 | 8,646 |
| 1 California Statewide Communities Development | | | | |
| Authority Revenue (Sutter Health) TOB VRDO | 0.250% | 6/7/12 | 4,038 | 4,038 |
| California Statewide Communities Development | | | | |
| Authority Senior Living Revenue | | | | |
| (Southern California Presbyterian Homes) | 7.000% | 11/15/29 | 2,000 | 2,257 |
| California Statewide Communities Development | | | | |
| Authority Student Housing Revenue | | | | |
| (CHF-Irvine LLC - UCI East Campus | | | | |
| Apartments Phase II) | 5.500% | 5/15/26 | 5,000 | 5,380 |
| California Statewide Communities Development | | | | |
| Authority Student Housing Revenue | | | | |
| (CHF-Irvine LLC - UCI East Campus | | | | |
| Apartments Phase II) | 5.125% | 5/15/31 | 7,000 | 7,377 |
| Central CA Unified School District GO | 5.500% | 8/1/29 (12) | 3,000 | 3,444 |
| Central Valley CA Financing Authority | | | | |
| Cogeneration Project Revenue | | | | |
| (Carson Ice-Gen Project) | 5.000% | 7/1/17 | 1,000 | 1,154 |
| Central Valley CA Financing Authority | | | | |
| Cogeneration Project Revenue | | | | |
| (Carson Ice-Gen Project) | 5.000% | 7/1/19 | 765 | 906 |
| Central Valley CA Financing Authority | | | | |
| Cogeneration Project Revenue | | | | |
| (Carson Ice-Gen Project) | 5.250% | 7/1/20 | 1,025 | 1,235 |
| Cerritos CA Community College District GO | 0.000% | 8/1/20 | 500 | 379 |
| Cerritos CA Community College District GO | 0.000% | 8/1/22 | 500 | 337 |
| Cerritos CA Community College District GO | 0.000% | 8/1/23 | 500 | 315 |
| 1 Chabot-Las Positas CA Community College | | | | |
| District GO TOB VRDO | 0.200% | 6/7/12 | 3,000 | 3,000 |
| Clovis CA Unified School District GO | 0.000% | 8/1/18 (14) | 3,645 | 3,167 |
| Compton CA Unified School District GO | 5.250% | 9/1/13 (Prere.) | 1,645 | 1,747 |
| Compton CA Unified School District GO | 5.250% | 9/1/13 (Prere.) | 1,460 | 1,551 |
| Compton CA Unified School District GO | 5.250% | 9/1/13 (Prere.) | 1,295 | 1,375 |
| Contra Costa County CA Public Financing | | | | |
| Authority Lease Revenue | 5.000% | 6/1/22 (14) | 15,300 | 16,651 |
| Corona-Norco CA Unified School District GO | 0.000% | 8/1/20 (12) | 1,825 | 1,437 |
| Corona-Norco CA Unified School District GO | 0.000% | 8/1/21 (12) | 2,010 | 1,479 |
| Corona-Norco CA Unified School District GO | 0.000% | 8/1/22 (12) | 1,700 | 1,175 |
| Corona-Norco CA Unified School District GO | 0.000% | 8/1/23 (12) | 1,000 | 655 |
| Corona-Norco CA Unified School District GO | 0.000% | 8/1/25 (12) | 1,325 | 778 |
| Corona-Norco CA Unified School District GO | 0.000% | 8/1/26 (12) | 1,530 | 843 |
| Corona-Norco CA Unified School District GO | 0.000% | 8/1/27 (12) | 1,500 | 772 |
| Corona-Norco CA Unified School District GO | 0.000% | 8/1/28 (12) | 1,290 | 627 |
| Culver City CA Redevelopment Agency | | | | |
| Tax Allocation Revenue | 5.375% | 11/1/16 (4) | 3,260 | 3,272 |
| 1 Desert CA Community College District | | | | |
| GO TOB VRDO | 0.250% | 6/7/12 | 3,700 | 3,700 |
| East Bay CA Municipal Utility District | | | | |
| Water System Revenue | 5.000% | 6/1/30 | 2,005 | 2,366 |
| East Bay CA Municipal Utility District | | | | |
| Water System Revenue | 5.000% | 6/1/31 | 16,020 | 18,794 |
| 1 East Bay CA Municipal Utility District | | | | |
| Water System Revenue TOB VRDO | 0.150% | 6/7/12 | 4,960 | 4,960 |
44
| | | | |
| California Intermediate-Term Tax-Exempt Fund | | | | |
| |
| |
| |
| | | | Face | Market |
| | | Maturity | Amount | Value |
| | Coupon | Date | ($000) | ($000) |
| East Bay CA Regional Park District Revenue | 5.000% | 9/1/28 | 4,415 | 5,152 |
| Eastern California Municipal Water District | | | | |
| Water & Sewer COP | 5.000% | 7/1/26 | 5,245 | 5,891 |
| Eastern California Municipal Water District | | | | |
| Water & Sewer COP | 5.000% | 7/1/27 | 6,220 | 6,958 |
| Eastern California Municipal Water District | | | | |
| Water & Sewer COP | 5.000% | 7/1/28 | 1,000 | 1,115 |
| Eastern California Municipal Water District | | | | |
| Water & Sewer Revenue VRDO | 0.150% | 6/7/12 | 2,200 | 2,200 |
| Fontana CA Public Financing Authority Tax | | | | |
| Allocation Revenue | 5.000% | 10/1/21 (2) | 3,335 | 3,477 |
| Fontana CA Public Financing Authority Tax | | | | |
| Allocation Revenue | 5.000% | 10/1/23 (2) | 2,875 | 2,971 |
| Fontana CA Public Financing Authority Tax | | | | |
| Allocation Revenue | 5.000% | 10/1/24 (2) | 3,475 | 3,574 |
| Fontana CA Public Financing Authority Tax | | | | |
| Allocation Revenue | 5.000% | 10/1/26 (2) | 4,480 | 4,593 |
| Fontana CA Unified School District GO | 5.250% | 8/1/26 (4) | 4,350 | 4,935 |
| Foothill/Eastern Corridor Agency California | | | | |
| Toll Road Revenue | 5.250% | 1/15/13 (14) | 5,000 | 5,004 |
| Foothill/Eastern Corridor Agency California | | | | |
| Toll Road Revenue | 5.375% | 1/15/15 (14) | 5,000 | 5,003 |
| Fresno CA Sewer Revenue | 5.000% | 9/1/24 (12) | 830 | 947 |
| 1 Fresno CA Sewer Revenue TOB VRDO | 0.200% | 6/7/12 (12) | 5,170 | 5,170 |
| Fresno County CA TRAN | 3.000% | 6/29/12 | 20,000 | 20,044 |
| Golden State Tobacco Securitization Corp. | | | | |
| California | 5.000% | 6/1/13 (Prere.) | 1,930 | 2,021 |
| Golden State Tobacco Securitization Corp. | | | | |
| California | 5.500% | 6/1/13 (Prere.) | 5,000 | 5,260 |
| Golden State Tobacco Securitization Corp. | | | | |
| California | 5.500% | 6/1/13 (Prere.) | 7,530 | 7,922 |
| Golden State Tobacco Securitization Corp. | | | | |
| California | 6.250% | 6/1/13 (Prere.) | 53,600 | 55,616 |
| Golden State Tobacco Securitization Corp. | | | | |
| California | 7.800% | 6/1/13 (Prere.) | 25,170 | 27,037 |
| Golden State Tobacco Securitization Corp. | | | | |
| California | 4.500% | 6/1/27 | 31,715 | 26,007 |
| Golden State Tobacco Securitization Corp. | | | | |
| California | 0.000% | 6/1/37 | 20,000 | 14,941 |
| Grossmont CA Union High School District GO | 0.000% | 8/1/28 | 3,210 | 1,491 |
| Grossmont CA Union High School District GO | 0.000% | 8/1/29 | 6,965 | 3,060 |
| Grossmont-Cuyamaca CA Community College | | | | |
| District GO | 0.000% | 8/1/25 (12) | 14,010 | 8,150 |
| Grossmont-Cuyamaca CA Community College | | | | |
| District GO | 0.000% | 8/1/28 (12) | 21,875 | 10,503 |
| Huntington Beach CA Union High School | | | | |
| District GO | 5.000% | 8/1/27 (4) | 3,530 | 3,784 |
| Inland Empire Tobacco Securitization Authority | | | | |
| California Revenue | 4.625% | 6/1/21 | 8,295 | 7,268 |
| Intermodal Container Transfer Facility Joint | | | | |
| Power Authority California Revenue | | | | |
| (Union Pacific Railroad Co.) | 5.125% | 11/1/12 (2) | 2,540 | 2,589 |
| Intermodal Container Transfer Facility Joint | | | | |
| Power Authority California Revenue | | | | |
| (Union Pacific Railroad Co.) | 5.125% | 11/1/13 (2) | 1,870 | 1,984 |
45
| | | | |
| California Intermediate-Term Tax-Exempt Fund | | | | |
| |
| |
| |
| | | | Face | Market |
| | | Maturity | Amount | Value |
| | Coupon | Date | ($000) | ($000) |
| Irvine CA Assessment District No. 05-21 | | | | |
| Improvement Revenue VRDO | 0.180% | 6/1/12 LOC | 12,700 | 12,700 |
| Irvine CA Assessment District No. 97-17 | | | | |
| Improvement Revenue VRDO | 0.180% | 6/1/12 LOC | 4,100 | 4,100 |
| Irvine CA Public Facilities & Infrastructure | | | | |
| Authority Assessment Revenue | 4.600% | 9/2/15 (2) | 2,515 | 2,531 |
| Irvine CA Public Facilities & Infrastructure | | | | |
| Authority Assessment Revenue | 4.700% | 9/2/16 (2) | 2,605 | 2,621 |
| Irvine CA Public Facilities & Infrastructure | | | | |
| Authority Assessment Revenue VRDO | 0.180% | 6/1/12 LOC | 3,800 | 3,800 |
| Irvine CA Public Facilities & Infrastructure | | | | |
| Authority Assessment Revenue VRDO | 0.180% | 6/1/12 LOC | 2,835 | 2,835 |
| Irvine CA Ranch Water District Revenue VRDO | 0.180% | 6/1/12 LOC | 4,100 | 4,100 |
| Irvine CA Unified School District Financing | | | | |
| Authority Special Tax Revenue | 5.000% | 9/1/25 (2) | 8,645 | 9,058 |
| Kings River Conservation District California COP | 5.000% | 5/1/13 | 2,315 | 2,397 |
| Kings River Conservation District California COP | 5.000% | 5/1/14 | 3,500 | 3,737 |
| Kings River Conservation District California COP | 5.000% | 5/1/15 (ETM) | 2,590 | 2,935 |
| Kings River Conservation District California COP | 5.000% | 5/1/15 | 1,755 | 1,925 |
| Loma Linda CA Hospital Revenue | | | | |
| (Loma Linda University) | 5.000% | 12/1/18 | 8,665 | 8,993 |
| Long Beach CA Community College District GO | 0.000% | 6/1/29 (4) | 6,380 | 2,877 |
| Long Beach CA Finance Authority Lease Revenue | 6.000% | 11/1/17 (2) | 3,235 | 3,479 |
| Long Beach CA Finance Authority Natural Gas | | | | |
| Purchase Revenue | 5.250% | 11/15/20 | 3,000 | 3,314 |
| Long Beach CA Finance Authority Natural Gas | | | | |
| Purchase Revenue | 1.723% | 11/15/25 | 16,845 | 13,438 |
| Long Beach CA Finance Authority Natural Gas | | | | |
| Purchase Revenue | 1.743% | 11/15/26 | 10,025 | 7,876 |
| Long Beach CA Unified School District GO | 5.000% | 8/1/30 | 5,000 | 5,752 |
| Los Angeles CA Community College District GO | 5.000% | 8/1/21 (4) | 10,000 | 11,299 |
| Los Angeles CA Community College District GO | 5.000% | 8/1/24 | 6,500 | 7,542 |
| Los Angeles CA Community College District GO | 5.000% | 8/1/25 | 5,000 | 5,748 |
| Los Angeles CA Community College District GO | 5.500% | 8/1/25 | 5,000 | 5,958 |
| Los Angeles CA Community College District GO | 5.000% | 8/1/27 | 4,250 | 4,835 |
| Los Angeles CA Community College District GO | 5.000% | 8/1/27 | 6,960 | 7,972 |
| Los Angeles CA Community College District GO | 5.000% | 8/1/31 (4) | 5,000 | 5,530 |
| Los Angeles CA Community College District GO | 5.000% | 8/1/32 | 5,000 | 5,547 |
| Los Angeles CA COP | 5.000% | 6/11/12 (Prere.) | 1,950 | 1,953 |
| Los Angeles CA COP | 5.000% | 6/11/12 (Prere.) | 1,725 | 1,727 |
| Los Angeles CA COP | 5.000% | 6/11/12 (Prere.) | 1,560 | 1,562 |
| Los Angeles CA COP | 5.000% | 6/11/12 (Prere.) | 1,435 | 1,437 |
| Los Angeles CA Department of Airports | | | | |
| International Airport Revenue | 5.000% | 5/15/13 (14) | 10,500 | 10,960 |
| Los Angeles CA Department of Airports | | | | |
| International Airport Revenue | 5.000% | 5/15/24 | 4,000 | 4,504 |
| Los Angeles CA Department of Airports | | | | |
| International Airport Revenue | 5.250% | 5/15/25 | 3,000 | 3,394 |
| Los Angeles CA Department of Airports | | | | |
| International Airport Revenue | 5.000% | 5/15/26 | 4,000 | 4,667 |
| Los Angeles CA Department of Airports | | | | |
| International Airport Revenue | 5.250% | 5/15/28 | 10,000 | 11,690 |
| Los Angeles CA Department of Airports | | | | |
| International Airport Revenue | 5.000% | 5/15/29 | 4,385 | 4,932 |
| Los Angeles CA Department of Airports | | | | |
| International Airport Revenue | 5.250% | 5/15/29 | 10,000 | 11,628 |
46
| | | | |
| California Intermediate-Term Tax-Exempt Fund | | | | |
| |
| |
| |
| | | | Face | Market |
| | | Maturity | Amount | Value |
| | Coupon | Date | ($000) | ($000) |
| Los Angeles CA Department of Airports | | | | |
| International Airport Revenue | 5.000% | 5/15/30 | 1,835 | 2,056 |
| Los Angeles CA Department of | | | | |
| Water & Power Revenue | 5.000% | 7/1/22 | 10,000 | 12,340 |
| Los Angeles CA Department of | | | | |
| Water & Power Revenue | 5.000% | 7/1/23 | 1,335 | 1,575 |
| Los Angeles CA Department of | | | | |
| Water & Power Revenue | 5.000% | 7/1/23 (4) | 20,605 | 23,155 |
| Los Angeles CA Department of Water & Power | | | | |
| Revenue | 5.000% | 7/1/24 | 2,770 | 3,186 |
| Los Angeles CA Department of Water & Power | | | | |
| Revenue | 5.000% | 7/1/26 | 2,350 | 2,663 |
| Los Angeles CA Department of Water & Power | | | | |
| Revenue | 5.000% | 7/1/26 | 2,000 | 2,331 |
| Los Angeles CA Department of Water & Power | | | | |
| Revenue | 5.000% | 7/1/27 | 1,655 | 1,894 |
| Los Angeles CA Department of Water & Power | | | | |
| Revenue | 5.000% | 7/1/27 | 5,000 | 5,796 |
| Los Angeles CA Department of Water & Power | | | | |
| Revenue | 5.000% | 7/1/28 | 2,000 | 2,280 |
| Los Angeles CA Department of Water & Power | | | | |
| Revenue | 5.000% | 7/1/29 | 1,670 | 1,895 |
| Los Angeles CA Department of Water & Power | | | | |
| Revenue | 5.000% | 7/1/32 (2) | 1,940 | 2,180 |
| 1 Los Angeles CA Department of Water & Power | | | | |
| Revenue TOB VRDO | 0.200% | 6/1/12 | 3,400 | 3,400 |
| 1 Los Angeles CA Department of Water & Power | | | | |
| Revenue TOB VRDO | 0.200% | 6/1/12 | 2,030 | 2,030 |
| Los Angeles CA Department of Water & Power | | | | |
| Revenue VRDO | 0.170% | 6/1/12 | 10,200 | 10,200 |
| Los Angeles CA Department of Water & Power | | | | |
| Revenue VRDO | 0.120% | 6/7/12 | 4,000 | 4,000 |
| Los Angeles CA Department of Water & Power | | | | |
| Revenue VRDO | 0.140% | 6/7/12 | 12,000 | 12,000 |
| Los Angeles CA GO | 5.000% | 9/1/14 (Prere.) | 4,055 | 4,480 |
| Los Angeles CA GO | 5.000% | 9/1/22 | 10,000 | 12,269 |
| Los Angeles CA GO | 5.000% | 9/1/28 | 5,850 | 6,809 |
| Los Angeles CA GO | 5.000% | 9/1/29 | 5,850 | 6,768 |
| Los Angeles CA GO | 5.000% | 9/1/30 | 5,850 | 6,738 |
| Los Angeles CA Harbor Department Revenue | 5.000% | 8/1/23 | 2,250 | 2,738 |
| Los Angeles CA Harbor Department Revenue | 5.000% | 8/1/25 | 3,795 | 4,541 |
| Los Angeles CA Municipal Improvement Corp. | | | | |
| Lease Revenue | 5.000% | 8/1/28 (14) | 8,980 | 9,249 |
| Los Angeles CA Municipal Improvement Corp. | | | | |
| Lease Revenue (Police Headquarters Facility) | 5.000% | 1/1/21 (14) | 10,830 | 11,848 |
| Los Angeles CA Municipal Improvement Corp. | | | | |
| Lease Revenue (Police Headquarters Facility) | 5.000% | 1/1/22 (14) | 6,500 | 7,053 |
| Los Angeles CA Municipal Improvement Corp. | | | | |
| Lease Revenue (Police Headquarters Facility) | 5.000% | 1/1/23 (14) | 14,700 | 15,871 |
| Los Angeles CA Unified School District GO | 5.000% | 7/1/13 (Prere.) | 3,900 | 4,099 |
| Los Angeles CA Unified School District GO | 5.000% | 7/1/13 (Prere.) | 3,000 | 3,153 |
| Los Angeles CA Unified School District GO | 5.000% | 7/1/13 (Prere.) | 5,000 | 5,255 |
| Los Angeles CA Unified School District GO | 5.000% | 7/1/13 (4) | 4,650 | 4,891 |
| Los Angeles CA Unified School District GO | 6.000% | 7/1/13 (3) | 3,745 | 3,974 |
| Los Angeles CA Unified School District GO | 5.000% | 7/1/14 | 5,000 | 5,465 |
| Los Angeles CA Unified School District GO | 5.000% | 7/1/14 (ETM) | 5,000 | 5,490 |
47
| | | | |
| California Intermediate-Term Tax-Exempt Fund | | | | |
| |
| |
| |
| | | | Face | Market |
| | | Maturity | Amount | Value |
| | Coupon | Date | ($000) | ($000) |
| Los Angeles CA Unified School District GO | 6.000% | 7/1/14 (3) | 1,440 | 1,603 |
| Los Angeles CA Unified School District GO | 5.000% | 7/1/15 | 6,350 | 7,177 |
| Los Angeles CA Unified School District GO | 5.000% | 7/1/16 (3) | 2,000 | 2,327 |
| Los Angeles CA Unified School District GO | 5.000% | 7/1/17 (4) | 3,515 | 4,206 |
| Los Angeles CA Unified School District GO | 5.500% | 7/1/17 (3) | 2,800 | 3,420 |
| Los Angeles CA Unified School District GO | 5.000% | 7/1/18 | 8,360 | 10,166 |
| Los Angeles CA Unified School District GO | 5.000% | 7/1/18 (2) | 4,000 | 4,617 |
| Los Angeles CA Unified School District GO | 5.000% | 7/1/18 (2) | 5,000 | 5,979 |
| Los Angeles CA Unified School District GO | 5.000% | 7/1/19 (3) | 5,000 | 5,442 |
| Los Angeles CA Unified School District GO | 5.000% | 7/1/19 (3) | 5,000 | 5,765 |
| Los Angeles CA Unified School District GO | 5.000% | 7/1/20 (3) | 10,000 | 11,504 |
| Los Angeles CA Unified School District GO | 5.000% | 7/1/20 (3) | 5,000 | 5,752 |
| Los Angeles CA Unified School District GO | 5.000% | 7/1/20 (2) | 14,135 | 16,261 |
| Los Angeles CA Unified School District GO | 5.000% | 7/1/21 (2) | 15,940 | 18,283 |
| Los Angeles CA Unified School District GO | 5.000% | 7/1/22 (2) | 16,760 | 19,137 |
| Los Angeles CA Unified School District GO | 4.500% | 7/1/23 (4) | 30,825 | 34,371 |
| Los Angeles CA Unified School District GO | 5.000% | 7/1/23 (2) | 6,000 | 6,957 |
| Los Angeles CA Unified School District GO | 5.000% | 7/1/23 (4) | 12,975 | 15,045 |
| Los Angeles CA Unified School District GO | 5.000% | 7/1/24 (4) | 17,210 | 19,956 |
| Los Angeles CA Unified School District GO | 5.000% | 7/1/25 (2) | 10,235 | 11,514 |
| Los Angeles CA Unified School District GO | 5.000% | 7/1/25 | 7,000 | 8,240 |
| Los Angeles CA Unified School District GO | 5.250% | 7/1/25 | 1,600 | 1,875 |
| Los Angeles CA Unified School District GO | 4.500% | 7/1/26 (2) | 10,000 | 10,987 |
| Los Angeles CA Unified School District GO | 5.000% | 7/1/26 | 5,710 | 6,530 |
| Los Angeles CA Unified School District GO | 5.000% | 7/1/27 | 1,595 | 1,809 |
| Los Angeles CA Unified School District GO | 5.000% | 7/1/27 | 8,375 | 9,712 |
| Los Angeles CA Unified School District GO | 4.500% | 1/1/28 (14) | 7,725 | 8,281 |
| Los Angeles CA Unified School District GO | 5.000% | 1/1/28 | 8,395 | 9,665 |
| Los Angeles CA Unified School District GO | 5.000% | 7/1/28 (2) | 7,845 | 8,605 |
| Los Angeles CA Unified School District GO | 5.250% | 7/1/28 | 5,000 | 5,822 |
| Los Angeles CA Unified School District GO | 5.000% | 7/1/30 (2) | 6,485 | 7,074 |
| Los Angeles CA Wastewater System Revenue | 5.000% | 6/1/20 | 3,000 | 3,733 |
| Los Angeles CA Wastewater System Revenue | 5.000% | 6/1/26 | 13,045 | 15,503 |
| Los Angeles CA Wastewater System Revenue | | | | |
| VRDO | 0.160% | 6/7/12 LOC | 28,600 | 28,600 |
| Los Angeles CA Wastewater System Revenue | | | | |
| VRDO | 0.160% | 6/7/12 LOC | 7,525 | 7,525 |
| Los Angeles County CA Capital Asset | | | | |
| Leasing Corp. Revenue | 6.000% | 12/1/13 (2) | 2,760 | 2,897 |
| Los Angeles County CA Metropolitan | | | | |
| Transportation Authority Sales | | | | |
| Tax Revenue | 4.000% | 7/1/13 | 3,910 | 4,072 |
| Los Angeles County CA Metropolitan | | | | |
| Transportation Authority Sales | | | | |
| Tax Revenue | 5.000% | 7/1/17 (4) | 10,000 | 10,515 |
| Los Angeles County CA Metropolitan | | | | |
| Transportation Authority Sales | | | | |
| Tax Revenue | 5.000% | 7/1/20 | 4,000 | 4,924 |
| Los Angeles County CA Metropolitan | | | | |
| Transportation Authority Sales | | | | |
| Tax Revenue | 5.000% | 7/1/22 | 10,000 | 12,556 |
| Los Angeles County CA Metropolitan | | | | |
| Transportation Authority Sales | | | | |
| Tax Revenue | 5.000% | 7/1/23 | 10,000 | 12,377 |
48
| | | | |
| California Intermediate-Term Tax-Exempt Fund | | | | |
| |
| |
| |
| | | | Face | Market |
| | | Maturity | Amount | Value |
| | Coupon | Date | ($000) | ($000) |
| 1 Los Angeles County CA Metropolitan | | | | |
| Transportation Authority Sales | | | | |
| Tax Revenue TOB VRDO | 0.200% | 6/1/12 | 1,600 | 1,600 |
| Los Angeles County CA Public Works | | | | |
| Financing Authority Lease Revenue | 5.000% | 12/1/14 (14) | 24,180 | 26,305 |
| Los Angeles County CA Public Works | | | | |
| Financing Authority Lease Revenue | 5.000% | 12/1/15 (14) | 8,940 | 9,977 |
| Los Angeles County CA Public Works | | | | |
| Financing Authority Lease Revenue | 5.000% | 12/1/19 (14) | 4,860 | 5,407 |
| Los Angeles County CA Public Works | | | | |
| Financing Authority Lease Revenue | 5.000% | 12/1/20 (14) | 5,000 | 5,563 |
| Los Angeles County CA Public Works | | | | |
| Financing Authority Lease Revenue | 5.000% | 12/1/21 (14) | 6,460 | 7,161 |
| Los Angeles County CA Public Works | | | | |
| Financing Authority Lease Revenue | 5.000% | 12/1/22 (14) | 6,790 | 7,527 |
| Los Angeles County CA Public Works | | | | |
| Financing Authority Lease Revenue | 5.000% | 12/1/23 (14) | 2,175 | 2,398 |
| Los Angeles County CA Public Works | | | | |
| Financing Authority Lease Revenue | 5.000% | 12/1/24 (14) | 3,095 | 3,412 |
| Los Angeles County CA Public Works | | | | |
| Financing Authority Revenue | | | | |
| (Regional Park & Open Space District) | 5.250% | 10/1/17 (4) | 1,000 | 1,225 |
| Los Angeles County CA Schools Regionalized | | | | |
| Business Services Corp. COP | 0.000% | 8/1/13 (ETM) | 2,010 | 1,935 |
| Los Angeles County CA Unified | | | | |
| School District GO | 5.000% | 7/1/21 | 12,500 | 15,536 |
| M-S-R California Energy Authority Revenue | 7.000% | 11/1/34 | 7,000 | 9,126 |
| Marysville CA Revenue (Fremont-Rideout | | | | |
| Health Group) | 5.250% | 1/1/23 | 500 | 566 |
| Marysville CA Revenue (Fremont-Rideout | | | | |
| Health Group) | 5.250% | 1/1/25 | 2,630 | 2,919 |
| Marysville CA Revenue (Fremont-Rideout | | | | |
| Health Group) | 5.250% | 1/1/28 | 1,500 | 1,624 |
| Metropolitan Water District of Southern | | | | |
| California Revenue | 5.000% | 10/1/26 | 6,000 | 7,310 |
| Metropolitan Water District of Southern | | | | |
| California Revenue | 5.000% | 10/1/30 | 8,585 | 10,296 |
| Metropolitan Water District of Southern | | | | |
| California Revenue | 5.000% | 1/1/31 | 1,150 | 1,297 |
| Metropolitan Water District of Southern | | | | |
| California Revenue | 5.000% | 7/1/31 | 2,930 | 3,366 |
| Metropolitan Water District of Southern | | | | |
| California Revenue | 5.000% | 10/1/31 | 11,065 | 13,207 |
| Metropolitan Water District of Southern | | | | |
| California Revenue | 5.000% | 10/1/32 | 9,965 | 11,819 |
| 3 Metropolitan Water District of Southern | | | | |
| California Revenue PUT | 0.530% | 5/1/15 | 10,000 | 10,000 |
| Metropolitan Water District of Southern | | | | |
| California Revenue VRDO | 0.150% | 6/1/12 | 6,300 | 6,300 |
| Modesto CA Irrigation District COP | 5.000% | 7/1/13 (Prere.) | 3,165 | 3,328 |
| Modesto CA Irrigation District COP | 5.000% | 10/1/21 (2) | 2,030 | 2,216 |
| Modesto CA Irrigation District COP | 5.000% | 10/1/22 (2) | 2,515 | 2,725 |
| Modesto CA Irrigation District COP | 5.000% | 10/1/23 (2) | 2,645 | 2,857 |
| Modesto CA Irrigation District COP | 5.000% | 7/1/27 | 3,855 | 4,171 |
| Modesto CA Irrigation District Financing Authority | | | | |
| Revenue (Domestic Water Project) | 5.125% | 9/1/15 (2) | 4,365 | 4,381 |
49
| | | | |
| California Intermediate-Term Tax-Exempt Fund | | | | |
| |
| |
| |
| | | | Face | Market |
| | | Maturity | Amount | Value |
| | Coupon | Date | ($000) | ($000) |
| 2 Mount Diablo CA Unified School District GO | 5.000% | 8/1/24 | 1,555 | 1,839 |
| New Haven CA Unified School District GO | 12.000% | 8/1/12 (ETM) | 600 | 612 |
| New Haven CA Unified School District GO | 12.000% | 8/1/15 (4) | 2,905 | 3,909 |
| Newport Beach CA Revenue (Hoag Memorial | | | | |
| Hospital Presbyterian) | 5.875% | 12/1/30 | 5,150 | 6,328 |
| Newport Beach CA Revenue (Hoag Memorial | | | | |
| Hospital Presbyterian) PUT | 5.000% | 2/7/13 | 5,000 | 5,152 |
| Newport Beach CA Revenue (Hoag Memorial | | | | |
| Hospital Presbyterian) VRDO | 0.160% | 6/7/12 LOC | 42,750 | 42,750 |
| Newport Mesa CA Unified School District GO | 0.000% | 8/1/29 | 4,000 | 1,889 |
| Newport Mesa CA Unified School District GO | 0.000% | 8/1/30 | 3,000 | 1,341 |
| Newport Mesa CA Unified School District GO | 0.000% | 8/1/31 | 1,500 | 633 |
| Newport Mesa CA Unified School District GO | 0.000% | 8/1/32 | 14,000 | 5,584 |
| Northern California Gas Authority No. 1 Revenue | 0.764% | 7/1/13 | 19,770 | 19,678 |
| Northern California Gas Authority No. 1 Revenue | 0.914% | 7/1/17 | 23,385 | 21,249 |
| Northern California Power Agency Capital | | | | |
| Facilities Revenue | 5.000% | 8/1/20 | 1,000 | 1,181 |
| Northern California Power Agency Revenue | | | | |
| (Hydroelectric Project) | 5.000% | 7/1/16 | 1,745 | 2,019 |
| Northern California Power Agency Revenue | | | | |
| (Hydroelectric Project) | 5.000% | 7/1/17 | 3,290 | 3,892 |
| Northern California Power Agency Revenue | | | | |
| (Hydroelectric Project) | 5.000% | 7/1/19 | 1,500 | 1,827 |
| Northern California Power Agency Revenue | | | | |
| (Hydroelectric Project) | 5.000% | 7/1/20 | 3,500 | 4,179 |
| Northern California Power Agency Revenue | | | | |
| (Hydroelectric Project) | 5.000% | 7/1/21 | 2,500 | 2,950 |
| Northern California Power Agency Revenue | | | | |
| (Hydroelectric Project) | 5.000% | 7/1/22 | 3,395 | 3,964 |
| Northern California Power Agency Revenue | | | | |
| (Hydroelectric Project) | 5.000% | 7/1/28 | 5,000 | 5,738 |
| Northern California Power Agency Revenue | | | | |
| (Hydroelectric Project) | 5.000% | 7/1/29 | 3,000 | 3,423 |
| Northern California Power Agency Revenue | | | | |
| (Hydroelectric Project) | 5.000% | 7/1/30 | 1,605 | 1,823 |
| Northern California Power Agency Revenue | | | | |
| (Hydroelectric Project) | 5.000% | 7/1/31 | 1,600 | 1,808 |
| Oakland CA GO | 5.000% | 1/15/31 | 3,000 | 3,318 |
| Oakland CA Joint Powers Financing Authority | | | | |
| Lease Revenue (Administration Buildings) | 5.000% | 8/1/23 (12) | 5,000 | 5,463 |
| Oakland CA Joint Powers Financing Authority | | | | |
| Lease Revenue (Administration Buildings) | 5.000% | 8/1/24 (12) | 3,695 | 4,025 |
| Oakland CA Joint Powers Financing Authority | | | | |
| Lease Revenue (Administration Buildings) | 5.000% | 8/1/25 (12) | 5,405 | 5,873 |
| Oakland CA Joint Powers Financing Authority | | | | |
| Lease Revenue (Administration Buildings) | 5.000% | 8/1/26 (12) | 4,190 | 4,545 |
| Oakland CA Joint Powers Financing Authority | | | | |
| Lease Revenue (Convention Center) | 5.500% | 10/1/12 (2) | 3,000 | 3,030 |
| Oakland CA Joint Powers Financing Authority | | | | |
| Lease Revenue (Convention Center) | 5.500% | 10/1/13 (2) | 1,500 | 1,556 |
| Oakland CA Redevelopment Agency Tax Allocation | | | | |
| Revenue (Central District Project) | 5.500% | 9/1/13 (14) | 3,990 | 4,097 |
| Oakland CA Redevelopment Agency Tax Allocation | | | | |
| Revenue (Central District Project) | 5.500% | 9/1/15 (14) | 3,790 | 3,914 |
| Oakland CA Redevelopment Agency Tax Allocation | | | | |
| Revenue (Central District Project) | 5.500% | 9/1/16 (14) | 6,210 | 6,411 |
50
| | | | |
| California Intermediate-Term Tax-Exempt Fund | | | | |
| |
| |
| |
| | | | Face | Market |
| | | Maturity | Amount | Value |
| | Coupon | Date | ($000) | ($000) |
| Oakland CA Redevelopment Agency Tax Allocation | | | | |
| Revenue (Central District Project) | 5.000% | 9/1/20 (2) | 12,870 | 13,089 |
| Oakland CA Unified School District GO | 5.000% | 8/1/19 (4) | 13,425 | 14,844 |
| Ohlone CA Community College District GO | 5.000% | 8/1/31 | 1,770 | 2,021 |
| Orange County CA Airport Revenue | 5.000% | 7/1/17 (4) | 1,725 | 1,800 |
| Orange County CA Development Agency Tax | | | | |
| Allocation Revenue | 5.250% | 9/1/14 (14) | 1,415 | 1,424 |
| Orange County CA Development Agency Tax | | | | |
| Allocation Revenue | 5.250% | 9/1/15 (14) | 1,485 | 1,494 |
| Orange County CA Development Agency Tax | | | | |
| Allocation Revenue | 5.375% | 9/1/16 (14) | 1,570 | 1,579 |
| Orange County CA Water District COP | 5.000% | 8/15/29 | 6,925 | 7,917 |
| Palm Springs CA Unified School District GO | 5.000% | 8/1/28 | 1,000 | 1,171 |
| Palm Springs CA Unified School District GO | 5.000% | 8/1/29 | 1,500 | 1,749 |
| Palm Springs CA Unified School District GO | 5.000% | 8/1/30 | 1,500 | 1,738 |
| Palm Springs CA Unified School District GO | 5.000% | 8/1/31 | 1,500 | 1,726 |
| Palo Alto CA Improvement Revenue | | | | |
| (University Avenue Area Parking) | 4.000% | 9/2/19 | 1,000 | 1,073 |
| Palo Alto CA Improvement Revenue | | | | |
| (University Avenue Area Parking) | 4.000% | 9/2/20 | 250 | 265 |
| Palo Alto CA Improvement Revenue | | | | |
| (University Avenue Area Parking) | 4.000% | 9/2/21 | 400 | 421 |
| Palo Alto CA Improvement Revenue | | | | |
| (University Avenue Area Parking) | 5.000% | 9/2/27 | 1,000 | 1,074 |
| Palo Alto CA Unified School District GO | 0.000% | 8/1/24 | 15,890 | 10,514 |
| Palomar Pomerado Health California COP | 6.625% | 11/1/29 | 5,000 | 5,570 |
| Palomar Pomerado Health System | | | | |
| California Revenue | 5.375% | 11/1/12 (14) | 7,080 | 7,092 |
| Pasadena CA Electric Revenue | 5.000% | 6/1/12 (Prere.) | 2,320 | 2,320 |
| Pasadena CA Electric Revenue | 5.000% | 6/1/12 (Prere.) | 2,535 | 2,535 |
| Pittsburg CA Redevelopment Agency Tax | | | | |
| Allocation Revenue (Los Medanos Community | | | | |
| Development Project) VRDO | 0.210% | 6/1/12 LOC | 5,400 | 5,400 |
| Pomona CA Single Family Mortgage Revenue | 7.600% | 5/1/23 (ETM) | 9,980 | 13,365 |
| Port of Oakland CA Revenue | 5.000% | 11/1/20 (14) | 4,825 | 5,343 |
| Port of Oakland CA Revenue | 5.000% | 11/1/26 (14) | 9,800 | 10,498 |
| 2 Poway CA Unified School District GO | 4.000% | 9/1/16 | 250 | 272 |
| Poway CA Unified School District GO | 0.000% | 8/1/17 | 2,000 | 1,813 |
| 2 Poway CA Unified School District GO | 4.000% | 9/1/17 | 250 | 273 |
| Poway CA Unified School District GO | 0.000% | 8/1/18 | 4,565 | 3,923 |
| 2 Poway CA Unified School District GO | 4.000% | 9/1/18 | 450 | 491 |
| Poway CA Unified School District GO | 0.000% | 8/1/19 | 5,425 | 4,404 |
| 2 Poway CA Unified School District GO | 5.000% | 9/1/19 | 1,015 | 1,169 |
| Poway CA Unified School District GO | 0.000% | 8/1/20 | 3,280 | 2,562 |
| 2 Poway CA Unified School District GO | 5.000% | 9/1/20 | 625 | 718 |
| 2 Poway CA Unified School District GO | 5.000% | 9/1/21 | 325 | 371 |
| 2 Poway CA Unified School District GO | 5.000% | 9/1/22 | 460 | 522 |
| 2 Poway CA Unified School District GO | 5.000% | 9/1/23 | 1,575 | 1,744 |
| Poway CA Unified School District GO | 5.000% | 8/1/26 | 5,125 | 6,092 |
| 2 Poway CA Unified School District GO | 5.000% | 9/1/26 | 1,000 | 1,084 |
| Poway CA Unified School District GO | 0.000% | 8/1/28 | 9,070 | 4,355 |
| 2 Poway CA Unified School District GO | 5.000% | 9/1/29 | 1,210 | 1,289 |
| 2 Poway CA Unified School District GO | 5.000% | 9/1/30 | 2,570 | 2,722 |
| Rancho Cucamonga CA Redevelopment | | | | |
| Agency Tax Allocation Revenue | | | | |
| (Rancho Redevelopment Project) | 5.000% | 9/1/15 (2) | 2,835 | 3,083 |
51
| | | | |
| California Intermediate-Term Tax-Exempt Fund | | | | |
| |
| |
| |
| | | | Face | Market |
| | | Maturity | Amount | Value |
| | Coupon | Date | ($000) | ($000) |
| Rancho Cucamonga CA Redevelopment | | | | |
| Agency Tax Allocation Revenue | | | | |
| (Rancho Redevelopment Project) | 5.000% | 9/1/16 (2) | 5,100 | 5,521 |
| Rancho Mirage CA Joint Powers Financing | | | | |
| Authority Revenue | | | | |
| (Eisenhower Medical Center) | 5.000% | 7/1/27 | 12,000 | 12,305 |
| Riverside CA Electric Revenue | 5.000% | 10/1/24 (4) | 1,000 | 1,135 |
| Riverside CA Electric Revenue | 5.000% | 10/1/25 (4) | 2,000 | 2,251 |
| Riverside CA Electric Revenue | 5.000% | 10/1/26 (4) | 2,500 | 2,797 |
| Riverside CA Electric Revenue | 5.000% | 10/1/27 (4) | 3,570 | 3,979 |
| 1 Riverside CA Electric Revenue TOB VRDO | 0.200% | 6/1/12 | 3,995 | 3,995 |
| Riverside CA Electric Revenue VRDO | 0.170% | 6/7/12 LOC | 12,200 | 12,200 |
| Riverside County CA Transportation | | | | |
| Commission Sales Tax Revenue VRDO | 0.160% | 6/7/12 | 2,025 | 2,025 |
| Rocklin CA Unified School District GO | 0.000% | 8/1/23 (14) | 7,030 | 4,603 |
| Rocklin CA Unified School District GO | 0.000% | 8/1/24 (14) | 2,965 | 1,842 |
| Roseville CA Electric System Revenue | 5.000% | 2/1/30 | 6,120 | 6,776 |
| Roseville CA Natural Gas Financing Authority | | | | |
| Gas Revenue | 5.000% | 2/15/18 | 4,180 | 4,547 |
| Roseville CA Natural Gas Financing Authority | | | | |
| Gas Revenue | 5.000% | 2/15/19 | 10,000 | 10,867 |
| Roseville CA Natural Gas Financing Authority | | | | |
| Gas Revenue | 5.000% | 2/15/20 | 2,000 | 2,160 |
| Sacramento CA Cogeneration Authority Revenue | 5.000% | 7/1/17 | 1,250 | 1,465 |
| Sacramento CA Cogeneration Authority Revenue | 5.000% | 7/1/18 | 725 | 863 |
| Sacramento CA Cogeneration Authority Revenue | 5.000% | 7/1/19 | 1,155 | 1,391 |
| Sacramento CA Cogeneration Authority Revenue | 5.250% | 7/1/20 | 1,250 | 1,533 |
| Sacramento CA Cogeneration Authority Revenue | 5.250% | 7/1/21 | 1,000 | 1,235 |
| Sacramento CA Financing Authority | | | | |
| Lease Revenue | 5.375% | 12/1/12 (Prere.) | 4,395 | 4,509 |
| Sacramento CA Financing Authority | | | | |
| Lease Revenue | 5.000% | 11/1/14 (14) | 2,235 | 2,321 |
| Sacramento CA Financing Authority | | | | |
| Lease Revenue | 5.375% | 12/1/14 (4) | 1,630 | 1,669 |
| Sacramento CA Financing Authority | | | | |
| Lease Revenue | 5.000% | 12/1/19 (14) | 12,860 | 14,198 |
| Sacramento CA Financing Authority | | | | |
| Lease Revenue | 5.000% | 12/1/20 (14) | 13,670 | 14,973 |
| Sacramento CA Municipal Utility District | | | | |
| Financing Authority Revenue | 5.000% | 7/1/21 (14) | 7,710 | 8,358 |
| Sacramento CA Municipal Utility District Revenue | 5.000% | 7/1/17 (14) | 4,000 | 4,434 |
| Sacramento CA Municipal Utility District Revenue | 5.250% | 7/1/24 (2) | 10,085 | 12,490 |
| Sacramento CA Municipal Utility District Revenue | 5.000% | 8/15/24 (4) | 7,550 | 8,690 |
| Sacramento CA Municipal Utility District Revenue | 5.000% | 8/15/24 | 2,660 | 3,204 |
| Sacramento CA Municipal Utility District Revenue | 5.000% | 8/15/25 (4) | 15,275 | 17,420 |
| Sacramento CA Municipal Utility District Revenue | 5.000% | 8/15/25 | 5,455 | 6,497 |
| Sacramento CA Municipal Utility District Revenue | 5.000% | 8/15/26 (4) | 5,000 | 5,669 |
| Sacramento CA Municipal Utility District Revenue | 5.000% | 8/15/30 | 6,435 | 7,406 |
| Sacramento CA Municipal Utility District Revenue | | | | |
| VRDO | 0.150% | 6/7/12 LOC | 5,000 | 5,000 |
| Sacramento CA Transportation Authority Sales | | | | |
| Tax Revenue VRDO | 0.120% | 6/7/12 | 2,400 | 2,400 |
| Sacramento County CA Airport Revenue | 5.000% | 7/1/23 (4) | 2,000 | 2,252 |
| Sacramento County CA Airport Revenue | 5.000% | 7/1/24 (4) | 2,500 | 2,796 |
| Sacramento County CA Airport Revenue | 5.000% | 7/1/24 (4) | 1,785 | 2,014 |
| Sacramento County CA Airport Revenue | 5.000% | 7/1/28 | 1,250 | 1,402 |
52
| | | | |
| California Intermediate-Term Tax-Exempt Fund | | | | |
| |
| |
| |
| | | | Face | Market |
| | | Maturity | Amount | Value |
| | Coupon | Date | ($000) | ($000) |
| Sacramento County CA Airport Revenue | 5.000% | 7/1/30 | 3,615 | 4,021 |
| Sacramento County CA Sanitation Districts | | | | |
| Financing Authority Revenue | 5.000% | 12/1/21 (14) | 1,850 | 2,112 |
| Sacramento County CA Sanitation Districts | | | | |
| Financing Authority Revenue | 5.000% | 12/1/22 (14) | 5,495 | 6,274 |
| Sacramento County CA Sanitation Districts | | | | |
| Financing Authority Revenue | 5.000% | 12/1/23 (14) | 7,030 | 8,009 |
| Sacramento County CA Water Financing | | | | |
| Authority Revenue (Agency Zones 40 & 41) | 5.000% | 6/1/13 (Prere.) | 1,235 | 1,294 |
| San Bernardino County CA Justice Center & | | | | |
| Airport COP | 5.000% | 7/1/14 (14) | 5,585 | 5,862 |
| San Bernardino County CA Medical Center COP | 5.500% | 8/1/17 (14) | 4,140 | 4,350 |
| San Bernardino County CA Medical Center COP | 6.500% | 8/1/17 (14) | 4,420 | 4,758 |
| San Bernardino County CA Medical Center COP | 5.500% | 8/1/22 (14) | 8,940 | 10,257 |
| San Bernardino County CA Transportation | | | | |
| Authority Revenue | 5.000% | 3/1/31 | 3,355 | 3,909 |
| 1 San Bernardino County CA Transportation | | | | |
| Authority Sales Tax Revenue TOB VRDO | 0.200% | 6/7/12 | 7,997 | 7,997 |
| San Diego CA Community College District GO | 5.000% | 8/1/23 | 10,000 | 12,702 |
| San Diego CA Community College District GO | 5.000% | 8/1/28 | 4,000 | 4,789 |
| San Diego CA Community College District GO | 5.000% | 8/1/29 | 5,000 | 5,844 |
| San Diego CA Community College District GO | 5.000% | 8/1/30 | 8,670 | 10,058 |
| San Diego CA Community College District GO | 5.000% | 8/1/30 | 9,830 | 11,404 |
| San Diego CA Community College District GO | 5.000% | 8/1/31 | 3,380 | 3,903 |
| San Diego CA Community College District GO | 5.000% | 8/1/32 | 2,000 | 2,305 |
| 1 San Diego CA Community College District GO | | | | |
| TOB VRDO | 0.180% | 6/7/12 | 3,290 | 3,290 |
| San Diego CA Financing Authority Lease Revenue | 5.250% | 4/1/14 (2) | 5,680 | 5,696 |
| San Diego CA Public Facilities Financing | | | | |
| Authority Sewer Revenue | 5.000% | 5/15/24 | 3,000 | 3,563 |
| San Diego CA Public Facilities Financing | | | | |
| Authority Sewer Revenue | 5.250% | 5/15/25 | 2,000 | 2,390 |
| San Diego CA Public Facilities Financing | | | | |
| Authority Sewer Revenue | 5.000% | 5/15/27 | 6,000 | 6,994 |
| San Diego CA Public Facilities Financing | | | | |
| Authority Sewer Revenue | 5.250% | 5/15/27 | 5,000 | 5,962 |
| San Diego CA Public Facilities Financing | | | | |
| Authority Sewer Revenue | 5.000% | 5/15/28 | 1,825 | 2,103 |
| San Diego CA Public Facilities Financing | | | | |
| Authority Water Revenue | 5.000% | 8/1/27 | 4,215 | 4,911 |
| San Diego CA Public Facilities Financing | | | | |
| Authority Water Revenue | 5.125% | 8/1/28 | 5,000 | 5,853 |
| San Diego CA Public Facilities Financing | | | | |
| Authority Water Revenue | 5.250% | 8/1/28 | 5,355 | 6,368 |
| San Diego CA Unified School District GO | 0.000% | 7/1/14 (14) | 3,400 | 3,344 |
| San Diego CA Unified School District GO | 0.000% | 7/1/18 (14) | 9,500 | 8,133 |
| San Diego CA Unified School District GO | 5.500% | 7/1/20 (4) | 9,490 | 12,112 |
| San Diego CA Unified School District GO | 5.500% | 7/1/22 (4) | 12,790 | 16,554 |
| San Diego CA Unified School District GO | 5.500% | 7/1/23 (4) | 4,210 | 5,454 |
| San Diego CA Unified School District GO | 0.000% | 7/1/26 | 8,425 | 4,545 |
| San Diego CA Unified School District GO | 5.500% | 7/1/26 (4) | 7,490 | 9,723 |
| San Diego CA Unified School District GO | 0.000% | 7/1/27 | 8,500 | 4,338 |
| San Diego CA Unified School District GO | 0.000% | 7/1/28 | 8,000 | 3,802 |
| San Diego CA Unified School District GO | 0.000% | 7/1/29 | 3,250 | 1,457 |
| San Diego CA Unified School District GO | 0.000% | 7/1/30 | 9,985 | 4,235 |
| San Diego CA Unified School District GO | 0.000% | 7/1/30 | 2,500 | 1,060 |
53
| | | | |
| California Intermediate-Term Tax-Exempt Fund | | | | |
| |
| |
| |
| | | | Face | Market |
| | | Maturity | Amount | Value |
| | Coupon | Date | ($000) | ($000) |
| San Diego County CA COP | 5.000% | 2/1/22 (2) | 2,000 | 2,179 |
| San Diego County CA COP VRDO | 0.250% | 6/7/12 LOC | 14,970 | 14,970 |
| San Diego County CA Regional Airport | | | | |
| Authority Revenue | 5.000% | 7/1/25 | 9,000 | 10,343 |
| San Diego County CA Regional Airport | | | | |
| Authority Revenue | 5.000% | 7/1/26 | 3,000 | 3,409 |
| San Diego County CA Regional Airport | | | | |
| Authority Revenue | 5.000% | 7/1/28 | 3,000 | 3,359 |
| San Diego County CA Regional Building | | | | |
| Authority Lease Revenue (County Operations | | | | |
| Center & Annex Redevelopment Project) | 5.000% | 2/1/23 | 4,285 | 4,903 |
| San Diego County CA Regional Building | | | | |
| Authority Lease Revenue (County Operations | | | | |
| Center & Annex Redevelopment Project) | 5.000% | 2/1/25 | 4,820 | 5,416 |
| San Diego County CA Regional Building | | | | |
| Authority Lease Revenue (County Operations | | | | |
| Center & Annex Redevelopment Project) | 5.250% | 2/1/26 | 1,140 | 1,290 |
| San Diego County CA Regional Building | | | | |
| Authority Lease Revenue (County Operations | | | | |
| Center & Annex Redevelopment Project) | 5.000% | 2/1/27 | 2,420 | 2,683 |
| San Diego County CA Regional Building | | | | |
| Authority Lease Revenue (County Operations | | | | |
| Center & Annex Redevelopment Project) | 5.500% | 2/1/28 | 5,780 | 6,565 |
| San Diego County CA Water Authority | | | | |
| Financing Agency Water Revenue | 5.000% | 5/1/27 | 2,000 | 2,317 |
| San Diego County CA Water Authority Revenue | 5.000% | 5/1/30 | 5,000 | 5,794 |
| San Diego County CA Water Authority Revenue | | | | |
| COP | 5.250% | 5/1/15 (14) | 6,215 | 7,020 |
| San Diego County CA Water Authority Revenue | | | | |
| COP | 5.250% | 5/1/16 (14) | 7,880 | 9,196 |
| San Diego County CA Water Authority Revenue | | | | |
| COP | 5.250% | 5/1/21 (14) | 6,725 | 8,546 |
| San Diego County CA Water Authority Revenue | | | | |
| COP | 5.250% | 5/1/22 (14) | 7,075 | 9,049 |
| San Francisco CA Bay Area Rapid Transit | | | | |
| District Sales Tax Revenue | 5.000% | 7/1/23 | 9,560 | 11,446 |
| San Francisco CA City & County | | | | |
| (Laguna Honda Hospital) GO | 5.000% | 6/15/12 (Prere.) | 8,000 | 8,175 |
| San Francisco CA City & County GO | 5.000% | 6/15/21 | 7,450 | 9,363 |
| San Francisco CA City & County GO | 5.000% | 6/15/22 | 2,595 | 3,239 |
| San Francisco CA City & County GO | 5.000% | 6/15/23 | 4,000 | 4,918 |
| San Francisco CA City & County | | | | |
| International Airport Revenue | 5.250% | 5/1/20 (14) | 5,000 | 6,168 |
| San Francisco CA City & County | | | | |
| International Airport Revenue | 5.000% | 5/1/21 | 5,000 | 5,987 |
| San Francisco CA City & County | | | | |
| International Airport Revenue | 5.000% | 5/1/22 | 5,000 | 5,899 |
| San Francisco CA City & County | | | | |
| International Airport Revenue | 5.000% | 5/1/24 (14) | 10,000 | 11,173 |
| San Francisco CA City & County | | | | |
| International Airport Revenue | 5.000% | 5/1/25 (14) | 2,000 | 2,235 |
| San Francisco CA City & County | | | | |
| International Airport Revenue | 5.250% | 5/1/26 | 22,000 | 25,474 |
| San Francisco CA City & County | | | | |
| International Airport Revenue | 5.000% | 5/1/27 (14) | 13,075 | 14,587 |
54
| | | | |
| California Intermediate-Term Tax-Exempt Fund | | | | |
| |
| |
| |
| | | | Face | Market |
| | | Maturity | Amount | Value |
| | Coupon | Date | ($000) | ($000) |
| San Francisco CA City & County | | | | |
| International Airport Revenue | 5.000% | 5/1/28 | 7,500 | 8,674 |
| San Francisco CA City & County | | | | |
| International Airport Revenue | 5.000% | 5/1/30 | 5,940 | 6,724 |
| San Francisco CA City & County Public Utilities | | | | |
| Commission Water Revenue | 5.000% | 11/1/12 (Prere.) | 4,865 | 4,962 |
| San Francisco CA City & County Public Utilities | | | | |
| Commission Water Revenue | 5.000% | 11/1/26 | 2,995 | 3,515 |
| San Francisco CA City & County Public Utilities | | | | |
| Commission Water Revenue | 5.000% | 11/1/28 | 1,000 | 1,163 |
| San Francisco CA City & County Public Utilities | | | | |
| Commission Water Revenue | 5.000% | 11/1/29 | 2,960 | 3,423 |
| San Francisco CA City & County Public Utilities | | | | |
| Commission Water Revenue | 5.000% | 11/1/29 | 10,000 | 11,565 |
| San Francisco CA City & County Public Utilities | | | | |
| Commission Water Revenue | 5.000% | 11/1/29 | 11,000 | 12,793 |
| San Francisco CA City & County Public Utilities | | | | |
| Commission Water Revenue | 5.000% | 11/1/30 | 2,705 | 3,117 |
| San Francisco CA City & County Public Utilities | | | | |
| Commission Water Revenue | 5.000% | 11/1/30 | 10,335 | 11,955 |
| San Francisco CA City & County Public Utilities | | | | |
| Commission Water Revenue | 5.000% | 11/1/31 (4) | 8,600 | 8,623 |
| 2 San Francisco CA City & County Public Utilities | | | | |
| Commission Water Revenue | 5.000% | 11/1/31 | 5,730 | 6,548 |
| San Francisco CA City & County Unified | | | | |
| School District GO | 5.000% | 6/15/31 | 7,965 | 9,077 |
| San Joaquin County CA Delta Community | | | | |
| College District Election GO | 0.000% | 8/1/26 (4) | 15,500 | 7,474 |
| San Joaquin County CA Delta Community | | | | |
| College District Election GO | 0.000% | 8/1/27 (4) | 15,500 | 6,957 |
| San Joaquin Hills CA Transportation Corridor | | | | |
| Agency Toll Road Revenue | 0.000% | 1/15/14 (14) | 5,500 | 5,153 |
| San Joaquin Hills CA Transportation Corridor | | | | |
| Agency Toll Road Revenue | 0.000% | 1/1/23 (ETM) | 16,000 | 12,587 |
| San Joaquin Hills CA Transportation Corridor | | | | |
| Agency Toll Road Revenue | 0.000% | 1/15/24 (14) | 7,000 | 3,581 |
| San Joaquin Hills CA Transportation Corridor | | | | |
| Agency Toll Road Revenue | 0.000% | 1/1/25 (ETM) | 17,750 | 12,936 |
| San Joaquin Hills CA Transportation Corridor | | | | |
| Agency Toll Road Revenue | 0.000% | 1/1/26 (ETM) | 9,350 | 6,557 |
| San Jose CA Airport Revenue | 5.375% | 3/1/13 (4) | 4,945 | 5,005 |
| San Jose CA Airport Revenue | 5.375% | 3/1/14 (4) | 7,550 | 7,640 |
| San Jose CA Airport Revenue | 5.375% | 3/1/15 (4) | 7,950 | 8,040 |
| San Jose CA Airport Revenue | 5.000% | 3/1/24 (2) | 2,035 | 2,206 |
| San Jose CA Airport Revenue | 5.000% | 3/1/25 (2) | 3,385 | 3,645 |
| San Jose CA Airport Revenue | 5.000% | 3/1/26 (2) | 3,850 | 4,131 |
| San Jose CA Financing Authority Lease Revenue | 5.000% | 9/1/13 (14) | 9,570 | 9,604 |
| San Jose CA Redevelopment Agency Tax | | | | |
| Allocation Revenue | 5.250% | 8/1/13 (14) | 5,000 | 5,166 |
| San Jose CA Redevelopment Agency Tax | | | | |
| Allocation Revenue | 5.250% | 8/1/14 (14) | 5,000 | 5,271 |
| San Jose CA Redevelopment Agency Tax | | | | |
| Allocation Revenue | 5.000% | 8/1/21 | 1,270 | 1,344 |
| San Jose CA Redevelopment Agency Tax | | | | |
| Allocation Revenue | 5.000% | 8/1/23 | 1,140 | 1,176 |
55
| | | | |
| California Intermediate-Term Tax-Exempt Fund | | | | |
| |
| |
| |
| | | | Face | Market |
| | | Maturity | Amount | Value |
| | Coupon | Date | ($000) | ($000) |
| San Jose CA Redevelopment Agency Tax | | | | |
| Allocation Revenue | 5.000% | 8/1/24 (14) | 16,360 | 16,567 |
| San Jose CA Redevelopment Agency Tax | | | | |
| Allocation Revenue | 5.000% | 8/1/25 (14) | 11,505 | 11,703 |
| San Jose CA Redevelopment Agency Tax | | | | |
| Allocation Revenue | 5.125% | 8/1/25 | 570 | 583 |
| San Jose CA Redevelopment Agency Tax | | | | |
| Allocation Revenue | 5.250% | 8/1/26 | 800 | 833 |
| San Jose CA Redevelopment Agency Tax | | | | |
| Allocation Revenue | 5.375% | 8/1/29 | 1,355 | 1,401 |
| 1 San Marcos CA Public Facilities Authority Tax | | | | |
| Allocation Revenue TOB VRDO | 0.170% | 6/1/12 LOC | 7,790 | 7,790 |
| San Marcos CA Unified School District GO | 0.000% | 8/1/30 | 2,000 | 828 |
| San Marcos CA Unified School District GO | 0.000% | 8/1/31 | 2,000 | 779 |
| San Marcos CA Unified School District GO | 0.000% | 8/1/32 | 2,500 | 916 |
| San Mateo CA Union High School District GO | 0.000% | 9/1/13 (14) | 1,715 | 1,706 |
| San Mateo CA Union High School District GO | 0.000% | 9/1/14 (14) | 1,500 | 1,477 |
| San Mateo County CA Community College | | | | |
| District GO | 5.375% | 9/1/12 (Prere.) | 1,300 | 1,317 |
| San Mateo County CA Community College | | | | |
| District GO | 0.000% | 9/1/21 (14) | 4,645 | 3,496 |
| San Mateo County CA Community College | | | | |
| District GO | 0.000% | 9/1/22 (14) | 5,675 | 4,053 |
| San Mateo County CA Community College | | | | |
| District GO | 0.000% | 9/1/24 (14) | 2,825 | 1,823 |
| San Mateo County CA Community College | | | | |
| District GO | 0.000% | 9/1/25 (14) | 4,000 | 2,420 |
| San Mateo County CA Community College | | | | |
| District GO | 5.000% | 9/1/26 | 3,170 | 3,618 |
| 1 San Mateo County CA Community College | | | | |
| District GO TOB VRDO | 0.200% | 6/7/12 | 7,565 | 7,565 |
| 1 San Mateo County CA Community College | | | | |
| District GO TOB VRDO | 0.240% | 6/7/12 | 10,280 | 10,280 |
| San Mateo County CA Joint Powers | | | | |
| Financing Authority Lease Revenue | | | | |
| (Youth Services Campus) | 4.625% | 7/15/25 | 2,455 | 2,663 |
| San Mateo County CA Joint Powers | | | | |
| Financing Authority Lease Revenue | | | | |
| (Youth Services Campus) | 5.250% | 7/15/28 | 2,000 | 2,243 |
| Santa Ana CA Community Redevelopment | | | | |
| Agency Tax Allocation Revenue | | | | |
| (South Main Street) | 5.000% | 9/1/18 (14) | 2,685 | 2,735 |
| Santa Clara CA Electric Revenue | 5.250% | 7/1/18 (14) | 1,720 | 1,808 |
| Santa Clara CA Electric Revenue | 5.000% | 7/1/30 | 1,000 | 1,118 |
| Santa Clara CA Electric Revenue | 5.250% | 7/1/32 | 2,500 | 2,821 |
| Santa Clara CA Unified School District GO | 5.000% | 7/1/28 | 3,775 | 4,366 |
| Santa Clara CA Unified School District GO | 5.000% | 7/1/29 | 4,115 | 4,743 |
| Santa Clara CA Unified School District GO | 5.000% | 7/1/30 | 4,405 | 5,043 |
| Santa Clara CA Unified School District GO | 5.000% | 7/1/31 | 4,715 | 5,366 |
| Santa Clara County CA Financing Authority | | | | |
| Lease Revenue (Multiple Facilities Projects) | 5.000% | 11/15/17 | 11,540 | 13,751 |
| Santa Clara County CA Financing Authority | | | | |
| Lease Revenue (Multiple Facilities Projects) | 5.000% | 11/15/18 | 7,920 | 9,584 |
| Santa Clara County CA Financing Authority | | | | |
| Lease Revenue (Multiple Facilities Projects) | 5.000% | 5/15/28 | 10,000 | 10,980 |
56
| | | | |
| California Intermediate-Term Tax-Exempt Fund | | | | |
| |
| |
| |
| | | | Face | Market |
| | | Maturity | Amount | Value |
| | Coupon | Date | ($000) | ($000) |
| Santa Clara County CA Financing Authority | | | | |
| Lease Revenue (VMC Facility Replacement | | | | |
| Project) VRDO | 0.170% | 6/7/12 | 20,600 | 20,600 |
| Santa Clara Valley CA Transportation Authority | | | | |
| Sales Tax Revenue | 5.000% | 4/1/32 (2) | 4,000 | 4,472 |
| Santa Clara Valley CA Transportation Authority | | | | |
| Sales Tax Revenue VRDO | 0.130% | 6/7/12 | 5,415 | 5,415 |
| Santa Clara Valley CA Transportation Authority | | | | |
| Sales Tax Revenue VRDO | 0.150% | 6/7/12 | 10,000 | 10,000 |
| Santa Clarita CA Community College District GO | 5.000% | 8/1/32 | 5,450 | 6,244 |
| Santa Monica CA Community College District GO | 0.000% | 8/1/26 | 11,025 | 6,213 |
| Santa Rosa CA Wastewater Revenue | 0.000% | 9/1/28 (4) | 11,095 | 5,190 |
| 2 Santa Rosa CA Wastewater Revenue | 5.000% | 9/1/29 | 2,870 | 3,280 |
| 2 Santa Rosa CA Wastewater Revenue | 5.000% | 9/1/30 | 3,055 | 3,478 |
| Simi Valley CA Unified School District GO | 0.000% | 8/1/26 (4) | 3,030 | 1,670 |
| Simi Valley CA Unified School District GO | 0.000% | 8/1/27 (4) | 2,900 | 1,492 |
| Solano County CA COP | 5.000% | 11/1/17 (14) | 4,110 | 4,774 |
| Solano County CA COP | 5.000% | 11/1/18 (14) | 3,810 | 4,352 |
| Solano County CA COP | 5.000% | 11/1/19 (14) | 3,995 | 4,534 |
| Solano County CA COP | 5.000% | 11/1/20 (14) | 4,195 | 4,706 |
| Solano County CA COP | 5.000% | 11/1/21 (14) | 4,405 | 4,901 |
| Sonoma-Marin Area Rail Transportation District | | | | |
| California Sales & Use Tax Revenue | 5.000% | 3/1/21 | 1,750 | 2,183 |
| Sonoma-Marin Area Rail Transportation District | | | | |
| California Sales & Use Tax Revenue | 5.000% | 3/1/22 | 3,000 | 3,764 |
| South Orange County CA Public Financing | | | | |
| Authority Special Tax Revenue | 5.375% | 8/15/12 (4) | 5,605 | 5,628 |
| South Orange County CA Public Financing | | | | |
| Authority Special Tax Revenue | | | | |
| (Portola Hills/Lomas Laguna) | 5.250% | 8/15/13 (2) | 2,290 | 2,295 |
| South San Francisco CA Redevelopment | | | | |
| Agency Tax Allocation Revenue | 5.000% | 9/1/31 (14) | 7,255 | 7,427 |
| Southern California Public Power Authority | | | | |
| Revenue | 5.000% | 7/1/28 | 10,000 | 11,503 |
| Southern California Public Power Authority | | | | |
| Revenue | 5.000% | 7/1/29 | 5,000 | 5,709 |
| Southern California Public Power Authority | | | | |
| Revenue | 5.000% | 7/1/30 | 10,750 | 12,217 |
| Southern California Public Power Authority | | | | |
| Revenue (Canyon Power Project) | 5.250% | 7/1/27 | 6,950 | 8,173 |
| Southern California Public Power Authority | | | | |
| Revenue (Linden Wind Energy Project) | 5.000% | 7/1/28 | 3,500 | 4,032 |
| Southern California Public Power Authority | | | | |
| Revenue (Linden Wind Energy Project) | 5.000% | 7/1/29 | 2,500 | 2,864 |
| Southern California Public Power Authority | | | | |
| Revenue (Linden Wind Energy Project) | 5.000% | 7/1/30 | 2,500 | 2,851 |
| Southern California Public Power Authority | | | | |
| Revenue (Mead-Adelanto Project) VRDO | 0.180% | 6/1/12 | 8,900 | 8,900 |
| Southern California Public Power Authority | | | | |
| Revenue (Milford Wind Corridor Phase I Project) | 5.000% | 7/1/28 | 5,000 | 5,717 |
| Southern California Public Power Authority | | | | |
| Revenue (Milford Wind Corridor Phase I Project) | 5.000% | 7/1/29 | 5,000 | 5,688 |
| Southern California Public Power Authority | | | | |
| Revenue (Natural Gas Project) | 5.000% | 11/1/18 | 1,040 | 1,123 |
| Southern California Public Power Authority | | | | |
| Revenue (Natural Gas Project) | 5.250% | 11/1/23 | 5,250 | 5,781 |
57
| | | | |
| California Intermediate-Term Tax-Exempt Fund | | | | |
| |
| |
| |
| | | | Face | Market |
| | | Maturity | Amount | Value |
| | Coupon | Date | ($000) | ($000) |
| Southern California Public Power Authority | | | | |
| Revenue (Natural Gas Project) | 5.250% | 11/1/24 | 5,000 | 5,437 |
| Southern California Public Power Authority | | | | |
| Revenue (Natural Gas Project) | 5.250% | 11/1/25 | 7,000 | 7,588 |
| Southern California Public Power Authority | | | | |
| Revenue (Natural Gas Project) | 5.250% | 11/1/26 | 2,500 | 2,679 |
| Southern California Public Power Authority | | | | |
| Revenue (San Juan Unit 3) | 5.500% | 1/1/13 (4) | 3,500 | 3,607 |
| Southern California Public Power Authority | | | | |
| Revenue (Transmission Project) | 5.000% | 7/1/23 | 5,000 | 5,814 |
| 1 Sweetwater CA Unified School District GO | | | | |
| TOB VRDO | 0.200% | 6/7/12 (13) | 3,300 | 3,300 |
| Tobacco Securitization Authority Revenue | | | | |
| (Southern California Tobacco Settlement) | 4.750% | 6/1/25 | 5,725 | 5,605 |
| 1 Torrance CA Hospital Revenue | | | | |
| (Torrance Memorial Medical Center) | | | | |
| TOB VRDO | 0.200% | 6/7/12 LOC | 2,000 | 2,000 |
| Tulare County CA COP | 5.000% | 8/15/15 (14) | 6,460 | 7,132 |
| Turlock CA Irrigation District Revenue | 5.000% | 1/1/21 | 3,805 | 4,516 |
| Turlock CA Irrigation District Revenue | 5.000% | 1/1/22 | 5,415 | 6,304 |
| Turlock CA Irrigation District Revenue | 5.000% | 1/1/28 | 7,020 | 7,697 |
| Turlock CA Irrigation District Revenue | 5.000% | 1/1/29 | 6,400 | 7,017 |
| Turlock CA Irrigation District Revenue | 5.000% | 1/1/30 | 7,770 | 8,477 |
| University of California Regents Medical | | | | |
| Center Revenue | 5.000% | 5/15/19 (14) | 5,075 | 5,718 |
| University of California Regents | | | | |
| Medical Center Revenue | 5.000% | 5/15/20 (14) | 5,065 | 5,707 |
| University of California Regents | | | | |
| Medical Center Revenue | 5.000% | 5/15/25 | 19,385 | 21,955 |
| University of California Regents | | | | |
| Medical Center Revenue | 5.000% | 5/15/26 | 10,095 | 11,434 |
| University of California Revenue | 5.000% | 5/15/17 (4) | 20,620 | 23,330 |
| University of California Revenue | 5.000% | 5/15/18 (4) | 10,000 | 11,286 |
| University of California Revenue | 5.000% | 5/15/19 (4) | 4,275 | 4,817 |
| University of California Revenue | 5.000% | 5/15/20 (4) | 30,900 | 34,815 |
| University of California Revenue | 5.000% | 5/15/21 (4) | 14,915 | 16,805 |
| University of California Revenue | 5.000% | 5/15/22 | 5,420 | 6,649 |
| University of California Revenue | 4.750% | 5/15/23 (14) | 11,185 | 11,335 |
| University of California Revenue | 5.750% | 5/15/25 | 3,000 | 3,672 |
| University of California Revenue | 4.750% | 5/15/26 | 21,320 | 22,200 |
| University of California Revenue | 5.000% | 5/15/26 (14) | 10,000 | 11,305 |
| University of California Revenue | 5.000% | 5/15/27 | 10,900 | 12,746 |
| University of California Revenue | 5.000% | 5/15/28 | 11,680 | 13,582 |
| 1 University of California Revenue TOB VRDO | 0.200% | 6/1/12 | 19,895 | 19,895 |
| 1 University of California Revenue TOB VRDO | 0.250% | 6/7/12 | 7,330 | 7,330 |
| Ventura County CA Community College | | | | |
| District GO | 5.000% | 8/1/12 (Prere.) | 2,030 | 2,067 |
| Ventura County CA Community College | | | | |
| District GO | 5.000% | 8/1/12 (Prere.) | 2,740 | 2,789 |
| Ventura County CA Community College | | | | |
| District GO | 5.000% | 8/1/16 (14) | 360 | 366 |
| Ventura County CA Community College | | | | |
| District GO | 5.000% | 8/1/17 (14) | 270 | 275 |
| Ventura County CA Community College | | | | |
| District GO | 5.000% | 8/1/24 | 1,210 | 1,480 |
58
| | | | |
| California Intermediate-Term Tax-Exempt Fund | | | | |
| |
| |
| |
| | | | Face | Market |
| | | Maturity | Amount | Value |
| | Coupon | Date | ($000) | ($000) |
| Ventura County CA Community College | | | | |
| District GO | 5.000% | 8/1/25 | 1,915 | 2,312 |
| Ventura County CA Community College | | | | |
| District GO | 5.000% | 8/1/27 | 2,205 | 2,624 |
| Ventura County CA Community College | | | | |
| District GO | 0.000% | 8/1/28 | 15,000 | 7,202 |
| Vista CA Unified School District GO | 5.375% | 8/1/12 (Prere.) | 1,695 | 1,710 |
| Vista CA Unified School District GO | 5.375% | 8/1/12 (Prere.) | 1,455 | 1,468 |
| Vista CA Unified School District GO | 5.375% | 8/1/15 (4) | 150 | 151 |
| Vista CA Unified School District GO | 5.375% | 8/1/16 (4) | 190 | 192 |
| Vista CA Unified School District GO | 5.375% | 8/1/17 (4) | 160 | 161 |
| Walnut CA Energy Center Authority Revenue | 5.000% | 1/1/30 | 2,000 | 2,190 |
| Washington Township CA Health Care | | | | |
| District Revenue | 6.000% | 7/1/29 | 1,000 | 1,126 |
| West Basin CA Municipal Water District Revenue | 5.000% | 8/1/22 | 2,000 | 2,473 |
| West Basin CA Municipal Water District Revenue | 5.000% | 8/1/23 | 1,500 | 1,819 |
| West Contra Costa CA Unified School District GO | 6.000% | 8/1/26 | 5,000 | 6,327 |
| Whittier CA Health Facility Revenue (Presbyterian | | | | |
| Intercommunity Hospital) VRDO | 0.140% | 6/7/12 LOC | 15,000 | 15,000 |
| William S. Hart CA Union High School District GO | 5.000% | 9/1/24 | 1,425 | 1,748 |
| William S. Hart CA Union High School District GO | 5.000% | 9/1/25 | 1,735 | 2,099 |
| William S. Hart CA Union High School District GO | 5.000% | 9/1/26 | 1,085 | 1,301 |
| William S. Hart CA Union High School District GO | 5.000% | 9/1/27 | 1,500 | 1,788 |
| | | | | 6,253,872 |
| Puerto Rico (0.2%) | | | | |
| Puerto Rico Aqueduct & Sewer Authority | | | | |
| Revenue | 6.250% | 7/1/12 (ETM) | 1,000 | 1,005 |
| Puerto Rico Highway & Transportation | | | | |
| Authority Revenue | 5.500% | 7/1/13 (ETM) | 1,475 | 1,513 |
| Puerto Rico Infrastructure Financing Authority | | | | |
| Special Tax Revenue | 5.500% | 7/1/21 (3) | 5,000 | 5,672 |
| Puerto Rico Infrastructure Financing Authority | | | | |
| Special Tax Revenue | 5.500% | 7/1/23 (3) | 1,585 | 1,797 |
| Puerto Rico Municipal Finance Agency GO | 5.000% | 7/1/14 (11) | 1,360 | 1,454 |
| Puerto Rico Municipal Finance Agency GO | 5.250% | 7/1/16 (11) | 1,400 | 1,560 |
| Puerto Rico Municipal Finance Agency GO | 5.250% | 7/1/18 (11) | 1,000 | 1,120 |
| | | | | 14,121 |
| Virgin Islands (0.0%) | | | | |
| Virgin Islands Public Finance Authority Revenue | 5.250% | 10/1/15 | 2,200 | 2,342 |
| Total Tax-Exempt Municipal Bonds (Cost $5,847,502) | | | | 6,270,335 |
| Other Assets and Liabilities (-0.3%) | | | | |
| Other Assets | | | | 98,066 |
| Liabilities | | | | (118,677) |
| | | | | (20,611) |
| Net Assets (100%) | | | | 6,249,724 |
59
| |
| California Intermediate-Term Tax-Exempt Fund | |
| |
| |
| At May 31, 2012, net assets consisted of: | |
| | Amount |
| | ($000) |
| Paid-in Capital | 5,928,087 |
| Undistributed Net Investment Income | — |
| Accumulated Net Realized Losses | (101,196) |
| Unrealized Appreciation (Depreciation) | 422,833 |
| Net Assets | 6,249,724 |
| |
| Investor Shares—Net Assets | |
| Applicable to 115,582,122 outstanding $.001 par value shares of | |
| beneficial interest (unlimited authorization) | 1,343,821 |
| Net Asset Value Per Share—Investor Shares | $11.63 |
| |
| Admiral Shares—Net Assets | |
| Applicable to 421,956,513 outstanding $.001 par value shares of | |
| beneficial interest (unlimited authorization) | 4,905,903 |
| Net Asset Value Per Share—Admiral Shares | $11.63 |
See Note A in Notes to Financial Statements.
1 Security exempt from registration under Rule 144A of the Securities Act of 1933. Such securities may be sold in transactions exempt from registration, normally to qualified institutional buyers. At May 31, 2012, the aggregate value of these securities was $222,280,000, representing 3.6% of net assets.
2 Security purchased on a when-issued or delayed-delivery basis for which the fund has not taken delivery as of May 31, 2012.
3 Adjustable-rate security.
A key to abbreviations and other references follows the Statement of Net Assets.
See accompanying Notes, which are an integral part of the Financial Statements.
60
California Intermediate-Term Tax-Exempt Fund
Key to Abbreviations
ARS—Auction Rate Security.
BAN—Bond Anticipation Note.
COP—Certificate of Participation.
CP—Commercial Paper.
FR—Floating Rate.
GAN—Grant Anticipation Note.
GO—General Obligation Bond.
PUT—Put Option Obligation.
RAN—Revenue Anticipation Note.
TAN—Tax Anticipation Note.
TOB—Tender Option Bond.
TRAN—Tax Revenue Anticipation Note.
VRDO—Variable Rate Demand Obligation.
VRDP—Variable Rate Demand Preferred.
(ETM)—Escrowed to Maturity.
(Prere.)—Prerefunded.
Scheduled principal and interest payments are guaranteed by:
(1) MBIA (Municipal Bond Investors Assurance).
(2) AMBAC (Ambac Assurance Corporation).
(3) FGIC (Financial Guaranty Insurance Company).
(4) AGM (Assured Guaranty Municipal Corporation).
(5) BIGI (Bond Investors Guaranty Insurance).
(6) Connie Lee Inc.
(7) FHA (Federal Housing Authority).
(8) CapMAC (Capital Markets Assurance Corporation).
(9) American Capital Access Financial Guaranty Corporation.
(10) XL Capital Assurance Inc.
(11) CIFG (CDC IXIS Financial Guaranty).
(12) Assured Guaranty Corporation.
(13) Berkshire Hathaway Assurance Corporation.
(14) National Public Finance Guarantee Corporation.
The insurance does not guarantee the market value of the municipal bonds.
LOC—Scheduled principal and interest payments are guaranteed by bank letter of credit.
61
California Intermediate-Term Tax-Exempt Fund
Statement of Operations
| |
| | Six Months Ended |
| | May 31, 2012 |
| | ($000) |
| Investment Income | |
| Income | |
| Interest | 106,628 |
| Total Income | 106,628 |
| Expenses | |
| The Vanguard Group—Note B | |
| Investment Advisory Services | 177 |
| Management and Administrative—Investor Shares | 1,028 |
| Management and Administrative—Admiral Shares | 2,108 |
| Marketing and Distribution—Investor Shares | 193 |
| Marketing and Distribution—Admiral Shares | 537 |
| Custodian Fees | 33 |
| Shareholders’ Reports—Investor Shares | 11 |
| Shareholders’ Reports—Admiral Shares | 6 |
| Trustees’ Fees and Expenses | 2 |
| Total Expenses | 4,095 |
| Net Investment Income | 102,533 |
| Realized Net Gain (Loss) | |
| Investment Securities Sold | 4,615 |
| Futures Contracts | (162) |
| Realized Net Gain (Loss) | 4,453 |
| Change in Unrealized Appreciation (Depreciation) of Investment Securities | 222,027 |
| Net Increase (Decrease) in Net Assets Resulting from Operations | 329,013 |
See accompanying Notes, which are an integral part of the Financial Statements.
62
California Intermediate-Term Tax-Exempt Fund
Statement of Changes in Net Assets
| | |
| | Six Months Ended | Year Ended |
| | May 31, | November 30, |
| | 2012 | 2011 |
| | ($000) | ($000) |
| Increase (Decrease) in Net Assets | | |
| Operations | | |
| Net Investment Income | 102,533 | 200,070 |
| Realized Net Gain (Loss) | 4,453 | (7,461) |
| Change in Unrealized Appreciation (Depreciation) | 222,027 | 120,346 |
| Net Increase (Decrease) in Net Assets Resulting from Operations | 329,013 | 312,955 |
| Distributions | | |
| Net Investment Income | | |
| Investor Shares | (21,492) | (43,985) |
| Admiral Shares | (81,041) | (156,085) |
| Realized Capital Gain | | |
| Investor Shares | — | — |
| Admiral Shares | — | — |
| Total Distributions | (102,533) | (200,070) |
| Capital Share Transactions | | |
| Investor Shares | 102,868 | (144,605) |
| Admiral Shares | 352,973 | 126,168 |
| Net Increase (Decrease) from Capital Share Transactions | 455,841 | (18,437) |
| Total Increase (Decrease) | 682,321 | 94,448 |
| Net Assets | | |
| Beginning of Period | 5,567,403 | 5,472,955 |
| End of Period | 6,249,724 | 5,567,403 |
See accompanying Notes, which are an integral part of the Financial Statements.
63
California Intermediate-Term Tax-Exempt Fund
Financial Highlights
| | | | | | |
| Investor Shares | | | | | | |
| Six Months | | | | | |
| | Ended | | | | | |
| For a Share Outstanding | May 31, | | | Year Ended November 30, |
| Throughout Each Period | 2012 | 2011 | 2010 | 2009 | 2008 | 2007 |
| Net Asset Value, Beginning of Period | $11.18 | $10.93 | $10.86 | $10.21 | $10.92 | $11.09 |
| Investment Operations | | | | | | |
| Net Investment Income | .194 | .408 | .408 | .412 | .425 | .435 |
| Net Realized and Unrealized Gain (Loss) | | | | | | |
| on Investments | .450 | .250 | .070 | .650 | (.710) | (.170) |
| Total from Investment Operations | .644 | .658 | .478 | 1.062 | (.285) | .265 |
| Distributions | | | | | | |
| Dividends from Net Investment Income | (.194) | (.408) | (.408) | (.412) | (.425) | (.435) |
| Distributions from Realized Capital Gains | — | — | — | — | — | — |
| Total Distributions | (.194) | (.408) | (.408) | (.412) | (.425) | (.435) |
| Net Asset Value, End of Period | $11.63 | $11.18 | $10.93 | $10.86 | $10.21 | $10.92 |
| |
| Total Return1 | 5.79% | 6.17% | 4.43% | 10.56% | -2.71% | 2.46% |
| |
| Ratios/Supplemental Data | | | | | | |
| Net Assets, End of Period (Millions) | $1,344 | $1,193 | $1,314 | $1,435 | $1,320 | $1,243 |
| Ratio of Total Expenses to | | | | | | |
| Average Net Assets | 0.20% | 0.20% | 0.20% | 0.20% | 0.15% | 0.15% |
| Ratio of Net Investment Income to | | | | | | |
| Average Net Assets | 3.38% | 3.73% | 3.70% | 3.88% | 3.96% | 3.97% |
| Portfolio Turnover Rate | 9% | 13% | 10% | 17% | 25% | 11% |
The expense ratio, net income ratio, and turnover rate for the current period have been annualized.
1 Total returns do not include account service fees that may have applied in the periods shown. Fund prospectuses provide information about any applicable account service fees.
See accompanying Notes, which are an integral part of the Financial Statements.
64
California Intermediate-Term Tax-Exempt Fund
Financial Highlights
| | | | | | |
| Admiral Shares | | | | | | |
| Six Months | | | | | |
| | Ended | | | | | |
| For a Share Outstanding | May 31, | | | Year Ended November 30, |
| Throughout Each Period | 2012 | 2011 | 2010 | 2009 | 2008 | 2007 |
| Net Asset Value, Beginning of Period | $11.18 | $10.93 | $10.86 | $10.21 | $10.92 | $11.09 |
| Investment Operations | | | | | | |
| Net Investment Income | .199 | .417 | .417 | .421 | .432 | .443 |
| Net Realized and Unrealized Gain (Loss) | | | | | | |
| on Investments | .450 | .250 | .070 | .650 | (.710) | (.170) |
| Total from Investment Operations | .649 | .667 | .487 | 1.071 | (.278) | .273 |
| Distributions | | | | | | |
| Dividends from Net Investment Income | (.199) | (.417) | (.417) | (.421) | (.432) | (.443) |
| Distributions from Realized Capital Gains | — | — | — | — | — | — |
| Total Distributions | (.199) | (.417) | (.417) | (.421) | (.432) | (.443) |
| Net Asset Value, End of Period | $11.63 | $11.18 | $10.93 | $10.86 | $10.21 | $10.92 |
| |
| Total Return1 | 5.83% | 6.26% | 4.52% | 10.65% | -2.64% | 2.53% |
| |
| Ratios/Supplemental Data | | | | | | |
| Net Assets, End of Period (Millions) | $4,906 | $4,375 | $4,159 | $3,626 | $3,210 | $3,116 |
| Ratio of Total Expenses to | | | | | | |
| Average Net Assets | 0.12% | 0.12% | 0.12% | 0.12% | 0.08% | 0.08% |
| Ratio of Net Investment Income to | | | | | | |
| Average Net Assets | 3.46% | 3.81% | 3.78% | 3.96% | 4.03% | 4.04% |
| Portfolio Turnover Rate | 9% | 13% | 10% | 17% | 25% | 11% |
The expense ratio, net income ratio, and turnover rate for the current period have been annualized.
1 Total returns do not include account service fees that may have applied in the periods shown. Fund prospectuses provide information about any applicable account service fees.
See accompanying Notes, which are an integral part of the Financial Statements.
65
California Intermediate-Term Tax-Exempt Fund
Notes to Financial Statements
Vanguard California Intermediate-Term Tax-Exempt Fund is registered under the Investment Company Act of 1940 as an open-end investment company, or mutual fund. The fund invests in debt instruments of municipal issuers whose ability to meet their obligations may be affected by economic and political developments in the state. The fund offers two classes of shares: Investor Shares and Admiral Shares. Investor Shares are available to any investor who meets the fund’s minimum purchase requirements. Admiral Shares are designed for investors who meet certain administrative, service, and account-size criteria.
A. The following significant accounting policies conform to generally accepted accounting principles for U.S. mutual funds. The fund consistently follows such policies in preparing its financial statements.
1. Security Valuation: Bonds, and temporary cash investments acquired over 60 days to maturity, are valued using the latest bid prices or using valuations based on a matrix system (which considers such factors as security prices, yields, maturities, and ratings), both as furnished by independent pricing services. Other temporary cash investments are valued at amortized cost, which approximates market value. Securities for which market quotations are not readily available, or whose values have been affected by events occurring before the fund’s pricing time but after the close of the securities’ primary markets, are valued by methods deemed by the board of trustees to represent fair value.
2. Futures Contracts: The fund uses futures contracts to invest in fixed income asset classes with greater efficiency and lower cost than is possible through direct investment, to add value when these instruments are attractively priced, or to adjust sensitivity to changes in interest rates. The primary risks associated with the use of futures contracts are imperfect correlation between changes in market values of bonds held by the fund and the prices of futures contracts, and the possibility of an illiquid market.
Futures contracts are valued based upon their quoted daily settlement prices. The aggregate principal amounts of the contracts are not recorded in the Statement of Net Assets. Fluctuations in the value of the contracts are recorded in the Statement of Net Assets as an asset (liability) and in the Statement of Operations as unrealized appreciation (depreciation) until the contracts are closed, when they are recorded as realized futures gains (losses).
The fund had no open futures contracts at May 31, 2012.
3. Federal Income Taxes: The fund intends to continue to qualify as a regulated investment company and distribute all of its income. Management has analyzed the fund’s tax positions taken for all open federal income tax years (November 30, 2008–2011), and for the period ended May 31, 2012, and has concluded that no provision for federal income tax is required in the fund’s financial statements.
4. Distributions: Distributions from net investment income are declared daily and paid on the first business day of the following month. Annual distributions from realized capital gains, if any, are recorded on the ex-dividend date.
5. Other: Interest income is accrued daily. Premiums and discounts on debt securities purchased are amortized and accreted, respectively, to interest income over the lives of the respective securities. Security transactions are accounted for on the date securities are bought or sold. Costs used to determine realized gains (losses) on the sale of investment securities are those of the specific securities sold.
66
California Intermediate-Term Tax-Exempt Fund
Each class of shares has equal rights as to assets and earnings, except that each class separately bears certain class-specific expenses related to maintenance of shareholder accounts (included in Management and Administrative expenses) and shareholder reporting. Marketing and distribution expenses are allocated to each class of shares based on a method approved by the board of trustees. Income, other non-class-specific expenses, and gains and losses on investments are allocated to each class of shares based on its relative net assets.
B. The Vanguard Group furnishes at cost investment advisory, corporate management, administrative, marketing, and distribution services. The costs of such services are allocated to the fund under methods approved by the board of trustees. The fund has committed to provide up to 0.40% of its net assets in capital contributions to Vanguard. At May 31, 2012, the fund had contributed capital of $897,000 to Vanguard (included in Other Assets), representing 0.01% of the fund’s net assets and 0.36% of Vanguard’s capitalization. The fund’s trustees and officers are also directors and officers of Vanguard.
C. Various inputs may be used to determine the value of the fund’s investments. These inputs are summarized in three broad levels for financial statement purposes. The inputs or methodologies used to value securities are not necessarily an indication of the risk associated with investing in those securities.
Level 1—Quoted prices in active markets for identical securities.
Level 2—Other significant observable inputs (including quoted prices for similar securities, interest rates, prepayment speeds, credit risk, etc.).
Level 3—Significant unobservable inputs (including the fund’s own assumptions used to determine the fair value of investments).
At May 31, 2012, 100% of the market value of the fund’s investments was determined based on Level 2 inputs.
D. Capital gain distributions are determined on a tax basis and may differ from realized capital gains for financial reporting purposes. Differences may be permanent or temporary. Permanent differences are reclassified among capital accounts in the financial statements to reflect their tax character. Temporary differences arise when gains or losses are recognized in different periods for financial statement and tax purposes; these differences will reverse at some time in the future.
The fund’s tax-basis capital gains and losses are determined only at the end of each fiscal year. For tax purposes, at November 30, 2011, the fund had available capital loss carryforwards totaling $101,222,000 to offset future net capital gains of $4,253,000 through November 30, 2012, $2,524,000 through November 30, 2013, $6,523,000 through November 30, 2014, $3,936,000 through November 30, 2015, $38,506,000 through November 30, 2016, $38,406,000 through November 30, 2017, $990,000 through November 30, 2018, and $6,084,000 through November 30, 2019. The fund will use these capital losses to offset net taxable capital gains, if any, realized during the year ending November 30, 2012; should the fund realize net capital losses for the year, the losses will be added to the loss carryforward balance above.
The fund had realized losses totaling $4,428,000 through November 30, 2011, which are deferred for tax purposes and reduce the amount of tax-basis unrealized appreciation on investment securities.
67
California Intermediate-Term Tax-Exempt Fund
At May 31, 2012, the cost of investment securities for tax purposes was $5,851,930,000. Net unrealized appreciation of investment securities for tax purposes was $418,405,000, consisting of unrealized gains of $431,322,000 on securities that had risen in value since their purchase and $12,917,000 in unrealized losses on securities that had fallen in value since their purchase.
E. During the six months ended May 31, 2012, the fund purchased $528,769,000 of investment securities and sold $249,973,000 of investment securities, other than temporary cash investments.
F. Capital share transactions for each class of shares were:
| | | | |
| | Six Months Ended | | Year Ended |
| | | May 31, 2012 | November 30, 2011 |
| | Amount | Shares | Amount | Shares |
| | ($000) | (000) | ($000) | (000) |
| Investor Shares | | | | |
| Issued | 239,143 | 20,757 | 340,985 | 31,243 |
| Issued in Lieu of Cash Distributions | 19,033 | 1,649 | 39,355 | 3,602 |
| Redeemed | (155,308) | (13,510) | (524,945) | (48,403) |
| Net Increase (Decrease)—Investor Shares | 102,868 | 8,896 | (144,605) | (13,558) |
| Admiral Shares | | | | |
| Issued | 613,913 | 53,306 | 1,028,223 | 94,169 |
| Issued in Lieu of Cash Distributions | 61,380 | 5,317 | 119,408 | 10,923 |
| Redeemed | (322,320) | (27,992) | (1,021,463) | (94,270) |
| Net Increase (Decrease)—Admiral Shares | 352,973 | 30,631 | 126,168 | 10,822 |
G. In preparing the financial statements as of May 31, 2012, management considered the impact of subsequent events for potential recognition or disclosure in these financial statements.
68
California Long-Term Tax-Exempt Fund
Fund Profile
As of May 31, 2012
| | | |
| Share-Class Characteristics | | |
| | Investor | Admiral |
| | Shares | Shares |
| Ticker Symbol | VCITX | VCLAX |
| Expense Ratio1 | 0.20% | 0.12% |
| 30-Day SEC Yield | 2.55% | 2.63% |
| |
| Financial Attributes | | | |
| |
| | | Barclays | |
| | CA | Barclays |
| | | Muni | Municipal |
| | | Bond | Bond |
| | Fund | Index | Index |
| Number of Bonds | 512 | 6,377 | 46,824 |
| Yield to Maturity | | | |
| (before expenses) | 2.6% | 2.5% | 2.4% |
| Average Coupon | 4.4% | 4.9% | 4.9% |
| Average Duration | 6.5 years | 7.5 years | 7.3 years |
| Average Effective | | | |
| Maturity | 6.4 years | 5.7 years | 5.7 years |
| Short-Term | | | |
| Reserves | 6.3% | — | — |
| | |
| Volatility Measures | | |
| | | Barclays |
| | Barclays CA | Municipal |
| | Muni Bond | Bond |
| | Index | Index |
| R-Squared | 0.97 | 0.96 |
| Beta | 0.97 | 1.24 |
| These measures show the degree and timing of the fund’s fluctuations compared with the indexes over 36 months. |
|
| |
| Distribution by Maturity (% of portfolio) | |
| Under 1 Year | | 10.5% |
| 1 - 3 Years | | 11.2 |
| 3 - 5 Years | | 12.2 |
| 5 - 10 Years | | 55.5 |
| 10 - 20 Years | | 8.1 |
| 20 - 30 Years | | 1.9 |
| Over 30 Years | | 0.6 |
| |
| Distribution by Credit Quality (% of portfolio) |
| AAA | | 6.7% |
| AA | | 47.8 |
| A | | 34.9 |
| BBB | | 8.2 |
| BB | | 0.1 |
| B | | 0.9 |
| Not Rated | | 1.4 |
| For information about these ratings, see the Glossary entry for Credit Quality. |
| | |
Investment Focus
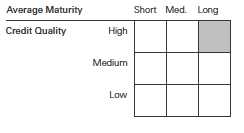
1 The expense ratios shown are from the prospectus dated March 28, 2012, and represent estimated costs for the current fiscal year. For the six months ended May 31, 2012, the annualized expense ratios were 0.20% for Investor Shares and 0.12% for Admiral Shares.
69
California Long-Term Tax-Exempt Fund
Performance Summary
All of the returns in this report represent past performance, which is not a guarantee of future results that may be achieved by the fund. (Current performance may be lower or higher than the performance data cited. For performance data current to the most recent month-end, visit our website at vanguard.com/performance.) Note, too, that both investment returns and principal value can fluctuate widely, so an investor’s shares, when sold, could be worth more or less than their original cost. The returns shown do not reflect taxes that a shareholder would pay on fund distributions or on the sale of fund shares.
| | | | |
| Fiscal-Year Total Returns (%): November 30, 2001, Through May 31, 2012 | |
| | | | | Barclays CA |
| | | | | Muni Bond |
| | | | Investor Shares | Index |
| Fiscal Year | Income Returns | Capital Returns | Total Returns | Total Returns |
| 2002 | 4.85% | 0.51% | 5.36% | 5.46% |
| 2003 | 4.73 | 2.22 | 6.95 | 5.91 |
| 2004 | 4.65 | -1.33 | 3.32 | 4.99 |
| 2005 | 4.54 | -0.32 | 4.22 | 4.59 |
| 2006 | 4.71 | 1.99 | 6.70 | 6.44 |
| 2007 | 4.52 | -3.37 | 1.15 | 2.17 |
| 2008 | 4.13 | -11.08 | -6.95 | -5.18 |
| 2009 | 4.96 | 7.75 | 12.71 | 13.21 |
| 2010 | 4.36 | 0.27 | 4.63 | 5.80 |
| 2011 | 4.51 | 2.09 | 6.60 | 7.49 |
| 2012 | 2.09 | 5.16 | 7.25 | 6.48 |
| Note: For 2012, performance data reflect the six months ended May 31, 2012. |
Average Annual Total Returns: Periods Ended March 31, 2012
This table presents returns through the latest calendar quarter—rather than through the end of the fiscal period.
Securities and Exchange Commission rules require that we provide this information.
| | | | | | |
| | | | | | | Ten Years |
| | Inception Date | One Year | Five Years | Income | Capital | Total |
| Investor Shares | 4/7/1986 | 14.46% | 4.34% | 4.59% | 0.37% | 4.96% |
| Admiral Shares | 11/12/2001 | 14.55 | 4.42 | 4.67 | 0.37 | 5.04 |
See Financial Highlights for dividend and capital gains information.
70
California Long-Term Tax-Exempt Fund
Financial Statements (unaudited)
Statement of Net Assets
As of May 31, 2012
The fund reports a complete list of its holdings in regulatory filings four times in each fiscal year, at the quarter-ends. For the second and fourth fiscal quarters, the lists appear in the fund’s semiannual and annual reports to shareholders. For the first and third fiscal quarters, the fund files the lists with the Securities and Exchange Commission on Form N-Q. Shareholders can look up the fund’s Forms N-Q on the SEC’s website at sec.gov. Forms N-Q may also be reviewed and copied at the SEC’s Public Reference Room (see the back cover of this report for further information).
| | | | |
| | | | Face | Market |
| | | Maturity | Amount | Value |
| | Coupon | Date | ($000) | ($000) |
| Tax-Exempt Municipal Bonds (101.0%) | | | | |
| California (100.8%) | | | | |
| ABAG Finance Authority for Nonprofit Corps. | | | | |
| California Revenue (899 Charleston Project) | | | | |
| VRDO | 0.270% | 6/1/12 LOC | 2,655 | 2,655 |
| ABAG Finance Authority for Nonprofit Corps. | | | | |
| California Revenue (Sharp Healthcare) | 4.000% | 8/1/21 | 500 | 550 |
| ABAG Finance Authority for Nonprofit Corps. | | | | |
| California Revenue (Sharp Healthcare) | 5.000% | 8/1/23 | 650 | 745 |
| Alameda CA Corridor Transportation | | | | |
| Authority Revenue | 5.125% | 10/1/17 (14) | 5,000 | 5,015 |
| Alameda CA Corridor Transportation | | | | |
| Authority Revenue | 5.125% | 10/1/18 (14) | 2,000 | 2,006 |
| Alameda CA Corridor Transportation | | | | |
| Authority Revenue | 0.000% | 10/1/30 (2) | 30,375 | 10,667 |
| Alameda County CA Unified School District GO | 0.000% | 8/1/24 (4) | 3,510 | 2,180 |
| Alameda County CA Unified School District GO | 0.000% | 8/1/29 (4) | 5,000 | 2,237 |
| Anaheim CA Public Financing Authority Revenue | | | | |
| (Distribution System) | 5.000% | 10/1/21 (14) | 3,390 | 3,555 |
| Bay Area CA Infrastructure Financing | | | | |
| Authority Revenue | 5.000% | 8/1/17 (14) | 4,750 | 5,115 |
| Bay Area Toll Authority California Toll Bridge | | | | |
| Revenue (San Francisco Bay Area) | 5.000% | 4/1/34 | 1,500 | 1,665 |
| Bay Area Toll Authority California Toll Bridge | | | | |
| Revenue (San Francisco Bay Area) | 5.000% | 4/1/34 | 5,000 | 5,478 |
| Bay Area Toll Authority California Toll Bridge | | | | |
| Revenue (San Francisco Bay Area) | 5.000% | 4/1/39 | 15,050 | 16,305 |
| Bay Area Toll Authority California Toll Bridge | | | | |
| Revenue (San Francisco Bay Area) | 5.000% | 10/1/42 | 5,000 | 5,440 |
| Bay Area Toll Authority California Toll Bridge | | | | |
| Revenue (San Francisco Bay Area) | 5.625% | 4/1/44 | 10,000 | 11,346 |
| Cabrillo CA Community College District Revenue | 0.000% | 5/1/26 (2) | 9,000 | 4,668 |
| California County CA Tobacco Securitization | | | | |
| Agency Revenue | 5.450% | 6/1/28 | 7,500 | 6,443 |
| California Department of Water Resources | | | | |
| Power Supply Revenue | 5.000% | 5/1/18 | 8,000 | 9,743 |
| California Department of Water Resources | | | | |
| Power Supply Revenue | 5.000% | 5/1/20 | 9,500 | 11,888 |
| California Department of Water Resources | | | | |
| Power Supply Revenue | 5.000% | 5/1/20 | 10,000 | 12,514 |
71
| | | | |
| California Long-Term Tax-Exempt Fund | | | | |
| |
| |
| |
| | | | Face | Market |
| | | Maturity | Amount | Value |
| | Coupon | Date | ($000) | ($000) |
| California Department of Water Resources | | | | |
| Power Supply Revenue | 5.000% | 5/1/21 | 5,000 | 6,149 |
| California Department of Water Resources | | | | |
| Power Supply Revenue | 5.000% | 5/1/22 | 30,000 | 35,047 |
| California Department of Water Resources | | | | |
| Water System Revenue (Central Valley Project) | 5.000% | 12/1/25 | 8,810 | 10,378 |
| California Department of Water Resources | | | | |
| Water System Revenue (Central Valley Project) | 5.000% | 12/1/31 | 1,395 | 1,683 |
| California Department of Water Resources | | | | |
| Water System Revenue (Central Valley Project) | 5.000% | 12/1/35 | 4,000 | 4,717 |
| California Economic Recovery Bonds GO | 5.000% | 7/1/18 | 12,000 | 14,573 |
| California Economic Recovery Bonds GO | 5.000% | 7/1/19 | 6,000 | 7,390 |
| California Economic Recovery Bonds GO | 5.000% | 7/1/20 | 19,855 | 24,033 |
| California Economic Recovery Bonds GO | 5.250% | 7/1/21 | 16,985 | 20,626 |
| California Economic Recovery Bonds GO | 5.000% | 7/1/22 | 5,000 | 5,722 |
| California Educational Facilities Authority Revenue | | | | |
| (California Institute of Technology) | 5.000% | 10/1/39 | 7,730 | 8,770 |
| California Educational Facilities Authority Revenue | | | | |
| (California Institute of Technology) | 5.000% | 11/1/39 | 3,000 | 3,386 |
| California Educational Facilities Authority Revenue | | | | |
| (College of Arts & Crafts) | 6.875% | 6/1/19 | 1,615 | 1,884 |
| California Educational Facilities Authority Revenue | | | | |
| (College of Arts & Crafts) | 5.750% | 6/1/25 | 2,000 | 2,002 |
| 1 California Educational Facilities Authority Revenue | | | | |
| (Pepperdine College) | 5.000% | 9/1/33 | 3,000 | 3,469 |
| California Educational Facilities Authority Revenue | | | | |
| (Pomona College) | 0.000% | 7/1/34 | 3,155 | 1,152 |
| California Educational Facilities Authority Revenue | | | | |
| (Pomona College) | 0.000% | 7/1/35 | 3,155 | 1,081 |
| California Educational Facilities Authority Revenue | | | | |
| (Pomona College) | 0.000% | 7/1/36 | 3,155 | 1,017 |
| California Educational Facilities Authority Revenue | | | | |
| (Pomona College) | 0.000% | 7/1/37 | 3,155 | 961 |
| California Educational Facilities Authority Revenue | | | | |
| (Pomona College) | 0.000% | 7/1/39 | 2,805 | 765 |
| California Educational Facilities Authority Revenue | | | | |
| (Pomona College) | 0.000% | 7/1/40 | 1,580 | 410 |
| California Educational Facilities Authority Revenue | | | | |
| (Stanford University) | 5.000% | 3/15/26 | 5,330 | 6,988 |
| California Educational Facilities Authority Revenue | | | | |
| (University of San Francisco) | 6.125% | 10/1/36 | 1,250 | 1,511 |
| California Educational Facilities Authority Revenue | | | | |
| (University of Southern California) | 4.750% | 10/1/37 | 1,650 | 1,788 |
| California Educational Facilities Authority Revenue | | | | |
| (University of Southern California) | 5.000% | 10/1/38 | 5,445 | 6,172 |
| California Educational Facilities Authority Revenue | | | | |
| (University of Southern California) | 5.250% | 10/1/38 | 3,420 | 3,971 |
| 2 California Educational Facilities Authority Revenue | | | | |
| (University of Southern California) TOB VRDO | 0.170% | 6/1/12 | 3,105 | 3,105 |
| California Educational Facilities Authority Revenue | | | | |
| (University of the Pacific) | 5.000% | 11/1/25 | 2,000 | 2,115 |
| California GO | 6.250% | 9/1/12 (3) | 2,940 | 2,973 |
| California GO | 7.000% | 11/1/13 (14) | 65 | 67 |
| California GO | 5.250% | 10/1/14 (14) | 1,955 | 1,981 |
| California GO | 5.000% | 11/1/14 | 22,840 | 25,181 |
| California GO | 5.000% | 11/1/15 | 1,520 | 1,717 |
72
| | | | |
| California Long-Term Tax-Exempt Fund | | | | |
| |
| |
| |
| | | | Face | Market |
| | | Maturity | Amount | Value |
| | Coupon | Date | ($000) | ($000) |
| California GO | 5.000% | 10/1/18 | 9,000 | 10,785 |
| California GO | 5.000% | 3/1/19 | 1,250 | 1,500 |
| California GO | 6.000% | 4/1/19 | 1,690 | 2,142 |
| California GO | 6.000% | 8/1/19 (3) | 210 | 212 |
| California GO | 5.000% | 10/1/19 | 10,070 | 12,180 |
| California GO | 5.000% | 4/1/20 | 1,460 | 1,720 |
| California GO | 5.000% | 11/1/22 | 1,000 | 1,163 |
| California GO | 5.250% | 9/1/23 | 10,100 | 12,125 |
| California GO | 5.000% | 3/1/25 | 7,000 | 7,961 |
| California GO | 5.125% | 2/1/26 | 15,325 | 16,092 |
| California GO | 5.000% | 6/1/26 (14) | 20,000 | 22,345 |
| California GO | 5.250% | 10/1/27 | 5,000 | 5,812 |
| California GO | 5.100% | 11/1/27 | 1,475 | 1,676 |
| California GO | 5.000% | 9/1/28 | 10,650 | 11,582 |
| California GO | 5.000% | 10/1/29 | 1,400 | 1,540 |
| California GO | 5.250% | 10/1/29 | 4,700 | 5,263 |
| California GO | 5.250% | 3/1/30 | 10,000 | 11,515 |
| California GO | 4.500% | 8/1/30 | 5,000 | 5,280 |
| California GO | 5.250% | 9/1/30 | 6,000 | 6,859 |
| California GO | 5.750% | 4/1/31 | 15,875 | 18,521 |
| California GO | 5.000% | 6/1/32 | 25,000 | 27,064 |
| California GO | 5.000% | 9/1/32 | 1,045 | 1,157 |
| California GO | 6.000% | 3/1/33 | 7,000 | 8,431 |
| California GO | 5.125% | 4/1/33 | 8,500 | 9,121 |
| California GO | 6.500% | 4/1/33 | 33,000 | 40,132 |
| California GO | 5.000% | 6/1/34 | 7,000 | 7,349 |
| California GO | 5.250% | 4/1/35 | 5,000 | 5,607 |
| California GO | 6.000% | 11/1/35 | 10,000 | 11,879 |
| California GO | 5.250% | 3/1/38 | 13,565 | 14,695 |
| California GO | 6.000% | 4/1/38 | 21,190 | 24,706 |
| California GO | 5.250% | 8/1/38 | 10,000 | 10,887 |
| California GO | 5.500% | 11/1/39 | 3,690 | 4,150 |
| California GO | 6.000% | 11/1/39 | 2,700 | 3,180 |
| California GO | 5.500% | 3/1/40 | 11,500 | 12,982 |
| California GO | 5.250% | 11/1/40 | 11,000 | 12,265 |
| California GO | 5.000% | 10/1/41 | 10,000 | 10,732 |
| 2 California GO TOB VRDO | 0.230% | 6/1/12 | 8,995 | 8,995 |
| California GO VRDO | 0.150% | 6/7/12 LOC | 2,400 | 2,400 |
| California GO VRDO | 0.170% | 6/7/12 LOC | 20,000 | 20,000 |
| California Health Facilities Financing Authority | | | | |
| Revenue (Adventist Health System/West) | 5.000% | 3/1/33 | 2,500 | 2,516 |
| California Health Facilities Financing Authority | | | | |
| Revenue (Casa Colina) | 6.125% | 4/1/32 | 10,000 | 10,013 |
| California Health Facilities Financing Authority | | | | |
| Revenue (Catholic Healthcare West) | 5.625% | 7/1/25 | 5,000 | 5,717 |
| California Health Facilities Financing Authority | | | | |
| Revenue (Catholic Healthcare West) | 5.250% | 3/1/27 | 2,500 | 2,805 |
| California Health Facilities Financing Authority | | | | |
| Revenue (Catholic Healthcare West) | 6.000% | 7/1/39 | 5,000 | 5,819 |
| California Health Facilities Financing Authority | | | | |
| Revenue (Catholic Healthcare West) | 5.250% | 3/1/41 | 9,000 | 9,802 |
| California Health Facilities Financing Authority | | | | |
| Revenue (Cedars-Sinai Medical Center) | 5.000% | 11/15/27 | 7,000 | 7,360 |
| California Health Facilities Financing Authority | | | | |
| Revenue (Cedars-Sinai Medical Center) | 5.000% | 8/15/34 | 2,415 | 2,599 |
73
| | | | |
| California Long-Term Tax-Exempt Fund | | | | |
| |
| |
| |
| | | | Face | Market |
| | | Maturity | Amount | Value |
| | Coupon | Date | ($000) | ($000) |
| California Health Facilities Financing Authority | | | | |
| Revenue (Cedars-Sinai Medical Center) | 5.000% | 8/15/39 | 10,245 | 10,946 |
| California Health Facilities Financing Authority | | | | |
| Revenue (Children’s Hospital of Orange County) | 6.500% | 11/1/38 | 3,000 | 3,638 |
| California Health Facilities Financing Authority | | | | |
| Revenue (Children’s Hospital of Orange County) | 5.250% | 11/1/41 | 4,025 | 4,426 |
| California Health Facilities Financing Authority | | | | |
| Revenue (Lucile Salter Packard Children’s | | | | |
| Hospital at Stanford) | 5.000% | 8/15/51 | 12,000 | 12,789 |
| California Health Facilities Financing Authority | | | | |
| Revenue (Memorial Health Services) | 5.000% | 10/1/25 | 2,750 | 3,209 |
| California Health Facilities Financing Authority | | | | |
| Revenue (Memorial Health Services) | 5.000% | 10/1/26 | 5,000 | 5,774 |
| California Health Facilities Financing Authority | | | | |
| Revenue (Memorial Health Services) | 5.000% | 10/1/33 | 2,500 | 2,813 |
| California Health Facilities Financing Authority | | | | |
| Revenue (Providence Health & Services) | 6.500% | 10/1/33 | 2,000 | 2,392 |
| California Health Facilities Financing Authority | | | | |
| Revenue (Providence Health & Services) | 5.500% | 10/1/39 | 6,500 | 7,316 |
| California Health Facilities Financing Authority | | | | |
| Revenue (Rady Children’s Hospital) | 5.500% | 8/15/33 | 3,520 | 3,892 |
| California Health Facilities Financing Authority | | | | |
| Revenue (Scripps Health) | 5.000% | 11/15/40 | 6,000 | 6,528 |
| California Health Facilities Financing Authority | | | | |
| Revenue (St. Joseph Health System) | 5.750% | 7/1/39 | 7,000 | 7,976 |
| California Health Facilities Financing Authority | | | | |
| Revenue (Stanford Hospital) | 5.000% | 8/15/51 | 16,675 | 18,075 |
| California Health Facilities Financing Authority | | | | |
| Revenue (Sutter Health) | 5.250% | 8/15/22 | 5,000 | 5,813 |
| California Health Facilities Financing Authority | | | | |
| Revenue (Sutter Health) | 5.875% | 8/15/31 | 4,000 | 4,795 |
| California Health Facilities Financing Authority | | | | |
| Revenue (Sutter Health) | 5.250% | 11/15/46 | 20,500 | 21,577 |
| 2 California Infrastructure & Economic | | | | |
| Development Bank Revenue (Bay Area | | | | |
| Toll Bridges Seismic Retrofit) TOB VRDO | 0.200% | 6/1/12 (ETM) | 12,575 | 12,575 |
| California Infrastructure & Economic | | | | |
| Development Bank Revenue | | | | |
| (Science Center Phase II Project) | 5.000% | 5/1/31 (14) | 4,135 | 4,211 |
| California Municipal Finance Authority | | | | |
| (Community Hospitals of Central California | | | | |
| Obligated Group) COP | 5.500% | 2/1/39 | 11,000 | 11,415 |
| California Municipal Finance Authority Revenue | | | | |
| (University of La Verne) | 5.250% | 6/1/20 | 2,420 | 2,710 |
| California Public Works Board Lease Revenue | | | | |
| (Community Colleges) | 5.000% | 3/1/27 (14) | 2,970 | 3,128 |
| California Public Works Board Lease Revenue | | | | |
| (Department of Corrections) | 5.000% | 1/1/15 (2) | 3,900 | 4,280 |
| California Public Works Board Lease Revenue | | | | |
| (Department of Corrections) | 5.000% | 1/1/17 | 6,000 | 6,650 |
| California Public Works Board Lease Revenue | | | | |
| (Department of Corrections) | 6.500% | 9/1/17 (2) | 22,280 | 24,751 |
| California Public Works Board Lease Revenue | | | | |
| (Department of Corrections) | 5.000% | 12/1/17 (14) | 13,835 | 14,952 |
| California Public Works Board Lease Revenue | | | | |
| (Department of Corrections) | 5.000% | 12/1/19 (14) | 15,230 | 16,358 |
74
| | | | |
| California Long-Term Tax-Exempt Fund | | | | |
| |
| |
| |
| | | | Face | Market |
| | | Maturity | Amount | Value |
| | Coupon | Date | ($000) | ($000) |
| California Public Works Board Lease Revenue | | | | |
| (Department of General Services) | 6.000% | 4/1/25 | 6,000 | 7,129 |
| California Public Works Board Lease Revenue | | | | |
| (Department of General Services) | 6.250% | 4/1/34 | 8,250 | 9,689 |
| California Public Works Board Lease Revenue | | | | |
| (Office of Emergency Services) | 5.000% | 3/1/27 (14) | 8,950 | 9,425 |
| California Public Works Board Lease Revenue | | | | |
| (Regents of The University of California) | 5.250% | 11/1/27 (14) | 9,045 | 10,094 |
| California Public Works Board Lease Revenue | | | | |
| (Regents of The University of California) | 5.000% | 5/1/30 | 17,000 | 18,544 |
| California Public Works Board Lease Revenue | | | | |
| (Various Capital Projects) | 5.000% | 4/1/23 | 4,180 | 4,805 |
| California Public Works Board Lease Revenue | | | | |
| (Various Capital Projects) | 6.250% | 11/1/24 | 5,000 | 6,085 |
| California State University Revenue Systemwide | 5.250% | 11/1/19 (4) | 5,000 | 5,424 |
| California State University Revenue Systemwide | 5.250% | 11/1/20 (4) | 4,745 | 5,148 |
| California State University Revenue Systemwide | 5.000% | 11/1/21 (2) | 17,215 | 19,204 |
| California State University Revenue Systemwide | 5.000% | 11/1/24 | 2,000 | 2,388 |
| California State University Revenue Systemwide | 5.750% | 11/1/27 | 4,500 | 5,292 |
| California State University Revenue Systemwide | 5.250% | 11/1/34 | 5,000 | 5,598 |
| California State University Revenue Systemwide | 5.000% | 11/1/35 (14) | 5,000 | 5,420 |
| California State University Revenue Systemwide | 5.000% | 11/1/37 | 10,000 | 10,992 |
| California State University Revenue Systemwide | 5.250% | 11/1/38 | 3,280 | 3,658 |
| California Statewide Communities Development | | | | |
| Authority Health Facility Revenue | | | | |
| (Adventist Health System/West) | 5.000% | 3/1/35 | 8,000 | 8,233 |
| California Statewide Communities Development | | | | |
| Authority Health Facility Revenue | | | | |
| (Henry Mayo Newhall Memorial Hospital) | 5.000% | 10/1/18 | 5,260 | 5,269 |
| California Statewide Communities Development | | | | |
| Authority Health Facility Revenue | | | | |
| (Memorial Health Services) | 6.000% | 4/1/13 (Prere.) | 8,500 | 8,909 |
| California Statewide Communities Development | | | | |
| Authority Revenue (Cottage Health System | | | | |
| Obligated Group) | 5.000% | 11/1/40 | 7,000 | 7,424 |
| California Statewide Communities Development | | | | |
| Authority Revenue (Daughters of Charity | | | | |
| Health System) | 5.250% | 7/1/30 | 5,000 | 5,084 |
| California Statewide Communities Development | | | | |
| Authority Revenue (John Muir Health) | 5.000% | 8/15/34 | 5,390 | 5,706 |
| California Statewide Communities Development | | | | |
| Authority Revenue (Kaiser Permanente) | 5.500% | 11/1/32 | 16,250 | 16,486 |
| California Statewide Communities Development | | | | |
| Authority Revenue (Kaiser Permanente) | 4.750% | 4/1/33 | 4,185 | 4,353 |
| California Statewide Communities Development | | | | |
| Authority Revenue (Kaiser Permanente) | 5.000% | 3/1/41 | 4,925 | 5,117 |
| California Statewide Communities Development | | | | |
| Authority Revenue (Kaiser Permanente) | 5.000% | 4/1/42 | 21,000 | 22,692 |
| California Statewide Communities Development | | | | |
| Authority Revenue (Kaiser Permanente) | 5.250% | 3/1/45 | 10,250 | 10,742 |
| California Statewide Communities Development | | | | |
| Authority Revenue (Los Angeles Orthopaedic | | | | |
| Hospital Foundation & Orthopaedic Hospital) | 5.750% | 6/1/30 (2) | 6,680 | 6,685 |
| California Statewide Communities Development | | | | |
| Authority Revenue (Proposition 1A | | | | |
| Receivables Program) | 5.000% | 6/15/13 | 9,000 | 9,435 |
75
| | | | |
| California Long-Term Tax-Exempt Fund | | | | |
| |
| |
| |
| | | | Face | Market |
| | | Maturity | Amount | Value |
| | Coupon | Date | ($000) | ($000) |
| California Statewide Communities Development | | | | |
| Authority Revenue (Redlands Community | | | | |
| Hospital) VRDO | 0.160% | 6/7/12 LOC | 3,200 | 3,200 |
| California Statewide Communities Development | | | | |
| Authority Revenue (Sutter Health) | 5.250% | 8/15/31 | 2,500 | 2,882 |
| California Statewide Communities Development | | | | |
| Authority Revenue (Sutter Health) | 5.500% | 8/15/34 | 10,885 | 10,995 |
| California Statewide Communities Development | | | | |
| Authority Revenue (Sutter Health) | 5.000% | 8/15/38 (2) | 2,900 | 3,066 |
| California Statewide Communities Development | | | | |
| Authority Revenue (Sutter Health) | 5.000% | 8/15/38 (2) | 3,490 | 3,689 |
| California Statewide Communities Development | | | | |
| Authority Revenue (Sutter Health) | 5.000% | 11/15/38 | 4,250 | 4,506 |
| 2 California Statewide Communities Development | | | | |
| Authority Revenue (Sutter Health) TOB VRDO | 0.250% | 6/7/12 | 6,273 | 6,273 |
| California Statewide Communities Development | | | | |
| Authority Revenue (Trinity Health) | 5.000% | 12/1/41 | 7,500 | 8,193 |
| California Statewide Communities Development | | | | |
| Authority Senior Living Revenue | | | | |
| (Southern California Presbyterian Homes) | 4.875% | 11/15/36 | 7,230 | 6,878 |
| California Statewide Communities Development | | | | |
| Authority Senior Living Revenue | | | | |
| (Southern California Presbyterian Homes) | 7.250% | 11/15/41 | 3,000 | 3,368 |
| California Statewide Communities Development | | | | |
| Authority Student Housing Revenue | | | | |
| (CHF-Irvine LLC - UCI East Campus | | | | |
| Apartments Phase II) | 5.000% | 5/15/38 | 13,000 | 13,148 |
| Cerritos CA Community College District GO | 0.000% | 8/1/34 | 3,000 | 974 |
| Cerritos CA Community College District GO | 5.000% | 8/1/38 | 7,000 | 7,752 |
| Clovis CA Unified School District GO | 0.000% | 8/1/13 (14) | 4,935 | 4,910 |
| Clovis CA Unified School District GO | 0.000% | 8/1/15 (14) | 2,770 | 2,682 |
| Clovis CA Unified School District GO | 0.000% | 8/1/16 (14) | 2,865 | 2,662 |
| 2 Desert CA Community College District GO | | | | |
| TOB VRDO | 0.250% | 6/7/12 | 2,300 | 2,300 |
| East Bay CA Municipal Utility District | | | | |
| Waste Water System Revenue | 5.000% | 6/1/33 (2) | 1,350 | 1,527 |
| East Bay CA Municipal Utility District | | | | |
| Water System Revenue | 5.000% | 6/1/32 (14) | 15,765 | 17,836 |
| East Bay CA Municipal Utility District | | | | |
| Water System Revenue | 5.000% | 6/1/36 | 10,000 | 11,552 |
| East Bay CA Regional Park District Revenue | 5.000% | 9/1/25 | 2,000 | 2,367 |
| East Bay CA Regional Park District Revenue | 5.000% | 9/1/27 | 4,070 | 4,765 |
| East Side CA Union High School District GO | 5.000% | 8/1/37 | 5,655 | 6,128 |
| Eastern California Municipal Water District | | | | |
| Water & Sewer Revenue | 6.750% | 7/1/12 (14) | 2,340 | 2,350 |
| Escondido CA Union High School District GO | 0.000% | 11/1/20 (14) | 4,000 | 2,844 |
| Fontana CA Public Financing Authority Tax | | | | |
| Allocation Revenue | 5.000% | 10/1/29 (2) | 9,450 | 9,615 |
| Fontana CA Public Financing Authority Tax | | | | |
| Allocation Revenue | 5.000% | 10/1/32 (2) | 5,000 | 5,098 |
| Fontana CA Unified School District GO | 5.250% | 8/1/31 (4) | 6,115 | 6,571 |
| Foothill-De Anza CA Community | | | | |
| College District GO | 0.000% | 8/1/17 (14) | 3,000 | 2,719 |
| Foothill-De Anza CA Community | | | | |
| College District GO | 0.000% | 8/1/22 (14) | 3,850 | 2,760 |
76
| | | | |
| California Long-Term Tax-Exempt Fund | | | | |
| |
| |
| |
| | | | Face | Market |
| | | Maturity | Amount | Value |
| | Coupon | Date | ($000) | ($000) |
| Foothill-De Anza CA Community | | | | |
| College District GO | 0.000% | 8/1/23 (14) | 3,590 | 2,418 |
| Foothill-De Anza CA Community | | | | |
| College District GO | 0.000% | 8/1/25 (14) | 2,390 | 1,438 |
| Foothill-De Anza CA Community | | | | |
| College District GO | 5.000% | 8/1/40 | 10,000 | 11,335 |
| Foothill/Eastern Corridor Agency | | | | |
| California Toll Road Revenue | 5.875% | 1/15/26 | 10,000 | 10,216 |
| Foothill/Eastern Corridor Agency | | | | |
| California Toll Road Revenue | 0.000% | 1/15/33 | 9,000 | 2,622 |
| Foothill/Eastern Corridor Agency | | | | |
| California Toll Road Revenue | 0.000% | 1/15/34 | 10,000 | 2,725 |
| Fresno CA Airport Revenue | 5.500% | 7/1/30 (4) | 1,500 | 1,502 |
| Fresno County CA TRAN | 3.000% | 6/29/12 | 20,000 | 20,044 |
| Gavilan CA Joint Community College District GO | 5.500% | 8/1/28 (2) | 3,405 | 3,762 |
| Golden State Tobacco Securitization Corp. | | | | |
| California | 5.500% | 6/1/13 (Prere.) | 4,000 | 4,208 |
| Golden State Tobacco Securitization Corp. | | | | |
| California | 6.250% | 6/1/13 (Prere.) | 24,000 | 24,903 |
| Golden State Tobacco Securitization Corp. | | | | |
| California | 5.125% | 6/1/47 | 12,785 | 9,200 |
| Golden State Tobacco Securitization Corp. | | | | |
| California | 5.750% | 6/1/47 | 8,500 | 6,780 |
| Grossmont CA Healthcare District GO | 6.125% | 7/15/40 | 2,500 | 3,022 |
| 2 Grossmont CA Healthcare District Revenue | | | | |
| TOB VRDO | 0.200% | 6/7/12 | 1,600 | 1,600 |
| Hartnell CA Community College District GO | 5.000% | 8/1/13 (Prere.) | 2,370 | 2,501 |
| Hartnell CA Community College District GO | 5.000% | 8/1/13 (Prere.) | 1,735 | 1,831 |
| Hartnell CA Community College District GO | 5.000% | 8/1/13 (Prere.) | 1,550 | 1,636 |
| Huntington Beach CA Union High School | | | | |
| District GO | 0.000% | 8/1/30 (4) | 4,900 | 2,090 |
| Irvine CA Assessment District No. 05-21 | | | | |
| Improvement Revenue VRDO | 0.180% | 6/1/12 LOC | 1,700 | 1,700 |
| Irvine CA Public Facilities & Infrastructure | | | | |
| Authority Assessment Revenue VRDO | 0.180% | 6/1/12 LOC | 2,100 | 2,100 |
| Irvine CA Unified School District Financing | | | | |
| Authority Special Tax Revenue | 5.000% | 9/1/30 (2) | 5,500 | 5,684 |
| Kern CA High School District GO | 6.400% | 8/1/14 (ETM) | 1,490 | 1,686 |
| Kern CA High School District GO | 6.400% | 8/1/15 (ETM) | 1,645 | 1,956 |
| Kern CA High School District GO | 6.400% | 8/1/16 (ETM) | 1,815 | 2,264 |
| Kern County CA GO | 5.750% | 8/1/35 (12) | 2,000 | 2,239 |
| La Mesa-Spring Valley CA School District GO | 5.375% | 8/1/12 (Prere.) | 1,890 | 1,906 |
| La Mesa-Spring Valley CA School District GO | 5.375% | 8/1/12 (Prere.) | 2,000 | 2,017 |
| La Mesa-Spring Valley CA School District GO | 5.375% | 8/1/12 (Prere.) | 1,775 | 1,790 |
| La Mesa-Spring Valley CA School District GO | 5.375% | 8/1/12 (Prere.) | 1,570 | 1,584 |
| Loma Linda CA Hospital Revenue | | | | |
| (Loma Linda University) | 5.000% | 12/1/20 | 6,155 | 6,316 |
| Loma Linda CA Hospital Revenue | | | | |
| (Loma Linda University) | 5.000% | 12/1/21 | 2,500 | 2,545 |
| Long Beach CA Finance Authority Lease Revenue | | | | |
| (Temple & Willow Facility) | 5.500% | 10/1/18 (14) | 5,030 | 5,112 |
| Long Beach CA Finance Authority Natural Gas | | | | |
| Purchase Revenue | 5.500% | 11/15/37 | 2,500 | 2,744 |
| Long Beach CA Finance Authority Tax Revenue | 5.500% | 8/1/26 (2) | 7,570 | 7,780 |
| Long Beach CA Finance Authority Tax Revenue | 5.500% | 8/1/31 (2) | 4,015 | 3,986 |
| Long Beach CA Harbor Revenue | 5.000% | 5/15/17 (14) | 3,655 | 3,951 |
77
| | | | |
| California Long-Term Tax-Exempt Fund | | | | |
| |
| |
| |
| | | | Face | Market |
| | | Maturity | Amount | Value |
| | Coupon | Date | ($000) | ($000) |
| Long Beach CA Unified School District GO | 5.000% | 8/1/30 | 6,000 | 6,903 |
| Los Angeles CA Community College District GO | 5.500% | 8/1/25 | 3,980 | 4,742 |
| Los Angeles CA Community College District GO | 5.000% | 8/1/31 (4) | 5,000 | 5,530 |
| Los Angeles CA Community College District GO | 5.000% | 8/1/32 (14) | 7,340 | 8,144 |
| Los Angeles CA Community College District GO | 6.000% | 8/1/33 | 5,160 | 6,162 |
| Los Angeles CA Community College District GO | 5.250% | 8/1/39 | 5,000 | 5,778 |
| Los Angeles CA Department of Airports | | | | |
| International Airport Revenue | 5.250% | 5/15/17 (14) | 6,800 | 6,827 |
| Los Angeles CA Department of Airports | | | | |
| International Airport Revenue | 5.000% | 5/15/22 | 2,000 | 2,414 |
| Los Angeles CA Department of Airports | | | | |
| International Airport Revenue | 5.250% | 5/15/27 | 5,000 | 5,880 |
| Los Angeles CA Department of Airports | | | | |
| International Airport Revenue | 5.000% | 5/15/29 | 5,000 | 5,726 |
| Los Angeles CA Department of Airports | | | | |
| International Airport Revenue | 5.000% | 5/15/30 | 3,195 | 3,579 |
| Los Angeles CA Department of Airports | | | | |
| International Airport Revenue | 5.000% | 5/15/30 | 14,590 | 16,630 |
| 2 Los Angeles CA Department of Airports | | | | |
| International Airport Revenue TOB VRDO | 0.200% | 6/7/12 | 1,440 | 1,440 |
| Los Angeles CA Department of Water & | | | | |
| Power Revenue | 5.000% | 7/1/25 | 4,070 | 4,638 |
| Los Angeles CA Department of Water & | | | | |
| Power Revenue | 5.000% | 7/1/29 (2) | 10,000 | 11,240 |
| Los Angeles CA Department of Water & | | | | |
| Power Revenue | 5.000% | 7/1/30 (2) | 16,000 | 17,983 |
| Los Angeles CA Department of Water & | | | | |
| Power Revenue | 5.000% | 7/1/32 (2) | 5,000 | 5,620 |
| Los Angeles CA Department of Water & | | | | |
| Power Revenue | 5.250% | 7/1/32 | 7,000 | 8,200 |
| Los Angeles CA Department of Water & | | | | |
| Power Revenue | 5.000% | 7/1/34 (14) | 5,995 | 6,395 |
| Los Angeles CA Department of Water & | | | | |
| Power Revenue | 5.375% | 7/1/34 | 3,000 | 3,427 |
| Los Angeles CA Department of Water & | | | | |
| Power Revenue | 5.000% | 7/1/36 | 5,000 | 5,603 |
| 1 Los Angeles CA Department of Water & | | | | |
| Power Revenue | 5.000% | 7/1/36 | 3,000 | 3,407 |
| Los Angeles CA Department of Water & | | | | |
| Power Revenue | 5.000% | 7/1/36 (14) | 2,000 | 2,007 |
| 1 Los Angeles CA Department of Water & | | | | |
| Power Revenue | 5.000% | 7/1/37 | 1,545 | 1,736 |
| Los Angeles CA Department of Water & | | | | |
| Power Revenue | 5.250% | 7/1/38 | 1,890 | 2,193 |
| Los Angeles CA Department of Water & | | | | |
| Power Revenue | 5.250% | 7/1/39 | 2,000 | 2,299 |
| 2 Los Angeles CA Department of Water & | | | | |
| Power Revenue TOB VRDO | 0.200% | 6/1/12 | 8,065 | 8,065 |
| 2 Los Angeles CA Department of Water & | | | | |
| Power Revenue TOB VRDO | 0.200% | 6/1/12 | 2,955 | 2,955 |
| Los Angeles CA Department of Water & | | | | |
| Power Revenue VRDO | 0.150% | 6/1/12 | 5,100 | 5,100 |
| Los Angeles CA Department of Water & | | | | |
| Power Revenue VRDO | 0.170% | 6/1/12 | 10,200 | 10,200 |
| Los Angeles CA GO | 5.000% | 9/1/22 | 11,155 | 13,686 |
| Los Angeles CA GO | 5.000% | 9/1/31 | 5,785 | 6,628 |
78
| | | | |
| California Long-Term Tax-Exempt Fund | | | | |
| |
| |
| |
| | | | Face | Market |
| | | Maturity | Amount | Value |
| | Coupon | Date | ($000) | ($000) |
| Los Angeles CA Unified School District GO | 5.000% | 7/1/13 (Prere.) | 10,000 | 10,509 |
| Los Angeles CA Unified School District GO | 5.000% | 7/1/20 (3) | 6,655 | 7,656 |
| Los Angeles CA Unified School District GO | 5.000% | 7/1/21 | 3,500 | 4,243 |
| Los Angeles CA Unified School District GO | 5.000% | 7/1/24 (2) | 9,745 | 11,007 |
| Los Angeles CA Unified School District GO | 5.000% | 7/1/24 (2) | 7,500 | 8,471 |
| Los Angeles CA Unified School District GO | 5.250% | 7/1/24 | 6,275 | 7,436 |
| Los Angeles CA Unified School District GO | 5.250% | 7/1/25 | 5,000 | 5,861 |
| Los Angeles CA Unified School District GO | 5.250% | 7/1/28 | 7,000 | 8,150 |
| Los Angeles CA Unified School District GO | 5.000% | 7/1/30 (3) | 7,500 | 8,181 |
| Los Angeles CA Unified School District GO | 5.000% | 7/1/32 (4) | 8,000 | 8,963 |
| Los Angeles CA Unified School District GO | 5.000% | 1/1/34 | 5,000 | 5,550 |
| Los Angeles CA Unified School District GO | 5.250% | 7/1/34 | 10,000 | 11,457 |
| Los Angeles County CA Metropolitan | | | | |
| Transportation Authority Sales Tax Revenue | 5.000% | 7/1/23 | 5,000 | 6,189 |
| 2 Los Angeles County CA Metropolitan | | | | |
| Transportation Authority Sales Tax Revenue | | | | |
| TOB VRDO | 0.200% | 6/1/12 | 14,615 | 14,615 |
| Los Angeles County CA Public Works Financing | | | | |
| Authority Lease Revenue | 5.000% | 12/1/23 (14) | 4,000 | 4,410 |
| Los Angeles County CA Public Works Financing | | | | |
| Authority Lease Revenue | 5.000% | 12/1/24 (14) | 4,000 | 4,410 |
| Los Angeles County CA Public Works Financing | | | | |
| Authority Lease Revenue | 5.000% | 12/1/25 (14) | 1,265 | 1,382 |
| Los Angeles County CA Public Works Financing | | | | |
| Authority Revenue | 5.500% | 10/1/18 (4) | 1,890 | 2,144 |
| Los Angeles County CA Sanitation Districts | | | | |
| Financing Authority Capital Projects Revenue | 4.500% | 10/1/42 (2) | 2,500 | 2,526 |
| Los Angeles County CA Schools Regionalized | | | | |
| Business Services Corp. COP | 0.000% | 8/1/14 (ETM) | 1,000 | 920 |
| Los Angeles County CA Schools Regionalized | | | | |
| Business Services Corp. COP | 0.000% | 8/1/20 (2) | 2,095 | 1,429 |
| M-S-R California Energy Authority Revenue | 7.000% | 11/1/34 | 7,000 | 9,126 |
| M-S-R California Energy Authority Revenue | 6.500% | 11/1/39 | 7,000 | 8,668 |
| M-S-R California Public Power Agency Revenue | | | | |
| (San Juan Project) | 6.125% | 7/1/13 (2) | 3,485 | 3,560 |
| M-S-R California Public Power Agency Revenue | | | | |
| (San Juan Project) | 6.750% | 7/1/20 (ETM) | 12,255 | 15,277 |
| 1 Marin CA Municipal Water District Financing | | | | |
| Authority Water Revenue | 5.000% | 7/1/44 | 4,000 | 4,531 |
| Metropolitan Water District of Southern | | | | |
| California Revenue | 5.000% | 7/1/25 | 3,410 | 3,940 |
| Metropolitan Water District of Southern | | | | |
| California Revenue | 5.000% | 10/1/26 | 4,000 | 4,873 |
| Metropolitan Water District of Southern | | | | |
| California Revenue | 5.000% | 7/1/28 | 4,235 | 4,797 |
| Metropolitan Water District of Southern | | | | |
| California Revenue | 5.000% | 7/1/31 | 3,000 | 3,446 |
| Metropolitan Water District of Southern | | | | |
| California Revenue | 5.000% | 10/1/33 | 7,535 | 8,901 |
| Metropolitan Water District of Southern | | | | |
| California Revenue | 5.000% | 10/1/35 | 2,855 | 3,333 |
| Metropolitan Water District of Southern | | | | |
| California Revenue VRDO | 0.150% | 6/1/12 | 5,900 | 5,900 |
| Modesto CA High School District GO | 0.000% | 8/1/15 (14) | 5,000 | 4,816 |
| Modesto CA High School District GO | 0.000% | 8/1/17 (14) | 3,000 | 2,659 |
| Modesto CA High School District GO | 0.000% | 8/1/18 (14) | 3,225 | 2,753 |
79
| | | | |
| California Long-Term Tax-Exempt Fund | | | | |
| |
| |
| |
| | | | Face | Market |
| | | Maturity | Amount | Value |
| | Coupon | Date | ($000) | ($000) |
| Modesto CA Irrigation District COP | 5.500% | 7/1/35 | 1,000 | 1,083 |
| Modesto CA Irrigation District COP | 5.000% | 10/1/36 (2) | 4,795 | 4,963 |
| Modesto CA Irrigation District Financing | | | | |
| Authority Revenue (Woodland Project) | 6.500% | 10/1/22 (ETM) | 9,750 | 12,293 |
| Monterey Park CA Redevelopment Agency | | | | |
| Tax Allocation Revenue | 5.000% | 9/1/16 (4) | 1,010 | 1,019 |
| Monterey Park CA Redevelopment Agency | | | | |
| Tax Allocation Revenue | 5.000% | 9/1/17 (4) | 1,060 | 1,069 |
| Monterey Park CA Redevelopment Agency | | | | |
| Tax Allocation Revenue | 5.000% | 9/1/18 (4) | 1,115 | 1,124 |
| Monterey Park CA Redevelopment Agency | | | | |
| Tax Allocation Revenue | 5.000% | 9/1/19 (4) | 1,120 | 1,128 |
| Monterey Park CA Redevelopment Agency | | | | |
| Tax Allocation Revenue | 5.000% | 9/1/20 (4) | 1,180 | 1,188 |
| 1 Mount Diablo CA Unified School District GO | 5.000% | 6/1/37 | 1,915 | 2,090 |
| Mount San Antonio CA Community College | | | | |
| District GO | 5.250% | 8/1/14 (Prere.) | 3,335 | 3,692 |
| Mount San Antonio CA Community College | | | | |
| District GO | 5.250% | 8/1/14 (Prere.) | 3,170 | 3,509 |
| Mount San Antonio CA Community College | | | | |
| District GO | 5.250% | 8/1/14 (Prere.) | 3,010 | 3,332 |
| New Haven CA Unified School District GO | 12.000% | 8/1/16 (4) | 2,480 | 3,571 |
| New Haven CA Unified School District GO | 12.000% | 8/1/17 (4) | 1,500 | 2,300 |
| Newark CA Unified School District GO | 0.000% | 8/1/13 (4) | 2,050 | 2,037 |
| Newport Beach CA Revenue (Hoag Memorial | | | | |
| Hospital Presbyterian) | 6.000% | 12/1/40 | 3,500 | 4,230 |
| Newport Mesa CA Unified School District GO | 0.000% | 8/1/35 | 4,000 | 1,367 |
| Newport Mesa CA Unified School District GO | 0.000% | 8/1/36 | 1,000 | 323 |
| Newport Mesa CA Unified School District GO | 0.000% | 8/1/37 | 2,000 | 612 |
| Newport Mesa CA Unified School District GO | 0.000% | 8/1/38 | 1,000 | 291 |
| North Orange County CA Community College | | | | |
| District GO | 5.375% | 8/1/12 (Prere.) | 5,080 | 5,174 |
| Northern California Gas Authority No. 1 Revenue | 0.914% | 7/1/17 | 17,000 | 15,447 |
| Northern California Power Agency Revenue | | | | |
| (Hydroelectric Project) | 6.300% | 7/1/18 (14) | 10,000 | 11,486 |
| Northern California Power Agency Revenue | | | | |
| (Hydroelectric Project) | 7.500% | 7/1/21 (Prere.) | 1,810 | 2,519 |
| Northern California Power Agency Revenue | | | | |
| (Hydroelectric Project) | 5.000% | 7/1/27 | 2,255 | 2,607 |
| Northern California Power Agency Revenue | | | | |
| (Hydroelectric Project) | 5.000% | 7/1/32 | 1,155 | 1,297 |
| Oakland CA GO | 5.000% | 1/15/31 | 3,550 | 3,927 |
| Oakland CA Redevelopment Agency Tax | | | | |
| Allocation Revenue (Central District Project) | 5.500% | 2/1/14 (2) | 1,980 | 2,047 |
| Oceanside CA Unified School District GO | 0.000% | 8/1/25 (12) | 6,865 | 3,994 |
| Ohlone CA Community College District GO | 5.250% | 8/1/41 | 5,000 | 5,672 |
| Orange County CA Water District Revenue | 5.000% | 8/15/41 | 6,855 | 7,583 |
| Palmdale CA COP | 5.250% | 9/1/19 (14) | 1,310 | 1,347 |
| Palmdale CA COP | 5.250% | 9/1/20 (14) | 1,450 | 1,490 |
| Palmdale CA COP | 5.250% | 9/1/21 (14) | 1,605 | 1,648 |
| Palmdale CA COP | 5.250% | 9/1/22 (14) | 1,765 | 1,811 |
| Palo Alto CA Improvement Revenue | | | | |
| (University Avenue Area Parking) | 4.250% | 9/2/22 | 200 | 212 |
| Palo Alto CA Improvement Revenue | | | | |
| (University Avenue Area Parking) | 5.000% | 9/2/26 | 1,000 | 1,080 |
| Palomar Pomerado Health California COP | 6.000% | 11/1/41 | 3,000 | 3,153 |
80
| | | | |
| California Long-Term Tax-Exempt Fund | | | | |
| |
| |
| |
| | | | Face | Market |
| | | Maturity | Amount | Value |
| | Coupon | Date | ($000) | ($000) |
| Palomar Pomerado Health California GO | 4.500% | 8/1/32 (14) | 12,500 | 12,765 |
| Palomar Pomerado Health California GO | 0.000% | 8/1/33 (12) | 4,000 | 1,336 |
| Palomar Pomerado Health System | | | | |
| California Revenue | 5.375% | 11/1/13 (14) | 6,730 | 6,742 |
| Peralta CA Community College District Revenue | 5.000% | 8/1/39 | 4,000 | 4,348 |
| Pittsburg CA Redevelopment Agency Tax | | | | |
| Allocation Revenue (Los Medanos Community | | | | |
| Development Project) | 5.700% | 8/1/13 (Prere.) | 7,000 | 7,580 |
| Pittsburg CA Redevelopment Agency Tax | | | | |
| Allocation Revenue (Los Medanos Community | | | | |
| Development Project) | 0.000% | 8/1/19 (2) | 1,150 | 875 |
| Pittsburg CA Redevelopment Agency Tax | | | | |
| Allocation Revenue (Los Medanos Community | | | | |
| Development Project) | 0.000% | 8/1/21 (2) | 2,575 | 1,753 |
| Pittsburg CA Redevelopment Agency Tax | | | | |
| Allocation Revenue (Los Medanos Community | | | | |
| Development Project) | 0.000% | 8/1/22 (2) | 3,755 | 2,297 |
| Pittsburg CA Redevelopment Agency Tax | | | | |
| Allocation Revenue (Los Medanos Community | | | | |
| Development Project) | 0.000% | 8/1/24 (2) | 1,000 | 506 |
| Pomona CA Unified School District GO | 5.600% | 8/1/14 (ETM) | 1,585 | 1,767 |
| Pomona CA Unified School District GO | 5.600% | 8/1/15 (ETM) | 2,000 | 2,327 |
| Pomona CA Unified School District GO | 5.600% | 8/1/16 (ETM) | 1,000 | 1,210 |
| Pomona CA Unified School District GO | 7.500% | 8/1/17 (ETM) | 2,540 | 3,410 |
| Port of Oakland CA Revenue | 5.000% | 11/1/16 (14) | 8,160 | 9,267 |
| Port of Oakland CA Revenue | 5.000% | 11/1/17 (14) | 5,000 | 5,713 |
| 1 Poway CA Unified School District GO | 5.000% | 9/1/25 | 1,840 | 2,004 |
| Poway CA Unified School District GO | 5.000% | 8/1/27 | 5,575 | 6,590 |
| 1 Poway CA Unified School District GO | 5.000% | 9/1/27 | 2,060 | 2,210 |
| 1 Poway CA Unified School District GO | 5.000% | 9/1/31 | 1,375 | 1,448 |
| 1 Poway CA Unified School District GO | 5.000% | 9/1/33 | 1,000 | 1,050 |
| 1 Poway CA Unified School District GO | 5.000% | 9/1/36 | 700 | 726 |
| Rancho Mirage CA Joint Powers Financing | | | | |
| Authority Revenue (Eisenhower Medical Center) | 5.000% | 7/1/47 | 15,900 | 15,939 |
| Rancho Mirage CA Redevelopment Agency | | | | |
| Tax Allocation Revenue | 5.125% | 4/1/21 (14) | 2,650 | 2,656 |
| Rancho Mirage CA Redevelopment Agency | | | | |
| Tax Allocation Revenue | 5.250% | 4/1/26 (14) | 2,905 | 2,909 |
| Rancho Mirage CA Redevelopment Agency | | | | |
| Tax Allocation Revenue | 5.250% | 4/1/33 (14) | 3,000 | 3,002 |
| Rio Hondo CA Community College District GO | 5.000% | 8/1/30 | 6,655 | 7,457 |
| 2 Riverside CA Electric Revenue TOB VRDO | 0.200% | 6/1/12 | 6,000 | 6,000 |
| Riverside CA Unified School District Community | | | | |
| Facilities District No. 7 (Victoria Grove) Special | | | | |
| Tax Revenue | 5.000% | 9/1/31 (2) | 4,000 | 4,111 |
| Riverside County CA Asset Leasing Corp. | | | | |
| Leasehold Revenue (Riverside County | | | | |
| Hospital Project) | 0.000% | 6/1/13 (14) | 5,000 | 4,900 |
| Riverside County CA Asset Leasing Corp. | | | | |
| Leasehold Revenue (Riverside County | | | | |
| Hospital Project) | 0.000% | 6/1/14 (14) | 2,000 | 1,913 |
| Riverside County CA Asset Leasing Corp. | | | | |
| Leasehold Revenue (Riverside County | | | | |
| Hospital Project) | 0.000% | 6/1/15 (14) | 2,000 | 1,861 |
| Roseville CA Electric System Revenue | 5.000% | 2/1/37 | 4,500 | 4,887 |
81
| | | | |
| California Long-Term Tax-Exempt Fund | | | | |
| |
| |
| |
| | | | Face | Market |
| | | Maturity | Amount | Value |
| | Coupon | Date | ($000) | ($000) |
| Roseville CA Natural Gas Financing Authority | | | | |
| Gas Revenue | 5.000% | 2/15/22 | 1,440 | 1,539 |
| Roseville CA Natural Gas Financing Authority | | | | |
| Gas Revenue | 5.000% | 2/15/28 | 2,450 | 2,567 |
| Sacramento CA Financing Authority | | | | |
| Lease Revenue | 5.375% | 11/1/14 (2) | 5,255 | 5,485 |
| Sacramento CA Financing Authority | | | | |
| Lease Revenue | 5.400% | 11/1/20 (2) | 6,785 | 7,835 |
| Sacramento CA Municipal Utility District Revenue | 5.900% | 7/1/20 (2) | 15,850 | 20,121 |
| Sacramento CA Municipal Utility District Revenue | 5.000% | 8/15/31 | 1,175 | 1,347 |
| Sacramento CA Municipal Utility District Revenue | 5.000% | 8/15/32 | 1,195 | 1,363 |
| Sacramento CA Municipal Utility District Revenue | 5.000% | 8/15/33 | 1,450 | 1,647 |
| Sacramento CA Municipal Utility District Revenue | | | | |
| VRDO | 0.150% | 6/7/12 LOC | 3,800 | 3,800 |
| Sacramento County CA Airport Revenue | 5.250% | 7/1/12 (Prere.) | 2,305 | 2,315 |
| Sacramento County CA Sanitation Districts | | | | |
| Financing Authority Revenue | 5.000% | 12/1/26 (14) | 5,000 | 5,613 |
| Sacramento County CA Sanitation Districts | | | | |
| Financing Authority Revenue | 5.000% | 12/1/30 (14) | 5,650 | 6,310 |
| San Bernardino County CA Medical Center COP | 6.500% | 8/1/17 (14) | 15,830 | 17,042 |
| San Bernardino County CA Transportation | | | | |
| Authority Revenue | 5.000% | 3/1/32 | 4,035 | 4,672 |
| 2 San Bernardino County CA Transportation | | | | |
| Authority Sales Tax Revenue TOB VRDO | 0.200% | 6/7/12 | 7,998 | 7,998 |
| San Diego CA Community College District GO | 5.000% | 8/1/28 | 6,000 | 7,184 |
| San Diego CA Community College District GO | 5.250% | 8/1/33 | 2,500 | 2,895 |
| San Diego CA Community College District GO | 0.000% | 8/1/36 | 8,000 | 2,426 |
| San Diego CA Community College District GO | 5.000% | 8/1/36 | 2,500 | 2,825 |
| San Diego CA Community College District GO | 0.000% | 8/1/38 | 3,510 | 951 |
| San Diego CA Community College District GO | 5.000% | 8/1/41 | 3,000 | 3,380 |
| San Diego CA Public Facilities Financing | | | | |
| Authority Sewer Revenue | 5.250% | 5/15/34 | 6,000 | 6,830 |
| San Diego CA Public Facilities Financing | | | | |
| Authority Sewer Revenue | 5.250% | 5/15/39 | 7,000 | 7,898 |
| San Diego CA Public Facilities Financing | | | | |
| Authority Water Revenue | 5.750% | 8/1/35 | 2,500 | 2,962 |
| San Diego CA Public Facilities Financing | | | | |
| Authority Water Revenue | 5.250% | 8/1/38 | 1,500 | 1,668 |
| San Diego CA Public Facilities Financing | | | | |
| Authority Water Revenue | 5.500% | 8/1/39 | 5,000 | 5,773 |
| San Diego CA Unified School District GO | 0.000% | 7/1/15 (14) | 2,770 | 2,686 |
| San Diego CA Unified School District GO | 5.500% | 7/1/24 (14) | 10,000 | 12,942 |
| San Diego CA Unified School District GO | 5.500% | 7/1/25 (14) | 9,000 | 11,669 |
| San Diego CA Unified School District GO | 0.000% | 7/1/29 | 8,150 | 3,655 |
| San Diego CA Unified School District GO | 0.000% | 7/1/30 | 1,500 | 634 |
| San Diego County CA COP | 5.000% | 2/1/28 (2) | 2,000 | 2,152 |
| San Diego County CA COP | 5.000% | 2/1/30 (2) | 2,345 | 2,512 |
| San Diego County CA Regional Airport | | | | |
| Authority Revenue | 5.000% | 7/1/26 | 4,000 | 4,546 |
| San Diego County CA Regional Airport | | | | |
| Authority Revenue | 5.000% | 7/1/28 | 3,200 | 3,583 |
| San Diego County CA Regional Airport | | | | |
| Authority Revenue | 5.000% | 7/1/34 | 2,715 | 2,956 |
| 1 San Diego County CA Regional Airport | | | | |
| Authority Revenue | 5.000% | 4/1/37 | 1,500 | 1,696 |
82
| | | | |
| California Long-Term Tax-Exempt Fund | | | | |
| |
| |
| |
| | | | Face | Market |
| | | Maturity | Amount | Value |
| | Coupon | Date | ($000) | ($000) |
| 1 San Diego County CA Regional Airport | | | | |
| Authority Revenue | 5.000% | 4/1/38 | 2,000 | 2,260 |
| San Diego County CA Regional Airport | | | | |
| Authority Revenue | 5.000% | 7/1/40 | 3,000 | 3,242 |
| 1 San Diego County CA Regional Airport | | | | |
| Authority Revenue | 5.000% | 4/1/48 | 3,000 | 3,326 |
| San Diego County CA Water Authority | | | | |
| Revenue | 5.000% | 5/1/31 | 4,700 | 5,419 |
| San Diego County CA Water Authority | | | | |
| Revenue COP | 5.000% | 5/1/26 (4) | 7,275 | 8,225 |
| San Francisco CA Bay Area Rapid Transit | | | | |
| District GO | 5.000% | 8/1/35 | 10,000 | 11,418 |
| San Francisco CA City & County GO | 5.000% | 6/15/23 | 6,000 | 7,377 |
| San Francisco CA City & County International | | | | |
| Airport Revenue | 5.000% | 5/1/18 | 6,300 | 7,556 |
| San Francisco CA City & County International | | | | |
| Airport Revenue | 5.000% | 5/1/19 | 7,500 | 9,123 |
| San Francisco CA City & County International | | | | |
| Airport Revenue | 5.000% | 5/1/20 | 5,315 | 6,460 |
| San Francisco CA City & County International | | | | |
| Airport Revenue | 5.000% | 5/1/25 | 5,220 | 6,113 |
| San Francisco CA City & County International | | | | |
| Airport Revenue | 5.000% | 5/1/29 | 2,065 | 2,375 |
| San Francisco CA City & County Public Utilities | | | | |
| Commission Water Revenue | 5.000% | 11/1/29 | 8,430 | 9,804 |
| San Francisco CA City & County Public Utilities | | | | |
| Commission Water Revenue | 5.000% | 11/1/31 | 1,100 | 1,266 |
| San Francisco CA City & County Public Utilities | | | | |
| Commission Water Revenue | 5.000% | 11/1/31 | 1,205 | 1,386 |
| San Francisco CA City & County Public Utilities | | | | |
| Commission Water Revenue | 5.000% | 11/1/34 | 1,275 | 1,455 |
| San Francisco CA City & County Public Utilities | | | | |
| Commission Water Revenue | 5.000% | 11/1/35 | 2,605 | 2,934 |
| San Francisco CA City & County Public Utilities | | | | |
| Commission Water Revenue | 4.750% | 11/1/36 (4) | 4,500 | 4,763 |
| 1 San Francisco CA City & County Public Utilities | | | | |
| Commission Water Revenue | 5.000% | 11/1/43 | 10,000 | 11,088 |
| 2 San Francisco CA City & County Public Utilities | | | | |
| Commission Water Revenue TOB VRDO | 0.180% | 6/7/12 | 4,600 | 4,600 |
| San Francisco CA City & County Redevelopment | | | | |
| Financing Authority Tax Allocation Revenue | | | | |
| (Mission Bay North) | 6.500% | 8/1/39 | 2,000 | 2,290 |
| San Francisco CA City & County Redevelopment | | | | |
| Financing Authority Tax Allocation Revenue | | | | |
| (Mission Bay North) | 6.750% | 8/1/41 | 1,000 | 1,148 |
| San Francisco CA City & County Unified School | | | | |
| District GO | 5.250% | 6/15/24 | 4,000 | 4,721 |
| San Francisco CA City & County Unified School | | | | |
| District GO | 5.000% | 6/15/32 | 8,365 | 9,482 |
| San Joaquin Hills CA Transportation Corridor | | | | |
| Agency Toll Road Revenue | 0.000% | 1/15/24 (14) | 6,000 | 3,070 |
| San Joaquin Hills CA Transportation Corridor | | | | |
| Agency Toll Road Revenue | 0.000% | 1/15/25 (14) | 6,000 | 2,898 |
| San Joaquin Hills CA Transportation Corridor | | | | |
| Agency Toll Road Revenue | 0.000% | 1/15/30 (14) | 7,000 | 2,491 |
83
| | | | |
| California Long-Term Tax-Exempt Fund | | | | |
| |
| |
| |
| | | | Face | Market |
| | | Maturity | Amount | Value |
| | Coupon | Date | ($000) | ($000) |
| San Joaquin Hills CA Transportation Corridor | | | | |
| Agency Toll Road Revenue | 0.000% | 1/15/31 (14) | 11,950 | 4,010 |
| San Jose CA Airport Revenue | 5.000% | 3/1/33 (2) | 4,000 | 4,189 |
| San Jose CA Redevelopment Agency Tax | | | | |
| Allocation Revenue | 5.500% | 8/1/30 | 850 | 886 |
| San Jose CA Redevelopment Agency Tax | | | | |
| Allocation Revenue | 5.500% | 8/1/35 | 2,750 | 2,847 |
| San Jose CA Special Hotel Tax Revenue | | | | |
| (Convention Center Expansion & | | | | |
| Renovation Project) | 6.500% | 5/1/42 | 5,000 | 5,719 |
| San Juan CA Unified School District GO | 0.000% | 8/1/13 (4) | 2,220 | 2,208 |
| San Juan CA Unified School District GO | 0.000% | 8/1/14 (4) | 2,610 | 2,558 |
| San Juan CA Unified School District GO | 0.000% | 8/1/16 (4) | 2,000 | 1,840 |
| San Juan CA Unified School District GO | 0.000% | 8/1/18 (4) | 1,785 | 1,501 |
| San Juan CA Unified School District GO | 0.000% | 8/1/19 (4) | 2,210 | 1,779 |
| San Juan CA Unified School District GO | 0.000% | 8/1/20 (4) | 4,930 | 3,851 |
| San Juan CA Unified School District GO | 0.000% | 8/1/23 (4) | 4,540 | 2,972 |
| 2 San Marcos CA Public Facilities Authority | | | | |
| Tax Allocation Revenue TOB VRDO | 0.170% | 6/1/12 LOC | 800 | 800 |
| San Marcos CA Unified School District GO | 5.000% | 8/1/34 | 5,620 | 6,243 |
| San Marcos CA Unified School District GO | 5.000% | 8/1/38 | 2,835 | 3,110 |
| San Mateo County CA Community College | | | | |
| District GO | 5.000% | 9/1/31 | 5,000 | 5,589 |
| 2 San Mateo County CA Community College | | | | |
| District GO TOB VRDO | 0.200% | 6/7/12 | 7,565 | 7,565 |
| San Mateo County CA Joint Powers | | | | |
| Financing Authority Lease Revenue | | | | |
| (Capital Project Program) | 6.500% | 7/1/13 (14) | 6,375 | 6,586 |
| San Mateo County CA Joint Powers | | | | |
| Financing Authority Lease Revenue | | | | |
| (Capital Project Program) | 5.000% | 7/1/21 (14) | 3,500 | 4,009 |
| San Ramon Valley CA Unified School District GO | 0.000% | 7/1/13 (14) | 3,680 | 3,665 |
| San Ramon Valley CA Unified School District GO | 0.000% | 7/1/14 (14) | 8,290 | 8,175 |
| San Ramon Valley CA Unified School District GO | 0.000% | 7/1/15 (14) | 2,005 | 1,949 |
| Santa Ana CA Financing Authority Police | | | | |
| Administration & Holding Facility Lease | | | | |
| Revenue | 6.250% | 7/1/16 (14) | 5,345 | 6,072 |
| Santa Ana CA Financing Authority Police | | | | |
| Administration & Holding Facility Lease | | | | |
| Revenue | 6.250% | 7/1/17 (14) | 2,000 | 2,302 |
| Santa Clara CA Electric Revenue | 5.000% | 7/1/21 (14) | 2,000 | 2,093 |
| Santa Clara CA Electric Revenue | 6.000% | 7/1/31 | 3,000 | 3,602 |
| Santa Clara CA Unified School District GO | 5.000% | 7/1/34 | 4,000 | 4,443 |
| Santa Clara County CA Financing Authority | | | | |
| Lease Revenue (Multiple Facilities Projects) | 5.250% | 5/15/36 | 5,000 | 5,523 |
| Santa Rosa CA Wastewater Revenue | 6.000% | 7/2/15 (2) | 4,935 | 5,244 |
| Santa Rosa CA Wastewater Revenue | 6.000% | 9/1/15 (4) | 3,930 | 4,218 |
| 1 Santa Rosa CA Wastewater Revenue | 5.000% | 9/1/28 | 4,845 | 5,565 |
| Solano County CA COP | 5.250% | 11/1/12 (Prere.) | 3,785 | 3,865 |
| Solano County CA COP | 5.250% | 11/1/12 (Prere.) | 3,770 | 3,849 |
| Sonoma-Marin Area Rail Transportation District | | | | |
| California Sales & Use Tax Revenue | 5.000% | 3/1/28 | 3,500 | 4,088 |
| South San Francisco CA Redevelopment Agency | | | | |
| Tax Allocation Revenue | 5.000% | 9/1/35 (14) | 8,610 | 8,744 |
| Southern California Public Power | | | | |
| Authority Revenue | 5.000% | 7/1/29 | 5,000 | 5,709 |
84
| | | | |
| California Long-Term Tax-Exempt Fund | | | | |
| |
| |
| |
| | | | Face | Market |
| | | Maturity | Amount | Value |
| | Coupon | Date | ($000) | ($000) |
| Southern California Public Power Authority | | | | |
| Revenue (Mead-Adelanto Project) VRDO | 0.180% | 6/1/12 | 8,500 | 8,500 |
| Southern California Public Power Authority | | | | |
| Revenue (Milford Wind Corridor Phase I Project) | 5.000% | 7/1/30 | 5,000 | 5,663 |
| Southern California Public Power Authority | | | | |
| Revenue (Natural Gas Project) | 5.000% | 11/1/17 | 1,865 | 2,040 |
| Southern California Public Power Authority | | | | |
| Revenue (Natural Gas Project) | 5.000% | 11/1/33 | 3,000 | 3,092 |
| Southern California Public Power Authority | | | | |
| Revenue (Transmission Project) | 5.750% | 7/1/21 (14) | 220 | 221 |
| Southern California Public Power Authority | | | | |
| Revenue (Transmission Project) | 5.000% | 7/1/23 | 5,000 | 5,814 |
| 2 Sweetwater CA Unified School District GO | | | | |
| TOB VRDO | 0.200% | 6/7/12 (13) | 700 | 700 |
| Tobacco Securitization Authority Revenue | | | | |
| (Northern California Tobacco Settlement) | 5.375% | 6/1/38 | 4,500 | 3,510 |
| Tobacco Securitization Authority Revenue | | | | |
| (Southern California Tobacco Settlement) | 5.000% | 6/1/37 | 2,155 | 1,645 |
| Torrance CA Hospital Revenue | | | | |
| (Torrance Memorial Medical Center) | 5.000% | 9/1/40 | 3,000 | 3,146 |
| 2 Torrance CA Hospital Revenue | | | | |
| (Torrance Memorial Medical Center) | | | | |
| TOB VRDO | 0.200% | 6/7/12 LOC | 1,900 | 1,900 |
| Turlock CA Irrigation District Revenue | 5.000% | 1/1/31 | 2,000 | 2,173 |
| Turlock CA Irrigation District Revenue | 5.000% | 1/1/35 | 3,000 | 3,243 |
| Turlock CA Irrigation District Revenue | 5.500% | 1/1/41 | 3,445 | 3,916 |
| Ukiah CA Electric Revenue | 6.250% | 6/1/18 (14) | 4,050 | 4,414 |
| Union CA Elementary School District GO | 0.000% | 9/1/15 (14) | 3,860 | 3,744 |
| Union CA Elementary School District GO | 0.000% | 9/1/16 (14) | 1,500 | 1,397 |
| Union CA Elementary School District GO | 0.000% | 9/1/17 (14) | 2,295 | 2,048 |
| Union CA Elementary School District GO | 0.000% | 9/1/18 (14) | 1,630 | 1,397 |
| Union CA Elementary School District GO | 0.000% | 9/1/19 (14) | 1,750 | 1,439 |
| Union CA Elementary School District GO | 0.000% | 9/1/20 (14) | 2,300 | 1,791 |
| Union CA Elementary School District GO | 0.000% | 9/1/21 (14) | 2,000 | 1,491 |
| University of California Regents Medical | | | | |
| Center Revenue VRDO | 0.170% | 6/1/12 | 6,700 | 6,700 |
| University of California Revenue | 5.750% | 5/15/25 | 7,000 | 8,569 |
| University of California Revenue | 4.750% | 5/15/33 | 9,425 | 10,109 |
| University of California Revenue | 5.000% | 5/15/33 (2) | 10,000 | 10,370 |
| University of California Revenue | 5.000% | 5/15/34 | 5,205 | 5,908 |
| University of California Revenue | 5.000% | 5/15/34 | 3,220 | 3,637 |
| University of California Revenue | 5.000% | 5/15/35 | 3,640 | 4,113 |
| University of California Revenue | 5.250% | 5/15/39 | 7,000 | 7,884 |
| University of California Revenue | 5.000% | 5/15/40 | 2,395 | 2,666 |
| University of California Revenue | 5.000% | 5/15/41 | 5,000 | 5,560 |
| 2 University of California Revenue TOB VRDO | 0.200% | 6/1/12 | 3,100 | 3,100 |
| 2 University of California Revenue TOB VRDO | 0.200% | 6/1/12 | 10,500 | 10,500 |
| 2 University of California Revenue TOB VRDO | 0.250% | 6/7/12 | 7,330 | 7,330 |
| Vallejo CA Sanitation & Flood Control COP | 5.000% | 7/1/19 (14) | 3,892 | 4,051 |
| Ventura County CA Community College | | | | |
| District GO | 5.500% | 8/1/33 | 8,500 | 10,119 |
| Walnut CA Energy Center Authority Revenue | 5.000% | 1/1/35 | 2,000 | 2,154 |
| Walnut CA Energy Center Authority Revenue | 5.000% | 1/1/40 | 10,000 | 10,696 |
| Walnut Valley CA Unified School District GO | 6.000% | 8/1/14 (ETM) | 2,205 | 2,477 |
| Walnut Valley CA Unified School District GO | 6.000% | 8/1/15 (ETM) | 2,470 | 2,891 |
| Walnut Valley CA Unified School District GO | 6.000% | 8/1/16 (ETM) | 2,690 | 3,273 |
85
| | | | |
| California Long-Term Tax-Exempt Fund | | | | |
| |
| |
| |
| | | | Face | Market |
| | | Maturity | Amount | Value |
| | Coupon | Date | ($000) | ($000) |
| Washington Township CA Health Care | | | | |
| District Revenue | 5.000% | 7/1/32 | 3,000 | 3,082 |
| Washington Township CA Health Care | | | | |
| District Revenue | 5.000% | 7/1/37 | 3,500 | 3,580 |
| West Contra Costa CA Unified School District GO | 5.250% | 8/1/35 (4) | 7,000 | 7,883 |
| Yuba City CA Unified School District GO | 0.000% | 9/1/15 (14) | 1,870 | 1,760 |
| Yuba City CA Unified School District GO | 0.000% | 9/1/17 (14) | 2,060 | 1,769 |
| Yuba City CA Unified School District GO | 0.000% | 9/1/19 (14) | 2,270 | 1,750 |
| | | | | 2,925,307 |
| Puerto Rico (0.2%) | | | | |
| Puerto Rico Municipal Finance Agency GO | 5.250% | 7/1/19 (11) | 2,250 | 2,508 |
| Puerto Rico Municipal Finance Agency GO | 5.250% | 7/1/20 (11) | 1,300 | 1,442 |
| Puerto Rico Public Buildings Authority | | | | |
| Government Facilities Revenue | 5.250% | 7/1/14 (Prere.) | 75 | 82 |
| 2 Puerto Rico Sales Tax Financing Corp. | | | | |
| Revenue TOB VRDO | 0.240% | 6/7/12 LOC | 1,510 | 1,510 |
| | | | | 5,542 |
| Total Tax-Exempt Municipal Bonds (Cost $2,714,339) | | | | 2,930,849 |
| Other Assets and Liabilities (-1.0%) | | | | |
| Other Assets | | | | 40,927 |
| Liabilities | | | | (70,456) |
| | | | | (29,529) |
| Net Assets (100%) | | | | 2,901,320 |
| |
| |
| At May 31, 2012, net assets consisted of: | | | | |
| | | | | Amount |
| | | | | ($000) |
| Paid-in Capital | | | | 2,799,694 |
| Undistributed Net Investment Income | | | | — |
| Accumulated Net Realized Losses | | | | (114,884) |
| Unrealized Appreciation (Depreciation) | | | | 216,510 |
| Net Assets | | | | 2,901,320 |
| |
| |
| Investor Shares—Net Assets | | | | |
| Applicable to 41,016,239 outstanding $.001 par value shares of | | | |
| beneficial interest (unlimited authorization) | | | | 484,618 |
| Net Asset Value Per Share—Investor Shares | | | | $11.82 |
| |
| |
| Admiral Shares—Net Assets | | | | |
| Applicable to 204,539,808 outstanding $.001 par value shares of | | | |
| beneficial interest (unlimited authorization) | | | | 2,416,702 |
| Net Asset Value Per Share—Admiral Shares | | | | $11.82 |
See Note A in Notes to Financial Statements.
1 Security purchased on a when-issued or delayed-delivery basis for which the fund has not taken delivery as of May 31, 2012.
2 Security exempt from registration under Rule 144A of the Securities Act of 1933. Such securities may be sold in transactions exempt from registration, normally to qualified institutional buyers. At May 31, 2012, the aggregate value of these securities was $113,926,000, representing 3.9% of net assets.
A key to abbreviations and other references follows the Statement of Net Assets.
See accompanying Notes, which are an integral part of the Financial Statements.
86
California Long-Term Tax-Exempt Fund
Key to Abbreviations
ARS—Auction Rate Security.
BAN—Bond Anticipation Note.
COP—Certificate of Participation.
CP—Commercial Paper.
FR—Floating Rate.
GAN—Grant Anticipation Note.
GO—General Obligation Bond.
PUT—Put Option Obligation.
RAN—Revenue Anticipation Note.
TAN—Tax Anticipation Note.
TOB—Tender Option Bond.
TRAN—Tax Revenue Anticipation Note.
VRDO—Variable Rate Demand Obligation.
VRDP—Variable Rate Demand Preferred.
(ETM)—Escrowed to Maturity.
(Prere.)—Prerefunded.
Scheduled principal and interest payments are guaranteed by:
(1) MBIA (Municipal Bond Investors Assurance).
(2) AMBAC (Ambac Assurance Corporation).
(3) FGIC (Financial Guaranty Insurance Company).
(4) AGM (Assured Guaranty Municipal Corporation).
(5) BIGI (Bond Investors Guaranty Insurance).
(6) Connie Lee Inc.
(7) FHA (Federal Housing Authority).
(8) CapMAC (Capital Markets Assurance Corporation).
(9) American Capital Access Financial Guaranty Corporation.
(10) XL Capital Assurance Inc.
(11) CIFG (CDC IXIS Financial Guaranty).
(12) Assured Guaranty Corporation.
(13) Berkshire Hathaway Assurance Corporation.
(14) National Public Finance Guarantee Corporation.
The insurance does not guarantee the market value of the municipal bonds.
LOC—Scheduled principal and interest payments are guaranteed by bank letter of credit.
87
California Long-Term Tax-Exempt Fund
Statement of Operations
| |
| | Six Months Ended |
| | May 31, 2012 |
| | ($000) |
| Investment Income | |
| Income | |
| Interest | 58,591 |
| Total Income | 58,591 |
| Expenses | |
| The Vanguard Group—Note B | |
| Investment Advisory Services | 84 |
| Management and Administrative—Investor Shares | 381 |
| Management and Administrative—Admiral Shares | 1,062 |
| Marketing and Distribution—Investor Shares | 65 |
| Marketing and Distribution—Admiral Shares | 260 |
| Custodian Fees | 17 |
| Shareholders’ Reports—Investor Shares | 5 |
| Shareholders’ Reports—Admiral Shares | 3 |
| Trustees’ Fees and Expenses | 1 |
| Total Expenses | 1,878 |
| Net Investment Income | 56,713 |
| Realized Net Gain (Loss) | |
| Investment Securities Sold | 3,866 |
| Futures Contracts | (72) |
| Realized Net Gain (Loss) | 3,794 |
| Change in Unrealized Appreciation (Depreciation) of Investment Securities | 133,502 |
| Net Increase (Decrease) in Net Assets Resulting from Operations | 194,009 |
See accompanying Notes, which are an integral part of the Financial Statements.
88
California Long-Term Tax-Exempt Fund
Statement of Changes in Net Assets
| | |
| | Six Months Ended | Year Ended |
| | May 31, | November 30, |
| | 2012 | 2011 |
| | ($000) | ($000) |
| Increase (Decrease) in Net Assets | | |
| Operations | | |
| Net Investment Income | 56,713 | 115,255 |
| Realized Net Gain (Loss) | 3,794 | (17,030) |
| Change in Unrealized Appreciation (Depreciation) | 133,502 | 66,022 |
| Net Increase (Decrease) in Net Assets Resulting from Operations | 194,009 | 164,247 |
| Distributions | | |
| Net Investment Income | | |
| Investor Shares | (9,251) | (19,336) |
| Admiral Shares | (47,462) | (95,919) |
| Realized Capital Gain | | |
| Investor Shares | — | — |
| Admiral Shares | — | — |
| Total Distributions | (56,713) | (115,255) |
| Capital Share Transactions | | |
| Investor Shares | 21,524 | (95,102) |
| Admiral Shares | 68,242 | (129,177) |
| Net Increase (Decrease) from Capital Share Transactions | 89,766 | (224,279) |
| Total Increase (Decrease) | 227,062 | (175,287) |
| Net Assets | | |
| Beginning of Period | 2,674,258 | 2,849,545 |
| End of Period | 2,901,320 | 2,674,258 |
See accompanying Notes, which are an integral part of the Financial Statements.
89
California Long-Term Tax-Exempt Fund
Financial Highlights
| | | | | | |
| Investor Shares | | | | | | |
| Six Months | | | | | |
| | Ended | | | | | |
| For a Share Outstanding | May 31, | | | Year Ended November 30, |
| Throughout Each Period | 2012 | 2011 | 2010 | 2009 | 2008 | 2007 |
| Net Asset Value, Beginning of Period | $11.24 | $11.01 | $10.98 | $10.19 | $11.46 | $11.86 |
| Investment Operations | | | | | | |
| Net Investment Income | .231 | .473 | .476 | .481 | .499 | .531 |
| Net Realized and Unrealized Gain (Loss) | | | | | | |
| on Investments | .580 | .230 | .030 | .790 | (1.270) | (.400) |
| Total from Investment Operations | .811 | .703 | .506 | 1.271 | (.771) | .131 |
| Distributions | | | | | | |
| Dividends from Net Investment Income | (.231) | (.473) | (.476) | (.481) | (.499) | (.531) |
| Distributions from Realized Capital Gains | — | — | — | — | — | — |
| Total Distributions | (.231) | (.473) | (.476) | (.481) | (.499) | (.531) |
| Net Asset Value, End of Period | $11.82 | $11.24 | $11.01 | $10.98 | $10.19 | $11.46 |
| |
| Total Return1 | 7.25% | 6.60% | 4.63% | 12.71% | -6.95% | 1.15% |
| |
| Ratios/Supplemental Data | | | | | | |
| Net Assets, End of Period (Millions) | $485 | $441 | $529 | $691 | $670 | $732 |
| Ratio of Total Expenses to | | | | | | |
| Average Net Assets | 0.20% | 0.20% | 0.20% | 0.20% | 0.15% | 0.15% |
| Ratio of Net Investment Income to | | | | | | |
| Average Net Assets | 3.97% | 4.33% | 4.26% | 4.51% | 4.51% | 4.58% |
| Portfolio Turnover Rate | 17% | 14% | 18% | 18% | 27% | 23% |
The expense ratio, net income ratio, and turnover rate for the current period have been annualized.
1 Total returns do not include account service fees that may have applied in the periods shown. Fund prospectuses provide information about any applicable account service fees.
See accompanying Notes, which are an integral part of the Financial Statements.
90
California Long-Term Tax-Exempt Fund
Financial Highlights
| | | | | | |
| Admiral Shares | | | | | | |
| Six Months | | | | | |
| | Ended | | | | | |
| For a Share Outstanding | May 31, | | | Year Ended November 30, |
| Throughout Each Period | 2012 | 2011 | 2010 | 2009 | 2008 | 2007 |
| Net Asset Value, Beginning of Period | $11.24 | $11.01 | $10.98 | $10.19 | $11.46 | $11.86 |
| Investment Operations | | | | | | |
| Net Investment Income | .235 | .482 | .485 | .490 | .507 | .540 |
| Net Realized and Unrealized Gain (Loss) | | | | | | |
| on Investments | .580 | .230 | .030 | .790 | (1.270) | (.400) |
| Total from Investment Operations | .815 | .712 | .515 | 1.280 | (.763) | .140 |
| Distributions | | | | | | |
| Dividends from Net Investment Income | (.235) | (.482) | (.485) | (.490) | (.507) | (.540) |
| Distributions from Realized Capital Gains | — | — | — | — | — | — |
| Total Distributions | (.235) | (.482) | (.485) | (.490) | (.507) | (.540) |
| Net Asset Value, End of Period | $11.82 | $11.24 | $11.01 | $10.98 | $10.19 | $11.46 |
| |
| Total Return1 | 7.29% | 6.68% | 4.72% | 12.80% | -6.88% | 1.22% |
| |
| Ratios/Supplemental Data | | | | | | |
| Net Assets, End of Period (Millions) | $2,417 | $2,234 | $2,321 | $2,183 | $2,078 | $2,251 |
| Ratio of Total Expenses to | | | | | | |
| Average Net Assets | 0.12% | 0.12% | 0.12% | 0.12% | 0.08% | 0.08% |
| Ratio of Net Investment Income to | | | | | | |
| Average Net Assets | 4.05% | 4.41% | 4.34% | 4.59% | 4.58% | 4.65% |
| Portfolio Turnover Rate | 17% | 14% | 18% | 18% | 27% | 23% |
The expense ratio, net income ratio, and turnover rate for the current period have been annualized.
1 Total returns do not include account service fees that may have applied in the periods shown. Fund prospectuses provide information about any applicable account service fees.
See accompanying Notes, which are an integral part of the Financial Statements.
91
California Long-Term Tax-Exempt Fund
Notes to Financial Statements
Vanguard California Long-Term Tax-Exempt Fund is registered under the Investment Company Act of 1940 as an open-end investment company, or mutual fund. The fund invests in debt instruments of municipal issuers whose ability to meet their obligations may be affected by economic and political developments in the state. The fund offers two classes of shares: Investor Shares and Admiral Shares. Investor Shares are available to any investor who meets the fund’s minimum purchase requirements. Admiral Shares are designed for investors who meet certain administrative, service, and account-size criteria.
A. The following significant accounting policies conform to generally accepted accounting principles for U.S. mutual funds. The fund consistently follows such policies in preparing its financial statements.
1. Security Valuation: Bonds, and temporary cash investments acquired over 60 days to maturity, are valued using the latest bid prices or using valuations based on a matrix system (which considers such factors as security prices, yields, maturities, and ratings), both as furnished by independent pricing services. Other temporary cash investments are valued at amortized cost, which approximates market value. Securities for which market quotations are not readily available, or whose values have been affected by events occurring before the fund’s pricing time but after the close of the securities’ primary markets, are valued by methods deemed by the board of trustees to represent fair value.
2. Futures Contracts: The fund uses futures contracts to invest in fixed income asset classes with greater efficiency and lower cost than is possible through direct investment, to add value when these instruments are attractively priced, or to adjust sensitivity to changes in interest rates. The primary risks associated with the use of futures contracts are imperfect correlation between changes in market values of bonds held by the fund and the prices of futures contracts, and the possibility of an illiquid market.
Futures contracts are valued based upon their quoted daily settlement prices. The aggregate principal amounts of the contracts are not recorded in the Statement of Net Assets. Fluctuations in the value of the contracts are recorded in the Statement of Net Assets as an asset (liability) and in the Statement of Operations as unrealized appreciation (depreciation) until the contracts are closed, when they are recorded as realized futures gains (losses).
The fund had no open futures contracts at May 31, 2012.
3. Federal Income Taxes: The fund intends to continue to qualify as a regulated investment company and distribute all of its income. Management has analyzed the fund’s tax positions taken for all open federal income tax years (November 30, 2008–2011), and for the period ended May 31, 2012, and has concluded that no provision for federal income tax is required in the fund’s financial statements.
4. Distributions: Distributions from net investment income are declared daily and paid on the first business day of the following month. Annual distributions from realized capital gains, if any, are recorded on the ex-dividend date.
5. Other: Interest income is accrued daily. Premiums and discounts on debt securities purchased are amortized and accreted, respectively, to interest income over the lives of the respective securities. Security transactions are accounted for on the date securities are bought or sold. Costs used to determine realized gains (losses) on the sale of investment securities are those of the specific securities sold.
92
California Long-Term Tax-Exempt Fund
Each class of shares has equal rights as to assets and earnings, except that each class separately bears certain class-specific expenses related to maintenance of shareholder accounts (included in Management and Administrative expenses) and shareholder reporting. Marketing and distribution expenses are allocated to each class of shares based on a method approved by the board of trustees. Income, other non-class-specific expenses, and gains and losses on investments are allocated to each class of shares based on its relative net assets.
B. The Vanguard Group furnishes at cost investment advisory, corporate management, administrative, marketing, and distribution services. The costs of such services are allocated to the fund under methods approved by the board of trustees. The fund has committed to provide up to 0.40% of its net assets in capital contributions to Vanguard. At May 31, 2012, the fund had contributed capital of $419,000 to Vanguard (included in Other Assets), representing 0.01% of the fund’s net assets and 0.17% of Vanguard’s capitalization. The fund’s trustees and officers are also directors and officers of Vanguard.
C. Various inputs may be used to determine the value of the fund’s investments. These inputs are summarized in three broad levels for financial statement purposes. The inputs or methodologies used to value securities are not necessarily an indication of the risk associated with investing in those securities.
Level 1—Quoted prices in active markets for identical securities.
Level 2—Other significant observable inputs (including quoted prices for similar securities, interest rates, prepayment speeds, credit risk, etc.).
Level 3—Significant unobservable inputs (including the fund’s own assumptions used to determine the fair value of investments).
At May 31, 2012, 100% of the market value of the fund’s investments was determined based on Level 2 inputs.
D. Capital gain distributions are determined on a tax basis and may differ from realized capital gains for financial reporting purposes. Differences may be permanent or temporary. Permanent differences are reclassified among capital accounts in the financial statements to reflect their tax character. Temporary differences arise when gains or losses are recognized in different periods for financial statement and tax purposes; these differences will reverse at some time in the future.
The fund’s tax-basis capital gains and losses are determined only at the end of each fiscal year. For tax purposes, at November 30, 2011, the fund had available capital loss carryforwards totaling $111,993,000 to offset future net capital gains of $971,000 through November 30, 2014, $18,323,000 through November 30, 2015, $22,521,000 through November 30, 2016, $40,669,000 through November 30, 2017, $12,572,000 through November 30, 2018, and $16,937,000 through November 30, 2019. The fund will use these capital losses to offset net taxable capital gains, if any, realized during the year ending November 30, 2012; should the fund realize net capital losses for the year, the losses will be added to the loss carryforward balance above.
The fund had realized losses totaling $6,386,000 through November 30, 2011, which are deferred for tax purposes and reduce the amount of tax-basis unrealized appreciation on investment securities.
93
California Long-Term Tax-Exempt Fund
At May 31, 2012, the cost of investment securities for tax purposes was $2,720,725,000. Net unrealized appreciation of investment securities for tax purposes was $210,124,000, consisting of unrealized gains of $215,909,000 on securities that had risen in value since their purchase and $5,785,000 in unrealized losses on securities that had fallen in value since their purchase.
E. During the six months ended May 31, 2012, the fund purchased $312,993,000 of investment securities and sold $219,342,000 of investment securities, other than temporary cash investments.
F. Capital share transactions for each class of shares were:
| | | | |
| | Six Months Ended | | Year Ended |
| | | May 31, 2012 | November 30, 2011 |
| | Amount | Shares | Amount | Shares |
| | ($000) | (000) | ($000) | (000) |
| Investor Shares | | | | |
| Issued | 62,238 | 5,336 | 74,491 | 6,831 |
| Issued in Lieu of Cash Distributions | 7,211 | 617 | 15,333 | 1,404 |
| Redeemed | (47,925) | (4,128) | (184,926) | (17,063) |
| Net Increase (Decrease)—Investor Shares | 21,524 | 1,825 | (95,102) | (8,828) |
| Admiral Shares | | | | |
| Issued | 179,899 | 15,488 | 381,777 | 35,101 |
| Issued in Lieu of Cash Distributions | 30,840 | 2,638 | 62,988 | 5,765 |
| Redeemed | (142,497) | (12,247) | (573,942) | (52,971) |
| Net Increase (Decrease)—Admiral Shares | 68,242 | 5,879 | (129,177) | (12,105) |
G. In preparing the financial statements as of May 31, 2012, management considered the impact of subsequent events for potential recognition or disclosure in these financial statements.
94
About Your Fund’s Expenses
As a shareholder of the fund, you incur ongoing costs, which include costs for portfolio management, administrative services, and shareholder reports (like this one), among others. Operating expenses, which are deducted from a fund’s gross income, directly reduce the investment return of the fund.
A fund’s expenses are expressed as a percentage of its average net assets. This figure is known as the expense ratio. The following examples are intended to help you understand the ongoing costs (in dollars) of investing in your fund and to compare these costs with those of other mutual funds. The examples are based on an investment of $1,000 made at the beginning of the period shown and held for the entire period.
The accompanying table illustrates your fund’s costs in two ways:
• Based on actual fund return. This section helps you to estimate the actual expenses that you paid over the period. The ”Ending Account Value“ shown is derived from the fund‘s actual return, and the third column shows the dollar amount that would have been paid by an investor who started with $1,000 in the fund. You may use the information here, together with the amount you invested, to estimate the expenses that you paid over the period.
To do so, simply divide your account value by $1,000 (for example, an $8,600 account value divided by $1,000 = 8.6), then multiply the result by the number given for your fund under the heading ”Expenses Paid During Period.“
• Based on hypothetical 5% yearly return. This section is intended to help you compare your fund‘s costs with those of other mutual funds. It assumes that the fund had a yearly return of 5% before expenses, but that the expense ratio is unchanged. In this case—because the return used is not the fund’s actual return—the results do not apply to your investment. The example is useful in making comparisons because the Securities and Exchange Commission requires all mutual funds to calculate expenses based on a 5% return. You can assess your fund’s costs by comparing this hypothetical example with the hypothetical examples that appear in shareholder reports of other funds.
Note that the expenses shown in the table are meant to highlight and help you compare ongoing costs only and do not reflect transaction costs incurred by the fund for buying and selling securities. Further, the expenses do not include any purchase, redemption, or account service fees described in the fund prospectus. If such fees were applied to your account, your costs would be higher. Your fund does not carry a “sales load.”
The calculations assume no shares were bought or sold during the period. Your actual costs may have been higher or lower, depending on the amount of your investment and the timing of any purchases or redemptions.
You can find more information about the fund’s expenses, including annual expense ratios, in the Financial Statements section of this report. For additional information on operating expenses and other shareholder costs, please refer to your fund’s current prospectus.
95
| | | |
| Six Months Ended May 31, 2012 | | | |
| | Beginning | Ending | Expenses |
| | Account Value | Account Value | Paid During |
| | 11/30/2011 | 5/31/2012 | Period |
| Based on Actual Fund Return | | | |
| California Tax-Exempt Money Market Fund | $1,000.00 | $1,000.16 | $0.75 |
| California Intermediate-Term Tax-Exempt Fund | | | |
| Investor Shares | $1,000.00 | $1,057.87 | $1.03 |
| Admiral Shares | 1,000.00 | 1,058.29 | 0.62 |
| California Long-Term Tax-Exempt Fund | | | |
| Investor Shares | $1,000.00 | $1,072.52 | $1.04 |
| Admiral Shares | 1,000.00 | 1,072.94 | 0.62 |
| Based on Hypothetical 5% Yearly Return | | | |
| California Tax-Exempt Money Market Fund | $1,000.00 | $1,024.25 | $0.76 |
| California Intermediate-Term Tax-Exempt Fund | | | |
| Investor Shares | $1,000.00 | $1,024.00 | $1.01 |
| Admiral Shares | 1,000.00 | 1,024.40 | 0.61 |
| California Long-Term Tax-Exempt Fund | | | |
| Investor Shares | $1,000.00 | $1,024.00 | $1.01 |
| Admiral Shares | 1,000.00 | 1,024.40 | 0.61 |
The calculations are based on expenses incurred in the most recent six-month period. The funds’ annualized six-month expense ratios for that period are: for the California Tax-Exempt Money Market Fund, 0.15%; for the California Intermediate-Term Tax-Exempt Fund, 0.20% for Investor Shares and 0.12% for Admiral Shares; and for the California Long-Term Tax-Exempt Fund, 0.20% for Investor Shares and 0.12% for Admiral Shares. (The six-month expense ratio for the California Tax-Exempt Money Market Fund reflects a temporary reduction in operating expenses, described in Note B of the Notes to Financial Statements. Before this reduction, the fund’s annualized six-month expense ratio was 0.16%.)The dollar amounts shown as “Expenses Paid” are equal to the annualized expense ratio multiplied by the average account value over the period, multiplied by the number of days in the most recent six-month period, then divided by the number of days in the most recent 12-month period.
96
Trustees Approve Advisory Arrangement
The board of trustees of Vanguard California Tax-Exempt Money Market Fund, Vanguard California Intermediate-Term Tax-Exempt Fund, and Vanguard California Long-Term Tax-Exempt Fund has renewed each fund’s investment advisory arrangement with The Vanguard Group, Inc. Vanguard—through its Fixed Income Group—serves as the investment advisor for the funds. The board determined that continuing the funds’ internalized management structure was in the best interests of the funds and their shareholders.
The board based its decision upon an evaluation of the advisor’s investment staff, portfolio management process, and performance. The trustees considered the factors discussed below, among others. However, no single factor determined whether the board approved the arrangement. Rather, it was the totality of the circumstances that drove the board’s decision.
Nature, extent, and quality of services
The board considered the quality of the funds’ investment management over both the short and long term, and took into account the organizational depth and stability of the advisor. The board noted that Vanguard has been managing investments for more than three decades. The Fixed Income Group adheres to a sound, disciplined investment management process; the team has considerable experience, stability, and depth.
The board concluded that Vanguard’s experience, stability, depth, and performance, among other factors, warranted continuation of the advisory arrangement.
Investment performance
The board considered the short- and long-term performance of the funds, including any periods of outperformance or underperformance of relevant benchmarks and peer groups. The board concluded that the funds have performed in line with expectations and that their results have been consistent with their investment strategies. Information about the funds’ most recent performance can be found in the Performance Summary sections of this report.
Cost
The board concluded that each fund’s expense ratio was well below the average expense ratio charged by funds in its peer groups and that the funds’ advisory fee rates were also well below their peer-group averages. Information about the funds’ expenses appears in the About Your Fund’s Expenses section of this report as well as in the Financial Statements sections.
The board does not conduct a profitability analysis of Vanguard, because of Vanguard’s unique “at-cost” structure. Unlike most other mutual fund management companies, Vanguard is owned by the funds it oversees, and produces “profits” only in the form of reduced expenses for fund shareholders.
The benefit of economies of scale
The board concluded that the funds’ low-cost arrangement with Vanguard ensures that the funds will realize economies of scale as they grow, with the cost to shareholders declining as fund assets increase.
The board will consider whether to renew the advisory arrangement again after a one-year period.
97
Glossary
7-Day SEC Yield and 30-Day SEC Yield. A money market fund’s 7-day SEC yield is calculated by annualizing its income distributions for the previous seven days, as required by the U.S. Securities and Exchange Commission. For other funds, 30-day SEC yield is derived using a formula specified by the commission. Under the formula, data related to the fund’s security holdings in the previous 30 days are used to calculate the fund’s hypothetical net income for that period, which is then annualized and divided by the fund’s estimated average net assets over the calculation period. For the purposes of this calculation, a security’s income is based on its current market yield to maturity (for bonds), its actual income (for asset-backed securities), or its projected dividend yield (for stocks). Because the SEC yield represents hypothetical annualized income, it will differ—at times significantly—from the fund’s actual experience. As a result, the fund’s income distributions may be higher or lower than implied by the SEC yield.
Average Coupon. The average interest rate paid on the fixed income securities held by a fund. It is expressed as a percentage of face value.
Average Duration. An estimate of how much the value of the bonds held by a fund will fluctuate in response to a change in interest rates. To see how the value could change, multiply the average duration by the change in rates. If interest rates rise by 1 percentage point, the value of the bonds in a fund with an average duration of five years would decline by about 5%. If rates decrease by a percentage point, the value would rise by 5%.
Average Effective Maturity. The average length of time until fixed income securities held by a fund reach maturity and are repaid, taking into consideration the possibility that the issuer may call the bond before its maturity date. The figure reflects the proportion of fund assets represented by each security; it also reflects any futures contracts held. In general, the longer the average effective maturity, the more a fund’s share price will fluctuate in response to changes in market interest rates.
Average Weighted Maturity. The average length of time until fixed income securities held by a fund reach maturity and are repaid. The figure reflects the proportion of fund assets represented by each security.
Beta. A measure of the magnitude of a fund’s past share-price fluctuations in relation to the ups and downs of a given market index. The index is assigned a beta of 1.00. Compared with a given index, a fund with a beta of 1.20 typically would have seen its share price rise or fall by 12% when the index rose or fell by 10%. For this report, beta is based on returns over the past 36 months for both the fund and the index. Note that a fund’s beta should be reviewed in conjunction with its R-squared (see definition). The lower the R-squared, the less correlation there is between the fund and the index, and the less reliable beta is as an indicator of volatility.
98
Credit Quality. For Vanguard money market funds, the Distribution by Credit Quality table includes tier ratings for consistency with SEC Rule 2a-7 under the Investment Company Act of 1940, which governs money market funds. A First Tier security is one that is eligible for money market funds and has been rated in the highest short-term rating category for debt obligations by the requisite nationally recognized statistical rating organizations. An unrated security is First Tier if it represents quality comparable to that of a rated security, as determined in accordance with SEC Rule 2a-7. A Second Tier security is one that is eligible for money market funds and is not a First Tier security. For Vanguard tax-exempt bond funds, credit-quality ratings are measured on a scale that generally ranges from AAA (highest) to D (lowest). “Not Rated” is used to classify securities for which a rating is not available. Credit-quality ratings are obtained from Moody’s and S&P, and the higher rating for each issue is used.
Expense Ratio. A fund’s total annual operating expenses expressed as a percentage of the fund’s average net assets. The expense ratio includes management and administrative expenses, but does not include the transaction costs of buying and selling portfolio securities.
Inception Date. The date on which the assets of a fund (or one of its share classes) are first invested in accordance with the fund’s investment objective. For funds with a subscription period, the inception date is the day after that period ends. Investment performance is measured from the inception date.
R-Squared. A measure of how much of a fund’s past returns can be explained by the returns from the market in general, as measured by a given index. If a fund’s total returns were precisely synchronized with an index’s returns, its R-squared would be 1.00. If the fund’s returns bore no relationship to the index’s returns, its R-squared would be 0. For this report, R-squared is based on returns over the past 36 months for both the fund and the index.
Short-Term Reserves. The percentage of a fund invested in highly liquid, short-term securities that can be readily converted to cash.
Yield to Maturity. The rate of return an investor would receive if the fixed income securities held by a fund were held to their maturity dates.
99
The People Who Govern Your Fund
The trustees of your mutual fund are there to see that the fund is operated and managed in your best interests since, as a shareholder, you are a part owner of the fund. Your fund’s trustees also serve on the board of directors of The Vanguard Group, Inc., which is owned by the Vanguard funds and provides services to them on an at-cost basis.
A majority of Vanguard’s board members are independent, meaning that they have no affiliation with Vanguard or the funds they oversee, apart from the sizable personal investments they have made as private individuals. The independent board members have distinguished backgrounds in business, academia, and public service. Each of the trustees and executive officers oversees 179 Vanguard funds.
The following table provides information for each trustee and executive officer of the fund. More information about the trustees is in the Statement of Additional Information, which can be obtained, without charge, by contacting Vanguard at 800-662-7447, or online at vanguard.com.
| |
| InterestedTrustee1 | and Delphi Automotive LLP (automotive components); |
| | Senior Advisor at New Mountain Capital; Trustee of |
| F. William McNabb III | The Conference Board. |
| Born 1957. Trustee Since July 2009. Chairman of the | |
| Board. Principal Occupation(s) During the Past Five | Amy Gutmann |
| Years: Chairman of the Board of The Vanguard Group, | Born 1949. Trustee Since June 2006. Principal |
| Inc., and of each of the investment companies served | Occupation(s) During the Past Five Years: President |
| by The Vanguard Group, since January 2010; Director | of the University of Pennsylvania; Christopher H. |
| of The Vanguard Group since 2008; Chief Executive | Browne Distinguished Professor of Political Science |
| Officer and President of The Vanguard Group and of | in the School of Arts and Sciences with secondary |
| each of the investment companies served by The | appointments at the Annenberg School for |
| Vanguard Group since 2008; Director of Vanguard | Communication and the Graduate School of Education |
| Marketing Corporation; Managing Director of The | of the University of Pennsylvania; Member of the |
| Vanguard Group (1995–2008). | National Commission on the Humanities and Social |
| | Sciences; Trustee of Carnegie Corporation of New |
| | York and of the National Constitution Center; Chair |
| IndependentTrustees | of the U. S. Presidential Commission for the Study |
| of Bioethical Issues. |
| Emerson U. Fullwood | |
| Born 1948. Trustee Since January 2008. Principal | JoAnn Heffernan Heisen |
| Occupation(s) During the Past Five Years: Executive | Born 1950. Trustee Since July 1998. Principal |
| Chief Staff and Marketing Officer for North America | Occupation(s) During the Past Five Years: Corporate |
| and Corporate Vice President (retired 2008) of Xerox | Vice President and Chief Global Diversity Officer |
| Corporation (document management products and | (retired 2008) and Member of the Executive |
| services); Executive in Residence and 2010 | Committee (1997–2008) of Johnson & Johnson |
| Distinguished Minett Professor at the Rochester | (pharmaceuticals/medical devices/consumer |
| Institute of Technology; Director of SPX Corporation | products); Director of Skytop Lodge Corporation |
| (multi-industry manufacturing), the United Way of | (hotels), the University Medical Center at Princeton, |
| Rochester, Amerigroup Corporation (managed health | the Robert Wood Johnson Foundation, and the Center |
| care), the University of Rochester Medical Center, | for Talent Innovation; Member of the Advisory Board |
| Monroe Community College Foundation, and North | of the Maxwell School of Citizenship and Public Affairs |
| Carolina A&T University. | at Syracuse University. |
| |
| Rajiv L. Gupta | |
| Born 1945. Trustee Since December 2001.2 | F. Joseph Loughrey |
| Principal Occupation(s) During the Past Five Years: | Born 1949. Trustee Since October 2009. Principal |
| Chairman and Chief Executive Officer (retired 2009) | Occupation(s) During the Past Five Years: President |
| and President (2006–2008) of Rohm Haas Co. | and Chief Operating Officer (retired 2009) of Cummins |
| (chemicals); Director of Tyco International, Ltd. | Inc. (industrial machinery); Director of SKF AB |
| (diversified manufacturing and services), Hewlett- | (industrial machinery), Hillenbrand, Inc. (specialized |
| Packard Co. (electronic computer manufacturing), | consumer services), the Lumina Foundation for |
| |
| | |
| Education, and Oxfam America; Chairman of the | Executive Officers | |
| Advisory Council for the College of Arts and Letters | | |
| and Member of the Advisory Board to the Kellogg | Glenn Booraem | |
| Institute for International Studies at the University | Born 1967. Controller Since July 2010. Principal |
| of Notre Dame. | Occupation(s) During the Past Five Years: Principal |
| | of The Vanguard Group, Inc.; Controller of each of |
| Mark Loughridge | the investment companies served by The Vanguard |
| Born 1953. Trustee Since March 2012. Principal | Group; Assistant Controller of each of the investment |
| Occupation(s) During the Past Five Years: Senior Vice | companies served by The Vanguard Group (2001–2010). |
| President and Chief Financial Officer at IBM (information | | |
| technology services); Fiduciary Member of IBM’s | Thomas J. Higgins | |
| Retirement Plan Committee. | Born 1957. Chief Financial Officer Since September |
| | 2008. Principal Occupation(s) During the Past Five |
| Scott C. Malpass | Years: Principal of The Vanguard Group, Inc.; Chief |
| Born 1962. Trustee Since March 2012. Principal | Financial Officer of each of the investment companies |
| Occupation(s) During the Past Five Years: Chief | served by The Vanguard Group; Treasurer of each of |
| Investment Officer and Vice President at the University | the investment companies served by The Vanguard |
| of Notre Dame; Assistant Professor of Finance at the | Group (1998–2008). | |
| Mendoza College of Business at Notre Dame; Member | | |
| of the Notre Dame 403(b) Investment Committee; | Kathryn J. Hyatt | |
| Director of TIFF Advisory Services, Inc. (investment | Born 1955. Treasurer Since November 2008. Principal |
| advisor); Member of the Investment Advisory | Occupation(s) During the Past Five Years: Principal of |
| Committees of the Financial Industry Regulatory | The Vanguard Group, Inc.; Treasurer of each of the |
| Authority (FINRA) and of Major League Baseball. | investment companies served by The Vanguard |
| | Group; Assistant Treasurer of each of the investment |
| André F. Perold | companies served by The Vanguard Group (1988–2008). |
| Born 1952. Trustee Since December 2004. Principal | | |
| Occupation(s) During the Past Five Years: George | Heidi Stam | |
| Gund Professor of Finance and Banking at the Harvard | Born 1956. Secretary Since July 2005. Principal |
| Business School (retired 2011); Chief Investment | Occupation(s) During the Past Five Years: Managing |
| Officer and Managing Partner of HighVista Strategies | Director of The Vanguard Group, Inc.; General Counsel |
| LLC (private investment firm); Director of Rand | of The Vanguard Group; Secretary of The Vanguard |
| Merchant Bank; Overseer of the Museum of Fine | Group and of each of the investment companies |
| Arts Boston. | served by The Vanguard Group; Director and Senior |
| | Vice President of Vanguard Marketing Corporation. |
| Alfred M. Rankin, Jr. | | |
| Born 1941. Trustee Since January 1993. Principal | Vanguard Senior ManagementTeam | |
| Occupation(s) During the Past Five Years: Chairman, | | |
| President, and Chief Executive Officer of NACCO | Mortimer J. Buckley | Michael S. Miller |
| Industries, Inc. (forklift trucks/housewares/lignite); | Kathleen C. Gubanich | James M. Norris |
| Director of Goodrich Corporation (industrial products/ | Paul A. Heller | Glenn W. Reed |
| aircraft systems and services) and the National | Martha G. King | George U. Sauter |
| Association of Manufacturers; Chairman of the Board | Chris D. McIsaac | |
| of the Federal Reserve Bank of Cleveland and of | | |
| University Hospitals of Cleveland; Advisory Chairman | | |
| of the Board of The Cleveland Museum of Art. | Chairman Emeritus and Senior Advisor |
| | |
| | John J. Brennan | |
| Peter F. Volanakis | Chairman, 1996–2009 | |
| Born 1955. Trustee Since July 2009. Principal | Chief Executive Officer and President, 1996–2008 |
| Occupation(s) During the Past Five Years: President | | |
| and Chief Operating Officer (retired 2010) of Corning | | |
| Incorporated (communications equipment); Director | Founder | |
| of SPX Corporation (multi-industry manufacturing); | John C. Bogle | |
| Overseer of the Amos Tuck School of Business | Chairman and Chief Executive Officer, 1974–1996 |
| Administration at Dartmouth College; Advisor to the | | |
| Norris Cotton Cancer Center. | | |
1 Mr. McNabb is considered an “interested person,” as defined in the Investment Company Act of 1940, because he is an officer of the Vanguard funds.
2 December 2002 for Vanguard Equity Income Fund, Vanguard Growth Equity Fund, the Vanguard Municipal Bond Funds, and the Vanguard State Tax-Exempt Funds.
|  |
| P.O. Box 2600 |
| Valley Forge, PA 19482-2600 |
Connect with Vanguard® > vanguard.com
| |
| Fund Information > 800-662-7447 | CFA® is a trademark owned by CFA Institute. |
| Direct Investor Account Services > 800-662-2739 | |
| Institutional Investor Services > 800-523-1036 | |
| Text Telephone for People | |
| With Hearing Impairment > 800-749-7273 | |
| |
| This material may be used in conjunction | |
| with the offering of shares of any Vanguard | |
| fund only if preceded or accompanied by | |
| the fund’s current prospectus. | |
| |
| All comparative mutual fund data are from Lipper Inc. or | |
| Morningstar, Inc., unless otherwise noted. | |
| |
| You can obtain a free copy of Vanguard’s proxy voting | |
| guidelines by visiting vanguard.com/proxyreporting or by | |
| calling Vanguard at 800-662-2739. The guidelines are | |
| also available from the SEC’s website, sec.gov. In | |
| addition, you may obtain a free report on how your fund | |
| voted the proxies for securities it owned during the 12 | |
| months ended June 30. To get the report, visit either | |
| vanguard.com/proxyreporting or sec.gov. | |
| |
| You can review and copy information about your fund at | |
| the SEC’s Public Reference Room in Washington, D.C. To | |
| find out more about this public service, call the SEC at | |
| 202-551-8090. Information about your fund is also | |
| available on the SEC’s website, and you can receive | |
| copies of this information, for a fee, by sending a | |
| request in either of two ways: via e-mail addressed to | |
| publicinfo@sec.gov or via regular mail addressed to the | |
| Public Reference Section, Securities and Exchange | |
| Commission, Washington, DC 20549-1520. | |
| |
| |
| | © 2012 The Vanguard Group, Inc. |
| | All rights reserved. |
| | Vanguard Marketing Corporation, Distributor. |
| |
| | Q752 072012 |
Item 2:
Not Applicable.
Item 3:
Not Applicable.
Item 4: Principal Accountant Fees and Services.
Not Applicable.
Item 5: Audit Committee of Listed Registrants.
Not Applicable.
Item 6: Investments.
Not Applicable.
Item 7: Disclosure of Proxy Voting Policies and Procedures for Closed-End Management Investment Companies.
Not Applicable.
Item 8: Portfolio Managers of Closed-End Management Investment Companies.
Not Applicable.
Item 9: Purchase of Equity Securities by Closed-End Management Investment Company and Affiliated Purchasers.
Not Applicable.
Item 10: Submission of Matters to a Vote of Security Holders.
Not Applicable.
Item 11: Controls and Procedures.
(a) Disclosure Controls and Procedures. The Principal Executive and Financial Officers concluded that the Registrant's Disclosure Controls and Procedures are effective based on their evaluation of the Disclosure Controls and Procedures as of a date within 90 days of the filing date of this report.
(b) Internal Control Over Financial Reporting. There were no significant changes in Registrant’s Internal Control Over Financial Reporting or in other factors that could significantly affect this control subsequent to the date of the evaluation, including any corrective actions with regard to significant deficiencies and material weaknesses.
Item 12: Exhibits.
(a) Certifications.
Pursuant to the requirements of the Securities Exchange Act of 1934 and the Investment Company Act of 1940, the registrant has duly caused this report to be signed on its behalf by the undersigned, thereunto duly authorized.
| |
| | VANGUARD CALIFORNIA TAX-FREE FUNDS |
| |
| By: | /s/ F. WILLIAM MCNABB III* |
| | F. WILLIAM MCNABB III |
| | CHIEF EXECUTIVE OFFICER |
| |
| Date: July 25, 2012 |
Pursuant to the requirements of the Securities Exchange Act of 1934 and the Investment Company Act of 1940, this report has been signed below by the following persons on behalf of the registrant and in the capacities and on the dates indicated.
| |
| | VANGUARD CALIFORNIA TAX-FREE FUNDS |
| |
| By: | /s/ F. WILLIAM MCNABB III* |
| | F. WILLIAM MCNABB III |
| | CHIEF EXECUTIVE OFFICER |
| |
| Date: July 25, 2012 |
| |
| | VANGUARD CALIFORNIA TAX-FREE FUNDS |
| |
| By: | /s/ THOMAS J. HIGGINS* |
| | THOMAS J. HIGGINS |
| | CHIEF FINANCIAL OFFICER |
| |
| Date: July 25, 2012 |
* By: /s/ Heidi Stam
Heidi Stam, pursuant to a Power of Attorney filed on March 27, 2012 see file Number 2-11444, Incorporated by Reference.