UNITED STATES
SECURITIES AND EXCHANGE COMMISSION
Washington, D.C. 20549
FORM N-CSR
CERTIFIED SHAREHOLDER REPORT OF REGISTERED
MANAGEMENT INVESTMENT COMPANIES
Investment Company Act file number: 811-04537
Liberty All-Star Growth Fund, Inc.
(Exact name of registrant as specified in charter)
1290 Broadway, Suite 1000, Denver, Colorado 80203
(Address of principal executive offices) (Zip code)
Sareena Khwaja-Dixon, Esq.
ALPS Fund Services, Inc.
1290 Broadway, Suite 1000
Denver, Colorado 80203
(Name and address of agent for service)
Registrant’s telephone number, including area code: 303-623-2577
Date of fiscal year end: December 31
Date of reporting period: January 1, 2021 - December 31, 2021
Item 1. Report to Stockholders.
(a)
Contents
| 1 | President’s Letter | |
| 6 | Unique Fund Attributes | |
| 8 | Table of Distributions and Rights Offerings | |
| 9 | Investment Growth | |
| 10 | Major Stock Changes in the Quarter | |
| 11 | Top 20 Holdings and Economic Sectors | |
| 12 | Investment Managers/ Portfolio Characteristics | |
| 13 | Manager Roundtable | |
| 18 | Schedule of Investments | |
| 25 | Statement of Assets and Liabilities | |
| 26 | Statement of Operations | |
| 27 | Statements of Changes in Net Assets | |
| 28 | Financial Highlights | |
| 30 | Notes to Financial Statements | |
| 39 | Report of Independent Registered Public Accounting Firm | |
| 40 | Automatic Dividend Reinvestment and Direct Purchase Plan | |
| 42 | Additional Information | |
| 43 | Directors and Officers | |
| 48 | Board Consideration of the Renewal of the Fund Management & Portfolio Management Agreements | |
| 53 | Summary of Updated Information Regarding the Fund | |
| 58 | Privacy Policy | |
| 60 | Description of Lipper Benchmark and Market Indices Inside Back Cover: Fund Information |
A SINGLE INVESTMENT...
A DIVERSIFIED GROWTH PORTFOLIO
A single fund that offers:
| • | A diversified, multi-managed portfolio of small-, mid- and large-cap growth stocks |
| • | Exposure to many of the industries that make the U.S. economy one of the world’s most dynamic |
| • | Access to institutional quality investment managers • Objective and ongoing manager evaluation |
| • | Active portfolio rebalancing |
| • | A quarterly fixed distribution policy |
| • | Actively managed, exchange-traded, closed-end fund listed on the New York Stock Exchange (ticker symbol: ASG) |
LIBERTY ALL-STAR® GROWTH FUND, INC.
| Liberty All-Star® Growth Fund | President's Letter |
| (Unaudited) |
| Fellow Shareholders: | January 2022 |
Supported by an economy showing resilience in a challenging environment, U.S. equities posted another year of strong gains in 2021. The S&P 500® Index led the way with a return of 28.71 percent. The Dow Jones Industrial Average (DJIA) advanced 20.95 percent and the NASDAQ Composite Index gained 22.18 percent.
Consumer demand bolstered by job growth and robust economic expansion in the wake of 2020’s Covid-19 pandemic drove stronger than expected corporate profits. The hospitality, entertainment and travel industries began to reopen. The employment picture brightened considerably, as the U.S. added 6.4 million jobs in 2021, more than any year on record, according to The Wall Street Journal. These positive factors were tempered by ongoing concerns with the delta and omicron variants, inflation that was the highest since 1982 and supply chain bottlenecks that confounded buyers and sellers alike. While the Federal Reserve maintained short-term interest rates at historically low levels, there were periodic upticks in Treasury yields, as bond investors weighed the potential for higher rates in 2022 and beyond.
In the final analysis, however, investor sentiment remained positive and powered the S&P 500® to 70 new record highs (only surpassed by 77 in 1954, according to The New York Times).
September was the poorest month of the year for the S&P 500® Index at -4.65 percent. October, however, was the best of the year with an increase of 7.01 percent. All 11 S&P sectors posted double-digit gains for the year, ranging from 17.66 percent for utilities to 54.87 percent for energy.
As 2021 drew to a close, interest rates resumed an upward move that emerged early in the year. The yield on 10-year Treasuries started 2021 at 0.91 percent, rose to the year’s high of 1.78 percent in March and closed the year at 1.51 percent. The increase reflected expectations of action by the Federal Reserve to increase the fed funds rate in an effort to contain the outbreak of inflationary pressures; higher rates are viewed as a negative for equities, particularly high multiple technology stocks.
As the year began, it was expected that value style stocks were likely to outperform growth stocks, continuing a shift that began in the latter stages of 2020. Indeed, the year opened with value style stocks outperforming by a wide margin in the first quarter. By year-end, however, the two styles were almost at parity; the broad-market Russell 3000® Growth Index returned 25.85 percent while its value counterpart returned 25.37 percent. Segmenting returns across the capitalization spectrum, however, produced a very different outcome. The large-cap Russell 1000® Growth Index outperformed the Value index by 2.44 percentage points. Other than that, value delivered better results. The Russell Midcap® Value Index returned 28.34 percent versus 12.73 percent for the Growth index. Among small-cap stocks, the Russell 2000® Value Index returned 28.27 percent while the corresponding Growth index returned 2.83 percent.
| Annual Report | December 31, 2021 | 1 |
| Liberty All-Star® Growth Fund | President's Letter |
| (Unaudited) |
Liberty All-Star® Growth Fund
Liberty All-Star Growth Fund generated a full-year return of 18.08 percent with shares valued at net asset value (NAV) with dividends reinvested and 25.36 percent with shares valued at market price with dividends reinvested. (Fund returns are net of expenses.)
Both returns were ahead of that posted by the Fund’s primary benchmark, the Lipper Multi-Cap Growth Mutual Fund Average, which returned 15.25 percent. Both Fund returns were also ahead of the 15.60 percent posted by the passive Russell Growth benchmark. The Fund’s NAV return trailed the S&P 500®, the DJIA and the NASDAQ Composite, but its market price return was ahead of all but the S&P 500®. In the fourth quarter, the Fund’s NAV return was 2.32 percent while its market price return was 10.84 percent compared to returns of 4.18 percent and 5.52 percent for the Funds primary and passive benchmarks.
Relative to their underlying NAV, Fund shares traded at both a discount and a premium in the fourth quarter. The range went from a discount of -0.2 percent to a premium of 11.5 percent; this compares with a discount/premium in the third quarter that ranged from -2.1 percent to 5.4 percent. For the full year, the discount/premium range was -2.1 percent to 15.2 percent.
In the fourth quarter the Fund paid its regular quarterly distribution of $0.18 per share, plus a one-time year-end distribution of $0.34 for a total of $0.52. The additional amount was based on the Fund’s realized capital gains and was the amount necessary to fulfill the Fund’s excise distribution requirement to avoid paying an excise tax. With this distribution, the total distributed to shareholders since 1997, when the distribution policy commenced, increased to $16.00 per share. The distribution policy is a major component of the Fund’s total return, and we emphasize that shareholders should include these distributions when determining the total return on their investment in the Fund.
It is our custom in Fund annual reports to provide shareholders with access to the thinking of the Fund’s three institutional-quality investment managers. We continue that tradition this year and invite shareholders to gain insights into the managers’ approach to portfolio construction—which, as you will read, is bottom-up, one stock at a time based on company fundamentals. The Q&A begins on page 13.
| 2 | www.all-starfunds.com |
| Liberty All-Star® Growth Fund | President's Letter |
| (Unaudited) |
We are pleased that the Fund generated double-digit returns for the trailing three years, a period when the NAV return was 31.69 percent annually and the market price return was 41.00 percent annually (both with dividends reinvested). We would also point out that the Fund has outperformed its primary benchmark not only for the trailing one and three years, but also for longer periods—five, 10, 15 and 20 years. We are further gratified that performance was solid in a year in which value style stocks outperformed growth stocks in two of the three capitalization ranges represented in the Fund’s portfolio. We believe this validates the Fund’s structure as a diversified growth portfolio for long-term investors seeking a high-quality equity investment.
Sincerely,

William R. Parmentier, Jr.
President and Chief Executive Officer
Liberty All-Star® Growth Fund, Inc.
The views expressed in the President’s Letter, Unique Fund Attributes and Manager Roundtable reflect the current views of the respective parties. These views are not guarantees of future performance and involve certain risks, uncertainties and assumptions that are difficult to predict, so actual outcomes and results may differ significantly from the views expressed. These views are subject to change at any time based upon economic, market or other conditions, and the respective parties disclaim any responsibility to update such views. These views may not be relied on as investment advice and, because investment decisions for the Fund are based on numerous factors, may not be relied on as an indication of trading intent. References to specific company securities should not be construed as a recommendation or investment advice.
| Annual Report | December 31, 2021 | 3 |
| Liberty All-Star® Growth Fund | President's Letter |
| (Unaudited) |
FUND STATISTICS AND SHORT-TERM PERFORMANCE
PERIODS ENDED DECEMBER 31, 2021
FUND STATISTICS:
| Net Asset Value (NAV) | $8.25 |
| Market Price | $9.00 |
| Premium | 9.1% |
| Quarter | 2021 | ||||
| Distributions* | $0.52 | $1.02 | |||
| Market Price Trading Range | $8.30 to $10.20 | $8.00 to $10.20 | |||
| Premium/(Discount) Range | 11.5% to -0.2% | 15.2% to -2.1% | |||
PERFORMANCE:
| Shares Valued at NAV with Dividends Reinvested | 2.32% | 18.08% | ||
| Shares Valued at Market Price with Dividends Reinvested | 10.84% | 25.36% | ||
| Dow Jones Industrial Average | 7.87% | 20.95% | ||
| Lipper Multi-Cap Growth Mutual Fund Average | 4.18% | 15.25% | ||
| NASDAQ Composite Index | 8.45% | 22.18% | ||
| Russell Growth Benchmark | 5.52% | 15.60% | ||
| S&P 500® Index | 11.03% | 28.71% |
| * | All 2021 distributions consist of ordinary dividends and long-term capital gains. The fourth quarter distribution of $0.52 includes $0.34 to fulfill the Fund’s excise distribution requirement to avoid paying an excise tax. A breakdown of each 2021 distribution for federal income tax purposes can be found in the table on page 42. |
| 4 | www.all-starfunds.com |
| Liberty All-Star® Growth Fund | President's Letter |
| (Unaudited) |
| ANNUALIZED RATES OF RETURN | ||||||
| LONG-TERM PERFORMANCE SUMMARY AND DISTRIBUTIONS PERIODS ENDED DECEMBER 31, 2021 | 3 YEARS | 5 YEARS | 10 YEARS | |||
| LIBERTY ALL-STAR® GROWTH FUND, INC. | ||||||
| Distributions | $2.11 | $2.99 | $5.03 | |||
| Shares Valued at NAV with Dividends Reinvested | 31.69% | 23.80% | 17.81% | |||
| Shares Valued at Market Price with Dividends Reinvested | 41.00% | 29.50% | 20.12% | |||
| Dow Jones Industrial Average | 18.49% | 15.51% | 14.21% | |||
| Lipper Multi-Cap Growth Mutual Fund Average | 29.36% | 21.90% | 17.01% | |||
| NASDAQ Composite Index | 34.26% | 24.97% | 20.96% | |||
| Russell Growth Benchmark | 28.09% | 20.38% | 17.16% | |||
| S&P 500® Index | 26.07% | 18.47% | 16.55% | |||
Performance returns for the Fund are calculated assuming all distributions are reinvested at actual reinvestment prices and all primary rights in the Fund's rights offerings were exercised. Returns are net of management fees and other Fund expenses.
The returns shown for the Lipper Multi-Cap Growth Mutual Fund Average are based on open-end mutual funds’ total returns, which include dividends, and are net of fund expenses. Returns for the unmanaged Dow Jones Industrial Average, NASDAQ Composite Index, the Russell Growth Benchmark and the S&P 500® Index are total returns, including dividends. A description of the Lipper benchmark and the market indices can be found on page 60.
Past performance cannot predict future results. Performance will fluctuate with market conditions. Current performance may be lower or higher than the performance data shown. Performance information does not reflect the deduction of taxes that shareholders would pay on Fund distributions or the sale of Fund shares. An investment in the Fund involves risk, including loss of principal.
Closed-end funds raise money in an initial public offering and shares are listed and traded on an exchange. Open-end mutual funds continuously issue and redeem shares at net asset value. Shares of closed-end funds frequently trade at a discount to net asset value. The price of the Fund’s shares is determined by a number of factors, several of which are beyond the control of the Fund. Therefore, the Fund cannot predict whether its shares will trade at, below or above net asset value.
| Annual Report | December 31, 2021 | 5 |
| Liberty All-Star® Growth Fund | Unique Fund Attributes |
| (Unaudited) |
UNIQUE ATTRIBUTES OF Liberty All-Star® Growth Fund
Several attributes help to make the Fund a core equity holding for investors seeking a diversified growth portfolio, income and the potential for long-term appreciation.
 | MULTI-MANAGEMENT FOR INDIVIDUAL INVESTORS |
| Large institutional investors have traditionally employed multiple investment managers. With three investment managers investing across the full capitalization range of growth stocks, the Fund brings multi-management to individual investors. |
 | REAL-TIME TRADING AND LIQUIDITY |
| The Fund has a fixed number of shares that trade on the New York Stock Exchange and other exchanges. Share pricing is continuous—not just end-of-day, as it is with open-end mutual funds. Fund shares offer immediate liquidity, there are no annual sales fees and can often be traded commission free. |
| 6 | www.all-starfunds.com |
| Liberty All-Star® Growth Fund | Unique Fund Attributes |
| (Unaudited) |
 | ACCESS TO INSTITUTIONAL MANAGERS |
| The Fund’s investment managers invest primarily for pension funds, endowments, foundations and other institutions. Because institutional managers are closely monitored by their clients, they tend to be more disciplined and consistent in their investment process. |
 | MONITORING AND REBALANCING |
| ALPS Advisors continuously monitors these investment managers to ensure that they are performing as expected and adhering to their style and strategy, and will replace the managers when warranted. Periodic rebalancing maintains the Fund’s structural integrity and is a well-recognized investment discipline. |
 | ALIGNMENT AND OBJECTIVITY |
| Alignment with shareholders’ best interests and objective decision-making help to ensure that the Fund is managed openly and equitably. In addition, the Fund is governed by a Board of Directors that is elected by and responsible to shareholders. |
 | DISTRIBUTION POLICY |
| Since 1997, the Fund has followed a policy of paying annual distributions on its shares at a rate that approximates historical equity market returns. The current annual distribution rate is 8 percent of the Fund’s net asset value (paid quarterly at 2 percent per quarter), providing a systematic mechanism for distributing funds to shareholders. |
| Annual Report | December 31, 2021 | 7 |
| Table of Distributions and | |
| Liberty All-Star® Growth Fund | Rights Offerings |
| (Unaudited) |
| RIGHTS OFFERINGS | ||||
| YEAR | PER SHARE DISTRIBUTIONS | MONTH COMPLETED | SHARES NEEDED TO PURCHASE ONE ADDITIONAL SHARE | SUBSCRIPTION PRICE |
| 1997 | $1.24 | |||
| 1998 | 1.35 | July | 10 | $12.41 |
| 1999 | 1.23 | |||
| 2000 | 1.34 | |||
| 2001 | 0.92 | September | 8 | 6.64 |
| 2002 | 0.67 | |||
| 2003 | 0.58 | September | 81 | 5.72 |
| 2004 | 0.63 | |||
| 2005 | 0.58 | |||
| 2006 | 0.59 | |||
| 2007 | 0.61 | |||
| 2008 | 0.47 | |||
| 20092 | 0.24 | |||
| 2010 | 0.25 | |||
| 2011 | 0.27 | |||
| 2012 | 0.27 | |||
| 2013 | 0.31 | |||
| 2014 | 0.33 | |||
| 20153 | 0.77 | |||
| 2016 | 0.36 | |||
| 2017 | 0.42 | |||
| 2018 | 0.46 | November | 3 | 4.81 |
| 2019 | 0.46 | |||
| 2020 | 0.63 | March | 5 | 4.34 |
| 2021 | $1.02 | June | 51 | 8.21 |
| Total | $16.00 | |||
| 1 | The number of shares offered was increased by an additional 25 percent to cover a portion of the over-subscription requests. |
| 2 | Effective with the second quarter distribution, the annual distribution rate was changed from 10 percent to 6 percent. |
| 3 | Effective with the second quarter distribution, the annual distribution rate was changed from 6 percent to 8 percent. |
DISTRIBUTION POLICY
The current policy is to pay distributions on its shares totaling approximately 8 percent of its net asset value per year, payable in four quarterly installments of 2 percent of the Fund’s net asset value at the close of the New York Stock Exchange on the Friday prior to each quarterly declaration date. Sources of distributions to shareholders may include ordinary dividends, long-term capital gains and return of capital. The actual amounts and sources of the amounts for tax reporting purposes will depend upon the Fund’s investment experience during its fiscal year and may be subject to changes based on tax regulations. If a distribution includes anything other than net investment income, the Fund provides a Section 19(a) notice of the best estimate of its distribution sources at that time. These estimates may not match the final tax characterization (for the full year’s distributions) contained in shareholder 1099-DIV forms after the end of the year. If the Fund’s ordinary dividends and long-term capital gains for any year exceed the amount distributed under the distribution policy, the Fund may, in its discretion, retain and not distribute capital gains and pay income tax thereon to the extent of such excess.
| 8 | www.all-starfunds.com |
| Liberty All-Star® Growth Fund | Investment Growth |
| (Unaudited) |
GROWTH OF A HYPOTHETICAL $10,000 INVESTMENT
The graph below illustrates the growth of a hypothetical $10,000 investment assuming the purchase of shares of common stock at the closing market price (NYSE: ASG) of $9.25 on December 31, 1996, and tracking its progress through December 31, 2021. For certain information, it also assumes that a shareholder exercised all primary rights in the Fund’s rights offerings (see below). This graph covers the period since the Fund commenced its distribution policy in 1997.
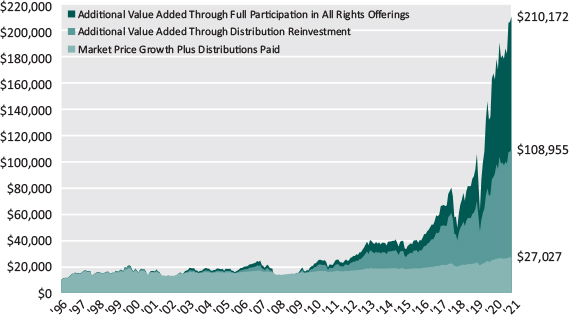
 | The growth of the investment assuming all distributions were received in cash and not reinvested back into the Fund. The value of the investment under this scenario grew to $27,027 (including the December 31, 2021 value of the original investment of $9,730, plus distributions during the period of $17,297). |
 | The additional value realized through reinvestment of all distributions. The value of the investment under this scenario grew to $108,955. |
 | The additional value realized by exercising all primary rights in the Fund’s rights offerings. The value of the investment under this scenario grew to $210,172 excluding the cost to exercise all primary rights in the rights offerings which was $82,340. |
Past performance cannot predict future results. Performance will fluctuate with changes in market conditions. Current performance may be lower or higher than the performance data shown. Performance information does not reflect the deduction of taxes that shareholders would pay on Fund distributions or the sale of Fund shares. An investment in the Fund involves risk, including loss of principal.
| Annual Report | December 31, 2021 | 9 |
| Liberty All-Star® Growth Fund | Major Stock Changes in the Quarter |
| December 31, 2021 (Unaudited) |
The following are the major ($2 million or more) stock changes - both purchases and sales - that were made in the Fund’s portfolio during the fourth quarter of 2021.
| SHARES | ||||
| SECURITY NAME | PURCHASE (SALES) | HELD AS OF 12/31/21 | ||
| PURCHASES | ||||
| Ameresco, Inc. | 24,418 | 47,578 | ||
| Chegg, Inc. | 49,068 | 147,637 | ||
| Match Group, Inc. | 29,158 | 29,158 | ||
| SALES | ||||
| NIKE, Inc. | (20,048) | 0 | ||
| Ollie's Bargain Outlet Holdings, Inc. | (36,643) | 47,547 | ||
| Paylocity Holding Corp. | (33,268) | 0 | ||
| Signature Bank | (27,533) | 0 | ||
| 10 | www.all-starfunds.com |
| Liberty All-Star® Growth Fund | Top 20 Holdings and Economic Sectors |
| December 31, 2021 (Unaudited) |
| TOP 20 HOLDINGS* | PERCENT OF NET ASSETS |
| SPS Commerce, Inc. | 2.21% |
| Amazon.com, Inc. | 1.98 |
| FirstService Corp. | 1.93 |
| SiteOne Landscape Supply, Inc. | 1.89 |
| Casella Waste Systems, Inc. | 1.77 |
| Visa, Inc. | 1.70 |
| UnitedHealth Group, Inc. | 1.67 |
| Microsoft Corp. | 1.67 |
| Montrose Environmental Group, Inc. | 1.65 |
| Progyny, Inc. | 1.59 |
| Natera, Inc. | 1.59 |
| Hamilton Lane, Inc. | 1.51 |
| StepStone Group, Inc. | 1.39 |
| Ball Corp. | 1.36 |
| Danaher Corp. | 1.36 |
| Workday, Inc. | 1.34 |
| Globant SA | 1.28 |
| Thermo Fisher Scientific, Inc. | 1.19 |
| Yum! Brands, Inc. | 1.19 |
| salesforce.com, Inc. | 1.18 |
| 31.45% |
| ECONOMIC SECTORS* | PERCENT OF NET ASSETS |
| Information Technology | 28.30% |
| Health Care | 20.76 |
| Industrials | 13.32 |
| Consumer Discretionary | 12.20 |
| Financials | 7.83 |
| Communication Services | 6.01 |
| Real Estate | 3.84 |
| Materials | 2.73 |
| Consumer Staples | 1.81 |
| Energy | 0.75 |
| Other Net Assets | 2.45 |
| 100.00% |
| * | Because the Fund is actively managed, there can be no guarantee that the Fund will continue to hold securities of the indicated issuers and sectors in the future. |
| Annual Report | December 31, 2021 | 11 |
| Investment Managers/ | |
| Liberty All-Star® Growth Fund | Portfolio Characteristics |
| (Unaudited) |
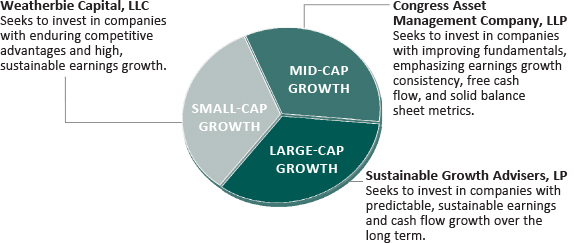
THE FUND’S THREE GROWTH INVESTMENT MANAGERS
AND THE MARKET CAPITALIZATION ON WHICH EACH FOCUSES:
ALPS Advisors, Inc., the investment advisor to the Fund, has the ultimate authority (subject to oversight by the Board of Directors) to oversee the investment managers and recommend their hiring, termination and replacement.
MANAGERS’ DIFFERING INVESTMENT STRATEGIES ARE
REFLECTED IN PORTFOLIO CHARACTERISTICS
The portfolio characteristics table below is a regular feature of the Fund’s shareholder reports. It serves as a useful tool for understanding the value of the Fund’s multi-managed portfolio. The characteristics are different for each of the Fund’s three investment managers. These differences are a reflection of the fact that each has a different capitalization focus and investment strategy. The shaded column highlights the characteristics of the Fund as a whole, while the first three columns show portfolio characteristics for the Russell Smallcap, Midcap and Largecap Growth indices. See page 60 for a description of these indices.
| MARKET CAPITALIZATION SPECTRUM | |||||||
| PORTFOLIO CHARACTERISTICS | SMALL | LARGE | |||||
| AS OF DECEMBER 31, 2021 |  | ||||||
| RUSSELL GROWTH: | |||||||
| Smallcap | Midcap | Largecap | |||||
| Index | Index | Index | Weatherbie | Congress | Sustainable | Total Fund | |
| Number of Holdings | 1,246 | 393 | 503 | 50 | 40 | 29 | 118* |
| Weighted Average Market Capitalization (billions) | $4.1 | $29.7 | $1,000.5 | $5.1 | $21.6 | $479.3 | $169.4 |
| Average Five-Year Earnings Per Share Growth | 15% | 19% | 25% | 26% | 24% | 28% | 26% |
| Average Five-Year Sales Per Share Growth | 9% | 13% | 17% | 10% | 11% | 14% | 12% |
| Price/Earnings Ratio** | 25x | 35x | 37x | 42x | 30x | 40x | 36x |
| Price/Book Value Ratio | 5.3x | 10.9x | 14.8x | 7.3x | 6.5x | 9.4x | 7.5x |
| * | Certain holdings are held by more than one manager. |
| ** | Excludes negative earnings. |
| 12 | www.all-starfunds.com |
| Liberty All-Star® Growth Fund | Manager Roundtable |
| (Unaudited) |
MANAGER ROUNDTABLE
Going beyond the financial market news headlines to hear from investment managers who build portfolios from the bottom up, one stock at a time.
Liberty All-Star Growth Fund’s three investment managers have long experience, in-depth knowledge, proven track records and a commitment to growth style investing. While macro-issues—like GDP, inflation and employment—dominate the business and financial news, these managers are at work at the micro level, building portfolios one stock at a time based on their style, strategy and intensive research. We asked the managers to take us inside their current thinking, using the larger context of the current market environment as a backdrop. The Fund’s Investment Advisor, ALPS Advisors, serves as moderator of the roundtable. Participating investment management firms, the portfolio manager for each and their respective capitalization focus are:
CONGRESS ASSET MANAGEMENT COMPANY, LLP
Portfolio Manager/Todd Solomon, CFA
Senior Vice President/Portfolio Manager
Capitalization Focus/Mid-Cap Growth—Congress Asset Management’s mid-cap growth strategy focuses on established, high-quality companies that are growing earnings and generating attractive levels of free cash flow. The firm also strives to construct portfolios with relatively low levels of volatility.
SUSTAINABLE GROWTH ADVISERS, LP
Portfolio Manager/Kishore D. Rao
Principal and Portfolio Manager
Capitalization Focus/Large-Cap Growth—Sustainable focuses on companies that have unique characteristics that lead to a high degree of predictability, strong profitability and above-average earnings and cash flow growth over the long term.
WEATHERBIE CAPITAL, LLC
Portfolio Manager/H. George Dai, Ph.D.
Chief Investment Officer and Senior Portfolio Manager
Capitalization Focus/Small-Cap Growth—Weatherbie practices a small capitalization growth investment style focusing on high quality companies that demonstrate superior earnings growth prospects, yet are reasonably priced relative to their intrinsic value. The firm seeks to provide superior returns relative to small capitalization growth indices over a full market cycle.
In 2020, the NASDAQ Composite—a proxy for growth relative to the S&P 500® Index and the Dow Jones Industrial Average—more than doubled the return of the other two indexes. It struggled at times in 2021—against the rotation to value/cyclicals early in the year and, as the year progressed, against higher interest rates and the prospect for the Fed both tapering and raising short-term rates. Do you anticipate factoring this new regime into your buy/sell/ portfolio construction or sector weighting decisions in 2022 and why/why not? We’ll start by asking Kishore Rao to articulate Sustainable’s large-cap perspective.
| Annual Report | December 31, 2021 | 13 |
| Liberty All-Star® Growth Fund | Manager Roundtable |
| (Unaudited) |
Rao (Sustainable – Large-Cap Growth): We have always believed that in order to be an effective growth manager you need to focus on valuation as well to limit price risk. Accordingly, given a higher likelihood for rising interest rates we increased the discount rate used in our discounted cash flow models, which is one way we look at stock valuations. We also implemented a metric we call the “Terminal Test” focused on understanding the level of growth in our company models, which comes from beyond the 10-year mark. This allows us to make a better judgment about how much of a company’s value is derived from more aspirational long-term growth—beyond 10 years—which naturally is more difficult to predict. This allows us to better understand the valuation of stocks and be more objective in considering the relative attractiveness of one stock versus another.
Todd Solomon, you have some thoughts about valuation.
Solomon (Congress – Mid-Cap Growth): Yes, we do. We continue to monitor the impacts of interest rates and inflation on our portfolio companies. Higher interest rates will disproportionately affect companies with no current earnings combined with a valuation that largely relies on distant streams of earnings and cash. Our longtime focus on “profitable growth now” served us well as 2021 progressed. Investors began to realize that the hyper-growth that followed 2020’s lows was not just unrepeatable, but likely to be followed by slowing, or even negative, growth for some firms in 2022. Valuation becomes a key metric in such a disruptive environment for growth stocks.
“Our longtime focus on ‘profitable growth now’ has served us well … valuation becomes a key metric in a disruptive environment for growth stocks.”
—Todd Solomon
(Congress – Mid-Cap Growth)
George Dai, what are Weatherbie’s thoughts about this rotation?
Dai (Weatherbie – Small-Cap Growth): The early November 2020 announcements of efficacious Covid-19 vaccines resulted in a market rotation that the Weatherbie Capital team would view as secular to cyclical—and there are many cyclical companies that meet our criteria for quality and growth.
The largest sector weights of the Russell 2000® Growth Index typically are health care and information technology. It is important to state that Weatherbie Capital is very experienced at investing in these two sectors and have a commensurate weighting in them. However, we also find growth in unexpected places by “fishing in a different pond” of more mundane services companies. As a result, our portfolio will often hold cyclical companies as reflected by positions like Signature Bank of New York, First Service Corporation, or Casella Waste Systems—investments that have been in the portion of the Liberty All-Star Growth Fund that we manage. This investment approach has been in place since the founding of the firm over 25 years ago and does not vary in response to macroeconomic events.
“We find growth in unexpected places by ‘fishing in a different pond’ of more mundane services companies … this approach has been in place for over 25 years and does not vary in response to macroeconomic events.”
—Georg Dai
(Weatherbie – Small-Cap Growth)
| 14 | www.all-starfunds.com |
| Liberty All-Star® Growth Fund | Manager Roundtable |
| (Unaudited) |
Thoughtful responses, thank you. Moving on, let us ask: With an emphasis on your particular capitalization focus for Liberty All-Star Growth Fund—small, mid or large—can you briefly argue the case for growth stocks in light of all the variables in play for the foreseeable future? We’re referring to things like the corona virus, higher inflation, the employment situation and supply chain disruptions. George, we’ll stay with you.
Dai (Weatherbie – Small-Cap Growth): Weatherbie Capital believes it is important to maintain a style-appropriate weighted average market capitalization. We achieve this by requiring new entrants into our portfolio of 50 high quality, smaller growth companies to be at or below $2.5 billion in market capitalization at the time of initial purchase. We will let our winners run up to $15 billion in market capitalization at which point they will typically transition out of the portfolio. These parameters lead to an average weighted market capitalization for the portfolio that is often between the Russell 2000® Growth and Russell 2500® Growth “smaller-cap” benchmarks.
With respect to the macro issues identified in the question, the Weatherbie team continues to find a wide array of new, exciting investment opportunities that meet our initial criteria for growth and quality. Moreover, according to research from our parent company Alger, the S&P 600® Small Cap Index has, on average, historically traded at a price-to-earnings premium relative to the S&P 500®. Currently, however, the S&P 600® Small-Cap Index exhibits a price/earnings discount of about 25 percent.
What’s the thinking from Congress and Sustainable?
Solomon (Congress – Mid-Cap Growth): Mid-cap stocks are primed for solid performance in 2022. Revenues and earnings tend to be more tilted to North America than their larger peers and we still feel that these economies are favorable places to invest compared to the rest of the world. Further, in times of slowing growth, mid-sized firms can be acquisition targets for larger firms that seek to augment their organic growth to satisfy shareholders.
Rao (Sustainable – Large-Cap Growth): In 2021 we saw a surge in more cyclical stocks rebounding off pandemic lows with investors expecting a significant surge in earnings growth from the Russell 1000® Growth Index. With earnings growth expected to moderate in 2022 due to less fiscal stimulus, monetary policy tapering, higher rates, ongoing Covid-19 pressures, and higher regulatory and other costs for businesses, the more predictable and sustainable mid-teens growth generated by our portfolio should look more attractive to investors. Historically, cyclical periods such as 2021 have been among the most difficult for our approach, but this is mitigated by the fact that the periods are typically short-lived and have historically led to a renewed focus on business fundamentals and improved performance by quality growth businesses. Over the coming three years, the portfolio is expected to generate 20.7 percent earnings growth relative to 13.1 percent growth for the Russell 1000® Growth Index.
“With earnings growth expected to moderate in 2022 … the more predictable and sustainable mid-teens growth generated by our portfolio should look more attractive to investors.”
—Kishore Rao
(Sustainable – Large-Cap Growth)
| Annual Report | December 31, 2021 | 15 |
| Liberty All-Star® Growth Fund | Manager Roundtable |
| (Unaudited) |
Some commentators have taken the position that innovation in the U.S. is lagging, i.e., no “disruptive” breakthroughs in recent years on the scale of game changers like PCs/laptops, the Internet and cell phones. Innovation is central to growth companies, and you are close to your portfolio companies. What is your view on this? And cite a company in the portion of the Liberty All-Star Growth Fund that you manage that exemplifies a highly innovative enterprise. Todd, start us off for Congress, please.
Solomon (Congress – Mid-Cap Growth): Our portfolio companies continue to innovate though the pace of new technology introductions remains volatile in a rapidly changing environment. Much of the past two years has been spent re-imagining the workplace environment as a distributed one and maximizing existing tools. Paycom (PAYC) is a perfect example of a company modifying its offerings and how it runs its own business. The company’s workforce, including its salesforce, went fully remote quickly by necessity and management was unsure how the sales team would perform without being face-to-face with existing clients and prospects. Results came in better than expected as time wasted during travel and nonproductive tasks was focused on remaining in contact with decision-makers. With its own experience in managing a remote workforce, it could improve its products and add offerings that enable better remote human resource management.
Kishore, what’s the large-cap perspective?
Rao (Sustainable – Large-Cap Growth): We would disagree that there are not substantial game changing companies present today. We see such game changers in health care, cloud computing and software as a service that are transforming the way business is done and the way health care will be delivered. Companies in the portfolio which would fall into these categories include very familiar names such as Amazon, Microsoft, Google and salesforce.com as well as not-so-familiar names such as Autodesk, Workday, Intuit, Intuitive Surgical and Illumina. Intuitive Surgical (ISRG) is a leader in robotic surgeries, which are revolutionizing patient care, reducing the time people spend recovering from surgery, improving patient results and reducing the costs of providing advanced health care. With the largest number of surgeons trained on its products and a broadening set of approved procedures, we see the company’s long-term revenue and earnings growth fitting the predictability and sustainability criteria we seek.
George, wrap up the discussion for us, please.
Dai (Weatherbie – Small-Cap Growth): As mentioned earlier, our team continues to find a wide array of new, exciting investment opportunities that meet our initial criteria for growth and quality. The U.S. enjoys some of the best colleges and universities in the world and they continuously produce innovative entrepreneurs—many of whom start their companies here. An example in the Liberty All-Star Growth Fund portfolio is Upstart Holdings, Inc. (UPST). The company operates a cloud-based artificial intelligence (AI) lending platform. The company’s platform aggregates consumer demand for loans and connects it to its network of the company’s AI-enabled bank partners. Its platform connects consumers, banks and institutional investors through a shared AI lending platform. Upstart exemplifies a highly innovative enterprise. We invested in the company in late December 2020 and it has since passed beyond our maximum market capitalization threshold of $15 billion and “graduated” from the portfolio.
| 16 | www.all-starfunds.com |
| Liberty All-Star® Growth Fund | Manager Roundtable |
| (Unaudited) |
Many thanks for sharing your thinking. The investment environment and the macro factors that shape it may merit consideration as you assess potential portfolio companies. But change is ongoing and the best way to meet the challenges it poses is well-researched, ground-up portfolio construction that reflects a well-defined style and strategy.
| Annual Report | December 31, 2021 | 17 |
| Liberty All-Star® Growth Fund | Schedule of Investments |
| December 31, 2021 |
| SHARES | VALUE | |||||||
| COMMON STOCKS (97.55%) | ||||||||
| COMMUNICATION SERVICES (6.01%) | ||||||||
| Entertainment (2.78%) | ||||||||
| Netflix, Inc.(a) | 7,528 | $ | 4,535,168 | |||||
| Take-Two Interactive Software, Inc.(a) | 20,000 | 3,554,400 | ||||||
| Walt Disney Co.(a) | 29,643 | 4,591,404 | ||||||
| 12,680,972 | ||||||||
| Interactive Media & Services (3.17%) | ||||||||
| Alphabet, Inc., Class C(a) | 1,843 | 5,332,886 | ||||||
| Match Group, Inc.(a) | 29,158 | 3,856,146 | ||||||
| Meta Platforms, Inc., Class A(a) | 15,640 | 5,260,514 | ||||||
| 14,449,546 | ||||||||
| Media (0.06%) | ||||||||
| TechTarget, Inc.(a) | 2,880 | 275,501 | ||||||
| CONSUMER DISCRETIONARY (12.20%) | ||||||||
| Distributors (0.87%) | ||||||||
| Pool Corp. | 7,000 | 3,962,000 | ||||||
| Diversified Consumer Services (0.99%) | ||||||||
| Chegg, Inc.(a) | 147,637 | 4,532,456 | ||||||
| Hotels, Restaurants & Leisure (1.97%) | ||||||||
| Planet Fitness, Inc., Class A(a) | 28,518 | 2,583,160 | ||||||
| Wingstop, Inc. | 5,787 | 999,994 | ||||||
| Yum! Brands, Inc. | 38,923 | 5,404,848 | ||||||
| 8,988,002 | ||||||||
| Internet & Direct Marketing Retail (2.90%) | ||||||||
| Amazon.com, Inc.(a) | 2,714 | 9,049,399 | ||||||
| Etsy, Inc.(a) | 19,000 | 4,159,860 | ||||||
| 13,209,259 | ||||||||
| Leisure Products (0.76%) | ||||||||
| Latham Group, Inc.(a) | 137,794 | 3,448,984 | ||||||
| Multiline Retail (0.53%) | ||||||||
| Ollie's Bargain Outlet Holdings, Inc.(a) | 47,547 | 2,433,931 | ||||||
| Specialty Retail (3.88%) | ||||||||
| Asbury Automotive Group, Inc.(a) | 21,500 | 3,713,695 | ||||||
| Burlington Stores, Inc.(a) | 11,500 | 3,352,365 | ||||||
| Floor & Decor Holdings, Inc., Class A(a) | 30,500 | 3,965,305 | ||||||
| MYT Netherlands Parent BV(a)(b)(c) | 121,972 | 2,587,026 | ||||||
| See Notes to Financial Statements. | |
| 18 | www.all-starfunds.com |
| Liberty All-Star® Growth Fund | Schedule of Investments |
| December 31, 2021 |
| SHARES | VALUE | |||||||
| COMMON STOCKS (continued) | ||||||||
| Specialty Retail (continued) | ||||||||
| Williams-Sonoma, Inc. | 24,000 | $ | 4,059,120 | |||||
| 17,677,511 | ||||||||
| Textiles, Apparel & Luxury Goods (0.30%) | ||||||||
| Canada Goose Holdings, Inc.(a) | 36,645 | 1,358,063 | ||||||
| CONSUMER STAPLES (1.81%) | ||||||||
| Food Products (0.91%) | ||||||||
| McCormick & Co., Inc. | 43,000 | 4,154,230 | ||||||
| Household Products (0.90%) | ||||||||
| Church & Dwight Co., Inc. | 40,000 | 4,100,000 | ||||||
| ENERGY (0.75%) | ||||||||
| Energy Equipment & Services (0.75%) | ||||||||
| Core Laboratories NV | 154,288 | 3,442,165 | ||||||
| FINANCIALS (7.83%) | ||||||||
| Banks (1.12%) | ||||||||
| First Republic Bank | 18,000 | 3,717,180 | ||||||
| Seacoast Banking Corp. of Florida | 38,672 | 1,368,602 | ||||||
| 5,085,782 | ||||||||
| Capital Markets (4.74%) | ||||||||
| Hamilton Lane, Inc., Class A | 66,264 | 6,866,276 | ||||||
| MSCI, Inc. | 7,556 | 4,629,485 | ||||||
| Raymond James Financial, Inc. | 37,500 | 3,765,000 | ||||||
| StepStone Group, Inc., Class A | 152,952 | 6,358,215 | ||||||
| 21,618,976 | ||||||||
| Consumer Finance (1.14%) | ||||||||
| American Express Co. | 24,334 | 3,981,042 | ||||||
| LendingTree, Inc.(a) | 10,038 | 1,230,659 | ||||||
| 5,211,701 | ||||||||
| Insurance (0.33%) | ||||||||
| Goosehead Insurance, Inc., Class A | 11,626 | 1,512,310 | ||||||
| Thrifts & Mortgage Finance (0.50%) | ||||||||
| Axos Financial, Inc.(a) | 40,712 | 2,276,208 | ||||||
| HEALTH CARE (20.76%) | ||||||||
| Biotechnology (4.67%) | ||||||||
| ACADIA Pharmaceuticals, Inc.(a) | 61,536 | 1,436,250 | ||||||
| See Notes to Financial Statements. | |
| Annual Report | December 31, 2021 | 19 |
| Liberty All-Star® Growth Fund | Schedule of Investments |
| December 31, 2021 |
| SHARES | VALUE | |||||||
| COMMON STOCKS (continued) | ||||||||
| Biotechnology (continued) | ||||||||
| Horizon Pharma Plc(a) | 37,500 | $ | 4,041,000 | |||||
| Natera, Inc.(a) | 77,671 | 7,253,695 | ||||||
| Neurocrine Biosciences, Inc.(a) | 37,000 | 3,151,290 | ||||||
| Regeneron Pharmaceuticals, Inc.(a) | 7,151 | 4,515,999 | ||||||
| Ultragenyx Pharmaceutical, Inc.(a) | 10,784 | 906,827 | ||||||
| 21,305,061 | ||||||||
| Health Care Equipment & Supplies (7.52%) | ||||||||
| Abbott Laboratories | 32,721 | 4,605,153 | ||||||
| Cooper Cos., Inc. | 10,000 | 4,189,400 | ||||||
| Danaher Corp. | 18,784 | 6,180,124 | ||||||
| Glaukos Corp.(a) | 35,780 | 1,590,063 | ||||||
| Inogen, Inc.(a) | 5,434 | 184,756 | ||||||
| Intuitive Surgical, Inc.(a) | 8,429 | 3,028,540 | ||||||
| Nevro Corp.(a) | 32,265 | 2,615,724 | ||||||
| ResMed, Inc. | 15,000 | 3,907,200 | ||||||
| STERIS PLC | 16,500 | 4,016,265 | ||||||
| West Pharmaceutical Services, Inc. | 8,500 | 3,986,585 | ||||||
| 34,303,810 | ||||||||
| Health Care Providers & Services (4.26%) | ||||||||
| Apria, Inc.(a) | 118,659 | 3,868,284 | ||||||
| PetIQ, Inc.(a) | 29,787 | 676,463 | ||||||
| Progyny, Inc.(a) | 144,301 | 7,265,555 | ||||||
| UnitedHealth Group, Inc. | 15,151 | 7,607,923 | ||||||
| 19,418,225 | ||||||||
| Health Care Technology (0.47%) | ||||||||
| Inspire Medical Systems, Inc.(a) | 6,525 | 1,501,141 | ||||||
| Tabula Rasa HealthCare, Inc.(a) | 42,654 | 639,810 | ||||||
| 2,140,951 | ||||||||
| Life Sciences Tools & Services (3.81%) | ||||||||
| Charles River Laboratories International, Inc.(a) | 10,500 | 3,956,190 | ||||||
| Illumina, Inc.(a) | 8,092 | 3,078,520 | ||||||
| Mettler-Toledo International, Inc.(a) | 2,500 | 4,243,025 | ||||||
| NeoGenomics, Inc.(a) | 19,400 | 661,928 | ||||||
| Thermo Fisher Scientific, Inc. | 8,115 | 5,414,653 | ||||||
| 17,354,316 | ||||||||
| Pharmaceuticals (0.03%) | ||||||||
| Aerie Pharmaceuticals, Inc.(a) | 17,441 | 122,436 | ||||||
| INDUSTRIALS (13.32%) | ||||||||
| Aerospace & Defense (0.80%) | ||||||||
| Huntington Ingalls Industries, Inc. | 17,000 | 3,174,580 | ||||||
| See Notes to Financial Statements. | |
| 20 | www.all-starfunds.com |
| Liberty All-Star® Growth Fund | Schedule of Investments |
| December 31, 2021 |
| SHARES | VALUE | |||||||
| COMMON STOCKS (continued) | ||||||||
| Aerospace & Defense (continued) | ||||||||
| Kratos Defense & Security Solutions, Inc.(a) | 25,297 | $ | 490,762 | |||||
| 3,665,342 | ||||||||
| Building Products (0.85%) | ||||||||
| Masco Corp. | 55,000 | 3,862,100 | ||||||
| Commercial Services & Supplies (5.21%) | ||||||||
| Casella Waste Systems, Inc., Class A(a) | 94,309 | 8,055,875 | ||||||
| Cintas Corp. | 9,000 | 3,988,530 | ||||||
| Copart, Inc.(a) | 27,500 | 4,169,550 | ||||||
| Montrose Environmental Group, Inc.(a) | 106,822 | 7,532,019 | ||||||
| 23,745,974 | ||||||||
| Construction & Engineering (0.85%) | ||||||||
| Ameresco, Inc., Class A(a) | 47,578 | 3,874,752 | ||||||
| Electrical Equipment (0.66%) | ||||||||
| Generac Holdings, Inc.(a) | 8,500 | 2,991,320 | ||||||
| Machinery (0.88%) | ||||||||
| IDEX Corp. | 17,000 | 4,017,440 | ||||||
| Professional Services (1.94%) | ||||||||
| Booz Allen Hamilton Holding Corp. | 50,000 | 4,239,500 | ||||||
| IHS Markit, Ltd. | 34,667 | 4,607,938 | ||||||
| 8,847,438 | ||||||||
| Trading Companies & Distributors (2.13%) | ||||||||
| SiteOne Landscape Supply, Inc.(a) | 35,504 | 8,601,909 | ||||||
| Transcat, Inc.(a) | 12,219 | 1,129,402 | ||||||
| 9,731,311 | ||||||||
| INFORMATION TECHNOLOGY (28.30%) | ||||||||
| Communications Equipment (0.84%) | ||||||||
| Ciena Corp.(a) | 50,000 | 3,848,500 | ||||||
| Electronic Equipment, Instruments & Components (3.57%) | ||||||||
| Keysight Technologies, Inc.(a) | 20,000 | 4,130,200 | ||||||
| Novanta, Inc.(a) | 23,070 | 4,067,933 | ||||||
| Teledyne Technologies, Inc.(a) | 9,000 | 3,932,010 | ||||||
| Zebra Technologies Corp., Class A(a) | 7,000 | 4,166,400 | ||||||
| 16,296,543 | ||||||||
| IT Services (6.09%) | ||||||||
| Akamai Technologies, Inc.(a) | 32,000 | 3,745,280 | ||||||
| CI&T, Inc.(a) | 53,924 | 641,156 | ||||||
| See Notes to Financial Statements. | |
| Annual Report | December 31, 2021 | 21 |
| Liberty All-Star® Growth Fund | Schedule of Investments |
| December 31, 2021 |
| SHARES | VALUE | |||||||
| COMMON STOCKS (continued) | ||||||||
| IT Services (continued) | ||||||||
| FleetCor Technologies, Inc.(a) | 17,036 | $ | 3,813,338 | |||||
| Globant SA(a) | 18,653 | 5,858,721 | ||||||
| Grid Dynamics Holdings, Inc.(a) | 15,367 | 583,485 | ||||||
| PayPal Holdings, Inc.(a) | 28,469 | 5,368,684 | ||||||
| Visa, Inc., Class A | 35,802 | 7,758,652 | ||||||
| 27,769,316 | ||||||||
| Semiconductors & Semiconductor Equipment (4.60%) | ||||||||
| Azenta, Inc. | 41,000 | 4,227,510 | ||||||
| Diodes, Inc.(a) | 35,000 | 3,843,350 | ||||||
| Entegris, Inc. | 28,500 | 3,949,530 | ||||||
| Impinj, Inc.(a) | 21,428 | 1,900,664 | ||||||
| Monolithic Power Systems, Inc. | 8,000 | 3,946,640 | ||||||
| Skyworks Solutions, Inc. | 20,000 | 3,102,800 | ||||||
| 20,970,494 | ||||||||
| Software (13.20%) | ||||||||
| Autodesk, Inc.(a) | 16,337 | 4,593,801 | ||||||
| BTRS Holdings, Inc.(a) | 58,642 | 458,580 | ||||||
| Cerence, Inc.(a) | 41,953 | 3,215,278 | ||||||
| Ebix, Inc. | 11,979 | 364,162 | ||||||
| Everbridge, Inc.(a) | 17,385 | 1,170,532 | ||||||
| Intuit, Inc. | 8,106 | 5,213,941 | ||||||
| LivePerson, Inc.(a) | 17,071 | 609,776 | ||||||
| Microsoft Corp. | 22,601 | 7,601,168 | ||||||
| Paycom Software, Inc.(a) | 10,000 | 4,151,900 | ||||||
| Qualys, Inc.(a) | 30,000 | 4,116,600 | ||||||
| Rapid7, Inc.(a) | 11,001 | 1,294,708 | ||||||
| RingCentral, Inc., Class A(a) | 16,412 | 3,074,788 | ||||||
| salesforce.com, Inc.(a) | 21,142 | 5,372,817 | ||||||
| SEMrush Holdings, Inc., Class A(a) | 28,606 | 596,435 | ||||||
| SPS Commerce, Inc.(a) | 70,638 | 10,055,319 | ||||||
| Vertex, Inc., Class A(a) | 138,284 | 2,194,567 | ||||||
| Workday, Inc., Class A(a) | 22,298 | 6,091,368 | ||||||
| 60,175,740 | ||||||||
| MATERIALS (2.73%) | ||||||||
| Chemicals (0.68%) | ||||||||
| Linde PLC | 8,929 | 3,093,274 | ||||||
| Containers & Packaging (2.05%) | ||||||||
| Ball Corp. | 64,515 | 6,210,859 | ||||||
| Ranpak Holdings Corp.(a) | 83,241 | 3,128,197 | ||||||
| 9,339,056 | ||||||||
| See Notes to Financial Statements. | |
| 22 | www.all-starfunds.com |
| Liberty All-Star® Growth Fund | Schedule of Investments |
| December 31, 2021 |
| SHARES | VALUE | |||||||
| COMMON STOCKS (continued) | ||||||||
| REAL ESTATE (3.84%) | ||||||||
| Equity Real Estate Investment Trusts (REITs) (1.92%) | ||||||||
| Equinix, Inc. | 5,490 | $ | 4,643,662 | |||||
| Sun Communities, Inc. | 19,500 | 4,094,415 | ||||||
| 8,738,077 | ||||||||
| Real Estate Management & Development (1.92%) | ||||||||
| FirstService Corp. | 44,675 | 8,777,297 | ||||||
| TOTAL COMMON STOCKS | ||||||||
| (COST OF $291,608,606) | 444,806,370 | |||||||
| SHORT TERM INVESTMENTS (5.06%) | ||||||||
| MONEY MARKET FUND (4.85%) | ||||||||
| State Street Institutional US Government Money Market Fund, 0.03%(d) | ||||||||
| (COST OF $22,092,767) | 22,092,767 | 22,092,767 | ||||||
| INVESTMENTS PURCHASED WITH COLLATERAL FROM SECURITIES LOANED (0.21%) | ||||||||
| State Street Navigator Securities Lending Government Money Market Portfolio, 0.03% | ||||||||
| (COST OF $941,775) | 941,775 | 941,775 | ||||||
| TOTAL SHORT TERM INVESTMENTS | ||||||||
| (COST OF $23,034,542) | 23,034,542 | |||||||
| TOTAL INVESTMENTS (102.61%) | ||||||||
| (COST OF $314,643,148) | 467,840,912 | |||||||
| LIABILITIES IN EXCESS OF OTHER ASSETS (-2.61%) | (11,879,719 | ) | ||||||
| NET ASSETS (100.00%) | $ | 455,961,193 | ||||||
| NET ASSET VALUE PER SHARE | ||||||||
| (55,276,044 SHARES OUTSTANDING) | $ | 8.25 | ||||||
| See Notes to Financial Statements. | |
| Annual Report | December 31, 2021 | 23 |
| Liberty All-Star® Growth Fund | Schedule of Investments |
| December 31, 2021 |
| (a) | Non-income producing security. |
| (b) | Security, or a portion of the security position, is currently on loan. The total market value of securities on loan is $967,176. |
| (c) | American Depositary Receipt. |
| (d) | Rate reflects seven-day effective yield on December 31, 2021. |
| See Notes to Financial Statements. | |
| 24 | www.all-starfunds.com |
| Liberty All-Star® Growth Fund | Statement of Assets and Liabilities |
| December 31, 2021 |
| ASSETS: | ||||
| Investments at value (Cost $314,643,148)(a) | $ | 467,840,912 | ||
| Receivable for investment securities sold | 7,169,951 | |||
| Dividends and interest receivable | 74,655 | |||
| Tax reclaim receivable | 19,356 | |||
| Prepaid and other assets | 42,700 | |||
| TOTAL ASSETS | 475,147,574 | |||
| LIABILITIES: | ||||
| Payable for investments purchased | 304,367 | |||
| Distributions payable to shareholders | 17,417,273 | |||
| Investment advisory fee payable | 288,252 | |||
| Payable for administration, pricing and bookkeeping fees | 90,305 | |||
| Payable for collateral upon return of securities loaned | 941,775 | |||
| Accrued expenses | 144,409 | |||
| TOTAL LIABILITIES | 19,186,381 | |||
| NET ASSETS | $ | 455,961,193 | ||
| NET ASSETS REPRESENTED BY: | ||||
| Paid-in capital | $ | 281,286,282 | ||
| Total distributable earnings | 174,674,911 | |||
| NET ASSETS | $ | 455,961,193 | ||
| Shares of common stock outstanding (authorized 200,000,000 shares at $0.10 Par) | 55,276,044 | |||
| NET ASSET VALUE PER SHARE | $ | 8.25 | ||
| (a) | Includes securities on loan of $967,176. |
| See Notes to Financial Statements. | |
| Annual Report | December 31, 2021 | 25 |
| Liberty All-Star® Growth Fund | Statement of Operations |
| For the Year Ended December 31, 2021 |
| INVESTMENT INCOME: | ||||
| Dividends (Net of foreign taxes withheld at source which amounted to $5,738) | $ | 1,590,047 | ||
| Securities lending income | 278,312 | |||
| TOTAL INVESTMENT INCOME | 1,868,359 | |||
| EXPENSES: | ||||
| Investment advisory fee | 3,170,775 | |||
| Administration fee | 792,706 | |||
| Pricing and bookkeeping fees | 113,670 | |||
| Audit fee | 30,286 | |||
| Custodian fee | 44,838 | |||
| Directors' fees and expenses | 154,771 | |||
| Insurance expense | 10,842 | |||
| Legal fees | 54,254 | |||
| NYSE fee | 40,782 | |||
| Proxy fees | 24,800 | |||
| Shareholder communication expenses | 32,604 | |||
| Transfer agent fees | 74,386 | |||
| Miscellaneous expenses | 10,188 | |||
| TOTAL EXPENSES | 4,554,902 | |||
| NET INVESTMENT LOSS | (2,686,543 | ) | ||
| REALIZED AND UNREALIZED GAIN ON INVESTMENTS: | ||||
| Net realized gain on investments | 56,783,488 | |||
| Net change in unrealized appreciation on investments | 8,985,632 | |||
| NET REALIZED AND UNREALIZED GAIN ON INVESTMENTS | 65,769,120 | |||
| NET INCREASE IN NET ASSETS RESULTING FROM OPERATIONS | $ | 63,082,577 | ||
| See Notes to Financial Statements. | |
| 26 | www.all-starfunds.com |
| Liberty All-Star® Growth Fund | Statements of Changes in Net Assets |
| For the Year Ended December 31, 2021 | For the Year Ended December 31, 2020 | |||||||
| FROM OPERATIONS: | ||||||||
| Net investment loss | $ | (2,686,543 | ) | $ | (1,853,706 | ) | ||
| Net realized gain on investments | 56,783,488 | 44,464,729 | ||||||
| Net change in unrealized appreciation on investments | 8,985,632 | 64,059,457 | ||||||
| Net Increase in Net Assets From Operations | 63,082,577 | 106,670,480 | ||||||
| DISTRIBUTIONS TO SHAREHOLDERS: | ||||||||
| From distributable earnings | (51,219,586 | ) | (25,798,075 | ) | ||||
| Total Distributions | (51,219,586 | ) | (25,798,075 | ) | ||||
| CAPITAL SHARE TRANSACTIONS: | ||||||||
| Proceeds from rights offering, net of offering cost | 87,267,859 | 13,230,787 | ||||||
| Dividend reinvestments | 18,689,426 | 8,712,285 | ||||||
| Net increase resulting from Capital Share Transactions | 105,957,285 | 21,943,072 | ||||||
| Total Increase in Net Assets | 117,820,276 | 102,815,477 | ||||||
| NET ASSETS: | ||||||||
| Beginning of period | 338,140,917 | 235,325,440 | ||||||
| End of period | $ | 455,961,193 | $ | 338,140,917 | ||||
| See Notes to Financial Statements. | |
| Annual Report | December 31, 2021 | 27 |
Liberty All-Star® Growth Fund
Financial Highlights
| PER SHARE OPERATING PERFORMANCE: |
| Net asset value at beginning of period |
| INCOME FROM INVESTMENT OPERATIONS: |
| Net investment loss(a) |
| Net realized and unrealized gain/(loss) on investments |
| Total from Investment Operations |
| LESS DISTRIBUTIONS TO SHAREHOLDERS: |
| Net realized gain on investments |
| Total Distributions |
| Change due to rights offering(b) |
| Net asset value at end of period |
| Market price at end of period |
| TOTAL INVESTMENT RETURN FOR SHAREHOLDERS:(c) |
| Based on net asset value |
| Based on market price |
| RATIOS AND SUPPLEMENTAL DATA: |
| Net assets at end of period (millions) |
| Ratio of expenses to average net assets |
| Ratio of net investment loss to average net assets |
| Portfolio turnover rate |
| (a) | Calculated using average shares outstanding during the period. |
| (b) | Effect of Fund's rights offering for shares at a price below net asset value, net of costs. |
| (c) | Calculated assuming all distributions are reinvested at actual reinvestment prices and all primary rights in the Fund's rights offerings were exercised. The net asset value and market price returns will differ depending upon the level of any discount from or premium to net asset value at which the Fund's shares traded during the period. Past performance is not a guarantee of future results. |
| See Notes to Financial Statements. | |
| 28 | www.all-starfunds.com |
Financial Highlights
| For the Year Ended December 31, | ||||||||||||||||||
| 2021 | 2020 | 2019 | 2018 | 2017 | ||||||||||||||
| $ | 7.98 | $ | 6.19 | $ | 4.94 | $ | 5.67 | $ | 4.80 | |||||||||
| (0.06 | ) | (0.05 | ) | (0.03 | ) | (0.03 | ) | (0.02 | ) | |||||||||
| 1.46 | 2.51 | 1.74 | (0.01 | ) | 1.31 | |||||||||||||
| 1.37 | 2.46 | 1.71 | (0.04 | ) | 1.29 | |||||||||||||
| (1.02 | ) | (0.63 | ) | (0.46 | ) | (0.46 | ) | (0.42 | ) | |||||||||
| (1.02 | ) | (0.63 | ) | (0.46 | ) | (0.46 | ) | (0.42 | ) | |||||||||
| (0.11 | ) | (0.04 | ) | – | (0.23 | ) | – | |||||||||||
| $ | 8.25 | $ | 7.98 | $ | 6.19 | $ | 4.94 | $ | 5.67 | |||||||||
| $ | 9.00 | $ | 8.20 | $ | 6.50 | $ | 4.39 | $ | 5.54 | |||||||||
| 18.1 | % | 42.4 | % | 35.8 | % | (1.0 | %) | 28.6 | % | |||||||||
| 25.4 | % | 39.4 | % | 60.5 | % | (9.9 | %) | 44.3 | % | |||||||||
| $ | 456 | $ | 338 | $ | 235 | $ | 183 | $ | 154 | |||||||||
| 1.12 | % | 1.20 | % | 1.22 | % | 1.25 | % | 1.26 | % | |||||||||
| (0.66 | %) | (0.69 | %) | (0.57 | %) | (0.47 | %) | (0.46 | %) | |||||||||
| 42 | % | 55 | % | 34 | % | 49 | % | 40 | % | |||||||||
| Annual Report | December 31, 2021 | 29 |
| Liberty All-Star® Growth Fund | Notes to Financial Statements |
| December 31, 2021 |
NOTE 1. ORGANIZATION
Liberty All-Star® Growth Fund, Inc. (the “Fund”) is a Maryland corporation registered under the Investment Company Act of 1940 (the “1940 Act”), as amended, as a diversified, closed-end management investment company.
Investment Goal
The Fund seeks long-term capital appreciation.
Fund Shares
The Fund may issue 200,000,000 shares of common stock at $0.10 par.
NOTE 2. SIGNIFICANT ACCOUNTING POLICIES
The following is a summary of significant accounting policies consistently followed by the Fund in the preparation of its financial statements. The Fund is considered an investment company under U.S. generally accepted accounting principles (“GAAP”) and follows the accounting and reporting guidance applicable to investment companies in the Financial Accounting Standards Board Accounting Standards Codification Topic 946.
Use of Estimates
The preparation of financial statements in conformity with GAAP requires management to make estimates and assumptions that affect the reported amounts and disclosures in the financial statements. Actual results could differ from these estimates.
Security Valuation
Equity securities are valued at the last sale price at the close of the principal exchange on which they trade, except for securities listed on the NASDAQ Stock Market LLC (“NASDAQ”), which are valued at the NASDAQ official closing price. Unlisted securities or listed securities for which there were no sales during the day are valued at the closing bid price on such exchanges or over-the-counter markets.
Cash collateral from securities lending activity is reinvested in the State Street Navigator Securities Lending Government Money Market Portfolio (“State Street Navigator”), a registered investment company under the 1940 Act, which operates as a money market fund in compliance with Rule 2a-7 under the 1940 Act. Shares of registered investment companies are valued daily at that investment company’s net asset value per share.
The Fund’s investments are valued at market value or, in the absence of market value with respect to any portfolio securities, at fair value according to procedures adopted by the Fund's Board of Directors (the "Board"). When market quotations are not readily available, or in management’s judgment they do not accurately reflect fair value of a security, or an event occurs after the market close but before the Fund is priced that materially affects the value of a security, the securities will be valued by the Fund’s Fair Valuation Committee, using fair valuation procedures established by the Board. Examples of potentially significant events that could materially impact the value of a security include, but are not limited to: single issuer events such as corporate actions, reorganizations, mergers, spin-offs, liquidations, acquisitions and buyouts; corporate announcements on earnings or product offerings; regulatory news; and litigation and multiple issuer events such as governmental actions; natural disasters or armed conflicts that affect a country or a region; or significant market fluctuations. Potential significant events are monitored by the Advisor, ALPS Advisors, Inc. (the “Advisor” and “AAI”), Sub-Advisers and/or the Valuation Committee through independent reviews of market indicators, general news sources and communications from the Fund’s custodian. As of December 31, 2021, the Fund held no securities that were fair valued.
| 30 | www.all-starfunds.com |
| Liberty All-Star® Growth Fund | Notes to Financial Statements |
| December 31, 2021 |
Security Transactions
Security transactions are recorded on trade date. Cost is determined and gains/(losses) are based upon the specific identification method for both financial statement and federal income tax purposes.
Income Recognition
Interest income is recorded on the accrual basis. Corporate actions and dividend income are recorded on the ex-date.
The Fund estimates components of distributions from real estate investment trusts (“REITs”). Distributions received in excess of income are recorded as a reduction of the cost of the related investments. Once the REIT reports annually the tax character of its distributions, the Fund revises its estimates. If the Fund no longer owns the applicable securities, any distributions received in excess of income are recorded as realized gains.
Lending of Portfolio Securities
The Fund may lend its portfolio securities only to borrowers that are approved by the Fund’s securities lending agent, State Street Bank & Trust Co. (“SSB”). The Fund will limit such lending to not more than 20% of the value of its total assets. The borrower pledges and maintains with the Fund collateral consisting of cash (U.S. Dollar only), securities issued or guaranteed by the U.S. government or its agencies or instrumentalities, or by irrevocable bank letters of credit issued by a person other than the borrower or an affiliate of the borrower. The initial collateral received by the Fund is required to have a value of no less than 102% of the market value of the loaned securities for securities traded on U.S. exchanges and a value of no less than 105% of the market value for all other securities. The collateral is maintained thereafter, at a market value equal to no less than 100% of the current value of the securities on loan. The market value of the loaned securities is determined at the close of each business day and any additional required collateral is delivered to the Fund on the next business day. During the term of the loan, the Fund is entitled to all distributions made on or in respect of the loaned securities. Loans of securities are terminable at any time and the borrower, after notice, is required to return borrowed securities within the standard time period for settlement of securities transactions.
Any cash collateral received is reinvested in State Street Navigator. Non-cash collateral, in the form of securities issued or guaranteed by the U.S. government or its agencies or instrumentalities, is not disclosed in the Fund’s Statement of Assets and Liabilities as it is held by the lending agent on behalf of the Fund and the Fund does not have the ability to re-hypothecate these securities. Income earned by the Fund from securities lending activity is disclosed in the Statement of Operations.
| Annual Report | December 31, 2021 | 31 |
| Liberty All-Star® Growth Fund | Notes to Financial Statements |
| December 31, 2021 |
The following is a summary of the Fund's securities lending positions and related cash and non-cash collateral received as of December 31, 2021:
| Market Value of Securities on Loan | Cash Collateral Received | Non-Cash Collateral Received | Total Collateral Received | |||||||||||
| $ | 967,176 | $ | 941,775 | $ | 50,025 | $ | 991,800 | |||||||
The risks of securities lending include the risk that the borrower may not provide additional collateral when required or may not return the securities when due. To mitigate these risks, the Fund benefits from a borrower default indemnity provided by SSB. SSB’s indemnity allows for full replacement of securities lent wherein SSB will purchase the unreturned loaned securities on the open market by applying the proceeds of the collateral or to the extent such proceeds are insufficient or the collateral is unavailable, SSB will purchase the unreturned loan securities at SSB’s expense. However, the Fund could suffer a loss if the value of the investments purchased with cash collateral falls below the value of the cash collateral received.
The following table reflects a breakdown of transactions accounted for as secured borrowings, the gross obligation by the type of collateral pledged or securities loaned, and the remaining contractual maturity of those transactions as of December 31, 2021:
Remaining contractual maturity of the agreements
| Securities Lending Transactions | Overnight & Continuous | Up to 30 days | 30-90 days | Greater than 90 days | Total | |||||||||||||||
| Common Stocks | $ | 941,775 | $ | – | $ | – | $ | – | $ | 941,775 | ||||||||||
| Total Borrowings | $ | 941,775 | ||||||||||||||||||
| Gross amount of recognized liabilities for securities lending (collateral received) | $ | 941,775 | ||||||||||||||||||
Fair Value Measurements
The Fund discloses the classification of its fair value measurements following a three-tier hierarchy based on the inputs used to measure fair value. Inputs refer broadly to the assumptions that market participants would use in pricing the asset or liability, including assumptions about risk. Inputs may be observable or unobservable. Observable inputs reflect the assumptions market participants would use in pricing the asset or liability that are developed based on market data obtained from sources independent of the reporting entity. Unobservable inputs reflect the reporting entity’s own assumptions about the assumptions market participants would use in pricing the asset or liability that are developed based on the best information available.
Valuation techniques used to value the Fund's investments by major category are as follows:
Equity securities that are valued based on unadjusted quoted prices in active markets are categorized as Level 1 in the hierarchy. In the event there were no sales during the day or closing prices are not available, securities are valued at the mean of the most recent quoted bid and ask prices on such day and are generally categorized as Level 2 in the hierarchy. Investments in open-end mutual funds are valued at their closing NAV each business day and are categorized as Level 1 in the hierarchy.
| 32 | www.all-starfunds.com |
| Liberty All-Star® Growth Fund | Notes to Financial Statements |
| December 31, 2021 |
Various inputs are used in determining the value of the Fund’s investments as of the end of the reporting period. When inputs used fall into different levels of the fair value hierarchy, the level in the hierarchy within which the fair value measurement falls is determined based on the lowest level input that is significant to the fair value measurement in its entirety. The designated input levels are not necessarily an indication of the risk or liquidity associated with these investments.
These inputs are categorized in the following hierarchy under applicable financial accounting standards:
| Level 1 – | Unadjusted quoted prices in active markets for identical investments, unrestricted assets or liabilities that a Fund has the ability to access at the measurement date; |
| Level 2 – | Quoted prices which are not active, quoted prices for similar assets or liabilities in active markets or inputs other than quoted prices that are observable (either directly or indirectly) for substantially the full term of the asset or liability; and |
| Level 3 – | Significant unobservable prices or inputs (including the Fund’s own assumptions in determining the fair value of investments) where there is little or no market activity for the asset or liability at the measurement date. |
The following is a summary of the inputs used to value the Fund’s investments as of December 31, 2021:
| Valuation Inputs | ||||||||||||||||
| Investments in Securities at Value | Level 1 | Level 2 | Level 3 | Total | ||||||||||||
| Common Stocks* | $ | 444,806,370 | $ | – | $ | – | $ | 444,806,370 | ||||||||
| Short Term Investments | 23,034,542 | – | – | 23,034,542 | ||||||||||||
| Total | $ | 467,840,912 | $ | – | $ | – | $ | 467,840,912 | ||||||||
| * | See Schedule of Investments for industry classifications. |
The Fund did not have any securities that used significant unobservable inputs (Level 3) in determining fair value during the period. There were no transfers into or out of Level 3 during the year ended December 31, 2021.
Distributions to Shareholders
The Fund currently has a policy of paying distributions on its common shares totaling approximately 8% of its net asset value per year. The distributions are payable in four quarterly distributions of 2% of the Fund’s net asset value at the close of the New York Stock Exchange on the Friday prior to each quarterly declaration date. Distributions to shareholders are recorded on ex-date.
NOTE 3. RISKS
Investment and Market Risk
An investment in shares is subject to investment risk, including the possible loss of the entire amount invested. An investment in shares represents an indirect investment in the securities owned by the Fund, most of which are anticipated to be traded on a national securities exchange or in the over-the-counter markets. The value of these securities, like other market investments, may move up or down, sometimes rapidly and unpredictably. Shares at any point in time may be worth less than their original cost, even after taking into account the reinvestment of dividends and other distributions.
| Annual Report | December 31, 2021 | 33 |
| Liberty All-Star® Growth Fund | Notes to Financial Statements |
| December 31, 2021 |
Common Stock Risk
The Fund is not limited in the percentage of its assets that may be invested in common stocks and other equity securities, and therefore a risk of investing in the Fund is common stock or equity risk. Equity risk is the risk that the market value of securities held by the Fund will fall due to general market or economic conditions, perceptions regarding the industries in which the issuers of securities held by the Fund participate, and the particular circumstances and performance of particular companies whose securities the Fund holds. In addition, common stock of an issuer in the Fund’s portfolio may decline in price if the issuer fails to make anticipated dividend payments because, among other reasons, the issuer of the security experiences a decline in its financial condition. Common equity securities in which the Fund will invest are structurally subordinated to preferred stocks, bonds and other debt instruments in a company’s capital structure, in terms of priority to corporate income, and therefore will be subject to greater payment risk than preferred stocks or debt instruments of such issuers. In addition, while broad market measures of common stocks have historically generated higher average returns than fixed income securities, common stocks have also experienced significantly more volatility in their returns.
Growth stocks are stocks of companies believed to have above-average potential for growth in revenue and earnings. In certain market conditions, prices of growth stocks may be more sensitive to changes in current or expected earnings than the prices of other stocks. Growth stocks may not perform as well as the stock market in general.
Market Disruption and Geopolitical Risk
Social, political, and economic events, such as natural disasters and health emergencies (e.g., epidemics and pandemics, such as the recent COVID-19 outbreak), ongoing U.S military activities and political developments, as well as the threat of terrorist attacks, could have significant adverse effects on the U.S. economy, the stock market, world economies and markets generally, and may lead to volatility in the value of the Fund’s investments. These types of events may develop quickly and unexpectedly and could significantly impact issuers, industries, governments and other systems, including financial markets. Global systems are increasingly interconnected, and an event in one area of the world may have adverse effects in other economies and financial markets. It is difficult to predict the timing or duration of an event, or its impact on the Fund and its shareholders.
NOTE 4. FEDERAL TAX INFORMATION
The timing and character of income and capital gain distributions are determined in accordance with income tax regulations, which may differ from GAAP. Reclassifications are made to the Fund’s capital accounts for permanent tax differences to reflect income and gains available for distribution (or available capital loss carryforwards) under income tax regulations. If, for any calendar year, the total distributions made under the distribution policy exceed the Fund’s net investment income and net realized capital gains, the excess will generally be treated as a non-taxable return of capital, reducing the shareholder’s adjusted basis in his or her shares. If the Fund’s net investment income and net realized capital gains for any year exceed the amount distributed under the distribution policy, the Fund may, in its discretion, retain and not distribute net realized capital gains and pay income tax thereon to the extent of such excess.
| 34 | www.all-starfunds.com |
| Liberty All-Star® Growth Fund | Notes to Financial Statements |
| December 31, 2021 |
Classification of Distributions to Shareholders
Net investment income/(loss) and net realized gain/(loss) may differ for financial statement and tax purposes. The character of distributions made during the year from net investment income or net realized gains may differ from its ultimate characterization for federal income tax purposes. Due to the timing of dividend distributions, the fiscal year in which amounts are distributed may differ from the fiscal year in which the income or realized gain was recorded by the Fund. The amounts and characteristics of tax basis distributions and composition of distributable earnings/(accumulated losses) are determined at the time in which distributions are paid, which may occur after the fiscal year end. Accordingly, tax basis balances have not been determined as of December 31, 2021.
The tax character of distributions paid during the years ended December 31, 2021 and December 31, 2020 were as follows:
| Distributions Paid From: | December 31, 2021 | December 31, 2020 | ||||||
| Ordinary Income | $ | 26,571,453 | $ | 8,209,844 | ||||
| Long-term capital gains | 24,648,133 | 17,588,231 | ||||||
| Total | $ | 51,219,586 | $ | 25,798,075 | ||||
As of December 31, 2021, the components of distributable earnings on a tax basis were as follows:
| Undistributed Ordinary Income | Accumulated Capital Gains | Net Unrealized Appreciation | Other Cumulative Effect of Timing Differences | Total | ||||||||||||||
| $ | – | $ | 23,499,111 | $ | 151,159,615 | $ | 16,185 | $ | 174,674,911 | |||||||||
As of December 31, 2021, the cost of investments for federal income tax purposes and accumulated net unrealized appreciation/(depreciation) on investments was as follows:
| Cost of Investments | Gross unrealized Appreciation (excess of value over tax cost) | Gross unrealized Depreciation (excess of tax cost over value) | Net Unrealized Appreciation | |||||||||||
| $ | 316,681,298 | $ | 168,791,738 | $ | (17,632,123 | ) | $ | 151,159,615 | ||||||
The differences between book-basis and tax-basis are primarily due to deferral of losses from wash sales and the differing treatment of certain other investments.
Federal Income Tax Status
For federal income tax purposes, the Fund currently qualifies, and intends to remain qualified, as a regulated investment company under the provisions of Subchapter M of the Internal Revenue Code of 1986, as amended, by distributing substantially all of its investment company taxable net income including realized gain, not offset by capital loss carryforwards, if any, to its shareholders. Accordingly, no provision for federal income or excise taxes has been made.
| Annual Report | December 31, 2021 | 35 |
| Liberty All-Star® Growth Fund | Notes to Financial Statements |
| December 31, 2021 |
As of and during the year ended December 31, 2021, the Fund did not have a liability for any unrecognized tax benefits. The Fund files U.S. federal, state, and local tax returns as required. The Fund’s tax returns are subject to examination by the relevant tax authorities until expiration of the applicable statute of limitations, which is generally three years after the filing of the tax return. Tax returns for open years have incorporated no uncertain tax positions that require a provision for income taxes.
NOTE 5. FEES AND COMPENSATION PAID TO AFFILIATES
Investment Advisory Fee
AAI serves as the investment advisor to the Fund. AAI receives a monthly investment advisory fee based on the Fund’s average daily net assets at the following annual rates:
| Average Daily Net Assets | Annual Fee Rate |
| First $300 million | 0.80% |
| Over $300 million | 0.72% |
Investment Advisory Fees for the year ended December 31, 2021 are reported on the Statement of Operations.
AAI retains multiple Portfolio Managers to manage the Fund’s investments in various asset classes. AAI pays each Portfolio Manager a portfolio management fee based on the assets of the investment portfolio that they manage. The portfolio management fee is paid from the investment advisory fees collected by AAI and is based on the Fund’s average daily net assets at the following annual rates:
| Average Daily Net Assets | Annual Fee Rate |
| First $300 million | 0.40% |
| Over $300 million | 0.36% |
Administration, Bookkeeping and Pricing Services
ALPS Fund Services, Inc. (“ALPS”) serves as the administrator to the Fund and the Fund has agreed to pay expenses incurred in connection with this service. Pursuant to an Administrative, Bookkeeping and Pricing Services Agreement, ALPS provides operational services to the Fund including, but not limited to, fund accounting and fund administration and generally assists in the Fund’s operations. The Fund’s administration fee is accrued on a daily basis and paid monthly. Administration, Pricing and Bookkeeping fees paid by the Fund for the year ended December 31, 2021 are disclosed in the Statement of Operations.
The Fund also reimburses ALPS for out-of-pocket expenses and charges, including fees payable to third parties for pricing the Fund’s portfolio securities and direct internal costs incurred by ALPS in connection with providing fund accounting oversight and monitoring and certain other services.
| 36 | www.all-starfunds.com |
| Liberty All-Star® Growth Fund | Notes to Financial Statements |
| December 31, 2021 |
Fees Paid to Officers
All officers of the Fund, including the Fund’s Chief Compliance Officer, are employees of AAI or its affiliates, and receive no compensation from the Fund. The Board of Directors has appointed a Chief Compliance Officer to the Fund in accordance with federal securities regulations.
NOTE 6. PORTFOLIO INFORMATION
Purchases and Sales of Securities
For the year ended December 31, 2021, the cost of purchases and proceeds from sales of securities, excluding short-term obligations, were $212,604,223 and $167,347,874, respectively.
NOTE 7. CAPITAL TRANSACTIONS
In a rights offering, which expired on June 28, 2021, shareholders exercised rights to purchase 10,660,771 shares at a subscription price of $8.21 per share for proceeds, net of expenses of $257,071, of $87,267,859. If the shares would have been issued at the NAV the proceeds would have been $92,171,814, net of expenses.
In a rights offering, which expired on March 27, 2020, shareholders exercised rights to purchase 3,094,412 shares at a subscription price of $4.34 per share for proceeds, net of expenses of $198,961, of $13,230,787. If the shares would have been issued at the NAV the proceeds would have been $14,530,440, net of expenses.
During the years ended December 31, 2021 and December 31, 2020, distributions in the amounts of $18,689,426 and $8,712,285, respectively, were paid in newly issued shares valued at market value or net asset value, but not less than 95% of market value. Such distributions resulted in the issuance of 2,240,208 and 1,262,794 shares, respectively.
NOTE 8. INDEMNIFICATION
In the normal course of business, the Fund enters into contracts that contain a variety of representations and warranties and which provide general indemnities. The Fund’s maximum exposure under these arrangements is unknown, as this would involve future claims against the Fund. Also, under the Fund’s organizational documents and by contract, the Directors and Officers of the Fund are indemnified against certain liabilities that may arise out of their duties to the Fund. However, based on experience, the Fund expects the risk of loss due to these warranties and indemnities to be minimal.
NOTE 9. OTHER MATTERS
Maryland Statutes
By resolution of the Board of Directors, the Fund has opted into the Maryland Control Share Acquisition Act and the Maryland Business Combination Act. In general, the Maryland Control Share Acquisition Act provides that “control shares” of a Maryland corporation acquired in a control share acquisition may not be voted except to the extent approved by shareholders at a meeting by a vote of two-thirds of the votes entitled to be cast on the matter (excluding shares owned by the acquirer and by officers or directors who are employees of the corporation). “Control shares” are voting shares of stock which, if aggregated with all other shares of stock owned by the acquirer or in respect of which the acquirer is able to exercise or direct the exercise of voting power (except solely by virtue of a revocable proxy), would entitle the acquirer to exercise voting power in electing directors within certain statutorily defined ranges (one-tenth but less than one-third, one-third but less than a majority, and more than a majority of the voting power). In general, the Maryland Business Combination Act prohibits an interested shareholder (a shareholder that holds 10% or more of the voting power of the outstanding stock of the corporation) of a Maryland corporation from engaging in a business combination (generally defined to include a merger, consolidation, share exchange, sale of a substantial amount of assets, a transfer of the corporation’s securities and similar transactions to or with the interested shareholder or an entity affiliated with the interested shareholder) with the corporation for a period of five years after the most recent date on which the interested shareholder became an interested shareholder. At the time of adoption, March 19, 2009, the Board and the Fund were not aware of any shareholder that held control shares or that was an interested shareholder under the statutes.
| Annual Report | December 31, 2021 | 37 |
| Liberty All-Star® Growth Fund | Notes to Financial Statements |
| December 31, 2021 |
NOTE 10. SUBSEQUENT EVENTS
Effective January 1, 2022, the Fund's Administrative fee schedule includes an additional breakpoint on average daily net assets over $600 million at 0.162% and the Fund Accounting fee, Financial Reporting fee and Multi-Manager fee included in the Fund’s Administration Agreement have been removed.
| 38 | www.all-starfunds.com |
| Liberty All-Star® | Report of Independent Registered |
| Growth Fund | Public Accounting Firm |
To the shareholders and the Board of Directors of Liberty All-Star® Growth Fund, Inc.
Opinion on the Financial Statements and Financial Highlights
We have audited the accompanying statement of assets and liabilities of Liberty All-Star® Growth Fund, Inc. (the "Fund"), including the schedule of investments, as of December 31, 2021, the related statement of operations for the year then ended, the statements of changes in net assets for each of the two years in the period then ended, the financial highlights for each of the five years in the period then ended, and the related notes. In our opinion, the financial statements and financial highlights present fairly, in all material respects, the financial position of the Fund as of December 31, 2021, and the results of its operations for the year then ended, the changes in its net assets for each of the two years in the period then ended, and the financial highlights for each of the five years in the period then ended in conformity with accounting principles generally accepted in the United States of America.
Basis for Opinion
These financial statements and financial highlights are the responsibility of the Fund's management. Our responsibility is to express an opinion on the Fund's financial statements and financial highlights based on our audits. We are a public accounting firm registered with the Public Company Accounting Oversight Board (United States) (PCAOB) and are required to be independent with respect to the Fund in accordance with the U.S. federal securities laws and the applicable rules and regulations of the Securities and Exchange Commission and the PCAOB.
We conducted our audits in accordance with the standards of the PCAOB. Those standards require that we plan and perform the audit to obtain reasonable assurance about whether the financial statements and financial highlights are free of material misstatement, whether due to error or fraud. The Fund is not required to have, nor were we engaged to perform, an audit of its internal control over financial reporting. As part of our audits we are required to obtain an understanding of internal control over financial reporting but not for the purpose of expressing an opinion on the effectiveness of the Fund’s internal control over financial reporting. Accordingly, we express no such opinion.
Our audits included performing procedures to assess the risks of material misstatement of the financial statements and financial highlights, whether due to error or fraud, and performing procedures that respond to those risks. Such procedures included examining, on a test basis, evidence regarding the amounts and disclosures in the financial statements and financial highlights. Our audits also included evaluating the accounting principles used and significant estimates made by management, as well as evaluating the overall presentation of the financial statements and financial highlights. Our procedures included confirmation of securities owned as of December 31, 2021, by correspondence with the custodian and brokers; when replies were not received from brokers, we performed other auditing procedures. We believe that our audits provide a reasonable basis for our opinion.
DELOITTE & TOUCHE LLP
Denver, Colorado
February 25, 2022
We have served as the auditor of one or more investment companies advised by ALPS Advisors, Inc. since 2007.
| Annual Report | December 31, 2021 | 39 |
| Liberty All-Star® | Automatic Dividend Reinvestment |
| Growth Fund | and Direct Purchase Plan |
| (Unaudited) |
Under the Fund’s Automatic Dividend Reinvestment and Direct Purchase Plan (the “Plan”), shareholders automatically participate and have all their Fund dividends and distributions reinvested by Computershare Trust Company, N.A., as agent for participants in the Plan (the “Plan Agent”), in additional shares of the Fund. For further information, call Investor Assistance at 1-800-LIB-FUND (1-800-542-3863) weekdays between 9 a.m. and 5 p.m. Eastern Time.
Shareholders whose shares are held in the name of a brokerage firm, bank or other nominee can participate in the Plan only if their brokerage firm, bank or nominee is able to do so on their behalf. Shareholders participating in the Plan through a brokerage firm may not be able to transfer their shares to another brokerage firm and continue to participate in the Plan.
Under the Plan, all dividends and distributions will be reinvested in additional shares of the Fund. Distributions declared payable in cash will be reinvested for the accounts of participants in the Plan in additional shares purchased by the Plan Agent on the open market at prevailing market prices. If, prior to the Plan Agent’s completion of such open market purchases, the market price of a share plus estimated brokerage commissions exceeds the net asset value, the remainder of the distribution will be paid in newly issued shares valued at net asset value (but not at a discount of more than 5% from market price). Distributions declared payable in shares (or cash at the option of shareholders) are paid to participants in the Plan entirely in newly issued full and fractional shares valued at the lower of market value or net asset value per share on the valuation date for the distribution (but not at a discount of more than 5 percent from market price). Dividends and distributions are subject to taxation, whether received in cash or in shares.
Plan participants have the option of making additional investments of $100 or more on a monthly basis up to a maximum of $120,000 in a calendar year. These direct purchases will be invested on or shortly after the 15th of each month and direct purchases should be sent so as to be received by the Plan Agent at least two business days prior to the next investment date. Barring suspension of trading, direct purchases will be invested within 35 days after such date. Alternatively, participants can authorize an automatic monthly deduction from a checking or savings account at a U.S. bank or other financial institution. A participant may withdraw a direct purchase by written notice received by the Plan Agent at least two business days before such payment is to be invested.
The Plan Agent maintains all shareholder accounts in the Plan and furnishes confirmations of all transactions in the account, including information needed by shareholders for tax records. Shares in the account of each Plan participant will be held by the Plan Agent in book-entry or noncertificated form in the name of the participant, and each shareholder’s proxy will include those shares purchased or received pursuant to the Plan.
There is no charge to participants for reinvesting distributions pursuant to the Plan. The Plan Agent’s fees are paid by the Fund, therefore indirectly by shareholders. There are no brokerage charges with respect to shares issued directly by the Fund as a result of dividends or distributions declared payable in shares. However, each participant bears a per share fee (which includes any brokerage commissions the Plan Agent is required to pay) incurred with respect to the Plan Agent’s open market purchases in connection with the reinvestment of distributions declared payable in cash.
| 40 | www.all-starfunds.com |
| Liberty All-Star® | Automatic Dividend Reinvestment |
| Growth Fund | and Direct Purchase Plan |
| (Unaudited) |
With respect to direct purchases, the Plan Agent will charge $1.25 for purchase by check and $2.00 for automatic investment transactions, plus a per share fee (which includes any brokerage commissions the Plan Agent is required to pay). Sales of shares held in the Plan will also be subject to a service fee of $2.50 and a per share fee currently $0.10. All fees described in this summary are subject to change. Please contact the Plan Agent for the current fees.
Shareholders may terminate their participation in the Plan by notifying the Plan Agent by telephone, through the Internet or in writing. Such termination will be effective immediately if notice is received by The Plan Agent prior to any dividend record date.
The Fund reserves the right to amend or terminate the Plan.
The full text of the Plan may be found on the Fund’s website at www.all-starfunds.com.
| Annual Report | December 31, 2021 | 41 |
| Liberty All-Star® Growth Fund | Additional Information |
| (Unaudited) |
TAX INFORMATION
All 2021 distributions whether received in cash or shares of the Fund consist of the following:
| (1) | ordinary dividends |
| (2) | long-term capital gains |
The table below details the breakdown of each 2021 distribution for federal income tax purposes.
| Total Ordinary Dividends | |||||
| Record Date | Payable Date | Amount per Share | Qualified | Non- Qualified | Long-Term Capital Gains |
| 01/22/21 | 03/08/21 | $0.16 | 2.73% | 49.15% | 48.12% |
| 04/23/21 | 06/07/21 | $0.17 | 2.73% | 49.15% | 48.12% |
| 07/23/21 | 09/07/21 | $0.17 | 2.73% | 49.15% | 48.12% |
| 11/19/21 | 01/03/22 | $0.52 | 2.73% | 49.15% | 48.12% |
Tax Designations
The Fund designates the following as a percentage of taxable ordinary income distributions for the calendar year ended December 31, 2021:
| Qualified Dividend Income | 5.26% |
| Dividend Received Deduction | 4.89% |
Pursuant to Section 852(b)(3) of the Internal Revenue Code, Liberty All-Star Growth Fund designated $24,648,133 as long-term capital gain dividends.
SHAREHOLDER MEETING RESULTS
On August 26, 2021, the Annual Meeting of Shareholders of the Fund was held to amend the Articles of Incorporation and to elect two Directors to the Board. On June 14, 2021, the record date for the meeting, the Fund had outstanding 42,967,143 shares of common stock. The votes cast at the meeting were as follows:
Proposal – To approve amendment to the Fund's Articles of Incorporation:
| For | Against/Withheld | Abstain |
| 22,690,037.211 | 8,483,487.317 | 1,019,919.460 |
Proposal – To elect two Directors:
| Nominee | For | Against/Withheld |
| Thomas W. Brock | 30,958,212.932 | 1,235,231.056 |
| John J. Neuhauser | 30,855,075.757 | 1,338,368.231 |
| 42 | www.all-starfunds.com |
| Liberty All-Star® Growth Fund | Directors and Officers |
| (Unaudited) |
The names of the Directors and Officers of the Fund, the date each was first elected or appointed to office, their term of office, their principal business occupations and other directorships they have held during at least the last five years, are shown below.
DISINTERESTED DIRECTORS
| Name (Year of Birth) and Address* | Position with the Fund, Term of Office and Length of Service | Principal Occupation(s) During Past Five Years | Number of Portfolios in Fund Complex Overseen by Director** | Other Directorships Held |
| Thomas W. Brock Year of Birth: 1947 | Director since 2005; Chairman since 2015; Term expires 2024 | Chief Executive Officer, Silver Bay Realty (2016 –2017); Acting Chief Executive Officer, Silver Bay Realty (2016); Director, Silver Bay Realty (2012-2017) | 2 | Trustee, Liberty All- Star® Equity Fund. (since 2005); Trustee, Equitable AXA Annuity Trust (since January 2016), and 1290 Funds (since January 2016) |
| George R. Gaspari Year of Birth: 1940 | Director since 2006; Term expires 2022 | Financial Services Consultant (1996-2012) | 2 | Trustee, Liberty All-Star® Equity Fund (since 2006); Trustee (1999 – January 2021) and Chairman — Audit Committee (January 2015 – January 2021), The Select Sector SPDR Trust |
John J. Neuhauser Year of Birth: 1943 | Director since 1998; Term expires 2024 | Retired. Formerly, President, St. Michael’s College (2007-2018); University Professor December 2005- 2007, Boston College (formerly Academic Vice President and Dean of Faculties, from 1999 - 2005, Boston College) | 2 | Trustee, Liberty All- Star® Equity Fund (since 1998) |
| Annual Report | December 31, 2021 | 43 |
| Liberty All-Star® Growth Fund | Directors and Officers |
| (Unaudited) |
DISINTERESTED DIRECTORS
| Name (Year of Birth) and Address* | Position with the Fund, Term of Office and Length of Service | Principal Occupation(s) During Past Five Years | Number of Portfolios in Fund Complex Overseen by Director** | Other Directorships Held |
| Maureen K. Usifer Year of Birth: 1960 | Director since 2018; Term expires 2023 | Board Member Green Mountain Care Board (2017-2021), Board Advisor, Healthy Living Market (2017-Present), Board of Trustees, Saint Michael’s College (2015- Present), and Chief Financial Officer, Seventh Generation, Inc. (2012-2016), Director PC Construction (2021-Present) | 2 | Trustee, Liberty All- Star® Equity Fund (since 2018); Director BlackRock Capital Investment Corporation (2005-Present) |
| Milton M. Irvin Year of Birth: 1949 | Director since 2018; Term expires 2023 | Retired (2012); Chair, Advisory Board Member Castle Oak Securities (2012- present); Chair, Investment Committee Member Executive Leadership Council (2006-2020); Chair, Board Member South Carolina State University (2015- 2020); Graduate Executive Board Member Wharton School (2009-2016) | 2 | Trustee, Liberty All-Star® Equity Fund (since 2018) |
| 44 | www.all-starfunds.com |
| Liberty All-Star® Growth Fund | Directors and Officers |
| (Unaudited) |
DISINTERESTED DIRECTORS
| Name (Year of Birth) and Address* | Position with the Fund, Term of Office and Length of Service | Principal Occupation(s) During Past Five Years | Number of Portfolios in Fund Complex Overseen by Director** | Other Directorships Held |
| Edmund J. Burke*** Year of Birth: 1961 | Director since 2006; Term expires 2022 | Mr. Burke joined ALPS in 1991 and served as the President and Director of ALPS Holdings, Inc., and ALPS Advisors, Inc., and Director of ALPS Distributors, Inc., ALPS Fund Services, Inc. (“ALPS”), and ALPS Portfolio Solutions Distributor, Inc. (collectively, the “ALPS Companies”). Mr. Burke retired from the ALPS Companies in June 2019. Mr. Burke is currently a partner at ETF Action, a web-based system that provides data and analytics to registered investment advisers, (since 2020) and a Director of Alliance Bioenergy Plus, Inc., technology company focused on emerging technologies in the renewable energy, biofuels, and bioplastics technology sectors (since 2020). | 27 | Trustee, Liberty All- Star® Equity Fund (since 2006); Trustee (since 2017) – ALPS ETF Trust, Trustee (since 2009) - Financial Investors Trust, Trustee (since 2004) - Clough Global Dividend and Income Fund, Trustee (since 2006) - Clough Global Equity Fund, Trustee - Clough Global Opportunities Fund, and Trustee - Clough Funds Trust (since 2015). |
| * | The address for all Directors is: c/o ALPS Fund Services, Inc., 1290 Broadway, Suite 1000; Denver, CO 80203. |
| ** | The “Fund Complex” for the Fund includes the Fund, Liberty All-Star® Equity Fund, and any registered investment company advised by AAI or any registered investment company sub-advised by Congress Asset Management Company, LLP, Sustainable Growth Advisers, LP, and Weatherbie Capital LLC. |
| *** | Mr. Burke was considered to be an “Interested Director” until December 31, 2021 because of his previous positions with ALPS. |
| Annual Report | December 31, 2021 | 45 |
| Liberty All-Star® Growth Fund | Directors and Officers |
| (Unaudited) |
OFFICERS
| Name (Year of Birth) and Address* | Position with the Fund | Year First Elected or Appointed to Office | Principal Occupation(s) During Past Five Years |
| William R. Parmentier, Jr. (1952) | President | 1999 | Chief Investment Officer, ALPS Advisors, Inc. (since 2006); President of the Liberty All-Star Funds (since April 1999); Senior Vice President, Banc of America Investment Advisors, Inc. (2005-2006). Mr. Parmentier is deemed an affiliate of the Funds as defined under the 1940 Act. |
| Mark T. Haley CFA (1964) | Senior Vice President | 1999 | Senior Vice President of the Liberty All-Star Funds (since January 1999); Vice President, ALPS Advisors, Inc. (since 2006); Vice President, Banc of America Investment Advisors (1999-2006). Mr. Haley is deemed an affiliate of the Funds as defined under the 1940 Act. |
| Erich Rettinger (1985) | Treasurer | 2021 | Vice President of AAI (since 2021) and serves as Treasurer of RiverNorth Opportunities Fund, Inc., Liberty All-Star Equity Fund, Principal Real Estate Income Fund, and ALPS Variable Investment Trust. From 2013-2021, he served as Vice President and Fund Controller of ALPS Fund Services. Because of his position with AAI, Mr. Rettinger is deemed an affiliate of the Fund as defined under the 1940 Act. |
| Matthew Sutula (1985) | Chief Compliance Officer | 2019 | Chief Compliance Officer of ALPS Advisors, Inc. (“AAI”) (since 2016). Prior to his current role, Mr. Sutula served as Compliance Manager and Senior Compliance Analyst for AAI, as well as Compliance Analyst for ALPS Fund Services, Inc. Prior to joining ALPS, he spent seven years at Morningstar, Inc. in various analyst roles supporting the registered investment company databases. Mr. Sutula is also Chief Compliance Officer of Principal Real Estate Income Fund, ALPS Variable Investment Trust, RiverNorth Opportunities Fund, Inc. and Liberty All- Star® Equity Fund. Because of his position with ALPS, Mr. Sutula is deemed an affiliate of the Funds as defined under the 1940 Act. |
| 46 | www.all-starfunds.com |
| Liberty All-Star® Growth Fund | Directors and Officers |
| (Unaudited) |
OFFICERS
| Name (Year of Birth) and Address* | Position with the Fund | Year First Elected or Appointed to Office | Principal Occupation(s) During Past Five Years |
| Sareena Khwaja-Dixon (1980) | Secretary | 2016 | Principal Legal Counsel and Vice President of ALPS Fund Services, Inc. Secretary of RiverNorth Opportunities Fund, Inc., Clough Dividend and Income Fund, Clough Global Opportunities Fund, Clough Global Equity Fund, Liberty All-Star® Equity Fund, Reaves Utility Income Fund, and Clough Funds Trust and Assistant Secretary of RiverNorth Specialty Finance Corp, RiverNorth/DoubleLine Strategic Opportunity Fund, Inc., RiverNorth Flexible Municipal Income Fund, Inc., RiverNorth Managed Duration Municipal Income Fund, Inc., RiverNorth Funds, and RiverNorth Opportunistic Municipal Income Fund, Inc. Because of her position with ALPS, Ms. Khwaja-Dixon is deemed an affiliate of the Funds as defined under the 1940 Act. |
| Tanya Tancheff (1973) | Assistant Secretary | 2021 | Senior Paralegal with ALPS. Assistant Secretary of Liberty All-Star® Equity Fund. Because of her position with ALPS, Ms. Tancheff is deemed an affiliate of the Funds as defined under the 1940 Act. |
| * | The address of each officer, other than Messrs. Parmentier and Haley is: c/o ALPS Fund Services, Inc., 1290 Broadway, Suite 1000, Denver, CO 80203. The address of Messrs. Parmentier and Haley is c/o ALPS Advisors, Inc., One Financial Center, 4th Floor, Boston, MA 02111. |
| Annual Report | December 31, 2021 | 47 |
| Liberty All-Star® | Board Consideration of the Renewal of the Fund |
| Growth Fund | Management & Portfolio Management Agreements |
| (Unaudited) |
The Investment Company Act of 1940 requires that the Board of Directors (“Board’) of the Liberty All-Star Growth Fund, Inc. (“Fund”), including all of the Directors who are not “interested persons” of the Fund (“Independent Directors”), annually review the Fund’s investment advisory agreements and consider whether to renew them for an additional year. At its meeting on September 10, 2021, the Board, including a majority of the Independent Directors, conducted such a review and approved the continuation of the Fund Management Agreement between the Fund and ALPS Advisors, Inc. (“AAI”) and each separate Portfolio Management Agreement among the Fund, AAI and the following independent investment management firms: Congress Asset Management Company, LLP (Congress”), Sustainable Growth Advisers, LP (“Sustainable”) and Weatherbie Capital, LLC (“Weatherbie”). Congress, Sustainable, and Weatherbie collectively are referred to as “Portfolio Managers,” and each as a “Portfolio Manager.”
Prior to the Board’s action, the Independent Directors met to consider management’s recommendations with respect to the renewal of the Fund Management Agreement and the Portfolio Management Agreements (each, an “Agreement” and, collectively, the Agreements”). In reaching its decision to renew each Agreement, the Board considered the overall fairness of each Agreement and whether each Agreement was in the best interests of the Fund. The Board further considered factors it deemed relevant with respect to the Fund, including: (1) the nature, extent and quality of services provided to the Fund by AAI, its affiliates and each Portfolio Manager; (2) the performance of the Fund and the Portfolio Managers (3) the level of the Fund’s management and portfolio management fees and expense ratios; (4) the costs of the services provided and profits realized by AAI and its affiliates from their relationship with the Fund; (5) the extent to which economies of scale would be realized as the Fund grows and whether fee levels will reflect economies of scale for the benefit of shareholders; (6) the “fall-out” benefits to AAI, each Portfolio Manager and their respective affiliates (i.e., any direct or indirect benefits to be derived by AAI, each Portfolio Manager and their respective affiliates from their relationships with the Fund); and (7) other general information about AAI and each Portfolio Manager. In considering each Agreement, the Board did not identify any single factor or information as all-important or controlling and each Independent Director may have attributed different weight to each factor.
The Board considered these factors in the context of the Fund’s multi-manager methodology, which seeks to achieve more consistent and less volatile performance over the long term than if a single Portfolio Manager was employed. The Fund allocates its portfolio assets among Portfolio Managers recommended by AAI and approved by the Board, currently three for the Fund. The Board considered that each Portfolio Manager employs a different investment style and/or strategy, and from time to time AAI rebalances the Fund’s portfolio assets among the Portfolio Managers. The Board also took into account that AAI continuously analyzes and evaluates each Portfolio Manager’s investment performance and portfolio composition and, from time to time recommends changes in the Portfolio Managers.
In connection with its deliberations, the Board considered information furnished throughout the year at regular Board meetings, as well as information prepared specifically in connection with the annual renewal and approval process. Information furnished and discussed throughout the year included AAI’s analyses of the Fund’s investment performance and related financial information for the Fund, presentations given by the Fund’s Portfolio Managers, as well as periodic reports on legal, compliance, brokerage commissions and execution and other services provided by AAI, the Portfolio Managers and their affiliates. Information furnished specifically in connection with the renewal process included, among other things, a report of the Fund’s investment performance over various time periods as compared to a peer universe and a market index and the Fund’s fees and expenses as compared to comparable groups of closed-end funds and open-end multi-managed funds based, in part, on information prepared by AAI regarding review of the Lipper peer groups. The information provided by AAI generally included information reflecting the Fund’s management fees, expense ratios, investment performance and profitability, including AAI’s profitability with respect to the Fund.
| 48 | www.all-starfunds.com |
| Liberty All-Star® | Board Consideration of the Renewal of the Fund |
| Growth Fund | Management & Portfolio Management Agreements |
| (Unaudited) |
As part of the process to consider the Agreements, legal counsel to the Independent Directors requested information on behalf of the Independent Directors from AAI and each Portfolio Manager. In response to these requests, the Independent Directors received reports from AAI and each Portfolio Manager that addressed specific factors designed to inform the Independent Directors’ consideration of each Agreement. In addition, counsel also provided the Independent Directors and the Board with a memorandum discussing the legal standards applicable to their consideration of the Agreements. In considering the proposed renewals, the Board considered all factors they believed to be relevant, including those discussed below. The Board did not identify any one factor as being dispositive.
Based on their evaluation of all material factors, the Board unanimously concluded that the terms of each Agreement were reasonable and fair and that the renewal of each of the Agreements was in the best interests of the Fund and its shareholders. The following is a summary of the Board’s considerations and conclusions during the full Board meeting and Executive Session regarding these matters.
Nature, Extent and Quality of the Services Provided
The Board considered the nature, extent and quality of the portfolio manager selection, evaluation and monitoring services provided by AAI, and the portfolio management services provided by each Portfolio Manager, in light of the investment objective of the Fund. The Board also considered the nature, extent and quality of the administrative services provided to the Fund by ALPS Fund Services, Inc., an affiliate of AAI. The Board considered the steps that AAI has taken to encourage strong performance, including AAI’s willingness to recommend Portfolio Manager changes when necessary to address performance issues.
The Board considered the background and experience of the personnel at AAI responsible for Portfolio Manager selection, evaluation and monitoring for the Fund and the personnel at each Portfolio Manager responsible for managing the Fund’s portfolio. The Board also considered the overall financial strength of AAI and each Portfolio Manager, the effect on the Fund of any turnover in personnel at each Portfolio Manager, the insurance maintained by AAI and each Portfolio Manager and the compliance records of AAI and each Portfolio Manager. The Board concluded that the nature, extent and quality of the services provided by AAI and each Portfolio Manager up for renewal were appropriate and consistent with the terms of the Agreements and that the Fund was likely to continue to benefit from services provided under the Agreements.
| Annual Report | December 31, 2021 | 49 |
| Liberty All-Star® | Board Consideration of the Renewal of the Fund |
| Growth Fund | Management & Portfolio Management Agreements |
| (Unaudited) |
Investment Performance
The Board considered the long-term and short-term investment performance of the Fund over multiple periods, which generally included annual total returns both on an absolute basis and relative to an appropriate benchmark and/or Lipper peer universe based on materials showing the performance of the Lipper peer group. The Board considered the Fund’s performance based on both net asset value (“NAV”) and market price and, in general, considered long-term performance to be more important in its evaluation than short-term performance. In addition, the Board considered the performance of the allocated portions of the Fund in the context of the Portfolio Managers’ different investment strategies and styles and the contribution of each Portfolio Manager to the Fund’s overall strategy and performance.
The Board received information which indicated among other things that, based on NAV, the Fund outperformed the Lipper Multi-Cap Growth Mutual Fund Average as of June 30, 2021 for the year-to-date, and one-, three-, five- and ten-year periods.
In addition to the performance of the Fund and each Portfolio Manager’s sleeve of the Fund, the Board considered management’s and the Portfolio Managers’ explanations for the Fund’s performance and the relevant benchmarks and peer groups. The Board accepted the explanations and determined that the performance information and explanations supported the renewal of the Agreements.
Costs of the Services Provided to the Fund
The Board considered the fees paid by the Fund to AAI and the fees paid by AAI to the Portfolio Managers as well as information provided by AAI about the management fees, overall expense ratio and expense reimbursement by AAI for selected closed-end funds and multi-manager open-end equity funds.
The Board considered that the Fund’s management and administration fees and its total expense ratio were lower than the median of a representative group of closed-end funds selected by AAI. The Board also considered that the Fund’s management and expense fees were higher than the median for multi-manager open-end equity funds.
The Board took into account that the Fund’s higher contractual management fees and expense ratios were generally consistent with the higher costs and greater complexity associated with the management of a closed-end multi-manager fund.
The Board considered that AAI currently does not have any institutional clients with investment objectives and strategies comparable to those of the Fund. The Board considered the breakpoint schedule that lowers the management fee rate paid by the Fund as the Fund’s assets increase. The Board also considered the management fees paid to the Portfolio Managers and the fee rates charged by the Portfolio Managers to their other accounts, including institutional accounts. The Board considered that the Portfolio Managers were paid by AAI, not the Fund. The Board also considered the differences in the level of services provided by and the differences in responsibility of AAI and the Portfolio Managers to the Fund and to other accounts. The Board concluded that the management fees payable by the Fund to AAI and the fees payable by AAI to the Portfolio Managers were reasonable in relation to the nature and quality of the services provided, taking into account the management fees paid by selected closed-end funds and open-end equity funds.
| 50 | www.all-starfunds.com |
| Liberty All-Star® | Board Consideration of the Renewal of the Fund |
| Growth Fund | Management & Portfolio Management Agreements |
| (Unaudited) |
Profitability and Costs of Services to AAI
The Board considered the level of profits realized by AAI in connection with the operation of the Fund. The Board considered the profitability information setting forth recent overall profitability of the Fund to AAI, as well as overall profitability information relating to certain prior calendar years. In reviewing the information, attention was given to the methodology followed in allocating costs to the Fund, it being recognized that allocation methodologies are inherently subjective and various allocation methodologies may be reasonable while producing different results. The Board considered management’s ongoing costs and expenditures in providing and improving services for the Fund as well as the ongoing need to meet regulatory and compliance requirements. In addition, the Board considered information prepared by management comparing the profitability of AAI on an overall basis to other investment company managers. The Board also considered the extent to which AAI and its affiliates might derive ancillary benefits from the Fund, noting that an affiliate of AAI serves as the Fund’s administrator and receives compensation for acting in this capacity.
The Board considered that it does not regard Portfolio Manager profitability as meaningful to an evaluation of the Portfolio Manager Agreements because the willingness of the Portfolio Managers to serve in such capacity depends primarily upon arm’s-length negotiations with AAI. The Board and AAI generally are aware of the fees charged by the Portfolio Managers to other clients, and the Board believes that the fees agreed upon with the Portfolio Managers are reasonable in light of the quality of investment advisory services rendered. The Board reached its conclusion based in part on the fees that the Portfolio Managers charge other clients, the reasonableness of the aggregate management fees paid by the Fund and the fact that each Portfolio Manager’s fee is paid by AAI and not the Fund. The Board understood that, as a business matter, AAI was entitled to earn reasonable profits for its services to the Fund. The Board determined that AAI’s profitability was reasonable in relation to the services provided and to the costs of providing management services to the Fund and supported the renewal of the Agreements.
Extent of Economies of Scale as the Fund Grows and Whether Fee Levels Reflect Economies of Scale
The Board considered whether economies of scale are realized by AAI as the Fund grows larger and the extent to which this is reflected in the level of management fees charged. The Board took into consideration the fee breakpoint schedules under the Agreements and concluded that the schedules reflect economies of scale with respect to the selection, evaluation and monitoring of Portfolio Managers and other services performed by AAI and the management of Fund assets by each Portfolio Manager.
The Board also considered that the Fund is currently at an asset level at which it can take advantage of the breakpoints in its fee schedule, the schedule is structured so that as the Fund’s assets increase, economies of scale may be shared for the benefit of shareholders. Based on the foregoing, the Board concluded that the breakpoint schedules in the Fund Agreement allow the Fund to realize economies of scale, which supports the renewal of the Agreements.
| Annual Report | December 31, 2021 | 51 |
| Liberty All-Star® | Board Consideration of the Renewal of the Fund |
| Growth Fund | Management & Portfolio Management Agreements |
| (Unaudited) |
Benefits Derived from the Relationship with the Fund
The Board also considered the potential ancillary, or “fall-out,” benefits that AAI or the Portfolio Managers might receive in connection with their association with the Fund. In its consideration of the Agreements, the Board considered, among other things, that AAI and the Portfolio Managers may derive ancillary benefits from the Fund’s operations. For example, under the Agreements, although it is not currently doing so, AAI may request that transactions giving rise to brokerage commissions be executed through brokers and dealers that provide brokerage or research services to the Fund or AAI. Each Portfolio Manager, through its position as a Portfolio Manager to the Fund, also may engage in soft dollar transactions.
In advance of the meeting, the Board received information regarding each Portfolio Manager’s procedures for executing portfolio transactions for the allocated portion(s) of the Fund and each Portfolio Manager’s soft dollar policies and procedures. In addition, the Board considered that a Portfolio Manager may be affiliated with registered broker-dealers who may, from time to time, receive brokerage commissions from the Fund in connection with the purchase and sale of portfolio securities; provided, however, that those transactions, among other things, must be consistent with seeking best execution. The Board determined that the foregoing ancillary benefits were consistent with the renewal of the Agreements.
Based on its evaluation of all material factors, the Board unanimously concluded that the terms of each Agreement were reasonable and fair and that the renewal of each Agreement was in the best interests of the Fund and its shareholders.
| 52 | www.all-starfunds.com |
| Liberty All-Star® | Summary of Updated Information |
| Growth Fund | Regarding the Fund |
| (Unaudited) |
The following information in this annual report is a summary of certain information about the Fund and changes since the Fund’s prospectus dated May 24, 2021 (the “prior disclosure date”). This information may not reflect all of the changes that have occurred since you purchased the Fund.
Portfolio Manager Information
Since the prior disclosure date, there have been no changes in the Fund’s portfolio managers or background.
Fund Organizational Structure
Since the prior disclosure date, there have been no changes in the Fund’s charter or by-laws that would delay or prevent a change of control of the Fund that have not been approved by stockholders.
Investment Objective
There have been no changes in the Fund’s investment objective since the prior disclosure date that have not been approved by stockholders.
The Fund is a diversified, closed-end management investment company registered under the 1940 Act. The Fund’s investment objective is to seek long-term capital appreciation. Under normal market conditions, the Fund seeks to achieve its investment objective through investing at least 65% of its net assets in a diversified portfolio of equity securities of companies of any market capitalization.
Although under normal market conditions the Fund will remain substantially fully invested in equity securities, up to 35% of the value of the Fund’s total assets may generally be invested in U.S. Government Securities, repurchase agreements with respect to U.S. Government Securities, and, to an extent not greater than 10% of the market value of the Fund’s total assets, money market mutual funds that invest primarily in U.S. Government Securities. The Fund may temporarily invest without limit in U.S. Government Securities, repurchase agreements and money market mutual funds for defensive purposes when AAI or the Portfolio Managers deem that market conditions are such that a more conservative approach to investment is desirable.
The Fund’s investment objective of long-term capital appreciation, as well as certain of its investment restrictions, are fundamental and may not be changed without a majority vote of the Fund’s outstanding shares. Under the 1940 Act, a “majority vote” means the vote of the lesser of (a) 67% of the shares of the Fund represented at a meeting at which the holders of more than 50% of the outstanding shares of the Fund are present or represented, or (b) more than 50% of the outstanding shares of the Fund. Non-fundamental policies may be changed by vote of the Board.
Principal Investment Strategies
There have been no changes in the Fund’s Principal Investment Strategies and Policies since the prior disclosure date.
Investment Practices
The following describes certain of the investment practices in which one or more of the Portfolio Managers may engage, each of which may involve certain special risks.
| Annual Report | December 31, 2021 | 53 |
| Liberty All-Star® | Summary of Updated Information |
| Growth Fund | Regarding the Fund |
| (Unaudited) |
Lending of Portfolio Securities. The Fund, in order to generate additional income, may lend its portfolio securities (principally to broker-dealers) where such loans are callable at any time and are continuously secured by collateral (cash or U.S. Government Securities) equal to and not less than the market value, determined daily, of the securities loaned. The Fund would receive amounts equal to the interest on the securities loaned. It would also be paid for having made the loan. Any cash collateral pursuant to these loans would be invested in Short-Term Money Market Instruments. The Fund could be subjected to delays in recovering the loaned securities in the event of default or bankruptcy of the borrower. The Fund will limit such lending to not more than 20% of the value of the Fund’s total assets. The Fund may pay fees to its custodian bank or others for administrative services in connection with securities loans.
Repurchase Agreements. The Fund may enter into repurchase agreements with banks or broker-dealer firms whereby such institutions sell U.S. Government Securities or other securities in which it may invest to the Fund and agree at the time of sale to repurchase them at a mutually agreed upon time and price. The resale price is greater than the purchase price, reflecting an agreed-upon interest rate that is effective during the time between the purchase and resale and is not related to the stated interest rate on the purchased securities. The Fund requires the seller of the securities to maintain on deposit with the Fund’s custodian bank securities in an amount at all times equal to or in excess of the value of the repurchase agreement. In the event that the seller of the securities defaults on its repurchase obligation or becomes bankrupt, the Fund could receive less than the repurchase price on the sale of the securities to another party or could be subjected to delays in selling the securities. Under normal market conditions, not more than 35% of the Fund’s net assets will be invested in Short-Term Money Market Instruments, including repurchase agreements, and not more than 10% of the Fund’s net assets will be invested in repurchase agreements maturing in more than seven days.
Securities of Other Investment Companies. The Fund may invest in the securities of other investment companies, including open-end mutual funds, closed-end funds, unit investment trusts, private investment companies and offshore investment companies. An investment in an investment company involves risks similar to those of investing directly in the investment company’s portfolio securities, including the risk that the value of the portfolio securities may fluctuate in accordance with changes in the financial condition of their issuers, the value of stocks and other securities generally, and other market factors.
In addition, investing in other investment companies involves certain other risks, costs, and expenses for the Fund. If the Fund invests in another investment company, the Fund will be charged its proportionate share of the advisory fees and other operating expenses of such investment company, which are in addition to the advisory fees and other operational expenses charged to the Fund. In addition, the Fund could incur a sales charge in connection with purchasing an investment company security or a redemption fee upon the redemption of such security. An investment in the shares of a closed-end investment company may also involve the payment of a substantial premium over, while sales of such shares may be made at a substantial discount from, the NAV of the issuers’ portfolio securities. Investments in securities of other investment companies will be made in compliance with applicable 1940 Act limitations. To the extent that the Fund invests in the securities of other investment companies, the Fund’s shareholders will indirectly bear a pro rata share of the investment company’s expenses in addition to the expenses associated with an investment in the Fund. The Fund may invest in investment companies managed by AAI or other affiliates of AAI.
| 54 | www.all-starfunds.com |
| Liberty All-Star® | Summary of Updated Information |
| Growth Fund | Regarding the Fund |
| (Unaudited) |
RISKS
The Fund is a diversified, multi-managed closed-end management investment company designed primarily as a long-term investment and not as a trading vehicle. The Fund is not intended to be a complete investment program and there can be no assurance that the Fund will achieve its investment objective.
Market Discount Risk
In addition, shares of closed-end management investment companies such as the Fund frequently trade at a discount from their NAV. The shares were designed primarily for long-term investors, and investors in shares should not view the Fund as a vehicle for trading purposes. This risk is separate and distinct from the risk that the Fund’s NAV may decline.
Investment and Market Risk
An investment in the Fund’s shares is subject to investment risk, including the possible loss of the entire amount that you invest. Your investment in shares represents an indirect investment in the securities owned by the Fund, most of which are traded on a national securities exchange or in the over-the-counter markets. The value of these securities, like other market investments, may move up or down, sometimes rapidly and unpredictably. Your shares at any point in time may be worth less than your original investment, even after taking into account the reinvestment of dividends and other distributions.
Common Stock Risk
The Fund is not limited in the percentage of its assets that may be invested in common stocks and other equity securities, and therefore a risk of investing in the Fund is equity risk. Equity risk is the risk that the market value of securities held by the Fund will fall due to general market or economic conditions, perceptions regarding the industries in which the issuers of securities held by the Fund participate, and the particular circumstances and performance of particular companies whose securities the Fund holds. For example: an adverse event, such as an unfavorable earnings report, may depress the value of equity securities of an issuer held by the Fund; the price of common stock of an issuer may be particularly sensitive to general movements in the stock market; or a drop in the stock market may depress the price of most or all of the common stocks and other equity securities held by the Fund. In addition, common stock of an issuer in the Fund’s portfolio may decline in price if the issuer fails to make anticipated dividend payments because, among other reasons, the issuer of the security experiences a decline in its financial condition. Common equity securities in which the Fund will invest are structurally subordinated to preferred stocks, bonds and other debt instruments in a company’s capital structure, in terms of priority to corporate income, and therefore will be subject to greater payment risk than preferred stocks or debt instruments of such issuers. In addition, while broad market measures of common stocks have historically generated higher average returns than fixed income securities, common stocks have also experienced significantly more volatility in those returns.
| Annual Report | December 31, 2021 | 55 |
| Liberty All-Star® | Summary of Updated Information |
| Growth Fund | Regarding the Fund |
| (Unaudited) |
Management Risk
The Fund is subject to management risk because it is an actively managed investment portfolio. AAI and the Portfolio Managers will apply investment techniques and risk analyses in selecting Portfolio Managers and making investment decisions for the Fund, respectively, but there can be no guarantee that these will produce the desired results.
Growth Stock Risk
Currently, the Fund’s net assets are allocated to Portfolio Managers that utilize a “growth” approach to investing. Over time, depending on market conditions, this allocation may increase or decrease. Growth stocks are stocks of companies believed to have above-average potential for growth in revenue and earnings. Prices of growth stocks may be more sensitive to changes in current or expected earnings than the prices of other stocks. In certain market conditions, growth stocks may not perform as well as the stock market in general.
Foreign Securities Risk
Investments in foreign securities involve risks in addition to those of investments in U.S. issuers. These risks include political and economic risks, currency fluctuations, higher transaction costs, less liquidity and greater volatility, delayed settlement, confiscatory taxation, withholding of taxes and less stringent investor protection and disclosure of standards in some foreign markets. These risks can make investments in foreign issuers more volatile and potentially less liquid than investments in U.S. issuers.
Tax Risk
The Fund may invest in preferred securities, convertible securities or other securities the federal income tax treatment of the income from which may not be clear or may be subject to recharacterization by the IRS.
The tax treatment of distributions the Fund reports as “qualified dividend income” may be affected by IRS interpretations of the Code and future changes in the Code and the Treasury regulations. There can be no assurance as to what portion, if any, of the Fund’s distributions will constitute qualified dividend income.
Inflation Risk
Inflation risk is the risk that the value of assets or income from investment will be worth less in the future as inflation decreases the value of money. As inflation increases, the real value of the Fund’s shares and distributions can decline.
Deflation Risk
Deflation risk is the risk that prices throughout the economy decline over time, which may have an adverse effect on the market valuation of companies, their assets and revenues. In addition, deflation may have an adverse effect on the creditworthiness of issuers and may make issuer default more likely, which may result in a decline in the value of the Fund’s portfolio.
Small and Mid-Cap Stock Risk
The Fund may invest in companies of any market capitalization. The Fund considers small companies to be those with a market capitalization up to $5 billion and medium-sized companies to be those with a market capitalization between $5 billion and $30 billion. Smaller and medium-sized company stocks may be more volatile than, and perform differently from, larger company stocks.
| 56 | www.all-starfunds.com |
| Liberty All-Star® | Summary of Updated Information |
| Growth Fund | Regarding the Fund |
| (Unaudited) |
Market Disruption and Geopolitical Risk
Certain events have a disruptive effect on the securities markets, such as health emergencies, cyber-attacks, terrorist attacks, war and other geopolitical events. The Fund cannot predict the effects of these events on the U.S. economy, the stock market and world economies and markets generally.
Legislation and Regulatory Risk
At any time after the date of this Prospectus, legislation or additional regulations may be enacted that could negatively affect the assets of the Fund or the issuers of such assets. Changing approaches to regulation may have a negative impact on the entities and/or securities in which the Fund invests. Legislation or regulation may also change the way in which the Fund itself is regulated.
| Annual Report | December 31, 2021 | 57 |
| Liberty All-Star® Growth Fund | Privacy Policy |
| (Unaudited) |
| FACTS | WHAT DO THE LIBERTY ALL-STAR FUNDS DO WITH YOUR PERSONAL INFORMATION? | |
| WHY? | Financial companies choose how they share your personal information. Federal law gives consumers the right to limit some but not all sharing. Federal law also requires us to tell you how we collect, share, and protect your personal information. Please read this notice carefully to understand what we do. | |
| WHAT? | The types of personal information we collect and share depend on the product or service you have with us. This information can include: | |
Social Security number Assets Retirement Assets Transaction History Checking Account Information | Purchase History Account Balances Account Transactions Wire Transfer Instructions | |
| When you are no longer our customer, we continue to share your information as described in this notice. | ||
| HOW? | All financial companies need to share customers’ personal information to run their everyday business. In the section below, we list the reasons financial companies can share their customers’ personal information; the reasons the Liberty All-Star Funds choose to share; and whether you can limit this sharing. | |
| REASONS WE CAN SHARE YOUR PERSONAL INFORMATION | DO THE LIBERTY ALL-STAR FUNDS SHARE? | CAN YOU LIMIT THIS SHARING? |
| For our everyday business purposes – such as to process your transactions, maintain your account(s), respond to court orders and legal investigations, or report to credit bureaus | Yes | No |
| For our marketing purposes – to offer our products and services to you | No | We don’t share |
| For joint marketing with other financial companies | No | We don’t share |
| For our affiliates’ everyday business purposes – information about your transactions and experiences | No | We don’t share |
| For our affiliates’ everyday business purposes – information about your creditworthiness | No | We don’t share |
| For non-affiliates to market to you | No | We don’t share |
| QUESTIONS? | Call 1-800-241-1850 |
| 58 | www.all-starfunds.com |
| Liberty All-Star® Growth Fund | Privacy Policy |
| (Unaudited) |
| WHO WE ARE | |
| Who is providing this notice? | Liberty All-Star Funds |
| WHAT WE DO | |
| How do the Liberty All-Star Funds protect my personal information? | To protect your personal information from unauthorized access and use, we use security measures that comply with federal law. These measures include computer safeguards and secured files and buildings.
Our service providers are held accountable for adhering to strict policies and procedures to prevent any misuse of your nonpublic personal information. |
| How do the Liberty All-Star Funds collect my personal information? | We collect your personal information, for example, when you • Open an account • Provide account information • Give us your contact information • Make deposits or withdrawals from your account • Make a wire transfer • Tell us where to send the money •Tells us who receives the money • Show your government-issued ID • Show your driver’s license We also collect your personal information from other companies. |
| Why can’t I limit all sharing? | Federal law gives you the right to limit only: • Sharing for affiliates’ everyday business purposes – information about your creditworthiness • Affiliates from using your information to market to you • Sharing for non-affiliates to market to you State laws and individual companies may give you additional rights to limit sharing. |
| DEFINITIONS | |
| Affiliates | Companies related by common ownership or control. They can be financial and nonfinancial companies. • The Liberty All-Star Funds do not share with our affiliates for marketing purposes. |
| Non-affiliates | Companies not related by common ownership or control. They can be financial and nonfinancial companies. • The Liberty All-Star Funds do not share with non-affiliates so they can market to you. |
| Joint marketing | A formal agreement between non-affiliated financial companies that together market financial products or services to you. • The Liberty All-Star Funds do not jointly market. |
| Annual Report | December 31, 2021 | 59 |
| Liberty All-Star® | Description of Lipper |
| Growth Fund | Benchmark and Market Indices |
| (Unaudited) |
Dow Jones Industrial Average
A price-weighted measure of 30 U.S. blue-chip companies.
Lipper Multi-Cap Growth Mutual Fund Average
The average of funds that, by portfolio practice, invest in a variety of market capitalization ranges without concentrating 75% of their equity assets in any one market capitalization range over an extended period of time. Multi-Cap growth funds typically have above-average characteristics compared to the S&P SuperComposite 1500® Index.
NASDAQ Composite Index
Measures all NASDAQ domestic and international based common type stocks listed on the NASDAQ Stock Market.
Russell 3000® Growth Index
Measures the performance of those Russell 3000® companies with lower book-to-price ratios and higher growth values. The Russell 3000® Index measures the performance of the 3,000 largest U.S. companies based on total market capitalization, which represents approximately 98% of the investable U.S. equity market.
Russell 3000® Value Index
Measures the performance of those Russell 3000® companies with higher book-to-price ratios and lower growth values.
Russell Top 200® Growth Index
Measures the performance of those Russell Top 200® companies with lower book-to-price-ratios and higher growth values. The Russell Top 200® Index measures the performance of the 200 largest companies in the Russell 3000® Index.
Russell 1000® Growth Index (Largecap)
Measures the performance of those Russell 1000® companies with lower book-to-price-ratios and higher growth values. The Russell 1000® Index measures the performance of the 1,000 largest companies in the Russell 3000® Index.
Russell 1000® Value Index (Largecap)
Measures the performance of those Russell 1000® companies with higher book-to-price-ratios and lower growth values.
Russell Midcap® Growth Index
Measures the performance of those Russell Midcap® companies with lower book-to-price-ratios and higher growth values. The Russell Midcap® Index measures the performance of the 800 smallest companies in the Russell 1000® Index.
Russell Midcap® Value Index
Measures the performance of those Russell Midcap® companies with higher book-to-price-ratios and lower growth values.
| 60 | www.all-starfunds.com |
| Liberty All-Star® | Description of Lipper |
| Growth Fund | Benchmark and Market Indices |
| (Unaudited) |
Russell 2000® Growth Index (Smallcap)
Measures the performance of those Russell 2000® companies with lower book-to-price-ratios and higher growth values. The Russell 2000® Index measures the performance of the 2,000 smallest companies in the Russell 3000® Index.
Russell 2000® Value Index (Smallcap)
Measures the performance of those Russell 2000® companies with higher book-to-price-ratios and lower growth values.
Russell Growth Benchmark
The average of the Russell Top 200®, Midcap® and 2000® Growth Indices.
S&P 500® Index
A large cap U.S. equities index that includes 500 leading companies and represents more than 83% of the total domestic U.S. equity market capitalization.
An investor cannot invest directly in an index.
| Annual Report | December 31, 2021 | 61 |
Intentionally Left Blank
Intentionally Left Blank
Intentionally Left Blank


(b) Not Applicable.
Item 2. Code of Ethics.
| (a) | The registrant has, as of the end of the period covered by this report, adopted a code of ethics that applies to the registrant’s principal executive officer, principal financial officer, principal accounting officer or controller, or persons performing similar functions, regardless of whether these individuals are employed by the registrant or a third party. |
| (b) | Not Applicable. |
| (c) | During the period covered by this report, there were not any amendments to a provision of the code of ethics adopted in 2(a) above. |
| (d) | During the period covered by this report, there were not any waivers or implicit waivers to a provision of the code of ethics adopted in 2(a) above. |
| (e) | Not Applicable. |
| (f) | The registrant’s Board of Directors adopted, effective October 1, 2013, a revised code of ethics described in 2(a) above. The revised code of ethics is attached hereto as Exhibit 13(a)(1). |
Item 3. Audit Committee Financial Expert.
| (a) | (1)(i) The registrant’s Board of Directors has determined that there is one audit committee financial expert serving on its audit committee. |
(2) The registrant’s Board of Directors has determined that Ms. Maureen K. Usifer is an “audit committee financial expert” and is “independent” as defined in paragraph (a)(2) of Item 3 of Form N-CSR.
Item 4. Principal Accountant Fees and Services.
(a) Audit Fees. The aggregate fees billed for each of the fiscal years ended December 31, 2021 and December 31, 2020 were approximately $26,300 and $26,300, respectively, for professional services rendered by the principal accountant for the audit of the registrant’s annual financial statements or services that are normally provided by the accountant in connection with the statutory and regulatory filings or engagements for those fiscal years.
(b) Audit-Related Fees. The aggregate fees billed in each of the fiscal years ended December 31, 2021 and December 31, 2020 were $0 and $0, respectively, for assurance and related services by the principal accountant that are reasonably related to the performance of the audit of the registrant’s financial statements and are not reported under paragraph (a) of this Item.
(c) Tax Fees. The aggregate fees billed in each of the fiscal years ended December 31, 2021 and December 31, 2020 were approximately $4,035 and $4,035, respectively. Tax Fees in both fiscal years 2020 and 2019 consist primarily of the review of annual tax returns and include amounts for professional services by the principal accountant for tax compliance, tax advice and tax planning.
(d) All Other Fees. The aggregate fees billed in each of the fiscal years ended December 31, 2021 and December 31, 2020 were $0 and $0, respectively, for products and services provided by the principal accountant, other than the services reported in paragraphs (a) through (c) of this Item.
(e)(1) Audit Committee Pre-Approval Policies and Procedures
The registrant’s Audit Committee is required to pre-approve the engagement of the registrant’s independent accountants to provide audit and non-audit services to the registrant and non-audit services to its investment adviser (not including any sub-adviser whose role is primarily portfolio management and is subcontracted with or overseen by another investment adviser) or any entity controlling, controlled by, or under common control with such investment adviser that provides ongoing services to the registrant (“Adviser Affiliates”), if the engagement relates directly to the operations or financial reporting of the registrant, including the fees and other compensation to be paid to the independent accountants.
The Audit Committee has adopted a Policy for Engagement of Independent Accountants for Audit and Non-Audit Services (“Policy”). The Policy sets forth the understanding of the Audit Committees regarding the engagement of the registrant’s independent accountants to provide (i) audit and permissible audit-related, tax and other services to the registrant; (ii) non-audit services to the registrant’s investment advisor (not including any sub- adviser whose role is primarily portfolio management and is subcontracted with or overseen by another investment adviser) and Adviser Affiliates, if the engagement relates directly to the operations or financial reporting of a Fund; and (iii) other audit and non-audit services to the registrant’s investment adviser (not including any sub-adviser whose role is primarily portfolio management and is subcontracted with or overseen by another investment adviser) and Adviser Affiliates. Unless a type of service receives general pre-approval under the Policy, it requires specific pre-approval by the Audit Committee if it is to be provided by the independent accountants. Pre-approval of non-audit services to the registrant, the registrant’s investment adviser (not including any sub-adviser whose role is primarily portfolio management and is subcontracted with or overseen by another investment adviser) and Adviser Affiliates may be waived provided that the “de minimis” requirements set forth in the SEC’s rules relating to pre-approval of non-audit services are met.
Under the Policy, the Audit Committee may delegate pre-approval authority to any pre-designated member or members who are Independent Directors. The member(s) to whom such authority is delegated must report, for informational purposes only, any pre-approval decisions to the Audit Committee at its next regular meeting. The Audit Committee’s responsibilities with respect to the pre-approval of services performed by the independent accountants may not be delegated to management.
The Policy requires the Fund Treasurer and/or Director of Board Administration to submit to the Audit Committee, on an annual basis, a schedule of the types of services that are subject to general pre-approval. The schedule(s) provide a description of each type of service that is subject to general pre-approval and, where possible, will provide estimated fee caps for each instance of providing each service. The Audit Committees will review and approve the types of services and review the projected fees for the next fiscal year and may add to, or subtract from, the list of general pre-approved services from time to time based on subsequent determinations. That approval acknowledges that each Audit Committee is in agreement with the specific types of services that the independent accountants will be permitted to perform.
(e)(2) The percentage of services described in each of paragraphs (b) through (d) of this Item that were approved pursuant to the “de minimis” exception under paragraph (c)(7)(i)(C) of Rule 2-01 of Regulation S-X during both fiscal years ended December 31, 2021 and December 31, 2020 was zero.
(f) Not applicable.
(g) The aggregate non-audit fees billed by the registrant’s accountant in each of the last two fiscal years of the Registrant were $4,035 in 2021 and $4,035 in 2020. These fees consisted of non-audit fees billed to (i) the Registrant of $4,035 in 2021 and $4,035 in 2020, respectively as described in response to paragraph (c) above and (ii) to ALPS Fund Services, Inc., (“AFS”), an entity under common control with the ALPS Advisors, Inc., the Registrant’s investment advisor, of $0 in 2021 and $0 in 2020, respectively. The non-audit fees billed to AFS related to SSAE 18 services and other compliance related matters.
(h) The registrant’s Audit Committee has considered whether the provision of non-audit services that were rendered to the registrant’s investment adviser (not including any sub-adviser whose role is primarily portfolio management and is subcontracted with or overseen by another investment adviser), and any entity controlling, controlled by, or under common control with the investment adviser that provides ongoing services to the registrant that were not pre-approved pursuant to paragraph (c)(7)(ii) of Rule 2-01 of Regulation S-X, is compatible with maintaining the principal accountant’s independence. The Audit Committee determined that the provision of such services is compatible with maintaining the principal accountant’s independence.
Item 5. Audit Committee of Listed Registrants.
The registrant has a separately-designated standing audit committee established in accordance with Section 3(a)(58)(A) of the Securities Exchange Act of 1934 (15 U.S.C. 78c(a)(58)(A)) and is comprised of the following members:
Thomas W. Brock, Edmund J. Burke, George R. Gaspari, Milton M. Irvin, John J. Neuhauser, and Maureen K. Usifer.
Item 6. Investments.
| (a) | The registrant’s “Schedule I – Investments in securities of unaffiliated issuers” (as set forth in 17 CFR 210.12-12) is included as part of the report of shareholders filed under Item 1 of this Form N-CSR. |
| (b) | Not Applicable. |
Item 7. Disclosure of Proxy Voting Policies and Procedures for Closed-End Management Investment Companies.
Attached, as Exhibit Item 7, is a copy of the registrant’s policies and procedures.
Item 8. Portfolio Managers of Closed-End Management Investment Companies.
As of March 9, 2022, unless otherwise noted.
Weatherbie Capital LLC (“Weatherbie”)
(a)(1) MANAGEMENT.
H. George Dai, Ph.D., Chief Investment Officer, Senior Portfolio Manager, is a co-manager responsible for managing the portion of the Fund allocated to Weatherbie Capital.
George Dai, Ph.D. is Chief Investment Officer and Senior Portfolio Manager of Weatherbie Capital, LLC. George is a Portfolio Manager on the Weatherbie Specialized Growth Strategy, the Weatherbie Long/Short Strategy, the Alger Dynamic Opportunities Strategy and the Alger Weatherbie Enduring Growth Strategy. Additionally, he maintains research responsibilities in the diversified business services, healthcare, and technology areas. George joined Weatherbie Capital in March 2001 and has 22 years of investment experience. Prior to joining Weatherbie, he was an equity analyst with 1838 Investment Advisors. George received his M.B.A. from the Wharton School, University of Pennsylvania, (Director’s List), and his Ph.D. in chemistry from Johns Hopkins University. Previously, he earned a B.S. from the University of Science and Technology of China and was a pharmaceutical research scientist at Procter & Gamble. George is a prized Bridge player, and he holds four U.S. patents. George was issued the Certificate in ESG Investing by the CFA Institute.
Joshua D. Bennett, CFA, Chief Operating officer, Senior Portfolio Manager, is a co-manager responsible for managing the portion of the Fund allocated to Weatherbie Capital.
Josh Bennett, CFA is Chief Operating Officer and Senior Portfolio Manager of Weatherbie Capital, LLC. Josh is a Portfolio Manager on the Weatherbie Specialized Growth Strategy, the Weatherbie Long/Short Strategy, the Alger Dynamic Opportunities Strategy and the Alger Weatherbie Enduring Growth Strategy. He also has research responsibilities in the consumer, industrials, technology and diversified business services areas. Josh joined Weatherbie Capital in July 2007 and has 21 years of investment experience. Prior to joining Weatherbie, he was an Equity Research Analyst at MFS Investment Management in Boston where he focused on the Aerospace/Defense and Transportation sectors. Josh also has previous experience with Fidelity Investments as a High Yield research associate. Josh received his M.B.A. from the Tuck School of Business at Dartmouth (Edward Tuck Scholar with Distinction) and he earned a B.A. in Economics (Summa Cum Laude) from Wheaton College (IL). Josh is a CFA charterholder and is a member of both the CFA Society Boston and the CFA Institute. Josh was issued the Certificate in ESG Investing by the CFA Society United Kingdom. He is a Trustee at Lexington Christian Academy (Lexington, MA) and a member of the Investment Committee of Christian Camps & Conferences.
Edward M.B Minn, CFA, Senior Managing Director and Portfolio Manager, is a co-manager responsible for managing the portion of the Fund allocated to Weatherbie Capital.
Ed Minn, CFA is Senior Managing Director and Portfolio Manager on the Weatherbie Specialized Growth Strategy, the Alger Weatherbie Select 15 Strategy and the Weatherbie Growth Strategy. Ed is also Research Analyst on the Weatherbie Specialized Growth and Weatherbie Long/Short Strategies. His research responsibilities are in the consumer, media & communications, diversified business services, information services and technology areas. Ed joined Weatherbie Capital in December 2013 and has 15 years of investing experience. Prior to joining the firm, he spent five years as a research analyst at Vinik Asset Management, LP, where he focused on the technology sector. He began his investment career at Raymond James & Associates, Inc. where he worked as a research associate covering energy stocks. Ed received his M.B.A. from the University of Chicago Booth School of Business with High Honors. Ed also holds a B.S. in economics from Duke University, where he graduated Summa Cum Laude. Ed is a CFA charterholder and is a member of both the CFA Society Boston and the CFA Institute.
OTHER ACCOUNTS. As of December 31, 2021, this team was responsible for the portfolio management of the following types of accounts in addition to the Fund:
Type of Account | Number of Accounts Managed | Total Assets (in millions) | Number of Accounts Managed For which Advisory Fee is Performance Based | Assets Managed for which Advisory Fee is Performance Based (in millions) |
| Weatherbie Capital, LLC | ||||
| Registered Investment Companies* | 4 | 1,950 | 0 | 0 |
| Other pooled investment vehicles* | 5 | 428 | 2 | 271 |
| Other accounts* | 34 | 2,658 | 1 | 161 |
| George Dai | ||||
| Registered Investment Companies* | 4 | 1,950 | 0 | 0 |
| Other pooled investment vehicles* | 4 | 191 | 1 | 34 |
| Other accounts* | 32 | 2,643 | 1 | 161 |
| Joshua D. Bennett | ||||
| Registered Investment Companies* | 4 | 1,950 | 0 | 0 |
| Other pooled investment vehicles* | 4 | 191 | 1 | 34 |
| Other accounts* | 32 | 2,643 | 1 | 161 |
| Edward M.B. Minn | ||||
| Registered Investment Companies* | 2 | 1,504 | 0 | 0 |
| Other pooled investment vehicles* | 3 | 255 | 1 | 237 |
| Other accounts* | 33 | 2,658 | 1 | 161 |
| * | Accounts are managed on a team basis. |
COMPENSATION STRUCTURE.
The compensation structure for the Weatherbie Capital investment team is as follows:
| • | Base salary: Market-based salary is typically a function of experience, education, industry knowledge and the individual's performance in his/her role. |
| • | Bonus (Weatherbie Bonus Pool): The annual bonus pool for Weatherbie Capital is calculated in a similar manner to the Alger bonus pool. Factors considered for funding the Weatherbie Capital bonus pool include overall firm performance results, absolute and relative investment performance generated by the investment professional and other contributions to the overall success of the firm. In addition, pre-tax operating profits of Weatherbie Capital are considered in determining the size of the bonus pool. Target amounts for employees participation in the pool are established annually with final approval by Dan Chung, CEO of Alger. |
| • | The Alger Profit Participation Plan: Weatherbie Capital investment professionals will receive a portion of their annual bonus allocation in The Alger Profit Participation Plan grants. The Firm gives key personnel the opportunity to share in the long-term growth and profitability of the Firm. Senior members of the firm are eligible to receive “awards” annually in the PPP plan. The awards track the returns of Alger mutual funds and have a four-year vesting schedule. The total award earned can increase or decrease with Alger's investment and Alger’s earnings growth over the four-year period. |
Senior professionals at Alger and Weatherbie Capital may receive Alger Partners Plan grants. The Partners Plan incentivizes key investment and non-investment executives through a phantom equity program that grants pro-rata rights to growth in the Firm's book value, dividend payments and participation. There are currently five active Alger participants in the Plan.
OWNERSHIP BY PORTFOLIO MANAGER: None
MATERIAL CONFLICTS OF INTEREST: None
Congress Asset Management Company, LLP (“Congress”)
(a)(1) MANAGEMENT. The portion of the Fund allocated to Congress is managed by Todd Solomon, CFA, Senior Vice President and Daniel Lagan, CFA, Chief Executive Officer, Chief Investment Officer.
Todd Solomon, CFA, Senior Vice President, Portfolio Manager
Todd joined Congress Asset Management in 2001. He is a member of Congress Asset Management’s Investment Oversight Committee and Chairs the Mid Cap Growth Committee, which was named the 2015 Small/Mid Cap SMA of the year by Investment Advisor Magazine and Envestnet. He has 28 years of investment experience, spanning both equity research and portfolio management. Previously, he has held positions at US Trust Company, Fidelity Management and Research Co, and the Pioneer Group, Inc. He is a CFA charterholder, and member of the Boston Security Analysts Society (BSAS.)
Education: MBA; New York University
BA; Georgetown University
Daniel Lagan, CFA, CEO, Chief Investment Officer
Mr. Lagan joined Congress Asset Management in 1989. He is the firm’s Chief Investment Officer, a position he has held since 2005. He chairs both the firm’s Investment Oversight Committee and Large Cap Growth Investment Committees. As CEO, he is responsible for all business aspects of the company, with the senior managers of operations, sales, and investments reporting to him. Prior to being named as CEO in 2013, he was the firm’s President for 17 years. He is a CFA charterholder, and a member of the Boston Security Analysts Society (BSAS) and the CFA Institute.
Education: MBA; Boston College
BA; St. Michael's College
(a)(2) OTHER ACCOUNTS. The table below provides information regarding the other accounts managed by Todd Solomon and Daniel Lagan as of December 31, 2021:
| Type of Account | Number of Accounts Managed | Total Assets (in millions) | Number of Accounts Managed for which Advisory Fee is Performance- Based | Assets Managed for (in millions) |
| Todd Solomon, CFA | ||||
| Registered Investment Companies | 2 | $1,697,561,415 | 0 | 0 |
| Other pooled investment vehicles | 0 | 0 | 0 | 0 |
| Other accounts | 42 | $820,898,895 | 0 | 0 |
| Type of Account | Number of Accounts Managed | Total Assets (in millions) | Number of Accounts Managed for which Advisory Fee is Performance- Based | Assets Managed for (in millions) |
| Daniel Lagan, CFA | ||||
| Registered Investment Companies | 1 | $509,391,881 | 0 | 0 |
| Other pooled investment vehicles | 0 | 0 | 0 | 0 |
| Other accounts | 47 | $450,506,758 | 0 | 0 |
MATERIAL CONFILCTS OF INTEREST: None
(a)(3) COMPENSATION STRUCTURE:
Mr. Todd Solomon and Mr. Daniel Lagan’s compensation consists of the following:
Congress Asset Management Company LLP has a core investment team in place and high employee retention due to a generous compensation structure, collaborative culture and career advancement opportunities.
Congress utilizes a team approach to the investment process. Because of this, the firm’s compensation plan is intended to reward all employees equitably based on the firm’s investment performance and financial profitability. Our compensation plan aims to accurately reflect our investment and financial success through three methods:
| 1. | Competitive base salary: This is the basis on which all other incentives are calculated. |
| 2. | Bonus plan up to 50% of base salary based on the following criteria: |
| • | Investment performance for fixed income and equity products |
| • | Firmwide net asset flows |
| • | Growth in profitability |
| • | Management discretion based on individual performance |
| 3. | Equity Bonus Plan: Since 1990, Congress Asset Management Company has used an Equity Bonus Plan to allow all participating employees to directly benefit from the long-term growth and profitability of the company. This deferred compensation plan is tied to the operating income of the company. |
(a)(4) OWNERSHIP BY PORTFOLIO MANAGERS.
| Portfolio Managers | Dollar Range of the Registrant’s Securities Owned by the Portfolio Managers |
| Todd Solomon, CFA | None |
| Daniel Lagan, CFA | None |
Sustainable Growth Advisers, LP (“SGA”)
(a)(1) MANAGEMENT.
Gordon M. Marchand, CFA, CIC, CPA1 - Principal, co-founder, portfolio manager and a member of the Investment Committee. He is also a member of the Firm’s Advisory Board and serves as the firm’s Chief Financial Officer. Prior to founding Sustainable Growth Advisers, Gordon was an executive officer, a member of the Board of Directors and Investment Policy Committee of Yeager, Wood & Marshall, Inc. which he joined in 1984. He also served as the firm’s Chief Financial and Operating Officer. Gordon began his career as a CPA for Grant Thornton Int’l and a management consultant for Price Waterhouse.
Education:
Georgetown University – BS;
University of Massachusetts/Amherst – MBA
Oxford University Management Center – Graduate Study
| 1 | Effective July 1, 2022, Gordon M. Marchand will no longer serve as a portfolio manager for the fund and Hrishikesh Gupta will be added as the portfolio manager of the fund. |
Robert L. Rohn – Principal, co-founder, portfolio manager and chairs the firm’s Investment Committee. He is also a member of the Firm’s Advisory Board. Prior to joining Sustainable Growth Advisers in November 2003, Rob managed over $1 billion of large capitalization, high quality growth stock portfolios at W.P Stewart & Co. During Rob’s twelve-year tenure with W.P. Stewart, he was an analyst and portfolio Manager, held the positions of Chairman of the Board and Chief Executive Officer of W.P. Stewart Inc., the company’s core U.S. investment business, and served as Chairman of the firm’s Management Committee. From 1988 through 1991, he was with Yeager, Wood & Marshall, a growth-oriented investment counseling firm, where he served as Vice President and a member of the Investment Policy Committee with responsibilities in equity analysis and portfolio management. Rob began his career in 1983 at JP Morgan, where he was an officer of the bank in Corporate Finance.
Education:
Dartmouth College – BA (Cum Laude);
Harvard Business School – MBA
Kishore Rao – Principal, portfolio manager, analyst and a member of the Investment Committee. Kishore has been with the firm since 2004. Prior to joining Sustainable Growth Advisers, Kishore was a member of the investment team at Trident Capital, a venture capital firm managing a portfolio of software, technology, and business service companies. He was a Founder and General Manager of the Street Events division of CCBN before it was sold to Thomson Reuters. Previously, Kishore was an Investment Analyst at Tiger Management following healthcare services and software companies and an Analyst at Wellington Management following semiconductor equipment.
Education:
Carnegie Mellon University – BS;
Harvard Business School – MBA
Hrishikesh (HK) Gupta2 – Principal, portfolio manager and analyst and a member of the Investment Committee. HK has been with the firm since 2014. Prior to joining SGA, HK was a Senior Analyst at MDR Capital Management, a long / short equity hedge fund, and an Associate Managing Director at Iridian Asset Management. HK followed the Technology, Telecommunications, Industrials, Basic Commodity and Refiners sectors while at MDR and Iridian. He also worked as an Investment Banking Associate at Bank of America Merrill Lynch, and advised industrials and financials’ clients on private placements and M&A. HK spent three years as a Product and Program Manager at Amazon.com and, as part of their strategic executive division, led the launch of Amazon’s Japanese and German merchant platforms.
Education:
Indian Institute of Technology (IIT) Bombay – BS;
University of California – MS;
NYU Stern School of Business - MBA
OTHER ACCOUNTS. The table below provides information about the other accounts managed by Messrs. Marchand, Rohn and Rao, as of December 31, 2021:
| Type of Account | Number of Accounts Managed | Total Assets Managed (in millions) | Number of Accounts Managed for which Advisory Fee is Performance Based | Assets Managed for which Advisory Fee is Performance Based (in millions) |
| Gordon M. Marchand | ||||
| Registered Investment Companies | 9 | $11,528 | 0 | $0 |
| Other Pooled Investment Vehicles | 29 | $9,011 | 0 | $0 |
| Other Accounts | 65 | $5,935 | 2 | $289 |
| Robert L. Rohn | ||||
| Registered Investment Companies | 9 | $11,329 | 0 | $0 |
| Other Pooled Investment Vehicles | 29 | $8,978 | 0 | $0 |
| Other Accounts | 64 | $5,913 | 2 | $289 |
| Kishore Rao | ||||
| Registered Investment Companies | 8 | $11,156 | 0 | $0 |
| Other Pooled Investment Vehicles | 11 | $2,235 | 0 | $0 |
| Other Accounts | 43 | $1,817 | 0 | $0 |
| 2 | Managing the fund effective July 1, 2022. |
Compensation Structure
SGA has adopted a system of compensation for portfolio managers that seeks to align the financial interests of the investment professionals with those of SGA. The compensation of SGA’s three principals/portfolio managers is based upon (i) a fixed base compensation and (ii) SGA’s financial performance. SGA’s compensation arrangements with its investment professionals are not determined on the basis of specific funds or accounts managed by the investment professional. All investment professionals receive customary benefits that are offered generally to all salaried employees of SGA.
OWNERSHIP BY PORTFOLIO MANAGERS. None of the individuals at the firm responsible for the day-to-day management of the Fund owns any shares of the Fund.
Potential conflicts of interest in managing multiple accounts
Like other investment professionals with multiple clients, a portfolio manager for a Fund may face certain potential conflicts of interest in connection with managing both the Fund and other accounts at the same time. The paragraphs below describe some of these potential conflicts, which may be faced by investment professionals at most major financial firms. ALPS Advisors, Inc. and the Fund have adopted compliance policies and procedures that attempt to address certain of these potential conflicts.
The management of accounts with different advisory fee rates and/or fee structures, including accounts that pay advisory fees based on account performance (“performance fee accounts”), may raise potential conflicts of interest by creating an incentive to favor higher-fee accounts. These potential conflicts may include, among others:
| • | The most attractive investments could be allocated to higher-fee accounts or performance fee accounts. |
| • | The trading of higher-fee accounts could be favored as to timing and/or execution price. For example, higher-fee accounts could be permitted to sell securities earlier than other accounts when a prompt sale is desirable or to buy securities at an earlier and more opportune time. |
| • | The trading of other accounts could be used to benefit higher-fee accounts (front-running). |
| • | The investment management team could focus their time and efforts primarily on higher-fee accounts due to a personal stake in compensation. |
Potential conflicts of interest may also arise when the portfolio managers have personal investments in other accounts that may create an incentive to favor those accounts.
A potential conflict of interest may arise when a Fund and other accounts purchase or sell the same securities. On occasions when a portfolio manager considers the purchase or sale of a security to be in the best interests of a Fund as well as other accounts, the adviser’s trading desk may, to the extent permitted by applicable laws and regulations, aggregate the securities to be sold or purchased in order to obtain the best execution and lower brokerage commissions, if any. Aggregation of trades may create the potential for unfairness to a Fund or another account if one account is favored over another in allocating the securities purchased or sold – for example, by allocating a disproportionate amount of a security that is likely to increase in value to a favored account.
“Cross trades,” in which one account sells a particular security to another account (potentially saving transaction costs for both accounts), may also pose a potential conflict of interest. Cross trades may be seen to involve a potential conflict of interest if, for example, one account is permitted to sell a security to another account at a higher price than an independent third party would pay. The Fund has adopted compliance procedures that provide that any transactions between a Fund and another advised account are to be made at an independent current market price, as required by law.
Another potential conflict of interest may arise based on the different investment objectives and strategies of a Fund and other accounts. For example, another account may have a shorter-term investment horizon or different investment objectives, policies or restrictions than a Fund. Depending on another account’s objectives or other factors, a portfolio manager may give advice and make decisions that may differ from advice given, or the timing or nature of decisions made, with respect to a Fund. In addition, investment decisions are the product of many factors in addition to basic suitability for the particular account involved. Thus, a particular security may be bought or sold for certain accounts even though it could have been bought or sold for other accounts at the same time. More rarely, a particular security may be bought for one or more accounts managed by a portfolio manager when one or more other accounts are selling the security (including short sales). There may be circumstances when purchases or sales of portfolio securities for one or more accounts may have an adverse effect on other accounts.
A Fund’s portfolio manager who is responsible for managing multiple funds and/or accounts may devote unequal time and attention to the management of those funds and/or accounts. As a result, the portfolio manager may not be able to formulate as complete a strategy or identify equally attractive investment opportunities for each of those accounts as might be the case if he or she were to devote substantially more attention to the management of a single fund. The effects of this potential conflict may be more pronounced where funds and/or accounts overseen by a particular portfolio manager have different investment strategies.
A Fund’s portfolio managers may be able to select or influence the selection of the brokers and dealers that are used to execute securities transactions for the Fund. In addition to executing trades, some brokers and dealers provide portfolio managers with brokerage and research services (as those terms are defined in Section 28(e) of the Securities Exchange Act of 1934), which may result in the payment of higher brokerage fees than might have otherwise be available. These services may be more beneficial to certain funds or accounts than to others. Although the payment of brokerage commissions is subject to the requirement that the portfolio manager determine in good faith that the commissions are reasonable in relation to the value of the brokerage and research services provided to the fund, a portfolio manager’s decision as to the selection of brokers and dealers could yield disproportionate costs and benefits among the funds and/or accounts that he or she manages.
The adviser or an affiliate may provide more services (such as distribution or recordkeeping) for some types of funds or accounts than for others. In such cases, a portfolio manager may benefit, either directly or indirectly, by devoting disproportionate attention to the management of fund and/or accounts that provide greater overall returns to the investment manager and its affiliates.
A Fund’s portfolio manager(s) may also face other potential conflicts of interest in managing the Fund, and the description above is not a complete description of every conflict that could be deemed to exist in managing both a Fund and other accounts. In addition, a Fund’s portfolio manager may also manage other accounts (including their personal assets or the assets of family members) in their personal capacity. The management of these accounts may also involve certain of the potential conflicts described above. Investment personnel at the advisers, including each Fund’s portfolio manager, are subject to restrictions on engaging in personal securities transactions pursuant to Codes of Ethics adopted by the adviser.
The adviser has trade allocation and other policies and procedures that it believes are reasonably designed to address these and other potential conflicts of interest.
Item 9. Purchases of Equity Securities by Closed-End Management Investment Company and Affiliated Purchasers.
During the fiscal year ended December 31, 2021, there were no purchases made by or on behalf of the registrant or any “affiliated purchaser”, as defined in Rule 10b-18(a)(3) under the Securities Exchange Act of 1934 (“Exchange Act”), of shares or other units of any class of the registrant’s equity securities that are registered by the registrant pursuant to Section 12 of the Exchange Act.
Item 10. Submission of Matters to a Vote of Security Holders.
There have not been any material changes to the procedures by which shareholders may recommend nominees to the registrant’s board of directors, since those procedures were last disclosed in response to the requirements of Item 407(c)(2)(iv) of Regulation S-K or this Item.
Item 11. Controls and Procedures.
| (a) | The Registrant’s Principal Executive Officer and Principal Financial Officer have concluded that the Registrant’s disclosure controls and procedures (as defined in Rule 30a-3(c) under the Investment Company Act of 1940, as amended) are effective based on their evaluation of these controls and procedures as of a date within 90 days of the filing date of this document. |
| (b) | There was no change in the Registrant's internal control over financial reporting (as defined in Rule 30a-3(d) under the Investment Company Act of 1940, as amended) during the period covered by this report that has materially affected, or is reasonably likely to materially affect, the Registrant's internal control over financial reporting. |
Item 12. Disclosure of Securities Lending Activities for Closed-End Management Investment Companies.
(a) For the fiscal year ended December 31, 2021, the registrant had the following dollar amounts of income and fees/compensation related to its securities lending activities to report:
| Gross Income from securities lending activity1 | $ | 349,032 | ||
| Fees and/or compensation for securities lending activities and related services | ||||
| Fees paid to securities lending agent from revenue split2 | $ | 69,892 | ||
| Fees paid for any cash collateral management service (including fees deducted from a pooled cash collateral reinvestment vehicle) that are not included in revenue split3 | $ | 828 | ||
| Administrative fees not included in revenue split4 | _ | |||
| Indemnification fee not included in revenue split5 | _ | |||
| Rebate (paid to borrowers)6 | _ | |||
| Other fees not included in revenue split | _ | |||
| Aggregate fees/comp for securities lending activities | $ | 70,720 | ||
| Net income from securities lending activities | $ | 278,312 |
| 1 | Gross income from securities lending activities represents the total revenue generated from securities lending activities prior to the application of any fees (revenue split, management fee, or otherwise) and/or rebates on cash collateral negotiated with borrowers. |
| 2 | Fees paid to securities lending agent from a revenue split is the agent lender’s income from the lending activities exclusive of any fees or rebates. |
| 3 | Fees paid for cash collateral management service (including fees deducted from a pooled cash collateral reinvestment vehicle) that are not included in the revenue split as calculated: Average monthly cash collateral balance for the reporting period multiplied by the most recently reported expense ratio. |
| 4 | Administrative fees not included in revenue split are fees for other administrative activities associated with client’s participation in securities lending activities. |
| 5 | Indemnification fee not included in revenue split is the fee for indemnifying the client for their participation in securities lending activities. There is currently no fee associated with indemnification. |
| 6 | Rebate (paid to borrowers) is the fee paid by the lender to the borrower for loans collateralized with cash. |
(b)The Fund only lends its portfolio securities to borrowers that are approved by the Fund’s securities lending agent. The agent monitors loans for compliance with certain policies of the Fund, including: (1) securities lending may not exceed 30% of the value of the Fund’s total assets; (2) the initial collateral received by the Fund must have a value of no less than 102% of the market value of the loaned securities for securities traded on U.S. exchanges and a value of no less than 105% of the market value of the loaned securities for all other securities; and, (3) thereafter the market value of the collateral must be no less than 100% of the current value of the securities on loan. The securities lending agent will obtain additional collateral in the event the market value of the collateral does not comply with these policies. The securities lending agent will recall securities on loan in the event it is determined that they need to be recalled for any reason, including for the Fund to cast a vote on a matter at a shareholders meeting. The securities lending agent collects distributions on loaned securities. The securities lending agent invests cash collateral received in a money market fund approved by the Fund’s board.
Item 13. Exhibits.
(a)(3) Not applicable.
(a)(4) Not applicable.
SIGNATURES
Pursuant to the requirements of the Securities Exchange Act of 1934 and the Investment Company Act of 1940, the registrant has duly caused this report to be signed on its behalf by the undersigned, thereunto duly authorized.
LIBERTY ALL-STAR GROWTH FUND, INC.
| By: | /s/ William R. Parmentier, Jr. | |
| William R. Parmentier, Jr. (Principal Executive Officer) | ||
| President | ||
| Date: | March 9, 2022 |
Pursuant to the requirements of the Securities Exchange Act of 1934 and the Investment Company Act of 1940, the registrant has duly caused this report to be signed on its behalf by the undersigned, thereunto duly authorized.
LIBERTY ALL-STAR GROWTH FUND, INC.
| By: | /s/William R. Parmentier, Jr. | |
| William R. Parmentier, Jr. (Principal Executive Officer) | ||
| President | ||
| Date: | March 9, 2022 | |
| By: | /s/ Erich Rettinger | |
| Erich Rettinger (Principal Financial Officer) | ||
| Treasurer | ||
| Date: | March 9, 2022 |