UNITED STATES
SECURITIES AND EXCHANGE COMMISSION
Washington, D.C. 20549
FORM N-CSR
CERTIFIED SHAREHOLDER REPORT OF REGISTERED
MANAGEMENT INVESTMENT COMPANIES
Investment Company Act file number 811-01466
Pioneer Fund
(Exact name of registrant as specified in charter)
60 State Street, Boston, MA 02109
(Address of principal executive offices) (ZIP code)
Christopher J. Kelley, Amundi Asset Management, Inc.,
60 State Street, Boston, MA 02109
(Name and address of agent for service)
Registrant’s telephone number, including area code: (617) 742-7825
Date of fiscal year end: December 31, 2023
Date of reporting period: January 1, 2023 through December 31, 2023
Form N-CSR is to be used by management investment companies to file reports with the Commission not later than 10 days after the transmission to stockholders of any report that is required to be transmitted to stockholders under Rule 30e-1 under the Investment Company Act of 1940 (17 CFR 270.30e-1). The Commission may use the information provided on Form N-CSR in its regulatory, disclosure review, inspection, and policymaking roles.
A registrant is required to disclose the information specified by Form N-CSR, and the Commission will make this information public. A registrant is not required to respond to the collection of information contained in Form N-CSR unless the Form displays a currently valid Office of Management and Budget (“OMB”) control number. Please direct comments concerning the accuracy of the information collection burden estimate and any suggestions for reducing the burden to Secretary, Securities and Exchange Commission, 450 Fifth Street, NW, Washington, DC 20549-0609. The OMB has reviewed this collection of information under the clearance requirements of 44 U.S.C. ss. 3507.
ITEM 1. REPORTS TO STOCKHOLDERS.
Pioneer Fund
Annual Report | December 31, 2023
| | | | | |
| A: PIODX | C: PCODX | K: PIOKX | R: PIORX | Y: PYODX |
visit us: www.amundi.com/us
Pioneer Fund | Annual Report | 12/31/231
Portfolio Management Discussion | 12/31/23
In the following discussion, Jeff Kripke discusses the market environment during the 12-month period ended December 31, 2023, and Pioneer Fund’s performance during the period. Mr. Kripke, a senior vice president and a portfolio manager at Amundi Asset Management US, Inc. (Amundi US), is responsible for the day-to-day management of the Fund, along with James Yu, a vice president and a portfolio manager at Amundi US, Craig Sterling, Managing Director, Director of Core Equity and Head of Equity Research, US, and a portfolio manager at Amundi US, and John Carey*, Managing Director, Director of Equity Income, US, and a portfolio manager at Amundi US.
| Q | How did the Fund perform during the 12-month period ended December 31, 2023? |
| A | Pioneer Fund’s Class A shares returned 28.71% at net asset value (NAV) during the 12-month period ended December 31, 2023, while the Fund’s benchmark, the Standard & Poor’s 500 Index (S&P 500), returned 26.29%. During the same period, the average return of the 1,438 mutual funds in Morningstar’s Large Blend Funds category was 22.14%. |
| Q | How would you describe the market for equities during the 12-month period ended December 31, 2023? |
| A | For the 12-month period ended December 31, 2023, the US equity market showed strong growth and resilience, despite ongoing economic and political uncertainities. The market was buoyed by a combination of factors, including low-interest rates, strong corporate earnings, and a robust consumer sector. One of the key drivers of the market's growth was the technology sector,which continued to outperform other sectors and drive innovation across a wide range of industries. Current Fund holdings in this sector saw strong growth in their stock prices, and are expected by many to continue to lead the market in the years to come. Another factor contributing to the market's strength was the ongoing recovery in the housing market, which helped to boost consumer confidence and spending. As more Americans feel secure in their financial situations, they are more likely to invest in the stock market and contribute to its growth. |
| * | Note to shareholders: John A. Carey plans to retire from portfolio management effective in May 2024. He remains a member of the Fund's current portfolio management team. |
2Pioneer Fund | Annual Report | 12/31/23
| | Despite these positive trends, there are still risks and uncertainties that could`impact the market in the years to come. These include ongoing geopolitical tensions, rising interest rates, and the potential for a global economic slowdown. However, many analysts remain optimistic about the market's prospects, and believe that it will continue to show strong growth in the years to come. |
| | The rise in the domestic equity market was particularly concentrated within growth stocks, which dramatically outperformed value stocks for the 12-month period. The broad US equity market, as measured by the S&P 500, registered a total return of 26.29% over the 12-month period. Shares of growth-oriented companies, as measured by the Russell 1000 Growth Index, returned 42.68% as investor exuberance over Artificial Intelligence steered investors towards technology companies, which make up a large portion of the growth index. Value, on the other hand, returned 11.46%, as measured by the Russell 1000 Value Index. |
| Q | Which of your investment decisions had the greatest effects on the Fund’s benchmark-relative performance during the 12-month period ended December 31, 2023? |
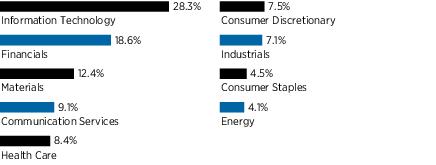
| A | The Fund outperformed the S&P 500 for the 12 months ended December 31, 2023. The largest contributors to returns during the period were the Fund’s underweight in defensive sectors such as consumer staples and utilities, which significantly underperformed the S&P 500. The Fund also benefitted from an overweight and security selection in the top performing S&P 500 sector, information technology, as well as security selection in the health care sector where the Fund’s exposure to pharmaceuticals aided results. Within the information technology sector, the Fund’s semiconductor holdings, in particular, were significant contributors to returns. We have maintained conviction in semiconductors for some time given their connection to artificial intelligence (AI) and the potential tailwind from the reshoring of semiconductor manufacturing to the US and Europe. |
| | We believe that the Fund’s strong results in 2023, especially after underperforming meaningfully in the first half of the year, is a |
Pioneer Fund | Annual Report | 12/31/233
| | testament to the disciplined, risk-reward focus of the Fund. For example, throughout 2022 and early 2023, the Fund built positions in semiconductor stocks given their exposure to Artificial Intelligence (AI), a theme that the Fund has favored for years, and what we viewed as attractive valuations. This conviction paid off as semiconductors rose broadly in 2023, as investors flocked to stocks with exposure to AI. As the valuations became more challenging in the second half of the year, we reduced some of the Fund's positions, as we believed that the risk-reward profile was not as attractive. Another area that demonstrated the Fund’s disciplined approach is its exposure to banks. Going into 2023, we had a preference for regional banks, which underperformed broadly due to the liquidity crisis in the US Banking sector. However, in our view, the sell-off in these stocks went too far; therefore, we continued to build the Fund's positions, despite the negative market sentiment. This discipline paid off in the second half of the year as bank stocks, and in particular regional banks, were among the top performers in the S&P 500 for the fourth quarter. |
| | Overall, though, the Fund’s exposure to banks did hurt Fund results for the full year, despite the bounce back in the fourth quarter. In addition, the Fund’s lack of exposure to some mega-cap growth stocks that outperformed in 2023 (after underperforming in 2022), such as Meta Platforms, detracted from returns. |
| | With respect to individual securities, relative to the Fund's benchmark, the top contributors in the year were NVIDIA and Martin Marietta Materials. Shares of NVIDIA, the leading manufacturer of graphic processing units, increased as a result of investor exuberance over Artificial Intelligence, given the importance of the companies GPUs and hardware in various AI technologies. We maintain the Fund's position in NVIDIA shares, as we believe AI adoption will continue to accelerate and we think that NVIDIA could continue to be a top beneficiary given their dominant competitive position in its core markets. |
| | Shares of Martin Marietta Materials, a leading supplier of aggregates and building materials, outperformed during the period, as investors favored building materials suppliers due to optimism that the suppliers would receive increased government |
4Pioneer Fund | Annual Report | 12/31/23
| | subsidies for “Green Energy” projects as a result of the inflation reduction act, among other bills. The Fund continues to hold shares of Martin Marietta and we believe heavy non-residential spending (infrastructure) may more than make up for any shortfall elsewhere. In addition, the company may benefit from the move to green energy as its materials are used to rebuild electric grids (solar, wind), and to build sea walls. |
| | Conversely, regional bank shares were the largest individual detractors from Fund performance, with Truist Financial and Citizens Financial Group detracting the most from returns. During the first half of the year in particular, the fallout from the collapse of two regional US banks and Credit Suisse caused banks and specifically regional banks to underperform. Truist Financial and Citizens Financial Group were the largest detractors from returns in the wake of these collapses. However, we continue to maintain the Fund's positions in the banks, as we believe these high quality “super-regional” banks are not exposed to the same issues plaguing the failed banks. Truist and Citizens have gone through significant stress testing given their large size and status as systemically important banks in the US. In addition, we believe both have adequate capital reserves and robust liquidity and risk management platforms in place. These regional banks also have diverse deposit bases that consist primarily of traditional retail and small to medium sized businesses that are not as risky, in our view. |
| Q | Did the Fund have any exposure to derivative securities during the 12-month period ended December 31, 2023? |
| A | No, the Fund had no exposure to derivatives during the period. |
| Q | Could you discuss the Fund’s commitment to ESG investing? |
| A | We integrate environmental, social, and corporate governance (ESG) factors in our fundamental research and investment selection processes. As the market continues to evolve and more financially relevant information is available, we believe this information helps us gain a more complete understanding of a company and its business. The Fund has followed certain ESG investment criteria since the 1940s and as market standards evolved, the Fund formally incorporated ESG language into the Fund's prospectus on July 1, 2018. The Fund generally does not |
Pioneer Fund | Annual Report | 12/31/235
| | invest in companies significantly involved in certain business activities, including but not limited to, the production of alcohol, tobacco products, and certain controversial military weapons, and the operation of thermal coal mines and gambling casinos and other related businesses. In addition, Amundi US considers pertinent ESG information, including ESG ratings, in seeking to avoid investing the Fund in companies perceived to have high ESG-related risk relative to its peers. |
| Q | What’s your investment outlook as the Fund enters a new fiscal year? |
| A | We are not sure when or if the long-anticipated recession will occur, but we are currently finding value in cyclical areas of the market, such as banks, materials, and to a lesser extent semiconductor stocks. This modest cyclical tilt is the result of our valuation discipline, which favors stocks with what we believe have at least 2:1 upside potential to downside risk, as those stocks have attractive risk-reward profiles, in our view. With this in mind, we believe maintaining a balanced Fund including cyclical stocks, reasonably priced growth, and some defensive stocks remains the best approach in the current environment. By comparison, we are avoiding equities of hyper-growth, unprofitable companies that are vulnerable to valuation compression if interest rates continue to rise. We also think low quality, distressed value stocks may underperform, especially those with excessive debt loads. |
| | As of the end of December 2023, the Fund’s largest overweight positions relative to the benchmark were in the financials and materials sectors. In financials, we continue to favor regional banks, but have also added exposure to some larger banks and financial services companies with exposure to capital markets. We have reduced our information technology position, and particularly our semiconductor positions given their strong performance. However, we continue to favor technology stocks that we believe can benefit from the trend towards AI, including some semiconductor stocks. In materials, we maintain a preference for stocks that are benefitting from the trend towards electrification and the green energy transition. |
6Pioneer Fund | Annual Report | 12/31/23
Notable underweight positions include the consumer (staples and discretionary) and health care sectors, though we have added to the Fund’s exposure to the pharmaceuticals sector more recently. Finally, the Fund continues to have no exposure to the real estate and utilities sectors , which are interest rate sensitive.
Pioneer Fund | Annual Report | 12/31/237
Please refer to the Schedule of Investments on pages 18 - 21 for a full listing of Fund securities.
All investments are subject to risk, including the possible loss of principal. In the past several years, financial markets have experienced increased volatility and heightened uncertainty. The market prices of securities may go up or down, sometimes rapidly or unpredictably, due to general market conditions, such as real or perceived adverse economic, political, or regulatory conditions, recessions, inflation, changes in interest or currency rates, lack of liquidity in the bond markets, the spread of infectious illness or other public health issues, armed conflict including Russia's military invasion of Ukraine, sanctions against Russia, other nations or individuals or companies and possible countermeasures, market disruptions caused by tariffs, trade disputes or other government actions, or adverse investor sentiment. These conditions may continue, recur, worsen or spread.
The Fund generally excludes corporate issuers that do not meet or exceed minimum ESG standards. Excluding specific issuers limits the universe of investments available to the Fund, which may mean forgoing some investment opportunities available to portfolios without similar ESG standards. At times, the Fund's investments may represent industries or industry sectors that are interrelated or have common risks, making the Fund more susceptible to any economic, political, or regulatory developments or other risks affecting those industries and sectors.
These risks may increase share price volatility.
For more information on this or any Pioneer fund, please visit amundi.com/usinvestors or call 1-800-622-9876. This material must be preceded or accompanied by the Fund's current prospectus or summary prospectus.
Any information in this shareholder report regarding market or economic trends or the factors influencing the Fund’s historical or future performance are statements of opinion as of the date of this report. Past performance is no guarantee of future results.
8Pioneer Fund | Annual Report | 12/31/23
Portfolio Summary | 12/31/23
Sector Distribution
(As a percentage of total investments)*
10 Largest Holdings
| (As a percentage of total investments)* |
| 1. | Microsoft Corp. | 6.71% |
| 2. | Apple, Inc. | 5.56 |
| 3. | Alphabet, Inc., Class A | 5.50 |
| 4. | Martin Marietta Materials, Inc. | 4.98 |
| 5. | NVIDIA Corp. | 4.53 |
| 6. | Citizens Financial Group, Inc. | 3.96 |
| 7. | Freeport-McMoRan, Inc. | 3.95 |
| 8. | Truist Financial Corp. | 3.83 |
| 9. | Caterpillar, Inc. | 3.37 |
| 10. | Amazon.com, Inc. | 3.10 |
* Excludes short-term investments and all derivative contracts except for options purchased. The Fund is actively managed, and current holdings may be different. The holdings listed should not be considered recommendations to buy or sell any securities.
Pioneer Fund | Annual Report | 12/31/239
Prices and Distributions | 12/31/23
Net Asset Value per Share
| Class | 12/31/23 | 12/31/22 |
| A | $36.48 | $29.27 |
| C | $28.42 | $23.04 |
| K | $37.29 | $29.89 |
| R | $36.59 | $29.36 |
| Y | $37.29 | $29.88 |
| | | |
Distributions per Share: 1/1/23 - 12/31/23
| Class | Net
Investment
Income | Short-Term
Capital Gains | Long-Term
Capital Gains |
| A | $0.2764 | $0.0686 | $0.7598 |
| C | $0.0989 | $0.0686 | $0.7598 |
| K | $0.3591 | $0.0686 | $0.7598 |
| R | $0.1391 | $0.0686 | $0.7598 |
| Y | $0.3592 | $0.0686 | $0.7598 |
Index Definition
The Standard & Poor’s 500 Index is an unmanaged, commonly used measure of the broad U.S. stock market. Indices are unmanaged and their returns assume reinvestment of dividends and do not reflect any fees or expenses. It is not possible to invest directly in an index.
The index defined here pertains to the “Value of $10,000 Investment” and “Value of $5 Million Investment” charts on pages 11 – 15.
10Pioneer Fund | Annual Report | 12/31/23
| Performance Update | 12/31/23 | Class A Shares |
Investment Returns
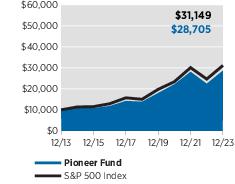
The mountain chart on the right shows the change in value of a $10,000 investment made in Class A shares of Pioneer Fund at public offering price during the periods shown, compared to that of the Standard & Poor's 500 Index.
Average Annual Total Returns
(As of December 31, 2023) |
| Period | Net
Asset
Value
(NAV) | Public
Offering
Price
(POP) | S&P
500
Index |
| 10 Years | 12.00% | 11.34% | 12.03% |
| 5 Years | 16.55 | 15.17 | 15.69 |
| 1 Year | 28.71 | 21.29 | 26.29 |
Expense Ratio
(Per prospectus dated May 1, 2023) |
| Gross |
| 1.00% |
Value of $10,000 Investment
Call 1-800-225-6292 or visit www.amundi.com/us for the most recent month-end performance results. Current performance may be lower or higher than the performance data quoted.
The performance data quoted represents past performance, which is no guarantee of future results. Investment return and principal value will fluctuate, and shares, when redeemed, may be worth more or less than their original cost.
NAV results represent the percent change in net asset value per share. POP returns reflect deduction of maximum 5.75% sales charge. NAV returns would have been lower had sales charges been reflected. All results are historical and assume the reinvestment of dividends and capital gains. Other share classes are available for which performance and expenses will differ.
Performance results reflect any applicable expense waivers in effect during the periods shown. Without such waivers Fund performance would be lower. Waivers may not be in effect for all funds. Certain fee waivers are contractual through a specified period. Otherwise, fee waivers can be rescinded at any time. See the prospectus and financial statements for more information.
The performance table and graph do not reflect the deduction of fees and taxes that a shareholder would pay on Fund distributions or the redemption of Fund shares.
Please refer to the financial highlights for a more current expense ratio.
Pioneer Fund | Annual Report | 12/31/2311
| Performance Update | 12/31/23 | Class C Shares |
Investment Returns
The mountain chart on the right shows the change in value of a $10,000 investment made in Class C shares of Pioneer Fund during the periods shown, compared to that of the Standard & Poor's 500 Index.
Average Annual Total Returns
(As of December 31, 2023) |
| Period | If
Held | If
Redeemed | S&P
500
Index |
| 10 Years | 11.12% | 11.12% | 12.03% |
| 5 Years | 15.62 | 15.62 | 15.69 |
| 1 Year | 27.67 | 26.67 | 26.29 |
Expense Ratio
(Per prospectus dated May 1, 2023) |
| Gross |
| 1.80% |
Value of $10,000 Investment
Call 1-800-225-6292 or visit www.amundi.com/us for the most recent month-end performance results. Current performance may be lower or higher than the performance data quoted.
The performance data quoted represents past performance, which is no guarantee of future results. Investment return and principal value will fluctuate, and shares, when redeemed, may be worth more or less than their original cost.
Class C shares held for less than one year are subject to a 1% contingent deferred sales charge (CDSC). “If Held” results represent the percent change in net asset value per share. “If Redeemed” returns reflect deduction of the CDSC for the one-year period, assuming a complete redemption of shares at the last price calculated on the last business day of the period, and no CDSC for the five- and 10-year periods. All results are historical and assume the reinvestment of dividends and capital gains. Other share classes are available for which performance and expenses will differ.
Performance results reflect any applicable expense waivers in effect during the periods shown. Without such waivers Fund performance would be lower. Waivers may not be in effect for all funds. Certain fee waivers are contractual through a specified period. Otherwise, fee waivers can be rescinded at any time. See the prospectus and financial statements for more information.
The performance table and graph do not reflect the deduction of fees and taxes that a shareholder would pay on Fund distributions or the redemption of Fund shares.
Please refer to the financial highlights for a more current expense ratio.
12Pioneer Fund | Annual Report | 12/31/23
| Performance Update | 12/31/23 | Class K Shares |
Investment Returns
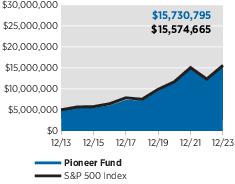
The mountain chart on the right shows the change in value of a $5 million investment made in Class K shares of Pioneer Fund during the periods shown, compared to that of the Standard & Poor's 500 Index.
Average Annual Total Returns
(As of December 31, 2023) |
| Period | Net
Asset
Value
(NAV) | S&P
500
Index |
| 10 Years | 12.14% | 12.03% |
| 5 Years | 16.84 | 15.69 |
| 1 Year | 29.06 | 26.29 |
Expense Ratio
(Per prospectus dated May 1, 2023) |
| Gross | Net |
| 0.71% | 0.61% |
Value of $5 Million Investment
Call 1-800-225-6292 or visit www.amundi.com/us for the most recent month-end performance results. Current performance may be lower or higher than the performance data quoted.
The performance data quoted represents past performance, which is no guarantee of future results. Investment return and principal value will fluctuate, and shares, when redeemed, may be worth more or less than their original cost.
The performance shown for Class K shares for the period prior to the commencement of operations of Class K shares on December 30, 2019, is the net asset value performance of the Fund’s Class A shares, which has not been restated to reflect any differences in expenses, including Rule 12b-1 fees applicable to Class A shares. Since fees for Class A shares generally are higher than those of Class K shares, the performance of Class K shares prior to their inception on December 30, 2019, would have been higher than the performance shown. For the period beginning December 30, 2019, the actual performance of Class K shares is reflected. Class K shares are not subject to sales charges and are available for limited groups of eligible investors, including institutional investors. All results are historical and assume the reinvestment of dividends and capital gains. Other share classes are available for which performance and expenses will differ.
Performance results reflect any applicable expense waivers in effect during the periods shown. Without such waivers Fund performance would be lower. Waivers may not be in effect for all funds. Certain fee waivers are contractual through a specified period. Otherwise, fee waivers can be rescinded at any time. See the prospectus and financial statements for more information.
The net expense ratio reflects the contractual expense limitation currently in effect through May 1, 2024 for Class K shares. There can be no assurance that Amundi US will extend the expense limitation beyond such time. Please see the prospectus and financial statements for more information.
The performance table and graph do not reflect the deduction of fees and taxes that a shareholder would pay on Fund distributions or the redemption of Fund shares.
Please refer to the financial highlights for more current expense ratios.
Pioneer Fund | Annual Report | 12/31/2313
| Performance Update | 12/31/23 | Class R Shares |
Investment Returns
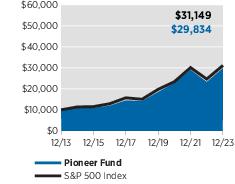
The mountain chart on the right shows the change in value of a $10,000 investment made in Class R shares of Pioneer Fund during the periods shown, compared to that of the Standard & Poor's 500 Index.
Average Annual Total Returns
(As of December 31, 2023) |
| Period | Net
Asset
Value
(NAV) | S&P
500
Index |
| 10 Years | 11.55% | 12.03% |
| 5 Years | 16.05 | 15.69 |
| 1 Year | 28.15 | 26.29 |
Expense Ratio
(Per prospectus dated May 1, 2023) |
| Gross |
| 1.50% |
Value of $10,000 Investment
Call 1-800-225-6292 or visit www.amundi.com/us for the most recent month-end performance results. Current performance may be lower or higher than the performance data quoted.
The performance data quoted represents past performance, which is no guarantee of future results. Investment return and principal value will fluctuate, and shares, when redeemed, may be worth more or less than their original cost.
Class R shares are not subject to sales charges and are available for limited groups of eligible investors, including institutional investors. All results are historical and assume the reinvestment of dividends and capital gains. Other share classes are available for which performance and expenses will differ.
Performance results reflect any applicable expense waivers in effect during the periods shown. Without such waivers Fund performance would be lower. Waivers may not be in effect for all funds. Certain fee waivers are contractual through a specified period. Otherwise, fee waivers can be rescinded at any time. See the prospectus and financial statements for more information.
The performance table and graph do not reflect the deduction of fees and taxes that a shareholder would pay on Fund distributions or the redemption of Fund shares.
Please refer to the financial highlights for a more current expense ratio.
14Pioneer Fund | Annual Report | 12/31/23
| Performance Update | 12/31/23 | Class Y Shares |
Investment Returns
The mountain chart on the right shows the change in value of a $5 million investment made in Class Y shares of Pioneer Fund during the periods shown, compared to that of the Standard & Poor's 500 Index.
Average Annual Total Returns
(As of December 31, 2023) |
| Period | Net
Asset
Value
(NAV) | S&P
500
Index |
| 10 Years | 12.32% | 12.03% |
| 5 Years | 16.90 | 15.69 |
| 1 Year | 29.11 | 26.29 |
Expense Ratio
(Per prospectus dated May 1, 2023) |
| Gross | Net |
| 0.82% | 0.61% |
Value of $5 Million Investment
Call 1-800-225-6292 or visit www.amundi.com/us for the most recent month-end performance results. Current performance may be lower or higher than the performance data quoted.
The performance data quoted represents past performance, which is no guarantee of future results. Investment return and principal value will fluctuate, and shares, when redeemed, may be worth more or less than their original cost.
Class Y shares are not subject to sales charges and are available for limited groups of eligible investors, including institutional investors. All results are historical and assume the reinvestment of dividends and capital gains. Other share classes are available for which performance and expenses will differ.
Performance results reflect any applicable expense waivers in effect during the periods shown. Without such waivers Fund performance would be lower. Waivers may not be in effect for all funds. Certain fee waivers are contractual through a specified period. Otherwise, fee waivers can be rescinded at any time. See the prospectus and financial statements for more information.
The net expense ratio reflects the contractual expense limitation currently in effect through May 1, 2024 for Class Y shares. There can be no assurance that Amundi US will extend the expense limitation beyond such time. Please see the prospectus and financial statements for more information.
The performance table and graph do not reflect the deduction of fees and taxes that a shareholder would pay on Fund distributions or the redemption of Fund shares.
Please refer to the financial highlights for more current expense ratios.
Pioneer Fund | Annual Report | 12/31/2315
Comparing Ongoing Fund Expenses
As a shareholder in the Fund, you incur two types of costs:
| (1) | ongoing costs, including management fees, distribution and/or service (12b-1) fees, and other Fund expenses; and |
| (2) | transaction costs, including sales charges (loads) on purchase payments. |
This example is intended to help you understand your ongoing expenses (in dollars) of investing in the Fund and to compare these costs with the ongoing costs of investing in other mutual funds. The example is based on an investment of $1,000 at the beginning of the Fund’s latest six-month period and held throughout the six months.
Using the Tables
Actual Expenses
The first table below provides information about actual account values and actual expenses. You may use the information in this table, together with the amount you invested, to estimate the expenses that you paid over the period as follows:
| (1) | Divide your account value by $1,000
Example: an $8,600 account value ÷ $1,000 = 8.6 |
| (2) | Multiply the result in (1) above by the corresponding share class’s number in the third row under the heading entitled “Expenses Paid During Period” to estimate the expenses you paid on your account during this period. |
Expenses Paid on a $1,000 Investment in Pioneer Fund
Based on actual returns from July 1, 2023 through December 31, 2023.
| Share Class | A | C | K | R | Y |
Beginning Account
Value on 7/1/23 | $1,000.00 | $1,000.00 | $1,000.00 | $1,000.00 | $1,000.00 |
Ending Account Value
(after expenses) on 12/31/23 | $1,132.80 | $1,128.20 | $1,134.30 | $1,130.20 | $1,134.60 |
Expenses Paid
During Period* | $4.84 | $9.12 | $3.28 | $7.03 | $3.28 |
| | |
| * | Expenses are equal to the Fund’s annualized expense ratio of 0.90%, 1.70%, 0.61%, 1.31%, and 0.61% for Class A, Class C, Class K, Class R, and Class Y shares, respectively, multiplied by the average account value over the period, multiplied by 184/365 (to reflect the one-half year period). |
16Pioneer Fund | Annual Report | 12/31/23
Hypothetical Example for Comparison Purposes
The table below provides information about hypothetical account values and hypothetical expenses based on the Fund’s actual expense ratio and an assumed rate of return of 5% per year before expenses, which is not the Fund’s actual return. The hypothetical account values and expenses may not be used to estimate the actual ending account balance or expenses you paid for the period.
You may use this information to compare the ongoing costs of investing in the Fund and other funds. To do so, compare this 5% hypothetical example with the 5% hypothetical examples that appear in the shareholder reports of the other funds.
Please note that the expenses shown in the tables are meant to highlight your ongoing costs only and do not reflect any transaction costs, such as sales charges (loads) that are charged at the time of the transaction. Therefore, the table below is useful in comparing ongoing costs only and will not help you determine the relative total costs of owning different funds. In addition, if these transaction costs were included, your costs would have been higher.
Expenses Paid on a $1,000 Investment in Pioneer Fund
Based on a hypothetical 5% return per year before expenses, reflecting the period from July 1, 2023 through December 31, 2023.
| Share Class | A | C | K | R | Y |
Beginning Account
Value on 7/1/23 | $1,000.00 | $1,000.00 | $1,000.00 | $1,000.00 | $1,000.00 |
Ending Account Value
(after expenses) on 12/31/23 | $1,020.67 | $1,016.64 | $1,022.13 | $1,018.60 | $1,022.13 |
Expenses Paid
During Period* | $4.58 | $8.64 | $3.11 | $6.67 | $3.11 |
| | |
| * | Expenses are equal to the Fund’s annualized expense ratio of 0.90%, 1.70%, 0.61%, 1.31%, and 0.61% for Class A, Class C, Class K, Class R, and Class Y shares, respectively, multiplied by the average account value over the period, multiplied by 184/365 (to reflect the one-half year period). |
Pioneer Fund | Annual Report | 12/31/2317
Schedule of Investments | 12/31/23
| Shares | | | | | | Value |
| | UNAFFILIATED ISSUERS — 99.9% | |
| | Common Stocks — 99.5% of Net Assets | |
| | Banks — 10.2% | |
| 9,030,686 | Citizens Financial Group, Inc. | $ 299,276,934 |
| 7,837,331 | Truist Financial Corp. | 289,354,260 |
| 4,286,713 | US Bancorp | 185,528,939 |
| | Total Banks | $774,160,133 |
|
|
| | Biotechnology — 5.0% | |
| 169,699(a) | Regeneron Pharmaceuticals, Inc. | $ 149,044,935 |
| 558,991(a) | Vertex Pharmaceuticals, Inc. | 227,447,848 |
| | Total Biotechnology | $376,492,783 |
|
|
| | Broadline Retail — 3.1% | |
| 1,541,628(a) | Amazon.com, Inc. | $ 234,234,958 |
| | Total Broadline Retail | $234,234,958 |
|
|
| | Capital Markets — 5.8% | |
| 873,204 | CME Group, Inc. | $ 183,896,762 |
| 460,858 | Goldman Sachs Group, Inc. | 177,785,191 |
| 137,673 | MSCI, Inc. | 77,874,732 |
| | Total Capital Markets | $439,556,685 |
|
|
| | Commercial Services & Supplies — 1.1% | |
| 1,001,855 | Veralto Corp. | $ 82,412,592 |
| | Total Commercial Services & Supplies | $82,412,592 |
|
|
| | Communications Equipment — 1.9% | |
| 612,074(a) | Arista Networks, Inc. | $ 144,149,548 |
| | Total Communications Equipment | $144,149,548 |
|
|
| | Construction Materials — 5.8% | |
| 754,702 | Martin Marietta Materials, Inc. | $ 376,528,375 |
| 278,557 | Vulcan Materials Co. | 63,235,224 |
| | Total Construction Materials | $439,763,599 |
|
|
| | Consumer Staples Distribution & Retail — 4.4% | |
| 2,661,048(a) | BJ's Wholesale Club Holdings, Inc. | $ 177,385,460 |
| 240,314 | Costco Wholesale Corp. | 158,626,465 |
| | Total Consumer Staples Distribution & Retail | $336,011,925 |
|
|
| | Electrical Equipment — 2.1% | |
| 1,751,419 | ABB, Ltd. (A.D.R.) | $ 77,587,861 |
| 261,635 | Rockwell Automation, Inc. | 81,232,435 |
| | Total Electrical Equipment | $158,820,296 |
|
|
The accompanying notes are an integral part of these financial statements.
18Pioneer Fund | Annual Report | 12/31/23
| Shares | | | | | | Value |
| | Entertainment — 3.6% | |
| 1,182,800 | Electronic Arts, Inc. | $ 161,818,868 |
| 1,185,052(a) | Live Nation Entertainment, Inc. | 110,920,867 |
| | Total Entertainment | $272,739,735 |
|
|
| | Financial Services — 2.6% | |
| 391,544 | Jack Henry & Associates, Inc. | $ 63,982,205 |
| 498,370 | Visa, Inc., Class A | 129,750,630 |
| | Total Financial Services | $193,732,835 |
|
|
| | Ground Transportation — 0.6% | |
| 172,000 | Union Pacific Corp. | $ 42,246,640 |
| | Total Ground Transportation | $42,246,640 |
|
|
| | Hotels, Restaurants & Leisure — 2.2% | |
| 2,331,699(a) | Planet Fitness, Inc., Class A | $ 170,214,027 |
| | Total Hotels, Restaurants & Leisure | $170,214,027 |
|
|
| | Interactive Media & Services — 5.5% | |
| 2,976,524(a) | Alphabet, Inc., Class A | $ 415,790,638 |
| | Total Interactive Media & Services | $415,790,638 |
|
|
| | IT Services — 5.0% | |
| 423,614 | Accenture Plc, Class A | $ 148,650,388 |
| 884,068(a) | Akamai Technologies, Inc. | 104,629,448 |
| 794,807 | International Business Machines Corp. | 129,990,685 |
| | Total IT Services | $383,270,521 |
|
|
| | Life Sciences Tools & Services — 1.1% | |
| 376,123 | Danaher Corp. | $ 87,012,295 |
| | Total Life Sciences Tools & Services | $87,012,295 |
|
|
| | Machinery — 3.3% | |
| 859,907 | Caterpillar, Inc. | $ 254,248,703 |
| | Total Machinery | $254,248,703 |
|
|
| | Metals & Mining — 6.6% | |
| 7,002,896 | Freeport-McMoRan, Inc. | $ 298,113,283 |
| 4,726,486 | Teck Resources, Ltd., Class B | 199,788,563 |
| | Total Metals & Mining | $497,901,846 |
|
|
| | Oil, Gas & Consumable Fuels — 4.0% | |
| 1,518,414 | Chevron Corp. | $ 226,486,632 |
| 664,174 | EOG Resources, Inc. | 80,331,846 |
| | Total Oil, Gas & Consumable Fuels | $306,818,478 |
|
|
The accompanying notes are an integral part of these financial statements.
Pioneer Fund | Annual Report | 12/31/2319
Schedule of Investments | 12/31/23 (continued)
| Shares | | | | | | Value |
| | Pharmaceuticals — 2.3% | |
| 151,106 | Eli Lilly & Co. | $ 88,082,710 |
| 822,696 | Novo Nordisk AS (A.D.R.) | 85,107,901 |
| | Total Pharmaceuticals | $173,190,611 |
|
|
| | Semiconductors & Semiconductor Equipment —
8.0% | |
| 386,462(a) | Advanced Micro Devices, Inc. | $ 56,968,364 |
| 233,951 | KLA Corp. | 135,995,716 |
| 88,587 | Lam Research Corp. | 69,386,654 |
| 690,595 | NVIDIA Corp. | 341,996,456 |
| | Total Semiconductors & Semiconductor Equipment | $604,347,190 |
|
|
| | Software — 7.7% | |
| 133,398(a) | Adobe, Inc. | $ 79,585,247 |
| 1,348,389 | Microsoft Corp. | 507,048,199 |
| | Total Software | $586,633,446 |
|
|
| | Specialty Retail — 2.1% | |
| 463,463 | Home Depot, Inc. | $ 160,613,103 |
| | Total Specialty Retail | $160,613,103 |
|
|
| | Technology Hardware, Storage & Peripherals —
5.5% | |
| 2,180,408 | Apple, Inc. | $ 419,793,952 |
| | Total Technology Hardware, Storage & Peripherals | $419,793,952 |
|
|
| | Total Common Stocks
(Cost $4,946,169,009) | $7,554,156,539 |
|
|
| | SHORT TERM INVESTMENTS — 0.4% of Net
Assets | |
| | Open-End Fund — 0.4% | |
| 32,041,898(b) | Dreyfus Government Cash Management,
Institutional Shares, 5.25% | $ 32,041,898 |
| | | | | | | $ 32,041,898 |
|
|
| | TOTAL SHORT TERM INVESTMENTS
(Cost $32,041,898) | $32,041,898 |
|
|
| | TOTAL INVESTMENTS IN UNAFFILIATED ISSUERS — 99.9%
(Cost $4,978,210,907) | $7,586,198,437 |
| | OTHER ASSETS AND LIABILITIES — 0.1% | $ 8,037,378 |
| | net assets — 100.0% | $7,594,235,815 |
| | | | | | | |
The accompanying notes are an integral part of these financial statements.
20Pioneer Fund | Annual Report | 12/31/23
| (A.D.R.) | American Depositary Receipts. |
| (a) | Non-income producing security. |
| (b) | Rate periodically changes. Rate disclosed is the 7-day yield at December 31, 2023. |
Purchases and sales of securities (excluding short-term investments) for the year ended December 31, 2023, aggregated $4,341,020,464 and $4,988,435,182, respectively.
At December 31, 2023, the net unrealized appreciation on investments based on cost for federal tax purposes of $5,044,617,603 was as follows:
| Aggregate gross unrealized appreciation for all investments in which there is an excess of value over tax cost | $2,668,797,400 |
| Aggregate gross unrealized depreciation for all investments in which there is an excess of tax cost over value | (127,216,566) |
| Net unrealized appreciation | $2,541,580,834 |
Various inputs are used in determining the value of the Fund's investments. These inputs are summarized in the three broad levels below.
| Level 1 | – | unadjusted quoted prices in active markets for identical securities. |
| Level 2 | – | other significant observable inputs (including quoted prices for similar securities, interest rates, prepayment speeds, credit risks, etc.). See Notes to Financial Statements — Note 1A. |
| Level 3 | – | significant unobservable inputs (including the Adviser's own assumptions in determining fair value of investments). See Notes to Financial Statements — Note 1A. |
The following is a summary of the inputs used as of December 31, 2023 in valuing the Fund's investments:
| | Level 1 | Level 2 | Level 3 | Total |
| Common Stocks | $7,554,156,539 | $— | $— | $7,554,156,539 |
| Open-End Fund | 32,041,898 | — | — | 32,041,898 |
| Total Investments in Securities | $ 7,586,198,437 | $ — | $ — | $ 7,586,198,437 |
During the year ended December 31, 2023, there were no transfers in or out of Level 3.
The accompanying notes are an integral part of these financial statements.
Pioneer Fund | Annual Report | 12/31/2321
Statement of Assets and Liabilities | 12/31/23
| ASSETS: | |
| Investments in unaffiliated issuers, at value (cost $4,978,210,907) | $7,586,198,437 |
| Cash | 342,869 |
| Receivables — | |
| Investment securities sold | 18,320,723 |
| Fund shares sold | 3,133,935 |
| Dividends | 10,699,775 |
| Interest | 198,056 |
| Due from the Adviser | 132,428 |
| Other assets | 80,202 |
| Total assets | $7,619,106,425 |
| LIABILITIES: | |
| Payables — | |
| Investment securities purchased | $ 17,323,417 |
| Fund shares repurchased | 4,701,315 |
| Trustees' fees | 340,636 |
| Management fees | 840,451 |
| Administrative expenses | 290,289 |
| Distribution fees | 237,306 |
| Accrued expenses | 1,137,196 |
| Total liabilities | $ 24,870,610 |
| NET ASSETS: | |
| Paid-in capital | $5,015,002,289 |
| Distributable earnings | 2,579,233,526 |
| Net assets | $7,594,235,815 |
| NET ASSET VALUE PER SHARE: | |
| No par value (unlimited number of shares authorized) | |
| Class A (based on $6,481,230,734/177,665,121 shares) | $ 36.48 |
| Class C (based on $81,484,836/2,866,873 shares) | $ 28.42 |
| Class K (based on $25,723,587/689,766 shares) | $ 37.29 |
| Class R (based on $44,991,364/1,229,542 shares) | $ 36.59 |
| Class Y (based on $960,805,294/25,768,909 shares) | $ 37.29 |
| MAXIMUM OFFERING PRICE PER SHARE: | |
| Class A (based on $36.48 net asset value per share/100%-5.75% maximum sales charge) | $ 38.71 |
The accompanying notes are an integral part of these financial statements.
22Pioneer Fund | Annual Report | 12/31/23
Statement of Operations FOR THE YEAR ENDED 12/31/23
| INVESTMENT INCOME: | | |
| Dividends from unaffiliated issuers (net of foreign taxes withheld $287,782) | $ 114,083,666 | |
| Interest from unaffiliated issuers | 90,378 | |
| Total Investment Income | | $ 114,174,044 |
| EXPENSES: | | |
| Management fees | | |
| Basic fees | $ 41,229,345 | |
| Performance adjustment | (2,548,407) | |
| Administrative expenses | 2,734,941 | |
| Transfer agent fees | | |
| Class A | 1,834,114 | |
| Class C | 59,956 | |
| Class K | 158 | |
| Class R | 80,367 | |
| Class Y | 943,455 | |
| Distribution fees | | |
| Class A | 14,556,670 | |
| Class C | 746,011 | |
| Class R | 207,843 | |
| Shareholder communications expense | 642,758 | |
| Custodian fees | 64,780 | |
| Registration fees | 187,462 | |
| Professional fees | 426,841 | |
| Printing expense | 60,759 | |
| Officers' and Trustees' fees | 464,515 | |
| Insurance expense | 39,500 | |
| Miscellaneous | 1,123,117 | |
| Total expenses | | $ 62,854,185 |
| Less fees waived and expenses reimbursed by the Adviser | | (3,197,542) |
| Net expenses | | $ 59,656,643 |
| Net investment income | | $ 54,517,401 |
| REALIZED AND UNREALIZED GAIN (LOSS) ON INVESTMENTS: | | |
| Net realized gain (loss) on: | | |
| Investments in unaffiliated issuers | $ 246,673,945 | |
| Other assets and liabilities denominated in foreign currencies | (13,067) | $ 246,660,878 |
| Change in net unrealized appreciation (depreciation) on: | | |
| Investments in unaffiliated issuers | $1,457,483,025 | |
| Other assets and liabilities denominated in foreign currencies | 569 | $1,457,483,594 |
| Net realized and unrealized gain (loss) on investments | | $1,704,144,472 |
| Net increase in net assets resulting from operations | | $1,758,661,873 |
The accompanying notes are an integral part of these financial statements.
Pioneer Fund | Annual Report | 12/31/2323
Statements of Changes in Net Assets
| | Year
Ended
12/31/23 | Year
Ended
12/31/22 |
| FROM OPERATIONS: | | |
| Net investment income (loss) | $ 54,517,401 | $ 39,871,950 |
| Net realized gain (loss) on investments | 246,660,878 | 104,975,505 |
| Change in net unrealized appreciation (depreciation) on investments | 1,457,483,594 | (1,782,653,301) |
| Net increase (decrease) in net assets resulting from operations | $ 1,758,661,873 | $(1,637,805,846) |
| DISTRIBUTIONS TO SHAREHOLDERS: | | |
| Class A ($1.11 and $1.21 per share, respectively) | $ (193,673,656) | $ (219,241,127) |
| Class C ($0.93 and $1.05 per share, respectively) | (2,598,825) | (2,997,578) |
| Class K ($1.19 and $1.30 per share, respectively) | (833,685) | (1,123,443) |
| Class R ($0.97 and $1.06 per share, respectively) | (1,189,636) | (1,361,320) |
| Class Y ($1.19 and $1.30 per share, respectively) | (30,345,086) | (43,517,373) |
| Total distributions to shareholders | $ (228,640,888) | $ (268,240,841) |
| FROM FUND SHARE TRANSACTIONS: | | |
| Net proceeds from sales of shares | $ 414,077,432 | $ 968,687,599 |
| Reinvestment of distributions | 219,731,923 | 254,172,530 |
| Cost of shares repurchased | (1,107,936,988) | (1,133,640,529) |
| Net increase (decrease) in net assets resulting from Fund share transactions | $ (474,127,633) | $ 89,219,600 |
| Net increase (decrease) in net assets | $ 1,055,893,352 | $ (1,816,827,087) |
| NET ASSETS: | | |
| Beginning of year | $ 6,538,342,463 | $ 8,355,169,550 |
| End of year | $ 7,594,235,815 | $ 6,538,342,463 |
The accompanying notes are an integral part of these financial statements.
24Pioneer Fund | Annual Report | 12/31/23
| | Year
Ended
12/31/23
Shares | Year
Ended
12/31/23
Amount | Year
Ended
12/31/22
Shares | Year
Ended
12/31/22
Amount |
| Class A | | | | |
| Shares sold | 3,067,551 | $ 99,328,128 | 4,710,877 | $ 155,695,652 |
| Reinvestment of distributions | 5,525,026 | 187,795,412 | 6,973,038 | 212,189,265 |
| Less shares repurchased | (16,291,410) | (527,370,454) | (16,715,618) | (544,094,409) |
| Net decrease | (7,698,833) | $(240,246,914) | (5,031,703) | $(176,209,492) |
| Class C | | | | |
| Shares sold | 454,565 | $ 11,462,385 | 937,948 | $ 24,312,640 |
| Reinvestment of distributions | 94,516 | 2,511,497 | 121,628 | 2,914,475 |
| Less shares repurchased | (743,071) | (18,785,623) | (667,268) | (16,971,621) |
Net increase
(decrease) | (193,990) | $ (4,811,741) | 392,308 | $ 10,255,494 |
| Class K | | | | |
| Shares sold | 225,021 | $ 7,344,489 | 543,295 | $ 18,287,008 |
| Reinvestment of distributions | 23,994 | 830,784 | 36,074 | 1,123,443 |
| Less shares repurchased | (376,212) | (12,416,309) | (462,429) | (15,074,731) |
Net increase
(decrease) | (127,197) | $ (4,241,036) | 116,940 | $ 4,335,720 |
| Class R | | | | |
| Shares sold | 182,110 | $ 5,904,587 | 273,249 | $ 9,019,772 |
| Reinvestment of distributions | 34,715 | 1,189,635 | 44,591 | 1,361,320 |
| Less shares repurchased | (318,413) | (10,463,572) | (368,049) | (11,996,539) |
| Net decrease | (101,588) | $ (3,369,350) | (50,209) | $ (1,615,447) |
| Class Y | | | | |
| Shares sold | 8,768,920 | $ 290,037,843 | 22,298,302 | $ 761,372,527 |
| Reinvestment of distributions | 791,230 | 27,404,595 | 1,174,541 | 36,584,027 |
| Less shares repurchased | (16,543,976) | (538,901,030) | (16,619,530) | (545,503,229) |
Net increase
(decrease) | (6,983,826) | $(221,458,592) | 6,853,313 | $ 252,453,325 |
The accompanying notes are an integral part of these financial statements.
Pioneer Fund | Annual Report | 12/31/2325
| | Year
Ended
12/31/23 | Year
Ended
12/31/22 | Year
Ended
12/31/21 | Year
Ended
12/31/20 | Year
Ended
12/31/19 |
| Class A | | | | | |
| Net asset value, beginning of period | $ 29.27 | $ 37.80 | $ 34.54 | $ 29.58 | $ 24.76 |
| Increase (decrease) from investment operations: | | | | | |
| Net investment income (loss) (a) | $ 0.25 | $ 0.17 | $ 0.05 | $ 0.16 | $ 0.25 |
| Net realized and unrealized gain (loss) on investments | 8.07 | (7.49) | 9.33 | 6.81 | 7.34 |
| Net increase (decrease) from investment operations | $ 8.32 | $ (7.32) | $ 9.38 | $ 6.97 | $ 7.59 |
| Distributions to shareholders: | | | | | |
| Net investment income | $ (0.28) | $ (0.17) | $ (0.05) | $ (0.15) | $ (0.24) |
| Net realized gain | (0.83) | (1.04) | (6.07) | (1.86) | (2.53) |
| Total distributions | $ (1.11) | $ (1.21) | $ (6.12) | $ (2.01) | $ (2.77) |
| Net increase (decrease) in net asset value | $ 7.21 | $ (8.53) | $ 3.26 | $ 4.96 | $ 4.82 |
| Net asset value, end of period | $ 36.48 | $ 29.27 | $ 37.80 | $ 34.54 | $ 29.58 |
| Total return (b) | 28.71% | (19.47)% | 27.81% | 23.90% | 31.00% |
| Ratio of net expenses to average net assets | 0.90% | 0.91% | 0.94% | 1.04% | 1.04% |
| Ratio of net investment income (loss) to average net assets | 0.77% | 0.51% | 0.13% | 0.52% | 0.86% |
| Portfolio turnover rate | 64% | 57% | 89% | 91% | 71% |
| Net assets, end of period (in thousands) | $6,481,231 | $5,425,590 | $7,196,933 | $5,984,206 | $5,144,683 |
| Ratios with no waiver of fees and assumption of expenses by the Adviser and no reduction for fees paid indirectly: | | | | | |
| Total expenses to average net assets | 0.93% | 1.00% | 1.06% | 1.08% | 1.04% |
| Net investment income (loss) to average net assets | 0.74% | 0.42% | 0.01% | 0.48% | 0.86% |
| (a) | The per-share data presented above is based on the average shares outstanding for the period presented. |
| (b) | Assumes initial investment at net asset value at the beginning of each period, reinvestment of all distributions, the complete redemption of the investment at net asset value at the end of each period and no sales charges. Total return would be reduced if sales charges were taken into account. |
The accompanying notes are an integral part of these financial statements.
26Pioneer Fund | Annual Report | 12/31/23
| | Year
Ended
12/31/23 | Year
Ended
12/31/22 | Year
Ended
12/31/21 | Year
Ended
12/31/20 | Year
Ended
12/31/19 |
| Class C | | | | | |
| Net asset value, beginning of period | $ 23.04 | $ 30.10 | $ 28.70 | $ 24.90 | $ 21.22 |
| Increase (decrease) from investment operations: | | | | | |
| Net investment income (loss) (a) | $ (0.01)(b) | $ (0.07)(b) | $ (0.20)(b) | $ (0.07)(b) | $ 0.01 |
| Net realized and unrealized gain (loss) on investments | 6.32 | (5.94) | 7.67 | 5.74 | 6.27 |
| Net increase (decrease) from investment operations | $ 6.31 | $ (6.01) | $ 7.47 | $ 5.67 | $ 6.28 |
| Distributions to shareholders: | | | | | |
| Net investment income | $ (0.10) | $ (0.01) | $ — | $ (0.01) | $ (0.07) |
| Net realized gain | (0.83) | (1.04) | (6.07) | (1.86) | (2.53) |
| Total distributions | $ (0.93) | $ (1.05) | $ (6.07) | $ (1.87) | $ (2.60) |
| Net increase (decrease) in net asset value | $ 5.38 | $ (7.06) | $ 1.40 | $ 3.80 | $ 3.68 |
| Net asset value, end of period | $ 28.42 | $ 23.04 | $ 30.10 | $ 28.70 | $ 24.90 |
| Total return (c) | 27.67% | (20.10)% | 26.79% | 22.99% | 29.92% |
| Ratio of net expenses to average net assets | 1.70% | 1.70% | 1.71% | 1.81% | 1.84% |
| Ratio of net investment income (loss) to average net assets | (0.03)% | (0.26)% | (0.63)% | (0.25)% | 0.05% |
| Portfolio turnover rate | 64% | 57% | 89% | 91% | 71% |
| Net assets, end of period (in thousands) | $81,485 | $70,521 | $80,320 | $47,608 | $40,142 |
| Ratios with no waiver of fees and assumption of expenses by the Adviser and no reduction for fees paid indirectly: | | | | | |
| Total expenses to average net assets | 1.73% | 1.80% | 1.83% | 1.85% | 1.84% |
| Net investment income (loss) to average net assets | (0.06)% | (0.36)% | (0.75)% | (0.29)% | 0.05% |
| (a) | The per-share data presented above is based on the average shares outstanding for the period presented. |
| (b) | The amount shown for a share outstanding does not correspond with net investment gain (loss) in the Statement of Operations for the period due to timing of the sales and repurchase of shares. |
| (c) | Assumes initial investment at net asset value at the beginning of each period, reinvestment of all distributions, the complete redemption of the investment at net asset value at the end of each period and no sales charges. Total return would be reduced if sales charges were taken into account. |
The accompanying notes are an integral part of these financial statements.
Pioneer Fund | Annual Report | 12/31/2327
Financial Highlights (continued)
| | Year
Ended
12/31/23 | Year
Ended
12/31/22 | Year
Ended
12/31/21 | Year
Ended
12/31/20 | 12/30/19* to
12/31/19 |
| Class K | | | | | |
| Net asset value, beginning of period | $ 29.89 | $ 38.56 | $ 35.13 | $ 30.04 | $ 30.12 |
| Increase (decrease) from investment operations: | | | | | |
| Net investment income (loss) (a) | $ 0.35 | $ 0.28 | $ 0.19 | $ 0.26 | $ 0.00(b) |
| Net realized and unrealized gain (loss) on investments | 8.24 | (7.65) | 9.48 | 6.93 | (0.08) |
| Net increase (decrease) from investment operations | $ 8.59 | $ (7.37) | $ 9.67 | $ 7.19 | $ (0.08) |
| Distributions to shareholders: | | | | | |
| Net investment income | $ (0.36) | $ (0.26) | $ (0.17) | $ (0.24) | $ — |
| Net realized gain | (0.83) | (1.04) | (6.07) | (1.86) | — |
| Total distributions | $ (1.19) | $ (1.30) | $ (6.24) | $ (2.10) | $ — |
| Net increase (decrease) in net asset value | $ 7.40 | $ (8.67) | $ 3.43 | $ 5.09 | $ (0.08) |
| Net asset value, end of period | $ 37.29 | $ 29.89 | $ 38.56 | $ 35.13 | $ 30.04 |
| Total return (c) | 29.06% | (19.22)% | 28.23% | 24.33% | 33.04%(d) |
| Ratio of net expenses to average net assets | 0.61% | 0.61% | 0.61% | 0.69% | 0.67%(e) |
| Ratio of net investment income (loss) to average net assets | 1.05% | 0.84% | 0.48% | 0.85% | 1.28%(e) |
| Portfolio turnover rate | 64% | 57% | 89% | 91% | 71%(d) |
| Net assets, end of period (in thousands) | $25,724 | $24,418 | $26,995 | $12,743 | $13,025 |
| Ratios with no waiver of fees and assumption of expenses by the Adviser and no reduction for fees paid indirectly: | | | | | |
| Total expenses to average net assets | 0.65% | 0.71% | 0.73% | 0.73% | 0.67%(e) |
| Net investment income (loss) to average net assets | 1.01% | 0.74% | 0.36% | 0.81% | 1.28%(e) |
| * | Class K commenced operations on December 30, 2019. |
| (a) | The per-share data presented above is based on the average shares outstanding for the period presented. |
| (b) | Amount is less than $0.01. |
| (c) | Assumes initial investment at net asset value at the beginning of each period, reinvestment of all distributions and the complete redemption of the investment at net asset value at the end of each period. |
| (d) | Not annualized. |
| (e) | Annualized. |
The accompanying notes are an integral part of these financial statements.
28Pioneer Fund | Annual Report | 12/31/23
| | Year
Ended
12/31/23 | Year
Ended
12/31/22 | Year
Ended
12/31/21 | Year
Ended
12/31/20 | Year
Ended
12/31/19 |
| Class R | | | | | |
| Net asset value, beginning of period | $ 29.36 | $ 37.91 | $ 34.73 | $ 29.74 | $ 24.89 |
| Increase (decrease) from investment operations: | | | | | |
| Net investment income (loss) (a) | $ 0.12 | $ 0.00(b) | $ (0.10)(c) | $ 0.04 | $ 0.13 |
| Net realized and unrealized gain (loss) on investments | 8.08 | (7.49) | 9.35 | 6.85 | 7.37 |
| Net increase (decrease) from investment operations | $ 8.20 | $ (7.49) | $ 9.25 | $ 6.89 | $ 7.50 |
| Distributions to shareholders: | | | | | |
| Net investment income | $ (0.14) | $ (0.02) | $ — | $ (0.04) | $ (0.12) |
| Net realized gain | (0.83) | (1.04) | (6.07) | (1.86) | (2.53) |
| Total distributions | $ (0.97) | $ (1.06) | $ (6.07) | $ (1.90) | $ (2.65) |
| Net increase (decrease) in net asset value | $ 7.23 | $ (8.55) | $ 3.18 | $ 4.99 | $ 4.85 |
| Net asset value, end of period | $ 36.59 | $ 29.36 | $ 37.91 | $ 34.73 | $ 29.74 |
| Total return (d) | 28.15% | (19.86)% | 27.28% | 23.41% | 30.45% |
| Ratio of net expenses to average net assets | 1.31% | 1.41% | 1.33% | 1.44% | 1.45% |
| Ratio of net investment income (loss) to average net assets | 0.36% | 0.01% | (0.27)% | 0.13% | 0.44% |
| Portfolio turnover rate | 64% | 57% | 89% | 91% | 71% |
| Net assets, end of period (in thousands) | $44,991 | $39,076 | $52,370 | $49,550 | $48,363 |
| Ratios with no waiver of fees and assumption of expenses by the Adviser and no reduction for fees paid indirectly: | | | | | |
| Total expenses to average net assets | 1.34% | 1.50% | 1.45% | 1.47% | 1.45% |
| Net investment income (loss) to average net assets | 0.33% | (0.08)% | (0.39)% | 0.10% | 0.44% |
| (a) | The per-share data presented above is based on the average shares outstanding for the period presented. |
| (b) | Amount rounds to less than $0.01 per share. |
| (c) | The amount shown for a share outstanding does not correspond with net investment gain (loss) in the Statement of Operations for the period due to timing of the sales and repurchase of shares. |
| (d) | Assumes initial investment at net asset value at the beginning of each period, reinvestment of all distributions and the complete redemption of the investment at net asset value at the end of each period. |
The accompanying notes are an integral part of these financial statements.
Pioneer Fund | Annual Report | 12/31/2329
Financial Highlights (continued)
| | Year
Ended
12/31/23 | Year
Ended
12/31/22 | Year
Ended
12/31/21 | Year
Ended
12/31/20 | Year
Ended
12/31/19 |
| Class Y | | | | | |
| Net asset value, beginning of period | $ 29.88 | $ 38.55 | $ 35.13 | $ 30.04 | $ 25.11 |
| Increase (decrease) from investment operations: | | | | | |
| Net investment income (loss) (a) | $ 0.35 | $ 0.28 | $ 0.19 | $ 0.27 | $ 0.32 |
| Net realized and unrealized gain (loss) on investments | 8.25 | (7.65) | 9.48 | 6.92 | 7.45 |
| Net increase (decrease) from investment operations | $ 8.60 | $ (7.37) | $ 9.67 | $ 7.19 | $ 7.77 |
| Distributions to shareholders: | | | | | |
| Net investment income | $ (0.36) | $ (0.26) | $ (0.18) | $ (0.24) | $ (0.31) |
| Net realized gain | (0.83) | (1.04) | (6.07) | (1.86) | (2.53) |
| Total distributions | $ (1.19) | $ (1.30) | $ (6.25) | $ (2.10) | $ (2.84) |
| Net increase (decrease) in net asset value | $ 7.41 | $ (8.67) | $ 3.42 | $ 5.09 | $ 4.93 |
| Net asset value, end of period | $ 37.29 | $ 29.88 | $ 38.55 | $ 35.13 | $ 30.04 |
| Total return (b) | 29.11% | (19.23)% | 28.20% | 24.33% | 31.31% |
| Ratio of net expenses to average net assets | 0.61% | 0.61% | 0.61% | 0.71% | 0.81% |
| Ratio of net investment income (loss) to average net assets | 1.05% | 0.84% | 0.48% | 0.84% | 1.09% |
| Portfolio turnover rate | 64% | 57% | 89% | 91% | 71% |
| Net assets, end of period (in thousands) | $960,805 | $978,738 | $998,552 | $378,626 | $107,783 |
| Ratios with no waiver of fees and assumption of expenses by the Adviser and no reduction for fees paid indirectly: | | | | | |
| Total expenses to average net assets | 0.75% | 0.82% | 0.81% | 0.83% | 0.81% |
| Net investment income (loss) to average net assets | 0.91% | 0.63% | 0.28% | 0.72% | 1.09% |
| (a) | The per-share data presented above is based on the average shares outstanding for the period presented. |
| (b) | Assumes initial investment at net asset value at the beginning of each period, reinvestment of all distributions and the complete redemption of the investment at net asset value at the end of each period. |
The accompanying notes are an integral part of these financial statements.
30Pioneer Fund | Annual Report | 12/31/23
Notes to Financial Statements | 12/31/23
1. Organization and Significant Accounting Policies
Pioneer Fund (the “Fund”) is a Delaware statutory trust. The Fund is registered under the Investment Company Act of 1940 (the "1940 Act''), as a diversified, open-end management investment company. The investment objective of the Fund is to provide reasonable income and capital growth.
The Fund offers five classes of shares designated as Class A, Class C, Class K, Class R and Class Y shares. Each class of shares represents an interest in the same portfolio of investments of the Fund and has identical rights (based on relative net asset values) to assets and liquidation proceeds. Share classes can bear different rates of class-specific fees and expenses, such as transfer agent and distribution fees. Differences in class-specific fees and expenses will result in differences in net investment income and, therefore, the payment of different dividends from net investment income earned by each class. The Amended and Restated Declaration of Trust of the Fund gives the Board of Trustees the flexibility to specify either per-share voting or dollar-weighted voting when submitting matters for shareholder approval. Under per-share voting, each share of a class of the Fund is entitled to one vote. Under dollar-weighted voting, a shareholder’s voting power is determined not by the number of shares owned, but by the dollar value of the shares on the record date. Each share class has exclusive voting rights with respect to matters affecting only that class, including with respect to the distribution plan for that class. There is no distribution plan for Class K or Class Y shares.
Amundi Asset Management US, Inc., an indirect, wholly owned subsidiary of Amundi and Amundi’s wholly owned subsidiary, Amundi USA, Inc., serves as the Fund’s investment adviser (the “Adviser”). Amundi Distributor US, Inc., an affiliate of the Adviser, serves as the Fund’s distributor (the “Distributor”).
The Fund is required to comply with Rule 18f-4 under the 1940 Act, which governs the use of derivatives by registered investment companies. Rule 18f-4 permits funds to enter into derivatives transactions (as defined in Rule 18f-4) and certain other transactions notwithstanding the restrictions on the issuance of “senior securities” under Section 18 of the 1940 Act. Rule 18f-4 requires a fund to establish and maintain a comprehensive derivatives risk management program, appoint a derivatives risk manager and comply with a relative or absolute limit on fund leverage risk calculated based on value-at-risk (“VaR”), unless the Fund uses derivatives in only a limited manner (a "limited derivatives user"). The Fund is currently a limited derivatives user for purposes of Rule 18f-4.
Pioneer Fund | Annual Report | 12/31/2331
The Fund is an investment company and follows investment company accounting and reporting guidance under U.S. Generally Accepted Accounting Principles (“U.S. GAAP”). U.S. GAAP requires the management of the Fund to make estimates and assumptions that affect the reported amounts of assets and liabilities, the disclosure of contingent assets and liabilities at the date of the financial statements, and the reported amounts of income, expenses and gain or loss on investments during the reporting period. Actual results could differ from those estimates.
The following is a summary of significant accounting policies followed by the Fund in the preparation of its financial statements:
| A. | Security Valuation |
| | The net asset value of the Fund is computed once daily, on each day the New York Stock Exchange (“NYSE”) is open, as of the close of regular trading on the NYSE. |
| | Equity securities that have traded on an exchange are valued by using the last sale price on the principal exchange where they are traded. Equity securities that have not traded on the date of valuation, or securities for which sale prices are not available, generally are valued using the mean between the last bid and asked prices or, if both last bid and asked prices are not available, at the last quoted bid price. Last sale and bid and asked prices are provided by independent third party pricing services. In the case of equity securities not traded on an exchange, prices are typically determined by independent third party pricing services using a variety of techniques and methods. |
| | The value of foreign securities is translated into U.S. dollars based on foreign currency exchange rate quotations supplied by a third party pricing source. Trading in non-U.S. equity securities is substantially completed each day at various times prior to the close of the NYSE. The values of such securities used in computing the net asset value of the Fund's shares are determined as of such times. The Adviser may use a fair value model developed by an independent pricing service to value non-U.S. equity securities. |
| | Shares of open-end registered investment companies (including money market mutual funds) are valued at such funds' net asset value. |
| | Securities for which independent pricing services or broker-dealers are unable to supply prices or for which market prices and/or quotations are not readily available or are considered to be unreliable are valued by a fair valuation team comprised of certain personnel of the Adviser. The Adviser is designated as the valuation designee for the Fund pursuant to |
32Pioneer Fund | Annual Report | 12/31/23
| | Rule 2a-5 under the 1940 Act. The Adviser’s fair valuation team is responsible for monitoring developments that may impact fair valued securities. |
| | Inputs used when applying fair value methods to value a security may include credit ratings, the financial condition of the company, current market conditions and comparable securities. The Adviser may use fair value methods if it is determined that a significant event has occurred after the close of the exchange or market on which the security trades and prior to the determination of the Fund's net asset value. Examples of a significant event might include political or economic news, corporate restructurings, natural disasters, terrorist activity or trading halts. Thus, the valuation of the Fund's securities may differ significantly from exchange prices, and such differences could be material. |
| B. | Investment Income and Transactions |
| | Dividend income is recorded on the ex-dividend date, except that certain dividends from foreign securities where the ex-dividend date may have passed are recorded as soon as the Fund becomes aware of the ex-dividend data in the exercise of reasonable diligence. |
| | Interest income, including interest on income-bearing cash accounts, is recorded on the accrual basis. Dividend and interest income are reported net of unrecoverable foreign taxes withheld at the applicable country rates and net of income accrued on defaulted securities. |
| | Interest and dividend income payable by delivery of additional shares is reclassified as PIK (payment-in-kind) income upon receipt and is included in interest and dividend income, respectively. |
| | Security transactions are recorded as of trade date. Gains and losses on sales of investments are calculated on the identified cost method for both financial reporting and federal income tax purposes. |
| C. | Foreign Currency Translation |
| | The books and records of the Fund are maintained in U.S. dollars. Amounts denominated in foreign currencies are translated into U.S. dollars using current exchange rates. |
| | Net realized gains and losses on foreign currency transactions, if any, represent, among other things, the net realized gains and losses on foreign currency exchange contracts, disposition of foreign currencies and the difference between the amount of income accrued and the U.S. dollars actually received. Further, the effects of changes in foreign |
Pioneer Fund | Annual Report | 12/31/2333
| | currency exchange rates on investments are not segregated on the Statement of Operations from the effects of changes in the market prices of those securities, but are included with the net realized and unrealized gain or loss on investments. |
| D. | Federal Income Taxes |
| | It is the Fund's policy to comply with the requirements of the Internal Revenue Code applicable to regulated investment companies and to distribute all of its net taxable income and net realized capital gains, if any, to its shareholders. Therefore, no provision for federal income taxes is required. As of December 31, 2023, the Fund did not accrue any interest or penalties with respect to uncertain tax positions, which, if applicable, would be recorded as an income tax expense on the Statement of Operations. Tax returns filed within the prior three years remain subject to examination by federal and state tax authorities. |
| | The amount and character of income and capital gain distributions to shareholders are determined in accordance with federal income tax rules, which may differ from U.S. GAAP. Distributions in excess of net investment income or net realized gains are temporary over distributions for financial statement purposes resulting from differences in the recognition or classification of income or distributions for financial statement and tax purposes. Capital accounts within the financial statements are adjusted for permanent book/tax differences to reflect tax character, but are not adjusted for temporary differences. |
| | The tax character of distributions paid during the years ended December 31, 2023 and December 31, 2022, was as follows: |
| | 2023 | 2022 |
| Distributions paid from: | | |
| Ordinary income | $ 73,739,692 | $ 63,506,166 |
| Long-term capital gains | 154,901,196 | 204,734,675 |
| Total | $ 228,640,888 | $ 268,240,841 |
The following shows the components of distributable earnings (losses) on a federal income tax basis at December 31, 2023:
| | 2023 |
| Distributable earnings/(losses): | |
| Undistributed ordinary income | $ 18,655,194 |
| Undistributed long-term capital gains | 18,997,498 |
| Net unrealized appreciation | 2,541,580,834 |
| Total | $2,579,233,526 |
34Pioneer Fund | Annual Report | 12/31/23
The difference between book-basis and tax-basis net unrealized appreciation is attributable to the tax deferral of losses on wash sales.
As of the date of this report, a significant portion of the Fund’s net asset value is attributable to net unrealized capital gains on portfolio securities. If the Fund realizes capital gains in excess of realized capital losses in any fiscal year, it makes capital gain distributions to shareholders. You may receive distributions that are attributable to appreciation that was present in the Fund’s portfolio securities at the time you made your investment but had not been realized at that time, or that are attributable to capital gains or other income that, although realized by the Fund, had not yet been distributed at the time you made your investment. Unless you purchase shares through a tax-advantaged account, these distributions will be taxable to you even though they economically represent a return of a portion of your investment. You may want to avoid buying shares when the Fund is about to declare a dividend or capital gain distribution. You should consult your tax adviser before buying shares no matter when you are investing.
| E. | Fund Shares |
| | The Fund records sales and repurchases of its shares as of trade date. The Distributor earned $247,545 in underwriting commissions on the sale of Class A shares during the year ended December 31, 2023. |
| F. | Class Allocations |
| | Income, common expenses and realized and unrealized gains and losses are calculated at the Fund level and allocated daily to each class of shares based on its respective percentage of adjusted net assets at the beginning of the day. |
| | Distribution fees are calculated based on the average daily net asset value attributable to Class A, Class C and Class R shares of the Fund, respectively (see Note 5). Class K and Class Y shares do not pay distribution fees. All expenses and fees paid to the Fund's transfer agent for its services are allocated among the classes of shares based on the number of accounts in each class and the ratable allocation of related out-of-pocket expenses (see Note 4). |
| | Distributions to shareholders are recorded as of the ex-dividend date. Distributions paid by the Fund with respect to each class of shares are calculated in the same manner and at the same time, except that net investment income dividends to Class A, Class C, Class K, Class R and Class Y shares can reflect different transfer agent and distribution expense rates. |
Pioneer Fund | Annual Report | 12/31/2335
| G. | Risks |
| | The value of securities held by the Fund may go up or down, sometimes rapidly or unpredictably, due to general market conditions, such as real or perceived adverse economic, political or regulatory conditions, recessions, the spread of infectious illness or other public health issues, inflation, changes in interest rates, armed conflict such as between Russia and Ukraine or in the Middle East, sanctions against Russia, other nations or individuals or companies and possible countermeasures, lack of liquidity in the bond markets or adverse investor sentiment. In the past several years, financial markets have experienced increased volatility, depressed valuations, decreased liquidity and heightened uncertainty. These conditions may continue, recur, worsen or spread. Inflation and interest rates have increased and may rise further. These circumstances could adversely affect the value and liquidity of the Fund's investments and negatively impact the Fund's performance. |
| | The long-term impact of the COVID-19 pandemic and its subsequent variants on economies, markets, industries and individual issuers, are not known. Some sectors of the economy and individual issuers have experienced or may experience particularly large losses. Periods of extreme volatility in the financial markets, reduced liquidity of many instruments, increased government debt, inflation, and disruptions to supply chains, consumer demand and employee availability, may continue for some time. Following Russia's invasion of Ukraine, Russian securities lost all, or nearly all, their market value. Other securities or markets could be similarly affected by past or future political, geopolitical or other events or conditions. |
| | Governments and central banks, including the U.S. Federal Reserve, have taken extraordinary and unprecedented actions to support local and global economies and the financial markets. These actions have resulted in significant expansion of public debt, including in the U.S. The consequences of high public debt, including its future impact on the economy and securities markets, may not be known for some time. |
| | The U.S. and other countries are periodically involved in disputes over trade and other matters, which may result in tariffs, investment restrictions and adverse impacts on affected companies and securities. For example, the U.S. has imposed tariffs and other trade barriers on Chinese exports, has restricted sales of certain categories of goods to China, and has established barriers to investments in China. Trade disputes may adversely affect the economies of the U.S. and its trading partners, as well as companies directly or indirectly affected and financial markets generally. If the political climate between the U.S. and |
36Pioneer Fund | Annual Report | 12/31/23
| | China does not improve or continues to deteriorate, if China were to attempt unification of Taiwan by force, or if other geopolitical conflicts develop or get worse, economies, markets and individual securities may be severely affected both regionally and globally, and the value of the Fund's assets may go down. |
| | At times, the Fund’s investments may represent industries or industry sectors that are interrelated or have common risks, making the Fund more susceptible to any economic, political, or regulatory developments or other risks affecting those industries and sectors. |
| | The Fund primarily invests in equity securities of U.S. issuers. |
| | The Adviser considers ESG factors in making investment decisions. Excluding specific issuers limits the universe of investments available to the Fund as compared with other funds that do not consider ESG factors, which may mean forgoing some investment opportunities available to funds that do not consider ESG factors. Accordingly, the Fund may underperform other funds that do not utilize an investment strategy that considers ESG factors. However, the strategy of seeking to identify companies with sustainable business models is believed to provide potential return and risk benefits, including the selection of issuers with fewer ESG-related risks. In considering ESG factors, the Adviser may use third party ESG ratings information that it believes to be reliable, but such information may not be accurate or complete, or may be biased. |
| | The Fund’s investments in foreign markets and countries with limited developing markets may subject the Fund to a greater degree of risk than investments in a developed market. These risks include disruptive political or economic conditions, military conflicts and sanctions, terrorism, sustained economic downturns, financial instability, less liquid trading markets, extreme price volatility, currency risks, reduction of government or central bank support, inadequate accounting standards, tariffs, tax disputes or other tax burdens, nationalization or expropriation of assets, and the imposition of adverse governmental laws, arbitrary application of laws and regulations or lack of rule of law and investment and repatriation restrictions. Lack of information and less market regulation also may affect the value of these securities. Withholding and other non-U.S. taxes may decrease the Fund’s return. Non-U.S. issuers may be located in parts of the world that have historically been prone to natural disasters. Investing in depositary receipts is subject to many of the same risks as investing directly in non-U.S. issuers. Depositary receipts may involve higher expenses and may trade at a discount (or premium) to the underlying security. |
Pioneer Fund | Annual Report | 12/31/2337
| | Russia launched a large-scale invasion of Ukraine on February 24, 2022. In response to the military action by Russia, various countries, including the U.S., the United Kingdom, and European Union issued broad-ranging economic sanctions against Russia and Belarus and certain companies and individuals. Since then, Russian securities have lost all, or nearly all, their market value, and many other issuers, securities and markets have been adversely affected. The United States and other countries may impose sanctions on other countries, companies and individuals in light of Russia’s military invasion. The extent and duration of the military action or future escalation of such hostilities, the extent and impact of existing and future sanctions, market disruptions and volatility, and the result of any diplomatic negotiations cannot be predicted. These and any related events could have a significant impact on the value and liquidity of certain Fund investments, on Fund performance and the value of an investment in the Fund, particularly with respect to securities and commodities, such as oil, natural gas and food commodities, as well as other sectors with exposure to Russian issuers or issuers in other countries affected by the invasion, and are likely to have collateral impacts on market sectors globally. |
| | The Fund may invest in REIT securities, the value of which can fall for a variety of reasons, such as declines in rental income, fluctuating interest rates, poor property management, environmental liabilities, uninsured damage, increased competition, or changes in real estate tax laws. |
| | With the increased use of technologies such as the Internet to conduct business, the Fund is susceptible to operational, information security and related risks. While the Fund’s Adviser has established business continuity plans in the event of, and risk management systems to prevent, limit or mitigate, such cyber-attacks, there are inherent limitations in such plans and systems, including the possibility that certain risks have not been identified. Furthermore, the Fund cannot control the cybersecurity plans and systems put in place by service providers to the Fund such as the Fund's custodian and accounting agent, and the Fund’s transfer agent. In addition, many beneficial owners of Fund shares hold them through accounts at broker-dealers, retirement platforms and other financial market participants over which neither the Fund nor the Adviser exercises control. Each of these may in turn rely on service providers to them, which are also subject to the risk of cyber-attacks. Cybersecurity failures or breaches at the Adviser or the Fund’s service providers or intermediaries have the ability to cause disruptions and impact business operations, potentially resulting in financial losses, interference with the Fund’s ability to calculate its net asset value, impediments to trading, the inability of Fund shareholders |
38Pioneer Fund | Annual Report | 12/31/23
| | to effect share purchases, redemptions or exchanges or receive distributions, loss of or unauthorized access to private shareholder information and violations of applicable privacy and other laws, regulatory fines, penalties, reputational damage, or additional compliance costs. Such costs and losses may not be covered under any insurance. In addition, maintaining vigilance against cyber-attacks may involve substantial costs over time, and system enhancements may themselves be subject to cyber-attacks. |
| | The Fund’s prospectus contains unaudited information regarding the Fund’s principal risks. Please refer to that document when considering the Fund’s principal risks. |
2. Management Agreement
The Adviser manages the Fund’s portfolio. Management fees payable under the Fund’s Investment Management Agreement with the Adviser are calculated daily and paid monthly at the annual rate of 0.60% of the Fund’s average daily net assets up to $7.5 billion, 0.575% on the next $2.5 billion of the Fund’s average daily net assets, and 0.55% on the excess over $10 billion of the Fund’s average daily net assets. The basic fee can increase or decrease by a maximum of 0.10% based on the investment performance of the Fund’s Class A shares as compared to the Standard and Poor’s 500 Index. The performance comparison is made for a rolling 36-month period. In addition, the Adviser, contractually limits any positive adjustment of the Fund’s management fee to 0.10% of the Fund’s average daily net assets on an annual basis (i.e., to a maximum annual fee of 0.70% after the performance adjustment). For the year ended December 31, 2023, the aggregate performance adjustment resulted in a decrease to the basic fee of $(2,548,407). For the year ended December 31, 2023, the net management fee (excluding waivers and/or assumption of expenses) was equivalent to 0.56% of the Fund’s average daily net assets.
The Adviser has contractually agreed to limit ordinary operating expenses (ordinary operating expenses means all fund expenses other than taxes, brokerage commissions, acquired fund fees and expenses, and extraordinary expenses, such as litigation) to the extent required to reduce fund expenses to 0.61% and 0.61% of the average daily net assets attributable to Class K shares and Class Y shares, respectively. These expense limitations are in effect through May 1, 2024. There can be no assurance that the Adviser will extend the expense limitation agreement for a class of shares beyond the date referred to above. Fees waived and expenses reimbursed during the year ended December 31, 2023 are reflected on the Statement of Operations.
Pioneer Fund | Annual Report | 12/31/2339
In addition, under the management and administration agreements, certain other services and costs, including accounting, regulatory reporting and insurance premiums, are paid by the Fund as administrative reimbursements. Reflected on the Statement of Assets and Liabilities is $840,451 in management fees payable to the Adviser at December 31, 2023.
3. Compensation of Officers and Trustees
The Fund pays an annual fee to its Trustees. The Adviser reimburses the Fund for fees paid to the Interested Trustees. Except for the chief compliance officer, the Fund does not pay any salary or other compensation to its officers. The Fund pays a portion of the chief compliance officer's compensation for their services as the Fund's chief compliance officer. Amundi US pays the remaining portion of the chief compliance officer's compensation. For the year ended December 31, 2023, the Fund paid $464,515 in Officers' and Trustees’ compensation, which is reflected on the Statement of Operations as Officers' and Trustees’ fees. At December 31, 2023, on its Statement of Assets and Liabilities, the Fund had a payable for Trustees’ fees of $340,636 and a payable for administrative expenses of $290,289, which includes the payable for Officers' compensation.
4. Transfer Agent
BNY Mellon Investment Servicing (US) Inc. serves as the transfer agent to the Fund at negotiated rates. Transfer agent fees and payables shown on the Statement of Operations and the Statement of Assets and Liabilities, respectively, include sub-transfer agent expenses incurred through the Fund’s omnibus relationship contracts.
In addition, the Fund reimbursed the transfer agent for out-of-pocket expenses incurred by the transfer agent related to shareholder communications activities such as proxy and statement mailings, and outgoing phone calls. For the year ended December 31, 2023, such out-of-pocket expenses by class of shares were as follows:
| Shareholder Communications: | |
| Class A | $572,856 |
| Class C | 8,855 |
| Class K | 2,827 |
| Class R | 3,342 |
| Class Y | 54,878 |
| Total | $642,758 |
5. Distribution and Service Plans
The Fund has adopted a distribution plan (the “Plan”) pursuant to Rule 12b-1 under the 1940 Act with respect to its Class A, Class C and Class R shares. Pursuant to the Plan, the Fund pays the Distributor 0.25%
40Pioneer Fund | Annual Report | 12/31/23
of the Fund's average daily net assets attributable to Class A shares as compensation for personal services and/or account maintenance services or distribution services with regard to Class A shares. Pursuant to the Plan, the Fund also pays the Distributor 1.00% of the average daily net assets attributable to Class C shares. The fee for Class C shares consists of a 0.25% service fee and a 0.75% distribution fee paid as compensation for personal services and/or account maintenance services or distribution services with regard to Class C shares. Pursuant to the Plan, the Fund further pays the Distributor 0.50% of the average daily net assets attributable to Class R shares for distribution services. Reflected on the Statement of Assets and Liabilities is $237,306 in distribution fees payable to the Distributor at December 31, 2023.
The Fund also has adopted a separate service plan for Class R shares (the “Service Plan”). The Service Plan authorizes the Fund to pay securities dealers, plan administrators or other service organizations that agree to provide certain services to retirement plans or plan participants holding shares of the Fund a service fee of up to 0.25% of the Fund’s average daily net assets attributable to Class R shares held by such plans.
In addition, redemptions of Class A and Class C shares may be subject to a contingent deferred sales charge (“CDSC”). A CDSC of 1.00% may be imposed on redemptions of certain net asset value purchases of Class A shares within 12 months of purchase. Redemptions of Class C shares within 12 months of purchase are subject to a CDSC of 1.00% based on the lower of cost or market value of shares being redeemed. Shares purchased as part of an exchange remain subject to any CDSC that applied to the original purchase of those shares. There is no CDSC for Class K, Class R or Class Y shares. Proceeds from the CDSCs are paid to the Distributor. For the year ended December 31, 2023, CDSCs in the amount of $11,763 were paid to the Distributor.
6. Line of Credit Facility
The Fund, along with certain other funds in the Pioneer Family of Funds, participates in a committed, unsecured revolving line of credit (“credit facility”). Borrowings are used solely for temporary or emergency purposes. The Fund may borrow up to the lesser of the amount available under the credit facility or the limits set for borrowing by the Fund’s prospectus and the 1940 Act. During the fiscal year ended December 31, 2023, the Fund participated in a credit facility in the amount of $380 million. Under such credit facility, depending on the type of loan, interest on borrowings was payable at the Secured Overnight Financing Rate ("SOFR") plus a credit spread. The Fund also paid both an upfront fee and an annual commitment fee to participate in the credit facility. The upfront fee in the amount of
Pioneer Fund | Annual Report | 12/31/2341
0.15% of the total credit facility and the commitment fee in the amount of 0.30% of the daily unused portion of each lender's commitment were allocated among participating funds based on an allocation schedule set forth in the credit facility. For the year ended December 31, 2023, the Fund had no borrowings under the credit facility.
42Pioneer Fund | Annual Report | 12/31/23
Report of Independent Registered Public Accounting Firm
To the Board of Trustees and the Shareholders of Pioneer Fund:
Opinion on the Financial Statements
We have audited the accompanying statement of assets and liabilities of Pioneer Fund (the “Fund”), including the schedule of investments, as of December 31, 2023, and the related statement of operations for the year then ended, the statements of changes in net assets for each of the two years in the period then ended, the financial highlights for each of the five years in the period then ended and the related notes (collectively referred to as the “financial statements”). In our opinion, the financial statements present fairly, in all material respects, the financial position of the Fund at December 31, 2023, the results of its operations for the year then ended, the changes in its net assets for each of the two years in the period then ended, and its financial highlights for each of the five years in the period then ended in conformity with U.S. generally accepted accounting principles.
Basis for Opinion
These financial statements are the responsibility of the Fund’s management. Our responsibility is to express an opinion on the Fund’s financial statements based on our audits. We are a public accounting firm registered with the Public Company Accounting Oversight Board (United States) ("PCAOB") and are required to be independent with respect to the Fund in accordance with the U.S. federal securities laws and the applicable rules and regulations of the Securities and Exchange Commission and the PCAOB.
We conducted our audits in accordance with the standards of the PCAOB. Those standards require that we plan and perform the audit to obtain reasonable assurance about whether the financial statements are free of material misstatement, whether due to error or fraud. The Fund is not required to have, nor were we engaged to perform, an audit of the Fund’s internal control over financial reporting. As part of our audits, we are required to obtain an understanding of internal control over financial reporting, but not for the purpose of expressing an opinion on the effectiveness of the Fund’s internal control over financial reporting. Accordingly, we express no such opinion.
Our audits included performing procedures to assess the risks of material misstatement of the financial statements, whether due to error or fraud, and performing procedures that respond to those risks. Such procedures
Pioneer Fund | Annual Report | 12/31/2343
included examining, on a test basis, evidence regarding the amounts and disclosures in the financial statements. Our procedures included confirmation of securities owned as of December 31, 2023, by correspondence with the custodian, brokers, and others; when replies were not received from brokers and others, we performed other auditing procedures. Our audits also included evaluating the accounting principles used and significant estimates made by management, as well as evaluating the overall presentation of the financial statements. We believe that our audits provide a reasonable basis for our opinion.
We have served as the auditor of one or more investment companies in the Pioneer family of funds since 2017.
Boston, Massachusetts
February 28, 2024
44Pioneer Fund | Annual Report | 12/31/23
Additional Information (unaudited)
For the year ended December 31, 2023, certain dividends paid by the Fund may be subject to a maximum tax rate of 20%, as provided for by the Jobs and Growth Tax Relief Reconciliation Act (the Act) of 2003. The Fund intends to designate up to the maximum amount of such dividends allowable under the Act, as taxed at a maximum rate of 20%. Complete information will be computed and reported in conjunction with your 2023 Form 1099-DIV.
The Fund designated $173,898,694 as long-term capital gains distributions during the year ended December 31, 2023. Distributable long-term gains are based on net realized long-term gains determined on a tax basis and may differ from such amounts for financial reporting purposes.
The qualifying percentage of the Fund’s ordinary income dividends for the purpose of the corporate dividends received deduction was 100.00%.
Pioneer Fund | Annual Report | 12/31/2345
Approval of Renewal of Investment Management Agreement
Amundi Asset Management US, Inc. (“Amundi US”) serves as the investment adviser to Pioneer Fund (the “Fund”) pursuant to an investment management agreement between Amundi US and the Fund. In order for Amundi US to remain the investment adviser of the Fund, the Trustees of the Fund, including a majority of the Fund’s Independent Trustees, must determine annually whether to renew the investment management agreement for the Fund.
The contract review process began in January 2023 as the Trustees of the Fund agreed on, among other things, an overall approach and timeline for the process. Contract review materials were provided to the Trustees in March 2023, July 2023 and September 2023. In addition, the Trustees reviewed and discussed the Fund’s performance at regularly scheduled meetings throughout the year, and took into account other information related to the Fund provided to the Trustees at regularly scheduled meetings, in connection with the review of the Fund’s investment management agreement.
In March 2023, the Trustees, among other things, discussed the memorandum provided by Fund counsel that summarized the legal standards and other considerations that are relevant to the Trustees in their deliberations regarding the renewal of the investment management agreement, and reviewed and discussed the qualifications of the investment management teams for the Fund, as well as the level of investment by the Fund’s portfolio managers in the Fund. In July 2023, the Trustees, among other things, reviewed the Fund’s management fees and total expense ratios, the financial statements of Amundi US and its parent companies, profitability analyses provided by Amundi US, and analyses from Amundi US as to possible economies of scale. The Trustees also reviewed the profitability of the institutional business of Amundi US as compared to that of Amundi US’s fund management business, and considered the differences between the fees and expenses of the Fund and the fees and expenses of Amundi US’s institutional accounts, as well as the different services provided by Amundi US to the Fund and to the institutional accounts. The Trustees further considered contract review materials, including additional materials received in response to the Trustees’ request, in September 2023.
At a meeting held on September 19, 2023, based on their evaluation of the information provided by Amundi US and third parties, the Trustees of the Fund, including the Independent Trustees voting separately advised by independent counsel, unanimously approved the renewal of the investment
46Pioneer Fund | Annual Report | 12/31/23
management agreement for another year. In approving the renewal of the investment management agreement, the Trustees considered various factors that they determined were relevant, including the factors described below. The Trustees did not identify any single factor as the controlling factor in determining to approve the renewal of the agreement.
Nature, Extent and Quality of Services
The Trustees considered the nature, extent and quality of the services that had been provided by Amundi US to the Fund, taking into account the investment objective and strategy of the Fund. The Trustees also reviewed Amundi US’s investment approach for the Fund and its research process. The Trustees considered Amundi US’ integration of environmental, social and governance (ESG) considerations into its investment research process. The Trustees considered the resources of Amundi US and the personnel of Amundi US who provide investment management services to the Fund. They also reviewed the amount of non-Fund assets managed by the portfolio managers of the Fund. They considered the non-investment resources and personnel of Amundi US that are involved in Amundi US’s services to the Fund, including Amundi US’s compliance, risk management, and legal resources and personnel. The Trustees considered the compliance services being provided to the Fund by Amundi US and how Amundi US has addressed any compliance issues during the past year. The Trustees noted the substantial attention and high priority given by Amundi US’s senior management to the Pioneer Fund complex, including with respect to the increasing regulation to which the Pioneer Funds are subject.
The Trustees considered that Amundi US supervises and monitors the performance of the Fund’s service providers and provides the Fund with personnel (including Fund officers) and other resources that are necessary for the Fund’s business management and operations. The Trustees also considered that, as administrator, Amundi US is responsible for the administration of the Fund’s business and other affairs. The Trustees considered that the Fund reimburses Amundi US its pro rata share of Amundi US’s costs of providing administration services to the Pioneer Funds.
Based on these considerations, the Trustees concluded that the nature, extent and quality of services that had been provided by Amundi US to the Fund were satisfactory and consistent with the terms of the investment management agreement.
Performance of the Fund
In considering the Fund’s performance, the Trustees regularly review and discuss throughout the year data prepared by Amundi US and information
Pioneer Fund | Annual Report | 12/31/2347
comparing the Fund’s performance with the performance of its peer group of funds, as classified by Morningstar, Inc. (Morningstar), and with the performance of the Fund’s benchmark index. They also discuss the Fund’s performance with Amundi US on a regular basis. The Trustees’ regular reviews and discussions were factored into the Trustees’ deliberations concerning the renewal of the investment management agreement.
Management Fee and Expenses
The Trustees considered information showing the fees and expenses of the Fund in comparison to the management fees of its peer group of funds as classified by Morningstar and also to the expense ratios of a peer group of funds selected on the basis of criteria determined by the Independent Trustees for this purpose using data provided by Strategic Insight Mutual Fund Research and Consulting, LLC (Strategic Insight), an independent third party. The peer group comparisons referred to below are organized in quintiles. Each quintile represents one-fifth of the peer group. In all peer group comparisons referred to below, first quintile is most favorable to the Fund’s shareowners. The Trustees noted that they separately review and consider the impact of the Fund’s transfer agency and Fund- and Amundi US-paid expenses for sub-transfer agency and intermediary arrangements, and that the results of the most recent such review were considered in the consideration of the Fund’s expense ratio.
The Trustees considered that the Fund’s management fee for the most recent fiscal year was in the third quintile relative to the management fees paid by other funds in its Morningstar category for the comparable period. The Trustees considered the breakpoints in the management fee schedule and the reduced fee rates above certain asset levels. The Trustees also noted the impact of the Fund’s performance on the management fee paid by the Fund. The Trustees considered that the expense ratio of the Fund’s Class Y shares for the most recent fiscal year was in the second quintile relative to its Strategic Insight peer group for the comparable period. The Trustees considered that the expense ratio of the Fund’s Class A shares for the most recent fiscal year was in the second quintile relative to its Strategic Insight peer group for the comparable period. The Trustees noted that Amundi US had agreed to waive fees and/or reimburse expenses in order to limit the ordinary operating expenses of the Fund. The Trustees considered an increase to the expense limit for each of the Fund’s Class K shares and Class Y shares that would be effective May 1, 2024.
The Trustees reviewed management fees charged by Amundi US to institutional and other clients, including publicly offered European funds sponsored by Amundi US’s affiliates, unaffiliated U.S. registered investment companies (in a sub-advisory capacity), and unaffiliated foreign
48Pioneer Fund | Annual Report | 12/31/23
and domestic separate accounts. The Trustees also considered Amundi US’s costs in providing services to the Fund and Amundi US’s costs in providing services to the other clients and considered the differences in management fees and profit margins for fund and non-fund services. In evaluating the fees associated with Amundi US’s client accounts, the Trustees took into account the respective demands, resources and complexity associated with the Fund and other client accounts. The Trustees noted that, in some instances, the fee rates for those clients were lower than the management fee for the Fund and considered that, under the investment management and administration agreements with the Fund, Amundi US performs additional services for the Fund that it does not provide to those other clients or services that are broader in scope, including oversight of the Fund’s other service providers and activities related to compliance and the extensive regulatory and tax regimes to which the Fund is subject. The Trustees also considered the entrepreneurial risks associated with Amundi US’s management of the Fund.
The Trustees concluded that the management fee payable by the Fund to Amundi US was reasonable in relation to the nature and quality of the services provided by Amundi US.
Profitability
The Trustees considered information provided by Amundi US regarding the profitability of Amundi US with respect to the advisory services provided by Amundi US to the Fund, including the methodology used by Amundi US in allocating certain of its costs to the management of the Fund. The Trustees also considered Amundi US’s profit margin in connection with the overall operation of the Fund. They further reviewed the financial results, including the profit margins, realized by Amundi US from non-fund businesses. The Trustees considered Amundi US’s profit margins in comparison to the limited industry data available and noted that the profitability of any adviser was affected by numerous factors, including its organizational structure and method for allocating expenses. The Trustees concluded that Amundi US’s profitability with respect to the management of the Fund was not unreasonable.
Economies of Scale
The Trustees considered Amundi US’s views relating to economies of scale in connection with the Pioneer Funds as fund assets grow and the extent to which any such economies of scale are shared with the Fund and Fund shareholders. The Trustees noted the breakpoints in the management fee schedule. The Trustees recognize that economies of scale are difficult to identify and quantify, and that, among other factors that may be relevant, are the following: fee levels, expense subsidization, investment by Amundi
Pioneer Fund | Annual Report | 12/31/2349
US in research and analytical capabilities and Amundi US’s commitment and resource allocation to the Fund. The Trustees noted that profitability also may be an indicator of the availability of any economies of scale, although profitability may vary for other reasons including due to reductions in expenses. The Trustees concluded that economies of scale, if any, were being appropriately shared with the Fund.
Other Benefits
The Trustees considered the other benefits that Amundi US enjoys from its relationship with the Fund. The Trustees considered the character and amount of fees paid or to be paid by the Fund, other than under the investment management agreement, for services provided by Amundi US and its affiliates. The Trustees further considered the revenues and profitability of Amundi US’s businesses other than the Fund business. To the extent applicable, the Trustees also considered the benefits to the Fund and to Amundi US and its affiliates from the use of “soft” commission dollars generated by the Fund to pay for research and brokerage services.
The Trustees considered that Amundi US is the principal U.S. asset management business of Amundi, which is one of the largest asset managers globally. Amundi’s worldwide asset management business manages over $2.1 trillion in assets (including the Pioneer Funds). The Trustees considered that Amundi US’s relationship with Amundi creates potential opportunities for Amundi US and Amundi that derive from Amundi US’s relationships with the Fund, including Amundi’s ability to market the services of Amundi US globally. The Trustees noted that Amundi US has access to additional research and portfolio management capabilities as a result of its relationship with Amundi and Amundi’s enhanced global presence that may contribute to an increase in the resources available to Amundi US. The Trustees considered that Amundi US and the Fund receive reciprocal intangible benefits from the relationship, including mutual brand recognition and, for the Fund, direct and indirect access to the resources of a large global asset manager. The Trustees concluded that any such benefits received by Amundi US as a result of its relationship with the Fund were reasonable.
Conclusion
After consideration of the factors described above as well as other factors, the Trustees, including the Independent Trustees, concluded that the investment management agreement for the Fund, including the fees payable thereunder, was fair and reasonable and voted to approve the proposed renewal of the investment management agreement.
50Pioneer Fund | Annual Report | 12/31/23
Trustees, Officers and Service Providers
Investment Adviser and Administrator
Amundi Asset Management US, Inc.
Custodian and Sub-Administrator
The Bank of New York Mellon Corporation
Independent Registered Public Accounting Firm
Ernst & Young LLP
Principal Underwriter
Amundi Distributor US, Inc.
Legal Counsel
Morgan, Lewis & Bockius LLP
Transfer Agent
BNY Mellon Investment Servicing (US) Inc.
Proxy Voting Policies and Procedures of the Fund are available without charge, upon request, by calling our toll free number (1-800-225-6292). Information regarding how the Fund voted proxies relating to portfolio securities during the most recent 12-month period ended June 30 is publicly available to shareholders at www.amundi.com/us. This information is also available on the Securities and Exchange Commission’s web site at www.sec.gov.
Trustees and Officers
The Fund's Trustees and officers are listed below, together with their principal occupations and other directorships they have held during at least the past five years. Trustees who are interested persons of the Fund within the meaning of the 1940 Act are referred to as Interested Trustees. Trustees who are not interested persons of the Fund are referred to as Independent Trustees. Each of the Trustees serves as a Trustee of each of the 47 U.S. registered investment portfolios for which Amundi US serves as investment adviser (the “Pioneer Funds”). The address for all Trustees and all officers of the Fund is 60 State Street, Boston, Massachusetts 02109.
The Statement of Additional Information of the Fund includes additional information about the Directors and is available, without charge, upon request, by calling 1-800-225-6292.
Pioneer Fund | Annual Report | 12/31/2351
Name, Age and Position
Held With the Trust | Term of Office and
Length of Service | Principal Occupation(s) During At Least The Past Five Years | Other Directorships Held by Trustee
During At Least The Past Five Years |
Thomas J. Perna (73)
Chairman of the Board
and Trustee | Trustee since 2006.
Serves until a successor
trustee is elected or
earlier retirement
or removal. | Private investor (2004 – 2008 and 2013 – present); Chairman (2008 – 2013) and Chief Executive Officer (2008 – 2012), Quadriserv, Inc. (technology products for securities lending industry); and Senior Executive Vice President, The Bank of New York (financial and securities services) (1986 – 2004) | Director, Broadridge Financial
Solutions, Inc. (investor
communications and securities
processing provider for financial
services industry) (2009 – present);
Director, Quadriserv, Inc. (2005 –
2013); and Commissioner, New
Jersey State Civil Service
Commission (2011 – 2015) |
John E. Baumgardner,
Jr. (72)*
Trustee | Trustee since 2019.
Serves until a successor
trustee is elected or
earlier retirement
or removal. | Of Counsel (2019 – present), Partner (1983-2018), Sullivan & Cromwell LLP (law firm). | Chairman, The Lakeville Journal
Company, LLC, (privately-held
community newspaper group)
(2015-present) |
Diane Durnin (66)
Trustee | Trustee since 2019.
Serves until a successor
trustee is elected or
earlier retirement
or removal. | Managing Director - Head of Product Strategy and Development, BNY Mellon Investment Management (investment management firm) (2012-2018); Vice Chairman – The Dreyfus Corporation (2005 – 2018): Executive Vice President Head of Product, BNY Mellon Investment Management (2007-2012); Executive Director- Product Strategy, Mellon Asset Management (2005-2007); Executive Vice President Head of Products, Marketing and Client Service, Dreyfus Corporation (investment management firm) (2000-2005); Senior Vice President Strategic Product and Business Development, Dreyfus Corporation (1994-2000) | None |
52Pioneer Fund | Annual Report | 12/31/23
Name, Age and Position
Held With the Trust | Term of Office and
Length of Service | Principal Occupation(s) During At Least The Past Five Years | Other Directorships Held by Trustee
During At Least The Past Five Years |
Benjamin M. Friedman (79)
Trustee | Trustee since 2008.
Serves until a successor
trustee is elected or
earlier retirement
or removal. | William Joseph Maier Professor of Political Economy, Harvard University (1972 – present) | Trustee, Mellon Institutional Funds
Investment Trust and Mellon
Institutional Funds Master Portfolio
(oversaw 17 portfolios in fund
complex) (1989 - 2008) |
Craig C. MacKay (60)
Trustee | Trustee since 2021.
Serves until a successor
trustee is elected or
earlier retirement
or removal. | Partner, England & Company, LLC (advisory firm) (2012 – present); Group Head – Leveraged Finance Distribution, Oppenheimer & Company (investment bank) (2006 – 2012); Group Head – Private Finance & High Yield Capital Markets Origination, SunTrust Robinson Humphrey (investment bank) (2003 – 2006); and Founder and Chief Executive Officer, HNY Associates, LLC (investment bank) (1996 – 2003) | Director, Equitable Holdings, Inc. (financial
services holding company) (2022 – present);
Board Member of Carver Bancorp, Inc. (holding
company) and Carver Federal Savings Bank,
NA (2017 – present); Advisory Council Member,
MasterShares ETF (2016 – 2017); Advisory
Council Member, The Deal (financial market
information publisher) (2015 – 2016); Board
Co-Chairman and Chief Executive Officer, Danis
Transportation Company (privately-owned
commercial carrier) (2000 – 2003); Board
Member and Chief Financial Officer, Customer
Access Resources (privately-owned
teleservices company) (1998 – 2000); Board
Member, Federation of Protestant Welfare
Agencies (human services agency) (1993 –
present); and Board Treasurer, Harlem Dowling
Westside Center (foster care agency)
(1999 – 2018) |
Pioneer Fund | Annual Report | 12/31/2353
Independent Trustees (continued)
Name, Age and Position
Held With the Trust | Term of Office and
Length of Service | Principal Occupation(s) During At Least The Past Five Years | Other Directorships Held by Trustee
During At Least The Past Five Years |
Lorraine H. Monchak (67)
Trustee | Trustee since 2017.
(Advisory Trustee from
2014 - 2017). Serves
until a successor trustee
is elected or earlier
retirement or removal. | Chief Investment Officer, 1199 SEIU Funds (healthcare workers union pension funds) (2001 – present); Vice President – International Investments Group, American International Group, Inc. (insurance company) (1993 – 2001); Vice President Corporate Finance and Treasury Group, Citibank, N.A. (1980 – 1986 and 1990 – 1993); Vice President – Asset/Liability Management Group, Federal Farm Funding Corporation (government-sponsored issuer of debt securities) (1988 – 1990); Mortgage Strategies Group, Shearson Lehman Hutton, Inc. (investment bank) (1987 – 1988); Mortgage Strategies Group, Drexel Burnham Lambert, Ltd. (investment bank) (1986 – 1987) | None |
Marguerite A. Piret (75)**
Trustee | Trustee since 1982.
Serves until a successor
trustee is elected or
earlier retirement
or removal. | Chief Financial Officer, American Ag Energy, Inc. (technology for the environment, energy and agriculture) (2019 – present); Chief Operating Officer, North Country Growers LLC (controlled environment agriculture company) (2020 – present); Chief Executive Officer, Green Heat LLC (biofuels company) (2022 – present); President and Chief Executive Officer, Newbury Piret Company (investment banking firm) (1981 – 2019) | Director of New America High
Income Fund, Inc. (closed-end
investment company) (2004 –
present); and Member, Board of
Governors, Investment Company
Institute (2000 – 2006) |
54Pioneer Fund | Annual Report | 12/31/23
Name, Age and Position
Held With the Trust | Term of Office and
Length of Service | Principal Occupation(s) During At Least The Past Five Years | Other Directorships Held by Trustee
During At Least The Past Five Years |
Fred J. Ricciardi (76)
Trustee | Trustee since 2014.
Serves until a successor
trustee is elected or
earlier retirement
or removal. | Private investor (2020 – present); Consultant (investment company services) (2012 – 2020); Executive Vice President, BNY Mellon (financial and investment company services) (1969 – 2012); Director, BNY International Financing Corp. (financial services) (2002 – 2012); Director, Mellon Overseas Investment Corp. (financial services) (2009 – 2012); Director, Financial Models (technology) (2005-2007); Director, BNY Hamilton Funds, Ireland (offshore investment companies) (2004-2007); Chairman/Director, AIB/BNY Securities Services, Ltd., Ireland (financial services) (1999-2006); Chairman, BNY Alternative Investment Services, Inc. (financial services) (2005-2007) | None |
| * Mr. Baumgardner is Of Counsel to Sullivan & Cromwell LLP, which acts as counsel to the Independent Trustees of each Pioneer Fund. |
| ** Ms. Piret became a non-voting Advisory Trustee of the Pioneer Funds effective January 22, 2024. | |
Pioneer Fund | Annual Report | 12/31/2355
Name, Age and Position
Held With the Trust | Term of Office and
Length of Service | Principal Occupation(s) During At Least The Past Five Years | Other Directorships Held by Trustee
During At Least The Past Five Years |
Lisa M. Jones (61)***
Trustee, President and Chief
Executive Officer | Trustee since 2017. Serves
until a successor trustee is
elected or earlier retirement
or removal | Director, CEO and President of Amundi US, Inc. (investment management firm) (since September 2014); Director, CEO and President of Amundi Asset Management US, Inc. (since September 2014); Director, CEO and President of Amundi Distributor US, Inc. (since September 2014); Director, CEO and President of Amundi Asset Management US, Inc. (since September 2014); Chair, Amundi US, Inc., Amundi Distributor US, Inc. and Amundi Asset Management US, Inc. (September 2014 – 2018); Managing Director, Morgan Stanley Investment Management (investment management firm) (2010 – 2013); Director of Institutional Business, CEO of International, Eaton Vance Management (investment management firm) (2005 – 2010); Director of Amundi Holdings US, Inc. (since 2017) | Director of Clearwater Analytics
(provider of web-based investment
accounting software for reporting
and reconciliation services)
(September 2022 – present) |
Kenneth J. Taubes (64)***,****
Trustee | Trustee since 2014. Serves
until a successor trustee is
elected or earlier retirement
or removal | Director and Executive Vice President (since 2008) and Chief Investment Officer, U.S. (since 2010) of Amundi US, Inc. (investment management firm); Director and Executive Vice President and Chief Investment Officer, U.S. of Amundi US (since 2008); Executive Vice President and Chief Investment Officer, U.S. of Amundi Asset Management US, Inc. (since 2009); Portfolio Manager of Amundi US (since 1999); Director of Amundi Holdings US, Inc. (since 2017) | None |
*** Ms. Jones and Mr. Taubes are Interested Trustee because she is an officer or director of the Fund’s investment adviser and certain of its affiliates.
**** Mr. Taubes retired as a Trustee, effective January 1, 2024. |
56Pioneer Fund | Annual Report | 12/31/23
Name, Age and Position
Held With the Trust***** | Term of Office and
Length of Service | Principal Occupation(s) During At Least The Past Five Years | Other Directorships Held by Officers
During At Least The Past Five Years |
Christopher J. Kelley (59)
Secretary and Chief Legal Officer | Since 2003. Serves at the
discretion of the Board | Vice President and Associate General Counsel of Amundi US since January 2008; Secretary and Chief Legal Officer of all of the Pioneer Funds since June 2010; Assistant Secretary of all of the Pioneer Funds from September 2003 to May 2010; Vice President and Senior Counsel of Amundi US from July 2002 to December 2007 | None |
Thomas Reyes (61)
Assistant Secretary | Since 2010. Serves at the
discretion of the Board | Assistant General Counsel of Amundi US since May 2013 and Assistant Secretary of all the Pioneer Funds since June 2010; Counsel of Amundi US from June 2007 to May 2013 | None |
Heather L. Melito-Dezan (47)
Assistant Secretary | Since 2022. Serves at the
discretion of the Board | Director - Trustee and Board Relationships of Amundi US since September 2019; Assistant Secretary of Amundi US, Inc. since July 2020: Assistant Secretary of Amundi Asset Management US, Inc. since July 2020: Assistant Secretary of Amundi Distributor US, Inc. since July 2020; Assistant Secretary of all the Pioneer Funds since September 2022; Private practice from 2017 – 2019. | None |
Anthony J. Koenig, Jr. (60)
Treasurer and Chief Financial
and Accounting Officer | Since 2021. Serves at the
discretion of the Board | Managing Director, Chief Operations Officer and Fund Treasurer of Amundi US since May 2021; Treasurer of all of the Pioneer Funds since May 2021; Assistant Treasurer of all of the Pioneer Funds from January 2021 to May 2021; and Chief of Staff, US Investment Management of Amundi US from May 2008 to January 2021 | None |
Luis I. Presutti (58)
Assistant Treasurer | Since 2000. Serves at the
discretion of the Board | Director – Fund Treasury of Amundi US since 1999; and Assistant Treasurer of all of the Pioneer Funds since 1999 | None |
Gary Sullivan (65)
Assistant Treasurer | Since 2002. Serves at the
discretion of the Board | Senior Manager – Fund Treasury of Amundi US since 2012; and Assistant Treasurer of all of the Pioneer Funds since 2002 | None |
Pioneer Fund | Annual Report | 12/31/2357
Fund Officers (continued)
Name, Age and Position
Held With the Trust***** | Term of Office and
Length of Service | Principal Occupation(s) During At Least The Past Five Years | Other Directorships Held by Officers
During At Least The Past Five Years |
Antonio Furtado (41)
Assistant Treasurer | Since 2020. Serves at the
discretion of the Board | Fund Oversight Manager – Fund Treasury of Amundi US since 2020; Assistant Treasurer of all of the Pioneer Funds since 2020; and Senior Fund Treasury Analyst from 2012 - 2020 | None |
Michael Melnick (52)
Assistant Treasurer | Since 2021. Serves at the
discretion of the Board | Vice President - Deputy Fund Treasurer of Amundi US since May 2021; Assistant Treasurer of all of the Pioneer Funds since July 2021; Director of Regulatory Reporting of Amundi US from 2001 – 2021; and Director of Tax of Amundi US from 2000 - 2001 | None |
John Malone (53)
Chief Compliance Officer | Since 2018. Serves at the
discretion of the Board | Managing Director, Chief Compliance Officer of Amundi US Asset Management; Amundi Asset Management US, Inc.; and the Pioneer Funds since September 2018; Chief Compliance Officer of Amundi Distributor US, Inc. since January 2014. | None |
Brandon Austin (51)
Anti-Money Laundering Officer | Since 2022.
Serves at the
discretion of the Board | Director, Financial Security – Amundi Asset Management; Anti-Money Laundering Officer of all the Pioneer Funds since March 2022: Director of Financial Security of Amundi US since July 2021; Vice President, Head of BSA, AML and OFAC, Deputy Compliance Manager, Crédit Agricole Indosuez Wealth Management (investment management firm) (2013 – 2021) | None |
| ***** Marco Pirondini has been appointed to serve as an Executive Vice President of the Fund and Chief Investment Officer of Amundi US, Inc., effective January 1, 2024. |
58Pioneer Fund | Annual Report | 12/31/23
How to Contact Amundi
We are pleased to offer a variety of convenient ways for you to contact us for assistance or information.
Call us for:
Account Information, including existing accounts,
new accounts, prospectuses, applications
and service forms
1-800-225-6292
FactFoneSM for automated fund yields, prices,
account information and transactions
1-800-225-4321
| Retirement plans information | 1-800-622-0176 |
Write to us:
Amundi
P.O. Box 534427
Pittsburgh, PA 15253-4427
| Our toll-free fax | 1-800-225-4240 |
| Our internet e-mail address | us.askamundi@amundi.com
(for general questions about Amundi only) |
Visit our web site: www.amundi.com/us
This report must be preceded or accompanied by a prospectus.
The Fund files a complete schedule of portfolio holdings with the Securities and Exchange Commission for the first and third quarters of each fiscal year as an exhibit to its reports on Form N-PORT. Shareholders may view the filed Form N-PORT by visiting the Commission’s web site at https://www.sec.gov.
Amundi Asset Management US, Inc.
60 State Street
Boston, MA 02109
www.amundi.com/us
Securities offered through Amundi Distributor US, Inc.
60 State Street, Boston, MA 02109
Underwriter of Pioneer Mutual Funds, Member SIPC
© 2023 Amundi Asset Management US, Inc. 18627-18-0224
ITEM 2. CODE OF ETHICS.
(a) Disclose whether, as of the end of the period covered by the report, the registrant has adopted a code of ethics that applies to the registrant’s principal executive officer, principal financial officer, principal accounting officer or controller, or persons performing similar functions, regardless of whether these individuals are employed by the registrant or a third party. If the registrant has not adopted such a code of ethics, explain why it has not done so.
The registrant has adopted, as of the end of the period covered by this report, a code of ethics that applies to the registrant’s principal executive officer, principal financial officer, principal accounting officer and controller.
(b) For purposes of this Item, the term “code of ethics” means written standards that are reasonably designed to deter wrongdoing and to promote:
(1) Honest and ethical conduct, including the ethical handling of actual or apparent conflicts of interest between personal and professional relationships;
(2) Full, fair, accurate, timely, and understandable disclosure in reports and documents that a registrant files with, or submits to, the Commission and in other public communications made by the registrant;
(3) Compliance with applicable governmental laws, rules, and regulations;
(4) The prompt internal reporting of violations of the code to an appropriate person or persons identified in the code; and
(5) Accountability for adherence to the code.
(c) The registrant must briefly describe the nature of any amendment, during the period covered by the report, to a provision of its code of ethics that applies to the registrant’s principal executive officer, principal financial officer, principal accounting officer or controller, or persons performing similar functions, regardless of whether these individuals are employed by the registrant or a third party, and that relates to any element of the code of ethics definition enumerated in paragraph (b) of this Item. The registrant must file a copy of any such amendment as an exhibit pursuant to Item 10(a), unless the registrant has elected to satisfy paragraph (f) of this Item by posting its code of ethics on its website pursuant to paragraph (f)(2) of this Item, or by undertaking to provide its code of ethics to any person without charge, upon request, pursuant to paragraph (f)(3) of this Item.
The registrant has made no amendments to the code of ethics during the period covered by this report.
(d) If the registrant has, during the period covered by the report, granted a waiver, including an implicit waiver, from a provision of the code of ethics to the registrant’s principal executive officer, principal financial officer, principal accounting officer or controller, or persons performing similar functions, regardless of whether these individuals are employed by the registrant or a third party, that relates to one or more of the items set forth in paragraph (b) of this Item, the registrant must briefly describe the nature of the waiver, the name of the person to whom the waiver was granted, and the date of the waiver.
Not applicable.
(e) If the registrant intends to satisfy the disclosure requirement under paragraph (c) or (d) of this Item regarding an amendment to, or a waiver from, a provision of its code of ethics that applies to the registrant’s principal executive officer, principal financial officer, principal accounting officer or controller, or persons performing similar functions and that relates to any element of the code of ethics definition enumerated in paragraph (b) of this Item by posting such information on its Internet website, disclose the registrant’s Internet address and such intention.
Not applicable.
(f) The registrant must:
(1) File with the Commission, pursuant to Item 12(a)(1), a copy of its code of ethics that applies to the registrant’s principal executive officer, principal financial officer, principal accounting officer or controller, or persons performing similar functions, as an exhibit to its annual report on this Form N-CSR (see attachment);
(2) Post the text of such code of ethics on its Internet website and disclose, in its most recent report on this Form N-CSR, its Internet address and the fact that it has posted such code of ethics on its Internet website; or
(3) Undertake in its most recent report on this Form N-CSR to provide to any person without charge, upon request, a copy of such code of ethics and explain the manner in which such request may be made. See Item 10(2)
ITEM 3. AUDIT COMMITTEE FINANCIAL EXPERT.
(a) (1) Disclose that the registrant’s Board of Trustees has determined that the registrant either:
(i) Has at least one audit committee financial expert serving on its audit committee; or
(ii) Does not have an audit committee financial expert serving on its audit committee.
The registrant’s Board of Trustees has determined that the registrant has at least one audit committee financial expert.
(2) If the registrant provides the disclosure required by paragraph (a)(1)(i) of this Item, it must disclose the name of the audit committee financial expert and whether that person is “independent.” In order to be considered “independent” for purposes of this Item, a member of an audit committee may not, other than in his or her capacity as a member of the audit committee, the Board of Trustees, or any other board committee:
(i) Accept directly or indirectly any consulting, advisory, or other compensatory fee from the issuer; or
(ii) Be an “interested person” of the investment company as defined in Section 2(a)(19) of the Act (15 U.S.C. 80a-2(a)(19)).
Mr. Fred J. Ricciardi, an independent Trustee, is such an audit committee financial expert.
(3) If the registrant provides the disclosure required by paragraph (a)(1) (ii) of this Item, it must explain why it does not have an audit committee financial expert.
Not applicable.
ITEM 4. PRINCIPAL ACCOUNTANT FEES AND SERVICES.
(a) Disclose, under the caption AUDIT FEES, the aggregate fees billed for each of the last two fiscal years for professional services rendered by the principal accountant for the audit of the registrant’s annual financial statements or services that are normally provided by the accountant in connection with statutory and regulatory filings or engagements for those fiscal years.
The audit fees for the Fund were $29,079 payable to Ernst & Young LLP for the year ended December 31, 2023 and $27,961 for the year ended December 31, 2022.
(b) Disclose, under the caption AUDIT-RELATED FEES, the aggregate fees billed in each of the last two fiscal years for assurance and related services by the principal accountant that are reasonably related to the performance of the audit of the registrant’s financial statements and are not reported under paragraph (a) of this Item. Registrants shall describe the nature of the services comprising the fees disclosed under this category.
The audit-related services fees for the Fund were $40,073 payable to Ernst & Young LLP for the year ended December 31, 2023 and $12,408 for the year ended December 31, 2022.
(c) Disclose, under the caption TAX FEES, the aggregate fees billed in each of the last two fiscal years for professional services rendered by the principal accountant for tax compliance, tax advice, and tax planning. Registrants shall describe the nature of the services comprising the fees disclosed under this category.
The Fund paid aggregate non-audit fees to Ernst & Young LLP for tax services of $9,155 and $8,803 during the fiscal years ended December 31, 2023 and 2022, respectively.
(d) Disclose, under the caption ALL OTHER FEES, the aggregate fees billed in each of the last two fiscal years for products and services provided by the principal accountant, other than the services reported in paragraphs (a) through (c) of this Item. Registrants shall describe the nature of the services comprising the fees disclosed under this category.
There were no other fees in 2023 or 2022.
(e) (1) Disclose the audit committee’s pre-approval policies and procedures described in paragraph (c)(7) of Rule 2-01 of Regulation S-X.
PIONEER FUNDS
APPROVAL OF AUDIT, AUDIT-RELATED, TAX AND OTHER SERVICES
PROVIDED BY THE INDEPENDENT AUDITOR
SECTION I - POLICY PURPOSE AND APPLICABILITY
The Pioneer Funds recognize the importance of maintaining the independence of their outside auditors. Maintaining independence is a shared responsibility involving Amundi Asset Management US, Inc., the audit committee and the independent auditors.
The Funds recognize that a Fund’s independent auditors: 1) possess knowledge of the Funds, 2) are able to incorporate certain services into the scope of the audit, thereby avoiding redundant work, cost and disruption of Fund personnel and processes, and 3) have expertise that has value to the Funds. As a result, there are situations where it is desirable to use the Fund’s independent auditors for services in addition to the annual audit and where the potential for conflicts of interests are minimal. Consequently, this policy, which is intended to comply with Rule 210.2-01(C)(7), sets forth guidelines and procedures to be followed by the Funds when retaining the independent audit firm to perform audit, audit-related tax and other services under those circumstances, while also maintaining independence.
Approval of a service in accordance with this policy for a Fund shall also constitute approval for any other Fund whose pre-approval is required pursuant to Rule 210.2-01(c)(7)(ii).
In addition to the procedures set forth in this policy, any non-audit services that may be provided consistently with Rule 210.2-01 may be approved by the Audit Committee itself and any pre-approval that may be waived in accordance with Rule 210.2-01(c)(7)(i)(C) is hereby waived.
Selection of a Fund’s independent auditors and their compensation shall be determined by the Audit Committee and shall not be subject to this policy.
| | | | |
SECTION II - POLICY |
SERVICE CATEGORY | | SERVICE CATEGORY DESCRIPTION | | SPECIFIC PRE-APPROVED SERVICE SUBCATEGORIES |
I. AUDIT SERVICES II. AUDIT-RELATED SERVICES | | Services that are directly related tperforming the independent audit of the Funds Services which are not prohibited under Rule 210.2-01(C)(4) (the “Rule”) and are related extensions of the audit services support the audit, or use the knowledge/expertise gained from the audit procedures as a foundation to complete the project. In most cases, if the Audit-Related Services are not performed by the Audit firm, the scope of the Audit Services would likely increase. The Services are typically well-defined and governed by accounting professional standards (AICPA, SEC, etc.) | | • Accounting research assistance • SEC consultation, registration statements, and reporting • Tax accrual related matters • Implementation of new accounting standards • Compliance letters (e.g. rating agency letters) • Regulatory reviews and assistance regarding financial matters • Semi-annual reviews (if requested) • Comfort letters for closed end offerings • AICPA attest and agreed-upon procedures • Technology control assessments • Financial reporting control assessments • Enterprise security architecture assessment |
| | |
| AUDIT COMMITTEE APPROVAL POLICY | | AUDIT COMMITTEE REPORTING POLICY |
• “One-time” pre-approval for the audit period for all pre-approved specific service subcategories. Approval of the independent auditors as auditors for a Fund shall constitute pre approval for these services. | | • A summary of all such services and related fees reported at each regularly scheduled Audit Committee meeting. |
| |
• “One-time” pre-approval for the fund fiscal year within a specified dollar limit for all pre-approved specific service subcategories | | • A summary of all such services and related fees (including comparison to specified dollar limits) reported quarterly. |
| | |
• Specific approval is needed to exceed the pre-approved dollar limit for these services (see general Audit Committee approval policy below for details on obtaining specific approvals) • Specific approval is needed to use the Fund’s auditors for Audit-Related Services not denoted as “pre-approved”, or to add a specific service subcategory as “pre-approved” | | |
SECTION III - POLICY DETAIL, CONTINUED
| | | | |
| SERVICE CATEGORY | | SERVICE CATEGORY DESCRIPTION | | SPECIFIC PRE-APPROVED SERVICE SUBCATEGORIES |
| III. TAX SERVICES | | Services which are not prohibited by the Rule, if an officer of the Fund determines that using the Fund’s auditor to provide these services creates significant synergy in the form of efficiency, minimized disruption, or the ability to maintain a desired level of confidentiality. | | • Tax planning and support • Tax controversy assistance • Tax compliance, tax returns, excise tax returns and support • Tax opinions |
| | |
AUDIT COMMITTEE APPROVAL POLICY | | AUDIT COMMITTEE REPORTING POLICY |
• “One-time” pre-approval for the fund fiscal year within a specified dollar limit | | • A summary of all such services and related fees (including comparison to specified dollar limits) reported quarterly. |
| |
• Specific approval is needed to exceed the pre-approved dollar limits for these services (see general Audit Committee approval policy below for details on obtaining specific approvals) | | |
| |
• Specific approval is needed to use the Fund’s auditors for tax services not denoted as pre-approved, or to add a specific service subcategory as “pre-approved” | | |
SECTION III - POLICY DETAIL, CONTINUED
| | | | |
SERVICE CATEGORY | | SERVICE CATEGORY DESCRIPTION | | SPECIFIC PRE-APPROVED SERVICE SUBCATEGORIES |
IV. OTHER SERVICES A. SYNERGISTIC, UNIQUE QUALIFICATIONS | | Services which are not prohibited by the Rule, if an officer of the Fund determines that using the Fund’s auditor to provide these services creates significant synergy in the form of efficiency, minimized disruption, the ability to maintain a desired level of confidentiality, or where the Fund’s auditors posses unique or superior qualifications to provide these services, resulting in superior value and results for the Fund. | | • Business Risk Management support • Other control and regulatory compliance projects |
| | |
| AUDIT COMMITTEE APPROVAL POLICY | | AUDIT COMMITTEE REPORTING POLICY |
• “One-time” pre-approval for the fund fiscal year within a specified dollar limit | | • A summary of all such services and related fees (including comparison to specified dollar limits) reported quarterly. |
| |
• Specific approval is needed to exceed the pre-approved dollar limits for these services (see general Audit Committee approval policy below for details on obtaining specific approvals) | | |
| |
• Specific approval is needed to use the Fund’s auditors for “Synergistic” or “Unique Qualifications” Other Services not denoted as pre-approved to the left, or to add a specific service subcategory as “pre-approved” | | |
SECTION III - POLICY DETAIL, CONTINUED
| | | | |
SERVICE CATEGORY | | SERVICE CATEGORY DESCRIPTION | | SPECIFIC PROHIBITED SERVICE SUBCATEGORIES |
| PROHIBITED SERVICES | | Services which result in the auditors losing independence status under the Rule. | | 1. Bookkeeping or other services related to the accounting records or financial statements of the audit client* 2. Financial information systems design and implementation* 3. Appraisal or valuation services, fairness* opinions, or contribution-in-kind reports 4. Actuarial services (i.e., setting actuarial reserves versus actuarial audit work)* 5. Internal audit outsourcing services* 6. Management functions or human resources 7. Broker or dealer, investment advisor, or investment banking services 8. Legal services and expert services unrelated to the audit 9. Any other service that the Public Company Accounting Oversight Board determines, by regulation, is impermissible |
| | |
| AUDIT COMMITTEE APPROVAL POLICY | | AUDIT COMMITTEE REPORTING POLICY |
• These services are not to be performed with the exception of the(*) services that may be permitted if they would not be subject to audit procedures at the audit client (as defined in rule 2-01(f)(4)) level the firm providing the service. | | • A summary of all services and related fees reported at each regularly scheduled Audit Committee meeting will serve as continual confirmation that has not provided any restricted services. |
GENERAL AUDIT COMMITTEE APPROVAL POLICY:
| | • | | For all projects, the officers of the Funds and the Fund’s auditors will each make an assessment to determine that any proposed projects will not impair independence. |
| | • | | Potential services will be classified into the four non-restricted service categories and the “Approval of Audit, Audit-Related, Tax and Other Services” Policy above will be applied. Any services outside the specific pre-approved service subcategories set forth above must be specifically approved by the Audit Committee. |
| | • | | At least quarterly, the Audit Committee shall review a report summarizing the services by service category, including fees, provided by the Audit firm as set forth in the above policy. |
(2) Disclose the percentage of services described in each of paragraphs (b) through (d) of this Item that were approved by the audit committee pursuant to paragraph (c)(7)(i)(C) of Rule 2-01 of Regulation S-X.
Non-Audit Services
Beginning with non-audit service contracts entered into on or after May 6, 2003, the effective date of the new SEC pre-approval rules, the Fund’s audit committee is required to pre-approve services to affiliates defined by SEC rules to the extent that the services are determined to have a direct impact on the operations or financial reporting of the Fund. For the years ended December 31, 2023 and 2022, there were no services provided to an affiliate that required the Fund’s audit committee pre-approval.
(f) If greater than 50 percent, disclose the percentage of hours expended on the principal accountants engagement to audit the registrant’s financial statements for the most recent fiscal year that were attributed to work performed by persons other than the principal accountant’s full-time, permanent employees.
N/A
(g) Disclose the aggregate non-audit fees billed by the registrants accountant for services rendered to the registrant, and rendered to the registrants investment adviser (not including any sub-adviser whose role is primarily portfolio management and is subcontracted with or overseen by another investment adviser), and any entity controlling, controlled by, or under common control with the adviser that provides ongoing services to the registrant for each of the last two fiscal years of the registrant.
The Fund paid aggregate non-audit fees to Ernst & Young LLP for tax services of $9,155 and $8,803 during the fiscal years ended December 31, 2023 and 2022, respectively.
(h) Disclose whether the registrants audit committee of the Board of Trustees has considered whether the provision of non-audit services that were rendered to the registrants investment adviser (not including any subadviser whose role is primarily portfolio management and is subcontracted with or overseen by another investment adviser), and any entity controlling, controlled by, or under common control with the investment adviser that provides ongoing services to the registrant that were not pre-approved pursuant to paragraph (c)(7)(ii) of Rule 2-01 of Regulation S-X is compatible with maintaining the principal accountant’s independence.
The Fund’s audit committee of the Board of Trustees has considered whether the provision of non-audit services that were rendered to the Affiliates (as defined) that were not pre- approved pursuant to paragraph (c)(7)(ii) of Rule 2-01 of Regulation S-X is compatible with maintaining the principal accountant’s independence.
(i) A registrant identified by the Commission pursuant to Section 104(i)(2)(A) of the Sarbanes-Oxley Act of 2002 (15 U.S.C. 7214(i)(2)(A)), as having retained, for the preparation of the audit report on its financial statements included in the Form NCSR, a registered public accounting firm that has a branch or office that is located in a foreign jurisdiction and that the Public Company Accounting Oversight Board has determined it is unable to inspect or investigate completely because of a position taken by an authority in the foreign jurisdiction must electronically submit to the Commission on a supplemental basis documentation that establishes that the registrant is not owned or controlled by a governmental entity in the foreign jurisdiction. The registrant must submit this documentation on or before the due date for this form. A registrant that is owned or controlled by a foreign governmental entity is not required to submit such documentation.
N/A
(j) A registrant that is a foreign issuer, as defined in 17 CFR 240.3b-4, identified by the Commission pursuant to Section 104(i)(2)(A) of the Sarbanes-Oxley Act of 2002 (15 U.S.C. 7214(i)(2)(A)), as having retained, for the preparation of the audit report on its financial statements included in the Form N-CSR, a registered public accounting firm that has a branch or office that is located in a foreign jurisdiction and that the Public Company Accounting Oversight Board has determined it is unable to inspect or investigate completely because of a position taken by an authority in the foreign jurisdiction, for each year in which the registrant is so identified, must provide the below disclosures. Also, any such identified foreign issuer that uses a variable-interest entity or any similar structure that results in additional foreign entities being consolidated in the financial statements of the registrant is required to provide the below disclosures for itself and its consolidated foreign operating entity or entities. A registrant must disclose:
(1) That, for the immediately preceding annual financial statement period, a registered public accounting firm that the PCAOB was unable to inspect or investigate completely, because of a position taken by an authority in the foreign jurisdiction, issued an audit report for the registrant;
N/A
(2) The percentage of shares of the registrant owned by governmental entities in the foreign jurisdiction in which the registrant is incorporated or otherwise organized;
N/A
(3) Whether governmental entities in the applicable foreign jurisdiction with respect to that registered public accounting firm have a controlling financial interest with respect to the registrant; N/A
(4) The name of each official of the Chinese Communist Party who is a member of the board of directors of the registrant or the operating entity with respect to the registrant;
N/A
(5) Whether the articles of incorporation of the registrant (or equivalent organizing document) contains any charter of the Chinese Communist Party, including the text of any such charter.
N/A
ITEM 5. AUDIT COMMITTEE OF LISTED REGISTRANTS
(a) If the registrant is a listed issuer as defined in Rule 10A-3 under the Exchange Act (17 CFR 240.10A-3), state whether or not the registrant has a separately-designated standing audit committee established in accordance with Section 3(a)(58)(A) of the Exchange Act (15 U.S.C. 78c(a)(58)(A)). If the registrant has such a committee, however designated, identify each committee member. If the entire board of directors is acting as the registrant’s audit committee as specified in Section 3(a)(58)(B) of the Exchange Act (15 U.S.C. 78c(a)(58)(B)), so state.
N/A
(b) If applicable, provide the disclosure required by Rule 10A-3(d) under the Exchange Act (17 CFR 240.10A-3(d)) regarding an exemption from the listing standards for audit committees.
N/A
ITEM 6. SCHEDULE OF INVESTMENTS.
File Schedule of Investments in securities of unaffiliated issuers as of the close of the reporting period as set forth in 210.1212 of Regulation S-X [17 CFR 210.12-12], unless the schedule is included as part of the report to shareholders filed under Item 1 of this Form.
Included in Item 1
ITEM 7. DISCLOSURE OF PROXY VOTING POLICIES AND PROCEDURES FOR CLOSED-END MANAGEMENT INVESTMENT COMPANIES.
A closed-end management investment company that is filing an annual report on this Form N-CSR must, unless it invests exclusively in non-voting securities, describe the policies and procedures that it uses to determine how to vote proxies relating to portfolio securities, including the procedures that the company uses when a vote presents a conflict between the interests of its shareholders, on the one hand, and those of the company’s investment adviser; principal underwriter; or any affiliated person (as defined in Section 2(a)(3) of the Investment Company Act of 1940 (15 U.S.C. 80a-2(a)(3)) and the rules thereunder) of the company, its investment adviser, or its principal underwriter, on the other. Include any policies and procedures of the company’s investment adviser, or any other third party, that the company uses, or that are used on the company’s behalf, to determine how to vote proxies relating to portfolio securities.
Not applicable to open-end management investment companies.
ITEM 8. PORTFOLIO MANAGERS OF CLOSED-END MANAGEMENT INVESTMENT COMPANIES.
(a) If the registrant is a closed-end management investment company that is filing an annual report on this Form N-CSR, provide the following information:
(1) State the name, title, and length of service of the person or persons employed by or associated with the registrant or an investment adviser of the registrant who are primarily responsible for the day-to-day management of the registrant’s portfolio (“Portfolio Manager”). Also state each Portfolio Manager’s business experience during the past 5 years.
Not applicable to open-end management investment companies.
ITEM 9. PURCHASES OF EQUITY SECURITIES BY CLOSED-END MANAGEMENT INVESTMENT COMPANY AND AFFILIATED PURCHASERS.
(a) If the registrant is a closed-end management investment company, in the following tabular format, provide the information specified in paragraph (b) of this Item with respect to any purchase made by or on behalf of the registrant or any affiliated purchaser, as defined in Rule 10b-18(a)(3) under the Exchange Act (17 CFR 240.10b-18(a)(3)), of shares or other units of any class of the registrant’s equity securities that is registered by the registrant pursuant to Section 12 of the Exchange Act (15 U.S.C. 781).
Not applicable to open-end management investment companies.
ITEM 10. SUBMISSION OF MATTERS TO A VOTE OF SECURITY HOLDERS.
Describe any material changes to the procedures by which shareholders may recommend nominees to the registrant’s board of directors, where those changes were implemented after the registrant last provided disclosure in response to the requirements of Item 407(c)(2)(iv) of Regulation S-R(17 CFR 229.407)(as required by Item 22(b)(15)) of Schedule 14A (17 CFR 240.14a-101), or this Item.
There have been no material changes to the procedures by which the shareholders may recommend nominees to the registrant’s board of directors since the registrant last provided disclosure in response to the requirements of Item 407(c)(2)(iv) of Regulation S-R of Schedule 14(A) in its definitive proxy statement, or this item.
ITEM 11. CONTROLS AND PROCEDURES.
(a) Disclose the conclusions of the registrant’s principal executive and principal financials officers, or persons performing similar functions, regarding the effectiveness of the registrant’s disclosure controls and procedures (as defined in Rule 30a-3(c) under the Act (17 CFR 270.30a-3(c))) as of a date within 90 days of the filing date of the report that includes the disclosure required by this paragraph, based on the evaluation of these controls and procedures required by Rule 30a-3(b) under the Act (17 CFR 270.30(a)-3(b) and Rules 13a-15(b) or 15d-15(b) under the Exchange Act (17 CFR 240.13a-15(b) or 240.15d-15(b)).
The registrant’s principal executive officer and principal financial officer have concluded that the registrant’s disclosure controls and procedures are effective based on the evaluation of these controls and procedures as of a date within 90 days of the filing date of this report.
(b) Disclose any change in the registrant’s internal control over financial reporting (as defined in Rule 30a-3(d) under the Act (17CFR 270.30a-3(d)) that occurred during the period covered by this report that has materially affected, or is reasonably likely to materially affect, the registrant’s internal control over financial reporting.
There were no significant changes in the registrant’s internal control over financial reporting that occurred during the period covered by this report that have materially affected, or are reasonably likely to materially affect, the registrant’s internal control over financial reporting.
Item 12. Disclosure of Securities Lending Activities for Closed-End Management Investment Companies.
(a) If the registrant is a closed-end management investment company, provide the following dollar amounts of income and compensation related to the securities lending activities of the registrant during its most recent fiscal year:
N/A
(1) Gross income from securities lending activities;
N/A
(2) All fees and/or compensation for each of the following securities lending activities and related services: any share of revenue generated by the securities lending program paid to the securities lending agent(s) (revenue split); fees paid for cash collateral management services (including fees deducted from a pooled cash collateral reinvestment vehicle) that are not included in the revenue split; administrative fees that are not included in the revenue split; fees for indemnification that are not included in the revenue split; rebates paid to borrowers; and any other fees relating to the securities lending program that are not included in the revenue split, including a description of those other fees;
N/A
(3) The aggregate fees/compensation disclosed pursuant to paragraph (2); and
N/A
(4) Net income from securities lending activities (i.e., the dollar amount in paragraph (1) minus the dollar amount in paragraph (3)).
If a fee for a service is included in the revenue split, state that the fee is included in the revenue split.
N/A
(b) If the registrant is a closed-end management investment company, describe the services provided to the registrant by the securities lending agent in the registrants most recent fiscal year.
N/A
ITEM 13. EXHIBITS.
(a) File the exhibits listed below as part of this Form. Letter or number the exhibits in the sequence indicated.
(1) Any code of ethics, or amendment thereto, that is the subject of the disclosure required by Item 2, to the extent that the registrant intends to satisfy the Item 2 requirements through filing of an exhibit.
(2) A separate certification for each principal executive officer and principal financial officer of the registrant as required by Rule 30a-2(a) under the Act (17 CFR 270.30a-2(a)) , exactly as set forth below: Filed herewith.
(b) Certifications pursuant to Rule 30a-2(b) under the 1940 Act and Section 906 of the Sarbanes-Oxley Act of 2002 are attached hereto.
SIGNATURES
[See General Instruction F]
Pursuant to the requirements of the Securities Exchange Act of 1934 and the Investment Company Act of 1940, the registrant has duly caused this report to be signed on its behalf by the undersigned, thereunto duly authorized.
(Registrant) Pioneer Fund
By (Signature and Title)* /s/ Lisa M. Jones
Lisa M. Jones, Principal Executive Officer
Date March 5, 2024
Pursuant to the requirements of the Securities Exchange Act of 1934 and the Investment Company Act of 1940, this report has been signed below by the following persons on behalf of the registrant and in the capacities and on the dates indicated.
By (Signature and Title)* /s/ Lisa M. Jones
Lisa M. Jones, Principal Executive Officer
Date March 5, 2024
By (Signature and Title)* /s/ Anthony J. Koenig, Jr.
Anthony J. Koenig, Jr., Principal Financial Officer
Date March 5, 2024
| * | Print the name and title of each signing officer under his or her signature. |