UNITED STATES
SECURITIES AND EXCHANGE COMMISSION
Washington, D.C. 20549
Form N-CSR
CERTIFIED SHAREHOLDER REPORT OF REGISTERED MANAGEMENT
INVESTMENT COMPANIES
Investment Company Act File Number 811-04550
THE MAINSTAY FUNDS
(Exact name of Registrant as specified in charter)
51 Madison Avenue, New York, NY 10010
(Address of principal executive offices) (Zip code)
J. Kevin Gao, Esq.
30 Hudson Street
Jersey City, New Jersey 07302
(Name and address of agent for service)
Registrant’s telephone number, including area code: (212) 576-7000
Date of fiscal year end: October 31
Date of reporting period: April 30, 2021
| Item 1. | Reports to Stockholders. |
please log in to newyorklifeinvestments.com/accounts.
| Not FDIC/NCUA Insured | Not a Deposit | May Lose Value | No Bank Guarantee | Not Insured by Any Government Agency |


President

| Average Annual Total Returns for the Period-Ended April 30, 20211 | ||||||||
| Class | Sales Charge | Inception Date | Six Months | One Year | Five Years | Ten Years | Gross Expense Ratio2 | |
| Class A Shares | Maximum 4.5% Initial Sales Charge | With sales charges | 6/1/1998 | -0.23% | 15.16% | 3.89% | 3.66% | 1.33% |
| Excluding sales charges | 4.47 | 20.59 | 4.85 | 4.14 | 1.33 | |||
| Investor Class Shares3 | Maximum 4% Initial Sales Charge | With sales charges | 2/28/2008 | 0.19 | 14.81 | 3.62 | 3.44 | 1.66 |
| Excluding sales charges | 4.37 | 20.22 | 4.58 | 3.92 | 1.66 | |||
| Class B Shares4 | Maximum 5% CDSC | With sales charges | 6/1/1998 | -1.06 | 14.26 | 3.44 | 3.14 | 2.40 |
| if Redeemed Within the First Six Years of Purchase | Excluding sales charges | 3.94 | 19.26 | 3.79 | 3.14 | 2.40 | ||
| Class C Shares | Maximum 1% CDSC | With sales charges | 9/1/1998 | 2.83 | 18.23 | 3.78 | 3.14 | 2.40 |
| if Redeemed Within One Year of Purchase | Excluding sales charges | 3.83 | 19.23 | 3.78 | 3.14 | 2.40 | ||
| Class I Shares | No Sales Charge | 8/31/2007 | 4.73 | 21.04 | 5.13 | 4.41 | 1.07 | |
| 1. | The Fund replaced MacKay and modified its investment objective and principal investment strategies as of June 21, 2019. The performance in the bar chart and table prior to those dates reflects MacKay’s, investment objective and principal investment strategies. |
| 2. | The gross expense ratios presented reflect the Fund’s “Total Annual Fund Operating Expenses” from the most recent Prospectus, as supplemented, and may differ from other expense ratios disclosed in this report. |
| 3. | Prior to June 30, 2020, the maximum initial sales charge for Investor Class shares was 4.5%, which is reflected in the average annual total return figures shown. |
| 4. | Class B shares are closed to all new purchases as well as additional investments by existing Class B shareholders. |
| Benchmark Performance | Six Months | One Year | Five Years | Ten Years |
| JPMorgan EMBI Global Diversified Index1 | 3.26% | 15.97% | 5.14% | 5.72% |
| Morningstar Emerging Markets Bond Category Average2 | 4.89 | 17.90 | 4.70 | 2.95 |
| 1. | The JPMorgan EMBI Global Diversified Index is the Fund’s primary broad based securities market index for comparison purposes. The JPMorgan EMBI Global Diversified Index is a market-capitalization weighted, total return index tracking the traded market for U.S. dollar-denominated Brady Bonds, Eurobonds, traded loans and local market debt instruments issued by sovereign and quasi-sovereign entities. Results assume reinvestment of all dividends and capital gains. An investment cannot be made directly in an index. |
| 2. | The Morningstar Emerging Markets Bond Category Average is representative of funds that invest more than 65% of their assets in foreign bonds from developing countries. The largest portion of the emerging-markets bond market comes from Latin America, followed by Eastern Europe. Africa, the Middle East, and Asia make up the rest. Results are based on average total returns of similar funds with all dividends and capital gain distributions reinvested. |
| 6 | MainStay Candriam Emerging Markets Debt Fund |
| Share Class | Beginning Account Value 11/1/20 | Ending Account Value (Based on Actual Returns and Expenses) 4/30/21 | Expenses Paid During Period1 | Ending Account Value (Based on Hypothetical 5% Annualized Return and Actual Expenses) 4/30/21 | Expenses Paid During Period1 | Net Expense Ratio During Period2 |
| Class A Shares | $1,000.00 | $1,044.70 | $ 5.88 | $1,019.04 | $ 5.81 | 1.16% |
| Investor Class Shares | $1,000.00 | $1,043.70 | $ 7.70 | $1,017.26 | $ 7.60 | 1.52% |
| Class B Shares | $1,000.00 | $1,039.40 | $11.48 | $1,013.54 | $11.33 | 2.27% |
| Class C Shares | $1,000.00 | $1,038.30 | $11.47 | $1,013.54 | $11.33 | 2.27% |
| Class I Shares | $1,000.00 | $1,047.30 | $ 4.31 | $1,020.58 | $ 4.26 | 0.85% |
| 1. | Expenses are equal to the Fund’s annualized expense ratio of each class multiplied by the average account value over the period, divided by 365 and multiplied by 181 (to reflect the six-month period). The table above represents the actual expenses incurred during the six-month period. In addition to the fees and expenses which the Fund bears directly, it also indirectly bears a pro rata share of the fees and expenses of the underlying funds in which it invests. Such indirect expenses are not included in the above-reported expense figures. |
| 2. | Expenses are equal to the Fund's annualized expense ratio to reflect the six-month period. |
| Colombia | 5.5% |
| Mexico | 5.0 |
| Dominican Republic | 4.7 |
| Egypt | 4.6 |
| South Africa | 4.0 |
| Brazil | 3.5 |
| Oman | 3.2 |
| Romania | 3.2 |
| Ghana | 3.1 |
| Ukraine | 3.1 |
| Azerbaijan | 2.9 |
| Argentina | 2.8 |
| Indonesia | 2.4 |
| China | 2.1 |
| Bahrain | 2.1 |
| Nigeria | 2.1 |
| Pakistan | 2.1 |
| United Arab Emirates | 2.1 |
| United States | 2.0 |
| Ecuador | 1.9 |
| Kenya | 1.9 |
| Uzbekistan | 1.9 |
| Cote D'Ivoire | 1.9 |
| Saudi Arabia | 1.8 |
| Bahamas | 1.6 |
| Kazakhstan | 1.6 |
| El Salvador | 1.5 |
| Turkey | 1.3 |
| Iraq | 1.2 |
| Panama | 1.2% |
| Philippines | 1.2 |
| Belarus | 1.1 |
| Guatemala | 1.0 |
| Croatia | 1.0 |
| Hungary | 1.0 |
| Tunisia | 1.0 |
| India | 1.0 |
| Namibia | 0.9 |
| Sri Lanka | 0.9 |
| Costa Rica | 0.9 |
| Paraguay | 0.8 |
| Chile | 0.8 |
| Venezuela | 0.7 |
| Honduras | 0.7 |
| Morocco | 0.6 |
| Jamaica | 0.6 |
| Senegal | 0.6 |
| Mongolia | 0.6 |
| Republic Of Serbia | 0.5 |
| Uruguay | 0.5 |
| Peru | 0.4 |
| Zambia | 0.4 |
| Armenia | 0.4 |
| Lebanon | 0.2 |
| Other Assets, Less Liabilities | 3.9 |
| 100.0% |
| 1. | Colombia Government Bond, 3.00%-7.25%, due 1/30/30–6/15/45 |
| 2. | Dominican Republic Government Bond, 4.50%-6.85%, due 1/25/27–1/30/60 |
| 3. | Egypt Government Bond, 3.875%-8.70%, due 10/6/25–2/16/61 |
| 4. | South Africa Government Bond, 4.85%-8.00%, due 4/14/26–9/30/49 |
| 5. | Oman Government Bond, 4.875%-7.00%, due 2/1/25–1/25/51 |
| 6. | Romanian Government Bond, 2.75%-5.125%, due 2/26/26–2/14/51 |
| 7. | Ghana Government Bond, 7.75%-8.627%, due 4/7/29–6/16/49 |
| 8. | Ukraine Government Bond, (zero coupon)-7.75%, due 9/1/27–5/31/40 |
| 9. | Petroleos Mexicanos, 5.95%-6.95%, due 1/23/30–1/28/60 |
| 10. | Bahrain Government Bond, 4.25%-6.25%, due 1/25/28–1/25/51 |
| 8 | MainStay Candriam Emerging Markets Debt Fund |
| 1. | See page 5 for other share class returns, which may be higher or lower than Class I share returns. See page 6 for more information on benchmark and peer group returns. |
| 2. | Modified duration is inversely related to the approximate percentage change in price for a given change in yield. |
| 3. | Duration is a measure of the price sensitivity of a fixed-income investment to changes in interest rates. Duration is expressed as a number of years and is considered a more accurate sensitivity gauge than average maturity. Modified duration is inversely related to the approximate percentage change in price for a given change in yield. |
| 4. | The terms “spread” and “yield spread” may refer to the difference in yield between a security or type of security and comparable U.S. Treasury issues. The terms may also refer to the difference in yield between two specific securities or types of securities at a given time. |
| 5. | Beta is a measure of volatility in relation to the market as a whole. A beta higher than 1 indicates that a security or portfolio will tend to exhibit higher volatility than the market. A beta lower than 1 indicates that a security or portfolio will tend to exhibit lower volatility than the market. |
| 10 | MainStay Candriam Emerging Markets Debt Fund |
| 6. | An obligation rated ‘BB’ by Standard & Poor’s (“S&P”) is deemed by S&P to be less vulnerable to nonpayment than other speculative issues. In the opinion of S&P, however, the obligor faces major ongoing uncertainties or exposure to adverse business, financial or economic conditions which could lead to the obligor’s inadequate capacity to meet its financial commitment on the obligation. When applied to Fund holdings, ratings are based solely on the creditworthiness of the bonds in the portfolio and are not meant to represent the security or safety of the Fund. |
| Principal Amount | Value | |
| Long-Term Bonds 94.1% | ||
| Corporate Bonds 8.0% | ||
| Brazil 2.0% | ||
| Braskem Netherlands Finance BV | ||
| Series Reg S | ||
| 4.50%, due 1/10/28 | $ 500,000 | $ 520,000 |
| Series Reg S | ||
| 4.50%, due 1/31/30 | 700,000 | 711,340 |
| Rede D'or Finance Sarl | ||
| Series Reg S | ||
| 4.50%, due 1/22/30 | 1,000,000 | 982,250 |
| 2,213,590 | ||
| Chile 0.3% | ||
| Sociedad Quimica y Minera de Chile SA | ||
| Series Reg S | ||
| 4.25%, due 1/22/50 | 250,000 | 268,438 |
| China 2.1% | ||
| CNPC Global Capital Ltd. | ||
| 2.00%, due 6/23/30 | 500,000 | 473,006 |
| Sinopec Group Overseas Development 2018 Ltd. | ||
| Series Reg S | ||
| 2.30%, due 1/8/31 (a) | 1,100,000 | 1,064,292 |
| Series Reg S | ||
| 2.70%, due 5/13/30 | 450,000 | 450,207 |
| State Grid Overseas Investment 2016 Ltd. | ||
| 1.625%, due 8/5/30 | 400,000 | 370,514 |
| 2,358,019 | ||
| Kazakhstan 1.6% | ||
| KazMunayGas National Co. JSC | ||
| Series Reg S | ||
| 4.75%, due 4/19/27 | 600,000 | 683,700 |
| Series Reg S | ||
| 5.75%, due 4/19/47 | 700,000 | 840,714 |
| Series Reg S | ||
| 6.375%, due 10/24/48 | 200,000 | 256,935 |
| 1,781,349 | ||
| Mexico 1.7% | ||
| Cemex SAB de CV | ||
| Series Reg S | ||
| 3.875%, due 7/11/31 | 800,000 | 791,760 |
| Series Reg S | ||
| 5.20%, due 9/17/30 | 300,000 | 326,460 |
| Principal Amount | Value | |
| Mexico (continued) | ||
| Industrias Penoles SAB de CV | ||
| Series Reg S | ||
| 4.75%, due 8/6/50 | $ 700,000 | $ 720,125 |
| 1,838,345 | ||
| Paraguay 0.2% | ||
| Bioceanico Sovereign Certificate Ltd. | ||
| Series Reg S | ||
| (zero coupon), due 6/5/34 | 344,427 | 252,292 |
| Venezuela 0.1% | ||
| Petroleos de Venezuela SA | ||
| 5.375%, due 4/12/27 (b)(c)(d) | 3,000,000 | 130,500 |
| Total Corporate Bonds (Cost $9,777,517) | 8,842,533 | |
| Foreign Government Bonds 86.1% | ||
| Argentina 2.8% | ||
| Argentine Republic Government Bond | ||
| 0.125%, due 7/9/30 (e) | 513,757 | 186,237 |
| 0.125%, due 7/9/35 (e) | 3,366,242 | 1,060,400 |
| 1.00%, due 7/9/29 | 233,373 | 88,450 |
| Provincia de Buenos Aires | ||
| 7.875%, due 6/15/27 (d)(f) | 4,000,000 | 1,750,000 |
| 3,085,087 | ||
| Armenia 0.4% | ||
| Armenia Government Bond | ||
| Series Reg S | ||
| 3.95%, due 9/26/29 | 500,000 | 478,225 |
| Azerbaijan 2.9% | ||
| Southern Gas Corridor CJSC | ||
| Series Reg S | ||
| 6.875%, due 3/24/26 | 1,000,000 | 1,200,060 |
| State Oil Co. of the Azerbaijan Republic | ||
| 6.95%, due 3/18/30 | 1,600,000 | 1,980,192 |
| 3,180,252 | ||
| Bahamas 1.6% | ||
| Bahamas Government Bond | ||
| Series Reg S | ||
| 6.00%, due 11/21/28 | 1,800,000 | 1,786,500 |
| 12 | MainStay Candriam Emerging Markets Debt Fund |
| Principal Amount | Value | |
| Foreign Government Bonds (continued) | ||
| Bahrain 2.1% | ||
| Bahrain Government Bond | ||
| Series Reg S | ||
| 4.25%, due 1/25/28 | $ 300,000 | $ 300,210 |
| Series Reg S | ||
| 5.25%, due 1/25/33 | 1,000,000 | 971,300 |
| Series Reg S | ||
| 5.25%, due 1/25/33 | 400,000 | 388,520 |
| Series Reg S | ||
| 6.25%, due 1/25/51 | 700,000 | 655,375 |
| 2,315,405 | ||
| Belarus 1.1% | ||
| Belarus Government Bond | ||
| Series Reg S | ||
| 6.875%, due 2/28/23 | 600,000 | 612,433 |
| Series Reg S | ||
| 7.625%, due 6/29/27 | 600,000 | 621,954 |
| 1,234,387 | ||
| Brazil 1.5% | ||
| Brazil Government Bond | ||
| 3.875%, due 6/12/30 | 500,000 | 496,330 |
| 4.75%, due 1/14/50 | 1,200,000 | 1,126,200 |
| 1,622,530 | ||
| Chile 0.5% | ||
| Chile Government Bond | ||
| 3.50%, due 4/15/53 | 550,000 | 570,152 |
| Colombia 5.5% | ||
| Colombia Government Bond | ||
| 3.00%, due 1/30/30 | 1,000,000 | 980,400 |
| 3.125%, due 4/15/31 | 500,000 | 489,695 |
| 4.125%, due 2/22/42 | 250,000 | 244,750 |
| 5.00%, due 6/15/45 | 500,000 | 532,465 |
| 6.125%, due 1/18/41 | 1,000,000 | 1,199,490 |
| 7.00%, due 6/30/32 | COP 5,000,000,000 | 1,308,738 |
| 7.25%, due 10/18/34 | 5,000,000,000 | 1,312,398 |
| 6,067,936 | ||
| Costa Rica 0.9% | ||
| Costa Rica Government Bond | ||
| Series Reg S | ||
| 4.375%, due 4/30/25 (a) | $ 400,000 | 406,000 |
| Series Reg S | ||
| 7.00%, due 4/4/44 | 600,000 | 615,000 |
| 1,021,000 | ||
| Principal Amount | Value | |
| Cote D'Ivoire 1.9% | ||
| Ivory Coast Government Bond | ||
| Series Reg S | ||
| 4.875%, due 1/30/32 | EUR 250,000 | $ 301,663 |
| Series Reg S | ||
| 5.75%, due 12/31/32 (e) | $ 1,060,417 | 1,069,929 |
| Series Reg S | ||
| 6.125%, due 6/15/33 | 650,000 | 688,278 |
| 2,059,870 | ||
| Croatia 1.0% | ||
| Croatia Government Bond | ||
| Series Reg S | ||
| 6.00%, due 1/26/24 | 1,000,000 | 1,142,268 |
| Dominican Republic 4.7% | ||
| Dominican Republic Government Bond | ||
| Series Reg S | ||
| 4.50%, due 1/30/30 | 600,000 | 622,500 |
| Series Reg S | ||
| 4.875%, due 9/23/32 | 850,000 | 889,525 |
| Series Reg S | ||
| 5.875%, due 1/30/60 | 900,000 | 897,750 |
| Series Reg S | ||
| 5.95%, due 1/25/27 | 250,000 | 283,750 |
| Series Reg S | ||
| 5.95%, due 1/25/27 | 1,750,000 | 1,986,250 |
| Series Reg S | ||
| 6.85%, due 1/27/45 | 500,000 | 568,750 |
| 5,248,525 | ||
| Ecuador 1.9% | ||
| Ecuador Government Bond | ||
| Series Reg S | ||
| (zero coupon), due 7/31/30 | 208,496 | 113,630 |
| Series Reg S | ||
| 0.50%, due 7/31/35 (e) | 400,000 | 272,004 |
| Series Reg S | ||
| 0.50%, due 7/31/40 (e) | 2,900,000 | 1,725,529 |
| 2,111,163 | ||
| Egypt 4.6% | ||
| Egypt Government Bond | ||
| Series Reg S | ||
| 3.875%, due 2/16/26 | 800,000 | 779,552 |
| Series Reg S | ||
| 5.25%, due 10/6/25 | 650,000 | 676,000 |
| Series Reg S | ||
| 5.875%, due 2/16/31 | 800,000 | 771,024 |
| Principal Amount | Value | |
| Foreign Government Bonds (continued) | ||
| Egypt (continued) | ||
| Egypt Government Bond (continued) | ||
| Series Reg S | ||
| 6.875%, due 4/30/40 | $ 1,200,000 | $ 1,168,176 |
| Series Reg S | ||
| 7.50%, due 1/31/27 | 200,000 | 220,580 |
| Series Reg S | ||
| 7.50%, due 2/16/61 | 450,000 | 416,812 |
| Series Reg S | ||
| 8.70%, due 3/1/49 | 1,000,000 | 1,040,942 |
| 5,073,086 | ||
| El Salvador 1.5% | ||
| El Salvador Government Bond | ||
| Series Reg S | ||
| 5.875%, due 1/30/25 | 89,000 | 91,652 |
| Series Reg S | ||
| 6.375%, due 1/18/27 | 511,000 | 527,608 |
| Series Reg S | ||
| 7.625%, due 2/1/41 | 1,000,000 | 1,025,300 |
| 1,644,560 | ||
| Ghana 3.1% | ||
| Ghana Government Bond | ||
| Series Reg S | ||
| 7.75%, due 4/7/29 | 1,700,000 | 1,736,975 |
| Series Reg S | ||
| 7.875%, due 2/11/35 | 1,000,000 | 983,560 |
| Series Reg S | ||
| 8.625%, due 4/7/34 | 450,000 | 464,067 |
| Series Reg S | ||
| 8.627%, due 6/16/49 | 250,000 | 242,500 |
| 3,427,102 | ||
| Guatemala 1.0% | ||
| Guatemala Government Bond | ||
| Series Reg S | ||
| 4.90%, due 6/1/30 | 500,000 | 558,500 |
| Series Reg S | ||
| 6.125%, due 6/1/50 | 500,000 | 600,000 |
| 1,158,500 | ||
| Honduras 0.7% | ||
| Honduras Government Bond | ||
| Series Reg S | ||
| 5.625%, due 6/24/30 | 700,000 | 735,000 |
| Principal Amount | Value | |
| Hungary 1.0% | ||
| Hungary Government Bond | ||
| 5.375%, due 3/25/24 | $ 1,000,000 | $ 1,133,740 |
| India 1.0% | ||
| Export-Import Bank of India | ||
| Series Reg S | ||
| 3.375%, due 8/5/26 | 1,000,000 | 1,058,031 |
| Indonesia 2.4% | ||
| Indonesia Government Bond | ||
| 5.125%, due 1/15/45 (f) | 1,000,000 | 1,203,455 |
| Pertamina Persero PT | ||
| Series Reg S | ||
| 3.10%, due 8/27/30 | 500,000 | 509,765 |
| Series Reg S | ||
| 4.175%, due 1/21/50 (a) | 400,000 | 399,384 |
| 5.625%, due 5/20/43 (f) | 500,000 | 577,088 |
| 2,689,692 | ||
| Iraq 1.2% | ||
| Iraq Government Bond | ||
| Series Reg S | ||
| 5.80%, due 1/15/28 | 568,750 | 548,332 |
| Series Reg S | ||
| 6.752%, due 3/9/23 | 800,000 | 813,360 |
| 1,361,692 | ||
| Jamaica 0.6% | ||
| Jamaica Government Bond | ||
| 7.875%, due 7/28/45 | 500,000 | 697,500 |
| Kenya 1.9% | ||
| Kenya Government Bond | ||
| Series Reg S | ||
| 6.875%, due 6/24/24 | 500,000 | 553,900 |
| 7.25%, due 2/28/28 (f) | 200,000 | 216,724 |
| Series Reg S | ||
| 8.00%, due 5/22/32 | 1,000,000 | 1,094,964 |
| Series Reg S | ||
| 8.25%, due 2/28/48 | 200,000 | 213,500 |
| 2,079,088 | ||
| Lebanon 0.2% | ||
| Lebanon Government Bond (b)(d) | ||
| 6.65%, due 4/22/24 | 1,200,000 | 146,232 |
| 6.85%, due 3/23/27 | 1,000,000 | 124,188 |
| 270,420 | ||
| 14 | MainStay Candriam Emerging Markets Debt Fund |
| Principal Amount | Value | |
| Foreign Government Bonds (continued) | ||
| Mexico 3.3% | ||
| Mexico Government Bond | ||
| 3.771%, due 5/24/61 | $ 700,000 | $ 624,078 |
| Petroleos Mexicanos | ||
| 5.95%, due 1/28/31 | 1,000,000 | 965,400 |
| 6.75%, due 9/21/47 | 700,000 | 618,800 |
| Series Reg S | ||
| 6.84%, due 1/23/30 | 800,000 | 822,000 |
| 6.95%, due 1/28/60 | 700,000 | 619,430 |
| 3,649,708 | ||
| Mongolia 0.6% | ||
| Mongolia Government Bond | ||
| Series Reg S | ||
| 5.125%, due 4/7/26 | 400,000 | 428,571 |
| Series Reg S | ||
| 5.625%, due 5/1/23 | 200,000 | 210,000 |
| 638,571 | ||
| Morocco 0.6% | ||
| Morocco Government Bond | ||
| Series Reg S | ||
| 3.00%, due 12/15/32 | 500,000 | 474,790 |
| Series Reg S | ||
| 4.00%, due 12/15/50 | 250,000 | 225,030 |
| 699,820 | ||
| Namibia 0.9% | ||
| Namibia Government Bond | ||
| Series Reg S | ||
| 5.25%, due 10/29/25 | 1,000,000 | 1,052,788 |
| Nigeria 2.1% | ||
| Nigeria Government Bond | ||
| 6.50%, due 11/28/27 (f) | 500,000 | 528,250 |
| Series Reg S | ||
| 7.625%, due 11/28/47 | 1,000,000 | 1,004,880 |
| Series Reg S | ||
| 7.875%, due 2/16/32 | 700,000 | 753,606 |
| 2,286,736 | ||
| Oman 3.2% | ||
| Oman Government Bond | ||
| Series Reg S | ||
| 4.875%, due 2/1/25 | 400,000 | 419,480 |
| Series Reg S | ||
| 4.875%, due 2/1/25 | 200,000 | 209,740 |
| Principal Amount | Value | |
| Oman (continued) | ||
| Oman Government Bond (continued) | ||
| Series Reg S | ||
| 6.25%, due 1/25/31 | $ 1,000,000 | $ 1,075,000 |
| Series Reg S | ||
| 6.25%, due 1/25/31 | 500,000 | 537,500 |
| Series Reg S | ||
| 7.00%, due 1/25/51 | 1,000,000 | 1,019,862 |
| Series Reg S | ||
| 7.00%, due 1/25/51 | 300,000 | 305,959 |
| 3,567,541 | ||
| Pakistan 2.1% | ||
| Pakistan Government Bond | ||
| Series Reg S | ||
| 6.875%, due 12/5/27 | 200,000 | 209,000 |
| Series Reg S | ||
| 7.375%, due 4/8/31 | 1,000,000 | 1,050,000 |
| Series Reg S | ||
| 8.875%, due 4/8/51 | 950,000 | 1,017,849 |
| 2,276,849 | ||
| Panama 1.2% | ||
| Panama Government Bond | ||
| 2.252%, due 9/29/32 | 600,000 | 572,856 |
| 3.87%, due 7/23/60 | 750,000 | 750,135 |
| 1,322,991 | ||
| Paraguay 0.6% | ||
| Paraguay Government Bond | ||
| Series Reg S | ||
| 2.739%, due 1/29/33 | 495,000 | 471,488 |
| Series Reg S | ||
| 5.40%, due 3/30/50 | 200,000 | 225,302 |
| 696,790 | ||
| Peru 0.4% | ||
| Peruvian Government Bond | ||
| 2.783%, due 1/23/31 | 500,000 | 500,000 |
| Philippines 1.2% | ||
| Philippine Government Bond | ||
| 1.648%, due 6/10/31 (a) | 300,000 | 286,479 |
| 3.70%, due 3/1/41 | 300,000 | 317,964 |
| 3.75%, due 1/14/29 | 600,000 | 672,876 |
| 1,277,319 | ||
| Principal Amount | Value | |
| Foreign Government Bonds (continued) | ||
| Republic Of Serbia 0.5% | ||
| Serbia Government Bond | ||
| Series Reg S | ||
| 2.125%, due 12/1/30 | $ 550,000 | $ 506,072 |
| Romania 3.2% | ||
| Romanian Government Bond | ||
| Series Reg S | ||
| 2.75%, due 2/26/26 | EUR 500,000 | 661,795 |
| Series Reg S | ||
| 3.00%, due 2/14/31 | $ 500,000 | 508,290 |
| Series Reg S | ||
| 3.375%, due 2/8/38 | EUR 700,000 | 909,659 |
| Series Reg S | ||
| 3.624%, due 5/26/30 | 200,000 | 277,083 |
| Series Reg S | ||
| 4.00%, due 2/14/51 | $ 600,000 | 596,178 |
| Series Reg S | ||
| 5.125%, due 6/15/48 | 500,000 | 580,645 |
| 3,533,650 | ||
| Saudi Arabia 1.8% | ||
| Saudi Arabian Oil Co. | ||
| Series Reg S | ||
| 1.625%, due 11/24/25 | 250,000 | 253,161 |
| Series Reg S | ||
| 2.25%, due 11/24/30 | 700,000 | 676,474 |
| Series Reg S | ||
| 2.25%, due 11/24/30 | 300,000 | 289,917 |
| Series Reg S | ||
| 3.25%, due 11/24/50 | 900,000 | 825,357 |
| 2,044,909 | ||
| Senegal 0.6% | ||
| Senegal Government Bond | ||
| Series Reg S | ||
| 6.25%, due 5/23/33 | 400,000 | 419,000 |
| Series Reg S | ||
| 6.75%, due 3/13/48 | 250,000 | 251,270 |
| 670,270 | ||
| South Africa 4.0% | ||
| South Africa Government Bond | ||
| 4.85%, due 9/30/29 | 500,000 | 516,465 |
| 4.875%, due 4/14/26 | 1,000,000 | 1,065,000 |
| 5.75%, due 9/30/49 | 600,000 | 578,250 |
| Principal Amount | Value | |
| South Africa (continued) | ||
| South Africa Government Bond (continued) | ||
| 6.25%, due 3/8/41 | $ 500,000 | $ 524,800 |
| 8.00%, due 1/31/30 | ZAR 28,000,000 | 1,783,932 |
| 4,468,447 | ||
| Sri Lanka 0.9% | ||
| Sri Lanka Government Bond | ||
| Series Reg S | ||
| 6.20%, due 5/11/27 | $ 200,000 | 130,200 |
| Series Reg S | ||
| 6.75%, due 4/18/28 | 600,000 | 390,150 |
| Series Reg S | ||
| 6.85%, due 11/3/25 | 500,000 | 331,490 |
| Series Reg S | ||
| 7.55%, due 3/28/30 | 290,000 | 188,877 |
| 1,040,717 | ||
| Tunisia 1.0% | ||
| Banque Centrale de Tunisie International Bond | ||
| 5.625%, due 2/17/24 | EUR 650,000 | 741,595 |
| Series Reg S | ||
| 5.75%, due 1/30/25 | $ 400,000 | 374,560 |
| 1,116,155 | ||
| Turkey 1.3% | ||
| Turkey Government Bond | ||
| 5.75%, due 5/11/47 | 600,000 | 493,601 |
| 6.875%, due 3/17/36 | 1,000,000 | 979,500 |
| 1,473,101 | ||
| Ukraine 3.1% | ||
| Ukraine Government Bond | ||
| (zero coupon), due 5/31/40 (g) | 1,200,000 | 1,264,500 |
| Series Reg S | ||
| 6.876%, due 5/21/29 | 900,000 | 900,360 |
| Series Reg S | ||
| 7.253%, due 3/15/33 | 400,000 | 400,000 |
| Series Reg S | ||
| 7.75%, due 9/1/27 | 804,000 | 861,904 |
| 3,426,764 | ||
| United Arab Emirates 2.1% | ||
| Finance Department Government of Sharjah | ||
| Series Reg S | ||
| 3.625%, due 3/10/33 | 1,600,000 | 1,576,000 |
| 16 | MainStay Candriam Emerging Markets Debt Fund |
| Principal Amount | Value | |
| Foreign Government Bonds (continued) | ||
| United Arab Emirates (continued) | ||
| Finance Department Government of Sharjah (continued) | ||
| Series Reg S | ||
| 4.00%, due 7/28/50 | $ 800,000 | $ 698,928 |
| 2,274,928 | ||
| Uruguay 0.5% | ||
| Uruguay Government Bond | ||
| 5.10%, due 6/18/50 | 400,000 | 501,472 |
| Uzbekistan 1.9% | ||
| Republic of Uzbekistan Bond | ||
| Series Reg S | ||
| 3.70%, due 11/25/30 | 1,300,000 | 1,291,854 |
| Series Reg S | ||
| 5.375%, due 2/20/29 | 700,000 | 781,158 |
| 2,073,012 | ||
| Venezuela 0.6% | ||
| Petroleos de Venezuela SA (b)(c)(d) | ||
| Series Reg S | ||
| 6.00%, due 5/16/24 | 2,500,000 | 108,750 |
| Series Reg S | ||
| 6.00%, due 11/15/26 (g) | 2,500,000 | 108,750 |
| Venezuela Government Bond | ||
| 9.25%, due 5/7/28 (b)(c)(d) | 4,095,000 | 417,690 |
| 635,190 | ||
| Zambia 0.4% | ||
| Zambia Government Bond | ||
| Series Reg S | ||
| 8.97%, due 7/30/27 (d) | 800,000 | 482,634 |
| Total Foreign Government Bonds (Cost $101,068,586) | 95,468,145 | |
| Total Long-Term Bonds (Cost $110,846,103) | 104,310,678 | |
| Shares | Value | ||
| Short-Term Investment 2.0% | |||
| Unaffiliated Investment Company 2.0% | |||
| United States 2.0% | |||
| BlackRock Liquidity FedFund, 0.05% (h)(i) | 2,211,750 | $ 2,211,750 | |
| Total Short-Term Investment (Cost $2,211,750) | 2,211,750 | ||
| Total Investments (Cost $113,057,853) | 96.1% | 106,522,428 | |
| Other Assets, Less Liabilities | 3.9 | 4,316,075 | |
| Net Assets | 100.0% | $ 110,838,503 | |
| † | Percentages indicated are based on Fund net assets. |
| (a) | All or a portion of this security was held on loan. As of April 30, 2021, the aggregate market value of securities on loan was $2,156,154. The Fund received cash collateral with a value of $2,211,750. (See Note 2(K)) |
| (b) | Issue in default. |
| (c) | Illiquid security—As of April 30, 2021, the total market value deemed illiquid under procedures approved by the Board of Trustees was $765,690, which represented 0.7% of the Fund’s net assets. |
| (d) | Issue in non-accrual status. |
| (e) | Step coupon—Rate shown was the rate in effect as of April 30, 2021. |
| (f) | May be sold to institutional investors only under Rule 144A or securities offered pursuant to Section 4(a)(2) of the Securities Act of 1933, as amended. |
| (g) | Coupon rate may change based on changes of the underlying collateral or prepayments of principal. Rate shown was the rate in effect as of April 30, 2021. |
| (h) | Current yield as of April 30, 2021. |
| (i) | Represents a security purchased with cash collateral received for securities on loan. |
| Currency Purchased | Currency Sold | Counterparty | Settlement Date | Unrealized Appreciation (Depreciation) | ||
| USD | 2,508,674 | EUR | 2,100,000 | JPMorgan Chase Bank N.A. | 5/19/21 | $ (16,803) |
| USD | 360,370 | EUR | 300,000 | JPMorgan Chase Bank N.A. | 5/19/21 | (413) |
| USD | 1,806,270 | ZAR | 27,000,000 | JPMorgan Chase Bank N.A. | 5/19/21 | (51,495) |
| Total Unrealized Depreciation | $ (68,711) | |||||
| 1. | Foreign Currency Forward Contracts are subject to limitations such that they cannot be “sold or repurchased,” although the Fund would be able to exit the transaction through other means, such as through the execution of an offsetting transaction. |
| Type | Number of Contracts | Expiration Date | Value at Trade Date | Current Notional Amount | Unrealized Appreciation (Depreciation)2 |
| Short Contracts | |||||
| U.S. Treasury 10 Year Ultra Bonds | (110) | June 2021 | $ (16,200,297) | $ (16,010,156) | $ 190,141 |
| Euro-Bund | (13) | June 2021 | (2,661,298) | (2,656,973) | 4,325 |
| Net Unrealized Appreciation | $ 194,466 |
| 1. | As of April 30, 2021, cash in the amount of $337,477 was on deposit with a broker or futures commission merchant for futures transactions. |
| 2. | Represents the difference between the value of the contracts at the time they were opened and the value as of April 30, 2021. |
| Abbreviation(s): |
| EUR—Euro |
| USD—United States Dollar |
| ZAR—South African Rand |
| 18 | MainStay Candriam Emerging Markets Debt Fund |
| Description | Quoted Prices in Active Markets for Identical Assets (Level 1) | Significant Other Observable Inputs (Level 2) | Significant Unobservable Inputs (Level 3) | Total | |||
| Asset Valuation Inputs | |||||||
| Investments in Securities (a) | |||||||
| Long-Term Bonds | |||||||
| Corporate Bonds | $ — | $ 8,842,533 | $ — | $ 8,842,533 | |||
| Foreign Government Bonds | — | 95,468,145 | — | 95,468,145 | |||
| Total Long-Term Bonds | — | 104,310,678 | — | 104,310,678 | |||
| Short-Term Investment | |||||||
| Unaffiliated Investment Company | 2,211,750 | — | — | 2,211,750 | |||
| Total Investments in Securities | 2,211,750 | 104,310,678 | — | 106,522,428 | |||
| Other Financial Instruments | |||||||
| Futures Contracts (b) | 194,466 | — | — | 194,466 | |||
| Total Investments in Securities and Other Financial Instruments | $ 2,406,216 | $ 104,310,678 | $ — | $ 106,716,894 | |||
| Liability Valuation Inputs | |||||||
| Other Financial Instruments | |||||||
| Foreign Currency Forward Contracts (b) | $ — | $ (68,711) | $ — | $ (68,711) |
| (a) | For a complete listing of investments and their industries, see the Portfolio of Investments. |
| (b) | The value listed for these securities reflects unrealized appreciation (depreciation) as shown on the Portfolio of Investments. |
| Assets | |
| Investment in securities, at value (identified cost $113,057,853) including securities on loan of $2,156,154 | $106,522,428 |
| Cash collateral on deposit at broker for futures contracts | 337,477 |
| Cash denominated in foreign currencies (identified cost $52,780) | 52,940 |
| Cash | 1,586,654 |
| Due from custodian | 58,125 |
| Receivables: | |
| Investment securities sold | 2,233,335 |
| Variation margin on futures contracts | 1,511,276 |
| Interest | 1,436,010 |
| Fund shares sold | 74,482 |
| Securities lending | 519 |
| Other assets | 56,581 |
| Total assets | 113,869,827 |
| Liabilities | |
| Cash collateral received for securities on loan | 2,211,750 |
| Payables: | |
| Investment securities purchased | 484,725 |
| Fund shares redeemed | 70,267 |
| Manager (See Note 3) | 49,956 |
| Professional fees | 47,607 |
| Transfer agent (See Note 3) | 36,980 |
| NYLIFE Distributors (See Note 3) | 24,730 |
| Shareholder communication | 24,121 |
| Custodian | 11,118 |
| Accrued expenses | 1,359 |
| Unrealized depreciation on foreign currency forward contracts | 68,711 |
| Total liabilities | 3,031,324 |
| Net assets | $110,838,503 |
| Composition of Net Assets | |
| Shares of beneficial interest outstanding (par value of $.01 per share) unlimited number of shares authorized | $ 111,238 |
| Additional paid-in-capital | 131,729,263 |
| 131,840,501 | |
| Total distributable earnings (loss) | (21,001,998) |
| Net assets | $110,838,503 |
| Class A | |
| Net assets applicable to outstanding shares | $84,398,730 |
| Shares of beneficial interest outstanding | 8,473,506 |
| Net asset value per share outstanding | $ 9.96 |
| Maximum sales charge (4.50% of offering price) | 0.47 |
| Maximum offering price per share outstanding | $ 10.43 |
| Investor Class | |
| Net assets applicable to outstanding shares | $13,634,542 |
| Shares of beneficial interest outstanding | 1,354,454 |
| Net asset value per share outstanding | $ 10.07 |
| Maximum sales charge (4.00% of offering price) | 0.42 |
| Maximum offering price per share outstanding | $ 10.49 |
| Class B | |
| Net assets applicable to outstanding shares | $ 1,353,227 |
| Shares of beneficial interest outstanding | 138,810 |
| Net asset value and offering price per share outstanding | $ 9.75 |
| Class C | |
| Net assets applicable to outstanding shares | $ 4,158,302 |
| Shares of beneficial interest outstanding | 425,885 |
| Net asset value and offering price per share outstanding | $ 9.76 |
| Class I | |
| Net assets applicable to outstanding shares | $ 7,293,702 |
| Shares of beneficial interest outstanding | 731,138 |
| Net asset value and offering price per share outstanding | $ 9.98 |
| 20 | MainStay Candriam Emerging Markets Debt Fund |
| Investment Income (Loss) | |
| Income | |
| Interest (net of foreign tax withholding of $6,677) | $2,504,062 |
| Securities lending | 3,521 |
| Dividends-affiliated | 32 |
| Total income | 2,507,615 |
| Expenses | |
| Manager (See Note 3) | 394,891 |
| Distribution/Service—Class A (See Note 3) | 105,929 |
| Distribution/Service—Investor Class (See Note 3) | 17,186 |
| Distribution/Service—Class B (See Note 3) | 7,905 |
| Distribution/Service—Class C (See Note 3) | 28,547 |
| Transfer agent (See Note 3) | 106,603 |
| Registration | 42,208 |
| Professional fees | 41,979 |
| Custodian | 16,603 |
| Shareholder communication | 15,935 |
| Trustees | 1,258 |
| Insurance | 471 |
| Miscellaneous | 5,539 |
| Total expenses before waiver/reimbursement | 785,054 |
| Expense waiver/reimbursement from Manager (See Note 3) | (74,712) |
| Net expenses | 710,342 |
| Net investment income (loss) | 1,797,273 |
| Realized and Unrealized Gain (Loss) | |
| Net realized gain (loss) on: | |
| Unaffiliated investment transactions | 162,318 |
| Futures transactions | 240,710 |
| Foreign currency transactions | 125,986 |
| Foreign currency forward transactions | (221,329) |
| Net realized gain (loss) | 307,685 |
| Net change in unrealized appreciation (depreciation) on: | |
| Unaffiliated investments | 2,718,505 |
| Futures contracts | 194,466 |
| Foreign currency forward contracts | (99,085) |
| Translation of other assets and liabilities in foreign currencies | 8,870 |
| Net change in unrealized appreciation (depreciation) | 2,822,756 |
| Net realized and unrealized gain (loss) | 3,130,441 |
| Net increase (decrease) in net assets resulting from operations | $4,927,714 |
for the six months ended April 30, 2021 (Unaudited) and the year ended October 31, 2020
| 2021 | 2020 | |
| Increase (Decrease) in Net Assets | ||
| Operations: | ||
| Net investment income (loss) | $ 1,797,273 | $ 5,646,222 |
| Net realized gain (loss) | 307,685 | (4,508,919) |
| Net change in unrealized appreciation (depreciation) | 2,822,756 | (6,122,854) |
| Net increase (decrease) in net assets resulting from operations | 4,927,714 | (4,985,551) |
| Distributions to shareholders: | ||
| Class A | (2,454,021) | (3,904,404) |
| Investor Class | (376,751) | (606,354) |
| Class B | (39,620) | (75,657) |
| Class C | (147,545) | (304,393) |
| Class I | (212,188) | (515,800) |
| Total distributions to shareholders | (3,230,125) | (5,406,608) |
| Capital share transactions: | ||
| Net proceeds from sales of shares | 6,378,732 | 12,038,594 |
| Net asset value of shares issued to shareholder in reinvestment of distributions | 3,057,843 | 5,139,994 |
| Cost of shares redeemed | (11,811,847) | (35,678,634) |
| Increase (decrease) in net assets derived from capital share transactions | (2,375,272) | (18,500,046) |
| Net increase (decrease) in net assets | (677,683) | (28,892,205) |
| Net Assets | ||
| Beginning of period | 111,516,186 | 140,408,391 |
| End of period | $110,838,503 | $111,516,186 |
| 22 | MainStay Candriam Emerging Markets Debt Fund |
| Six months ended April 30, 2021* | Year Ended October 31, | ||||||||||
| Class A | 2020 | 2019 | 2018 | 2017 | 2016 | ||||||
| Net asset value at beginning of period | $ 9.81 | $ 10.46 | $ 9.71 | $ 10.88 | $ 10.52 | $ 9.60 | |||||
| Net investment income (loss) (a) | 0.16 | 0.47 | 0.49 | 0.45 | 0.53 | 0.57 | |||||
| Net realized and unrealized gain (loss) on investments | 0.27 | (0.65) | 0.76 | (1.19) | 0.31 | 0.87 | |||||
| Net realized and unrealized gain (loss) on foreign currency transactions | 0.01 | (0.02) | 0.00‡ | (0.00)‡ | (0.01) | 0.01 | |||||
| Total from investment operations | 0.44 | (0.20) | 1.25 | (0.74) | 0.83 | 1.45 | |||||
| Less distributions: | |||||||||||
| From net investment income | (0.29) | (0.45) | (0.50) | (0.43) | (0.36) | (0.29) | |||||
| Return of capital | — | — | — | — | (0.11) | (0.24) | |||||
| Total distributions | (0.29) | (0.45) | (0.50) | (0.43) | (0.47) | (0.53) | |||||
| Net asset value at end of period | $ 9.96 | $ 9.81 | $ 10.46 | $ 9.71 | $ 10.88 | $ 10.52 | |||||
| Total investment return (b) | 4.47% | (1.80)% | 13.05% | (6.95)% | 8.18% | 15.63% | |||||
| Ratios (to average net assets)/Supplemental Data: | |||||||||||
| Net investment income (loss) | 3.26%†† | 4.70% | 4.78% | 4.36% | 5.04% | 5.70% (c) | |||||
| Net expenses (d) | 1.16%†† | 1.17% | 1.23% | 1.26% | 1.22% | 1.22% (e) | |||||
| Expenses (before waiver/reimbursement) (d) | 1.29%†† | 1.33% | 1.26% | 1.26% | 1.22% | 1.22% | |||||
| Portfolio turnover rate | 63% | 102% | 102% | 44% | 37% | 38% | |||||
| Net assets at end of period (in 000’s) | $ 84,399 | $ 82,874 | $ 93,472 | $ 86,452 | $ 110,238 | $ 109,657 | |||||
| * | Unaudited. |
| ‡ | Less than one cent per share. |
| †† | Annualized. |
| (a) | Per share data based on average shares outstanding during the period. |
| (b) | Total investment return is calculated exclusive of sales charges and assumes the reinvestment of dividends and distributions. For periods of less than one year, total return is not annualized. |
| (c) | Without the custody fee reimbursement, net investment income (loss) would have been 5.69%. |
| (d) | In addition to the fees and expenses which the Fund bears directly, it also indirectly bears a pro-rata share of the fees and expenses of the underlying funds in which it invests. Such indirect expenses are not included in the above expense ratios. |
| (e) | Without the custody fee reimbursement, net expenses would have been 1.23%. |
| Six months ended April 30, 2021* | Year Ended October 31, | ||||||||||
| Investor Class | 2020 | 2019 | 2018 | 2017 | 2016 | ||||||
| Net asset value at beginning of period | $ 9.91 | $ 10.57 | $ 9.80 | $ 10.98 | $ 10.61 | $ 9.68 | |||||
| Net investment income (loss) (a) | 0.15 | 0.44 | 0.47 | 0.43 | 0.52 | 0.55 | |||||
| Net realized and unrealized gain (loss) on investments | 0.28 | (0.66) | 0.77 | (1.20) | 0.31 | 0.88 | |||||
| Net realized and unrealized gain (loss) on foreign currency transactions | 0.01 | (0.02) | 0.00‡ | (0.00)‡ | (0.01) | 0.01 | |||||
| Total from investment operations | 0.44 | (0.24) | 1.24 | (0.77) | 0.82 | 1.44 | |||||
| Less distributions: | |||||||||||
| From net investment income | (0.28) | (0.42) | (0.47) | (0.41) | (0.35) | (0.27) | |||||
| Return of capital | — | — | — | — | (0.10) | (0.24) | |||||
| Total distributions | (0.28) | (0.42) | (0.47) | (0.41) | (0.45) | (0.51) | |||||
| Net asset value at end of period | $ 10.07 | $ 9.91 | $ 10.57 | $ 9.80 | $ 10.98 | $ 10.61 | |||||
| Total investment return (b) | 4.37% | (2.20)% | 12.82% | (7.18)% | 7.99% | 15.38% | |||||
| Ratios (to average net assets)/Supplemental Data: | |||||||||||
| Net investment income (loss) | 2.93%†† | 4.38% | 4.50% | 4.15% | 4.86% | 5.50% (c) | |||||
| Net expenses (d) | 1.52%†† | 1.49% | 1.52% | 1.47% | 1.42% | 1.42% (e) | |||||
| Expenses (before waiver/reimbursement) (d) | 1.65%†† | 1.66% | 1.56% | 1.49% | 1.42% | 1.42% | |||||
| Portfolio turnover rate | 63% | 102% | 102% | 44% | 37% | 38% | |||||
| Net assets at end of period (in 000’s) | $ 13,635 | $ 13,801 | $ 16,024 | $ 15,911 | $ 18,613 | $ 32,318 | |||||
| * | Unaudited. |
| ‡ | Less than one cent per share. |
| †† | Annualized. |
| (a) | Per share data based on average shares outstanding during the period. |
| (b) | Total investment return is calculated exclusive of sales charges and assumes the reinvestment of dividends and distributions. For periods of less than one year, total return is not annualized. |
| (c) | Without the custody fee reimbursement, net investment income (loss) would have been 5.49%. |
| (d) | In addition to the fees and expenses which the Fund bears directly, it also indirectly bears a pro-rata share of the fees and expenses of the underlying funds in which it invests. Such indirect expenses are not included in the above expense ratios. |
| (e) | Without the custody fee reimbursement, net expenses would have been 1.43%. |
| 24 | MainStay Candriam Emerging Markets Debt Fund |
| Six months ended April 30, 2021* | Year Ended October 31, | ||||||||||
| Class B | 2020 | 2019 | 2018 | 2017 | 2016 | ||||||
| Net asset value at beginning of period | $ 9.61 | $ 10.26 | $ 9.52 | $ 10.69 | $ 10.34 | $ 9.44 | |||||
| Net investment income (loss) (a) | 0.12 | 0.36 | 0.38 | 0.34 | 0.43 | 0.47 | |||||
| Net realized and unrealized gain (loss) on investments | 0.25 | (0.64) | 0.75 | (1.18) | 0.30 | 0.86 | |||||
| Net realized and unrealized gain (loss) on foreign currency transactions | 0.01 | (0.02) | 0.00‡ | 0.00‡ | (0.01) | 0.01 | |||||
| Total from investment operations | 0.38 | (0.30) | 1.13 | (0.84) | 0.72 | 1.34 | |||||
| Less distributions: | |||||||||||
| From net investment income | (0.24) | (0.35) | (0.39) | (0.33) | (0.29) | (0.20) | |||||
| Return of capital | — | — | — | — | (0.08) | (0.24) | |||||
| Total distributions | (0.24) | (0.35) | (0.39) | (0.33) | (0.37) | (0.44) | |||||
| Net asset value at end of period | $ 9.75 | $ 9.61 | $ 10.26 | $ 9.52 | $ 10.69 | $ 10.34 | |||||
| Total investment return (b) | 3.94% | (2.91)% | 12.04% | (7.98)% | 7.20% | 14.60% | |||||
| Ratios (to average net assets)/Supplemental Data: | |||||||||||
| Net investment income (loss) | 2.35%†† | 3.66% | 3.76% | 3.37% | 4.11% | 4.78% (c) | |||||
| Net expenses (d) | 2.27%†† | 2.24% | 2.27% | 2.22% | 2.17% | 2.17% (e) | |||||
| Expenses (before waiver/reimbursement) (d) | 2.40%†† | 2.40% | 2.31% | 2.24% | 2.17% | 2.17% | |||||
| Portfolio turnover rate | 63% | 102% | 102% | 44% | 37% | 38% | |||||
| Net assets at end of period (in 000’s) | $ 1,353 | $ 1,789 | $ 2,663 | $ 3,660 | $ 6,012 | $ 7,506 | |||||
| * | Unaudited. |
| ‡ | Less than one cent per share. |
| †† | Annualized. |
| (a) | Per share data based on average shares outstanding during the period. |
| (b) | Total investment return is calculated exclusive of sales charges and assumes the reinvestment of dividends and distributions. For periods of less than one year, total return is not annualized. |
| (c) | Without the custody fee reimbursement, net investment income (loss) would have been 4.77%. |
| (d) | In addition to the fees and expenses which the Fund bears directly, it also indirectly bears a pro-rata share of the fees and expenses of the underlying funds in which it invests. Such indirect expenses are not included in the above expense ratios. |
| (e) | Without the custody fee reimbursement, net expenses would have been 2.18%. |
| Six months ended April 30, 2021* | Year Ended October 31, | ||||||||||
| Class C | 2020 | 2019 | 2018 | 2017 | 2016 | ||||||
| Net asset value at beginning of period | $ 9.63 | $ 10.27 | $ 9.54 | $ 10.70 | $ 10.35 | $ 9.45 | |||||
| Net investment income (loss) (a) | 0.12 | 0.36 | 0.38 | 0.35 | 0.43 | 0.47 | |||||
| Net realized and unrealized gain (loss) on investments | 0.24 | (0.64) | 0.74 | (1.18) | 0.29 | 0.86 | |||||
| Net realized and unrealized gain (loss) on foreign currency transactions | 0.01 | (0.02) | 0.00‡ | (0.00)‡ | (0.00)‡ | 0.01 | |||||
| Total from investment operations | 0.37 | (0.30) | 1.12 | (0.83) | 0.72 | 1.34 | |||||
| Less distributions: | |||||||||||
| From net investment income | (0.24) | (0.34) | (0.39) | (0.33) | (0.29) | (0.20) | |||||
| Return of capital | — | — | — | — | (0.08) | (0.24) | |||||
| Total distributions | (0.24) | (0.34) | (0.39) | (0.33) | (0.37) | (0.44) | |||||
| Net asset value at end of period | $ 9.76 | $ 9.63 | $ 10.27 | $ 9.54 | $ 10.70 | $ 10.35 | |||||
| Total investment return (b) | 3.83% | (2.81)% | 11.91% | (7.88)% | 7.19% | 14.58% | |||||
| Ratios (to average net assets)/Supplemental Data: | |||||||||||
| Net investment income (loss) | 2.41%†† | 3.68% | 3.78% | 3.39% | 4.11% | 4.77% (c) | |||||
| Net expenses (d) | 2.27%†† | 2.24% | 2.27% | 2.22% | 2.17% | 2.17% (e) | |||||
| Expenses (before waiver/reimbursement) (d) | 2.40%†† | 2.40% | 2.31% | 2.24% | 2.17% | 2.17% | |||||
| Portfolio turnover rate | 63% | 102% | 102% | 44% | 37% | 38% | |||||
| Net assets at end of period (in 000’s) | $ 4,158 | $ 6,365 | $ 11,150 | $ 19,246 | $ 28,270 | $ 35,789 | |||||
| * | Unaudited. |
| ‡ | Less than one cent per share. |
| †† | Annualized. |
| (a) | Per share data based on average shares outstanding during the period. |
| (b) | Total investment return is calculated exclusive of sales charges and assumes the reinvestment of dividends and distributions. For periods of less than one year, total return is not annualized. |
| (c) | Without the custody fee reimbursement, net investment income (loss) would have been 4.76%. |
| (d) | In addition to the fees and expenses which the Fund bears directly, it also indirectly bears a pro-rata share of the fees and expenses of the underlying funds in which it invests. Such indirect expenses are not included in the above expense ratios. |
| (e) | Without the custody fee reimbursement, net expenses would have been 2.18%. |
| 26 | MainStay Candriam Emerging Markets Debt Fund |
| Six months ended April 30, 2021* | Year Ended October 31, | ||||||||||
| Class I | 2020 | 2019 | 2018 | 2017 | 2016 | ||||||
| Net asset value at beginning of period | $ 9.82 | $ 10.48 | $ 9.72 | $ 10.90 | $ 10.53 | $ 9.61 | |||||
| Net investment income (loss) (a) | 0.18 | 0.51 | 0.52 | 0.48 | 0.56 | 0.59 | |||||
| Net realized and unrealized gain (loss) on investments | 0.28 | (0.67) | 0.76 | (1.20) | 0.32 | 0.88 | |||||
| Net realized and unrealized gain (loss) on foreign currency transactions | 0.01 | (0.02) | 0.00‡ | (0.00)‡ | (0.01) | 0.01 | |||||
| Total from investment operations | 0.47 | (0.18) | 1.28 | (0.72) | 0.87 | 1.48 | |||||
| Less distributions: | |||||||||||
| From net investment income | (0.31) | (0.48) | (0.52) | (0.46) | (0.39) | (0.32) | |||||
| Return of capital | — | — | — | — | (0.11) | (0.24) | |||||
| Total distributions | (0.31) | (0.48) | (0.52) | (0.46) | (0.50) | (0.56) | |||||
| Net asset value at end of period | $ 9.98 | $ 9.82 | $ 10.48 | $ 9.72 | $ 10.90 | $ 10.53 | |||||
| Total investment return (b) | 4.73% | (1.59)% | 13.46% | (6.80)% | 8.54% | 15.90% | |||||
| Ratios (to average net assets)/Supplemental Data: | |||||||||||
| Net investment income (loss) | 3.60%†† | 5.09% | 4.99% | 4.60% | 5.22% | 5.96% (c) | |||||
| Net expenses (d) | 0.85%†† | 0.85% | 0.94% | 1.01% | 0.97% | 0.97% (e) | |||||
| Expenses (before waiver/reimbursement) (d) | 1.04%†† | 1.07% | 1.01% | 1.01% | 0.97% | 0.97% | |||||
| Portfolio turnover rate | 63% | 102% | 102% | 44% | 37% | 38% | |||||
| Net assets at end of period (in 000’s) | $ 7,294 | $ 6,687 | $ 17,100 | $ 10,428 | $ 22,717 | $ 13,759 | |||||
| * | Unaudited. |
| ‡ | Less than one cent per share. |
| †† | Annualized. |
| (a) | Per share data based on average shares outstanding during the period. |
| (b) | Total investment return is calculated exclusive of sales charges and assumes the reinvestment of dividends and distributions. Class I shares are not subject to sales charges. For periods of less than one year, total return is not annualized. |
| (c) | Without the custody fee reimbursement, net investment income (loss) would have been 5.95%. |
| (d) | In addition to the fees and expenses which the Fund bears directly, it also indirectly bears a pro-rata share of the fees and expenses of the underlying funds in which it invests. Such indirect expenses are not included in the above expense ratios. |
| (e) | Without the custody fee reimbursement, net expenses would have been 0.98%. |
| Class | Commenced Operations |
| Class A | June 1, 1998 |
| Investor Class | February 28, 2008 |
| Class B | June 1, 1998 |
| Class C | September 1, 1998 |
| Class I | August 31, 2007 |
| Class R6 | N/A* |
| SIMPLE Class | N/A* |
| * | Class R6 shares were registered for sale effective as of February 28, 2017 and SIMPLE Class shares were registered for sale effective as of August 31, 2020 but have not yet commenced operations. |
| 28 | MainStay Candriam Emerging Markets Debt Fund |
| • | Level 1—quoted prices in active markets for an identical asset or liability |
| • | Level 2—other significant observable inputs (including quoted prices for a similar asset or liability in active markets, interest rates and yield curves, prepayment speeds, credit risk, etc.) |
| • | Level 3—significant unobservable inputs (including the Fund's own assumptions about the assumptions that market participants would use in measuring fair value of an asset or liability) |
| • Benchmark yields | • Reported trades |
| • Broker/dealer quotes | • Issuer spreads |
| • Two-sided markets | • Benchmark securities |
| • Bids/offers | • Reference data (corporate actions or material event notices) |
| • Industry and economic events | • Comparable bonds |
| • Monthly payment information |
| 30 | MainStay Candriam Emerging Markets Debt Fund |
| 32 | MainStay Candriam Emerging Markets Debt Fund |
| Asset Derivatives | Interest Rate Contracts Risk | Total |
| Futures Contracts - Net Assets—Net unrealized appreciation on futures contracts (a) | $194,466 | $194,466 |
| Total Fair Value | $194,466 | $194,466 |
| (a) | Includes cumulative appreciation (depreciation) of futures contracts as reported in the Portfolio of Investments. Only current day’s variation margin is reported within the Statement of Assets and Liabilities. |
| Liability Derivatives | Foreign Exchange Contracts Risk | Total |
| Forward Contracts - Unrealized depreciation on foreign currency forward contracts | $(68,711) | $(68,711) |
| Total Fair Value | $(68,711) | $(68,711) |
| Net Realized Gain (Loss) from: | Foreign Exchange Contracts Risk | Interest Rate Contracts Risk | Total |
| Futures Contracts | $ — | $240,710 | $ 240,710 |
| Forward Contracts | (221,329) | — | (221,329) |
| Total Net Realized Gain (Loss) | $(221,329) | $240,710 | $ 19,381 |
| Net Change in Unrealized Appreciation (Depreciation) | Foreign Exchange Contracts Risk | Interest Rate Contracts Risk | Total |
| Futures Contracts | $ — | $194,466 | $194,466 |
| Forward Contracts | (99,085) | — | (99,085) |
| Total Net Change in Unrealized Appreciation (Depreciation) | $(99,085) | $194,466 | $ 95,381 |
| Average Notional Amount | Total |
| Futures Contracts Short (a) | $(17,734,772) |
| Forward Contracts Long (b) | $ 1,095,386 |
| Forward Contracts Short | $ (4,813,566) |
| (a) | Positions were open three months during the reporting period. |
| (b) | Positions were open one month during the reporting period. |
| 34 | MainStay Candriam Emerging Markets Debt Fund |
| Class | Expense | Waived |
| Class A | $51,612 | $— |
| Investor Class | 33,140 | — |
| Class B | 3,807 | — |
| Class C | 13,752 | — |
| Class I | 4,292 | — |
| Affiliated Investment Companies | Value, Beginning of Period | Purchases at Cost | Proceeds from Sales | Net Realized Gain/(Loss) on Sales | Change in Unrealized Appreciation/ (Depreciation) | Value, End of Period | Dividend Income | Other Distributions | Shares End of Period |
| MainStay U.S. Government Liquidity Fund | $ 5,821 | $ 5,161 | $ (10,982) | $ — | $ — | $ — | $ —(a) | $ — | — |
| (a) | Less than $500. |
| Federal Tax Cost | Gross Unrealized Appreciation | Gross Unrealized (Depreciation) | Net Unrealized Appreciation/ (Depreciation) | |
| Investments | $113,225,181 | $2,636,489 | $(9,339,242) | $(6,702,753) |
| Capital Loss Available Through | Short-Term Capital Loss Amounts (000’s) | Long-Term Capital Loss Amounts (000’s) |
| Unlimited | $3,596 | $9,486 |
| 2020 | |
| Distributions paid from: | |
| Ordinary Income | $5,406,608 |
| 36 | MainStay Candriam Emerging Markets Debt Fund |
| Class A | Shares | Amount |
| Period ended April 30, 2021: | ||
| Shares sold | 469,744 | $ 4,737,463 |
| Shares issued to shareholders in reinvestment of distributions | 226,974 | 2,303,385 |
| Shares redeemed | (759,682) | (7,653,476) |
| Net increase (decrease) in shares outstanding before conversion | (62,964) | (612,628) |
| Shares converted into Class A (See Note 1) | 86,957 | 875,350 |
| Net increase (decrease) | 23,993 | $ 262,722 |
| Year ended October 31, 2020: | ||
| Shares sold | 696,868 | $ 6,940,578 |
| Shares issued to shareholders in reinvestment of distributions | 375,972 | 3,684,567 |
| Shares redeemed | (1,678,861) | (16,459,620) |
| Net increase (decrease) in shares outstanding before conversion | (606,021) | (5,834,475) |
| Shares converted into Class A (See Note 1) | 125,083 | 1,241,731 |
| Shares converted from Class A (See Note 1) | (3,814) | (32,724) |
| Net increase (decrease) | (484,752) | $ (4,625,468) |
| Investor Class | Shares | Amount |
| Period ended April 30, 2021: | ||
| Shares sold | 19,795 | $ 202,834 |
| Shares issued to shareholders in reinvestment of distributions | 35,564 | 364,991 |
| Shares redeemed | (88,253) | (901,210) |
| Net increase (decrease) in shares outstanding before conversion | (32,894) | (333,385) |
| Shares converted into Investor Class (See Note 1) | 44,451 | 444,372 |
| Shares converted from Investor Class (See Note 1) | (49,443) | (510,328) |
| Net increase (decrease) | (37,886) | $ (399,341) |
| Year ended October 31, 2020: | ||
| Shares sold | 84,985 | $ 814,508 |
| Shares issued to shareholders in reinvestment of distributions | 60,127 | 595,107 |
| Shares redeemed | (219,231) | (2,167,018) |
| Net increase (decrease) in shares outstanding before conversion | (74,119) | (757,403) |
| Shares converted into Investor Class (See Note 1) | 43,802 | 437,065 |
| Shares converted from Investor Class (See Note 1) | (93,645) | (945,640) |
| Net increase (decrease) | (123,962) | $ (1,265,978) |
| Class B | Shares | Amount |
| Period ended April 30, 2021: | ||
| Shares sold | 566 | $ 5,628 |
| Shares issued to shareholders in reinvestment of distributions | 3,408 | 33,999 |
| Shares redeemed | (35,217) | (348,264) |
| Net increase (decrease) in shares outstanding before conversion | (31,243) | (308,637) |
| Shares converted from Class B (See Note 1) | (16,082) | (158,711) |
| Net increase (decrease) | (47,325) | $ (467,348) |
| Year ended October 31, 2020: | ||
| Shares sold | 3,472 | $ 31,047 |
| Shares issued to shareholders in reinvestment of distributions | 6,737 | 64,708 |
| Shares redeemed | (47,132) | (446,113) |
| Net increase (decrease) in shares outstanding before conversion | (36,923) | (350,358) |
| Shares converted from Class B (See Note 1) | (36,532) | (357,664) |
| Net increase (decrease) | (73,455) | $ (708,022) |
| Class C | Shares | Amount |
| Period ended April 30, 2021: | ||
| Shares sold | 25,037 | $ 246,312 |
| Shares issued to shareholders in reinvestment of distributions | 14,610 | 146,013 |
| Shares redeemed | (207,527) | (2,033,326) |
| Net increase (decrease) in shares outstanding before conversion | (167,880) | (1,641,001) |
| Shares converted from Class C (See Note 1) | (67,482) | (650,683) |
| Net increase (decrease) | (235,362) | $ (2,291,684) |
| Year ended October 31, 2020: | ||
| Shares sold | 60,247 | $ 591,756 |
| Shares issued to shareholders in reinvestment of distributions | 29,700 | 285,515 |
| Shares redeemed | (478,295) | (4,597,030) |
| Net increase (decrease) in shares outstanding before conversion | (388,348) | (3,719,759) |
| Shares converted from Class C (See Note 1) | (35,796) | (342,768) |
| Net increase (decrease) | (424,144) | $ (4,062,527) |
| Class I | Shares | Amount |
| Period ended April 30, 2021: | ||
| Shares sold | 116,852 | $ 1,186,495 |
| Shares issued to shareholders in reinvestment of distributions | 20,629 | 209,455 |
| Shares redeemed | (87,122) | (875,571) |
| Net increase (decrease) | 50,359 | $ 520,379 |
| Year ended October 31, 2020: | ||
| Shares sold | 353,067 | $ 3,660,705 |
| Shares issued to shareholders in reinvestment of distributions | 51,147 | 510,097 |
| Shares redeemed | (1,355,592) | (12,008,853) |
| Net increase (decrease) | (951,378) | $ (7,838,051) |
| 38 | MainStay Candriam Emerging Markets Debt Fund |
| 40 | MainStay Candriam Emerging Markets Debt Fund |
| 42 | MainStay Candriam Emerging Markets Debt Fund |
| 44 | MainStay Candriam Emerging Markets Debt Fund |
1.
| 2. | This Fund is registered for sale in CA, CT, DE, FL, MA, NJ, NY and VT. |
| 3. | An affiliate of New York Life Investment Management LLC. |
| 1738550MS071-21 | MSCEMD10-06/21 |
please log in to newyorklifeinvestments.com/accounts.
| Not FDIC/NCUA Insured | Not a Deposit | May Lose Value | No Bank Guarantee | Not Insured by Any Government Agency |


President

| Average Annual Total Returns for the Period-Ended April 30, 2021 | ||||||||
| Class | Sales Charge | Inception Date | Six Months | One Year of Since Inception | Five Years or Since Inception | Ten Years or Since Inception | Gross Expense Ratio1 | |
| Class A Shares2 | Maximum 3% Initial Sales Charge | With sales charges | 1/3/1995 | 12.53% | 19.46% | 6.81% | 6.92% | 1.03% |
| Excluding sales charges | 16.01 | 23.16 | 8.02 | 7.53 | 1.03 | |||
| Investor Class Shares3 | Maximum 2.5% Initial Sales Charge | With sales charges | 2/28/2008 | 13.06 | 19.30 | 6.67 | 6.72 | 1.18 |
| Excluding sales charges | 15.95 | 22.99 | 7.88 | 7.32 | 1.18 | |||
| Class B Shares4 | Maximum 5% CDSC | With sales charges | 12/29/1987 | 10.51 | 17.01 | 6.76 | 6.52 | 1.93 |
| if Redeemed Within the First Six Years of Purchase | Excluding sales charges | 15.51 | 22.01 | 7.06 | 6.52 | 1.93 | ||
| Class C Shares | Maximum 1% CDSC | With sales charges | 9/1/1998 | 14.49 | 21.00 | 7.06 | 6.52 | 1.93 |
| if Redeemed Within One Year of Purchase | Excluding sales charges | 15.49 | 22.00 | 7.06 | 6.52 | 1.93 | ||
| Class I Shares | No Sales Charge | 1/2/2004 | 16.15 | 23.45 | 8.29 | 7.79 | 0.78 | |
| Class R2 Shares | No Sales Charge | 2/27/2015 | 15.96 | 22.97 | 7.92 | 5.82 | 1.12 | |
| Class R3 Shares | No Sales Charge | 2/29/2016 | 15.82 | 22.73 | 7.65 | 8.64 | 1.38 | |
| Class R6 Shares | No Sales Charge | 2/28/2018 | 16.25 | 23.62 | 8.73 | N/A | 0.68 | |
| SIMPLE Class Shares | No Sales Charge | 8/31/2020 | 15.81 | 11.89 | N/A | N/A | 1.43 | |
| 1. | The gross expense ratios presented reflect the Fund’s “Total Annual Fund Operating Expenses” from the most recent Prospectus, as supplemented, and may differ from other expense ratios disclosed in this report. |
| 2. | Prior to November 4, 2019, the maximum initial sales charge applicable was 5.5%, which is reflected in the average annual total return figures shown. |
| 3. | Prior to June 30, 2020, the maximum initial sales charge for Investor Class shares was 3.0%, which is reflected in the average annual total return figures shown. |
| 4. | Class B shares are closed to all new purchases as well as additional investments by existing Class B shareholders. |
| Benchmark Performance | Six Months | One Year | Five Years | Ten Years |
| MSCI World Index (Net)1 | 29.10% | 45.33% | 14.03% | 9.92% |
| Bloomberg Barclays U.S. Aggregate Bond Index2 | -1.52 | -0.27 | 3.19 | 3.39 |
| Blended Benchmark Index3 | 16.11 | 25.45 | 9.87 | 7.53 |
| Morningstar World Allocation Category Average4 | 19.24 | 27.93 | 7.14 | 4.30 |
| 1. | The MSCI World Index (Net) is the Fund’s primary broad-based securities market index for comparison purposes. The MSCI World Index (Net) is a free float-adjusted market capitalization weighted index that is designed to measure the equity market performance of developed markets. Results assume reinvestment of all dividends and capital gains. An investment cannot be made directly in an index. |
| 2. | The Fund has selected the Bloomberg Barclays U.S. Aggregate Bond Index as a secondary benchmark. The Bloomberg Barclays U.S. Aggregate Bond Index measures performance of the investment-grade, U.S. dollar-denominated, fixed-rate taxable bond market, including Treasurys, government-related and corporate securities, mortgage-backed securities (agency fixed-rate and hybrid adjustable-rate mortgage pass-throughs), asset-backed securities and commercial mortgage-backed securities. Results assume reinvestment of all dividends and capital gains. An investment cannot be made directly in an index. |
| 3. | The Fund has selected the Blended Benchmark Index as an additional benchmark. The Blended Benchmark Index consists of the 60% MSCI World Index and 40% of the Bloomberg Barclays U.S. Aggregate Bond Index, respectively. Results assume reinvestment of all dividends and capital gains. An investment cannot be made directly in an index. |
| 4. | The Morningstar World Allocation Category Average is representative of funds that seek to provide both capital appreciation and income by investing in three major areas: stocks, bonds, and cash. While these funds do explore the whole world, most of them focus on the U.S., Canada, Japan, and the larger markets in Europe. It is rare for such funds to invest more than 10% of their assets in emerging markets. These funds typically have at least 10% of assets in bonds, less than 70% of assets in stocks, and at least 40% of assets in non-U.S. stocks or bonds. Results are based on average total returns of similar funds with all dividends and capital gain distributions reinvested. |
| 6 | MainStay Income Builder Fund |
| Share Class | Beginning Account Value 11/1/20 | Ending Account Value (Based on Actual Returns and Expenses) 4/30/21 | Expenses Paid During Period1 | Ending Account Value (Based on Hypothetical 5% Annualized Return and Actual Expenses) 4/30/21 | Expenses Paid During Period1 | Net Expense Ratio During Period2 |
| Class A Shares | $1,000.00 | $1,160.10 | $ 5.41 | $1,019.79 | $5.06 | 1.01% |
| Investor Class Shares | $1,000.00 | $1,159.50 | $ 6.26 | $1,018.99 | $5.86 | 1.17% |
| Class B Shares | $1,000.00 | $1,155.10 | $10.26 | $1,015.27 | $9.59 | 1.92% |
| Class C Shares | $1,000.00 | $1,154.90 | $10.26 | $1,015.27 | $9.59 | 1.92% |
| Class I Shares | $1,000.00 | $1,161.50 | $ 4.07 | $1,021.03 | $3.81 | 0.76% |
| Class R2 Shares | $1,000.00 | $1,159.60 | $ 5.94 | $1,019.29 | $5.56 | 1.11% |
| Class R3 Shares | $1,000.00 | $1,158.20 | $ 7.28 | $1,018.05 | $6.81 | 1.36% |
| Class R6 Shares | $1,000.00 | $1,162.50 | $ 3.59 | $1,021.47 | $3.36 | 0.67% |
| SIMPLE Class Shares | $1,000.00 | $1,158.10 | $ 7.60 | $1,017.75 | $7.10 | 1.42% |
| 1. | Expenses are equal to the Fund’s annualized expense ratio of each class multiplied by the average account value over the period, divided by 365 and multiplied by 181 (to reflect the six-month period). The table above represents the actual expenses incurred during the six-month period. In addition to the fees and expenses which the Fund bears directly, it also indirectly bears a pro rata share of the fees and expenses of the underlying funds in which it invests. Such indirect expenses are not included in the above-reported expense figures. |
| 2. | Expenses are equal to the Fund's annualized expense ratio to reflect the six-month period. |
| 1. | U.S. Treasury Inflation Linked Notes, 0.125%-1.25%, due 4/30/23–7/15/30 |
| 2. | FNMA, 2.00%-4.00%, due 7/25/29–3/25/60 |
| 3. | Bank of America Corp., 2.496%-8.57%, due 5/17/22–4/22/42 |
| 4. | UMBS, 30 Year, 2.00%-3.50%, due 11/1/48–9/1/50 |
| 5. | Microsoft Corp. |
| 6. | JPMorgan Chase & Co., 2.182%-4.60%, due 4/1/23–4/22/52 |
| 7. | AbbVie, Inc. |
| 8. | International Business Machines Corp. |
| 9. | Verizon Communications, Inc. |
| 10. | JPMorgan Chase & Co. |
| 8 | MainStay Income Builder Fund |
| 1. | See page 5 for other share class returns, which may be higher or lower than Class I share returns. See page 6 for more information on benchmark and peer group returns. |
| 2. | Duration is a measure of the price sensitivity of a fixed-income investment to changes in interest rates. Duration is expressed as a number of years and is considered a more accurate sensitivity gauge than average maturity. |
| 10 | MainStay Income Builder Fund |
| 3. | The terms “spread” and “yield spread” may refer to the difference in yield between a security or type of security and comparable U.S. Treasury issues. The terms may also refer to the difference in yield between two specific securities or types of securities at a given time. |
| 4. | An obligation rated ‘AAA’ has the highest rating assigned by Standard & Poor’s (“S&P”), and in the opinion of S&P, the obligor’s capacity to meet its financial commitment on the obligation is extremely strong. When applied to Fund holdings, ratings are based solely on the creditworthiness of the bonds in the portfolio and are not meant to represent the security or safety of the Fund. |
| 12 | MainStay Income Builder Fund |
| Principal Amount | Value | |
| Long-Term Bonds 50.8% | ||
| Asset-Backed Securities 3.5% | ||
| Automobile Asset-Backed Securities 0.6% | ||
| Avis Budget Rental Car Funding AESOP LLC | ||
| Series 2020-1A, Class A | ||
| 2.33%, due 8/20/26 (a) | $ 1,270,000 | $ 1,323,078 |
| Ford Credit Auto Owner Trust | ||
| Series 2020-2, Class A | ||
| 1.06%, due 4/15/33 (a) | 1,105,000 | 1,098,431 |
| Series 2020-1, Class A | ||
| 2.04%, due 8/15/31 (a) | 1,110,000 | 1,152,316 |
| Ford Credit Floorplan Master Owner Trust | ||
| Series 2019-4, Class A | ||
| 2.44%, due 9/15/26 | 2,015,000 | 2,128,076 |
| Series 2017-3, Class A | ||
| 2.48%, due 9/15/24 | 1,270,000 | 1,307,626 |
| Series 2018-4, Class A | ||
| 4.06%, due 11/15/30 | 1,480,000 | 1,682,385 |
| JPMorgan Chase Bank NA | ||
| Series 2020-1, Class B | ||
| 0.991%, due 1/25/28 (a) | 711,461 | 713,418 |
| Santander Revolving Auto Loan Trust | ||
| Series 2019-A, Class A | ||
| 2.51%, due 1/26/32 (a) | 975,000 | 1,025,858 |
| 10,431,188 | ||
| Credit Card Asset-Backed Security 0.1% | ||
| Capital One Multi-Asset Execution Trust | ||
| Series 2019-A3, Class A3 | ||
| 2.06%, due 8/15/28 | 1,330,000 | 1,389,523 |
| Home Equity Asset-Backed Securities 0.2% | ||
| Carrington Mortgage Loan Trust | ||
| Series 2007-HE1, Class A3 | ||
| 0.296% (1 Month LIBOR + 0.19%), due 6/25/37 (b) | 3,380,123 | 3,331,361 |
| Chase Funding Trust | ||
| Series 2002-2, Class 1A5 | ||
| 6.333%, due 4/25/32 (c) | 31,751 | 32,359 |
| Equity One Mortgage Pass-Through Trust | ||
| Series 2003-3, Class AF4 | ||
| 5.495%, due 12/25/33 (c) | 70,643 | 71,590 |
| Principal Amount | Value | |
| Home Equity Asset-Backed Securities (continued) | ||
| JPMorgan Mortgage Acquisition Trust | ||
| Series 2007-HE1, Class AF1 | ||
| 0.206% (1 Month LIBOR + 0.10%), due 3/25/47 (b) | $ 354,572 | $ 227,895 |
| Mastr Asset-Backed Securities Trust | ||
| Series 2006-HE4, Class A1 | ||
| 0.206% (1 Month LIBOR + 0.10%), due 11/25/36 (b) | 538,824 | 244,206 |
| 3,907,411 | ||
| Other Asset-Backed Securities 2.6% | ||
| American Airlines Pass-Through Trust | ||
| Series 2016-2, Class AA | ||
| 3.20%, due 6/15/28 | 550,460 | 553,407 |
| Series 2016-2, Class A | ||
| 3.65%, due 6/15/28 | 1,279,010 | 1,230,656 |
| Series 2013-2, Class A | ||
| 4.95%, due 1/15/23 | 3,783,227 | 3,821,861 |
| CF Hippolyta LLC | ||
| Series 2021-1A, Class A1 | ||
| 1.53%, due 3/15/61 (a) | 1,605,000 | 1,605,445 |
| Series 2020-1, Class A1 | ||
| 1.69%, due 7/15/60 (a) | 2,133,037 | 2,162,586 |
| Series 2020-1, Class A2 | ||
| 1.99%, due 7/15/60 (a) | 1,221,898 | 1,224,652 |
| Crown Castle Towers LLC | ||
| 4.241%, due 7/15/28 (a) | 2,680,000 | 3,009,833 |
| CVS Pass-Through Trust | ||
| 5.789%, due 1/10/26 (a) | 109,051 | 119,935 |
| Delta Air Lines Pass-Through Trust | ||
| Series 2019-1, Class AA | ||
| 3.204%, due 4/25/24 | 2,355,000 | 2,468,672 |
| MMAF Equipment Finance LLC | ||
| Series 2020-BA, Class A4 | ||
| 0.66%, due 11/15/27 (a) | 3,750,000 | 3,725,634 |
| MVW LLC | ||
| Series 2019-2A, Class A | ||
| 2.22%, due 10/20/38 (a) | 1,653,721 | 1,688,672 |
| Navient Private Education Refi Loan Trust | ||
| Series 2020-DA, Class A | ||
| 1.69%, due 5/15/69 (a) | 620,831 | 627,630 |
| Series 2020-EA, Class A | ||
| 1.69%, due 5/15/69 (a) | 1,158,556 | 1,178,843 |
| PFS Financing Corp. | ||
| Series 2020-B, Class B | ||
| 1.71%, due 6/15/24 (a) | 830,000 | 835,041 |
| Principal Amount | Value | |
| Asset-Backed Securities (continued) | ||
| Other Asset-Backed Securities (continued) | ||
| PFS Financing Corp. (continued) | ||
| Series 2020-A, Class B | ||
| 1.77%, due 6/15/25 (a) | $ 1,780,000 | $ 1,801,002 |
| Progress Residential | ||
| Series 2021-SFR1, Class A | ||
| 1.052%, due 4/17/38 (a) | 1,565,000 | 1,530,551 |
| Series 2021-SFR3, Class A | ||
| 1.637%, due 5/17/26 (a) | 930,000 | 932,073 |
| Series 2021-SFR4, Class B | ||
| 1.808%, due 5/17/38 (a) | 1,420,000 | 1,418,653 |
| Progress Residential Trust | ||
| Series 2021-SFR2, Class A | ||
| 1.546%, due 4/19/38 (a) | 885,000 | 885,960 |
| Series 2021-SFR2, Class B | ||
| 1.796%, due 4/19/38 (a) | 2,500,000 | 2,500,249 |
| Sierra Timeshare Receivables Funding LLC | ||
| Series 2020-2A, Class A | ||
| 1.33%, due 7/20/37 (a) | 1,070,280 | 1,076,807 |
| Series 2020-2A, Class C | ||
| 3.51%, due 7/20/37 (a) | 2,083,479 | 2,148,337 |
| U.S. Airways Pass-Through Trust | ||
| Series 2012-1, Class A | ||
| 5.90%, due 10/1/24 | 1,194,484 | 1,252,778 |
| Series 2010-1, Class A | ||
| 6.25%, due 4/22/23 | 531,612 | 541,525 |
| United Airlines Pass-Through Trust | ||
| Series 2020-1, Class A | ||
| 5.875%, due 10/15/27 | 1,874,750 | 2,073,858 |
| Series 2007-1 | ||
| 6.636%, due 7/2/22 | 966,105 | 999,918 |
| 41,414,578 | ||
| Total Asset-Backed Securities (Cost $55,203,076) | 57,142,700 | |
| Corporate Bonds 31.6% | ||
| Aerospace & Defense 0.2% | ||
| BAE Systems plc | ||
| 3.00%, due 9/15/50 (United Kingdom) (a) | 1,285,000 | 1,198,963 |
| L3Harris Technologies, Inc. | ||
| 4.40%, due 6/15/28 | 2,215,000 | 2,537,480 |
| 3,736,443 | ||
| Principal Amount | Value | |
| Agriculture 0.1% | ||
| BAT Capital Corp. | ||
| 3.734%, due 9/25/40 (United Kingdom) | $ 2,105,000 | $ 1,965,193 |
| JBS Investments II GmbH | ||
| 7.00%, due 1/15/26 (a) | 585,000 | 622,908 |
| 2,588,101 | ||
| Airlines 0.5% | ||
| American Airlines, Inc. | ||
| 5.50%, due 4/20/26 (a) | 1,400,000 | 1,470,000 |
| 5.75%, due 4/20/29 (a) | 850,000 | 910,775 |
| Delta Air Lines, Inc. | ||
| 4.50%, due 10/20/25 (a) | 1,080,000 | 1,158,464 |
| 4.75%, due 10/20/28 (a) | 755,000 | 829,083 |
| 7.00%, due 5/1/25 (a) | 2,310,000 | 2,686,154 |
| Mileage Plus Holdings LLC | ||
| 6.50%, due 6/20/27 (a) | 1,860,000 | 2,041,350 |
| 9,095,826 | ||
| Auto Manufacturers 1.1% | ||
| Daimler Finance North America LLC | ||
| 0.742% (3 Month LIBOR + 0.55%), due 5/4/21 (Germany) (a)(b) | 2,400,000 | 2,400,000 |
| Ford Motor Co. | ||
| 8.50%, due 4/21/23 | 2,100,000 | 2,352,000 |
| 9.00%, due 4/22/25 | 2,200,000 | 2,686,750 |
| Ford Motor Credit Co. LLC | ||
| 3.35%, due 11/1/22 | 820,000 | 839,098 |
| 4.063%, due 11/1/24 | 1,935,000 | 2,037,284 |
| 4.25%, due 9/20/22 | 655,000 | 676,648 |
| 5.875%, due 8/2/21 | 350,000 | 353,325 |
| General Motors Co. | ||
| 6.125%, due 10/1/25 | 670,000 | 795,159 |
| General Motors Financial Co., Inc. | ||
| 2.35%, due 1/8/31 | 810,000 | 775,113 |
| 3.15%, due 6/30/22 | 900,000 | 924,349 |
| 3.45%, due 4/10/22 | 3,800,000 | 3,886,288 |
| 17,726,014 | ||
| Banks 7.8% | ||
| Bank of America Corp. | ||
| 2.496%, due 2/13/31 (d) | 1,600,000 | 1,604,634 |
| 2.676%, due 6/19/41 (d) | 2,795,000 | 2,625,895 |
| 3.004%, due 12/20/23 (d) | 1,794,000 | 1,864,953 |
| 3.194%, due 7/23/30 (d) | 1,425,000 | 1,510,875 |
| 3.311%, due 4/22/42 (d) | 970,000 | 989,680 |
| 3.458%, due 3/15/25 (d) | 1,700,000 | 1,822,539 |
| 3.499%, due 5/17/22 (d) | 4,490,000 | 4,495,119 |
| 14 | MainStay Income Builder Fund |
| Principal Amount | Value | |
| Corporate Bonds (continued) | ||
| Banks (continued) | ||
| Bank of America Corp. (continued) | ||
| 4.20%, due 8/26/24 | $ 2,615,000 | $ 2,882,782 |
| Series MM | ||
| 4.30%, due 1/28/25 (d)(e) | 3,519,000 | 3,624,570 |
| Series DD | ||
| 6.30%, due 3/10/26 (d)(e) | 2,085,000 | 2,438,797 |
| 8.57%, due 11/15/24 | 485,000 | 609,102 |
| Barclays Bank plc | ||
| 10.00%, due 5/21/21 (United Kingdom) | GBP 1,186,000 | 1,644,546 |
| BNP Paribas SA (France) | ||
| 3.052%, due 1/13/31 (a)(d) | $ 3,630,000 | 3,761,916 |
| 4.625% (5 Year Treasury Constant Maturity Rate + 3.34%), due 2/25/31 (a)(b)(e) | 1,400,000 | 1,421,000 |
| Citibank NA | ||
| 3.40%, due 7/23/21 | 3,585,000 | 3,600,623 |
| Citigroup, Inc. | ||
| 3.352%, due 4/24/25 (d) | 2,565,000 | 2,749,915 |
| 3.668%, due 7/24/28 (d) | 1,180,000 | 1,300,541 |
| 3.98%, due 3/20/30 (d) | 2,370,000 | 2,643,270 |
| 4.05%, due 7/30/22 | 105,000 | 109,604 |
| 5.30%, due 5/6/44 | 1,200,000 | 1,543,272 |
| 6.625%, due 6/15/32 | 770,000 | 1,027,872 |
| 6.875%, due 6/1/25 | 1,715,000 | 2,084,362 |
| Citizens Financial Group, Inc. | ||
| 2.638%, due 9/30/32 (a) | 3,405,000 | 3,353,543 |
| Credit Suisse Group AG | ||
| 2.593%, due 9/11/25 (Switzerland) (a)(d) | 3,000,000 | 3,120,867 |
| First Horizon Bank | ||
| 5.75%, due 5/1/30 | 1,555,000 | 1,890,661 |
| First Horizon Corp. | ||
| 4.00%, due 5/26/25 | 2,100,000 | 2,315,700 |
| Freedom Mortgage Corp. | ||
| 7.625%, due 5/1/26 (a) | 1,595,000 | 1,662,787 |
| Goldman Sachs Group, Inc. (The) | ||
| 1.364% (3 Month LIBOR + 1.17%), due 5/15/26 (b) | 2,245,000 | 2,282,030 |
| 1.431%, due 3/9/27 (d) | 1,255,000 | 1,250,100 |
| 1.992%, due 1/27/32 (d) | 1,370,000 | 1,301,257 |
| 2.615%, due 4/22/32 (d) | 1,005,000 | 1,009,904 |
| 2.905%, due 7/24/23 (d) | 880,000 | 905,951 |
| 2.908%, due 6/5/23 (d) | 800,000 | 820,968 |
| 3.50%, due 11/16/26 | 1,085,000 | 1,184,159 |
| 5.25%, due 7/27/21 | 805,000 | 814,282 |
| 6.75%, due 10/1/37 | 829,000 | 1,174,860 |
| Principal Amount | Value | |
| Banks (continued) | ||
| HSBC Holdings plc | ||
| 3.973%, due 5/22/30 (United Kingdom) (d) | $ 2,365,000 | $ 2,589,674 |
| JPMorgan Chase & Co. | ||
| 2.182%, due 6/1/28 (d) | 1,800,000 | 1,837,821 |
| 2.956%, due 5/13/31 (d) | 1,115,000 | 1,145,398 |
| 3.157%, due 4/22/42 (d) | 1,175,000 | 1,176,905 |
| 3.207%, due 4/1/23 (d) | 3,915,000 | 4,017,252 |
| 3.328%, due 4/22/52 (d) | 890,000 | 890,167 |
| 3.54%, due 5/1/28 (d) | 1,980,000 | 2,166,833 |
| Series HH | ||
| 4.60%, due 2/1/25 (d)(e) | 3,427,000 | 3,534,094 |
| Lloyds Banking Group plc (United Kingdom) | ||
| 4.582%, due 12/10/25 | 1,633,000 | 1,829,344 |
| 4.65%, due 3/24/26 | 3,090,000 | 3,480,688 |
| Morgan Stanley | ||
| 3.125%, due 1/23/23 | 4,435,000 | 4,643,046 |
| Series H | ||
| 3.794% (3 Month LIBOR + 3.61%), due 7/15/21 (b)(e) | 1,890,000 | 1,896,615 |
| 5.00%, due 11/24/25 | 2,855,000 | 3,288,396 |
| 7.25%, due 4/1/32 | 490,000 | 700,261 |
| Natwest Group plc | ||
| 3.073% (1 Year Treasury Constant Maturity Rate + 2.55%), due 5/22/28 (United Kingdom) (b) | 3,705,000 | 3,876,581 |
| PNC Bank NA | ||
| 2.55%, due 12/9/21 | 2,185,000 | 2,210,974 |
| PNC Financial Services Group, Inc. (The) | ||
| 2.55%, due 1/22/30 | 1,980,000 | 2,032,706 |
| Societe Generale SA | ||
| 5.375% (5 Year Treasury Constant Maturity Rate + 4.514%), due 11/18/30 (France) (a)(b)(e) | 3,305,000 | 3,437,200 |
| Standard Chartered plc | ||
| 4.75% (5 Year Treasury Constant Maturity Rate + 3.805%), due 1/14/31 (United Kingdom) (a)(b)(e)(f) | 1,225,000 | 1,243,620 |
| Truist Bank | ||
| 2.636% (5 Year Treasury Constant Maturity Rate + 1.15%), due 9/17/29 (b) | 1,900,000 | 1,998,933 |
| Principal Amount | Value | |
| Corporate Bonds (continued) | ||
| Banks (continued) | ||
| Truist Financial Corp. | ||
| Series P | ||
| 4.95% (5 Year Treasury Constant Maturity Rate + 4.605%), due 9/1/25 (b)(e) | $ 2,205,000 | $ 2,425,500 |
| UBS Group AG | ||
| 4.375% (5 Year Treasury Constant Maturity Rate + 3.313%), due 2/10/31 (Switzerland) (a)(b)(e) | 2,350,000 | 2,341,211 |
| Wachovia Corp. | ||
| 5.50%, due 8/1/35 | 315,000 | 397,140 |
| Wells Fargo & Co. | ||
| 2.406%, due 10/30/25 (d) | 1,795,000 | 1,877,370 |
| 4.90%, due 11/17/45 | 55,000 | 67,129 |
| Wells Fargo Bank NA | ||
| 3.55%, due 8/14/23 | 1,815,000 | 1,942,431 |
| 5.85%, due 2/1/37 | 140,000 | 187,038 |
| 126,677,263 | ||
| Beverages 0.3% | ||
| Anheuser-Busch InBev Worldwide, Inc. (Belgium) | ||
| 4.15%, due 1/23/25 | 635,000 | 708,220 |
| 4.75%, due 1/23/29 | 3,075,000 | 3,608,691 |
| 4,316,911 | ||
| Biotechnology 0.2% | ||
| Biogen, Inc. | ||
| 3.625%, due 9/15/22 | 3,480,000 | 3,642,992 |
| Building Materials 0.7% | ||
| Builders FirstSource, Inc. | ||
| 5.00%, due 3/1/30 (a) | 2,455,000 | 2,605,369 |
| 6.75%, due 6/1/27 (a) | 1,044,000 | 1,122,718 |
| Carrier Global Corp. | ||
| 2.722%, due 2/15/30 | 2,265,000 | 2,306,099 |
| Cemex SAB de CV | ||
| 3.125%, due 3/19/26 (Mexico) (a) | EUR 4,255,000 | 5,261,981 |
| 11,296,167 | ||
| Chemicals 0.6% | ||
| Air Liquide Finance SA | ||
| 1.75%, due 9/27/21 (France) (a) | $ 1,725,000 | 1,733,113 |
| Braskem Netherlands Finance BV | ||
| 4.50%, due 1/10/28 (Brazil) (a) | 2,135,000 | 2,220,400 |
| Huntsman International LLC | ||
| 4.50%, due 5/1/29 | 1,862,000 | 2,089,029 |
| Principal Amount | Value | |
| Chemicals (continued) | ||
| Nutrition & Biosciences, Inc. | ||
| 1.832%, due 10/15/27 (a) | $ 2,300,000 | $ 2,272,249 |
| Orbia Advance Corp. SAB de CV | ||
| 4.00%, due 10/4/27 (Mexico) (a) | 1,800,000 | 1,965,240 |
| 10,280,031 | ||
| Commercial Services 0.7% | ||
| Allied Universal Holdco LLC | ||
| 6.625%, due 7/15/26 (a) | 1,650,000 | 1,744,875 |
| Ashtead Capital, Inc. | ||
| 4.00%, due 5/1/28 (United Kingdom) (a) | 935,000 | 980,581 |
| California Institute of Technology | ||
| 3.65%, due 9/1/19 | 1,913,000 | 2,038,301 |
| Cintas Corp. No. 2 | ||
| 3.70%, due 4/1/27 | 2,740,000 | 3,062,489 |
| Herc Holdings, Inc. | ||
| 5.50%, due 7/15/27 (a) | 1,805,000 | 1,908,787 |
| Sodexo, Inc. | ||
| 2.718%, due 4/16/31 (France) (a) | 2,370,000 | 2,354,094 |
| 12,089,127 | ||
| Computers 0.8% | ||
| Apple, Inc. | ||
| 2.75%, due 1/13/25 | 1,990,000 | 2,130,268 |
| Dell International LLC | ||
| 4.90%, due 10/1/26 (a) | 1,749,000 | 2,009,180 |
| 5.30%, due 10/1/29 (a) | 810,000 | 959,129 |
| 8.10%, due 7/15/36 (a) | 2,300,000 | 3,402,820 |
| International Business Machines Corp. | ||
| 7.00%, due 10/30/25 | 2,050,000 | 2,588,487 |
| NCR Corp. | ||
| 5.00%, due 10/1/28 (a) | 2,376,000 | 2,447,280 |
| 13,537,164 | ||
| Cosmetics & Personal Care 0.0% ‡ | ||
| Estee Lauder Cos., Inc. (The) | ||
| 2.60%, due 4/15/30 | 740,000 | 768,569 |
| Distribution & Wholesale 0.5% | ||
| Avient Corp. | ||
| 5.75%, due 5/15/25 (a) | 2,877,000 | 3,035,062 |
| Performance Food Group, Inc. | ||
| 5.50%, due 10/15/27 (a) | 4,566,000 | 4,811,834 |
| 7,846,896 | ||
| Diversified Financial Services 2.2% | ||
| AerCap Ireland Capital DAC (Ireland) | ||
| 3.30%, due 1/23/23 | 1,275,000 | 1,325,249 |
| 16 | MainStay Income Builder Fund |
| Principal Amount | Value | |
| Corporate Bonds (continued) | ||
| Diversified Financial Services (continued) | ||
| AerCap Ireland Capital DAC (Ireland) (continued) | ||
| 4.45%, due 12/16/21 | $ 1,465,000 | $ 1,495,214 |
| 4.625%, due 7/1/22 | 964,000 | 1,009,226 |
| Air Lease Corp. | ||
| 2.30%, due 2/1/25 | 2,990,000 | 3,072,981 |
| 2.75%, due 1/15/23 | 1,850,000 | 1,910,644 |
| 3.50%, due 1/15/22 | 890,000 | 908,630 |
| 4.25%, due 9/15/24 | 1,185,000 | 1,296,378 |
| Ally Financial, Inc. | ||
| 3.875%, due 5/21/24 | 810,000 | 878,447 |
| 8.00%, due 11/1/31 | 3,260,000 | 4,585,045 |
| Aviation Capital Group LLC | ||
| 1.95%, due 1/30/26 (a) | 1,210,000 | 1,186,191 |
| Avolon Holdings Funding Ltd. (Ireland) | ||
| 2.125%, due 2/21/26 (a) | 1,515,000 | 1,481,169 |
| 2.875%, due 2/15/25 (a) | 2,720,000 | 2,779,990 |
| Banco BTG Pactual SA | ||
| 2.75%, due 1/11/26 (Brazil) (a) | 2,630,000 | 2,498,526 |
| Capital One Financial Corp. | ||
| 4.20%, due 10/29/25 | 435,000 | 484,585 |
| Charles Schwab Corp. (The) | ||
| Series G | ||
| 5.375% (5 Year Treasury Constant Maturity Rate + 4.971%), due 6/1/25 (b)(e) | 2,350,000 | 2,612,965 |
| Discover Financial Services | ||
| 3.85%, due 11/21/22 | 1,491,000 | 1,566,754 |
| Home Point Capital, Inc. | ||
| 5.00%, due 2/1/26 (a) | 2,155,000 | 2,122,028 |
| Intercontinental Exchange, Inc. | ||
| 3.00%, due 9/15/60 | 1,970,000 | 1,766,690 |
| OneMain Finance Corp. | ||
| 6.125%, due 3/15/24 | 540,000 | 583,200 |
| PennyMac Financial Services, Inc. | ||
| 4.25%, due 2/15/29 (a) | 1,275,000 | 1,220,813 |
| 5.375%, due 10/15/25 (a) | 350,000 | 368,813 |
| 35,153,538 | ||
| Electric 0.9% | ||
| Connecticut Light and Power Co. (The) | ||
| 4.00%, due 4/1/48 | 1,145,000 | 1,331,894 |
| Duquesne Light Holdings, Inc. | ||
| 3.616%, due 8/1/27 (a) | 2,265,000 | 2,479,913 |
| Entergy Louisiana LLC | ||
| 4.00%, due 3/15/33 | 2,200,000 | 2,533,671 |
| Principal Amount | Value | |
| Electric (continued) | ||
| Evergy, Inc. | ||
| 5.292%, due 6/15/22 (c) | $ 1,130,000 | $ 1,174,925 |
| Public Service Electric and Gas Co. | ||
| 3.00%, due 5/15/27 | 2,235,000 | 2,421,812 |
| Puget Energy, Inc. | ||
| 5.625%, due 7/15/22 | 815,000 | 855,296 |
| Southern California Edison Co. | ||
| Series E | ||
| 3.70%, due 8/1/25 | 870,000 | 954,487 |
| 4.00%, due 4/1/47 | 1,320,000 | 1,375,326 |
| WEC Energy Group, Inc. | ||
| 2.306% (3 Month LIBOR + 2.113%), due 5/15/67 (b) | 1,095,000 | 999,224 |
| 14,126,548 | ||
| Environmental Control 0.2% | ||
| Republic Services, Inc. | ||
| 4.75%, due 5/15/23 | 881,000 | 948,052 |
| Stericycle, Inc. | ||
| 3.875%, due 1/15/29 (a) | 280,000 | 279,300 |
| Waste Management, Inc. | ||
| 2.40%, due 5/15/23 | 2,275,000 | 2,361,461 |
| 3,588,813 | ||
| Food 1.3% | ||
| Kraft Heinz Foods Co. | ||
| 4.25%, due 3/1/31 | 2,888,000 | 3,184,550 |
| 5.00%, due 7/15/35 | 1,199,000 | 1,400,326 |
| Nestle Holdings, Inc. | ||
| 1.00%, due 9/15/27 (a) | 3,750,000 | 3,632,652 |
| 3.10%, due 9/24/21 (a) | 2,975,000 | 3,001,790 |
| Smithfield Foods, Inc. | ||
| 3.35%, due 2/1/22 (a) | 1,575,000 | 1,602,910 |
| 4.25%, due 2/1/27 (a) | 1,180,000 | 1,295,187 |
| Sysco Corp. | ||
| 3.30%, due 2/15/50 | 1,130,000 | 1,093,058 |
| 5.95%, due 4/1/30 | 1,161,000 | 1,464,009 |
| Tyson Foods, Inc. | ||
| 3.95%, due 8/15/24 | 2,255,000 | 2,460,897 |
| US Foods, Inc. | ||
| 6.25%, due 4/15/25 (a) | 1,940,000 | 2,060,658 |
| 21,196,037 | ||
| Food Service 0.1% | ||
| Aramark Services, Inc. | ||
| 6.375%, due 5/1/25 (a) | 1,776,000 | 1,889,220 |
| Principal Amount | Value | |
| Corporate Bonds (continued) | ||
| Gas 0.1% | ||
| National Fuel Gas Co. | ||
| 2.95%, due 3/1/31 | $ 825,000 | $ 805,410 |
| Southern California Gas Co. | ||
| Series VV | ||
| 4.30%, due 1/15/49 | 845,000 | 1,017,619 |
| 1,823,029 | ||
| Healthcare-Services 0.5% | ||
| Health Care Service Corp. A Mutual Legal Reserve Co. | ||
| 2.20%, due 6/1/30 (a) | 3,800,000 | 3,752,375 |
| Laboratory Corp. of America Holdings | ||
| 2.30%, due 12/1/24 | 2,355,000 | 2,456,965 |
| NYU Langone Hospitals | ||
| Series 2020 | ||
| 3.38%, due 7/1/55 | 1,550,000 | 1,555,771 |
| 7,765,111 | ||
| Holding Companies-Diversified 0.2% | ||
| CK Hutchison International 17 II Ltd. | ||
| 3.25%, due 9/29/27 (United Kingdom) (a) | 2,620,000 | 2,847,225 |
| Home Builders 0.1% | ||
| Lennar Corp. | ||
| 5.875%, due 11/15/24 | 1,345,000 | 1,529,504 |
| Insurance 1.7% | ||
| Athene Global Funding | ||
| 2.50%, due 3/24/28 (a) | 2,405,000 | 2,424,117 |
| Equitable Holdings, Inc. | ||
| 5.00%, due 4/20/48 | 2,305,000 | 2,812,480 |
| Jackson National Life Global Funding | ||
| 0.657% (3 Month LIBOR + 0.48%), due 6/11/21 (a)(b) | 3,660,000 | 3,661,585 |
| Liberty Mutual Group, Inc. | ||
| 4.25%, due 6/15/23 (a) | 850,000 | 915,552 |
| MassMutual Global Funding II | ||
| 2.50%, due 10/17/22 (a) | 3,347,000 | 3,454,639 |
| 2.95%, due 1/11/25 (a) | 1,105,000 | 1,181,211 |
| Peachtree Corners Funding Trust | ||
| 3.976%, due 2/15/25 (a) | 940,000 | 1,032,554 |
| Principal Life Global Funding II | ||
| 2.375%, due 11/21/21 (a) | 4,070,000 | 4,117,077 |
| Protective Life Corp. | ||
| 8.45%, due 10/15/39 | 1,640,000 | 2,522,357 |
| Principal Amount | Value | |
| Insurance (continued) | ||
| Reliance Standard Life Global Funding II | ||
| 2.50%, due 10/30/24 (a) | $ 2,420,000 | $ 2,534,614 |
| Voya Financial, Inc. | ||
| 3.65%, due 6/15/26 | 690,000 | 765,293 |
| Willis North America, Inc. | ||
| 2.95%, due 9/15/29 | 1,735,000 | 1,815,945 |
| 3.875%, due 9/15/49 | 440,000 | 474,171 |
| 27,711,595 | ||
| Internet 0.5% | ||
| Cablevision Lightpath LLC | ||
| 3.875%, due 9/15/27 (a) | 1,815,000 | 1,790,044 |
| Expedia Group, Inc. | ||
| 3.25%, due 2/15/30 | 3,165,000 | 3,212,902 |
| 3.60%, due 12/15/23 (a) | 1,135,000 | 1,209,534 |
| 3.80%, due 2/15/28 | 440,000 | 471,859 |
| 5.00%, due 2/15/26 | 60,000 | 68,173 |
| 6.25%, due 5/1/25 (a) | 207,000 | 240,799 |
| Weibo Corp. | ||
| 3.50%, due 7/5/24 (China) | 1,190,000 | 1,248,179 |
| 8,241,490 | ||
| Iron & Steel 0.4% | ||
| ArcelorMittal SA | ||
| 4.55%, due 3/11/26 (Luxembourg) | 2,040,000 | 2,264,964 |
| Vale Overseas Ltd. (Brazil) | ||
| 6.25%, due 8/10/26 | 2,585,000 | 3,089,075 |
| 6.875%, due 11/21/36 | 864,000 | 1,173,968 |
| 6,528,007 | ||
| Lodging 0.6% | ||
| Boyd Gaming Corp. | ||
| 8.625%, due 6/1/25 (a) | 563,000 | 623,354 |
| Hilton Domestic Operating Co., Inc. | ||
| 4.875%, due 1/15/30 | 1,715,000 | 1,828,653 |
| 5.75%, due 5/1/28 (a) | 740,000 | 795,500 |
| Las Vegas Sands Corp. | ||
| 3.20%, due 8/8/24 | 1,415,000 | 1,484,087 |
| Marriott International, Inc. | ||
| 2.30%, due 1/15/22 | 2,450,000 | 2,473,525 |
| Sands China Ltd. (Macao) | ||
| 4.60%, due 8/8/23 | 810,000 | 865,890 |
| 5.125%, due 8/8/25 | 1,310,000 | 1,458,357 |
| 9,529,366 | ||
| Machinery-Diversified 0.1% | ||
| CNH Industrial Capital LLC | ||
| 4.20%, due 1/15/24 | 1,435,000 | 1,561,592 |
| 18 | MainStay Income Builder Fund |
| Principal Amount | Value | |
| Corporate Bonds (continued) | ||
| Media 0.6% | ||
| Comcast Corp. | ||
| 3.25%, due 11/1/39 | $ 1,665,000 | $ 1,723,746 |
| 4.70%, due 10/15/48 | 1,410,000 | 1,765,624 |
| Grupo Televisa SAB | ||
| 5.25%, due 5/24/49 (Mexico) (f) | 1,230,000 | 1,481,855 |
| Sirius XM Radio, Inc. | ||
| 4.125%, due 7/1/30 (a) | 2,200,000 | 2,200,000 |
| Sky Ltd. | ||
| 3.75%, due 9/16/24 (United Kingdom) (a) | 950,000 | 1,043,055 |
| Time Warner Entertainment Co. LP | ||
| 8.375%, due 3/15/23 | 800,000 | 913,109 |
| 9,127,389 | ||
| Metal Fabricate & Hardware 0.3% | ||
| Precision Castparts Corp. | ||
| 3.25%, due 6/15/25 | 4,040,000 | 4,383,483 |
| Mining 0.2% | ||
| Glencore Funding LLC | ||
| 1.625%, due 9/1/25 (Australia) (a) | 2,805,000 | 2,823,003 |
| Miscellaneous—Manufacturing 0.5% | ||
| General Electric Co. | ||
| 3.625%, due 5/1/30 | 1,525,000 | 1,656,848 |
| 4.25%, due 5/1/40 | 1,660,000 | 1,855,090 |
| 4.35%, due 5/1/50 | 1,300,000 | 1,447,441 |
| Textron Financial Corp. | ||
| 1.929% (3 Month LIBOR + 1.735%), due 2/15/42 (a)(b) | 3,540,000 | 2,867,400 |
| 7,826,779 | ||
| Oil & Gas 1.0% | ||
| BP Capital Markets America, Inc. | ||
| 3.00%, due 2/24/50 | 820,000 | 757,310 |
| BP Capital Markets plc | ||
| 4.875% (5 Year Treasury Constant Maturity Rate + 4.398%), due 3/22/30 (United Kingdom) (b)(e) | 2,620,000 | 2,812,570 |
| Gazprom PJSC Via Gaz Capital SA | ||
| 7.288%, due 8/16/37 (Russia) (a) | 2,065,000 | 2,870,350 |
| Marathon Petroleum Corp. | ||
| 4.50%, due 5/1/23 | 1,455,000 | 1,558,762 |
| 4.70%, due 5/1/25 | 1,585,000 | 1,788,706 |
| 5.125%, due 12/15/26 | 1,260,000 | 1,485,454 |
| Total Capital International SA | ||
| 3.127%, due 5/29/50 (France) | 2,285,000 | 2,191,699 |
| Principal Amount | Value | |
| Oil & Gas (continued) | ||
| Valero Energy Corp. | ||
| 4.00%, due 4/1/29 | $ 1,435,000 | $ 1,566,146 |
| 6.625%, due 6/15/37 | 1,050,000 | 1,371,884 |
| 16,402,881 | ||
| Packaging & Containers 0.2% | ||
| Berry Global, Inc. | ||
| 4.875%, due 7/15/26 (a) | 200,000 | 211,810 |
| Owens-Brockway Glass Container, Inc. | ||
| 6.625%, due 5/13/27 (a) | 2,640,000 | 2,851,200 |
| 3,063,010 | ||
| Pharmaceuticals 0.9% | ||
| AbbVie, Inc. | ||
| 3.45%, due 3/15/22 | 2,715,000 | 2,773,072 |
| 4.05%, due 11/21/39 | 2,780,000 | 3,104,184 |
| Becton Dickinson and Co. | ||
| 4.669%, due 6/6/47 | 1,635,000 | 1,952,542 |
| CVS Health Corp. | ||
| 2.70%, due 8/21/40 | 2,930,000 | 2,702,843 |
| 4.78%, due 3/25/38 | 1,110,000 | 1,326,999 |
| Teva Pharmaceutical Finance Netherlands III BV | ||
| 3.15%, due 10/1/26 (Israel) | 2,995,000 | 2,812,305 |
| 14,671,945 | ||
| Pipelines 0.7% | ||
| Enterprise Products Operating LLC | ||
| 3.125%, due 7/31/29 | 1,595,000 | 1,688,990 |
| 3.95%, due 1/31/60 | 1,460,000 | 1,464,213 |
| 4.20%, due 1/31/50 | 405,000 | 434,377 |
| MPLX LP | ||
| 2.65%, due 8/15/30 | 1,705,000 | 1,683,568 |
| 4.875%, due 6/1/25 | 100,000 | 112,752 |
| Spectra Energy Partners LP | ||
| 4.75%, due 3/15/24 | 1,740,000 | 1,921,400 |
| Transcontinental Gas Pipe Line Co. LLC | ||
| 4.60%, due 3/15/48 | 2,340,000 | 2,727,408 |
| Western Midstream Operating LP | ||
| 6.50%, due 2/1/50 (c) | 860,000 | 973,081 |
| 11,005,789 | ||
| Real Estate 0.1% | ||
| Realogy Group LLC | ||
| 5.75%, due 1/15/29 (a) | 1,305,000 | 1,353,937 |
| Principal Amount | Value | |
| Corporate Bonds (continued) | ||
| Real Estate Investment Trusts 1.1% | ||
| Alexandria Real Estate Equities, Inc. | ||
| 3.375%, due 8/15/31 | $ 1,290,000 | $ 1,384,798 |
| American Tower Corp. | ||
| 3.375%, due 10/15/26 | 1,920,000 | 2,087,912 |
| 3.60%, due 1/15/28 | 1,025,000 | 1,119,240 |
| Digital Realty Trust LP | ||
| 3.60%, due 7/1/29 | 480,000 | 528,388 |
| 3.70%, due 8/15/27 | 500,000 | 553,798 |
| 4.45%, due 7/15/28 | 2,505,000 | 2,873,679 |
| Equinix, Inc. | ||
| 1.25%, due 7/15/25 | 1,645,000 | 1,642,892 |
| 2.625%, due 11/18/24 | 1,820,000 | 1,918,151 |
| GLP Capital LP | ||
| 3.35%, due 9/1/24 | 1,280,000 | 1,355,994 |
| Iron Mountain, Inc. | ||
| 5.25%, due 7/15/30 (a) | 1,690,000 | 1,755,487 |
| Kilroy Realty LP | ||
| 3.45%, due 12/15/24 | 2,060,000 | 2,209,017 |
| 17,429,356 | ||
| Retail 1.0% | ||
| 7-Eleven, Inc. | ||
| 2.50%, due 2/10/41 (a) | 300,000 | 273,034 |
| 2.80%, due 2/10/51 (a) | 1,080,000 | 977,654 |
| AutoNation, Inc. | ||
| 4.75%, due 6/1/30 | 2,430,000 | 2,833,500 |
| Macy's Retail Holdings LLC | ||
| 5.875%, due 4/1/29 (a)(f) | 1,500,000 | 1,539,300 |
| Macy's, Inc. | ||
| 8.375%, due 6/15/25 (a) | 3,145,000 | 3,469,658 |
| McDonald's Corp. | ||
| 3.35%, due 4/1/23 | 2,875,000 | 3,032,649 |
| QVC, Inc. | ||
| 4.375%, due 9/1/28 | 2,245,000 | 2,297,825 |
| Starbucks Corp. | ||
| 3.35%, due 3/12/50 | 925,000 | 911,094 |
| 4.45%, due 8/15/49 | 1,305,000 | 1,539,509 |
| 16,874,223 | ||
| Semiconductors 0.1% | ||
| Broadcom, Inc. | ||
| 3.50%, due 2/15/41 (a) | 760,000 | 733,524 |
| NXP BV | ||
| 3.40%, due 5/1/30 (Netherlands) (a) | 1,255,000 | 1,342,071 |
| 2,075,595 | ||
| Principal Amount | Value | |
| Software 0.3% | ||
| Fiserv, Inc. | ||
| 3.20%, due 7/1/26 | $ 525,000 | $ 569,515 |
| Oracle Corp. | ||
| 3.65%, due 3/25/41 | 575,000 | 587,554 |
| salesforce.com, Inc. | ||
| 3.25%, due 4/11/23 | 1,300,000 | 1,371,161 |
| 3.70%, due 4/11/28 | 1,915,000 | 2,150,625 |
| 4,678,855 | ||
| Telecommunications 2.1% | ||
| Altice France SA (France) | ||
| 5.125%, due 7/15/29 (a) | 2,100,000 | 2,102,625 |
| 7.375%, due 5/1/26 (a) | 2,515,000 | 2,607,552 |
| AT&T, Inc. | ||
| Series B | ||
| 2.875% (5 Month Euribor ICE Swap Rate + 3.14%), due 3/2/25 (b)(e) | EUR 2,000,000 | 2,410,636 |
| 3.50%, due 9/15/53 (a) | $ 2,184,000 | 2,008,982 |
| 4.35%, due 3/1/29 | 795,000 | 902,357 |
| CommScope Technologies LLC | ||
| 6.00%, due 6/15/25 (a) | 736,000 | 748,880 |
| CommScope, Inc. | ||
| 7.125%, due 7/1/28 (a) | 2,540,000 | 2,746,375 |
| Level 3 Financing, Inc. | ||
| 3.40%, due 3/1/27 (a) | 2,545,000 | 2,700,881 |
| Sprint Spectrum Co. LLC | ||
| 4.738%, due 3/20/25 (a) | 4,170,000 | 4,464,506 |
| T-Mobile US, Inc. | ||
| 2.625%, due 2/15/29 | 1,545,000 | 1,505,023 |
| 4.50%, due 4/15/50 (a) | 1,015,000 | 1,144,727 |
| VEON Holdings BV | ||
| 4.95%, due 6/16/24 (Netherlands) (a) | 2,430,000 | 2,600,076 |
| Verizon Communications, Inc. | ||
| 1.298% (3 Month LIBOR + 1.10%), due 5/15/25 (b) | 2,705,000 | 2,770,559 |
| 3.40%, due 3/22/41 | 770,000 | 788,806 |
| 3.55%, due 3/22/51 | 855,000 | 868,569 |
| Vodafone Group plc | ||
| 4.25%, due 9/17/50 (United Kingdom) | 2,830,000 | 3,146,847 |
| 33,517,401 | ||
| 20 | MainStay Income Builder Fund |
| Principal Amount | Value | |
| Corporate Bonds (continued) | ||
| Toys, Games & Hobbies 0.1% | ||
| Hasbro, Inc. | ||
| 2.60%, due 11/19/22 | $ 1,230,000 | $ 1,268,182 |
| Total Corporate Bonds (Cost $488,509,770) | 513,594,407 | |
| Foreign Government Bonds 0.9% | ||
| Brazil 0.2% | ||
| Federative Republic of Brazil | ||
| 4.625%, due 1/13/28 | 2,913,000 | 3,124,396 |
| Chile 0.2% | ||
| Corp. Nacional del Cobre de Chile | ||
| 3.00%, due 9/30/29 (a) | 2,825,000 | 2,904,015 |
| Colombia 0.1% | ||
| Colombia Government Bond | ||
| 3.25%, due 4/22/32 | 1,360,000 | 1,334,051 |
| Mexico 0.4% | ||
| Mexico Government Bond | ||
| 2.659%, due 5/24/31 | 5,892,000 | 5,666,278 |
| 3.75%, due 4/19/71 | 1,860,000 | 1,624,152 |
| 7,290,430 | ||
| Total Foreign Government Bonds (Cost $15,103,579) | 14,652,892 | |
| Loan Assignments 0.7% | ||
| Buildings & Real Estate 0.0% ‡ | ||
| Realogy Group LLC | ||
| Extended 2025 Term Loan | ||
| 3.00% (1 Month LIBOR + 2.25%), due 2/8/25 (b) | 694,913 | 688,460 |
| Containers, Packaging & Glass 0.2% | ||
| BWAY Holding Co. | ||
| Initial Term Loan | ||
| 3.443% (3 Month LIBOR + 3.25%), due 4/3/24 (b) | 3,116,432 | 3,006,871 |
| Diversified/Conglomerate Service 0.1% | ||
| TruGreen LP | ||
| First Lien Second Refinancing Term Loan | ||
| Principal Amount | Value | |
| Diversified/Conglomerate Service (continued) | ||
| TruGreen LP (continued) | ||
| 4.75% (1 Month LIBOR + 4.00%), due 11/2/27 (b) | $ 1,341,637 | $ 1,339,401 |
| Second Lien Initial Term Loan | ||
| 9.25% (3 Month LIBOR + 8.50%), due 11/2/28 (b) | 580,000 | 597,400 |
| 1,936,801 | ||
| Finance 0.2% | ||
| Alliant Holdings Intermediate LLC 2018 Initial Term Loan | ||
| 3.363% (1 Month LIBOR + 3.25%), due 5/9/25 (b) | 3,107,076 | 3,070,002 |
| Personal & Nondurable Consumer Products 0.1% | ||
| Prestige Brands, Inc. | ||
| Term Loan B4 | ||
| 2.109% (1 Month LIBOR + 2.00%), due 1/26/24 (b) | 801,831 | 802,458 |
| Telecommunications 0.1% | ||
| Level 3 Financing, Inc. | ||
| Tranche 2027 Term Loan B | ||
| 1.863% (1 Month LIBOR + 1.75%), due 3/1/27 (b) | 2,142,032 | 2,115,702 |
| Total Loan Assignments (Cost $11,660,422) | 11,620,294 | |
| Mortgage-Backed Securities 7.9% | ||
| Agency (Collateralized Mortgage Obligations) 2.6% | ||
| FHLMC | ||
| REMIC, Series 5073, Class DG | ||
| 1.50%, due 8/25/38 | 2,050,000 | 2,081,508 |
| REMIC, Series 4993, Class D | ||
| 2.00%, due 9/25/47 | 2,150,000 | 2,229,894 |
| REMIC, Series 5049, Class UI | ||
| 3.00%, due 12/25/50 | 5,373,741 | 966,565 |
| REMIC, Series 4888, Class BA | ||
| 3.50%, due 9/15/48 | 809,003 | 844,898 |
| REMIC, Series 4877, Class AT | ||
| 3.50%, due 11/15/48 | 1,480,098 | 1,564,090 |
| REMIC, Series 4877, Class BE | ||
| 3.50%, due 11/15/48 | 1,984,169 | 2,082,622 |
| REMIC, Series 4958, Class DL | ||
| 4.00%, due 1/25/50 | 3,390,094 | 3,635,469 |
| Principal Amount | Value | |
| Mortgage-Backed Securities (continued) | ||
| Agency (Collateralized Mortgage Obligations) (continued) | ||
| FNMA | ||
| REMIC, Series 2021-33, Class AI | ||
| 2.50%, due 5/25/47 | 6,560,000 | $ 903,955 |
| REMIC, Series 2013-77, Class CY | ||
| 3.00%, due 7/25/43 | $ 1,902,000 | 2,016,561 |
| REMIC, Series 2019-13, Class PE | ||
| 3.00%, due 3/25/49 | 1,491,844 | 1,584,207 |
| REMIC, Series 2019-13, Class CA | ��� | |
| 3.50%, due 4/25/49 | 2,389,779 | 2,612,194 |
| REMIC, Series 2021-6, Class ML | ||
| 3.50%, due 6/25/50 | 2,340,263 | 2,550,403 |
| REMIC, Series 2021-6, Class MC | ||
| 3.50%, due 6/25/50 | 3,745,000 | 4,083,128 |
| REMIC, Series 2021-12, Class GC | ||
| 3.50%, due 7/25/50 | 2,663,000 | 2,882,783 |
| REMIC, Series 2020-10, Class DA | ||
| 3.50%, due 3/25/60 | 2,449,509 | 2,654,498 |
| GNMA | ||
| REMIC, Series 2021-15, Class AI | ||
| 2.00%, due 1/20/51 | 5,518,136 | 611,120 |
| REMIC, Series 2013-149, Class BA | ||
| 3.25%, due 8/16/41 | 4,703,717 | 4,971,021 |
| UMBS, Single Family, 30 Year | ||
| 2.50%, due 5/25/51 TBA (g) | 3,070,000 | 3,184,885 |
| 41,459,801 | ||
| Commercial Mortgage Loans (Collateralized Mortgage Obligations) 3.0% | ||
| BANK | ||
| Series 2019-BN21, Class A5 | ||
| 2.851%, due 10/17/52 | 2,795,000 | 2,944,871 |
| Bayview Commercial Asset Trust | ||
| Series 2006-4A, Class A1 | ||
| 0.336% (1 Month LIBOR + 0.23%), due 12/25/36 (a)(b) | 58,123 | 55,823 |
| Benchmark Mortgage Trust | ||
| Series 2020-B19, Class A2 | ||
| 1.691%, due 9/15/53 | 2,175,000 | 2,212,496 |
| Series 2019-B12, Class A5 | ||
| 3.116%, due 8/15/52 | 2,852,000 | 3,066,587 |
| BX Commercial Mortgage Trust | ||
| Series 2020-VIV2, Class C | ||
| 3.66%, due 3/9/44 (a) | 1,870,000 | 1,921,477 |
| Series 2020-VIV3, Class B | ||
| 3.662%, due 3/9/44 (a) | 1,622,236 | 1,733,646 |
| Principal Amount | Value | |
| Commercial Mortgage Loans (Collateralized Mortgage Obligations) (continued) | ||
| BX Trust | ||
| Series 2018-BILT, Class A | ||
| 0.915% (1 Month LIBOR + 0.80%), due 5/15/30 (a)(b) | $ 2,705,000 | $ 2,706,137 |
| Series 2018-GW, Class A | ||
| 0.915% (1 Month LIBOR + 0.80%), due 5/15/35 (a)(b) | 1,770,000 | 1,769,975 |
| Series 2021-LBA, Class AV | ||
| 0.915% (1 Month LIBOR + 0.80%), due 2/15/36 (a)(b) | 1,910,000 | 1,909,961 |
| Series 2019-OC11, Class A | ||
| 3.202%, due 12/9/41 (a) | 1,355,000 | 1,434,244 |
| Series 2019-OC11, Class B | ||
| 3.605%, due 12/9/41 (a) | 390,000 | 418,737 |
| Series 2019-OC11, Class C | ||
| 3.856%, due 12/9/41 (a) | 570,000 | 606,374 |
| CSAIL Commercial Mortgage Trust | ||
| Series 2015-C3, Class A4 | ||
| 3.718%, due 8/15/48 | 2,050,254 | 2,244,951 |
| FREMF Mortgage Trust | ||
| REMIC, Series 2015-K720, Class B | ||
| 3.51%, due 7/25/22 (a) | 1,080,000 | 1,112,649 |
| REMIC, Series 2014-K41, Class B | ||
| 3.964%, due 11/25/47 (a) | 870,000 | 949,315 |
| GB Trust | ||
| Series 2020-FLIX, Class C | ||
| 1.715% (1 Month LIBOR + 1.60%), due 8/15/37 (a)(b) | 1,300,000 | 1,307,041 |
| Series 2020-FLIX, Class D | ||
| 2.465% (1 Month LIBOR + 2.35%), due 8/15/37 (a)(b) | 1,795,000 | 1,802,352 |
| GS Mortgage Securities Trust | ||
| Series 2019-GC42, Class A4 | ||
| 3.001%, due 9/1/52 | 825,000 | 880,289 |
| Series 2019-GC40, Class A4 | ||
| 3.16%, due 7/10/52 | 2,002,000 | 2,158,421 |
| Hawaii Hotel Trust | ||
| Series 2019-MAUI, Class A | ||
| 1.265% (1 Month LIBOR + 1.15%), due 5/15/38 (a)(b) | 1,200,000 | 1,201,489 |
| Hudson Yards Mortgage Trust | ||
| Series 2019-30HY, Class A | ||
| 3.228%, due 7/10/39 (a) | 1,460,000 | 1,572,620 |
| Manhattan West Mortgage Trust | ||
| Series 2020-1MW, Class A | ||
| 2.13%, due 9/10/39 (a) | 2,910,000 | 2,953,240 |
| 22 | MainStay Income Builder Fund |
| Principal Amount | Value | |
| Mortgage-Backed Securities (continued) | ||
| Commercial Mortgage Loans (Collateralized Mortgage Obligations) (continued) | ||
| Morgan Stanley Bank of America Merrill Lynch Trust | ||
| Series 2015-C23, Class A3 | ||
| 3.451%, due 7/15/50 | $ 1,162,420 | $ 1,248,245 |
| Morgan Stanley Capital I Trust | ||
| Series 2015-UBS8, Class A4 | ||
| 3.809%, due 12/15/48 | 1,830,000 | 2,015,629 |
| One Bryant Park Trust | ||
| Series 2019-OBP, Class A | ||
| 2.516%, due 9/15/54 (a) | 2,725,000 | 2,778,446 |
| Wells Fargo Commercial Mortgage Trust | ||
| Series 2018-1745, Class A | ||
| 3.874%, due 6/15/36 (a) | 2,640,000 | 2,913,035 |
| Series 2018-AUS, Class A | ||
| 4.194%, due 8/17/36 (a) | 3,120,000 | 3,474,457 |
| 49,392,507 | ||
| Whole Loan (Collateralized Mortgage Obligations) 2.3% | ||
| Chase Home Lending Mortgage Trust | ||
| Series 2019-ATR2, Class A3 | ||
| 3.50%, due 7/25/49 (a)(h) | 230,795 | 238,852 |
| FHLMC STACR REMIC Trust | ||
| Series 2020-DNA6, Class M2 | ||
| 2.01% (SOFR 30A + 2.00%), due 12/25/50 (a)(b) | 2,825,000 | 2,828,401 |
| FHLMC Structured Agency Credit Risk Debt Notes | ||
| Series 2017-DNA1, Class M2 | ||
| 3.356% (1 Month LIBOR + 3.25%), due 7/25/29 (b) | 3,267,094 | 3,391,827 |
| Series 2017-HQA1, Class M2 | ||
| 3.656% (1 Month LIBOR + 3.55%), due 8/25/29 (b) | 3,574,445 | 3,693,252 |
| Series 2015-DNA3, Class M3 | ||
| 4.806% (1 Month LIBOR + 4.70%), due 4/25/28 (b) | 2,123,999 | 2,200,458 |
| Series 2016-DNA1, Class M3 | ||
| 5.656% (1 Month LIBOR + 5.55%), due 7/25/28 (b) | 1,508,063 | 1,586,260 |
| Flagstar Mortgage Trust | ||
| Series 2021-2, Class A2 | ||
| 2.50%, due 4/25/51 (a)(h) | 2,150,000 | 2,194,861 |
| Principal Amount | Value | |
| Whole Loan (Collateralized Mortgage Obligations) (continued) | ||
| FNMA | ||
| Series 2017-C01, Class 1M2 | ||
| 3.656% (1 Month LIBOR + 3.55%), due 7/25/29 (b) | $ 2,380,792 | $ 2,461,667 |
| Series 2017-C02, Class 2M2 | ||
| 3.756% (1 Month LIBOR + 3.65%), due 9/25/29 (b) | 1,101,261 | 1,139,975 |
| GNR-2017-H07 | ||
| 1.00%, due 4/20/27 (i) | 6,445,000 | 6,400,001 |
| J.P. Morgan Mortgage Trust | ||
| Series 2021-6, Class A4 | ||
| 2.50%, due 10/25/51 (a)(h) | 1,975,000 | 2,029,621 |
| Series 2019-3, Class A3 | ||
| 4.00%, due 9/25/49 (a)(h) | 268,146 | 274,136 |
| New Residential Mortgage Loan Trust | ||
| Series 2019-5A, Class B7 | ||
| 4.469%, due 8/25/59 (a) | 3,182,416 | 2,539,209 |
| Series 2019-2A, Class B6 | ||
| 4.976%, due 12/25/57 (a)(h) | 974,350 | 697,925 |
| NewRez LLC | ||
| Series 2021-1, Class A | ||
| (zero coupon) (1 Month LIBOR + 0.75%), due 5/25/55 (a)(b) | 2,600,000 | 2,600,000 |
| OBX Trust | ||
| Series 2021-J1, Class A1 | ||
| 2.50%, due 5/25/51 (a)(h) | 920,000 | 935,597 |
| Seasoned Loans Structured Transaction | ||
| Series 2019-1, Class A1 | ||
| 3.50%, due 5/25/29 | 872,537 | 919,843 |
| Wells Fargo Mortgage Backed Securities Trust | ||
| Series 2020-2, Class A1 | ||
| 3.00%, due 12/25/49 (a)(h) | 1,516,734 | 1,539,073 |
| 37,670,958 | ||
| Total Mortgage-Backed Securities (Cost $125,690,576) | 128,523,266 | |
| Municipal Bonds 0.2% | ||
| California 0.2% | ||
| Regents of the University of California Medical Center, Pooled, Revenue Bonds | ||
| Series N | ||
| 3.006%, due 5/15/50 | 2,700,000 | 2,646,442 |
| Principal Amount | Value | |
| Municipal Bonds (continued) | ||
| New York 0.0% ‡ | ||
| New York State Thruway Authority, Revenue Bonds | ||
| Series M | ||
| 2.90%, due 1/1/35 | $ 450,000 | $ 473,594 |
| Total Municipal Bonds (Cost $3,150,000) | 3,120,036 | |
| U.S. Government & Federal Agencies 6.0% | ||
| Federal Home Loan Mortgage Corporation (Mortgage Pass-Through Securities) 1.1% | ||
| UMBS, 30 Year | ||
| 2.00%, due 7/1/50 | 887,982 | 897,321 |
| 2.00%, due 8/1/50 | 2,457,258 | 2,483,100 |
| 2.00%, due 8/1/50 | 5,734,955 | 5,835,907 |
| 2.00%, due 8/1/50 | 3,136,417 | 3,169,402 |
| 2.00%, due 9/1/50 | 1,587,857 | 1,607,222 |
| 3.00%, due 11/1/48 | 2,051,339 | 2,166,821 |
| 3.50%, due 7/1/50 | 1,878,487 | 2,000,573 |
| 18,160,346 | ||
| Federal National Mortgage Association (Mortgage Pass-Through Securities) 1.1% | ||
| FNMA, Other | ||
| 3.50%, due 2/1/42 | 2,297,693 | 2,501,801 |
| UMBS, 20 Year | ||
| 2.50%, due 5/1/41 | 840,000 | 876,779 |
| 3.50%, due 3/1/37 | 3,841,989 | 4,236,451 |
| UMBS, 30 Year | ||
| 2.00%, due 10/1/50 | 408,825 | 415,025 |
| 2.00%, due 12/1/50 | 655,109 | 661,999 |
| 2.50%, due 8/1/50 | 247,185 | 257,297 |
| 2.50%, due 10/1/50 | 254,077 | 264,243 |
| 2.50%, due 11/1/50 | 1,203,185 | 1,264,004 |
| 2.50%, due 1/1/51 | 787,992 | 822,287 |
| 2.50%, due 1/1/51 | 1,211,725 | 1,260,655 |
| 3.00%, due 3/1/50 | 1,775,261 | 1,882,788 |
| 4.00%, due 8/1/48 | 3,592,379 | 3,865,400 |
| 4.00%, due 2/1/49 | 642,619 | 696,199 |
| 19,004,928 | ||
| Government National Mortgage Association (Mortgage Pass-Through Securities) 0.0% ‡ | ||
| GNMA I, 30 Year | ||
| 6.50%, due 4/15/29 | 10 | 11 |
| 6.50%, due 8/15/29 | 6 | 7 |
| 18 | ||
| Principal Amount | Value | |
| United States Treasury Bonds 0.8% | ||
| U.S. Treasury Bond | ||
| 1.875%, due 2/15/51 | $ 2,025,000 | $ 1,842,117 |
| U.S. Treasury Bonds | ||
| 4.375%, due 11/15/39 | 6,581,000 | 8,930,880 |
| 4.375%, due 5/15/40 | 1,270,000 | 1,730,772 |
| 12,503,769 | ||
| United States Treasury Inflation - Indexed Notes 1.5% | ||
| U.S. Treasury Inflation Linked Notes | ||
| 0.125%, due 1/15/30 (j) | 5,610,000 | 6,283,487 |
| 0.125%, due 7/15/30 (j) | 5,570,000 | 6,279,904 |
| 0.875%, due 1/15/29 (j) | 9,415,000 | 11,383,081 |
| 23,946,472 | ||
| United States Treasury Notes 1.5% | ||
| U.S. Treasury Notes | ||
| 0.125%, due 4/30/23 | 10,705,000 | 10,697,473 |
| 0.375%, due 4/15/24 | 7,105,000 | 7,113,881 |
| 0.75%, due 4/30/26 | 295,000 | 293,617 |
| 1.25%, due 4/30/28 | 5,995,000 | 5,971,582 |
| 24,076,553 | ||
| Total U.S. Government & Federal Agencies (Cost $94,777,622) | 97,692,086 | |
| Total Long-Term Bonds (Cost $794,095,045) | 826,345,681 | |
| Shares | ||
| Common Stocks 44.6% | ||
| Aerospace & Defense 1.2% | ||
| BAE Systems plc (United Kingdom) | 1,218,745 | 8,520,094 |
| Lockheed Martin Corp. | 14,576 | 5,547,043 |
| Raytheon Technologies Corp. | 56,343 | 4,689,991 |
| 18,757,128 | ||
| Air Freight & Logistics 0.8% | ||
| Deutsche Post AG (Registered) (Germany) | 127,696 | 7,515,695 |
| United Parcel Service, Inc., Class B | 26,606 | 5,423,899 |
| 12,939,594 | ||
| Automobiles 0.3% | ||
| Toyota Motor Corp. (Japan) | 55,800 | 4,149,388 |
| Banks 1.8% | ||
| JPMorgan Chase & Co. | 48,711 | 7,492,239 |
| 24 | MainStay Income Builder Fund |
| Shares | Value | |
| Common Stocks (continued) | ||
| Banks (continued) | ||
| PNC Financial Services Group, Inc. (The) | 31,103 | $ 5,814,706 |
| Royal Bank of Canada (Canada) | 79,947 | 7,630,137 |
| Truist Financial Corp. | 133,821 | 7,936,923 |
| 28,874,005 | ||
| Beverages 0.9% | ||
| Coca-Cola Co. (The) | 111,469 | 6,017,097 |
| Coca-Cola European Partners plc (United Kingdom) | 67,936 | 3,860,123 |
| PepsiCo, Inc. | 33,394 | 4,814,079 |
| 14,691,299 | ||
| Biotechnology 1.2% | ||
| AbbVie, Inc. | 123,722 | 13,795,003 |
| Amgen, Inc. | 23,700 | 5,679,468 |
| 19,474,471 | ||
| Capital Markets 1.2% | ||
| BlackRock, Inc. | 5,793 | 4,746,205 |
| Lazard Ltd., Class A | 158,088 | 7,112,379 |
| Singapore Exchange Ltd. (Singapore) | 499,900 | 3,925,572 |
| T. Rowe Price Group, Inc. | 24,726 | 4,430,899 |
| 20,215,055 | ||
| Chemicals 2.1% | ||
| BASF SE (Germany) | 92,920 | 7,493,713 |
| Dow, Inc. | 124,118 | 7,757,375 |
| LyondellBasell Industries NV, Class A | 75,233 | 7,804,671 |
| Nutrien Ltd. (Canada) | 188,995 | 10,430,634 |
| 33,486,393 | ||
| Commercial Services & Supplies 0.0% ‡ | ||
| Quad/Graphics, Inc. | 10 | 36 |
| Communications Equipment 0.7% | ||
| Cisco Systems, Inc. | 225,386 | 11,474,401 |
| Diversified Telecommunication Services 2.8% | ||
| AT&T, Inc. | 221,951 | 6,971,481 |
| BCE, Inc. (Canada) | 140,339 | 6,633,605 |
| Deutsche Telekom AG (Registered) (Germany) | 226,412 | 4,355,261 |
| Orange SA (France) | 497,596 | 6,191,730 |
| Telenor ASA (Norway) | 225,340 | 4,018,708 |
| TELUS Corp. (Canada) | 263,123 | 5,458,762 |
| Shares | Value | |
| Diversified Telecommunication Services (continued) | ||
| Verizon Communications, Inc. | 218,727 | $ 12,640,233 |
| 46,269,780 | ||
| Electric Utilities 1.8% | ||
| American Electric Power Co., Inc. | 54,951 | 4,874,703 |
| Duke Energy Corp. | 44,122 | 4,442,644 |
| Entergy Corp. | 56,086 | 6,129,639 |
| Evergy, Inc. | 81,799 | 5,232,682 |
| Fortis, Inc. (Canada) | 99,607 | 4,443,275 |
| Terna Rete Elettrica Nazionale SpA (Italy) | 656,824 | 4,840,657 |
| 29,963,600 | ||
| Electrical Equipment 0.8% | ||
| Eaton Corp. plc | 51,540 | 7,366,612 |
| Emerson Electric Co. | 62,401 | 5,646,667 |
| 13,013,279 | ||
| Equity Real Estate Investment Trusts 1.7% | ||
| American Tower Corp. | 17,223 | 4,387,904 |
| Iron Mountain, Inc. | 331,642 | 13,305,477 |
| Welltower, Inc. | 70,835 | 5,314,750 |
| WP Carey, Inc. | 61,720 | 4,622,211 |
| 27,630,342 | ||
| Food Products 0.7% | ||
| Danone SA (France) | 52,222 | 3,681,020 |
| Nestle SA (Registered) (Switzerland) | 38,754 | 4,620,351 |
| Orkla ASA (Norway) | 344,947 | 3,520,747 |
| 11,822,118 | ||
| Gas Utilities 0.6% | ||
| Snam SpA (Italy) | 1,658,002 | 9,328,798 |
| Health Care Equipment & Supplies 0.3% | ||
| Medtronic plc | 33,063 | 4,328,608 |
| Hotels, Restaurants & Leisure 1.2% | ||
| Las Vegas Sands Corp. (k) | 66,688 | 4,085,307 |
| McDonald's Corp. | 21,256 | 5,018,116 |
| Restaurant Brands International, Inc. (Canada) | 81,626 | 5,600,360 |
| Vail Resorts, Inc. | 14,193 | 4,614,996 |
| 19,318,779 | ||
| Household Durables 0.4% | ||
| Leggett & Platt, Inc. | 128,153 | 6,365,360 |
| Shares | Value | |
| Common Stocks (continued) | ||
| Household Products 0.7% | ||
| Kimberly-Clark Corp. | 58,948 | $ 7,858,948 |
| Procter & Gamble Co. (The) | 29,058 | 3,876,918 |
| 11,735,866 | ||
| Industrial Conglomerates 0.3% | ||
| Siemens AG (Registered) (Germany) | 32,792 | 5,472,865 |
| Insurance 3.4% | ||
| Allianz SE (Registered) (Germany) | 41,752 | 10,862,488 |
| Assicurazioni Generali SpA (Italy) | 307,378 | 6,165,862 |
| AXA SA (France) (f) | 230,908 | 6,530,755 |
| Great-West Lifeco, Inc. (Canada) | 209,606 | 6,077,662 |
| MetLife, Inc. | 193,088 | 12,286,189 |
| Muenchener Rueckversicherungs-Gesellschaft AG (Registered) (Germany) | 29,094 | 8,417,519 |
| Tokio Marine Holdings, Inc. (Japan) | 108,300 | 5,182,624 |
| 55,523,099 | ||
| IT Services 0.8% | ||
| International Business Machines Corp. | 96,441 | 13,683,049 |
| Leisure Products 0.5% | ||
| Hasbro, Inc. | 78,194 | 7,776,393 |
| Media 0.3% | ||
| Omnicom Group, Inc. | 58,321 | 4,797,485 |
| Multiline Retail 0.3% | ||
| Target Corp. | 21,199 | 4,393,705 |
| Multi-Utilities 1.2% | ||
| Ameren Corp. | 47,967 | 4,069,520 |
| Dominion Energy, Inc. | 83,751 | 6,691,705 |
| National Grid plc (United Kingdom) | 374,255 | 4,706,572 |
| WEC Energy Group, Inc. | 45,179 | 4,390,043 |
| 19,857,840 | ||
| Oil, Gas & Consumable Fuels 2.2% | ||
| Chevron Corp. | 66,591 | 6,863,534 |
| Enterprise Products Partners LP | 382,988 | 8,812,554 |
| Magellan Midstream Partners LP | 140,124 | 6,553,600 |
| Phillips 66 | 65,942 | 5,335,367 |
| TOTAL SE (France) | 183,777 | 8,136,333 |
| 35,701,388 | ||
| Shares | Value | |
| Personal Products 0.5% | ||
| Unilever plc (United Kingdom) | 128,516 | $ 7,510,363 |
| Pharmaceuticals 3.9% | ||
| AstraZeneca plc, Sponsored ADR (United Kingdom) (f) | 74,923 | 3,976,164 |
| Bayer AG (Registered) (Germany) | 55,195 | 3,571,398 |
| GlaxoSmithKline plc (United Kingdom) | 321,029 | 5,939,212 |
| Johnson & Johnson | 42,866 | 6,975,584 |
| Merck & Co., Inc. | 112,831 | 8,405,909 |
| Novartis AG (Registered) (Switzerland) | 63,819 | 5,447,938 |
| Pfizer, Inc. | 205,576 | 7,945,512 |
| Roche Holding AG (Switzerland) | 15,494 | 5,049,017 |
| Sanofi (France) (f) | 77,076 | 8,086,841 |
| Takeda Pharmaceutical Co. Ltd. (Japan) | 235,000 | 7,816,131 |
| 63,213,706 | ||
| Semiconductors & Semiconductor Equipment 3.8% | ||
| Analog Devices, Inc. | 63,032 | 9,653,981 |
| Broadcom, Inc. | 20,637 | 9,414,599 |
| Intel Corp. | 83,478 | 4,802,489 |
| KLA Corp. | 39,287 | 12,389,156 |
| Taiwan Semiconductor Manufacturing Co. Ltd., Sponsored ADR (Taiwan) | 121,932 | 14,234,342 |
| Texas Instruments, Inc. | 64,670 | 11,673,582 |
| 62,168,149 | ||
| Software 0.9% | ||
| Microsoft Corp. | 60,398 | 15,231,168 |
| Specialty Retail 0.5% | ||
| Home Depot, Inc. (The) | 15,210 | 4,923,021 |
| Industria de Diseno Textil SA (Spain) | 102,859 | 3,662,875 |
| 8,585,896 | ||
| Technology Hardware, Storage & Peripherals 1.4% | ||
| Apple, Inc. | 62,664 | 8,237,809 |
| Samsung Electronics Co. Ltd. GDR (Republic of Korea) | 7,655 | 13,939,755 |
| 22,177,564 | ||
| Textiles, Apparel & Luxury Goods 0.4% | ||
| Hanesbrands, Inc. | 277,477 | 5,843,666 |
| Tobacco 2.0% | ||
| Altria Group, Inc. | 228,298 | 10,901,229 |
| British American Tobacco plc (United Kingdom) | 184,853 | 6,846,911 |
| 26 | MainStay Income Builder Fund |
| Shares | Value | ||
| Common Stocks (continued) | |||
| Tobacco (continued) | |||
| British American Tobacco plc, Sponsored ADR (United Kingdom) (f) | 63,382 | $ 2,377,459 | |
| Philip Morris International, Inc. | 132,321 | 12,570,495 | |
| 32,696,094 | |||
| Trading Companies & Distributors 0.8% | |||
| MSC Industrial Direct Co., Inc., Class A | 68,989 | 6,220,048 | |
| Watsco, Inc. | 23,057 | 6,752,473 | |
| 12,972,521 | |||
| Wireless Telecommunication Services 0.2% | |||
| Rogers Communications, Inc., Class B (Canada) | 71,874 | 3,540,050 | |
| Total Common Stocks (Cost $573,436,909) | 724,983,301 | ||
| Short-Term Investments 4.6% | |||
| Affiliated Investment Company 3.6% | |||
| MainStay U.S. Government Liquidity Fund, 0.01% (l) | 57,896,967 | 57,896,967 | |
| Total Affiliated Investment Company (Cost $57,896,967) | 57,896,967 | ||
| Unaffiliated Investment Company 1.0% | |||
| BlackRock Liquidity FedFund, 0.05% (l)(m) | 16,806,935 | 16,806,935 | |
| Total Unaffiliated Investment Company (Cost $16,806,934) | 16,806,935 | ||
| Total Short-Term Investments (Cost $74,703,901) | 74,703,902 | ||
| Total Investments (Cost $1,442,235,855) | 100.0% | 1,626,032,884 | |
| Other Assets, Less Liabilities | (0.0)‡ | (216,974) | |
| Net Assets | 100.0% | $ 1,625,815,910 | |
| † | Percentages indicated are based on Fund net assets. |
| ‡ | Less than one-tenth of a percent. |
| (a) | May be sold to institutional investors only under Rule 144A or securities offered pursuant to Section 4(a)(2) of the Securities Act of 1933, as amended. |
| (b) | Floating rate—Rate shown was the rate in effect as of April 30, 2021. |
| (c) | Step coupon—Rate shown was the rate in effect as of April 30, 2021. |
| (d) | Fixed to floating rate—Rate shown was the rate in effect as of April 30, 2021. |
| (e) | Security is perpetual and, thus, does not have a predetermined maturity date. The date shown, if applicable, reflects the next call date. |
| (f) | All or a portion of this security was held on loan. As of April 30, 2021, the aggregate market value of securities on loan was $18,988,421; the total market value of collateral held by the Fund was $19,782,410. The market value of the collateral held included non-cash collateral in the form of U.S. Treasury securities with a value of $2,975,475. The Fund received cash collateral with a value of $16,806,935. (See Note 2(L)) |
| (g) | TBA—Security purchased on a forward commitment basis with an approximate principal amount and maturity date. The actual principal amount and maturity date will be determined upon settlement. As of April 30, 2021, the total net market value was $3,184,885, which represented 0.2% of the Fund’s net assets. All or a portion of this security is a part of a mortgage dollar roll agreement. |
| (h) | Coupon rate may change based on changes of the underlying collateral or prepayments of principal. Rate shown was the rate in effect as of April 30, 2021. |
| (i) | Delayed delivery security. |
| (j) | Treasury Inflation Protected Security—Pays a fixed rate of interest on a principal amount that is continuously adjusted for inflation based on the Consumer Price Index-Urban Consumers. |
| (k) | Non-income producing security. |
| (l) | Current yield as of April 30, 2021. |
| (m) | Represents a security purchased with cash collateral received for securities on loan. |
| Currency Purchased | Currency Sold | Counterparty | Settlement Date | Unrealized Appreciation (Depreciation) | ||
| GBP | 8,537,000 | USD | 11,730,478 | JPMorgan Chase Bank N.A. | 5/4/21 | $ 59,546 |
| USD | 18,104,834 | AUD | 23,293,000 | JPMorgan Chase Bank N.A. | 5/4/21 | 161,071 |
| USD | 48,095,922 | EUR | 39,827,000 | JPMorgan Chase Bank N.A. | 5/4/21 | 213,911 |
| USD | 43,012,194 | GBP | 30,915,000 | JPMorgan Chase Bank N.A. | 5/4/21 | 317,033 |
| USD | 1,067,591 | JPY | 116,276,687 | Brown Brothers Harriman & Co. | 5/7/21 | 3,641 |
| USD | 46,816,924 | JPY | 5,081,523,000 | JPMorgan Chase Bank N.A. | 5/6/21 | 320,511 |
| Total Unrealized Appreciation | 1,075,713 | |||||
| AUD | 23,293,000 | USD | 18,042,408 | JPMorgan Chase Bank N.A. | 5/4/21 | (98,646) |
| AUD | 23,293,000 | USD | 18,110,750 | JPMorgan Chase Bank N.A. | 8/3/21 | (159,943) |
| EUR | 13,978,000 | USD | 17,032,193 | JPMorgan Chase Bank N.A. | 5/4/21 | (227,142) |
| EUR | 25,849,000 | USD | 31,259,919 | JPMorgan Chase Bank N.A. | 5/4/21 | (182,959) |
| EUR | 39,827,000 | USD | 48,192,263 | JPMorgan Chase Bank N.A. | 8/2/21 | (219,447) |
| GBP | 22,378,000 | USD | 31,212,834 | JPMorgan Chase Bank N.A. | 5/4/21 | (307,698) |
| GBP | 30,915,000 | USD | 43,025,642 | JPMorgan Chase Bank N.A. | 8/2/21 | (319,970) |
| JPY | 5,081,523,000 | USD | 49,071,949 | JPMorgan Chase Bank N.A. | 5/6/21 | (2,575,536) |
| JPY | 5,081,523,000 | USD | 46,860,659 | JPMorgan Chase Bank N.A. | 8/2/21 | (327,098) |
| Total Unrealized Depreciation | (4,418,439) | |||||
| Net Unrealized Depreciation | $ (3,342,726) | |||||
| 1. | Foreign Currency Forward Contracts are subject to limitations such that they cannot be “sold or repurchased,” although the Fund would be able to exit the transaction through other means, such as through the execution of an offsetting transaction. |
| Type | Number of Contracts | Expiration Date | Value at Trade Date | Current Notional Amount | Unrealized Appreciation (Depreciation)2 |
| Long Contracts | |||||
| U.S. Treasury 2 Year Notes | 489 | June 2021 | $ 108,039,632 | $ 107,950,570 | $ (89,062) |
| U.S. Treasury 5 Year Notes | 265 | June 2021 | 32,693,895 | 32,843,437 | 149,542 |
| U.S. Treasury 10 Year Notes | 200 | June 2021 | 26,359,891 | 26,406,250 | 46,359 |
| E-mini Financial Select Sector Index | 280 | June 2021 | 29,497,132 | 31,185,000 | 1,687,868 |
| E-MINI S&P 500 Index Industrial Sector | 461 | June 2021 | 44,918,752 | 47,220,230 | 2,301,478 |
| Euro STOXX 50 Index | 1,112 | June 2021 | 50,552,668 | 52,673,939 | 2,121,271 |
| FTSE 100 Index | 172 | June 2021 | 15,876,851 | 16,479,379 | 602,528 |
| S&P 500 E-Mini Index | 505 | June 2021 | 99,170,501 | 105,403,600 | 6,233,099 |
| U.S. Treasury Long Bonds | 135 | June 2021 | 21,516,626 | 21,228,750 | (287,876) |
| U.S. Treasury Ultra Bonds | 330 | June 2021 | 61,932,865 | 61,349,063 | (583,802) |
| Yen Denominated Nikkei 225 Index | 465 | June 2021 | 61,466,155 | 61,374,554 | (91,601) |
| Total Long Contracts | 12,089,804 | ||||
| Short Contracts | |||||
| U.S. Treasury 10 Year Ultra Bonds | (298) | June 2021 | (43,985,185) | (43,372,969) | 612,216 |
| Net Unrealized Appreciation | $ 12,702,020 |
| 1. | As of April 30, 2021, cash in the amount of $21,982,299 was on deposit with a broker or futures commission merchant for futures transactions. |
| 2. | Represents the difference between the value of the contracts at the time they were opened and the value as of April 30, 2021. |
| Abbreviation(s): |
| ADR—American Depositary Receipt |
| AUD—Australia Dollar |
| 28 | MainStay Income Builder Fund |
| EUR—Euro |
| FHLMC—Federal Home Loan Mortgage Corp. |
| FNMA—Federal National Mortgage Association |
| FTSE—Financial Times Stock Exchange |
| GBP—British Pound Sterling |
| GDR—Global Depositary Receipt |
| GNMA—Government National Mortgage Association |
| JPY—Japanese Yen |
| LIBOR—London Interbank Offered Rate |
| REMIC—Real Estate Mortgage Investment Conduit |
| SOFR—Secured Overnight Financing Rate |
| TBA—To Be Announced |
| UMBS—Uniform Mortgage Backed Securities |
| USD—United States Dollar |
| Description | Quoted Prices in Active Markets for Identical Assets (Level 1) | Significant Other Observable Inputs (Level 2) | Significant Unobservable Inputs (Level 3) | Total | |||
| Asset Valuation Inputs | |||||||
| Investments in Securities (a) | |||||||
| Long-Term Bonds | |||||||
| Asset-Backed Securities | $ — | $ 57,142,700 | $ — | $ 57,142,700 | |||
| Corporate Bonds | — | 513,594,407 | — | 513,594,407 | |||
| Foreign Government Bonds | — | 14,652,892 | — | 14,652,892 | |||
| Loan Assignments | — | 11,620,294 | — | 11,620,294 | |||
| Mortgage-Backed Securities | — | 128,523,266 | — | 128,523,266 | |||
| Municipal Bonds | — | 3,120,036 | — | 3,120,036 | |||
| U.S. Government & Federal Agencies | — | 97,692,086 | — | 97,692,086 | |||
| Total Long-Term Bonds | — | 826,345,681 | — | 826,345,681 | |||
| Common Stocks | 724,983,301 | — | — | 724,983,301 | |||
| Short-Term Investments | |||||||
| Affiliated Investment Company | 57,896,967 | — | — | 57,896,967 | |||
| Unaffiliated Investment Company | 16,806,935 | — | — | 16,806,935 | |||
| Total Short-Term Investments | 74,703,902 | — | — | 74,703,902 | |||
| Total Investments in Securities | 799,687,203 | 826,345,681 | — | 1,626,032,884 | |||
| Other Financial Instruments | |||||||
| Foreign Currency Forward Contracts (b) | — | 1,075,713 | — | 1,075,713 | |||
| Futures Contracts (b) | 13,754,361 | — | — | 13,754,361 | |||
| Total Other Financial Instruments | 13,754,361 | 1,075,713 | — | 14,830,074 | |||
| Total Investments in Securities and Other Financial Instruments | $ 813,441,564 | $ 827,421,394 | $ — | $ 1,640,862,958 | |||
| Liability Valuation Inputs | |||||||
| Other Financial Instruments | |||||||
| Foreign Currency Forward Contracts (b) | $ — | $ (4,418,439) | $ — | $ (4,418,439) | |||
| Futures Contracts (b) | (1,052,341) | — | — | (1,052,341) | |||
| Total Other Financial Instruments | $ (1,052,341) | $ (4,418,439) | $ — | $ (5,470,780) |
| (a) | For a complete listing of investments and their industries, see the Portfolio of Investments. |
| (b) | The value listed for these securities reflects unrealized appreciation (depreciation) as shown on the Portfolio of Investments. |
| 30 | MainStay Income Builder Fund |
| Assets | |
| Investment in unaffiliated securities, at value (identified cost $1,384,338,888) including securities on loan of $18,988,421 | $1,568,135,917 |
| Investment in affiliated investment companies, at value (identified cost $57,896,967) | 57,896,967 |
| Cash collateral on deposit at broker for futures contracts | 21,982,299 |
| Cash denominated in foreign currencies (identified cost $3,864,437) | 3,888,647 |
| Due from custodian | 115,621 |
| Receivables: | |
| Dividends and interest | 9,348,403 |
| Investment securities sold | 8,358,766 |
| Fund shares sold | 5,272,659 |
| Securities lending | 12,508 |
| Unrealized appreciation on foreign currency forward contracts | 1,075,713 |
| Other assets | 156,861 |
| Total assets | 1,676,244,361 |
| Liabilities | |
| Cash collateral received for securities on loan | 16,806,935 |
| Due to custodian | 10,690,836 |
| Payables: | |
| Investment securities purchased | 14,672,231 |
| Fund shares redeemed | 1,681,032 |
| Manager (See Note 3) | 816,464 |
| Variation margin on futures contracts | 514,528 |
| Transfer agent (See Note 3) | 328,711 |
| NYLIFE Distributors (See Note 3) | 310,991 |
| Shareholder communication | 87,933 |
| Professional fees | 69,129 |
| Custodian | 29,688 |
| Accrued expenses | 1,534 |
| Unrealized depreciation on foreign currency forward contracts | 4,418,439 |
| Total liabilities | 50,428,451 |
| Net assets | $1,625,815,910 |
| Composition of Net Assets | |
| Shares of beneficial interest outstanding (par value of $.01 per share) unlimited number of shares authorized | $ 760,993 |
| Additional paid-in-capital | 1,396,064,409 |
| 1,396,825,402 | |
| Total distributable earnings (loss) | 228,990,508 |
| Net assets | $1,625,815,910 |
| Class A | |
| Net assets applicable to outstanding shares | $762,570,550 |
| Shares of beneficial interest outstanding | 35,858,403 |
| Net asset value per share outstanding | $ 21.27 |
| Maximum sales charge (3.00% of offering price) | 0.66 |
| Maximum offering price per share outstanding | $ 21.93 |
| Investor Class | |
| Net assets applicable to outstanding shares | $ 82,904,120 |
| Shares of beneficial interest outstanding | 3,894,846 |
| Net asset value per share outstanding | $ 21.29 |
| Maximum sales charge (2.50% of offering price) | 0.55 |
| Maximum offering price per share outstanding | $ 21.84 |
| Class B | |
| Net assets applicable to outstanding shares | $ 19,386,279 |
| Shares of beneficial interest outstanding | 904,407 |
| Net asset value and offering price per share outstanding | $ 21.44 |
| Class C | |
| Net assets applicable to outstanding shares | $146,133,746 |
| Shares of beneficial interest outstanding | 6,831,396 |
| Net asset value and offering price per share outstanding | $ 21.39 |
| Class I | |
| Net assets applicable to outstanding shares | $504,310,804 |
| Shares of beneficial interest outstanding | 23,466,415 |
| Net asset value and offering price per share outstanding | $ 21.49 |
| Class R2 | |
| Net assets applicable to outstanding shares | $ 3,235,258 |
| Shares of beneficial interest outstanding | 152,146 |
| Net asset value and offering price per share outstanding | $ 21.26 |
| Class R3 | |
| Net assets applicable to outstanding shares | $ 1,974,537 |
| Shares of beneficial interest outstanding | 92,845 |
| Net asset value and offering price per share outstanding | $ 21.27 |
| Class R6 | |
| Net assets applicable to outstanding shares | $105,272,650 |
| Shares of beneficial interest outstanding | 4,897,479 |
| Net asset value and offering price per share outstanding | $ 21.50 |
| SIMPLE Class | |
| Net assets applicable to outstanding shares | $ 27,966 |
| Shares of beneficial interest outstanding | 1,314 |
| Net asset value and offering price per share outstanding (a) | $ 21.29 |
| (a) | The difference between the recalculated and stated NAV was caused by rounding. |
| Investment Income (Loss) | |
| Income | |
| Interest (net of foreign tax withholding of $2,164) | $ 13,074,199 |
| Dividends-unaffiliated (net of foreign tax withholding of $706,411) | 11,864,735 |
| Securities lending | 30,423 |
| Dividends-affiliated | 2,992 |
| Other | 538,716 |
| Total income | 25,511,065 |
| Expenses | |
| Manager (See Note 3) | 4,778,310 |
| Distribution/Service—Class A (See Note 3) | 886,822 |
| Distribution/Service—Investor Class (See Note 3) | 103,452 |
| Distribution/Service—Class B (See Note 3) | 98,882 |
| Distribution/Service—Class C (See Note 3) | 765,233 |
| Distribution/Service—Class R2 (See Note 3) | 4,116 |
| Distribution/Service—Class R3 (See Note 3) | 4,549 |
| Distribution/Service—SIMPLE Class (See Note 3) | 66 |
| Transfer agent (See Note 3) | 902,263 |
| Registration | 95,010 |
| Professional fees | 83,465 |
| Shareholder communication | 77,446 |
| Custodian | 47,992 |
| Trustees | 16,261 |
| Insurance | 6,056 |
| Shareholder service (See Note 3) | 2,556 |
| Miscellaneous | 31,655 |
| Total expenses | 7,904,134 |
| Net investment income (loss) | 17,606,931 |
| Realized and Unrealized Gain (Loss) | |
| Net realized gain (loss) on: | |
| Unaffiliated investment transactions | 28,303,228 |
| Futures transactions | 45,018,662 |
| Foreign currency transactions | (14,635) |
| Foreign currency forward transactions | 2,812,248 |
| Net realized gain (loss) | 76,119,503 |
| Net change in unrealized appreciation (depreciation) on: | |
| Unaffiliated investments | 120,865,458 |
| Futures contracts | 17,179,627 |
| Foreign currency forward contracts | (4,397,219) |
| Translation of other assets and liabilities in foreign currencies | (579,394) |
| Net change in unrealized appreciation (depreciation) | 133,068,472 |
| Net realized and unrealized gain (loss) | 209,187,975 |
| Net increase (decrease) in net assets resulting from operations | $226,794,906 |
| 32 | MainStay Income Builder Fund |
for the six months ended April 30, 2021 (Unaudited) and the year ended October 31, 2020
| 2021 | 2020 | |
| Increase (Decrease) in Net Assets | ||
| Operations: | ||
| Net investment income (loss) | $ 17,606,931 | $ 33,859,779 |
| Net realized gain (loss) | 76,119,503 | (32,719,980) |
| Net change in unrealized appreciation (depreciation) | 133,068,472 | (19,728,631) |
| Net increase (decrease) in net assets resulting from operations | 226,794,906 | (18,588,832) |
| Distributions to shareholders: | ||
| Class A | (10,715,609) | (38,695,065) |
| Investor Class | (1,162,371) | (4,945,627) |
| Class B | (198,708) | (1,245,001) |
| Class C | (1,536,449) | (9,531,711) |
| Class I | (7,763,418) | (30,256,759) |
| Class R2 | (47,362) | (155,024) |
| Class R3 | (24,744) | (49,678) |
| Class R6 | (1,651,446) | (6,279,420) |
| SIMPLE Class | (343) | (72) |
| Total distributions to shareholders | (23,100,450) | (91,158,357) |
| Capital share transactions: | ||
| Net proceeds from sales of shares | 132,103,632 | 320,543,037 |
| Net asset value of shares issued to shareholder in reinvestment of distributions | 21,141,146 | 83,497,446 |
| Cost of shares redeemed | (161,731,870) | (384,329,610) |
| Increase (decrease) in net assets derived from capital share transactions | (8,487,092) | 19,710,873 |
| Net increase (decrease) in net assets | 195,207,364 | (90,036,316) |
| Net Assets | ||
| Beginning of period | 1,430,608,546 | 1,520,644,862 |
| End of period | $1,625,815,910 | $1,430,608,546 |
| Six months ended April 30, 2021* | Year Ended October 31, | ||||||||||
| Class A | 2020 | 2019 | 2018 | 2017 | 2016 | ||||||
| Net asset value at beginning of period | $ 18.61 | $ 19.96 | $ 18.51 | $ 19.97 | $ 18.30 | $ 18.79 | |||||
| Net investment income (loss) (a) | 0.23 | 0.44 | 0.54 | 0.52 | 0.48 | 0.58 | |||||
| Net realized and unrealized gain (loss) on investments | 2.74 | (0.65) | 1.73 | (1.04) | 1.83 | (0.17) | |||||
| Net realized and unrealized gain (loss) on foreign currency transactions | (0.00)‡ | 0.04 | 0.06 | 0.07 | (0.09) | 0.30 | |||||
| Total from investment operations | 2.97 | (0.17) | 2.33 | (0.45) | 2.22 | 0.71 | |||||
| Less distributions: | |||||||||||
| From net investment income | (0.31) | (0.42) | (0.56) | (0.52) | (0.55) | (0.61) | |||||
| From net realized gain on investments | — | (0.76) | (0.32) | (0.49) | — | (0.59) | |||||
| Total distributions | (0.31) | (1.18) | (0.88) | (1.01) | (0.55) | (1.20) | |||||
| Net asset value at end of period | $ 21.27 | $ 18.61 | $ 19.96 | $ 18.51 | $ 19.97 | $ 18.30 | |||||
| Total investment return (b) | 16.01% | (0.90)% | 13.09% | (2.38)% | 12.30% | 4.08% | |||||
| Ratios (to average net assets)/Supplemental Data: | |||||||||||
| Net investment income (loss) | 2.28%†† | 2.32% | 2.83% | 2.72% | 2.52% | 3.21% | |||||
| Net expenses (c) | 1.01%†† | 1.02% | 1.02% | 1.01% | 1.01% | 1.02% | |||||
| Portfolio turnover rate | 23% (d) | 65% (d) | 62% (d) | 44% (d) | 29% | 27% | |||||
| Net assets at end of period (in 000’s) | $ 762,571 | $ 638,250 | $ 625,049 | $ 571,206 | $ 652,333 | $ 574,390 | |||||
| * | Unaudited. |
| ‡ | Less than one cent per share. |
| †† | Annualized. |
| (a) | Per share data based on average shares outstanding during the period. |
| (b) | Total investment return is calculated exclusive of sales charges and assumes the reinvestment of dividends and distributions. For periods of less than one year, total return is not annualized. |
| (c) | In addition to the fees and expenses which the Fund bears directly, it also indirectly bears a pro-rata share of the fees and expenses of the underlying funds in which it invests. Such indirect expenses are not included in the above expense ratios. |
| (d) | The portfolio turnover rates not including mortgage dollar rolls were 23%, 62%, 54% and 36% for the six-month period ended April 30, 2021 and for the years ended October 31, 2020, 2019 and 2018, respectively. |
| 34 | MainStay Income Builder Fund |
| Six months ended April 30, 2021* | Year Ended October 31, | ||||||||||
| Investor Class | 2020 | 2019 | 2018 | 2017 | 2016 | ||||||
| Net asset value at beginning of period | $ 18.62 | $ 19.98 | $ 18.52 | $ 19.99 | $ 18.31 | $ 18.80 | |||||
| Net investment income (loss) (a) | 0.21 | 0.41 | 0.51 | 0.50 | 0.47 | 0.56 | |||||
| Net realized and unrealized gain (loss) on investments | 2.75 | (0.66) | 1.74 | (1.05) | 1.82 | (0.16) | |||||
| Net realized and unrealized gain (loss) on foreign currency transactions | (0.00)‡ | 0.04 | 0.06 | 0.07 | (0.09) | 0.28 | |||||
| Total from investment operations | 2.96 | (0.21) | 2.31 | (0.48) | 2.20 | 0.68 | |||||
| Less distributions: | |||||||||||
| From net investment income | (0.29) | (0.39) | (0.53) | (0.50) | (0.52) | (0.58) | |||||
| From net realized gain on investments | — | (0.76) | (0.32) | (0.49) | — | (0.59) | |||||
| Total distributions | (0.29) | (1.15) | (0.85) | (0.99) | (0.52) | (1.17) | |||||
| Net asset value at end of period | $ 21.29 | $ 18.62 | $ 19.98 | $ 18.52 | $ 19.99 | $ 18.31 | |||||
| Total investment return (b) | 15.95% | (1.11)% | 12.98% | (2.56)% | 12.19% | 3.93% | |||||
| Ratios (to average net assets)/Supplemental Data: | |||||||||||
| Net investment income (loss) | 2.11%†† | 2.16% | 2.70% | 2.59% | 2.45% | 3.09% | |||||
| Net expenses (c) | 1.17%†† | 1.17% | 1.16% | 1.13% | 1.14% | 1.16% | |||||
| Expenses (before waiver/reimbursement) (c) | 1.17%†† | 1.17% | 1.17% | 1.14% | 1.14% | 1.16% | |||||
| Portfolio turnover rate | 23% (d) | 65% (d) | 62% (d) | 44% (d) | 29% | 27% | |||||
| Net assets at end of period (in 000’s) | $ 82,904 | $ 79,992 | $ 88,050 | $ 85,132 | $ 94,000 | $ 153,137 | |||||
| * | Unaudited. |
| ‡ | Less than one cent per share. |
| †† | Annualized. |
| (a) | Per share data based on average shares outstanding during the period. |
| (b) | Total investment return is calculated exclusive of sales charges and assumes the reinvestment of dividends and distributions. For periods of less than one year, total return is not annualized. |
| (c) | In addition to the fees and expenses which the Fund bears directly, it also indirectly bears a pro-rata share of the fees and expenses of the underlying funds in which it invests. Such indirect expenses are not included in the above expense ratios. |
| (d) | The portfolio turnover rates not including mortgage dollar rolls were 23%, 62%, 54% and 36% for the six-month period ended April 30, 2021 and for the years ended October 31, 2020, 2019 and 2018, respectively. |
| Six months ended April 30, 2021* | Year Ended October 31, | ||||||||||
| Class B | 2020 | 2019 | 2018 | 2017 | 2016 | ||||||
| Net asset value at beginning of period | $ 18.75 | $ 20.11 | $ 18.64 | $ 20.10 | $ 18.40 | $ 18.89 | |||||
| Net investment income (loss) (a) | 0.14 | 0.27 | 0.37 | 0.36 | 0.32 | 0.42 | |||||
| Net realized and unrealized gain (loss) on investments | 2.76 | (0.66) | 1.75 | (1.05) | 1.83 | (0.17) | |||||
| Net realized and unrealized gain (loss) on foreign currency transactions | (0.00)‡ | 0.04 | 0.06 | 0.07 | (0.09) | 0.30 | |||||
| Total from investment operations | 2.90 | (0.35) | 2.18 | (0.62) | 2.06 | 0.55 | |||||
| Less distributions: | |||||||||||
| From net investment income | (0.21) | (0.25) | (0.39) | (0.35) | (0.36) | (0.45) | |||||
| From net realized gain on investments | — | (0.76) | (0.32) | (0.49) | — | (0.59) | |||||
| Total distributions | (0.21) | (1.01) | (0.71) | (0.84) | (0.36) | (1.04) | |||||
| Net asset value at end of period | $ 21.44 | $ 18.75 | $ 20.11 | $ 18.64 | $ 20.10 | $ 18.40 | |||||
| Total investment return (b) | 15.51% | (1.84)% | 12.11% | (3.22)% | 11.27% | 3.20% | |||||
| Ratios (to average net assets)/Supplemental Data: | |||||||||||
| Net investment income (loss) | 1.35%†† | 1.42% | 1.96% | 1.85% | 1.67% | 2.34% | |||||
| Net expenses (c) | 1.92%†† | 1.92% | 1.91% | 1.88% | 1.89% | 1.91% | |||||
| Expenses (before waiver/reimbursement) (c) | 1.92%†† | 1.92% | 1.92% | 1.89% | 1.89% | 1.91% | |||||
| Portfolio turnover rate | 23% (d) | 65% (d) | 62% (d) | 44% (d) | 29% | 27% | |||||
| Net assets at end of period (in 000’s) | $ 19,386 | $ 19,409 | $ 26,396 | $ 30,343 | $ 39,475 | $ 42,253 | |||||
| * | Unaudited. |
| ‡ | Less than one cent per share. |
| †† | Annualized. |
| (a) | Per share data based on average shares outstanding during the period. |
| (b) | Total investment return is calculated exclusive of sales charges and assumes the reinvestment of dividends and distributions. For periods of less than one year, total return is not annualized. |
| (c) | In addition to the fees and expenses which the Fund bears directly, it also indirectly bears a pro-rata share of the fees and expenses of the underlying funds in which it invests. Such indirect expenses are not included in the above expense ratios. |
| (d) | The portfolio turnover rates not including mortgage dollar rolls were 23%, 62%, 54% and 36% for the six-month period ended April 30, 2021 and for the years ended October 31, 2020, 2019 and 2018, respectively. |
| 36 | MainStay Income Builder Fund |
| Six months ended April 30, 2021* | Year Ended October 31, | ||||||||||
| Class C | 2020 | 2019 | 2018 | 2017 | 2016 | ||||||
| Net asset value at beginning of period | $ 18.71 | $ 20.07 | $ 18.60 | $ 20.07 | $ 18.37 | $ 18.86 | |||||
| Net investment income (loss) (a) | 0.14 | 0.27 | 0.37 | 0.36 | 0.32 | 0.42 | |||||
| Net realized and unrealized gain (loss) on investments | 2.75 | (0.66) | 1.75 | (1.06) | 1.83 | (0.17) | |||||
| Net realized and unrealized gain (loss) on foreign currency transactions | (0.00)‡ | 0.04 | 0.06 | 0.07 | (0.09) | 0.30 | |||||
| Total from investment operations | 2.89 | (0.35) | 2.18 | (0.63) | 2.06 | 0.55 | |||||
| Less distributions: | |||||||||||
| From net investment income | (0.21) | (0.25) | (0.39) | (0.35) | (0.36) | (0.45) | |||||
| From net realized gain on investments | — | (0.76) | (0.32) | (0.49) | — | (0.59) | |||||
| Total distributions | (0.21) | (1.01) | (0.71) | (0.84) | (0.36) | (1.04) | |||||
| Net asset value at end of period | $ 21.39 | $ 18.71 | $ 20.07 | $ 18.60 | $ 20.07 | $ 18.37 | |||||
| Total investment return (b) | 15.49% | (1.85)% | 12.13% | (3.28)% | 11.35% | 3.15% | |||||
| Ratios (to average net assets)/Supplemental Data: | |||||||||||
| Net investment income (loss) | 1.35%†† | 1.42% | 1.95% | 1.85% | 1.65% | 2.32% | |||||
| Net expenses (c) | 1.92%†† | 1.92% | 1.91% | 1.88% | 1.89% | 1.91% | |||||
| Expenses (before waiver/reimbursement) (c) | 1.92%†† | 1.92% | 1.92% | 1.89% | 1.89% | 1.91% | |||||
| Portfolio turnover rate | 23% (d) | 65% (d) | 62% (d) | 44% (d) | 29% | 27% | |||||
| Net assets at end of period (in 000’s) | $ 146,134 | $ 148,220 | $ 191,737 | $ 212,400 | $ 266,592 | $ 254,312 | |||||
| * | Unaudited. |
| ‡ | Less than one cent per share. |
| †† | Annualized. |
| (a) | Per share data based on average shares outstanding during the period. |
| (b) | Total investment return is calculated exclusive of sales charges and assumes the reinvestment of dividends and distributions. For periods of less than one year, total return is not annualized. |
| (c) | In addition to the fees and expenses which the Fund bears directly, it also indirectly bears a pro-rata share of the fees and expenses of the underlying funds in which it invests. Such indirect expenses are not included in the above expense ratios. |
| (d) | The portfolio turnover rates not including mortgage dollar rolls were 23%, 62%, 54% and 36% for the six-month period ended April 30, 2021 and for the years ended October 31, 2020, 2019 and 2018, respectively. |
| Six months ended April 30, 2021* | Year Ended October 31, | ||||||||||
| Class I | 2020 | 2019 | 2018 | 2017 | 2016 | ||||||
| Net asset value at beginning of period | $ 18.80 | $ 20.16 | $ 18.68 | $ 20.15 | $ 18.46 | $ 18.95 | |||||
| Net investment income (loss) (a) | 0.26 | 0.49 | 0.59 | 0.58 | 0.54 | 0.63 | |||||
| Net realized and unrealized gain (loss) on investments | 2.76 | (0.66) | 1.76 | (1.06) | 1.84 | (0.16) | |||||
| Net realized and unrealized gain (loss) on foreign currency transactions | (0.00)‡ | 0.04 | 0.06 | 0.07 | (0.09) | 0.28 | |||||
| Total from investment operations | 3.02 | (0.13) | 2.41 | (0.41) | 2.29 | 0.75 | |||||
| Less distributions: | |||||||||||
| From net investment income | (0.33) | (0.47) | (0.61) | (0.57) | (0.60) | (0.65) | |||||
| From net realized gain on investments | — | (0.76) | (0.32) | (0.49) | — | (0.59) | |||||
| Total distributions | (0.33) | (1.23) | (0.93) | (1.06) | (0.60) | (1.24) | |||||
| Net asset value at end of period | $ 21.49 | $ 18.80 | $ 20.16 | $ 18.68 | $ 20.15 | $ 18.46 | |||||
| Total investment return (b) | 16.15% | (0.69)% | 13.41% | (2.17)% | 12.60% | 4.30% | |||||
| Ratios (to average net assets)/Supplemental Data: | |||||||||||
| Net investment income (loss) | 2.53%†† | 2.57% | 3.09% | 3.03% | 2.77% | 3.44% | |||||
| Net expenses (c) | 0.76%†† | 0.77% | 0.77% | 0.76% | 0.76% | 0.77% | |||||
| Portfolio turnover rate | 23% (d) | 65% (d) | 62% (d) | 44% (d) | 29% | 27% | |||||
| Net assets at end of period (in 000’s) | $ 504,311 | $ 448,922 | $ 484,614 | $ 499,675 | $ 766,054 | $ 542,330 | |||||
| * | Unaudited. |
| ‡ | Less than one cent per share. |
| †† | Annualized. |
| (a) | Per share data based on average shares outstanding during the period. |
| (b) | Total investment return is calculated exclusive of sales charges and assumes the reinvestment of dividends and distributions. Class I shares are not subject to sales charges. For periods of less than one year, total return is not annualized. |
| (c) | In addition to the fees and expenses which the Fund bears directly, it also indirectly bears a pro-rata share of the fees and expenses of the underlying funds in which it invests. Such indirect expenses are not included in the above expense ratios. |
| (d) | The portfolio turnover rates not including mortgage dollar rolls were 23%, 62%, 54% and 36% for the six-month period ended April 30, 2021 and for the years ended October 31, 2020, 2019 and 2018, respectively. |
| 38 | MainStay Income Builder Fund |
| Six months ended April 30, 2021* | Year Ended October 31, | ||||||||||
| Class R2 | 2020 | 2019 | 2018 | 2017 | 2016 | ||||||
| Net asset value at beginning of period | $ 18.61 | $ 19.95 | $ 18.50 | $ 19.96 | $ 18.29 | $ 18.78 | |||||
| Net investment income (loss) (a) | 0.22 | 0.42 | 0.52 | 0.50 | 0.46 | 0.55 | |||||
| Net realized and unrealized gain (loss) on investments | 2.73 | (0.63) | 1.73 | (1.04) | 1.83 | (0.19) | |||||
| Net realized and unrealized gain (loss) on foreign currency transactions | (0.00)‡ | 0.04 | 0.06 | 0.07 | (0.09) | 0.33 | |||||
| Total from investment operations | 2.95 | (0.17) | 2.31 | (0.47) | 2.20 | 0.69 | |||||
| Less distributions: | |||||||||||
| From net investment income | (0.30) | (0.41) | (0.54) | (0.50) | (0.53) | (0.59) | |||||
| From net realized gain on investments | — | (0.76) | (0.32) | (0.49) | — | (0.59) | |||||
| Total distributions | (0.30) | (1.17) | (0.86) | (0.99) | (0.53) | (1.18) | |||||
| Net asset value at end of period | $ 21.26 | $ 18.61 | $ 19.95 | $ 18.50 | $ 19.96 | $ 18.29 | |||||
| Total investment return (b) | 15.96% | (1.00)% | 12.98% | (2.48)% | 12.20% | 3.99% | |||||
| Ratios (to average net assets)/Supplemental Data: | |||||||||||
| Net investment income (loss) | 2.17%†† | 2.21% | 2.77% | 2.61% | 2.36% | 3.03% | |||||
| Net expenses (c) | 1.11%†† | 1.11% | 1.12% | 1.11% | 1.11% | 1.12% | |||||
| Portfolio turnover rate | 23% (d) | 65% (d) | 62% (d) | 44% (d) | 29% | 27% | |||||
| Net assets at end of period (in 000’s) | $ 3,235 | $ 3,044 | $ 2,524 | $ 3,587 | $ 4,409 | $ 838 | |||||
| * | Unaudited. |
| ‡ | Less than one cent per share. |
| †† | Annualized. |
| (a) | Per share data based on average shares outstanding during the period. |
| (b) | Total investment return is calculated exclusive of sales charges and assumes the reinvestment of dividends and distributions. Class R2 shares are not subject to sales charges. For periods of less than one year, total return is not annualized. |
| (c) | In addition to the fees and expenses which the Fund bears directly, it also indirectly bears a pro-rata share of the fees and expenses of the underlying funds in which it invests. Such indirect expenses are not included in the above expense ratios. |
| (d) | The portfolio turnover rates not including mortgage dollar rolls were 23%, 62%, 54% and 36% for the six-month period ended April 30, 2021 and for the years ended October 31, 2020, 2019 and 2018, respectively. |
| Six months ended April 30, 2021* | Year Ended October 31, | February 29, 2016^ through October 31, 2016 | |||||||||
| Class R3 | 2020 | 2019 | 2018 | 2017 | |||||||
| Net asset value at beginning of period | $ 18.61 | $ 19.96 | $ 18.51 | $ 19.97 | $ 18.30 | $ 17.10 | |||||
| Net investment income (loss) (a) | 0.20 | 0.37 | 0.45 | 0.42 | 0.42 | 0.35 | |||||
| Net realized and unrealized gain (loss) on investments | 2.73 | (0.64) | 1.76 | (1.00) | 1.82 | (1.69) | |||||
| Net realized and unrealized gain (loss) on foreign currency transactions | (0.00)‡ | 0.04 | 0.06 | 0.06 | (0.09) | 2.95 | |||||
| Total from investment operations | 2.93 | (0.23) | 2.27 | (0.52) | 2.15 | 1.61 | |||||
| Less distributions: | |||||||||||
| From net investment income | (0.27) | (0.36) | (0.50) | (0.45) | (0.48) | (0.41) | |||||
| From net realized gain on investments | — | (0.76) | (0.32) | (0.49) | — | — | |||||
| Total distributions | (0.27) | (1.12) | (0.82) | (0.94) | (0.48) | (0.41) | |||||
| Net asset value at end of period | $ 21.27 | $ 18.61 | $ 19.96 | $ 18.51 | $ 19.97 | $ 18.30 | |||||
| Total investment return (b) | 15.82% | (1.24)% | 12.70% | (2.73)% | 11.89% | 9.42% | |||||
| Ratios (to average net assets)/Supplemental Data: | |||||||||||
| Net investment income (loss) | 1.92%†† | 1.97% | 2.34% | 2.19% | 2.16% | 2.81%†† | |||||
| Net expenses (c) | 1.36%†† | 1.37% | 1.36% | 1.35% | 1.36% | 1.36%†† | |||||
| Portfolio turnover rate | 23% (d) | 65% (d) | 62% (d) | 44% (d) | 29% | 27% | |||||
| Net assets at end of period (in 000’s) | $ 1,975 | $ 1,196 | $ 590 | $ 136 | $ 201 | $ 39 | |||||
| * | Unaudited. |
| ^ | Inception date. |
| ‡ | Less than one cent per share. |
| †† | Annualized. |
| (a) | Per share data based on average shares outstanding during the period. |
| (b) | Total investment return is calculated exclusive of sales charges and assumes the reinvestment of dividends and distributions. Class R3 shares are not subject to sales charges. For periods of less than one year, total return is not annualized. |
| (c) | In addition to the fees and expenses which the Fund bears directly, it also indirectly bears a pro-rata share of the fees and expenses of the underlying funds in which it invests. Such indirect expenses are not included in the above expense ratios. |
| (d) | The portfolio turnover rates not including mortgage dollar rolls were 23%, 62%, 54% and 36% for the six-month period ended April 30, 2021 and for the years ended October 31, 2020, 2019 and 2018, respectively. |
| 40 | MainStay Income Builder Fund |
| Six months ended April 30, 2021* | Year Ended October 31, | February 28, 2018^ through October 31, 2018 | |||||
| Class R6 | 2020 | 2019 | |||||
| Net asset value at beginning of period | $ 18.80 | $ 20.16 | $ 18.68 | $ 19.19 | |||
| Net investment income (loss) (a) | 0.27 | 0.51 | 0.61 | 0.33 | |||
| Net realized and unrealized gain (loss) on investments | 2.77 | (0.66) | 1.76 | (0.47) | |||
| Net realized and unrealized gain (loss) on foreign currency transactions | (0.00)‡ | 0.04 | 0.06 | 0.03 | |||
| Total from investment operations | 3.04 | (0.11) | 2.43 | (0.11) | |||
| Less distributions: | |||||||
| From net investment income | (0.34) | (0.49) | (0.63) | (0.40) | |||
| From net realized gain on investments | — | (0.76) | (0.32) | — | |||
| Total distributions | (0.34) | (1.25) | (0.95) | (0.40) | |||
| Net asset value at end of period | $ 21.50 | $ 18.80 | $ 20.16 | $ 18.68 | |||
| Total investment return (b) | 16.25% | (0.60)% | 13.52% | (0.61)% | |||
| Ratios (to average net assets)/Supplemental Data: | |||||||
| Net investment income (loss) | 2.62%†† | 2.67% | 3.18% | 2.55%†† | |||
| Net expenses (c) | 0.67%†† | 0.67% | 0.67% | 0.66%†† | |||
| Portfolio turnover rate (d) | 23% | 65% | 62% | 44% | |||
| Net assets at end of period (in 000’s) | $ 105,273 | $ 91,551 | $ 101,685 | $ 94,869 | |||
| * | Unaudited. |
| ^ | Inception date. |
| ‡ | Less than one cent per share. |
| †† | Annualized. |
| (a) | Per share data based on average shares outstanding during the period. |
| (b) | Total investment return is calculated exclusive of sales charges and assumes the reinvestment of dividends and distributions. Class R6 shares are not subject to sales charges. For periods of less than one year, total return is not annualized. |
| (c) | In addition to the fees and expenses which the Fund bears directly, it also indirectly bears a pro-rata share of the fees and expenses of the underlying funds in which it invests. Such indirect expenses are not included in the above expense ratios. |
| (d) | The portfolio turnover rates not including mortgage dollar rolls were 23%, 62%, 54% and 36% for the six-month period ended April 30, 2021 and for the years ended October 31, 2020, 2019 and 2018, respectively. |
| Six months ended April 30, 2021* | August 31, 2020^ through October 31, | ||
| SIMPLE Class | 2020 | ||
| Net asset value at beginning of period | $ 18.62 | $ 19.33** | |
| Net investment income (loss) (a) | 0.19 | 0.04 | |
| Net realized and unrealized gain (loss) on investments | 2.74 | (0.74) | |
| Net realized and unrealized gain (loss) on foreign currency transactions | (0.00)‡ | 0.05 | |
| Total from investment operations | 2.93 | (0.65) | |
| Less distributions: | |||
| From net investment income | (0.26) | (0.06) | |
| Net asset value at end of period | $ 21.29 | $ 18.62 | |
| Total investment return (b) | 15.81% | (3.39)% | |
| Ratios (to average net assets)/Supplemental Data: | |||
| Net investment income (loss)†† | 1.87% | 1.62% | |
| Net expenses†† (c) | 1.42% | 1.43% | |
| Portfolio turnover rate (d) | 23% | 65% | |
| Net assets at end of period (in 000’s) | $ 28 | $ 24 |
| * | Unaudited. |
| ** | Based on the net asset value of Investor Class as of August 31, 2020. |
| ‡ | Less than one cent per share. |
| ^ | Inception date. |
| †† | Annualized. |
| (a) | Per share data based on average shares outstanding during the period. |
| (b) | Total investment return is calculated exclusive of sales charges and assumes the reinvestment of dividends and distributions. SIMPLE Class shares are not subject to sales charges. For periods of less than one year, total return is not annualized. |
| (c) | In addition to the fees and expenses which the Fund bears directly, it also indirectly bears a pro-rata share of the fees and expenses of the underlying funds in which it invests. Such indirect expenses are not included in the above expense ratios. |
| (d) | The portfolio turnover rates not including mortgage dollar rolls were 23% and 62% for the six-month period ended April 30, 2021 and for the year ended October 31, 2020 respectively. |
| 42 | MainStay Income Builder Fund |
| Class | Commenced Operations |
| Class A | January 3, 1995 |
| Investor Class | February 28, 2008 |
| Class B | December 29, 1987 |
| Class C | September 1, 1998 |
| Class I | January 2, 2004 |
| Class R2 | February 27, 2015 |
| Class R3 | February 29, 2016 |
| Class R6 | February 28, 2018 |
| SIMPLE Class | August 31, 2020 |
| • | Level 1—quoted prices in active markets for an identical asset or liability |
| • | Level 2—other significant observable inputs (including quoted prices for a similar asset or liability in active markets, interest rates and yield curves, prepayment speeds, credit risk, etc.) |
| • | Level 3—significant unobservable inputs (including the Fund's own assumptions about the assumptions that market participants would use in measuring fair value of an asset or liability) |
| • Broker/dealer quotes | • Benchmark securities |
| • Two-sided markets | • Reference data (corporate actions or material event notices) |
| • Bids/offers | • Monthly payment information |
| • Industry and economic events | • Reported trades |
| 44 | MainStay Income Builder Fund |
| 46 | MainStay Income Builder Fund |
| 48 | MainStay Income Builder Fund |
| Asset Derivatives | Foreign Exchange Contracts Risk | Equity Contracts Risk | Interest Rate Contracts Risk | Total |
| Futures Contracts - Net Assets—Net unrealized appreciation on futures contracts (a) | $ — | $12,946,244 | $808,117 | $13,754,361 |
| Forward Contracts - Unrealized appreciation on foreign currency forward contracts | 1,075,713 | — | — | 1,075,713 |
| Total Fair Value | $1,075,713 | $12,946,244 | $808,117 | $14,830,074 |
| (a) | Includes cumulative appreciation (depreciation) of futures contracts as reported in the Portfolio of Investments. Only current day’s variation margin is reported within the Statement of Assets and Liabilities. |
| Liability Derivatives | Foreign Exchange Contracts Risk | Equity Contracts Risk | Interest Rate Contracts Risk | Total |
| Futures Contracts - Net Assets—Net unrealized depreciation on futures contracts (a) | $ — | $(91,601) | $(960,740) | $(1,052,341) |
| Forward Contracts - Unrealized depreciation on foreign currency forward contracts | (4,418,439) | — | — | (4,418,439) |
| Total Fair Value | $(4,418,439) | $(91,601) | $(960,740) | $(5,470,780) |
| (a) | Includes cumulative appreciation (depreciation) of futures contracts as reported in the Portfolio of Investments. Only current day’s variation margin is reported within the Statement of Assets and Liabilities. |
| 50 | MainStay Income Builder Fund |
| Net Realized Gain (Loss) from: | Foreign Exchange Contracts Risk | Equity Contracts Risk | Interest Rate Contracts Risk | Total |
| Futures Contracts | $ — | $54,579,325 | $(9,560,663) | $45,018,662 |
| Forward Contracts | 2,812,248 | — | — | 2,812,248 |
| Total Net Realized Gain (Loss) | $2,812,248 | $54,579,325 | $(9,560,663) | $47,830,910 |
| Net Change in Unrealized Appreciation (Depreciation) | Foreign Exchange Contracts Risk | Equity Contracts Risk | Interest Rate Contracts Risk | Total |
| Futures Contracts | $ — | $15,087,316 | $2,092,311 | $17,179,627 |
| Forward Contracts | (4,397,219) | — | — | (4,397,219) |
| Total Net Change in Unrealized Appreciation (Depreciation) | $(4,397,219) | $15,087,316 | $2,092,311 | $12,782,408 |
| Average Notional Amount | Total |
| Futures Contracts Long | $507,833,305 |
| Futures Contracts Short | $ (49,436,341) |
| Forward Contracts Long | $134,686,285 |
| Forward Contracts Short | $ (68,932,107) |
| Class R2 | $ 1,646 |
| Class R3 | 910 |
| Class | Expense | Waived |
| Class A | $333,992 | $— |
| Investor Class | 108,969 | — |
| Class B | 26,038 | — |
| Class C | 201,511 | — |
| Class I | 227,316 | — |
| Class R2 | 1,550 | — |
| Class R3 | 856 | — |
| Class R6 | 1,996 | — |
| SIMPLE Class | 35 | — |
| 52 | MainStay Income Builder Fund |
| Affiliated Investment Companies | Value, Beginning of Period | Purchases at Cost | Proceeds from Sales | Net Realized Gain/(Loss) on Sales | Change in Unrealized Appreciation/ (Depreciation) | Value, End of Period | Dividend Income | Other Distributions | Shares End of Period |
| MainStay U.S. Government Liquidity Fund | $ 48,170 | $ 399,026 | $ (389,299) | $ — | $ — | $ 57,897 | $ —(a) | $ — | 57,897 |
| (a) | Less than $500. |
| Class R2 | $ 35,381 | 1.1% |
| Class R6 | 102,078,212 | 97.0 |
| SIMPLE Class | 27,966 | 100.0 |
| Federal Tax Cost | Gross Unrealized Appreciation | Gross Unrealized (Depreciation) | Net Unrealized Appreciation/ (Depreciation) | |
| Investments | $1,442,321,983 | $197,159,378 | $(13,448,477) | $183,710,901 |
| Capital Loss Available Through | Short-Term Capital Loss Amounts (000’s) | Long-Term Capital Loss Amounts (000’s) |
| Unlimited | $11,815 | $28,574 |
| 2020 | |
| Distributions paid from: | |
| Ordinary Income | $54,765,080 |
| Long-Term Capital Gains | 36,393,277 |
| Total | $91,158,357 |
| Class A | Shares | Amount |
| Period ended April 30, 2021: | ||
| Shares sold | 3,314,123 | $ 68,314,787 |
| Shares issued to shareholders in reinvestment of distributions | 495,780 | 10,179,003 |
| Shares redeemed | (2,768,879) | (56,868,722) |
| Net increase (decrease) in shares outstanding before conversion | 1,041,024 | 21,625,068 |
| Shares converted into Class A (See Note 1) | 527,622 | 10,822,561 |
| Shares converted from Class A (See Note 1) | (9,550) | (198,741) |
| Net increase (decrease) | 1,559,096 | $ 32,248,888 |
| Year ended October 31, 2020: | ||
| Shares sold | 7,127,473 | $ 133,913,849 |
| Shares issued to shareholders in reinvestment of distributions | 1,951,567 | 37,506,471 |
| Shares redeemed | (6,670,244) | (123,495,824) |
| Net increase (decrease) in shares outstanding before conversion | 2,408,796 | 47,924,496 |
| Shares converted into Class A (See Note 1) | 608,398 | 11,635,143 |
| Shares converted from Class A (See Note 1) | (31,742) | (572,507) |
| Net increase (decrease) | 2,985,452 | $ 58,987,132 |
| Investor Class | Shares | Amount |
| Period ended April 30, 2021: | ||
| Shares sold | 112,609 | $ 2,313,123 |
| Shares issued to shareholders in reinvestment of distributions | 55,867 | 1,147,388 |
| Shares redeemed | (182,150) | (3,743,188) |
| Net increase (decrease) in shares outstanding before conversion | (13,674) | (282,677) |
| Shares converted into Investor Class (See Note 1) | 35,114 | 725,786 |
| Shares converted from Investor Class (See Note 1) | (421,562) | (8,643,119) |
| Net increase (decrease) | (400,122) | $ (8,200,010) |
| Year ended October 31, 2020: | ||
| Shares sold | 468,570 | $ 8,788,800 |
| Shares issued to shareholders in reinvestment of distributions | 255,745 | 4,923,774 |
| Shares redeemed | (419,834) | (7,927,609) |
| Net increase (decrease) in shares outstanding before conversion | 304,481 | 5,784,965 |
| Shares converted into Investor Class (See Note 1) | 67,654 | 1,261,890 |
| Shares converted from Investor Class (See Note 1) | (484,829) | (9,324,546) |
| Net increase (decrease) | (112,694) | $ (2,277,691) |
| Class B | Shares | Amount |
| Period ended April 30, 2021: | ||
| Shares sold | 9,863 | $ 204,098 |
| Shares issued to shareholders in reinvestment of distributions | 7,746 | 160,173 |
| Shares redeemed | (90,547) | (1,869,086) |
| Net increase (decrease) in shares outstanding before conversion | (72,938) | (1,504,815) |
| Shares converted from Class B (See Note 1) | (57,688) | (1,192,839) |
| Net increase (decrease) | (130,626) | $ (2,697,654) |
| Year ended October 31, 2020: | ||
| Shares sold | 30,233 | $ 569,662 |
| Shares issued to shareholders in reinvestment of distributions | 54,023 | 1,052,476 |
| Shares redeemed | (224,781) | (4,229,189) |
| Net increase (decrease) in shares outstanding before conversion | (140,525) | (2,607,051) |
| Shares converted from Class B (See Note 1) | (137,306) | (2,609,221) |
| Net increase (decrease) | (277,831) | $ (5,216,272) |
| 54 | MainStay Income Builder Fund |
| Class C | Shares | Amount |
| Period ended April 30, 2021: | ||
| Shares sold | 187,946 | $ 3,869,580 |
| Shares issued to shareholders in reinvestment of distributions | 70,707 | 1,458,913 |
| Shares redeemed | (1,265,524) | (26,236,183) |
| Net increase (decrease) in shares outstanding before conversion | (1,006,871) | (20,907,690) |
| Shares converted from Class C (See Note 1) | (81,977) | (1,707,054) |
| Net increase (decrease) | (1,088,848) | $ (22,614,744) |
| Year ended October 31, 2020: | ||
| Shares sold | 917,156 | $ 17,512,908 |
| Shares issued to shareholders in reinvestment of distributions | 442,234 | 8,593,985 |
| Shares redeemed | (2,960,648) | (55,532,149) |
| Net increase (decrease) in shares outstanding before conversion | (1,601,258) | (29,425,256) |
| Shares converted from Class C (See Note 1) | (33,696) | (627,959) |
| Net increase (decrease) | (1,634,954) | $ (30,053,215) |
| Class I | Shares | Amount |
| Period ended April 30, 2021: | ||
| Shares sold | 2,422,142 | $ 50,396,589 |
| Shares issued to shareholders in reinvestment of distributions | 315,178 | 6,536,436 |
| Shares redeemed | (3,157,265) | (65,317,248) |
| Net increase (decrease) in shares outstanding before conversion | (419,945) | (8,384,223) |
| Shares converted into Class I (See Note 1) | 9,192 | 193,406 |
| Net increase (decrease) | (410,753) | $ (8,190,817) |
| Year ended October 31, 2020: | ||
| Shares sold | 8,019,937 | $ 150,877,719 |
| Shares issued to shareholders in reinvestment of distributions | 1,292,612 | 25,075,976 |
| Shares redeemed | (9,493,240) | (176,280,540) |
| Net increase (decrease) in shares outstanding before conversion | (180,691) | (326,845) |
| Shares converted into Class I (See Note 1) | 14,271 | 262,557 |
| Net increase (decrease) | (166,420) | $ (64,288) |
| Class R2 | Shares | Amount |
| Period ended April 30, 2021: | ||
| Shares sold | 7,649 | $ 157,388 |
| Shares issued to shareholders in reinvestment of distributions | 907 | 18,588 |
| Shares redeemed | (19,990) | (415,591) |
| Net increase (decrease) | (11,434) | $ (239,615) |
| Year ended October 31, 2020: | ||
| Shares sold | 39,504 | $ 733,426 |
| Shares issued to shareholders in reinvestment of distributions | 3,946 | 75,822 |
| Shares redeemed | (6,397) | (122,183) |
| Net increase (decrease) | 37,053 | $ 687,065 |
| Class R3 | Shares | Amount |
| Period ended April 30, 2021: | ||
| Shares sold | 39,858 | $ 799,445 |
| Shares issued to shareholders in reinvestment of distributions | 1,194 | 24,509 |
| Shares redeemed | (12,476) | (256,504) |
| Net increase (decrease) | 28,576 | $ 567,450 |
| Year ended October 31, 2020: | ||
| Shares sold | 36,748 | $ 715,768 |
| Shares issued to shareholders in reinvestment of distributions | 2,565 | 49,126 |
| Shares redeemed | (4,574) | (86,605) |
| Net increase (decrease) | 34,739 | $ 678,289 |
| Class R6 | Shares | Amount |
| Period ended April 30, 2021: | ||
| Shares sold | 290,371 | $ 6,048,622 |
| Shares issued to shareholders in reinvestment of distributions | 77,885 | 1,615,793 |
| Shares redeemed | (339,234) | (7,025,348) |
| Net increase (decrease) | 29,022 | $ 639,067 |
| Year ended October 31, 2020: | ||
| Shares sold | 393,526 | $ 7,405,905 |
| Shares issued to shareholders in reinvestment of distributions | 320,653 | 6,219,744 |
| Shares redeemed | (888,573) | (16,655,511) |
| Net increase (decrease) in shares outstanding before conversion | (174,394) | (3,029,862) |
| Shares converted from Class R6 (See Note 1) | (1,261) | (25,357) |
| Net increase (decrease) | (175,655) | $ (3,055,219) |
| SIMPLE Class | Shares | Amount |
| Period ended April 30, 2021: | ||
| Shares issued to shareholders in reinvestment of distributions | 17 | $ 343 |
| Net increase (decrease) | 17 | $ 343 |
| Year ended October 31, 2020:(a) | ||
| Shares sold | 1,293 | $ 25,000 |
| Shares issued to shareholders in reinvestment of distributions | 4 | 72 |
| Net increase (decrease) | 1,297 | $ 25,072 |
| (a) | The inception date of the class was August 31, 2020. |
| 56 | MainStay Income Builder Fund |
| 58 | MainStay Income Builder Fund |
| 60 | MainStay Income Builder Fund |
| 62 | MainStay Income Builder Fund |
1.
| 2. | This Fund is registered for sale in CA, CT, DE, FL, MA, NJ, NY and VT. |
| 3. | An affiliate of New York Life Investment Management LLC. |
| 1738551MS071-21 | MSIB10-06/21 |
please log in to newyorklifeinvestments.com/accounts.
| Not FDIC/NCUA Insured | Not a Deposit | May Lose Value | No Bank Guarantee | Not Insured by Any Government Agency |


President

| Average Annual Total Returns for the Period-Ended April 30, 2021 | ||||||||
| Class | Sales Charge | Inception Date | Six Months | One Year | Five Years | Ten Years | Gross Expense Ratio1 | |
| Class A Shares | Maximum 5.5% Initial Sales Charge | With sales charges | 1/3/1995 | 17.80% | 41.79% | 14.37% | 9.67% | 0.96% |
| Excluding sales charges | 24.66 | 50.04 | 15.67 | 10.29 | 0.96 | |||
| Investor Class Shares2 | Maximum 5% Initial Sales Charge | With sales charges | 2/28/2008 | 18.28 | 41.55 | 14.16 | 9.47 | 1.16 |
| Excluding sales charges | 24.50 | 49.79 | 15.46 | 10.09 | 1.16 | |||
| Class B Shares3 | Maximum 5% CDSC | With sales charges | 5/1/1986 | 19.04 | 43.64 | 14.37 | 9.27 | 1.91 |
| if Redeemed Within the First Six Years of Purchase | Excluding sales charges | 24.04 | 48.64 | 14.60 | 9.27 | 1.91 | ||
| Class C Shares | Maximum 1% CDSC | With sales charges | 9/1/1998 | 23.08 | 47.64 | 14.61 | 9.27 | 1.91 |
| if Redeemed Within One Year of Purchase | Excluding sales charges | 24.08 | 48.64 | 14.61 | 9.27 | 1.91 | ||
| Class I Shares | No Sales Charge | 11/28/2008 | 24.84 | 50.52 | 16.06 | 10.62 | 0.71 | |
| 1. | The gross expense ratios presented reflect the Fund’s “Total Annual Fund Operating Expenses” from the most recent Prospectus, as supplemented, and may differ from other expense ratios disclosed in this report. |
| 2. | Prior to June 30, 2020, the maximum initial sales charge was 5.5%, which is reflected in the average annual total return figures shown. |
| 3. | Class B shares are closed to all new purchases as well as additional investments by existing Class B shareholders. |
| Benchmark Performance | Six Months | One Year | Five Years | Ten Years |
| ICE BofA U.S. Convertible Index1 | 27.33% | 60.79% | 19.06% | 12.43% |
| Morningstar Convertibles Category Average2 | 21.42 | 48.71 | 15.66 | 9.59 |
| 1. | The ICE BofA U.S. Convertible Index is the Fund’s primary broad–based securities market index for comparison purposes. The ICE BofA U.S. Convertible Index is a market-capitalization weighted index of domestic corporate convertible securities. In order to be included in this Index, bonds and preferred stocks must be convertible only to common stock. Results assume reinvestment of all income and capital gains. An investment cannot be made directly in an index. |
| 2. | The Morningstar Convertibles Category Average is representative of funds that are designed to offer some of the capital-appreciation potential of stock portfolios while also supplying some of the safety and yield of bond portfolios. Results are based on average total returns of similar funds with all dividends and capital gain distributions reinvested. |
| 6 | MainStay MacKay Convertible Fund |
| Share Class | Beginning Account Value 11/1/20 | Ending Account Value (Based on Actual Returns and Expenses) 4/30/21 | Expenses Paid During Period1 | Ending Account Value (Based on Hypothetical 5% Annualized Return and Actual Expenses) 4/30/21 | Expenses Paid During Period1 | Net Expense Ratio During Period2 |
| Class A Shares | $1,000.00 | $1,246.60 | $ 5.12 | $1,020.23 | $4.61 | 0.92% |
| Investor Class Shares | $1,000.00 | $1,245.00 | $ 6.29 | $1,019.19 | $5.66 | 1.13% |
| Class B Shares | $1,000.00 | $1,240.40 | $10.44 | $1,015.47 | $9.39 | 1.88% |
| Class C Shares | $1,000.00 | $1,240.80 | $10.45 | $1,015.47 | $9.39 | 1.88% |
| Class I Shares | $1,000.00 | $1,248.40 | $ 3.40 | $1,021.77 | $3.06 | 0.61% |
| 1. | Expenses are equal to the Fund’s annualized expense ratio of each class multiplied by the average account value over the period, divided by 365 and multiplied by 181 (to reflect the six-month period). The table above represents the actual expenses incurred during the six-month period. In addition to the fees and expenses which the Fund bears directly, it also indirectly bears a pro rata share of the fees and expenses of the underlying funds in which it invests. Such indirect expenses are not included in the above-reported expense figures. |
| 2. | Expenses are equal to the Fund's annualized expense ratio to reflect the six-month period. |
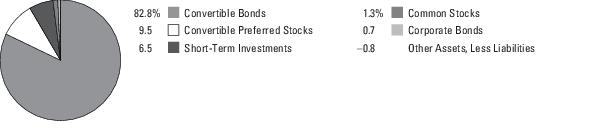
| 1. | Anthem, Inc., 2.75%, due 10/15/42 |
| 2. | Danaher Corp. |
| 3. | NICE Ltd., (zero coupon), due 9/15/25 |
| 4. | Southwest Airlines Co., 1.25%, due 5/1/25 |
| 5. | Microchip Technology, Inc., 1.625%, due 2/15/25–2/15/27 |
| 6. | Pioneer Natural Resources Co., 0.25%, due 5/15/25 |
| 7. | Lumentum Holdings, Inc., 0.25%, due 3/15/24 |
| 8. | Chart Industries, Inc., 1.00%, due 11/15/24 |
| 9. | Bank of America Corp. |
| 10. | Teladoc Health, Inc., 1.25%, due 6/1/27 |
| 8 | MainStay MacKay Convertible Fund |
| 1. | See page 5 for other share class returns, which may be higher or lower than Class I share returns. See page 6 for more information on benchmark and peer group returns. |
| 10 | MainStay MacKay Convertible Fund |
| Principal Amount | Value | |
| Long-Term Bonds 0.7% | ||
| Corporate Bonds 0.7% | ||
| Biotechnology 0.6% | ||
| Bridgebio Pharma, Inc. | ||
| 2.50%, due 3/15/27 | $ 6,975,000 | $ 10,733,130 |
| Oil & Gas Services 0.1% | ||
| Weatherford International Ltd. | ||
| 11.00%, due 12/1/24 (a)(b) | 1,970,000 | 1,945,375 |
| Total Corporate Bonds (Cost $32,375,044) | 12,678,505 | |
| Total Long-Term Bonds (Cost $32,375,044) | 12,678,505 | |
| Convertible Securities 92.3% | ||
| Convertible Bonds 82.8% | ||
| Airlines 3.5% | ||
| American Airlines Group, Inc. | ||
| 6.50%, due 7/1/25 | 7,040,000 | 11,228,800 |
| JetBlue Airways Corp. | ||
| 0.50%, due 4/1/26 (a) | 4,632,000 | 5,083,620 |
| Southwest Airlines Co. | ||
| 1.25%, due 5/1/25 | 27,566,000 | 47,999,297 |
| Spirit Airlines, Inc. | ||
| 1.00%, due 5/15/26 | 3,315,000 | 3,418,268 |
| 67,729,985 | ||
| Auto Manufacturers 0.8% | ||
| Ford Motor Co. | ||
| (zero coupon), due 3/15/26 (a) | 16,225,000 | 16,103,312 |
| Biotechnology 5.5% | ||
| Apellis Pharmaceuticals, Inc. | ||
| 3.50%, due 9/15/26 | 7,350,000 | 11,512,305 |
| BioMarin Pharmaceutical, Inc. | ||
| 0.599%, due 8/1/24 | 28,812,000 | 29,388,240 |
| Exact Sciences Corp. | ||
| 0.375%, due 3/1/28 | 22,800,000 | 29,155,500 |
| Guardant Health, Inc. | ||
| (zero coupon), due 11/15/27 (a) | 7,026,000 | 9,243,581 |
| Halozyme Therapeutics, Inc. | ||
| 0.25%, due 3/1/27 (a) | 3,556,000 | 3,440,430 |
| Illumina, Inc. | ||
| (zero coupon), due 8/15/23 (b) | 12,566,000 | 15,126,323 |
| Ionis Pharmaceuticals, Inc. | ||
| (zero coupon), due 4/1/26 (a) | 9,349,000 | 9,490,121 |
| 107,356,500 | ||
| Principal Amount | Value | |
| Building Materials 1.1% | ||
| Patrick Industries, Inc. | ||
| 1.00%, due 2/1/23 | $ 17,232,000 | $ 21,033,810 |
| Commercial Services 3.3% | ||
| Alarm.com Holdings, Inc. | ||
| (zero coupon), due 1/15/26 (a) | 3,775,000 | 3,539,063 |
| Chegg, Inc. | ||
| (zero coupon), due 9/1/26 (a) | 8,817,000 | 9,729,560 |
| Euronet Worldwide, Inc. | ||
| 0.75%, due 3/15/49 (b) | 11,900,000 | 13,618,063 |
| Repay Holdings Corp. | ||
| (zero coupon), due 2/1/26 (a) | 2,525,000 | 2,453,984 |
| Sabre GLBL, Inc. | ||
| 4.00%, due 4/15/25 | 1,835,000 | 3,873,685 |
| Shift4 Payments, Inc. | ||
| (zero coupon), due 12/15/25 (a) | 3,720,000 | 5,240,736 |
| Square, Inc. | ||
| 0.125%, due 3/1/25 | 7,055,000 | 14,656,762 |
| 0.25%, due 11/1/27 (a) | 855,000 | 1,008,900 |
| 0.50%, due 5/15/23 | 3,016,000 | 9,511,239 |
| 63,631,992 | ||
| Computers 2.7% | ||
| Lumentum Holdings, Inc. | ||
| 0.25%, due 3/15/24 | 25,786,000 | 38,593,666 |
| Parsons Corp. | ||
| 0.25%, due 8/15/25 (a) | 4,641,000 | 5,325,547 |
| Zscaler, Inc. | ||
| 0.125%, due 7/1/25 (a) | 5,870,000 | 8,306,050 |
| 52,225,263 | ||
| Diversified Financial Services 0.2% | ||
| LendingTree, Inc. | ||
| 0.625%, due 6/1/22 | 4,144,000 | 4,866,610 |
| Electric 1.0% | ||
| NRG Energy, Inc. | ||
| 2.75%, due 6/1/48 | 16,385,000 | 18,576,494 |
| Energy-Alternate Sources 1.9% | ||
| Enphase Energy, Inc. | ||
| (zero coupon), due 3/1/26 (a) | 9,485,000 | 8,636,093 |
| NextEra Energy Partners LP | ||
| (zero coupon), due 11/15/25 (a) | 9,417,000 | 10,071,481 |
| SolarEdge Technologies, Inc. | ||
| (zero coupon), due 9/15/25 (a) | 14,777,000 | 17,931,889 |
| 36,639,463 | ||
| Principal Amount | Value | |
| Convertible Bonds (continued) | ||
| Entertainment 1.9% | ||
| Live Nation Entertainment, Inc. | ||
| 2.50%, due 3/15/23 | $ 6,833,000 | $ 9,220,450 |
| Marriott Vacations Worldwide Corp. | ||
| (zero coupon), due 1/15/26 (a) | 3,110,000 | 3,693,125 |
| Vail Resorts, Inc. | ||
| (zero coupon), due 1/1/26 (a) | 22,830,000 | 24,328,219 |
| 37,241,794 | ||
| Food 0.5% | ||
| Chefs' Warehouse, Inc. (The) | ||
| 1.875%, due 12/1/24 | 8,676,000 | 8,920,013 |
| Healthcare-Products 3.3% | ||
| Cantel Medical Corp. | ||
| 3.25%, due 5/15/25 (a) | 4,372,000 | 9,550,087 |
| CONMED Corp. | ||
| 2.625%, due 2/1/24 | 14,746,000 | 24,414,582 |
| Haemonetics Corp. | ||
| (zero coupon), due 3/1/26 (a) | 4,672,000 | 3,883,970 |
| Integra LifeSciences Holdings Corp. | ||
| 0.50%, due 8/15/25 | 6,602,000 | 7,633,893 |
| NuVasive, Inc. | ||
| 0.375%, due 3/15/25 | 8,085,000 | 8,433,666 |
| Omnicell, Inc. | ||
| 0.25%, due 9/15/25 (a) | 2,760,000 | 4,311,120 |
| SmileDirectClub, Inc. | ||
| (zero coupon), due 2/1/26 (a) | 5,700,000 | 5,012,437 |
| 63,239,755 | ||
| Healthcare-Services 4.9% | ||
| Anthem, Inc. | ||
| 2.75%, due 10/15/42 | 11,746,000 | 62,305,483 |
| Teladoc Health, Inc. | ||
| 1.25%, due 6/1/27 (a) | 29,441,000 | 33,065,923 |
| 95,371,406 | ||
| Internet 9.8% | ||
| Booking Holdings, Inc. | ||
| 0.90%, due 9/15/21 | 19,156,000 | 23,370,320 |
| Etsy, Inc. | ||
| 0.125%, due 10/1/26 | 11,184,000 | 26,184,540 |
| Expedia Group, Inc. | ||
| (zero coupon), due 2/15/26 (a) | 2,822,000 | 3,073,158 |
| Match Group Financeco 2, Inc. | ||
| 0.875%, due 6/15/26 (a) | 12,450,000 | 22,993,716 |
| Match Group Financeco, Inc. | ||
| 0.875%, due 10/1/22 (a) | 2,000 | 7,086 |
| Principal Amount | Value | |
| Internet (continued) | ||
| Okta, Inc. | ||
| 0.125%, due 9/1/25 | $ 5,611,000 | $ 8,665,488 |
| Palo Alto Networks, Inc. | ||
| 0.375%, due 6/1/25 (a) | 9,385,000 | 12,261,503 |
| 0.75%, due 7/1/23 | 13,659,000 | 19,259,190 |
| Q2 Holdings, Inc. | ||
| 0.75%, due 6/1/26 | 4,395,000 | 5,826,122 |
| Shopify, Inc. | ||
| 0.125%, due 11/1/25 (b) | 16,390,000 | 19,288,981 |
| Snap, Inc. | ||
| (zero coupon), due 5/1/27 (a) | 4,640,000 | 4,770,500 |
| Twitter, Inc. | ||
| (zero coupon), due 3/15/26 (a) | 7,010,000 | 6,409,175 |
| Uber Technologies, Inc. | ||
| (zero coupon), due 12/15/25 (a) | 4,665,000 | 4,917,037 |
| Wix.com Ltd. | ||
| (zero coupon), due 7/1/23 | 9,213,000 | 20,786,831 |
| Zendesk, Inc. | ||
| 0.625%, due 6/15/25 (a) | 8,790,000 | 12,943,275 |
| 190,756,922 | ||
| Leisure Time 2.1% | ||
| Carnival Corp. | ||
| 5.75%, due 4/1/23 | 6,302,000 | 18,600,529 |
| NCL Corp. Ltd. (a) | ||
| 5.375%, due 8/1/25 | 4,670,000 | 8,863,660 |
| 6.00%, due 5/15/24 | 2,849,000 | 6,971,147 |
| Royal Caribbean Cruises Ltd. | ||
| 4.25%, due 6/15/23 (a) | 5,055,000 | 7,119,968 |
| 41,555,304 | ||
| Machinery-Diversified 1.9% | ||
| Chart Industries, Inc. | ||
| 1.00%, due 11/15/24 (a) | 13,592,000 | 37,760,275 |
| Media 3.5% | ||
| Cable One, Inc. | ||
| 1.125%, due 3/15/28 (a) | 11,860,000 | 11,782,585 |
| DISH Network Corp. | ||
| (zero coupon), due 12/15/25 (a) | 23,010,000 | 28,233,270 |
| Liberty Media Corp. | ||
| 1.375%, due 10/15/23 | 11,345,000 | 14,818,699 |
| Liberty Media Corp-Liberty Formula One | ||
| 1.00%, due 1/30/23 | 9,441,000 | 12,663,921 |
| 67,498,475 | ||
| 12 | MainStay MacKay Convertible Fund |
| Principal Amount | Value | |
| Convertible Bonds (continued) | ||
| Oil & Gas 4.2% | ||
| Centennial Resource Production LLC | ||
| 3.25%, due 4/1/28 | $ 5,813,000 | $ 5,733,362 |
| Ensco Jersey Finance Ltd. | ||
| 3.00%, due 1/31/24 (c)(d) | 20,143,000 | 4,078,957 |
| EQT Corp. | ||
| 1.75%, due 5/1/26 (a) | 21,040,000 | 31,284,376 |
| Pioneer Natural Resources Co. | ||
| 0.25%, due 5/15/25 (a) | 26,272,000 | 39,985,984 |
| 81,082,679 | ||
| Oil & Gas Services 1.8% | ||
| Helix Energy Solutions Group, Inc. | ||
| 6.75%, due 2/15/26 | 14,649,000 | 15,813,595 |
| Oil States International, Inc. | ||
| 1.50%, due 2/15/23 | 1,104,000 | 1,020,382 |
| 4.75%, due 4/1/26 (a)(b) | 19,935,000 | 18,230,814 |
| 35,064,791 | ||
| Pharmaceuticals 2.4% | ||
| DexCom, Inc. | ||
| 0.25%, due 11/15/25 (a) | 23,353,000 | 23,469,765 |
| Neurocrine Biosciences, Inc. | ||
| 2.25%, due 5/15/24 | 10,073,000 | 13,334,134 |
| Pacira BioSciences, Inc. | ||
| 0.75%, due 8/1/25 (a) | 7,100,000 | 7,907,625 |
| 2.375%, due 4/1/22 | 1,655,000 | 1,867,047 |
| 46,578,571 | ||
| Real Estate Investment Trusts 0.4% | ||
| Summit Hotel Properties, Inc. | ||
| 1.50%, due 2/15/26 | 7,815,000 | 8,502,720 |
| Retail 2.2% | ||
| American Eagle Outfitters, Inc. | ||
| 3.75%, due 4/15/25 (a) | 5,529,000 | 22,281,870 |
| Burlington Stores, Inc. | ||
| 2.25%, due 4/15/25 (a) | 13,238,000 | 21,189,074 |
| 43,470,944 | ||
| Semiconductors 8.2% | ||
| Cree, Inc. | ||
| 1.75%, due 5/1/26 (a) | 2,320,000 | 5,087,992 |
| Inphi Corp. | ||
| 0.75%, due 4/15/25 | 19,787,000 | 29,000,322 |
| Microchip Technology, Inc. | ||
| 1.625%, due 2/15/25 | 8,778,000 | 29,142,960 |
| 1.625%, due 2/15/27 | 7,129,000 | 15,833,614 |
| Principal Amount | Value | |
| Semiconductors (continued) | ||
| Micron Technology, Inc. | ||
| Series D | ||
| 3.125%, due 5/1/32 | $ 3,183,000 | $ 27,425,683 |
| Novellus Systems, Inc. | ||
| 2.625%, due 5/15/41 | 1,076,000 | 21,241,174 |
| ON Semiconductor Corp. | ||
| 1.625%, due 10/15/23 | 2,305,000 | 4,501,953 |
| Rambus, Inc. | ||
| 1.375%, due 2/1/23 | 9,996,000 | 11,689,322 |
| Silicon Laboratories, Inc. | ||
| 0.625%, due 6/15/25 (a) | 11,680,000 | 15,315,984 |
| 159,239,004 | ||
| Software 10.0% | ||
| Akamai Technologies, Inc. | ||
| 0.375%, due 9/1/27 | 11,420,000 | 12,826,088 |
| Atlassian, Inc. | ||
| 0.625%, due 5/1/23 | 7,719,000 | 22,447,817 |
| Bentley Systems, Inc. | ||
| 0.125%, due 1/15/26 (a) | 3,570,000 | 3,797,589 |
| Bill.com Holdings, Inc. | ||
| (zero coupon), due 12/1/25 (a) | 4,680,000 | 5,692,050 |
| Coupa Software, Inc. | ||
| 0.375%, due 6/15/26 (a) | 6,055,000 | 7,008,663 |
| Datadog, Inc. | ||
| 0.125%, due 6/15/25 (a) | 7,470,000 | 8,945,325 |
| Envestnet, Inc. | ||
| 1.75%, due 6/1/23 | 12,037,000 | 14,715,232 |
| Everbridge, Inc. | ||
| 0.125%, due 12/15/24 | 5,415,000 | 7,310,250 |
| Five9, Inc. | ||
| 0.50%, due 6/1/25 (a) | 4,675,000 | 7,122,037 |
| J2 Global, Inc. | ||
| 1.75%, due 11/1/26 (a) | 5,220,000 | 6,133,500 |
| MongoDB, Inc. | ||
| 0.25%, due 1/15/26 | 7,075,000 | 10,992,781 |
| RingCentral, Inc. | ||
| (zero coupon), due 3/1/25 | 21,079,000 | 23,972,894 |
| Slack Technologies, Inc. | ||
| 0.50%, due 4/15/25 | 6,747,000 | 9,837,969 |
| Splunk, Inc. | ||
| 0.50%, due 9/15/23 | 12,142,000 | 13,500,386 |
| Twilio, Inc. | ||
| 0.25%, due 6/1/23 | 3,269,000 | 16,974,282 |
| Workday, Inc. | ||
| 0.25%, due 10/1/22 | 7,982,000 | 13,624,476 |
| Principal Amount | Value | |
| Convertible Bonds (continued) | ||
| Software (continued) | ||
| Zynga, Inc. | ||
| (zero coupon), due 12/15/26 (a) | $ 8,635,000 | $ 9,379,769 |
| 194,281,108 | ||
| Telecommunications 4.7% | ||
| Infinera Corp. | ||
| 2.50%, due 3/1/27 (b) | 7,050,000 | 9,954,311 |
| InterDigital, Inc. | ||
| 2.00%, due 6/1/24 | 4,500,000 | 4,913,187 |
| NICE Ltd. | ||
| (zero coupon), due 9/15/25 (a)(b) | 46,000,000 | 48,833,176 |
| Viavi Solutions, Inc. | ||
| 1.00%, due 3/1/24 | 14,679,000 | 19,770,778 |
| Vonage Holdings Corp. | ||
| 1.75%, due 6/1/24 | 8,091,000 | 8,858,773 |
| 92,330,225 | ||
| Transportation 0.8% | ||
| Atlas Air Worldwide Holdings, Inc. | ||
| 2.25%, due 6/1/22 | 13,687,000 | 15,073,493 |
| Trucking & Leasing 0.2% | ||
| Greenbrier Cos., Inc. (The) | ||
| 2.875%, due 4/15/28 (a) | 3,245,000 | 3,537,050 |
| Total Convertible Bonds (Cost $1,220,068,730) | 1,609,667,958 | |
| Shares | ||
| Convertible Preferred Stocks 9.5% | ||
| Banks 1.7% | ||
| Bank of America Corp. | ||
| Series L | ||
| 7.25% (e) | 12,072 | 17,093,710 |
| Wells Fargo & Co. | ||
| Series L | ||
| 7.50% (b)(e) | 11,552 | 16,563,489 |
| 33,657,199 | ||
| Capital Markets 0.7% | ||
| KKR & Co., Inc. | ||
| Series C | ||
| 6.00% (b) | 165,650 | 12,420,437 |
| Shares | Value | |
| Chemicals 0.3% | ||
| Lyondellbasell Advanced Polymers, Inc. | ||
| 6.00% (e) | 5,832 | $ 6,281,064 |
| Electric Utilities 0.9% | ||
| PG&E Corp. | ||
| 5.50% | 160,900 | 17,761,751 |
| Health Care Equipment & Supplies 3.3% | ||
| Becton Dickinson and Co. | ||
| Series B | ||
| 6.00% (b) | 86,450 | 4,774,633 |
| Danaher Corp. | ||
| Series A | ||
| 4.75% | 34,880 | 59,767,229 |
| 64,541,862 | ||
| Independent Power and Renewable Electricity Producers 0.7% | ||
| AES Corp. (The) | ||
| 6.875% | 118,500 | 12,915,315 |
| Machinery 1.2% | ||
| Stanley Black & Decker, Inc. | ||
| 5.25% (b) | 182,200 | 22,230,222 |
| Semiconductors & Semiconductor Equipment 0.7% | ||
| Broadcom, Inc. | ||
| Series A | ||
| 8.00% | 9,655 | 13,994,440 |
| Total Convertible Preferred Stocks (Cost $162,260,784) | 183,802,290 | |
| Total Convertible Securities (Cost $1,382,329,514) | 1,793,470,248 | |
| Common Stocks 1.3% | ||
| Banks 0.8% | ||
| Bank of America Corp. | 398,621 | 16,156,109 |
| Energy Equipment & Services 0.2% | ||
| Weatherford International plc (f) | 272,914 | 2,892,889 |
| Health Care Equipment & Supplies 0.3% | ||
| Teleflex, Inc. | 14,082 | 5,949,363 |
| Total Common Stocks (Cost $14,687,748) | 24,998,361 | |
| 14 | MainStay MacKay Convertible Fund |
| Shares | Value | ||
| Short-Term Investments 6.5% | |||
| Affiliated Investment Company 4.0% | |||
| MainStay U.S. Government Liquidity Fund, 0.01% (g) | 77,758,609 | $ 77,758,609 | |
| Unaffiliated Investment Company 2.5% | |||
| BlackRock Liquidity FedFund, 0.05% (g)(h) | 48,552,039 | 48,552,039 | |
| Total Short-Term Investments (Cost $126,310,648) | 126,310,648 | ||
| Total Investments (Cost $1,555,702,954) | 100.8% | 1,957,457,762 | |
| Other Assets, Less Liabilities | (0.8) | (14,575,021) | |
| Net Assets | 100.0% | $ 1,942,882,741 | |
| † | Percentages indicated are based on Fund net assets. |
| (a) | May be sold to institutional investors only under Rule 144A or securities offered pursuant to Section 4(a)(2) of the Securities Act of 1933, as amended. |
| (b) | All or a portion of this security was held on loan. As of April 30, 2021, the aggregate market value of securities on loan was $47,247,064. The Fund received cash collateral with a value of $48,552,039. (See Note 2(G)) |
| (c) | Issue in default. |
| (d) | Issue in non-accrual status. |
| (e) | Security is perpetual and, thus, does not have a predetermined maturity date. The date shown, if applicable, reflects the next call date. |
| (f) | Non-income producing security. |
| (g) | Current yield as of April 30, 2021. |
| (h) | Represents a security purchased with cash collateral received for securities on loan. |
| Description | Quoted Prices in Active Markets for Identical Assets (Level 1) | Significant Other Observable Inputs (Level 2) | Significant Unobservable Inputs (Level 3) | Total | |||
| Asset Valuation Inputs | |||||||
| Investments in Securities (a) | |||||||
| Long-Term Bonds | |||||||
| Corporate Bonds | $ — | $ 12,678,505 | $ — | $ 12,678,505 | |||
| Total Corporate Bonds | — | 12,678,505 | — | 12,678,505 | |||
| Convertible Securities | |||||||
| Convertible Bonds | — | 1,609,667,958 | — | 1,609,667,958 | |||
| Convertible Preferred Stocks | 183,802,290 | — | — | 183,802,290 | |||
| Total Convertible Securities | 183,802,290 | 1,609,667,958 | — | 1,793,470,248 | |||
| Common Stocks | 24,998,361 | — | — | 24,998,361 | |||
| Short-Term Investments | |||||||
| Affiliated Investment Company | 77,758,609 | — | — | 77,758,609 | |||
| Unaffiliated Investment Company | 48,552,039 | — | — | 48,552,039 | |||
| Total Short-Term Investments | 126,310,648 | — | — | 126,310,648 | |||
| Total Investments in Securities | $ 335,111,299 | $ 1,622,346,463 | $ — | $ 1,957,457,762 |
| (a) | For a complete listing of investments and their industries, see the Portfolio of Investments. |
| Assets | |
| Investment in unaffiliated securities, at value (identified cost $1,477,944,345) including securities on loan of $47,247,064 | $1,879,699,153 |
| Investment in affiliated investment companies, at value (identified cost $77,758,609) | 77,758,609 |
| Cash | 1,497,000 |
| Due from custodian | 4,640,000 |
| Receivables: | |
| Investment securities sold | 27,895,935 |
| Dividends and interest | 3,321,265 |
| Fund shares sold | 3,304,741 |
| Securities lending | 27,391 |
| Other assets | 83,928 |
| Total assets | 1,998,228,022 |
| Liabilities | |
| Cash collateral received for securities on loan | 48,552,039 |
| Payables: | |
| Investment securities purchased | 4,640,000 |
| Manager (See Note 3) | 826,297 |
| Fund shares redeemed | 562,149 |
| Transfer agent (See Note 3) | 383,941 |
| NYLIFE Distributors (See Note 3) | 241,544 |
| Professional fees | 65,555 |
| Shareholder communication | 56,610 |
| Custodian | 11,697 |
| Accrued expenses | 5,449 |
| Total liabilities | 55,345,281 |
| Net assets | $1,942,882,741 |
| Composition of Net Assets | |
| Shares of beneficial interest outstanding (par value of $.01 per share) unlimited number of shares authorized | $ 796,761 |
| Additional paid-in-capital | 1,274,054,610 |
| 1,274,851,371 | |
| Total distributable earnings (loss) | 668,031,370 |
| Net assets | $1,942,882,741 |
| Class A | |
| Net assets applicable to outstanding shares | $852,889,824 |
| Shares of beneficial interest outstanding | 34,997,908 |
| Net asset value per share outstanding | $ 24.37 |
| Maximum sales charge (5.50% of offering price) | 1.42 |
| Maximum offering price per share outstanding | $ 25.79 |
| Investor Class | |
| Net assets applicable to outstanding shares | $ 56,643,373 |
| Shares of beneficial interest outstanding | 2,325,317 |
| Net asset value per share outstanding | $ 24.36 |
| Maximum sales charge (5.00% of offering price) | 1.28 |
| Maximum offering price per share outstanding | $ 25.64 |
| Class B | |
| Net assets applicable to outstanding shares | $ 11,348,760 |
| Shares of beneficial interest outstanding | 472,351 |
| Net asset value and offering price per share outstanding | $ 24.03 |
| Class C | |
| Net assets applicable to outstanding shares | $ 57,544,608 |
| Shares of beneficial interest outstanding | 2,398,192 |
| Net asset value and offering price per share outstanding | $ 23.99 |
| Class I | |
| Net assets applicable to outstanding shares | $964,456,176 |
| Shares of beneficial interest outstanding | 39,482,309 |
| Net asset value and offering price per share outstanding | $ 24.43 |
| 16 | MainStay MacKay Convertible Fund |
| Investment Income (Loss) | |
| Income | |
| Interest | $ 6,715,582 |
| Dividends-unaffiliated | 3,432,673 |
| Securities lending | 85,667 |
| Dividends-affiliated | 2,701 |
| Total income | 10,236,623 |
| Expenses | |
| Manager (See Note 3) | 5,158,139 |
| Distribution/Service—Class A (See Note 3) | 986,415 |
| Distribution/Service—Investor Class (See Note 3) | 73,512 |
| Distribution/Service—Class B (See Note 3) | 57,549 |
| Distribution/Service—Class C (See Note 3) | 296,705 |
| Transfer agent (See Note 3) | 989,061 |
| Professional fees | 80,965 |
| Registration | 61,398 |
| Shareholder communication | 59,831 |
| Trustees | 17,533 |
| Custodian | 16,605 |
| Insurance | 5,814 |
| Miscellaneous | 25,660 |
| Total expenses before waiver/reimbursement | 7,829,187 |
| Expense waiver/reimbursement from Manager (See Note 3) | (289,562) |
| Net expenses | 7,539,625 |
| Net investment income (loss) | 2,696,998 |
| Realized and Unrealized Gain (Loss) | |
| Net realized gain (loss) on investments | 281,071,042 |
| Net change in unrealized appreciation (depreciation) on investments | 114,420,250 |
| Net realized and unrealized gain (loss) | 395,491,292 |
| Net increase (decrease) in net assets resulting from operations | $398,188,290 |
for the six months ended April 30, 2021 (Unaudited) and the year ended October 31, 2020
| 2021 | 2020 | |
| Increase (Decrease) in Net Assets | ||
| Operations: | ||
| Net investment income (loss) | $ 2,696,998 | $ 7,023,112 |
| Net realized gain (loss) | 281,071,042 | 136,092,037 |
| Net change in unrealized appreciation (depreciation) | 114,420,250 | 126,219,090 |
| Net increase (decrease) in net assets resulting from operations | 398,188,290 | 269,334,239 |
| Distributions to shareholders: | ||
| Class A | (48,475,411) | (13,476,076) |
| Investor Class | (4,180,115) | (1,333,183) |
| Class B | (728,517) | (222,915) |
| Class C | (3,711,276) | (1,152,529) |
| Class I | (63,098,839) | (21,838,382) |
| Total distributions to shareholders | (120,194,158) | (38,023,085) |
| Capital share transactions: | ||
| Net proceeds from sales of shares | 202,616,135 | 441,125,603 |
| Net asset value of shares issued to shareholder in reinvestment of distributions | 107,060,392 | 34,121,687 |
| Cost of shares redeemed | (276,435,178) | (526,300,928) |
| Increase (decrease) in net assets derived from capital share transactions | 33,241,349 | (51,053,638) |
| Net increase (decrease) in net assets | 311,235,481 | 180,257,516 |
| Net Assets | ||
| Beginning of period | 1,631,647,260 | 1,451,389,744 |
| End of period | $1,942,882,741 | $1,631,647,260 |
| 18 | MainStay MacKay Convertible Fund |
| Six months ended April 30, 2021* | Year Ended October 31, | ||||||||||
| Class A | 2020 | 2019 | 2018 | 2017 | 2016 | ||||||
| Net asset value at beginning of period | $ 20.90 | $ 17.81 | $ 17.07 | $ 17.75 | $ 15.72 | $ 16.51 | |||||
| Net investment income (loss) (a) | 0.02 | 0.06 | 0.12 | 0.15 | 0.19 | 0.20 | |||||
| Net realized and unrealized gain (loss) on investments | 4.98 | 3.47 | 1.60 | 0.40 | 2.34 | 0.35 | |||||
| Total from investment operations | 5.00 | 3.53 | 1.72 | 0.55 | 2.53 | 0.55 | |||||
| Less distributions: | |||||||||||
| From net investment income | (0.10) | (0.13) | (0.15) | (0.22) | (0.24) | (0.64) | |||||
| From net realized gain on investments | (1.43) | (0.31) | (0.83) | (1.01) | (0.26) | (0.70) | |||||
| Total distributions | (1.53) | (0.44) | (0.98) | (1.23) | (0.50) | (1.34) | |||||
| Net asset value at end of period | $ 24.37 | $ 20.90 | $ 17.81 | $ 17.07 | $ 17.75 | $ 15.72 | |||||
| Total investment return (b) | 24.66% | 20.27% | 10.75% | 3.28% | 16.30% | 3.71% | |||||
| Ratios (to average net assets)/Supplemental Data: | |||||||||||
| Net investment income (loss) | 0.18%†† | 0.33% | 0.67% | 0.87% | 1.12% | 1.31% | |||||
| Net expenses (c) | 0.92%†† | 0.96% | 0.98% | 0.98% | 0.98% | 1.01% | |||||
| Expenses (before waiver/reimbursement) (c) | 0.92%†† | 0.96% | 0.98% | 0.98% | 0.99% | 1.01% | |||||
| Portfolio turnover rate | 24% | 46% | 23% | 43% | 38% | 24% | |||||
| Net assets at end of period (in 000’s) | $ 852,890 | $ 657,626 | $ 545,605 | $ 518,381 | $ 482,341 | $ 368,583 | |||||
| * | Unaudited. |
| †† | Annualized. |
| (a) | Per share data based on average shares outstanding during the period. |
| (b) | Total investment return is calculated exclusive of sales charges and assumes the reinvestment of dividends and distributions. For periods of less than one year, total return is not annualized. |
| (c) | In addition to the fees and expenses which the Fund bears directly, it also indirectly bears a pro-rata share of the fees and expenses of the underlying funds in which it invests. Such indirect expenses are not included in the above expense ratios. |
| Six months ended April 30, 2021* | Year Ended October 31, | ||||||||||
| Investor Class | 2020 | 2019 | 2018 | 2017 | 2016 | ||||||
| Net asset value at beginning of period | $ 20.90 | $ 17.80 | $ 17.07 | $ 17.75 | $ 15.72 | $ 16.50 | |||||
| Net investment income (loss) (a) | (0.00)‡ | 0.03 | 0.09 | 0.13 | 0.16 | 0.18 | |||||
| Net realized and unrealized gain (loss) on investments | 4.97 | 3.47 | 1.59 | 0.39 | 2.34 | 0.36 | |||||
| Total from investment operations | 4.97 | 3.50 | 1.68 | 0.52 | 2.50 | 0.54 | |||||
| Less distributions: | |||||||||||
| From net investment income | (0.08) | (0.09) | (0.12) | (0.19) | (0.21) | (0.62) | |||||
| From net realized gain on investments | (1.43) | (0.31) | (0.83) | (1.01) | (0.26) | (0.70) | |||||
| Total distributions | (1.51) | (0.40) | (0.95) | (1.20) | (0.47) | (1.32) | |||||
| Net asset value at end of period | $ 24.36 | $ 20.90 | $ 17.80 | $ 17.07 | $ 17.75 | $ 15.72 | |||||
| Total investment return (b) | 24.50% | 20.08% | 10.50% | 3.12% | 16.11% | 3.60% | |||||
| Ratios (to average net assets)/Supplemental Data: | |||||||||||
| Net investment income (loss) | (0.03)%†† | 0.13% | 0.51% | 0.72% | 0.95% | 1.14% | |||||
| Net expenses (c) | 1.13%†† | 1.16% | 1.15% | 1.13% | 1.14% | 1.18% | |||||
| Expenses (before waiver/reimbursement) (c) | 1.13%†† | 1.16% | 1.17% | 1.14% | 1.15% | 1.18% | |||||
| Portfolio turnover rate | 24% | 46% | 23% | 43% | 38% | 24% | |||||
| Net assets at end of period (in 000’s) | $ 56,643 | $ 57,829 | $ 59,242 | $ 52,723 | $ 56,289 | $ 79,430 | |||||
| * | Unaudited. |
| ‡ | Less than one cent per share. |
| †† | Annualized. |
| (a) | Per share data based on average shares outstanding during the period. |
| (b) | Total investment return is calculated exclusive of sales charges and assumes the reinvestment of dividends and distributions. For periods of less than one year, total return is not annualized. |
| (c) | In addition to the fees and expenses which the Fund bears directly, it also indirectly bears a pro-rata share of the fees and expenses of the underlying funds in which it invests. Such indirect expenses are not included in the above expense ratios. |
| Six months ended April 30, 2021* | Year Ended October 31, | ||||||||||
| Class B | 2020 | 2019 | 2018 | 2017 | 2016 | ||||||
| Net asset value at beginning of period | $ 20.67 | $ 17.68 | $ 16.98 | $ 17.67 | $ 15.66 | $ 16.45 | |||||
| Net investment income (loss) (a) | (0.09) | (0.11) | (0.04) | (0.01) | 0.04 | 0.06 | |||||
| Net realized and unrealized gain (loss) on investments | 4.92 | 3.44 | 1.60 | 0.39 | 2.32 | 0.35 | |||||
| Total from investment operations | 4.83 | 3.33 | 1.56 | 0.38 | 2.36 | 0.41 | |||||
| Less distributions: | |||||||||||
| From net investment income | (0.04) | (0.03) | (0.03) | (0.06) | (0.09) | (0.50) | |||||
| From net realized gain on investments | (1.43) | (0.31) | (0.83) | (1.01) | (0.26) | (0.70) | |||||
| Total distributions | (1.47) | (0.34) | (0.86) | (1.07) | (0.35) | (1.20) | |||||
| Net asset value at end of period | $ 24.03 | $ 20.67 | $ 17.68 | $ 16.98 | $ 17.67 | $ 15.66 | |||||
| Total investment return (b) | 24.04% | 19.15% | 9.76% | 2.35% | 15.21% | 2.83% | |||||
| Ratios (to average net assets)/Supplemental Data: | |||||||||||
| Net investment income (loss) | (0.78)%†† | (0.61)% | (0.23)% | (0.03)% | 0.21% | 0.39% | |||||
| Net expenses (c) | 1.88%†† | 1.91% | 1.90% | 1.88% | 1.89% | 1.93% | |||||
| Expenses (before waiver/reimbursement) (c) | 1.88%†† | 1.91% | 1.92% | 1.89% | 1.90% | 1.93% | |||||
| Portfolio turnover rate | 24% | 46% | 23% | 43% | 38% | 24% | |||||
| Net assets at end of period (in 000’s) | $ 11,349 | $ 10,454 | $ 11,786 | $ 15,051 | $ 19,290 | $ 21,436 | |||||
| * | Unaudited. |
| †† | Annualized. |
| (a) | Per share data based on average shares outstanding during the period. |
| (b) | Total investment return is calculated exclusive of sales charges and assumes the reinvestment of dividends and distributions. For periods of less than one year, total return is not annualized. |
| (c) | In addition to the fees and expenses which the Fund bears directly, it also indirectly bears a pro-rata share of the fees and expenses of the underlying funds in which it invests. Such indirect expenses are not included in the above expense ratios. |
| Six months ended April 30, 2021* | Year Ended October 31, | ||||||||||
| Class C | 2020 | 2019 | 2018 | 2017 | 2016 | ||||||
| Net asset value at beginning of period | $ 20.64 | $ 17.65 | $ 16.96 | $ 17.65 | $ 15.64 | $ 16.43 | |||||
| Net investment income (loss) (a) | (0.09) | (0.11) | (0.04) | (0.00)‡ | 0.04 | 0.06 | |||||
| Net realized and unrealized gain (loss) on investments | 4.91 | 3.44 | 1.59 | 0.38 | 2.32 | 0.35 | |||||
| Total from investment operations | 4.82 | 3.33 | 1.55 | 0.38 | 2.36 | 0.41 | |||||
| Less distributions: | |||||||||||
| From net investment income | (0.04) | (0.03) | (0.03) | (0.06) | (0.09) | (0.50) | |||||
| From net realized gain on investments | (1.43) | (0.31) | (0.83) | (1.01) | (0.26) | (0.70) | |||||
| Total distributions | (1.47) | (0.34) | (0.86) | (1.07) | (0.35) | (1.20) | |||||
| Net asset value at end of period | $ 23.99 | $ 20.64 | $ 17.65 | $ 16.96 | $ 17.65 | $ 15.64 | |||||
| Total investment return (b) | 24.08% | 19.18% | 9.71% | 2.35% | 15.23% | 2.77% | |||||
| Ratios (to average net assets)/Supplemental Data: | |||||||||||
| Net investment income (loss) | (0.79)%†† | (0.61)% | (0.23)% | (0.03)% | 0.21% | 0.39% | |||||
| Net expenses (c) | 1.88%†† | 1.91% | 1.90% | 1.88% | 1.89% | 1.93% | |||||
| Expenses (before waiver/reimbursement) (c) | 1.88%†† | 1.91% | 1.92% | 1.89% | 1.90% | 1.93% | |||||
| Portfolio turnover rate | 24% | 46% | 23% | 43% | 38% | 24% | |||||
| Net assets at end of period (in 000’s) | $ 57,545 | $ 52,999 | $ 60,891 | $ 80,830 | $ 82,335 | $ 76,501 | |||||
| * | Unaudited. |
| ‡ | Less than one cent per share. |
| †† | Annualized. |
| (a) | Per share data based on average shares outstanding during the period. |
| (b) | Total investment return is calculated exclusive of sales charges and assumes the reinvestment of dividends and distributions. For periods of less than one year, total return is not annualized. |
| (c) | In addition to the fees and expenses which the Fund bears directly, it also indirectly bears a pro-rata share of the fees and expenses of the underlying funds in which it invests. Such indirect expenses are not included in the above expense ratios. |
| 20 | MainStay MacKay Convertible Fund |
| Six months ended April 30, 2021* | Year Ended October 31, | ||||||||||
| Class I | 2020 | 2019 | 2018 | 2017 | 2016 | ||||||
| Net asset value at beginning of period | $ 20.95 | $ 17.85 | $ 17.11 | $ 17.79 | $ 15.75 | $ 16.54 | |||||
| Net investment income (loss) (a) | 0.06 | 0.13 | 0.18 | 0.22 | 0.25 | 0.24 | |||||
| Net realized and unrealized gain (loss) on investments | 4.99 | 3.48 | 1.60 | 0.39 | 2.34 | 0.35 | |||||
| Total from investment operations | 5.05 | 3.61 | 1.78 | 0.61 | 2.59 | 0.59 | |||||
| Less distributions: | |||||||||||
| From net investment income | (0.14) | (0.20) | (0.21) | (0.28) | (0.29) | (0.68) | |||||
| From net realized gain on investments | (1.43) | (0.31) | (0.83) | (1.01) | (0.26) | (0.70) | |||||
| Total distributions | (1.57) | (0.51) | (1.04) | (1.29) | (0.55) | (1.38) | |||||
| Net asset value at end of period | $ 24.43 | $ 20.95 | $ 17.85 | $ 17.11 | $ 17.79 | $ 15.75 | |||||
| Total investment return (b) | 24.84% | 20.71% | 11.14% | 3.65% | 16.69% | 3.96% | |||||
| Ratios (to average net assets)/Supplemental Data: | |||||||||||
| Net investment income (loss) | 0.48%†† | 0.68% | 1.04% | 1.25% | 1.45% | 1.56% | |||||
| Net expenses (c) | 0.61%†† | 0.61% | 0.61% | 0.61% | 0.64% | 0.76% | |||||
| Expenses (before waiver/reimbursement) (c) | 0.67%†† | 0.71% | 0.73% | 0.73% | 0.74% | 0.76% | |||||
| Portfolio turnover rate | 24% | 46% | 23% | 43% | 38% | 24% | |||||
| Net assets at end of period (in 000’s) | $ 964,456 | $ 852,739 | $ 773,865 | $ 683,594 | $ 562,526 | $ 252,852 | |||||
| * | Unaudited. |
| †† | Annualized. |
| (a) | Per share data based on average shares outstanding during the period. |
| (b) | Total investment return is calculated exclusive of sales charges and assumes the reinvestment of dividends and distributions. Class I shares are not subject to sales charges. For periods of less than one year, total return is not annualized. |
| (c) | In addition to the fees and expenses which the Fund bears directly, it also indirectly bears a pro-rata share of the fees and expenses of the underlying funds in which it invests. Such indirect expenses are not included in the above expense ratios. |
| Class | Commenced Operations |
| Class A | January 3, 1995 |
| Investor Class | February 28, 2008 |
| Class B | May 1, 1986 |
| Class C | September 1, 1998 |
| Class I | November 28, 2008 |
| Class R6 | N/A* |
| SIMPLE Class | N/A* |
| * | Class R6 shares were registered for sale effective as of February 28, 2017 and SIMPLE Class shares were registered for sale effective as of August 31, 2020 but have not yet commenced operations. |
| 22 | MainStay MacKay Convertible Fund |
| • | Level 1—quoted prices in active markets for an identical asset or liability |
| • | Level 2—other significant observable inputs (including quoted prices for a similar asset or liability in active markets, interest rates and yield curves, prepayment speeds, credit risk, etc.) |
| • | Level 3—significant unobservable inputs (including the Fund's own assumptions about the assumptions that market participants would use in measuring fair value of an asset or liability) |
| • Benchmark yields | • Reported trades |
| • Broker/dealer quotes | • Issuer spreads |
| • Two-sided markets | • Benchmark securities |
| • Bids/offers | • Reference data (corporate actions or material event notices) |
| • Industry and economic events | • Comparable bonds |
| • Monthly payment information |
| 24 | MainStay MacKay Convertible Fund |
| 26 | MainStay MacKay Convertible Fund |
| Class | Expense | Waived |
| Class A | $358,988 | $— |
| Investor Class | 89,145 | — |
| Class B | 17,452 | — |
| Class C | 89,984 | — |
| Class I | 433,492 | — |
| Affiliated Investment Companies | Value, Beginning of Period | Purchases at Cost | Proceeds from Sales | Net Realized Gain/(Loss) on Sales | Change in Unrealized Appreciation/ (Depreciation) | Value, End of Period | Dividend Income | Other Distributions | Shares End of Period |
| MainStay U.S. Government Liquidity Fund | $ 60,631 | $ 333,279 | $ (316,151) | $ — | $ — | $ 77,759 | $ 3 | $ — | 77,759 |
| Federal Tax Cost | Gross Unrealized Appreciation | Gross Unrealized (Depreciation) | Net Unrealized Appreciation/ (Depreciation) | |
| Investments | $1,569,764,782 | $443,284,197 | $(55,591,217) | $387,692,980 |
| 2020 | |
| Distributions paid from: | |
| Ordinary Income | $12,864,160 |
| Long-Term Capital Gains | 25,158,925 |
| Total | $38,023,085 |
| Class A | Shares | Amount |
| Period ended April 30, 2021: | ||
| Shares sold | 3,228,521 | $ 76,218,612 |
| Shares issued to shareholders in reinvestment of distributions | 2,104,575 | 46,614,503 |
| Shares redeemed | (2,566,283) | (60,152,880) |
| Net increase (decrease) in shares outstanding before conversion | 2,766,813 | 62,680,235 |
| Shares converted into Class A (See Note 1) | 787,251 | 18,114,798 |
| Shares converted from Class A (See Note 1) | (15,554) | (371,916) |
| Net increase (decrease) | 3,538,510 | $ 80,423,117 |
| Year ended October 31, 2020: | ||
| Shares sold | 4,824,291 | $ 91,966,797 |
| Shares issued to shareholders in reinvestment of distributions | 740,743 | 13,145,043 |
| Shares redeemed | (5,573,401) | (102,784,136) |
| Net increase (decrease) in shares outstanding before conversion | (8,367) | 2,327,704 |
| Shares converted into Class A (See Note 1) | 880,877 | 16,956,773 |
| Shares converted from Class A (See Note 1) | (53,288) | (999,795) |
| Net increase (decrease) | 819,222 | $ 18,284,682 |
| Investor Class | Shares | Amount |
| Period ended April 30, 2021: | ||
| Shares sold | 130,929 | $ 3,081,047 |
| Shares issued to shareholders in reinvestment of distributions | 188,062 | 4,163,693 |
| Shares redeemed | (125,081) | (2,941,941) |
| Net increase (decrease) in shares outstanding before conversion | 193,910 | 4,302,799 |
| Shares converted into Investor Class (See Note 1) | 38,903 | 936,166 |
| Shares converted from Investor Class (See Note 1) | (674,566) | (15,468,491) |
| Net increase (decrease) | (441,753) | $ (10,229,526) |
| Year ended October 31, 2020: | ||
| Shares sold | 437,729 | $ 8,173,460 |
| Shares issued to shareholders in reinvestment of distributions | 74,975 | 1,326,608 |
| Shares redeemed | (338,316) | (6,247,912) |
| Net increase (decrease) in shares outstanding before conversion | 174,388 | 3,252,156 |
| Shares converted into Investor Class (See Note 1) | 61,840 | 1,123,928 |
| Shares converted from Investor Class (See Note 1) | (796,900) | (15,363,947) |
| Net increase (decrease) | (560,672) | $ (10,987,863) |
| Class B | Shares | Amount |
| Period ended April 30, 2021: | ||
| Shares sold | 13,869 | $ 319,972 |
| Shares issued to shareholders in reinvestment of distributions | 31,173 | 683,004 |
| Shares redeemed | (37,070) | (863,797) |
| Net increase (decrease) in shares outstanding before conversion | 7,972 | 139,179 |
| Shares converted from Class B (See Note 1) | (41,451) | (960,068) |
| Net increase (decrease) | (33,479) | $ (820,889) |
| Year ended October 31, 2020: | ||
| Shares sold | 28,921 | $ 552,676 |
| Shares issued to shareholders in reinvestment of distributions | 11,800 | 208,506 |
| Shares redeemed | (110,550) | (2,042,015) |
| Net increase (decrease) in shares outstanding before conversion | (69,829) | (1,280,833) |
| Shares converted from Class B (See Note 1) | (91,151) | (1,666,664) |
| Net increase (decrease) | (160,980) | $ (2,947,497) |
| 28 | MainStay MacKay Convertible Fund |
| Class C | Shares | Amount |
| Period ended April 30, 2021: | ||
| Shares sold | 251,524 | $ 5,820,265 |
| Shares issued to shareholders in reinvestment of distributions | 162,888 | 3,564,001 |
| Shares redeemed | (471,397) | (10,929,466) |
| Net increase (decrease) in shares outstanding before conversion | (56,985) | (1,545,200) |
| Shares converted from Class C (See Note 1) | (112,395) | (2,622,739) |
| Net increase (decrease) | (169,380) | $ (4,167,939) |
| Year ended October 31, 2020: | ||
| Shares sold | 464,089 | $ 8,568,551 |
| Shares issued to shareholders in reinvestment of distributions | 54,069 | 954,315 |
| Shares redeemed | (1,360,299) | (25,010,993) |
| Net increase (decrease) in shares outstanding before conversion | (842,141) | (15,488,127) |
| Shares converted from Class C (See Note 1) | (39,567) | (762,500) |
| Net increase (decrease) | (881,708) | $ (16,250,627) |
| Class I | Shares | Amount |
| Period ended April 30, 2021: | ||
| Shares sold | 4,972,950 | $ 117,176,239 |
| Shares issued to shareholders in reinvestment of distributions | 2,343,368 | 52,035,191 |
| Shares redeemed | (8,552,541) | (201,547,094) |
| Net increase (decrease) in shares outstanding before conversion | (1,236,223) | (32,335,664) |
| Shares converted into Class I (See Note 1) | 15,524 | 372,250 |
| Net increase (decrease) | (1,220,699) | $ (31,963,414) |
| Year ended October 31, 2020: | ||
| Shares sold | 17,361,683 | $ 331,864,119 |
| Shares issued to shareholders in reinvestment of distributions | 1,037,248 | 18,487,215 |
| Shares redeemed | (21,094,224) | (390,215,872) |
| Net increase (decrease) in shares outstanding before conversion | (2,695,293) | (39,864,538) |
| Shares converted into Class I (See Note 1) | 36,723 | 712,205 |
| Net increase (decrease) | (2,658,570) | $ (39,152,333) |
| 30 | MainStay MacKay Convertible Fund |
| 32 | MainStay MacKay Convertible Fund |
| 34 | MainStay MacKay Convertible Fund |
| 36 | MainStay MacKay Convertible Fund |
1.
| 2. | This Fund is registered for sale in CA, CT, DE, FL, MA, NJ, NY and VT. |
| 3. | An affiliate of New York Life Investment Management LLC. |
| 1737258MS071-21 | MSC10-06/21 |
please log in to newyorklifeinvestments.com/accounts.
| Not FDIC/NCUA Insured | Not a Deposit | May Lose Value | No Bank Guarantee | Not Insured by Any Government Agency |


President

| Average Annual Total Returns for the Period-Ended April 30, 2021 | ||||||||
| Class | Sales Charge | Inception Date | Six Months | One Year or Since Inception | Five Years | Ten Years or Since Inception | Gross Expense Ratio1 | |
| Class A Shares | Maximum 4.5% Initial Sales Charge | With sales charges | 1/3/1995 | 2.26% | 12.15% | 5.62% | 5.37% | 0.99% |
| Excluding sales charges | 7.08 | 17.43 | 6.60 | 5.85 | 0.99 | |||
| Investor Class Shares2 | Maximum 4% Initial Sales Charge | With sales charges | 2/28/2008 | 2.72 | 11.99 | 5.54 | 5.31 | 1.08 |
| Excluding sales charges | 7.00 | 17.26 | 6.52 | 5.79 | 1.08 | |||
| Class B Shares3 | Maximum 5% CDSC | With sales charges | 5/1/1986 | 1.67 | 11.30 | 5.41 | 4.99 | 1.83 |
| if Redeemed Within the First Six Years of Purchase | Excluding sales charges | 6.67 | 16.30 | 5.74 | 4.99 | 1.83 | ||
| Class C Shares | Maximum 1% CDSC | With sales charges | 9/1/1998 | 5.66 | 15.51 | 5.73 | 5.01 | 1.83 |
| if Redeemed Within One Year of Purchase | Excluding sales charges | 6.66 | 16.51 | 5.73 | 5.01 | 1.83 | ||
| Class I Shares | No Sales Charge | 1/2/2004 | 7.22 | 17.75 | 6.84 | 6.10 | 0.74 | |
| Class R1 Shares | No Sales Charge | 6/29/2012 | 7.17 | 17.66 | 6.74 | 5.95 | 0.84 | |
| Class R2 Shares | No Sales Charge | 5/1/2008 | 7.03 | 17.33 | 6.50 | 5.74 | 1.09 | |
| Class R3 Shares | No Sales Charge | 2/29/2016 | 6.91 | 16.82 | 6.21 | 7.45 | 1.34 | |
| Class R6 Shares | No Sales Charge | 6/17/2013 | 7.31 | 17.95 | 7.01 | 5.69 | 0.60 | |
| SIMPLE Class Shares | No Sales Charge | 8/31/2020 | 6.87 | 6.10 | N/A | N/A | 1.33 | |
| 1. | The gross expense ratios presented reflect the Fund’s “Total Annual Fund Operating Expenses” from the most recent Prospectus, as supplemented, and may differ from other expense ratios disclosed in this report. |
| 2. | Prior to June 30, 2020, the maximum initial sales charge for Investor Class shares was 4.5%, which is reflected in the average annual total return figures shown. |
| 3. | Class B shares are closed to all new purchases as well as additional investments by existing Class B shareholders. |
| Benchmark Performance | Six Months | One Year | Five Years | Ten Years |
| ICE BofA U.S. High Yield Constrained Index1 | 8.13% | 20.01% | 7.31% | 6.26% |
| Morningstar High Yield Bond Category Average2 | 7.92 | 18.47 | 6.04 | 5.05 |
| 1. | The ICE BofA U.S. High Yield Constrained Index is the Fund’s primary broad-based securities market index for comparison purposes. The ICE BofA U.S. High Yield Constrained Index is a market value-weighted index of all domestic and Yankee high-yield bonds, including deferred interest bonds and payment-in-kind securities. Issuers included in the Index have maturities of one year or more and have a credit rating lower than BBB-/Baa3, but are not in default. No single issuer may constitute greater than 2% of the Index. Results assume reinvestment of all dividends and capital gains. An investment cannot be made directly in an index. |
| 2. | The Morningstar High Yield Bond Category Average is representative of funds that concentrate on lower-quality bonds, which are riskier than those of higher-quality companies. These portfolios primarily invest in U.S. high-income debt securities where at least 65% or more of bond assets are not rated or are rated by a major agency such as Standard & Poor’s or Moody’s at the level of BB and below. Results are based on average total returns of similar funds with all dividends and capital gain distributions reinvested. |
| 6 | MainStay MacKay High Yield Corporate Bond Fund |
| Share Class | Beginning Account Value 11/1/20 | Ending Account Value (Based on Actual Returns and Expenses) 4/30/21 | Expenses Paid During Period1 | Ending Account Value (Based on Hypothetical 5% Annualized Return and Actual Expenses) 4/30/21 | Expenses Paid During Period1 | Net Expense Ratio During Period2 |
| Class A Shares | $1,000.00 | $1,070.80 | $4.88 | $1,020.08 | $4.76 | 0.95% |
| Investor Class Shares | $1,000.00 | $1,070.00 | $5.44 | $1,019.54 | $5.31 | 1.06% |
| Class B Shares | $1,000.00 | $1,066.70 | $9.27 | $1,015.82 | $9.05 | 1.81% |
| Class C Shares | $1,000.00 | $1,066.60 | $9.27 | $1,015.82 | $9.05 | 1.81% |
| Class I Shares | $1,000.00 | $1,072.20 | $3.60 | $1,021.32 | $3.51 | 0.70% |
| Class R1 Shares | $1,000.00 | $1,071.70 | $4.11 | $1,020.83 | $4.01 | 0.80% |
| Class R2 Shares | $1,000.00 | $1,070.30 | $5.39 | $1,019.59 | $5.26 | 1.05% |
| Class R3 Shares | $1,000.00 | $1,069.10 | $6.67 | $1,018.35 | $6.51 | 1.30% |
| Class R6 Shares | $1,000.00 | $1,073.10 | $2.93 | $1,021.97 | $2.86 | 0.57% |
| SIMPLE Class Shares | $1,000.00 | $1,068.70 | $6.72 | $1,018.30 | $6.56 | 1.31% |
| 1. | Expenses are equal to the Fund’s annualized expense ratio of each class multiplied by the average account value over the period, divided by 365 and multiplied by 181 (to reflect the six-month period). The table above represents the actual expenses incurred during the six-month period. In addition to the fees and expenses which the Fund bears directly, it also indirectly bears a pro rata share of the fees and expenses of the underlying funds in which it invests. Such indirect expenses are not included in the above-reported expense figures. |
| 2. | Expenses are equal to the Fund's annualized expense ratio to reflect the six-month period. |
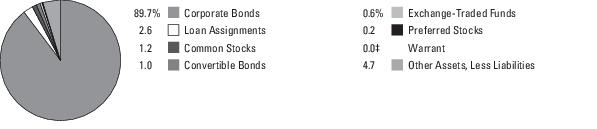
| 1. | CCO Holdings LLC, 4.25%-5.875%, due 2/15/26–5/1/32 |
| 2. | HCA, Inc., 3.50%-8.36%, due 5/1/23–11/6/33 |
| 3. | T-Mobile US, Inc., 2.625%-6.00%, due 4/15/22–4/15/50 |
| 4. | MSCI, Inc., 3.625%-5.375%, due 5/15/27–11/1/31 |
| 5. | Carnival Corp., 5.75%-11.50%, due 4/1/23–8/1/27 |
| 6. | MGM Growth Properties Operating Partnership LP, 3.875%-5.75%, due 5/1/24–2/15/29 |
| 7. | TransDigm, Inc., 4.625%-8.00%, due 5/15/25–5/1/29 |
| 8. | Netflix, Inc., 3.625%-5.875%, due 2/15/22–6/15/30 |
| 9. | Occidental Petroleum Corp., 2.70%-7.15%, due 2/15/23–9/15/36 |
| 10. | Sprint Capital Corp., 6.875%, due 11/15/28 |
| 8 | MainStay MacKay High Yield Corporate Bond Fund |
| 1. | See page 5 for other share class returns, which may be higher or lower than Class I share returns. See page 6 for more information on benchmark and peer group returns. |
| 2. | The terms “spread” and “yield spread” may refer to the difference in yield between a security or type of security and comparable U.S. Treasury issues. The terms may also refer to the difference in yield between two specific securities or types of securities at a given time. |
| 3. | An obligation rated ‘CCC’ by Standard & Poor’s (“S&P”) is deemed by S&P to be currently vulnerable to nonpayment and is dependent upon favorable business, financial and economic conditions for the obligor to meet its financial commitment on the obligation. It is the opinion of S&P that in the event of adverse business, financial or economic conditions, the obligor is not likely to have the capacity to meet its financial commitment on the obligation. When applied to Fund holdings, ratings are based solely on the creditworthiness of the bonds in the portfolio and are not meant to represent the security or safety of the Fund. |
| 4. | Duration is a measure of the price sensitivity of a fixed-income investment to changes in interest rates. Duration is expressed as a number of years and is considered a more accurate sensitivity gauge than average maturity. |
| 5. | Modified duration is inversely related to the approximate percentage change in price for a given change in yield. Duration to worst is the duration of a bond computed using the bond’s nearest call date or maturity, whichever comes first. This measure ignores future cash flow fluctuations due to embedded optionality. |
| Principal Amount | Value | |
| Long-Term Bonds 93.3% | ||
| Convertible Bonds 1.0% | ||
| Investment Companies 0.2% | ||
| Ares Capital Corp. | ||
| 3.75%, due 2/1/22 | $ 3,690,000 | $ 3,826,530 |
| 4.625%, due 3/1/24 | 18,360,000 | 20,023,416 |
| 23,849,946 | ||
| Media 0.5% | ||
| DISH Network Corp. | ||
| 2.375%, due 3/15/24 | 33,079,000 | 32,334,723 |
| 3.375%, due 8/15/26 | 23,500,000 | 24,792,500 |
| 57,127,223 | ||
| Oil & Gas Services 0.3% | ||
| Forum Energy Technologies, Inc. | ||
| 9.00% (6.25% Cash and 2.75% PIK), due 8/4/25 (a) | 47,346,987 | 44,771,088 |
| Total Convertible Bonds (Cost $116,804,202) | 125,748,257 | |
| Corporate Bonds 89.7% | ||
| Advertising 1.1% | ||
| Lamar Media Corp. | ||
| 3.625%, due 1/15/31 (b) | 36,000,000 | 35,100,000 |
| 3.75%, due 2/15/28 | 21,000,000 | 21,186,060 |
| 4.00%, due 2/15/30 | 18,500,000 | 18,685,000 |
| 4.875%, due 1/15/29 | 5,000,000 | 5,262,500 |
| Outfront Media Capital LLC (b) | ||
| 4.25%, due 1/15/29 | 7,275,000 | 7,227,785 |
| 4.625%, due 3/15/30 | 5,305,000 | 5,251,950 |
| 5.00%, due 8/15/27 | 22,000,000 | 22,687,500 |
| 6.25%, due 6/15/25 | 15,216,000 | 16,147,980 |
| 131,548,775 | ||
| Aerospace & Defense 1.8% | ||
| F-Brasile SpA | ||
| Series XR | ||
| 7.375%, due 8/15/26 (b) | 23,280,000 | 23,629,200 |
| Rolls-Royce plc | ||
| 5.75%, due 10/15/27 (b) | 9,000,000 | 9,652,500 |
| SSL Robotics LLC | ||
| 9.75%, due 12/31/23 (b) | 2,958,000 | 3,299,915 |
| TransDigm UK Holdings plc | ||
| 6.875%, due 5/15/26 | 18,100,000 | 19,027,625 |
| TransDigm, Inc. | ||
| 4.625%, due 1/15/29 (b) | 29,200,000 | 28,776,892 |
| 4.875%, due 5/1/29 (b) | 21,420,000 | 21,098,700 |
| 6.25%, due 3/15/26 (b) | 80,375,000 | 85,097,031 |
| Principal Amount | Value | |
| Aerospace & Defense (continued) | ||
| TransDigm, Inc. (continued) | ||
| 6.50%, due 5/15/25 | $ 5,000,000 | $ 5,064,640 |
| 7.50%, due 3/15/27 | 11,350,000 | 12,158,688 |
| 8.00%, due 12/15/25 (b) | 11,000,000 | 11,948,750 |
| 219,753,941 | ||
| Airlines 1.0% | ||
| American Airlines, Inc. (b) | ||
| 5.50%, due 4/20/26 | 18,160,000 | 19,068,000 |
| 5.75%, due 4/20/29 | 11,500,000 | 12,322,250 |
| Delta Air Lines, Inc. | ||
| 4.50%, due 10/20/25 (b) | 17,200,000 | 18,449,612 |
| 4.75%, due 10/20/28 (b) | 23,500,000 | 25,805,896 |
| 7.00%, due 5/1/25 (b) | 6,000,000 | 6,977,023 |
| 7.375%, due 1/15/26 | 7,000,000 | 8,222,373 |
| Mileage Plus Holdings LLC | ||
| 6.50%, due 6/20/27 (b) | 19,910,000 | 21,851,225 |
| Spirit Loyalty Cayman Ltd. | ||
| 8.00%, due 9/20/25 (b) | 7,500,000 | 8,445,675 |
| 121,142,054 | ||
| Apparel 0.0% ‡ | ||
| Levi Strauss & Co. | ||
| 5.00%, due 5/1/25 | 3,000,000 | 3,060,000 |
| Auto Manufacturers 2.5% | ||
| Ford Holdings LLC | ||
| 9.30%, due 3/1/30 | 30,695,000 | 40,839,697 |
| Ford Motor Co. | ||
| 7.45%, due 7/16/31 | 16,935,000 | 21,782,644 |
| 9.00%, due 4/22/25 | 8,400,000 | 10,258,500 |
| 9.625%, due 4/22/30 | 7,000,000 | 9,817,500 |
| Ford Motor Credit Co. LLC | ||
| 3.339%, due 3/28/22 | 6,000,000 | 6,082,800 |
| 3.375%, due 11/13/25 | 12,000,000 | 12,277,320 |
| 4.00%, due 11/13/30 | 25,000,000 | 25,531,250 |
| 4.125%, due 8/17/27 | 4,000,000 | 4,180,440 |
| 4.271%, due 1/9/27 | 7,500,000 | 7,875,825 |
| 4.389%, due 1/8/26 | 2,500,000 | 2,668,750 |
| 5.125%, due 6/16/25 | 13,000,000 | 14,201,200 |
| 5.584%, due 3/18/24 | 3,660,000 | 3,989,400 |
| General Motors Co. | ||
| 6.80%, due 10/1/27 | 5,500,000 | 6,915,153 |
| General Motors Financial Co., Inc. | ||
| 4.35%, due 4/9/25 | 7,410,000 | 8,212,943 |
| 5.10%, due 1/17/24 | 1,900,000 | 2,101,476 |
| 5.25%, due 3/1/26 | 14,220,000 | 16,384,138 |
| 10 | MainStay MacKay High Yield Corporate Bond Fund |
| Principal Amount | Value | |
| Corporate Bonds (continued) | ||
| Auto Manufacturers (continued) | ||
| JB Poindexter & Co., Inc. | ||
| 7.125%, due 4/15/26 (b) | $ 40,745,000 | $ 43,036,906 |
| Mclaren Finance plc | ||
| 5.75%, due 8/1/22 (b) | 26,535,000 | 26,203,312 |
| PM General Purchaser LLC | ||
| 9.50%, due 10/1/28 (b) | 16,975,000 | 18,714,938 |
| Wabash National Corp. | ||
| 5.50%, due 10/1/25 (b) | 17,824,000 | 18,180,480 |
| 299,254,672 | ||
| Auto Parts & Equipment 1.9% | ||
| Adient Global Holdings Ltd. | ||
| 4.875%, due 8/15/26 (b) | 24,525,000 | 25,168,781 |
| Adient US LLC (b) | ||
| 7.00%, due 5/15/26 | 117,000 | 125,483 |
| 9.00%, due 4/15/25 | 8,635,000 | 9,569,739 |
| American Axle & Manufacturing, Inc. | ||
| 6.25%, due 4/1/25 | 2,676,000 | 2,770,998 |
| Dealer Tire LLC | ||
| 8.00%, due 2/1/28 (b) | 4,160,000 | 4,394,000 |
| Exide Global Holding Netherlands CV | ||
| 10.75%, due 10/26/24 (c)(d)(e) | 13,730,000 | 13,345,560 |
| IHO Verwaltungs GmbH (a)(b) | ||
| 4.75% (4.75% Cash or 5.50% PIK), due 9/15/26 | 33,725,000 | 34,588,360 |
| 6.00% (6.00% Cash or 6.75% PIK), due 5/15/27 | 28,859,000 | 30,381,312 |
| 6.375% (6.375% Cash or 7.125% PIK), due 5/15/29 | 30,170,000 | 33,102,524 |
| Meritor, Inc. | ||
| 4.50%, due 12/15/28 (b) | 4,000,000 | 4,050,000 |
| 6.25%, due 2/15/24 | 1,932,000 | 1,960,980 |
| 6.25%, due 6/1/25 (b) | 8,000,000 | 8,558,920 |
| Real Hero Merger Sub 2, Inc. | ||
| 6.25%, due 2/1/29 (b) | 33,030,000 | 34,170,856 |
| Tenneco, Inc. | ||
| 5.00%, due 7/15/26 | 3,500,000 | 3,390,170 |
| 5.375%, due 12/15/24 | 4,100,000 | 4,135,875 |
| 7.875%, due 1/15/29 (b) | 15,000,000 | 16,889,250 |
| Wheel Pros, Inc. | ||
| 6.50%, due 5/15/29 (b) | 5,000,000 | 5,006,800 |
| 231,609,608 | ||
| Principal Amount | Value | |
| Building Materials 1.1% | ||
| Griffon Corp. | ||
| 5.75%, due 3/1/28 | $ 3,550,000 | $ 3,789,625 |
| James Hardie International Finance DAC | ||
| 5.00%, due 1/15/28 (b) | 31,840,000 | 33,750,400 |
| Koppers, Inc. | ||
| 6.00%, due 2/15/25 (b) | 27,535,000 | 28,292,213 |
| Patrick Industries, Inc. | ||
| 7.50%, due 10/15/27 (b) | 21,040,000 | 22,828,400 |
| Summit Materials LLC (b) | ||
| 5.125%, due 6/1/25 | 7,815,000 | 7,922,456 |
| 5.25%, due 1/15/29 | 15,500,000 | 16,313,750 |
| 6.50%, due 3/15/27 | 21,730,000 | 22,925,150 |
| 135,821,994 | ||
| Chemicals 1.7% | ||
| Axalta Coating Systems LLC (b) | ||
| 3.375%, due 2/15/29 | 6,000,000 | 5,830,380 |
| 4.75%, due 6/15/27 | 4,700,000 | 4,923,250 |
| Blue Cube Spinco LLC | ||
| 10.00%, due 10/15/25 | 8,958,000 | 9,424,712 |
| GPD Cos., Inc. | ||
| 10.125%, due 4/1/26 (b) | 26,307,000 | 28,641,746 |
| Innophos Holdings, Inc. | ||
| 9.375%, due 2/15/28 (b) | 26,851,000 | 29,200,462 |
| Iris Holdings, Inc. | ||
| 8.75% (8.75% Cash or 9.50% PIK), due 2/15/26 (a)(b) | 14,175,000 | 14,600,250 |
| NOVA Chemicals Corp. (b) | ||
| 4.875%, due 6/1/24 | 9,810,000 | 10,342,291 |
| 5.25%, due 6/1/27 | 12,500,000 | 13,281,250 |
| Olin Corp. | ||
| 5.50%, due 8/15/22 | 6,000,000 | 6,240,000 |
| 9.50%, due 6/1/25 (b) | 5,000,000 | 6,268,750 |
| SCIH Salt Holdings, Inc. (b) | ||
| 4.875%, due 5/1/28 | 4,500,000 | 4,488,750 |
| 6.625%, due 5/1/29 | 21,700,000 | 21,347,375 |
| TPC Group, Inc. (b) | ||
| 10.50%, due 8/1/24 | 21,482,000 | 20,085,670 |
| 10.875%, due 8/1/24 | 22,000,721 | 22,880,750 |
| W.R. Grace & Co.-Conn. | ||
| 4.875%, due 6/15/27 (b) | 1,500,000 | 1,563,750 |
| 199,119,386 | ||
| Coal 0.1% | ||
| Natural Resource Partners LP | ||
| 9.125%, due 6/30/25 (b) | 10,000,000 | 9,537,500 |
| Principal Amount | Value | |
| Corporate Bonds (continued) | ||
| Commercial Services 3.2% | ||
| Allied Universal Holdco LLC (b) | ||
| 6.625%, due 7/15/26 | $ 8,350,000 | $ 8,830,125 |
| 9.75%, due 7/15/27 | 14,705,000 | 16,138,737 |
| AMN Healthcare, Inc. (b) | ||
| 4.00%, due 4/15/29 | 9,500,000 | 9,500,000 |
| 4.625%, due 10/1/27 | 10,977,000 | 11,333,753 |
| Ashtead Capital, Inc. (b) | ||
| 4.00%, due 5/1/28 | 13,500,000 | 14,158,125 |
| 4.25%, due 11/1/29 | 10,000,000 | 10,700,000 |
| 4.375%, due 8/15/27 | 10,044,000 | 10,521,090 |
| 5.25%, due 8/1/26 | 17,120,000 | 17,933,200 |
| Carriage Services, Inc. | ||
| 4.25%, due 5/15/29 (b)(f) | 9,000,000 | 8,943,750 |
| Cimpress plc | ||
| 7.00%, due 6/15/26 (b) | 30,585,000 | 32,190,712 |
| Gartner, Inc. (b) | ||
| 3.75%, due 10/1/30 | 18,000,000 | 18,045,000 |
| 4.50%, due 7/1/28 | 4,000,000 | 4,205,080 |
| Graham Holdings Co. | ||
| 5.75%, due 6/1/26 (b) | 39,695,000 | 41,481,275 |
| IHS Markit Ltd. (b) | ||
| 4.75%, due 2/15/25 | 3,000,000 | 3,368,700 |
| 5.00%, due 11/1/22 | 28,545,000 | 30,040,525 |
| Korn Ferry | ||
| 4.625%, due 12/15/27 (b) | 10,685,000 | 11,124,154 |
| MPH Acquisition Holdings LLC | ||
| 5.75%, due 11/1/28 (b) | 11,500,000 | 11,340,035 |
| NESCO Holdings II, Inc. | ||
| 5.50%, due 4/15/29 (b) | 12,650,000 | 13,029,500 |
| Nielsen Co. Luxembourg SARL (The) | ||
| 5.00%, due 2/1/25 (b) | 4,000,000 | 4,105,000 |
| Ritchie Bros Auctioneers, Inc. | ||
| 5.375%, due 1/15/25 (b) | 21,925,000 | 22,560,825 |
| Service Corp. International | ||
| 3.375%, due 8/15/30 | 17,700,000 | 17,124,750 |
| United Rentals North America, Inc. | ||
| 3.875%, due 11/15/27 | 12,735,000 | 13,339,912 |
| 3.875%, due 2/15/31 | 17,500,000 | 17,611,650 |
| 4.875%, due 1/15/28 | 8,300,000 | 8,787,625 |
| 5.25%, due 1/15/30 | 3,500,000 | 3,828,125 |
| WW International, Inc. | ||
| 4.50%, due 4/15/29 (b) | 21,540,000 | 21,247,056 |
| 381,488,704 | ||
| Principal Amount | Value | |
| Computers 0.0% ‡ | ||
| Booz Allen Hamilton, Inc. | ||
| 3.875%, due 9/1/28 (b) | $ 2,500,000 | $ 2,493,750 |
| Cosmetics & Personal Care 0.4% | ||
| Edgewell Personal Care Co. (b) | ||
| 4.125%, due 4/1/29 | 27,480,000 | 27,411,300 |
| 5.50%, due 6/1/28 | 13,505,000 | 14,349,062 |
| 41,760,362 | ||
| Distribution & Wholesale 0.6% | ||
| Avient Corp. | ||
| 5.25%, due 3/15/23 | 26,406,000 | 28,386,450 |
| 5.75%, due 5/15/25 (b) | 8,550,000 | 9,019,737 |
| G-III Apparel Group Ltd. | ||
| 7.875%, due 8/15/25 (b) | 22,000,000 | 23,760,000 |
| H&E Equipment Services, Inc. | ||
| 3.875%, due 12/15/28 (b) | 14,000,000 | 13,667,500 |
| 74,833,687 | ||
| Diversified Financial Services 1.5% | ||
| Credit Acceptance Corp. | ||
| 5.125%, due 12/31/24 (b) | 15,215,000 | 15,690,469 |
| 6.625%, due 3/15/26 | 32,875,000 | 34,722,575 |
| Genworth Mortgage Holdings, Inc. | ||
| 6.50%, due 8/15/25 (b) | 25,600,000 | 27,799,296 |
| Jefferies Finance LLC | ||
| 6.25%, due 6/3/26 (b) | 14,020,000 | 14,685,950 |
| LPL Holdings, Inc. (b) | ||
| 4.00%, due 3/15/29 | 27,730,000 | 27,730,000 |
| 4.625%, due 11/15/27 | 8,000,000 | 8,340,000 |
| Oxford Finance LLC | ||
| 6.375%, due 12/15/22 (b) | 17,860,000 | 18,109,683 |
| PennyMac Financial Services, Inc. | ||
| 4.25%, due 2/15/29 (b) | 11,000,000 | 10,532,500 |
| PRA Group, Inc. | ||
| 7.375%, due 9/1/25 (b) | 16,400,000 | 17,568,500 |
| StoneX Group, Inc. | ||
| 8.625%, due 6/15/25 (b) | 8,196,000 | 8,769,720 |
| 183,948,693 | ||
| Electric 1.2% | ||
| Clearway Energy Operating LLC | ||
| 4.75%, due 3/15/28 (b) | 17,350,000 | 18,167,879 |
| 5.00%, due 9/15/26 | 1,960,000 | 2,023,700 |
| DPL, Inc. | ||
| 4.125%, due 7/1/25 (b) | 22,825,000 | 24,555,135 |
| 12 | MainStay MacKay High Yield Corporate Bond Fund |
| Principal Amount | Value | |
| Corporate Bonds (continued) | ||
| Electric (continued) | ||
| Keystone Power Pass-Through Holders LLC | ||
| 13.00% (13.00% PIK), due 6/1/24 (a)(b)(d) | $ 11,052,813 | $ 9,063,307 |
| NextEra Energy Operating Partners LP | ||
| 3.875%, due 10/15/26 (b) | 16,330,000 | 17,079,628 |
| NRG Energy, Inc. | ||
| 5.75%, due 1/15/28 | 3,000,000 | 3,187,500 |
| 6.625%, due 1/15/27 | 7,000,000 | 7,295,400 |
| Pattern Energy Operations LP | ||
| 4.50%, due 8/15/28 (b) | 18,500,000 | 18,731,250 |
| PG&E Corp. | ||
| 5.00%, due 7/1/28 | 22,300,000 | 23,359,250 |
| 5.25%, due 7/1/30 | 12,000,000 | 12,810,000 |
| Vistra Operations Co., LLC | ||
| 5.00%, due 7/31/27 (b) | 10,500,000 | 10,878,315 |
| 147,151,364 | ||
| Electrical Components & Equipment 0.1% | ||
| WESCO Distribution, Inc. (b) | ||
| 7.125%, due 6/15/25 | 6,665,000 | 7,198,200 |
| 7.25%, due 6/15/28 | 5,000,000 | 5,550,000 |
| 12,748,200 | ||
| Engineering & Construction 0.5% | ||
| Arcosa, Inc. | ||
| 4.375%, due 4/15/29 (b) | 5,345,000 | 5,466,385 |
| Great Lakes Dredge & Dock Corp. | ||
| 8.00%, due 5/15/22 | 13,874,000 | 13,907,020 |
| PowerTeam Services LLC | ||
| 9.033%, due 12/4/25 (b) | 15,425,000 | 17,102,469 |
| TopBuild Corp. | ||
| 3.625%, due 3/15/29 (b) | 2,000,000 | 1,980,000 |
| Weekley Homes LLC | ||
| 4.875%, due 9/15/28 (b) | 20,500,000 | 21,166,250 |
| 59,622,124 | ||
| Entertainment 2.5% | ||
| Affinity Gaming | ||
| 6.875%, due 12/15/27 (b) | 7,445,000 | 7,902,905 |
| Allen Media LLC | ||
| 10.50%, due 2/15/28 (b) | 23,020,000 | 24,631,400 |
| Bally's Corp. | ||
| 6.75%, due 6/1/27 (b) | 23,765,000 | 25,281,920 |
| Boyne USA, Inc. | ||
| 7.25%, due 5/1/25 (b) | 500,000 | 518,815 |
| Principal Amount | Value | |
| Entertainment (continued) | ||
| CCM Merger, Inc. | ||
| 6.375%, due 5/1/26 (b) | $ 5,000,000 | $ 5,225,000 |
| Churchill Downs, Inc. (b) | ||
| 4.75%, due 1/15/28 | 33,530,000 | 34,452,075 |
| 5.50%, due 4/1/27 | 38,727,000 | 40,201,143 |
| International Game Technology plc | ||
| 6.25%, due 1/15/27 (b) | 22,700,000 | 25,502,088 |
| Jacobs Entertainment, Inc. | ||
| 7.875%, due 2/1/24 (b) | 10,359,000 | 10,799,257 |
| Live Nation Entertainment, Inc. (b) | ||
| 3.75%, due 1/15/28 | 5,500,000 | 5,479,925 |
| 6.50%, due 5/15/27 | 38,280,000 | 42,299,400 |
| Merlin Entertainments Ltd. | ||
| 5.75%, due 6/15/26 (b) | 34,400,000 | 36,292,000 |
| Midwest Gaming Borrower LLC | ||
| 4.875%, due 5/1/29 (b) | 6,750,000 | 6,747,908 |
| Motion Bondco DAC | ||
| 6.625%, due 11/15/27 (b) | 13,975,000 | 14,114,750 |
| Powdr Corp. | ||
| 6.00%, due 8/1/25 (b) | 7,500,000 | 7,893,750 |
| Vail Resorts, Inc. | ||
| 6.25%, due 5/15/25 (b) | 10,095,000 | 10,713,319 |
| 298,055,655 | ||
| Food 2.1% | ||
| B&G Foods, Inc. | ||
| 5.25%, due 4/1/25 | 24,375,000 | 25,090,163 |
| Ingles Markets, Inc. | ||
| 5.75%, due 6/15/23 | 1,736,000 | 1,752,839 |
| Kraft Heinz Foods Co. | ||
| 3.875%, due 5/15/27 | 17,155,000 | 18,682,262 |
| 4.25%, due 3/1/31 | 13,000,000 | 14,334,884 |
| 6.50%, due 2/9/40 | 24,794,000 | 32,768,373 |
| 6.875%, due 1/26/39 | 34,650,000 | 47,554,560 |
| 7.125%, due 8/1/39 (b) | 9,000,000 | 12,759,655 |
| Lamb Weston Holdings, Inc. | ||
| 4.875%, due 5/15/28 (b) | 12,310,000 | 13,571,775 |
| Land O' Lakes, Inc. | ||
| 6.00%, due 11/15/22 (b) | 21,000,000 | 22,353,092 |
| Land O'Lakes Capital Trust I | ||
| 7.45%, due 3/15/28 (b) | 18,586,000 | 21,652,690 |
| Nathan's Famous, Inc. | ||
| 6.625%, due 11/1/25 (b) | 4,000,000 | 4,100,000 |
| Post Holdings, Inc. | ||
| 4.625%, due 4/15/30 (b) | 5,000,000 | 5,050,000 |
| Simmons Foods, Inc. | ||
| 4.625%, due 3/1/29 (b) | 16,350,000 | 16,476,059 |
| Principal Amount | Value | |
| Corporate Bonds (continued) | ||
| Food (continued) | ||
| TreeHouse Foods, Inc. | ||
| 4.00%, due 9/1/28 | $ 12,600,000 | $ 12,537,000 |
| 248,683,352 | ||
| Food Service 0.2% | ||
| Aramark Services, Inc. | ||
| 6.375%, due 5/1/25 (b) | 26,315,000 | 27,992,581 |
| Forest Products & Paper 0.9% | ||
| Mercer International, Inc. | ||
| 5.125%, due 2/1/29 (b) | 35,710,000 | 36,915,212 |
| 5.50%, due 1/15/26 | 2,585,000 | 2,650,039 |
| Schweitzer-Mauduit International, Inc. | ||
| 6.875%, due 10/1/26 (b) | 12,500,000 | 13,218,750 |
| Smurfit Kappa Treasury Funding DAC | ||
| 7.50%, due 11/20/25 | 45,070,000 | 55,910,687 |
| 108,694,688 | ||
| Gas 0.7% | ||
| AmeriGas Partners LP | ||
| 5.625%, due 5/20/24 | 22,706,000 | 25,260,425 |
| 5.75%, due 5/20/27 | 13,560,000 | 15,162,792 |
| 5.875%, due 8/20/26 | 25,075,000 | 28,052,656 |
| Rockpoint Gas Storage Canada Ltd. | ||
| 7.00%, due 3/31/23 (b) | 19,230,000 | 19,470,375 |
| 87,946,248 | ||
| Hand & Machine Tools 0.1% | ||
| Werner FinCo. LP | ||
| 8.75%, due 7/15/25 (b) | 13,030,000 | 13,730,363 |
| Healthcare-Products 0.9% | ||
| Hologic, Inc. (b) | ||
| 3.25%, due 2/15/29 | 29,000,000 | 28,492,500 |
| 4.625%, due 2/1/28 | 10,205,000 | 10,766,275 |
| Teleflex, Inc. | ||
| 4.25%, due 6/1/28 (b) | 33,685,000 | 34,779,762 |
| 4.625%, due 11/15/27 | 5,000,000 | 5,317,400 |
| 4.875%, due 6/1/26 | 6,250,000 | 6,407,500 |
| Varex Imaging Corp. | ||
| 7.875%, due 10/15/27 (b) | 20,000,000 | 22,322,000 |
| 108,085,437 | ||
| Principal Amount | Value | |
| Healthcare-Services 4.6% | ||
| Acadia Healthcare Co., Inc. (b) | ||
| 5.00%, due 4/15/29 | $ 7,000,000 | $ 7,236,250 |
| 5.50%, due 7/1/28 | 8,950,000 | 9,453,438 |
| AHP Health Partners, Inc. | ||
| 9.75%, due 7/15/26 (b) | 21,000,000 | 22,706,250 |
| Catalent Pharma Solutions, Inc. (b) | ||
| 3.125%, due 2/15/29 | 20,050,000 | 19,398,375 |
| 5.00%, due 7/15/27 | 15,395,000 | 16,107,019 |
| Centene Corp. | ||
| 3.00%, due 10/15/30 | 11,700,000 | 11,612,250 |
| 4.25%, due 12/15/27 | 4,000,000 | 4,192,440 |
| 4.625%, due 12/15/29 | 20,070,000 | 21,725,775 |
| 5.375%, due 6/1/26 (b) | 3,045,000 | 3,172,281 |
| 5.375%, due 8/15/26 (b) | 4,255,000 | 4,463,495 |
| Charles River Laboratories International, Inc. | ||
| 4.00%, due 3/15/31 (b) | 6,445,000 | 6,638,350 |
| DaVita, Inc. (b) | ||
| 3.75%, due 2/15/31 | 6,000,000 | 5,700,000 |
| 4.625%, due 6/1/30 | 10,780,000 | 10,914,750 |
| Encompass Health Corp. | ||
| 4.50%, due 2/1/28 | 23,185,000 | 24,025,456 |
| 4.625%, due 4/1/31 | 5,000,000 | 5,300,000 |
| 4.75%, due 2/1/30 | 19,790,000 | 20,779,500 |
| HCA, Inc. | ||
| 3.50%, due 9/1/30 | 20,920,000 | 21,502,620 |
| 5.25%, due 4/15/25 | 15,000,000 | 17,242,402 |
| 5.25%, due 6/15/26 | 5,000,000 | 5,803,020 |
| 5.375%, due 2/1/25 | 26,525,000 | 29,560,256 |
| 5.375%, due 9/1/26 | 4,170,000 | 4,734,451 |
| 5.625%, due 9/1/28 | 11,000,000 | 12,828,750 |
| 5.875%, due 5/1/23 | 7,240,000 | 7,901,215 |
| 5.875%, due 2/15/26 | 25,000,000 | 28,718,750 |
| 5.875%, due 2/1/29 | 4,565,000 | 5,386,700 |
| 7.50%, due 12/15/23 | 2,500,000 | 2,850,000 |
| 7.50%, due 11/6/33 | 19,975,000 | 27,223,528 |
| 7.58%, due 9/15/25 | 8,520,000 | 10,138,800 |
| 7.69%, due 6/15/25 | 31,650,000 | 37,742,625 |
| 8.36%, due 4/15/24 | 4,524,000 | 5,293,080 |
| IQVIA, Inc. (b) | ||
| 5.00%, due 10/15/26 | 30,113,000 | 31,132,852 |
| 5.00%, due 5/15/27 | 5,000,000 | 5,231,250 |
| Legacy LifePoint Health LLC | ||
| 6.75%, due 4/15/25 (b) | 9,190,000 | 9,764,375 |
| LifePoint Health, Inc. | ||
| 5.375%, due 1/15/29 (b) | 12,800,000 | 12,802,560 |
| ModivCare, Inc. | ||
| 5.875%, due 11/15/25 (b) | 5,000,000 | 5,312,500 |
| 14 | MainStay MacKay High Yield Corporate Bond Fund |
| Principal Amount | Value | |
| Corporate Bonds (continued) | ||
| Healthcare-Services (continued) | ||
| Molina Healthcare, Inc. | ||
| 3.875%, due 11/15/30 (b) | $ 10,000,000 | $ 10,300,000 |
| 4.375%, due 6/15/28 (b) | 6,000,000 | 6,165,000 |
| 5.375%, due 11/15/22 (g) | 8,180,000 | 8,578,775 |
| RegionalCare Hospital Partners Holdings, Inc. | ||
| 9.75%, due 12/1/26 (b) | 35,490,000 | 38,329,200 |
| Select Medical Corp. | ||
| 6.25%, due 8/15/26 (b) | 9,950,000 | 10,579,188 |
| 548,547,526 | ||
| Holding Companies-Diversified 0.3% | ||
| Stena International SA (b) | ||
| 5.75%, due 3/1/24 | 5,000,000 | 5,089,625 |
| 6.125%, due 2/1/25 | 34,995,000 | 35,519,925 |
| 40,609,550 | ||
| Home Builders 2.2% | ||
| Adams Homes, Inc. | ||
| 7.50%, due 2/15/25 (b) | 21,730,000 | 22,762,175 |
| Ashton Woods USA LLC (b) | ||
| 6.625%, due 1/15/28 | 6,000,000 | 6,435,000 |
| 6.75%, due 8/1/25 | 5,496,000 | 5,722,710 |
| 9.875%, due 4/1/27 | 10,540,000 | 11,976,075 |
| Brookfield Residential Properties, Inc. (b) | ||
| 6.25%, due 9/15/27 | 17,360,000 | 18,401,600 |
| 6.375%, due 5/15/25 | 7,665,000 | 7,837,463 |
| Century Communities, Inc. | ||
| 5.875%, due 7/15/25 | 4,630,000 | 4,792,050 |
| 6.75%, due 6/1/27 | 26,205,000 | 28,197,235 |
| Installed Building Products, Inc. | ||
| 5.75%, due 2/1/28 (b) | 17,080,000 | 17,934,000 |
| M/I Homes, Inc. | ||
| 4.95%, due 2/1/28 | 7,500,000 | 7,886,625 |
| 5.625%, due 8/1/25 | 6,000,000 | 6,195,000 |
| Meritage Homes Corp. | ||
| 3.875%, due 4/15/29 (b) | 20,150,000 | 20,714,402 |
| 5.125%, due 6/6/27 | 8,015,000 | 8,976,800 |
| Picasso Finance Sub, Inc. | ||
| 6.125%, due 6/15/25 (b) | 13,500,000 | 14,360,625 |
| PulteGroup, Inc. | ||
| 6.375%, due 5/15/33 | 8,125,000 | 10,504,000 |
| Shea Homes LP (b) | ||
| 4.75%, due 2/15/28 | 23,125,000 | 23,529,687 |
| 4.75%, due 4/1/29 | 7,000,000 | 7,073,150 |
| Principal Amount | Value | |
| Home Builders (continued) | ||
| STL Holding Co. LLC | ||
| 7.50%, due 2/15/26 (b) | $ 12,000,000 | $ 12,540,000 |
| Williams Scotsman International, Inc. | ||
| 4.625%, due 8/15/28 (b) | 13,000,000 | 13,262,210 |
| Winnebago Industries, Inc. | ||
| 6.25%, due 7/15/28 (b) | 15,795,000 | 17,121,780 |
| 266,222,587 | ||
| Household Products & Wares 0.2% | ||
| Central Garden & Pet Co. | ||
| 4.125%, due 10/15/30 | 9,350,000 | 9,644,244 |
| Spectrum Brands, Inc. | ||
| 5.75%, due 7/15/25 | 11,687,000 | 12,030,598 |
| 21,674,842 | ||
| Housewares 0.1% | ||
| Newell Brands, Inc. | ||
| 4.875%, due 6/1/25 | 5,035,000 | 5,563,675 |
| Scotts Miracle-Gro Co. (The) | ||
| 4.00%, due 4/1/31 (b) | 8,000,000 | 7,920,000 |
| 13,483,675 | ||
| Insurance 1.0% | ||
| American Equity Investment Life Holding Co. | ||
| 5.00%, due 6/15/27 | 21,500,000 | 24,170,741 |
| Fairfax Financial Holdings Ltd. | ||
| 8.30%, due 4/15/26 | 5,435,000 | 6,898,666 |
| Fidelity & Guaranty Life Holdings, Inc. | ||
| 5.50%, due 5/1/25 (b) | 15,725,000 | 18,091,455 |
| MGIC Investment Corp. | ||
| 5.25%, due 8/15/28 | 17,960,000 | 18,947,800 |
| NMI Holdings, Inc. | ||
| 7.375%, due 6/1/25 (b) | 16,000,000 | 18,400,000 |
| Radian Group, Inc. | ||
| 4.875%, due 3/15/27 | 5,000,000 | 5,300,000 |
| USI, Inc. | ||
| 6.875%, due 5/1/25 (b) | 25,170,000 | 25,579,013 |
| 117,387,675 | ||
| Internet 2.2% | ||
| Cars.com, Inc. | ||
| 6.375%, due 11/1/28 (b) | 17,470,000 | 18,253,005 |
| Netflix, Inc. | ||
| 3.625%, due 6/15/25 (b) | 10,000,000 | 10,753,200 |
| 4.875%, due 4/15/28 | 10,131,000 | 11,663,314 |
| 4.875%, due 6/15/30 (b) | 11,000,000 | 12,760,000 |
| Principal Amount | Value | |
| Corporate Bonds (continued) | ||
| Internet (continued) | ||
| Netflix, Inc. (continued) | ||
| 5.375%, due 11/15/29 (b) | $ 9,430,000 | $ 11,198,125 |
| 5.50%, due 2/15/22 | 22,265,000 | 23,072,106 |
| 5.75%, due 3/1/24 | 24,961,000 | 28,127,927 |
| 5.875%, due 2/15/25 | 7,411,000 | 8,568,969 |
| 5.875%, due 11/15/28 | 32,450,000 | 39,482,726 |
| Uber Technologies, Inc. (b) | ||
| 6.25%, due 1/15/28 | 4,125,000 | 4,481,441 |
| 7.50%, due 5/15/25 | 12,075,000 | 13,056,094 |
| 7.50%, due 9/15/27 | 23,710,000 | 26,146,677 |
| VeriSign, Inc. | ||
| 4.625%, due 5/1/23 | 6,615,000 | 6,634,845 |
| 4.75%, due 7/15/27 | 19,419,000 | 20,678,128 |
| 5.25%, due 4/1/25 | 26,661,000 | 30,126,930 |
| 265,003,487 | ||
| Investment Companies 1.3% | ||
| Ares Capital Corp. | ||
| 4.20%, due 6/10/24 | 5,000,000 | 5,393,483 |
| Compass Group Diversified Holdings LLC | ||
| 5.25%, due 4/15/29 (b) | 33,000,000 | 34,815,000 |
| FS Energy and Power Fund | ||
| 7.50%, due 8/15/23 (b) | 82,632,000 | 83,871,480 |
| Icahn Enterprises LP | ||
| 5.25%, due 5/15/27 | 13,705,000 | 13,979,100 |
| 6.25%, due 5/15/26 | 17,770,000 | 18,731,357 |
| 156,790,420 | ||
| Iron & Steel 1.0% | ||
| Allegheny Ludlum LLC | ||
| 6.95%, due 12/15/25 | 22,688,000 | 24,616,480 |
| Big River Steel LLC | ||
| 6.625%, due 1/31/29 (b) | 37,000,000 | 39,960,000 |
| Mineral Resources Ltd. | ||
| 8.125%, due 5/1/27 (b) | 46,945,000 | 51,995,343 |
| 116,571,823 | ||
| Leisure Time 3.0% | ||
| Carlson Travel, Inc. (b) | ||
| 6.75%, due 12/15/25 | 62,616,000 | 58,859,040 |
| 10.50%, due 3/31/25 (g) | 37,071,219 | 38,554,068 |
| 11.50% (9.50% Cash and 2.00% PIK), due 12/15/26 (a)(h) | 37,808,545 | 29,679,708 |
| Carnival Corp. (b) | ||
| 5.75%, due 3/1/27 | 61,000,000 | 64,317,180 |
| 7.625%, due 3/1/26 | 8,500,000 | 9,307,500 |
| Principal Amount | Value | |
| Leisure Time (continued) | ||
| Carnival Corp. (b) (continued) | ||
| 9.875%, due 8/1/27 | $ 31,843,000 | $ 37,415,525 |
| 10.50%, due 2/1/26 | 28,445,000 | 33,526,699 |
| 11.50%, due 4/1/23 | 21,000,000 | 24,133,200 |
| Royal Caribbean Cruises Ltd. | ||
| 5.50%, due 4/1/28 (b) | 19,770,000 | 20,732,799 |
| Silversea Cruise Finance Ltd. | ||
| 7.25%, due 2/1/25 (b) | 46,202,000 | 47,814,450 |
| 364,340,169 | ||
| Lodging 1.9% | ||
| Boyd Gaming Corp. | ||
| 4.75%, due 12/1/27 | 23,645,000 | 24,238,253 |
| 6.00%, due 8/15/26 | 32,365,000 | 33,578,687 |
| 6.375%, due 4/1/26 | 13,450,000 | 13,887,125 |
| 8.625%, due 6/1/25 (b) | 8,000,000 | 8,857,600 |
| Hilton Domestic Operating Co., Inc. | ||
| 3.75%, due 5/1/29 (b) | 10,265,000 | 10,290,663 |
| 4.00%, due 5/1/31 (b) | 15,100,000 | 15,251,000 |
| 4.875%, due 1/15/30 | 23,325,000 | 24,870,748 |
| 5.375%, due 5/1/25 (b) | 5,000,000 | 5,265,750 |
| 5.75%, due 5/1/28 (b) | 12,500,000 | 13,437,500 |
| Hyatt Hotels Corp. | ||
| 5.375%, due 4/23/25 | 11,500,000 | 12,982,730 |
| 5.75%, due 4/23/30 | 10,595,000 | 12,535,648 |
| Marriott International, Inc. | ||
| Series GG | ||
| 3.50%, due 10/15/32 | 9,200,000 | 9,603,581 |
| Series FF | ||
| 4.625%, due 6/15/30 | 3,000,000 | 3,368,279 |
| Series EE | ||
| 5.75%, due 5/1/25 | 28,075,000 | 32,318,343 |
| Marriott Ownership Resorts, Inc. | ||
| 6.50%, due 9/15/26 | 11,006,000 | 11,501,270 |
| 231,987,177 | ||
| Machinery—Construction & Mining 0.1% | ||
| Terex Corp. | ||
| 5.00%, due 5/15/29 (b) | 8,575,000 | 8,918,000 |
| Machinery-Diversified 0.7% | ||
| Briggs & Stratton Corp. (Escrow Claim Shares) | ||
| 6.875%, due 12/15/20 (i)(j)(k) | 9,200,000 | 736,000 |
| Colfax Corp. | ||
| 6.375%, due 2/15/26 (b) | 13,980,000 | 14,818,800 |
| Stevens Holding Co., Inc. | ||
| 6.125%, due 10/1/26 (b) | 16,965,000 | 18,237,375 |
| 16 | MainStay MacKay High Yield Corporate Bond Fund |
| Principal Amount | Value | |
| Corporate Bonds (continued) | ||
| Machinery-Diversified (continued) | ||
| Tennant Co. | ||
| 5.625%, due 5/1/25 | $ 21,840,000 | $ 22,454,359 |
| Vertical Holdco GmbH | ||
| 7.625%, due 7/15/28 (b) | 10,515,000 | 11,461,350 |
| Vertical US Newco, Inc. | ||
| 5.25%, due 7/15/27 (b) | 14,425,000 | 15,101,244 |
| 82,809,128 | ||
| Media 5.9% | ||
| Block Communications, Inc. | ||
| 4.875%, due 3/1/28 (b) | 14,000,000 | 14,245,000 |
| Cable One, Inc. | ||
| 4.00%, due 11/15/30 (b) | 28,400,000 | 27,974,000 |
| CCO Holdings LLC (b) | ||
| 4.25%, due 2/1/31 | 27,570,000 | 27,570,000 |
| 4.50%, due 8/15/30 | 42,430,000 | 43,167,858 |
| 4.50%, due 5/1/32 | 36,900,000 | 37,269,000 |
| 4.75%, due 3/1/30 | 29,935,000 | 31,244,656 |
| 5.00%, due 2/1/28 | 21,000,000 | 21,945,000 |
| 5.125%, due 5/1/27 | 41,225,000 | 43,144,609 |
| 5.375%, due 6/1/29 | 13,495,000 | 14,648,418 |
| 5.50%, due 5/1/26 | 825,000 | 851,400 |
| 5.75%, due 2/15/26 | 22,195,000 | 22,971,825 |
| 5.875%, due 5/1/27 | 5,920,000 | 6,110,565 |
| CSC Holdings LLC (b) | ||
| 5.75%, due 1/15/30 | 23,400,000 | 24,877,125 |
| 6.50%, due 2/1/29 | 7,000,000 | 7,735,000 |
| Diamond Sports Group LLC | ||
| 6.625%, due 8/15/27 (b) | 13,930,000 | 7,522,200 |
| DISH DBS Corp. | ||
| 5.875%, due 7/15/22 | 14,537,000 | 15,220,239 |
| 6.75%, due 6/1/21 | 10,205,000 | 10,217,756 |
| 7.75%, due 7/1/26 | 30,375,000 | 35,007,187 |
| LCPR Senior Secured Financing DAC (b) | ||
| 5.125%, due 7/15/29 | 7,500,000 | 7,694,550 |
| 6.75%, due 10/15/27 | 53,680,000 | 57,706,000 |
| Meredith Corp. | ||
| 6.50%, due 7/1/25 (b) | 5,000,000 | 5,337,500 |
| 6.875%, due 2/1/26 | 69,733,000 | 71,563,491 |
| News Corp. | ||
| 3.875%, due 5/15/29 (b) | 42,070,000 | 42,899,200 |
| Quebecor Media, Inc. | ||
| 5.75%, due 1/15/23 | 27,505,000 | 29,395,969 |
| Scripps Escrow, Inc. | ||
| 5.875%, due 7/15/27 (b) | 5,000,000 | 5,261,100 |
| Principal Amount | Value | |
| Media (continued) | ||
| Sirius XM Radio, Inc. (b) | ||
| 4.625%, due 7/15/24 | $ 5,000,000 | $ 5,131,250 |
| 5.00%, due 8/1/27 | 13,000,000 | 13,613,565 |
| 5.375%, due 7/15/26 | 6,000,000 | 6,196,200 |
| 5.50%, due 7/1/29 | 11,590,000 | 12,524,444 |
| Sterling Entertainment Enterprises LLC | ||
| 10.25%, due 1/15/25 (c)(d)(e)(k) | 20,000,000 | 20,700,000 |
| Townsquare Media, Inc. | ||
| 6.875%, due 2/1/26 (b) | 4,155,000 | 4,331,587 |
| Videotron Ltd. | ||
| 5.00%, due 7/15/22 | 8,374,000 | 8,729,895 |
| 5.375%, due 6/15/24 (b) | 17,850,000 | 19,640,355 |
| Virgin Media Finance plc | ||
| 5.00%, due 7/15/30 (b) | 12,500,000 | 12,463,500 |
| 714,910,444 | ||
| Metal Fabricate & Hardware 0.8% | ||
| Advanced Drainage Systems, Inc. | ||
| 5.00%, due 9/30/27 (b) | 11,765,000 | 12,313,602 |
| Grinding Media, Inc. | ||
| 7.375%, due 12/15/23 (b) | 67,820,000 | 68,986,504 |
| Park-Ohio Industries, Inc. | ||
| 6.625%, due 4/15/27 | 13,040,000 | 13,333,400 |
| 94,633,506 | ||
| Mining 2.3% | ||
| Alcoa Nederland Holding BV | ||
| 7.00%, due 9/30/26 (b) | 20,510,000 | 21,586,775 |
| Arconic Corp. | ||
| 6.00%, due 5/15/25 (b) | 13,695,000 | 14,619,413 |
| Century Aluminum Co. | ||
| 7.50%, due 4/1/28 (b) | 22,650,000 | 23,872,194 |
| Compass Minerals International, Inc. (b) | ||
| 4.875%, due 7/15/24 | 7,000,000 | 7,210,000 |
| 6.75%, due 12/1/27 | 31,535,000 | 33,978,962 |
| First Quantum Minerals Ltd. (b) | ||
| 6.875%, due 10/15/27 | 10,000,000 | 10,975,000 |
| 7.25%, due 4/1/23 | 25,027,000 | 25,496,256 |
| 7.50%, due 4/1/25 | 5,000,000 | 5,190,625 |
| Hecla Mining Co. | ||
| 7.25%, due 2/15/28 | 4,350,000 | 4,757,813 |
| IAMGOLD Corp. | ||
| 5.75%, due 10/15/28 (b) | 28,000,000 | 29,120,000 |
| Joseph T Ryerson & Son, Inc. | ||
| 8.50%, due 8/1/28 (b) | 11,700,000 | 12,927,915 |
| Principal Amount | Value | |
| Corporate Bonds (continued) | ||
| Mining (continued) | ||
| Novelis Corp. (b) | ||
| 4.75%, due 1/30/30 | $ 22,145,000 | $ 23,030,800 |
| 5.875%, due 9/30/26 | 64,580,000 | 67,369,210 |
| 280,134,963 | ||
| Miscellaneous—Manufacturing 0.8% | ||
| Amsted Industries, Inc. (b) | ||
| 4.625%, due 5/15/30 | 2,100,000 | 2,142,000 |
| 5.625%, due 7/1/27 | 23,395,000 | 24,798,700 |
| EnPro Industries, Inc. | ||
| 5.75%, due 10/15/26 | 21,784,000 | 23,036,580 |
| FXI Holdings, Inc. (b) | ||
| 7.875%, due 11/1/24 | 2,445,000 | 2,524,463 |
| 12.25%, due 11/15/26 | 22,892,000 | 26,497,490 |
| Hillenbrand, Inc. | ||
| 3.75%, due 3/1/31 | 5,395,000 | 5,347,794 |
| 5.00%, due 9/15/26 (g) | 3,000,000 | 3,322,500 |
| 5.75%, due 6/15/25 | 7,850,000 | 8,409,312 |
| 96,078,839 | ||
| Office Furnishings 0.2% | ||
| Interface, Inc. | ||
| 5.50%, due 12/1/28 (b) | 16,405,000 | 17,061,200 |
| Oil & Gas 8.5% | ||
| Apache Corp. | ||
| 4.625%, due 11/15/25 | 6,000,000 | 6,337,500 |
| 4.875%, due 11/15/27 | 13,500,000 | 14,249,250 |
| Ascent Resources Utica Holdings LLC (b) | ||
| 7.00%, due 11/1/26 | 10,000,000 | 10,125,000 |
| 9.00%, due 11/1/27 | 11,295,000 | 14,655,263 |
| California Resources Corp. | ||
| 7.125%, due 2/1/26 (b) | 10,000,000 | 10,243,200 |
| Callon Petroleum Co. | ||
| 6.125%, due 10/1/24 | 20,100,000 | 18,592,500 |
| 9.00%, due 4/1/25 (b) | 14,000,000 | 14,525,000 |
| Centennial Resource Production LLC (b) | ||
| 5.375%, due 1/15/26 | 10,445,000 | 9,779,131 |
| 6.875%, due 4/1/27 | 21,950,000 | 20,687,436 |
| Chevron USA, Inc. | ||
| 3.85%, due 1/15/28 | 5,560,000 | 6,274,500 |
| 3.90%, due 11/15/24 | 6,550,000 | 7,237,549 |
| 4.95%, due 8/15/47 | 2,850,000 | 3,626,370 |
| 5.05%, due 11/15/44 | 17,415,000 | 22,128,773 |
| 5.25%, due 11/15/43 | 6,500,000 | 8,496,357 |
| Principal Amount | Value | |
| Oil & Gas (continued) | ||
| Chevron USA, Inc. (continued) | ||
| 6.00%, due 3/1/41 | $ 3,500,000 | $ 4,932,249 |
| Colgate Energy Partners III LLC | ||
| 7.75%, due 2/15/26 (b) | 20,645,000 | 20,851,450 |
| Comstock Resources, Inc. | ||
| 6.75%, due 3/1/29 (b) | 12,430,000 | 12,697,245 |
| 9.75%, due 8/15/26 | 56,129,000 | 61,027,939 |
| Continental Resources, Inc. | ||
| 4.50%, due 4/15/23 | 4,849,000 | 5,089,122 |
| 5.75%, due 1/15/31 (b) | 5,000,000 | 5,800,000 |
| Encino Acquisition Partners Holdings LLC | ||
| 8.50%, due 5/1/28 (b) | 23,730,000 | 23,248,756 |
| Endeavor Energy Resources LP | ||
| 6.625%, due 7/15/25 (b) | 7,025,000 | 7,481,625 |
| EQT Corp. | ||
| 7.625%, due 2/1/25 (g) | 21,899,000 | 25,206,077 |
| Gulfport Energy Corp. (d)(i)(j) | ||
| 6.00%, due 10/15/24 | 50,754,000 | 50,880,885 |
| 6.375%, due 5/15/25 | 24,354,000 | 24,414,885 |
| 6.375%, due 1/15/26 | 11,915,000 | 11,915,000 |
| 6.625%, due 5/1/23 | 17,072,000 | 17,242,720 |
| Hilcorp Energy I LP (b) | ||
| 5.75%, due 2/1/29 | 4,000,000 | 4,070,000 |
| 6.00%, due 2/1/31 | 4,395,000 | 4,526,850 |
| Marathon Oil Corp. | ||
| 4.40%, due 7/15/27 | 12,265,000 | 13,682,129 |
| 6.60%, due 10/1/37 | 3,100,000 | 3,926,573 |
| 6.80%, due 3/15/32 | 5,000,000 | 6,307,890 |
| Matador Resources Co. | ||
| 5.875%, due 9/15/26 | 12,000,000 | 11,970,000 |
| Moss Creek Resources Holdings, Inc. | ||
| 7.50%, due 1/15/26 (b) | 12,465,000 | 11,062,688 |
| Murphy Oil Corp. | ||
| 6.875%, due 8/15/24 | 10,590,000 | 10,828,275 |
| Occidental Petroleum Corp. | ||
| 2.70%, due 2/15/23 | 8,054,000 | 8,074,135 |
| 2.90%, due 8/15/24 | 8,000,000 | 7,980,000 |
| 3.20%, due 8/15/26 | 12,000,000 | 11,670,000 |
| 3.40%, due 4/15/26 | 2,744,000 | 2,713,651 |
| 3.50%, due 8/15/29 | 5,000,000 | 4,775,000 |
| 5.55%, due 3/15/26 | 30,505,000 | 32,754,744 |
| 5.875%, due 9/1/25 | 6,000,000 | 6,555,000 |
| 6.125%, due 1/1/31 | 10,000,000 | 11,125,000 |
| 6.375%, due 9/1/28 | 6,635,000 | 7,431,200 |
| 6.45%, due 9/15/36 | 6,850,000 | 7,783,313 |
| 6.625%, due 9/1/30 | 13,270,000 | 15,127,800 |
| 18 | MainStay MacKay High Yield Corporate Bond Fund |
| Principal Amount | Value | |
| Corporate Bonds (continued) | ||
| Oil & Gas (continued) | ||
| Occidental Petroleum Corp. (continued) | ||
| 6.95%, due 7/1/24 | $ 13,950,000 | $ 15,432,187 |
| 7.15%, due 5/15/28 | 4,000,000 | 4,305,000 |
| Parkland Corp. (b) | ||
| 4.50%, due 10/1/29 | 14,985,000 | 15,294,440 |
| 5.875%, due 7/15/27 | 11,025,000 | 11,739,420 |
| PBF Holding Co. LLC | ||
| 6.00%, due 2/15/28 | 29,500,000 | 22,260,257 |
| 7.25%, due 6/15/25 | 22,000,000 | 18,755,000 |
| 9.25%, due 5/15/25 (b) | 23,790,000 | 24,920,025 |
| PDC Energy, Inc. | ||
| 6.125%, due 9/15/24 | 22,880,000 | 23,452,000 |
| Range Resources Corp. | ||
| 5.875%, due 7/1/22 | 9,604,000 | 9,676,030 |
| 8.25%, due 1/15/29 (b) | 3,000,000 | 3,254,310 |
| 9.25%, due 2/1/26 | 36,000,000 | 39,530,880 |
| Southwestern Energy Co. | ||
| 6.45%, due 1/23/25 (g) | 25,936,000 | 28,010,880 |
| 7.50%, due 4/1/26 | 27,545,000 | 29,134,346 |
| 7.75%, due 10/1/27 | 2,500,000 | 2,687,325 |
| 8.375%, due 9/15/28 | 5,800,000 | 6,372,576 |
| Sunoco LP | ||
| 6.00%, due 4/15/27 | 19,965,000 | 20,994,196 |
| Talos Production, Inc. | ||
| 12.00%, due 1/15/26 (b) | 81,465,000 | 81,668,662 |
| Transocean Guardian Ltd. | ||
| 5.875%, due 1/15/24 (b) | 9,501,125 | 8,836,046 |
| Transocean Pontus Ltd. | ||
| 6.125%, due 8/1/25 (b) | 2,015,500 | 1,965,113 |
| Transocean Poseidon Ltd. | ||
| 6.875%, due 2/1/27 (b) | 11,750,000 | 11,162,500 |
| Transocean Sentry Ltd. | ||
| 5.375%, due 5/15/23 (b) | 12,008,258 | 11,377,824 |
| Viper Energy Partners LP | ||
| 5.375%, due 11/1/27 (b) | 14,350,000 | 14,995,033 |
| 1,025,934,080 | ||
| Oil & Gas Services 0.5% | ||
| Bristow Group, Inc. | ||
| 6.875%, due 3/1/28 (b) | 18,800,000 | 19,058,500 |
| Nine Energy Service, Inc. | ||
| 8.75%, due 11/1/23 (b) | 25,850,000 | 10,727,750 |
| TechnipFMC plc | ||
| 6.50%, due 2/1/26 (b) | 28,615,000 | 30,548,971 |
| 60,335,221 | ||
| Principal Amount | Value | |
| Packaging & Containers 0.5% | ||
| ARD Finance SA | ||
| 6.50% (6.50% Cash or 7.25% PIK), due 6/30/27 (a)(b) | $ 19,985,000 | $ 20,909,306 |
| Cascades USA, Inc. (b) | ||
| 5.125%, due 1/15/26 | 11,306,000 | 11,984,360 |
| 5.375%, due 1/15/28 | 22,385,000 | 23,326,513 |
| Graphic Packaging International LLC | ||
| 3.50%, due 3/1/29 (b) | 5,000,000 | 4,952,500 |
| 61,172,679 | ||
| Pharmaceuticals 2.6% | ||
| Bausch Health Americas, Inc. (b) | ||
| 8.50%, due 1/31/27 | 11,915,000 | 13,270,331 |
| 9.25%, due 4/1/26 | 14,000,000 | 15,507,800 |
| Bausch Health Cos., Inc. (b) | ||
| 5.00%, due 1/30/28 | 10,315,000 | 10,469,725 |
| 5.00%, due 2/15/29 | 10,000,000 | 10,015,400 |
| 5.25%, due 1/30/30 | 8,735,000 | 8,778,675 |
| 5.25%, due 2/15/31 | 11,100,000 | 11,115,096 |
| 6.125%, due 4/15/25 | 18,000,000 | 18,378,540 |
| 6.25%, due 2/15/29 | 11,000,000 | 11,632,500 |
| 7.00%, due 1/15/28 | 7,000,000 | 7,612,500 |
| 7.25%, due 5/30/29 | 5,000,000 | 5,540,450 |
| Cheplapharm Arzneimittel GmbH | ||
| 5.50%, due 1/15/28 (b) | 5,000,000 | 5,200,000 |
| Endo DAC (b) | ||
| 6.00%, due 6/30/28 | 8,352,000 | 6,347,520 |
| 9.50%, due 7/31/27 | 6,255,000 | 6,630,300 |
| Jazz Securities DAC | ||
| 4.375%, due 1/15/29 (b) | 30,000,000 | 30,675,000 |
| Organon Finance 1 LLC (b) | ||
| 4.125%, due 4/30/28 | 31,900,000 | 32,681,231 |
| 5.125%, due 4/30/31 | 25,000,000 | 25,940,000 |
| Owens & Minor, Inc. | ||
| 4.50%, due 3/31/29 (b) | 13,250,000 | 13,379,981 |
| Par Pharmaceutical, Inc. | ||
| 7.50%, due 4/1/27 (b) | 26,701,000 | 28,102,803 |
| Prestige Brands, Inc. (b) | ||
| 3.75%, due 4/1/31 | 12,915,000 | 12,397,496 |
| 5.125%, due 1/15/28 | 24,750,000 | 25,925,625 |
| Vizient, Inc. | ||
| 6.25%, due 5/15/27 (b) | 12,000,000 | 12,710,880 |
| 312,311,853 | ||
| Pipelines 5.0% | ||
| ANR Pipeline Co. | ||
| 7.375%, due 2/15/24 | 2,555,000 | 2,979,200 |
| 9.625%, due 11/1/21 | 10,349,000 | 10,813,175 |
| Principal Amount | Value | |
| Corporate Bonds (continued) | ||
| Pipelines (continued) | ||
| Antero Midstream Partners LP | ||
| 5.375%, due 9/15/24 | $ 8,920,000 | $ 9,064,950 |
| 5.75%, due 1/15/28 (b) | 8,000,000 | 8,152,080 |
| Cheniere Energy Partners LP | ||
| 4.00%, due 3/1/31 (b) | 25,000,000 | 25,437,500 |
| 5.625%, due 10/1/26 | 15,530,000 | 16,190,025 |
| CNX Midstream Partners LP | ||
| 6.50%, due 3/15/26 (b) | 22,036,000 | 22,779,715 |
| Enable Midstream Partners LP | ||
| 3.90%, due 5/15/24 (g) | 3,000,000 | 3,198,289 |
| 4.15%, due 9/15/29 | 9,295,000 | 9,904,439 |
| 4.40%, due 3/15/27 | 15,475,000 | 16,937,111 |
| 4.95%, due 5/15/28 | 17,610,000 | 19,678,874 |
| EQM Midstream Partners LP (b) | ||
| 4.50%, due 1/15/29 | 7,705,000 | 7,647,212 |
| 4.75%, due 1/15/31 | 11,005,000 | 10,893,739 |
| 6.00%, due 7/1/25 | 12,250,000 | 13,383,125 |
| 6.50%, due 7/1/27 | 8,900,000 | 9,827,683 |
| Genesis Energy LP | ||
| 6.25%, due 5/15/26 | 8,635,000 | 8,455,824 |
| 7.75%, due 2/1/28 | 9,890,000 | 9,988,900 |
| 8.00%, due 1/15/27 | 7,750,000 | 7,984,205 |
| Harvest Midstream I LP | ||
| 7.50%, due 9/1/28 (b) | 22,840,000 | 24,610,100 |
| Hess Midstream Operations LP | ||
| 5.625%, due 2/15/26 (b) | 1,000,000 | 1,037,500 |
| Holly Energy Partners LP | ||
| 5.00%, due 2/1/28 (b) | 9,870,000 | 10,190,775 |
| MPLX LP | ||
| 4.875%, due 12/1/24 | 15,000,000 | 16,816,508 |
| New Fortress Energy, Inc. | ||
| 6.50%, due 9/30/26 (b) | 12,705,000 | 12,963,293 |
| NGL Energy Operating LLC | ||
| 7.50%, due 2/1/26 (b) | 8,260,000 | 8,652,350 |
| NGPL PipeCo LLC (b) | ||
| 4.875%, due 8/15/27 | 16,630,000 | 18,709,462 |
| 7.768%, due 12/15/37 | 10,630,000 | 14,282,443 |
| NuStar Logistics LP | ||
| 5.75%, due 10/1/25 | 3,000,000 | 3,228,750 |
| 6.00%, due 6/1/26 | 15,000,000 | 16,256,250 |
| Oasis Midstream Partners LP | ||
| 8.00%, due 4/1/29 (b) | 8,600,000 | 8,801,756 |
| PBF Logistics LP | ||
| 6.875%, due 5/15/23 | 6,050,000 | 6,042,438 |
| Plains All American Pipeline LP | ||
| Series B | ||
| 6.125%, due 11/15/22 (l)(m) | 44,328,000 | 36,792,240 |
| Principal Amount | Value | |
| Pipelines (continued) | ||
| Rockies Express Pipeline LLC (b) | ||
| 3.60%, due 5/15/25 | $ 7,000,000 | $ 6,956,110 |
| 4.80%, due 5/15/30 | 15,220,000 | 14,934,625 |
| Ruby Pipeline LLC | ||
| 8.00%, due 4/1/22 (b)(g) | 47,525,333 | 40,628,054 |
| Tallgrass Energy Partners LP (b) | ||
| 5.50%, due 9/15/24 | 15,667,000 | 15,960,756 |
| 6.00%, due 3/1/27 | 19,000,000 | 19,279,300 |
| 7.50%, due 10/1/25 | 8,500,000 | 9,286,250 |
| Targa Resources Partners LP | ||
| 5.00%, due 1/15/28 | 6,320,000 | 6,653,696 |
| 5.875%, due 4/15/26 | 7,590,000 | 7,950,525 |
| 6.50%, due 7/15/27 | 10,116,000 | 11,001,150 |
| TransMontaigne Partners LP | ||
| 6.125%, due 2/15/26 | 20,835,000 | 20,939,175 |
| Western Midstream Operating LP | ||
| 3.95%, due 6/1/25 | 3,715,000 | 3,875,209 |
| 4.35%, due 2/1/25 (g) | 33,100,000 | 34,991,996 |
| 4.65%, due 7/1/26 | 5,000,000 | 5,353,125 |
| 4.75%, due 8/15/28 | 12,000,000 | 12,894,960 |
| 6.50%, due 2/1/50 (g) | 3,000,000 | 3,394,470 |
| 605,799,312 | ||
| Real Estate 0.7% | ||
| Howard Hughes Corp. (The) (b) | ||
| 4.125%, due 2/1/29 | 10,000,000 | 9,900,000 |
| 4.375%, due 2/1/31 | 9,155,000 | 9,063,450 |
| Newmark Group, Inc. | ||
| 6.125%, due 11/15/23 | 43,914,000 | 47,870,753 |
| Realogy Group LLC | ||
| 9.375%, due 4/1/27 (b) | 16,000,000 | 17,880,000 |
| 84,714,203 | ||
| Real Estate Investment Trusts 3.6% | ||
| CTR Partnership LP | ||
| 5.25%, due 6/1/25 | 5,000,000 | 5,148,000 |
| Equinix, Inc. | ||
| 5.375%, due 5/15/27 | 55,635,000 | 59,778,695 |
| GLP Capital LP | ||
| 4.00%, due 1/15/31 | 3,400,000 | 3,585,504 |
| 5.25%, due 6/1/25 | 10,000,000 | 11,289,400 |
| 5.30%, due 1/15/29 | 14,080,000 | 16,001,216 |
| 5.375%, due 11/1/23 | 6,000,000 | 6,591,600 |
| 5.375%, due 4/15/26 | 5,620,000 | 6,357,525 |
| 5.75%, due 6/1/28 | 7,700,000 | 8,964,444 |
| Host Hotels & Resorts LP | ||
| Series I | ||
| 3.50%, due 9/15/30 | 15,400,000 | 15,879,864 |
| 20 | MainStay MacKay High Yield Corporate Bond Fund |
| Principal Amount | Value | |
| Corporate Bonds (continued) | ||
| Real Estate Investment Trusts (continued) | ||
| MGM Growth Properties Operating Partnership LP | ||
| 3.875%, due 2/15/29 (b) | $ 43,460,000 | $ 44,000,208 |
| 4.625%, due 6/15/25 (b) | 21,650,000 | 23,033,110 |
| 5.625%, due 5/1/24 | 63,960,000 | 68,962,951 |
| 5.75%, due 2/1/27 | 25,800,000 | 28,775,127 |
| MPT Operating Partnership LP | ||
| 3.50%, due 3/15/31 | 15,000,000 | 14,965,800 |
| 4.625%, due 8/1/29 | 11,640,000 | 12,323,850 |
| 5.00%, due 10/15/27 | 27,425,000 | 28,864,813 |
| 5.25%, due 8/1/26 | 5,500,000 | 5,671,875 |
| RHP Hotel Properties LP | ||
| 4.50%, due 2/15/29 (b) | 10,000,000 | 9,896,800 |
| 4.75%, due 10/15/27 | 26,050,000 | 26,808,576 |
| SBA Communications Corp. | ||
| 3.125%, due 2/1/29 (b) | 9,000,000 | 8,621,749 |
| 3.875%, due 2/15/27 | 10,000,000 | 10,226,750 |
| VICI Properties LP (b) | ||
| 3.75%, due 2/15/27 | 12,987,000 | 13,091,286 |
| 4.125%, due 8/15/30 | 7,080,000 | 7,190,660 |
| 436,029,803 | ||
| Retail 3.3% | ||
| 1011778 B.C. Unlimited Liability Co. (b) | ||
| 3.50%, due 2/15/29 | 3,655,000 | 3,563,625 |
| 4.00%, due 10/15/30 | 36,450,000 | 35,538,750 |
| Asbury Automotive Group, Inc. | ||
| 4.50%, due 3/1/28 | 22,302,000 | 22,971,060 |
| 4.75%, due 3/1/30 | 14,400,000 | 15,048,000 |
| Beacon Roofing Supply, Inc. | ||
| 4.875%, due 11/1/25 (b) | 17,935,000 | 18,346,249 |
| Dave & Buster's, Inc. | ||
| 7.625%, due 11/1/25 (b) | 4,000,000 | 4,321,470 |
| Group 1 Automotive, Inc. | ||
| 4.00%, due 8/15/28 (b) | 10,000,000 | 9,987,500 |
| Ken Garff Automotive LLC | ||
| 4.875%, due 9/15/28 (b) | 23,200,000 | 23,403,000 |
| KFC Holding Co. (b) | ||
| 4.75%, due 6/1/27 | 12,287,000 | 12,916,709 |
| 5.25%, due 6/1/26 | 30,686,000 | 31,545,515 |
| LCM Investments Holdings II LLC | ||
| 4.875%, due 5/1/29 (b) | 10,000,000 | 10,229,200 |
| Lithia Motors, Inc. | ||
| 4.375%, due 1/15/31 (b) | 5,000,000 | 5,262,500 |
| Murphy Oil USA, Inc. | ||
| 3.75%, due 2/15/31 (b) | 3,000,000 | 2,955,000 |
| Principal Amount | Value | |
| Retail (continued) | ||
| Murphy Oil USA, Inc. (continued) | ||
| 4.75%, due 9/15/29 | $ 7,500,000 | $ 7,875,000 |
| 5.625%, due 5/1/27 | 10,417,000 | 10,915,766 |
| NMG Holding Co., Inc. | ||
| 7.125%, due 4/1/26 (b) | 49,035,000 | 50,156,921 |
| Penske Automotive Group, Inc. | ||
| 3.50%, due 9/1/25 | 10,000,000 | 10,250,000 |
| 5.50%, due 5/15/26 | 15,855,000 | 16,370,287 |
| Ultra Resources, Inc. Escrow Claim Shares | ||
| 6.875%, due 4/15/22 (c)(d)(e)(j) | 28,880,000 | — |
| Yum! Brands, Inc. | ||
| 3.625%, due 3/15/31 | 34,370,000 | 33,923,534 |
| 4.625%, due 1/31/32 | 35,000,000 | 36,582,000 |
| 4.75%, due 1/15/30 (b) | 30,090,000 | 32,196,300 |
| 7.75%, due 4/1/25 (b) | 4,500,000 | 4,916,250 |
| 399,274,636 | ||
| Semiconductors 0.1% | ||
| Microchip Technology, Inc. | ||
| 4.25%, due 9/1/25 (b) | 6,000,000 | 6,301,062 |
| Software 3.8% | ||
| ACI Worldwide, Inc. | ||
| 5.75%, due 8/15/26 (b) | 7,500,000 | 7,884,375 |
| Ascend Learning LLC | ||
| 6.875%, due 8/1/25 (b) | 27,000,000 | 27,675,000 |
| BY Crown Parent LLC (b) | ||
| 4.25%, due 1/31/26 | 13,200,000 | 13,827,000 |
| 7.375%, due 10/15/24 | 30,140,000 | 30,766,912 |
| Camelot Finance SA | ||
| 4.50%, due 11/1/26 (b) | 15,990,000 | 16,549,650 |
| CDK Global, Inc. | ||
| 4.875%, due 6/1/27 | 8,570,000 | 9,062,689 |
| 5.25%, due 5/15/29 (b) | 7,000,000 | 7,507,500 |
| Change Healthcare Holdings LLC | ||
| 5.75%, due 3/1/25 (b) | 13,500,000 | 13,719,375 |
| Fair Isaac Corp. (b) | ||
| 4.00%, due 6/15/28 | 1,500,000 | 1,520,625 |
| 5.25%, due 5/15/26 | 12,250,000 | 13,597,500 |
| MSCI, Inc. (b) | ||
| 3.625%, due 9/1/30 | 32,125,000 | 32,636,751 |
| 3.625%, due 11/1/31 | 34,000,000 | 34,000,000 |
| 3.875%, due 2/15/31 | 44,255,000 | 45,351,196 |
| 4.00%, due 11/15/29 | 34,330,000 | 35,874,850 |
| 5.375%, due 5/15/27 | 23,885,000 | 25,534,259 |
| Open Text Corp. (b) | ||
| 3.875%, due 2/15/28 | 17,385,000 | 17,602,313 |
| Principal Amount | Value | |
| Corporate Bonds (continued) | ||
| Software (continued) | ||
| Open Text Corp. (b) (continued) | ||
| 5.875%, due 6/1/26 | $ 30,090,000 | $ 31,030,313 |
| Open Text Holdings, Inc. | ||
| 4.125%, due 2/15/30 (b) | 24,827,000 | 25,105,807 |
| PTC, Inc. (b) | ||
| 3.625%, due 2/15/25 | 11,000,000 | 11,285,450 |
| 4.00%, due 2/15/28 | 22,759,000 | 23,361,431 |
| SS&C Technologies, Inc. | ||
| 5.50%, due 9/30/27 (b) | 22,095,000 | 23,473,176 |
| Veritas US, Inc. | ||
| 7.50%, due 9/1/25 (b) | 10,000,000 | 10,350,000 |
| 457,716,172 | ||
| Telecommunications 5.3% | ||
| Altice France SA | ||
| 7.375%, due 5/1/26 (b) | 28,300,000 | 29,341,440 |
| CommScope Technologies LLC | ||
| 6.00%, due 6/15/25 (b) | 4,779,000 | 4,862,633 |
| CommScope, Inc. (b) | ||
| 7.125%, due 7/1/28 | 7,250,000 | 7,839,063 |
| 8.25%, due 3/1/27 | 27,815,000 | 29,796,819 |
| Connect Finco SARL | ||
| 6.75%, due 10/1/26 (b) | 54,590,000 | 57,005,607 |
| Hughes Satellite Systems Corp. | ||
| 5.25%, due 8/1/26 | 18,000,000 | 19,818,000 |
| 6.625%, due 8/1/26 | 19,275,000 | 21,298,875 |
| Level 3 Financing, Inc. | ||
| 5.375%, due 5/1/25 | 31,477,000 | 32,169,494 |
| Lumen Technologies, Inc. | ||
| Series T | ||
| 5.80%, due 3/15/22 | 28,940,000 | 29,851,610 |
| Series S | ||
| 6.45%, due 6/15/21 | 10,000,000 | 10,050,000 |
| QualityTech LP | ||
| 3.875%, due 10/1/28 (b) | 20,000,000 | 20,175,000 |
| Sprint Capital Corp. | ||
| 6.875%, due 11/15/28 | 104,520,000 | 131,698,043 |
| Sprint Corp. | ||
| 7.25%, due 9/15/21 | 4,185,000 | 4,273,722 |
| 7.875%, due 9/15/23 | 46,900,000 | 53,466,000 |
| Switch Ltd. | ||
| 3.75%, due 9/15/28 (b) | 18,195,000 | 18,104,025 |
| T-Mobile US, Inc. | ||
| 2.625%, due 2/15/29 | 9,000,000 | 8,767,125 |
| 2.875%, due 2/15/31 | 33,390,000 | 32,596,987 |
| 4.00%, due 4/15/22 | 3,000,000 | 3,067,500 |
| 4.50%, due 4/15/50 (b) | 15,000,000 | 16,917,150 |
| Principal Amount | Value | |
| Telecommunications (continued) | ||
| T-Mobile US, Inc. (continued) | ||
| 4.75%, due 2/1/28 | $ 31,435,000 | $ 33,596,156 |
| 5.125%, due 4/15/25 | 28,045,000 | 28,527,374 |
| 5.375%, due 4/15/27 | 33,000,000 | 34,938,750 |
| 6.00%, due 4/15/24 | 15,315,000 | 15,410,719 |
| 643,572,092 | ||
| Textiles 0.2% | ||
| Eagle Intermediate Global Holding BV | ||
| 7.50%, due 5/1/25 (b) | 26,759,000 | 24,283,793 |
| Toys, Games & Hobbies 0.5% | ||
| Mattel, Inc. (b) | ||
| 3.375%, due 4/1/26 | 8,000,000 | 8,281,760 |
| 3.75%, due 4/1/29 | 11,395,000 | 11,677,824 |
| 5.875%, due 12/15/27 | 19,775,000 | 21,727,781 |
| 6.75%, due 12/31/25 | 13,000,000 | 13,656,500 |
| 55,343,865 | ||
| Transportation 0.4% | ||
| Teekay Corp. | ||
| 9.25%, due 11/15/22 (b) | 6,000,000 | 6,120,000 |
| Watco Cos. LLC | ||
| 6.50%, due 6/15/27 (b) | 42,800,000 | 45,582,000 |
| 51,702,000 | ||
| Trucking & Leasing 0.0% ‡ | ||
| Fortress Transportation and Infrastructure Investors LLC | ||
| 6.75%, due 3/15/22 (b) | 4,596,000 | 4,597,884 |
| Total Corporate Bonds (Cost $10,201,123,646) | 10,814,336,804 | |
| Loan Assignments 2.6% | ||
| Automobile 0.2% | ||
| Dealer Tire LLC Term Loan B1 | ||
| 4.363% (1 Month LIBOR + 4.25%), due 1/1/38 (n) | 17,266,326 | 17,250,130 |
| Beverage, Food & Tobacco 0.1% | ||
| United Natural Foods, Inc. | ||
| Initial Term Loan | ||
| 3.613% (1 Month LIBOR + 3.50%), due 10/22/25 (n) | 16,027,634 | 16,010,677 |
| 22 | MainStay MacKay High Yield Corporate Bond Fund |
| Principal Amount | Value | |
| Loan Assignments (continued) | ||
| Containers, Packaging & Glass 0.1% | ||
| Neenah Foundry Co. Term Loan | ||
| 10.00% (2 Month LIBOR + 9.00%), due 12/13/22 (n) | $ 8,266,424 | $ 7,026,461 |
| Electronics 0.1% | ||
| Camelot U.S. Acquisition 1 Co. (n) | ||
| Initial Term Loan | ||
| 3.113% (1 Month LIBOR + 3.00%), due 10/30/26 | 4,907,026 | 4,857,956 |
| Amendment No. 2 Incremental Term Loan | ||
| 4.00% (1 Month LIBOR + 3.00%), due 10/30/26 | 4,987,500 | 4,988,747 |
| 9,846,703 | ||
| Finance 0.9% | ||
| BY Crown Parent LLC Initial Term Loan B1 | ||
| 4.00% (1 Month LIBOR + 3.00%), due 2/2/26 (n) | 14,806,199 | 14,787,691 |
| Great Outdoors Group LLC | ||
| Term Loan B1 | ||
| 5.00% (3 Month LIBOR + 4.25%), due 3/6/28 (n) | 79,800,000 | 80,079,300 |
| Jefferies Finance LLC Closing Date Term Loan | ||
| 3.125% (1 Month LIBOR + 3.00%), due 6/3/26 (n) | 9,825,000 | 9,726,750 |
| 104,593,741 | ||
| Healthcare, Education & Childcare 0.3% | ||
| AHP Health Partners, Inc. | ||
| Term Loan B1 | ||
| 4.75% (1 Month LIBOR + 3.75%), due 6/30/25 (n) | 10,000,000 | 10,006,250 |
| Ascend Learning LLC Initial Term Loan | ||
| 4.00% (1 Month LIBOR + 3.00%), due 7/12/24 (n) | 5,880,665 | 5,867,016 |
| LifePoint Health, Inc. | ||
| First Lien Term Loan B | ||
| 3.863% (1 Month LIBOR + 3.75%), due 11/16/25 (n) | 8,653,924 | 8,620,390 |
| Organon & Co. | ||
| Term Loan | ||
| TBD, due 4/8/28 | 11,000,000 | 10,966,604 |
| 35,460,260 | ||
| Principal Amount | Value | |
| Insurance 0.1% | ||
| USI, Inc. | ||
| 2017 New Term Loan | ||
| 3.203% (3 Month LIBOR + 3.00%), due 5/16/24 (n) | $ 14,483,688 | $ 14,315,576 |
| Leisure, Amusement, Motion Pictures & Entertainment 0.0% ‡ | ||
| NASCAR Holdings LLC Initial Term Loan | ||
| 2.859% (1 Month LIBOR + 2.75%), due 10/19/26 (n) | 4,874,043 | 4,828,348 |
| Manufacturing 0.1% | ||
| Adient US LLC Term Loan B1 | ||
| 3.50% (1 Month LIBOR + 3.50%), due 4/10/28 (n) | 16,000,000 | 15,980,000 |
| Media 0.1% | ||
| Allen Media LLC Initial Term Loan | ||
| 5.703% (3 Month LIBOR + 5.50%), due 2/10/27 (n) | 9,898,423 | 9,881,923 |
| Oil & Gas 0.2% | ||
| Ascent Resources Utica Holdings LLC Second Lien Term Loan | ||
| 10.00% (3 Month LIBOR + 9.00%), due 11/1/25 (n) | 9,011,000 | 9,951,523 |
| PetroQuest Energy LLC 2020 Term Loan | ||
| TBD, due 9/19/26 (c)(d)(e) | 1,879,718 | 1,879,718 |
| PetroQuest Energy LLC Term Loan | ||
| 8.50% (1 Month LIBOR + 7.50%), due 11/8/23 (c)(d)(e)(n) | 18,430,144 | 15,112,718 |
| 26,943,959 | ||
| Utilities 0.4% | ||
| PG&E Corp. | ||
| Term Loan | ||
| 3.50% (3 Month LIBOR + 3.00%), due 6/23/25 (n) | 53,595,000 | 53,360,522 |
| Total Loan Assignments (Cost $316,251,708) | 315,498,300 | |
| Total Long-Term Bonds (Cost $10,634,179,556) | 11,255,583,361 | |
| Shares | Value | |
| Common Stocks 1.2% | ||
| Commercial Services & Supplies 0.0% ‡ | ||
| ATD New Holdings, Inc. (c)(d)(o) | 142,545 | $ 4,989,075 |
| Electric Utilities 0.0% ‡ | ||
| Keycon Power Holdings LLC (c)(d)(e)(o) | 38,680 | 387 |
| Electrical Equipment 0.3% | ||
| Energy Technologies, Inc. (c)(d)(e)(o) | 16,724 | 31,775,600 |
| Hotels, Restaurants & Leisure 0.0% ‡ | ||
| Carlson Travel, Inc. (c)(e)(k)(o) | 25,452 | 1,414,113 |
| Independent Power and Renewable Electricity Producers 0.4% | ||
| GenOn Energy, Inc. (c)(k) | 386,241 | 47,314,522 |
| Metals & Mining 0.1% | ||
| Franco-Nevada Corp. | 55,000 | 7,658,200 |
| Neenah Enterprises, Inc. (c)(d)(e)(k)(o) | 720,961 | 7,584,510 |
| 15,242,710 | ||
| Oil, Gas & Consumable Fuels 0.4% | ||
| California Resources Corp. (o) | 250,191 | 5,929,527 |
| PetroQuest Energy, Inc. (c)(d)(e)(o) | 28,470,874 | — |
| Talos Energy, Inc. (o) | 2,074,193 | 23,210,220 |
| Titan Energy LLC (o) | 91,174 | 5,447 |
| Whiting Petroleum Corp. (o) | 371,340 | 14,879,594 |
| 44,024,788 | ||
| Software 0.0% ‡ | ||
| ASG warrant Corp. (c)(d)(e)(o) | 12,502 | — |
| Total Common Stocks (Cost $183,101,293) | 144,761,195 | |
| Preferred Stock 0.2% | ||
| Electrical Equipment 0.2% | ||
| Energy Technologies Ltd. (c)(d)(e)(o) | 37,258 | 29,433,820 |
| Total Preferred Stock (Cost $35,514,837) | 29,433,820 | |
| Exchange-Traded Funds 0.6% | ||
| iShares Gold Trust (o) | 1,859,000 | 31,324,150 |
| Shares | Value | ||
| iShares iBoxx High Yield Corporate Bond ETF | 65,000 | $ 5,683,600 | |
| SPDR Gold Shares (o) | 157,836 | 26,147,111 | |
| Vanguard Value ETF | 36,762 | 4,998,897 | |
| Total Exchange-Traded Funds (Cost $54,691,345) | 68,153,758 | ||
| Number of Warrants | |||
| Warrant 0.0% ‡ | |||
| Oil, Gas & Consumable Fuels 0.0% ‡ | |||
| California Resources Corp. | |||
| Expires 10/27/24 (o) | 38,941 | 155,764 | |
| Total Warrant (Cost $15,576) | 155,764 | ||
| Total Investments (Cost $10,907,502,607) | 95.3% | 11,498,087,898 | |
| Other Assets, Less Liabilities | 4.7 | 565,085,719 | |
| Net Assets | 100.0% | $ 12,063,173,617 | |
| † | Percentages indicated are based on Fund net assets. |
| ‡ | Less than one-tenth of a percent. |
| (a) | PIK ("Payment-in-Kind")—issuer may pay interest or dividends with additional securities and/or in cash. |
| (b) | May be sold to institutional investors only under Rule 144A or securities offered pursuant to Section 4(a)(2) of the Securities Act of 1933, as amended. |
| (c) | Fair valued security—Represents fair value as measured in good faith under procedures approved by the Board of Trustees. As of April 30, 2021, the total market value was $173,550,023, which represented 1.4% of the Fund’s net assets. |
| (d) | Illiquid security—As of April 30, 2021, the total market value deemed illiquid under procedures approved by the Board of Trustees was $238,338,185, which represented 2.0% of the Fund’s net assets. |
| (e) | Security in which significant unobservable inputs (Level 3) were used in determining fair value. |
| (f) | Delayed delivery security. |
| (g) | Step coupon—Rate shown was the rate in effect as of April 30, 2021. |
| (h) | Coupon rate may change based on changes of the underlying collateral or prepayments of principal. Rate shown was the rate in effect as of April 30, 2021. |
| (i) | Issue in default. |
| (j) | Issue in non-accrual status. |
| (k) | Restricted security. (See Note 6) |
| (l) | Fixed to floating rate—Rate shown was the rate in effect as of April 30, 2021. |
| (m) | Security is perpetual and, thus, does not have a predetermined maturity date. The date shown, if applicable, reflects the next call date. |
| 24 | MainStay MacKay High Yield Corporate Bond Fund |
| (n) | Floating rate—Rate shown was the rate in effect as of April 30, 2021. |
| (o) | Non-income producing security. |
| Abbreviation(s): |
| ETF—Exchange-Traded Fund |
| LIBOR—London Interbank Offered Rate |
| SPDR—Standard & Poor’s Depositary Receipt |
| TBD—To Be Determined |
| Description | Quoted Prices in Active Markets for Identical Assets (Level 1) | Significant Other Observable Inputs (Level 2) | Significant Unobservable Inputs (Level 3) | Total | |||
| Asset Valuation Inputs | |||||||
| Investments in Securities (a) | |||||||
| Long-Term Bonds | |||||||
| Convertible Bonds | $ — | $ 125,748,257 | $ — | $ 125,748,257 | |||
| Corporate Bonds | — | 10,780,291,244 | 34,045,560 | 10,814,336,804 | |||
| Loan Assignments | — | 298,505,864 | 16,992,436 | 315,498,300 | |||
| Total Long-Term Bonds | — | 11,204,545,365 | 51,037,996 | 11,255,583,361 | |||
| Common Stocks | 51,682,988 | 52,303,597 | 40,774,610 | 144,761,195 | |||
| Preferred Stock | — | — | 29,433,820 | 29,433,820 | |||
| Exchange-Traded Funds | 68,153,758 | — | — | 68,153,758 | |||
| Warrant | 155,764 | — | — | 155,764 | |||
| Total Investments in Securities | $ 119,992,510 | $ 11,256,848,962 | $ 121,246,426 | $ 11,498,087,898 |
| (a) | For a complete listing of investments and their industries, see the Portfolio of Investments. |
| Investments in Securities | Balance as of October 31, 2020 | Accrued Discounts (Premiums) | Realized Gain (Loss) | Change in Unrealized Appreciation (Depreciation) | Purchases | Sales | Transfers in to Level 3 | Transfers out of Level 3 | Balance as of April 30, 2021 | Change in Unrealized Appreciation (Depreciation) from Investments Still Held as of April 30, 2021 | |||||||||
| Long-Term Bonds | |||||||||||||||||||
| Corporate Bonds | $ 32,017,390 | $22,859 | $(37,348,307) | $39,353,618 | $ — | $ — | $ — | $ — | $ 34,045,560 | $ 1,829,005 | |||||||||
| Loan Assignments | 21,944,560 | — | — | (162,884) | 971,880 | — | 1,812,750 | (7,573,870) | 16,992,436 | (162,884) | |||||||||
| Common Stocks | 80,034,187 | — | 2,091,567 | 22,442,054 | 110,500 | (2,105,138) | — | (61,798,560) | 40,774,610 | 24,239,786 | |||||||||
| Preferred Stock | 33,565,732 | — | — | (4,131,912) | — | — | — | — | 29,433,820 | (4,131,912) | |||||||||
| Total | $167,561,869 | $22,859 | $(35,256,740) | $57,500,876 | $1,082,380 | $(2,105,138) | $1,812,750 | $(69,372,430) | $121,246,426 | $21,773,995 |
| Assets | |
| Investment in securities, at value (identified cost $10,907,502,607) | $11,498,087,898 |
| Cash | 491,310,960 |
| Receivables: | |
| Interest | 163,241,831 |
| Investment securities sold | 19,288,113 |
| Fund shares sold | 18,450,618 |
| Other assets | 336,480 |
| Total assets | 12,190,715,900 |
| Liabilities | |
| Payables: | |
| Investment securities purchased | 97,059,164 |
| Fund shares redeemed | 17,871,888 |
| Manager (See Note 3) | 5,468,143 |
| Transfer agent (See Note 3) | 1,747,175 |
| NYLIFE Distributors (See Note 3) | 1,075,835 |
| Shareholder communication | 502,223 |
| Professional fees | 197,837 |
| Custodian | 30,585 |
| Accrued expenses | 22,383 |
| Distributions payable | 3,567,050 |
| Total liabilities | 127,542,283 |
| Net assets | $12,063,173,617 |
| Composition of Net Assets | |
| Shares of beneficial interest outstanding (par value of $.01 per share) unlimited number of shares authorized | $ 21,368,082 |
| Additional paid-in-capital | 11,886,326,079 |
| 11,907,694,161 | |
| Total distributable earnings (loss) | 155,479,456 |
| Net assets | $12,063,173,617 |
| Class A | |
| Net assets applicable to outstanding shares | $4,014,422,878 |
| Shares of beneficial interest outstanding | 710,692,378 |
| Net asset value per share outstanding | $ 5.65 |
| Maximum sales charge (4.50% of offering price) | 0.27 |
| Maximum offering price per share outstanding | $ 5.92 |
| Investor Class | |
| Net assets applicable to outstanding shares | $ 149,708,317 |
| Shares of beneficial interest outstanding | 26,310,135 |
| Net asset value per share outstanding | $ 5.69 |
| Maximum sales charge (4.00% of offering price) | 0.24 |
| Maximum offering price per share outstanding | $ 5.93 |
| Class B | |
| Net assets applicable to outstanding shares | $ 32,553,434 |
| Shares of beneficial interest outstanding | 5,789,864 |
| Net asset value and offering price per share outstanding | $ 5.62 |
| Class C | |
| Net assets applicable to outstanding shares | $ 233,712,967 |
| Shares of beneficial interest outstanding | 41,545,302 |
| Net asset value and offering price per share outstanding | $ 5.63 |
| Class I | |
| Net assets applicable to outstanding shares | $3,978,845,109 |
| Shares of beneficial interest outstanding | 704,255,458 |
| Net asset value and offering price per share outstanding | $ 5.65 |
| Class R1 | |
| Net assets applicable to outstanding shares | $ 60,373 |
| Shares of beneficial interest outstanding | 10,706 |
| Net asset value and offering price per share outstanding | $ 5.64 |
| Class R2 | |
| Net assets applicable to outstanding shares | $ 11,185,737 |
| Shares of beneficial interest outstanding | 1,979,674 |
| Net asset value and offering price per share outstanding | $ 5.65 |
| Class R3 | |
| Net assets applicable to outstanding shares | $ 3,135,816 |
| Shares of beneficial interest outstanding | 555,762 |
| Net asset value and offering price per share outstanding | $ 5.64 |
| Class R6 | |
| Net assets applicable to outstanding shares | $3,639,522,457 |
| Shares of beneficial interest outstanding | 645,664,235 |
| Net asset value and offering price per share outstanding | $ 5.64 |
| SIMPLE Class | |
| Net assets applicable to outstanding shares | $ 26,529 |
| Shares of beneficial interest outstanding | 4,662 |
| Net asset value and offering price per share outstanding | $ 5.69 |
| 26 | MainStay MacKay High Yield Corporate Bond Fund |
| Investment Income (Loss) | |
| Income | |
| Interest | $326,097,076 |
| Dividends (net of foreign tax withholding of $2,246) | 16,628,181 |
| Securities lending | 112 |
| Other | 266,604 |
| Total income | 342,991,973 |
| Expenses | |
| Manager (See Note 3) | 33,067,048 |
| Distribution/Service—Class A (See Note 3) | 4,804,354 |
| Distribution/Service—Investor Class (See Note 3) | 186,725 |
| Distribution/Service—Class B (See Note 3) | 193,543 |
| Distribution/Service—Class C (See Note 3) | 1,419,759 |
| Distribution/Service—Class R2 (See Note 3) | 13,366 |
| Distribution/Service—Class R3 (See Note 3) | 6,528 |
| Distribution/Service—SIMPLE Class (See Note 3) | 65 |
| Transfer agent (See Note 3) | 5,797,738 |
| Shareholder communication | 826,705 |
| Professional fees | 389,157 |
| Registration | 262,672 |
| Trustees | 131,974 |
| Custodian | 49,277 |
| Insurance | 38,902 |
| Shareholder service (See Note 3) | 6,680 |
| Miscellaneous | 162,491 |
| Total expenses | 47,356,984 |
| Net investment income (loss) | 295,634,989 |
| Realized and Unrealized Gain (Loss) | |
| Net realized gain (loss) on investments | 87,333,992 |
| Net change in unrealized appreciation (depreciation) on investments | 472,172,921 |
| Net realized and unrealized gain (loss) | 559,506,913 |
| Net increase (decrease) in net assets resulting from operations | $855,141,902 |
for the six months ended April 30, 2021 (Unaudited) and the year ended October 31, 2020
| 2021 | 2020 | |
| Increase (Decrease) in Net Assets | ||
| Operations: | ||
| Net investment income (loss) | $ 295,634,989 | $ 581,584,037 |
| Net realized gain (loss) | 87,333,992 | (211,397,989) |
| Net change in unrealized appreciation (depreciation) | 472,172,921 | 64,514,837 |
| Net increase (decrease) in net assets resulting from operations | 855,141,902 | 434,700,885 |
| Distributions to shareholders: | ||
| Class A | (97,351,186) | (177,680,636) |
| Investor Class | (3,707,949) | (8,009,437) |
| Class B | (804,906) | (2,399,380) |
| Class C | (5,815,957) | (15,036,249) |
| Class I | (99,842,960) | (186,258,181) |
| Class R1 | (1,470) | (2,637) |
| Class R2 | (264,153) | (677,108) |
| Class R3 | (62,323) | (79,045) |
| Class R6 | (114,362,990) | (193,592,509) |
| SIMPLE Class | (607) | (205) |
| (322,214,501) | (583,735,387) | |
| Distributions to shareholders from return of capital: | ||
| Class A | — | (18,631,215) |
| Investor Class | — | (839,853) |
| Class B | — | (251,594) |
| Class C | — | (1,576,669) |
| Class I | — | (19,530,637) |
| Class R1 | — | (276) |
| Class R2 | — | (71,000) |
| Class R3 | — | (8,289) |
| Class R6 | — | (20,299,700) |
| SIMPLE Class | — | (21) |
| — | (61,209,254) | |
| Total distributions to shareholders | (322,214,501) | (644,944,641) |
| Capital share transactions: | ||
| Net proceeds from sales of shares | 2,222,881,459 | 5,414,314,356 |
| Net asset value of shares issued to shareholder in reinvestment of distributions | 300,667,416 | 598,382,398 |
| Cost of shares redeemed | (2,957,285,596) | (3,491,257,176) |
| Increase (decrease) in net assets derived from capital share transactions | (433,736,721) | 2,521,439,578 |
| Net increase (decrease) in net assets | 99,190,680 | 2,311,195,822 |
| 2021 | 2020 | |
| Net Assets | ||
| Beginning of period | $11,963,982,937 | $ 9,652,787,115 |
| End of period | $12,063,173,617 | $11,963,982,937 |
| 28 | MainStay MacKay High Yield Corporate Bond Fund |
| Six months ended April 30, 2021* | Year Ended October 31, | ||||||||||
| Class A | 2020 | 2019 | 2018 | 2017 | 2016 | ||||||
| Net asset value at beginning of period | $ 5.41 | $ 5.61 | $ 5.52 | $ 5.77 | $ 5.74 | $ 5.57 | |||||
| Net investment income (loss) (a) | 0.13 | 0.29 | 0.29 | 0.29 | 0.30 | 0.33 | |||||
| Net realized and unrealized gain (loss) on investments | 0.25 | (0.17) | 0.12 | (0.22) | 0.09 | 0.20 | |||||
| Net realized and unrealized gain (loss) on foreign currency transactions | — | — | — | — | — | 0.00‡ | |||||
| Total from investment operations | 0.38 | 0.12 | 0.41 | 0.07 | 0.39 | 0.53 | |||||
| Less distributions: | |||||||||||
| From net investment income | (0.14) | (0.29) | (0.29) | (0.29) | (0.31) | (0.34) | |||||
| Return of capital | — | (0.03) | (0.03) | (0.03) | (0.05) | (0.02) | |||||
| Total distributions | (0.14) | (0.32) | (0.32) | (0.32) | (0.36) | (0.36) | |||||
| Net asset value at end of period | $ 5.65 | $ 5.41 | $ 5.61 | $ 5.52 | $ 5.77 | $ 5.74 | |||||
| Total investment return (b) | 7.08% | 2.26% | 7.58% | 1.29% | 6.91% | 9.96% | |||||
| Ratios (to average net assets)/Supplemental Data: | |||||||||||
| Net investment income (loss) | 4.59%†† | 5.35% | 5.21% | 5.15% | 5.25% | 5.98% | |||||
| Net expenses (c) | 0.95%†† | 0.97% | 0.99% | 0.99% | 0.97% | 0.95% | |||||
| Portfolio turnover rate | 22% | 38% | 30% | 30% | 43% | 41% | |||||
| Net assets at end of period (in 000’s) | $ 4,014,423 | $ 3,525,782 | $ 3,405,587 | $ 3,290,659 | $ 3,683,113 | $ 3,551,864 | |||||
| * | Unaudited. |
| ‡ | Less than one cent per share. |
| †† | Annualized. |
| (a) | Per share data based on average shares outstanding during the period. |
| (b) | Total investment return is calculated exclusive of sales charges and assumes the reinvestment of dividends and distributions. For periods of less than one year, total return is not annualized. |
| (c) | In addition to the fees and expenses which the Fund bears directly, it also indirectly bears a pro-rata share of the fees and expenses of the underlying funds in which it invests. Such indirect expenses are not included in the above expense ratios. |
| Six months ended April 30, 2021* | Year Ended October 31, | ||||||||||
| Investor Class | 2020 | 2019 | 2018 | 2017 | 2016 | ||||||
| Net asset value at beginning of period | $ 5.45 | $ 5.65 | $ 5.57 | $ 5.82 | $ 5.79 | $ 5.62 | |||||
| Net investment income (loss) (a) | 0.13 | 0.29 | 0.29 | 0.29 | 0.30 | 0.33 | |||||
| Net realized and unrealized gain (loss) on investments | 0.25 | (0.17) | 0.11 | (0.22) | 0.09 | 0.20 | |||||
| Net realized and unrealized gain (loss) on foreign currency transactions | — | — | — | — | — | 0.00‡ | |||||
| Total from investment operations | 0.38 | 0.12 | 0.40 | 0.07 | 0.39 | 0.53 | |||||
| Less distributions: | |||||||||||
| From net investment income | (0.14) | (0.29) | (0.29) | (0.29) | (0.31) | (0.34) | |||||
| Return of capital | — | (0.03) | (0.03) | (0.03) | (0.05) | (0.02) | |||||
| Total distributions | (0.14) | (0.32) | (0.32) | (0.32) | (0.36) | (0.36) | |||||
| Net asset value at end of period | $ 5.69 | $ 5.45 | $ 5.65 | $ 5.57 | $ 5.82 | $ 5.79 | |||||
| Total investment return (b) | 7.00% | 2.24% | 7.33% | 1.29% | 6.90% | 9.91% | |||||
| Ratios (to average net assets)/Supplemental Data: | |||||||||||
| Net investment income (loss) | 4.48%†† | 5.27% | 5.15% | 5.12% | 5.21% | 5.90% | |||||
| Net expenses (c) | 1.06%†† | 1.06% | 1.05% | 1.03% | 1.02% | 1.03% | |||||
| Portfolio turnover rate | 22% | 38% | 30% | 30% | 43% | 41% | |||||
| Net assets at end of period (in 000’s) | $ 149,708 | $ 149,726 | $ 162,260 | $ 159,970 | $ 167,139 | $ 287,493 | |||||
| * | Unaudited. |
| ‡ | Less than one cent per share. |
| †† | Annualized. |
| (a) | Per share data based on average shares outstanding during the period. |
| (b) | Total investment return is calculated exclusive of sales charges and assumes the reinvestment of dividends and distributions. For periods of less than one year, total return is not annualized. |
| (c) | In addition to the fees and expenses which the Fund bears directly, it also indirectly bears a pro-rata share of the fees and expenses of the underlying funds in which it invests. Such indirect expenses are not included in the above expense ratios. |
| Six months ended April 30, 2021* | Year Ended October 31, | ||||||||||
| Class B | 2020 | 2019 | 2018 | 2017 | 2016 | ||||||
| Net asset value at beginning of period | $ 5.38 | $ 5.58 | $ 5.50 | $ 5.74 | $ 5.71 | $ 5.54 | |||||
| Net investment income (loss) (a) | 0.10 | 0.25 | 0.24 | 0.25 | 0.26 | 0.28 | |||||
| Net realized and unrealized gain (loss) on investments | 0.26 | (0.18) | 0.11 | (0.21) | 0.08 | 0.20 | |||||
| Net realized and unrealized gain (loss) on foreign currency transactions | — | — | — | — | — | 0.00‡ | |||||
| Total from investment operations | 0.36 | 0.07 | 0.35 | 0.04 | 0.34 | 0.48 | |||||
| Less distributions: | |||||||||||
| From net investment income | (0.12) | (0.24) | (0.25) | (0.26) | (0.27) | (0.29) | |||||
| Return of capital | — | (0.03) | (0.02) | (0.02) | (0.04) | (0.02) | |||||
| Total distributions | (0.12) | (0.27) | (0.27) | (0.28) | (0.31) | (0.31) | |||||
| Net asset value at end of period | $ 5.62 | $ 5.38 | $ 5.58 | $ 5.50 | $ 5.74 | $ 5.71 | |||||
| Total investment return (b) | 6.67% | 1.39% | 6.52% | 0.64% | 6.06% | 8.85% | |||||
| Ratios (to average net assets)/Supplemental Data: | |||||||||||
| Net investment income (loss) | 3.74%†† | 4.55% | 4.41% | 4.37% | 4.47% | 5.16% | |||||
| Net expenses (c) | 1.81%†† | 1.81% | 1.80% | 1.78% | 1.77% | 1.78% | |||||
| Portfolio turnover rate | 22% | 38% | 30% | 30% | 43% | 41% | |||||
| Net assets at end of period (in 000’s) | $ 32,553 | $ 45,661 | $ 63,517 | $ 81,221 | $ 108,263 | $ 132,509 | |||||
| * | Unaudited. |
| ‡ | Less than one cent per share. |
| †† | Annualized. |
| (a) | Per share data based on average shares outstanding during the period. |
| (b) | Total investment return is calculated exclusive of sales charges and assumes the reinvestment of dividends and distributions. For periods of less than one year, total return is not annualized. |
| (c) | In addition to the fees and expenses which the Fund bears directly, it also indirectly bears a pro-rata share of the fees and expenses of the underlying funds in which it invests. Such indirect expenses are not included in the above expense ratios. |
| Six months ended April 30, 2021* | Year Ended October 31, | ||||||||||
| Class C | 2020 | 2019 | 2018 | 2017 | 2016 | ||||||
| Net asset value at beginning of period | $ 5.39 | $ 5.59 | $ 5.50 | $ 5.74 | $ 5.72 | $ 5.55 | |||||
| Net investment income (loss) (a) | 0.10 | 0.25 | 0.24 | 0.25 | 0.26 | 0.28 | |||||
| Net realized and unrealized gain (loss) on investments | 0.26 | (0.18) | 0.12 | (0.21) | 0.07 | 0.20 | |||||
| Net realized and unrealized gain (loss) on foreign currency transactions | — | — | — | — | — | 0.00‡ | |||||
| Total from investment operations | 0.36 | 0.07 | 0.36 | 0.04 | 0.33 | 0.48 | |||||
| Less distributions: | |||||||||||
| From net investment income | (0.12) | (0.24) | (0.25) | (0.26) | (0.27) | (0.29) | |||||
| Return of capital | — | (0.03) | (0.02) | (0.02) | (0.04) | (0.02) | |||||
| Total distributions | (0.12) | (0.27) | (0.27) | (0.28) | (0.31) | (0.31) | |||||
| Net asset value at end of period | $ 5.63 | $ 5.39 | $ 5.59 | $ 5.50 | $ 5.74 | $ 5.72 | |||||
| Total investment return (b) | 6.66% | 1.39% | 6.71% | 0.64% | 5.87% | 9.04% | |||||
| Ratios (to average net assets)/Supplemental Data: | |||||||||||
| Net investment income (loss) | 3.73%†† | 4.54% | 4.41% | 4.36% | 4.45% | 5.15% | |||||
| Net expenses (c) | 1.81%†† | 1.81% | 1.80% | 1.78% | 1.77% | 1.78% | |||||
| Portfolio turnover rate | 22% | 38% | 30% | 30% | 43.0% | 41% | |||||
| Net assets at end of period (in 000’s) | $ 233,713 | $ 297,431 | $ 373,760 | $ 550,819 | $ 676,463 | $ 678,364 | |||||
| * | Unaudited. |
| ‡ | Less than one cent per share. |
| †† | Annualized. |
| (a) | Per share data based on average shares outstanding during the period. |
| (b) | Total investment return is calculated exclusive of sales charges and assumes the reinvestment of dividends and distributions. For periods of less than one year, total return is not annualized. |
| (c) | In addition to the fees and expenses which the Fund bears directly, it also indirectly bears a pro-rata share of the fees and expenses of the underlying funds in which it invests. Such indirect expenses are not included in the above expense ratios. |
| 30 | MainStay MacKay High Yield Corporate Bond Fund |
| Six months ended April 30, 2021* | Year Ended October 31, | ||||||||||
| Class I | 2020 | 2019 | 2018 | 2017 | 2016 | ||||||
| Net asset value at beginning of period | $ 5.41 | $ 5.61 | $ 5.53 | $ 5.78 | $ 5.75 | $ 5.58 | |||||
| Net investment income (loss) (a) | 0.13 | 0.30 | 0.30 | 0.31 | 0.32 | 0.34 | |||||
| Net realized and unrealized gain (loss) on investments | 0.26 | (0.17) | 0.11 | (0.22) | 0.08 | 0.20 | |||||
| Net realized and unrealized gain (loss) on foreign currency transactions | — | — | — | — | — | 0.00‡ | |||||
| Total from investment operations | 0.39 | 0.13 | 0.41 | 0.09 | 0.40 | 0.54 | |||||
| Less distributions: | |||||||||||
| From net investment income | (0.15) | (0.30) | (0.30) | (0.31) | (0.32) | (0.35) | |||||
| Return of capital | — | (0.03) | (0.03) | (0.03) | (0.05) | (0.02) | |||||
| Total distributions | (0.15) | (0.33) | (0.33) | (0.34) | (0.37) | (0.37) | |||||
| Net asset value at end of period | $ 5.65 | $ 5.41 | $ 5.61 | $ 5.53 | $ 5.78 | $ 5.75 | |||||
| Total investment return (b) | 7.22% | 2.56% | 7.68% | 1.57% | 7.17% | 10.23% | |||||
| Ratios (to average net assets)/Supplemental Data: | |||||||||||
| Net investment income (loss) | 4.84%†† | 5.60% | 5.45% | 5.40% | 5.51% | 6.23% | |||||
| Net expenses (c) | 0.70%†† | 0.72% | 0.74% | 0.74% | 0.72% | 0.70% | |||||
| Portfolio turnover rate | 22% | 38% | 30% | 30% | 43% | 41% | |||||
| Net assets at end of period (in 000’s) | $ 3,978,845 | $ 3,509,954 | $ 3,451,487 | $ 3,709,306 | $ 4,067,560 | $ 5,313,266 | |||||
| * | Unaudited. |
| ‡ | Less than one cent per share. |
| †† | Annualized. |
| (a) | Per share data based on average shares outstanding during the period. |
| (b) | Total investment return is calculated exclusive of sales charges and assumes the reinvestment of dividends and distributions. Class I shares are not subject to sales charges. For periods of less than one year, total return is not annualized. |
| (c) | In addition to the fees and expenses which the Fund bears directly, it also indirectly bears a pro-rata share of the fees and expenses of the underlying funds in which it invests. Such indirect expenses are not included in the above expense ratios. |
| Six months ended April 30, 2021* | Year Ended October 31, | ||||||||||
| Class R1 | 2020 | 2019 | 2018 | 2017 | 2016 | ||||||
| Net asset value at beginning of period | $ 5.40 | $ 5.60 | $ 5.52 | $ 5.77 | $ 5.74 | $ 5.57 | |||||
| Net investment income (loss) (a) | 0.13 | 0.30 | 0.30 | 0.30 | 0.32 | 0.34 | |||||
| Net realized and unrealized gain (loss) on investments | 0.25 | (0.17) | 0.11 | (0.22) | 0.07 | 0.19 | |||||
| Net realized and unrealized gain (loss) on foreign currency transactions | — | — | — | — | — | 0.00‡ | |||||
| Total from investment operations | 0.38 | 0.13 | 0.41 | 0.08 | 0.39 | 0.53 | |||||
| Less distributions: | |||||||||||
| From net investment income | (0.14) | (0.30) | (0.30) | (0.30) | (0.31) | (0.34) | |||||
| Return of capital | — | (0.03) | (0.03) | (0.03) | (0.05) | (0.02) | |||||
| Total distributions | (0.14) | (0.33) | (0.33) | (0.33) | (0.36) | (0.36) | |||||
| Net asset value at end of period | $ 5.64 | $ 5.40 | $ 5.60 | $ 5.52 | $ 5.77 | $ 5.74 | |||||
| Total investment return (b) | 7.17% | 2.45% | 7.58% | 1.46% | 7.07% | 10.13% | |||||
| Ratios (to average net assets)/Supplemental Data: | |||||||||||
| Net investment income (loss) | 4.74%†† | 5.52% | 5.36% | 5.25% | 5.48% | 6.11% | |||||
| Net expenses (c) | 0.80%†† | 0.82% | 0.84% | 0.84% | 0.82% | 0.80% | |||||
| Portfolio turnover rate | 22% | 38% | 30% | 30% | 43% | 41% | |||||
| Net assets at end of period (in 000’s) | $ 60 | $ 51 | $ 53 | $ 72 | $ 37 | $ 59 | |||||
| * | Unaudited. |
| ‡ | Less than one cent per share. |
| †† | Annualized. |
| (a) | Per share data based on average shares outstanding during the period. |
| (b) | Total investment return is calculated exclusive of sales charges and assumes the reinvestment of dividends and distributions. Class R1 shares are not subject to sales charges. For periods of less than one year, total return is not annualized. |
| (c) | In addition to the fees and expenses which the Fund bears directly, it also indirectly bears a pro-rata share of the fees and expenses of the underlying funds in which it invests. Such indirect expenses are not included in the above expense ratios. |
| 32 | MainStay MacKay High Yield Corporate Bond Fund |
| Six months ended April 30, 2021* | Year Ended October 31, | ||||||||||
| Class R2 | 2020 | 2019 | 2018 | 2017 | 2016 | ||||||
| Net asset value at beginning of period | $ 5.41 | $ 5.61 | $ 5.52 | $ 5.77 | $ 5.74 | $ 5.57 | |||||
| Net investment income (loss) (a) | 0.12 | 0.29 | 0.28 | 0.29 | 0.30 | 0.32 | |||||
| Net realized and unrealized gain (loss) on investments | 0.26 | (0.18) | 0.12 | (0.22) | 0.08 | 0.20 | |||||
| Net realized and unrealized gain (loss) on foreign currency transactions | — | — | — | — | — | 0.00‡ | |||||
| Total from investment operations | 0.38 | 0.11 | 0.40 | 0.07 | 0.38 | 0.52 | |||||
| Less distributions: | |||||||||||
| From net investment income | (0.14) | (0.28) | (0.29) | (0.29) | (0.30) | (0.33) | |||||
| Return of capital | — | (0.03) | (0.02) | (0.03) | (0.05) | (0.02) | |||||
| Total distributions | (0.14) | (0.31) | (0.31) | (0.32) | (0.35) | (0.35) | |||||
| Net asset value at end of period | $ 5.65 | $ 5.41 | $ 5.61 | $ 5.52 | $ 5.77 | $ 5.74 | |||||
| Total investment return (b) | 7.03% | 2.17% | 7.49% | 1.20% | 6.80% | 9.83% | |||||
| Ratios (to average net assets)/Supplemental Data: | |||||||||||
| Net investment income (loss) | 4.49%†† | 5.26% | 5.10% | 5.06% | 5.16% | 5.89% | |||||
| Net expenses (c) | 1.05%†† | 1.07% | 1.09% | 1.09% | 1.07% | 1.05% | |||||
| Portfolio turnover rate | 22% | 38% | 30% | 30% | 43% | 41.0% | |||||
| Net assets at end of period (in 000’s) | $ 11,186 | $ 13,006 | $ 13,866 | $ 11,116 | $ 9,562 | $ 10,917 | |||||
| * | Unaudited. |
| ‡ | Less than one cent per share. |
| †† | Annualized. |
| (a) | Per share data based on average shares outstanding during the period. |
| (b) | Total investment return is calculated exclusive of sales charges and assumes the reinvestment of dividends and distributions. Class R2 shares are not subject to sales charges. For periods of less than one year, total return is not annualized. |
| (c) | In addition to the fees and expenses which the Fund bears directly, it also indirectly bears a pro-rata share of the fees and expenses of the underlying funds in which it invests. Such indirect expenses are not included in the above expense ratios. |
| Six months ended April 30, 2021* | Year Ended October 31, | February 29, 2016^ through October 31, 2016 | |||||||||
| Class R3 | 2020 | 2019 | 2018 | 2017 | |||||||
| Net asset value at beginning of period | $ 5.40 | $ 5.60 | $ 5.52 | $ 5.77 | $ 5.74 | $ 5.17 | |||||
| Net investment income (loss) (a) | 0.12 | 0.27 | 0.27 | 0.27 | 0.28 | 0.20 | |||||
| Net realized and unrealized gain (loss) on investments | 0.25 | (0.17) | 0.11 | (0.22) | 0.09 | 0.60 | |||||
| Total from investment operations | 0.37 | 0.10 | 0.38 | 0.05 | 0.37 | 0.80 | |||||
| Less distributions: | |||||||||||
| From net investment income | (0.13) | (0.27) | (0.28) | (0.28) | (0.29) | (0.21) | |||||
| Return of capital | — | (0.03) | (0.02) | (0.02) | (0.05) | (0.02) | |||||
| Total distributions | (0.13) | (0.30) | (0.30) | (0.30) | (0.34) | (0.23) | |||||
| Net asset value at end of period | $ 5.64 | $ 5.40 | $ 5.60 | $ 5.52 | $ 5.77 | $ 5.74 | |||||
| Total investment return (b) | 6.91% | 1.90% | 7.03% | 0.96% | 6.58% | 15.59% | |||||
| Ratios (to average net assets)/Supplemental Data: | |||||||||||
| Net investment income (loss) | 4.23%†† | 4.96% | 4.84% | 4.77% | 4.81% | 5.40%†† | |||||
| Net expenses (c) | 1.30%†† | 1.32% | 1.34% | 1.34% | 1.32% | 1.30%†† | |||||
| Portfolio turnover rate | 22% | 38% | 30% | 30% | 43% | 41% | |||||
| Net assets at end of period (in 000’s) | $ 3,136 | $ 1,924 | $ 1,281 | $ 606 | $ 392 | $ 130 | |||||
| * | Unaudited. |
| ^ | Inception date. |
| †† | Annualized. |
| (a) | Per share data based on average shares outstanding during the period. |
| (b) | Total investment return is calculated exclusive of sales charges and assumes the reinvestment of dividends and distributions. Class R3 shares are not subject to sales charges. For periods of less than one year, total return is not annualized. |
| (c) | In addition to the fees and expenses which the Fund bears directly, it also indirectly bears a pro-rata share of the fees and expenses of the underlying funds in which it invests. Such indirect expenses are not included in the above expense ratios. |
| Six months ended April 30, 2021* | Year Ended October 31, | ||||||||||
| Class R6 | 2020 | 2019 | 2018 | 2017 | 2016 | ||||||
| Net asset value at beginning of period | $ 5.40 | $ 5.60 | $ 5.52 | $ 5.77 | $ 5.74 | $ 5.58 | |||||
| Net investment income (loss) (a) | 0.14 | 0.31 | 0.31 | 0.31 | 0.32 | 0.35 | |||||
| Net realized and unrealized gain (loss) on investments | 0.25 | (0.17) | 0.11 | (0.21) | 0.09 | 0.19 | |||||
| Total from investment operations | 0.39 | 0.14 | 0.42 | 0.10 | 0.41 | 0.54 | |||||
| Less distributions: | |||||||||||
| From net investment income | (0.15) | (0.31) | (0.31) | (0.32) | 0.33 | 0.36 | |||||
| Return of capital | — | (0.03) | (0.03) | (0.03) | (0.05) | (0.02) | |||||
| Total distributions | (0.15) | (0.34) | (0.34) | (0.35) | (0.38) | (0.38) | |||||
| Net asset value at end of period | $ 5.64 | $ 5.40 | $ 5.60 | $ 5.52 | $ 5.77 | $ 5.74 | |||||
| Total investment return (b) | 7.31% | 2.70% | 7.84% | 1.71% | 7.36% | 10.24% | |||||
| Ratios (to average net assets)/Supplemental Data: | |||||||||||
| Net investment income (loss) | 4.97%†† | 5.65% | 5.60% | 5.54% | 5.45% | 6.23% | |||||
| Net expenses (c) | 0.57%†† | 0.58% | 0.58% | 0.58% | 0.58% | 0.58% | |||||
| Portfolio turnover rate | 22% | 38% | 30% | 30% | 43% | 41% | |||||
| Net assets at end of period (in 000’s) | $ 3,639,522 | $ 4,420,424 | $ 2,180,977 | $ 904,028 | $ 1,668,163 | $ 53,712 | |||||
| * | Unaudited. |
| †† | Annualized. |
| (a) | Per share data based on average shares outstanding during the period. |
| (b) | Total investment return is calculated exclusive of sales charges and assumes the reinvestment of dividends and distributions. Class R6 shares are not subject to sales charges. For periods of less than one year, total return is not annualized. |
| (c) | In addition to the fees and expenses which the Fund bears directly, it also indirectly bears a pro-rata share of the fees and expenses of the underlying funds in which it invests. Such indirect expenses are not included in the above expense ratios. |
| 34 | MainStay MacKay High Yield Corporate Bond Fund |
| Six months ended April 30, 2021* | August 31, 2020^ through October 31, | ||
| SIMPLE Class | 2020 | ||
| Net asset value at beginning of period | $ 5.45 | $ 5.54 | |
| Net investment income (loss) (a) | 0.12 | 0.04 | |
| Net realized and unrealized gain (loss) on investments | 0.25 | (0.08) | |
| Total from investment operations | 0.37 | (0.04) | |
| Less distributions: | |||
| From net investment income | (0.13) | (0.05) | |
| Return of capital | — | (0.00)‡ | |
| Net asset value at end of period | $ 5.69 | $ 5.45 | |
| Total investment return (b) | 6.87% | (0.72)% | |
| Ratios (to average net assets)/Supplemental Data: | |||
| Net investment income (loss)†† | 4.23% | 4.74% | |
| Net expenses†† (c) | 1.31% | 1.30% | |
| Portfolio turnover rate | 22% | 38% | |
| Net assets at end of period (in 000’s) | $ 27 | $ 25 |
| * | Unaudited. |
| ^ | Inception date. |
| ‡ | Less than one cent per share. |
| †† | Annualized. |
| (a) | Per share data based on average shares outstanding during the period. |
| (b) | Total investment return is calculated exclusive of sales charges and assumes the reinvestment of dividends and distributions. SIMPLE Class shares are not subject to sales charges. For periods of less than one year, total return is not annualized. |
| (c) | In addition to the fees and expenses which the Fund bears directly, it also indirectly bears a pro-rata share of the fees and expenses of the underlying funds in which it invests. Such indirect expenses are not included in the above expense ratios. |
| Class | Commenced Operations |
| Class A | January 3, 1995 |
| Investor Class | February 28, 2008 |
| Class B | May 1, 1986 |
| Class C | September 1, 1998 |
| Class I | January 2, 2004 |
| Class R1 | June 29, 2012 |
| Class R2 | May 1, 2008 |
| Class R3 | February 29, 2016 |
| Class R6 | June 17, 2013 |
| SIMPLE Class | August 31, 2020 |
| 36 | MainStay MacKay High Yield Corporate Bond Fund |
| • | Level 1—quoted prices in active markets for an identical asset or liability |
| • | Level 2—other significant observable inputs (including quoted prices for a similar asset or liability in active markets, interest rates and yield curves, prepayment speeds, credit risk, etc.) |
| • | Level 3—significant unobservable inputs (including the Fund's own assumptions about the assumptions that market participants would use in measuring fair value of an asset or liability) |
| • Benchmark yields | • Reported trades |
| • Broker/dealer quotes | • Issuer spreads |
| • Two-sided markets | • Benchmark securities |
| • Bids/offers | • Reference data (corporate actions or material event notices) |
| • Industry and economic events | • Comparable bonds |
| • Monthly payment information |
| Asset Class | Fair Value at 4/30/21* | Valuation Technique | Un- observable Inputs | Inputs/ Range |
| Corporate Bonds | 13,345,560 | Income Approach | Spread Adjustment | 0.97% |
| Loan Assignments | 16,992,436 | Market Approach | Implied natural gas price | $2.00 |
| Common Stocks | 387 | Market Approach | Ownership % of equity interest | 16.56%-39.70% |
| 31,775,600 | Income Approach | Rate of Return | 14.00% | |
| Market Approach | EBITDA Multiple | 6.5x-10.0x | ||
| 1,414,113 | Market Approach | Discount Rate | 50% | |
| 7,584,510 | Market Approach | EBITDA Multiple | 5.75x | |
| 0 | Market Approach | Implied natural gas price | $2.00 | |
| Preferred Stock | 29,433,820 | Income Approach | Spread Adjustment | 4.46% |
| $100,546,426 | ||||
| * The table above does not include a level 3 investment that was valued by a broker. As of April 30, 2021, the value of this investment was $20,700,100. The inputs for this investment was not readily available or cannot be reasonably estimated. | ||||
| 38 | MainStay MacKay High Yield Corporate Bond Fund |
| 40 | MainStay MacKay High Yield Corporate Bond Fund |
| Class R1 | $ 28 |
| Class R2 | 5,346 |
| Class R3 | 1,306 |
| 42 | MainStay MacKay High Yield Corporate Bond Fund |
| Class | Expense | Waived |
| Class A | $2,590,655 | $— |
| Investor Class | 183,209 | — |
| Class B | 47,410 | — |
| Class C | 348,137 | — |
| Class I | 2,533,464 | — |
| Class R1 | 38 | — |
| Class R2 | 7,210 | — |
| Class R3 | 1,760 | — |
| Class R6 | 85,823 | — |
| SIMPLE Class | 32 | — |
| Class I | $450,358 | 0.0%‡ |
| Class R1 | 41,501 | 68.7 |
| SIMPLE Class | 26,529 | 100.0 |
| ‡ | Less than one-tenth of a percent. |
| Federal Tax Cost | Gross Unrealized Appreciation | Gross Unrealized (Depreciation) | Net Unrealized Appreciation/ (Depreciation) | |
| Investments | $10,901,578,292 | $756,896,965 | $(160,387,359) | $596,509,606 |
| Capital Loss Available Through | Short-Term Capital Loss Amounts (000’s) | Long-Term Capital Loss Amounts (000’s) |
| Unlimited | $11,928 | $474,220 |
| 2020 | |
| Distributions paid from: | |
| Ordinary Income | $583,735,387 |
| Return of Capital | 61,209,254 |
| Total | $644,944,641 |
| Borrower | Unfunded Commitments | Unrealized Appreciation/ (Depreciation) |
| Neenah Foundry Term Loan (TBD), due 4/1/23 | $1,285,000 | $0 |
| PetroQuest Energy LLC 2020 Term Loan (TBD), due 9/19/26 | 12,336 | 0 |
| Total | $1,297,336 | $0 |
| Security | Date(s) of Acquisition | Principal Amount /Shares | Cost | 4/30/21 Value | Percent of Net Assets |
| Briggs & Stratton Corp. (Escrow Claim Shares) | |||||
| Corporate Bond 6.875%, due 12/15/20 | 2/26/21 | $ 9,200,000 | $ 9,323,706 | $ 736,000 | 0.0% ‡ |
| Carlson Travel, Inc. | |||||
| Common Stock | 9/4/20-2/4/21 | 25,452 | — | 1,414,113 | 0.0‡ |
| GenOn Energy, Inc. | |||||
| Common Stock | 12/14/18 | 386,241 | 43,250,890 | 47,314,522 | 0,4 |
| Neenah Enterprises, Inc. | |||||
| Common Stock | 4/12/20 | 720,961 | 6,114,571 | 7,584,510 | 0.0‡ |
| Sterling Entertainment Enterprises LLC | |||||
| Corporate Bond 10.25%, due 1/15/25 | 12/28/17 | $ 20,000,000 | 19,815,562 | 20,700,000 | 0,2 |
| Total | $ 78,504,729 | $ 77,749,145 | 0.6% | ||
| ‡ | Less than one-tenth of a percent. |
| 44 | MainStay MacKay High Yield Corporate Bond Fund |
| Class A | Shares | Amount |
| Period ended April 30, 2021: | ||
| Shares sold | 135,264,303 | $ 754,566,536 |
| Shares issued to shareholders in reinvestment of distributions | 15,117,739 | 84,763,101 |
| Shares redeemed | (99,356,428) | (555,118,928) |
| Net increase (decrease) in shares outstanding before conversion | 51,025,614 | 284,210,709 |
| Shares converted into Class A (See Note 1) | 8,508,587 | 47,671,836 |
| Shares converted from Class A (See Note 1) | (656,067) | (3,636,937) |
| Net increase (decrease) | 58,878,134 | $ 328,245,608 |
| Year ended October 31, 2020: | ||
| Shares sold | 162,189,152 | $ 862,805,279 |
| Shares issued to shareholders in reinvestment of distributions | 31,290,846 | 168,572,345 |
| Shares redeemed | (153,726,255) | (818,209,762) |
| Net increase (decrease) in shares outstanding before conversion | 39,753,743 | 213,167,862 |
| Shares converted into Class A (See Note 1) | 7,327,259 | 39,745,182 |
| Shares converted from Class A (See Note 1) | (2,426,758) | (13,511,692) |
| Net increase (decrease) | 44,654,244 | $ 239,401,352 |
| Investor Class | Shares | Amount |
| Period ended April 30, 2021: | ||
| Shares sold | 1,181,033 | $ 6,689,270 |
| Shares issued to shareholders in reinvestment of distributions | 622,178 | 3,514,936 |
| Shares redeemed | (1,455,006) | (8,226,826) |
| Net increase (decrease) in shares outstanding before conversion | 348,205 | 1,977,380 |
| Shares converted into Investor Class (See Note 1) | 784,557 | 4,437,543 |
| Shares converted from Investor Class (See Note 1) | (2,295,359) | (12,955,070) |
| Net increase (decrease) | (1,162,597) | $ (6,540,147) |
| Year ended October 31, 2020: | ||
| Shares sold | 3,476,036 | $ 18,943,660 |
| Shares issued to shareholders in reinvestment of distributions | 1,553,045 | 8,430,250 |
| Shares redeemed | (3,567,862) | (19,332,577) |
| Net increase (decrease) in shares outstanding before conversion | 1,461,219 | 8,041,333 |
| Shares converted into Investor Class (See Note 1) | 949,252 | 5,122,805 |
| Shares converted from Investor Class (See Note 1) | (3,638,926) | (19,982,653) |
| Net increase (decrease) | (1,228,455) | $ (6,818,515) |
| Class B | Shares | Amount |
| Period ended April 30, 2021: | ||
| Shares sold | 43,296 | $ 241,472 |
| Shares issued to shareholders in reinvestment of distributions | 130,173 | 725,946 |
| Shares redeemed | (2,247,393) | (12,547,754) |
| Net increase (decrease) in shares outstanding before conversion | (2,073,924) | (11,580,336) |
| Shares converted from Class B (See Note 1) | (615,623) | (3,431,355) |
| Net increase (decrease) | (2,689,547) | $ (15,011,691) |
| Year ended October 31, 2020: | ||
| Shares sold | 220,973 | $ 1,194,012 |
| Shares issued to shareholders in reinvestment of distributions | 453,682 | 2,434,490 |
| Shares redeemed | (2,243,156) | (12,006,607) |
| Net increase (decrease) in shares outstanding before conversion | (1,568,501) | (8,378,105) |
| Shares converted from Class B (See Note 1) | (1,327,691) | (7,151,912) |
| Net increase (decrease) | (2,896,192) | $ (15,530,017) |
| Class C | Shares | Amount |
| Period ended April 30, 2021: | ||
| Shares sold | 3,504,035 | $ 19,558,606 |
| Shares issued to shareholders in reinvestment of distributions | 979,855 | 5,469,909 |
| Shares redeemed | (12,648,680) | (70,671,295) |
| Net increase (decrease) in shares outstanding before conversion | (8,164,790) | (45,642,780) |
| Shares converted from Class C (See Note 1) | (5,495,289) | (30,622,688) |
| Net increase (decrease) | (13,660,079) | $ (76,265,468) |
| Year ended October 31, 2020: | ||
| Shares sold | 9,226,500 | $ 48,471,453 |
| Shares issued to shareholders in reinvestment of distributions | 2,812,640 | 15,100,791 |
| Shares redeemed | (22,129,547) | (118,456,173) |
| Net increase (decrease) in shares outstanding before conversion | (10,090,407) | (54,883,929) |
| Shares converted from Class C (See Note 1) | (1,610,770) | (8,681,316) |
| Net increase (decrease) | (11,701,177) | $ (63,565,245) |
| Class I | Shares | Amount |
| Period ended April 30, 2021: | ||
| Shares sold | 152,621,654 | $ 858,160,719 |
| Shares issued to shareholders in reinvestment of distributions | 16,464,121 | 92,317,051 |
| Shares redeemed | (111,681,300) | (628,123,210) |
| Net increase (decrease) in shares outstanding before conversion | 57,404,475 | 322,354,560 |
| Shares converted into Class I (See Note 1) | 669,105 | 3,708,534 |
| Shares converted from Class I (See Note 1) | (2,523,717) | (14,208,525) |
| Net increase (decrease) | 55,549,863 | $ 311,854,569 |
| Year ended October 31, 2020: | ||
| Shares sold | 316,267,141 | $ 1,685,293,008 |
| Shares issued to shareholders in reinvestment of distributions | 35,224,225 | 189,883,002 |
| Shares redeemed | (318,299,322) | (1,713,046,438) |
| Net increase (decrease) in shares outstanding before conversion | 33,192,044 | 162,129,572 |
| Shares converted into Class I (See Note 1) | 570,677 | 3,030,446 |
| Net increase (decrease) | 33,762,721 | $ 165,160,018 |
| Class R1 | Shares | Amount |
| Period ended April 30, 2021: | ||
| Shares sold | 1,074 | $ 6,005 |
| Shares issued to shareholders in reinvestment of distributions | 263 | 1,470 |
| Shares redeemed | (18) | (103) |
| Net increase (decrease) | 1,319 | $ 7,372 |
| Year ended October 31, 2020: | ||
| Shares sold | 638 | $ 3,461 |
| Shares issued to shareholders in reinvestment of distributions | 542 | 2,913 |
| Shares redeemed | (1,231) | (6,888) |
| Net increase (decrease) | (51) | $ (514) |
| 46 | MainStay MacKay High Yield Corporate Bond Fund |
| Class R2 | Shares | Amount |
| Period ended April 30, 2021: | ||
| Shares sold | 236,194 | $ 1,326,367 |
| Shares issued to shareholders in reinvestment of distributions | 39,082 | 219,264 |
| Shares redeemed | (696,918) | (3,817,941) |
| Net increase (decrease) in shares outstanding before conversion | (421,642) | (2,272,310) |
| Shares converted from Class R2 (See Note 1) | (2,744) | (15,506) |
| Net increase (decrease) | (424,386) | $ (2,287,816) |
| Year ended October 31, 2020: | ||
| Shares sold | 385,054 | $ 2,096,445 |
| Shares issued to shareholders in reinvestment of distributions | 119,352 | 643,342 |
| Shares redeemed | (565,097) | (3,035,083) |
| Net increase (decrease) in shares outstanding before conversion | (60,691) | (295,296) |
| Shares converted from Class R2 (See Note 1) | (6,682) | (36,415) |
| Net increase (decrease) | (67,373) | $ (331,711) |
| Class R3 | Shares | Amount |
| Period ended April 30, 2021: | ||
| Shares sold | 241,631 | $ 1,358,722 |
| Shares issued to shareholders in reinvestment of distributions | 10,450 | 58,592 |
| Shares redeemed | (52,310) | (293,891) |
| Net increase (decrease) | 199,771 | $ 1,123,423 |
| Year ended October 31, 2020: | ||
| Shares sold | 166,149 | $ 909,222 |
| Shares issued to shareholders in reinvestment of distributions | 15,330 | 82,408 |
| Shares redeemed | (52,384) | (283,628) |
| Net increase (decrease) in shares outstanding before conversion | 129,095 | 708,002 |
| Shares converted from Class R3 (See Note 1) | (1,651) | (9,031) |
| Net increase (decrease) | 127,444 | $ 698,971 |
| Class R6 | Shares | Amount |
| Period ended April 30, 2021: | ||
| Shares sold | 103,599,623 | $ 580,973,762 |
| Shares issued to shareholders in reinvestment of distributions | 20,309,909 | 113,596,540 |
| Shares redeemed | (298,698,358) | (1,678,481,268) |
| Net increase (decrease) in shares outstanding before conversion | (174,788,826) | (983,910,966) |
| Shares converted into Class R6 (See Note 1) | 2,528,207 | 14,208,525 |
| Shares converted from Class R6 (See Note 1) | (919,403) | (5,160,737) |
| Net increase (decrease) | (173,180,022) | $ (974,863,178) |
| Year ended October 31, 2020: | ||
| Shares sold | 541,233,062 | $ 2,794,572,816 |
| Shares issued to shareholders in reinvestment of distributions | 39,761,619 | 213,232,631 |
| Shares redeemed | (151,718,551) | (806,880,020) |
| Net increase (decrease) in shares outstanding before conversion | 429,276,130 | 2,200,925,427 |
| Shares converted into Class R6 (See Note 1) | 1,761,091 | 10,020,608 |
| Shares converted from Class R6 (See Note 1) | (1,588,011) | (8,546,022) |
| Net increase (decrease) | 429,449,210 | $ 2,202,400,013 |
| SIMPLE Class | Shares | Amount |
| Period ended April 30, 2021: | ||
| Shares issued to shareholders in reinvestment of distributions | 108 | $ 607 |
| Shares redeemed | (774) | (4,380) |
| Net increase (decrease) in shares outstanding before conversion | (666) | (3,773) |
| Shares converted into SIMPLE Class (See Note 1) | 774 | 4,380 |
| Net increase (decrease) | 108 | $ 607 |
| Period ended October 31, 2020:(a) | ||
| Shares sold | 4,513 | $ 25,000 |
| Shares issued to shareholders in reinvestment of distributions | 41 | 226 |
| Net increase (decrease) | 4,554 | $ 25,226 |
| (a) | The inception date of the class was August 31, 2020. |
| 48 | MainStay MacKay High Yield Corporate Bond Fund |
| 50 | MainStay MacKay High Yield Corporate Bond Fund |
| 52 | MainStay MacKay High Yield Corporate Bond Fund |
| 54 | MainStay MacKay High Yield Corporate Bond Fund |
1.
| 2. | This Fund is registered for sale in CA, CT, DE, FL, MA, NJ, NY and VT. |
| 3. | An affiliate of New York Life Investment Management LLC. |
| 1739388MS071-21 | MSHY10-06/21 |
please log in to newyorklifeinvestments.com/accounts.
| Not FDIC/NCUA Insured | Not a Deposit | May Lose Value | No Bank Guarantee | Not Insured by Any Government Agency |


President
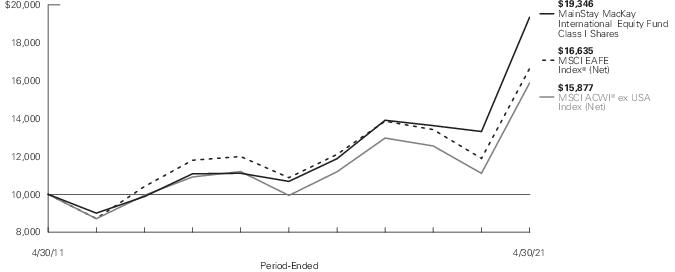
| Average Annual Total Returns for the Period-Ended April 30, 2021 | ||||||||
| Class | Sales Charge | Inception Date | Six Months | One Year | Five Years or Since Inception | Ten Years | Gross Expense Ratio1 | |
| Class A Shares | Maximum 5.5% Initial Sales Charge | With sales charges | 1/3/1995 | 17.43% | 36.91% | 11.02% | 5.93% | 1.40% |
| Excluding sales charges | 24.26 | 44.88 | 12.28 | 6.53 | 1.40 | |||
| Investor Class Shares2 | Maximum 5% Initial Sales Charge | With sales charges | 2/28/2008 | 17.84 | 36.40 | 10.62 | 5.57 | 1.75 |
| Excluding sales charges | 24.04 | 44.34 | 11.88 | 6.17 | 1.75 | |||
| Class B Shares3 | Maximum 5% CDSC | With sales charges | 9/13/1994 | 18.56 | 38.22 | 10.78 | 5.36 | 2.50 |
| if Redeemed Within the First Six Years of Purchase | Excluding sales charges | 23.56 | 43.22 | 11.04 | 5.36 | 2.50 | ||
| Class C Shares | Maximum 1% CDSC | With sales charges | 9/1/1998 | 22.55 | 42.30 | 11.04 | 5.37 | 2.50 |
| if Redeemed Within One Year of Purchase | Excluding sales charges | 23.55 | 43.30 | 11.04 | 5.37 | 2.50 | ||
| Class I Shares | No Sales Charge | 1/2/2004 | 24.42 | 45.32 | 12.62 | 6.82 | 1.15 | |
| Class R1 Shares | No Sales Charge | 1/2/2004 | 24.27 | 45.02 | 12.44 | 6.69 | 1.25 | |
| Class R2 Shares | No Sales Charge | 1/2/2004 | 24.17 | 44.73 | 12.18 | 6.43 | 1.50 | |
| Class R3 Shares | No Sales Charge | 4/28/2006 | 23.96 | 44.31 | 11.88 | 6.15 | 1.75 | |
| Class R6 Shares | No Sales Charge | 2/28/2019 | 24.40 | 45.35 | 19.41 | N/A | 1.02 | |
| 1. | The gross expense ratios presented reflect the Fund’s “Total Annual Fund Operating Expenses” from the most recent Prospectus, as supplemented, and may differ from other expense ratios disclosed in this report. |
| 2. | Prior to June 30, 2020, the maximum initial sales charge was 5.5%, which is reflected in the average annual total return figures shown. |
| 3. | Class B shares are closed to all new purchases as well as additional investments by existing Class B shareholders. |
| Benchmark Performance | Six Months | One Year | Five Years | Ten Years |
| MSCI ACWI® ex USA Index (Net)1 | 27.40% | 42.98% | 9.83% | 4.73% |
| MSCI EAFE Index® (Net)2 | 28.84 | 39.88 | 8.87 | 5.22 |
| Morningstar Foreign Large Growth Category Average3 | 22.78 | 46.85 | 12.84 | 7.03 |
| 1. | The Fund has selected the MSCI ACWI® (All Country World Index) ex USA Index (Net) as its primary broad-based securities market index for comparison purposes. The MSCI ACWI® ex USA Index (Net) is a free float-adjusted market capitalization weighted index that is designed to measure the equity market performance of developed and emerging markets, excluding the U.S. Results assume reinvestment of all income and capital gains. An investment cannot be made directly in an index. |
| 2. | The MSCI EAFE® Index (Net) is the Fund’s secondary benchmark. The MSCI EAFE® Index (Net) consists of international stocks representing the developed world outside of North America. Results assume reinvestment of all dividends and capital gains. An investment cannot be made directly in an index. |
| 3. | The Morningstar Foreign Large Growth Category Average is representative of funds that focus on high-priced growth stocks, mainly outside of the United States. Most of these portfolios divide their assets among a dozen or more developed markets, including Japan, Britain, France, and Germany. These portfolios primarily invest in stocks that have market caps in the top 70% of each economically integrated market and will have less than 20% of assets invested in U.S. stocks. Results are based on average total returns of similar funds with all dividends and capital gain distributions reinvested. |
| 6 | MainStay MacKay International Equity Fund |
| Share Class | Beginning Account Value 11/1/20 | Ending Account Value (Based on Actual Returns and Expenses) 4/30/21 | Expenses Paid During Period1 | Ending Account Value (Based on Hypothetical 5% Annualized Return and Actual Expenses) 4/30/21 | Expenses Paid During Period1 | Net Expense Ratio During Period2 |
| Class A Shares | $1,000.00 | $1,242.60 | $ 6.62 | $1,018.89 | $ 5.96 | 1.19% |
| Investor Class Shares | $1,000.00 | $1,240.40 | $ 8.44 | $1,017.26 | $ 7.60 | 1.52% |
| Class B Shares | $1,000.00 | $1,235.60 | $12.58 | $1,013.54 | $11.33 | 2.27% |
| Class C Shares | $1,000.00 | $1,235.50 | $12.58 | $1,013.54 | $11.33 | 2.27% |
| Class I Shares | $1,000.00 | $1,244.20 | $ 4.73 | $1,020.58 | $ 4.26 | 0.85% |
| Class R1 Shares | $1,000.00 | $1,242.70 | $ 5.78 | $1,019.64 | $ 5.21 | 1.04% |
| Class R2 Shares | $1,000.00 | $1,241.70 | $ 7.17 | $1,018.40 | $ 6.46 | 1.29% |
| Class R3 Shares | $1,000.00 | $1,239.60 | $ 8.55 | $1,017.16 | $ 7.70 | 1.54% |
| Class R6 Shares | $1,000.00 | $1,244.00 | $ 4.62 | $1,020.68 | $ 4.16 | 0.83% |
| 1. | Expenses are equal to the Fund’s annualized expense ratio of each class multiplied by the average account value over the period, divided by 365 and multiplied by 181 (to reflect the six-month period). The table above represents the actual expenses incurred during the six-month period. In addition to the fees and expenses which the Fund bears directly, it also indirectly bears a pro rata share of the fees and expenses of the underlying funds in which it invests. Such indirect expenses are not included in the above-reported expense figures. |
| 2. | Expenses are equal to the Fund's annualized expense ratio to reflect the six-month period. |
| United Kingdom | 18.2% |
| Germany | 15.3 |
| United States | 11.2 |
| Japan | 9.0 |
| France | 8.7 |
| Netherlands | 6.4 |
| India | 4.7 |
| China | 4.2 |
| Denmark | 4.0 |
| Switzerland | 3.8 |
| Taiwan | 3.7 |
| Sweden | 3.0% |
| Spain | 2.8 |
| Brazil | 1.6 |
| Mexico | 1.2 |
| Canada | 1.1 |
| Ireland | 1.0 |
| Israel | 1.0 |
| Other Assets, Less Liabilities | –0.9 |
| 100.0% |
| 1. | Tencent Holdings Ltd. |
| 2. | Lonza Group AG (Registered) |
| 3. | Taiwan Semiconductor Manufacturing Co. Ltd., Sponsored |
| 4. | Deutsche Boerse AG |
| 5. | Linde plc |
| 6. | STERIS plc |
| 7. | SAP SE |
| 8. | Koninklijke Philips NV |
| 9. | Experian plc |
| 10. | Koninklijke DSM NV |
| 8 | MainStay MacKay International Equity Fund |
| 1. | See page 5 for other share class returns, which may be higher or lower than Class I share returns. See page 6 for more information on benchmark and peer group returns. |
| 2. | Beta is a measure of volatility in relation to the market as a whole. A beta higher than 1 indicates that a security or portfolio will tend to exhibit higher volatility than the market. A beta lower than 1 indicates that a security or portfolio will tend to exhibit lower volatility than the market. |
| Shares | Value | |
| Common Stocks 97.4% | ||
| Brazil 1.6% | ||
| Notre Dame Intermedica Participacoes SA (Health Care Providers & Services) | 432,894 | $ 6,476,615 |
| Canada 1.1% | ||
| Constellation Software, Inc. (Software) | 3,094 | 4,540,829 |
| China 4.2% | ||
| Tencent Holdings Ltd. (Interactive Media & Services) | 214,807 | 17,228,253 |
| Denmark 4.0% | ||
| Chr Hansen Holding A/S (Chemicals) | 40,093 | 3,683,985 |
| Novo Nordisk A/S, Class B (Pharmaceuticals) | 171,701 | 12,690,606 |
| 16,374,591 | ||
| France 8.7% | ||
| BioMerieux (Health Care Equipment & Supplies) | 70,205 | 8,349,240 |
| Dassault Systemes SE (Software) | 17,636 | 4,091,096 |
| Edenred (IT Services) | 193,943 | 10,993,870 |
| Teleperformance (Professional Services) | 31,728 | 12,248,355 |
| 35,682,561 | ||
| Germany 15.3% | ||
| Carl Zeiss Meditec AG (Health Care Equipment & Supplies) | 21,460 | 3,781,032 |
| Deutsche Boerse AG (Capital Markets) | 85,582 | 14,744,274 |
| SAP SE (Software) | 95,731 | 13,438,212 |
| Scout24 AG (Interactive Media & Services) (a) | 152,191 | 12,650,658 |
| Symrise AG (Chemicals) | 96,675 | 12,482,836 |
| Zalando SE (Internet & Direct Marketing Retail) (a)(b) | 52,086 | 5,419,169 |
| 62,516,181 | ||
| India 4.7% | ||
| HDFC Bank Ltd. (Banks) (b) | 594,176 | 11,328,830 |
| Housing Development Finance Corp. Ltd. (Thrifts & Mortgage Finance) | 239,657 | 7,830,084 |
| 19,158,914 | ||
| Ireland 1.0% | ||
| ICON plc (Life Sciences Tools & Services) (b)(c) | 19,012 | 4,124,653 |
| Shares | Value | |
| Israel 1.0% | ||
| NICE Ltd., Sponsored ADR (Software) (b) | 16,959 | $ 4,091,020 |
| Japan 9.0% | ||
| CyberAgent, Inc. (Media) | 459,500 | 9,451,514 |
| Menicon Co. Ltd. (Health Care Equipment & Supplies) | 103,500 | 6,307,164 |
| Relo Group, Inc. (Real Estate Management & Development) | 287,900 | 5,927,121 |
| SMS Co. Ltd. (Professional Services) | 239,600 | 6,541,920 |
| TechnoPro Holdings, Inc. (Professional Services) | 119,600 | 8,787,519 |
| 37,015,238 | ||
| Mexico 1.2% | ||
| Regional SAB de CV (Banks) (b) | 960,080 | 4,877,417 |
| Netherlands 6.4% | ||
| Koninklijke DSM NV (Chemicals) | 72,550 | 13,013,707 |
| Koninklijke Philips NV (Health Care Equipment & Supplies) | 231,176 | 13,029,421 |
| 26,043,128 | ||
| Spain 2.8% | ||
| Industria de Diseno Textil SA (Specialty Retail) (c) | 327,144 | 11,649,809 |
| Sweden 3.0% | ||
| Hexagon AB, Class B (Electronic Equipment, Instruments & Components) | 93,498 | 8,917,351 |
| MIPS AB (Leisure Products) | 44,473 | 3,595,959 |
| 12,513,310 | ||
| Switzerland 3.8% | ||
| Lonza Group AG (Registered) (Life Sciences Tools & Services) | 24,375 | 15,501,779 |
| Taiwan 3.7% | ||
| Taiwan Semiconductor Manufacturing Co. Ltd., Sponsored ADR (Semiconductors & Semiconductor Equipment) | 130,189 | 15,198,264 |
| United Kingdom 18.2% | ||
| Big Yellow Group plc (Equity Real Estate Investment Trusts) | 236,751 | 3,910,501 |
| Diageo plc (Beverages) | 263,200 | 11,817,137 |
| Experian plc (Professional Services) | 337,667 | 13,020,073 |
| 10 | MainStay MacKay International Equity Fund |
| Shares | Value | |
| Common Stocks (continued) | ||
| United Kingdom (continued) | ||
| HomeServe plc (Commercial Services & Supplies) | 523,546 | $ 7,910,093 |
| Linde plc (Chemicals) | 50,508 | 14,437,207 |
| Prudential plc (Insurance) | 508,231 | 10,770,539 |
| St James's Place plc (Capital Markets) | 666,045 | 12,523,641 |
| 74,389,191 | ||
| United States 7.7% | ||
| Accenture plc, Class A (IT Services) | 12,934 | 3,750,472 |
| Globant SA (IT Services) (b) | 17,070 | 3,912,103 |
| STERIS plc (Health Care Equipment & Supplies) | 66,922 | 14,121,880 |
| TE Connectivity Ltd. (Electronic Equipment, Instruments & Components) | 73,230 | 9,847,238 |
| 31,631,693 | ||
| Total Common Stocks (Cost $307,340,301) | 399,013,446 | |
| Short-Term Investments 3.5% | ||
| Affiliated Investment Company 0.1% | ||
| United States 0.1% | ||
| MainStay U.S. Government Liquidity Fund, 0.01% (d) | 498,680 | 498,680 |
| Shares | Value | ||
| Unaffiliated Investment Company 3.4% | |||
| United States 3.4% | |||
| BlackRock Liquidity FedFund, 0.05% (d)(e) | 13,649,915 | $ 13,649,915 | |
| Total Short-Term Investments (Cost $14,148,595) | 14,148,595 | ||
| Total Investments (Cost $321,488,896) | 100.9% | 413,162,041 | |
| Other Assets, Less Liabilities | (0.9) | (3,668,395) | |
| Net Assets | 100.0% | $ 409,493,646 | |
| † | Percentages indicated are based on Fund net assets. |
| (a) | May be sold to institutional investors only under Rule 144A or securities offered pursuant to Section 4(a)(2) of the Securities Act of 1933, as amended. |
| (b) | Non-income producing security. |
| (c) | All or a portion of this security was held on loan. As of April 30, 2021, the aggregate market value of securities on loan was $12,864,729. The Fund received cash collateral with a value of $13,649,915. (See Note 2(I)) |
| (d) | Current yield as of April 30, 2021. |
| (e) | Represents a security purchased with cash collateral received for securities on loan. |
| Abbreviation(s): |
| ADR—American Depositary Receipt |
| Description | Quoted Prices in Active Markets for Identical Assets (Level 1) | Significant Other Observable Inputs (Level 2) | Significant Unobservable Inputs (Level 3) | Total | |||
| Asset Valuation Inputs | |||||||
| Investments in Securities (a) | |||||||
| Common Stocks | $ 382,638,855 | $ 16,374,591 | $ — | $ 399,013,446 | |||
| Short-Term Investments | |||||||
| Affiliated Investment Company | 498,680 | — | — | 498,680 | |||
| Unaffiliated Investment Company | 13,649,915 | — | — | 13,649,915 | |||
| Total Short-Term Investments | 14,148,595 | — | — | 14,148,595 | |||
| Total Investments in Securities | $ 396,787,450 | $ 16,374,591 | $ — | $ 413,162,041 |
| (a) | For a complete listing of investments and their industries, see the Portfolio of Investments. |
| Value | Percent | ||
| Banks | $ 16,206,247 | 4.0% | |
| Beverages | 11,817,137 | 2.9 | |
| Capital Markets | 27,267,915 | 6.7 | |
| Chemicals | 43,617,735 | 10.7 | |
| Commercial Services & Supplies | 7,910,093 | 1.9 | |
| Electronic Equipment, Instruments & Components | 18,764,589 | 4.5 | |
| Equity Real Estate Investment Trusts | 3,910,501 | 1.0 | |
| Health Care Equipment & Supplies | 45,588,737 | 11.0 | |
| Health Care Providers & Services | 6,476,615 | 1.6 | |
| Insurance | 10,770,539 | 2.6 | |
| Interactive Media & Services | 29,878,911 | 7.3 | |
| Internet & Direct Marketing Retail | 5,419,169 | 1.3 | |
| IT Services | 18,656,445 | 4.6 | |
| Leisure Products | 3,595,959 | 0.9 | |
| Life Sciences Tools & Services | 19,626,432 | 4.8 | |
| Media | 9,451,514 | 2.3 | |
| Pharmaceuticals | 12,690,606 | 3.1 | |
| Professional Services | 40,597,867 | 9.9 | |
| Real Estate Management & Development | 5,927,121 | 1.5 | |
| Semiconductors & Semiconductor Equipment | 15,198,264 | 3.7 | |
| Software | 26,161,157 | 6.4 | |
| Specialty Retail | 11,649,809 | 2.8 | |
| Thrifts & Mortgage Finance | 7,830,084 | 1.9 | |
| 399,013,446 | 97.4 | ||
| Short-Term Investments | 14,148,595 | 3.5 | |
| Other Assets, Less Liabilities | (3,668,395) | (0.9) | |
| Net Assets | $409,493,646 | 100.0% |
| † | Percentages indicated are based on Fund net assets. |
| 12 | MainStay MacKay International Equity Fund |
| Assets | |
| Investment in unaffiliated securities, at value (identified cost $320,990,216) including securities on loan of $12,864,729 | $412,663,361 |
| Investment in affiliated investment companies, at value (identified cost $498,680) | 498,680 |
| Cash denominated in foreign currencies (identified cost $9,346,005) | 9,524,641 |
| Receivables: | |
| Dividends and interest | 1,080,450 |
| Fund shares sold | 283,727 |
| Investment securities sold | 216,715 |
| Securities lending | 1,763 |
| Other assets | 81,489 |
| Total assets | 424,350,826 |
| Liabilities | |
| Cash collateral received for securities on loan | 13,649,915 |
| Payables: | |
| Foreign capital gains tax (See Note 2) | 746,942 |
| Manager (See Note 3) | 248,826 |
| Transfer agent (See Note 3) | 49,950 |
| Professional fees | 41,713 |
| Fund shares redeemed | 37,002 |
| Custodian | 29,228 |
| NYLIFE Distributors (See Note 3) | 26,243 |
| Shareholder communication | 24,097 |
| Accrued expenses | 3,264 |
| Total liabilities | 14,857,180 |
| Net assets | $409,493,646 |
| Composition of Net Assets | |
| Shares of beneficial interest outstanding (par value of $.01 per share) unlimited number of shares authorized | $ 186,206 |
| Additional paid-in-capital | 291,489,249 |
| 291,675,455 | |
| Total distributable earnings (loss) | 117,818,191 |
| Net assets | $409,493,646 |
| Class A | |
| Net assets applicable to outstanding shares | $ 79,804,256 |
| Shares of beneficial interest outstanding | 3,644,806 |
| Net asset value per share outstanding | $ 21.90 |
| Maximum sales charge (5.50% of offering price) | 1.27 |
| Maximum offering price per share outstanding | $ 23.17 |
| Investor Class | |
| Net assets applicable to outstanding shares | $ 24,059,003 |
| Shares of beneficial interest outstanding | 1,113,966 |
| Net asset value per share outstanding | $ 21.60 |
| Maximum sales charge (5.00% of offering price) | 1.14 |
| Maximum offering price per share outstanding | $ 22.74 |
| Class B | |
| Net assets applicable to outstanding shares | $ 2,460,811 |
| Shares of beneficial interest outstanding | 131,917 |
| Net asset value and offering price per share outstanding | $ 18.65 |
| Class C | |
| Net assets applicable to outstanding shares | $ 2,620,455 |
| Shares of beneficial interest outstanding | 140,465 |
| Net asset value and offering price per share outstanding | $ 18.66 |
| Class I | |
| Net assets applicable to outstanding shares | $ 47,605,251 |
| Shares of beneficial interest outstanding | 2,154,094 |
| Net asset value and offering price per share outstanding | $ 22.10 |
| Class R1 | |
| Net assets applicable to outstanding shares | $ 181,795 |
| Shares of beneficial interest outstanding | 8,281 |
| Net asset value and offering price per share outstanding | $ 21.95 |
| Class R2 | |
| Net assets applicable to outstanding shares | $ 472,427 |
| Shares of beneficial interest outstanding | 21,553 |
| Net asset value and offering price per share outstanding | $ 21.92 |
| Class R3 | |
| Net assets applicable to outstanding shares | $ 1,451,725 |
| Shares of beneficial interest outstanding | 67,164 |
| Net asset value and offering price per share outstanding | $ 21.61 |
| Class R6 | |
| Net assets applicable to outstanding shares | $250,837,923 |
| Shares of beneficial interest outstanding | 11,338,393 |
| Net asset value and offering price per share outstanding | $ 22.12 |
| Investment Income (Loss) | |
| Income | |
| Dividends-unaffiliated (net of foreign tax withholding of $129,109) | $ 1,688,503 |
| Securities lending | 2,457 |
| Dividends-affiliated | 28 |
| Interest | 13 |
| Total income | 1,691,001 |
| Expenses | |
| Manager (See Note 3) | 1,714,181 |
| Distribution/Service—Class A (See Note 3) | 92,173 |
| Distribution/Service—Investor Class (See Note 3) | 29,410 |
| Distribution/Service—Class B (See Note 3) | 12,718 |
| Distribution/Service—Class C (See Note 3) | 15,209 |
| Distribution/Service—Class R2 (See Note 3) | 708 |
| Distribution/Service—Class R3 (See Note 3) | 3,392 |
| Transfer agent (See Note 3) | 136,717 |
| Registration | 61,173 |
| Professional fees | 45,826 |
| Custodian | 40,385 |
| Shareholder communication | 17,231 |
| Trustees | 3,785 |
| Insurance | 1,229 |
| Shareholder service (See Note 3) | 1,044 |
| Miscellaneous | 15,414 |
| Total expenses before waiver/reimbursement | 2,190,595 |
| Expense waiver/reimbursement from Manager (See Note 3) | (327,331) |
| Net expenses | 1,863,264 |
| Net investment income (loss) | (172,263) |
| Realized and Unrealized Gain (Loss) | |
| Net realized gain (loss) on: | |
| Unaffiliated investment transactions | 30,309,338 |
| Foreign currency transactions | 639,552 |
| Net realized gain (loss) | 30,948,890 |
| Net change in unrealized appreciation (depreciation) on: | |
| Unaffiliated investments(a) | 48,839,174 |
| Translation of other assets and liabilities in foreign currencies | 315,761 |
| Net change in unrealized appreciation (depreciation) | 49,154,935 |
| Net realized and unrealized gain (loss) | 80,103,825 |
| Net increase (decrease) in net assets resulting from operations | $79,931,562 |
| (a) | Net change in unrealized appreciation (depreciation) on investments recorded net of foreign capital gains tax in the amount of $(715,684). |
| 14 | MainStay MacKay International Equity Fund |
for the six months ended April 30, 2021 (Unaudited) and the year ended October 31, 2020
| 2021 | 2020 | |
| Increase (Decrease) in Net Assets | ||
| Operations: | ||
| Net investment income (loss) | $ (172,263) | $ 461,055 |
| Net realized gain (loss) | 30,948,890 | 10,333,966 |
| Net change in unrealized appreciation (depreciation) | 49,154,935 | 17,780,932 |
| Net increase (decrease) in net assets resulting from operations | 79,931,562 | 28,575,953 |
| Distributions to shareholders: | ||
| Class A | (2,496,323) | (1,722,435) |
| Investor Class | (878,981) | (658,491) |
| Class B | (104,666) | (97,268) |
| Class C | (133,782) | (119,383) |
| Class I | (1,460,846) | (1,446,255) |
| Class R1 | (5,793) | (8,457) |
| Class R2 | (19,645) | (12,558) |
| Class R3 | (47,741) | (31,572) |
| Class R6 | (8,406,730) | (6,312,311) |
| Total distributions to shareholders | (13,554,507) | (10,408,730) |
| Capital share transactions: | ||
| Net proceeds from sales of shares | 23,801,538 | 37,289,281 |
| Net asset value of shares issued to shareholder in reinvestment of distributions | 13,508,068 | 10,370,218 |
| Cost of shares redeemed | (21,866,225) | (49,485,401) |
| Increase (decrease) in net assets derived from capital share transactions | 15,443,381 | (1,825,902) |
| Net increase (decrease) in net assets | 81,820,436 | 16,341,321 |
| Net Assets | ||
| Beginning of period | 327,673,210 | 311,331,889 |
| End of period | $409,493,646 | $327,673,210 |
| Six months ended April 30, 2021* | Year Ended October 31, | ||||||||||
| Class A | 2020 | 2019 | 2018 | 2017 | 2016 | ||||||
| Net asset value at beginning of period | $ 18.27 | $ 17.12 | $ 15.48 | $ 16.38 | $ 13.51 | $ 13.51 | |||||
| Net investment income (loss) (a) | (0.03) | (0.01) | 0.09 | 0.03 | 0.00‡ | 0.04 | |||||
| Net realized and unrealized gain (loss) on investments | 4.37 | 1.69 | 1.73 | (0.83) | 2.90 | (0.04) | |||||
| Net realized and unrealized gain (loss) on foreign currency transactions | 0.03 | (0.01) | (0.03) | (0.01) | 0.01 | 0.01 | |||||
| Total from investment operations | 4.37 | 1.67 | 1.79 | (0.81) | 2.91 | 0.01 | |||||
| Less distributions: | |||||||||||
| From net investment income | — | (0.05) | — | (0.09) | (0.04) | (0.01) | |||||
| From net realized gain on investments | (0.74) | (0.47) | (0.15) | — | — | — | |||||
| Total distributions | (0.74) | (0.52) | (0.15) | (0.09) | (0.04) | (0.01) | |||||
| Net asset value at end of period | $ 21.90 | $ 18.27 | $ 17.12 | $ 15.48 | $ 16.38 | $ 13.51 | |||||
| Total investment return (b) | 24.26% | 9.84% | 11.74% | (4.98)% | 21.59% | 0.05% | |||||
| Ratios (to average net assets)/Supplemental Data: | |||||||||||
| Net investment income (loss) | (0.31)%†† | (0.09)% | 0.57% | 0.17% | 0.01% | 0.28% (c) | |||||
| Net expenses (d) | 1.19%†† | 1.21% | 1.21% | 1.32% | 1.34% | 1.32% (e) | |||||
| Expenses (before waiver/reimbursement) (d) | 1.35%†† | 1.40% | 1.35% | 1.32% | 1.34% | 1.32% (e) | |||||
| Portfolio turnover rate | 29% | 135% | 58% | 53% | 45% | 33% | |||||
| Net assets at end of period (in 000’s) | $ 79,804 | $ 61,795 | $ 57,566 | $ 59,304 | $ 54,553 | $ 41,891 | |||||
| * | Unaudited. |
| ‡ | Less than one cent per share. |
| †† | Annualized. |
| (a) | Per share data based on average shares outstanding during the period. |
| (b) | Total investment return is calculated exclusive of sales charges and assumes the reinvestment of dividends and distributions. For periods of less than one year, total return is not annualized. |
| (c) | Without the custody fee reimbursement, net investment income (loss) would have been 0.27%. |
| (d) | In addition to the fees and expenses which the Fund bears directly, it also indirectly bears a pro-rata share of the fees and expenses of the underlying funds in which it invests. Such indirect expenses are not included in the above expense ratios. |
| (e) | Without the custody fee reimbursement, net expenses would have been 1.33%. |
| 16 | MainStay MacKay International Equity Fund |
| Six months ended April 30, 2021* | Year Ended October 31, | ||||||||||
| Investor Class | 2020 | 2019 | 2018 | 2017 | 2016 | ||||||
| Net asset value at beginning of period | $ 18.06 | $ 16.94 | $ 15.38 | $ 16.27 | $ 13.43 | $ 13.47 | |||||
| Net investment income (loss) (a) | (0.07) | (0.07) | 0.03 | (0.03) | (0.04) | (0.01) | |||||
| Net realized and unrealized gain (loss) on investments | 4.31 | 1.67 | 1.71 | (0.82) | 2.87 | (0.04) | |||||
| Net realized and unrealized gain (loss) on foreign currency transactions | 0.04 | (0.01) | (0.03) | (0.01) | 0.01 | 0.01 | |||||
| Total from investment operations | 4.28 | 1.59 | 1.71 | (0.86) | 2.84 | (0.04) | |||||
| Less distributions: | |||||||||||
| From net investment income | — | — | — | (0.03) | — | — | |||||
| From net realized gain on investments | (0.74) | (0.47) | (0.15) | — | — | — | |||||
| Total distributions | (0.74) | (0.47) | (0.15) | (0.03) | — | — | |||||
| Net asset value at end of period | $ 21.60 | $ 18.06 | $ 16.94 | $ 15.38 | $ 16.27 | $ 13.43 | |||||
| Total investment return (b) | 24.04% | 9.40% | 11.36% | (5.31)% | 21.15% | (0.30)% | |||||
| Ratios (to average net assets)/Supplemental Data: | |||||||||||
| Net investment income (loss) | (0.65)%†† | (0.43)% | 0.21% | (0.19)% | (0.26)% | (0.11)% (c) | |||||
| Net expenses (d) | 1.52%†† | 1.56% | 1.59% | 1.66% | 1.69% | 1.69% (e) | |||||
| Expenses (before waiver/reimbursement) (d) | 1.68%†† | 1.75% | 1.75% | 1.70% | 1.69% | 1.69% (e) | |||||
| Portfolio turnover rate | 29% | 135% | 58% | 53% | 45% | 33% | |||||
| Net assets at end of period (in 000’s) | $ 24,059 | $ 21,699 | $ 23,870 | $ 21,679 | $ 25,029 | $ 31,523 | |||||
| * | Unaudited. |
| †† | Annualized. |
| (a) | Per share data based on average shares outstanding during the period. |
| (b) | Total investment return is calculated exclusive of sales charges and assumes the reinvestment of dividends and distributions. For periods of less than one year, total return is not annualized. |
| (c) | Without the custody fee reimbursement, net investment income (loss) would have been (0.12)%. |
| (d) | In addition to the fees and expenses which the Fund bears directly, it also indirectly bears a pro-rata share of the fees and expenses of the underlying funds in which it invests. Such indirect expenses are not included in the above expense ratios. |
| (e) | Without the custody fee reimbursement, net expenses would have been 1.70%. |
| Six months ended April 30, 2021* | Year Ended October 31, | ||||||||||
| Class B | 2020 | 2019 | 2018 | 2017 | 2016 | ||||||
| Net asset value at beginning of period | $ 15.74 | $ 14.94 | $ 13.68 | $ 14.55 | $ 12.10 | $ 12.23 | |||||
| Net investment income (loss) (a) | (0.13) | (0.18) | (0.08) | (0.14) | (0.14) | (0.10) | |||||
| Net realized and unrealized gain (loss) on investments | 3.75 | 1.46 | 1.51 | (0.72) | 2.58 | (0.04) | |||||
| Net realized and unrealized gain (loss) on foreign currency transactions | 0.03 | (0.01) | (0.02) | (0.01) | 0.01 | 0.01 | |||||
| Total from investment operations | 3.65 | 1.27 | 1.41 | (0.87) | 2.45 | (0.13) | |||||
| Less distributions: | |||||||||||
| From net realized gain on investments | (0.74) | (0.47) | (0.15) | — | — | — | |||||
| Net asset value at end of period | $ 18.65 | $ 15.74 | $ 14.94 | $ 13.68 | $ 14.55 | $ 12.10 | |||||
| Total investment return (b) | 23.56% | 8.57% | 10.49% | (5.98)% | 20.25% | (1.06)% | |||||
| Ratios (to average net assets)/Supplemental Data: | |||||||||||
| Net investment income (loss) | (1.42)%†† | (1.20)% | (0.59)% | (0.95)% | (1.05)% | (0.86)% (c) | |||||
| Net expenses (d) | 2.27%†† | 2.31% | 2.35% | 2.41% | 2.44% | 2.44% (e) | |||||
| Expenses (before waiver/reimbursement) (d) | 2.43%†† | 2.50% | 2.50% | 2.44% | 2.44% | 2.44% (e) | |||||
| Portfolio turnover rate | 29% | 135% | 58% | 53% | 45% | 33% | |||||
| Net assets at end of period (in 000’s) | $ 2,461 | $ 2,368 | $ 3,345 | $ 4,404 | $ 6,210 | $ 6,991 | |||||
| * | Unaudited. |
| †† | Annualized. |
| (a) | Per share data based on average shares outstanding during the period. |
| (b) | Total investment return is calculated exclusive of sales charges and assumes the reinvestment of dividends and distributions. For periods of less than one year, total return is not annualized. |
| (c) | Without the custody fee reimbursement, net investment income (loss) would have been (0.87)%. |
| (d) | In addition to the fees and expenses which the Fund bears directly, it also indirectly bears a pro-rata share of the fees and expenses of the underlying funds in which it invests. Such indirect expenses are not included in the above expense ratios. |
| (e) | Without the custody fee reimbursement, net expenses would have been 2.45%. |
| Six months ended April 30, 2021* | Year Ended October 31, | ||||||||||
| Class C | 2020 | 2019 | 2018 | 2017 | 2016 | ||||||
| Net asset value at beginning of period | $ 15.75 | $ 14.93 | $ 13.68 | $ 14.56 | $ 12.10 | $ 12.23 | |||||
| Net investment income (loss) (a) | (0.13) | (0.18) | (0.09) | (0.14) | (0.14) | (0.10) | |||||
| Net realized and unrealized gain (loss) on investments | 3.75 | 1.48 | 1.51 | (0.73) | 2.59 | (0.04) | |||||
| Net realized and unrealized gain (loss) on foreign currency transactions | 0.03 | (0.01) | (0.02) | (0.01) | 0.01 | 0.01 | |||||
| Total from investment operations | 3.65 | 1.29 | 1.40 | (0.88) | 2.46 | (0.13) | |||||
| Less distributions: | |||||||||||
| From net realized gain on investments | (0.74) | (0.47) | (0.15) | — | — | — | |||||
| Net asset value at end of period | $ 18.66 | $ 15.75 | $ 14.93 | $ 13.68 | $ 14.56 | $ 12.10 | |||||
| Total investment return (b) | 23.55% | 8.64% | 10.49% | (6.04)% | 20.33% | (1.06)% | |||||
| Ratios (to average net assets)/Supplemental Data: | |||||||||||
| Net investment income (loss) | (1.46)%†† | (1.20)% | (0.65)% | (0.93)% | (1.05)% | (0.84)% (c) | |||||
| Net expenses (d) | 2.27%†† | 2.31% | 2.35% | 2.41% | 2.44% | 2.44% (e) | |||||
| Expenses (before waiver/reimbursement) (d) | 2.43%†† | 2.50% | 2.50% | 2.44% | 2.44% | 2.44% (e) | |||||
| Portfolio turnover rate | 29% | 135% | 58% | 53% | 45% | 33% | |||||
| Net assets at end of period (in 000’s) | $ 2,620 | $ 2,952 | $ 3,915 | $ 6,960 | $ 7,564 | $ 7,850 | |||||
| * | Unaudited. |
| †† | Annualized. |
| (a) | Per share data based on average shares outstanding during the period. |
| (b) | Total investment return is calculated exclusive of sales charges and assumes the reinvestment of dividends and distributions. For periods of less than one year, total return is not annualized. |
| (c) | Without the custody fee reimbursement, net investment income (loss) would have been (0.85)%. |
| (d) | In addition to the fees and expenses which the Fund bears directly, it also indirectly bears a pro-rata share of the fees and expenses of the underlying funds in which it invests. Such indirect expenses are not included in the above expense ratios. |
| (e) | Without the custody fee reimbursement, net expenses would have been 2.45%. |
| 18 | MainStay MacKay International Equity Fund |
| Six months ended April 30, 2021* | Year Ended October 31, | ||||||||||
| Class I | 2020 | 2019 | 2018 | 2017 | 2016 | ||||||
| Net asset value at beginning of period | $ 18.43 | $ 17.28 | $ 15.57 | $ 16.48 | $ 13.59 | $ 13.59 | |||||
| Net investment income (loss) (a) | 0.00‡ | 0.05 | 0.09 | 0.07 | 0.05 | 0.07 | |||||
| Net realized and unrealized gain (loss) on investments | 4.40 | 1.70 | 1.81 | (0.84) | 2.90 | (0.04) | |||||
| Net realized and unrealized gain (loss) on foreign currency transactions | 0.03 | (0.01) | (0.03) | (0.01) | 0.01 | 0.01 | |||||
| Total from investment operations | 4.43 | 1.74 | 1.87 | (0.78) | 2.96 | 0.04 | |||||
| Less distributions: | |||||||||||
| From net investment income | (0.02) | (0.12) | (0.01) | (0.13) | (0.07) | (0.04) | |||||
| From net realized gain on investments | (0.74) | (0.47) | (0.15) | — | — | — | |||||
| Total distributions | (0.76) | (0.59) | (0.16) | (0.13) | (0.07) | (0.04) | |||||
| Net asset value at end of period | $ 22.10 | $ 18.43 | $ 17.28 | $ 15.57 | $ 16.48 | $ 13.59 | |||||
| Total investment return (b) | 24.42% | 10.22% | 12.19% | (4.80)% | 21.94% | 0.29% | |||||
| Ratios (to average net assets)/Supplemental Data: | |||||||||||
| Net investment income (loss) | 0.04%†† | 0.27% | 0.55% | 0.42% | 0.31% | 0.54% (c) | |||||
| Net expenses (d) | 0.85%†† | 0.85% | 0.92% | 1.07% | 1.09% | 1.07% (e) | |||||
| Expenses (before waiver/reimbursement) (d) | 1.10%†† | 1.16% | 1.10% | 1.07% | 1.09% | 1.07% (e) | |||||
| Portfolio turnover rate | 29% | 135% | 58% | 53% | 45% | 33% | |||||
| Net assets at end of period (in 000’s) | $ 47,605 | $ 35,880 | $ 43,280 | $ 213,030 | $ 205,009 | $ 179,274 | |||||
| * | Unaudited. |
| ‡ | Less than one cent per share. |
| †† | Annualized. |
| (a) | Per share data based on average shares outstanding during the period. |
| (b) | Total investment return is calculated exclusive of sales charges and assumes the reinvestment of dividends and distributions. Class I shares are not subject to sales charges. For periods of less than one year, total return is not annualized. |
| (c) | Without the custody fee reimbursement, net investment income (loss) would have been 0.53%. |
| (d) | In addition to the fees and expenses which the Fund bears directly, it also indirectly bears a pro-rata share of the fees and expenses of the underlying funds in which it invests. Such indirect expenses are not included in the above expense ratios. |
| (e) | Without the custody fee reimbursement, net expenses would have been 1.08%. |
| Six months ended April 30, 2021* | Year Ended October 31, | ||||||||||
| Class R1 | 2020 | 2019 | 2018 | 2017 | 2016 | ||||||
| Net asset value at beginning of period | $ 18.31 | $ 17.15 | $ 15.48 | $ 16.38 | $ 13.51 | $ 13.51 | |||||
| Net investment income (loss) (a) | (0.02) | (0.01) | 0.05 | 0.05 | 0.03 | 0.06 | |||||
| Net realized and unrealized gain (loss) on investments | 4.37 | 1.72 | 1.80 | (0.83) | 2.89 | (0.05) | |||||
| Net realized and unrealized gain (loss) on foreign currency transactions | 0.03 | (0.01) | (0.03) | (0.01) | 0.01 | 0.01 | |||||
| Total from investment operations | 4.38 | 1.70 | 1.82 | (0.79) | 2.93 | 0.02 | |||||
| Less distributions: | |||||||||||
| From net investment income | — | (0.07) | — | (0.11) | (0.06) | (0.02) | |||||
| From net realized gain on investments | (0.74) | (0.47) | (0.15) | — | — | — | |||||
| Total distributions | (0.74) | (0.54) | (0.15) | (0.11) | (0.06) | (0.02) | |||||
| Net asset value at end of period | $ 21.95 | $ 18.31 | $ 17.15 | $ 15.48 | $ 16.38 | $ 13.51 | |||||
| Total investment return (b) | 24.27% | 10.05% | 11.93% | (4.86)% | 21.78% | 0.18% | |||||
| Ratios (to average net assets)/Supplemental Data: | |||||||||||
| Net investment income (loss) | (0.15)%†† | (0.05)% | 0.33% | 0.29% | 0.21% | 0.41% (c) | |||||
| Net expenses (d) | 1.04%†† | 1.06% | 1.11% | 1.17% | 1.19% | 1.17% (e) | |||||
| Expenses (before waiver/reimbursement) (d) | 1.20%†† | 1.25% | 1.19% | 1.17% | 1.19% | 1.17% (e) | |||||
| Portfolio turnover rate | 29% | 135% | 58% | 53% | 45% | 33% | |||||
| Net assets at end of period (in 000’s) | $ 182 | $ 143 | $ 265 | $ 2,109 | $ 2,616 | $ 2,478 | |||||
| * | Unaudited. |
| †† | Annualized. |
| (a) | Per share data based on average shares outstanding during the period. |
| (b) | Total investment return is calculated exclusive of sales charges and assumes the reinvestment of dividends and distributions. Class R1 shares are not subject to sales charges. For periods of less than one year, total return is not annualized. |
| (c) | Without the custody fee reimbursement, net investment income (loss) would have been 0.40%. |
| (d) | In addition to the fees and expenses which the Fund bears directly, it also indirectly bears a pro-rata share of the fees and expenses of the underlying funds in which it invests. Such indirect expenses are not included in the above expense ratios. |
| (e) | Without the custody fee reimbursement, net expenses would have been 1.18%. |
| 20 | MainStay MacKay International Equity Fund |
| Six months ended April 30, 2021* | Year Ended October 31, | ||||||||||
| Class R2 | 2020 | 2019 | 2018 | 2017 | 2016 | ||||||
| Net asset value at beginning of period | $ 18.30 | $ 17.15 | $ 15.52 | $ 16.42 | $ 13.54 | $ 13.54 | |||||
| Net investment income (loss) (a) | (0.04) | (0.03) | 0.06 | (0.02) | 0.01 | 0.01 | |||||
| Net realized and unrealized gain (loss) on investments | 4.37 | 1.69 | 1.75 | (0.79) | 2.88 | (0.01) | |||||
| Net realized and unrealized gain (loss) on foreign currency transactions | 0.03 | (0.01) | (0.03) | (0.01) | 0.01 | 0.00‡ | |||||
| Total from investment operations | 4.36 | 1.65 | 1.78 | (0.82) | 2.90 | 0.00‡ | |||||
| Less distributions: | |||||||||||
| From net investment income | — | (0.03) | — | (0.08) | (0.02) | — | |||||
| From net realized gain on investments | (0.74) | (0.47) | (0.15) | — | — | — | |||||
| Total distributions | (0.74) | (0.50) | (0.15) | (0.08) | (0.02) | — | |||||
| Net asset value at end of period | $ 21.92 | $ 18.30 | $ 17.15 | $ 15.52 | $ 16.42 | $ 13.54 | |||||
| Total investment return (b) | 24.17% | 9.72% | 11.64% | (5.06)% (c) | 21.55% (c) | (0.07)% | |||||
| Ratios (to average net assets)/Supplemental Data: | |||||||||||
| Net investment income (loss) | (0.42)%†† | (0.18)% | 0.38% | (0.13)% | 0.06% | 0.08% | |||||
| Net expenses (d) | 1.29%†† | 1.31% | 1.31% | 1.42% | 1.44% | 1.42% | |||||
| Expenses (before waiver/reimbursement) (d) | 1.45%†† | 1.50% | 1.45% | 1.42% | 1.44% | 1.42% | |||||
| Portfolio turnover rate | 29% | 135% | 58% | 53% | 45% | 33% | |||||
| Net assets at end of period (in 000’s) | $ 472 | $ 486 | $ 454 | $ 602 | $ 1,201 | $ 847 | |||||
| * | Unaudited. |
| ‡ | Less than one cent per share. |
| †† | Annualized. |
| (a) | Per share data based on average shares outstanding during the period. |
| (b) | Total investment return is calculated exclusive of sales charges and assumes the reinvestment of dividends and distributions. Class R2 shares are not subject to sales charges. For periods of less than one year, total return is not annualized. |
| (c) | Total investment return may reflect adjustments to conform to generally accepted accounting principles. |
| (d) | In addition to the fees and expenses which the Fund bears directly, it also indirectly bears a pro-rata share of the fees and expenses of the underlying funds in which it invests. Such indirect expenses are not included in the above expense ratios. |
| Six months ended April 30, 2021* | Year Ended October 31, | ||||||||||
| Class R3 | 2020 | 2019 | 2018 | 2017 | 2016 | ||||||
| Net asset value at beginning of period | $ 18.08 | $ 16.96 | $ 15.38 | $ 16.29 | $ 13.44 | $ 13.48 | |||||
| Net investment income (loss) (a) | (0.07) | (0.08) | 0.03 | (0.04) | (0.04) | (0.01) | |||||
| Net realized and unrealized gain (loss) on investments | 4.31 | 1.68 | 1.73 | (0.82) | 2.88 | (0.04) | |||||
| Net realized and unrealized gain (loss) on foreign currency transactions | 0.03 | (0.01) | (0.03) | (0.01) | 0.01 | 0.01 | |||||
| Total from investment operations | 4.27 | 1.59 | 1.73 | (0.87) | 2.85 | (0.04) | |||||
| Less distributions: | |||||||||||
| From net investment income | — | — | — | (0.04) | — | — | |||||
| From net realized gain on investments | (0.74) | (0.47) | (0.15) | — | — | — | |||||
| Total distributions | (0.74) | (0.47) | (0.15) | (0.04) | — | — | |||||
| Net asset value at end of period | $ 21.61 | $ 18.08 | $ 16.96 | $ 15.38 | $ 16.29 | $ 13.44 | |||||
| Total investment return (b) | 23.96% | 9.46% | 11.35% | (5.39)% (c) | 21.21% | (0.30)% | |||||
| Ratios (to average net assets)/Supplemental Data: | |||||||||||
| Net investment income (loss) | (0.66)%†† | (0.46)% | 0.22% | (0.21)% | (0.27)% | (0.11)% (d) | |||||
| Net expenses (e) | 1.54%†† | 1.56% | 1.56% | 1.67% | 1.69% | 1.67% (f) | |||||
| Expenses (before waiver/reimbursement) (e) | 1.70%†† | 1.75% | 1.70% | 1.67% | 1.69% | 1.67% (f) | |||||
| Portfolio turnover rate | 29% | 135% | 58% | 53% | 45% | 33% | |||||
| Net assets at end of period (in 000’s) | $ 1,452 | $ 1,140 | $ 1,154 | $ 1,057 | $ 1,446 | $ 1,108 | |||||
| * | Unaudited. |
| †† | Annualized. |
| (a) | Per share data based on average shares outstanding during the period. |
| (b) | Total investment return is calculated exclusive of sales charges and assumes the reinvestment of dividends and distributions. Class R3 shares are not subject to sales charges. For periods of less than one year, total return is not annualized. |
| (c) | Total investment return may reflect adjustments to conform to generally accepted accounting principles. |
| (d) | Without the custody fee reimbursement, net investment income (loss) would have been (0.12)%. |
| (e) | In addition to the fees and expenses which the Fund bears directly, it also indirectly bears a pro-rata share of the fees and expenses of the underlying funds in which it invests. Such indirect expenses are not included in the above expense ratios. |
| (f) | Without the custody fee reimbursement, net expenses would have been 1.68%. |
| 22 | MainStay MacKay International Equity Fund |
| Six months ended April 30, 2021* | Year Ended October 31, | February 28, 2019 through October 31, 2019^ | |||
| Class R6 | 2020 | ||||
| Net asset value at beginning of period | $ 18.45 | $ 17.28 | $ 16.13 | ||
| Net investment income (loss) (a) | 0.00‡ | 0.05 | 0.15 | ||
| Net realized and unrealized gain (loss) on investments | 4.41 | 1.71 | 1.02 | ||
| Net realized and unrealized gain (loss) on foreign currency transactions | 0.03 | (0.01) | (0.02) | ||
| Total from investment operations | 4.44 | 1.75 | 1.15 | ||
| Less distributions: | |||||
| From net investment income | (0.03) | (0.11) | — | ||
| From net realized gain on investments | (0.74) | (0.47) | — | ||
| Total distributions | (0.77) | (0.58) | — | ||
| Net asset value at end of period | $ 22.12 | $ 18.45 | $ 17.28 | ||
| Total investment return (b) | 24.40% | 10.27% | 7.13% | ||
| Ratios (to average net assets)/Supplemental Data: | |||||
| Net investment income (loss) | 0.05%†† | 0.31% | 1.37%†† | ||
| Net expenses (c) | 0.83%†† | 0.83% | 0.83%†† | ||
| Expenses (before waiver/reimbursement) (c) | 0.99%†† | 1.02% | 1.00%†† | ||
| Portfolio turnover rate | 29% | 135% | 58% | ||
| Net assets at end of period (in 000’s) | $ 250,838 | $ 201,210 | $ 177,483 |
| * | Unaudited. |
| ^ | Inception date. |
| ‡ | Less than one cent per share. |
| †† | Annualized. |
| (a) | Per share data based on average shares outstanding during the period. |
| (b) | Total investment return is calculated exclusive of sales charges and assumes the reinvestment of dividends and distributions. Class R6 shares are not subject to sales charges. For periods of less than one year, total return is not annualized. |
| (c) | In addition to the fees and expenses which the Fund bears directly, it also indirectly bears a pro-rata share of the fees and expenses of the underlying funds in which it invests. Such indirect expenses are not included in the above expense ratios. |
| Class | Commenced Operations |
| Class A | January 3, 1995 |
| Investor Class | February 28, 2008 |
| Class B | September 13, 1994 |
| Class C | September 1, 1998 |
| Class I | January 2, 2004 |
| Class R1 | January 2, 2004 |
| Class R2 | January 2, 2004 |
| Class R3 | April 28, 2006 |
| Class R6 | February 28, 2019 |
| SIMPLE Class | N/A* |
| * | SIMPLE Class shares were registered for sale effective as of August 31, 2020 but have not yet commenced operations. |
| 24 | MainStay MacKay International Equity Fund |
| • | Level 1—quoted prices in active markets for an identical asset or liability |
| • | Level 2—other significant observable inputs (including quoted prices for a similar asset or liability in active markets, interest rates and yield curves, prepayment speeds, credit risk, etc.) |
| • | Level 3—significant unobservable inputs (including the Fund's own assumptions about the assumptions that market participants would use in measuring fair value of an asset or liability) |
| • Broker/dealer quotes | • Benchmark securities |
| • Two-sided markets | • Reference data (corporate actions or material event notices) |
| • Bids/offers | • Monthly payment information |
| • Industry and economic events | • Reported trades |
| 26 | MainStay MacKay International Equity Fund |
| 28 | MainStay MacKay International Equity Fund |
| Class R1 | $ 83 |
| Class R2 | 283 |
| Class R3 | 678 |
| Class | Expense | Waived |
| Class A | $41,822 | $— |
| Investor Class | 52,238 | — |
| Class B | 5,647 | — |
| Class C | 6,753 | — |
| Class I | 24,325 | — |
| Class R1 | 94 | — |
| Class R2 | 321 | — |
| Class R3 | 770 | — |
| Class R6 | 4,747 | — |
| Affiliated Investment Companies | Value, Beginning of Period | Purchases at Cost | Proceeds from Sales | Net Realized Gain/(Loss) on Sales | Change in Unrealized Appreciation/ (Depreciation) | Value, End of Period | Dividend Income | Other Distributions | Shares End of Period |
| MainStay U.S. Government Liquidity Fund | $ 565 | $ 13,753 | $ (13,819) | $ — | $ — | $ 499 | $ —(a) | $ — | 499 |
| (a) | Less than $500. |
| Class R6 | $106,454,385 | 42.4% |
| Federal Tax Cost | Gross Unrealized Appreciation | Gross Unrealized (Depreciation) | Net Unrealized Appreciation/ (Depreciation) | |
| Investments | $318,912,848 | $95,709,819 | $(1,460,625) | $94,249,194 |
| 2020 | |
| Distributions paid from: | |
| Ordinary Income | $ 1,693,597 |
| Long-Term Capital Gains | 8,715,133 |
| Total | $10,408,730 |
| 30 | MainStay MacKay International Equity Fund |
| Class A | Shares | Amount |
| Period ended April 30, 2021: | ||
| Shares sold | 277,044 | $ 5,809,884 |
| Shares issued to shareholders in reinvestment of distributions | 122,230 | 2,462,926 |
| Shares redeemed | (271,221) | (5,651,797) |
| Net increase (decrease) in shares outstanding before conversion | 128,053 | 2,621,013 |
| Shares converted into Class A (See Note 1) | 135,218 | 2,803,670 |
| Shares converted from Class A (See Note 1) | (115) | (2,340) |
| Net increase (decrease) | 263,156 | $ 5,422,343 |
| Year ended October 31, 2020: | ||
| Shares sold | 305,883 | $ 5,330,979 |
| Shares issued to shareholders in reinvestment of distributions | 95,951 | 1,698,341 |
| Shares redeemed | (600,551) | (10,083,501) |
| Net increase (decrease) in shares outstanding before conversion | (198,717) | (3,054,181) |
| Shares converted into Class A (See Note 1) | 223,664 | 4,030,614 |
| Shares converted from Class A (See Note 1) | (5,124) | (79,523) |
| Net increase (decrease) | 19,823 | $ 896,910 |
| Investor Class | Shares | Amount |
| Period ended April 30, 2021: | ||
| Shares sold | 31,183 | $ 646,585 |
| Shares issued to shareholders in reinvestment of distributions | 44,112 | 877,820 |
| Shares redeemed | (51,158) | (1,055,262) |
| Net increase (decrease) in shares outstanding before conversion | 24,137 | 469,143 |
| Shares converted into Investor Class (See Note 1) | 15,207 | 313,756 |
| Shares converted from Investor Class (See Note 1) | (126,794) | (2,593,639) |
| Net increase (decrease) | (87,450) | $ (1,810,740) |
| Year ended October 31, 2020: | ||
| Shares sold | 83,420 | $ 1,384,378 |
| Shares issued to shareholders in reinvestment of distributions | 37,405 | 656,557 |
| Shares redeemed | (147,323) | (2,489,350) |
| Net increase (decrease) in shares outstanding before conversion | (26,498) | (448,415) |
| Shares converted into Investor Class (See Note 1) | 27,800 | 458,079 |
| Shares converted from Investor Class (See Note 1) | (208,691) | (3,739,070) |
| Net increase (decrease) | (207,389) | $ (3,729,406) |
| Class B | Shares | Amount |
| Period ended April 30, 2021: | ||
| Shares sold | 2,380 | $ 42,686 |
| Shares issued to shareholders in reinvestment of distributions | 6,071 | 104,666 |
| Shares redeemed | (9,886) | (177,760) |
| Net increase (decrease) in shares outstanding before conversion | (1,435) | (30,408) |
| Shares converted from Class B (See Note 1) | (17,040) | (305,411) |
| Net increase (decrease) | (18,475) | $ (335,819) |
| Year ended October 31, 2020: | ||
| Shares sold | 1,072 | $ 15,470 |
| Shares issued to shareholders in reinvestment of distributions | 6,316 | 97,267 |
| Shares redeemed | (39,599) | (579,400) |
| Net increase (decrease) in shares outstanding before conversion | (32,211) | (466,663) |
| Shares converted from Class B (See Note 1) | (41,338) | (610,299) |
| Net increase (decrease) | (73,549) | $ (1,076,962) |
| Class C | Shares | Amount |
| Period ended April 30, 2021: | ||
| Shares sold | 4,946 | $ 89,047 |
| Shares issued to shareholders in reinvestment of distributions | 7,760 | 133,783 |
| Shares redeemed | (47,615) | (852,120) |
| Net increase (decrease) in shares outstanding before conversion | (34,909) | (629,290) |
| Shares converted from Class C (See Note 1) | (12,108) | (216,036) |
| Net increase (decrease) | (47,017) | $ (845,326) |
| Year ended October 31, 2020: | ||
| Shares sold | 17,456 | $ 265,182 |
| Shares issued to shareholders in reinvestment of distributions | 7,668 | 118,089 |
| Shares redeemed | (95,370) | (1,445,206) |
| Net increase (decrease) in shares outstanding before conversion | (70,246) | (1,061,935) |
| Shares converted from Class C (See Note 1) | (4,412) | (64,219) |
| Net increase (decrease) | (74,658) | $ (1,126,154) |
| Class I | Shares | Amount |
| Period ended April 30, 2021: | ||
| Shares sold | 274,249 | $ 5,806,319 |
| Shares issued to shareholders in reinvestment of distributions | 71,624 | 1,454,680 |
| Shares redeemed | (138,770) | (2,926,329) |
| Net increase (decrease) | 207,103 | $ 4,334,670 |
| Year ended October 31, 2020: | ||
| Shares sold | 176,080 | $ 3,133,855 |
| Shares issued to shareholders in reinvestment of distributions | 80,878 | 1,438,833 |
| Shares redeemed | (815,405) | (13,551,566) |
| Net increase (decrease) in shares outstanding before conversion | (558,447) | (8,978,878) |
| Shares converted into Class I (See Note 1) | 232 | 4,418 |
| Net increase (decrease) | (558,215) | $ (8,974,460) |
| Class R1 | Shares | Amount |
| Period ended April 30, 2021: | ||
| Shares sold | 695 | $ 14,680 |
| Shares issued to shareholders in reinvestment of distributions | 287 | 5,793 |
| Shares redeemed | (493) | (10,141) |
| Net increase (decrease) | 489 | $ 10,332 |
| Year ended October 31, 2020: | ||
| Shares sold | 1,016 | $ 17,294 |
| Shares issued to shareholders in reinvestment of distributions | 478 | 8,457 |
| Shares redeemed | (9,157) | (160,158) |
| Net increase (decrease) | (7,663) | $ (134,407) |
| Class R2 | Shares | Amount |
| Period ended April 30, 2021: | ||
| Shares sold | 660 | $ 14,055 |
| Shares issued to shareholders in reinvestment of distributions | 697 | 14,076 |
| Shares redeemed | (6,351) | (140,877) |
| Net increase (decrease) | (4,994) | $ (112,746) |
| Year ended October 31, 2020: | ||
| Shares sold | 1,521 | $ 26,460 |
| Shares issued to shareholders in reinvestment of distributions | 501 | 8,885 |
| Shares redeemed | (1,949) | (34,210) |
| Net increase (decrease) | 73 | $ 1,135 |
| Class R3 | Shares | Amount |
| Period ended April 30, 2021: | ||
| Shares sold | 7,030 | $ 145,065 |
| Shares issued to shareholders in reinvestment of distributions | 2,389 | 47,594 |
| Shares redeemed | (5,338) | (111,156) |
| Net increase (decrease) | 4,081 | $ 81,503 |
| Year ended October 31, 2020: | ||
| Shares sold | 14,635 | $ 248,807 |
| Shares issued to shareholders in reinvestment of distributions | 1,793 | 31,478 |
| Shares redeemed | (21,410) | (336,531) |
| Net increase (decrease) | (4,982) | $ (56,246) |
| Class R6 | Shares | Amount |
| Period ended April 30, 2021: | ||
| Shares sold | 530,047 | $ 11,233,217 |
| Shares issued to shareholders in reinvestment of distributions | 413,513 | 8,406,730 |
| Shares redeemed | (513,643) | (10,940,783) |
| Net increase (decrease) | 429,917 | $ 8,699,164 |
| Year ended October 31, 2020: | ||
| Shares sold | 1,496,857 | $ 26,866,856 |
| Shares issued to shareholders in reinvestment of distributions | 354,425 | 6,312,311 |
| Shares redeemed | (1,215,108) | (20,805,479) |
| Net increase (decrease) | 636,174 | $ 12,373,688 |
| 32 | MainStay MacKay International Equity Fund |
| 34 | MainStay MacKay International Equity Fund |
| 36 | MainStay MacKay International Equity Fund |
| 38 | MainStay MacKay International Equity Fund |
| 40 | MainStay MacKay International Equity Fund |
1.
| 2. | This Fund is registered for sale in CA, CT, DE, FL, MA, NJ, NY and VT. |
| 3. | An affiliate of New York Life Investment Management LLC. |
| 1737261MS071-21 | MSIE10-06/21 |
please log in to newyorklifeinvestments.com/accounts.
| Not FDIC/NCUA Insured | Not a Deposit | May Lose Value | No Bank Guarantee | Not Insured by Any Government Agency |


President
| Average Annual Total Returns for the Period-Ended April 30, 2021 | ||||||||
| Class | Sales Charge | Inception Date | Six Months | One Year | Five Years or Since Inception | Ten Years or Since Inception | Gross Expense Ratio1 | |
| Class A Shares | Maximum 4.5% Initial Sales Charge | With sales charges | 2/28/1997 | -0.26% | 7.11% | 3.27% | 3.18% | 1.19% |
| Excluding sales charges | 4.44 | 12.16 | 4.22 | 3.65 | 1.19 | |||
| Investor Class Shares2 | Maximum 4.0% Initial Sales Charge | With sales charges | 2/28/2008 | 0.17 | 7.00 | 3.21 | 3.10 | 1.25 |
| Excluding sales charges | 4.34 | 12.05 | 4.17 | 3.58 | 1.25 | |||
| Class B Shares3 | Maximum 5% CDSC | With sales charges | 2/28/1997 | -1.11 | 6.12 | 3.04 | 2.80 | 2.01 |
| if Redeemed Within the First Six Years of Purchase | Excluding sales charges | 3.89 | 11.12 | 3.39 | 2.80 | 2.01 | ||
| Class C Shares | Maximum 1% CDSC | With sales charges | 9/1/1998 | 3.01 | 10.25 | 3.42 | 2.80 | 2.01 |
| if Redeemed Within One Year of Purchase | Excluding sales charges | 4.01 | 11.25 | 3.42 | 2.80 | 2.01 | ||
| Class I Shares | No Sales Charge | 1/2/2004 | 4.56 | 12.42 | 4.48 | 3.91 | 0.95 | |
| Class R2 Shares | No Sales Charge | 2/28/2014 | 4.27 | 12.16 | 4.12 | 2.64 | 1.30 | |
| Class R3 Shares | No Sales Charge | 2/29/2016 | 4.25 | 11.74 | 3.84 | 4.75 | 1.53 | |
| Class R6 Shares | No Sales Charge | 2/28/2018 | 4.61 | 13.05 | 4.30 | N/A | 0.83 | |
| 1. | The gross expense ratios presented reflect the Fund’s “Total Annual Fund Operating Expenses” from the most recent Prospectus, as supplemented, and may differ from other expense ratios disclosed in this report. |
| 2. | Prior to June 30, 2020, the maximum initial sales charge was 4.5%, which is reflected in the average annual total return figures shown. |
| 3. | Class B shares are closed to all new purchases as well as additional investments by existing Class B shareholders. |
| Benchmark Performance | Six Months | One Year | Five Years | Ten Years |
| Bloomberg Barclays U.S. Aggregate Bond Index1 | -1.52% | -0.27% | 3.19% | 3.39% |
| ICE BofA U.S. Dollar 3-Month Deposit Offered Rate Constant Maturity Index2 | 0.11 | 0.34 | 1.48 | 0.90 |
| Morningstar Nontraditional Bond Category Average3 | 4.64 | 10.87 | 3.47 | 2.34 |
| 1. | The Bloomberg Barclays U.S. Aggregate Bond Index is a broad-based benchmark that measures the investment grade, U.S. dollar-denominated, fixed-rate taxable bond market, including Treasurys, government-related and corporate securities, mortgage-backed securities (agency fixed-rate and hybrid adjustable rate mortgage passthroughs), asset-backed securities, and commercial mortgage-backed securities. Results assume reinvestment of all dividends and capital gains. An investment cannot be made directly in an index. |
| 2. | The Fund has selected the ICE BofA U.S. Dollar 3-Month Deposit Offered Rate Constant Maturity Index as a secondary benchmark. The ICE BofA U.S. Dollar 3-Month Deposit Offered Rate Constant Maturity Index is unmanaged and tracks the performance of a synthetic asset paying London Interbank Offered Rate to a stated maturity. The index is based on the assumed purchase at par of a synthetic instrument having exactly its stated maturity and with a coupon equal to that day’s fixing rate. That issue is assumed to be sold the following business day (priced at a yield equal to the current day fixing rate) and rolled into a new instrument. Results assume reinvestment of all dividends and capital gains. An investment cannot be made directly in an index. |
| 3. | The Fund has selected the Morningstar Nontraditional Bond Category Average as an additional benchmark. The Morningstar Nontraditional Bond Category Average contains funds that pursue strategies divergent in one or more ways from conventional practice in the broader bond-fund universe. Morningstar category averages are equal-weighted returns based on constituents of the category at the end of the period. Results assume reinvestment of all dividends and capital gains. An investment cannot be made directly in an index. |
| 6 | MainStay MacKay Strategic Bond Fund |
| Share Class | Beginning Account Value 11/1/20 | Ending Account Value (Based on Actual Returns and Expenses) 4/30/21 | Expenses Paid During Period1 | Ending Account Value (Based on Hypothetical 5% Annualized Return and Actual Expenses) 4/30/21 | Expenses Paid During Period1 | Net Expense Ratio During Period2, 3 |
| Class A Shares | $1,000.00 | $1,044.40 | $5.53 | $1,019.39 | $5.46 | 1.09% |
| Investor Class Shares | $1,000.00 | $1,043.40 | $6.03 | $1,018.89 | $5.96 | 1.19% |
| Class B Shares | $1,000.00 | $1,038.90 | $9.81 | $1,015.17 | $9.69 | 1.94% |
| Class C Shares | $1,000.00 | $1,040.10 | $9.81 | $1,015.17 | $9.69 | 1.94% |
| Class I Shares | $1,000.00 | $1,045.60 | $4.26 | $1,020.63 | $4.21 | 0.84% |
| Class R2 Shares | $1,000.00 | $1,042.70 | $6.03 | $1,018.89 | $5.96 | 1.19% |
| Class R3 Shares | $1,000.00 | $1,042.50 | $7.29 | $1,017.65 | $7.20 | 1.44% |
| Class R6 Shares | $1,000.00 | $1,046.10 | $3.60 | $1,021.27 | $3.56 | 0.71% |
| 1. | Expenses are equal to the Fund’s annualized expense ratio of each class multiplied by the average account value over the period, divided by 365 and multiplied by 181 (to reflect the six-month period). The table above represents the actual expenses incurred during the six-month period. In addition to the fees and expenses which the Fund bears directly, it also indirectly bears a pro rata share of the fees and expenses of the underlying funds in which it invests. Such indirect expenses are not included in the above-reported expense figures. |
| 2. | Expenses are equal to the Fund's annualized expense ratio to reflect the six-month period. |
| 3. | Expenses are inclusive of dividends and interest on investments sold short. |
| 1. | U.S. Treasury Inflation Linked Notes, 0.125%-0.875%, due 1/15/29–7/15/30 |
| 2. | FNMA, 2.00%-5.806%, due 4/25/28–3/25/60 |
| 3. | Bank of America Corp., 2.676%-8.57%, due 11/15/24–6/19/41 |
| 4. | Wells Fargo Commercial Mortgage Trust, 3.04%-4.194%, due 6/15/36–10/15/52 |
| 5. | FHLMC Structured Agency Credit Risk Debt Notes, 3.656%-4.006%, due 3/25/29–8/25/29 |
| 6. | BX Trust, 0.915%-3.856%, due 5/15/30–12/9/41 |
| 7. | Ally Financial, Inc., 5.75%-8.00%, due 11/20/25–11/1/31 |
| 8. | Air Lease Corp., 2.30%-3.25%, due 2/1/25–3/1/25 |
| 9. | JPMorgan Chase & Co., 2.956%-4.60%, due 2/1/25–4/22/52 |
| 10. | Marathon Petroleum Corp., 4.50%-5.125%, due 5/1/23–5/1/25 |
| 8 | MainStay MacKay Strategic Bond Fund |
| 1. | See page 5 for other share class returns, which may be higher or lower than Class I share returns. See page 6 for more information on benchmark and peer group returns. |
| 2. | Duration is a measure of the price sensitivity of a fixed-income investment to changes in interest rates. Duration is expressed as a number of years and is considered a more accurate sensitivity gauge than average maturity. |
| 3. | The terms “spread” and “yield spread” may refer to the difference in yield between a security or type of security and comparable U.S. Treasury issues. The terms may also refer to the difference in yield between two specific securities or types of securities at a given time. |
| 4. | The yield curve is a line that plots the yields of various securities of similar quality—typically U.S. Treasury issues—across a range of maturities. The U.S. Treasury yield curve serves as a benchmark for other debt and is used in economic forecasting. |
| 5. | An obligation rated ‘AAA’ has the highest rating assigned by Standard & Poor’s (“S&P”), and in the opinion of S&P, the obligor’s capacity to meet its financial commitment on the obligation is extremely strong. When applied to Fund holdings, ratings are based solely on the creditworthiness of the bonds in the portfolio and are not meant to represent the security or safety of the Fund. |
| 10 | MainStay MacKay Strategic Bond Fund |
| Principal Amount | Value | |
| Long-Term Bonds 97.6% | ||
| Asset-Backed Securities 10.3% | ||
| Automobile Asset-Backed Securities 2.2% | ||
| American Credit Acceptance Receivables Trust | ||
| Series 2020-2, Class C | ||
| 3.88%, due 4/13/26 (a) | $ 2,725,000 | $ 2,870,409 |
| Avis Budget Rental Car Funding AESOP LLC (a) | ||
| Series 2020-2A, Class A | ||
| 2.02%, due 2/20/27 | 1,425,000 | 1,460,156 |
| Series 2020-1A, Class A | ||
| 2.33%, due 8/20/26 | 1,360,000 | 1,416,840 |
| Series 2017-2A, Class A | ||
| 2.97%, due 3/20/24 | 1,095,000 | 1,140,314 |
| Series 2018-2A, Class A | ||
| 4.00%, due 3/20/25 | 1,405,000 | 1,522,615 |
| Drive Auto Receivables Trust | ||
| Series 2021-1, Class D | ||
| 1.45%, due 1/16/29 | 2,000,000 | 2,004,931 |
| Ford Credit Floorplan Master Owner Trust | ||
| Series 2019-4, Class A | ||
| 2.44%, due 9/15/26 | 1,465,000 | 1,547,211 |
| Series 2018-4, Class A | ||
| 4.06%, due 11/15/30 | 1,570,000 | 1,784,692 |
| Santander Revolving Auto Loan Trust | ||
| Series 2019-A, Class A | ||
| 2.51%, due 1/26/32 (a) | 910,000 | 957,468 |
| 14,704,636 | ||
| Home Equity Asset-Backed Securities 0.6% | ||
| Carrington Mortgage Loan Trust | ||
| Series 2007-HE1, Class A3 | ||
| 0.296% (1 Month LIBOR + 0.19%), due 6/25/37 (b) | 3,105,488 | 3,060,688 |
| First NLC Trust | ||
| Series 2007-1, Class A1 | ||
| 0.176% (1 Month LIBOR + 0.07%), due 8/25/37 (a)(b) | 280,042 | 176,685 |
| GSAA Home Equity Trust | ||
| Series 2007-8, Class A3 | ||
| 0.556% (1 Month LIBOR + 0.45%), due 8/25/37 (b) | 100,072 | 99,918 |
| JPMorgan Mortgage Acquisition Trust | ||
| Series 2007-HE1, Class AF1 | ||
| 0.206% (1 Month LIBOR + 0.10%), due 3/25/47 (b) | 98,228 | 63,134 |
| Mastr Asset-Backed Securities Trust | ||
| Series 2006-HE4, Class A1 | ||
| 0.206% (1 Month LIBOR + 0.10%), due 11/25/36 (b) | 76,099 | 34,490 |
| Principal Amount | Value | |
| Home Equity Asset-Backed Securities (continued) | ||
| Morgan Stanley ABS Capital I, Inc. Trust (b) | ||
| Series 2007-HE4, Class A2A | ||
| 0.216% (1 Month LIBOR + 0.11%), due 2/25/37 | $ 79,315 | $ 32,727 |
| Series 2007-HE7, Class M1 | ||
| 2.106% (1 Month LIBOR + 2.00%), due 7/25/37 | 635,000 | 646,852 |
| 4,114,494 | ||
| Other Asset-Backed Securities 7.5% | ||
| American Airlines Pass-Through Trust | ||
| Series 2016-1, Class A | ||
| 4.10%, due 1/15/28 | 1,001,658 | 986,380 |
| Series 2013-2, Class A | ||
| 4.95%, due 1/15/23 | 2,870,777 | 2,900,093 |
| Series 2016-1, Class B | ||
| 5.25%, due 1/15/24 | 1,095,394 | 1,068,087 |
| CF Hippolyta LLC (a) | ||
| Series 2020-1, Class A1 | ||
| 1.69%, due 7/15/60 | 1,670,163 | 1,693,300 |
| Series 2021-1A, Class B1 | ||
| 1.98%, due 3/15/61 | 1,075,000 | 1,079,296 |
| Series 2020-1, Class A2 | ||
| 1.99%, due 7/15/60 | 1,056,137 | 1,058,517 |
| Continental Airlines Pass-Through Trust | ||
| Series 2007-1, Class A | ||
| 5.983%, due 4/19/22 | 1,396,062 | 1,435,689 |
| Crown Castle Towers LLC | ||
| 4.241%, due 7/15/28 (a) | 3,825,000 | 4,295,751 |
| CVS Pass-Through Trust | ||
| 5.789%, due 1/10/26 (a) | 34,770 | 38,240 |
| DB Master Finance LLC | ||
| Series 2019-1A, Class A23 | ||
| 4.352%, due 5/20/49 (a) | 1,428,250 | 1,530,056 |
| Delta Air Lines Pass-Through Trust | ||
| Series 2019-1, Class AA | ||
| 3.204%, due 4/25/24 | 3,360,000 | 3,522,182 |
| Domino's Pizza Master Issuer LLC (a) | ||
| Series 2018-1A, Class A2I | ||
| 4.116%, due 7/25/48 | 156,000 | 163,485 |
| Series 2015-1A, Class A2II | ||
| 4.474%, due 10/25/45 | 2,459,125 | 2,592,975 |
| Hilton Grand Vacations Trust (a) | ||
| Series 2019-AA, Class A | ||
| 2.34%, due 7/25/33 | 1,966,548 | 2,028,107 |
| Series 2020-AA, Class A | ||
| 2.74%, due 2/25/39 | 1,152,272 | 1,198,676 |
| Principal Amount | Value | |
| Asset-Backed Securities (continued) | ||
| Other Asset-Backed Securities (continued) | ||
| Hilton Grand Vacations Trust (a) (continued) | ||
| Series 2020-AA, Class B | ||
| 4.22%, due 2/25/39 | $ 1,033,327 | $ 1,101,328 |
| MVW LLC | ||
| Series 2019-2A, Class A | ||
| 2.22%, due 10/20/38 (a) | 1,842,079 | 1,881,011 |
| Navient Private Education Refi Loan Trust (a) | ||
| Series 2020-GA, Class B | ||
| 2.50%, due 9/16/69 | 1,145,000 | 1,148,234 |
| Series 2020-HA, Class B | ||
| 2.78%, due 1/15/69 | 500,000 | 495,287 |
| PFS Financing Corp. (a) | ||
| Series 2020-B, Class B | ||
| 1.71%, due 6/15/24 | 685,000 | 689,160 |
| Series 2020-A, Class B | ||
| 1.77%, due 6/15/25 | 1,475,000 | 1,492,403 |
| Progress Residential | ||
| Series 2021-SFR4, Class B | ||
| 1.808%, due 5/17/38 (a) | 1,040,000 | 1,039,013 |
| Progress Residential Trust | ||
| Series 2021-SFR2, Class B | ||
| 1.796%, due 4/19/38 (a) | 2,000,000 | 2,000,200 |
| Sierra Timeshare Receivables Funding LLC (a) | ||
| Series 2021-1A, Class C | ||
| 1.79%, due 11/20/37 | 698,765 | 703,016 |
| Series 2019-3A, Class A | ||
| 2.34%, due 8/20/36 | 1,159,454 | 1,189,207 |
| Series 2018-2A, Class A | ||
| 3.50%, due 6/20/35 | 505,447 | 524,956 |
| Series 2020-2A, Class C | ||
| 3.51%, due 7/20/37 | 1,541,204 | 1,589,180 |
| U.S. Airways Pass-Through Trust | ||
| Series 2010-1, Class A | ||
| 6.25%, due 4/22/23 | 3,632,683 | 3,700,424 |
| United Airlines Pass-Through Trust | ||
| Series 2014-2, Class B | ||
| 4.625%, due 9/3/22 | 3,029,986 | 3,114,601 |
| Series 2020-1, Class A | ||
| 5.875%, due 10/15/27 | 1,451,266 | 1,605,398 |
| Wendy's Funding LLC | ||
| Series 2019-1A, Class A2I | ||
| 3.783%, due 6/15/49 (a) | 1,656,475 | 1,760,485 |
| 49,624,737 | ||
| Total Asset-Backed Securities (Cost $65,988,794) | 68,443,867 | |
| Principal Amount | Value | |
| Corporate Bonds 51.2% | ||
| Advertising 0.2% | ||
| Clear Channel International BV | ||
| 6.625%, due 8/1/25 (a) | $ 1,077,000 | $ 1,125,465 |
| Aerospace & Defense 0.1% | ||
| BAE Systems plc | ||
| 3.00%, due 9/15/50 (a) | 605,000 | 564,492 |
| Agriculture 0.3% | ||
| BAT Capital Corp. | ||
| 3.734%, due 9/25/40 | 1,330,000 | 1,241,666 |
| JBS Investments II GmbH | ||
| 7.00%, due 1/15/26 (a) | 960,000 | 1,022,208 |
| 2,263,874 | ||
| Airlines 1.1% | ||
| American Airlines, Inc. (a) | ||
| 5.50%, due 4/20/26 | 1,100,000 | 1,155,000 |
| 5.75%, due 4/20/29 | 660,000 | 707,190 |
| Delta Air Lines, Inc. (a) | ||
| 4.50%, due 10/20/25 | 845,000 | 906,391 |
| 4.75%, due 10/20/28 | 590,000 | 647,892 |
| 7.00%, due 5/1/25 | 2,010,000 | 2,337,303 |
| Mileage Plus Holdings LLC | ||
| 6.50%, due 6/20/27 (a) | 1,520,000 | 1,668,200 |
| 7,421,976 | ||
| Auto Manufacturers 2.0% | ||
| Ford Motor Co. | ||
| 8.50%, due 4/21/23 | 1,925,000 | 2,156,000 |
| 9.00%, due 4/22/25 | 2,000,000 | 2,442,500 |
| Ford Motor Credit Co. LLC | ||
| 3.35%, due 11/1/22 | 1,115,000 | 1,140,968 |
| 4.063%, due 11/1/24 | 2,280,000 | 2,400,521 |
| 4.25%, due 9/20/22 | 860,000 | 888,423 |
| General Motors Co. | ||
| 6.125%, due 10/1/25 | 585,000 | 694,281 |
| General Motors Financial Co., Inc. | ||
| 2.35%, due 1/8/31 | 708,000 | 677,506 |
| 2.90%, due 2/26/25 | 2,500,000 | 2,640,395 |
| 13,040,594 | ||
| Banks 9.2% | ||
| Bank of America Corp. | ||
| 2.676%, due 6/19/41 (c) | 2,200,000 | 2,066,894 |
| Series MM | ||
| 4.30%, due 1/28/25 (c)(d) | 3,526,000 | 3,631,780 |
| 12 | MainStay MacKay Strategic Bond Fund |
| Principal Amount | Value | |
| Corporate Bonds (continued) | ||
| Banks (continued) | ||
| Bank of America Corp. (continued) | ||
| Series DD | ||
| 6.30%, due 3/10/26 (c)(d) | $ 3,570,000 | $ 4,175,783 |
| 8.57%, due 11/15/24 | 1,645,000 | 2,065,923 |
| Barclays Bank plc | ||
| 10.00%, due 5/21/21 | GBP 449,000 | 622,598 |
| Barclays plc | ||
| 2.852%, due 5/7/26 (c) | $ 2,375,000 | 2,500,948 |
| BNP Paribas SA (a) | ||
| 3.052%, due 1/13/31 (c) | 2,135,000 | 2,212,587 |
| 4.625% (5 Year Treasury Constant Maturity Rate + 3.34%), due 2/25/31 (b)(d) | 1,135,000 | 1,152,025 |
| Citigroup, Inc. | ||
| Series M | ||
| 6.30%, due 5/15/24 (c)(d) | 3,260,000 | 3,507,426 |
| Citizens Financial Group, Inc. | ||
| 2.638%, due 9/30/32 (a) | 2,270,000 | 2,235,695 |
| Freedom Mortgage Corp. | ||
| 7.625%, due 5/1/26 (a) | 1,955,000 | 2,038,088 |
| Goldman Sachs Group, Inc. (The) | ||
| 3.21%, due 4/22/42 (c) | 1,330,000 | 1,342,632 |
| JPMorgan Chase & Co. (c) | ||
| 2.956%, due 5/13/31 | 980,000 | 1,006,718 |
| 3.157%, due 4/22/42 | 895,000 | 896,451 |
| 3.328%, due 4/22/52 | 675,000 | 675,127 |
| Series HH | ||
| 4.60%, due 2/1/25 (d) | 4,752,000 | 4,900,500 |
| Lloyds Banking Group plc | ||
| 4.582%, due 12/10/25 | 1,365,000 | 1,529,121 |
| 4.65%, due 3/24/26 | 1,985,000 | 2,235,976 |
| Morgan Stanley | ||
| Series H | ||
| 3.794% (3 Month LIBOR + 3.61%), due 7/15/21 (b)(d) | 4,098,000 | 4,112,343 |
| Natwest Group plc | ||
| 3.073% (1 Year Treasury Constant Maturity Rate + 2.55%), due 5/22/28 (b) | 2,145,000 | 2,244,336 |
| Popular, Inc. | ||
| 6.125%, due 9/14/23 | 1,582,000 | 1,702,960 |
| Santander Holdings USA, Inc. | ||
| 3.40%, due 1/18/23 | 1,500,000 | 1,564,391 |
| Societe Generale SA | ||
| 5.375% (5 Year Treasury Constant Maturity Rate + 4.514%), due 11/18/30 (a)(b)(d) | 2,380,000 | 2,475,200 |
| Principal Amount | Value | |
| Banks (continued) | ||
| Standard Chartered plc | ||
| 4.75% (5 Year Treasury Constant Maturity Rate + 3.805%), due 1/14/31 (a)(b)(d) | $ 945,000 | $ 959,364 |
| Texas Capital Bancshares, Inc. | ||
| 4.00% (5 Year Treasury Constant Maturity Rate + 3.15%), due 5/6/31 (b) | 1,075,000 | 1,075,000 |
| Truist Financial Corp. | ||
| Series P | ||
| 4.95% (5 Year Treasury Constant Maturity Rate + 4.605%), due 9/1/25 (b)(d) | 1,915,000 | 2,106,500 |
| UBS Group AG | ||
| 4.375% (5 Year Treasury Constant Maturity Rate + 3.313%), due 2/10/31 (a)(b)(d) | 1,825,000 | 1,818,175 |
| Wells Fargo & Co. (c) | ||
| 3.584%, due 5/22/28 | 380,000 | 416,777 |
| Series S | ||
| 5.90%, due 6/15/24 (d) | 3,690,000 | 4,005,089 |
| 61,276,407 | ||
| Beverages 0.3% | ||
| Anheuser-Busch InBev Worldwide, Inc. | ||
| 4.75%, due 1/23/29 | 1,770,000 | 2,077,198 |
| Biotechnology 0.1% | ||
| Biogen, Inc. | ||
| 3.15%, due 5/1/50 | 890,000 | 811,865 |
| Building Materials 0.5% | ||
| Builders FirstSource, Inc. (a) | ||
| 5.00%, due 3/1/30 | 2,335,000 | 2,478,019 |
| 6.75%, due 6/1/27 | 631,000 | 678,577 |
| 3,156,596 | ||
| Chemicals 1.0% | ||
| Alpek SAB de CV | ||
| 3.25%, due 2/25/31 (a) | 825,000 | 812,633 |
| Braskem Netherlands Finance BV | ||
| 4.50%, due 1/10/28 (a) | 1,250,000 | 1,300,000 |
| Nutrition & Biosciences, Inc. | ||
| 2.30%, due 11/1/30 (a) | 1,475,000 | 1,436,638 |
| Orbia Advance Corp. SAB de CV | ||
| 4.00%, due 10/4/27 (a) | 2,600,000 | 2,838,680 |
| 6,387,951 | ||
| Principal Amount | Value | |
| Corporate Bonds (continued) | ||
| Commercial Services 2.6% | ||
| Allied Universal Holdco LLC | ||
| 6.625%, due 7/15/26 (a) | $ 2,130,000 | $ 2,252,475 |
| Ashtead Capital, Inc. | ||
| 4.25%, due 11/1/29 (a) | 2,060,000 | 2,204,200 |
| California Institute of Technology | ||
| 3.65%, due 9/1/19 | 2,218,000 | 2,363,278 |
| Herc Holdings, Inc. | ||
| 5.50%, due 7/15/27 (a) | 2,320,000 | 2,453,400 |
| IHS Markit Ltd. | ||
| 3.625%, due 5/1/24 | 3,710,000 | 3,992,702 |
| Sodexo, Inc. | ||
| 2.718%, due 4/16/31 (a) | 1,805,000 | 1,792,886 |
| Trustees of the University of Pennsylvania (The) | ||
| 3.61%, due 2/15/19 | 2,315,000 | 2,424,171 |
| 17,483,112 | ||
| Computers 1.5% | ||
| Dell International LLC (a) | ||
| 4.90%, due 10/1/26 | 4,000,000 | 4,595,037 |
| 8.10%, due 7/15/36 | 1,045,000 | 1,546,064 |
| NCR Corp. (a) | ||
| 5.00%, due 10/1/28 | 1,629,000 | 1,677,870 |
| 6.125%, due 9/1/29 | 717,000 | 779,737 |
| 8.125%, due 4/15/25 | 1,193,000 | 1,300,370 |
| 9,899,078 | ||
| Distribution & Wholesale 0.5% | ||
| Performance Food Group, Inc. | ||
| 5.50%, due 10/15/27 (a) | 2,866,000 | 3,020,305 |
| Diversified Financial Services 4.2% | ||
| AerCap Ireland Capital DAC | ||
| 3.50%, due 5/26/22 | 892,000 | 914,737 |
| Air Lease Corp. | ||
| 2.30%, due 2/1/25 | 3,275,000 | 3,365,890 |
| 3.25%, due 3/1/25 | 4,000,000 | 4,243,817 |
| Ally Financial, Inc. | ||
| 5.75%, due 11/20/25 | 3,820,000 | 4,377,360 |
| 8.00%, due 11/1/31 | 3,280,000 | 4,613,174 |
| Avolon Holdings Funding Ltd. | ||
| 3.25%, due 2/15/27 (a) | 2,125,000 | 2,161,511 |
| Banco BTG Pactual SA | ||
| 2.75%, due 1/11/26 (a) | 2,695,000 | 2,560,277 |
| Principal Amount | Value | |
| Diversified Financial Services (continued) | ||
| Capital One Financial Corp. | ||
| Series E | ||
| 3.99% (3 Month LIBOR + 3.80%), due 6/1/21 (b)(d) | $ 1,535,000 | $ 1,523,027 |
| Charles Schwab Corp. (The) | ||
| Series G | ||
| 5.375% (5 Year Treasury Constant Maturity Rate + 4.971%), due 6/1/25 (b)(d) | 2,060,000 | 2,290,514 |
| Home Point Capital, Inc. | ||
| 5.00%, due 2/1/26 (a) | 702,000 | 691,259 |
| Intercontinental Exchange, Inc. | ||
| 3.00%, due 9/15/60 | 1,560,000 | 1,399,003 |
| 28,140,569 | ||
| Electric 1.8% | ||
| Appalachian Power Co. | ||
| Series X | ||
| 3.30%, due 6/1/27 | 1,800,000 | 1,950,627 |
| Duke Energy Corp. | ||
| 4.875% (5 Year Treasury Constant Maturity Rate + 3.388%), due 9/16/24 (b)(d) | 2,415,000 | 2,560,624 |
| Pacific Gas and Electric Co. | ||
| 3.50%, due 8/1/50 | 1,205,000 | 1,043,476 |
| Potomac Electric Power Co. | ||
| 4.15%, due 3/15/43 | 1,305,000 | 1,511,833 |
| WEC Energy Group, Inc. | ||
| 2.306% (3 Month LIBOR + 2.113%), due 5/15/67 (b) | 5,495,000 | 5,014,369 |
| 12,080,929 | ||
| Electronics 0.1% | ||
| FLIR Systems, Inc. | ||
| 2.50%, due 8/1/30 | 965,000 | 960,187 |
| Environmental Control 0.0% ‡ | ||
| Stericycle, Inc. | ||
| 3.875%, due 1/15/29 (a) | 215,000 | 214,463 |
| Food 0.8% | ||
| Kraft Heinz Foods Co. | ||
| 4.25%, due 3/1/31 | 1,722,000 | 1,898,821 |
| 5.00%, due 7/15/35 | 809,000 | 944,841 |
| Smithfield Foods, Inc. | ||
| 3.00%, due 10/15/30 (a) | 1,520,000 | 1,516,033 |
| Tyson Foods, Inc. | ||
| 3.95%, due 8/15/24 | 2,000 | 2,182 |
| 14 | MainStay MacKay Strategic Bond Fund |
| Principal Amount | Value | |
| Corporate Bonds (continued) | ||
| Food (continued) | ||
| US Foods, Inc. | ||
| 6.25%, due 4/15/25 (a) | $ 1,185,000 | $ 1,258,701 |
| 5,620,578 | ||
| Food Service 0.2% | ||
| Aramark Services, Inc. | ||
| 6.375%, due 5/1/25 (a) | 1,075,000 | 1,143,531 |
| Gas 0.1% | ||
| National Fuel Gas Co. | ||
| 2.95%, due 3/1/31 | 650,000 | 634,566 |
| Healthcare-Services 0.5% | ||
| Health Care Service Corp. A Mutual Legal Reserve Co. | ||
| 3.20%, due 6/1/50 (a) | 1,445,000 | 1,415,564 |
| NYU Langone Hospitals | ||
| Series 2020 | ||
| 3.38%, due 7/1/55 | 1,700,000 | 1,706,330 |
| 3,121,894 | ||
| Home Builders 0.2% | ||
| Lennar Corp. | ||
| 4.75%, due 11/29/27 | 188,000 | 217,531 |
| Toll Brothers Finance Corp. | ||
| 3.80%, due 11/1/29 | 495,000 | 526,928 |
| 4.35%, due 2/15/28 | 303,000 | 333,300 |
| 1,077,759 | ||
| Household Products & Wares 0.3% | ||
| Kronos Acquisition Holdings, Inc. | ||
| 5.00%, due 12/31/26 (a) | 1,710,000 | 1,724,963 |
| Insurance 2.2% | ||
| Athene Global Funding | ||
| 2.50%, due 3/24/28 (a) | 1,900,000 | 1,915,103 |
| Empower Finance 2020 LP | ||
| 3.075%, due 9/17/51 (a) | 1,495,000 | 1,435,165 |
| Lincoln National Corp. | ||
| 2.549% (3 Month LIBOR + 2.358%), due 5/17/66 (b) | 3,537,000 | 3,041,820 |
| NMI Holdings, Inc. | ||
| 7.375%, due 6/1/25 (a) | 685,000 | 787,750 |
| Protective Life Corp. | ||
| 8.45%, due 10/15/39 | 2,476,000 | 3,808,144 |
| Principal Amount | Value | |
| Insurance (continued) | ||
| Reliance Standard Life Global Funding II | ||
| 2.50%, due 10/30/24 (a) | $ 2,900,000 | $ 3,037,347 |
| Willis North America, Inc. | ||
| 3.875%, due 9/15/49 | 425,000 | 458,006 |
| 14,483,335 | ||
| Internet 1.2% | ||
| Cablevision Lightpath LLC | ||
| 3.875%, due 9/15/27 (a) | 1,315,000 | 1,296,919 |
| Expedia Group, Inc. | ||
| 3.25%, due 2/15/30 | 3,920,000 | 3,979,329 |
| 3.60%, due 12/15/23 (a) | 895,000 | 953,773 |
| 6.25%, due 5/1/25 (a) | 189,000 | 219,860 |
| Match Group Holdings II LLC | ||
| 4.125%, due 8/1/30 (a) | 122,000 | 122,458 |
| Weibo Corp. | ||
| 3.50%, due 7/5/24 | 1,515,000 | 1,589,068 |
| 8,161,407 | ||
| Iron & Steel 1.2% | ||
| ArcelorMittal SA | ||
| 4.55%, due 3/11/26 | 3,470,000 | 3,852,659 |
| Vale Overseas Ltd. | ||
| 3.75%, due 7/8/30 | 1,660,000 | 1,746,320 |
| 6.25%, due 8/10/26 | 1,980,000 | 2,366,100 |
| 7,965,079 | ||
| Lodging 1.2% | ||
| Boyd Gaming Corp. | ||
| 8.625%, due 6/1/25 (a) | 500,000 | 553,600 |
| Hilton Domestic Operating Co., Inc. | ||
| 4.875%, due 1/15/30 | 1,930,000 | 2,057,901 |
| 5.375%, due 5/1/25 (a) | 935,000 | 984,695 |
| Marriott International, Inc. | ||
| 3.75%, due 10/1/25 | 4,253,000 | 4,581,778 |
| 8,177,974 | ||
| Machinery-Diversified 0.2% | ||
| Clark Equipment Co. | ||
| 5.875%, due 6/1/25 (a) | 1,225,000 | 1,300,031 |
| Media 0.5% | ||
| Grupo Televisa SAB | ||
| 5.25%, due 5/24/49 (e) | 1,695,000 | 2,042,068 |
| Time Warner Entertainment Co. LP | ||
| 8.375%, due 3/15/23 | 1,087,000 | 1,240,686 |
| 3,282,754 | ||
| Principal Amount | Value | |
| Corporate Bonds (continued) | ||
| Mining 0.6% | ||
| Glencore Funding LLC | ||
| 1.625%, due 9/1/25 (a) | $ 2,225,000 | $ 2,239,281 |
| Industrias Penoles SAB de CV | ||
| 4.75%, due 8/6/50 (a)(e) | 1,962,000 | 2,018,407 |
| 4,257,688 | ||
| Miscellaneous—Manufacturing 1.3% | ||
| General Electric Co. | ||
| 3.625%, due 5/1/30 | 1,400,000 | 1,521,040 |
| 4.25%, due 5/1/40 | 1,525,000 | 1,704,225 |
| 4.35%, due 5/1/50 | 1,960,000 | 2,182,296 |
| Textron Financial Corp. | ||
| 1.929% (3 Month LIBOR + 1.735%), due 2/15/42 (a)(b) | 4,350,000 | 3,523,500 |
| 8,931,061 | ||
| Oil & Gas 2.4% | ||
| BP Capital Markets plc | ||
| 4.875% (5 Year Treasury Constant Maturity Rate + 4.398%), due 3/22/30 (b)(d) | 2,170,000 | 2,329,495 |
| Gazprom PJSC Via Gaz Capital SA | ||
| 7.288%, due 8/16/37 (a) | 2,520,000 | 3,502,800 |
| Marathon Petroleum Corp. | ||
| 4.50%, due 5/1/23 | 1,330,000 | 1,424,848 |
| 4.70%, due 5/1/25 | 1,450,000 | 1,636,356 |
| 5.125%, due 4/1/24 | 4,350,000 | 4,395,233 |
| Petrobras Global Finance BV | ||
| 5.60%, due 1/3/31 | 915,000 | 987,742 |
| 6.75%, due 6/3/50 | 1,645,000 | 1,799,975 |
| 16,076,449 | ||
| Packaging & Containers 1.2% | ||
| Berry Global, Inc. | ||
| 4.875%, due 7/15/26 (a) | 135,000 | 142,972 |
| Crown European Holdings SA | ||
| 4.00%, due 7/15/22 (a) | EUR 3,540,000 | 4,409,078 |
| Graham Packaging Co., Inc. | ||
| 7.125%, due 8/15/28 (a) | $ 750,000 | 804,375 |
| Owens-Brockway Glass Container, Inc. | ||
| 6.625%, due 5/13/27 (a) | 2,325,000 | 2,511,000 |
| 7,867,425 | ||
| Pharmaceuticals 0.8% | ||
| AbbVie, Inc. | ||
| 4.25%, due 11/21/49 | 2,790,000 | 3,161,264 |
| Principal Amount | Value | |
| Pharmaceuticals (continued) | ||
| Teva Pharmaceutical Finance Netherlands III BV | ||
| 3.15%, due 10/1/26 | $ 2,146,000 | $ 2,015,094 |
| 5,176,358 | ||
| Pipelines 2.2% | ||
| Enterprise Products Operating LLC | ||
| 3.95%, due 1/31/60 | 1,630,000 | 1,634,703 |
| 4.20%, due 1/31/50 | 520,000 | ��� 557,719 |
| Hess Midstream Operations LP | ||
| 5.625%, due 2/15/26 (a) | 367,000 | 380,763 |
| Kinder Morgan, Inc. | ||
| 5.625%, due 11/15/23 (a) | 2,449,000 | 2,714,669 |
| 7.75%, due 1/15/32 | 2,035,000 | 2,868,833 |
| MPLX LP | ||
| 4.00%, due 3/15/28 | 560,000 | 618,305 |
| Plains All American Pipeline LP | ||
| 3.80%, due 9/15/30 | 1,040,000 | 1,071,159 |
| Sabine Pass Liquefaction LLC | ||
| 5.75%, due 5/15/24 | 2,146,000 | 2,422,629 |
| Western Midstream Operating LP | ||
| 6.50%, due 2/1/50 (f) | 1,800,000 | 2,036,682 |
| 14,305,462 | ||
| Real Estate 0.2% | ||
| Realogy Group LLC | ||
| 7.625%, due 6/15/25 (a) | 1,490,000 | 1,627,825 |
| Real Estate Investment Trusts 0.9% | ||
| CyrusOne LP | ||
| 3.45%, due 11/15/29 | 1,850,000 | 1,932,380 |
| GLP Capital LP | ||
| 3.35%, due 9/1/24 | 1,535,000 | 1,626,134 |
| Host Hotels & Resorts LP | ||
| Series D | ||
| 3.75%, due 10/15/23 | 472,000 | 499,760 |
| Iron Mountain, Inc. | ||
| 4.875%, due 9/15/29 (a) | 1,941,000 | 1,976,947 |
| 6,035,221 | ||
| Retail 2.5% | ||
| 7-Eleven, Inc. (a) | ||
| 2.50%, due 2/10/41 | 230,000 | 209,326 |
| 2.80%, due 2/10/51 | 840,000 | 760,398 |
| AutoNation, Inc. | ||
| 4.75%, due 6/1/30 | 2,300,000 | 2,681,913 |
| Darden Restaurants, Inc. | ||
| 3.85%, due 5/1/27 | 3,512,000 | 3,871,685 |
| 16 | MainStay MacKay Strategic Bond Fund |
| Principal Amount | Value | |
| Corporate Bonds (continued) | ||
| Retail (continued) | ||
| Macy's Retail Holdings LLC | ||
| 5.875%, due 4/1/29 (a)(e) | $ 1,170,000 | $ 1,200,654 |
| Macy's, Inc. | ||
| 8.375%, due 6/15/25 (a) | 2,035,000 | 2,245,073 |
| Nordstrom, Inc. | ||
| 4.25%, due 8/1/31 (a) | 1,285,000 | 1,302,067 |
| QVC, Inc. | ||
| 4.375%, due 9/1/28 | 1,730,000 | 1,770,707 |
| Starbucks Corp. | ||
| 4.45%, due 8/15/49 | 1,970,000 | 2,324,010 |
| 16,365,833 | ||
| Semiconductors 0.6% | ||
| Broadcom, Inc. (a) | ||
| 3.469%, due 4/15/34 | 2,040,000 | 2,062,506 |
| 3.75%, due 2/15/51 (e) | 620,000 | 598,892 |
| NXP BV | ||
| 3.40%, due 5/1/30 (a) | 1,135,000 | 1,213,746 |
| 3,875,144 | ||
| Software 0.1% | ||
| Oracle Corp. | ||
| 3.65%, due 3/25/41 | 450,000 | 459,825 |
| Telecommunications 4.3% | ||
| Altice France SA (a) | ||
| 5.125%, due 7/15/29 | 1,655,000 | 1,657,069 |
| 7.375%, due 5/1/26 | 2,491,000 | 2,582,669 |
| AT&T, Inc. | ||
| Series B | ||
| 2.875% (5 Month Euribor ICE Swap Rate + 3.14%), due 3/2/25 (b)(d) | EUR 2,200,000 | 2,651,700 |
| 3.65%, due 6/1/51 | $ 1,485,000 | 1,428,332 |
| CommScope Technologies LLC | ||
| 5.00%, due 3/15/27 (a) | 1,899,000 | 1,881,316 |
| Sprint Corp. | ||
| 7.875%, due 9/15/23 | 3,620,000 | 4,126,800 |
| Sprint Spectrum Co. LLC | ||
| 4.738%, due 3/20/25 (a) | 2,255,000 | 2,414,259 |
| T-Mobile US, Inc. | ||
| 2.625%, due 2/15/29 | 1,205,000 | 1,173,821 |
| 4.50%, due 4/15/50 (a) | 920,000 | 1,037,585 |
| 6.00%, due 3/1/23 | 3,000,000 | 3,025,350 |
| VEON Holdings BV | ||
| 4.95%, due 6/16/24 (a) | 3,345,000 | 3,579,116 |
| Verizon Communications, Inc. | ||
| 3.40%, due 3/22/41 | 600,000 | 614,654 |
| Principal Amount | Value | |
| Telecommunications (continued) | ||
| Verizon Communications, Inc. (continued) | ||
| 3.55%, due 3/22/51 | $ 665,000 | $ 675,554 |
| Vodafone Group plc | ||
| 4.25%, due 9/17/50 | 1,815,000 | 2,018,207 |
| 28,866,432 | ||
| Total Corporate Bonds (Cost $322,755,276) | 340,463,655 | |
| Foreign Government Bonds 3.6% | ||
| Brazil 1.0% | ||
| Federative Republic of Brazil | ||
| 4.625%, due 1/13/28 | 6,444,000 | 6,911,641 |
| Chile 0.5% | ||
| Corp. Nacional del Cobre de Chile (a) | ||
| 3.00%, due 9/30/29 | 1,890,000 | 1,942,863 |
| 3.75%, due 1/15/31 | 1,290,000 | 1,390,323 |
| 3,333,186 | ||
| Indonesia 0.4% | ||
| Indonesia Asahan Aluminium Persero PT | ||
| 5.45%, due 5/15/30 (a) | 2,115,000 | 2,432,250 |
| Mexico 1.7% | ||
| Comision Federal de Electricidad | ||
| 4.677%, due 2/9/51 (a) | 1,855,000 | 1,724,223 |
| Mexico Government Bond | ||
| 2.659%, due 5/24/31 | 3,857,000 | 3,709,238 |
| 3.75%, due 4/19/71 | 1,480,000 | 1,292,336 |
| Petroleos Mexicanos | ||
| 6.75%, due 9/21/47 | 4,835,000 | 4,274,140 |
| 10,999,937 | ||
| Total Foreign Government Bonds (Cost $24,197,892) | 23,677,014 | |
| Loan Assignments 4.3% | ||
| Buildings & Real Estate 0.1% | ||
| Realogy Group LLC | ||
| Extended 2025 Term Loan | ||
| 3.00% (1 Month LIBOR + 2.25%), due 2/8/25 (b) | 901,698 | 893,325 |
| Principal Amount | Value | |
| Loan Assignments (continued) | ||
| Containers, Packaging & Glass 0.7% | ||
| BWAY Holding Co. | ||
| Initial Term Loan | ||
| 3.443% (3 Month LIBOR + 3.25%), due 4/3/24 (b) | $ 4,583,568 | $ 4,422,428 |
| Diversified/Conglomerate Service 0.8% | ||
| Change Healthcare Holdings, Inc. | ||
| Closing Date Term Loan | ||
| 3.50% (1 Month LIBOR + 2.50%, 3 Month LIBOR + 2.50%), due 3/1/24 (b) | 3,756,956 | 3,752,260 |
| TruGreen LP (b) | ||
| First Lien Second Refinancing Term Loan | ||
| 4.75% (1 Month LIBOR + 4.00%), due 11/2/27 | 1,042,388 | 1,040,650 |
| Second Lien Initial Term Loan | ||
| 9.25% (3 Month LIBOR + 8.50%), due 11/2/28 | 450,000 | 463,500 |
| 5,256,410 | ||
| Finance 0.5% | ||
| Alliant Holdings Intermediate LLC 2018 Initial Term Loan | ||
| 3.363% (1 Month LIBOR + 3.25%), due 5/9/25 (b) | 3,624,101 | 3,580,858 |
| Healthcare, Education & Childcare 0.3% | ||
| Syneos Health, Inc. Replacement Term Loan B | ||
| 1.863% (1 Month LIBOR + 1.75%), due 8/1/24 (b) | 1,977,925 | 1,965,254 |
| Personal & Nondurable Consumer Products 0.4% | ||
| Prestige Brands, Inc. | ||
| Term Loan B4 | ||
| 2.109% (1 Month LIBOR + 2.00%), due 1/26/24 (b) | 2,508,906 | 2,510,865 |
| Personal, Food & Miscellaneous Services 0.2% | ||
| 1011778 B.C. Unlimited Liability Co. | ||
| Term Loan B4 | ||
| 1.863% (1 Month LIBOR + 1.75%), due 11/19/26 (b) | 1,388,949 | 1,366,379 |
| Principal Amount | Value | |
| Radio and TV Broadcasting 0.4% | ||
| Nielsen Finance LLC | ||
| Term Loan B4 | ||
| 2.113% (1 Month LIBOR + 2.00%), due 10/4/23 (b) | $ 2,732,277 | $ 2,726,130 |
| Telecommunications 0.9% | ||
| Level 3 Financing, Inc. | ||
| Tranche 2027 Term Loan B | ||
| 1.863% (1 Month LIBOR + 1.75%), due 3/1/27 (b) | 2,698,623 | 2,665,451 |
| SBA Senior Finance II LLC | ||
| Initial Term Loan | ||
| 1.87% (1 Month LIBOR + 1.75%), due 4/11/25 (b) | 3,454,974 | 3,426,039 |
| 6,091,490 | ||
| Total Loan Assignments (Cost $29,003,386) | 28,813,139 | |
| Mortgage-Backed Securities 21.9% | ||
| Agency (Collateralized Mortgage Obligations) 2.3% | ||
| FHLMC | ||
| REMIC, Series 5070, Class IG | ||
| 1.50%, due 1/25/44 | 6,751,944 | 413,336 |
| REMIC, Series 5048, Class IC | ||
| 2.00%, due 12/25/50 | 7,182,458 | 699,526 |
| REMIC, Series 5051, Class KI | ||
| 2.50%, due 12/25/50 | 4,578,256 | 753,082 |
| REMIC, Series 4888, Class BA | ||
| 3.50%, due 9/15/48 | 1,029,405 | 1,075,080 |
| REMIC, Series 5036 | ||
| 3.50%, due 11/25/50 | 4,215,825 | 703,675 |
| REMIC, Series 4924, Class NS | ||
| 5.944% (1 Month LIBOR + 6.05%), due 10/25/49 (b) | 4,228,112 | 650,185 |
| REMIC, Series 4957, Class SB | ||
| 5.944% (1 Month LIBOR + 6.05%), due 11/25/49 (b) | 2,839,283 | 494,622 |
| FNMA | ||
| REMIC, Series 2020-78, Class TI | ||
| 2.00%, due 11/25/50 | 4,334,671 | 507,893 |
| REMIC, Series 2020-91, Class MI | ||
| 2.00%, due 12/25/50 | 5,296,161 | 581,882 |
| REMIC, Series 2021-2, Class AI | ||
| 2.00%, due 2/25/51 | 10,539,194 | 1,196,138 |
| REMIC, Series 2020-91, Class AI | ||
| 2.50%, due 12/25/50 | 4,326,157 | 703,202 |
| 18 | MainStay MacKay Strategic Bond Fund |
| Principal Amount | Value | |
| Mortgage-Backed Securities (continued) | ||
| Agency (Collateralized Mortgage Obligations) (continued) | ||
| FNMA (continued) | ||
| REMIC, Series 2021-7, Class EI | ||
| 2.50%, due 2/25/51 | $ 3,265,069 | $ 404,772 |
| REMIC, Series 2021-13, Class BI | ||
| 3.00%, due 2/25/50 | 2,730,000 | 378,981 |
| REMIC, Series 2021-6, Class MC | ||
| 3.50%, due 6/25/50 | 2,900,000 | 3,161,835 |
| REMIC, Series 2020-10, Class DA | ||
| 3.50%, due 3/25/60 | 2,567,902 | 2,782,798 |
| GNMA | ||
| REMIC, Series 2021-15, Class AI | ||
| 2.00%, due 1/20/51 | 8,069,533 | 893,681 |
| 15,400,688 | ||
| Commercial Mortgage Loans (Collateralized Mortgage Obligations) 11.4% | ||
| BANK | ||
| Series 2019-BN21, Class A5 | ||
| 2.851%, due 10/17/52 | 3,345,000 | 3,524,362 |
| Bayview Commercial Asset Trust (a)(b) | ||
| Series 2006-4A, Class A1 | ||
| 0.336% (1 Month LIBOR + 0.23%), due 12/25/36 | 12,415 | 11,923 |
| Series 2005-3A, Class A1 | ||
| 0.586% (1 Month LIBOR + 0.48%), due 11/25/35 | 931,115 | 881,971 |
| Benchmark Mortgage Trust | ||
| Series 2019-B12, Class A5 | ||
| 3.116%, due 8/15/52 | 3,316,216 | 3,565,731 |
| BX Commercial Mortgage Trust (a)(g) | ||
| Series 2020-VIV2, Class C | ||
| 3.66%, due 3/9/44 | 1,435,000 | 1,474,502 |
| Series 2020-VIV3, Class B | ||
| 3.662%, due 3/9/44 | 1,380,000 | 1,474,774 |
| Series 2020-VIVA, Class D | ||
| 3.667%, due 3/11/44 | 750,000 | 755,016 |
| BX Trust (a) | ||
| Series 2018-BILT, Class A | ||
| 0.915% (1 Month LIBOR + 0.80%), due 5/15/30 (b) | 2,385,000 | 2,386,002 |
| Series 2018-GW, Class A | ||
| 0.915% (1 Month LIBOR + 0.80%), due 5/15/35 (b) | 1,555,000 | 1,554,978 |
| Series 2021-MFM1, Class C | ||
| 1.315% (1 Month LIBOR + 1.20%), due 1/15/34 (b) | 1,375,000 | 1,374,175 |
| Principal Amount | Value | |
| Commercial Mortgage Loans (Collateralized Mortgage Obligations) (continued) | ||
| BX Trust (a) (continued) | ||
| Series 2021-MFM1, Class D | ||
| 1.615% (1 Month LIBOR + 1.50%), due 1/15/34 (b) | $ 730,000 | $ 729,562 |
| Series 2021-LBA, Class DV | ||
| 1.715% (1 Month LIBOR + 1.60%), due 2/15/36 (b) | 1,270,000 | 1,268,833 |
| Series 2019-OC11, Class A | ||
| 3.202%, due 12/9/41 | 1,120,000 | 1,185,501 |
| Series 2019-OC11, Class B | ||
| 3.605%, due 12/9/41 | 305,000 | 327,474 |
| Series 2019-OC11, Class C | ||
| 3.856%, due 12/9/41 | 1,265,000 | 1,345,725 |
| Citigroup Commercial Mortgage Trust | ||
| Series 2015-GC27, Class AS | ||
| 3.571%, due 2/10/48 | 840,000 | 892,227 |
| COMM Mortgage Trust | ||
| Series 2012-CR4, Class AM | ||
| 3.251%, due 10/15/45 | 1,280,000 | 1,293,410 |
| Commercial Mortgage Trust | ||
| Series 2013-CR9, Class B | ||
| 4.387%, due 7/10/45 (a)(g) | 1,020,000 | 1,015,682 |
| CSAIL Commercial Mortgage Trust | ||
| Series 2015-C3, Class A4 | ||
| 3.718%, due 8/15/48 | 2,636,000 | 2,886,321 |
| CSMC WEST Trust | ||
| Series 2020-WEST, Class A | ||
| 3.04%, due 2/15/35 (a) | 2,250,000 | 2,315,105 |
| DROP Mortgage Trust | ||
| Series 2021-FILE, Class A | ||
| 1.26% (1 Month LIBOR + 1.15%), due 4/15/26 (a)(b) | 1,065,000 | 1,065,667 |
| GB Trust (a)(b) | ||
| Series 2020-FLIX, Class C | ||
| 1.715% (1 Month LIBOR + 1.60%), due 8/15/37 | 1,000,000 | 1,005,416 |
| Series 2020-FLIX, Class D | ||
| 2.465% (1 Month LIBOR + 2.35%), due 8/15/37 | 1,390,000 | 1,395,693 |
| GS Mortgage Securities Corp. Trust | ||
| Series 2019-BOCA, Class A | ||
| 1.315% (1 Month LIBOR + 1.20%), due 6/15/38 (a)(b) | 4,110,000 | 4,115,104 |
| GS Mortgage Securities Trust | ||
| Series 2019-GC42, Class A4 | ||
| 3.001%, due 9/1/52 | 1,365,000 | 1,456,478 |
| Principal Amount | Value | |
| Mortgage-Backed Securities (continued) | ||
| Commercial Mortgage Loans (Collateralized Mortgage Obligations) (continued) | ||
| GS Mortgage Securities Trust (continued) | ||
| Series 2019-GC40, Class A4 | ||
| 3.16%, due 7/10/52 | $ 2,560,000 | $ 2,760,019 |
| Series 2017-GS7, Class A4 | ||
| 3.43%, due 8/10/50 | 2,720,000 | 2,976,884 |
| Hawaii Hotel Trust | ||
| Series 2019-MAUI, Class A | ||
| 1.265% (1 Month LIBOR + 1.15%), due 5/15/38 (a)(b) | 1,860,000 | 1,862,307 |
| Hudson Yards Mortgage Trust | ||
| Series 2019-30HY, Class A | ||
| 3.228%, due 7/10/39 (a) | 1,360,000 | 1,464,907 |
| J.P. Morgan Chase Commercial Mortgage Securities Corp. | ||
| Series 2018-AON, Class B | ||
| 4.379%, due 7/5/31 (a)(g) | 1,330,000 | 1,408,268 |
| JPMBB Commercial Mortgage Securities Trust | ||
| Series 2014-C26, Class A3 | ||
| 3.231%, due 1/15/48 | 1,896,249 | 2,018,293 |
| JPMorgan Chase Commercial Mortgage Securities Corp. | ||
| Series 2018-AON, Class A | ||
| 4.128%, due 7/5/31 (a) | 3,370,000 | 3,590,396 |
| Manhattan West Mortgage Trust | ||
| Series 2020-1MW, Class A | ||
| 2.13%, due 9/10/39 (a) | 1,260,000 | 1,278,722 |
| Morgan Stanley Bank of America Merrill Lynch Trust | ||
| Series 2015-C23, Class A3 | ||
| 3.451%, due 7/15/50 | 1,254,830 | 1,347,478 |
| One Bryant Park Trust | ||
| Series 2019-OBP, Class A | ||
| 2.516%, due 9/15/54 (a) | 3,825,000 | 3,900,021 |
| UBS-Barclays Commercial Mortgage Trust | ||
| Series 2013-C6, Class B | ||
| 3.875%, due 4/10/46 (a)(h) | 1,010,000 | 1,019,291 |
| Wells Fargo Commercial Mortgage Trust | ||
| Series 2019-C53, Class A4 | ||
| 3.04%, due 10/15/52 | 3,100,000 | 3,305,715 |
| Series 2018-1745, Class A | ||
| 3.874%, due 6/15/36 (a)(g) | 2,900,000 | 3,199,924 |
| Series 2018-AUS, Class A | ||
| 4.194%, due 8/17/36 (a)(g) | 4,310,000 | 4,799,651 |
| WFRBS Commercial Mortgage Trust | ||
| Series 2012-C7, Class AS | ||
| 4.09%, due 6/15/45 (h) | 1,415,000 | 1,435,492 |
| 75,669,000 | ||
| Principal Amount | Value | |
| Whole Loan (Collateralized Mortgage Obligations) 8.2% | ||
| Alternative Loan Trust | ||
| Series 2005-31, Class 1A1 | ||
| 0.666% (1 Month LIBOR + 0.56%), due 8/25/35 (b) | $ 2,532,950 | $ 2,418,672 |
| Banc of America Alternative Loan Trust | ||
| Series 2005-11, Class 2CB1 | ||
| 6.00%, due 12/25/35 | 534,970 | 531,780 |
| Chase Home Lending Mortgage Trust | ||
| Series 2019-ATR2, Class A3 | ||
| 3.50%, due 7/25/49 (a)(h) | 399,514 | 413,462 |
| Connecticut Avenue Securities Trust | ||
| Series 2020-R02, Class 2M2 | ||
| 2.106% (1 Month LIBOR + 2.00%), due 1/25/40 (a)(b) | 3,156,000 | 3,176,426 |
| FHLMC STACR REMIC Trust | ||
| Series 2020-DNA6, Class M2 | ||
| 2.01% (SOFR 30A + 2.00%), due 12/25/50 (a)(b) | 3,280,000 | 3,283,948 |
| FHLMC STACR Trust (a)(b) | ||
| Series 2019-DNA3, Class B1 | ||
| 3.356% (1 Month LIBOR + 3.25%), due 7/25/49 | 1,470,000 | 1,486,482 |
| Series 2018-DNA2, Class B1 | ||
| 3.806% (1 Month LIBOR + 3.70%), due 12/25/30 | 2,070,000 | 2,134,041 |
| FHLMC Structured Agency Credit Risk Debt Notes (b) | ||
| Series 2017-HQA1, Class M2 | ||
| 3.656% (1 Month LIBOR + 3.55%), due 8/25/29 | 1,880,996 | 1,943,517 |
| Series 2016-DNA4, Class M3 | ||
| 3.906% (1 Month LIBOR + 3.80%), due 3/25/29 | 1,677,632 | 1,748,490 |
| Series 2016-HQA3, Class M3 | ||
| 3.956% (1 Month LIBOR + 3.85%), due 3/25/29 | 4,820,000 | 5,014,124 |
| Series 2016-HQA4, Class M3 | ||
| 4.006% (1 Month LIBOR + 3.90%), due 4/25/29 | 1,544,387 | 1,608,095 |
| FNMA (b) | ||
| Series 2017-C05, Class 1M2 | ||
| 2.306% (1 Month LIBOR + 2.20%), due 1/25/30 | 662,136 | 670,690 |
| Series 2017-C02, Class 2M2 | ||
| 3.756% (1 Month LIBOR + 3.65%), due 9/25/29 | 1,802,064 | 1,865,413 |
| Series 2016-C04, Class 1M2 | ||
| 4.356% (1 Month LIBOR + 4.25%), due 1/25/29 | 1,836,264 | 1,924,913 |
| 20 | MainStay MacKay Strategic Bond Fund |
| Principal Amount | Value | |
| Mortgage-Backed Securities (continued) | ||
| Whole Loan (Collateralized Mortgage Obligations) (continued) | ||
| FNMA (b) (continued) | ||
| Series 2016-C06, Class 1M2 | ||
| 4.356% (1 Month LIBOR + 4.25%), due 4/25/29 | $ 2,541,463 | $ 2,650,102 |
| Series 2016-C07, Class 2M2 | ||
| 4.456% (1 Month LIBOR + 4.35%), due 5/25/29 | 2,226,076 | 2,320,177 |
| Series 2016-C05, Class 2M2 | ||
| 4.556% (1 Month LIBOR + 4.45%), due 1/25/29 | 4,953,253 | 5,164,723 |
| Series 2015-C04, Class 1M2 | ||
| 5.806% (1 Month LIBOR + 5.70%), due 4/25/28 | 791,810 | 839,486 |
| Galton Funding Mortgage Trust | ||
| Series 2018-2, Class A51 | ||
| 4.50%, due 10/25/58 (a)(h) | 1,570,000 | 1,629,626 |
| GNR-2017-H07 | ||
| 1.00%, due 4/20/27 (i) | 300,000 | 297,905 |
| GreenPoint Mortgage Funding Trust | ||
| Series 2007-AR3, Class A1 | ||
| 0.326% (1 Month LIBOR + 0.22%), due 6/25/37 (b) | 526,463 | 523,304 |
| Impac Secured Assets Trust | ||
| Series 2006-5, Class 2A | ||
| 0.306% (1 Month LIBOR + 0.20%), due 12/25/36 (b) | 114,598 | 111,249 |
| JPMorgan Mortgage Trust | ||
| Series 2019-1, Class A3 | ||
| 4.00%, due 5/25/49 (a)(h) | 280,318 | 284,816 |
| Mello Warehouse Securitization Trust | ||
| Series 2021-1, Class B | ||
| 1.006% (1 Month LIBOR + 0.90%), due 2/25/55 (a)(b) | 1,060,000 | 1,064,069 |
| New Residential Mortgage Loan Trust (a) | ||
| Series 2019-5A, Class B7 | ||
| 4.469%, due 8/25/59 (g) | 2,494,561 | 1,990,379 |
| Series 2019-4A, Class B6 | ||
| 4.786%, due 12/25/58 (h) | 2,215,447 | 1,798,000 |
| Series 2019-2A, Class B6 | ||
| 4.976%, due 12/25/57 (h) | 877,377 | 628,464 |
| NewRez LLC | ||
| Series 2021-1, Class B | ||
| (zero coupon) (1 Month LIBOR + 0.90%), due 5/25/55 (a)(b) | 3,085,000 | 3,084,985 |
| Sequoia Mortgage Trust (a)(h) | ||
| Series 2017-1, Class A4 | ||
| 3.50%, due 2/25/47 | 152,269 | 152,650 |
| Principal Amount | Value | |
| Whole Loan (Collateralized Mortgage Obligations) (continued) | ||
| Sequoia Mortgage Trust (a)(h) (continued) | ||
| Series 2018-7, Class B3 | ||
| 4.224%, due 9/25/48 | $ 1,434,955 | $ 1,472,569 |
| STACR Trust | ||
| Series 2018-DNA3, Class M2 | ||
| 2.206% (1 Month LIBOR + 2.10%), due 9/25/48 (a)(b) | 1,425,000 | 1,441,758 |
| WaMu Mortgage Pass-Through Certificates Trust | ||
| Series 2006-AR9, Class 2A | ||
| 1.908% (11th District Cost of Funds Index + 1.50%), due 8/25/46 (b) | 684,418 | 669,213 |
| 54,343,528 | ||
| Total Mortgage-Backed Securities (Cost $139,352,251) | 145,413,216 | |
| Municipal Bonds 0.5% | ||
| California 0.4% | ||
| Regents of the University of California Medical Center, Pooled, Revenue Bonds | ||
| Series N | ||
| 3.006%, due 5/15/50 | 2,760,000 | 2,705,252 |
| New York 0.1% | ||
| New York State Thruway Authority, Revenue Bonds | ||
| Series M | ||
| 2.90%, due 1/1/35 | 645,000 | 678,818 |
| Total Municipal Bonds (Cost $3,405,000) | 3,384,070 | |
| U.S. Government & Federal Agencies 5.8% | ||
| United States Treasury Bond 0.8% | ||
| U.S. Treasury Bond | ||
| 1.875%, due 2/15/51 | 5,940,000 | 5,403,543 |
| United States Treasury Inflation - Indexed Notes 5.0% | ||
| U.S. Treasury Inflation Linked Notes (j) | ||
| 0.125%, due 1/15/30 | 10,670,000 | 11,950,946 |
| Principal Amount | Value | |
| U.S. Government & Federal Agencies (continued) | ||
| United States Treasury Inflation - Indexed Notes (continued) | ||
| U.S. Treasury Inflation Linked Notes (j) (continued) | ||
| 0.125%, due 7/15/30 | $ 6,210,000 | $ 7,001,473 |
| 0.875%, due 1/15/29 | 11,995,000 | 14,502,396 |
| 33,454,815 | ||
| Total U.S. Government & Federal Agencies (Cost $37,037,194) | 38,858,358 | |
| Total Long-Term Bonds (Cost $621,739,793) | 649,053,319 | |
| Shares | ||
| Common Stocks 0.0% ‡ | ||
| Commercial Services & Supplies 0.0% ‡ | ||
| Quad/Graphics, Inc. | 14 | 50 |
| Tobacco 0.0% ‡ | ||
| Turning Point Brands, Inc. | 6,802 | 332,074 |
| Total Common Stocks (Cost $0) | 332,124 | |
| Short-Term Investments 3.4% | ||
| Affiliated Investment Company 2.9% | ||
| MainStay U.S. Government Liquidity Fund, 0.01% (k) | 18,837,275 | 18,837,275 |
| Unaffiliated Investment Company 0.5% | ||
| BlackRock Liquidity FedFund, 0.05% (k)(l) | 3,446,470 | 3,446,470 |
| Total Short-Term Investments (Cost $22,283,745) | 22,283,745 | |
| Total Investments, Before Investments Sold Short (Cost $644,023,538) | 101.0% | 671,669,188 |
| Principal Amount | Value | ||
| Investments Sold Short (0.8)% | |||
| Corporate Bond Sold Short (0.8)% | |||
| Mining (0.8)% | |||
| FMG Resources August 2006 Pty. Ltd. | |||
| 5.125%, due 5/15/24 (a) | $ (5,000,000) | $ (5,455,974) | |
| Total Investments Sold Short (Proceeds $5,142,028) | (5,455,974) | ||
| Total Investments, Net of Investments Sold Short (Cost $638,881,510) | 100.2% | 666,213,214 | |
| Other Assets, Less Liabilities | (0.2) | (1,291,151) | |
| Net Assets | 100.0% | $ 664,922,063 | |
| † | Percentages indicated are based on Fund net assets. |
| ‡ | Less than one-tenth of a percent. |
| (a) | May be sold to institutional investors only under Rule 144A or securities offered pursuant to Section 4(a)(2) of the Securities Act of 1933, as amended. |
| (b) | Floating rate—Rate shown was the rate in effect as of April 30, 2021. |
| (c) | Fixed to floating rate—Rate shown was the rate in effect as of April 30, 2021. |
| (d) | Security is perpetual and, thus, does not have a predetermined maturity date. The date shown, if applicable, reflects the next call date. |
| (e) | All or a portion of this security was held on loan. As of April 30, 2021, the aggregate market value of securities on loan was $3,323,364. The Fund received cash collateral with a value of $3,446,470. (See Note 2(N)) |
| (f) | Step coupon—Rate shown was the rate in effect as of April 30, 2021. |
| (g) | Collateral strip rate—A bond whose interest was based on the weighted net interest rate of the collateral. The coupon rate adjusts periodically based on a predetermined schedule. Rate shown was the rate in effect as of April 30, 2021. |
| (h) | Coupon rate may change based on changes of the underlying collateral or prepayments of principal. Rate shown was the rate in effect as of April 30, 2021. |
| (i) | Delayed delivery security. |
| (j) | Treasury Inflation Protected Security—Pays a fixed rate of interest on a principal amount that is continuously adjusted for inflation based on the Consumer Price Index-Urban Consumers. |
| (k) | Current yield as of April 30, 2021. |
| (l) | Represents a security purchased with cash collateral received for securities on loan. |
| 22 | MainStay MacKay Strategic Bond Fund |
| Currency Purchased | Currency Sold | Counterparty | Settlement Date | Unrealized Appreciation (Depreciation) | ||
| USD | 7,446,254 | EUR | 6,111,000 | JPMorgan Chase Bank N.A. | 5/4/21 | $ 99,304 |
| USD | 7,446,586 | EUR | 6,154,000 | JPMorgan Chase Bank N.A. | 8/2/21 | 33,909 |
| USD | 691,695 | GBP | 497,000 | JPMorgan Chase Bank N.A. | 8/2/21 | 5,144 |
| Total Unrealized Appreciation | 138,357 | |||||
| USD | 681,541 | GBP | 496,000 | JPMorgan Chase Bank N.A. | 5/4/21 | (3,460) |
| Total Unrealized Depreciation | (3,460) | |||||
| Net Unrealized Appreciation | $ 134,897 | |||||
| 1. | Foreign Currency Forward Contracts are subject to limitations such that they cannot be “sold or repurchased,” although the Fund would be able to exit the transaction through other means, such as through the execution of an offsetting transaction. |
| Type | Number of Contracts | Expiration Date | Value at Trade Date | Current Notional Amount | Unrealized Appreciation (Depreciation)2 |
| Long Contracts | |||||
| U.S. Treasury 2 Year Notes | 104 | June 2021 | $ 22,973,866 | $ 22,958,812 | $ (15,054) |
| U.S. Treasury 5 Year Notes | 122 | June 2021 | 15,111,577 | 15,120,375 | 8,798 |
| U.S. Treasury Long Bonds | 15 | June 2021 | 2,404,247 | 2,358,750 | (45,497) |
| Total Long Contracts | (51,753) | ||||
| Short Contracts | |||||
| U.S. Treasury 10 Year Notes | (43) | June 2021 | (5,716,247) | (5,677,344) | 38,903 |
| U.S. Treasury 10 Year Ultra Bonds | (421) | June 2021 | (62,453,830) | (61,275,234) | 1,178,596 |
| U.S. Treasury Ultra Bonds | (202) | June 2021 | (37,792,890) | (37,553,063) | 239,827 |
| Total Short Contracts | 1,457,326 | ||||
| Net Unrealized Appreciation | $ 1,405,573 |
| 1. | As of April 30, 2021, cash in the amount of $2,425,867 was on deposit with a broker or futures commission merchant for futures transactions. |
| 2. | Represents the difference between the value of the contracts at the time they were opened and the value as of April 30, 2021. |
| Notional Amount | Currency | Expiration Date | Payments made by Fund | Payments Received by Fund | Payment Frequency Paid/ Received | Upfront Premiums Paid/ (Received) | Value | Unrealized Appreciation/ (Depreciation) | ||
| $ 40,000,000 | USD | 3/16/23 | Fixed 2.793% | 3 month USD LIBOR | Quarterly | $ — | $ (2,024,232) | $ (2,024,232) | ||
| 41,000,000 | USD | 3/29/23 | Fixed 2.762% | 3 month USD LIBOR | Quarterly | — | (2,044,219) | (2,044,219) | ||
| $ — | $ (4,068,451) | $ (4,068,451) |
| 1. | As of April 30, 2021, cash in the amount of $739,891 was on deposit with a broker for centrally cleared swap agreements. |
| Abbreviation(s): |
| EUR—Euro |
| FHLMC—Federal Home Loan Mortgage Corp. |
| FNMA—Federal National Mortgage Association |
| GBP—British Pound Sterling |
| GNMA—Government National Mortgage Association |
| LIBOR—London Interbank Offered Rate |
| REMIC—Real Estate Mortgage Investment Conduit |
| SOFR—Secured Overnight Financing Rate |
| USD—United States Dollar |
| Description | Quoted Prices in Active Markets for Identical Assets (Level 1) | Significant Other Observable Inputs (Level 2) | Significant Unobservable Inputs (Level 3) | Total | |||
| Asset Valuation Inputs | |||||||
| Investments in Securities (a) | |||||||
| Long-Term Bonds | |||||||
| Asset-Backed Securities | $ — | $ 68,443,867 | $ — | $ 68,443,867 | |||
| Corporate Bonds | — | 340,463,655 | — | 340,463,655 | |||
| Foreign Government Bonds | — | 23,677,014 | — | 23,677,014 | |||
| Loan Assignments | — | 28,813,139 | — | 28,813,139 | |||
| Mortgage-Backed Securities | — | 145,413,216 | — | 145,413,216 | |||
| Municipal Bonds | — | 3,384,070 | — | 3,384,070 | |||
| U.S. Government & Federal Agencies | — | 38,858,358 | — | 38,858,358 | |||
| Total Long-Term Bonds | — | 649,053,319 | — | 649,053,319 | |||
| Common Stocks | 332,124 | — | — | 332,124 | |||
| Short-Term Investments | |||||||
| Affiliated Investment Company | 18,837,275 | — | — | 18,837,275 | |||
| Unaffiliated Investment Company | 3,446,470 | — | — | 3,446,470 | |||
| Total Short-Term Investments | 22,283,745 | — | — | 22,283,745 | |||
| Total Investments in Securities | 22,615,869 | 649,053,319 | — | 671,669,188 | |||
| Other Financial Instruments | |||||||
| Foreign Currency Forward Contracts (b) | — | 138,357 | — | 138,357 | |||
| Futures Contracts (b) | 1,466,124 | — | — | 1,466,124 | |||
| Total Other Financial Instruments | 1,466,124 | 138,357 | — | 1,604,481 | |||
| Total Investments in Securities and Other Financial Instruments | $ 24,081,993 | $ 649,191,676 | $ — | $ 673,273,669 | |||
| Liability Valuation Inputs | |||||||
| Long-Term Bonds Sold Short | |||||||
| Corporate Bond Sold Short | $ — | $ (5,455,974) | $ — | $ (5,455,974) | |||
| Other Financial Instruments | |||||||
| Foreign Currency Forward Contracts (b) | — | (3,460) | — | (3,460) | |||
| Futures Contracts (b) | (60,551) | — | — | (60,551) | |||
| Interest Rate Swaps (b) | — | (4,068,451) | — | (4,068,451) | |||
| Total Other Financial Instruments | (60,551) | (4,071,911) | — | (4,132,462) | |||
| Total Investments in Securities Sold Short and Other Financial Instruments | $ (60,551) | $ (9,527,885) | $ — | $ (9,588,436) |
| (a) | For a complete listing of investments and their industries, see the Portfolio of Investments. |
| (b) | The value listed for these securities reflects unrealized appreciation (depreciation) as shown on the Portfolio of Investments. |
| 24 | MainStay MacKay Strategic Bond Fund |
| Assets | |
| Investment in unaffiliated securities before investments sold short, at value (identified cost $625,186,263) including securities on loan of $3,323,364 | $ 652,831,913 |
| Investment in affiliated investment companies, at value (identified cost $18,837,275) | 18,837,275 |
| Cash collateral on deposit at broker for futures contracts | 2,425,867 |
| Cash collateral on deposit at broker for swap contracts | 739,891 |
| Cash denominated in foreign currencies (identified cost $200,236) | 199,710 |
| Cash | 2,103,154 |
| Receivables: | |
| Interest | 4,808,457 |
| Fund shares sold | 1,047,774 |
| Variation margin on centrally cleared swap contracts | 291,562 |
| Variation margin on futures contracts | 130,529 |
| Investment securities sold | 105,638 |
| Securities lending | 658 |
| Unrealized appreciation on foreign currency forward contracts | 138,357 |
| Other assets | 89,238 |
| Total assets | 683,750,023 |
| Liabilities | |
| Investments sold short (proceeds $5,142,028) | 5,455,974 |
| Cash collateral received for securities on loan | 3,446,470 |
| Payables: | |
| Investment securities purchased | 8,186,345 |
| Fund shares redeemed | 869,910 |
| Manager (See Note 3) | 328,070 |
| Transfer agent (See Note 3) | 176,512 |
| NYLIFE Distributors (See Note 3) | 88,795 |
| Shareholder communication | 63,930 |
| Professional fees | 55,605 |
| Custodian | 16,018 |
| Variation margin on centrally cleared swap contracts | 564 |
| Accrued expenses | 3,276 |
| Distributions payable | 133,031 |
| Unrealized depreciation on foreign currency forward contracts | 3,460 |
| Total liabilities | 18,827,960 |
| Net assets | $ 664,922,063 |
| Composition of Net Assets | |
| Shares of beneficial interest outstanding (par value of $.01 per share) unlimited number of shares authorized | $ 731,222 |
| Additional paid-in-capital | 832,474,601 |
| 833,205,823 | |
| Total distributable earnings (loss) | (168,283,760) |
| Net assets | $ 664,922,063 |
| Class A | |
| Net assets applicable to outstanding shares | $181,816,438 |
| Shares of beneficial interest outstanding | 20,001,817 |
| Net asset value per share outstanding | $ 9.09 |
| Maximum sales charge (4.50% of offering price) | 0.43 |
| Maximum offering price per share outstanding | $ 9.52 |
| Investor Class | |
| Net assets applicable to outstanding shares | $ 17,674,453 |
| Shares of beneficial interest outstanding | 1,927,559 |
| Net asset value per share outstanding | $ 9.17 |
| Maximum sales charge (4.00% of offering price) | 0.38 |
| Maximum offering price per share outstanding | $ 9.55 |
| Class B | |
| Net assets applicable to outstanding shares | $ 4,024,961 |
| Shares of beneficial interest outstanding | 445,084 |
| Net asset value and offering price per share outstanding | $ 9.04 |
| Class C | |
| Net assets applicable to outstanding shares | $ 53,234,537 |
| Shares of beneficial interest outstanding | 5,891,033 |
| Net asset value and offering price per share outstanding | $ 9.04 |
| Class I | |
| Net assets applicable to outstanding shares | $405,568,149 |
| Shares of beneficial interest outstanding | 44,570,850 |
| Net asset value and offering price per share outstanding | $ 9.10 |
| Class R2 | |
| Net assets applicable to outstanding shares | $ 1,011,734 |
| Shares of beneficial interest outstanding | 111,262 |
| Net asset value and offering price per share outstanding | $ 9.09 |
| Class R3 | |
| Net assets applicable to outstanding shares | $ 435,140 |
| Shares of beneficial interest outstanding | 47,861 |
| Net asset value and offering price per share outstanding | $ 9.09 |
| Class R6 | |
| Net assets applicable to outstanding shares | $ 1,156,651 |
| Shares of beneficial interest outstanding | 126,720 |
| Net asset value and offering price per share outstanding | $ 9.13 |
| Investment Income (Loss) | |
| Income | |
| Interest | $11,326,447 |
| Securities lending | 2,505 |
| Dividends-affiliated | 930 |
| Dividends-unaffiliated (net of foreign tax withholding of $100) | 530 |
| Total income | 11,330,412 |
| Expenses | |
| Manager (See Note 3) | 1,998,135 |
| Distribution/Service—Class A (See Note 3) | 221,411 |
| Distribution/Service—Investor Class (See Note 3) | 22,257 |
| Distribution/Service—Class B (See Note 3) | 22,396 |
| Distribution/Service—Class C (See Note 3) | 301,092 |
| Distribution/Service—Class R2 (See Note 3) | 1,233 |
| Distribution/Service—Class R3 (See Note 3) | 839 |
| Transfer agent (See Note 3) | 484,458 |
| Interest on investments sold short | 106,477 |
| Registration | 77,952 |
| Professional fees | 55,884 |
| Shareholder communication | 49,927 |
| Custodian | 22,243 |
| Trustees | 7,463 |
| Insurance | 3,394 |
| Broker fees and charges on short sales | 728 |
| Shareholder service (See Note 3) | 661 |
| Miscellaneous | 16,618 |
| Total expenses | 3,393,168 |
| Net investment income (loss) | 7,937,244 |
| Realized and Unrealized Gain (Loss) | |
| Net realized gain (loss) on: | |
| Unaffiliated investment transactions | 9,917,727 |
| Futures transactions | 8,580,923 |
| Swap transactions | (834,086) |
| Foreign currency transactions | 8,838 |
| Foreign currency forward transactions | (895,400) |
| Net realized gain (loss) | 16,778,002 |
| Net change in unrealized appreciation (depreciation) on: | |
| Unaffiliated investments | 4,264,347 |
| Futures contracts | (1,053,428) |
| Investments sold short | (183,446) |
| Swap contracts | 829,416 |
| Foreign currency forward contracts | 699,150 |
| Translation of other assets and liabilities in foreign currencies | (35,593) |
| Net change in unrealized appreciation (depreciation) | 4,520,446 |
| Net realized and unrealized gain (loss) | 21,298,448 |
| Net increase (decrease) in net assets resulting from operations | $29,235,692 |
| 26 | MainStay MacKay Strategic Bond Fund |
for the six months ended April 30, 2021 (Unaudited) and the year ended October 31, 2020
| 2021 | 2020 | |
| Increase (Decrease) in Net Assets | ||
| Operations: | ||
| Net investment income (loss) | $ 7,937,244 | $ 20,944,697 |
| Net realized gain (loss) | 16,778,002 | (4,133,341) |
| Net change in unrealized appreciation (depreciation) | 4,520,446 | (1,070,079) |
| Net increase (decrease) in net assets resulting from operations | 29,235,692 | 15,741,277 |
| Distributions to shareholders: | ||
| Class A | (1,974,460) | (4,402,631) |
| Investor Class | (185,344) | (440,469) |
| Class B | (29,560) | (108,106) |
| Class C | (395,177) | (1,281,225) |
| Class I | (4,958,830) | (13,052,942) |
| Class R2 | (10,484) | (143,506) |
| Class R3 | (3,304) | (5,136) |
| Class R6 | (10,192) | (197,722) |
| (7,567,351) | (19,631,737) | |
| Distributions to shareholders from return of capital: | ||
| Class A | — | (131,689) |
| Investor Class | — | (13,175) |
| Class B | — | (3,234) |
| Class C | — | (38,323) |
| Class I | — | (390,433) |
| Class R2 | — | (4,292) |
| Class R3 | — | (154) |
| Class R6 | — | (5,914) |
| — | (587,214) | |
| Total distributions to shareholders | (7,567,351) | (20,218,951) |
| Capital share transactions: | ||
| Net proceeds from sales of shares | 65,145,411 | 207,685,790 |
| Net asset value of shares issued to shareholder in reinvestment of distributions | 6,787,367 | 18,303,153 |
| Cost of shares redeemed | (99,167,457) | (503,088,197) |
| Increase (decrease) in net assets derived from capital share transactions | (27,234,679) | (277,099,254) |
| Net increase (decrease) in net assets | (5,566,338) | (281,576,928) |
| Net Assets | ||
| Beginning of period | 670,488,401 | 952,065,329 |
| End of period | $664,922,063 | $ 670,488,401 |
| Six months ended April 30, 2021* | Year Ended October 31, | ||||||||||
| Class A | 2020 | 2019 | 2018 | 2017 | 2016 | ||||||
| Net asset value at beginning of period | $ 8.80 | $ 8.74 | $ 8.65 | $ 8.90 | $ 8.81 | $ 8.72 | |||||
| Net investment income (loss) (a) | 0.10 | 0.22 | 0.23 | 0.24 | 0.25 | 0.35 | |||||
| Net realized and unrealized gain (loss) on investments | 0.29 | 0.06 | 0.11 | (0.23) | 0.15 | 0.08 | |||||
| Net realized and unrealized gain (loss) on foreign currency transactions | 0.00‡ | 0.00‡ | 0.00‡ | 0.01 | (0.00)‡ | (0.02) | |||||
| Total from investment operations | 0.39 | 0.28 | 0.34 | 0.02 | 0.40 | 0.41 | |||||
| Less distributions: | |||||||||||
| From net investment income | (0.10) | (0.21) | (0.25) | (0.27) | (0.31) | (0.32) | |||||
| Return of capital | — | (0.01) | — | (0.00)‡ | (0.00)‡ | — | |||||
| Total distributions | (0.10) | (0.22) | (0.25) | (0.27) | (0.31) | (0.32) | |||||
| Net asset value at end of period | $ 9.09 | $ 8.80 | $ 8.74 | $ 8.65 | $ 8.90 | $ 8.81 | |||||
| Total investment return (b) | 4.44% | 3.27% | 3.99% | 0.25% | 4.65% | 4.94% | |||||
| Ratios (to average net assets)/Supplemental Data: | |||||||||||
| Net investment income (loss) | 2.32%†† | 2.60% | 2.66% | 2.69%†† | 2.79% | 4.04% | |||||
| Net expenses (c)(d) | 1.09%†† | 1.18% | 1.27% | 1.25% | 1.13% | 1.16% | |||||
| Portfolio turnover rate | 20% | 56% (e) | 50% (e) | 22% | 41% | 15% | |||||
| Net assets at end of period (in 000’s) | $ 181,816 | $ 175,682 | $ 197,686 | $ 220,618 | $ 302,192 | $ 412,834 | |||||
| * | Unaudited. |
| ‡ | Less than one cent per share. |
| †† | Annualized. |
| (a) | Per share data based on average shares outstanding during the period. |
| (b) | Total investment return is calculated exclusive of sales charges and assumes the reinvestment of dividends and distributions. For periods of less than one year, total return is not annualized. |
| (c) | In addition to the fees and expenses which the Fund bears directly, it also indirectly bears a pro-rata share of the fees and expenses of the underlying funds in which it invests. Such indirect expenses are not included in the above expense ratios. |
| (d) | The expense ratios presented below show the impact of short sales expense: |
| Period Ended | Net Expenses (excluding short sale expenses) | Short Sales Expenses | ||
| April 30, 2021 | 1.06% | 0.03% | ||
| October 31, 2020 | 1.07% | 0.11% | ||
| October 31, 2019 | 1.07% | 0.20% | ||
| October 31, 2018 | 1.03% | 0.22% | ||
| October 31, 2017 | 1.01% | 0.12% | ||
| October 31, 2016 | 1.00% | 0.16% |
| (e) | The portfolio turnover rate not including mortgage dollar rolls was 53% and 44% for the years ended October 31, 2020 and 2019, respectively. |
| 28 | MainStay MacKay Strategic Bond Fund |
| Six months ended April 30, 2021* | Year Ended October 31, | ||||||||||
| Investor Class | 2020 | 2019 | 2018 | 2017 | 2016 | ||||||
| Net asset value at beginning of period | $ 8.88 | $ 8.81 | $ 8.72 | $ 8.97 | $ 8.88 | $ 8.78 | |||||
| Net investment income (loss) (a) | 0.10 | 0.22 | 0.23 | 0.24 | 0.24 | 0.35 | |||||
| Net realized and unrealized gain (loss) on investments | 0.28 | 0.06 | 0.11 | (0.23) | 0.16 | 0.10 | |||||
| Net realized and unrealized gain (loss) on foreign currency transactions | 0.00‡ | 0.00‡ | 0.00‡ | 0.01 | (0.00)‡ | (0.03) | |||||
| Total from investment operations | 0.38 | 0.28 | 0.34 | 0.02 | 0.40 | 0.42 | |||||
| Less distributions: | |||||||||||
| From net investment income | (0.09) | (0.20) | (0.25) | (0.27) | (0.31) | (0.32) | |||||
| Return of capital | — | (0.01) | — | (0.00)‡ | (0.00)‡ | — | |||||
| Total distributions | (0.09) | (0.21) | (0.25) | (0.27) | (0.31) | (0.32) | |||||
| Net asset value at end of period | $ 9.17 | $ 8.88 | $ 8.81 | $ 8.72 | $ 8.97 | $ 8.88 | |||||
| Total investment return (b) | 4.34% | 3.29% | 3.93% | 0.23% | 4.59% | 5.00% | |||||
| Ratios (to average net assets)/Supplemental Data: | |||||||||||
| Net investment income (loss) | 2.22%†† | 2.54% | 2.63% | 2.68% | 2.74% | 4.01% | |||||
| Net expenses (c)(d) | 1.19%†† | 1.24% | 1.29% | 1.27% | 1.15% | 1.18% | |||||
| Portfolio turnover rate | 20% | 56% (e) | 50% (e) | 22% | 41% | 15% | |||||
| Net assets at end of period (in 000’s) | $ 17,674 | $ 18,139 | $ 19,748 | $ 20,451 | $ 22,033 | $ 31,851 | |||||
| * | Unaudited. |
| ‡ | Less than one cent per share. |
| †† | Annualized. |
| (a) | Per share data based on average shares outstanding during the period. |
| (b) | Total investment return is calculated exclusive of sales charges and assumes the reinvestment of dividends and distributions. For periods of less than one year, total return is not annualized. |
| (c) | In addition to the fees and expenses which the Fund bears directly, it also indirectly bears a pro-rata share of the fees and expenses of the underlying funds in which it invests. Such indirect expenses are not included in the above expense ratios. |
| (d) | The expense ratios presented below show the impact of short sales expense: |
| Period Ended | Net Expenses (excluding short sale expenses) | Short Sales Expenses | ||
| April 30, 2021 | 1.16% | 0.03% | ||
| October 31, 2020 | 1.13% | 0.11% | ||
| October 31, 2019 | 1.09% | 0.20% | ||
| October 31, 2018 | 1.05% | 0.22% | ||
| October 31, 2017 | 1.03% | 0.12% | ||
| October 31, 2016 | 1.02% | 0.16% |
| (e) | The portfolio turnover rate not including mortgage dollar rolls was 53% and 44% for the years ended October 31, 2020 and 2019, respectively. |
| Six months ended April 30, 2021* | Year Ended October 31, | ||||||||||
| Class B | 2020 | 2019 | 2018 | 2017 | 2016 | ||||||
| Net asset value at beginning of period | $ 8.76 | $ 8.70 | $ 8.61 | $ 8.86 | $ 8.77 | $ 8.68 | |||||
| Net investment income (loss) (a) | 0.07 | 0.15 | 0.16 | 0.17 | 0.18 | 0.28 | |||||
| Net realized and unrealized gain (loss) on investments | 0.27 | 0.06 | 0.11 | (0.23) | 0.15 | 0.10 | |||||
| Net realized and unrealized gain (loss) on foreign currency transactions | 0.00‡ | 0.00‡ | 0.00‡ | 0.01 | (0.00)‡ | (0.03) | |||||
| Total from investment operations | 0.34 | 0.21 | 0.27 | (0.05) | 0.33 | 0.35 | |||||
| Less distributions: | |||||||||||
| From net investment income | (0.06) | (0.15) | (0.18) | (0.20) | (0.24) | (0.26) | |||||
| Return of capital | — | (0.00)‡ | — | (0.00)‡ | (0.00)‡ | — | |||||
| Total distributions | (0.06) | (0.15) | (0.18) | (0.20) | (0.24) | (0.26) | |||||
| Net asset value at end of period | $ 9.04 | $ 8.76 | $ 8.70 | $ 8.61 | $ 8.86 | $ 8.77 | |||||
| Total investment return (b) | 3.89% | 2.44% | 3.20% | (0.52)% | 3.86% | 4.16% | |||||
| Ratios (to average net assets)/Supplemental Data: | |||||||||||
| Net investment income (loss) | 1.47%†† | 1.77% | 1.90% | 1.92% | 2.00% | 3.26% | |||||
| Net expenses (c)(d) | 1.94%†† | 2.00% | 2.04% | 2.02% | 1.90% | 1.93% | |||||
| Portfolio turnover rate | 20% | 56% (e) | 50% (e) | 22% | 41% | 15% | |||||
| Net assets at end of period (in 000’s) | $ 4,025 | $ 4,872 | $ 7,970 | $ 11,015 | $ 15,223 | $ 18,313 | |||||
| * | Unaudited. |
| ‡ | Less than one cent per share. |
| †† | Annualized. |
| (a) | Per share data based on average shares outstanding during the period. |
| (b) | Total investment return is calculated exclusive of sales charges and assumes the reinvestment of dividends and distributions. For periods of less than one year, total return is not annualized. |
| (c) | In addition to the fees and expenses which the Fund bears directly, it also indirectly bears a pro-rata share of the fees and expenses of the underlying funds in which it invests. Such indirect expenses are not included in the above expense ratios. |
| (d) | The expense ratios presented below show the impact of short sales expense: |
| Period Ended | Net Expenses (excluding short sale expenses) | Short Sales Expenses | ||
| April 30, 2021 | 1.91% | 0.03% | ||
| October 31, 2020 | 1.89% | 0.11% | ||
| October 31, 2019 | 1.84% | 0.20% | ||
| October 31, 2018 | 1.80% | 0.22% | ||
| October 31, 2017 | 1.78% | 0.12% | ||
| October 31, 2016 | 1.77% | 0.16% |
| (e) | The portfolio turnover rate not including mortgage dollar rolls was 53% and 44% for the years ended October 31, 2020 and 2019, respectively. |
| 30 | MainStay MacKay Strategic Bond Fund |
| Six months ended April 30, 2021* | Year Ended October 31, | ||||||||||
| Class C | 2020 | 2019 | 2018 | 2017 | 2016 | ||||||
| Net asset value at beginning of period | $ 8.75 | $ 8.69 | $ 8.60 | $ 8.85 | $ 8.76 | $ 8.67 | |||||
| Net investment income (loss) (a) | 0.07 | 0.15 | 0.16 | 0.17 | 0.18 | 0.28 | |||||
| Net realized and unrealized gain (loss) on investments | 0.28 | 0.06 | 0.11 | (0.23) | 0.15 | 0.10 | |||||
| Net realized and unrealized gain (loss) on foreign currency transactions | 0.00‡ | 0.00‡ | 0.00‡ | 0.01 | (0.00)‡ | (0.03) | |||||
| Total from investment operations | 0.35 | 0.21 | 0.27 | (0.05) | 0.33 | 0.35 | |||||
| Less distributions: | |||||||||||
| From net investment income | (0.06) | (0.15) | (0.18) | (0.20) | (0.24) | (0.26) | |||||
| Return of capital | — | (0.00)‡ | — | (0.00)‡ | (0.00)‡ | — | |||||
| Total distributions | (0.06) | (0.15) | (0.18) | (0.20) | (0.24) | (0.26) | |||||
| Net asset value at end of period | $ 9.04 | $ 8.75 | $ 8.69 | $ 8.60 | $ 8.85 | $ 8.76 | |||||
| Total investment return (b) | 4.01% | 2.45% | 3.21% | (0.52)% | 3.86% | 4.16% | |||||
| Ratios (to average net assets)/Supplemental Data: | |||||||||||
| Net investment income (loss) | 1.46%†† | 1.78% | 1.90% | 1.92% | 2.00% | 3.27% | |||||
| Net expenses (c)(d) | 1.94%†† | 2.00% | 2.04% | 2.02% | 1.90% | 1.93% | |||||
| Portfolio turnover rate | 20% | 56% (e) | 50% (e) | 22% | 41% | 15% | |||||
| Net assets at end of period (in 000’s) | $ 53,235 | $ 65,158 | $ 91,598 | $ 128,279 | $ 167,595 | $ 220,513 | |||||
| * | Unaudited. |
| ‡ | Less than one cent per share. |
| †† | Annualized. |
| (a) | Per share data based on average shares outstanding during the period. |
| (b) | Total investment return is calculated exclusive of sales charges and assumes the reinvestment of dividends and distributions. For periods of less than one year, total return is not annualized. |
| (c) | In addition to the fees and expenses which the Fund bears directly, it also indirectly bears a pro-rata share of the fees and expenses of the underlying funds in which it invests. Such indirect expenses are not included in the above expense ratios. |
| (d) | The expense ratios presented below show the impact of short sales expense: |
| Period Ended | Net Expenses (excluding short sale expenses) | Short Sales Expenses | ||
| April 30, 2021 | 1.91% | 0.03% | ||
| October 31, 2020 | 1.89% | 0.11% | ||
| October 31, 2019 | 1.84% | 0.20% | ||
| October 31, 2018 | 1.80% | 0.22% | ||
| October 31, 2017 | 1.78% | 0.12% | ||
| October 31, 2016 | 1.77% | 0.16% |
| (e) | The portfolio turnover rate not including mortgage dollar rolls was 53% and 44% for the years ended October 31, 2020 and 2019, respectively. |
| Six months ended April 30, 2021* | Year Ended October 31, | ||||||||||
| Class I | 2020 | 2019 | 2018 | 2017 | 2016 | ||||||
| Net asset value at beginning of period | $ 8.81 | $ 8.75 | $ 8.66 | $ 8.91 | $ 8.82 | $ 8.72 | |||||
| Net investment income (loss) (a) | 0.12 | 0.24 | 0.25 | 0.26 | 0.26 | 0.37 | |||||
| Net realized and unrealized gain (loss) on investments | 0.28 | 0.06 | 0.11 | (0.23) | 0.16 | 0.11 | |||||
| Net realized and unrealized gain (loss) on foreign currency transactions | 0.00‡ | 0.00‡ | 0.00‡ | 0.01 | (0.00)‡ | (0.03) | |||||
| Total from investment operations | 0.40 | 0.30 | 0.36 | 0.04 | 0.42 | 0.45 | |||||
| Less distributions: | |||||||||||
| From net investment income | (0.11) | (0.23) | (0.27) | (0.29) | (0.33) | (0.35) | |||||
| Return of capital | — | (0.01) | — | (0.00)‡ | (0.00)‡ | — | |||||
| Total distributions | (0.11) | (0.24) | (0.27) | (0.29) | (0.33) | (0.35) | |||||
| Net asset value at end of period | $ 9.10 | $ 8.81 | $ 8.75 | $ 8.66 | $ 8.91 | $ 8.82 | |||||
| Total investment return (b) | 4.56% | 3.53% | 4.24% | 0.51% | 4.90% | 5.32% | |||||
| Ratios (to average net assets)/Supplemental Data: | |||||||||||
| Net investment income (loss) | 2.57%†† | 2.83% | 2.91% | 2.94% | 2.99% | 4.30% | |||||
| Net expenses (c)(d) | 0.84%†† | 0.94% | 1.02% | 1.00% | 0.88% | 0.91% | |||||
| Portfolio turnover rate | 20% | 56% (e) | 50% (e) | 22% | 41% | 15% | |||||
| Net assets at end of period (in 000’s) | $ 405,568 | $ 404,964 | $ 604,981 | $ 717,129 | $ 837,363 | $ 735,359 | |||||
| * | Unaudited. |
| ‡ | Less than one cent per share. |
| †† | Annualized. |
| (a) | Per share data based on average shares outstanding during the period. |
| (b) | Total investment return is calculated exclusive of sales charges and assumes the reinvestment of dividends and distributions. Class I shares are not subject to sales charges. For periods of less than one year, total return is not annualized. |
| (c) | In addition to the fees and expenses which the Fund bears directly, it also indirectly bears a pro-rata share of the fees and expenses of the underlying funds in which it invests. Such indirect expenses are not included in the above expense ratios. |
| (d) | The expense ratios presented below show the impact of short sales expense: |
| Period Ended | Net Expenses (excluding short sale expenses) | Short Sales Expenses | ||
| April 30, 2021 | 0.81% | 0.03% | ||
| October 31, 2020 | 0.83% | 0.11% | ||
| October 31, 2019 | 0.82% | 0.20% | ||
| October 31, 2018 | 0.78% | 0.22% | ||
| October 31, 2017 | 0.76% | 0.12% | ||
| October 31, 2016 | 0.75% | 0.16% |
| (e) | The portfolio turnover rate not including mortgage dollar rolls was 53% and 44% for the years ended October 31, 2020 and 2019, respectively. |
| 32 | MainStay MacKay Strategic Bond Fund |
| Six months ended April 30, 2021* | Year Ended October 31, | ||||||||||
| Class R2 | 2020 | 2019 | 2018 | 2017 | 2016 | ||||||
| Net asset value at beginning of period | $ 8.81 | $ 8.74 | $ 8.65 | $ 8.90 | $ 8.81 | $ 8.72 | |||||
| Net investment income (loss) (a) | 0.10 | 0.21 | 0.22 | 0.23 | 0.23 | 0.34 | |||||
| Net realized and unrealized gain (loss) on investments | 0.28 | 0.07 | 0.11 | (0.23) | 0.16 | 0.10 | |||||
| Net realized and unrealized gain (loss) on foreign currency transactions | 0.00‡ | 0.00‡ | 0.00‡ | 0.01 | (0.00)‡ | (0.03) | |||||
| Total from investment operations | 0.38 | 0.28 | 0.33 | 0.01 | 0.39 | 0.41 | |||||
| Less distributions: | |||||||||||
| From net investment income | (0.10) | (0.20) | (0.24) | (0.26) | (0.30) | (0.32) | |||||
| Return of capital | — | (0.01) | — | (0.00)‡ | (0.00)‡ | — | |||||
| Total distributions | (0.10) | (0.21) | (0.24) | (0.26) | (0.30) | (0.32) | |||||
| Net asset value at end of period | $ 9.09 | $ 8.81 | $ 8.74 | $ 8.65 | $ 8.90 | $ 8.81 | |||||
| Total investment return (b) | 4.27% | 3.27% | 3.89% | 0.16% | 4.54% | 4.84% | |||||
| Ratios (to average net assets)/Supplemental Data: | |||||||||||
| Net investment income (loss) | 2.23%†† | 2.49% | 2.54% | 2.67% | 2.63% | 3.97% | |||||
| Net expenses (c)(d) | 1.19%†† | 1.29% | 1.37% | 1.34% | 1.23% | 1.28% | |||||
| Portfolio turnover rate | 20% | 56% (e) | 50% (e) | 22% | 41% | 15% | |||||
| Net assets at end of period (in 000’s) | $ 1,012 | $ 934 | $ 7,232 | $ 6,657 | $ 773 | $ 662 | |||||
| * | Unaudited. |
| ‡ | Less than one cent per share. |
| †† | Annualized. |
| (a) | Per share data based on average shares outstanding during the period. |
| (b) | Total investment return is calculated exclusive of sales charges and assumes the reinvestment of dividends and distributions. Class R2 shares are not subject to sales charges. For periods of less than one year, total return is not annualized. |
| (c) | In addition to the fees and expenses which the Fund bears directly, it also indirectly bears a pro-rata share of the fees and expenses of the underlying funds in which it invests. Such indirect expenses are not included in the above expense ratios. |
| (d) | The expense ratios presented below show the impact of short sales expense: |
| Period Ended | Net Expenses (excluding short sale expenses) | Short Sales Expenses | ||
| April 30, 2021 | 1.16% | 0.03% | ||
| October 31, 2020 | 1.18% | 0.11% | ||
| October 31, 2019 | 1.17% | 0.20% | ||
| October 31, 2018 | 1.14% | 0.20% | ||
| October 31, 2017 | 1.11% | 0.12% | ||
| October 31, 2016 | 1.12% | 0.16% |
| (e) | The portfolio turnover rate not including mortgage dollar rolls was 53% and 44% for the years ended October 31, 2020 and 2019, respectively. |
| Six months ended April 30, 2021* | Year Ended October 31, | February 29, 2016 through October 31, 2016 | |||||||||
| Class R3 | 2020 | 2019 | 2018 | 2017 | |||||||
| Net asset value at beginning of period | $ 8.80 | $ 8.74 | $ 8.65 | $ 8.90 | $ 8.81 | $ 8.20 | |||||
| Net investment income (loss) (a) | 0.09 | 0.20 | 0.20 | 0.21 | 0.21 | 0.21 | |||||
| Net realized and unrealized gain (loss) on investments | 0.28 | 0.05 | 0.11 | (0.23) | 0.16 | 0.86 | |||||
| Net realized and unrealized gain (loss) on foreign currency transactions | 0.00‡ | 0.00‡ | 0.00‡ | 0.01 | (0.00)‡ | (0.27) | |||||
| Total from investment operations | 0.37 | 0.25 | 0.31 | (0.01) | 0.37 | 0.80 | |||||
| Less distributions: | |||||||||||
| From net investment income | (0.08) | (0.18) | (0.22) | (0.24) | (0.28) | (0.19) | |||||
| Return of capital | — | (0.01) | — | (0.00)‡ | (0.00)‡ | — | |||||
| Total distributions | (0.08) | (0.19) | (0.22) | (0.24) | (0.28) | (0.19) | |||||
| Net asset value at end of period | $ 9.09 | $ 8.80 | $ 8.74 | $ 8.65 | $ 8.90 | $ 8.81 | |||||
| Total investment return (b) | 4.25% | 2.90% | 3.63% | (0.09)% | 4.28% | 9.77% | |||||
| Ratios (to average net assets)/Supplemental Data: | |||||||||||
| Net investment income (loss) | 2.01%†† | 2.27% | 2.29% | 2.36% | 2.34% | 3.32% | |||||
| Net expenses (c)(d) | 1.44%†† | 1.52% | 1.62% | 1.60% | 1.48% | 1.50% | |||||
| Portfolio turnover rate | 20% | 56% (e) | 50% (e) | 22% | 41% | 15% | |||||
| Net assets at end of period (in 000’s) | $ 435 | $ 276 | $ 218 | $ 190 | $ 114 | $ 32 | |||||
| * | Unaudited. |
| ‡ | Less than one cent per share. |
| †† | Annualized. |
| (a) | Per share data based on average shares outstanding during the period. |
| (b) | Total investment return is calculated exclusive of sales charges and assumes the reinvestment of dividends and distributions. Class R3 shares are not subject to sales charges. For periods of less than one year, total return is not annualized. |
| (c) | In addition to the fees and expenses which the Fund bears directly, it also indirectly bears a pro-rata share of the fees and expenses of the underlying funds in which it invests. Such indirect expenses are not included in the above expense ratios. |
| (d) | The expense ratios presented below show the impact of short sales expense: |
| Period Ended | Net Expenses (excluding short sale expenses) | Short Sales Expenses | ||
| April 30, 2021 | 1.41% | 0.03% | ||
| October 31, 2020 | 1.41% | 0.11% | ||
| October 31, 2019 | 1.42% | 0.20% | ||
| October 31, 2018 | 1.38% | 0.22% | ||
| October 31, 2017 | 1.36% | 0.12% | ||
| October 31, 2016 | 1.34% | 0.16% |
| (e) | The portfolio turnover rate not including mortgage dollar rolls was 53% and 44% for the years ended October 31, 2020 and 2019, respectively. |
| 34 | MainStay MacKay Strategic Bond Fund |
| Six months ended April 30, 2021* | Year Ended October 31, | February 28, 2018 through October 31, 2018 | |||||
| Class R6 | 2020 | 2019 | |||||
| Net asset value at beginning of period | $ 8.84 | $ 8.75 | $ 8.66 | $ 8.83 | |||
| Net investment income (loss) (a) | 0.12 | 0.25 | 0.27 | 0.19 | |||
| Net realized and unrealized gain (loss) on investments | 0.29 | 0.08 | 0.11 | (0.15) | |||
| Net realized and unrealized gain (loss) on foreign currency transactions | 0.00‡ | 0.01 | 0.00‡ | 0.01 | |||
| Total from investment operations | 0.41 | 0.34 | 0.38 | 0.05 | |||
| Less distributions: | |||||||
| From net investment income | (0.12) | (0.24) | (0.29) | (0.22) | |||
| Return of capital | — | (0.01) | — | (0.00)‡ | |||
| Total distributions | (0.12) | (0.25) | (0.29) | (0.22) | |||
| Net asset value at end of period | $ 9.13 | $ 8.84 | $ 8.75 | $ 8.66 | |||
| Total investment return (b) | 4.61% | 4.04% | 4.43% | 0.54% | |||
| Ratios (to average net assets)/Supplemental Data: | |||||||
| Net investment income (loss) | 2.74%†† | 2.88% | 3.13% | 3.18%†† | |||
| Net expenses (c)(d) | 0.71%†† | 0.82% | 0.84% | 0.85%†† | |||
| Portfolio turnover rate | 20% | 56% (e) | 50% (e) | 22% | |||
| Net assets at end of period (in 000’s) | $ 1,157 | $ 465 | $ 22,632 | $ 52,504 | |||
| * | Unaudited. |
| ‡ | Less than one cent per share. |
| †† | Annualized. |
| (a) | Per share data based on average shares outstanding during the period. |
| (b) | Total investment return is calculated exclusive of sales charges and assumes the reinvestment of dividends and distributions. Class R6 shares are not subject to sales charges. For periods of less than one year, total return is not annualized. |
| (c) | In addition to the fees and expenses which the Fund bears directly, it also indirectly bears a pro-rata share of the fees and expenses of the underlying funds in which it invests. Such indirect expenses are not included in the above expense ratios. |
| (d) | The expense ratios presented below show the impact of short sales expense: |
| Period Ended | Net Expenses (excluding short sale expenses) | Short Sales Expenses | ||
| April 30, 2021 | 0.68% | 0.03% | ||
| October 31, 2020 | 0.66% | 0.16% | ||
| October 31, 2019 | 0.64% | 0.20% | ||
| October 31, 2018 | 0.62% | 0.23% |
| (e) | The portfolio turnover rate not including mortgage dollar rolls was 53% and 44% for the years ended October 31, 2020 and 2019, respectively. |
| Class | Commenced Operations |
| Class A | February 28, 1997 |
| Investor Class | February 28, 2008 |
| Class B | February 28, 1997 |
| Class C | September 1, 1998 |
| Class I | January 2, 2004 |
| Class R2 | February 28, 2014 |
| Class R3 | February 29, 2016 |
| Class R6 | February 28, 2018 |
| SIMPLE Class | N/A* |
| * | SIMPLE Class shares were registered for sale effective as of August 31, 2020, but have not yet commenced operations. |
| 36 | MainStay MacKay Strategic Bond Fund |
| • | Level 1—quoted prices in active markets for an identical asset or liability |
| • | Level 2—other significant observable inputs (including quoted prices for a similar asset or liability in active markets, interest rates and yield curves, prepayment speeds, credit risk, etc.) |
| • | Level 3—significant unobservable inputs (including the Fund's own assumptions about the assumptions that market participants would use in measuring fair value of an asset or liability) |
| • Benchmark yields | • Reported trades |
| • Broker/dealer quotes | • Issuer spreads |
| • Two-sided markets | • Benchmark securities |
| • Bids/offers | • Reference data (corporate actions or material event notices) |
| • Industry and economic events | • Comparable bonds |
| • Monthly payment information |
| 38 | MainStay MacKay Strategic Bond Fund |
| 40 | MainStay MacKay Strategic Bond Fund |
| 42 | MainStay MacKay Strategic Bond Fund |
| Asset Derivatives | Foreign Exchange Contracts Risk | Interest Rate Contracts Risk | Total |
| Futures Contracts - Net Assets—Net unrealized appreciation on futures contracts (a) | $ — | $1,466,124 | $1,466,124 |
| Forward Contracts - Unrealized appreciation on foreign currency forward contracts | 138,357 | — | 138,357 |
| Total Fair Value | $138,357 | $1,466,124 | $1,604,481 |
| (a) | Includes cumulative appreciation (depreciation) of futures contracts as reported in the Portfolio of Investments. Only current day’s variation margin is reported within the Statement of Assets and Liabilities. |
| Liability Derivatives | Foreign Exchange Contracts Risk | Interest Rate Contracts Risk | Total |
| Futures Contracts - Net Assets—Net unrealized depreciation on futures contracts (a) | $ — | $ (60,551) | $ (60,551) |
| Centrally Cleared Swap Contracts - Net Assets—Net unrealized depreciation on swap contracts (b) | — | (4,068,451) | (4,068,451) |
| Forward Contracts - Unrealized depreciation on foreign currency forward contracts | (3,460) | — | (3,460) |
| Total Fair Value | $(3,460) | $(4,129,002) | $(4,132,462) |
| (a) | Includes cumulative appreciation (depreciation) of futures contracts as reported in the Portfolio of Investments. Only current day’s variation margin is reported within the Statement of Assets and Liabilities. |
| (b) | Includes cumulative appreciation (depreciation) of centrally cleared swap agreements as reported in the Portfolio of Investments. Only the current day’s variation margin is reported within the Statement of Assets and Liabilities. |
| Net Realized Gain (Loss) from: | Foreign Exchange Contracts Risk | Interest Rate Contracts Risk | Total |
| Futures Contracts | $ — | $8,580,923 | $8,580,923 |
| Swap Contracts | — | (834,086) | (834,086) |
| Forward Contracts | (895,400) | — | (895,400) |
| Total Net Realized Gain (Loss) | $(895,400) | $7,746,837 | $6,851,437 |
| Net Change in Unrealized Appreciation (Depreciation) | Foreign Exchange Contracts Risk | Interest Rate Contracts Risk | Total |
| Futures Contracts | $ — | $(1,053,428) | $(1,053,428) |
| Swap Contracts | — | 829,416 | 829,416 |
| Forward Contracts | 699,150 | — | 699,150 |
| Total Net Change in Unrealized Appreciation (Depreciation) | $699,150 | $ (224,012) | $ 475,138 |
| Average Notional Amount | Total |
| Futures Contracts Long | $ 33,408,108 |
| Futures Contracts Short | $(102,472,349) |
| Swap Contracts Long | $ 81,000,000 |
| Forward Contracts Long | $ 8,069,859 |
| Forward Contracts Short | $ (10,638,524) |
| 44 | MainStay MacKay Strategic Bond Fund |
| Class R2 | $ 493 |
| Class R3 | 168 |
| Class | Expense | Waived |
| Class A | $117,533 | $— |
| Investor Class | 21,331 | — |
| Class B | 5,362 | — |
| Class C | 72,083 | — |
| Class I | 267,255 | — |
| Class R2 | 656 | — |
| Class R3 | 224 | — |
| Class R6 | 14 | — |
| Affiliated Investment Companies | Value, Beginning of Period | Purchases at Cost | Proceeds from Sales | Net Realized Gain/(Loss) on Sales | Change in Unrealized Appreciation/ (Depreciation) | Value, End of Period | Dividend Income | Other Distributions | Shares End of Period |
| MainStay U.S. Government Liquidity Fund | $ 30,619 | $ 128,670 | $ (140,452) | $ — | $ — | $ 18,837 | $ 1 | $ — | 18,837 |
| Class R3 | $31,735 | 7.3% |
| Class R6 | 28,506 | 2.5 |
| Federal Tax Cost | Gross Unrealized Appreciation | Gross Unrealized (Depreciation) | Net Unrealized Appreciation/ (Depreciation) | |
| Investments | $638,806,407 | $33,017,537 | $(5,610,730) | $27,406,807 |
| 46 | MainStay MacKay Strategic Bond Fund |
| Capital Loss Available Through | Short-Term Capital Loss Amounts (000’s) | Long-Term Capital Loss Amounts (000’s) |
| Unlimited | $37,596 | $170,144 |
| 2020 | |
| Distributions paid from: | |
| Ordinary Income | $19,631,737 |
| Return of Capital | 587,214 |
| Total | $20,218,951 |
| Class A | Shares | Amount |
| Period ended April 30, 2021: | ||
| Shares sold | 1,913,998 | $ 17,337,812 |
| Shares issued to shareholders in reinvestment of distributions | 198,646 | 1,798,249 |
| Shares redeemed | (2,386,484) | (21,580,739) |
| Net increase (decrease) in shares outstanding before conversion | (273,840) | (2,444,678) |
| Shares converted into Class A (See Note 1) | 386,459 | 3,488,033 |
| Shares converted from Class A (See Note 1) | (68,900) | (622,756) |
| Net increase (decrease) | 43,719 | $ 420,599 |
| Year ended October 31, 2020: | ||
| Shares sold | 3,549,959 | $ 30,759,137 |
| Shares issued to shareholders in reinvestment of distributions | 488,987 | 4,220,842 |
| Shares redeemed | (6,892,108) | (59,273,038) |
| Net increase (decrease) in shares outstanding before conversion | (2,853,162) | (24,293,059) |
| Shares converted into Class A (See Note 1) | 265,023 | 2,297,846 |
| Shares converted from Class A (See Note 1) | (70,039) | (603,380) |
| Net increase (decrease) | (2,658,178) | $ (22,598,593) |
| Investor Class | Shares | Amount |
| Period ended April 30, 2021: | ||
| Shares sold | 56,373 | $ 513,444 |
| Shares issued to shareholders in reinvestment of distributions | 19,841 | 181,150 |
| Shares redeemed | (167,350) | (1,529,879) |
| Net increase (decrease) in shares outstanding before conversion | (91,136) | (835,285) |
| Shares converted into Investor Class (See Note 1) | 103,498 | 941,097 |
| Shares converted from Investor Class (See Note 1) | (127,794) | (1,166,503) |
| Net increase (decrease) | (115,432) | $ (1,060,691) |
| Year ended October 31, 2020: | ||
| Shares sold | 155,915 | $ 1,356,863 |
| Shares issued to shareholders in reinvestment of distributions | 51,115 | 444,676 |
| Shares redeemed | (304,909) | (2,639,908) |
| Net increase (decrease) in shares outstanding before conversion | (97,879) | (838,369) |
| Shares converted into Investor Class (See Note 1) | 83,544 | 726,787 |
| Shares converted from Investor Class (See Note 1) | (183,114) | (1,598,912) |
| Net increase (decrease) | (197,449) | $ (1,710,494) |
| Class B | Shares | Amount |
| Period ended April 30, 2021: | ||
| Shares sold | 5,596 | $ 49,934 |
| Shares issued to shareholders in reinvestment of distributions | 2,672 | 24,064 |
| Shares redeemed | (80,549) | (724,977) |
| Net increase (decrease) in shares outstanding before conversion | (72,281) | (650,979) |
| Shares converted from Class B (See Note 1) | (39,013) | (349,910) |
| Net increase (decrease) | (111,294) | $ (1,000,889) |
| Year ended October 31, 2020: | ||
| Shares sold | 13,761 | $ 117,932 |
| Shares issued to shareholders in reinvestment of distributions | 10,913 | 93,552 |
| Shares redeemed | (309,879) | (2,667,687) |
| Net increase (decrease) in shares outstanding before conversion | (285,205) | (2,456,203) |
| Shares converted from Class B (See Note 1) | (74,998) | (645,966) |
| Net increase (decrease) | (360,203) | $ (3,102,169) |
| Class C | Shares | Amount |
| Period ended April 30, 2021: | ||
| Shares sold | 146,683 | $ 1,317,444 |
| Shares issued to shareholders in reinvestment of distributions | 42,956 | 386,583 |
| Shares redeemed | (1,420,701) | (12,783,462) |
| Net increase (decrease) in shares outstanding before conversion | (1,231,062) | (11,079,435) |
| Shares converted from Class C (See Note 1) | (324,766) | (2,908,217) |
| Net increase (decrease) | (1,555,828) | $ (13,987,652) |
| Year ended October 31, 2020: | ||
| Shares sold | 425,749 | $ 3,655,007 |
| Shares issued to shareholders in reinvestment of distributions | 140,651 | 1,205,409 |
| Shares redeemed | (3,582,005) | (30,766,598) |
| Net increase (decrease) in shares outstanding before conversion | (3,015,605) | (25,906,182) |
| Shares converted from Class C (See Note 1) | (79,690) | (688,962) |
| Net increase (decrease) | (3,095,295) | $ (26,595,144) |
| Class I | Shares | Amount |
| Period ended April 30, 2021: | ||
| Shares sold | 4,954,623 | $ 44,928,685 |
| Shares issued to shareholders in reinvestment of distributions | 482,654 | 4,373,821 |
| Shares redeemed | (6,893,989) | (62,398,962) |
| Net increase (decrease) in shares outstanding before conversion | (1,456,712) | (13,096,456) |
| Shares converted into Class I (See Note 1) | 68,322 | 618,256 |
| Net increase (decrease) | (1,388,390) | $ (12,478,200) |
| Year ended October 31, 2020: | ||
| Shares sold | 19,754,574 | $ 169,630,141 |
| Shares issued to shareholders in reinvestment of distributions | 1,386,876 | 11,983,027 |
| Shares redeemed | (44,391,197) | (377,209,880) |
| Net increase (decrease) in shares outstanding before conversion | (23,249,747) | (195,596,712) |
| Shares converted into Class I (See Note 1) | 59,162 | 512,587 |
| Net increase (decrease) | (23,190,585) | $(195,084,125) |
| 48 | MainStay MacKay Strategic Bond Fund |
| Class R2 | Shares | Amount |
| Period ended April 30, 2021: | ||
| Shares sold | 10,158 | $ 92,051 |
| Shares issued to shareholders in reinvestment of distributions | 1,158 | 10,484 |
| Shares redeemed | (6,097) | (55,129) |
| Net increase (decrease) | 5,219 | $ 47,406 |
| Year ended October 31, 2020: | ||
| Shares sold | 134,616 | $ 1,173,741 |
| Shares issued to shareholders in reinvestment of distributions | 17,187 | 147,798 |
| Shares redeemed | (873,599) | (7,642,240) |
| Net increase (decrease) | (721,796) | $ (6,320,701) |
| Class R3 | Shares | Amount |
| Period ended April 30, 2021: | ||
| Shares sold | 18,119 | $ 164,159 |
| Shares issued to shareholders in reinvestment of distributions | 312 | 2,823 |
| Shares redeemed | (1,860) | (16,795) |
| Net increase (decrease) | 16,571 | $ 150,187 |
| Year ended October 31, 2020: | ||
| Shares sold | 7,100 | $ 62,561 |
| Shares issued to shareholders in reinvestment of distributions | 488 | 4,213 |
| Shares redeemed | (1,200) | (10,300) |
| Net increase (decrease) | 6,388 | $ 56,474 |
| Class R6 | Shares | Amount |
| Period ended April 30, 2021: | ||
| Shares sold | 81,520 | $ 741,882 |
| Shares issued to shareholders in reinvestment of distributions | 1,121 | 10,193 |
| Shares redeemed | (8,509) | (77,514) |
| Net increase (decrease) | 74,132 | $ 674,561 |
| Year ended October 31, 2020: | ||
| Shares sold | 107,790 | $ 930,408 |
| Shares issued to shareholders in reinvestment of distributions | 23,680 | 203,636 |
| Shares redeemed | (2,666,072) | (22,878,546) |
| Net increase (decrease) | (2,534,602) | $ (21,744,502) |
| 50 | MainStay MacKay Strategic Bond Fund |
| 52 | MainStay MacKay Strategic Bond Fund |
| 54 | MainStay MacKay Strategic Bond Fund |
| 56 | MainStay MacKay Strategic Bond Fund |
1.
| 2. | This Fund is registered for sale in CA, CT, DE, FL, MA, NJ, NY and VT. |
| 3. | An affiliate of New York Life Investment Management LLC. |
| 1738547MS071-21 | MSSB10-06/21 |
please log in to newyorklifeinvestments.com/accounts.
| Not FDIC/NCUA Insured | Not a Deposit | May Lose Value | No Bank Guarantee | Not Insured by Any Government Agency |


President

| Average Annual Total Returns for the Period-Ended April 30, 2021 | ||||||||
| Class | Sales Charge | Inception Date | Six Months | One Year or Since Inception | Five Years or Since Inception | Ten Years | Gross Expense Ratio1 | |
| Class A Shares | Maximum 4.5% Initial Sales Charge | With sales charges | 1/3/1995 | -0.91% | 4.79% | 2.91% | 4.85% | 0.75% |
| Excluding sales charges | 3.75 | 9.73 | 3.86 | 5.34 | 0.75 | |||
| Investor Class Shares2 | Maximum 4% Initial Sales Charge | With sales charges | 2/28/2008 | -0.42 | 4.83 | 2.91 | 4.83 | 0.76 |
| Excluding sales charges | 3.73 | 9.77 | 3.86 | 5.32 | 0.76 | |||
| Class B Shares3 | Maximum 5% CDSC | With sales charges | 5/1/1986 | -1.39 | 4.54 | 3.26 | 5.05 | 1.01 |
| if Redeemed Within the First Six Years of Purchase | Excluding sales charges | 3.61 | 9.54 | 3.61 | 5.05 | 1.01 | ||
| Class C Shares | Maximum 1% CDSC | With sales charges | 9/1/1998 | 2.61 | 8.53 | 3.61 | 5.05 | 1.01 |
| if Redeemed Within One Year of Purchase | Excluding sales charges | 3.61 | 9.53 | 3.61 | 5.05 | 1.01 | ||
| Class C2 Shares | Maximum 1% CDSC | With sales charges | 8/31/2020 | 2.53 | 1.96 | N/A | N/A | 1.16 |
| if Redeemed Within One Year of Purchase | Excluding sales charges | 3.53 | 2.96 | N/A | N/A | 1.16 | ||
| Class I Shares | No Sales Charge | 12/21/2009 | 3.88 | 10.10 | 4.12 | 5.60 | 0.50 | |
| Class R6 Shares | No Sales Charge | 11/1/2019 | 3.90 | 10.05 | 5.27 | N/A | 0.44 | |
| 1. | The gross expense ratios presented reflect the Fund’s “Total Annual Fund Operating Expenses” from the most recent Prospectus, as supplemented, and may differ from other expense ratios disclosed in this report. |
| 2. | Prior to June 30, 2020, the maximum initial sales charge for Investor Class shares was 1.0%, which is reflected in the average annual total return figures shown. |
| 3. | Class B shares are closed to all new purchases as well as additional investments by existing Class B shareholders. |
| Benchmark Performance | Six Months | One Year | Five Years | Ten Years |
| Bloomberg Barclays Municipal Bond Index1 | 2.62% | 7.75% | 3.51% | 4.44% |
| Morningstar Muni National Long Category Average2 | 4.27 | 10.86 | 3.59 | 4.61 |
| 1. | The Bloomberg Barclays Municipal Bond Index is the Fund’s primary broadbased securities market index for comparison purposes. The Bloomberg Barclays Municipal Bond Index is considered representative of the broadbased market for investment-grade, tax-exempt bonds with a maturity of at least one year. Bonds subject to the alternative minimum tax or with floating or zero coupons are excluded. Results assume reinvestment of all dividends and capital gains. An investment cannot be made directly in an index. |
| 2. | The Morningstar Muni National Long Category Average is representative of funds that invest in bonds issued by various state and local governments to fund public projects. The income from these bonds is generally free from federal taxes. These portfolios have durations of more than 7 years. Results are based on average total returns of similar funds with all dividends and capital gain distributions reinvested. |
| 6 | MainStay MacKay Tax Free Bond Fund |
| Share Class | Beginning Account Value 11/1/20 | Ending Account Value (Based on Actual Returns and Expenses) 4/30/21 | Expenses Paid During Period1 | Ending Account Value (Based on Hypothetical 5% Annualized Return and Actual Expenses) 4/30/21 | Expenses Paid During Period1 | Net Expense Ratio During Period2 |
| Class A Shares | $1,000.00 | $1,037.50 | $3.69 | $1,021.18 | $3.66 | 0.73% |
| Investor Class Shares | $1,000.00 | $1,037.30 | $3.84 | $1,021.03 | $3.81 | 0.76% |
| Class B Shares | $1,000.00 | $1,036.10 | $5.10 | $1,019.79 | $5.06 | 1.01% |
| Class C Shares | $1,000.00 | $1,036.10 | $5.10 | $1,019.79 | $5.06 | 1.01% |
| Class C2 Shares | $1,000.00 | $1,035.30 | $5.80 | $1,019.09 | $5.76 | 1.15% |
| Class I Shares | $1,000.00 | $1,038.80 | $2.43 | $1,022.41 | $2.41 | 0.48% |
| Class R6 Shares | $1,000.00 | $1,039.00 | $2.22 | $1,022.61 | $2.21 | 0.44% |
| 1. | Expenses are equal to the Fund’s annualized expense ratio of each class multiplied by the average account value over the period, divided by 365 and multiplied by 181 (to reflect the six-month period). The table above represents the actual expenses incurred during the six-month period. In addition to the fees and expenses which the Fund bears directly, it also indirectly bears a pro rata share of the fees and expenses of the underlying funds in which it invests. Such indirect expenses are not included in the above-reported expense figures. |
| 2. | Expenses are equal to the Fund's annualized expense ratio to reflect the six-month period. |
| New York | 21.3% |
| California | 14.8 |
| Illinois | 10.0 |
| New Jersey | 5.2 |
| Texas | 4.5 |
| Connecticut | 2.9 |
| Florida | 2.7 |
| Utah | 2.4 |
| Pennsylvania | 2.2 |
| Georgia | 2.2 |
| South Carolina | 2.1 |
| Michigan | 1.6 |
| Iowa | 1.6 |
| Nevada | 1.5 |
| Alabama | 1.3 |
| Puerto Rico | 1.3 |
| Virginia | 1.2 |
| Missouri | 1.0 |
| Wisconsin | 0.9 |
| District of Columbia | 0.8 |
| Colorado | 0.8 |
| Ohio | 0.8 |
| Maryland | 0.8 |
| Washington | 0.7 |
| Arizona | 0.7 |
| Delaware | 0.7 |
| Indiana | 0.7 |
| Arkansas | 0.6 |
| Nebraska | 0.5 |
| U.S. Virgin Islands | 0.5 |
| Oklahoma | 0.5% |
| Louisiana | 0.5 |
| Tennessee | 0.5 |
| Guam | 0.4 |
| Idaho | 0.4 |
| Minnesota | 0.4 |
| Montana | 0.4 |
| Oregon | 0.4 |
| Kentucky | 0.3 |
| Massachusetts | 0.3 |
| Rhode Island | 0.2 |
| Hawaii | 0.2 |
| Kansas | 0.2 |
| New Mexico | 0.1 |
| New Hampshire | 0.1 |
| North Dakota | 0.1 |
| South Dakota | 0.1 |
| Wyoming | 0.1 |
| North Carolina | 0.1 |
| Alaska | 0.0‡ |
| Maine | 0.0‡ |
| Mississippi | 0.0‡ |
| Vermont | 0.0‡ |
| Short–Term Investment | 3.3 |
| Other Assets, Less Liabilities | 3.1 |
| 100.0% |
| ‡ | Less than one–tenth of a percent. |
| 1. | Metropolitan Transportation Authority, 0.557%-5.25%, due 2/1/22–11/15/48 |
| 2. | New York State Dormitory Authority, 3.00%-5.25%, due 3/15/31–2/15/48 |
| 3. | New York City Transitional Finance Authority, 3.00%-5.00%, due 5/1/32–11/1/42 |
| 4. | Triborough Bridge & Tunnel Authority, 0.085%-5.00%, due 1/1/32–5/15/51 |
| 5. | State of New Jersey, 2.00%-5.00%, due 6/1/28–6/1/42 |
| 6. | State of California, 0.055%-5.25%, due 10/1/33–5/1/48 |
| 7. | San Francisco City & County Airport Commission, 5.00%, due 5/1/27–5/1/50 |
| 8. | South Carolina Public Service Authority, 3.00%-5.50%, due 12/1/25–12/1/56 |
| 9. | State of Connecticut, 3.00%-5.00%, due 4/15/27–1/15/40 |
| 10. | State of Connecticut, 3.125%-5.00%, due 1/1/30–5/1/40 |
| 8 | MainStay MacKay Tax Free Bond Fund |
| 1. | See page 5 for other share class returns, which may be higher or lower than Class I share returns. See page 6 for more information on benchmark and peer group returns. |
| 2. | The yield curve is a line that plots the yields of various securities of similar quality—typically U.S. Treasury issues—across a range of maturities. The U.S. Treasury yield curve serves as a benchmark for other debt and is used in economic forecasting. |
| 3. | An obligation rated ‘AAA’ has the highest rating assigned by Standard & Poor’s (“S&P”), and in the opinion of S&P, the obligor’s capacity to meet its financial commitment on the obligation is extremely strong. When applied to Fund holdings, ratings are based solely on the creditworthiness of the bonds in the portfolio and are not meant to represent the security or safety of the Fund. |
| 4. | Duration is a measure of the price sensitivity of a fixed-income investment to changes in interest rates. Duration is expressed as a number of years and is considered a more accurate sensitivity gauge than average maturity. |
| 5. | Modified duration is inversely related to the approximate percentage change in price for a given change in yield. Duration to worst is the duration of a bond computed using the bond’s nearest call date or maturity, whichever comes first. This measure ignores future cash flow fluctuations due to embedded optionality. |
| 6. | An obligation rated ‘AA’ by S&P is deemed by S&P to differ from the highest-rated obligations only to a small degree. In the opinion of S&P, the obligor's capacity to meet its financial commitment on the obligation is very strong. When applied to Fund holdings, ratings are based solely on the creditworthiness of the bonds in the portfolio and are not meant to represent the security or safety of the Fund. |
| 10 | MainStay MacKay Tax Free Bond Fund |
| Principal Amount | Value | |
| Municipal Bonds 93.6% | ||
| Long-Term Municipal Bonds 88.6% | ||
| Alabama 1.3% | ||
| City of Birmingham AL, Unlimited General Obligation | ||
| Series A | ||
| 5.00%, due 3/1/43 (a) | $ 2,650,000 | $ 2,886,186 |
| County of Jefferson, Sewer, Revenue Bonds, Sub. Lien | ||
| Series D | ||
| 6.00%, due 10/1/42 | 5,910,000 | 6,902,918 |
| Health Care Authority of the City of Huntsville (The), HH Health System, Revenue Bonds | ||
| Series B | ||
| 4.00%, due 6/1/45 | 20,370,000 | 23,715,196 |
| Houston County Health Care Authority, Southeast Alabama Medical Centre, Revenue Bonds | ||
| Series A | ||
| 5.00%, due 10/1/25 | 1,000,000 | 1,179,766 |
| Lower Alabama Gas District (The), Revenue Bonds | ||
| 4.00%, due 12/1/50 (b) | 750,000 | 858,537 |
| Series A | ||
| 5.00%, due 9/1/46 | 10,000,000 | 14,625,233 |
| Southeast Energy Authority, A Cooperative District, Project No. 1, Revenue Bonds | ||
| Series A | ||
| 4.00%, due 10/1/28 | 2,400,000 | 2,862,408 |
| Series A | ||
| 4.00%, due 11/1/51 (b) | 38,500,000 | 45,741,038 |
| University of South Alabama, Revenue Bonds | ||
| Insured: AGM | ||
| 4.00%, due 11/1/35 | 2,000,000 | 2,286,805 |
| Insured: AGM | ||
| 5.00%, due 11/1/29 | 1,110,000 | 1,341,434 |
| Insured: AGM | ||
| 5.00%, due 11/1/30 | 2,000,000 | 2,413,103 |
| Water Works Board of the City of Birmingham (The), Revenue Bonds | ||
| Series B | ||
| 5.00%, due 1/1/32 | 6,140,000 | 7,499,627 |
| 112,312,251 | ||
| Principal Amount | Value | |
| Alaska 0.0% ‡ | ||
| Alaska Industrial Development & Export Authority, Greater Fairbanks Community Hospital Foundation Obligated Group, Revenue Bonds | ||
| 5.00%, due 4/1/32 | $ 3,550,000 | $ 3,795,824 |
| Arizona 0.7% | ||
| Arizona Board of Regents, Revenue Bonds | ||
| Series A | ||
| 5.00%, due 7/1/39 | 2,000,000 | 2,603,682 |
| Series A | ||
| 5.00%, due 7/1/43 | 3,480,000 | 4,486,890 |
| Arizona Health Facilities Authority, Phoenix Children's Hospital, Revenue Bonds | ||
| Series A | ||
| 5.00%, due 2/1/42 | 1,000,000 | 1,031,900 |
| Arizona Industrial Development Authority, Provident Group, NCCU Properties LLC, Central University Project, Revenue Bonds | ||
| Series A, Insured: BAM | ||
| 4.00%, due 6/1/44 | 940,000 | 1,062,316 |
| Arizona Industrial Development Authority, Phoenix Children's Hospital, Revenue Bonds | ||
| Series A | ||
| 4.00%, due 2/1/50 | 18,850,000 | 21,734,576 |
| Maricopa County Industrial Development Authority, Banner Health Obligated Group, Revenue Bonds | ||
| Series A | ||
| 4.00%, due 1/1/41 | 11,010,000 | 12,545,175 |
| Series E | ||
| 4.00%, due 1/1/45 | 7,000,000 | 8,166,762 |
| Maricopa County Unified School District No. 090 Saddle Mountain, Unlimited General Obligation | ||
| Insured: AGM | ||
| 4.00%, due 7/1/35 | 7,175,000 | 8,533,435 |
| 60,164,736 | ||
| Principal Amount | Value | |
| Long-Term Municipal Bonds (continued) | ||
| Arkansas 0.5% | ||
| County of Pulaski, Arkansas Children's Hospital, Revenue Bonds | ||
| 5.00%, due 3/1/34 | $ 2,000,000 | $ 2,365,637 |
| Pulaski County Special School District, Arkansas Construction Bonds, Limited General Obligation | ||
| Insured: State Aid Withholding | ||
| 4.00%, due 2/1/48 | 15,500,000 | 15,975,546 |
| Springdale Public Facilities Board, Arkansas Children's Northwest, Inc., Revenue Bonds | ||
| 5.00%, due 3/1/34 | 2,890,000 | 3,374,704 |
| Springdale School District No. 50, Limited General Obligation | ||
| Insured: State Aid Withholding | ||
| 4.00%, due 6/1/36 | 2,500,000 | 2,592,549 |
| Insured: State Aid Withholding | ||
| 4.00%, due 6/1/40 | 10,400,000 | 10,755,478 |
| University of Arkansas, UALR Campus, Revenue Bonds | ||
| 5.00%, due 10/1/29 | 1,315,000 | 1,603,665 |
| 5.00%, due 10/1/30 | 1,110,000 | 1,350,579 |
| 5.00%, due 10/1/31 | 1,205,000 | 1,466,181 |
| 39,484,339 | ||
| California 13.2% | ||
| Alta Loma School District, Unlimited General Obligation | ||
| Series C | ||
| 4.00%, due 8/1/45 | 4,500,000 | 5,337,874 |
| Series B | ||
| 5.00%, due 8/1/44 | 4,000,000 | 4,964,253 |
| Antelope Valley Community College District, Election 2016, Unlimited General Obligation | ||
| Series A | ||
| 4.50%, due 8/1/38 | 11,500,000 | 13,435,533 |
| Bay Area Toll Authority, Revenue Bonds | ||
| Series S-H | ||
| 5.00%, due 4/1/44 | 2,615,000 | 3,256,530 |
| Principal Amount | Value | |
| California (continued) | ||
| California Health Facilities Financing Authority, Providence St. Joseph Health Obligated Group, Revenue Bonds | ||
| Series A | ||
| 4.00%, due 10/1/35 | $ 1,230,000 | $ 1,405,412 |
| California Health Facilities Financing Authority, CommonSpirit Health Obligated Group, Revenue Bonds | ||
| Series A | ||
| 4.00%, due 4/1/45 | 6,500,000 | 7,523,026 |
| California Health Facilities Financing Authority, City of Hope Obligated Group, Revenue Bonds | ||
| 4.00%, due 11/15/45 | 5,000,000 | 5,824,308 |
| 5.00%, due 11/15/49 | 20,000,000 | 23,920,814 |
| California Health Facilities Financing Authority, Sutter Health Obligated Group, Revenue Bonds | ||
| Series A | ||
| 5.00%, due 11/15/34 | 5,000,000 | 6,031,614 |
| California Infrastructure and Economic Development Bank, California State Teachers' Retirement System, Green Bond, Revenue Bonds | ||
| 5.00%, due 8/1/49 | 10,000,000 | 12,537,161 |
| California Municipal Finance Authority, Southern California Institute of Architecture Project, Revenue Bonds | ||
| 5.00%, due 12/1/23 | 405,000 | 444,077 |
| 5.00%, due 12/1/24 | 425,000 | 479,592 |
| 5.00%, due 12/1/25 | 450,000 | 521,193 |
| 5.00%, due 12/1/26 | 470,000 | 556,401 |
| 5.00%, due 12/1/27 | 495,000 | 596,151 |
| 5.00%, due 12/1/28 | 520,000 | 621,032 |
| California Municipal Finance Authority, CHF-Davis I LLC, West Village Student Housing Project, Revenue Bonds | ||
| 5.00%, due 5/15/32 | 1,570,000 | 1,924,804 |
| Insured: BAM | ||
| 5.00%, due 5/15/32 | 1,500,000 | 1,866,866 |
| Insured: BAM | ||
| 5.00%, due 5/15/36 | 4,400,000 | 5,418,939 |
| Insured: BAM | ||
| 5.00%, due 5/15/39 | 9,815,000 | 12,000,155 |
| 12 | MainStay MacKay Tax Free Bond Fund |
| Principal Amount | Value | |
| Long-Term Municipal Bonds (continued) | ||
| California (continued) | ||
| California Municipal Finance Authority, CHF-Davis I LLC, West Village Student Housing Project, Revenue Bonds (continued) | ||
| Insured: BAM | ||
| 5.00%, due 5/15/43 | $ 11,750,000 | $ 14,250,234 |
| California School Facilities Financing Authority, Azusa Unified School District, Revenue Bonds | ||
| Insured: AGM | ||
| (zero coupon), due 8/1/49 | 16,000,000 | 5,277,101 |
| California State University, Revenue Bonds | ||
| Series A | ||
| 5.00%, due 11/1/44 | 26,470,000 | 33,725,287 |
| Chino Valley Unified School District, Election 2016, Limited General Obligation | ||
| Series B | ||
| 4.00%, due 8/1/45 | 14,310,000 | 16,974,439 |
| Chula Vista Elementary School District, Revenue Bonds | ||
| (zero coupon), due 8/1/23 | 5,000,000 | 4,960,199 |
| City of Escondido CA, Unlimited General Obligation | ||
| 5.00%, due 9/1/36 | 5,000,000 | 5,898,295 |
| City of Long Beach CA, Airport System, Revenue Bonds | ||
| Series A | ||
| 5.00%, due 6/1/30 | 5,000,000 | 5,017,447 |
| City of Los Angeles, Department of Airports, Revenue Bonds, Senior Lien (c) | ||
| Series C | ||
| 4.00%, due 5/15/50 | 15,000,000 | 17,385,990 |
| Series C | ||
| 5.00%, due 5/15/25 | 4,475,000 | 5,272,462 |
| Series C | ||
| 5.00%, due 5/15/34 | 12,280,000 | 15,931,965 |
| City of Los Angeles, Department of Airports, Revenue Bonds | ||
| Series D | ||
| 5.00%, due 5/15/31 (c) | 2,530,000 | 2,942,326 |
| Series B | ||
| 5.00%, due 5/15/31 (c) | 12,615,000 | 15,791,109 |
| Series E | ||
| 5.00%, due 5/15/36 (c) | 3,205,000 | 4,053,197 |
| Principal Amount | Value | |
| California (continued) | ||
| City of Los Angeles, Department of Airports, Revenue Bonds (continued) | ||
| Series E | ||
| 5.00%, due 5/15/37 (c) | $ 1,000,000 | $ 1,261,138 |
| Series F | ||
| 5.00%, due 5/15/37 (c) | 2,350,000 | 2,935,342 |
| Series A | ||
| 5.00%, due 5/15/40 | 6,850,000 | 8,808,314 |
| Series C | ||
| 5.00%, due 5/15/44 (c) | 4,285,000 | 5,182,443 |
| Series E | ||
| 5.00%, due 5/15/44 (c) | 10,230,000 | 12,714,096 |
| Series A | ||
| 5.00%, due 5/15/51 (c) | 17,625,000 | 22,333,008 |
| City of Los Angeles CA, Wastewater System, Green Bond, Revenue Bonds | ||
| Series A | ||
| 5.00%, due 6/1/43 | 10,000,000 | 12,478,199 |
| City of Sacramento CA, Transient Occupancy Tax, Revenue Bonds | ||
| Series A | ||
| 5.00%, due 6/1/28 | 2,700,000 | 3,353,569 |
| Series A | ||
| 5.00%, due 6/1/29 | 3,165,000 | 3,925,023 |
| Series A | ||
| 5.00%, due 6/1/30 | 4,920,000 | 6,059,140 |
| Series A | ||
| 5.00%, due 6/1/32 | 2,260,000 | 2,763,762 |
| Series A | ||
| 5.00%, due 6/1/33 | 1,225,000 | 1,493,528 |
| Coachella Valley Unified School District, Election 2005, Unlimited General Obligation | ||
| Series F, Insured: BAM | ||
| 5.00%, due 8/1/46 | 12,385,000 | 14,793,907 |
| Coast Community College District, Election 2012, Unlimited General Obligation | ||
| Series D | ||
| 4.50%, due 8/1/39 | 15,000,000 | 18,070,192 |
| Compton Unified School District, Unlimited General Obligation | ||
| Series B, Insured: BAM | ||
| (zero coupon), due 6/1/38 | 1,250,000 | 772,530 |
| Series B, Insured: BAM | ||
| (zero coupon), due 6/1/39 | 5,105,000 | 3,033,765 |
| Principal Amount | Value | |
| Long-Term Municipal Bonds (continued) | ||
| California (continued) | ||
| Compton Unified School District, Unlimited General Obligation (continued) | ||
| Series B, Insured: BAM | ||
| (zero coupon), due 6/1/40 | $ 1,500,000 | $ 857,162 |
| Series B, Insured: BAM | ||
| (zero coupon), due 6/1/41 | 1,750,000 | 961,612 |
| Corona-Norco Unified School District, Election 2014, Unlimited General Obligation | ||
| Series C | ||
| 4.00%, due 8/1/49 | 7,000,000 | 8,005,776 |
| Cotati-Rohnert Park Unified School District, Election 2016, Unlimited General Obligation | ||
| Series C, Insured: AGM | ||
| 5.00%, due 8/1/42 | 2,865,000 | 3,423,859 |
| El Monte Union High School District, Unlimited General Obligation | ||
| Series A | ||
| 5.00%, due 6/1/49 | 17,390,000 | 21,507,039 |
| Enterprise Elementary School District, Unlimited General Obligation | ||
| Series B, Insured: AGM | ||
| 5.00%, due 8/1/49 | 5,000,000 | 5,894,400 |
| Firebaugh-Las Deltas Unified School District, Election 2016, Unlimited General Obligation | ||
| Series A, Insured: AGM | ||
| 5.25%, due 8/1/41 | 3,000,000 | 3,754,858 |
| Fontana Public Finance Authority, City of Fontana, Revenue Bonds | ||
| Series A, Insured: BAM | ||
| 5.00%, due 9/1/32 | 1,320,000 | 1,504,837 |
| Fontana Unified School District, Unlimited General Obligation | ||
| Series C | ||
| (zero coupon), due 8/1/35 | 14,800,000 | 7,388,694 |
| Series C | ||
| (zero coupon), due 8/1/36 | 15,500,000 | 7,188,192 |
| Foothill-Eastern Transportation Corridor Agency, Revenue Bonds | ||
| Series B-2, Insured: AGM | ||
| 3.50%, due 1/15/53 (d) | 4,800,000 | 5,455,251 |
| Principal Amount | Value | |
| California (continued) | ||
| Fresno Unified School District, Election 2001, Unlimited General Obligation | ||
| Series G | ||
| (zero coupon), due 8/1/32 | $ 6,000,000 | $ 2,847,257 |
| Series G | ||
| (zero coupon), due 8/1/33 | 10,000,000 | 4,408,977 |
| Series G | ||
| (zero coupon), due 8/1/41 | 23,485,000 | 5,930,230 |
| Golden State Tobacco Securitization Corp., Revenue Bonds | ||
| Series A-1 | ||
| 5.00%, due 6/1/33 | 12,545,000 | 15,290,270 |
| Golden State Tobacco Securitization Corp., Asset-Backed, Revenue Bonds | ||
| Series A, Insured: AGM-CR ST APPROP | ||
| 5.00%, due 6/1/40 | 5,410,000 | 6,328,523 |
| Jurupa Unified School District, Election 2014, Unlimited General Obligation | ||
| Series C | ||
| 5.25%, due 8/1/43 | 5,500,000 | 6,944,909 |
| Live Oak Elementary School District, Certificate of Participation | ||
| Insured: AGM | ||
| 5.00%, due 8/1/39 | 3,205,000 | 3,813,271 |
| Live Oak Unified School District, Election 2016, Unlimited General Obligation | ||
| Series B, Insured: AGM | ||
| 5.00%, due 8/1/48 | 1,500,000 | 1,825,356 |
| Los Angeles County Public Works Financing Authority, County of Los Angeles, Revenue Bonds | ||
| Series E-1 | ||
| 5.00%, due 12/1/49 | 7,630,000 | 9,698,101 |
| Los Angeles Unified School District, Unlimited General Obligation | ||
| Series C | ||
| 3.00%, due 7/1/35 | 9,970,000 | 11,133,725 |
| Series C | ||
| 4.00%, due 7/1/33 | 3,500,000 | 4,353,596 |
| Series C | ||
| 4.00%, due 7/1/36 | 6,000,000 | 7,374,085 |
| Series C | ||
| 4.00%, due 7/1/37 | 5,000,000 | 6,115,190 |
| 14 | MainStay MacKay Tax Free Bond Fund |
| Principal Amount | Value | |
| Long-Term Municipal Bonds (continued) | ||
| California (continued) | ||
| Los Angeles Unified School District, Election 2008, Unlimited General Obligation | ||
| Series B-1 | ||
| 5.25%, due 7/1/42 | $ 68,405,000 | $ 85,666,523 |
| Napa Valley Unified School District, Election 2016, Unlimited General Obligation | ||
| Series C, Insured: AGM | ||
| 4.00%, due 8/1/44 | 9,000,000 | 10,323,033 |
| Novato Unified School District, Election 2016, Unlimited General Obligation | ||
| Series C | ||
| 2.00%, due 8/1/39 | 4,645,000 | 4,597,236 |
| Oakland Unified School District, Alameda County, Unlimited General Obligation | ||
| Insured: AGM | ||
| 5.00%, due 8/1/27 | 1,160,000 | 1,374,008 |
| Insured: AGM | ||
| 5.00%, due 8/1/28 | 1,755,000 | 2,075,813 |
| Insured: AGM | ||
| 5.00%, due 8/1/29 | 2,535,000 | 2,995,591 |
| Paramount Unified School District, Election 2006, Unlimited General Obligation | ||
| Insured: BAM | ||
| (zero coupon), due 8/1/43 | 25,000,000 | 6,471,020 |
| Pomona Unified School District, Election 2008, Unlimited General Obligation | ||
| Series E, Insured: AGM | ||
| 5.00%, due 8/1/30 | 3,285,000 | 3,472,436 |
| Richmond Joint Powers Financing Authority, Civic Center Project, Revenue Bonds | ||
| Series A, Insured: AGM | ||
| 5.00%, due 11/1/37 | 3,660,000 | 4,559,266 |
| Riverside County Community Facilities District No. 07-2, Special Tax, Special Tax | ||
| Insured: AGM | ||
| 4.00%, due 9/1/45 | 4,000,000 | 4,697,995 |
| Principal Amount | Value | |
| California (continued) | ||
| Riverside County Redevelopment Successor Agency, Jurupa Valley Project, Tax Allocation | ||
| Series B, Insured: BAM | ||
| 5.00%, due 10/1/30 | $ 2,645,000 | $ 3,095,563 |
| Riverside County Transportation Commission, Sales Tax, Revenue Bonds | ||
| Series B | ||
| 4.00%, due 6/1/36 | 20,000,000 | 23,103,936 |
| Riverside Unified School District, Election 2016, Unlimited General Obligation | ||
| Series B | ||
| 4.00%, due 8/1/42 | 5,000,000 | 5,791,859 |
| San Bernardino City Unified School District, Election 2012, Unlimited General Obligation | ||
| Series A, Insured: AGM | ||
| 5.00%, due 8/1/30 | 1,000,000 | 1,108,734 |
| San Bernardino Community College District, Election 2018, Unlimited General Obligation | ||
| Series A | ||
| 3.00%, due 8/1/41 | 7,500,000 | 7,991,780 |
| San Diego Association of Governments South Bay Expressway, South Bay Expressway, Revenue Bonds, Senior Lien | ||
| Series A | ||
| 5.00%, due 7/1/30 | 2,475,000 | 3,046,591 |
| Series A | ||
| 5.00%, due 7/1/32 | 1,800,000 | 2,208,072 |
| Series A | ||
| 5.00%, due 7/1/38 | 1,150,000 | 1,394,765 |
| San Diego County Regional Airport Authority, Revenue Bonds | ||
| Series A | ||
| 4.00%, due 7/1/38 | 1,750,000 | 2,052,113 |
| San Diego County Water Authority, Revenue Bonds | ||
| Series A | ||
| 5.00%, due 5/1/34 | 2,000,000 | 2,146,663 |
| Principal Amount | Value | |
| Long-Term Municipal Bonds (continued) | ||
| California (continued) | ||
| San Diego Public Facilities Financing Authority, Capital Improvement Projects, Revenue Bonds | ||
| Series A | ||
| 5.00%, due 10/15/44 | $ 3,000,000 | $ 3,507,543 |
| San Francisco Bay Area Rapid Transit District, Green Bonds, Unlimited General Obligation | ||
| Series C-1 | ||
| 3.00%, due 8/1/50 | 31,565,000 | 33,623,193 |
| San Francisco City & County Airport Commission, San Francisco International Airport, Revenue Bonds, Second Series | ||
| Series H | ||
| 5.00%, due 5/1/27 (c) | 7,745,000 | 9,630,183 |
| Series E | ||
| 5.00%, due 5/1/35 (c) | 8,350,000 | 10,460,289 |
| Series E | ||
| 5.00%, due 5/1/37 (c) | 7,535,000 | 9,385,149 |
| Series E | ||
| 5.00%, due 5/1/45 (c) | 3,250,000 | 3,977,591 |
| Series A | ||
| 5.00%, due 5/1/47 (c) | 9,000,000 | 10,777,397 |
| Series D | ||
| 5.00%, due 5/1/48 (c) | 9,000,000 | 10,859,084 |
| Series E | ||
| 5.00%, due 5/1/50 (c) | 15,000,000 | 18,295,833 |
| Series F | ||
| 5.00%, due 5/1/50 | 29,580,000 | 36,670,651 |
| San Francisco City & County Airport Commission, San Francisco International Airport, Revenue Bonds (c) | ||
| Series A | ||
| 5.00%, due 5/1/36 | 4,245,000 | 5,302,859 |
| Series A | ||
| 5.00%, due 5/1/38 | 6,000,000 | 7,455,166 |
| Series A | ||
| 5.00%, due 5/1/49 | 15,000,000 | 18,301,728 |
| San Francisco City & County Airport Comm-San Francisco International Airport, Revenue Bonds, Second Series (c) | ||
| Series E | ||
| 5.00%, due 5/1/36 | 3,220,000 | 4,022,428 |
| Principal Amount | Value | |
| California (continued) | ||
| San Francisco City & County Airport Comm-San Francisco International Airport, Revenue Bonds, Second Series (c) (continued) | ||
| Series 2020 | ||
| 5.00%, due 5/1/37 | $ 4,470,000 | $ 5,694,741 |
| San Jose Evergreen Community College District, Election 2016, Unlimited General Obligation | ||
| Series B | ||
| 3.00%, due 9/1/37 | 1,565,000 | 1,725,782 |
| San Marcos Schools Financing Authority, San Marcos Unified School District, Revenue Bonds | ||
| Insured: AGM | ||
| 5.00%, due 8/15/34 | 1,000,000 | 1,217,876 |
| Insured: AGM | ||
| 5.00%, due 8/15/35 | 1,000,000 | 1,215,819 |
| Insured: AGM | ||
| 5.00%, due 8/15/36 | 1,100,000 | 1,335,040 |
| Santa Clara Valley Water District, Revenue Bonds | ||
| Series A | ||
| 5.00%, due 6/1/49 | 2,865,000 | 3,411,930 |
| Santa Monica Community College District, Election 2016, Unlimited General Obligation | ||
| Series A | ||
| 4.00%, due 8/1/47 | 8,580,000 | 10,021,005 |
| Selma Unified School District, Election 2006, Unlimited General Obligation | ||
| Series D, Insured: AGM | ||
| (zero coupon), due 8/1/39 | 730,000 | 454,794 |
| Series D, Insured: AGM | ||
| (zero coupon), due 8/1/41 | 730,000 | 423,906 |
| Sierra Joint Community College District, Election 2018, Unlimited General Obligation | ||
| Series A | ||
| 4.00%, due 8/1/53 | 3,500,000 | 4,060,868 |
| Simi Valley Unified School District, Election 2016, Unlimited General Obligation | ||
| Series A | ||
| 5.00%, due 8/1/39 | 1,000,000 | 1,239,530 |
| 16 | MainStay MacKay Tax Free Bond Fund |
| Principal Amount | Value | |
| Long-Term Municipal Bonds (continued) | ||
| California (continued) | ||
| Simi Valley Unified School District, Election 2016, Unlimited General Obligation (continued) | ||
| Series A | ||
| 5.00%, due 8/1/40 | $ 1,195,000 | $ 1,481,410 |
| Solano County Community College District, Election 2012, Unlimited General Obligation | ||
| Series C | ||
| 5.25%, due 8/1/42 | 16,460,000 | 20,721,216 |
| Southern California Water Replenishment District, Revenue Bonds | ||
| 5.00%, due 8/1/38 | 1,750,000 | 2,203,616 |
| State of California, Unlimited General Obligation | ||
| 3.00%, due 10/1/33 | 5,000,000 | 5,652,116 |
| 4.00%, due 3/1/36 | 13,000,000 | 15,783,576 |
| State of California, Various Purposes, Unlimited General Obligation | ||
| 3.00%, due 11/1/34 | 3,445,000 | 3,922,439 |
| 3.00%, due 11/1/35 | 4,000,000 | 4,541,489 |
| 4.00%, due 10/1/34 | 20,790,000 | 25,356,397 |
| 4.00%, due 3/1/37 | 20,100,000 | 24,324,172 |
| 4.00%, due 3/1/38 | 8,000,000 | 9,654,103 |
| 4.00%, due 3/1/40 | 7,500,000 | 9,008,150 |
| 4.00%, due 3/1/46 | 20,000,000 | 23,679,460 |
| 5.25%, due 10/1/39 | 5,635,000 | 6,805,324 |
| Tahoe-Truckee Unified School District, Election 2014, Unlimited General Obligation | ||
| Series B | ||
| 5.00%, due 8/1/41 | 2,200,000 | 2,636,579 |
| Tulare County Transportation Authority, Sales Tax, Revenue Bonds | ||
| 4.00%, due 2/1/37 | 5,945,000 | 7,109,806 |
| Turlock Irrigation District, Revenue Bonds | ||
| 5.00%, due 1/1/44 | 4,000,000 | 5,118,812 |
| Twin Rivers Unified School District, Election 2006, Unlimited General Obligation | ||
| Series Series 2008, Insured: AGM | ||
| (zero coupon), due 8/1/32 | 5,120,000 | 4,149,987 |
| Principal Amount | Value | |
| California (continued) | ||
| University of California, Limited Project, Revenue Bonds | ||
| Series Q | ��� | |
| 3.00%, due 5/15/51 | $ 13,915,000 | $ 14,768,415 |
| University of California, Revenue Bonds | ||
| Series AV | ||
| 5.00%, due 5/15/42 | 1,725,000 | 2,128,978 |
| Series AZ | ||
| 5.00%, due 5/15/43 | 9,180,000 | 11,470,264 |
| Series AZ | ||
| 5.25%, due 5/15/58 | 5,905,000 | 7,412,705 |
| Westminster School District, Election 2008, Unlimited General Obligation | ||
| Series B, Insured: BAM | ||
| (zero coupon), due 8/1/48 | 13,900,000 | 2,462,788 |
| Winters Joint Unified School District, Election 2016, Unlimited General Obligation | ||
| Series B, Insured: BAM | ||
| 5.00%, due 8/1/46 | 1,400,000 | 1,733,480 |
| 1,131,497,576 | ||
| Colorado 0.8% | ||
| Adams State University, Revenue Bonds | ||
| Series A, Insured: State Higher Education Intercept Program | ||
| 4.00%, due 5/15/37 | 750,000 | 881,903 |
| Series A, Insured: State Higher Education Intercept Program | ||
| 4.00%, due 5/15/39 | 1,085,000 | 1,269,579 |
| Series A, Insured: State Higher Education Intercept Program | ||
| 4.00%, due 5/15/42 | 1,500,000 | 1,737,220 |
| City & County of Denver, Airport System, Revenue Bonds (c) | ||
| Series A | ||
| 5.00%, due 12/1/25 | 5,370,000 | 6,398,184 |
| Series A | ||
| 5.25%, due 12/1/48 | 10,000,000 | 12,346,467 |
| City & County of Denver, Convention Center Expansion Project, Certificate of Participation | ||
| Series A | ||
| 5.375%, due 6/1/43 | 2,875,000 | 3,412,305 |
| Principal Amount | Value | |
| Long-Term Municipal Bonds (continued) | ||
| Colorado (continued) | ||
| Colorado Health Facilities Authority, AdventHealth Obligated Group, Revenue Bonds | ||
| Series A | ||
| 4.00%, due 11/15/43 | $ 3,905,000 | $ 4,570,296 |
| Colorado Health Facilities Authority, CommonSpirit Health Obligated Group, Revenue Bonds | ||
| Series A-2 | ||
| 4.00%, due 8/1/49 | 15,975,000 | 18,029,716 |
| Colorado Housing and Finance Authority, Revenue Bonds | ||
| Series C, Class I, Insured: GNMA | ||
| 4.25%, due 11/1/48 | 4,800,000 | 5,332,298 |
| Denver Convention Center Hotel Authority, Revenue Bonds, Senior Lien | ||
| 5.00%, due 12/1/36 | 1,000,000 | 1,159,052 |
| Regional Transportation District, Certificate Participation | ||
| Series A | ||
| 4.50%, due 6/1/44 | 10,000,000 | 10,635,961 |
| South Suburban Park & Recreation District, Unlimited General Obligation | ||
| 4.00%, due 12/15/38 | 1,140,000 | 1,353,433 |
| Vista Ridge Metropolitan District, Unlimited General Obligation | ||
| Series A, Insured: BAM | ||
| 5.00%, due 12/1/31 | 1,250,000 | 1,500,502 |
| 68,626,916 | ||
| Connecticut 2.8% | ||
| City of Bridgeport CT, Unlimited General Obligation | ||
| Series D, Insured: AGM | ||
| 5.00%, due 8/15/33 | 3,090,000 | 3,692,703 |
| Series D, Insured: AGM | ||
| 5.00%, due 8/15/34 | 3,090,000 | 3,685,713 |
| Series D, Insured: AGM | ||
| 5.00%, due 8/15/35 | 3,090,000 | 3,678,738 |
| Series D, Insured: AGM | ||
| 5.00%, due 8/15/36 | 3,090,000 | 3,670,042 |
| Principal Amount | Value | |
| Connecticut (continued) | ||
| City of Hartford CT, Unlimited General Obligation | ||
| Series A, Insured: State Guaranteed | ||
| 5.00%, due 4/1/28 | $ 2,500,000 | $ 2,597,759 |
| Series A, Insured: State Guaranteed | ||
| 5.00%, due 4/1/29 | 895,000 | 929,780 |
| Series A, Insured: AGM ST GTD | ||
| 5.00%, due 4/1/32 | 195,000 | 202,670 |
| Series C, Insured: AGM ST GTD | ||
| 5.00%, due 7/15/32 | 7,470,000 | 8,743,750 |
| Series C, Insured: AGM ST GTD | ||
| 5.00%, due 7/15/34 | 2,500,000 | 2,916,116 |
| City of New Haven CT, Unlimited General Obligation | ||
| Series A, Insured: AGM | ||
| 5.00%, due 8/15/29 | 1,450,000 | 1,743,533 |
| Connecticut Housing Finance Authority, Revenue Bonds | ||
| Series C-1 | ||
| 4.00%, due 11/15/45 | 4,420,000 | 4,860,705 |
| Series B-1 | ||
| 4.00%, due 5/15/49 | 2,530,000 | 2,861,128 |
| Connecticut State Health & Educational Facilities Authority, Yale University, Revenue Bonds | ||
| Series X-2 | ||
| 0.25%, due 7/1/37 (b)(e) | 11,000,000 | 10,981,880 |
| State of Connecticut, Unlimited General Obligation | ||
| Series A | ||
| 3.00%, due 1/15/32 | 12,660,000 | 14,391,536 |
| Series A | ||
| 3.00%, due 1/15/33 | 6,000,000 | 6,763,117 |
| Series A | ||
| 3.00%, due 1/15/34 | 5,000,000 | 5,608,810 |
| Series A | ||
| 3.00%, due 1/15/35 | 7,250,000 | 8,110,885 |
| Series A | ||
| 3.00%, due 1/15/36 | 6,875,000 | 7,660,687 |
| Series A | ||
| 3.00%, due 1/15/37 | 5,110,000 | 5,673,357 |
| Series A | ||
| 4.00%, due 4/15/37 | 2,920,000 | 3,443,603 |
| Series B | ||
| 5.00%, due 4/15/27 | 3,000,000 | 3,132,607 |
| 18 | MainStay MacKay Tax Free Bond Fund |
| Principal Amount | Value | |
| Long-Term Municipal Bonds (continued) | ||
| Connecticut (continued) | ||
| State of Connecticut, Unlimited General Obligation (continued) | ||
| Series A | ||
| 5.00%, due 3/1/28 | $ 1,990,000 | $ 2,241,277 |
| Series F | ||
| 5.00%, due 9/15/28 | 12,810,000 | 16,605,614 |
| Series C | ||
| 5.00%, due 6/15/33 | 1,775,000 | 2,232,155 |
| Series E, Insured: BAM | ||
| 5.00%, due 9/15/33 | 4,500,000 | 5,733,801 |
| Series C | ||
| 5.00%, due 6/15/34 | 1,375,000 | 1,724,558 |
| Series A | ||
| 5.00%, due 4/15/35 | 6,000,000 | 7,318,344 |
| Series E, Insured: BAM | ||
| 5.00%, due 9/15/35 | 2,325,000 | 2,949,286 |
| Series A | ||
| 5.00%, due 4/15/36 | 2,050,000 | 2,610,991 |
| Series E, Insured: BAM | ||
| 5.00%, due 9/15/37 | 2,000,000 | 2,523,738 |
| Series A | ||
| 5.00%, due 4/15/39 | 1,250,000 | 1,576,595 |
| Series A | ||
| 5.00%, due 1/15/40 | 750,000 | 957,689 |
| State of Connecticut, Transportation Infrastructure, Special Tax, Revenue Bonds | ||
| Series A | ||
| 3.125%, due 5/1/40 | 4,250,000 | 4,642,802 |
| Series A | ||
| 4.00%, due 5/1/39 | 9,550,000 | 11,320,492 |
| Series A | ||
| 5.00%, due 9/1/30 | 5,000,000 | 5,714,349 |
| Series A | ||
| 5.00%, due 9/1/30 | 1,830,000 | 2,218,782 |
| Series A | ||
| 5.00%, due 1/1/31 | 5,000,000 | 6,243,618 |
| Series A, Insured: BAM | ||
| 5.00%, due 9/1/31 | 14,470,000 | 17,586,168 |
| Series A | ||
| 5.00%, due 9/1/33 | 13,000,000 | 15,649,209 |
| Series A | ||
| 5.00%, due 9/1/34 | 3,250,000 | 3,693,588 |
| Series A | ||
| 5.00%, due 1/1/36 | 4,075,000 | 5,035,431 |
| Principal Amount | Value | |
| Connecticut (continued) | ||
| State of Connecticut, Transportation Infrastructure, Special Tax | ||
| 5.00%, due 1/1/30 | $ 4,635,000 | $ 5,813,039 |
| University of Connecticut, Revenue Bonds | ||
| Series A | ||
| 5.00%, due 11/1/33 | 2,000,000 | 2,523,781 |
| Series A | ||
| 5.00%, due 11/1/35 | 3,990,000 | 5,012,421 |
| 237,276,847 | ||
| Delaware 0.7% | ||
| Delaware State Health Facilities Authority, Christiana Health Care System Obligated Group, Revenue Bonds | ||
| Series A | ||
| 5.00%, due 10/1/34 | 6,360,000 | 8,216,264 |
| Series A | ||
| 5.00%, due 10/1/35 | 8,085,000 | 10,420,529 |
| Series A | ||
| 5.00%, due 10/1/37 | 9,135,000 | 11,705,067 |
| Series A | ||
| 5.00%, due 10/1/38 | 5,000,000 | 6,381,537 |
| Series A | ||
| 5.00%, due 10/1/45 | 18,155,000 | 22,724,129 |
| 59,447,526 | ||
| District of Columbia 0.8% | ||
| District of Columbia, Bryant Street Project, Tax Allocation | ||
| 4.00%, due 6/1/39 | 2,370,000 | 2,804,435 |
| 4.00%, due 6/1/43 | 2,035,000 | 2,386,823 |
| District of Columbia, Friendship Public Charter School, Inc., Revenue Bonds | ||
| Series A | ||
| 5.00%, due 6/1/42 | 5,500,000 | 5,910,393 |
| District of Columbia Water & Sewer Authority | ||
| Insured: AGM | ||
| 5.50%, due 10/1/28 | 1,250,000 | 1,571,283 |
| Metropolitan Washington Airports Authority, Revenue Bonds (c) | ||
| Series A | ||
| 4.00%, due 10/1/35 | 1,750,000 | 2,101,346 |
| Series A | ||
| 4.00%, due 10/1/36 | 2,350,000 | 2,812,268 |
| Principal Amount | Value | |
| Long-Term Municipal Bonds (continued) | ||
| District of Columbia (continued) | ||
| Metropolitan Washington Airports Authority, Revenue Bonds (c) (continued) | ||
| Series A | ||
| 5.00%, due 10/1/29 | $ 2,500,000 | $ 3,255,394 |
| Series A | ||
| 5.00%, due 10/1/30 | 3,000,000 | 3,971,652 |
| Series A | ||
| 5.00%, due 10/1/31 | 4,000,000 | 5,258,386 |
| Series A | ||
| 5.00%, due 10/1/32 | 4,000,000 | 5,238,216 |
| Series A | ||
| 5.00%, due 10/1/33 | 3,175,000 | 4,142,236 |
| Metropolitan Washington Airports Authority, Dulles Toll Road, Metrorail & Capital Improvement Project, Revenue Bonds, Second Lien | ||
| Series C, Insured: AGC | ||
| 6.50%, due 10/1/41 (a) | 8,000,000 | 10,279,266 |
| Metropolitan Washington Airports Authority Dulles Toll Road, Dulles Toll Road, Metrorail & Capital Improvement Project, Revenue Bonds, Sub. Lien | ||
| Series B | ||
| 4.00%, due 10/1/39 | 1,000,000 | 1,161,447 |
| Series B | ||
| 5.00%, due 10/1/33 | 1,500,000 | 1,903,280 |
| Metropolitan Washington Airports Authority Dulles Toll Road, Dulles Toll Road, Metrorail & Capital Improvement Project, Revenue Bonds | ||
| Series B | ||
| 6.50%, due 10/1/44 (a) | 7,140,000 | 9,574,350 |
| Tender Option Bond Trust Receipts/Certificates, Revenue Bonds | ||
| Series 2020-YX1120 | ||
| 0.11%, due 10/1/49 (b)(e)(f) | 8,390,000 | 8,390,000 |
| 70,760,775 | ||
| Principal Amount | Value | |
| Florida 2.7% | ||
| Central Florida Expressway Authority, Revenue Bonds, Senior Lien | ||
| Insured: AGM | ||
| 4.00%, due 7/1/37 | $ 3,705,000 | $ 4,552,378 |
| Central Florida Expressway Authority, Revenue Bonds | ||
| Series A | ||
| 5.00%, due 7/1/35 | 2,205,000 | 2,835,895 |
| City of Gainesville FL, Revenue Bonds | ||
| Series A | ||
| 5.00%, due 10/1/44 | 12,580,000 | 15,874,872 |
| City of Miami Beach FL, Beach Parking, Revenue Bonds | ||
| Insured: BAM | ||
| 5.00%, due 9/1/40 | 2,500,000 | 2,918,931 |
| City of Miami FL, Parking System, Revenue Bonds | ||
| Insured: BAM | ||
| 4.00%, due 10/1/33 | 1,520,000 | 1,789,741 |
| Insured: BAM | ||
| 4.00%, due 10/1/36 | 3,395,000 | 3,959,281 |
| Insured: BAM | ||
| 4.00%, due 10/1/37 | 2,535,000 | 2,947,752 |
| Insured: BAM | ||
| 4.00%, due 10/1/38 | 1,675,000 | 1,939,916 |
| Insured: BAM | ||
| 4.00%, due 10/1/39 | 2,820,000 | 3,258,691 |
| City of Orlando FL, Tourist Development Tax, Unrefunded, Revenue Bonds | ||
| Series C, Insured: AGC | ||
| 5.50%, due 11/1/38 | 1,600,000 | 1,604,194 |
| City of South Miami, Miami Health Facilities Authority, Inc., Revenue Bonds | ||
| 5.00%, due 8/15/42 | 20,000,000 | 24,011,678 |
| County of Broward, Airport System, Revenue Bonds | ||
| Series A | ||
| 5.00%, due 10/1/49 (c) | 4,000,000 | 4,903,079 |
| County of Miami-Dade, Water & Sewer System, Revenue Bonds | ||
| 3.00%, due 10/1/36 | 2,100,000 | 2,346,792 |
| 3.00%, due 10/1/43 | 6,750,000 | 7,347,825 |
| 4.00%, due 10/1/42 | 3,000,000 | 3,614,425 |
| 20 | MainStay MacKay Tax Free Bond Fund |
| Principal Amount | Value | |
| Long-Term Municipal Bonds (continued) | ||
| Florida (continued) | ||
| County of Miami-Dade FL, Aviation, Revenue Bonds | ||
| Series A | ||
| 4.00%, due 10/1/38 | $ 2,250,000 | $ 2,687,112 |
| County of Miami-Dade FL, Water & Sewer System, Revenue Bonds | ||
| Series A | ||
| 4.00%, due 10/1/44 | 9,500,000 | 10,857,897 |
| Series B | ||
| 5.00%, due 10/1/31 | 10,000,000 | 11,902,861 |
| Series B | ||
| 5.00%, due 10/1/44 | 20,000,000 | 25,436,158 |
| County of Miami-Dade FL, Transit System, Revenue Bonds | ||
| Series A | ||
| 4.00%, due 7/1/48 | 19,340,000 | 22,666,130 |
| County of Miami-Dade FL, Unlimited General Obligation | ||
| Series A | ||
| 5.00%, due 7/1/37 | 2,000,000 | 2,407,521 |
| County of Sarasota FL, Utility System, Revenue Bonds | ||
| Series A | ||
| 5.00%, due 10/1/40 | 5,750,000 | 7,205,661 |
| Florida Governmental Utility Authority, Revenue Bonds | ||
| Insured: AGM | ||
| 4.00%, due 10/1/37 | 1,375,000 | 1,625,830 |
| Insured: AGM | ||
| 4.00%, due 10/1/39 | 1,400,000 | 1,647,427 |
| Florida Keys Aqueduct Authority, Revenue Bonds | ||
| Series A | ||
| 5.00%, due 9/1/49 | 6,000,000 | 6,933,786 |
| Greater Orlando Aviation Authority, Revenue Bonds | ||
| Series A | ||
| 5.00%, due 10/1/32 (c) | 7,025,000 | 8,982,402 |
| JEA Electric System, Revenue Bonds | ||
| Series B | ||
| 4.00%, due 10/1/36 | 4,500,000 | 5,224,951 |
| Orange County Health Facilities Authority, Presbyterian Retirement Communities, Inc., Revenue Bonds | ||
| 5.00%, due 8/1/31 | 1,500,000 | 1,657,781 |
| Principal Amount | Value | |
| Florida (continued) | ||
| Putnam County Development Authority, Seminole Electric Cooperative, Inc., Revenue Bonds | ||
| Series A | ||
| 5.00%, due 3/15/42 | $ 5,000,000 | $ 6,045,199 |
| Village Community Development District No. 8, Special Assessment | ||
| Insured: AGM | ||
| 3.50%, due 5/1/40 | 6,190,000 | 6,871,537 |
| West Palm Beach Community Redevelopment Agency, City Center Community Redevelopment Area, Tax Allocation | ||
| 5.00%, due 3/1/34 | 10,100,000 | 12,783,612 |
| 5.00%, due 3/1/35 | 10,620,000 | 13,397,556 |
| 232,238,871 | ||
| Georgia 1.9% | ||
| Atlanta Development Authority, Revenue Bonds | ||
| Series A-1 | ||
| 5.00%, due 7/1/33 | 1,000,000 | 1,152,695 |
| Brookhaven Development Authority, Children's Healthcare of Atlanta, Revenue Bonds | ||
| Series A | ||
| 4.00%, due 7/1/44 | 7,915,000 | 9,287,816 |
| Series A | ||
| 5.00%, due 7/1/32 | 1,550,000 | 2,022,812 |
| Series A | ||
| 5.00%, due 7/1/33 | 2,380,000 | 3,095,385 |
| Series A | ||
| 5.00%, due 7/1/35 | 1,900,000 | 2,458,957 |
| Series A | ||
| 5.00%, due 7/1/36 | 2,850,000 | 3,672,628 |
| Series A | ||
| 5.00%, due 7/1/37 | 2,800,000 | 3,597,697 |
| Series A | ||
| 5.00%, due 7/1/38 | 2,250,000 | 2,883,879 |
| Series A | ||
| 5.00%, due 7/1/39 | 1,300,000 | 1,662,394 |
| City of Atlanta GA, Department of Aviation, Revenue Bonds | ||
| Series C | ||
| 5.00%, due 1/1/42 | 1,310,000 | 1,348,429 |
| Principal Amount | Value | |
| Long-Term Municipal Bonds (continued) | ||
| Georgia (continued) | ||
| City of Dalton (The), Georgia Combined Utilities, Revenue Bonds | ||
| 5.00%, due 3/1/30 | $ 2,055,000 | $ 2,491,908 |
| Coweta County Development Authority, Piedmont Healthcare, Inc., Revenue Bonds | ||
| Series A | ||
| 5.00%, due 7/1/44 | 5,000,000 | 6,259,354 |
| Development Authority of Appling County, Oglethorpe Power Corp. Project, Revenue Bonds | ||
| Series A | ||
| 1.50%, due 1/1/38 (b)(e) | 2,500,000 | 2,565,242 |
| Development Authority of Burke County (The), Oglethorpe Power Corp. Project, Revenue Bonds | ||
| Series A | ||
| 1.50%, due 1/1/40 (b)(e) | 7,365,000 | 7,557,204 |
| Development Authority of Monroe County (The), Oglethorpe Power Corp. Scherer Project, Revenue Bonds | ||
| Series A | ||
| 1.50%, due 1/1/39 (b)(e) | 3,750,000 | 3,847,863 |
| Gainesville & Hall County Hospital Authority, Northeast Health System, Inc. Project, Revenue Bonds | ||
| Series A, Insured: County Guaranteed | ||
| 5.25%, due 8/15/49 | 5,155,000 | 5,925,110 |
| Main Street Natural Gas, Inc., Revenue Bonds | ||
| Series A | ||
| 5.00%, due 5/15/35 | 3,000,000 | 4,128,230 |
| Series A | ||
| 5.00%, due 5/15/36 | 3,700,000 | 5,135,119 |
| Municipal Electric Authority of Georgia, Project One Subordinated Bonds, Revenue Bonds | ||
| Series A | ||
| 5.00%, due 1/1/35 | 5,000,000 | 5,697,752 |
| Series A | ||
| 5.00%, due 1/1/45 | 3,300,000 | 4,146,019 |
| Principal Amount | Value | |
| Georgia (continued) | ||
| Municipal Electric Authority of Georgia, Project One Subordinated Bonds, Revenue Bonds (continued) | ||
| Series A | ||
| 5.00%, due 1/1/50 | $ 4,000,000 | $ 4,991,270 |
| Municipal Electric Authority of Georgia, Plant Vogtle Units 3 & 4 Project, Revenue Bonds | ||
| Series A | ||
| 5.00%, due 1/1/37 | 1,000,000 | 1,222,525 |
| Series A | ||
| 5.00%, due 1/1/38 | 1,340,000 | 1,634,328 |
| Series A | ||
| 5.00%, due 1/1/49 | 52,395,000 | 62,598,800 |
| Series A | ||
| 5.00%, due 1/1/59 | 10,000,000 | 11,851,413 |
| 161,234,829 | ||
| Guam 0.4% | ||
| Antonio B Won Pat International Airport Authority, Revenue Bonds | ||
| Series C, Insured: AGM | ||
| 6.125%, due 10/1/43 (c) | 5,000,000 | 5,491,215 |
| Guam Government Waterworks Authority, Water and Wastewater System, Revenue Bonds | ||
| 5.00%, due 7/1/40 | 1,730,000 | 2,008,286 |
| 5.00%, due 1/1/46 | 5,000,000 | 5,645,347 |
| Series A | ||
| 5.00%, due 1/1/50 | 1,660,000 | 2,022,791 |
| 5.25%, due 7/1/33 | 1,000,000 | 1,105,950 |
| Guam Power Authority, Revenue Bonds | ||
| Series A, Insured: AGM | ||
| 5.00%, due 10/1/30 | 5,610,000 | 5,931,396 |
| Series A, Insured: AGM | ||
| 5.00%, due 10/1/44 | 655,000 | 726,483 |
| Territory of Guam, Section 30, Revenue Bonds | ||
| Series A | ||
| 5.00%, due 12/1/27 | 2,265,000 | 2,664,679 |
| Series A | ||
| 5.00%, due 12/1/34 | 2,290,000 | 2,636,942 |
| 22 | MainStay MacKay Tax Free Bond Fund |
| Principal Amount | Value | |
| Long-Term Municipal Bonds (continued) | ||
| Guam (continued) | ||
| Territory of Guam, Business Privilege Tax, Revenue Bonds | ||
| Series A | ||
| 5.125%, due 1/1/42 | $ 3,085,000 | $ 3,174,133 |
| 31,407,222 | ||
| Hawaii 0.2% | ||
| State of Hawaii Department of Budget & Finance, Hawaiian Electric Co., Inc., Revenue Bonds | ||
| 3.50%, due 10/1/49 | 7,000,000 | 7,310,877 |
| State of Hawaii Department of Budget & Finance, Hawai'i Pacific Health Obligated Group, Revenue Bonds | ||
| Series A | ||
| 6.00%, due 7/1/33 | 3,000,000 | 3,344,095 |
| State of Hawaii State Highway Fund, Revenue Bonds | ||
| Series A | ||
| 5.00%, due 1/1/38 | 2,765,000 | 3,479,774 |
| Series A | ||
| 5.00%, due 1/1/39 | 3,150,000 | 3,955,157 |
| Series A | ||
| 5.00%, due 1/1/40 | 2,140,000 | 2,681,967 |
| 20,771,870 | ||
| Idaho 0.4% | ||
| Idaho Housing & Finance Association, Federal Highway Trust Fund, Revenue Bonds | ||
| Series A | ||
| 5.00%, due 7/15/36 | 16,920,000 | 21,521,265 |
| Series A | ||
| 5.00%, due 7/15/37 | 10,000,000 | 12,682,617 |
| 34,203,882 | ||
| Illinois 10.0% | ||
| Chicago Board of Education, Capital Appreciation, School Reform, Unlimited General Obligation | ||
| Series A, Insured: NATL-RE | ||
| (zero coupon), due 12/1/26 | 19,995,000 | 18,309,835 |
| Chicago Board of Education, Unlimited General Obligation | ||
| Series A, Insured: AGM | ||
| 5.00%, due 12/1/27 | 8,250,000 | 10,237,116 |
| Principal Amount | Value | |
| Illinois (continued) | ||
| Chicago Board of Education, Unlimited General Obligation (continued) | ||
| Series A, Insured: AGM | ||
| 5.50%, due 12/1/39 | $ 11,455,000 | $ 11,677,142 |
| Chicago Board of Education, Revenue Bonds | ||
| 6.00%, due 4/1/46 | 19,485,000 | 23,422,441 |
| Chicago O'Hare International Airport, Revenue Bonds, Senior Lien | ||
| Series A | ||
| 4.00%, due 1/1/32 (c) | 2,900,000 | 2,970,897 |
| Series A | ||
| 4.00%, due 1/1/37 | 11,290,000 | 13,385,696 |
| Series A, Insured: AGM | ||
| 4.00%, due 1/1/37 | 15,000,000 | 17,837,548 |
| Series B, Insured: AGM | ||
| 4.00%, due 1/1/53 | 10,000,000 | 11,369,524 |
| Series B | ||
| 5.00%, due 1/1/28 | 1,000,000 | 1,262,012 |
| Series C | ||
| 5.00%, due 1/1/35 | 6,000,000 | 7,111,442 |
| Series D | ||
| 5.00%, due 1/1/47 (c) | 5,000,000 | 5,870,854 |
| Series C | ||
| 5.50%, due 1/1/34 (c) | 3,000,000 | 3,221,230 |
| Chicago O'Hare International Airport, Revenue Bonds | ||
| Series A | ||
| 5.00%, due 1/1/32 (c) | 15,000,000 | 17,202,123 |
| Chicago O'Hare International Airport, Passenger Facility Charge, Revenue Bonds | ||
| Series A | ||
| 5.00%, due 1/1/30 | 2,915,000 | 3,003,268 |
| Series B | ||
| 5.00%, due 1/1/31 (c) | 2,000,000 | 2,056,244 |
| Chicago Park District, Limited General Obligation | ||
| Series A, Insured: BAM | ||
| 4.00%, due 1/1/31 | 1,955,000 | 2,328,806 |
| Series C, Insured: BAM | ||
| 4.00%, due 1/1/38 | 2,800,000 | 3,249,222 |
| Series C, Insured: BAM | ||
| 4.00%, due 1/1/39 | 3,145,000 | 3,640,037 |
| Series A | ||
| 5.00%, due 1/1/28 | 1,000,000 | 1,169,557 |
| Principal Amount | Value | |
| Long-Term Municipal Bonds (continued) | ||
| Illinois (continued) | ||
| Chicago Park District, Limited General Obligation (continued) | ||
| Series A | ||
| 5.00%, due 1/1/29 | $ 750,000 | $ 872,498 |
| Series A | ||
| 5.00%, due 1/1/31 | 1,000,000 | 1,153,299 |
| Series A | ||
| 5.00%, due 1/1/35 | 2,000,000 | 2,288,798 |
| Chicago Park District, Unlimited General Obligation | ||
| Series F-2 | ||
| 4.00%, due 1/1/38 | 1,150,000 | 1,319,707 |
| Series F-2 | ||
| 5.00%, due 1/1/37 | 2,050,000 | 2,552,040 |
| Chicago Park District, Personal Property Replacement Tax, Unlimited General Obligation | ||
| Series D, Insured: BAM | ||
| 4.00%, due 1/1/34 | 4,555,000 | 5,345,056 |
| Chicago Park District, Limited Tax, Limited General Obligation | ||
| Series B, Insured: BAM | ||
| 5.00%, due 1/1/29 | 2,500,000 | 2,719,044 |
| Series A | ||
| 5.50%, due 1/1/33 | 2,000,000 | 2,197,874 |
| Series A | ||
| 5.75%, due 1/1/38 | 4,000,000 | 4,400,028 |
| Chicago Park District, Special Recreation Activity Alternate Revenue Source, Unlimited General Obligation | ||
| Insured: BAM | ||
| 5.00%, due 11/15/30 | 1,435,000 | 1,827,171 |
| Chicago Transit Authority, Sales Tax Receipts, Revenue Bonds, Second Lien | ||
| Series A | ||
| 4.00%, due 12/1/50 | 32,730,000 | 37,210,793 |
| 5.00%, due 12/1/46 | 2,480,000 | 2,976,078 |
| Chicago Transit Authority, Sales Tax Receipts, Revenue Bonds | ||
| 5.25%, due 12/1/29 | 2,000,000 | 2,059,428 |
| 5.25%, due 12/1/31 | 1,735,000 | 1,786,554 |
| Chicago Transit Authority Sales Tax Receipts Fund, Revenue Bonds | ||
| 5.00%, due 12/1/44 | 2,000,000 | 2,295,443 |
| 5.25%, due 12/1/49 | 1,500,000 | 1,741,691 |
| Principal Amount | Value | |
| Illinois (continued) | ||
| City of Chicago Heights IL, Unlimited General Obligation | ||
| Series B, Insured: BAM | ||
| 5.25%, due 12/1/34 | $ 2,115,000 | $ 2,603,375 |
| City of Chicago IL, Waterworks, Revenue Bonds, Second Lien | ||
| 4.00%, due 11/1/37 | 1,250,000 | 1,304,647 |
| Series 2, Insured: AGM | ||
| 5.00%, due 11/1/28 | 2,000,000 | 2,540,862 |
| Series 2, Insured: AGM | ||
| 5.00%, due 11/1/30 | 3,000,000 | 3,764,802 |
| Series 2, Insured: AGM | ||
| 5.00%, due 11/1/32 | 5,000,000 | 6,236,344 |
| Series 2, Insured: AGM | ||
| 5.00%, due 11/1/33 | 10,000,000 | 12,445,939 |
| Series 2, Insured: AGM | ||
| 5.00%, due 11/1/38 | 3,500,000 | 4,312,471 |
| Insured: AGM | ||
| 5.25%, due 11/1/33 | 5,000,000 | 6,319,008 |
| Insured: AGM | ||
| 5.25%, due 11/1/34 | 1,785,000 | 2,256,435 |
| Insured: AGM | ||
| 5.25%, due 11/1/35 | 3,025,000 | 3,827,435 |
| City of Chicago IL, Waterworks, Project, Revenue Bonds, Second Lien | ||
| 5.00%, due 11/1/27 | 1,655,000 | 1,898,748 |
| 5.00%, due 11/1/29 | 1,700,000 | 1,934,682 |
| City of Chicago IL, Wastewater Transmission Project, Revenue Bonds, Second Lien | ||
| 5.00%, due 1/1/28 | 1,000,000 | 1,116,677 |
| Series B, Insured: AGM | ||
| 5.00%, due 1/1/30 | 7,585,000 | 9,311,282 |
| 5.00%, due 1/1/33 | 2,000,000 | 2,220,991 |
| Series B | ||
| 5.00%, due 1/1/33 | 2,490,000 | 3,021,576 |
| 5.00%, due 1/1/39 | 8,420,000 | 9,350,373 |
| 5.00%, due 1/1/44 | 13,090,000 | 14,529,058 |
| Series A, Insured: AGM | ||
| 5.25%, due 1/1/42 | 4,000,000 | 4,901,622 |
| City of Chicago IL, Motor Fuel Tax, Revenue Bonds | ||
| Insured: AGM | ||
| 5.00%, due 1/1/33 | 4,725,000 | 5,080,138 |
| 24 | MainStay MacKay Tax Free Bond Fund |
| Principal Amount | Value | |
| Long-Term Municipal Bonds (continued) | ||
| Illinois (continued) | ||
| City of Chicago IL, Project, Unlimited General Obligation | ||
| Series A | ||
| 5.00%, due 1/1/40 | $ 1,750,000 | $ 1,753,385 |
| City of Chicago IL, Unlimited General Obligation | ||
| Series A | ||
| 5.50%, due 1/1/49 | 10,000,000 | 12,064,969 |
| Series A | ||
| 6.00%, due 1/1/38 | 43,000,000 | 52,182,929 |
| Series A, Insured: BAM | ||
| 6.00%, due 1/1/38 | 6,000,000 | 7,304,756 |
| Cook County Community College District No. 508, Unlimited General Obligation | ||
| Insured: BAM | ||
| 5.50%, due 12/1/38 | 5,000,000 | 5,580,434 |
| Cook County Community High School District No. 212 Leyden, Revenue Bonds | ||
| Series C, Insured: BAM | ||
| 5.00%, due 12/1/30 | 3,370,000 | 3,906,640 |
| Series C, Insured: BAM | ||
| 5.00%, due 12/1/31 | 2,610,000 | 3,024,609 |
| County of Will IL, Unlimited General Obligation | ||
| 5.00%, due 11/15/45 | 18,000,000 | 21,731,825 |
| Illinois Finance Authority, University of Chicago, Revenue Bonds | ||
| Series A | ||
| 4.00%, due 4/1/50 | 10,775,000 | 12,631,921 |
| Illinois Finance Authority, Carle Foundation (The), Revenue Bonds (g) | ||
| Series A | ||
| 5.00%, due 8/15/35 | 5,000,000 | 6,650,942 |
| Series A | ||
| 5.00%, due 8/15/36 | 4,825,000 | 6,390,181 |
| Illinois Finance Authority, Rehab Institute of Chicago, Revenue Bonds | ||
| Series A | ||
| 6.00%, due 7/1/43 | 9,600,000 | 10,434,155 |
| Principal Amount | Value | |
| Illinois (continued) | ||
| Illinois Housing Development Authority, Revenue Bonds | ||
| Series A, Insured: GNMA FNMA FHLMC COLL | ||
| 3.00%, due 4/1/51 | $ 8,000,000 | $ 8,773,540 |
| Illinois Sports Facilities Authority (The), Revenue Bonds | ||
| Insured: AGM | ||
| 5.25%, due 6/15/31 | 5,000,000 | 5,574,133 |
| Illinois State Toll Highway Authority, Revenue Bonds, Senior Lien | ||
| Series B | ||
| 5.00%, due 1/1/41 | 5,665,000 | 6,765,677 |
| Metropolitan Pier & Exposition Authority, McCormick Place Expansion Project, Revenue Bonds | ||
| Series A, Insured: NATL-RE | ||
| (zero coupon), due 6/15/36 | 58,750,000 | 39,328,701 |
| Metropolitan Pier & Exposition Authority, McCormick Place Expansion Project, Capital Appreciation, Revenue Bonds | ||
| Insured: AGM | ||
| (zero coupon), due 6/15/44 | 10,000,000 | 5,221,261 |
| Rock Island County Public Building Commission, County of Rock Island, Revenue Bonds | ||
| Insured: AGM | ||
| 5.00%, due 12/1/36 | 2,645,000 | 3,198,835 |
| Sales Tax Securitization Corp., Revenue Bonds | ||
| Series A | ||
| 4.00%, due 1/1/48 | 20,000,000 | 22,290,824 |
| Series C | ||
| 5.00%, due 1/1/33 | 2,000,000 | 2,482,055 |
| Series A | ||
| 5.00%, due 1/1/40 | 4,915,000 | 5,877,709 |
| Series 2018C | ||
| 5.00%, due 1/1/43 | 15,000,000 | 18,183,085 |
| Series C | ||
| 5.25%, due 1/1/35 | 9,000,000 | 11,272,144 |
| Series 2018C | ||
| 5.25%, due 1/1/43 | 20,000,000 | 24,597,520 |
| Sales Tax Securitization Corp., Revenue Bonds, Second Lien | ||
| Series 2020A | ||
| 5.00%, due 1/1/26 | 1,400,000 | 1,661,588 |
| Principal Amount | Value | |
| Long-Term Municipal Bonds (continued) | ||
| Illinois (continued) | ||
| Sales Tax Securitization Corp., Revenue Bonds, Second Lien (continued) | ||
| Series A, Insured: BAM | ||
| 5.00%, due 1/1/37 | $ 1,650,000 | $ 2,072,046 |
| Sangamon County School District No. 186 Springfield, Unlimited General Obligation | ||
| Series C, Insured: AGM | ||
| 5.00%, due 6/1/28 | 1,005,000 | 1,276,172 |
| Series C, Insured: AGM | ||
| 5.00%, due 6/1/34 | 1,000,000 | 1,299,629 |
| Series C, Insured: AGM | ||
| 5.00%, due 6/1/38 | 1,635,000 | 2,098,108 |
| Series C, Insured: AGM | ||
| 5.00%, due 6/1/39 | 1,000,000 | 1,279,937 |
| Southern Illinois University, Housing & Auxiliary Facilities System, Revenue Bonds | ||
| Series 2015B, Insured: BAM | ||
| 5.00%, due 4/1/26 | 1,175,000 | 1,356,004 |
| Series B, Insured: BAM | ||
| 5.00%, due 4/1/29 | 1,620,000 | 1,844,353 |
| Series B, Insured: BAM | ||
| 5.00%, due 4/1/30 | 1,000,000 | 1,135,683 |
| State of Illinois, Sales Tax, Revenue Bonds | ||
| Series C | ||
| 4.00%, due 6/15/27 | 2,000,000 | 2,251,739 |
| 4.50%, due 6/15/36 | 17,500,000 | 17,544,935 |
| State of Illinois, Unlimited General Obligation | ||
| Series C | ||
| 4.00%, due 10/1/40 | 5,000,000 | 5,695,375 |
| Insured: BAM | ||
| 4.00%, due 6/1/41 | 12,600,000 | 13,607,622 |
| Series D | ||
| 5.00%, due 11/1/26 | 8,725,000 | 10,410,263 |
| 5.00%, due 2/1/27 | 4,730,000 | 5,717,695 |
| 5.00%, due 1/1/28 | 6,155,000 | 7,147,953 |
| 5.00%, due 2/1/28 | 10,000,000 | 11,967,123 |
| Series D | ||
| 5.00%, due 11/1/28 | 7,380,000 | 8,870,868 |
| 5.25%, due 2/1/32 | 10,000,000 | 11,022,771 |
| 5.50%, due 5/1/39 | 15,000,000 | 19,144,848 |
| 5.75%, due 5/1/45 | 5,000,000 | 6,418,495 |
| Principal Amount | Value | |
| Illinois (continued) | ||
| State of Illinois, Unlimited General Obligation (continued) | ||
| Series A | ||
| 6.00%, due 5/1/27 | $ 9,665,000 | $ 12,291,615 |
| Tender Option Bond Trust Receipts/Certificates, Revenue Bonds | ||
| Series 2015-XF1009, Insured: AGM | ||
| 0.11%, due 6/15/32 (d)(e)(f) | 17,390,000 | 17,390,000 |
| United City of Yorkville IL, Special Tax | ||
| Insured: AGM | ||
| 5.00%, due 3/1/32 | 3,773,000 | 4,376,965 |
| Village of Bellwood, Unlimited General Obligation | ||
| Insured: AGM | ||
| 5.00%, due 12/1/29 | 1,500,000 | 1,789,442 |
| Village of Oswego, Unlimited General Obligation | ||
| 5.00%, due 12/15/33 | 7,670,000 | 9,187,671 |
| Village of Rosemont IL, Corporate Purpose, Unlimited General Obligation | ||
| Series A, Insured: AGM | ||
| 5.00%, due 12/1/40 | 8,090,000 | 9,754,799 |
| Village of Schaumburg IL, Unlimited General Obligation | ||
| Series A | ||
| 4.00%, due 12/1/41 | 37,350,000 | 39,666,204 |
| Western Illinois Economic Development Authority, City of Quincy, Revenue Bonds | ||
| Series B, Insured: BAM | ||
| 4.00%, due 12/1/34 | 1,500,000 | 1,728,335 |
| 858,277,429 | ||
| Indiana 0.7% | ||
| Indiana Finance Authority, Educational Facilities-Butler University, Revenue Bonds | ||
| Series B | ||
| 5.00%, due 2/1/24 | 2,100,000 | 2,169,090 |
| Series A | ||
| 5.00%, due 2/1/25 | 2,215,000 | 2,286,815 |
| Series B | ||
| 5.00%, due 2/1/25 | 2,210,000 | 2,281,989 |
| Series B | ||
| 5.00%, due 2/1/26 | 2,320,000 | 2,394,794 |
| 26 | MainStay MacKay Tax Free Bond Fund |
| Principal Amount | Value | |
| Long-Term Municipal Bonds (continued) | ||
| Indiana (continued) | ||
| Indiana University, Revenue Bonds | ||
| Series A | ||
| 4.00%, due 6/1/32 | $ 2,595,000 | $ 3,180,742 |
| Series A | ||
| 4.00%, due 6/1/33 | 1,885,000 | 2,301,566 |
| Series A | ||
| 4.00%, due 6/1/38 | 3,015,000 | 3,626,881 |
| Series A | ||
| 4.00%, due 6/1/39 | 3,095,000 | 3,713,249 |
| Indianapolis Local Public Improvement Bond Bank, Public Improvement, Revenue Bonds | ||
| Series A, Insured: AGM | ||
| 4.00%, due 6/1/37 | 22,080,000 | 26,148,876 |
| Series A, Insured: AGM | ||
| 4.00%, due 6/1/38 | 7,500,000 | 8,862,839 |
| Vanderburgh County Redevelopment District, Tax Allocation | ||
| Insured: AGM | ||
| 5.00%, due 2/1/31 | 1,460,000 | 1,742,533 |
| 58,709,374 | ||
| Iowa 1.6% | ||
| City of Coralville IA, Certificate of Participation | ||
| Series E | ||
| 4.00%, due 6/1/21 | 545,000 | 545,089 |
| Series E | ||
| 4.00%, due 6/1/22 | 1,405,000 | 1,409,332 |
| Series E | ||
| 4.00%, due 6/1/23 | 1,320,000 | 1,326,938 |
| Iowa Finance Authority, Renewable Natural Gas Project, Green Bond, Revenue Bonds | ||
| 1.50%, due 1/1/42 (b)(c) | 3,000,000 | 3,033,714 |
| Iowa Finance Authority, Mortgage-Backed Securities Program, Revenue Bonds | ||
| Series A, Insured: GNMA / FNMA / FHLMC | ||
| 4.00%, due 7/1/47 | 2,620,000 | 2,968,385 |
| Series C, Insured: GNMA / FNMA / FHLMC | ||
| 4.00%, due 7/1/48 | 1,615,000 | 1,767,189 |
| PEFA, Inc., Revenue Bonds | ||
| 5.00%, due 9/1/49 (b) | 102,820,000 | 124,576,404 |
| 135,627,051 | ||
| Principal Amount | Value | |
| Kansas 0.2% | ||
| City of Hutchinson KS, Hutchinson Regional Medical Center, Inc., Revenue Bonds | ||
| 5.00%, due 12/1/26 | $ 565,000 | $ 653,811 |
| 5.00%, due 12/1/28 | 410,000 | 469,268 |
| 5.00%, due 12/1/30 | 500,000 | 563,333 |
| University of Kansas Hospital Authority, KU Health System, Revenue Bonds | ||
| 5.00%, due 9/1/33 | 2,500,000 | 2,947,979 |
| 5.00%, due 9/1/34 | 5,000,000 | 5,888,950 |
| 5.00%, due 9/1/35 | 2,800,000 | 3,293,893 |
| 13,817,234 | ||
| Kentucky 0.2% | ||
| City of Ashland KY, Ashland Hospital Corp., King's Daughters Medical Center Project, Revenue Bonds | ||
| Series A | ||
| 5.00%, due 2/1/23 | 1,525,000 | 1,618,911 |
| Fayette County School District Finance Corp., Fayette County School District, Revenue Bonds | ||
| Series A, Insured: State Intercept | ||
| 4.00%, due 5/1/38 | 2,995,000 | 3,332,949 |
| Kentucky Public Energy Authority, Revenue Bonds | ||
| Series A | ||
| 4.00%, due 4/1/48 (b) | 15,000,000 | 16,450,973 |
| 21,402,833 | ||
| Louisiana 0.5% | ||
| City of Shreveport LA, Unlimited General Obligation | ||
| Insured: BAM | ||
| 5.00%, due 8/1/30 | 5,355,000 | 6,690,050 |
| Louisiana Public Facilities Authority, Unrefunded-Ochsner Clinic Foundation Project, Revenue Bonds | ||
| 5.00%, due 5/15/34 | 2,010,000 | 2,371,964 |
| Louisiana Public Facilities Authority, Loyola University of New Orleans, Revenue Bonds | ||
| Series Series 2011 | ||
| 5.25%, due 10/1/30 | 2,930,000 | 2,991,216 |
| Louisiana Stadium & Exposition District, Revenue Bonds | ||
| 5.00%, due 7/3/23 | 11,200,000 | 12,038,860 |
| Principal Amount | Value | |
| Long-Term Municipal Bonds (continued) | ||
| Louisiana (continued) | ||
| Louisiana Stadium & Exposition District, Revenue Bonds, Senior Lien | ||
| Series A | ||
| 5.00%, due 7/1/30 | $ 1,485,000 | $ 1,630,645 |
| Port New Orleans Board of Commissioners, Revenue Bonds | ||
| Series D | ||
| 5.00%, due 4/1/50 | 7,325,000 | 9,090,371 |
| State of Louisiana, Unlimited General Obligation | ||
| Series A | ||
| 4.00%, due 2/1/34 | 9,830,000 | 10,706,825 |
| 45,519,931 | ||
| Maine 0.0% ‡ | ||
| Maine State Housing Authority, Revenue Bonds | ||
| Series F | ||
| 3.65%, due 11/15/42 | 1,110,000 | 1,175,897 |
| Maryland 0.8% | ||
| City of Baltimore MD, Water Project, Revenue Bonds | ||
| Series A | ||
| 4.00%, due 7/1/37 | 2,065,000 | 2,476,327 |
| County of Baltimore, Public Improvement, Unlimited General Obligation | ||
| 4.00%, due 3/1/37 | 5,565,000 | 6,663,958 |
| Maryland Community Development Administration, Department of Housing & Community Development, Revenue Bonds | ||
| Series A | ||
| 3.00%, due 9/1/51 | 25,400,000 | 27,862,837 |
| Maryland Stadium Authority, Construction and Reviatalization Program, Certificate of Participation | ||
| Series A, Insured: State Intercept | ||
| 5.00%, due 5/1/42 | 24,645,000 | 30,444,479 |
| 67,447,601 | ||
| Principal Amount | Value | |
| Massachusetts 0.3% | ||
| City of Worcester MA, Limited General Obligation | ||
| Insured: AGM | ||
| 3.00%, due 2/15/30 | $ 1,000,000 | $ 1,149,004 |
| Massachusetts Development Finance Agency, WGBH Educational Foundation, Revenue Bonds | ||
| 4.00%, due 1/1/33 | 1,000,000 | 1,143,512 |
| Massachusetts Development Finance Agency, UMass Boston Student Housing Project, Revenue Bonds | ||
| 5.00%, due 10/1/30 | 1,200,000 | 1,323,374 |
| 5.00%, due 10/1/31 | 1,200,000 | 1,320,222 |
| 5.00%, due 10/1/32 | 1,240,000 | 1,360,981 |
| 5.00%, due 10/1/33 | 1,500,000 | 1,642,430 |
| 5.00%, due 10/1/34 | 2,170,000 | 2,370,396 |
| Massachusetts Educational Financing Authority, Revenue Bonds | ||
| Series I | ||
| 6.00%, due 1/1/28 | 285,000 | 289,092 |
| Massachusetts Housing Finance Agency, Single Family Housing, Revenue Bonds | ||
| Series 199 | ||
| 4.00%, due 12/1/48 | 2,990,000 | 3,262,148 |
| Massachusetts School Building Authority, Revenue Bonds | ||
| Series A | ||
| 5.00%, due 8/15/45 | 4,585,000 | 5,940,888 |
| Metropolitan Boston Transit Parking Corp., Revenue Bonds | ||
| 5.25%, due 7/1/36 | 2,000,000 | 2,016,203 |
| 21,818,250 | ||
| Michigan 1.6% | ||
| City of Detroit MI, Sewage Disposal System, Revenue Bonds | ||
| Series A, Insured: BHAC-CR NATL-RE | ||
| 5.00%, due 7/1/35 | 5,345,000 | 5,385,753 |
| City of Detroit MI, Water and Sewage Disposable System, Revenue Bonds | ||
| Series A | ||
| 5.25%, due 7/1/39 | 12,400,000 | 13,139,081 |
| 28 | MainStay MacKay Tax Free Bond Fund |
| Principal Amount | Value | |
| Long-Term Municipal Bonds (continued) | ||
| Michigan (continued) | ||
| City of Detroit MI, Water Supply System, Revenue Bonds | ||
| Series A | ||
| 5.25%, due 7/1/41 | $ 5,000,000 | $ 5,040,912 |
| Series A | ||
| 5.75%, due 7/1/37 | 5,550,000 | 5,599,805 |
| Detroit City School District, Improvement School Building & Site, Unlimited General Obligation | ||
| Series A, Insured: Q-SBLF | ||
| 5.00%, due 5/1/29 | 3,620,000 | 3,790,590 |
| Series A, Insured: Q-SBLF | ||
| 5.00%, due 5/1/33 | 4,535,000 | 4,746,385 |
| Downriver Utility Wastewater Authority, Revenue Bonds | ||
| Insured: AGM | ||
| 5.00%, due 4/1/31 | 1,600,000 | 2,026,084 |
| Grand Rapids Public Schools, Unlimited General Obligation | ||
| Insured: AGM | ||
| 5.00%, due 11/1/42 | 1,400,000 | 1,741,164 |
| Great Lakes Water Authority, Water Supply System, Revenue Bonds, Senior Lien | ||
| Series C | ||
| 5.25%, due 7/1/35 | 20,000,000 | 24,552,768 |
| Hudsonville Public Schools, Unlimited General Obligation | ||
| Series I, Insured: Q-SBLF | ||
| 4.00%, due 5/1/42 | 1,800,000 | 2,140,751 |
| Lincoln Consolidated School District, Unlimited General Obligation | ||
| Series A, Insured: AGM Q-SBLF | ||
| 5.00%, due 5/1/28 | 2,030,000 | 2,459,398 |
| Series A, Insured: AGM Q-SBLF | ||
| 5.00%, due 5/1/30 | 1,455,000 | 1,742,199 |
| Series A, Insured: AGM Q-SBLF | ||
| 5.00%, due 5/1/40 | 1,500,000 | 1,769,579 |
| Livonia Public Schools, Unlimited General Obligation | ||
| Series II, Insured: AGM | ||
| 5.00%, due 5/1/40 | 4,365,000 | 5,188,015 |
| Michigan Finance Authority, Revenue Notes | ||
| Series A-2, Insured: State Aid Withholding | ||
| 4.00%, due 8/20/21 | 20,000,000 | 20,229,898 |
| Principal Amount | Value | |
| Michigan (continued) | ||
| Michigan Finance Authority, Tobacco Settlement Asset-Backed, Revenue Bonds, Senior Lien | ||
| Series A | ||
| 4.00%, due 6/1/36 | $ 2,000,000 | $ 2,408,692 |
| Michigan Finance Authority, Wayne County Criminal Justice Center Project, Revenue Bonds, Senior Lien | ||
| 5.00%, due 11/1/25 | 1,000,000 | 1,183,629 |
| 5.00%, due 11/1/27 | 1,200,000 | 1,484,722 |
| Michigan Finance Authority, Great Lakes Water Authority Sewage Disposal System, Revenue Bonds, Second Lien | ||
| Series C-7, Insured: NATL-RE | ||
| 5.00%, due 7/1/32 | 2,500,000 | 2,842,024 |
| Michigan Finance Authority, Great Lakes Water Authority Sewage Disposal System, Revenue Bonds, Senior Lien | ||
| Series C-3, Insured: AGM | ||
| 5.00%, due 7/1/33 | 3,000,000 | 3,413,466 |
| Michigan Finance Authority, Local Government Loan Program, Revenue Bonds | ||
| Series D-1 | ||
| 5.00%, due 7/1/34 | 500,000 | 587,063 |
| Michigan Finance Authority, Local Government Loan Program, Revenue Bonds, Senior Lien | ||
| Series C-1 | ||
| 5.00%, due 7/1/44 | 2,500,000 | 2,641,775 |
| Michigan Finance Authority, Great Lakes Water Authority Water Supply System, Revenue Bonds | ||
| Series D-1, Insured: AGM | ||
| 5.00%, due 7/1/35 | 2,000,000 | 2,270,923 |
| Series D-6, Insured: NATL-RE | ||
| 5.00%, due 7/1/36 | 7,500,000 | 8,495,779 |
| South Huron Valley Utility Authority, State Of Michigan 2020 Sewage Disposal System Improvement, Revenue Bonds | ||
| Insured: BAM | ||
| 4.00%, due 5/1/34 | 5,185,000 | 6,232,890 |
| Principal Amount | Value | |
| Long-Term Municipal Bonds (continued) | ||
| Michigan (continued) | ||
| Thornapple Kellogg School District, Unlimited General Obligation | ||
| Insured: Q-SBLF | ||
| 4.00%, due 5/1/44 | $ 1,665,000 | $ 1,971,284 |
| Tri-County Area School District, Unlimited General Obligation | ||
| Insured: AGM | ||
| 4.00%, due 5/1/30 | 1,225,000 | 1,484,774 |
| Insured: AGM | ||
| 4.00%, due 5/1/31 | 1,285,000 | 1,549,029 |
| Insured: AGM | ||
| 4.00%, due 5/1/32 | 1,350,000 | 1,625,283 |
| 137,743,715 | ||
| Minnesota 0.1% | ||
| City of St Paul Minnesota, Fairview Health Services, Revenue Bonds | ||
| Series A | ||
| 4.00%, due 11/15/37 | 1,000,000 | 1,123,151 |
| Minnesota Housing Finance Agency, Residential Housing Finance, Revenue Bonds | ||
| Series E, Insured: GNMA / FNMA / FHLMC | ||
| 4.25%, due 1/1/49 | 4,030,000 | 4,484,755 |
| Minnesota Office of Higher Education, Student Loan Program, Revenue Bonds, Senior Lien | ||
| 2.65%, due 11/1/38 (c) | 3,240,000 | 3,256,545 |
| 8,864,451 | ||
| Mississippi 0.0% ‡ | ||
| Mississippi Home Corp., Single Family Mortgage Housing, Revenue Bonds | ||
| Series A, Insured: GNMA / FNMA / FHLMC | ||
| 4.00%, due 12/1/44 | 1,610,000 | 1,772,814 |
| Missouri 0.9% | ||
| City of Kansas City MO, Improvement Downtown Arena Project, Revenue Bonds | ||
| Series E | ||
| 5.00%, due 4/1/40 | 10,055,000 | 11,594,922 |
| Principal Amount | Value | |
| Missouri (continued) | ||
| Kansas City Industrial Development Authority, International Airport Terminal Modernization Project, Revenue Bonds | ||
| Series A, Insured: AGM | ||
| 4.00%, due 3/1/50 (c) | $ 15,000,000 | $ 17,313,795 |
| Kansas City Industrial Development Authority, Airport, Revenue Bonds (c) | ||
| Series A, Insured: AGM | ||
| 4.00%, due 3/1/50 | 2,280,000 | 2,631,697 |
| Series B | ||
| 5.00%, due 3/1/46 | 6,430,000 | 7,824,967 |
| Missouri Housing Development Commission, First Place Homeownership Loan Program, Revenue Bonds | ||
| Series A, Insured: GNMA / FNMA / FHLMC | ||
| 4.25%, due 5/1/47 | 6,595,000 | 7,402,424 |
| Series A, Insured: GNMA / FNMA / FHLMC | ||
| 4.25%, due 5/1/49 | 3,585,000 | 3,994,930 |
| Missouri State Health & Educational Facilities Authority, BJC Healthcare System, Revenue Bonds | ||
| Series A | ||
| 4.00%, due 7/1/46 | 5,000,000 | 5,952,388 |
| 4.50%, due 1/1/39 | 2,865,000 | 3,137,601 |
| Springfield School District No. R-12, Unlimited General Obligation | ||
| 4.00%, due 3/1/35 | 3,140,000 | 3,776,089 |
| St Louis Municipal Finance Corp., Convention Center Expansion, Revenue Bonds | ||
| Insured: AGM | ||
| 5.00%, due 10/1/49 | 5,260,000 | 6,509,695 |
| State of Missouri, SSM Health Care, Revenue Bonds | ||
| Series A | ||
| 5.00%, due 6/1/30 | 4,000,000 | 4,538,232 |
| Tender Option Bond Trust Receipts/Certificates, Revenue Bonds | ||
| Series 2020-YX1159 | ||
| 0.12%, due 3/1/46 (b)(e)(f) | 3,165,000 | 3,165,000 |
| 77,841,740 | ||
| 30 | MainStay MacKay Tax Free Bond Fund |
| Principal Amount | Value | |
| Long-Term Municipal Bonds (continued) | ||
| Montana 0.4% | ||
| Montana Board of Housing, Single Family Mortgage, Revenue Bonds | ||
| Series B | ||
| 3.40%, due 12/1/33 | $ 1,520,000 | $ 1,651,343 |
| Series B | ||
| 3.60%, due 6/1/37 | 1,970,000 | 2,141,235 |
| Montana Facility Finance Authority, Benefis Health System Obligated Group, Revenue Bonds | ||
| 5.00%, due 2/15/30 | 1,790,000 | 2,146,127 |
| 5.00%, due 2/15/31 | 1,500,000 | 1,791,240 |
| 5.00%, due 2/15/33 | 1,320,000 | 1,568,071 |
| 5.00%, due 2/15/34 | 1,200,000 | 1,422,142 |
| Silver Bow County School District No. 1, School Building, Unlimited General Obligation | ||
| 4.00%, due 7/1/30 | 1,745,000 | 2,095,155 |
| 4.00%, due 7/1/32 | 1,945,000 | 2,308,330 |
| 4.00%, due 7/1/33 | 2,020,000 | 2,388,992 |
| Yellowstone County K-12 School District No. 26 Lockwood, School District No. 26 Lockwood, Unlimited General Obligation | ||
| 5.00%, due 7/1/29 | 2,260,000 | 2,877,568 |
| 5.00%, due 7/1/30 | 2,500,000 | 3,161,571 |
| 5.00%, due 7/1/31 | 3,015,000 | 3,797,569 |
| 5.00%, due 7/1/32 | 3,300,000 | 4,143,998 |
| 31,493,341 | ||
| Nebraska 0.5% | ||
| Central Plains Energy, Nebraska Gas Project No. 3, Revenue Bonds | ||
| Series A | ||
| 5.00%, due 9/1/42 | 14,495,000 | 20,822,408 |
| 5.00%, due 9/1/42 | 13,960,000 | 14,838,485 |
| Nebraska Investment Finance Authority, Single Family Housing, Revenue Bonds | ||
| Series C | ||
| 4.00%, due 9/1/48 | 4,315,000 | 4,754,087 |
| 40,414,980 | ||
| Nevada 1.5% | ||
| Clark County School District, Limited General Obligation | ||
| Series B, Insured: BAM | ||
| 3.00%, due 6/15/37 | 5,000,000 | 5,499,814 |
| Principal Amount | Value | |
| Nevada (continued) | ||
| Clark County School District, Limited General Obligation (continued) | ||
| Series B, Insured: BAM | ||
| 3.00%, due 6/15/39 | $ 6,340,000 | $ 6,879,679 |
| Series C | ||
| 4.00%, due 6/15/32 | 5,000,000 | 5,626,269 |
| Series B, Insured: AGM | ||
| 4.00%, due 6/15/35 | 5,395,000 | 6,389,395 |
| Series C | ||
| 4.00%, due 6/15/37 | 4,845,000 | 5,521,214 |
| Series B, Insured: BAM | ||
| 5.00%, due 6/15/34 | 5,750,000 | 7,290,619 |
| County of Clark NV, Park Improvement, Limited General Obligation | ||
| 4.00%, due 12/1/35 | 8,425,000 | 9,967,221 |
| 4.00%, due 12/1/36 | 5,000,000 | 5,898,549 |
| Las Vegas Convention & Visitors Authority, Convention Center Expansion, Revenue Bonds | ||
| Series B | ||
| 4.00%, due 7/1/49 | 9,800,000 | 10,881,410 |
| Series B | ||
| 5.00%, due 7/1/31 | 1,245,000 | 1,515,688 |
| Series B | ||
| 5.00%, due 7/1/43 | 22,500,000 | 26,811,742 |
| Las Vegas Valley Water District, Water Improvement, Limited General Obligation | ||
| Series A | ||
| 5.00%, due 6/1/46 | 3,665,000 | 4,358,034 |
| Washoe County School District, Limited General Obligation | ||
| Series A, Insured: BAM | ||
| 3.00%, due 6/1/33 | 3,000,000 | 3,353,485 |
| Series A, Insured: BAM | ||
| 3.00%, due 6/1/34 | 2,490,000 | 2,764,583 |
| Washoe County School District, School Improvement Bonds, Limited General Obligation | ||
| Series A | ||
| 4.00%, due 10/1/49 | 20,000,000 | 23,299,438 |
| 126,057,140 | ||
| Principal Amount | Value | |
| Long-Term Municipal Bonds (continued) | ||
| New Hampshire 0.1% | ||
| City of Manchester NH, General Airport, Revenue Bonds | ||
| Series A, Insured: AGM | ||
| 5.00%, due 1/1/26 | $ 1,800,000 | $ 1,853,775 |
| New Hampshire Business Finance Authority, Pennichuck Water Works, Inc., Revenue Bonds | ||
| Series A | ||
| 4.00%, due 4/1/50 (c) | 5,525,000 | 6,169,580 |
| 8,023,355 | ||
| New Jersey 4.9% | ||
| Atlantic County Improvement Authority (The), Stockton University, Revenue Bonds | ||
| Series A, Insured: AGM | ||
| 5.00%, due 7/1/31 | 2,670,000 | 3,112,884 |
| Series A, Insured: AGM | ||
| 5.00%, due 7/1/32 | 1,305,000 | 1,516,553 |
| Series A, Insured: AGM | ||
| 5.00%, due 7/1/33 | 1,395,000 | 1,616,656 |
| City of Atlantic City NJ, Unlimited General Obligation | ||
| Series B, Insured: AGM ST AID WITHHLDG | ||
| 5.00%, due 3/1/32 | 3,400,000 | 4,116,919 |
| New Brunswick Parking Authority, City Guaranteed Parking, Revenue Bonds | ||
| Series A, Insured: BAM | ||
| 5.00%, due 9/1/28 | 2,500,000 | 3,044,207 |
| Series A, Insured: BAM | ||
| 5.00%, due 9/1/29 | 2,370,000 | 2,874,880 |
| Series A, Insured: BAM | ||
| 5.00%, due 9/1/30 | 4,605,000 | 5,580,659 |
| Series A, Insured: BAM | ||
| 5.00%, due 9/1/31 | 6,780,000 | 8,208,619 |
| New Jersey Building Authority, Unrefunded, Revenue Bonds | ||
| Series A, Insured: BAM | ||
| 5.00%, due 6/15/25 | 2,015,000 | 2,398,469 |
| Series A, Insured: BAM | ||
| 5.00%, due 6/15/28 | 1,805,000 | 2,180,973 |
| Principal Amount | Value | |
| New Jersey (continued) | ||
| New Jersey Economic Development Authority, New Jersey-American Water Co., Inc., Revenue Bonds | ||
| Series E | ||
| 0.85%, due 12/1/25 (c) | $ 1,550,000 | $ 1,541,267 |
| New Jersey Economic Development Authority, The Goethals Bridge Replacement Project, Revenue Bonds (c) | ||
| 5.00%, due 1/1/28 | 1,000,000 | 1,114,732 |
| 5.50%, due 1/1/26 | 1,000,000 | 1,132,384 |
| New Jersey Economic Development Authority, State of New Jersey Motor Vehicle Surcharge, Revenue Bonds | ||
| Series A, Insured: BAM | ||
| 5.00%, due 7/1/28 | 2,000,000 | 2,469,397 |
| New Jersey Educational Facilities Authority, Stevens Institute of Technology, Green Bond, Revenue Bonds | ||
| Series A | ||
| 3.00%, due 7/1/50 | 1,775,000 | 1,836,616 |
| New Jersey Educational Facilities Authority, Stockton University, Revenue Bonds | ||
| Series A, Insured: BAM | ||
| 5.00%, due 7/1/29 | 4,775,000 | 5,687,768 |
| Series A, Insured: BAM | ||
| 5.00%, due 7/1/30 | 5,000,000 | 5,925,614 |
| Series A, Insured: BAM | ||
| 5.00%, due 7/1/31 | 3,000,000 | 3,544,721 |
| New Jersey Health Care Facilities Financing Authority, Hackensack Meridian Health, Inc., Revenue Bonds | ||
| Series A | ||
| 5.00%, due 7/1/38 | 10,000,000 | 12,017,127 |
| New Jersey Health Care Facilities Financing Authority, RWJ Barnabas Health, Revenue Bonds | ||
| Series A | ||
| 5.625%, due 7/1/32 | 25,000 | 25,217 |
| 32 | MainStay MacKay Tax Free Bond Fund |
| Principal Amount | Value | |
| Long-Term Municipal Bonds (continued) | ||
| New Jersey (continued) | ||
| New Jersey Higher Education Student Assistance Authority, Subordinate Student loan, Revenue Bonds | ||
| Series C | ||
| 4.00%, due 12/1/48 (c) | $ 2,250,000 | $ 2,406,035 |
| New Jersey Housing & Mortgage Finance Agency, Single-Family Home Mortgage, Revenue Bonds | ||
| Series E | ||
| 3.50%, due 4/1/51 | 26,640,000 | 29,698,621 |
| Series C | ||
| 4.75%, due 10/1/50 | 10,335,000 | 11,772,603 |
| New Jersey Transportation Trust Fund Authority, Transportation System, Revenue Bonds | ||
| Series C, Insured: NATL-RE | ||
| (zero coupon), due 12/15/30 | 20,000,000 | 16,737,832 |
| Series C, Insured: AGM | ||
| (zero coupon), due 12/15/34 | 30,000,000 | 22,707,153 |
| Series A | ||
| 5.00%, due 6/15/21 | 2,195,000 | 2,206,885 |
| Series A | ||
| 5.00%, due 12/15/26 | 4,500,000 | 5,518,957 |
| Series BB | ||
| 5.00%, due 6/15/44 | 11,255,000 | 13,665,595 |
| Series AA | ||
| 5.00%, due 6/15/46 | 7,440,000 | 9,005,870 |
| Series AA | ||
| 5.25%, due 6/15/43 | 10,205,000 | 12,554,401 |
| New Jersey Transportation Trust Fund Authority, Federal Highway Reimbursement, Revenue Bonds | ||
| Series A | ||
| 5.00%, due 6/15/28 | 4,800,000 | 5,760,062 |
| Series A | ||
| 5.00%, due 6/15/29 | 8,380,000 | 9,998,351 |
| New Jersey Transportation Trust Fund Authority, Transportation Program, Revenue Bonds | ||
| Series AA | ||
| 5.00%, due 6/15/44 | 13,255,000 | 14,303,350 |
| New Jersey Turnpike Authority, Revenue Bonds | ||
| Series E | ||
| 5.00%, due 1/1/45 | 2,000,000 | 2,298,295 |
| Principal Amount | Value | |
| New Jersey (continued) | ||
| Newark Housing Authority Scholarship Foundation A New Jersey Non (The), Police Facility, Revenue Bonds | ||
| Insured: AGM MUN GOVT GTD | ||
| 4.00%, due 12/1/27 | $ 500,000 | $ 584,639 |
| Insured: AGM MUN GOVT GTD | ||
| 4.00%, due 12/1/29 | 250,000 | 288,670 |
| Insured: AGM MUN GOVT GTD | ||
| 4.00%, due 12/1/31 | 225,000 | 257,898 |
| Insured: AGM MUN GOVT GTD | ||
| 5.00%, due 12/1/28 | 750,000 | 923,001 |
| Insured: AGM MUN GOVT GTD | ||
| 5.00%, due 12/1/38 | 1,740,000 | 2,103,291 |
| South Jersey Transportation Authority, Revenue Bonds | ||
| Series A, Insured: AGM | ||
| 5.00%, due 11/1/31 | 1,750,000 | 2,267,264 |
| Series A, Insured: AGM | ||
| 5.00%, due 11/1/32 | 1,500,000 | 1,936,512 |
| Series A, Insured: BAM | ||
| 5.00%, due 11/1/45 | 2,000,000 | 2,522,878 |
| State of New Jersey, Unlimited General Obligation | ||
| 2.00%, due 6/1/32 | 3,500,000 | 3,522,317 |
| 2.00%, due 6/1/34 | 13,055,000 | 12,873,558 |
| State of New Jersey, COVID-19 General Obligation Emergency Bonds, Unlimited General Obligation | ||
| Series A | ||
| 4.00%, due 6/1/30 | 32,060,000 | 39,373,219 |
| Series A | ||
| 4.00%, due 6/1/31 | 31,800,000 | 39,508,918 |
| Series A | ||
| 5.00%, due 6/1/28 | 15,000,000 | 19,153,141 |
| Series A | ||
| 5.00%, due 6/1/29 | 10,675,000 | 13,911,796 |
| State of New Jersey, Various Purposes, Unlimited General Obligation | ||
| 5.00%, due 6/1/40 | 5,000,000 | 6,133,933 |
| 5.00%, due 6/1/41 | 11,500,000 | 14,079,394 |
| 5.00%, due 6/1/42 | 10,000,000 | 12,217,771 |
| Tobacco Settlement Financing Corp., Revenue Bonds | ||
| Series A | ||
| 5.00%, due 6/1/31 | 3,000,000 | 3,731,611 |
| Principal Amount | Value | |
| Long-Term Municipal Bonds (continued) | ||
| New Jersey (continued) | ||
| Tobacco Settlement Financing Corp., Revenue Bonds (continued) | ||
| Series A | ||
| 5.00%, due 6/1/33 | $ 6,500,000 | $ 8,024,521 |
| Series A | ||
| 5.00%, due 6/1/34 | 1,500,000 | 1,846,165 |
| Series A | ||
| 5.00%, due 6/1/36 | 6,000,000 | 7,338,422 |
| 421,178,591 | ||
| New Mexico 0.1% | ||
| City of Albuquerque NM, Gross Receipts Lodgers Tax, Revenue Bonds | ||
| Series A | ||
| 4.00%, due 7/1/36 | 2,490,000 | 2,984,277 |
| New Mexico Hospital Equipment Loan Council, Presbyterian Healthcare Services, Revenue Bonds | ||
| Series A | ||
| 5.00%, due 8/1/44 | 5,000,000 | 6,226,605 |
| 9,210,882 | ||
| New York 20.7% | ||
| Build NYC Resource Corp., Royal Charter Properties, Inc., Revenue Bonds | ||
| Insured: AGM | ||
| 5.00%, due 12/15/21 | 1,075,000 | 1,105,488 |
| City of New York NY, Unlimited General Obligation | ||
| Series A-1 | ||
| 3.00%, due 8/1/36 | 9,520,000 | 10,278,583 |
| Series A, A-1 | ||
| 4.00%, due 8/1/38 | 10,000,000 | 11,648,428 |
| Series D-1, Insured: BAM | ||
| 4.00%, due 3/1/41 | 12,500,000 | 14,660,560 |
| Series C | ||
| 4.00%, due 8/1/41 | 2,300,000 | 2,700,880 |
| Series D-1, Insured: BAM | ||
| 4.00%, due 3/1/50 | 22,760,000 | 26,310,517 |
| Series I | ||
| 5.00%, due 8/1/23 | 3,675,000 | 3,898,932 |
| Series A-1 | ||
| 5.00%, due 8/1/39 | 4,000,000 | 5,075,122 |
| Principal Amount | Value | |
| New York (continued) | ||
| City of New York NY, Unlimited General Obligation (continued) | ||
| Series B-1 | ||
| 5.00%, due 10/1/42 | $ 2,870,000 | $ 3,629,502 |
| Series F-1 | ||
| 5.00%, due 4/1/43 | 7,455,000 | 9,092,976 |
| Series B-1 | ||
| 5.00%, due 10/1/43 | 3,555,000 | 4,486,505 |
| Series B-1 | ||
| 5.25%, due 10/1/32 | 20,000,000 | 24,876,108 |
| County of Nassau, Limited General Obligation | ||
| Series C, Insured: BAM | ||
| 5.00%, due 4/1/37 | 2,525,000 | 2,996,474 |
| Series B, Insured: AGM | ||
| 5.00%, due 4/1/44 | 5,000,000 | 6,323,283 |
| County of Nassau NY, Limited General Obligation | ||
| Series A | ||
| 2.00%, due 12/10/21 | 50,000,000 | 50,560,120 |
| County of Suffolk NY, Limited General Obligation | ||
| Series I | ||
| 2.00%, due 7/22/21 | 29,000,000 | 29,113,787 |
| County of Suffolk NY, Public Improvement, Limited General Obligation | ||
| Series B, Insured: AGM | ||
| 3.00%, due 10/15/31 | 4,460,000 | 4,767,977 |
| Series B, Insured: AGM | ||
| 5.00%, due 10/15/28 | 4,020,000 | 5,095,624 |
| Long Island Power Authority, Revenue Bonds | ||
| Series A | ||
| 4.00%, due 9/1/34 | 5,000,000 | 5,891,019 |
| Series A, Insured: BAM | ||
| 5.00%, due 9/1/39 | 10,000,000 | 11,350,763 |
| Series A, Insured: BAM | ||
| 5.00%, due 9/1/44 | 10,000,000 | 11,294,482 |
| Series B | ||
| 5.00%, due 9/1/45 | 8,970,000 | 10,382,405 |
| Long Island Power Authority, Electric System, Revenue Bonds | ||
| 5.00%, due 9/1/39 | 1,875,000 | 2,349,270 |
| Metropolitan Transportation Authority, Revenue Bonds | ||
| Insured: AGM | ||
| 0.557%, due 11/1/32 (d)(e) | 28,000,000 | 28,005,379 |
| 34 | MainStay MacKay Tax Free Bond Fund |
| Principal Amount | Value | |
| Long-Term Municipal Bonds (continued) | ||
| New York (continued) | ||
| Metropolitan Transportation Authority, Revenue Bonds (continued) | ||
| Series A-2S | ||
| 4.00%, due 2/1/22 | $ 12,500,000 | $ 12,840,345 |
| Series D-1 | ||
| 5.00%, due 9/1/22 | 23,115,000 | 24,556,780 |
| Series D-1 | ||
| 5.00%, due 11/15/26 | 2,785,000 | 3,314,418 |
| Series D | ||
| 5.00%, due 11/15/26 | 2,000,000 | 2,131,436 |
| Series A-1 | ||
| 5.00%, due 11/15/37 | 1,300,000 | 1,480,676 |
| Series C | ||
| 5.00%, due 11/15/38 | 7,500,000 | 8,055,046 |
| 5.00%, due 11/15/38 | 5,385,000 | 5,880,068 |
| Series A-1 | ||
| 5.00%, due 11/15/40 | 4,890,000 | 5,552,863 |
| Series C | ||
| 5.00%, due 11/15/42 | 10,000,000 | 10,721,589 |
| Series E | ||
| 5.00%, due 11/15/43 | 2,500,000 | 2,722,788 |
| Series B | ||
| 5.00%, due 11/15/43 | 1,575,000 | 1,688,015 |
| Series C-1 | ||
| 5.25%, due 11/15/29 | 2,230,000 | 2,639,050 |
| Series B | ||
| 5.25%, due 11/15/35 | 2,870,000 | 3,208,776 |
| Metropolitan Transportation Authority, Green Bond, Revenue Bonds | ||
| Series A-1, Insured: AGM | ||
| 4.00%, due 11/15/42 | 7,500,000 | 8,680,773 |
| Series A-1, Insured: AGM | ||
| 4.00%, due 11/15/44 | 4,845,000 | 5,578,666 |
| Series C, Insured: AGM | ||
| 4.00%, due 11/15/48 | 10,715,000 | 12,202,680 |
| Series A-1 | ||
| 4.00%, due 11/15/48 | 9,060,000 | 10,380,160 |
| Series A-1 | ||
| 5.00%, due 11/15/41 | 2,910,000 | 3,377,903 |
| Series D | ||
| 5.00%, due 11/15/45 | 12,500,000 | 15,544,346 |
| Principal Amount | Value | |
| New York (continued) | ||
| Metropolitan Transportation Authority, Climate Certified Green Bond, Revenue Bonds | ||
| Series C, Insured: AGM | ||
| 4.00%, due 11/15/47 | $ 1,880,000 | $ 2,143,347 |
| Series C, Insured: BAM | ||
| 5.00%, due 11/15/44 | 14,845,000 | 18,347,875 |
| Metropolitan Transportation Authority, Dedicated Tax Fund, Revenue Bonds | ||
| Series A | ||
| 5.00%, due 3/1/22 | 39,840,000 | 41,436,166 |
| Series A | ||
| 5.00%, due 11/15/26 | 2,095,000 | 2,590,882 |
| Series A | ||
| 5.25%, due 11/15/27 | 2,295,000 | 2,852,084 |
| Series A | ||
| 5.25%, due 11/15/33 | 8,750,000 | 10,783,850 |
| Series A | ||
| 5.25%, due 11/15/34 | 10,000,000 | 12,256,933 |
| Series A | ||
| 5.25%, due 11/15/36 | 10,515,000 | 12,824,916 |
| Metropolitan Transportation Authority, Dedicated Tax Fund, Green Bond, Revenue Bonds | ||
| Series B-2 | ||
| 5.00%, due 11/15/28 | 3,040,000 | 3,828,613 |
| Series B-2 | ||
| 5.00%, due 11/15/33 | 1,735,000 | 2,144,122 |
| Series B-1 | ||
| 5.00%, due 11/15/36 | 13,340,000 | 15,992,610 |
| New York City Housing Development Corp., Green Bond, Revenue Bonds | ||
| Insured: FHA 542(C) | ||
| 2.25%, due 11/1/36 | 4,700,000 | 4,723,470 |
| New York City Housing Development Corp., Multi-Family Housing, Green Bond, Revenue Bonds | ||
| Series J | ||
| 3.05%, due 11/1/49 | 12,790,000 | 13,333,998 |
| Series G-1-B | ||
| 3.05%, due 5/1/50 | 24,270,000 | 25,172,885 |
| Series J | ||
| 3.15%, due 11/1/54 | 23,145,000 | 24,190,839 |
| Principal Amount | Value | |
| Long-Term Municipal Bonds (continued) | ||
| New York (continued) | ||
| New York City Housing Development Corp., Multi-Family Housing, Revenue Bonds | ||
| Series E-1-C | ||
| 4.95%, due 11/1/46 | $ 4,625,000 | $ 5,372,080 |
| New York City Industrial Development Agency, Queens Baseball Stadium Project, Revenue Bonds | ||
| Insured: AGM | ||
| 3.00%, due 1/1/39 | 4,000,000 | 4,302,308 |
| New York City Industrial Development Agency, Yankee Stadium Project, Revenue Bonds | ||
| Series A, Insured: AGM | ||
| 4.00%, due 3/1/31 | 4,075,000 | 4,984,179 |
| New York City Transitional Finance Authority, Future Tax Secured, Revenue Bonds | ||
| Series A | ||
| 3.00%, due 11/1/37 | 10,000,000 | 10,807,732 |
| Series B-1 | ||
| 4.00%, due 11/1/37 | 30,300,000 | 36,082,240 |
| Series C | ||
| 4.00%, due 5/1/38 | 14,250,000 | 17,061,129 |
| Series C-1 | ||
| 4.00%, due 11/1/38 | 11,380,000 | 13,389,421 |
| Series B-1 | ||
| 4.00%, due 11/1/38 | 7,875,000 | 9,346,660 |
| Series C | ||
| 4.00%, due 5/1/40 | 6,835,000 | 8,110,830 |
| Series B-1 | ||
| 4.00%, due 11/1/41 | 11,500,000 | 13,542,938 |
| Series C | ||
| 4.00%, due 5/1/42 | 10,000,000 | 11,788,647 |
| Series B-1 | ||
| 4.00%, due 11/1/42 | 12,315,000 | 14,468,341 |
| Series F-1 | ||
| 5.00%, due 5/1/32 | 4,000,000 | 4,940,117 |
| Series A-1 | ||
| 5.00%, due 5/1/33 | 10,000,000 | 12,055,205 |
| Series A-2 | ||
| 5.00%, due 8/1/34 | 7,795,000 | 9,678,808 |
| Series E-1 | ||
| 5.00%, due 2/1/37 | 5,000,000 | 5,979,059 |
| Series E-1 | ||
| 5.00%, due 2/1/41 | 2,500,000 | 2,874,214 |
| Principal Amount | Value | |
| New York (continued) | ||
| New York City Transitional Finance Authority, Future Tax Secured, Revenue Bonds (continued) | ||
| Series F-1 | ||
| 5.00%, due 5/1/42 | $ 11,500,000 | $ 14,132,111 |
| New York City Transitional Finance Authority Building Aid, Revenue Bonds | ||
| Series S-1, Insured: State Aid Withholding | ||
| 5.00%, due 7/15/33 | 6,060,000 | 7,034,607 |
| Series S-2, Insured: State Aid Withholding | ||
| 5.00%, due 7/15/34 | 3,000,000 | 3,536,115 |
| Series S-1, Insured: State Aid Withholding | ||
| 5.00%, due 7/15/36 | 10,000,000 | 11,572,433 |
| Series S-1, Insured: State Aid Withholding | ||
| 5.00%, due 7/15/43 | 8,555,000 | 10,121,294 |
| New York City Transitional Finance Authority Future Tax Secured, Revenue Bonds | ||
| Series E-1 | ||
| 4.00%, due 2/1/42 | 6,500,000 | 7,689,764 |
| Series F-1 | ||
| 5.00%, due 2/1/34 | 8,165,000 | 8,824,072 |
| Series A-2 | ||
| 5.00%, due 5/1/36 | 5,000,000 | 6,344,470 |
| New York City Water & Sewer System, Second General Resolution, Revenue Bonds | ||
| Series DD-2 | ||
| 3.50%, due 6/15/40 | 2,585,000 | 2,883,216 |
| Series FF-2 | ||
| 4.00%, due 6/15/41 | 2,500,000 | 2,947,159 |
| Series DD-3 | ||
| 4.00%, due 6/15/42 | 5,000,000 | 5,924,292 |
| Series AA-2 | ||
| 4.00%, due 6/15/43 | 4,695,000 | 5,588,990 |
| Series EE | ||
| 5.00%, due 6/15/40 | 15,585,000 | 19,349,200 |
| Series EE | ||
| 5.00%, due 6/15/47 | 11,710,000 | 12,765,529 |
| Series CC-1 | ||
| 5.00%, due 6/15/47 | 10,000,000 | 11,297,721 |
| 36 | MainStay MacKay Tax Free Bond Fund |
| Principal Amount | Value | |
| Long-Term Municipal Bonds (continued) | ||
| New York (continued) | ||
| New York City Water & Sewer System, Revenue Bonds | ||
| Series EE | ||
| 4.25%, due 6/15/47 | $ 10,000,000 | $ 10,713,235 |
| New York Convention Center Development Corp., Hotel Unit Fee, Revenue Bonds, Sub. Lien | ||
| Series B, Insured: BAM | ||
| (zero coupon), due 11/15/36 | 5,050,000 | 3,556,068 |
| New York Liberty Development Corp., Bank of America Tower at One Bryant Park Project, Revenue Bonds | ||
| 2.45%, due 9/15/69 | 12,925,000 | 13,440,704 |
| New York Liberty Development Corp., Revenue Bonds | ||
| Series 1WTC | ||
| 5.00%, due 12/15/41 | 12,315,000 | 12,644,191 |
| New York Liberty Development Corp., World Trade Center Project, Revenue Bonds | ||
| 5.75%, due 11/15/51 | 18,940,000 | 19,468,303 |
| New York State Dormitory Authority, Revenue Bonds | ||
| Series A | ||
| 3.00%, due 3/15/38 | 10,000,000 | 10,768,255 |
| Series A | ||
| 4.00%, due 3/15/40 | 28,120,000 | 33,481,458 |
| New York State Dormitory Authority, State Personal Income Tax, Revenue Bonds | ||
| Series D | ||
| 4.00%, due 2/15/39 | 10,480,000 | 12,303,349 |
| Series D | ||
| 4.00%, due 2/15/40 | 3,615,000 | 4,235,228 |
| Series D | ||
| 4.00%, due 2/15/47 | 25,250,000 | 29,155,753 |
| Series A | ||
| 5.00%, due 3/15/31 | 13,000,000 | 17,311,623 |
| Series E | ||
| 5.00%, due 3/15/34 | 4,190,000 | 4,974,309 |
| Series B | ||
| 5.00%, due 2/15/38 | 13,490,000 | 16,573,513 |
| Series D | ||
| 5.00%, due 2/15/48 | 10,200,000 | 12,787,199 |
| Series A | ||
| 5.25%, due 3/15/39 | 1,840,000 | 2,355,155 |
| Principal Amount | Value | |
| New York (continued) | ||
| New York State Dormitory Authority, Sales Tax, Revenue Bonds | ||
| Series C | ||
| 4.00%, due 3/15/44 | $ 11,385,000 | $ 12,874,702 |
| Series A | ||
| 5.00%, due 3/15/40 | 8,280,000 | 10,023,067 |
| Series A | ||
| 5.00%, due 3/15/40 | 23,580,000 | 29,127,504 |
| Series E | ||
| 5.00%, due 3/15/40 | 5,000,000 | 6,257,707 |
| Series A | ||
| 5.00%, due 3/15/43 | 10,000,000 | 12,279,374 |
| Series A | ||
| 5.00%, due 3/15/44 | 5,000,000 | 6,011,910 |
| Series A | ||
| 5.00%, due 3/15/45 | 3,000,000 | 3,670,144 |
| New York State Dormitory Authority, School District Revenue Financing Program, Revenue Bonds | ||
| Series A, Insured: AGM | ||
| 5.00%, due 10/1/33 | 750,000 | 946,974 |
| Series A, Insured: AGM | ||
| 5.00%, due 10/1/34 | 3,700,000 | 4,651,696 |
| New York State Dormitory Authority, University Facilities, Revenue Bonds | ||
| Series A | ||
| 5.00%, due 7/1/36 | 1,000,000 | 1,217,952 |
| Series A | ||
| 5.00%, due 7/1/38 | 1,000,000 | 1,211,524 |
| New York State Thruway Authority, Revenue Bonds | ||
| Series L | ||
| 3.50%, due 1/1/37 | 2,500,000 | 2,761,125 |
| Series N | ||
| 4.00%, due 1/1/41 | 9,000,000 | 10,572,455 |
| Series N | ||
| 4.00%, due 1/1/45 | 5,000,000 | 5,817,616 |
| Series L | ||
| 5.00%, due 1/1/31 | 3,550,000 | 4,453,692 |
| Series L | ||
| 5.00%, due 1/1/34 | 2,430,000 | 3,016,545 |
| Series N | ||
| 5.00%, due 1/1/34 | 10,855,000 | 14,118,229 |
| Series N | ||
| 5.00%, due 1/1/35 | 5,000,000 | 6,482,945 |
| Series N | ||
| 5.00%, due 1/1/36 | 16,260,000 | 21,026,556 |
| Principal Amount | Value | |
| Long-Term Municipal Bonds (continued) | ||
| New York (continued) | ||
| New York State Thruway Authority, Revenue Bonds (continued) | ||
| Series N | ||
| 5.00%, due 1/1/38 | $ 6,095,000 | $ 7,818,252 |
| New York State Thruway Authority, Junior Indebtedness Obligations, Revenue Bonds | ||
| Series B | ||
| 4.00%, due 1/1/39 | 11,555,000 | 13,383,757 |
| Series B | ||
| 4.00%, due 1/1/45 | 8,900,000 | 10,172,308 |
| Series B | ||
| 4.00%, due 1/1/50 | 5,500,000 | 6,255,492 |
| New York State Thruway Authority, General Revenue Junior Indebtedness Obligation, Revenue Bonds | ||
| Series B, Insured: AGM | ||
| 4.00%, due 1/1/50 | 10,940,000 | 12,591,380 |
| New York State Urban Development Corp., State Personal Income Tax, Revenue Bonds | ||
| Series C | ||
| 3.00%, due 3/15/40 | 18,965,000 | 20,285,907 |
| Series E | ||
| 4.00%, due 3/15/34 | 15,000,000 | 17,998,948 |
| Series C | ||
| 4.00%, due 3/15/42 | 4,635,000 | 5,455,765 |
| Series C | ||
| 4.00%, due 3/15/49 | 4,000,000 | 4,652,841 |
| Series A | ||
| 5.00%, due 3/15/30 | 12,350,000 | 14,827,010 |
| Series A | ||
| 5.00%, due 3/15/43 | 10,360,000 | 12,794,732 |
| 5.00%, due 3/15/47 | 5,000,000 | 6,340,688 |
| New York State Urban Development Corp., Sales Tax, Revenue Bonds | ||
| Series A | ||
| 5.00%, due 3/15/41 | 10,000,000 | 12,608,940 |
| New York Transportation Development Corp., Laguardia Airport Terminal B Redevelopment Project, Revenue Bonds (c) | ||
| Series A, Insured: AGM | ||
| 4.00%, due 7/1/31 | 10,925,000 | 12,022,314 |
| Series A, Insured: AGM | ||
| 4.00%, due 7/1/36 | 24,800,000 | 27,119,373 |
| Principal Amount | Value | |
| New York (continued) | ||
| Nuveen New York Quality Municipal Income Fund, Preferred Shares | ||
| 0.41%, due 5/1/47 (b)(c)(e)(f) | $ 20,000,000 | $ 20,000,000 |
| Onondaga County Trust for Cultural Resources, Syracuse University Project, Revenue Bonds | ||
| 4.00%, due 12/1/49 | 3,000,000 | 3,497,876 |
| 5.00%, due 12/1/43 | 18,995,000 | 24,212,153 |
| Port Authority of New York & New Jersey, Revenue Bonds | ||
| Series 222 | ||
| 4.00%, due 7/15/37 | 4,250,000 | 5,075,610 |
| Series 222 | ||
| 4.00%, due 7/15/39 | 8,915,000 | 10,573,090 |
| Series 222 | ||
| 4.00%, due 7/15/40 | 2,000,000 | 2,368,726 |
| 4.00%, due 11/1/41 (c) | 5,395,000 | 6,224,488 |
| Series 209 | ||
| 5.00%, due 7/15/30 | 2,475,000 | 3,168,240 |
| Port Authority of New York & New Jersey, Consolidated 218th, Revenue Bonds (c) | ||
| Series 218 | ||
| 4.00%, due 11/1/37 | 1,720,000 | 2,011,014 |
| Series 218 | ||
| 5.00%, due 11/1/44 | 3,190,000 | 3,947,010 |
| Series 218 | ||
| 5.00%, due 11/1/49 | 3,500,000 | 4,312,372 |
| Port Authority of New York & New Jersey, Consolidated 214th, Revenue Bonds | ||
| Series 214 | ||
| 4.00%, due 9/1/43 (c) | 11,355,000 | 13,016,108 |
| Port Authority of New York & New Jersey, Consolidated 172nd, Revenue Bonds, Second Series | ||
| Series One Hundered Seventy - Second Series | ||
| 4.25%, due 10/1/32 | 5,000,000 | 5,165,255 |
| Port Authority of New York & New Jersey, Consolidated 197th, Revenue Bonds (c) | ||
| Series 197 | ||
| 5.00%, due 11/15/34 | 12,500,000 | 15,168,400 |
| Series 197 | ||
| 5.00%, due 11/15/35 | 10,000,000 | 12,110,750 |
| 38 | MainStay MacKay Tax Free Bond Fund |
| Principal Amount | Value | |
| Long-Term Municipal Bonds (continued) | ||
| New York (continued) | ||
| Port Authority of New York & New Jersey, Consolidated 221st, Revenue Bonds | ||
| Series 221 | ||
| 5.00%, due 7/15/35 (c) | $ 3,000,000 | $ 3,814,723 |
| Rensselaer City School District, Certificate Participation | ||
| Insured: AGM ST AID WITHHLDG | ||
| 5.00%, due 6/1/30 | 1,880,000 | 2,252,951 |
| Insured: AGM ST AID WITHHLDG | ||
| 5.00%, due 6/1/32 | 2,000,000 | 2,393,468 |
| Tender Option Bond Trust Receipts/Certificates, Revenue Bonds | ||
| Series 2016-XM0454 | ||
| 0.14%, due 9/15/40 (d)(e)(f) | 5,000,000 | 5,000,000 |
| Triborough Bridge & Tunnel Authority, Revenue Bonds | ||
| Series B | ||
| 5.00%, due 11/15/35 | 8,560,000 | 10,414,196 |
| Series B | ||
| 5.00%, due 11/15/38 | 3,600,000 | 4,382,872 |
| Series A | ||
| 5.00%, due 11/15/43 | 6,000,000 | 7,478,661 |
| Series A | ||
| 5.00%, due 11/15/45 | 12,540,000 | 15,273,518 |
| Triborough Bridge & Tunnel Authority, Revenue Bonds, Senior Lien | ||
| Series A-1 | ||
| 5.00%, due 5/15/51 | 20,000,000 | 25,760,098 |
| Triborough Bridge & Tunnel Authority, MTA Bridges & Tunnels, Revenue Bonds | ||
| Series A | ||
| 5.00%, due 11/15/46 | 7,855,000 | 9,559,356 |
| Series A | ||
| 5.00%, due 11/15/49 | 17,500,000 | 21,620,574 |
| Series A | ||
| 5.00%, due 11/15/49 | 33,500,000 | 42,469,374 |
| TSASC, Inc., Tobacco Settlement Bonds, Revenue Bonds | ||
| Series A | ||
| 5.00%, due 6/1/34 | 6,990,000 | 8,441,786 |
| Series A | ||
| 5.00%, due 6/1/35 | 2,865,000 | 3,452,761 |
| Principal Amount | Value | |
| New York (continued) | ||
| West Islip Union Free School District, Limited General Obligation | ||
| Insured: State Aid Withholding | ||
| 1.75%, due 6/21/21 | $ 5,000,000 | $ 5,009,449 |
| 1,776,660,679 | ||
| North Dakota 0.1% | ||
| State Board of Higher Education of the State of North Dakota, University of North Dakota Housing & Auxiliary Facilities, Revenue Bonds | ||
| Series A, Insured: AGM | ||
| 4.00%, due 4/1/44 | 4,000,000 | 4,606,198 |
| Ohio 0.6% | ||
| Akron Bath Copley Joint Township Hospital District, Children's Hospital Medical Center of Akron, Revenue Bonds | ||
| 5.00%, due 11/15/42 | 7,000,000 | 7,280,367 |
| Buckeye Tobacco Settlement Financing Authority, Revenue Bonds, Senior Lien | ||
| Series A-2 | ||
| 4.00%, due 6/1/37 | 2,000,000 | 2,353,819 |
| Series A-2 | ||
| 5.00%, due 6/1/36 | 1,000,000 | 1,267,148 |
| Clermont County Port Authority, West Clermont Local School District Project, Revenue Bonds | ||
| Insured: BAM | ||
| 5.00%, due 12/1/32 | 2,200,000 | 2,580,039 |
| Insured: BAM | ||
| 5.00%, due 12/1/33 | 1,335,000 | 1,561,710 |
| Cleveland-Cuyahoga County Port Authority, Annual Appropriation Bonds, Revenue Bonds | ||
| 6.00%, due 11/15/25 | 1,980,000 | 1,988,514 |
| County of Hamilton OH, Christ Hospital Project, Revenue Bonds | ||
| 5.50%, due 6/1/42 | 2,000,000 | 2,114,887 |
| Ohio Higher Educational Facility Commission, Oberlin College Project, Revenue Bonds | ||
| 5.00%, due 10/1/31 | 2,800,000 | 3,093,374 |
| Principal Amount | Value | |
| Long-Term Municipal Bonds (continued) | ||
| Ohio (continued) | ||
| Ohio Housing Finance Agency, Residential Mortgage, Revenue Bonds | ||
| Series A, Insured: GNMA / FNMA / FHLMC | ||
| 4.50%, due 9/1/48 | $ 4,855,000 | $ 5,432,055 |
| State of Ohio, Cleveland Clinic Health System Obligated Group, Revenue Bonds | ||
| 4.00%, due 1/1/46 | 11,000,000 | 12,809,905 |
| University of Cincinnati, Revenue Bonds | ||
| Series A | ||
| 5.00%, due 6/1/45 | 10,000,000 | 12,134,246 |
| 52,616,064 | ||
| Oklahoma 0.5% | ||
| Garfield County Educational Facilities Authority, Enid Public Schools Project, Revenue Bonds | ||
| Series A | ||
| 5.00%, due 9/1/26 | 1,800,000 | 2,206,578 |
| Series A | ||
| 5.00%, due 9/1/27 | 3,780,000 | 4,606,009 |
| Series A | ||
| 5.00%, due 9/1/28 | 5,000,000 | 6,061,610 |
| Series A | ||
| 5.00%, due 9/1/29 | 4,620,000 | 5,581,318 |
| Lincoln County Educational Facilities Authority, Stroud Public Schools Project, Revenue Bonds | ||
| 5.00%, due 9/1/28 | 3,200,000 | 3,879,430 |
| 5.00%, due 9/1/29 | 2,370,000 | 2,863,143 |
| Oklahoma Housing Finance Agency, Revenue Bonds | ||
| Series A | ||
| 4.75%, due 9/1/48 | 2,620,000 | 2,965,453 |
| Oklahoma Municipal Power Authority, Power Supply System, Revenue Bonds | ||
| Series A | ||
| 4.00%, due 1/1/47 | 7,650,000 | 7,920,707 |
| Principal Amount | Value | |
| Oklahoma (continued) | ||
| Weatherford Industrial Trust, Custer County Independent School District No. 26 Weatherford, Revenue Bonds | ||
| 5.00%, due 3/1/31 | $ 1,820,000 | $ 2,315,568 |
| 5.00%, due 3/1/33 | 2,500,000 | 3,157,107 |
| 41,556,923 | ||
| Oregon 0.3% | ||
| Port of Portland Airport OR, Airport, Revenue Bonds | ||
| Series A | ||
| 5.00%, due 7/1/37 (c) | 10,550,000 | 13,300,220 |
| State of Oregon Housing & Community Services Department, Single Family Mortgage Program, Revenue Bonds | ||
| Series C | ||
| 4.50%, due 7/1/49 | 8,665,000 | 9,562,851 |
| 22,863,071 | ||
| Pennsylvania 2.2% | ||
| City of Philadelphia PA, Unlimited General Obligation | ||
| Series B | ||
| 5.00%, due 2/1/38 | 5,650,000 | 7,143,703 |
| City of Philadelphia PA, Water & Wastewater, Revenue Bonds | ||
| Series A | ||
| 5.00%, due 10/1/47 | 12,000,000 | 14,604,617 |
| Commonwealth Financing Authority, Tobacco Master Settlement Payment, Revenue Bonds | ||
| Insured: AGM | ||
| 4.00%, due 6/1/39 | 6,000,000 | 6,858,716 |
| Insured: BAM | ||
| 5.00%, due 6/1/31 | 10,000,000 | 12,462,290 |
| Commonwealth of Pennsylvania, Unlimited General Obligation, First Series | ||
| Series First | ||
| 4.00%, due 3/1/35 | 5,000,000 | 5,839,105 |
| DuBois Hospital Authority, Penn Highlands Healthcare Obligated Group, Revenue Bonds | ||
| 4.00%, due 7/15/50 | 6,000,000 | 6,659,264 |
| Monroeville Finance Authority, UPMC Obligated Group, Revenue Bonds | ||
| 4.25%, due 2/15/42 | 12,500,000 | 13,047,992 |
| 40 | MainStay MacKay Tax Free Bond Fund |
| Principal Amount | Value | |
| Long-Term Municipal Bonds (continued) | ||
| Pennsylvania (continued) | ||
| Pennsylvania Economic Development Financing Authority, UPMC Obligated Group, Revenue Bonds | ||
| Series A | ||
| 4.00%, due 11/15/36 | $ 4,965,000 | $ 5,757,472 |
| Series A | ||
| 4.00%, due 11/15/42 | 7,500,000 | 8,559,929 |
| Pennsylvania Higher Educational Facilities Authority, University of Pennsylvania Health System, Revenue Bonds | ||
| 4.00%, due 8/15/44 | 13,355,000 | 15,620,447 |
| Pennsylvania Turnpike Commission, Revenue Bonds | ||
| Series A, Insured: BAM | ||
| 5.00%, due 12/1/44 | 10,000,000 | 12,517,350 |
| Series A-1 | ||
| 5.00%, due 12/1/46 | 5,705,000 | 6,771,792 |
| Philadelphia Gas Works Co., 1998 General Ordinance, Revenue Bonds | ||
| Series 14T | ||
| 5.00%, due 10/1/31 | 2,300,000 | 2,786,574 |
| Pittsburgh Water & Sewer Authority, Revenue Bonds, First Lien | ||
| Series A, Insured: AGM | ||
| 5.00%, due 9/1/44 | 4,530,000 | 5,630,860 |
| School District of Philadelphia (The), Revenue Notes | ||
| Series A | ||
| 4.00%, due 6/30/21 | 15,000,000 | 15,092,335 |
| State Public School Building Authority, Philadelphia Community College, Revenue Bonds | ||
| Series A, Insured: BAM | ||
| 5.00%, due 6/15/28 | 5,505,000 | 6,409,587 |
| State Public School Building Authority, School District of Philadelphia (The), Revenue Bonds | ||
| Series A, Insured: AGM ST AID WITHHLDG | ||
| 5.00%, due 6/1/31 | 30,000,000 | 36,480,909 |
| Principal Amount | Value | |
| Pennsylvania (continued) | ||
| Upper Merion Area School District, Limited General Obligation | ||
| Series A, Insured: State Aid Withholding | ||
| 3.00%, due 1/15/41 | $ 1,300,000 | $ 1,402,715 |
| Series A, Insured: State Aid Withholding | ||
| 3.00%, due 1/15/42 | 2,000,000 | 2,146,712 |
| Series A, Insured: State Aid Withholding | ||
| 3.00%, due 1/15/43 | 3,000,000 | 3,206,632 |
| 188,999,001 | ||
| Puerto Rico 1.3% | ||
| Commonwealth of Puerto Rico, Public Improvement, Unlimited General Obligation | ||
| Series A, Insured: AGC | ||
| 5.00%, due 7/1/26 | 575,000 | 591,036 |
| Series A, Insured: AGC | ||
| 5.00%, due 7/1/27 | 525,000 | 539,642 |
| Series A-4, Insured: AGM | ||
| 5.00%, due 7/1/31 | 5,170,000 | 5,314,186 |
| Series A, Insured: AGM | ||
| 5.00%, due 7/1/35 | 35,025,000 | 36,438,350 |
| Series A, Insured: NATL-RE | ||
| 5.25%, due 7/1/21 | 440,000 | 443,523 |
| Series C, Insured: AGM | ||
| 5.375%, due 7/1/28 | 700,000 | 720,335 |
| Series C, Insured: AGM | ||
| 5.75%, due 7/1/37 | 1,150,000 | 1,186,075 |
| Series C-9, Insured: NATL-RE | ||
| 6.00%, due 7/1/27 | 2,240,000 | 2,313,385 |
| Commonwealth of Puerto Rico, Unrefunded, Unlimited General Obligation | ||
| Series A, Insured: AGC | ||
| 5.00%, due 7/1/34 | 285,000 | 292,948 |
| Series B, Insured: AGC | ||
| 5.25%, due 7/1/32 | 500,000 | 514,525 |
| Puerto Rico Commonwealth Aqueduct & Sewer Authority, Revenue Bonds, Senior Lien | ||
| Series A, Insured: AGC | ||
| 6.125%, due 7/1/24 | 545,000 | 586,759 |
| Principal Amount | Value | |
| Long-Term Municipal Bonds (continued) | ||
| Puerto Rico (continued) | ||
| Puerto Rico Convention Center District Authority, Hotel Occupancy Tax, Revenue Bonds | ||
| Series A, Insured: AGC | ||
| 4.50%, due 7/1/36 | $ 4,855,000 | $ 4,946,465 |
| Puerto Rico Electric Power Authority, Revenue Bonds | ||
| Series DDD, Insured: AGM | ||
| 3.625%, due 7/1/23 | 3,115,000 | 3,122,130 |
| Series UU, Insured: AGC | ||
| 4.25%, due 7/1/27 | 2,345,000 | 2,350,784 |
| Series NN, Insured: NATL-RE | ||
| 4.75%, due 7/1/33 | 1,140,000 | 1,153,685 |
| Series RR, Insured: NATL-RE | ||
| 5.00%, due 7/1/22 | 1,450,000 | 1,470,967 |
| Series PP, Insured: NATL-RE | ||
| 5.00%, due 7/1/23 | 1,105,000 | 1,123,640 |
| Series SS, Insured: NATL-RE | ||
| 5.00%, due 7/1/23 | 825,000 | 838,917 |
| Series UU, Insured: AGM | ||
| 5.00%, due 7/1/23 | 2,290,000 | 2,353,866 |
| Series PP, Insured: NATL-RE | ||
| 5.00%, due 7/1/24 | 2,915,000 | 2,978,211 |
| Series UU, Insured: AGM | ||
| 5.00%, due 7/1/24 | 4,415,000 | 4,538,129 |
| Series TT, Insured: AGM | ||
| 5.00%, due 7/1/27 | 500,000 | 513,944 |
| Series SS, Insured: AGM | ||
| 5.00%, due 7/1/30 | 550,000 | 565,339 |
| Series VV, Insured: NATL-RE | ||
| 5.25%, due 7/1/26 | 1,875,000 | 2,068,631 |
| Series VV, Insured: NATL-RE | ||
| 5.25%, due 7/1/29 | 1,470,000 | 1,640,948 |
| Series VV, Insured: NATL-RE | ||
| 5.25%, due 7/1/32 | 1,225,000 | 1,371,047 |
| Series VV, Insured: NATL-RE | ||
| 5.25%, due 7/1/34 | 550,000 | 616,040 |
| Series VV, Insured: NATL-RE | ||
| 5.25%, due 7/1/35 | 120,000 | 134,238 |
| Puerto Rico Highway & Transportation Authority, Unrefunded, Revenue Bonds | ||
| Series D, Insured: AGM | ||
| 5.00%, due 7/1/27 | 2,240,000 | 2,302,471 |
| Series J, Insured: NATL-RE | ||
| 5.00%, due 7/1/29 | 650,000 | 667,225 |
| Principal Amount | Value | |
| Puerto Rico (continued) | ||
| Puerto Rico Highway & Transportation Authority, Revenue Bonds | ||
| Series L, Insured: NATL-RE | ||
| 5.25%, due 7/1/24 | $ 2,195,000 | $ 2,355,873 |
| Series N, Insured: NATL-RE | ||
| 5.25%, due 7/1/32 | 5,525,000 | 6,183,700 |
| Series N, Insured: NATL-RE | ||
| 5.25%, due 7/1/33 | 5,030,000 | 5,640,745 |
| Series E, Insured: AGM | ||
| 5.50%, due 7/1/21 | 670,000 | 674,952 |
| Puerto Rico Municipal Finance Agency, Revenue Bonds | ||
| Series A, Insured: AGM | ||
| 4.75%, due 8/1/22 | 820,000 | 829,179 |
| Series A, Insured: AGM | ||
| 5.00%, due 8/1/21 | 195,000 | 196,031 |
| Series A, Insured: AGM | ||
| 5.00%, due 8/1/27 | 290,000 | 298,088 |
| Series A, Insured: AGM | ||
| 5.00%, due 8/1/30 | 1,440,000 | 1,480,160 |
| Series C, Insured: AGC | ||
| 5.25%, due 8/1/23 | 340,000 | 368,390 |
| Puerto Rico Public Buildings Authority, Government Facilities, Revenue Bonds | ||
| Series F, Insured: NATL-RE XLCA-ICR COMWLT | ||
| 5.25%, due 7/1/23 | 265,000 | 280,076 |
| Series K, Insured: AGM ST GTD | ||
| 5.25%, due 7/1/27 | 1,150,000 | 1,183,407 |
| Series M-3, Insured: NATL COMMWLTH GTD | ||
| 6.00%, due 7/1/26 | 300,000 | 309,591 |
| Series M-3, Insured: NATL COMMWLTH GTD | ||
| 6.00%, due 7/1/27 | 7,465,000 | 7,709,561 |
| Puerto Rico Sales Tax Financing Corp., Revenue Bonds | ||
| Insured: BHAC | ||
| (zero coupon), due 8/1/54 | 98,098 | 20,603 |
| 111,227,797 | ||
| Rhode Island 0.2% | ||
| City of Cranston RI, Unlimited General Obligation | ||
| Series A, Insured: BAM | ||
| 5.00%, due 8/1/37 | 1,335,000 | 1,694,770 |
| 42 | MainStay MacKay Tax Free Bond Fund |
| Principal Amount | Value | |
| Long-Term Municipal Bonds (continued) | ||
| Rhode Island (continued) | ||
| Providence Public Building Authority, Various Capital Projects, Revenue Bonds | ||
| Series A, Insured: AGM | ||
| 5.875%, due 6/15/26 | $ 1,565,000 | $ 1,573,970 |
| Rhode Island Health and Educational Building Corp., Lifespan Obligated Group, Revenue Bonds | ||
| 5.00%, due 5/15/26 | 5,000,000 | 5,965,911 |
| Rhode Island Health and Educational Building Corp., Public Schools Financing Program, Revenue Bonds | ||
| Series B | ||
| 5.00%, due 5/15/33 | 1,045,000 | 1,330,117 |
| Series B | ||
| 5.00%, due 5/15/34 | 1,095,000 | 1,389,515 |
| Series B | ||
| 5.00%, due 5/15/35 | 1,150,000 | 1,456,640 |
| Series B | ||
| 5.00%, due 5/15/36 | 1,205,000 | 1,521,974 |
| Series B | ||
| 5.00%, due 5/15/37 | 1,265,000 | 1,593,080 |
| Rhode Island Housing and Mortgage Finance Corp., Homeownership Opportunity, Revenue Bonds | ||
| Series 69-B, Insured: GNMA / FNMA / FHLMC | ||
| 4.00%, due 10/1/48 | 4,390,000 | 4,863,500 |
| 21,389,477 | ||
| South Carolina 2.1% | ||
| Patriots Energy Group Financing Agency, Gas Supply, Revenue Bonds | ||
| Series A | ||
| 4.00%, due 10/1/48 (b) | 4,355,000 | 4,754,425 |
| Piedmont Municipal Power Agency, Revenue Bonds | ||
| Series C, Insured: AGC | ||
| 5.75%, due 1/1/34 | 10,345,000 | 10,427,821 |
| South Carolina Public Service Authority, Revenue Bonds | ||
| Series A | ||
| 3.00%, due 12/1/41 | 7,550,000 | 8,106,980 |
| Series A | ||
| 4.00%, due 12/1/40 | 7,750,000 | 9,162,977 |
| Principal Amount | Value | |
| South Carolina (continued) | ||
| South Carolina Public Service Authority, Revenue Bonds (continued) | ||
| Series A | ||
| 4.00%, due 12/1/42 | $ 12,870,000 | $ 15,133,097 |
| Series C | ||
| 5.00%, due 12/1/29 | 5,000,000 | 5,742,585 |
| Series A | ||
| 5.00%, due 12/1/32 | 10,000,000 | 12,016,262 |
| Series A | ||
| 5.00%, due 12/1/43 | 15,000,000 | 19,106,362 |
| Series B | ||
| 5.00%, due 12/1/46 | 3,125,000 | 3,761,300 |
| Series A | ||
| 5.00%, due 12/1/50 | 1,500,000 | 1,732,068 |
| Series B | ||
| 5.00%, due 12/1/56 | 2,500,000 | 2,985,327 |
| Series E | ||
| 5.25%, due 12/1/55 | 27,430,000 | 32,418,776 |
| Series E | ||
| 5.50%, due 12/1/53 | 3,460,000 | 3,873,921 |
| South Carolina Public Service Authority, Santee Cooper Project, Revenue Bonds | ||
| Series A | ||
| 5.00%, due 12/1/25 | 6,445,000 | 6,617,506 |
| Series D | ||
| 5.00%, due 12/1/26 | 1,215,000 | 1,278,271 |
| Series A | ||
| 5.00%, due 12/1/32 | 3,000,000 | 3,960,226 |
| Series C | ||
| 5.00%, due 12/1/36 | 3,860,000 | 3,958,166 |
| Series C, Insured: AGM | ||
| 5.00%, due 12/1/36 | 2,000,000 | 2,051,451 |
| Series D | ||
| 5.00%, due 12/1/43 | 5,290,000 | 5,565,476 |
| South Carolina State Housing Finance & Development Authority, Revenue Bonds | ||
| Series A | ||
| 4.50%, due 7/1/48 | 3,180,000 | 3,518,853 |
| South Carolina Transportation Infrastructure Bank, Revenue Bonds | ||
| Series A, Insured: AGM | ||
| 5.00%, due 10/1/35 | 6,110,000 | 7,489,953 |
| Series A | ||
| 5.00%, due 10/1/36 | 15,000,000 | 18,395,802 |
| Principal Amount | Value | |
| Long-Term Municipal Bonds (continued) | ||
| South Carolina (continued) | ||
| Sumter Two School Facilities, Inc., Sumter School District Project, Revenue Bonds | ||
| Series C, Insured: BAM | ||
| 5.00%, due 12/1/27 | $ 1,100,000 | $ 1,286,514 |
| 183,344,119 | ||
| South Dakota 0.1% | ||
| South Dakota Conservancy District, State Revolving Fund Program, Revenue Bonds | ||
| 5.00%, due 8/1/37 | 1,750,000 | 2,215,456 |
| 5.00%, due 8/1/38 | 3,000,000 | 3,787,107 |
| 6,002,563 | ||
| Tennessee 0.5% | ||
| Metropolitan Nashville Airport Authority (The), Revenue Bonds (c) | ||
| Series B | ||
| 4.00%, due 7/1/49 | 2,035,000 | 2,324,991 |
| Series B | ||
| 5.00%, due 7/1/32 | 2,500,000 | 3,220,622 |
| Series B | ||
| 5.00%, due 7/1/33 | 5,700,000 | 7,287,663 |
| Series B | ||
| 5.00%, due 7/1/49 | 17,690,000 | 21,764,911 |
| Tennessee Housing Development Agency, Revenue Bonds | ||
| 4.50%, due 7/1/49 | 6,675,000 | 7,471,381 |
| 42,069,568 | ||
| Texas 4.1% | ||
| Bexar County Hospital District, Certficates of Obligation, Limited General Obligation | ||
| 4.00%, due 2/15/37 | 4,200,000 | 4,818,839 |
| Central Texas Turnpike System, Revenue Bonds | ||
| Series C | ||
| 5.00%, due 8/15/34 | 5,000,000 | 5,618,321 |
| Series C | ||
| 5.00%, due 8/15/42 | 2,135,000 | 2,377,140 |
| City of Austin TX, Airport System, Revenue Bonds (c) | ||
| 5.00%, due 11/15/24 | 4,000,000 | 4,620,765 |
| 5.00%, due 11/15/25 | 4,000,000 | 4,761,450 |
| Principal Amount | Value | |
| Texas (continued) | ||
| City of Austin TX, Airport System, Revenue Bonds (c) (continued) | ||
| Series B | ||
| 5.00%, due 11/15/44 | $ 28,655,000 | $ 35,302,880 |
| Series B | ||
| 5.00%, due 11/15/48 | 2,490,000 | 3,058,374 |
| City of Corpus Christi TX, Utility System, Revenue Bonds, Junior Lien | ||
| Series A | ||
| 3.00%, due 7/15/40 | 3,085,000 | 3,437,813 |
| City of Donna TX, Tax & International Toll Bridge, Limited General Obligation | ||
| Insured: BAM | ||
| 5.00%, due 2/15/30 | 1,035,000 | 1,159,119 |
| City of Houston TX, Hotel Occupancy Tax & Special Tax, Revenue Bonds | ||
| 5.00%, due 9/1/26 | 565,000 | 626,092 |
| 5.00%, due 9/1/31 | 2,450,000 | 2,670,987 |
| 5.00%, due 9/1/34 | 1,550,000 | 1,680,134 |
| City of Houston TX, Limited General Obligation | ||
| Series A | ||
| 5.00%, due 3/1/29 | 5,000,000 | 6,183,333 |
| City of Mount Pleasant, Texas Combination Tax and Certificates of Obligation, Limited General Obligation | ||
| Insured: AGM | ||
| 3.00%, due 5/15/35 (g) | 1,445,000 | 1,644,651 |
| Dallas Area Rapid Transit, Revenue Bonds | ||
| Series B | ||
| 4.00%, due 12/1/36 | 9,000,000 | 10,346,809 |
| Dallas County Hospital District, Limited General Obligation | ||
| 5.00%, due 8/15/30 | 10,000,000 | 12,835,784 |
| Dallas Fort Worth International Airport, Revenue Bonds | ||
| Series B | ||
| 4.00%, due 11/1/35 | 21,390,000 | 26,132,039 |
| Series C | ||
| 5.125%, due 11/1/43 (c) | 5,310,000 | 5,658,236 |
| Grand Parkway Transportation Corp., Revenue Bonds | ||
| Series C | ||
| 4.00%, due 10/1/49 | 26,470,000 | 30,789,830 |
| 44 | MainStay MacKay Tax Free Bond Fund |
| Principal Amount | Value | |
| Long-Term Municipal Bonds (continued) | ||
| Texas (continued) | ||
| Grand Parkway Transportation Corp., Revenue Bonds (continued) | ||
| Series A | ||
| 5.00%, due 10/1/35 | $ 1,500,000 | $ 1,875,272 |
| Series A | ||
| 5.00%, due 10/1/43 | 8,625,000 | 10,662,929 |
| Harris County Cultural Education Facilities Finance Corp., Memorial Hermann Health System, Revenue Bonds | ||
| Series A | ||
| 5.00%, due 7/1/38 | 4,280,000 | 5,004,028 |
| Harris County Toll Road Authority (The), Revenue Bonds, First Lien | ||
| 4.00%, due 8/15/37 | 3,155,000 | 3,859,974 |
| North Harris County Regional Water Authority, Revenue Bonds, Senior Lien | ||
| Insured: BAM | ||
| 5.00%, due 12/15/32 | 3,215,000 | 3,454,697 |
| North Texas Tollway Authority, North Texas Tollway System, Revenue Bonds | ||
| Series A | ||
| 5.00%, due 1/1/34 | 1,400,000 | 1,613,733 |
| Series A | ||
| 5.00%, due 1/1/35 | 2,950,000 | 3,395,748 |
| Series A, Insured: BAM | ||
| 5.00%, due 1/1/38 | 9,500,000 | 10,894,678 |
| Series B | ||
| 5.00%, due 1/1/40 | 22,140,000 | 23,644,249 |
| State of Texas, Anticipation Notes, Revenue Notes | ||
| 4.00%, due 8/26/21 | 50,000,000 | 50,616,575 |
| Tarrant County Cultural Education Facilities Finance Corp., Buckner Retirement Services, Revenue Bonds | ||
| Series A | ||
| 5.00%, due 11/15/23 | 1,245,000 | 1,372,071 |
| Series A | ||
| 5.00%, due 11/15/24 | 1,305,000 | 1,484,414 |
| Series A | ||
| 5.00%, due 11/15/25 | 1,370,000 | 1,602,748 |
| Series A | ||
| 5.00%, due 11/15/26 | 1,440,000 | 1,730,221 |
| Principal Amount | Value | |
| Texas (continued) | ||
| Tarrant County Cultural Education Facilities Finance Corp., Buckner Retirement Services, Revenue Bonds (continued) | ||
| Series B | ||
| 5.00%, due 11/15/46 | $ 3,590,000 | $ 4,114,516 |
| Texas Department of Housing & Community Affairs, Residential Mortgage, Revenue Bonds | ||
| Series A, Insured: GNMA / FNMA | ||
| 4.75%, due 1/1/49 | 20,000 | 22,493 |
| Texas Municipal Gas Acquisition & Supply Corp. III, Gas Supply, Revenue Bonds | ||
| 5.00%, due 12/15/28 | 9,750,000 | 12,354,494 |
| 5.00%, due 12/15/29 | 19,925,000 | 25,625,547 |
| Texas Municipal Power Agency, Revenue Bonds | ||
| 5.00%, due 9/1/47 | 2,750,000 | 2,759,194 |
| Texas Private Activity Bond Surface Transportation Corp., LBJ Infrastructure Group LLC, Revenue Bonds, Senior Lien | ||
| 4.00%, due 12/31/37 | 4,250,000 | 4,958,661 |
| 4.00%, due 12/31/38 | 3,000,000 | 3,487,356 |
| 4.00%, due 6/30/39 | 3,000,000 | 3,488,537 |
| Texas Public Finance Authority, Financing System-Texas Southern University, Revenue Bonds | ||
| Insured: BAM | ||
| 4.00%, due 5/1/31 | 1,000,000 | 1,094,747 |
| Insured: BAM | ||
| 4.00%, due 5/1/32 | 1,295,000 | 1,414,573 |
| Texas State University System, Revenue Bonds | ||
| Series A | ||
| 4.00%, due 3/15/35 | 2,000,000 | 2,370,720 |
| Town of Prosper TX, Certificates Of Obligation, Limited General Obligation | ||
| 4.00%, due 2/15/31 | 1,235,000 | 1,464,618 |
| Viridian Municipal Management District, Unlimited General Obligation | ||
| Series A, Insured: BAM | ||
| 6.00%, due 12/1/32 | 500,000 | 592,420 |
| Principal Amount | Value | |
| Long-Term Municipal Bonds (continued) | ||
| Texas (continued) | ||
| West Harris County Regional Water Authority, Revenue Bonds | ||
| 5.00%, due 12/15/39 | $ 1,200,000 | $ 1,544,068 |
| 350,225,877 | ||
| U.S. Virgin Islands 0.5% | ||
| Virgin Islands Public Finance Authority, Revenue Bonds | ||
| 5.00%, due 9/1/30 (f) | 5,000,000 | 5,591,747 |
| Virgin Islands Public Finance Authority, United States Virgin Islands Federal Excise Tax, Revenue Bonds | ||
| Series A, Insured: AGM | ||
| 5.00%, due 10/1/32 | 15,655,000 | 16,452,533 |
| Virgin Islands Public Finance Authority, Matching Fund Loan, Revenue Bonds | ||
| Series A | ||
| 5.00%, due 10/1/32 | 5,100,000 | 5,061,900 |
| Series A | ||
| 6.625%, due 10/1/29 | 6,455,000 | 6,507,581 |
| Series A | ||
| 6.75%, due 10/1/37 | 5,000,000 | 5,040,730 |
| Virgin Islands Public Finance Authority, United States Virgin Islands, Revenue Bonds | ||
| Series C, Insured: AGM | ||
| 5.00%, due 10/1/39 | 5,920,000 | 6,532,683 |
| 45,187,174 | ||
| Utah 2.4% | ||
| County of Utah UT, IHC Health Services, Inc., Revenue Bonds | ||
| Series A | ||
| 4.00%, due 5/15/43 | 6,750,000 | 8,002,227 |
| Series B | ||
| 4.00%, due 5/15/47 | 1,670,000 | 1,788,734 |
| Series A | ||
| 5.00%, due 5/15/43 | 19,725,000 | 25,251,182 |
| Salt Lake City Corp., Revenue Bonds (c) | ||
| Series A | ||
| 5.00%, due 7/1/42 | 18,790,000 | 22,396,359 |
| Series A | ||
| 5.00%, due 7/1/43 | 22,555,000 | 27,277,216 |
| Principal Amount | Value | |
| Utah (continued) | ||
| Salt Lake City Corp., Revenue Bonds (c) (continued) | ||
| Series A | ||
| 5.00%, due 7/1/47 | $ 23,695,000 | $ 28,188,553 |
| Utah Charter School Finance Authority, Spectrum Academy Project, Revenue Bonds | ||
| Insured: UT CSCE | ||
| 4.00%, due 4/15/45 | 2,975,000 | 3,379,654 |
| Utah Housing Corp., Revenue Bonds | ||
| Series E, Insured: GNMA | ||
| 2.00%, due 4/21/51 | 10,000,000 | 10,318,600 |
| Series F, Insured: GNMA | ||
| 2.50%, due 5/21/51 | 9,500,000 | 9,975,000 |
| Utah Housing Corp., Mortgage-Backed, Revenue Bonds | ||
| Series H, Insured: GNMA | ||
| 4.50%, due 10/21/48 | 1,811,870 | 1,950,586 |
| Series J, Insured: GNMA | ||
| 4.50%, due 12/21/48 | 1,939,547 | 2,088,039 |
| Series A, Insured: GNMA | ||
| 4.50%, due 1/21/49 | 4,477,425 | 4,820,217 |
| Series B, Insured: GNMA | ||
| 4.50%, due 2/21/49 | 3,050,984 | 3,284,568 |
| Utah Infrastructure Agency, Revenue Bonds | ||
| 5.00%, due 10/15/38 | 1,990,000 | 2,416,093 |
| 5.00%, due 10/15/41 | 2,175,000 | 2,624,549 |
| Utah Transit Authority, Revenue Bonds | ||
| 4.00%, due 6/15/39 | 27,885,000 | 29,079,356 |
| Series 2018-2 | ||
| 4.00%, due 12/15/41 | 13,300,000 | 15,145,306 |
| Utah Transit Authority, Sales Tax, Revenue Bonds | ||
| Insured: BAM | ||
| 5.00%, due 12/15/40 | 2,780,000 | 3,409,142 |
| Weber Basin Water Conservancy District, Revenue Bonds | ||
| Series A | ||
| 5.00%, due 10/1/44 | 5,130,000 | 6,501,245 |
| 207,896,626 | ||
| 46 | MainStay MacKay Tax Free Bond Fund |
| Principal Amount | Value | |
| Long-Term Municipal Bonds (continued) | ||
| Vermont 0.0% ‡ | ||
| Vermont Educational & Health Buildings Financing Agency, Middlebury College Project, Revenue Bonds | ||
| 4.00%, due 11/1/36 | $ 1,250,000 | $ 1,473,263 |
| Virginia 1.2% | ||
| Arlington County Industrial Development Authority, Virginia Hospital Center, Revenue Bonds | ||
| 3.75%, due 7/1/50 | 10,000,000 | 11,268,595 |
| 4.00%, due 7/1/45 | 12,000,000 | 13,920,439 |
| Hampton Roads Transportation Accountability Commission, Revenue Bonds, Senior Lien | ||
| Series A | ||
| 4.00%, due 7/1/50 | 6,500,000 | 7,653,120 |
| Series A | ||
| 4.00%, due 7/1/55 | 37,835,000 | 44,370,739 |
| Virginia Housing Development Authority, Revenue Bonds | ||
| Series B | ||
| 3.35%, due 5/1/54 | 3,800,000 | 4,020,788 |
| Virginia Resources Authority, Infrastructure Revenue, Revenue Bonds | ||
| Series A, Insured: Moral Obligation | ||
| 5.00%, due 11/1/30 | 2,245,000 | 2,408,927 |
| Virginia Small Business Financing Authority, 95 Express Lanes LLC, Revenue Bonds, Senior Lien | ||
| 5.00%, due 7/1/49 (c) | 20,000,000 | 20,551,578 |
| 104,194,186 | ||
| Washington 0.7% | ||
| Thurston & Pierce Counties Community Schools, Yelm Community Schools, Unlimited General Obligation | ||
| Insured: School Bond Guaranty | ||
| 4.00%, due 12/1/35 | 3,900,000 | 4,629,290 |
| University of Washington, Revenue Bonds | ||
| Series A | ||
| 4.00%, due 4/1/38 | 1,860,000 | 2,245,752 |
| Principal Amount | Value | |
| Washington (continued) | ||
| University of Washington, Revenue Bonds (continued) | ||
| Series A | ||
| 4.00%, due 4/1/39 | $ 2,345,000 | $ 2,823,754 |
| Series B | ||
| 5.00%, due 6/1/37 | 2,765,000 | 3,225,963 |
| Washington Higher Education Facilities Authority, Seattle Pacific University Project, Revenue Bonds | ||
| Series A | ||
| 5.00%, due 10/1/32 | 1,330,000 | 1,658,308 |
| Series A | ||
| 5.00%, due 10/1/35 | 1,000,000 | 1,235,989 |
| Series A | ||
| 5.00%, due 10/1/38 | 1,175,000 | 1,439,687 |
| Series A | ||
| 5.00%, due 10/1/45 | 1,600,000 | 1,929,583 |
| Washington State Convention Center Public Facilities District, Revenue Bonds | ||
| Insured: AGM | ||
| 4.00%, due 7/1/58 | 20,000,000 | 22,105,238 |
| 5.00%, due 7/1/48 | 6,615,000 | 7,720,427 |
| Insured: AGM | ||
| 5.00%, due 7/1/58 | 2,935,000 | 3,478,390 |
| Washington State Housing Finance Commission, Single Family Program, Revenue Bonds | ||
| Series 1N | ||
| 4.00%, due 12/1/48 | 5,000,000 | 5,483,772 |
| Series 1N | ||
| 4.00%, due 6/1/49 | 260,000 | 286,785 |
| 58,262,938 | ||
| Wisconsin 0.2% | ||
| Public Finance Authority, Appalachian Regional Healthcare System Obligated Group, Revenue Bonds | ||
| 5.00%, due 7/1/39 | 350,000 | 442,646 |
| Wisconsin Center District, Junior Dedicated, Revenue Bonds, Junior Lien | ||
| Series A | ||
| 5.00%, due 12/15/31 | 3,665,000 | 3,856,877 |
| Series A | ||
| 5.00%, due 12/15/32 | 2,850,000 | 2,996,433 |
| Principal Amount | Value | |
| Long-Term Municipal Bonds (continued) | ||
| Wisconsin (continued) | ||
| Wisconsin Health & Educational Facilities Authority, Miriam Osborn Memorial Home Association Project, Revenue Bonds | ||
| Series C | ||
| 5.00%, due 2/15/23 | $ 2,110,000 | $ 2,283,598 |
| Wisconsin Housing & Economic Development Authority, Revenue Bonds | ||
| Series D | ||
| 4.00%, due 3/1/47 | 4,700,000 | 5,184,182 |
| 14,763,736 | ||
| Wyoming 0.1% | ||
| West Park Hospital District, Revenue Bonds | ||
| Series A | ||
| 5.50%, due 6/1/21 | 250,000 | 250,968 |
| Series A | ||
| 6.375%, due 6/1/26 | 1,000,000 | 1,004,626 |
| Wyoming Community Development Authority, Revenue Bonds | ||
| Series 3 | ||
| 4.00%, due 6/1/43 | 3,420,000 | 3,737,926 |
| Series 1 | ||
| 4.00%, due 12/1/48 | 3,295,000 | 3,626,159 |
| 8,619,679 | ||
| Total Long-Term Municipal Bonds (Cost $7,150,769,474) | 7,591,579,012 | |
| Short-Term Municipal Notes 5.0% | ||
| Arkansas 0.1% | ||
| City of Osceola AR, Plum Point Energy Associates LLC Project, Revenue Bonds | ||
| 0.10%, due 4/1/36 (b)(e) | 5,000,000 | 5,000,000 |
| California 1.6% | ||
| California Infrastructure and Economic Development Bank, Brightline West Passenger Rail Project, Revenue Bonds | ||
| Series A | ||
| 0.45%, due 1/1/50 (b)(c)(e)(f) | 42,000,000 | 42,004,611 |
| Principal Amount | Value | |
| California (continued) | ||
| Invesco California Value Municipal Income Trust | ||
| 1.11%, due 12/1/22 (d)(e)(f) | $ 80,000,000 | $ 80,000,000 |
| State of California, Unlimited General Obligation | ||
| Series A | ||
| 0.055%, due 5/1/48 (b)(e) | 12,500,000 | 12,500,000 |
| 134,504,611 | ||
| Connecticut 0.1% | ||
| Connecticut State Health & Educational Facilities Authority, Yale-New Haven Health Obligated Group, Revenue Bonds | ||
| Series C | ||
| 0.07%, due 7/1/25 (b)(e) | 8,400,000 | 8,400,000 |
| Georgia 0.3% | ||
| Development Authority of Burke County (The), Georgia Power Company Plant Vogtle Project, Revenue Bonds | ||
| 0.06%, due 11/1/52 (b)(e) | 22,655,000 | 22,655,000 |
| Indiana 0.0% ‡ | ||
| Indiana Finance Authority, Indianapolis Power & Light Co., Revenue Bonds (b)(e) | ||
| Series A | ||
| 0.75%, due 12/1/38 | 1,500,000 | 1,493,736 |
| Series B | ||
| 0.95%, due 12/1/38 (c) | 3,260,000 | 3,254,229 |
| 4,747,965 | ||
| Kentucky 0.1% | ||
| County of Meade, Nucor Corp., Green Bond, Revenue Bonds | ||
| Series A-1 | ||
| 0.11%, due 7/1/60 (b)(c)(e) | 8,160,000 | 8,160,000 |
| Michigan 0.0% ‡ | ||
| Michigan State Building Authority, Multi-Modal Facilities Program, Revenue Bonds | ||
| Series III | ||
| 0.12%, due 10/15/42 (b)(e) | 3,500,000 | 3,500,000 |
| 48 | MainStay MacKay Tax Free Bond Fund |
| Principal Amount | Value | |
| Short-Term Municipal Notes (continued) | ||
| Minnesota 0.3% | ||
| County of Hennepin, Unlimited General Obligation | ||
| Series B | ||
| 0.06%, due 12/1/38 (b)(e) | $ 22,260,000 | $ 22,260,000 |
| Missouri 0.1% | ||
| Rib Floater Trust Various States, Revenue Bonds | ||
| Series 2019-016 | ||
| 0.10%, due 6/1/45 (b)(e)(f) | 11,000,000 | 11,000,000 |
| New Jersey 0.3% | ||
| New Jersey Economic Development Authority, New Jersey-American Water Co., Inc., Revenue Bonds | ||
| Series D | ||
| 1.10%, due 11/1/29 (b)(c)(e) | 2,040,000 | 2,027,206 |
| New Jersey Turnpike Authority, Revenue Bonds | ||
| Series D-1 | ||
| 0.781%, due 1/1/24 (d)(e) | 25,750,000 | 25,989,398 |
| 28,016,604 | ||
| New York 0.6% | ||
| City of New York NY, Limited General Obligation (b)(e) | ||
| Series 3 | ||
| 0.22%, due 4/1/42 | 7,500,000 | 7,500,000 |
| Series 2 | ||
| 0.22%, due 4/1/42 | 9,900,000 | 9,900,000 |
| New York City Housing Development Corp., Multi-Family, Sustainable Neighborhood, Revenue Bonds | ||
| Series E-3 | ||
| 0.06%, due 5/1/59 (b)(e) | 2,300,000 | 2,300,000 |
| Triborough Bridge & Tunnel Authority, Revenue Bonds (b)(e) | ||
| 0.085%, due 1/1/32 | 20,000,000 | 20,000,000 |
| 0.10%, due 1/1/32 | 10,000,000 | 10,000,000 |
| Triborough Bridge & Tunnel Authority, MTA Bridges & Tunnels, Revenue Bonds | ||
| Series 2005B-4A | ||
| 0.387%, due 1/1/32 (d)(e) | 2,750,000 | 2,750,975 |
| 52,450,975 | ||
| Principal Amount | Value | |
| North Carolina 0.1% | ||
| Invesco Municipal Income Opportunities Trust II | ||
| 1.12%, due 12/1/22 (d)(e)(f) | $ 5,000,000 | $ 5,000,000 |
| Ohio 0.2% | ||
| County of Franklin, Trinity Health Credit Group, Revenue Bonds | ||
| (zero coupon), due 12/1/46 (b)(e) | 12,500,000 | 12,500,000 |
| State of Ohio, Adult Correctional Building Fund Projects, Revenue Bonds | ||
| Series C | ||
| 0.08%, due 10/1/36 (b)(e) | 6,300,000 | 6,300,000 |
| 18,800,000 | ||
| Oregon 0.1% | ||
| Oregon State Facilities Authority, PeaceHealth Obligated Group, Revenue Bonds | ||
| Series B | ||
| 0.04%, due 8/1/34 (b)(e) | 9,200,000 | 9,200,000 |
| South Carolina 0.0% ‡ | ||
| South Carolina State Housing Finance & Development Authority, Franklin Square LP, Revenue Bonds | ||
| 0.07%, due 11/1/41 (b)(e) | 200,000 | 200,000 |
| Texas 0.4% | ||
| Harris County Health Facilities Development Corp., Methodist Hospital, Revenue Bonds (b)(e) | ||
| Series A-1 | ||
| 0.02%, due 12/1/41 | 22,825,000 | 22,825,000 |
| Series A-2 | ||
| 0.02%, due 12/1/41 | 14,875,000 | 14,875,000 |
| 37,700,000 | ||
| Wisconsin 0.7% | ||
| Nuveen Quality Municipal Income Fund | ||
| Series D | ||
| 0.41%, due 3/1/29 (d)(e) | 11,800,000 | 11,800,000 |
| State of Wisconsin, Unlimited General Obligation | ||
| Series A | ||
| 0.07%, due 5/1/29 (b)(e) | 26,600,000 | 26,600,000 |
| Principal Amount | Value | ||
| Short-Term Municipal Notes (continued) | |||
| Wisconsin (continued) | |||
| Wisconsin Health & Educational Facilities Authority, Educational Facilities Authority, Marshfield Clinic Health System Inc., Revenue Bonds | |||
| Series A | |||
| 0.04%, due 2/15/50 (b)(e) | $ 18,685,000 | $ 18,685,000 | |
| 57,085,000 | |||
| Total Short-Term Municipal Notes (Cost $428,423,667) | 428,680,155 | ||
| Total Municipal Bonds (Cost $7,579,193,141) | 8,020,259,167 | ||
| Shares | |||
| Short-Term Investment 3.3% | |||
| Unaffiliated Investment Company 3.3% | |||
| BlackRock Liquidity Funds MuniCash, 0.01% (h) | 279,501,625 | 279,554,655 | |
| Total Short-Term Investment (Cost $279,554,250) | 279,554,655 | ||
| Total Investments (Cost $7,858,747,391) | 96.9% | 8,299,813,822 | |
| Other Assets, Less Liabilities | 3.1 | 269,303,122 | |
| Net Assets | 100.0% | $ 8,569,116,944 | |
| † | Percentages indicated are based on Fund net assets. |
| ‡ | Less than one-tenth of a percent. |
| (a) | Step coupon—Rate shown was the rate in effect as of April 30, 2021. |
| (b) | Coupon rate may change based on changes of the underlying collateral or prepayments of principal. Rate shown was the rate in effect as of April 30, 2021. |
| (c) | Interest on these securities was subject to alternative minimum tax. |
| (d) | Floating rate—Rate shown was the rate in effect as of April 30, 2021. |
| (e) | Variable-rate demand notes (VRDNs)—Provide the right to sell the security at face value on either that day or within the rate-reset period. VRDNs will normally trade as if the maturity is the earlier put date, even though stated maturity is longer. The interest rate is reset on the put date at a stipulated daily, weekly, monthly, quarterly, or other specified time interval to reflect current market conditions. These securities do not indicate a reference rate and spread in their description. The maturity date shown is the final maturity. |
| (f) | May be sold to institutional investors only under Rule 144A or securities offered pursuant to Section 4(a)(2) of the Securities Act of 1933, as amended. |
| (g) | Delayed delivery security. |
| (h) | Current yield as of April 30, 2021. |
| Type | Number of Contracts | Expiration Date | Value at Trade Date | Current Notional Amount | Unrealized Appreciation (Depreciation)2 |
| Short Contracts | |||||
| U.S. Treasury 10 Year Notes | (4,335) | June 2021 | $ (580,456,326) | $ (572,355,469) | $ 8,100,857 |
| 1. | As of April 30, 2021, cash in the amount of $6,610,875 was on deposit with a broker or futures commission merchant for futures transactions. |
| 2. | Represents the difference between the value of the contracts at the time they were opened and the value as of April 30, 2021. |
| Abbreviation(s): |
| AGC—Assured Guaranty Corp. |
| AGM—Assured Guaranty Municipal Corp. |
| BAM—Build America Mutual Assurance Co. |
| BHAC—Berkshire Hathaway Assurance Corp. |
| COMMWLTH GTD—Commonwealth Guaranteed |
| 50 | MainStay MacKay Tax Free Bond Fund |
| FHLMC—Federal Home Loan Mortgage Corp. |
| FNMA—Federal National Mortgage Association |
| GNMA—Government National Mortgage Association |
| MUN GOVT GTD—Municipal Government Guaranteed |
| NATL—National Public Finance Guarantee Corp. |
| NATL-RE—National Public Finance Guarantee Corp. |
| Q-SBLF—Qualified School Board Loan Fund |
| UT CSCE—Utah Charter School Credit Enhancement Program |
| Description | Quoted Prices in Active Markets for Identical Assets (Level 1) | Significant Other Observable Inputs (Level 2) | Significant Unobservable Inputs (Level 3) | Total | |||
| Asset Valuation Inputs | |||||||
| Investments in Securities (a) | |||||||
| Municipal Bonds | |||||||
| Long-Term Municipal Bonds | $ — | $ 7,591,579,012 | $ — | $ 7,591,579,012 | |||
| Short-Term Municipal Notes | — | 428,680,155 | — | 428,680,155 | |||
| Total Municipal Bonds | — | 8,020,259,167 | — | 8,020,259,167 | |||
| Short-Term Investment | |||||||
| Unaffiliated Investment Company | 279,554,655 | — | — | 279,554,655 | |||
| Total Investments in Securities | 279,554,655 | 8,020,259,167 | — | 8,299,813,822 | |||
| Other Financial Instruments | |||||||
| Futures Contracts (b) | �� 8,100,857 | — | — | 8,100,857 | |||
| Total Other Financial Instruments | 8,100,857 | — | — | 8,100,857 | |||
| Total Investments in Securities and Other Financial Instruments | $ 287,655,512 | $ 8,020,259,167 | $ — | $ 8,307,914,679 |
| (a) | For a complete listing of investments and their industries, see the Portfolio of Investments. |
| (b) | The value listed for these securities reflects unrealized appreciation (depreciation) as shown on the Portfolio of Investments. |
| Assets | |
| Investment in securities, at value (identified cost $7,858,747,391) | $8,299,813,822 |
| Cash collateral on deposit at broker for futures contracts | 6,610,875 |
| Cash | 218,806,875 |
| Receivables: | |
| Interest | 90,873,635 |
| Fund shares sold | 30,811,981 |
| Investment securities sold | 25,653,225 |
| Variation margin on futures contracts | 270,923 |
| Other assets | 226,347 |
| Total assets | 8,673,067,683 |
| Liabilities | |
| Payables: | |
| Investment securities purchased | 82,338,681 |
| Fund shares redeemed | 12,971,204 |
| Manager (See Note 3) | 2,846,942 |
| NYLIFE Distributors (See Note 3) | 686,531 |
| Transfer agent (See Note 3) | 644,299 |
| Professional fees | 112,704 |
| Custodian | 31,696 |
| Shareholder communication | 31,501 |
| Accrued expenses | 3,125 |
| Distributions payable | 4,284,056 |
| Total liabilities | 103,950,739 |
| Net assets | $8,569,116,944 |
| Composition of Net Assets | |
| Shares of beneficial interest outstanding (par value of $.01 per share) unlimited number of shares authorized | $ 8,003,580 |
| Additional paid-in-capital | 8,164,844,152 |
| 8,172,847,732 | |
| Total distributable earnings (loss) | 396,269,212 |
| Net assets | $8,569,116,944 |
| Class A | |
| Net assets applicable to outstanding shares | $2,917,570,870 |
| Shares of beneficial interest outstanding | 272,557,122 |
| Net asset value per share outstanding | $ 10.70 |
| Maximum sales charge (4.50% of offering price) | 0.50 |
| Maximum offering price per share outstanding | $ 11.20 |
| Investor Class | |
| Net assets applicable to outstanding shares | $ 9,419,199 |
| Shares of beneficial interest outstanding | 876,057 |
| Net asset value per share outstanding | $ 10.75 |
| Maximum sales charge (4.00% of offering price) | 0.45 |
| Maximum offering price per share outstanding | $ 11.20 |
| Class B | |
| Net assets applicable to outstanding shares | $ 8,069,413 |
| Shares of beneficial interest outstanding | 754,042 |
| Net asset value and offering price per share outstanding | $ 10.70 |
| Class C | |
| Net assets applicable to outstanding shares | $ 207,255,487 |
| Shares of beneficial interest outstanding | 19,356,752 |
| Net asset value and offering price per share outstanding | $ 10.71 |
| Class C2 | |
| Net assets applicable to outstanding shares | $ 1,771,945 |
| Shares of beneficial interest outstanding | 165,598 |
| Net asset value and offering price per share outstanding | $ 10.70 |
| Class I | |
| Net assets applicable to outstanding shares | $5,172,619,337 |
| Shares of beneficial interest outstanding | 483,087,787 |
| Net asset value and offering price per share outstanding | $ 10.71 |
| Class R6 | |
| Net assets applicable to outstanding shares | $ 252,410,693 |
| Shares of beneficial interest outstanding | 23,560,658 |
| Net asset value and offering price per share outstanding | $ 10.71 |
| 52 | MainStay MacKay Tax Free Bond Fund |
| Investment Income (Loss) | |
| Income | |
| Interest | $100,766,780 |
| Expenses | |
| Manager (See Note 3) | 16,546,130 |
| Distribution/Service—Class A (See Note 3) | 3,490,269 |
| Distribution/Service—Investor Class (See Note 3) | 11,603 |
| Distribution/Service—Class B (See Note 3) | 21,592 |
| Distribution/Service—Class C (See Note 3) | 552,271 |
| Distribution/Service—Class C2 (See Note 3) | 3,446 |
| Transfer agent (See Note 3) | 1,961,342 |
| Registration | 323,763 |
| Professional fees | 230,518 |
| Shareholder communication | 101,928 |
| Trustees | 83,074 |
| Custodian | 35,337 |
| Insurance | 24,945 |
| Miscellaneous | 86,424 |
| Total expenses | 23,472,642 |
| Net investment income (loss) | 77,294,138 |
| Realized and Unrealized Gain (Loss) | |
| Net realized gain (loss) on: | |
| Unaffiliated investment transactions | 50,287,232 |
| Futures transactions | 11,324,163 |
| Net realized gain (loss) | 61,611,395 |
| Net change in unrealized appreciation (depreciation) on: | |
| Unaffiliated investments | 151,247,997 |
| Futures contracts | 5,277,118 |
| Net change in unrealized appreciation (depreciation) | 156,525,115 |
| Net realized and unrealized gain (loss) | 218,136,510 |
| Net increase (decrease) in net assets resulting from operations | $295,430,648 |
for the six months ended April 30, 2021 (Unaudited) and the year ended October 31, 2020
| 2021 | 2020 | |
| Increase (Decrease) in Net Assets | ||
| Operations: | ||
| Net investment income (loss) | $ 77,294,138 | $ 133,277,608 |
| Net realized gain (loss) | 61,611,395 | 16,233,287 |
| Net change in unrealized appreciation (depreciation) | 156,525,115 | 85,374,477 |
| Net increase (decrease) in net assets resulting from operations | 295,430,648 | 234,885,372 |
| Distributions to shareholders: | ||
| Class A | (31,853,777) | (61,436,754) |
| Investor Class | (104,584) | (252,488) |
| Class B | (87,143) | (272,310) |
| Class C | (2,219,421) | (5,412,059) |
| Class C2 | (9,430) | (295) |
| Class I | (60,702,463) | (98,634,481) |
| Class R6 | (2,887,785) | (2,964,947) |
| Total distributions to shareholders | (97,864,603) | (168,973,334) |
| Capital share transactions: | ||
| Net proceeds from sales of shares | 1,548,682,998 | 4,265,384,837 |
| Net asset value of shares issued to shareholder in reinvestment of distributions | 71,841,154 | 122,276,059 |
| Cost of shares redeemed | (791,486,420) | (1,754,536,854) |
| Increase (decrease) in net assets derived from capital share transactions | 829,037,732 | 2,633,124,042 |
| Net increase (decrease) in net assets | 1,026,603,777 | 2,699,036,080 |
| Net Assets | ||
| Beginning of period | 7,542,513,167 | 4,843,477,087 |
| End of period | $8,569,116,944 | $ 7,542,513,167 |
| 54 | MainStay MacKay Tax Free Bond Fund |
| Six months ended April 30, 2021* | Year Ended October 31, | ||||||||||
| Class A | 2020 | 2019 | 2018 | 2017 | 2016 | ||||||
| Net asset value at beginning of period | $ 10.43 | $ 10.33 | $ 9.80 | $ 10.02 | $ 10.18 | $ 9.93 | |||||
| Net investment income (loss) | 0.09 | 0.26 | 0.30 | 0.31 | 0.31 | 0.32 | |||||
| Net realized and unrealized gain (loss) on investments | 0.30 | 0.11 | 0.53 | (0.22) | (0.16) | 0.25 | |||||
| Total from investment operations | 0.39 | 0.37 | 0.83 | 0.09 | 0.15 | 0.57 | |||||
| Less distributions: | |||||||||||
| From net investment income | (0.12) | (0.27) | (0.30) | (0.31) | (0.31) | (0.32) | |||||
| Net asset value at end of period | $ 10.70 | $ 10.43 | $ 10.33 | $ 9.80 | $ 10.02 | $ 10.18 | |||||
| Total investment return (a) | 3.75% | 3.66% | 8.55% | 0.94% | 1.50% | 5.73% | |||||
| Ratios (to average net assets)/Supplemental Data: | |||||||||||
| Net investment income (loss) | 1.76%†† | 2.04% | 2.93% | 3.15% | 3.05% | 3.04% | |||||
| Net expenses (b) | 0.73%†† | 0.75% | 0.78% | 0.80% | 0.81% | 0.80% | |||||
| Portfolio turnover rate | 22% (c) | 72% (c) | 38% (c) | 40% | 62% | 47% | |||||
| Net assets at end of period (in 000’s) | $ 2,917,571 | $ 2,674,765 | $ 1,728,643 | $ 1,405,803 | $ 1,564,955 | $ 1,248,065 | |||||
| * | Unaudited. |
| †† | Annualized. |
| (a) | Total investment return is calculated exclusive of sales charges and assumes the reinvestment of dividends and distributions. For periods of less than one year, total return is not annualized. |
| (b) | In addition to the fees and expenses which the Fund bears directly, it also indirectly bears a pro-rata share of the fees and expenses of the underlying funds in which it invests. Such indirect expenses are not included in the above expense ratios. |
| (c) | The portfolio turnover rate includes variable rate demand notes. |
| Six months ended April 30, 2021* | Year Ended October 31, | ||||||||||
| Investor Class | 2020 | 2019 | 2018 | 2017 | 2016 | ||||||
| Net asset value at beginning of period | $ 10.48 | $ 10.38 | $ 9.84 | $ 10.06 | $ 10.23 | $ 9.97 | |||||
| Net investment income (loss) | 0.09 | 0.20 | 0.30 | 0.32 | 0.31 | 0.32 | |||||
| Net realized and unrealized gain (loss) on investments | 0.30 | 0.17 | 0.54 | (0.22) | (0.17) | 0.26 | |||||
| Total from investment operations | 0.39 | 0.37 | 0.84 | 0.10 | 0.14 | 0.58 | |||||
| Less distributions: | |||||||||||
| From net investment income | (0.12) | (0.27) | (0.30) | (0.32) | (0.31) | (0.32) | |||||
| Net asset value at end of period | $ 10.75 | $ 10.48 | $ 10.38 | $ 9.84 | $ 10.06 | $ 10.23 | |||||
| Total investment return (a) | 3.73% | 3.64% | 8.63% | 0.97% | 1.43% | 5.83% | |||||
| Ratios (to average net assets)/Supplemental Data: | |||||||||||
| Net investment income (loss) | 1.65%†† | 2.04% | 2.95% | 3.17% | 3.10% | 3.11% | |||||
| Net expenses (b) | 0.76%†† | 0.76% | 0.77% | 0.78% | 0.79% | 0.79% | |||||
| Portfolio turnover rate | 22% (c) | 72% (c) | 38% (c) | 40% | 62% | 47% | |||||
| Net assets at end of period (in 000’s) | $ 9,419 | $ 9,334 | $ 9,815 | $ 9,690 | $ 10,216 | $ 16,344 | |||||
| * | Unaudited. |
| †† | Annualized. |
| (a) | Total investment return is calculated exclusive of sales charges and assumes the reinvestment of dividends and distributions. For periods of less than one year, total return is not annualized. |
| (b) | In addition to the fees and expenses which the Fund bears directly, it also indirectly bears a pro-rata share of the fees and expenses of the underlying funds in which it invests. Such indirect expenses are not included in the above expense ratios. |
| (c) | The portfolio turnover rate includes variable rate demand notes. |
| Six months ended April 30, 2021* | Year Ended October 31, | ||||||||||
| Class B | 2020 | 2019 | 2018 | 2017 | 2016 | ||||||
| Net asset value at beginning of period | $ 10.43 | $ 10.33 | $ 9.80 | $ 10.01 | $ 10.18 | $ 9.92 | |||||
| Net investment income (loss) | 0.07 | 0.12 | 0.27 | 0.29 | 0.28 | 0.29 | |||||
| Net realized and unrealized gain (loss) on investments | 0.31 | 0.23 | 0.53 | (0.21) | (0.17) | 0.26 | |||||
| Total from investment operations | 0.38 | 0.35 | 0.80 | 0.08 | 0.11 | 0.55 | |||||
| Less distributions: | |||||||||||
| From net investment income | (0.11) | (0.25) | (0.27) | (0.29) | (0.28) | (0.29) | |||||
| Net asset value at end of period | $ 10.70 | $ 10.43 | $ 10.33 | $ 9.80 | $ 10.01 | $ 10.18 | |||||
| Total investment return (a) | 3.61% | 3.38% | 8.28% | 0.81% | 1.17% | 5.58% | |||||
| Ratios (to average net assets)/Supplemental Data: | |||||||||||
| Net investment income (loss) | 1.34%†† | 1.80% | 2.71% | 2.92% | 2.85% | 2.84% | |||||
| Net expenses (b) | 1.01%†† | 1.01% | 1.02% | 1.03% | 1.04% | 1.04% | |||||
| Portfolio turnover rate | 22% (c) | 72% (c) | 38% (c) | 40% | 62% | 47% | |||||
| Net assets at end of period (in 000’s) | $ 8,069 | $ 9,286 | $ 12,354 | $ 14,704 | $ 17,068 | $ 19,318 | |||||
| * | Unaudited. |
| †† | Annualized. |
| (a) | Total investment return is calculated exclusive of sales charges and assumes the reinvestment of dividends and distributions. For periods of less than one year, total return is not annualized. |
| (b) | In addition to the fees and expenses which the Fund bears directly, it also indirectly bears a pro-rata share of the fees and expenses of the underlying funds in which it invests. Such indirect expenses are not included in the above expense ratios. |
| (c) | The portfolio turnover rate includes variable rate demand notes. |
| Six months ended April 30, 2021* | Year Ended October 31, | ||||||||||
| Class C | 2020 | 2019 | 2018 | 2017 | 2016 | ||||||
| Net asset value at beginning of period | $ 10.44 | $ 10.34 | $ 9.80 | $ 10.02 | $ 10.18 | $ 9.93 | |||||
| Net investment income (loss) | 0.08 | 0.18 | 0.27 | 0.29 | 0.28 | 0.29 | |||||
| Net realized and unrealized gain (loss) on investments | 0.30 | 0.17 | 0.54 | (0.22) | (0.16) | 0.25 | |||||
| Total from investment operations | 0.38 | 0.35 | 0.81 | 0.07 | 0.12 | 0.54 | |||||
| Less distributions: | |||||||||||
| From net investment income | (0.11) | (0.25) | (0.27) | (0.29) | (0.28) | (0.29) | |||||
| Net asset value at end of period | $ 10.71 | $ 10.44 | $ 10.34 | $ 9.80 | $ 10.02 | $ 10.18 | |||||
| Total investment return (a) | 3.61% | 3.38% | 8.39% | 0.71% | 1.27% | 5.48% | |||||
| Ratios (to average net assets)/Supplemental Data: | |||||||||||
| Net investment income (loss) | 1.42%†† | 1.79% | 2.69% | 2.92% | 2.85% | 2.81% | |||||
| Net expenses (b) | 1.01%†† | 1.01% | 1.02% | 1.03% | 1.04% | 1.04% | |||||
| Portfolio turnover rate | 22% (c) | 72% (c) | 38% (c) | 40% | 62% | 47% | |||||
| Net assets at end of period (in 000’s) | $ 207,255 | $ 220,146 | $ 225,762 | $ 213,883 | $ 241,526 | $ 273,386 | |||||
| * | Unaudited. |
| †† | Annualized. |
| (a) | Total investment return is calculated exclusive of sales charges and assumes the reinvestment of dividends and distributions. For periods of less than one year, total return is not annualized. |
| (b) | In addition to the fees and expenses which the Fund bears directly, it also indirectly bears a pro-rata share of the fees and expenses of the underlying funds in which it invests. Such indirect expenses are not included in the above expense ratios. |
| (c) | The portfolio turnover rate includes variable rate demand notes. |
| 56 | MainStay MacKay Tax Free Bond Fund |
| Six months ended April 30, 2021 | August 31, 2020^ through October 31, 2020 | ||
| Class C2 | |||
| Net asset value at beginning of period | $ 10.43 | $ 10.52 | |
| Net investment income (loss) | 0.10 | 0.03 | |
| Net realized and unrealized gain (loss) on investments | 0.27 | (0.09) | |
| Total from investment operations | 0.37 | (0.06) | |
| Less distributions: | |||
| From net investment income | (0.10) | (0.03) | |
| Net asset value at end of period | $ 10.70 | $ 10.43 | |
| Total investment return (a) | 3.53% | (0.54)% | |
| Ratios (to average net assets)/Supplemental Data: | |||
| Net investment income (loss) | 1.97%†† | 1.02% | |
| Net expenses (b) | 1.15%†† | 1.15% | |
| Portfolio turnover rate (c) | 22% | 72% | |
| Net assets at end of period (in 000’s) | $ 1,772 | $ 251 |
| ^ | Inception date. |
| †† | Annualized. |
| (a) | Total investment return is calculated exclusive of sales charges and assumes the reinvestment of dividends and distributions. For periods of less than one year, total return is not annualized. |
| (b) | In addition to the fees and expenses which the Fund bears directly, it also indirectly bears a pro-rata share of the fees and expenses of the underlying funds in which it invests. Such indirect expenses are not included in the above expense ratios. |
| (c) | The portfolio turnover rate includes variable rate demand notes. |
| Six months ended April 30, 2021* | Year Ended October 31, | ||||||||||
| Class I | 2020 | 2019 | 2018 | 2017 | 2016 | ||||||
| Net asset value at beginning of period | $ 10.44 | $ 10.34 | $ 9.80 | $ 10.02 | $ 10.18 | $ 9.93 | |||||
| Net investment income (loss) | 0.11 | 0.29 | 0.32 | 0.34 | 0.33 | 0.34 | |||||
| Net realized and unrealized gain (loss) on investments | 0.29 | 0.11 | 0.54 | (0.22) | (0.16) | 0.25 | |||||
| Total from investment operations | 0.40 | 0.40 | 0.86 | 0.12 | 0.17 | 0.59 | |||||
| Less distributions: | |||||||||||
| From net investment income | (0.13) | (0.30) | (0.32) | (0.34) | (0.33) | (0.34) | |||||
| Net asset value at end of period | $ 10.71 | $ 10.44 | $ 10.34 | $ 9.80 | $ 10.02 | $ 10.18 | |||||
| Total investment return (a) | 3.88% | 3.91% | 8.93% | 1.19% | 1.75% | 5.99% | |||||
| Ratios (to average net assets)/Supplemental Data: | |||||||||||
| Net investment income (loss) | 2.03%†† | 2.28% | 3.14% | 3.40% | 3.31% | 3.29% | |||||
| Net expenses (b) | 0.48%†† | 0.50% | 0.52% | 0.55% | 0.56% | 0.55% | |||||
| Portfolio turnover rate | 22% (c) | 72% (c) | 38% (c) | 40% | 62% | 47% | |||||
| Net assets at end of period (in 000’s) | $ 5,172,619 | $ 4,430,985 | $ 2,866,903 | $ 1,320,591 | $ 1,019,263 | $ 899,128 | |||||
| * | Unaudited. |
| †† | Annualized. |
| (a) | Total investment return is calculated exclusive of sales charges and assumes the reinvestment of dividends and distributions. Class I shares are not subject to sales charges. For periods of less than one year, total return is not annualized. |
| (b) | In addition to the fees and expenses which the Fund bears directly, it also indirectly bears a pro-rata share of the fees and expenses of the underlying funds in which it invests. Such indirect expenses are not included in the above expense ratios. |
| (c) | The portfolio turnover rate includes variable rate demand notes. |
| Six months ended April 30, 2021* | November 1, 2019^ through October 31, | ||
| Class R6 | 2020 | ||
| Net asset value at beginning of period | $ 10.44 | $ 10.34 | |
| Net investment income (loss) | 0.11 | 0.27 | |
| Net realized and unrealized gain (loss) on investments | 0.30 | 0.13 | |
| Total from investment operations | 0.41 | 0.40 | |
| Less distributions: | |||
| From net investment income | (0.14) | (0.30) | |
| Net asset value at end of period | $ 10.71 | $ 10.44 | |
| Total investment return (a) | 3.90% | 3.95% | |
| Ratios (to average net assets)/Supplemental Data: | |||
| Net investment income (loss) | 2.13%†† | 2.27% | |
| Net expenses (b) | 0.44%†† | 0.44% | |
| Portfolio turnover rate (c) | 22% | 72% | |
| Net assets at end of period (in 000’s) | $ 252,411 | $ 197,746 |
| * | Unaudited. |
| ^ | Inception date. |
| †† | Annualized. |
| (a) | Total investment return is calculated exclusive of sales charges and assumes the reinvestment of dividends and distributions. Class R6 shares are not subject to sales charges. For periods of less than one year, total return is not annualized. |
| (b) | In addition to the fees and expenses which the Fund bears directly, it also indirectly bears a pro-rata share of the fees and expenses of the underlying funds in which it invests. Such indirect expenses are not included in the above expense ratios. |
| (c) | The portfolio turnover rate includes variable rate demand notes. |
| 58 | MainStay MacKay Tax Free Bond Fund |
| Class | Commenced Operations |
| Class A | January 3, 1995 |
| Investor Class | February 28, 2008 |
| Class B | May 1, 1986 |
| Class C | September 1, 1998 |
| Class C2 | August 31, 2020 |
| Class I | December 21, 2009 |
| Class R6 | November 1, 2019 |
| SIMPLE Class | N/A* |
| * | SIMPLE Class shares were registered for sale effective as of August 31, 2020 but have not yet commenced operations. |
| • | Level 1—quoted prices in active markets for an identical asset or liability |
| • | Level 2—other significant observable inputs (including quoted prices for a similar asset or liability in active markets, interest rates and yield curves, prepayment speeds, credit risk, etc.) |
| • | Level 3—significant unobservable inputs (including the Fund's own assumptions about the assumptions that market participants would use in measuring fair value of an asset or liability) |
| • Benchmark yields | • Reported trades |
| • Broker/dealer quotes | • Issuer spreads |
| • Two-sided markets | • Benchmark securities |
| • Bids/offers | • Reference data (corporate actions or material event notices) |
| • Industry and economic events | • Comparable bonds |
| • Monthly payment information |
| 60 | MainStay MacKay Tax Free Bond Fund |
| 62 | MainStay MacKay Tax Free Bond Fund |
| Asset Derivatives | Interest Rate Contracts Risk | Total |
| Futures Contracts - Net Assets—Net unrealized appreciation on futures contracts (a) | $8,100,857 | $8,100,857 |
| Total Fair Value | $8,100,857 | $8,100,857 |
| (a) | Includes cumulative appreciation (depreciation) of futures contracts as reported in the Portfolio of Investments. Only current day’s variation margin is reported within the Statement of Assets and Liabilities. |
| Net Realized Gain (Loss) from: | Interest Rate Contracts Risk | Total |
| Futures Contracts | $11,324,163 | $11,324,163 |
| Total Net Realized Gain (Loss) | $11,324,163 | $11,324,163 |
| Net Change in Unrealized Appreciation (Depreciation) | Interest Rate Contracts Risk | Total |
| Futures Contracts | $5,277,118 | $5,277,118 |
| Total Net Change in Unrealized Appreciation (Depreciation) | $5,277,118 | $5,277,118 |
| Average Notional Amount | Total |
| Futures Contracts Short | $(499,061,328) |
| 64 | MainStay MacKay Tax Free Bond Fund |
| Class | Expense | Waived |
| Class A | $ 686,986 | $— |
| Investor Class | 3,410 | — |
| Class B | 3,172 | — |
| Class C | 81,153 | — |
| Class C2 | 390 | — |
| Class I | 1,181,734 | — |
| Class R6 | 4,497 | — |
| Class C2 | $25,704 | 1.5% |
| Class R6 | 26,946 | 0.0‡ |
| ‡ | Less than one-tenth of a percent. |
| Federal Tax Cost | Gross Unrealized Appreciation | Gross Unrealized (Depreciation) | Net Unrealized Appreciation/ (Depreciation) | |
| Investments | $7,877,913,775 | $426,055,271 | $(4,155,224) | $421,900,047 |
| Capital Loss Available Through | Short-Term Capital Loss Amounts (000’s) | Long-Term Capital Loss Amounts (000’s) |
| Unlimited | $24,599 | $— |
| 2020 | |
| Distributions paid from: | |
| Ordinary Income | $ 322,848 |
| Exempt Interest Dividends | 168,650,486 |
| Total | $168,973,334 |
| Class A | Shares | Amount |
| Period ended April 30, 2021: | ||
| Shares sold | 36,205,484 | $ 386,118,609 |
| Shares issued to shareholders in reinvestment of distributions | 2,612,796 | 27,863,927 |
| Shares redeemed | (23,061,270) | (245,574,701) |
| Net increase (decrease) in shares outstanding before conversion | 15,757,010 | 168,407,835 |
| Shares converted into Class A (See Note 1) | 490,551 | 5,200,437 |
| Shares converted from Class A (See Note 1) | (43,627) | (465,334) |
| Net increase (decrease) | 16,203,934 | $ 173,142,938 |
| Year ended October 31, 2020: | ||
| Shares sold | 157,611,398 | $1,621,322,710 |
| Shares issued to shareholders in reinvestment of distributions | 5,260,382 | 54,696,460 |
| Shares redeemed | (73,877,620) | (761,621,950) |
| Net increase (decrease) in shares outstanding before conversion | 88,994,160 | 914,397,220 |
| Shares converted into Class A (See Note 1) | 541,773 | 5,625,267 |
| Shares converted from Class A (See Note 1) | (472,247) | (4,948,405) |
| Net increase (decrease) | 89,063,686 | $ 915,074,082 |
| Investor Class | Shares | Amount |
| Period ended April 30, 2021: | ||
| Shares sold | 80,314 | $ 862,294 |
| Shares issued to shareholders in reinvestment of distributions | 9,174 | 98,261 |
| Shares redeemed | (66,143) | (709,684) |
| Net increase (decrease) in shares outstanding before conversion | 23,345 | 250,871 |
| Shares converted into Investor Class (See Note 1) | 44,584 | 476,636 |
| Shares converted from Investor Class (See Note 1) | (82,519) | (883,061) |
| Net increase (decrease) | (14,590) | $ (155,554) |
| Year ended October 31, 2020: | ||
| Shares sold | 218,794 | $ 2,273,329 |
| Shares issued to shareholders in reinvestment of distributions | 22,612 | 236,084 |
| Shares redeemed | (114,676) | (1,193,871) |
| Net increase (decrease) in shares outstanding before conversion | 126,730 | 1,315,542 |
| Shares converted into Investor Class (See Note 1) | 39,045 | 407,397 |
| Shares converted from Investor Class (See Note 1) | (221,001) | (2,293,359) |
| Net increase (decrease) | (55,226) | $ (570,420) |
| 66 | MainStay MacKay Tax Free Bond Fund |
| Class B | Shares | Amount |
| Period ended April 30, 2021: | ||
| Shares sold | 735 | $ 7,824 |
| Shares issued to shareholders in reinvestment of distributions | 7,713 | 82,233 |
| Shares redeemed | (117,962) | (1,254,772) |
| Net increase (decrease) in shares outstanding before conversion | (109,514) | (1,164,715) |
| Shares converted from Class B (See Note 1) | (26,681) | (283,634) |
| Net increase (decrease) | (136,195) | $ (1,448,349) |
| Year ended October 31, 2020: | ||
| Shares sold | 253,107 | $ 2,612,189 |
| Shares issued to shareholders in reinvestment of distributions | 24,633 | 255,982 |
| Shares redeemed | (546,601) | (5,546,225) |
| Net increase (decrease) in shares outstanding before conversion | (268,861) | (2,678,054) |
| Shares converted from Class B (See Note 1) | (36,760) | (381,759) |
| Net increase (decrease) | (305,621) | $ (3,059,813) |
| Class C | Shares | Amount |
| Period ended April 30, 2021: | ||
| Shares sold | 2,086,472 | $ 22,271,889 |
| Shares issued to shareholders in reinvestment of distributions | 161,204 | 1,719,316 |
| Shares redeemed | (3,584,973) | (38,157,161) |
| Net increase (decrease) in shares outstanding before conversion | (1,337,297) | (14,165,956) |
| Shares converted from Class C (See Note 1) | (399,429) | (4,237,846) |
| Net increase (decrease) | (1,736,726) | $ (18,403,802) |
| Year ended October 31, 2020: | ||
| Shares sold | 6,054,077 | $ 62,779,856 |
| Shares issued to shareholders in reinvestment of distributions | 382,748 | 3,980,400 |
| Shares redeemed | (6,954,302) | (72,186,731) |
| Net increase (decrease) in shares outstanding before conversion | (517,477) | (5,426,475) |
| Shares converted from Class C (See Note 1) | (230,958) | (2,395,190) |
| Net increase (decrease) | (748,435) | $ (7,821,665) |
| Class C2 | Shares | Amount |
| Period ended April 30, 2021: | ||
| Shares sold | 140,914 | $ 1,500,736 |
| Shares issued to shareholders in reinvestment of distributions | 883 | 9,415 |
| Shares redeemed | (226) | (2,411) |
| Net increase (decrease) | 141,571 | $ 1,507,740 |
| Year ended October 31, 2020:(a) | ||
| Shares sold | 23,999 | $ 250,964 |
| Shares issued to shareholders in reinvestment of distributions | 28 | 295 |
| Shares redeemed | (0) ‡ | (5) |
| Net increase (decrease) | 24,027 | $ 251,254 |
| Class I | Shares | Amount |
| Period ended April 30, 2021: | ||
| Shares sold | 101,235,765 | $1,080,184,359 |
| Shares issued to shareholders in reinvestment of distributions | 3,942,231 | 42,046,507 |
| Shares redeemed | (46,246,638) | (492,989,611) |
| Net increase (decrease) in shares outstanding before conversion | 58,931,358 | 629,241,255 |
| Shares converted into Class I (See Note 1) | 67,128 | 717,577 |
| Shares converted from Class I (See Note 1) | (462,423) | (4,927,803) |
| Net increase (decrease) | 58,536,063 | $ 625,031,029 |
| Year ended October 31, 2020: | ||
| Shares sold | 229,489,098 | $2,384,123,938 |
| Shares issued to shareholders in reinvestment of distributions | 6,061,484 | 63,084,471 |
| Shares redeemed | (84,329,184) | (869,303,407) |
| Net increase (decrease) in shares outstanding before conversion | 151,221,398 | 1,577,905,002 |
| Shares converted into Class I (See Note 1) | 459,012 | 4,807,540 |
| Shares converted from Class I (See Note 1) | (4,502,591) | (47,113,382) |
| Net increase (decrease) | 147,177,819 | $1,535,599,160 |
| Class R6 | Shares | Amount |
| Period ended April 30, 2021: | ||
| Shares sold | 5,411,593 | $ 57,737,287 |
| Shares issued to shareholders in reinvestment of distributions | 2,014 | 21,495 |
| Shares redeemed | (1,202,307) | (12,798,080) |
| Net increase (decrease) in shares outstanding before conversion | 4,211,300 | 44,960,702 |
| Shares converted into Class R6 (See Note 1) | 412,762 | 4,403,028 |
| Net increase (decrease) | 4,624,062 | $ 49,363,730 |
| Year ended October 31, 2020:(b) | ||
| Shares sold | 18,912,996 | $ 192,021,851 |
| Shares issued to shareholders in reinvestment of distributions | 2,153 | 22,367 |
| Shares redeemed | (4,398,883) | (44,684,665) |
| Net increase (decrease) in shares outstanding before conversion | 14,516,266 | 147,359,553 |
| Shares converted into Class R6 (See Note 1) | 4,510,631 | 47,243,588 |
| Shares converted from Class R6 (See Note 1) | (90,301) | (951,697) |
| Net increase (decrease) | 18,936,596 | $ 193,651,444 |
| ‡ | Less than one cent per share. |
| (a) | The inception date of the class was August 31, 2020. |
| (b) | The inception date of the class was November 1, 2019. |
| 68 | MainStay MacKay Tax Free Bond Fund |
| 70 | MainStay MacKay Tax Free Bond Fund |
| 72 | MainStay MacKay Tax Free Bond Fund |
| 74 | MainStay MacKay Tax Free Bond Fund |
1.
| 2. | This Fund is registered for sale in CA, CT, DE, FL, MA, NJ, NY and VT. |
| 3. | An affiliate of New York Life Investment Management LLC. |
| 1737619MS071-21 | MST10-06/21 |
please log in to newyorklifeinvestments.com/accounts.
| Not FDIC/NCUA Insured | Not a Deposit | May Lose Value | No Bank Guarantee | Not Insured by Any Government Agency |


President
| Average Annual Total Returns for the Period-Ended April 30, 20211 | ||||||||
| Class | Sales Charge | Inception Date | Six Months | One Year | Five Years or Since Inception | Ten Years | Gross Expense Ratio2 | |
| Class A Shares | Maximum 4.5% Initial Sales Charge | With sales charges | 1/3/1995 | -3.42% | -0.27% | 1.82% | 2.05% | 0.98% |
| Excluding sales charges | 1.13 | 4.43 | 2.76 | 2.52 | 0.98 | |||
| Investor Class Shares | Maximum 4% Initial Sales Charge | With sales charges | 2/28/2008 | -3.07 | -0.58 | 1.52 | 1.79 | 1.28 |
| Excluding sales charges | 0.97 | 4.11 | 2.46 | 2.26 | 1.28 | |||
| Class B Shares3 | Maximum 5% CDSC | With sales charges | 5/1/1986 | -4.36 | -1.76 | 1.31 | 1.49 | 2.03 |
| if Redeemed Within the First Six Years of Purchase | Excluding sales charges | 0.60 | 3.24 | 1.69 | 1.49 | 2.03 | ||
| Class C Shares | Maximum 1% CDSC | With sales charges | 9/1/1998 | -0.39 | 2.35 | 1.69 | 1.50 | 2.03 |
| if Redeemed Within One Year of Purchase | Excluding sales charges | 0.60 | 3.35 | 1.69 | 1.50 | 2.03 | ||
| Class I Shares | No Sales Charge | 1/2/2004 | 1.24 | 4.65 | 3.04 | 2.78 | 0.73 | |
| Class R6 Shares | No Sales Charge | 11/1/2019 | 1.39 | 4.84 | 3.50 | N/A | 0.58 | |
| 1. | Effective February 28, 2019 and June 21, 2019, the Fund modified its principal investment strategies. The past performance in the bar chart and table prior to those dates reflects the Fund’s prior principal investment strategies. |
| 2. | The gross expense ratios presented reflect the Fund’s “Total Annual Fund Operating Expenses” from the most recent Prospectus, as supplemented, and may differ from other expense ratios disclosed in this report. |
| 3. | Class B shares are closed to all new purchases as well as additional investments by existing Class B shareholders. |
| Benchmark Performance | Six Months | One Year | Five Years | Ten Years |
| Bloomberg Barclays 5-10 Year Taxable Municipal Bond Index1 | 0.62% | 4.76% | 4.34% | 5.12% |
| Bloomberg Barclays Taxable Municipal Bond Index2 | 0.95 | 5.34 | 5.45 | 6.71 |
| Morningstar Intermediate Core Bond Category Average3 | -0.87 | 1.48 | 3.29 | 3.32 |
| 1. | The Fund has selected the Bloomberg Barclays 5-10 Year Taxable Municipal Bond Index as its primary benchmark as a replacement for the Bloomberg Barclays Taxable Municipal Bond Index because it believes that the Bloomberg Barclays 5-10 Year Taxable Municipal Bond Index is more reflective of its current investment style. The Bloomberg Barclays 5-10 Year Taxable Municipal Bond Index is the 5-10 year component of the Bloomberg Barclays Taxable Municipal Bond Index. |
| 2. | The Bloomberg Barclays Taxable Municipal Index is a rules-based, market value weighted index engineered for the long-term taxable bond market. Results assume reinvestment of all income and capital gains. An investment cannot be made directly in an index. |
| 3. | The Morningstar Intermediate Core Bond Category Average is representative of funds that invest primarily in investment-grade U.S. fixed-income issues including government, corporate, and securitized debt, and hold less than 5% in below-investment-grade exposures. Their durations (a measure of interest-rate sensitivity) typically range between 75% and 125% of the three-year average of the effective duration of the Morningstar Core Bond Index. Results are based on average total returns of similar funds with all dividends and capital gain distributions reinvested. |
| 6 | MainStay MacKay U.S. Infrastructure Bond Fund |
| Share Class | Beginning Account Value 11/1/20 | Ending Account Value (Based on Actual Returns and Expenses) 4/30/21 | Expenses Paid During Period1 | Ending Account Value (Based on Hypothetical 5% Annualized Return and Actual Expenses) 4/30/21 | Expenses Paid During Period1 | Net Expense Ratio During Period2 |
| Class A Shares | $1,000.00 | $1,011.30 | $4.24 | $1,020.58 | $4.26 | 0.85% |
| Investor Class Shares | $1,000.00 | $1,009.70 | $5.88 | $1,018.94 | $5.91 | 1.18% |
| Class B Shares | $1,000.00 | $1,006.00 | $9.60 | $1,015.22 | $9.64 | 1.93% |
| Class C Shares | $1,000.00 | $1,006.00 | $9.60 | $1,015.22 | $9.64 | 1.93% |
| Class I Shares | $1,000.00 | $1,012.40 | $2.99 | $1,021.82 | $3.01 | 0.60% |
| Class R6 Shares | $1,000.00 | $1,013.90 | $2.65 | $1,022.17 | $2.66 | 0.53% |
| 1. | Expenses are equal to the Fund’s annualized expense ratio of each class multiplied by the average account value over the period, divided by 365 and multiplied by 181 (to reflect the six-month period). The table above represents the actual expenses incurred during the six-month period. In addition to the fees and expenses which the Fund bears directly, it also indirectly bears a pro rata share of the fees and expenses of the underlying funds in which it invests. Such indirect expenses are not included in the above-reported expense figures. |
| 2. | Expenses are equal to the Fund's annualized expense ratio to reflect the six-month period. |

| 1. | State of New York, 1.84%, due 3/15/30 |
| 2. | California Health Facilities Financing Authority, 2.584%-2.984%, due 6/1/29–6/1/33 |
| 3. | State of Illinois, 3.00%-6.875%, due 3/1/23–4/1/35 |
| 4. | Guam Government Waterworks Authority, 2.75%-3.25%, due 7/1/30–7/1/34 |
| 5. | Texas Transportation Commission, 1.383%, due 10/1/28 |
| 6. | Reading Area Water Authority, 2.209%-2.439%, due 12/1/28–12/1/31 |
| 7. | South Carolina Public Service Authority, 3.922%-4.322%, due 12/1/24–12/1/27 |
| 8. | Pennsylvania Economic Development Financing Authority, 1.364%-6.532%, due 6/15/26–6/15/39 |
| 9. | State of Connecticut, 2.098%-5.85%, due 7/1/25–3/15/32 |
| 10. | State of Connecticut, 4.00%, due 5/1/37 |
| 8 | MainStay MacKay U.S. Infrastructure Bond Fund |
| 1. | See page 5 for other share class returns, which may be higher or lower than Class I share returns. See page 6 for more information on benchmark and peer group returns. |
| 2. | The yield curve is a line that plots the yields of various securities of similar quality—typically U.S. Treasury issues—across a range of maturities. The U.S. Treasury yield curve serves as a benchmark for other debt and is used in economic forecasting. |
| 3. | An obligation rated ‘AAA’ has the highest rating assigned by Standard & Poor’s (“S&P”), and in the opinion of S&P, the obligor’s capacity to meet its financial commitment on the obligation is extremely strong. An obligation rated ‘AA’ by S&P is deemed by S&P to differ from the highest-rated obligations only to a small degree. In the opinion of S&P, the obligor's capacity to meet its financial commitment on the obligation is very strong. When applied to Fund holdings, ratings are based solely on the creditworthiness of the bonds in the portfolio and are not meant to represent the security or safety of the Fund. |
| 4. | Duration is a measure of the price sensitivity of a fixed-income investment to changes in interest rates. Duration is expressed as a number of years and is considered a more accurate sensitivity gauge than average maturity. |
| 5. | Modified duration is inversely related to the approximate percentage change in price for a given change in yield. Duration to worst is the duration of a bond computed using the bond’s nearest call date or maturity, whichever comes first. This measure ignores future cash flow fluctuations due to embedded optionality. |
| 6. | An obligation rated ‘A’ by S&P is deemed by S&P to be somewhat more susceptible to the adverse effects of changes in circumstances and economic conditions than obligations in higher-rated categories. In the opinion of S&P, however, the obligor's capacity to meet its financial commitment on the obligation is still strong. When applied to Fund holdings, ratings are based solely on the creditworthiness of the bonds in the portfolio and are not meant to represent the security or safety of the Fund. |
| 10 | MainStay MacKay U.S. Infrastructure Bond Fund |
| Principal Amount | Value | |
| Long-Term Bonds 92.8% | ||
| Asset-Backed Security 0.0% ‡ | ||
| Other Asset-Backed Security 0.0% ‡ | ||
| Atlantic City Electric Transition Funding LLC | ||
| Series 2002-1, Class A4 | ||
| 5.55%, due 10/20/23 | $ 185,157 | $ 188,643 |
| Total Asset-Backed Security (Cost $187,039) | 188,643 | |
| Corporate Bonds 3.9% | ||
| Commercial Services 0.8% | ||
| Howard University | ||
| Series 2020, Insured: AGM | ||
| 1.991%, due 10/1/25 | 2,860,000 | 2,871,394 |
| Series 2020, Insured: AGM | ||
| 2.657%, due 10/1/26 | 1,500,000 | 1,527,236 |
| 4,398,630 | ||
| Electric 0.2% | ||
| Duke Energy Florida Project Finance LLC | ||
| Series 2026 | ||
| 2.538%, due 9/1/29 | 1,100,000 | 1,132,928 |
| Entertainment 0.3% | ||
| Smithsonian Institution | ||
| 1.967%, due 9/1/31 | 1,500,000 | 1,539,215 |
| Healthcare-Services 2.2% | ||
| Adventist Health System | ||
| 3.378%, due 3/1/23 | 1,600,000 | 1,665,443 |
| Baptist Health Obligated Group | ||
| 3.289%, due 12/1/28 | 650,000 | 661,162 |
| OhioHealth Corp. | ||
| Series 2020 | ||
| 2.175%, due 11/15/27 | 1,040,000 | 1,077,518 |
| Rogers Memorial Hospital, Inc. | ||
| Series 2019 | ||
| 2.631%, due 7/1/26 | 1,080,000 | 1,134,959 |
| Series 2019 | ||
| 2.988%, due 7/1/29 | 505,000 | 524,163 |
| Series 2019 | ||
| 3.188%, due 7/1/31 | 640,000 | 651,097 |
| Series 2019 | ||
| 3.792%, due 7/1/39 | 2,480,000 | 2,552,871 |
| Principal Amount | Value | |
| Healthcare-Services (continued) | ||
| Sun Health Services | ||
| Series 19B | ||
| 2.98%, due 11/15/27 | $ 1,110,000 | $ 1,110,299 |
| Sutter Health | ||
| Series 20A | ||
| 2.294%, due 8/15/30 | 1,000,000 | 991,709 |
| Toledo Hospital (The) | ||
| Series B | ||
| 5.325%, due 11/15/28 | 2,000,000 | 2,315,740 |
| 12,684,961 | ||
| Leisure Time 0.4% | ||
| YMCA of Greater New York | ||
| Series 2018 | ||
| 5.021%, due 8/1/38 | 2,440,000 | 2,544,085 |
| Total Corporate Bonds (Cost $21,711,327) | 22,299,819 | |
| Municipal Bonds 88.8% | ||
| Arizona 0.6% | ||
| Arizona Industrial Development Authority, Provident Group, NCCU Properties LLC, Central University Project, Revenue Bonds | ||
| Series B, Insured: BAM | ||
| 3.10%, due 6/1/25 | 600,000 | 616,910 |
| Arizona Industrial Development Authority, Voyager Foundation Inc., Project, Revenue Bonds | ||
| Series 2020 | ||
| 3.65%, due 10/1/29 | 1,115,000 | 1,078,734 |
| Series 2020 | ||
| 3.90%, due 10/1/34 | 1,900,000 | 1,785,146 |
| 3,480,790 | ||
| Arkansas 0.3% | ||
| City of Rogers AR, Revenue Bonds | ||
| Series A | ||
| 3.828%, due 11/1/25 | 1,675,000 | 1,877,846 |
| California 17.2% | ||
| Anaheim Housing and Public Improvements Authority, Water System, Revenue Bonds | ||
| Series B | ||
| 1.998%, due 10/1/27 | 1,000,000 | 1,027,318 |
| Principal Amount | Value | |
| Municipal Bonds (continued) | ||
| California (continued) | ||
| Anaheim Housing and Public Improvements Authority, Water System, Revenue Bonds (continued) | ||
| Series B | ||
| 2.123%, due 10/1/28 | $ 1,000,000 | $ 1,023,976 |
| Series B | ||
| 2.273%, due 10/1/30 | 1,000,000 | 1,018,429 |
| Antelope Valley Community College District, Unlimited General Obligation | ||
| 2.338%, due 8/1/31 | 2,000,000 | 2,066,754 |
| Bay Area Toll Authority, Revenue Bonds | ||
| Series F-1 | ||
| 2.069%, due 4/1/31 | 3,065,000 | 3,027,899 |
| Series F-1 | ||
| 2.574%, due 4/1/31 | 1,500,000 | 1,563,819 |
| California Educational Facilities Authority, Chapman University, Revenue Bonds | ||
| Series A | ||
| 3.281%, due 4/1/28 | 1,000,000 | 1,050,190 |
| Series A | ||
| 3.661%, due 4/1/33 | 3,300,000 | 3,431,075 |
| California Health Facilities Financing Authority, Personal Income Tax, No Place Like Home Program, Revenue Bonds, Senior Lien | ||
| 2.584%, due 6/1/29 | 3,000,000 | 3,126,254 |
| 2.864%, due 6/1/31 | 4,000,000 | 4,153,776 |
| 2.984%, due 6/1/33 | 2,370,000 | 2,447,187 |
| California Infrastructure and Economic Development Bank, J. David Gladstone Institutes (The), Revenue Bonds | ||
| 3.20%, due 10/1/29 | 1,785,000 | 1,843,032 |
| California Municipal Finance Authority, Harvey Mudd College, Revenue Bonds | ||
| 2.262%, due 12/1/30 | 1,520,000 | 1,520,342 |
| California State University, Revenue Bonds | ||
| Series D | ||
| 1.74%, due 11/1/30 | 750,000 | 730,505 |
| California Statewide Communities Development Authority, California Independent System Operator Corp., Green Bond, Revenue Bonds | ||
| 0.932%, due 2/1/26 | 1,100,000 | 1,095,096 |
| Principal Amount | Value | |
| California (continued) | ||
| California Statewide Communities Development Authority, Buck Institute for Research on Aging, Revenue Bonds | ||
| Insured: AGM | ||
| 2.148%, due 11/15/30 | $ 3,985,000 | $ 3,898,814 |
| City of Montebello CA, Revenue Bonds | ||
| Insured: AGM | ||
| 3.343%, due 6/1/31 | 1,000,000 | 1,057,404 |
| Insured: AGM | ||
| 3.393%, due 6/1/32 | 1,000,000 | 1,055,695 |
| City of Sacramento CA, Water, Revenue Bonds | ||
| 2.297%, due 9/1/30 | 1,000,000 | 1,028,675 |
| City of San Buenaventura CA, Water Revenue, Revenue Bonds | ||
| 2.727%, due 1/1/40 | 2,755,000 | 2,712,889 |
| Coast Community College District, Unlimited General Obligation | ||
| 2.588%, due 8/1/29 | 2,565,000 | 2,754,648 |
| County of Riverside, Revenue Bonds | ||
| 2.667%, due 2/15/25 | 4,000,000 | 4,188,830 |
| El Cajon Redevelopment Agency, Cajon Redevelopment Project, Tax Allocation | ||
| Insured: AGM-CR AMBAC | ||
| 7.70%, due 10/1/30 | 2,000,000 | 2,681,695 |
| El Dorado Irrigation District, Revenue Bonds | ||
| Series C | ||
| 2.055%, due 3/1/29 | 4,500,000 | 4,529,039 |
| El Rancho Unified School District, Unlimited General Obligation | ||
| Insured: AGM | ||
| 2.60%, due 8/1/26 | 1,250,000 | 1,285,222 |
| Foothill-Eastern Transportation Corridor Agency, Revenue Bonds, Senior Lien | ||
| Series B, Insured: AGM | ||
| 2.291%, due 1/15/33 | 1,700,000 | 1,659,159 |
| Inglewood Joint Powers Authority, City of Inglewood, Revenue Bonds | ||
| Insured: BAM | ||
| 3.469%, due 8/1/29 | 1,000,000 | 1,078,266 |
| La Quinta Redevelopment Agency Successor Agency | ||
| 2.354%, due 9/1/30 | 1,475,000 | 1,514,267 |
| 12 | MainStay MacKay U.S. Infrastructure Bond Fund |
| Principal Amount | Value | |
| Municipal Bonds (continued) | ||
| California (continued) | ||
| Los Angeles Community College District, Election 2008, Unlimited General Obligation | ||
| Series B | ||
| 7.53%, due 8/1/29 | $ 2,250,000 | $ 3,131,416 |
| Lynwood Housing Authority, Revenue Bonds | ||
| 4.00%, due 9/1/29 | 2,370,000 | 2,401,376 |
| Port of Oakland, Revenue Bonds, Senior Lien | ||
| 2.099%, due 5/1/30 | 2,500,000 | 2,487,617 |
| San Bernardino Community College District, Election 2018, Unlimited General Obligation | ||
| Series A-1 | ||
| 2.64%, due 8/1/29 | 3,500,000 | 3,695,122 |
| San Diego County Regional Transportation Commission, Revenue Bonds | ||
| Series A | ||
| 2.499%, due 4/1/30 | 2,000,000 | 2,088,958 |
| San Diego Public Facilities Financing Authority, Water Utility, Revenue Bonds | ||
| Series B | ||
| 1.903%, due 8/1/26 | 2,750,000 | 2,845,030 |
| San Luis Unit/Westlands Water District Financing Authority, Revenue Bonds | ||
| Series A, Insured: AGM | ||
| 1.828%, due 9/1/26 | 3,000,000 | 3,060,647 |
| Series A, Insured: AGM | ||
| 2.028%, due 9/1/27 | 2,000,000 | 2,040,382 |
| Santa Clarita Community College District, Unlimited General Obligation | ||
| 2.632%, due 8/1/28 | 500,000 | 530,490 |
| 2.682%, due 8/1/29 | 600,000 | 635,834 |
| 2.762%, due 8/1/30 | 600,000 | 638,823 |
| 2.812%, due 8/1/31 | 650,000 | 693,577 |
| Solano County Community College District, Unlimited General Obligation | ||
| 2.717%, due 8/1/29 | 450,000 | 470,013 |
| 2.817%, due 8/1/30 | 575,000 | 603,441 |
| 2.867%, due 8/1/31 | 675,000 | 708,374 |
| 2.917%, due 8/1/32 | 650,000 | 681,843 |
| 2.967%, due 8/1/33 | 630,000 | 659,715 |
| Principal Amount | Value | |
| California (continued) | ||
| State of California, Various Purposes, Unlimited General Obligation | ||
| 2.375%, due 10/1/26 | $ 2,100,000 | $ 2,237,555 |
| Transbay Joint Powers Authority, Green Bond, Tax Allocation | ||
| Series 2020A | ||
| 3.58%, due 10/1/32 | 2,730,000 | 2,980,172 |
| University of California, Revenue Bonds | ||
| Series BD | ||
| 3.349%, due 7/1/29 | 1,500,000 | 1,666,388 |
| Ventura County Public Financing Authority, Revenue Bonds | ||
| Series A | ||
| 1.741%, due 11/1/27 | 2,000,000 | 1,993,403 |
| West Contra Costa Unified School District, Unlimited General Obligation | ||
| 2.177%, due 8/1/27 | 4,000,000 | 4,012,865 |
| 98,833,296 | ||
| Colorado 0.8% | ||
| City & County of Denver, Airport System, Revenue Bonds | ||
| Series C | ||
| 1.722%, due 11/15/27 | 3,500,000 | 3,527,804 |
| Colorado Housing and Finance Authority, Revenue Bonds | ||
| Series G-1, Insured: GNMA | ||
| 3.65%, due 11/1/46 | 955,000 | 1,015,406 |
| 4,543,210 | ||
| Connecticut 4.9% | ||
| City of Bridgeport CT, Unlimited General Obligation | ||
| Series D, Insured: BAM | ||
| 2.913%, due 9/15/28 | 1,650,000 | 1,715,660 |
| City of Waterbury CT, Unlimited General Obligation | ||
| Series C | ||
| 2.492%, due 9/1/31 | 2,855,000 | 2,922,931 |
| Connecticut State Health & Educational Facilities Authority, Connecticut State University System, Revenue Bonds | ||
| Insured: BAM | ||
| 1.70%, due 11/1/27 | 6,460,000 | 6,505,635 |
| State of Connecticut, Unlimited General Obligation | ||
| Series A | ||
| 2.098%, due 7/1/25 | 3,000,000 | 3,146,527 |
| Principal Amount | Value | |
| Municipal Bonds (continued) | ||
| Connecticut (continued) | ||
| State of Connecticut, Unlimited General Obligation (continued) | ||
| Series A | ||
| 2.547%, due 7/1/28 | $ 1,000,000 | $ 1,059,733 |
| Series A | ||
| 2.627%, due 7/1/29 | 1,000,000 | 1,062,002 |
| Series A | ||
| 5.85%, due 3/15/32 | 1,000,000 | 1,325,114 |
| State of Connecticut, Special Tax | ||
| Series A | ||
| 4.00%, due 5/1/37 (a) | 4,650,000 | 5,650,266 |
| State of Connecticut Bradley International Airport CFC, Ground Transportation Center Project, Revenue Bonds | ||
| Series B | ||
| 3.024%, due 7/1/25 | 2,045,000 | 2,129,905 |
| 3.431%, due 7/1/28 | 1,195,000 | 1,236,628 |
| Town of Hamden, Unlimited General Obligation | ||
| Series B, Insured: BAM | ||
| 2.80%, due 8/1/31 | 1,250,000 | 1,281,357 |
| 28,035,758 | ||
| Delaware 0.1% | ||
| Delaware Municipal Electric Corp. (The), Middletown & Seaford Project, Revenue Bonds | ||
| Series B, Insured: BAM | ||
| 4.35%, due 10/1/34 | 500,000 | 522,819 |
| District of Columbia 0.2% | ||
| District of Columbia, Revenue Bonds | ||
| Series B | ||
| 2.632%, due 3/1/30 | 1,000,000 | 1,046,300 |
| Florida 6.1% | ||
| City of Deltona FL, Utility System, Revenue Bonds | ||
| Insured: BAM | ||
| 2.539%, due 10/1/41 | 1,250,000 | 1,208,965 |
| City of Miami FL, Street & Sidewalk Improvement Program, Revenue Bonds | ||
| Series B, Insured: AGM | ||
| 4.592%, due 1/1/33 (b) | 1,115,000 | 1,248,763 |
| Principal Amount | Value | |
| Florida (continued) | ||
| County of Broward, Airport System, Revenue Bonds | ||
| Insured: BAM | ||
| 2.504%, due 10/1/28 | $ 1,965,000 | $ 2,064,997 |
| County of Miami-Dade, Transit System, Revenue Bonds | ||
| Series B | ||
| 1.25%, due 7/1/27 | 2,750,000 | 2,710,862 |
| County of Miami-Dade, Revenue Bonds | ||
| Series A | ||
| 1.621%, due 10/1/27 | 2,500,000 | 2,500,537 |
| County of Miami-Dade, Aviation, Revenue Bonds | ||
| Series E | ||
| 2.449%, due 10/1/29 | 1,000,000 | 1,024,140 |
| Series B | ||
| 3.275%, due 10/1/29 | 2,715,000 | 2,952,312 |
| County of Miami-Dade, Water & Sewer System, Revenue Bonds | ||
| Series C | ||
| 2.601%, due 10/1/29 | 2,145,000 | 2,274,403 |
| County of Miami-Dade FL, Aviation, Revenue Bonds | ||
| Series B | ||
| 1.885%, due 10/1/21 | 2,610,000 | 2,628,408 |
| Series B | ||
| 1.885%, due 10/1/21 | 3,390,000 | 3,409,728 |
| Florida Municipal Power Agency, All Requirements Power Supply, Revenue Bonds | ||
| 1.425%, due 10/1/26 | 4,000,000 | 4,010,526 |
| Reedy Creek Improvement District, Limited General Obligation | ||
| Series A | ||
| 2.047%, due 6/1/28 | 2,000,000 | 2,056,223 |
| St Johns County Industrial Development Authority, Flagler Health, Revenue Bonds | ||
| Series B, Insured: AGM | ||
| 2.538%, due 10/1/30 | 2,500,000 | 2,530,366 |
| State Board of Administration Finance Corp., Revenue Bonds | ||
| Series 2020A | ||
| 2.154%, due 7/1/30 | 2,000,000 | 2,001,542 |
| 14 | MainStay MacKay U.S. Infrastructure Bond Fund |
| Principal Amount | Value | |
| Municipal Bonds (continued) | ||
| Florida (continued) | ||
| Tampa-Hillsborough County Expressway Authority, Revenue Bonds | ||
| Series B, Insured: BAM | ||
| 1.64%, due 7/1/27 | $ 2,500,000 | $ 2,534,874 |
| 35,156,646 | ||
| Guam 1.7% | ||
| Antonio B Won Pat International Airport Authority, Revenue Bonds | ||
| Series B | ||
| 3.319%, due 10/1/25 | 1,000,000 | 986,336 |
| Guam Government Waterworks Authority, Revenue Bonds | ||
| Series B | ||
| 2.75%, due 7/1/30 | 6,500,000 | 6,299,954 |
| Series B | ||
| 3.25%, due 7/1/34 | 2,000,000 | 1,932,302 |
| Port Authority of Guam, Revenue Bonds | ||
| Series C | ||
| 4.532%, due 7/1/27 | 500,000 | 530,258 |
| 9,748,850 | ||
| Hawaii 1.0% | ||
| City & County Honolulu, Wastewater System, Revenue Bonds | ||
| Series A | ||
| 0.998%, due 7/1/27 | 1,650,000 | 1,606,908 |
| City & County of Honolulu, Build America Bonds, Unlimited General Obligation | ||
| Series A | ||
| 5.518%, due 12/1/28 | 2,400,000 | 3,024,888 |
| State of Hawaii Airports System, Customer Facility Charge, Revenue Bonds | ||
| Series A | ||
| 3.14%, due 7/1/47 | 1,500,000 | 1,441,701 |
| 6,073,497 | ||
| Illinois 6.9% | ||
| Chicago O'Hare International Airport, Revenue Bonds, Senior Lien | ||
| Series D | ||
| 1.704%, due 1/1/26 | 5,000,000 | 5,105,701 |
| Chicago Transit Authority, Sales Tax Receipts, Revenue Bonds | ||
| Series B | ||
| 2.214%, due 12/1/25 | 1,500,000 | 1,529,642 |
| Principal Amount | Value | |
| Illinois (continued) | ||
| City of Chicago Heights IL, Unlimited General Obligation | ||
| Series A, Insured: BAM | ||
| 7.25%, due 12/1/34 | $ 3,815,000 | $ 5,317,688 |
| City of Chicago IL, Taxable Project, Unlimited General Obligation | ||
| Series C-1, Insured: BAM | ||
| 7.781%, due 1/1/35 | 2,195,000 | 3,215,819 |
| County of Cook, Build America Bonds, Unlimited General Obligation | ||
| Insured: AGM | ||
| 6.229%, due 11/15/34 | 1,725,000 | 2,336,923 |
| Series B | ||
| 6.36%, due 11/15/33 | 1,500,000 | 2,018,098 |
| Lake County Community Unit School District No. 187 North Chicago, Unlimited General Obligation | ||
| Series A, Insured: BAM | ||
| 4.25%, due 1/1/26 | 500,000 | 563,425 |
| Series A, Insured: BAM | ||
| 4.25%, due 1/1/29 | 750,000 | 834,993 |
| Series A, Insured: BAM | ||
| 4.25%, due 1/1/30 | 750,000 | 828,449 |
| Sales Tax Securitization Corp., Revenue Bonds, Second Lien | ||
| Series B, Insured: BAM | ||
| 2.857%, due 1/1/31 | 3,000,000 | 3,147,629 |
| Sales Tax Securitization Corp., Revenue Bonds | ||
| 3.372%, due 1/1/31 | 3,550,000 | 3,834,331 |
| Sangamon County Water Reclamation District, Alternative Revenue Source, Unlimited General Obligation | ||
| Series B | ||
| 2.907%, due 1/1/34 | 1,885,000 | 1,847,454 |
| State of Illinois, Sales Tax, Revenue Bonds | ||
| 3.00%, due 6/15/25 | 3,750,000 | 3,894,693 |
| State of Illinois, Unlimited General Obligation | ||
| Series B | ||
| 4.31%, due 4/1/23 | 500,000 | 523,489 |
| State of Illinois, Build America Bonds, Unlimited General Obligation | ||
| 5.95%, due 3/1/23 | 450,000 | 483,603 |
| Series 3, Insured: AGM | ||
| 6.725%, due 4/1/35 | 1,510,000 | 1,917,563 |
| Principal Amount | Value | |
| Municipal Bonds (continued) | ||
| Illinois (continued) | ||
| State of Illinois, Build America Bonds, Unlimited General Obligation (continued) | ||
| Insured: AGM | ||
| 6.875%, due 7/1/25 | $ 2,000,000 | $ 2,289,313 |
| 39,688,813 | ||
| Indiana 0.4% | ||
| Indiana University, Revenue Bonds | ||
| Series B | ||
| 2.19%, due 6/1/30 | 1,000,000 | 1,041,263 |
| Series B | ||
| 2.29%, due 6/1/31 | 1,250,000 | 1,308,714 |
| 2,349,977 | ||
| Kentucky 1.3% | ||
| Kenton County Airport Board, Customer Facility Charge, Revenue Bonds | ||
| 3.826%, due 1/1/29 | 925,000 | 1,013,090 |
| 4.489%, due 1/1/39 | 2,500,000 | 2,700,717 |
| 4.689%, due 1/1/49 | 1,400,000 | 1,505,623 |
| Kentucky Economic Development Finance Authority, Louisville Arena Project, Revenue Bonds | ||
| Series B, Insured: AGM | ||
| 4.435%, due 12/1/38 | 2,000,000 | 2,188,779 |
| 7,408,209 | ||
| Louisiana 2.3% | ||
| City of Bossier City, Utilities, Revenue Bonds | ||
| Insured: BAM | ||
| 2.00%, due 10/1/30 (a) | 1,650,000 | 1,653,404 |
| City of New Orleans LA, Sewerage Service, Revenue Bonds | ||
| Insured: AGM | ||
| 1.641%, due 6/1/29 | 2,000,000 | 1,932,637 |
| City of New Orleans LA, Water System, Revenue Bonds | ||
| Insured: AGM | ||
| 1.691%, due 12/1/29 | 1,500,000 | 1,450,827 |
| Principal Amount | Value | |
| Louisiana (continued) | ||
| Louisiana Local Government Environmental Facilities & Community Development Authority, East Baton Rouge Sewerage Commission, Revenue Bonds, Sub. Lien | ||
| Series A | ||
| 1.447%, due 2/1/26 | $ 1,900,000 | $ 1,902,461 |
| Series A | ||
| 1.547%, due 2/1/27 | 2,505,000 | 2,480,449 |
| Series A, Insured: AGM | ||
| 2.343%, due 2/1/33 | 2,000,000 | 1,991,923 |
| State of Louisiana Gasoline & Fuels Tax, Revenue Bonds | ||
| Series A-2 | ||
| 1.498%, due 5/1/28 | 1,700,000 | 1,675,228 |
| 13,086,929 | ||
| Maryland 1.5% | ||
| City of Baltimore MD, Water Project, Revenue Bonds | ||
| Series B | ||
| 1.925%, due 7/1/31 | 1,045,000 | 1,046,738 |
| County of Baltimore MD, Build America Bonds, Unlimited General Obligation | ||
| 4.90%, due 11/1/32 | 1,000,000 | 1,238,999 |
| Maryland Community Development Administration, Department of Housing & Community Development, Revenue Bonds | ||
| Series D | ||
| 2.644%, due 3/1/50 | 1,415,000 | 1,455,569 |
| Maryland Economic Development Corp., Seagirt Marine Terminal Project, Revenue Bonds | ||
| Series B | ||
| 4.00%, due 6/1/26 | 3,650,000 | 3,863,520 |
| Series B | ||
| 4.125%, due 6/1/29 | 580,000 | 606,687 |
| Series B | ||
| 4.125%, due 6/1/30 | 500,000 | 517,624 |
| 8,729,137 | ||
| Massachusetts 2.0% | ||
| City of Worcester MA, Limited General Obligation | ||
| Series B, Insured: AGM | ||
| 1.514%, due 11/15/28 | 1,675,000 | 1,664,064 |
| 16 | MainStay MacKay U.S. Infrastructure Bond Fund |
| Principal Amount | Value | |
| Municipal Bonds (continued) | ||
| Massachusetts (continued) | ||
| Commonwealth of Massachusetts, Limited General Obligation | ||
| Series E | ||
| 1.52%, due 11/1/30 | $ 2,400,000 | $ 2,351,372 |
| Massachusetts Development Finance Agency, Berklee College of Music Issue, Revenue Bonds | ||
| Series A | ||
| 1.902%, due 10/1/27 | 1,000,000 | 996,673 |
| Massachusetts Development Finance Agency, Lesley University, Revenue Bonds | ||
| Series B | ||
| 3.165%, due 7/1/32 | 1,705,000 | 1,763,890 |
| Massachusetts Development Finance Agency, Wellforce Obligated Group, Revenue Bonds | ||
| Series B, Insured: AGM | ||
| 4.496%, due 7/1/33 | 2,545,000 | 2,834,845 |
| Massachusetts Port Authority, Revenue Bonds | ||
| Series C | ||
| 2.719%, due 7/1/42 | 2,000,000 | 1,946,219 |
| 11,557,063 | ||
| Michigan 0.7% | ||
| Michigan Finance Authority, Local Government Loan Program, Revenue Bonds | ||
| Series C-1, Insured: State Aid Direct Deposit | ||
| 3.585%, due 11/1/35 | 1,000,000 | 1,060,787 |
| Series E, Insured: State Aid Direct Deposit | ||
| 8.369%, due 11/1/35 | 715,000 | 1,033,738 |
| University of Michigan, Revenue Bonds | ||
| Series B | ||
| 1.672%, due 4/1/30 | 1,870,000 | 1,836,335 |
| 3,930,860 | ||
| Mississippi 0.2% | ||
| State of Mississippi, Unlimited General Obligation | ||
| Series A | ||
| 1.382%, due 11/1/29 | 1,000,000 | 973,203 |
| Principal Amount | Value | |
| Missouri 0.2% | ||
| State of Missouri, Health & Educational Facilities Authority, Revenue Bonds | ||
| Series B | ||
| 2.744%, due 10/1/26 | $ 1,185,000 | $ 1,229,771 |
| Nebraska 0.2% | ||
| Nebraska Public Power District, Revenue Bonds | ||
| Series B-1 | ||
| 2.593%, due 1/1/29 | 1,350,000 | 1,432,811 |
| New Jersey 4.2% | ||
| Casino Reinvestment Development Authority, Inc., Revenue Bonds | ||
| Series B, Insured: NATL-RE | ||
| 5.46%, due 6/1/25 | 2,250,000 | 2,362,402 |
| City of Vineland NJ, Unlimited General Obligation | ||
| 3.193%, due 4/15/29 | 1,175,000 | 1,247,177 |
| New Jersey Economic Development Authority, School Facilities Construction Refunding Bonds, Revenue Bonds | ||
| Series NNN | ||
| 3.282%, due 6/15/25 | 3,675,000 | 3,896,354 |
| New Jersey Economic Development Authority, State Pension Funding Bonds, Revenue Bonds | ||
| Series A, Insured: NATL-RE | ||
| 7.425%, due 2/15/29 | 534,000 | 689,208 |
| New Jersey Educational Facilities Authority, Seton Hall University, Revenue Bonds | ||
| Series D, Insured: AGM | ||
| 2.302%, due 7/1/25 | 1,400,000 | 1,451,973 |
| New Jersey Educational Facilities Authority, Kean University, Revenue Bonds | ||
| Series C | ||
| 3.236%, due 9/1/25 | 2,045,000 | 2,211,450 |
| New Jersey Educational Facilities Authority, The College Of New Jersey, Revenue Bonds | ||
| Series G, Insured: BAM | ||
| 3.459%, due 7/1/32 | 1,330,000 | 1,460,249 |
| Principal Amount | Value | |
| Municipal Bonds (continued) | ||
| New Jersey (continued) | ||
| New Jersey Transportation Trust Fund Authority, Transportation System, Revenue Bonds | ||
| Series B | ||
| 2.631%, due 6/15/24 | $ 4,150,000 | $ 4,324,629 |
| North Hudson Sewerage Authority, Revenue Bonds, Senior Lien | ||
| Insured: AGM | ||
| 2.978%, due 6/1/29 | 1,000,000 | 1,056,008 |
| South Jersey Transportation Authority, Revenue Bonds | ||
| Series B, Insured: BAM | ||
| 2.381%, due 11/1/27 | 1,750,000 | 1,751,669 |
| Series B | ||
| 3.02%, due 11/1/25 | 500,000 | 519,836 |
| Series B | ||
| 3.12%, due 11/1/26 | 500,000 | 518,557 |
| Series B | ||
| 3.26%, due 11/1/27 | 500,000 | 517,927 |
| Series B | ||
| 3.36%, due 11/1/28 | 2,000,000 | 2,066,934 |
| 24,074,373 | ||
| New York 6.3% | ||
| Brookhaven Local Development Corp., Long Island Community Hospital Project, Revenue Bonds | ||
| Series B | ||
| 4.50%, due 10/1/25 | 2,000,000 | 2,100,176 |
| Series B | ||
| 6.00%, due 10/1/30 | 1,855,000 | 2,112,650 |
| City of Yonkers NY, Limited General Obligation | ||
| Series C, Insured: BAM | ||
| 2.818%, due 5/1/28 | 1,000,000 | 1,037,207 |
| Metropolitan Transportation Authority, Revenue Bonds | ||
| Series A-1 | ||
| 5.00%, due 2/1/23 | 5,000,000 | 5,402,783 |
| New York City Industrial Development Agency, Yankee Stadium Project, Revenue Bonds | ||
| Series B, Insured: AGM | ||
| 2.681%, due 3/1/33 | 1,750,000 | 1,732,983 |
| Principal Amount | Value | |
| New York (continued) | ||
| New York State Dormitory Authority, Revenue Bonds | ||
| Series A | ||
| 4.00%, due 3/15/40 | $ 2,000,000 | $ 2,381,327 |
| New York State Dormitory Authority, Montefiore Obligated Group, Revenue Bonds | ||
| Series B, Insured: AGM | ||
| 4.946%, due 8/1/48 | 1,000,000 | 1,135,372 |
| New York State Energy Research & Development Authority, Residential Solar And Energy Efficiency Financing, Green Bond, Revenue Bonds | ||
| Series A | ||
| 3.62%, due 4/1/25 | 750,000 | 798,069 |
| Series A | ||
| 3.77%, due 4/1/26 | 1,045,000 | 1,121,426 |
| Series A | ||
| 3.927%, due 4/1/27 | 995,000 | 1,077,643 |
| Oneida County Local Development Corp., Mohawk Valley Health System Project, Revenue Bonds | ||
| Series B, Insured: AGM | ||
| 2.499%, due 12/1/23 | 3,680,000 | 3,770,548 |
| Series B, Insured: AGM | ||
| 2.549%, due 12/1/24 | 2,455,000 | 2,515,179 |
| Port Authority of New York & New Jersey, Consolidated 159th, Revenue Bonds | ||
| Series B | ||
| 6.04%, due 12/1/29 | 620,000 | 821,010 |
| State of New York, Unlimited General Obligation | ||
| Series B | ||
| 1.84%, due 3/15/30 | 10,000,000 | 10,009,334 |
| 36,015,707 | ||
| Ohio 5.0% | ||
| American Municipal Power, Inc., Hydroelectric Projects, Revenue Bonds | ||
| Series D | ||
| 3.014%, due 2/15/31 | 2,000,000 | 2,081,211 |
| Series C | ||
| 7.334%, due 2/15/28 | 4,000,000 | 5,066,497 |
| 18 | MainStay MacKay U.S. Infrastructure Bond Fund |
| Principal Amount | Value | |
| Municipal Bonds (continued) | ||
| Ohio (continued) | ||
| City of Cleveland OH, Airport System, Revenue Bonds | ||
| Series A, Insured: BAM | ||
| 2.882%, due 1/1/31 | $ 1,400,000 | $ 1,454,638 |
| Dayton Metro Library, Unlimited General Obligation | ||
| 2.676%, due 12/1/29 | 2,035,000 | 2,170,892 |
| JobsOhio Beverage System, Revenue Bonds | ||
| Series B | ||
| 3.985%, due 1/1/29 | 2,050,000 | 2,329,113 |
| Northeast Ohio Regional Sewer District, Wastewater Improvement, Revenue Bonds | ||
| 2.419%, due 11/15/30 | 1,245,000 | 1,307,101 |
| 2.519%, due 11/15/31 | 1,655,000 | 1,738,797 |
| State of Ohio, Higher Education, Unlimited General Obligation | ||
| Series A | ||
| 1.50%, due 8/1/29 | 4,000,000 | 3,936,973 |
| State of Ohio, Common Schools, Unlimited General Obligation | ||
| Series A | ||
| 1.50%, due 9/15/29 | 3,000,000 | 2,948,921 |
| Summit County Development Finance Authority, Franciscan University of Steubenville Project, Revenue Bonds | ||
| Series B | ||
| 5.125%, due 11/1/48 | 1,000,000 | 1,087,478 |
| Series A | ||
| 6.00%, due 11/1/48 (b) | 1,750,000 | 2,015,761 |
| University of Cincinnati, Revenue Bonds | ||
| Series B | ||
| 2.533%, due 6/1/29 | 2,500,000 | 2,635,877 |
| 28,773,259 | ||
| Oregon 2.1% | ||
| Oregon State Facilities Authority, Lewis & Clark College Project, Revenue Bonds | ||
| Series A | ||
| 2.486%, due 10/1/35 | 4,000,000 | 3,697,771 |
| Port of Portland Airport OR, Portland International Airport Customer Facility Charge, Revenue Bonds | ||
| 4.067%, due 7/1/39 | 1,000,000 | 1,054,174 |
| Principal Amount | Value | |
| Oregon (continued) | ||
| State of Oregon, Article Xi-Q State Projects, Unlimited General Obligation | ||
| Series G | ||
| 1.315%, due 5/1/27 | $ 1,000,000 | $ 1,004,628 |
| State of Oregon, Unlimited General Obligation | ||
| 1.70%, due 8/1/29 | 2,135,000 | 2,135,000 |
| 1.70%, due 8/1/29 | 2,000,000 | 2,000,000 |
| 1.80%, due 8/1/30 | 1,000,000 | 1,000,000 |
| Washington & Multnomah Counties School District No. 48J Beaverton, Unlimited General Obligation | ||
| Insured: School Bond Guaranty | ||
| 1.693%, due 6/15/30 | 1,500,000 | 1,496,465 |
| 12,388,038 | ||
| Pennsylvania 6.9% | ||
| Authority Improvement Municipalities, Carlow University, Revenue Bonds | ||
| Series B | ||
| 5.00%, due 11/1/53 | 1,000,000 | 999,660 |
| City of Philadelphia PA, Water & Wastewater, Revenue Bonds | ||
| Series B | ||
| 1.734%, due 11/1/28 | 2,740,000 | 2,746,430 |
| City of Pittsburgh PA, Unlimited General Obligation | ||
| Series B | ||
| 1.679%, due 9/1/30 | 800,000 | 761,831 |
| County of Allegheny, Unlimited General Obligation | ||
| Series C-79 | ||
| 1.248%, due 11/1/26 | 1,875,000 | 1,878,308 |
| Series C-79 | ||
| 1.438%, due 11/1/27 | 3,605,000 | 3,603,430 |
| County of Beaver, Unlimited General Obligation | ||
| Series B, Insured: BAM | ||
| 3.979%, due 11/15/29 | 1,805,000 | 2,069,114 |
| Pennsylvania Economic Development Financing Authority, State System of Higher Education, Revenue Bonds | ||
| 1.364%, due 6/15/26 | 5,000,000 | 5,068,614 |
| Principal Amount | Value | |
| Municipal Bonds (continued) | ||
| Pennsylvania (continued) | ||
| Pennsylvania Economic Development Financing Authority, Build America Bonds, Revenue Bonds | ||
| Series B | ||
| 6.532%, due 6/15/39 | $ 1,495,000 | $ 2,102,656 |
| Philadelphia Authority for Industrial Development, Revenue Bonds | ||
| 1.625%, due 4/15/26 | 1,850,000 | 1,858,070 |
| 2.216%, due 4/15/28 | 2,250,000 | 2,266,372 |
| Reading Area Water Authority, Green Bond, Revenue Bonds | ||
| Insured: BAM | ||
| 2.209%, due 12/1/28 | 2,345,000 | 2,387,189 |
| Insured: BAM | ||
| 2.309%, due 12/1/29 | 2,390,000 | 2,438,266 |
| Insured: BAM | ||
| 2.439%, due 12/1/31 | 3,295,000 | 3,359,563 |
| State Public School Building Authority, School District of Philadelphia (The), Revenue Bonds | ||
| Series A, Insured: State Aid Withholding | ||
| 3.046%, due 4/1/28 | 1,920,000 | 2,054,664 |
| Temple University-of The Commonwealth System of Higher Education, Revenue Bonds | ||
| Insured: State Appropriations | ||
| 1.657%, due 4/1/26 | 2,520,000 | 2,556,363 |
| Insured: State Appropriations | ||
| 1.857%, due 4/1/27 | 3,445,000 | 3,491,693 |
| 39,642,223 | ||
| Rhode Island 1.8% | ||
| Rhode Island Commerce Corp., Historic Structures Tax Credit Financing Program, Revenue Bonds | ||
| Series A | ||
| 3.297%, due 5/1/28 | 1,000,000 | 1,096,548 |
| Rhode Island Health and Educational Building Corp., Rhode Island School of Design, Revenue Bonds | ||
| 1.771%, due 8/15/26 | 1,350,000 | 1,380,191 |
| 1.991%, due 8/15/27 | 2,500,000 | 2,553,587 |
| Rhode Island Turnpike & Bridge Authority, Revenue Bonds | ||
| Series 1 | ||
| 2.761%, due 12/1/29 | 1,570,000 | 1,637,113 |
| Principal Amount | Value | |
| Rhode Island (continued) | ||
| State of Rhode Island, Unlimited General Obligation | ||
| Series D | ||
| 1.80%, due 10/15/31 | $ 4,000,000 | $ 3,974,469 |
| 10,641,908 | ||
| South Carolina 1.4% | ||
| South Carolina Public Service Authority, Revenue Bonds | ||
| Series E | ||
| 3.922%, due 12/1/24 | 813,000 | 900,234 |
| Series E | ||
| 4.322%, due 12/1/27 | 6,040,000 | 7,053,199 |
| 7,953,433 | ||
| Tennessee 0.7% | ||
| Metropolitan Government Nashville & Davidson County Health & Educational Facilities Board, Lipscomb University Project, Revenue Bonds | ||
| Series B | ||
| 4.409%, due 10/1/34 | 1,280,000 | 1,334,428 |
| Tennessee Energy Acquisition Corp., Revenue Bonds | ||
| Series A | ||
| 4.00%, due 5/1/48 (c) | 2,500,000 | 2,669,166 |
| 4,003,594 | ||
| Texas 6.8% | ||
| Central Texas Regional Mobility Authority, Revenue Bonds, Senior Lien | ||
| Series C | ||
| 1.837%, due 1/1/27 | 1,290,000 | 1,290,044 |
| City of Austin TX, Rental Car Special Facility, Revenue Bonds | ||
| Insured: AGM | ||
| 1.71%, due 11/15/29 | 1,645,000 | 1,589,268 |
| City of Brownsville TX, Utilities System, Revenue Bonds | ||
| Series A, Insured: AGM | ||
| 1.477%, due 9/1/27 | 1,500,000 | 1,503,344 |
| City of Corpus Christi TX, Utility System, Revenue Bonds, Junior Lien | ||
| Series B | ||
| 1.489%, due 7/15/27 | 2,250,000 | 2,254,934 |
| Series B | ||
| 1.706%, due 7/15/28 | 2,500,000 | 2,501,824 |
| 20 | MainStay MacKay U.S. Infrastructure Bond Fund |
| Principal Amount | Value | |
| Municipal Bonds (continued) | ||
| Texas (continued) | ||
| City of Dallas TX, Waterworks & Sewer System, Revenue Bonds | ||
| Series D | ||
| 1.347%, due 10/1/26 | $ 1,000,000 | $ 1,011,709 |
| City of Houston TX, Airport System, Revenue Bonds, Sub. Lien | ||
| Series C | ||
| 1.816%, due 7/1/27 | 2,000,000 | 2,026,088 |
| City of Houston TX, Limited General Obligation | ||
| Series B | ||
| 2.366%, due 3/1/28 | 2,855,000 | 2,971,389 |
| Dallas Fort Worth International Airport, Revenue Bonds | ||
| Series C | ||
| 1.749%, due 11/1/27 | 2,000,000 | 2,006,606 |
| El Paso Independent School District, Unlimited General Obligation | ||
| Series A, Insured: PSF | ||
| 5.00%, due 8/15/28 | 4,000,000 | 4,978,131 |
| Gainesville Hospital District, Limited General Obligation | ||
| Series A | ||
| 4.753%, due 8/15/23 | 1,520,000 | 1,615,244 |
| Pflugerville Independent School District, Unlimited General Obligation | ||
| Insured: PSF | ||
| 4.25%, due 2/15/30 (a) | 1,500,000 | 1,805,140 |
| Port of Corpus Christi Authority of Nueces County, Revenue Bonds, Senior Lien | ||
| Series B | ||
| 4.875%, due 12/1/38 | 2,000,000 | 2,243,702 |
| Tarrant County Cultural Education Facilities Finance Corp., Hendrick Medical Center Obligated Group, Revenue Bonds | ||
| Insured: AGM | ||
| 1.824%, due 9/1/27 | 900,000 | 902,356 |
| Insured: AGM | ||
| 2.411%, due 9/1/31 | 2,350,000 | 2,346,314 |
| Texas Transportation Commission, Unlimited General Obligation | ||
| 1.383%, due 10/1/28 | 8,270,000 | 8,186,291 |
| 39,232,384 | ||
| Principal Amount | Value | |
| Utah 0.6% | ||
| County of Salt Lake, Convention Hotel, Revenue Bonds | ||
| 5.25%, due 10/1/34 (b) | $ 3,610,000 | $ 3,596,115 |
| Virginia 1.8% | ||
| Farmville Industrial Development Authority, Longwood University Student Housing Project, Revenue Bonds | ||
| Series B | ||
| 5.00%, due 1/1/34 | 2,000,000 | 2,082,861 |
| Fredericksburg Economic Development Authority, Fredericksburg Stadium Project, Revenue Bonds | ||
| Series A | ||
| 4.00%, due 9/1/29 (b) | 2,315,000 | 2,496,432 |
| Virginia College Building Authority, 21st Century College & Equipment Program, Revenue Bonds | ||
| Series E | ||
| 1.227%, due 2/1/27 | 3,500,000 | 3,496,139 |
| Virginia Resources Authority, Infrastructure Revenue, Revenue Bonds | ||
| Series C, Insured: Moral Obligation | ||
| 2.55%, due 11/1/28 | 2,050,000 | 2,169,045 |
| 10,244,477 | ||
| Washington 1.1% | ||
| Klickitat County Public Utility District No. 1, Revenue Bonds | ||
| Series B, Insured: AGM | ||
| 2.803%, due 12/1/29 | 700,000 | 729,979 |
| Northwest Open Access Network, Revenue Bonds | ||
| 1.485%, due 12/1/26 | 1,100,000 | 1,080,243 |
| 1.685%, due 12/1/27 | 1,260,000 | 1,230,183 |
| 1.95%, due 12/1/28 | 1,865,000 | 1,825,932 |
| 2.04%, due 12/1/29 | 1,000,000 | 970,659 |
| 2.12%, due 12/1/30 | 750,000 | 724,657 |
| 6,561,653 | ||
| West Virginia 0.6% | ||
| County of Ohio, Special District Excise Tax, Revenue Bonds | ||
| Series A | ||
| 4.00%, due 3/1/40 | 3,500,000 | 3,204,971 |
| Principal Amount | Value | |
| Municipal Bonds (continued) | ||
| Wisconsin 0.9% | ||
| State of Wisconsin, Revenue Bonds | ||
| Series A | ||
| 2.399%, due 5/1/30 | $ 2,000,000 | $ 2,085,519 |
| Wisconsin Department of Transportation, Revenue Bonds | ||
| Series I | ||
| 1.007%, due 7/1/26 | 3,000,000 | 2,987,813 |
| 5,073,332 | ||
| Total Municipal Bonds (Cost $500,288,693) | 511,111,252 | |
| U.S. Government & Federal Agencies 0.1% | ||
| Federal Home Loan Mortgage Corporation (Mortgage Pass-Through Securities) 0.1% | ||
| FHLMC Gold Pools, 30 Year | ||
| 4.00%, due 10/1/48 | 183,481 | 201,212 |
| 6.50%, due 4/1/37 | 33,478 | 39,755 |
| 240,967 | ||
| Government National Mortgage Association (Mortgage Pass-Through Security) 0.0% ‡ | ||
| GNMA I, 30 Year | ||
| 6.50%, due 4/15/31 | 123,585 | 141,865 |
| Total U.S. Government & Federal Agencies (Cost $343,779) | 382,832 | |
| Total Long-Term Bonds (Cost $522,530,838) | 533,982,546 | |
| Shares | ||
| Short-Term Investments 6.1% | ||
| Affiliated Investment Company 5.7% | ||
| MainStay U.S. Government Liquidity Fund, 0.01% (d) | 32,448,742 | 32,448,742 |
| Principal Amount | Value | ||
| Short-Term Municipal Note 0.4% | |||
| County of Sacramento Insured: AGM | |||
| 1.56%, due7/10/30 (e)(f) | 2,500,000 | $ 2,493,766 | |
| Total Short-Term Municipal Note (Cost $2,494,592) | 2,493,766 | ||
| Total Short-Term Investments (Cost $34,943,334) | 34,942,508 | ||
| Total Investments (Cost $557,474,172) | 98.9% | 568,925,054 | |
| Other Assets, Less Liabilities | 1.1 | 6,416,531 | |
| Net Assets | 100.0% | $ 575,341,585 | |
| † | Percentages indicated are based on Fund net assets. |
| ‡ | Less than one-tenth of a percent. |
| (a) | Delayed delivery security. |
| (b) | May be sold to institutional investors only under Rule 144A or securities offered pursuant to Section 4(a)(2) of the Securities Act of 1933, as amended. |
| (c) | Coupon rate may change based on changes of the underlying collateral or prepayments of principal. Rate shown was the rate in effect as of April 30, 2021. |
| (d) | Current yield as of April 30, 2021. |
| (e) | Floating rate—Rate shown was the rate in effect as of April 30, 2021. |
| (f) | Variable-rate demand notes (VRDNs)—Provide the right to sell the security at face value on either that day or within the rate-reset period. VRDNs will normally trade as if the maturity is the earlier put date, even though stated maturity is longer. The interest rate is reset on the put date at a stipulated daily, weekly, monthly, quarterly, or other specified time interval to reflect current market conditions. These securities do not indicate a reference rate and spread in their description. The maturity date shown is the final maturity. |
| 22 | MainStay MacKay U.S. Infrastructure Bond Fund |
| Type | Number of Contracts | Expiration Date | Value at Trade Date | Current Notional Amount | Unrealized Appreciation (Depreciation)2 |
| Short Contracts | |||||
| U.S. Treasury 10 Year Notes | (250) | June 2021 | $ (33,577,390) | $ (33,007,813) | $ 569,577 |
| 1. | As of April 30, 2021, cash in the amount of $381,250 was on deposit with a broker or futures commission merchant for futures transactions. |
| 2. | Represents the difference between the value of the contracts at the time they were opened and the value as of April 30, 2021. |
| Abbreviation(s): |
| AGM—Assured Guaranty Municipal Corp. |
| AMBAC—Ambac Assurance Corp. |
| BAM—Build America Mutual Assurance Co. |
| FHLMC—Federal Home Loan Mortgage Corp. |
| GNMA—Government National Mortgage Association |
| NATL-RE—National Public Finance Guarantee Corp. |
| PSF—Permanent School Fund |
| Description | Quoted Prices in Active Markets for Identical Assets (Level 1) | Significant Other Observable Inputs (Level 2) | Significant Unobservable Inputs (Level 3) | Total | |||
| Asset Valuation Inputs | |||||||
| Investments in Securities (a) | |||||||
| Long-Term Bonds | |||||||
| Asset-Backed Security | $ — | $ 188,643 | $ — | $ 188,643 | |||
| Corporate Bonds | — | 22,299,819 | — | 22,299,819 | |||
| Municipal Bonds | — | 511,111,252 | — | 511,111,252 | |||
| U.S. Government & Federal Agencies | — | 382,832 | — | 382,832 | |||
| Total Long-Term Bonds | — | 533,982,546 | — | 533,982,546 | |||
| Short-Term Investments | |||||||
| Affiliated Investment Company | 32,448,742 | — | — | 32,448,742 | |||
| Short-Term Municipal Note | — | 2,493,766 | — | 2,493,766 | |||
| Total Short-Term Investments | 32,448,742 | 2,493,766 | — | 34,942,508 | |||
| Total Investments in Securities | 32,448,742 | 536,476,312 | — | 568,925,054 | |||
| Other Financial Instruments | |||||||
| Futures Contracts (b) | 569,577 | — | — | 569,577 | |||
| Total Investments in Securities and Other Financial Instruments | $ 33,018,319 | $ 536,476,312 | $ — | $ 569,494,631 |
| (a) | For a complete listing of investments and their industries, see the Portfolio of Investments. |
| (b) | The value listed for these securities reflects unrealized appreciation (depreciation) as shown on the Portfolio of Investments. |
| Assets | |
| Investment in unaffiliated securities, at value (identified cost $525,025,430) | $536,476,312 |
| Investment in affiliated investment companies, at value (identified cost $32,448,742) | 32,448,742 |
| Cash collateral on deposit at broker for futures contracts | 381,250 |
| Receivables: | |
| Investment securities sold | 19,487,193 |
| Interest | 4,225,897 |
| Fund shares sold | 1,789,939 |
| Variation margin on futures contracts | 15,624 |
| Other assets | 86,497 |
| Total assets | 594,911,454 |
| Liabilities | |
| Due to custodian | 45,998 |
| Payables: | |
| Investment securities purchased | 18,227,160 |
| Fund shares redeemed | 643,737 |
| Dividend payable | 257,365 |
| Manager (See Note 3) | 195,079 |
| Transfer agent (See Note 3) | 97,277 |
| Professional fees | 45,995 |
| NYLIFE Distributors (See Note 3) | 34,658 |
| Shareholder communication | 12,446 |
| Custodian | 10,154 |
| Total liabilities | 19,569,869 |
| Net assets | $575,341,585 |
| Composition of Net Assets | |
| Shares of beneficial interest outstanding (par value of $.01 per share) unlimited number of shares authorized | $ 655,405 |
| Additional paid-in-capital | 560,845,813 |
| 561,501,218 | |
| Total distributable earnings (loss) | 13,840,367 |
| Net assets | $575,341,585 |
| Class A | |
| Net assets applicable to outstanding shares | $112,794,221 |
| Shares of beneficial interest outstanding | 12,961,049 |
| Net asset value per share outstanding | $ 8.70 |
| Maximum sales charge (4.50% of offering price) | 0.41 |
| Maximum offering price per share outstanding | $ 9.11 |
| Investor Class | |
| Net assets applicable to outstanding shares | $ 18,930,476 |
| Shares of beneficial interest outstanding | 2,165,588 |
| Net asset value per share outstanding | $ 8.74 |
| Maximum sales charge (4.00% of offering price) | 0.36 |
| Maximum offering price per share outstanding | $ 9.10 |
| Class B | |
| Net assets applicable to outstanding shares | $ 1,595,317 |
| Shares of beneficial interest outstanding | 183,307 |
| Net asset value and offering price per share outstanding | $ 8.70 |
| Class C | |
| Net assets applicable to outstanding shares | $ 7,307,528 |
| Shares of beneficial interest outstanding | 839,829 |
| Net asset value and offering price per share outstanding | $ 8.70 |
| Class I | |
| Net assets applicable to outstanding shares | $301,178,695 |
| Shares of beneficial interest outstanding | 34,226,360 |
| Net asset value and offering price per share outstanding | $ 8.80 |
| Class R6 | |
| Net assets applicable to outstanding shares | $133,535,348 |
| Shares of beneficial interest outstanding | 15,164,334 |
| Net asset value and offering price per share outstanding | $ 8.81 |
| 24 | MainStay MacKay U.S. Infrastructure Bond Fund |
| Investment Income (Loss) | |
| Income | |
| Interest | $6,522,300 |
| Dividends-affiliated | 1,074 |
| Other | 144 |
| Total income | 6,523,518 |
| Expenses | |
| Manager (See Note 3) | 1,384,372 |
| Transfer agent (See Note 3) | 349,117 |
| Distribution/Service—Class A (See Note 3) | 136,444 |
| Distribution/Service—Investor Class (See Note 3) | 23,832 |
| Distribution/Service—Class B (See Note 3) | 8,817 |
| Distribution/Service—Class C (See Note 3) | 44,305 |
| Registration | 77,139 |
| Professional fees | 45,983 |
| Shareholder communication | 23,374 |
| Custodian | 14,590 |
| Trustees | 5,575 |
| Insurance | 1,765 |
| Miscellaneous | 11,407 |
| Total expenses before waiver/reimbursement | 2,126,720 |
| Expense waiver/reimbursement from Manager (See Note 3) | (235,543) |
| Net expenses | 1,891,177 |
| Net investment income (loss) | 4,632,341 |
| Realized and Unrealized Gain (Loss) | |
| Net realized gain (loss) on: | |
| Unaffiliated investment transactions | 1,332,954 |
| Futures transactions | 829,996 |
| Net realized gain (loss) | 2,162,950 |
| Net change in unrealized appreciation (depreciation) on: | |
| Unaffiliated investments | (730,971) |
| Futures contracts | 341,676 |
| Net change in unrealized appreciation (depreciation) | (389,295) |
| Net realized and unrealized gain (loss) | 1,773,655 |
| Net increase (decrease) in net assets resulting from operations | $6,405,996 |
for the six months ended April 30, 2021 (Unaudited) and the year ended October 31, 2020
| 2021 | 2020 | |
| Increase (Decrease) in Net Assets | ||
| Operations: | ||
| Net investment income (loss) | $ 4,632,341 | $ 8,862,817 |
| Net realized gain (loss) | 2,162,950 | 7,771,192 |
| Net change in unrealized appreciation (depreciation) | (389,295) | 4,583,107 |
| Net increase (decrease) in net assets resulting from operations | 6,405,996 | 21,217,116 |
| Distributions to shareholders: | ||
| Class A | (2,107,371) | (1,754,280) |
| Investor Class | (342,320) | (324,263) |
| Class B | (25,356) | (20,251) |
| Class C | (130,848) | (93,576) |
| Class I | (6,335,930) | (3,817,800) |
| Class R6 | (2,284,834) | (2,994,329) |
| Total distributions to shareholders | (11,226,659) | (9,004,499) |
| Capital share transactions: | ||
| Net proceeds from sales of shares | 207,423,563 | 506,198,949 |
| Net asset value of shares issued to shareholder in reinvestment of distributions | 8,396,674 | 8,017,362 |
| Cost of shares redeemed | (144,406,218) | (316,791,224) |
| Increase (decrease) in net assets derived from capital share transactions | 71,414,019 | 197,425,087 |
| Net increase (decrease) in net assets | 66,593,356 | 209,637,704 |
| Net Assets | ||
| Beginning of period | 508,748,229 | 299,110,525 |
| End of period | $ 575,341,585 | $ 508,748,229 |
| 26 | MainStay MacKay U.S. Infrastructure Bond Fund |
| Six months ended April 30, 2021 | Year Ended October 31, | ||||||||||
| Class A | 2020 | 2019 | 2018 | 2017 | 2016 | ||||||
| Net asset value at beginning of period | $ 8.77 | $ 8.64 | $ 7.93 | $ 8.33 | $ 8.56 | $ 8.51 | |||||
| Net investment income (loss) (a) | 0.07 | 0.16 | 0.21 | 0.19 | 0.17 | 0.17 | |||||
| Net realized and unrealized gain (loss) on investments | 0.03 | 0.14 | 0.71 | (0.40) | (0.22) | 0.05 | |||||
| Total from investment operations | 0.10 | 0.30 | 0.92 | (0.21) | (0.05) | 0.22 | |||||
| Less distributions: | |||||||||||
| From net investment income | (0.07) | (0.17) | (0.21) | (0.19) | (0.18) | (0.17) | |||||
| From net realized gain on investments | (0.10) | — | — | — | — | — | |||||
| Return of capital | — | — | (0.00)‡ | — | — | — | |||||
| Total distributions | (0.17) | (0.17) | (0.21) | (0.19) | (0.18) | (0.17) | |||||
| Net asset value at end of period | $ 8.70 | $ 8.77 | $ 8.64 | $ 7.93 | $ 8.33 | $ 8.56 | |||||
| Total investment return (b) | 1.13% | 3.45% | 11.76% | (2.54)% | (0.60)% | 2.60% | |||||
| Ratios (to average net assets)/Supplemental Data: | |||||||||||
| Net investment income (loss) | 1.51%†† | 1.84% | 2.52% | 2.31% | 2.07% | 1.99% (c) | |||||
| Net expenses (d) | 0.85%†† | 0.85% | 0.89% | 1.00% | 1.00% | 0.98% (e) | |||||
| Expenses (before waiver/reimbursement) (d) | 0.95%†† | 0.98% | 1.02% | 1.04% | 1.00% | 0.99% | |||||
| Portfolio turnover rate | 26% (f) | 89% (f) | 124% (f) | 58% (g) | 20% (g) | 41% (g) | |||||
| Net assets at end of period (in 000’s) | $ 112,794 | $ 103,475 | $ 84,513 | $ 68,269 | $ 82,828 | $ 93,242 | |||||
| ‡ | Less than one cent per share. |
| †† | Annualized. |
| (a) | Per share data based on average shares outstanding during the period. |
| (b) | Total investment return is calculated exclusive of sales charges and assumes the reinvestment of dividends and distributions. For periods of less than one year, total return is not annualized. |
| (c) | Without the custody fee reimbursement, net investment income (loss) would have been 1.98%. |
| (d) | In addition to the fees and expenses which the Fund bears directly, it also indirectly bears a pro-rata share of the fees and expenses of the underlying funds in which it invests. Such indirect expenses are not included in the above expense ratios. |
| (e) | Without the custody fee reimbursement, net expenses would have been 0.99%. |
| (f) | The portfolio turnover rate includes variable rate demand notes. |
| (g) | The portfolio turnover rates not including mortgage dollar rolls were 52%, 6% and 16% for the years ended October 31, 2018, 2017 and 2016, respectively. |
| Six months ended April 30, 2021* | Year Ended October 31, | ||||||||||
| Investor Class | 2020 | 2019 | 2018 | 2017 | 2016 | ||||||
| Net asset value at beginning of period | $ 8.81 | $ 8.68 | $ 7.97 | $ 8.36 | $ 8.59 | $ 8.54 | |||||
| Net investment income (loss) (a) | 0.05 | 0.14 | 0.19 | 0.16 | 0.15 | 0.15 | |||||
| Net realized and unrealized gain (loss) on investments | 0.03 | 0.13 | 0.71 | (0.39) | (0.23) | 0.05 | |||||
| Total from investment operations | 0.08 | 0.27 | 0.90 | (0.23) | (0.08) | 0.20 | |||||
| Less distributions: | |||||||||||
| From net investment income | (0.05) | (0.14) | (0.19) | (0.16) | (0.15) | (0.15) | |||||
| From net realized gain on investments | (0.10) | — | — | — | — | — | |||||
| Return of capital | — | — | (0.00)‡ | — | — | — | |||||
| Total distributions | (0.15) | (0.14) | (0.19) | (0.16) | (0.15) | (0.15) | |||||
| Net asset value at end of period | $ 8.74 | $ 8.81 | $ 8.68 | $ 7.97 | $ 8.36 | $ 8.59 | |||||
| Total investment return (b) | 0.97% | 3.14% | 11.36% | (2.72)% | (0.91)% | 2.34% | |||||
| Ratios (to average net assets)/Supplemental Data: | |||||||||||
| Net investment income (loss) | 1.19%†† | 1.57% | 2.21% | 1.98% | 1.77% | 1.74% (c) | |||||
| Net expenses (d) | 1.18%†† | 1.15% | 1.21% | 1.33% | 1.30% | 1.23% (e) | |||||
| Expenses (before waiver/reimbursement) (d) | 1.28%†† | 1.28% | 1.35% | 1.44% | 1.30% | 1.24% | |||||
| Portfolio turnover rate | 26% (f) | 89% (f) | 124% (f) | 58% (g) | 20% (g) | 41% (g) | |||||
| Net assets at end of period (in 000’s) | $ 18,930 | $ 19,459 | $ 20,520 | $ 21,012 | $ 24,187 | $ 40,094 | |||||
| * | Unaudited. |
| ‡ | Less than one cent per share. |
| †† | Annualized. |
| (a) | Per share data based on average shares outstanding during the period. |
| (b) | Total investment return is calculated exclusive of sales charges and assumes the reinvestment of dividends and distributions. For periods of less than one year, total return is not annualized. |
| (c) | Without the custody fee reimbursement, net investment income (loss) would have been 1.73%. |
| (d) | In addition to the fees and expenses which the Fund bears directly, it also indirectly bears a pro-rata share of the fees and expenses of the underlying funds in which it invests. Such indirect expenses are not included in the above expense ratios. |
| (e) | Without the custody fee reimbursement, net expenses would have been 1.24%. |
| (f) | The portfolio turnover rate includes variable rate demand notes. |
| (g) | The portfolio turnover rates not including mortgage dollar rolls were 52%, 6% and 16% for the years ended October 31, 2018, 2017 and 2016, respectively. |
| 28 | MainStay MacKay U.S. Infrastructure Bond Fund |
| Six months ended April 30, 2021* | Year Ended October 31, | ||||||||||
| Class B | 2020 | 2019 | 2018 | 2017 | 2016 | ||||||
| Net asset value at beginning of period | $ 8.77 | $ 8.64 | $ 7.94 | $ 8.33 | $ 8.56 | $ 8.51 | |||||
| Net investment income (loss) (a) | 0.02 | 0.07 | 0.12 | 0.10 | 0.08 | 0.08 | |||||
| Net realized and unrealized gain (loss) on investments | 0.03 | 0.14 | 0.70 | (0.39) | (0.22) | 0.05 | |||||
| Total from investment operations | 0.05 | 0.21 | 0.82 | (0.29) | (0.14) | 0.13 | |||||
| Less distributions: | |||||||||||
| From net investment income | (0.02) | (0.08) | (0.12) | (0.10) | (0.09) | (0.08) | |||||
| From net realized gain on investments | (0.10) | — | — | — | — | — | |||||
| Return of capital | — | — | (0.00)‡ | — | — | — | |||||
| Total distributions | (0.12) | (0.08) | (0.12) | (0.10) | (0.09) | (0.08) | |||||
| Net asset value at end of period | $ 8.70 | $ 8.77 | $ 8.64 | $ 7.94 | $ 8.33 | $ 8.56 | |||||
| Total investment return (b) | 0.60% | 2.39% | 10.46% | (3.46)% | (1.66)% | 1.59% | |||||
| Ratios (to average net assets)/Supplemental Data: | |||||||||||
| Net investment income (loss) | 0.45%†† | 0.85% | 1.46% | 1.23% | 1.01% | 0.99% (c) | |||||
| Net expenses (d) | 1.93%†† | 1.90% | 1.96% | 2.08% | 2.05% | 1.98% (e) | |||||
| Expenses (before waiver/reimbursement) (d) | 2.03%†† | 2.03% | 2.10% | 2.19% | 2.05% | 1.99% | |||||
| Portfolio turnover rate | 26% (f) | 89% (f) | 124% (f) | 58% (g) | 20% (g) | 41% (g) | |||||
| Net assets at end of period (in 000’s) | $ 1,595 | $ 1,902 | $ 2,621 | $ 3,224 | $ 4,730 | $ 7,154 | |||||
| * | Unaudited. |
| ‡ | Less than one cent per share. |
| †† | Annualized. |
| (a) | Per share data based on average shares outstanding during the period. |
| (b) | Total investment return is calculated exclusive of sales charges and assumes the reinvestment of dividends and distributions. For periods of less than one year, total return is not annualized. |
| (c) | Without the custody fee reimbursement, net investment income (loss) would have been 0.98%. |
| (d) | In addition to the fees and expenses which the Fund bears directly, it also indirectly bears a pro-rata share of the fees and expenses of the underlying funds in which it invests. Such indirect expenses are not included in the above expense ratios. |
| (e) | Without the custody fee reimbursement, net expenses would have been 1.99%. |
| (f) | The portfolio turnover rate includes variable rate demand notes. |
| (g) | The portfolio turnover rates not including mortgage dollar rolls were 52%, 6% and 16% for the years ended October 31, 2018, 2017 and 2016, respectively. |
| Six months ended April 30, 2021* | Year Ended October 31, | ||||||||||
| Class C | 2020 | 2019 | 2018 | 2017 | 2016 | ||||||
| Net asset value at beginning of period | $ 8.77 | $ 8.64 | $ 7.93 | $ 8.32 | $ 8.55 | $ 8.50 | |||||
| Net investment income (loss) (a) | 0.02 | 0.08 | 0.12 | 0.10 | 0.08 | 0.08 | |||||
| Net realized and unrealized gain (loss) on investments | 0.03 | 0.13 | 0.71 | (0.39) | (0.22) | 0.05 | |||||
| Total from investment operations | 0.05 | 0.21 | 0.83 | (0.29) | (0.14) | 0.13 | |||||
| Less distributions: | |||||||||||
| From net investment income | (0.02) | (0.08) | (0.12) | (0.10) | (0.09) | (0.08) | |||||
| From net realized gain on investments | (0.10) | — | — | — | — | — | |||||
| Return of capital | — | — | (0.00)‡ | — | — | — | |||||
| Total distributions | (0.12) | (0.08) | (0.12) | (0.10) | (0.09) | (0.08) | |||||
| Net asset value at end of period | $ 8.70 | $ 8.77 | $ 8.64 | $ 7.93 | $ 8.32 | $ 8.55 | |||||
| Total investment return (b) | 0.60% | 2.38% | 10.59% | (3.46)% | (1.66)% | 1.59% | |||||
| Ratios (to average net assets)/Supplemental Data: | |||||||||||
| Net investment income (loss) | 0.45%†† | 0.88% | 1.47% | 1.23% | 1.00% | 0.99% (c) | |||||
| Net expenses (d) | 1.93%†† | 1.90% | 1.96% | 2.08% | 2.05% | 1.98% (e) | |||||
| Expenses (before waiver/reimbursement) (d) | 2.03%†† | 2.02% | 2.10% | 2.19% | 2.05% | 1.99% | |||||
| Portfolio turnover rate | 26% (f) | 89% (f) | 124% (f) | 58% (g) | 20% (g) | 41% (g) | |||||
| Net assets at end of period (in 000’s) | $ 7,308 | $ 8,708 | $ 14,152 | $ 7,612 | $ 9,472 | $ 19,338 | |||||
| * | Unaudited. |
| ‡ | Less than one cent per share. |
| †† | Annualized. |
| (a) | Per share data based on average shares outstanding during the period. |
| (b) | Total investment return is calculated exclusive of sales charges and assumes the reinvestment of dividends and distributions. For periods of less than one year, total return is not annualized. |
| (c) | Without the custody fee reimbursement, net investment income (loss) would have been 0.98%. |
| (d) | In addition to the fees and expenses which the Fund bears directly, it also indirectly bears a pro-rata share of the fees and expenses of the underlying funds in which it invests. Such indirect expenses are not included in the above expense ratios. |
| (e) | Without the custody fee reimbursement, net expenses would have been 1.99%. |
| (f) | The portfolio turnover rate includes variable rate demand notes. |
| (g) | The portfolio turnover rates not including mortgage dollar rolls were 52%, 6% and 16% for the years ended October 31, 2018, 2017 and 2016, respectively. |
| 30 | MainStay MacKay U.S. Infrastructure Bond Fund |
| Six months ended April 30, 2021* | Year Ended October 31, | ||||||||||
| Class I | 2020 | 2019 | 2018 | 2017 | 2016 | ||||||
| Net asset value at beginning of period | $ 8.87 | $ 8.73 | $ 8.02 | $ 8.42 | $ 8.64 | $ 8.59 | |||||
| Net investment income (loss) (a) | 0.08 | 0.17 | 0.24 | 0.21 | 0.20 | 0.19 | |||||
| Net realized and unrealized gain (loss) on investments | 0.03 | 0.16 | 0.71 | (0.40) | (0.22) | 0.05 | |||||
| Total from investment operations | 0.11 | 0.33 | 0.95 | (0.19) | (0.02) | 0.24 | |||||
| Less distributions: | |||||||||||
| From net investment income | (0.08) | (0.19) | (0.24) | (0.21) | (0.20) | (0.19) | |||||
| From net realized gain on investments | (0.10) | — | — | — | — | — | |||||
| Return of capital | — | — | (0.00)‡ | — | — | — | |||||
| Total distributions | (0.18) | (0.19) | (0.24) | (0.21) | (0.20) | (0.19) | |||||
| Net asset value at end of period | $ 8.80 | $ 8.87 | $ 8.73 | $ 8.02 | $ 8.42 | $ 8.64 | |||||
| Total investment return (b) | 1.24% | 3.78% | 11.95% | (2.26)% | (0.23)% | 2.83% | |||||
| Ratios (to average net assets)/Supplemental Data: | |||||||||||
| Net investment income (loss) | 1.74%†† | 1.97% | 2.64% | 2.56% | 2.33% | 2.16% (c) | |||||
| Net expenses (d) | 0.60%†† | 0.60% | 0.60% | 0.75% | 0.75% | 0.73% (e) | |||||
| Expenses (before waiver/reimbursement) (d) | 0.70%†† | 0.72% | 0.74% | 0.79% | 0.75% | 0.74% | |||||
| Portfolio turnover rate | 26% (f) | 89% (f) | 124% (f) | 58% (g) | 20% (g) | 41% (g) | |||||
| Net assets at end of period (in 000’s) | $ 301,179 | $ 292,000 | $ 177,305 | $ 5,003 | $ 6,926 | $ 14,061 | |||||
| * | Unaudited. |
| ‡ | Less than one cent per share. |
| †† | Annualized. |
| (a) | Per share data based on average shares outstanding during the period. |
| (b) | Total investment return is calculated exclusive of sales charges and assumes the reinvestment of dividends and distributions. Class I shares are not subject to sales charges. For periods of less than one year, total return is not annualized. |
| (c) | Without the custody fee reimbursement, net investment income (loss) would have been 2.15%. |
| (d) | In addition to the fees and expenses which the Fund bears directly, it also indirectly bears a pro-rata share of the fees and expenses of the underlying funds in which it invests. Such indirect expenses are not included in the above expense ratios. |
| (e) | Without the custody fee reimbursement, net expenses would have been 0.74%. |
| (f) | The portfolio turnover rate includes variable rate demand notes. |
| (g) | The portfolio turnover rates not including mortgage dollar rolls were 52%, 6% and 16% for the years ended October 31, 2018, 2017 and 2016, respectively. |
| Six months ended April 30, 2021* | November 1, 2019 through October 31, | ||
| Class R6 | 2020 ^ | ||
| Net asset value at beginning of period | $ 8.87 | $ 8.72 | |
| Net investment income (loss) (a) | 0.08 | 0.19 | |
| Net realized and unrealized gain (loss) on investments | 0.04 | 0.15 | |
| Total from investment operations | 0.12 | 0.34 | |
| Less distributions: | |||
| From net investment income | (0.08) | (0.19) | |
| From net realized gain on investments | (0.10) | — | |
| Total distributions | (0.18) | (0.19) | |
| Net asset value at end of period | $ 8.81 | $ 8.87 | |
| Total investment return (b) | 1.39% | 3.85% | |
| Ratios (to average net assets)/Supplemental Data: | |||
| Net investment income (loss) | 1.81%†† | 2.16% | |
| Net expenses (c) | 0.53%†† | 0.53% | |
| Expenses (before waiver/reimbursement) (c) | 0.56%†† | 0.58% | |
| Portfolio turnover rate (d) | 26% | 89% | |
| Net assets at end of period (in 000’s) | $ 133,535 | $ 83,204 |
| * | Unaudited. |
| ^ | Inception date. |
| †† | Annualized. |
| (a) | Per share data based on average shares outstanding during the period. |
| (b) | Total investment return is calculated exclusive of sales charges and assumes the reinvestment of dividends and distributions. Class R6 shares are not subject to sales charges. For periods of less than one year, total return is not annualized. |
| (c) | In addition to the fees and expenses which the Fund bears directly, it also indirectly bears a pro-rata share of the fees and expenses of the underlying funds in which it invests. Such indirect expenses are not included in the above expense ratios. |
| (d) | The portfolio turnover rate includes variable rate demand notes. |
| 32 | MainStay MacKay U.S. Infrastructure Bond Fund |
| Class | Commenced Operations |
| Class A | January 3, 1995 |
| Investor Class | February 28, 2008 |
| Class B | May 1, 1986 |
| Class C | September 1, 1998 |
| Class I | January 2, 2004 |
| Class R6 | November 1, 2019 |
| SIMPLE Class | N/A* |
| * | SIMPLE Class shares were registered for sale effective as of August 31, 2020 but have not yet commenced operations. |
| • | Level 1—quoted prices in active markets for an identical asset or liability |
| • | Level 2—other significant observable inputs (including quoted prices for a similar asset or liability in active markets, interest rates and yield curves, prepayment speeds, credit risk, etc.) |
| • | Level 3—significant unobservable inputs (including the Fund's own assumptions about the assumptions that market participants would use in measuring fair value of an asset or liability) |
| • Benchmark yields | • Reported trades |
| • Broker/dealer quotes | • Issuer spreads |
| • Two-sided markets | • Benchmark securities |
| • Bids/offers | • Reference data (corporate actions or material event notices) |
| • Industry and economic events | • Comparable bonds |
| • Monthly payment information |
| 34 | MainStay MacKay U.S. Infrastructure Bond Fund |
| 36 | MainStay MacKay U.S. Infrastructure Bond Fund |
| Asset Derivatives | Interest Rate Contracts Risk | Total |
| Futures Contracts - Net Assets—Net unrealized appreciation on futures contracts (a) | $569,577 | $569,577 |
| Total Fair Value | $569,577 | $569,577 |
| (a) | Includes cumulative appreciation (depreciation) of futures contracts as reported in the Portfolio of Investments. Only current day’s variation margin is reported within the Statement of Assets and Liabilities. |
| Net Realized Gain (Loss) from: | Interest Rate Contracts Risk | Total |
| Futures Contracts | $829,996 | $829,996 |
| Total Net Realized Gain (Loss) | $829,996 | $829,996 |
| Net Change in Unrealized Appreciation (Depreciation) | Interest Rate Contracts Risk | Total |
| Futures Contracts | $341,676 | $341,676 |
| Total Net Change in Unrealized Appreciation (Depreciation) | $341,676 | $341,676 |
| Average Notional Amount | Total |
| Futures Contracts Short | $(33,707,031) |
| 38 | MainStay MacKay U.S. Infrastructure Bond Fund |
| Class | Expense | Waived |
| Class A | $ 73,445 | $— |
| Investor Class | 43,724 | — |
| Class B | 4,043 | — |
| Class C | 20,322 | — |
| Class I | 205,317 | — |
| Class R6 | 2,266 | — |
| Affiliated Investment Companies | Value, Beginning of Period | Purchases at Cost | Proceeds from Sales | Net Realized Gain/(Loss) on Sales | Change in Unrealized Appreciation/ (Depreciation) | Value, End of Period | Dividend Income | Other Distributions | Shares End of Period |
| MainStay U.S. Government Liquidity Fund | $ — | $ 159,886 | $ (127,437) | $ — | $ — | $ 32,449 | $ 1 | $ — | 32,449 |
| Class R6 | $26,316 | 0.0%‡ |
| ‡ | Less than one-tenth of a percent. |
| Federal Tax Cost | Gross Unrealized Appreciation | Gross Unrealized (Depreciation) | Net Unrealized Appreciation/ (Depreciation) | |
| Investments | $557,486,310 | $14,341,058 | $(2,902,314) | $11,438,744 |
| 2020 | |
| Distributions paid from: | |
| Ordinary Income | $9,004,499 |
| Class A | Shares | Amount |
| Period ended April 30, 2021: | ||
| Shares sold | 2,336,935 | $ 20,519,127 |
| Shares issued to shareholders in reinvestment of distributions | 223,803 | 1,966,297 |
| Shares redeemed | (1,526,348) | (13,354,791) |
| Net increase (decrease) in shares outstanding before conversion | 1,034,390 | 9,130,633 |
| Shares converted into Class A (See Note 1) | 128,071 | 1,114,088 |
| Net increase (decrease) | 1,162,461 | $ 10,244,721 |
| Year ended October 31, 2020: | ||
| Shares sold | 3,581,160 | $ 31,130,263 |
| Shares issued to shareholders in reinvestment of distributions | 188,669 | 1,645,048 |
| Shares redeemed | (1,957,726) | (16,997,883) |
| Net increase (decrease) in shares outstanding before conversion | 1,812,103 | 15,777,428 |
| Shares converted into Class A (See Note 1) | 217,000 | 1,885,861 |
| Shares converted from Class A (See Note 1) | (11,740) | (99,177) |
| Net increase (decrease) | 2,017,363 | $ 17,564,112 |
| 40 | MainStay MacKay U.S. Infrastructure Bond Fund |
| Investor Class | Shares | Amount |
| Period ended April 30, 2021: | ||
| Shares sold | 30,043 | $ 298,461 |
| Shares issued to shareholders in reinvestment of distributions | 37,751 | 333,314 |
| Shares redeemed | (107,781) | (950,031) |
| Net increase (decrease) in shares outstanding before conversion | (39,987) | (318,256) |
| Shares converted into Investor Class (See Note 1) | 27,862 | 243,516 |
| Shares converted from Investor Class (See Note 1) | (31,339) | (275,865) |
| Net increase (decrease) | (43,464) | $ (350,605) |
| Year ended October 31, 2020: | ||
| Shares sold | 149,694 | $ 1,311,706 |
| Shares issued to shareholders in reinvestment of distributions | 35,776 | 313,146 |
| Shares redeemed | (225,826) | (1,968,500) |
| Net increase (decrease) in shares outstanding before conversion | (40,356) | (343,648) |
| Shares converted into Investor Class (See Note 1) | 56,369 | 495,075 |
| Shares converted from Investor Class (See Note 1) | (171,249) | (1,493,289) |
| Net increase (decrease) | (155,236) | $ (1,341,862) |
| Class B | Shares | Amount |
| Period ended April 30, 2021: | ||
| Shares sold | 3,882 | $ 41,152 |
| Shares issued to shareholders in reinvestment of distributions | 2,632 | 23,147 |
| Shares redeemed | (15,215) | (132,943) |
| Net increase (decrease) in shares outstanding before conversion | (8,701) | (68,644) |
| Shares converted from Class B (See Note 1) | (24,793) | (216,272) |
| Net increase (decrease) | (33,494) | $ (284,916) |
| Year ended October 31, 2020: | ||
| Shares sold | 15,226 | $ 128,529 |
| Shares issued to shareholders in reinvestment of distributions | 2,122 | 18,468 |
| Shares redeemed | (48,244) | (417,353) |
| Net increase (decrease) in shares outstanding before conversion | (30,896) | (270,356) |
| Shares converted from Class B (See Note 1) | (55,577) | (487,410) |
| Net increase (decrease) | (86,473) | $ (757,766) |
| Class C | Shares | Amount |
| Period ended April 30, 2021: | ||
| Shares sold | 163,125 | $ 1,446,818 |
| Shares issued to shareholders in reinvestment of distributions | 13,076 | 115,023 |
| Shares redeemed | (251,239) | (2,191,109) |
| Net increase (decrease) in shares outstanding before conversion | (75,038) | (629,268) |
| Shares converted from Class C (See Note 1) | (78,178) | (676,242) |
| Net increase (decrease) | (153,216) | $ (1,305,510) |
| Year ended October 31, 2020: | ||
| Shares sold | 1,153,768 | $ 10,234,702 |
| Shares issued to shareholders in reinvestment of distributions | 9,972 | 86,769 |
| Shares redeemed | (1,786,435) | (15,500,354) |
| Net increase (decrease) in shares outstanding before conversion | (622,695) | (5,178,883) |
| Shares converted from Class C (See Note 1) | (22,622) | (197,934) |
| Net increase (decrease) | (645,317) | $ (5,376,817) |
| Class I | Shares | Amount |
| Period ended April 30, 2021: | ||
| Shares sold | 14,546,388 | $ 128,271,509 |
| Shares issued to shareholders in reinvestment of distributions | 646,347 | 5,743,542 |
| Shares redeemed | (13,899,498) | (123,196,509) |
| Net increase (decrease) | 1,293,237 | $ 10,818,542 |
| Year ended October 31, 2020: | ||
| Shares sold | 36,185,559 | $ 318,007,846 |
| Shares issued to shareholders in reinvestment of distributions | 418,535 | 3,695,502 |
| Shares redeemed | (12,947,404) | (114,102,580) |
| Net increase (decrease) in shares outstanding before conversion | 23,656,690 | 207,600,768 |
| Shares converted from Class I (See Note 1) | (11,026,106) | (96,147,647) |
| Net increase (decrease) | 12,630,584 | $ 111,453,121 |
| Class R6 | Shares | Amount |
| Period ended April 30, 2021: | ||
| Shares sold | 6,298,883 | $ 56,846,496 |
| Shares issued to shareholders in reinvestment of distributions | 24,216 | 215,351 |
| Shares redeemed | (515,005) | (4,580,835) |
| Net increase (decrease) in shares outstanding before conversion | 5,808,094 | 52,481,012 |
| Shares converted from Class R6 (See Note 1) | (21,364) | (189,225) |
| Net increase (decrease) | 5,786,730 | $ 52,291,787 |
| Year ended October 31, 2020:(a) | ||
| Shares sold | 16,784,819 | $ 145,385,903 |
| Shares issued to shareholders in reinvestment of distributions | 256,439 | 2,258,429 |
| Shares redeemed | (18,678,194) | (167,804,554) |
| Net increase (decrease) in shares outstanding before conversion | (1,636,936) | (20,160,222) |
| Shares converted into Class R6 (See Note 1) | 11,026,106 | 96,147,647 |
| Shares converted from Class R6 (See Note 1) | (11,566) | (103,126) |
| Net increase (decrease) | 9,377,604 | $ 75,884,299 |
| (a) | The inception date of the class was November 1, 2019. |
| 42 | MainStay MacKay U.S. Infrastructure Bond Fund |
| 44 | MainStay MacKay U.S. Infrastructure Bond Fund |
| 46 | MainStay MacKay U.S. Infrastructure Bond Fund |
| 48 | MainStay MacKay U.S. Infrastructure Bond Fund |
1.
| 2. | This Fund is registered for sale in CA, CT, DE, FL, MA, NJ, NY and VT. |
| 3. | An affiliate of New York Life Investment Management LLC. |
| 1737431MS071-21 | MSINF10-06/21 |
please log in to newyorklifeinvestments.com/accounts.
| Not FDIC/NCUA Insured | Not a Deposit | May Lose Value | No Bank Guarantee | Not Insured by Any Government Agency |


President
| Average Annual Total Returns for the Period-Ended April 30, 2021 | ||||||||
| Class | Sales Charge | Inception Date | Six Months | One Year or Since Inception | Five Years | Ten Years | Gross Expense Ratio1 | |
| Class A Shares2 | No Sales Charge | 1/3/1995 | 0.00% | 0.01% | 0.77% | 0.39% | 0.55% | |
| Investor Class Shares2 | No Sales Charge | 2/28/2008 | 0.00 | 0.01 | 0.62 | 0.32 | 0.90 | |
| Class B Shares2, 3 | No Sales Charge | 5/1/1986 | 0.00 | 0.01 | 0.62 | 0.32 | 0.90 | |
| Class C Shares2 | No Sales Charge | 9/1/1998 | 0.00 | 0.01 | 0.62 | 0.32 | 0.90 | |
| SIMPLE Class Shares2 | No Sales Charge | 8/31/2020 | 0.01 | 0.01 | N/A | N/A | 0.90 | |
| 1. | The gross expense ratios presented reflect the Fund’s “Total Annual Fund Operating Expenses” from the most recent Prospectus, as supplemented, and may differ from other expense ratios disclosed in this report. |
| 2. | As of April 30,2021, MainStay Money Market Fund had an effective 7-day yield of 0.01% for Class A, 0.01% for Investor Class, 0.01% for Class B, 0.01% for Class C and 0.015% for SIMPLE Class shares. The 7-day current yield was 0.01% for Class A, 0.01% for Investor Class, 0.01% for Class B, 0.01% for Class C and 0.015% for SIMPLE Class shares. These yields reflect certain expense limitations. Had these expense limitations not been in effect, the effective 7-day yield would have been -0.04%, -0.08%,-0.08%, -0.08% and -0.08%, for Class A, Investor Class, Class B, Class C and SIMPLE Class shares, respectively, and the 7-day current yield would have been -0.04%, -0.08%, -0.08%, -0.08% and -0.08%, for Class A, Investor Class, Class B, Class C and SIMPLE Class shares, respectively. The current yield reflects the Fund’s earnings better than the Fund’s total return. |
| 3. | Class B shares are closed to all new purchases as well as additional investments by existing Class B shareholders. |
| Benchmark Performance | Six Months | One Year | Five Years | Ten Years |
| Average Lipper Money Market Fund1 | 0.00% | 0.05% | 0.89% | 0.46% |
| Morningstar Prime Money Market Category Average2 | 0.00 | 0.06 | 0.95 | 0.49 |
| 1. | The Average Lipper Money Market Fund is an equally weighted performance average adjusted for capital gains distributions and income dividends of all of the money market funds in the Lipper Universe. Lipper Inc., a wholly-owned subsidiary of Thomson Reuters, is an independent monitor of mutual fund performance. Results do not reflect any deduction of sales charges. Lipper averages are not class specific. Lipper returns are unaudited. Results are based on average total returns of similar funds with all dividend and capital gain distributions reinvested. |
| 2. | The Morningstar Prime Money Market Category Average is representative of funds that invest in short-term money market securities in order to provide a level of current income that is consistent with the preservation of capital. Results are based on average total returns of similar funds with all dividends and capital gain distributions reinvested. |
| 6 | MainStay Money Market Fund |
| Share Class | Beginning Account Value 11/1/20 | Ending Account Value (Based on Actual Returns and Expenses) 4/30/21 | Expenses Paid During Period1 | Ending Account Value (Based on Hypothetical 5% Annualized Return and Actual Expenses) 4/30/21 | Expenses Paid During Period1 | Net Expense Ratio During Period2 |
| Class A Shares | $1,000.00 | $1,000.00 | $0.64 | $1,024.15 | $0.65 | 0.13% |
| Investor Class Shares | $1,000.00 | $1,000.00 | $0.79 | $1,024.00 | $0.80 | 0.16% |
| Class B Shares | $1,000.00 | $1,000.00 | $0.84 | $1,023.95 | $0.85 | 0.17% |
| Class C Shares | $1,000.00 | $1,000.00 | $0.84 | $1,023.95 | $0.85 | 0.17% |
| SIMPLE Class Shares | $1,000.00 | $1,000.10 | $0.79 | $1,024.00 | $0.80 | 0.16% |
| 1. | Expenses are equal to the Fund’s annualized expense ratio of each class multiplied by the average account value over the period, divided by 365 and multiplied by 181 (to reflect the six-month period). The table above represents the actual expenses incurred during the six-month period. In addition to the fees and expenses which the Fund bears directly, it also indirectly bears a pro rata share of the fees and expenses of the underlying funds in which it invests. Such indirect expenses are not included in the above-reported expense figures. |
| 2. | Expenses are equal to the Fund's annualized expense ratio to reflect the six-month period. |

| 8 | MainStay Money Market Fund |
| 1. | See page 5 for other share class returns, which may be higher or lower than Class A share returns. See page 6 for more information on benchmark and peer group returns. |
| 2. | Duration is a measure of the price sensitivity of a fixed-income investment to changes in interest rates. Duration is expressed as a number of years and is considered a more accurate sensitivity gauge than average maturity. |
| 3. | The terms “spread” and “yield spread” may refer to the difference in yield between a security or type of security and comparable U.S. Treasury issues. The terms may also refer to the difference in yield between two specific securities or types of securities at a given time. |
| Principal Amount | Value | |
| Short-Term Investments 100.0% | ||
| Certificates Of Deposit 9.3% | ||
| Bank of Montreal | ||
| 0.17%, due 8/13/21 | $ 17,000,000 | $ 17,000,000 |
| Nordea Bank Abp | ||
| 0.276% (3 Month LIBOR + 0.10%), due 6/7/21 (a) | 20,000,000 | 20,000,000 |
| Royal Bank of Canada | ||
| 0.309% (3 Month LIBOR + 0.12%), due 6/16/21 (a) | 5,000,000 | 5,000,000 |
| Total Certificates Of Deposit (Cost $42,000,000) | 42,000,000 | |
| Commercial Paper 52.2% | ||
| ANZ New Zealand Int'l Ltd. | ||
| 0.17%, due 7/7/21 | 15,000,000 | 14,995,254 |
| 0.17%, due 8/2/21 | 5,000,000 | 4,997,804 |
| BASF SE | ||
| 0.17%, due 6/7/21 | 10,000,000 | 9,998,253 |
| 0.19%, due 6/21/21 (b) | 10,000,000 | 9,997,308 |
| CDP Financial, Inc. (b) | ||
| 0.08%, due 5/6/21 | 3,000,000 | 2,999,967 |
| 0.14%, due 8/18/21 | 17,000,000 | 16,992,794 |
| Exxon Mobil Corp. | ||
| 0.10%, due 5/3/21 | 4,900,000 | 4,899,973 |
| National Australia Bank Ltd. | ||
| 0.259% (3 Month LIBOR + 0.06%), due 11/5/21 (a) | 18,000,000 | 18,000,000 |
| National Bank of Canada | ||
| 0.15%, due 5/3/21 | 5,000,000 | 4,999,958 |
| 0.17%, due 8/2/21 | 15,000,000 | 14,993,413 |
| National Rural Utilities Cooperative Finance Corp. | ||
| 0.15%, due 5/5/21 | 18,000,000 | 17,999,700 |
| 0.15%, due 5/24/21 | 2,000,000 | 1,999,808 |
| Ontario Teachers' Finance Trust | ||
| 0.11%, due 5/19/21 (b) | 18,000,000 | 17,999,010 |
| PSP Capital, Inc. | ||
| 0.11%, due 6/1/21 (b) | 7,000,000 | 6,999,337 |
| Royal Bank of Canada | ||
| 0.13%, due 8/23/21 | 14,000,000 | 13,994,237 |
| Toronto-Dominion Bank (The) | ||
| 0.297% (3 Month LIBOR + 0.11%), due 6/10/21 (a)(b) | 20,000,000 | 20,000,000 |
| Total Capital Canada Ltd. | ||
| 0.18%, due 7/26/21 (b) | 3,000,000 | 2,998,710 |
| 0.16%, due 8/18/21 | 17,000,000 | 16,991,764 |
| UnitedHealth Group, Inc. | ||
| 0.15%, due 6/1/21 | 10,305,000 | 10,303,669 |
| Principal Amount | Value | |
| Commercial Paper (continued) | ||
| UnitedHealth Group, Inc. (continued) | ||
| 0.14%, due 6/2/21 | $ 7,000,000 | $ 6,999,129 |
| Westpac Banking Corp. | ||
| 0.277% (3 Month LIBOR + 0.09%), due 5/28/21 (a)(b) | 15,000,000 | 15,000,072 |
| Total Commercial Paper (Cost $234,160,160) | 234,160,160 | |
| Repurchase Agreements 12.2% | ||
| RBC Capital Markets LLC 0.01%, dated 4/30/21 due 5/3/21 Proceeds at Maturity $39,766,033 (Collateralized by United States Treasury securities with rates between 0.13% and 4.63% and maturity dates between 10/31/22 and 02/15/40, with a Principal Amount of $34,027,700 and a Market Value of $40,561,448) | 39,766,000 | 39,766,000 |
| TD Securities (U.S.A.) LLC 0.01%, dated 4/30/21 due 5/3/21 Proceeds at Maturity $15,000,013 (Collateralized by United States Treasury securities with rate of 4.75% and maturity dates 02/15/41, with a Principal Amount of $10,637,700 and a Market Value of $15,300,076) | 15,000,000 | 15,000,000 |
| Total Repurchase Agreements (Cost $54,766,000) | 54,766,000 | |
| U.S. Treasury Debt 26.3% (c) | ||
| U.S. Treasury Bills | ||
| 0.009%, due 5/20/21 | 6,000,000 | 5,999,972 |
| 10 | MainStay Money Market Fund |
| Principal Amount | Value | ||
| Short-Term Investments (continued) | |||
| U.S. Treasury Debt (continued) (c) | |||
| U.S. Treasury Bills (continued) | |||
| 0.015%, due 5/13/21 | $ 101,000,000 | $ 100,999,504 | |
| 0.015%, due 5/18/21 | 11,000,000 | 10,999,922 | |
| Total U.S. Treasury Debt (Cost $117,999,398) | 117,999,398 | ||
| Total Short-Term Investments (Cost $448,925,558) | 100.0% | 448,925,558 | |
| Other Assets, Less Liabilities | (0.0)‡ | (68,504) | |
| Net Assets | 100.0% | $ 448,857,054 | |
| † | Percentages indicated are based on Fund net assets. |
| ‡ | Less than one-tenth of a percent. |
| (a) | Floating rate—Rate shown was the rate in effect as of April 30, 2021. |
| (b) | May be sold to institutional investors only under Rule 144A or securities offered pursuant to Section 4(a)(2) of the Securities Act of 1933, as amended. |
| (c) | Interest rate shown represents yield to maturity. |
| Abbreviation(s): |
| LIBOR—London Interbank Offered Rate |
| Description | Quoted Prices in Active Markets for Identical Assets (Level 1) | Significant Other Observable Inputs (Level 2) | Significant Unobservable Inputs (Level 3) | Total | |||
| Asset Valuation Inputs | |||||||
| Investments in Securities (a) | |||||||
| Short-Term Investments | |||||||
| Certificates Of Deposit | $ — | $ 42,000,000 | $ — | $ 42,000,000 | |||
| Commercial Paper | — | 234,160,160 | — | 234,160,160 | |||
| Repurchase Agreements | — | 54,766,000 | — | 54,766,000 | |||
| U.S. Treasury Debt | — | 117,999,398 | — | 117,999,398 | |||
| Total Investments in Securities | $ — | $ 448,925,558 | $ — | $ 448,925,558 |
| (a) | For a complete listing of investments and their industries, see the Portfolio of Investments. |
| Assets | |
| Investment in securities, at value (amortized cost $394,159,558) | $394,159,558 |
| Repurchase agreements, at value (amortized cost $54,766,000) | 54,766,000 |
| Receivables: | |
| Interest | 42,871 |
| Fund shares sold | 2,999 |
| Other assets | 253,436 |
| Total assets | 449,224,864 |
| Liabilities | |
| Due to custodian | 482 |
| Payables: | |
| Manager (See Note 3) | 146,188 |
| Transfer agent (See Note 3) | 83,090 |
| Fund shares redeemed | 54,608 |
| Professional fees | 40,014 |
| Shareholder communication | 25,859 |
| Custodian | 15,902 |
| Dividends payable | 1,667 |
| Total liabilities | 367,810 |
| Net assets | $448,857,054 |
| Composition of Net Assets | |
| Shares of beneficial interest outstanding (par value of $.01 per share) unlimited number of shares authorized | $ 448,862 |
| Additional paid-in-capital | 448,365,426 |
| 448,814,288 | |
| Total distributable earnings (loss) | 42,766 |
| Net assets | $448,857,054 |
| Class A | |
| Net assets applicable to outstanding shares | $375,114,541 |
| Shares of beneficial interest outstanding | 375,107,367 |
| Net asset value and offering price per share outstanding | $ 1.00 |
| Investor Class | |
| Net assets applicable to outstanding shares | $ 26,014,221 |
| Shares of beneficial interest outstanding | 26,023,624 |
| Net asset value and offering price per share outstanding | $ 1.00 |
| Class B | |
| Net assets applicable to outstanding shares | $ 27,356,713 |
| Shares of beneficial interest outstanding | 27,359,819 |
| Net asset value and offering price per share outstanding | $ 1.00 |
| Class C | |
| Net assets applicable to outstanding shares | $ 20,346,577 |
| Shares of beneficial interest outstanding | 20,346,151 |
| Net asset value and offering price per share outstanding | $ 1.00 |
| SIMPLE Class | |
| Net assets applicable to outstanding shares | $ 25,002 |
| Shares of beneficial interest outstanding | 25,002 |
| Net asset value and offering price per share outstanding | $ 1.00 |
| 12 | MainStay Money Market Fund |
| Investment Income (Loss) | |
| Income | |
| Interest | $ 342,412 |
| Expenses | |
| Manager (See Note 3) | 951,442 |
| Transfer agent (See Note 3) | 284,907 |
| Registration | 69,193 |
| Professional fees | 41,062 |
| Custodian | 21,179 |
| Shareholder communication | 19,707 |
| Trustees | 5,120 |
| Insurance | 2,369 |
| Miscellaneous | 5,912 |
| Total expenses before waiver/reimbursement | 1,400,891 |
| Expense waiver/reimbursement from Manager (See Note 3) | (1,082,311) |
| Net expenses | 318,580 |
| Net investment income (loss) | 23,832 |
| Realized and Unrealized Gain (Loss) | |
| Net realized gain (loss) on investments | 1,639 |
| Net increase (decrease) in net assets resulting from operations | $ 25,471 |
for the six months ended April 30, 2021 (Unaudited) and the year ended October 31, 2020
| 2021 | 2020 | |
| Increase (Decrease) in Net Assets | ||
| Operations: | ||
| Net investment income (loss) | $ 23,832 | $ 1,571,395 |
| Net realized gain (loss) | 1,639 | 39,794 |
| Net increase (decrease) in net assets resulting from operations | 25,471 | 1,611,189 |
| Distributions to shareholders: | ||
| Class A | (19,868) | (1,296,502) |
| Investor Class | (1,336) | (95,085) |
| Class B | (1,433) | (108,934) |
| Class C | (1,151) | (70,584) |
| SIMPLE Class | (2) | (1) |
| Total distributions to shareholders | (23,790) | (1,571,106) |
| Capital share transactions: | ||
| Net proceeds from sales of shares | 202,559,438 | 684,343,367 |
| Net asset value of shares issued to shareholder in reinvestment of distributions | 21,390 | 1,524,810 |
| Cost of shares redeemed | (255,603,847) | (555,872,249) |
| Increase (decrease) in net assets derived from capital share transactions | (53,023,019) | 129,995,928 |
| Net increase (decrease) in net assets | (53,021,338) | 130,036,011 |
| Net Assets | ||
| Beginning of period | 501,878,392 | 371,842,381 |
| End of period | $ 448,857,054 | $ 501,878,392 |
| 14 | MainStay Money Market Fund |
| Six months ended April 30, 2021* | Year Ended October 31, | ||||||||||
| Class A | 2020 | 2019 | 2018 | 2017 | 2016 | ||||||
| Net asset value at beginning of period | $ 1.00 | $ 1.00 | $ 1.00 | $ 1.00 | $ 1.00 | $ 1.00 | |||||
| Net investment income (loss) (a) | 0.00‡ | 0.00‡ | 0.02 | 0.01 | 0.00‡ | 0.00‡ | |||||
| Net realized and unrealized gain (loss) on investments | 0.00‡ | 0.00‡ | 0.00‡ | (0.00)‡ | 0.00‡ | 0.00‡ | |||||
| Total from investment operations | 0.00‡ | 0.00‡ | 0.02 | 0.01 | 0.00‡ | 0.00‡ | |||||
| Less distributions: | |||||||||||
| From net investment income | (0.00)‡ | (0.00)‡ | (0.02) | (0.01) | (0.00)‡ | (0.00)‡ | |||||
| Net asset value at end of period | $ 1.00 | $ 1.00 | $ 1.00 | $ 1.00 | $ 1.00 | $ 1.00 | |||||
| Total investment return (b) | 0.00% | 0.45% | 1.84% | 1.21% | 0.35% | 0.01% | |||||
| Ratios (to average net assets)/Supplemental Data: | |||||||||||
| Net investment income (loss) | 0.02%†† | 0.37% | 1.82% | 1.20% | 0.32% | 0.02% | |||||
| Net expenses | 0.13%†† | 0.39% | 0.56% | 0.57% | 0.59% | 0.43% | |||||
| Expenses (before waiver/reimbursement) | 0.53%†† | 0.55% | 0.56% | 0.57% | 0.60% | 0.64% | |||||
| Net assets at end of period (in 000’s) | $ 375,115 | $ 415,041 | $ 290,421 | $ 235,855 | $ 227,572 | $ 226,181 | |||||
| * | Unaudited. |
| ‡ | Less than one cent per share. |
| †† | Annualized. |
| (a) | Per share data based on average shares outstanding during the period. |
| (b) | Total investment return is calculated exclusive of sales charges and assumes the reinvestment of distributions. For periods of less than one year, total return is not annualized. |
| Six months ended April 30, 2021* | Year Ended October 31, | ||||||||||
| Investor Class | 2020 | 2019 | 2018 | 2017 | 2016 | ||||||
| Net asset value at beginning of period | $ 1.00 | $ 1.00 | $ 1.00 | $ 1.00 | $ 1.00 | $ 1.00 | |||||
| Net investment income (loss) (a) | (0.00)‡ | 0.00‡ | 0.02 | 0.01 | 0.00‡ | 0.00‡ | |||||
| Net realized and unrealized gain (loss) on investments | 0.00‡ | 0.00‡ | 0.00‡ | (0.00)‡ | 0.00‡ | 0.00‡ | |||||
| Total from investment operations | 0.00‡ | 0.00‡ | 0.02 | 0.01 | 0.00‡ | 0.00‡ | |||||
| Less distributions: | |||||||||||
| From net investment income | (0.00)‡ | (0.00)‡ | (0.02) | (0.01) | (0.00)‡ | (0.00)‡ | |||||
| Net asset value at end of period | $ 1.00 | $ 1.00 | $ 1.00 | $ 1.00 | $ 1.00 | $ 1.00 | |||||
| Total investment return (b) | 0.00% | 0.35% | 1.59% | 0.98% | 0.20% | 0.01% | |||||
| Ratios (to average net assets)/Supplemental Data: | |||||||||||
| Net investment income (loss) | (0.02)%†† | 0.33% | 1.58% | 0.97% | 0.18% | 0.02% | |||||
| Net expenses | 0.16%†† | 0.51% | 0.80% | 0.80% | 0.73% | 0.43% | |||||
| Expenses (before waiver/reimbursement) | 0.88%†† | 0.91% | 0.88% | 0.84% | 0.79% | 0.83% | |||||
| Net assets at end of period (in 000’s) | $ 26,014 | $ 28,427 | $ 28,133 | $ 26,548 | $ 27,087 | $ 58,658 | |||||
| * | Unaudited. |
| ‡ | Less than one cent per share. |
| †† | Annualized. |
| (a) | Per share data based on average shares outstanding during the period. |
| (b) | Total investment return is calculated exclusive of sales charges and assumes the reinvestment of distributions. For periods of less than one year, total return is not annualized. |
| Six months ended April 30, 2021* | Year Ended October 31, | ||||||||||
| Class B | 2020 | 2019 | 2018 | 2017 | 2016 | ||||||
| Net asset value at beginning of period | $ 1.00 | $ 1.00 | $ 1.00 | $ 1.00 | $ 1.00 | $ 1.00 | |||||
| Net investment income (loss) (a) | (0.00)‡ | 0.00‡ | 0.02 | 0.01 | 0.00‡ | 0.00‡ | |||||
| Net realized and unrealized gain (loss) on investments | 0.00‡ | 0.00‡ | 0.00‡ | (0.00)‡ | 0.00‡ | 0.00‡ | |||||
| Total from investment operations | 0.00‡ | 0.00‡ | 0.02 | 0.01 | 0.00‡ | 0.00‡ | |||||
| Less distributions: | |||||||||||
| From net investment income | (0.00)‡ | (0.00)‡ | (0.02) | (0.01) | (0.00)‡ | (0.00)‡ | |||||
| Net asset value at end of period | $ 1.00 | $ 1.00 | $ 1.00 | $ 1.00 | $ 1.00 | $ 1.00 | |||||
| Total investment return (b) | 0.00% | 0.35% | 1.59% | 0.98% | 0.20% | 0.01% | |||||
| Ratios (to average net assets)/Supplemental Data: | |||||||||||
| Net investment income (loss) | (0.02)%†† | 0.35% | 1.59% | 0.96% | 0.17% | 0.02% | |||||
| Net expenses | 0.17%†† | 0.52% | 0.80% | 0.80% | 0.73% | 0.43% | |||||
| Expenses (before waiver/reimbursement) | 0.88%†† | 0.90% | 0.88% | 0.84% | 0.79% | 0.83% | |||||
| Net assets at end of period (in 000’s) | $ 27,357 | $ 30,215 | $ 32,981 | $ 37,284 | $ 43,351 | $ 53,341 | |||||
| * | Unaudited. |
| ‡ | Less than one cent per share. |
| †† | Annualized. |
| (a) | Per share data based on average shares outstanding during the period. |
| (b) | Total investment return is calculated exclusive of sales charges and assumes the reinvestment of distributions. For periods of less than one year, total return is not annualized. |
| Six months ended April 30, 2021* | Year Ended October 31, | ||||||||||
| Class C | 2020 | 2019 | 2018 | 2017 | 2016 | ||||||
| Net asset value at beginning of period | $ 1.00 | $ 1.00 | $ 1.00 | $ 1.00 | $ 1.00 | $ 1.00 | |||||
| Net investment income (loss) (a) | (0.00)‡ | 0.00‡ | 0.02 | 0.01 | 0.00‡ | 0.00‡ | |||||
| Net realized and unrealized gain (loss) on investments | 0.00‡ | 0.00‡ | 0.00‡ | (0.00)‡ | 0.00‡ | 0.00‡ | |||||
| Total from investment operations | 0.00‡ | 0.00‡ | 0.02 | 0.01 | 0.00‡ | 0.00‡ | |||||
| Less distributions: | |||||||||||
| From net investment income | (0.00)‡ | (0.00)‡ | (0.02) | (0.01) | (0.00)‡ | (0.00)‡ | |||||
| Net asset value at end of period | $ 1.00 | $ 1.00 | $ 1.00 | $ 1.00 | $ 1.00 | $ 1.00 | |||||
| Total investment return (b) | 0.00% | 0.35% | 1.60% | 0.98% | 0.20% | 0.01% | |||||
| Ratios (to average net assets)/Supplemental Data: | |||||||||||
| Net investment income (loss) | (0.02)%†† | 0.27% | 1.59% | 0.94% | 0.17% | 0.02% | |||||
| Net expenses | 0.17%†† | 0.50% | 0.80% | 0.80% | 0.73% | 0.43% | |||||
| Expenses (before waiver/reimbursement) | 0.88%†† | 0.90% | 0.88% | 0.84% | 0.79% | 0.83% | |||||
| Net assets at end of period (in 000’s) | $ 20,347 | $ 28,171 | $ 20,308 | $ 22,983 | $ 30,831 | $ 41,311 | |||||
| * | Unaudited. |
| ‡ | Less than one cent per share. |
| †† | Annualized. |
| (a) | Per share data based on average shares outstanding during the period. |
| (b) | Total investment return is calculated exclusive of sales charges and assumes the reinvestment of distributions. For periods of less than one year, total return is not annualized. |
| 16 | MainStay Money Market Fund |
| Six months ended April 30, 2021* | August 31, 2020 through October 31, | ||
| SIMPLE Class | 2020 | ||
| Net asset value at beginning of period | $ 1.00 | $ 1.00 | |
| Net investment income (loss) (a) | (0.00)‡ | (0.00)‡ | |
| Net realized and unrealized gain (loss) on investments | 0.00‡ | 0.00‡ | |
| Total from investment operations | 0.00‡ | 0.00‡ | |
| Less distributions: | |||
| From net investment income | (0.00)‡ | (0.00)‡ | |
| Net asset value at end of period | $ 1.00 | $ 1.00 | |
| Total investment return (b) | 0.01% | 0.00%‡‡ | |
| Ratios (to average net assets)/Supplemental Data: | |||
| Net investment income (loss) | (0.02)%†† | (0.02)%†† | |
| Net expenses | 0.16%†† | 0.19%†† | |
| Expenses (before waiver/reimbursement) | 0.87%†† | 0.95%†† | |
| Net assets at end of period (in 000’s) | $ 25 | $ 25 |
| * | Unaudited. |
| ‡‡ | Less than one-tenth percent. |
| ‡ | Less than one cent per share. |
| †† | Annualized. |
| (a) | Per share data based on average shares outstanding during the period. |
| (b) | Total investment return is calculated exclusive of sales charges and assumes the reinvestment of dividends and distributions. SIMPLE Class shares are not subject to sales charges. For periods of less than one year, total return is not annualized. |
| Class | Commenced Operations |
| Class A | January 3, 1995 |
| Investor Class | February 28, 2008 |
| Class B | May 1, 1986 |
| Class C | September 1, 1998 |
| SIMPLE Class | August 31, 2020 |
| Class R6 | N/A * |
| * | Class R6 shares were registered for sale effective as of February 28, 2020 but have not yet commenced operations. |
| 18 |
| • | Level 1—quoted prices in active markets for an identical asset or liability |
| • | Level 2—other significant observable inputs (including quoted prices for a similar asset or liability in active markets, interest rates and yield curves, prepayment speeds, credit risk, etc.) |
| • | Level 3—significant unobservable inputs (including the Fund's own assumptions about the assumptions that market participants would use in measuring fair value of an asset or liability) |
| • Benchmark yields | • Reported trades |
| • Broker/dealer quotes | • Issuer spreads |
| • Two-sided markets | • Benchmark securities |
| • Bids/offers | • Reference data (corporate actions or material event notices) |
| • Industry and economic events | • Comparable bonds |
| • Monthly payment information |
| 20 |
| Class | Expense | Waived |
| Class A | $125,494 | $— |
| Investor Class | 54,302 | — |
| Class B | 58,256 | — |
| Class C | 46,804 | — |
| SIMPLE Class | 51 | — |
| SIMPLE Class | $25,002 | 100.0% |
| 2020 | |
| Distributions paid from: | |
| Ordinary Income | $1,571,106 |
| 22 |
| Class A (at $1 per share) | Shares |
| Six-month period ended April 30, 2021: | |
| Shares sold | 185,058,557 |
| Shares issued to shareholders in reinvestment of distributions | 4,448 |
| Shares redeemed | (230,594,923) |
| Net increase (decrease) in shares outstanding before conversion | (45,531,918) |
| Shares converted into Class A (See Note 1) | 5,629,879 |
| Shares converted from Class A (See Note 1) | (28,670) |
| Net increase (decrease) | (39,930,709) |
| Year ended October 31, 2020 : | |
| Shares sold | 601,124,007 |
| Shares issued to shareholders in reinvestment of distributions | 1,257,799 |
| Shares redeemed | (492,493,653) |
| Net increase (decrease) in shares outstanding before conversion | 109,888,153 |
| Shares converted into Class A (See Note 1) | 15,683,919 |
| Shares converted from Class A (See Note 1) | (983,961) |
| Net increase (decrease) | 124,588,111 |
| Investor Class (at $1 per share) | Shares |
| Six-month period ended April 30, 2021: | |
| Shares sold | 10,887,096 |
| Shares issued to shareholders in reinvestment of distributions | 348 |
| Shares redeemed | (8,455,704) |
| Net increase (decrease) in shares outstanding before conversion | 2,431,740 |
| Shares converted into Investor Class (See Note 1) | 141,332 |
| Shares converted from Investor Class (See Note 1) | (4,985,904) |
| Net increase (decrease) | (2,412,832) |
| Year ended October 31, 2020 : | |
| Shares sold | 38,675,933 |
| Shares issued to shareholders in reinvestment of distributions | 90,306 |
| Shares redeemed | (23,968,779) |
| Net increase (decrease) in shares outstanding before conversion | 14,797,460 |
| Shares converted into Investor Class (See Note 1) | 1,036,162 |
| Shares converted from Investor Class (See Note 1) | (15,542,396) |
| Net increase (decrease) | 291,226 |
| Class B (at $1 per share) | Shares |
| Six-month period ended April 30, 2021: | |
| Shares sold | 1,149,241 |
| Shares issued to shareholders in reinvestment of distributions | 910 |
| Shares redeemed | (3,971,043) |
| Net increase (decrease) in shares outstanding before conversion | (2,820,892) |
| Shares converted from Class B (See Note 1) | (37,610) |
| Net increase (decrease) | (2,858,502) |
| Year ended October 31, 2020 : | |
| Shares sold | 6,683,934 |
| Shares issued to shareholders in reinvestment of distributions | 107,207 |
| Shares redeemed | (9,441,545) |
| Net increase (decrease) in shares outstanding before conversion | (2,650,404) |
| Shares converted from Class B (See Note 1) | (117,832) |
| Net increase (decrease) | (2,768,236) |
| Class C (at $1 per share) | Shares |
| Six-month period ended April 30, 2021: | |
| Shares sold | 5,464,539 |
| Shares issued to shareholders in reinvestment of distributions | 849 |
| Shares redeemed | (12,578,066) |
| Net increase (decrease) in shares outstanding before conversion | (7,112,678) |
| Shares converted from Class C (See Note 1) | (711,528) |
| Net increase (decrease) | (7,824,206) |
| Year ended October 31, 2020 : | |
| Shares sold | 37,834,493 |
| Shares issued to shareholders in reinvestment of distributions | 69,497 |
| Shares redeemed | (29,968,272) |
| Net increase (decrease) in shares outstanding before conversion | 7,935,718 |
| Shares converted from Class C (See Note 1) | (75,892) |
| Net increase (decrease) | 7,859,826 |
| SIMPLE Class (at $1 per share) | Shares |
| Six-month period ended April 30, 2021: | |
| Shares issued to shareholders in reinvestment of distributions | 1 |
| Net increase (decrease) | 1 |
| Period ended October 31, 2020 (a): | |
| Shares sold | 25,000 |
| Shares issued to shareholders in reinvestment of distributions | 1 |
| Net increase (decrease) | 25,001 |
| (a) | The inception date of the SIMPLE Class was August 31, 2020. |
| 24 |
| 26 | MainStay Money Market Fund |
| 28 | MainStay Money Market Fund |
| 30 |
1.
| 2. | This Fund is registered for sale in CA, CT, DE, FL, MA, NJ, NY and VT. |
| 3. | An affiliate of New York Life Investment Management LLC. |
| 1737111MS071-21 | MSMM10-06/21 |
please log in to newyorklifeinvestments.com/accounts.
| Not FDIC/NCUA Insured | Not a Deposit | May Lose Value | No Bank Guarantee | Not Insured by Any Government Agency |


President

| Average Annual Total Returns for the Period-Ended April 30, 2021 | ||||||||
| Class | Sales Charge | Inception Date | Six Months | One Year or Since Inception | Five Years | Ten Years or Since Inception | Gross Expense Ratio1 | |
| Class A Shares | Maximum 5.5% Initial Sales Charge | With sales charges | 7/1/1995 | 16.51% | 41.24% | 21.47% | 15.02% | 0.97% |
| Excluding sales charges | 23.29 | 49.46 | 22.85 | 15.67 | 0.97 | |||
| Investor Class Shares2 | Maximum 5% Initial Sales Charge | With sales charges | 2/28/2008 | 17.09 | 40.92 | 21.35 | 14.93 | 1.10 |
| Excluding sales charges | 23.26 | 49.12 | 22.74 | 15.58 | 1.10 | |||
| Class B Shares3 | Maximum 5% CDSC | With sales charges | 4/1/2005 | 17.69 | 43.18 | 21.64 | 14.71 | 1.85 |
| if Redeemed Within the First Six Years of Purchase | Excluding sales charges | 22.69 | 48.18 | 21.82 | 14.71 | 1.85 | ||
| Class C Shares | Maximum 1% CDSC | With sales charges | 4/1/2005 | 21.74 | 47.11 | 21.83 | 14.72 | 1.85 |
| if Redeemed Within One Year of Purchase | Excluding sales charges | 22.74 | 48.11 | 21.83 | 14.72 | 1.85 | ||
| Class I Shares | No Sales Charge | 4/1/2005 | 23.47 | 49.83 | 23.18 | 15.95 | 0.72 | |
| Class R1 Shares | No Sales Charge | 4/1/2005 | 23.39 | 49.66 | 23.05 | 15.84 | 0.82 | |
| Class R2 Shares | No Sales Charge | 4/1/2005 | 23.30 | 49.41 | 22.74 | 15.56 | 1.07 | |
| Class R3 Shares | No Sales Charge | 4/28/2006 | 23.06 | 48.93 | 22.44 | 15.27 | 1.32 | |
| Class R6 Shares | No Sales Charge | 6/17/2013 | 23.50 | 49.88 | 23.29 | 18.63 | 0.64 | |
| SIMPLE Class Shares | No Sales Charge | 8/31/2020 | 23.06 | 12.67 | N/A | N/A | 1.35 | |
| 1. | The gross expense ratios presented reflect the Fund’s “Total Annual Fund Operating Expenses” from the most recent Prospectus, as supplemented, and may differ from other expense ratios disclosed in this report. |
| 2. | Prior to June 30, 2020, the maximum initial sales charge was 5.5%, which is reflected in the average annual total return figures shown. |
| 3. | Class B shares are closed to all new purchases as well as additional investments by existing Class B shareholders. |
| Benchmark Performance | Six Months | One Year | Five Years | Ten Years |
| Russell 1000® Growth Index1 | 24.31% | 51.41% | 22.88% | 17.02% |
| S&P 500® Index2 | 28.85 | 45.98 | 17.42 | 14.17 |
| Morningstar Large Growth Category Average3 | 25.34 | 51.64 | 20.63 | 14.64 |
| 1. | The Russell 1000® Growth Index is the Fund’s primary broad-based securities market index for comparison purposes. The Russell 1000® Growth Index measures the performance of the large-cap growth segment of the U.S. equity universe. It includes those Russell 1000® Index companies with higher price-to-book ratios and higher forecasted growth values. Results assume reinvestment of all dividends and capital gains. An investment cannot be made directly in an index. |
| 2. | The S&P 500® Index is the Fund’s secondary benchmark. “S&P 500®” is a trademark of The McGraw-Hill Companies, Inc. The S&P 500® Index is widely regarded as the standard index for measuring large-cap U.S. stock market performance. Results assume reinvestment of all dividends and capital gains. An investment cannot be made directly in an index. |
| 3. | The Morningstar Large Growth Category Average is representative of funds that invest primarily in big U.S. companies that are projected to grow faster than other large-cap stocks. Stocks in the top 70% of the capitalization of the U.S. equity market are defined as large cap. Growth is defined based on fast growth and high valuations. Most of these portfolios focus on companies in rapidly expanding industries. Results are based on average total returns of similar funds with all dividends and capital gain distributions reinvested. |
| 6 | MainStay Winslow Large Cap Growth Fund |
| Share Class | Beginning Account Value 11/1/20 | Ending Account Value (Based on Actual Returns and Expenses) 4/30/21 | Expenses Paid During Period1 | Ending Account Value (Based on Hypothetical 5% Annualized Return and Actual Expenses) 4/30/21 | Expenses Paid During Period1 | Net Expense Ratio During Period2 |
| Class A Shares | $1,000.00 | $1,232.90 | $ 5.20 | $1,020.13 | $4.71 | 0.94% |
| Investor Class Shares | $1,000.00 | $1,232.60 | $ 5.98 | $1,019.44 | $5.41 | 1.08% |
| Class B Shares | $1,000.00 | $1,226.90 | $10.10 | $1,015.72 | $9.15 | 1.83% |
| Class C Shares | $1,000.00 | $1,227.40 | $10.11 | $1,015.72 | $9.15 | 1.83% |
| Class I Shares | $1,000.00 | $1,234.70 | $ 3.82 | $1,021.37 | $3.46 | 0.69% |
| Class R1 Shares | $1,000.00 | $1,233.90 | $ 4.38 | $1,020.88 | $3.96 | 0.79% |
| Class R2 Shares | $1,000.00 | $1,233.00 | $ 5.76 | $1,019.64 | $5.21 | 1.04% |
| Class R3 Shares | $1,000.00 | $1,230.60 | $ 7.13 | $1,018.40 | $6.46 | 1.29% |
| Class R6 Shares | $1,000.00 | $1,235.00 | $ 3.44 | $1,021.72 | $3.11 | 0.62% |
| SIMPLE Class Shares | $1,000.00 | $1,230.60 | $ 7.36 | $1,018.20 | $6.66 | 1.33% |
| 1. | Expenses are equal to the Fund’s annualized expense ratio of each class multiplied by the average account value over the period, divided by 365 and multiplied by 181 (to reflect the six-month period). The table above represents the actual expenses incurred during the six-month period. In addition to the fees and expenses which the Fund bears directly, it also indirectly bears a pro rata share of the fees and expenses of the underlying funds in which it invests. Such indirect expenses are not included in the above-reported expense figures. |
| 2. | Expenses are equal to the Fund's annualized expense ratio to reflect the six-month period. |
| Software | 20.2% |
| IT Services | 14.4 |
| Interactive Media & Services | 12.8 |
| Internet & Direct Marketing Retail | 9.0 |
| Technology Hardware, Storage & Peripherals | 5.7 |
| Semiconductors & Semiconductor Equipment | 4.6 |
| Hotels, Restaurants & Leisure | 4.0 |
| Textiles, Apparel & Luxury Goods | 3.9 |
| Life Sciences Tools & Services | 3.8 |
| Health Care Equipment & Supplies | 3.5 |
| Capital Markets | 2.8 |
| Pharmaceuticals | 1.7 |
| Health Care Providers & Services | 1.6 |
| Road & Rail | 1.5 |
| Personal Products | 1.4 |
| Electronic Equipment, Instruments & Components | 1.3% |
| Chemicals | 1.2 |
| Containers & Packaging | 1.2 |
| Commercial Services & Supplies | 1.1 |
| Health Care Technology | 1.1 |
| Air Freight & Logistics | 1.0 |
| Professional Services | 0.8 |
| Entertainment | 0.7 |
| Specialty Retail | 0.3 |
| Real Estate Management & Development | 0.1 |
| Short–Term Investments | 0.4 |
| Other Assets, Less Liabilities | –0.1 |
| 100.0% |
| 1. | Microsoft Corp. |
| 2. | Amazon.com, Inc. |
| 3. | Alphabet, Inc. |
| 4. | Apple, Inc. |
| 5. | Visa, Inc., Class A |
| 6. | Mastercard, Inc., Class A |
| 7. | Adobe, Inc. |
| 8. | Facebook, Inc., Class A |
| 9. | NVIDIA Corp. |
| 10. | NIKE, Inc., Class B |
| 8 | MainStay Winslow Large Cap Growth Fund |
| 1. | See page 5 for other share class returns, which may be higher or lower than Class I share returns. See page 6 for more information on benchmark and peer group returns. |
| 10 | MainStay Winslow Large Cap Growth Fund |
| Shares | Value | |
| Common Stocks 99.7% | ||
| Air Freight & Logistics 1.0% | ||
| United Parcel Service, Inc., Class B | 817,500 | $ 166,655,550 |
| Capital Markets 2.8% | ||
| Coinbase Global, Inc., Class A (a) | 358,000 | 106,555,120 |
| Moody's Corp. | 738,650 | 241,324,342 |
| MSCI, Inc. | 209,300 | 101,671,661 |
| 449,551,123 | ||
| Chemicals 1.2% | ||
| Linde plc | 654,330 | 187,033,687 |
| Commercial Services & Supplies 1.1% | ||
| Cintas Corp. | 510,150 | 176,073,171 |
| Containers & Packaging 1.2% | ||
| Ball Corp. | 1,980,300 | 185,435,292 |
| Electronic Equipment, Instruments & Components 1.3% | ||
| TE Connectivity Ltd. | 1,489,300 | 200,266,171 |
| Entertainment 0.7% | ||
| Netflix, Inc. (a) | 217,200 | 111,525,684 |
| Health Care Equipment & Supplies 3.5% | ||
| Align Technology, Inc. (a) | 418,400 | 249,169,752 |
| Edwards Lifesciences Corp. (a) | 1,885,400 | 180,093,408 |
| Insulet Corp. (a) | 449,100 | 132,583,302 |
| 561,846,462 | ||
| Health Care Providers & Services 1.6% | ||
| UnitedHealth Group, Inc. | 655,000 | 261,214,000 |
| Health Care Technology 1.1% | ||
| Veeva Systems, Inc., Class A (a) | 617,550 | 174,426,998 |
| Hotels, Restaurants & Leisure 4.0% | ||
| Chipotle Mexican Grill, Inc. (a) | 125,900 | 187,846,577 |
| Hilton Worldwide Holdings, Inc. (a) | 1,684,200 | 216,756,540 |
| Starbucks Corp. | 2,025,500 | 231,899,495 |
| 636,502,612 | ||
| Interactive Media & Services 12.8% | ||
| Alphabet, Inc. (a) | ||
| Class A | 241,090 | 567,405,315 |
| Class C | 243,241 | 586,239,999 |
| Shares | Value | |
| Interactive Media & Services (continued) | ||
| Bumble, Inc., Class A (a) | 1,504,400 | $ 90,625,056 |
| Facebook, Inc., Class A (a) | 1,503,680 | 488,816,294 |
| Pinterest, Inc., Class A (a) | 1,807,300 | 119,950,501 |
| Snap, Inc., Class A (a) | 2,849,100 | 176,131,362 |
| 2,029,168,527 | ||
| Internet & Direct Marketing Retail 9.0% | ||
| Alibaba Group Holding Ltd., Sponsored ADR (a) | 330,300 | 76,282,785 |
| Amazon.com, Inc. (a) | 388,690 | 1,347,751,480 |
| 1,424,034,265 | ||
| IT Services 14.4% | ||
| Mastercard, Inc., Class A | 1,477,700 | 564,570,062 |
| PayPal Holdings, Inc. (a) | 1,510,980 | 396,314,944 |
| Snowflake, Inc., Class A (a) | 626,200 | 145,021,658 |
| Square, Inc., Class A (a) | 900,300 | 220,411,446 |
| Visa, Inc., Class A | 3,087,700 | 721,163,212 |
| Wix.com Ltd. (a) | 736,500 | 234,118,620 |
| 2,281,599,942 | ||
| Life Sciences Tools & Services 3.8% | ||
| Agilent Technologies, Inc. | 1,762,400 | 235,527,136 |
| Bio-Techne Corp. | 200,800 | 85,839,992 |
| IQVIA Holdings, Inc. (a) | 1,195,800 | 280,642,302 |
| 602,009,430 | ||
| Personal Products 1.4% | ||
| Estee Lauder Cos., Inc. (The), Class A | 707,900 | 222,139,020 |
| Pharmaceuticals 1.7% | ||
| Zoetis, Inc. | 1,529,640 | 264,673,609 |
| Professional Services 0.8% | ||
| CoStar Group, Inc. (a) | 147,100 | 125,686,653 |
| Real Estate Management & Development 0.1% | ||
| Compass, Inc., Class A (a)(b) | 482,100 | 9,169,542 |
| Road & Rail 1.5% | ||
| Uber Technologies, Inc. (a) | 4,330,600 | 237,186,962 |
| Semiconductors & Semiconductor Equipment 4.6% | ||
| ASML Holding NV (Registered) | 447,170 | 289,810,877 |
| NVIDIA Corp. | 732,000 | 439,478,160 |
| 729,289,037 | ||
| Shares | Value | |
| Common Stocks (continued) | ||
| Software 20.2% | ||
| Adobe, Inc. (a) | 988,710 | $ 502,600,841 |
| Atlassian Corp. plc, Class A (a) | 903,350 | 214,599,826 |
| DocuSign, Inc. (a) | 804,400 | 179,332,936 |
| Intuit, Inc. | 634,810 | 261,643,290 |
| Microsoft Corp. | 5,402,730 | 1,362,460,451 |
| PTC, Inc. (a) | 1,018,400 | 133,349,296 |
| salesforce.com, Inc. (a) | 642,090 | 147,886,169 |
| ServiceNow, Inc. (a) | 475,600 | 240,829,572 |
| Workday, Inc., Class A (a) | 656,970 | 162,271,590 |
| 3,204,973,971 | ||
| Specialty Retail 0.3% | ||
| Carvana Co. (a) | 194,600 | �� 55,511,596 |
| Technology Hardware, Storage & Peripherals 5.7% | ||
| Apple, Inc. | 6,882,900 | 904,826,034 |
| Textiles, Apparel & Luxury Goods 3.9% | ||
| Lululemon Athletica, Inc. (a) | 634,500 | 212,728,815 |
| NIKE, Inc., Class B | 3,032,040 | 402,109,145 |
| 614,837,960 | ||
| Total Common Stocks (Cost $7,297,542,646) | 15,815,637,298 | |
| Short-Term Investments 0.4% | ||
| Affiliated Investment Company 0.3% | ||
| MainStay U.S. Government Liquidity Fund, 0.01% (c) | 51,116,626 | 51,116,626 |
| Shares | Value | ||
| Unaffiliated Investment Company 0.1% | |||
| BlackRock Liquidity FedFund, 0.05% (c)(d) | 4,028,409 | $ 4,028,409 | |
| Total Short-Term Investments (Cost $55,145,035) | 55,145,035 | ||
| Total Investments (Cost $7,352,687,681) | 100.1% | 15,870,782,333 | |
| Other Assets, Less Liabilities | (0.1) | (10,278,867) | |
| Net Assets | 100.0% | $ 15,860,503,466 | |
| † | Percentages indicated are based on Fund net assets. |
| (a) | Non-income producing security. |
| (b) | All or a portion of this security was held on loan. As of April 30, 2021, the aggregate market value of securities on loan was $9,043,401; the total market value of collateral held by the Fund was $9,155,061. The market value of the collateral held included non-cash collateral in the form of U.S. Treasury securities with a value of $5,126,652. The Fund received cash collateral with a value of $4,028,409. (See Note 2(H)) |
| (c) | Current yield as of April 30, 2021. |
| (d) | Represents a security purchased with cash collateral received for securities on loan. |
| Abbreviation(s): |
| ADR—American Depositary Receipt |
| 12 | MainStay Winslow Large Cap Growth Fund |
| Description | Quoted Prices in Active Markets for Identical Assets (Level 1) | Significant Other Observable Inputs (Level 2) | Significant Unobservable Inputs (Level 3) | Total | |||
| Asset Valuation Inputs | |||||||
| Investments in Securities (a) | |||||||
| Common Stocks | $ 15,815,637,298 | $ — | $ — | $ 15,815,637,298 | |||
| Short-Term Investments | |||||||
| Affiliated Investment Company | 51,116,626 | — | — | 51,116,626 | |||
| Unaffiliated Investment Company | 4,028,409 | — | — | 4,028,409 | |||
| Total Short-Term Investments | 55,145,035 | — | — | 55,145,035 | |||
| Total Investments in Securities | $ 15,870,782,333 | $ — | $ — | $ 15,870,782,333 |
| (a) | For a complete listing of investments and their industries, see the Portfolio of Investments. |
| Assets | |
| Investment in unaffiliated securities, at value (identified cost $7,301,571,055) including securities on loan of $9,043,401 | $15,819,665,707 |
| Investment in affiliated investment companies, at value (identified cost $51,116,626) | 51,116,626 |
| Receivables: | |
| Investment securities sold | 58,035,283 |
| Fund shares sold | 12,643,913 |
| Dividends and interest | 1,034,927 |
| Securities lending | 61,396 |
| Other assets | 256,641 |
| Total assets | 15,942,814,493 |
| Liabilities | |
| Cash collateral received for securities on loan | 4,028,409 |
| Payables: | |
| Investment securities purchased | 56,098,082 |
| Fund shares redeemed | 11,932,291 |
| Manager (See Note 3) | 7,678,529 |
| Transfer agent (See Note 3) | 1,529,782 |
| NYLIFE Distributors (See Note 3) | 618,439 |
| Professional fees | 211,119 |
| Shareholder communication | 152,611 |
| Custodian | 34,070 |
| Accrued expenses | 27,695 |
| Total liabilities | 82,311,027 |
| Net assets | $15,860,503,466 |
| Composition of Net Assets | |
| Shares of beneficial interest outstanding (par value of $.01 per share) unlimited number of shares authorized | $ 11,191,335 |
| Additional paid-in-capital | 5,469,117,972 |
| 5,480,309,307 | |
| Total distributable earnings (loss) | 10,380,194,159 |
| Net assets | $15,860,503,466 |
| Class A | |
| Net assets applicable to outstanding shares | $1,686,128,717 |
| Shares of beneficial interest outstanding | 130,274,224 |
| Net asset value per share outstanding | $ 12.94 |
| Maximum sales charge (5.50% of offering price) | 0.75 |
| Maximum offering price per share outstanding | $ 13.69 |
| Investor Class | |
| Net assets applicable to outstanding shares | $ 112,478,781 |
| Shares of beneficial interest outstanding | 8,895,416 |
| Net asset value per share outstanding | $ 12.64 |
| Maximum sales charge (5.00% of offering price) | 0.67 |
| Maximum offering price per share outstanding | $ 13.31 |
| Class B | |
| Net assets applicable to outstanding shares | $ 20,984,341 |
| Shares of beneficial interest outstanding | 2,196,445 |
| Net asset value and offering price per share outstanding | $ 9.55 |
| Class C | |
| Net assets applicable to outstanding shares | $ 84,952,213 |
| Shares of beneficial interest outstanding | 8,915,014 |
| Net asset value and offering price per share outstanding | $ 9.53 |
| Class I | |
| Net assets applicable to outstanding shares | $7,996,315,348 |
| Shares of beneficial interest outstanding | 553,892,516 |
| Net asset value and offering price per share outstanding | $ 14.44 |
| Class R1 | |
| Net assets applicable to outstanding shares | $1,079,833,056 |
| Shares of beneficial interest outstanding | 77,692,350 |
| Net asset value and offering price per share outstanding | $ 13.90 |
| Class R2 | |
| Net assets applicable to outstanding shares | $ 178,096,691 |
| Shares of beneficial interest outstanding | 13,883,612 |
| Net asset value and offering price per share outstanding | $ 12.83 |
| Class R3 | |
| Net assets applicable to outstanding shares | $ 61,958,592 |
| Shares of beneficial interest outstanding | 5,241,649 |
| Net asset value and offering price per share outstanding | $ 11.82 |
| Class R6 | |
| Net assets applicable to outstanding shares | $4,639,697,977 |
| Shares of beneficial interest outstanding | 318,137,666 |
| Net asset value and offering price per share outstanding | $ 14.58 |
| SIMPLE Class | |
| Net assets applicable to outstanding shares | $ 57,750 |
| Shares of beneficial interest outstanding | 4,575 |
| Net asset value and offering price per share outstanding | $ 12.62 |
| 14 | MainStay Winslow Large Cap Growth Fund |
| Investment Income (Loss) | |
| Income | |
| Dividends-unaffiliated (net of foreign tax withholding of $99,583) | $ 30,696,600 |
| Securities lending | 112,957 |
| Dividends-affiliated | 4,911 |
| Interest | 4,176 |
| Total income | 30,818,644 |
| Expenses | |
| Manager (See Note 3) | 45,512,337 |
| Transfer agent (See Note 3) | 4,214,861 |
| Distribution/Service—Class A (See Note 3) | 1,910,040 |
| Distribution/Service—Investor Class (See Note 3) | 139,464 |
| Distribution/Service—Class B (See Note 3) | 104,729 |
| Distribution/Service—Class C (See Note 3) | 492,432 |
| Distribution/Service—Class R2 (See Note 3) | 211,659 |
| Distribution/Service—Class R3 (See Note 3) | 152,584 |
| Distribution/Service—SIMPLE Class (See Note 3) | 77 |
| Shareholder service (See Note 3) | 622,917 |
| Professional fees | 425,910 |
| Shareholder communication | 207,336 |
| Trustees | 157,555 |
| Registration | 144,837 |
| Custodian | 50,367 |
| Insurance | 47,842 |
| Miscellaneous | 175,393 |
| Total expenses before waiver/reimbursement | 54,570,340 |
| Expense waiver/reimbursement from Manager (See Note 3) | (754,250) |
| Net expenses | 53,816,090 |
| Net investment income (loss) | (22,997,446) |
| Realized and Unrealized Gain (Loss) | |
| Net realized gain (loss) on investments | 1,890,968,874 |
| Net change in unrealized appreciation (depreciation) on investments | 1,245,738,878 |
| Net realized and unrealized gain (loss) | 3,136,707,752 |
| Net increase (decrease) in net assets resulting from operations | $3,113,710,306 |
for the six months ended April 30, 2021 (Unaudited) and the year ended October 31, 2020
| 2021 | 2020 | |
| Increase (Decrease) in Net Assets | ||
| Operations: | ||
| Net investment income (loss) | $ (22,997,446) | $ (11,097,027) |
| Net realized gain (loss) | 1,890,968,874 | 820,924,239 |
| Net change in unrealized appreciation (depreciation) | 1,245,738,878 | 2,446,952,380 |
| Net increase (decrease) in net assets resulting from operations | 3,113,710,306 | 3,256,779,592 |
| Distributions to shareholders: | ||
| Class A | (77,962,860) | (111,361,863) |
| Investor Class | (6,618,823) | (12,020,268) |
| Class B | (1,541,249) | (2,904,982) |
| Class C | (7,351,319) | (18,187,627) |
| Class I | (355,187,506) | (608,819,185) |
| Class R1 | (49,620,776) | (94,596,707) |
| Class R2 | (8,981,664) | (17,824,571) |
| Class R3 | (3,495,754) | (6,648,447) |
| Class R6 | (207,330,897) | (315,525,286) |
| SIMPLE Class | (1,359) | — |
| Total distributions to shareholders | (718,092,207) | (1,187,888,936) |
| Capital share transactions: | ||
| Net proceeds from sales of shares | 1,336,657,632 | 2,681,398,278 |
| Net asset value of shares issued to shareholder in reinvestment of distributions | 659,912,779 | 1,090,257,801 |
| Cost of shares redeemed | (2,036,200,041) | (3,975,423,287) |
| Increase (decrease) in net assets derived from capital share transactions | (39,629,630) | (203,767,208) |
| Net increase (decrease) in net assets | 2,355,988,469 | 1,865,123,448 |
| Net Assets | ||
| Beginning of period | 13,504,514,997 | 11,639,391,549 |
| End of period | $15,860,503,466 | $13,504,514,997 |
| 16 | MainStay Winslow Large Cap Growth Fund |
| Six months ended April 30, 2021* | Year Ended October 31, | ||||||||||
| Class A | 2020 | 2019 | 2018 | 2017 | 2016 | ||||||
| Net asset value at beginning of period | $ 11.08 | $ 9.59 | $ 9.95 | $ 10.41 | $ 9.17 | $ 10.68 | |||||
| Net investment income (loss) (a) | (0.03) | (0.03) | (0.02) | (0.02) | (0.01) | (0.01) | |||||
| Net realized and unrealized gain (loss) on investments | 2.53 | 2.58 | 1.48 | 1.12 | 2.31 | (0.23) | |||||
| Total from investment operations | 2.50 | 2.55 | 1.46 | 1.10 | 2.30 | (0.24) | |||||
| Less distributions: | |||||||||||
| From net investment income | — | — | — | (0.00)‡ | — | — | |||||
| From net realized gain on investments | (0.64) | (1.06) | (1.82) | (1.56) | (1.06) | (1.27) | |||||
| Total distributions | (0.64) | (1.06) | (1.82) | (1.56) | (1.06) | (1.27) | |||||
| Net asset value at end of period | $ 12.94 | $ 11.08 | $ 9.59 | $ 9.95 | $ 10.41 | $ 9.17 | |||||
| Total investment return (b) | 23.29% | 29.44% | 17.05% | 12.36% | 28.54% | (2.44)% | |||||
| Ratios (to average net assets)/Supplemental Data: | |||||||||||
| Net investment income (loss) | (0.55)%†† | (0.31)% | (0.20)% | (0.21)% | (0.15)% | (0.13)% | |||||
| Net expenses (c) | 0.94%†† | 0.97% | 0.99% | 0.97% | 1.00% | 0.99% | |||||
| Expenses (before waiver/reimbursement) (c) | 0.95%†† | 0.97% | 0.99% | 0.98% | 1.00% | 1.00% | |||||
| Portfolio turnover rate | 34% | 44% | 54% | 52% | 61% | 84% | |||||
| Net assets at end of period (in 000’s) | $ 1,686,129 | $ 1,341,381 | $ 1,008,608 | $ 1,092,962 | $ 960,123 | $ 882,021 | |||||
| * | Unaudited. |
| ‡ | Less than one cent per share. |
| †† | Annualized. |
| (a) | Per share data based on average shares outstanding during the period. |
| (b) | Total investment return is calculated exclusive of sales charges and assumes the reinvestment of dividends and distributions. For periods of less than one year, total return is not annualized. |
| (c) | In addition to the fees and expenses which the Fund bears directly, it also indirectly bears a pro-rata share of the fees and expenses of the underlying funds in which it invests. Such indirect expenses are not included in the above expense ratios. |
| Six months ended April 30, 2021* | Year Ended October 31, | ||||||||||
| Investor Class | 2020 | 2019 | 2018 | 2017 | 2016 | ||||||
| Net asset value at beginning of period | $ 10.84 | $ 9.42 | $ 9.81 | $ 10.30 | $ 9.09 | $ 10.61 | |||||
| Net investment income (loss) (a) | (0.04) | (0.04) | (0.03) | (0.03) | (0.02) | (0.02) | |||||
| Net realized and unrealized gain (loss) on investments | 2.48 | 2.52 | 1.46 | 1.10 | 2.29 | (0.23) | |||||
| Total from investment operations | 2.44 | 2.48 | 1.43 | 1.07 | 2.27 | (0.25) | |||||
| Less distributions: | |||||||||||
| From net realized gain on investments | (0.64) | (1.06) | (1.82) | (1.56) | (1.06) | (1.27) | |||||
| Net asset value at end of period | $ 12.64 | $ 10.84 | $ 9.42 | $ 9.81 | $ 10.30 | $ 9.09 | |||||
| Total investment return (b) | 23.26% | 29.19% | 16.96% | 12.19% | 28.45% | (2.57)% | |||||
| Ratios (to average net assets)/Supplemental Data: | |||||||||||
| Net investment income (loss) | (0.71)%†† | (0.43)% | (0.31)% | (0.30)% | (0.19)% | (0.19)% | |||||
| Net expenses (c) | 1.08%†† | 1.10% | 1.09% | 1.06% | 1.07% | 1.05% | |||||
| Expenses (before waiver/reimbursement) (c) | 1.09%†† | 1.10% | 1.10% | 1.07% | 1.07% | 1.06% | |||||
| Portfolio turnover rate | 34% | 44% | 54% | 52% | 61% | 84% | |||||
| Net assets at end of period (in 000’s) | $ 112,479 | $ 110,831 | $ 109,236 | $ 103,987 | $ 108,078 | $ 167,631 | |||||
| * | Unaudited. |
| †† | Annualized. |
| (a) | Per share data based on average shares outstanding during the period. |
| (b) | Total investment return is calculated exclusive of sales charges and assumes the reinvestment of dividends and distributions. For periods of less than one year, total return is not annualized. |
| (c) | In addition to the fees and expenses which the Fund bears directly, it also indirectly bears a pro-rata share of the fees and expenses of the underlying funds in which it invests. Such indirect expenses are not included in the above expense ratios. |
| Six months ended April 30, 2021* | Year Ended October 31, | ||||||||||
| Class B | 2020 | 2019 | 2018 | 2017 | 2016 | ||||||
| Net asset value at beginning of period | $ 8.37 | $ 7.55 | $ 8.26 | $ 8.98 | $ 8.11 | $ 9.67 | |||||
| Net investment income (loss) (a) | (0.06) | (0.09) | (0.08) | (0.09) | (0.08) | (0.08) | |||||
| Net realized and unrealized gain (loss) on investments | 1.88 | 1.97 | 1.19 | 0.93 | 2.01 | (0.21) | |||||
| Total from investment operations | 1.82 | 1.88 | 1.11 | 0.84 | 1.93 | (0.29) | |||||
| Less distributions: | |||||||||||
| From net realized gain on investments | (0.64) | (1.06) | (1.82) | (1.56) | (1.06) | (1.27) | |||||
| Net asset value at end of period | $ 9.55 | $ 8.37 | $ 7.55 | $ 8.26 | $ 8.98 | $ 8.11 | |||||
| Total investment return (b) | 22.69% | 28.37% | 15.96% | 11.28% (c) | 27.61% | (3.32)% | |||||
| Ratios (to average net assets)/Supplemental Data: | |||||||||||
| Net investment income (loss) | (1.34)%†† | (1.17)% | (1.05)% | (1.04)% | (0.96)% | (0.94)% | |||||
| Net expenses (d) | 1.83%†† | 1.85% | 1.84% | 1.81% | 1.82% | 1.80% | |||||
| Expenses (before waiver/reimbursement) (d) | 1.84%†† | 1.85% | 1.85% | 1.82% | 1.82% | 1.81% | |||||
| Portfolio turnover rate | 34% | 44% | 54% | 52% | 61% | 84% | |||||
| Net assets at end of period (in 000’s) | $ 20,984 | $ 20,172 | $ 21,015 | $ 25,685 | $ 31,793 | $ 36,549 | |||||
| * | Unaudited. |
| †† | Annualized. |
| (a) | Per share data based on average shares outstanding during the period. |
| (b) | Total investment return is calculated exclusive of sales charges and assumes the reinvestment of dividends and distributions. For periods of less than one year, total return is not annualized. |
| (c) | Total investment return may reflect adjustments to conform to generally accepted accounting principles. |
| (d) | In addition to the fees and expenses which the Fund bears directly, it also indirectly bears a pro-rata share of the fees and expenses of the underlying funds in which it invests. Such indirect expenses are not included in the above expense ratios. |
| Six months ended April 30, 2021* | Year Ended October 31, | ||||||||||
| Class C | 2020 | 2019 | 2018 | 2017 | 2016 | ||||||
| Net asset value at beginning of period | $ 8.35 | $ 7.53 | $ 8.25 | $ 8.96 | $ 8.10 | $ 9.66 | |||||
| Net investment income (loss) (a) | (0.06) | (0.09) | (0.07) | (0.09) | (0.08) | (0.08) | |||||
| Net realized and unrealized gain (loss) on investments | 1.88 | 1.97 | 1.17 | 0.94 | 2.00 | (0.21) | |||||
| Total from investment operations | 1.82 | 1.88 | 1.10 | 0.85 | 1.92 | (0.29) | |||||
| Less distributions: | |||||||||||
| From net realized gain on investments | (0.64) | (1.06) | (1.82) | (1.56) | (1.06) | (1.27) | |||||
| Net asset value at end of period | $ 9.53 | $ 8.35 | $ 7.53 | $ 8.25 | $ 8.96 | $ 8.10 | |||||
| Total investment return (b) | 22.74% | 28.46% | 15.97% | 11.42% | 27.51% | (3.31)% | |||||
| Ratios (to average net assets)/Supplemental Data: | |||||||||||
| Net investment income (loss) | (1.39)%†† | (1.17)% | (1.04)% | (1.05)% | (0.96)% | (0.94)% | |||||
| Net expenses (c) | 1.83%†† | 1.85% | 1.84% | 1.81% | 1.82% | 1.80% | |||||
| Expenses (before waiver/reimbursement) (c) | 1.84%†† | 1.85% | 1.85% | 1.82% | 1.82% | 1.81% | |||||
| Portfolio turnover rate | 34% | 44% | 54% | 52% | 61% | 84% | |||||
| Net assets at end of period (in 000’s) | $ 84,952 | $ 95,761 | $ 131,945 | $ 197,231 | $ 229,283 | $ 306,409 | |||||
| * | Unaudited. |
| †† | Annualized. |
| (a) | Per share data based on average shares outstanding during the period. |
| (b) | Total investment return is calculated exclusive of sales charges and assumes the reinvestment of dividends and distributions. For periods of less than one year, total return is not annualized. |
| (c) | In addition to the fees and expenses which the Fund bears directly, it also indirectly bears a pro-rata share of the fees and expenses of the underlying funds in which it invests. Such indirect expenses are not included in the above expense ratios. |
| 18 | MainStay Winslow Large Cap Growth Fund |
| Six months ended April 30, 2021* | Year Ended October 31, | ||||||||||
| Class I | 2020 | 2019 | 2018 | 2017 | 2016 | ||||||
| Net asset value at beginning of period | $ 12.28 | $ 10.49 | $ 10.69 | $ 11.06 | $ 9.65 | $ 11.15 | |||||
| Net investment income (loss) (a) | (0.02) | (0.01) | 0.00‡ | 0.00‡ | 0.01 | 0.01 | |||||
| Net realized and unrealized gain (loss) on investments | 2.82 | 2.86 | 1.62 | 1.20 | 2.46 | (0.24) | |||||
| Total from investment operations | 2.80 | 2.85 | 1.62 | 1.20 | 2.47 | (0.23) | |||||
| Less distributions: | |||||||||||
| From net investment income | — | — | — | (0.01) | — | — | |||||
| From net realized gain on investments | (0.64) | (1.06) | (1.82) | (1.56) | (1.06) | (1.27) | |||||
| Total distributions | (0.64) | (1.06) | (1.82) | (1.57) | (1.06) | (1.27) | |||||
| Net asset value at end of period | $ 14.44 | $ 12.28 | $ 10.49 | $ 10.69 | $ 11.06 | $ 9.65 | |||||
| Total investment return (b) | 23.47% | 29.80% | 17.29% | 12.54% (c) | 28.92% | (2.23)% | |||||
| Ratios (to average net assets)/Supplemental Data: | |||||||||||
| Net investment income (loss) | (0.26)%†† | (0.06)% | 0.05% | 0.04% | 0.12% | 0.12% | |||||
| Net expenses (d) | 0.69%†† | 0.72% | 0.74% | 0.72% | 0.75% | 0.74% | |||||
| Expenses (before waiver/reimbursement) (d) | 0.70%†† | 0.72% | 0.74% | 0.73% | 0.75% | 0.75% | |||||
| Portfolio turnover rate | 34% | 44% | 54% | 52% | 61% | 84% | |||||
| Net assets at end of period (in 000’s) | $ 7,996,315 | $ 6,824,224 | $ 6,080,320 | $ 6,275,780 | $ 6,752,754 | $ 8,994,997 | |||||
| * | Unaudited. |
| ‡ | Less than one cent per share. |
| †† | Annualized. |
| (a) | Per share data based on average shares outstanding during the period. |
| (b) | Total investment return is calculated exclusive of sales charges and assumes the reinvestment of dividends and distributions. Class I shares are not subject to sales charges. For periods of less than one year, total return is not annualized. |
| (c) | Total investment return may reflect adjustments to conform to generally accepted accounting principles. |
| (d) | In addition to the fees and expenses which the Fund bears directly, it also indirectly bears a pro-rata share of the fees and expenses of the underlying funds in which it invests. Such indirect expenses are not included in the above expense ratios. |
| Six months ended April 30, 2021* | Year Ended October 31, | ||||||||||
| Class R1 | 2020 | 2019 | 2018 | 2017 | 2016 | ||||||
| Net asset value at beginning of period | $ 11.85 | $ 10.17 | $ 10.43 | $ 10.83 | $ 9.48 | $ 10.99 | |||||
| Net investment income (loss) (a) | (0.02) | (0.02) | (0.00)‡ | (0.01) | 0.00‡ | 0.00‡ | |||||
| Net realized and unrealized gain (loss) on investments | 2.71 | 2.76 | 1.56 | 1.17 | 2.41 | (0.24) | |||||
| Total from investment operations | 2.69 | 2.74 | 1.56 | 1.16 | 2.41 | (0.24) | |||||
| Less distributions: | |||||||||||
| From net realized gain on investments | (0.64) | (1.06) | (1.82) | (1.56) | (1.06) | (1.27) | |||||
| Net asset value at end of period | $ 13.90 | $ 11.85 | $ 10.17 | $ 10.43 | $ 10.83 | $ 9.48 | |||||
| Total investment return (b) | 23.39% | 29.64% | 17.25% | 12.46% | 28.79% | (2.37)% | |||||
| Ratios (to average net assets)/Supplemental Data: | |||||||||||
| Net investment income (loss) | (0.38)%†† | (0.15)% | (0.04)% | (0.06)% | 0.01% | 0.02% | |||||
| Net expenses (c) | 0.79%†† | 0.82% | 0.84% | 0.82% | 0.85% | 0.84% | |||||
| Expenses (before waiver/reimbursement) (c) | 0.80%†† | 0.82% | 0.84% | 0.83% | 0.85% | 0.85% | |||||
| Portfolio turnover rate | 34% | 44% | 54% | 52% | 61% | 84% | |||||
| Net assets at end of period (in 000’s) | $ 1,079,833 | $ 914,359 | $ 919,236 | $ 1,102,423 | $ 1,596,638 | $ 1,636,560 | |||||
| * | Unaudited. |
| ‡ | Less than one cent per share. |
| †† | Annualized. |
| (a) | Per share data based on average shares outstanding during the period. |
| (b) | Total investment return is calculated exclusive of sales charges and assumes the reinvestment of dividends and distributions. Class R1 shares are not subject to sales charges. For periods of less than one year, total return is not annualized. |
| (c) | In addition to the fees and expenses which the Fund bears directly, it also indirectly bears a pro-rata share of the fees and expenses of the underlying funds in which it invests. Such indirect expenses are not included in the above expense ratios. |
| Six months ended April 30, 2021* | Year Ended October 31, | ||||||||||
| Class R2 | 2020 | 2019 | 2018 | 2017 | 2016 | ||||||
| Net asset value at beginning of period | $ 10.99 | $ 9.53 | $ 9.90 | $ 10.38 | $ 9.15 | $ 10.68 | |||||
| Net investment income (loss) (a) | (0.03) | (0.04) | (0.03) | (0.03) | (0.02) | (0.02) | |||||
| Net realized and unrealized gain (loss) on investments | 2.51 | 2.56 | 1.48 | 1.11 | 2.31 | (0.24) | |||||
| Total from investment operations | 2.48 | 2.52 | 1.45 | 1.08 | 2.29 | (0.26) | |||||
| Less distributions: | |||||||||||
| From net realized gain on investments | (0.64) | (1.06) | (1.82) | (1.56) | (1.06) | (1.27) | |||||
| Net asset value at end of period | $ 12.83 | $ 10.99 | $ 9.53 | $ 9.90 | $ 10.38 | $ 9.15 | |||||
| Total investment return (b) | 23.30% | 29.29% | 16.89% | 12.17% (c) | 28.49% | (2.66)% | |||||
| Ratios (to average net assets)/Supplemental Data: | |||||||||||
| Net investment income (loss) | (0.55)%†† | (0.40)% | (0.29)% | (0.31)% | (0.24)% | (0.23)% | |||||
| Net expenses (d) | 1.04%†† | 1.07% | 1.09% | 1.07% | 1.10% | 1.09% | |||||
| Expenses (before waiver/reimbursement) (d) | 1.05%†† | 1.07% | 1.09% | 1.08% | 1.10% | 1.10% | |||||
| Portfolio turnover rate | 34% | 44% | 54% | 52% | 61% | 84% | |||||
| Net assets at end of period (in 000’s) | $ 178,097 | $ 159,297 | $ 163,288 | $ 227,298 | $ 303,192 | $ 391,535 | |||||
| * | Unaudited. |
| †† | Annualized. |
| (a) | Per share data based on average shares outstanding during the period. |
| (b) | Total investment return is calculated exclusive of sales charges and assumes the reinvestment of dividends and distributions. Class R2 shares are not subject to sales charges. For periods of less than one year, total return is not annualized. |
| (c) | Total investment return may reflect adjustments to conform to generally accepted accounting principles. |
| (d) | In addition to the fees and expenses which the Fund bears directly, it also indirectly bears a pro-rata share of the fees and expenses of the underlying funds in which it invests. Such indirect expenses are not included in the above expense ratios. |
| Six months ended April 30, 2021* | Year Ended October 31, | ||||||||||
| Class R3 | 2020 | 2019 | 2018 | 2017 | 2016 | ||||||
| Net asset value at beginning of period | $ 10.19 | $ 8.93 | $ 9.41 | $ 9.96 | $ 8.85 | $ 10.39 | |||||
| Net investment income (loss) (a) | (0.04) | (0.06) | (0.05) | (0.05) | (0.04) | (0.04) | |||||
| Net realized and unrealized gain (loss) on investments | 2.31 | 2.38 | 1.39 | 1.06 | 2.21 | (0.23) | |||||
| Total from investment operations | 2.27 | 2.32 | 1.34 | 1.01 | 2.17 | (0.27) | |||||
| Less distributions: | |||||||||||
| From net realized gain on investments | (0.64) | (1.06) | (1.82) | (1.56) | (1.06) | (1.27) | |||||
| Net asset value at end of period | $ 11.82 | $ 10.19 | $ 8.93 | $ 9.41 | $ 9.96 | $ 8.85 | |||||
| Total investment return (b) | 23.06% | 28.99% | 16.69% | 11.97% | 28.05% | (2.83)% | |||||
| Ratios (to average net assets)/Supplemental Data: | |||||||||||
| Net investment income (loss) | (0.81)%†† | (0.65)% | (0.55)% | (0.55)% | (0.49)% | (0.48)% | |||||
| Net expenses (c) | 1.29%†† | 1.32% | 1.34% | 1.32% | 1.35% | 1.34% | |||||
| Expenses (before waiver/reimbursement) (c) | 1.30%†† | 1.32% | 1.34% | 1.33% | 1.35% | 1.35% | |||||
| Portfolio turnover rate | 34% | 44% | 54% | 52% | 61% | 84% | |||||
| Net assets at end of period (in 000’s) | $ 61,959 | $ 56,657 | $ 57,283 | $ 61,850 | $ 78,634 | $ 87,060 | |||||
| * | Unaudited. |
| †† | Annualized. |
| (a) | Per share data based on average shares outstanding during the period. |
| (b) | Total investment return is calculated exclusive of sales charges and assumes the reinvestment of dividends and distributions. Class R3 shares are not subject to sales charges. For periods of less than one year, total return is not annualized. |
| (c) | In addition to the fees and expenses which the Fund bears directly, it also indirectly bears a pro-rata share of the fees and expenses of the underlying funds in which it invests. Such indirect expenses are not included in the above expense ratios. |
| 20 | MainStay Winslow Large Cap Growth Fund |
| Six months ended April 30, 2021* | Year Ended October 31, | ||||||||||
| Class R6 | 2020 | 2019 | 2018 | 2017 | 2016 | ||||||
| Net asset value at beginning of period | $ 12.39 | $ 10.58 | $ 10.76 | $ 11.12 | $ 9.69 | $ 11.18 | |||||
| Net investment income (loss) (a) | (0.02) | 0.00‡ | 0.01 | 0.01 | 0.02 | 0.02 | |||||
| Net realized and unrealized gain (loss) on investments | 2.85 | 2.88 | 1.63 | 1.21 | 2.47 | (0.24) | |||||
| Total from investment operations | 2.83 | 2.88 | 1.64 | 1.22 | 2.49 | (0.22) | |||||
| Less distributions: | |||||||||||
| From net investment income | — | (0.01) | — | (0.02) | — | — | |||||
| From net realized gain on investments | (0.64) | (1.06) | (1.82) | (1.56) | (1.06) | (1.27) | |||||
| Total distributions | (0.64) | (1.07) | (1.82) | (1.58) | (1.06) | (1.27) | |||||
| Net asset value at end of period | $ 14.58 | $ 12.39 | $ 10.58 | $ 10.76 | $ 11.12 | $ 9.69 | |||||
| Total investment return (b) | 23.50% | 29.83% | 17.49% | 12.72% | 29.02% | (2.12)% | |||||
| Ratios (to average net assets)/Supplemental Data: | |||||||||||
| Net investment income (loss) | (0.24)%†† | 0.02% | 0.13% | 0.13% | 0.21% | 0.23% | |||||
| Net expenses (c) | 0.62%†† | 0.64% | 0.64% | 0.63% | 0.63% | 0.62% | |||||
| Expenses (before waiver/reimbursement) (c) | 0.63%†† | 0.64% | 0.64% | 0.64% | 0.63% | 0.63% | |||||
| Portfolio turnover rate | 34% | 44% | 54% | 52% | 61% | 84% | |||||
| Net assets at end of period (in 000’s) | $ 4,639,698 | $ 3,981,812 | $ 3,148,459 | $ 2,463,405 | $ 2,122,217 | $ 1,693,868 | |||||
| * | Unaudited. |
| ‡ | Less than one cent per share. |
| †† | Annualized. |
| (a) | Per share data based on average shares outstanding during the period. |
| (b) | Total investment return is calculated exclusive of sales charges and assumes the reinvestment of dividends and distributions. Class R6 shares are not subject to sales charges. For periods of less than one year, total return is not annualized. |
| (c) | In addition to the fees and expenses which the Fund bears directly, it also indirectly bears a pro-rata share of the fees and expenses of the underlying funds in which it invests. Such indirect expenses are not included in the above expense ratios. |
| Six months ended April 30, 2021* | August 31, 2020^ through October 31, | ||
| SIMPLE Class | 2020 | ||
| Net asset value at beginning of period | $ 10.84 | $ 11.84** | |
| Net investment income (loss) (a) | (0.06) | (0.02) | |
| Net realized and unrealized gain (loss) on investments | 2.48 | (0.98) | |
| Total from investment operations | 2.42 | (1.00) | |
| Less distributions: | |||
| From net realized gain on investments | (0.64) | — | |
| Net asset value at end of period | $ 12.62 | $ 10.84 | |
| Total investment return (b) | 23.06% | (8.45)% | |
| Ratios (to average net assets)/Supplemental Data: | |||
| Net investment income (loss)†† | (0.97)% | (1.00)% | |
| Net expenses†† (c) | 1.33% | 1.32% | |
| Expenses (before waiver/reimbursement)†† (c) | 1.34% | 1.33% | |
| Portfolio turnover rate | 34% | 44% | |
| Net assets at end of period (in 000’s) | $ 58 | $ 23 |
| * | Unaudited. |
| ^ | Inception date. |
| ** | Based on the net asset value of Investor Class as of August 31, 2020. |
| †† | Annualized. |
| (a) | Per share data based on average shares outstanding during the period. |
| (b) | Total investment return is calculated exclusive of sales charges and assumes the reinvestment of dividends and distributions. SIMPLE Class shares are not subject to sales charges. For periods of less than one year, total return is not annualized. |
| (c) | In addition to the fees and expenses which the Fund bears directly, it also indirectly bears a pro-rata share of the fees and expenses of the underlying funds in which it invests. Such indirect expenses are not included in the above expense ratios. |
| Class | Commenced Operations |
| Class A | July 1, 1995 |
| Investor Class | February 28, 2008 |
| Class B | April 1, 2005 |
| Class C | April 1, 2005 |
| Class I | April 1, 2005 |
| Class R1 | April 1, 2005 |
| Class R2 | April 1, 2005 |
| Class R3 | April 28, 2006 |
| Class R6 | June 17, 2013 |
| SIMPLE Class | August 31, 2020 |
| 22 | MainStay Winslow Large Cap Growth Fund |
| • | Level 1—quoted prices in active markets for an identical asset or liability |
| • | Level 2—other significant observable inputs (including quoted prices for a similar asset or liability in active markets, interest rates and yield curves, prepayment speeds, credit risk, etc.) |
| • | Level 3—significant unobservable inputs (including the Fund's own assumptions about the assumptions that market participants would use in measuring fair value of an asset or liability) |
| • Broker/dealer quotes | • Benchmark securities |
| • Two-sided markets | • Reference data (corporate actions or material event notices) |
| • Bids/offers | • Monthly payment information |
| • Industry and economic events | • Reported trades |
| 24 | MainStay Winslow Large Cap Growth Fund |
| 26 | MainStay Winslow Large Cap Growth Fund |
| Class R1 | $ 507,736 |
| Class R2 | 84,664 |
| Class R3 | 30,517 |
| Class | Expense | Waived |
| Class A | $ 574,877 | $— |
| Investor Class | 120,147 | — |
| Class B | 22,564 | — |
| Class C | 106,081 | — |
| Class I | 2,834,929 | — |
| Class R1 | 382,019 | — |
| Class R2 | 63,696 | — |
| Class R3 | 22,960 | — |
| Class R6 | 87,555 | — |
| SIMPLE Class | 33 | — |
| Affiliated Investment Companies | Value, Beginning of Period | Purchases at Cost | Proceeds from Sales | Net Realized Gain/(Loss) on Sales | Change in Unrealized Appreciation/ (Depreciation) | Value, End of Period | Dividend Income | Other Distributions | Shares End of Period |
| MainStay U.S. Government Liquidity Fund | $ 41,324 | $ 1,066,533 | $ (1,056,740) | $ — | $ — | $ 51,117 | $ 5 | $ — | 51,117 |
| SIMPLE Class | $28,167 | 48.8% |
| Federal Tax Cost | Gross Unrealized Appreciation | Gross Unrealized (Depreciation) | Net Unrealized Appreciation/ (Depreciation) | |
| Investments | $7,358,549,322 | $8,601,323,851 | $(89,090,840) | $8,512,233,011 |
| 2020 | |
| Distributions paid from: | |
| Ordinary Income | $ 37,642,284 |
| Long-Term Capital Gains | 1,150,246,652 |
| Total | $1,187,888,936 |
| 28 | MainStay Winslow Large Cap Growth Fund |
| Class A | Shares | Amount |
| Period ended April 30, 2021: | ||
| Shares sold | 14,513,928 | $ 174,518,821 |
| Shares issued to shareholders in reinvestment of distributions | 5,387,035 | 62,220,173 |
| Shares redeemed | (12,189,840) | (146,657,825) |
| Net increase (decrease) in shares outstanding before conversion | 7,711,123 | 90,081,169 |
| Shares converted into Class A (See Note 1) | 1,666,545 | 19,736,728 |
| Shares converted from Class A (See Note 1) | (175,801) | (2,216,220) |
| Net increase (decrease) | 9,201,867 | $ 107,601,677 |
| Year ended October 31, 2020: | ||
| Shares sold | 32,993,648 | $ 322,813,743 |
| Shares issued to shareholders in reinvestment of distributions | 10,490,222 | 92,418,858 |
| Shares redeemed | (31,378,235) | (300,975,018) |
| Net increase (decrease) in shares outstanding before conversion | 12,105,635 | 114,257,583 |
| Shares converted into Class A (See Note 1) | 4,046,114 | 41,357,685 |
| Shares converted from Class A (See Note 1) | (269,689) | (2,459,106) |
| Net increase (decrease) | 15,882,060 | $ 153,156,162 |
| Investor Class | Shares | Amount |
| Period ended April 30, 2021: | ||
| Shares sold | 806,040 | $ 9,467,485 |
| Shares issued to shareholders in reinvestment of distributions | 586,173 | 6,612,026 |
| Shares redeemed | (1,463,219) | (16,958,779) |
| Net increase (decrease) in shares outstanding before conversion | (71,006) | (879,268) |
| Shares converted into Investor Class (See Note 1) | 76,161 | 886,472 |
| Shares converted from Investor Class (See Note 1) | (1,331,147) | (15,431,551) |
| Net increase (decrease) | (1,325,992) | $ (15,424,347) |
| Year ended October 31, 2020: | ||
| Shares sold | 3,060,260 | $ 28,957,683 |
| Shares issued to shareholders in reinvestment of distributions | 1,389,575 | 12,005,927 |
| Shares redeemed | (2,341,927) | (22,496,141) |
| Net increase (decrease) in shares outstanding before conversion | 2,107,908 | 18,467,469 |
| Shares converted into Investor Class (See Note 1) | 198,705 | 1,823,319 |
| Shares converted from Investor Class (See Note 1) | (3,683,197) | (37,084,878) |
| Net increase (decrease) | (1,376,584) | $ (16,794,090) |
| Class B | Shares | Amount |
| Period ended April 30, 2021: | ||
| Shares sold | 48,525 | $ 435,859 |
| Shares issued to shareholders in reinvestment of distributions | 175,009 | 1,496,329 |
| Shares redeemed | (200,174) | (1,774,461) |
| Net increase (decrease) in shares outstanding before conversion | 23,360 | 157,727 |
| Shares converted from Class B (See Note 1) | (238,090) | (2,061,249) |
| Net increase (decrease) | (214,730) | $ (1,903,522) |
| Year ended October 31, 2020: | ||
| Shares sold | 222,509 | $ 1,622,326 |
| Shares issued to shareholders in reinvestment of distributions | 419,160 | 2,812,565 |
| Shares redeemed | (543,653) | (3,974,624) |
| Net increase (decrease) in shares outstanding before conversion | 98,016 | 460,267 |
| Shares converted from Class B (See Note 1) | (470,044) | (3,397,144) |
| Net increase (decrease) | (372,028) | $ (2,936,877) |
| Class C | Shares | Amount |
| Period ended April 30, 2021: | ||
| Shares sold | 748,640 | $ 6,641,158 |
| Shares issued to shareholders in reinvestment of distributions | 768,446 | 6,554,843 |
| Shares redeemed | (3,720,952) | (33,065,648) |
| Net increase (decrease) in shares outstanding before conversion | (2,203,866) | (19,869,647) |
| Shares converted from Class C (See Note 1) | (355,199) | (3,103,223) |
| Net increase (decrease) | (2,559,065) | $ (22,972,870) |
| Year ended October 31, 2020: | ||
| Shares sold | 3,316,185 | $ 23,558,218 |
| Shares issued to shareholders in reinvestment of distributions | 1,763,435 | 11,797,381 |
| Shares redeemed | (10,845,199) | (82,589,582) |
| Net increase (decrease) in shares outstanding before conversion | (5,765,579) | (47,233,983) |
| Shares converted from Class C (See Note 1) | (273,731) | (2,045,824) |
| Net increase (decrease) | (6,039,310) | $ (49,279,807) |
| Class I | Shares | Amount |
| Period ended April 30, 2021: | ||
| Shares sold | 46,314,909 | $ 620,477,905 |
| Shares issued to shareholders in reinvestment of distributions | 24,932,557 | 320,632,678 |
| Shares redeemed | (73,415,752) | (988,039,765) |
| Net increase (decrease) in shares outstanding before conversion | (2,168,286) | (46,929,182) |
| Shares converted into Class I (See Note 1) | 155,778 | 2,188,324 |
| Net increase (decrease) | (2,012,508) | $ (44,740,858) |
| Year ended October 31, 2020: | ||
| Shares sold | 119,737,170 | $ 1,266,637,622 |
| Shares issued to shareholders in reinvestment of distributions | 56,071,825 | 546,139,579 |
| Shares redeemed | (199,076,962) | (2,136,259,259) |
| Net increase (decrease) in shares outstanding before conversion | (23,267,967) | (323,482,058) |
| Shares converted into Class I (See Note 1) | 196,676 | 1,988,212 |
| Shares converted from Class I (See Note 1) | (696,227) | (8,127,755) |
| Net increase (decrease) | (23,767,518) | $ (329,621,601) |
| Class R1 | Shares | Amount |
| Period ended April 30, 2021: | ||
| Shares sold | 5,663,735 | $ 72,817,503 |
| Shares issued to shareholders in reinvestment of distributions | 4,004,675 | 49,617,929 |
| Shares redeemed | (9,164,568) | (118,584,040) |
| Net increase (decrease) | 503,842 | $ 3,851,392 |
| Year ended October 31, 2020: | ||
| Shares sold | 16,027,615 | $ 165,681,100 |
| Shares issued to shareholders in reinvestment of distributions | 10,052,287 | 94,592,017 |
| Shares redeemed | (39,307,312) | (405,516,655) |
| Net increase (decrease) | (13,227,410) | $ (145,243,538) |
| Class R2 | Shares | Amount |
| Period ended April 30, 2021: | ||
| Shares sold | 1,443,407 | $ 17,113,302 |
| Shares issued to shareholders in reinvestment of distributions | 534,450 | 6,119,453 |
| Shares redeemed | (2,587,660) | (30,823,054) |
| Net increase (decrease) | (609,803) | $ (7,590,299) |
| Year ended October 31, 2020: | ||
| Shares sold | 3,470,793 | $ 33,305,555 |
| Shares issued to shareholders in reinvestment of distributions | 1,377,180 | 12,050,323 |
| Shares redeemed | (7,490,386) | (72,813,229) |
| Net increase (decrease) | (2,642,413) | $ (27,457,351) |
| Class R3 | Shares | Amount |
| Period ended April 30, 2021: | ||
| Shares sold | 478,642 | $ 5,234,865 |
| Shares issued to shareholders in reinvestment of distributions | 317,889 | 3,356,909 |
| Shares redeemed | (1,117,325) | (12,332,251) |
| Net increase (decrease) | (320,794) | $ (3,740,477) |
| Year ended October 31, 2020: | ||
| Shares sold | 1,075,483 | $ 9,564,113 |
| Shares issued to shareholders in reinvestment of distributions | 761,865 | 6,193,959 |
| Shares redeemed | (2,690,447) | (24,467,750) |
| Net increase (decrease) in shares outstanding before conversion | (853,099) | (8,709,678) |
| Shares converted from Class R3 (See Note 1) | (2,332) | (25,933) |
| Net increase (decrease) | (855,431) | $ (8,735,611) |
| Class R6 | Shares | Amount |
| Period ended April 30, 2021: | ||
| Shares sold | 31,560,926 | $ 429,923,271 |
| Shares issued to shareholders in reinvestment of distributions | 15,650,584 | 203,301,080 |
| Shares redeemed | (50,426,704) | (687,963,499) |
| Net increase (decrease) | (3,215,194) | $ (54,739,148) |
| Year ended October 31, 2020: | ||
| Shares sold | 76,258,553 | $ 829,232,918 |
| Shares issued to shareholders in reinvestment of distributions | 31,764,719 | 312,247,192 |
| Shares redeemed | (85,028,835) | (926,331,029) |
| Net increase (decrease) in shares outstanding before conversion | 22,994,437 | 215,149,081 |
| Shares converted into Class R6 (See Note 1) | 689,835 | 8,127,756 |
| Shares converted from Class R6 (See Note 1) | (12,916) | (156,332) |
| Net increase (decrease) | 23,671,356 | $ 223,120,505 |
| SIMPLE Class | Shares | Amount |
| Period ended April 30, 2021: | ||
| Shares sold | 2,344 | $ 27,463 |
| Shares issued to shareholders in reinvestment of distributions | 120 | 1,359 |
| Shares redeemed | (63) | (719) |
| Net increase (decrease) in shares outstanding before conversion | 2,401 | 28,103 |
| Shares converted into SIMPLE Class (See Note 1) | 63 | 719 |
| Net increase (decrease) | 2,464 | $ 28,822 |
| Period ended October 31, 2020: | ||
| Shares sold | 2,111 | $ 25,000 |
| Net increase (decrease) | 2,111 | $ 25,000 |
| 30 | MainStay Winslow Large Cap Growth Fund |
| 32 | MainStay Winslow Large Cap Growth Fund |
| 34 | MainStay Winslow Large Cap Growth Fund |
| 36 | MainStay Winslow Large Cap Growth Fund |
| 38 | MainStay Winslow Large Cap Growth Fund |
1.
| 2. | This Fund is registered for sale in CA, CT, DE, FL, MA, NJ, NY and VT. |
| 3. | An affiliate of New York Life Investment Management LLC. |
| 1737112MS071-21 | MSLG10-06/21 |
please log in to newyorklifeinvestments.com/accounts.
| Not FDIC/NCUA Insured | Not a Deposit | May Lose Value | No Bank Guarantee | Not Insured by Any Government Agency |


President

| Average Annual Total Returns for the Period-Ended April 30, 2021 | ||||||||
| Class | Sales Charge | Inception Date1 | Six Months or Since Inception | One Year | Five Years | Ten Years or Since Inception | Gross Expense Ratio2 | |
| Class A Shares | Maximum 5.5% Initial Sales Charge | With sales charges | 6/1/1998 | 25.59% | 40.07% | 14.60% | 12.64% | 0.95% |
| Excluding sales charges | 32.90 | 48.22 | 15.90 | 13.28 | 0.95 | |||
| Investor Class Shares3 | Maximum 5% Initial Sales Charge | With sales charges | 2/28/2008 | 26.12 | 39.70 | 14.28 | 12.28 | 1.15 |
| Excluding sales charges | 32.76 | 47.83 | 15.58 | 12.92 | 1.15 | |||
| Class B Shares4 | Maximum 5% CDSC | With sales charges | 6/1/1998 | 27.22 | 41.68 | 14.50 | 12.08 | 1.90 |
| if Redeemed Within the First Six Years of Purchase | Excluding sales charges | 32.22 | 46.68 | 14.73 | 12.08 | 1.90 | ||
| Class C Shares | Maximum 1% CDSC | With sales charges | 9/1/1998 | 31.25 | 45.73 | 14.72 | 12.08 | 1.90 |
| if Redeemed Within One Year of Purchase | Excluding sales charges | 32.25 | 46.73 | 14.72 | 12.08 | 1.90 | ||
| Class I Shares | No Sales Charge | 12/28/2004 | 33.10 | 48.62 | 16.20 | 13.57 | 0.70 | |
| Class R3 Shares | No Sales Charge | 2/29/2016 | 32.70 | 47.72 | 15.48 | 16.06 | 1.30 | |
| Class R6 Shares | No Sales Charge | 4/26/2021 | -0.03 | N/A | N/A | N/A | 0.64 | |
| 1. | Effective March 5, 2021, the Fund replaced its subadvisor and modified its principal investment strategies. The past performance in the graph and table prior to that date reflects the Fund's prior subadvisor and principal investment strategies. |
| 2. | The gross expense ratios presented reflect the Fund’s “Total Annual Fund Operating Expenses” from the most recent Prospectus, as supplemented, and may differ from other expense ratios disclosed in this report. |
| 3. | Prior to June 30, 2020, the maximum initial sales charge was 5.5%, which is reflected in the average annual total return figures shown. |
| 4. | Class B shares are closed to all new purchases as well as additional investments by existing Class B shareholders. |
| Benchmark Performance | Six Months | One Year | Five Years | Ten Years |
| S&P 500® Index1 | 28.85% | 45.98% | 17.42% | 14.17% |
| Russell 3000® Index2 | 31.08 | 50.92 | 17.67 | 14.03 |
| Morningstar Large Blend Category Average3 | 28.98 | 45.28 | 15.35 | 11.88 |
| 1. | The S&P 500® Index is the Fund's primary broad-based securities market index for comparison purposes. “S&P 500®” is a trademark of The McGraw-Hill Companies, Inc. The S&P 500® Index is widely regarded as the standard index for measuring large-cap U.S. stock market performance. Results assume reinvestment of all dividends and capital gains. An investment cannot be made directly in an index. |
| 2. | The Russell 3000® Index is the Fund’s secondary benchmark. The Russell 3000® Index measures the performance of the largest 3,000 U.S. companies representing approximately 98% of the investable U.S. equity market. Results assume reinvestment of all dividends and capital gains. An investment cannot be made directly in an index. |
| 3. | The Morningstar Large Blend Category Average is representative of funds that represent the overall U.S. stock market in size, growth rates and price. Stocks in the top 70% of the capitalization of the U.S. equity market are defined as large cap. The blend style is assigned to portfolios where neither growth nor value characteristics predominate. These portfolios tend to invest across the spectrum of U.S. industries, and owing to their broad exposure, the portfolios’ returns are often similar to those of the S&P 500® Index. Results are based on average total returns of similar funds with all dividends and capital gain distributions reinvested. |
| 6 | MainStay WMC Enduring Capital Fund |
| Share Class | Beginning Account Value 11/1/20 | Ending Account Value (Based on Actual Returns and Expenses) 4/30/21 | Expenses Paid During Period1 | Ending Account Value (Based on Hypothetical 5% Annualized Return and Actual Expenses) 4/30/21 | Expenses Paid During Period1 | Net Expense Ratio During Period2 |
| Class A Shares | $1,000.00 | $1,329.00 | $ 5.83 | $1,019.79 | $ 5.06 | 1.01% |
| Investor Class Shares | $1,000.00 | $1,327.60 | $ 7.50 | $1,018.35 | $ 6.51 | 1.30% |
| Class B Shares | $1,000.00 | $1,322.20 | $11.80 | $1,014.63 | $10.24 | 2.05% |
| Class C Shares | $1,000.00 | $1,322.50 | $11.46 | $1,014.93 | $ 9.94 | 1.99% |
| Class I Shares | $1,000.00 | $1,331.00 | $ 4.33 | $1,021.08 | $ 3.76 | 0.75% |
| Class R3 Shares | $1,000.00 | $1,327.00 | $ 7.90 | $1,018.00 | $ 6.85 | 1.37% |
| Class R6 Shares | $1,000.00 | $ 999.70 | $ 0.13 | $1,000.96 | $ 0.13 | 0.60% |
| 1. | Expenses are equal to the Fund’s annualized expense ratio of each class multiplied by the average account value over the period, divided by 365 and multiplied by 181 (to reflect the six-month period). The table above represents the actual expenses incurred during the six-month period. In addition to the fees and expenses which the Fund bears directly, it also indirectly bears a pro rata share of the fees and expenses of the underlying funds in which it invests. Such indirect expenses are not included in the above-reported expense figures. |
| 2. | Expenses are equal to the Fund's annualized expense ratio to reflect the six-month period. |
| Machinery | 12.2% |
| Equity Real Estate Investment Trusts | 10.2 |
| Commercial Services & Supplies | 9.7 |
| Chemicals | 6.8 |
| Road & Rail | 6.6 |
| Insurance | 6.5 |
| Banks | 6.4 |
| Capital Markets | 6.3 |
| Software | 4.0 |
| Health Care Equipment & Supplies | 3.4 |
| Food & Staples Retailing | 3.4 |
| Household Durables | 3.4 |
| Health Care Providers & Services | 3.4 |
| Electric Utilities | 3.3 |
| Diversified Financial Services | 3.3% |
| Air Freight & Logistics | 3.2 |
| Containers & Packaging | 3.1 |
| Trading Companies & Distributors | 2.9 |
| Internet & Direct Marketing Retail | 0.6 |
| Interactive Media & Services | 0.2 |
| Semiconductors & Semiconductor Equipment | 0.1 |
| IT Services | 0.1 |
| Pharmaceuticals | 0.1 |
| Short–Term Investment | 0.8 |
| Other Assets, Less Liabilities | –0.0‡ |
| 100.0% |
| 1. | Public Storage |
| 2. | Sherwin-Williams Co. (The) |
| 3. | Waste Connections, Inc. |
| 4. | American Tower Corp. |
| 5. | Danaher Corp. |
| 6. | Costco Wholesale Corp. |
| 7. | IDEX Corp. |
| 8. | Progressive Corp. (The) |
| 9. | Old Dominion Freight Line, Inc. |
| 10. | NVR, Inc. |
| 8 | MainStay WMC Enduring Capital Fund |
During the time MacKay Shields managed the Fund, the Fund’s performance relative to the S&P 500® Index benefited from strong stock selection, most notably within information technology and financials stocks. In terms of stock-selection model efficacy, the combination of signals used by the quantitative stock selection model was rewarded over the same period, primarily driven by valuation measures.
During the time Wellington managed the Fund, rising interest rates and increased clarity on an economic reopening drove the market higher, with value stocks outperforming growth stocks. The
During the time MacKay Shields managed the Fund, the strongest positive contributions to the Fund’s performance relative to the S&P 500® Index were the information technology, financials and industrials sectors. During the same period, the communication services, consumer staples and consumer discretionary sectors were the weakest contributors to relative performance.
During the time Wellington managed the Fund, the health care, real estate and energy sectors provided the strongest positive contributions to relative performance. Over the same period, the consumer discretionary, utilities and communication services sectors detracted most significantly from the Fund’s relative performance.
The individual stocks that made the strongest positive contributions to the Fund’s absolute performance during the time MacKay Shields managed the Fund included technology hardware storage & peripherals maker Apple, regional bank Signature Bank and software company Microsoft. The stocks that detracted most significantly from the Fund’s absolute performance during the same period were household products company Procter and Gamble, metals & mining firm Newmont and utility Dominion Energy.
The top two absolute contributors to absolute performance, during
| 1. | See page 5 for other share class returns, which may be higher or lower than Class I share returns. See page 6 for more information on benchmark and peer group returns. |
| 2. | Alpha measures the relationship between a mutual fund’s return and its beta over a three-year period. Often, alpha is viewed as the excess return (positive or negative) or the value added by the portfolio manager. Beta is a measure of volatility in relation to the market as a whole. A beta higher than 1 indicates that a security or portfolio will tend to exhibit higher volatility than the market. A beta lower than 1 indicates that a security or portfolio will tend to exhibit lower volatility than the market. |
During the time MacKay Shields managed the Fund, the Fund’s largest initial purchase was in electric car maker Tesla, while the largest increased position size was in regional banking company Synovus Financial. During the same period, the Fund’s largest full sale was in consumer credit services provider Synchrony Financial, while the most significantly reduced position size was in social media company Facebook.
During the time Wellington managed the Fund, we did not initiate or eliminate any positions. We added to the Fund’s position in Canadian National Railway after the share price weakness that resulted from the bid for Kansas City Southern Railway. We believed that the potential combination of the two businesses made logistical sense when looking at network maps, and could have a positive impact on long-term value creation.
The Fund’s largest increases in sector exposures relative to the S&P 500® Index were in the financials and real estate sectors.
There were no significant changes to sector weights during the time Wellington managed the Fund.
At the end of the period when MacKay Shields managed the Fund, the Fund’s largest overweight exposures relative to the S&P 500® Index were in the consumer discretionary and health care sectors. As of the same date, the Fund’s most significantly underweight positions relative to the benchmark were in the communication services and materials sectors.
As of April 30, 2021, the Fund’s largest benchmark-relative overweights were in the industrials, financials and real estate sectors. As of the same date, the Fund’s held relatively underweight exposure to the information technology, communication services and consumer discretionary sectors.
| 10 | MainStay WMC Enduring Capital Fund |
| Shares | Value | |
| Common Stocks 99.2% | ||
| Air Freight & Logistics 3.2% | ||
| Expeditors International of Washington, Inc. | 239,144 | $ 26,272,360 |
| Banks 6.4% | ||
| First Republic Bank | 145,235 | 26,612,862 |
| M&T Bank Corp. | 159,644 | 25,174,262 |
| 51,787,124 | ||
| Capital Markets 6.3% | ||
| Brookfield Asset Management, Inc., Class A | 549,381 | 25,040,786 |
| Charles Schwab Corp. (The) | 371,048 | 26,121,779 |
| 51,162,565 | ||
| Chemicals 6.8% | ||
| Linde plc | 92,588 | 26,465,354 |
| Sherwin-Williams Co. (The) | 105,094 | 28,782,094 |
| 55,247,448 | ||
| Commercial Services & Supplies 9.7% | ||
| Cintas Corp. | 73,095 | 25,228,008 |
| Copart, Inc. (a) | 205,456 | 25,581,327 |
| Waste Connections, Inc. | 239,856 | 28,569,248 |
| 79,378,583 | ||
| Containers & Packaging 3.1% | ||
| Ball Corp. | 272,816 | 25,546,490 |
| Diversified Financial Services 3.3% | ||
| Berkshire Hathaway, Inc., Class B (a) | 98,440 | 27,066,078 |
| Electric Utilities 3.3% | ||
| NextEra Energy, Inc. | 349,837 | 27,115,866 |
| Equity Real Estate Investment Trusts 10.2% | ||
| American Tower Corp. | 110,748 | 28,215,268 |
| Boston Properties, Inc. | 235,996 | 25,806,163 |
| Public Storage | 103,802 | 29,184,971 |
| 83,206,402 | ||
| Food & Staples Retailing 3.4% | ||
| Costco Wholesale Corp. | 75,402 | 28,056,330 |
| Health Care Equipment & Supplies 3.4% | ||
| Danaher Corp. | 110,544 | 28,071,543 |
| Shares | Value | |
| Health Care Providers & Services 3.4% | ||
| UnitedHealth Group, Inc. | 68,927 | $ 27,488,088 |
| Household Durables 3.4% | ||
| NVR, Inc. (a) | 5,494 | 27,569,441 |
| Insurance 6.5% | ||
| Markel Corp. (a) | 21,568 | 25,373,026 |
| Progressive Corp. (The) | 275,986 | 27,802,830 |
| 53,175,856 | ||
| Interactive Media & Services 0.2% | ||
| Alphabet, Inc., Class A (a) | 553 | 1,301,485 |
| Internet & Direct Marketing Retail 0.6% | ||
| Amazon.com, Inc. (a) | 1,488 | 5,159,521 |
| IT Services 0.1% | ||
| Visa, Inc., Class A | 3,075 | 718,197 |
| Machinery 12.2% | ||
| Deere & Co. | 66,002 | 24,476,842 |
| Fortive Corp. | 335,513 | 23,761,030 |
| IDEX Corp. | 124,111 | 27,825,686 |
| PACCAR, Inc. | 257,793 | 23,170,435 |
| 99,233,993 | ||
| Pharmaceuticals 0.1% | ||
| Johnson & Johnson | 4,397 | 715,524 |
| Road & Rail 6.6% | ||
| Canadian National Railway Co. | 243,471 | 26,212,031 |
| Old Dominion Freight Line, Inc. | 107,595 | 27,739,067 |
| 53,951,098 | ||
| Semiconductors & Semiconductor Equipment 0.1% | ||
| Intel Corp. | 20,000 | 1,150,600 |
| Software 4.0% | ||
| Constellation Software, Inc. | 17,699 | 25,975,476 |
| Microsoft Corp. | 25,927 | 6,538,271 |
| 32,513,747 | ||
| Trading Companies & Distributors 2.9% | ||
| Watsco, Inc. | 81,803 | 23,956,827 |
| Total Common Stocks (Cost $748,505,689) | 809,845,166 | |
| Shares | Value | ||
| Short-Term Investment 0.8% | |||
| Affiliated Investment Company 0.8% | |||
| MainStay U.S. Government Liquidity Fund, 0.01% (b) | 6,319,130 | $ 6,319,130 | |
| Total Short-Term Investment (Cost $6,319,130) | 6,319,130 | ||
| Total Investments (Cost $754,824,819) | 100.0% | 816,164,296 | |
| Other Assets, Less Liabilities | (0.0)‡ | (243,021) | |
| Net Assets | 100.0% | $ 815,921,275 | |
| † | Percentages indicated are based on Fund net assets. |
| ‡ | Less than one-tenth of a percent. |
| (a) | Non-income producing security. |
| (b) | Current yield as of April 30, 2021. |
| Description | Quoted Prices in Active Markets for Identical Assets (Level 1) | Significant Other Observable Inputs (Level 2) | Significant Unobservable Inputs (Level 3) | Total | |||
| Asset Valuation Inputs | |||||||
| Investments in Securities (a) | |||||||
| Common Stocks | $ 809,845,166 | $ — | $ — | $ 809,845,166 | |||
| Short-Term Investment | |||||||
| Affiliated Investment Company | 6,319,130 | — | — | 6,319,130 | |||
| Total Investments in Securities | $ 816,164,296 | $ — | $ — | $ 816,164,296 |
| (a) | For a complete listing of investments and their industries, see the Portfolio of Investments. |
| 12 | MainStay WMC Enduring Capital Fund |
| Assets | |
| Investment in unaffiliated securities, at value (identified cost $748,505,689) | $809,845,166 |
| Investment in affiliated investment companies, at value (identified cost $6,319,130) | 6,319,130 |
| Cash | 5,165 |
| Due from custodian | 4,179,112 |
| Receivables: | |
| Fund shares sold | 183,706 |
| Dividends and interest | 111,566 |
| Other assets | 173,570 |
| Total assets | 820,817,415 |
| Liabilities | |
| Payables: | |
| Fund shares redeemed | 2,222,842 |
| Investment securities purchased | 1,584,834 |
| Manager (See Note 3) | 511,355 |
| Custodian | 220,041 |
| Transfer agent (See Note 3) | 131,606 |
| NYLIFE Distributors (See Note 3) | 81,644 |
| Professional fees | 72,028 |
| Shareholder communication | 56,328 |
| Broker fees and charges on short sales | 138 |
| Accrued expenses | 15,324 |
| Total liabilities | 4,896,140 |
| Net assets | $815,921,275 |
| Composition of Net Assets | |
| Shares of beneficial interest outstanding (par value of $.01 per share) unlimited number of shares authorized | $ 248,817 |
| Additional paid-in-capital | 704,269,617 |
| 704,518,434 | |
| Total distributable earnings (loss) | 111,402,841 |
| Net assets | $815,921,275 |
| Class A | |
| Net assets applicable to outstanding shares | $201,052,233 |
| Shares of beneficial interest outstanding | 6,112,624 |
| Net asset value per share outstanding | $ 32.89 |
| Maximum sales charge (5.50% of offering price) | 1.91 |
| Maximum offering price per share outstanding | $ 34.80 |
| Investor Class | |
| Net assets applicable to outstanding shares | $ 32,708,057 |
| Shares of beneficial interest outstanding | 994,128 |
| Net asset value per share outstanding | $ 32.90 |
| Maximum sales charge (5.00% of offering price) | 1.73 |
| Maximum offering price per share outstanding | $ 34.63 |
| Class B | |
| Net assets applicable to outstanding shares | $ 5,772,791 |
| Shares of beneficial interest outstanding | 194,810 |
| Net asset value and offering price per share outstanding | $ 29.63 |
| Class C | |
| Net assets applicable to outstanding shares | $ 40,384,006 |
| Shares of beneficial interest outstanding | 1,363,935 |
| Net asset value and offering price per share outstanding | $ 29.61 |
| Class I | |
| Net assets applicable to outstanding shares | $213,594,791 |
| Shares of beneficial interest outstanding | 6,462,106 |
| Net asset value and offering price per share outstanding | $ 33.05 |
| Class R3 | |
| Net assets applicable to outstanding shares | $ 263,652 |
| Shares of beneficial interest outstanding | 8,057 |
| Net asset value and offering price per share outstanding | $ 32.72 |
| Class R6 | |
| Net assets applicable to outstanding shares | $322,145,745 |
| Shares of beneficial interest outstanding | 9,745,993 |
| Net asset value and offering price per share outstanding | $ 33.05 |
| Investment Income (Loss) | |
| Income | |
| Dividends-unaffiliated (net of foreign tax withholding of $1,388) | $ 1,052,295 |
| Securities lending | 167 |
| Dividends-affiliated | 69 |
| Interest | 67 |
| Total income | 1,052,598 |
| Expenses | |
| Manager (See Note 3) | 479,236 |
| Distribution/Service—Class A (See Note 3) | 97,186 |
| Distribution/Service—Investor Class (See Note 3) | 21,459 |
| Distribution/Service—Class B (See Note 3) | 20,209 |
| Distribution/Service—Class C (See Note 3) | 38,614 |
| Distribution/Service—Class R3 (See Note 3) | 590 |
| Transfer agent (See Note 3) | 87,398 |
| Registration | 53,541 |
| Professional fees | 31,472 |
| Custodian | 12,840 |
| Shareholder communication | 11,732 |
| Trustees | 1,535 |
| Insurance | 746 |
| Shareholder service (See Note 3) | 118 |
| Miscellaneous | 7,215 |
| Total expenses | 863,891 |
| Net investment income (loss) | 188,707 |
| Realized and Unrealized Gain (Loss) | |
| Net realized gain (loss) on: | |
| Unaffiliated investment transactions | 51,044,183 |
| Foreign currency transactions | (2,413) |
| Net realized gain (loss) | 51,041,770 |
| Net change in unrealized appreciation (depreciation) on investments | (9,959,330) |
| Net realized and unrealized gain (loss) | 41,082,440 |
| Net increase (decrease) in net assets resulting from operations | $41,271,147 |
| 14 | MainStay WMC Enduring Capital Fund |
for the six months ended April 30, 2021 (Unaudited) and the year ended October 31, 2020
| 2021 | 2020 | |
| Increase (Decrease) in Net Assets | ||
| Operations: | ||
| Net investment income (loss) | $ 188,707 | $ 1,152,001 |
| Net realized gain (loss) | 51,041,770 | (392,753) |
| Net change in unrealized appreciation (depreciation) | (9,959,330) | 8,091,461 |
| Net increase (decrease) in net assets resulting from operations | 41,271,147 | 8,850,709 |
| Distributions to shareholders: | ||
| Class A | (592,297) | (3,811,045) |
| Investor Class | (96,995) | (982,374) |
| Class B | — | (257,924) |
| Class C | — | (565,775) |
| Class I | (399,948) | (6,060,406) |
| Class R3 | (1,131) | (13,142) |
| Total distributions to shareholders | (1,090,371) | (11,690,666) |
| Capital share transactions: | ||
| Net proceeds from sales of shares | 37,285,632 | 15,271,205 |
| Net asset value of shares issued in connection with the acquisition of MainStay Epoch U.S. All Cap Fund | 485,242,709 | — |
| Net asset value of shares issued in connection with the acquisition of MainStay MacKay U.S. Equity Opportunities Fund | 147,554,277 | — |
| Net asset value of shares issued to shareholder in reinvestment of distributions | 1,063,805 | 11,515,981 |
| Cost of shares redeemed | (21,567,152) | (92,597,286) |
| Increase (decrease) in net assets derived from capital share transactions | 649,579,271 | (65,810,100) |
| Net increase (decrease) in net assets | 689,760,047 | (68,650,057) |
| Net Assets | ||
| Beginning of period | 126,161,228 | 194,811,285 |
| End of period | $815,921,275 | $126,161,228 |
| Six months ended April 30, 2021* | Year Ended October 31, | ||||||||||
| Class A | 2020 | 2019 | 2018 | 2017 | 2016 | ||||||
| Net asset value at beginning of period | $ 24.95 | $ 24.92 | $ 26.31 | $ 24.56 | $ 19.95 | $ 20.20 | |||||
| Net investment income (loss) (a) | 0.04 | 0.16 | 0.26 | 0.24 | 0.23 | 0.25 | |||||
| Net realized and unrealized gain (loss) on investments | 8.14 | 1.36 | 1.28 | 1.74 | 4.63 | (0.28) | |||||
| Net realized and unrealized gain (loss) on foreign currency transactions | (0.00)‡ | — | — | — | — | — | |||||
| Total from investment operations | 8.18 | 1.52 | 1.54 | 1.98 | 4.86 | (0.03) | |||||
| Less distributions: | |||||||||||
| From net investment income | (0.24) | (0.27) | (0.22) | (0.23) | (0.25) | (0.22) | |||||
| From net realized gain on investments | — | (1.22) | (2.71) | — | — | — | |||||
| Total distributions | (0.24) | (1.49) | (2.93) | (0.23) | (0.25) | (0.22) | |||||
| Net asset value at end of period | $ 32.89 | $ 24.95 | $ 24.92 | $ 26.31 | $ 24.56 | $ 19.95 | |||||
| Total investment return (b) | 32.90% | 6.42% | 6.80% | 8.07% | 24.59% | (0.13)% | |||||
| Ratios (to average net assets)/Supplemental Data: | |||||||||||
| Net investment income (loss) | 0.30%†† | 0.64% | 1.08% | 0.90% | 1.05% | 1.29% (c) | |||||
| Net expenses (d) | 1.01%†† | 0.99% | 0.97% | 0.97% | 0.96% | 0.95% (e) | |||||
| Portfolio turnover rate | 22% | 166% | 164% | 137% | 134% | 164% | |||||
| Net assets at end of period (in 000’s) | $ 201,052 | $ 62,611 | $ 63,814 | $ 63,956 | $ 53,909 | $ 42,928 | |||||
| * | Unaudited. |
| ‡ | Less than one cent per share. |
| †† | Annualized. |
| (a) | Per share data based on average shares outstanding during the period. |
| (b) | Total investment return is calculated exclusive of sales charges and assumes the reinvestment of dividends and distributions. For periods of less than one year, total return is not annualized. |
| (c) | Without the custody fee reimbursement, net investment income (loss) would have been 1.28%. |
| (d) | In addition to the fees and expenses which the Fund bears directly, it also indirectly bears a pro-rata share of the fees and expenses of the underlying funds in which it invests. Such indirect expenses are not included in the above expense ratios. |
| (e) | Without the custody fee reimbursement, net expenses would have been 0.96%. |
| 16 | MainStay WMC Enduring Capital Fund |
| Six months ended April 30, 2021* | Year Ended October 31, | ||||||||||
| Investor Class | 2020 | 2019 | 2018 | 2017 | 2016 | ||||||
| Net asset value at beginning of period | $ 24.92 | $ 24.90 | $ 26.29 | $ 24.53 | $ 19.93 | $ 20.19 | |||||
| Net investment income (loss) (a) | 0.01 | 0.08 | 0.20 | 0.18 | 0.18 | 0.21 | |||||
| Net realized and unrealized gain (loss) on investments | 8.13 | 1.37 | 1.27 | 1.74 | 4.62 | (0.29) | |||||
| Net realized and unrealized gain (loss) on foreign currency transactions | (0.00)‡ | — | — | — | — | — | |||||
| Total from investment operations | 8.14 | 1.45 | 1.47 | 1.92 | 4.80 | (0.08) | |||||
| Less distributions: | |||||||||||
| From net investment income | (0.16) | (0.21) | (0.15) | (0.16) | (0.20) | (0.18) | |||||
| From net realized gain on investments | — | (1.22) | (2.71) | — | — | — | |||||
| Total distributions | (0.16) | (1.43) | (2.86) | (0.16) | (0.20) | (0.18) | |||||
| Net asset value at end of period | $ 32.90 | $ 24.92 | $ 24.90 | $ 26.29 | $ 24.53 | $ 19.93 | |||||
| Total investment return (b) | 32.76% | 6.05% | 6.51% | 7.82% | 24.25% | (0.39)% | |||||
| Ratios (to average net assets)/Supplemental Data: | |||||||||||
| Net investment income (loss) | 0.05%†† | 0.35% | 0.82% | 0.68% | 0.83% | 1.05% (c) | |||||
| Net expenses (d) | 1.30%†† | 1.30% | 1.23% | 1.21% | 1.22% | 1.20% (e) | |||||
| Expenses (before waiver/reimbursement) (d) | 1.30%†† | 1.31% | 1.27% | 1.23% | 1.22% | 1.20% (e) | |||||
| Portfolio turnover rate | 22% | 166% | 164% | 137% | 134% | 164% | |||||
| Net assets at end of period (in 000’s) | $ 32,708 | $ 15,544 | $ 17,203 | $ 16,580 | $ 17,216 | $ 21,880 | |||||
| * | Unaudited. |
| ‡ | Less than one cent per share. |
| †† | Annualized. |
| (a) | Per share data based on average shares outstanding during the period. |
| (b) | Total investment return is calculated exclusive of sales charges and assumes the reinvestment of dividends and distributions. For periods of less than one year, total return is not annualized. |
| (c) | Without the custody fee reimbursement, net investment income (loss) would have been 1.04%. |
| (d) | In addition to the fees and expenses which the Fund bears directly, it also indirectly bears a pro-rata share of the fees and expenses of the underlying funds in which it invests. Such indirect expenses are not included in the above expense ratios. |
| (e) | Without the custody fee reimbursement, net expenses would have been 1.21%. |
| Six months ended April 30, 2021* | Year Ended October 31, | ||||||||||
| Class B | 2020 | 2019 | 2018 | 2017 | 2016 | ||||||
| Net asset value at beginning of period | $ 22.40 | $ 22.50 | $ 24.04 | $ 22.46 | $ 18.25 | $ 18.49 | |||||
| Net investment income (loss) (a) | (0.09) | (0.08) | 0.02 | (0.02) | 0.01 | 0.05 | |||||
| Net realized and unrealized gain (loss) on investments | 7.32 | 1.22 | 1.15 | 1.60 | 4.24 | (0.26) | |||||
| Net realized and unrealized gain (loss) on foreign currency transactions | (0.00)‡ | — | — | — | — | — | |||||
| Total from investment operations | 7.23 | 1.14 | 1.17 | 1.58 | 4.25 | (0.21) | |||||
| Less distributions: | |||||||||||
| From net investment income | — | (0.02) | — | — | (0.04) | (0.03) | |||||
| From net realized gain on investments | — | (1.22) | (2.71) | — | — | — | |||||
| Total distributions | — | (1.24) | (2.71) | — | (0.04) | (0.03) | |||||
| Net asset value at end of period | $ 29.63 | $ 22.40 | $ 22.50 | $ 24.04 | $ 22.46 | $ 18.25 | |||||
| Total investment return (b) | 32.22% | 5.28% | 5.71% | 7.03% | 23.31% | (1.12)% | |||||
| Ratios (to average net assets)/Supplemental Data: | |||||||||||
| Net investment income (loss) | (0.69)%†† | (0.39)% | 0.10% | (0.07)% | 0.06% | 0.30% (c) | |||||
| Net expenses (d) | 2.05%†† | 2.05% | 1.98% | 1.96% | 1.97% | 1.95% (e) | |||||
| Expenses (before waiver/reimbursement) (d) | 2.05%†† | 2.06% | 2.02% | 1.98% | 1.97% | 1.95% (e) | |||||
| Portfolio turnover rate | 22% | 166% | 164% | 137% | 134% | 164% | |||||
| Net assets at end of period (in 000’s) | $ 5,773 | $ 3,666 | $ 4,718 | $ 5,855 | $ 6,635 | $ 6,604 | |||||
| * | Unaudited. |
| ‡ | Less than one cent per share. |
| †† | Annualized. |
| (a) | Per share data based on average shares outstanding during the period. |
| (b) | Total investment return is calculated exclusive of sales charges and assumes the reinvestment of dividends and distributions. For periods of less than one year, total return is not annualized. |
| (c) | Without the custody fee reimbursement, net investment income (loss) would have been 0.29%. |
| (d) | In addition to the fees and expenses which the Fund bears directly, it also indirectly bears a pro-rata share of the fees and expenses of the underlying funds in which it invests. Such indirect expenses are not included in the above expense ratios. |
| (e) | Without the custody fee reimbursement, net expenses would have been 1.96%. |
| 18 | MainStay WMC Enduring Capital Fund |
| Six months ended April 30, 2021* | Year Ended October 31, | ||||||||||
| Class C | 2020 | 2019 | 2018 | 2017 | 2016 | ||||||
| Net asset value at beginning of period | $ 22.38 | $ 22.48 | $ 24.02 | $ 22.45 | $ 18.24 | $ 18.48 | |||||
| Net investment income (loss) (a) | (0.09) | (0.08) | 0.02 | (0.02) | 0.01 | 0.06 | |||||
| Net realized and unrealized gain (loss) on investments | 7.32 | 1.22 | 1.15 | 1.59 | 4.24 | (0.27) | |||||
| Net realized and unrealized gain (loss) on foreign currency transactions | (0.00)‡ | — | — | — | — | — | |||||
| Total from investment operations | 7.23 | 1.14 | 1.17 | 1.57 | 4.25 | (0.21) | |||||
| Less distributions: | |||||||||||
| From net investment income | — | (0.02) | — | — | (0.04) | (0.03) | |||||
| From net realized gain on investments | — | (1.22) | (2.71) | — | — | — | |||||
| Total distributions | — | (1.24) | (2.71) | — | (0.04) | (0.03) | |||||
| Net asset value at end of period | $ 29.61 | $ 22.38 | $ 22.48 | $ 24.02 | $ 22.45 | $ 18.24 | |||||
| Total investment return (b) | 32.25% | 5.29% | 5.72% | 6.99% | 23.33% | (1.12)% | |||||
| Ratios (to average net assets)/Supplemental Data: | |||||||||||
| Net investment income (loss) | (0.73)%†† | (0.38)% | 0.10% | (0.08)% | 0.06% | 0.34% (c) | |||||
| Net expenses (d) | 1.99%†† | 2.05% | 1.98% | 1.96% | 1.97% | 1.95% (e) | |||||
| Expenses (before waiver/reimbursement) (d) | 1.99%†† | 2.06% | 2.02% | 1.98% | 1.97% | 1.95% (e) | |||||
| Portfolio turnover rate | 22% | 166% | 164% | 137% | 134% | 164% | |||||
| Net assets at end of period (in 000’s) | $ 40,384 | $ 6,641 | $ 10,946 | $ 14,964 | $ 15,459 | $ 16,509 | |||||
| * | Unaudited. |
| ‡ | Less than one cent per share. |
| †† | Annualized. |
| (a) | Per share data based on average shares outstanding during the period. |
| (b) | Total investment return is calculated exclusive of sales charges and assumes the reinvestment of dividends and distributions. For periods of less than one year, total return is not annualized. |
| (c) | Without the custody fee reimbursement, net investment income (loss) would have been 0.33%. |
| (d) | In addition to the fees and expenses which the Fund bears directly, it also indirectly bears a pro-rata share of the fees and expenses of the underlying funds in which it invests. Such indirect expenses are not included in the above expense ratios. |
| (e) | Without the custody fee reimbursement, net expenses would have been 1.96%. |
| Six months ended April 30, 2021* | Year Ended October 31, | ||||||||||
| Class I | 2020 | 2019 | 2018 | 2017 | 2016 | ||||||
| Net asset value at beginning of period | $ 25.09 | $ 25.05 | $ 26.44 | $ 24.67 | $ 20.04 | $ 20.29 | |||||
| Net investment income (loss) (a) | 0.07 | 0.23 | 0.32 | 0.31 | 0.29 | 0.31 | |||||
| Net realized and unrealized gain (loss) on investments | 8.18 | 1.37 | 1.28 | 1.74 | 4.65 | (0.29) | |||||
| Net realized and unrealized gain (loss) on foreign currency transactions | (0.00)‡ | — | — | — | — | — | |||||
| Total from investment operations | 8.25 | 1.60 | 1.60 | 2.05 | 4.94 | 0.02 | |||||
| Less distributions: | |||||||||||
| From net investment income | (0.29) | (0.34) | (0.28) | (0.28) | (0.31) | (0.27) | |||||
| From net realized gain on investments | — | (1.22) | (2.71) | — | — | — | |||||
| Total distributions | (0.29) | (1.56) | (2.99) | (0.28) | (0.31) | (0.27) | |||||
| Net asset value at end of period | $ 33.05 | $ 25.09 | $ 25.05 | $ 26.44 | $ 24.67 | $ 20.04 | |||||
| Total investment return (b) | 33.10% | 6.66% | 7.06% | 8.36% | 24.89% | 0.12% | |||||
| Ratios (to average net assets)/Supplemental Data: | |||||||||||
| Net investment income (loss) | 0.46%†† | 0.96% | 1.34% | 1.16% | 1.31% | 1.55% (c) | |||||
| Net expenses (d) | 0.75%†† | 0.74% | 0.72% | 0.71% | 0.71% | 0.70% (e) | |||||
| Portfolio turnover rate | 22% | 166% | 164% | 137% | 134% | 164% | |||||
| Net assets at end of period (in 000’s) | $ 213,595 | $ 37,491 | $ 97,903 | $ 98,395 | $ 96,441 | $ 87,774 | |||||
| * | Unaudited. |
| ‡ | Less than one cent per share. |
| †† | Annualized. |
| (a) | Per share data based on average shares outstanding during the period. |
| (b) | Total investment return is calculated exclusive of sales charges and assumes the reinvestment of dividends and distributions. Class I shares are not subject to sales charges. For periods of less than one year, total return is not annualized. |
| (c) | Without the custody fee reimbursement, net investment income (loss) would have been 1.54%. |
| (d) | In addition to the fees and expenses which the Fund bears directly, it also indirectly bears a pro-rata share of the fees and expenses of the underlying funds in which it invests. Such indirect expenses are not included in the above expense ratios. |
| (e) | Without the custody fee reimbursement, net expenses would have been 0.71%. |
| 20 | MainStay WMC Enduring Capital Fund |
| Six months ended April 30, 2021* | Year Ended October 31, | February 29, 2016^ through October 31, 2016 | |||||||||
| Class R3 | 2020 | 2019 | 2018 | 2017 | |||||||
| Net asset value at beginning of period | $ 24.78 | $ 24.77 | $ 26.17 | $ 24.48 | $ 19.90 | $ 18.44 | |||||
| Net investment income (loss) (a) | (0.00)‡ | 0.07 | 0.17 | 0.14 | 0.13 | 0.10 | |||||
| Net realized and unrealized gain (loss) on investments | 8.08 | 1.36 | 1.28 | 1.73 | 4.65 | 1.36 | |||||
| Net realized and unrealized gain (loss) on foreign currency transactions | (0.00)‡ | — | — | — | — | — | |||||
| Total from investment operations | 8.08 | 1.43 | 1.45 | 1.87 | 4.78 | 1.46 | |||||
| Less distributions: | |||||||||||
| From net investment income | (0.14) | (0.20) | (0.14) | (0.18) | (0.20) | — | |||||
| From net realized gain on investments | — | (1.22) | (2.71) | — | — | — | |||||
| Total distributions | (0.14) | (1.42) | (2.85) | (0.18) | (0.20) | — | |||||
| Net asset value at end of period | $ 32.72 | $ 24.78 | $ 24.77 | $ 26.17 | $ 24.48 | $ 19.90 | |||||
| Total investment return (b) | 32.70% | 6.02% | 6.42% | 7.66% | 24.17% | 7.92% (c) | |||||
| Ratios (to average net assets)/Supplemental Data: | |||||||||||
| Net investment income (loss) | (0.01)%†† | 0.30% | 0.70% | 0.52% | 0.60% | 0.74%†† (d) | |||||
| Net expenses (e) | 1.37%†† | 1.34% | 1.32% | 1.32% | 1.31% | 1.31%†† (f) | |||||
| Portfolio turnover rate | 22% | 166% | 164% | 137% | 134% | 164% | |||||
| Net assets at end of period (in 000’s) | $ 264 | $ 207 | $ 227 | $ 137 | $ 86 | $ 29 | |||||
| * | Unaudited. |
| ^ | Inception date. |
| ‡ | Less than one cent per share. |
| †† | Annualized. |
| (a) | Per share data based on average shares outstanding during the period. |
| (b) | Total investment return is calculated exclusive of sales charges and assumes the reinvestment of dividends and distributions. Class R3 shares are not subject to sales charges. For periods of less than one year, total return is not annualized. |
| (c) | Total investment return may reflect adjustments to conform to generally accepted accounting principles. |
| (d) | Without the custody fee reimbursement, net investment income (loss) would have been 0.73%. |
| (e) | In addition to the fees and expenses which the Fund bears directly, it also indirectly bears a pro-rata share of the fees and expenses of the underlying funds in which it invests. Such indirect expenses are not included in the above expense ratios. |
| (f) | Without the custody fee reimbursement, net expenses would have been 1.32%. |
| April 26, 2021^through April 30, 2021* | |
| Class R6 | |
| Net asset value at beginning of period | $ 33.07 |
| Net investment income (loss) (a) | (0.00)‡ |
| Net realized and unrealized gain (loss) on investments | (0.02) |
| Net realized and unrealized gain (loss) on foreign currency transactions | (0.00)‡ |
| Total from investment operations | (0.02) |
| Net asset value at end of period | $ 33.05 |
| Total investment return (b) | (0.03)% |
| Ratios (to average net assets)/Supplemental Data: | |
| Net investment income (loss)†† | (0.05)% |
| Net expenses†† (c) | 0.60% |
| Portfolio turnover rate | 22% |
| Net assets at end of period (in 000’s) | $ 322,146 |
| * | Unaudited. |
| ^ | Inception date. |
| ‡ | Less than one cent per share. |
| †† | Annualized. |
| (a) | Per share data based on average shares outstanding during the period. |
| (b) | Total investment return is calculated exclusive of sales charges and assumes the reinvestment of dividends and distributions. Class R6 shares are not subject to sales charges. For periods of less than one year, total return is not annualized. |
| (c) | In addition to the fees and expenses which the Fund bears directly, it also indirectly bears a pro-rata share of the fees and expenses of the underlying funds in which it invests. Such indirect expenses are not included in the above expense ratios. |
| 22 | MainStay WMC Enduring Capital Fund |
| Class | Commenced Operations |
| Class A | June 1, 1998 |
| Investor Class | February 28, 2008 |
| Class B | June 1, 1998 |
| Class C | September 1, 1998 |
| Class I | December 28, 2004 |
| Class R3 | February 29, 2016 |
| Class R6 | April 26, 2021 |
| Class R2 | N/A * |
| SIMPLE Class | N/A * |
| * | Class R2 and SIMPLE Class shares were registered for sale effective as of December 14, 2007 and August 31, 2020, respectively, but have not yet commenced operations. |
| • | Level 1—quoted prices in active markets for an identical asset or liability |
| • | Level 2—other significant observable inputs (including quoted prices for a similar asset or liability in active markets, interest rates and yield curves, prepayment speeds, credit risk, etc.) |
| • | Level 3—significant unobservable inputs (including the Fund's own assumptions about the assumptions that market participants would use in measuring fair value of an asset or liability) |
| • Broker/dealer quotes | • Benchmark securities |
| • Two-sided markets | • Reference data (corporate actions or material event notices) |
| • Bids/offers | • Monthly payment information |
| • Industry and economic events | • Reported trades |
| 24 | MainStay WMC Enduring Capital Fund |
| 26 | MainStay WMC Enduring Capital Fund |
| Class R3 | $ 118 |
| Class | Expense | Waived |
| Class A | $22,398 | $— |
| Investor Class | 30,233 | — |
| Class B | 7,118 | — |
| Class C | 13,604 | — |
| Class I | 13,801 | — |
| Class R3 | 68 | — |
| Class R6 | 176 | — |
| Affiliated Investment Companies | Value, Beginning of Period | Purchases at Cost | Proceeds from Sales | Net Realized Gain/(Loss) on Sales | Change in Unrealized Appreciation/ (Depreciation) | Value, End of Period | Dividend Income | Other Distributions | Shares End of Period |
| MainStay U.S. Government Liquidity Fund | $ 71 | $ 53,578 | $ (47,330) | $ — | $ — | $ 6,319 | $ —(a) | $ — | 6,319 |
| (a) | Less than $500. |
| Class R3 | $53,994 | 20.5% |
| Class R6 | 37,907 | 0.0‡ |
| ‡ | Less than one-tenth of a percent. |
| 28 | MainStay WMC Enduring Capital Fund |
| Federal Tax Cost | Gross Unrealized Appreciation | Gross Unrealized (Depreciation) | Net Unrealized Appreciation/ (Depreciation) | |
| Investments | $755,623,673 | $63,781,516 | $(3,240,893) | $60,540,623 |
| Capital Loss Available Through | Short-Term Capital Loss Amounts (000’s) | Long-Term Capital Loss Amounts (000’s) |
| Unlimited | $378 | $— |
| 2020 | |
| Distributions paid from: | |
| Ordinary Income | $ 2,154,756 |
| Long-Term Capital Gains | 9,535,910 |
| Total | $11,690,666 |
| Class A | Shares | Amount |
| Period ended April 30, 2021: | ||
| Shares sold | 229,016 | $ 6,876,096 |
| Shares issued in connection with the acquisition of MainStay Epoch U.S. All Cap Fund | 1,545,799 | 50,867,461 |
| Shares issued in connection with the acquisition of MainStay MacKay U.S. Equity Opportunities Fund | 1,903,874 | 62,650,579 |
| Shares issued to shareholders in reinvestment of distributions | 20,437 | 567,749 |
| Shares redeemed | (207,004) | (6,050,498) |
| Net increase (decrease) in shares outstanding before conversion | 3,492,122 | 114,911,387 |
| Shares converted into Class A (See Note 1) | 111,223 | 3,264,716 |
| Shares converted from Class A (See Note 1) | (98) | (2,684) |
| Net increase (decrease) | 3,603,247 | $118,173,419 |
| Year ended October 31, 2020: | ||
| Shares sold | 371,300 | $ 8,874,189 |
| Shares issued to shareholders in reinvestment of distributions | 157,411 | 3,758,985 |
| Shares redeemed | (681,380) | (16,032,818) |
| Net increase (decrease) in shares outstanding before conversion | (152,669) | (3,399,644) |
| Shares converted into Class A (See Note 1) | 104,209 | 2,571,686 |
| Shares converted from Class A (See Note 1) | (3,304) | (71,354) |
| Net increase (decrease) | (51,764) | $ (899,312) |
| Investor Class | Shares | Amount |
| Period ended April 30, 2021: | ||
| Shares sold | 20,233 | $ 609,810 |
| Shares issued in connection with the acquisition of MainStay Epoch U.S. All Cap Fund | 319,550 | 10,519,323 |
| Shares issued in connection with the acquisition of MainStay MacKay U.S. Equity Opportunities Fund | 145,980 | 4,805,532 |
| Shares issued to shareholders in reinvestment of distributions | 3,475 | 96,668 |
| Shares redeemed | (27,848) | (817,139) |
| Net increase (decrease) in shares outstanding before conversion | 461,390 | 15,214,194 |
| Shares converted into Investor Class (See Note 1) | 9,492 | 284,495 |
| Shares converted from Investor Class (See Note 1) | (100,555) | (2,952,260) |
| Net increase (decrease) | 370,327 | $ 12,546,429 |
| Year ended October 31, 2020: | ||
| Shares sold | 56,719 | $ 1,340,955 |
| Shares issued to shareholders in reinvestment of distributions | 41,039 | 981,666 |
| Shares redeemed | (95,721) | (2,291,076) |
| Net increase (decrease) in shares outstanding before conversion | 2,037 | 31,545 |
| Shares converted into Investor Class (See Note 1) | 16,201 | 379,207 |
| Shares converted from Investor Class (See Note 1) | (85,403) | (2,129,027) |
| Net increase (decrease) | (67,165) | $ (1,718,275) |
| Class B | Shares | Amount |
| Period ended April 30, 2021: | ||
| Shares sold | 2,004 | $ 51,944 |
| Shares issued in connection with the acquisition of MainStay Epoch U.S. All Cap Fund | 56,787 | 1,683,892 |
| Shares redeemed | (12,973) | (347,529) |
| Net increase (decrease) in shares outstanding before conversion | 45,818 | 1,388,307 |
| Shares converted from Class B (See Note 1) | (14,639) | (388,978) |
| Net increase (decrease) | 31,179 | $ 999,329 |
| Year ended October 31, 2020: | ||
| Shares sold | 10,544 | $ 208,129 |
| Shares issued to shareholders in reinvestment of distributions | 11,381 | 246,389 |
| Shares redeemed | (37,905) | (829,164) |
| Net increase (decrease) in shares outstanding before conversion | (15,980) | (374,646) |
| Shares converted from Class B (See Note 1) | (30,111) | (643,112) |
| Net increase (decrease) | (46,091) | $ (1,017,758) |
| 30 | MainStay WMC Enduring Capital Fund |
| Class C | Shares | Amount |
| Period ended April 30, 2021: | ||
| Shares sold | 2,146 | $ 6,383 |
| Shares issued in connection with the acquisition of MainStay Epoch U.S. All Cap Fund | 69,442 | 2,057,308 |
| Shares issued in connection with the acquisition of MainStay MacKay U.S. Equity Opportunities Fund | 1,092,350 | 32,362,061 |
| Shares redeemed | (89,228) | (2,391,783) |
| Net increase (decrease) in shares outstanding before conversion | 1,074,710 | 32,033,969 |
| Shares converted from Class C (See Note 1) | (7,483) | (205,289) |
| Net increase (decrease) | 1,067,227 | $ 31,828,680 |
| Year ended October 31, 2020: | ||
| Shares sold | 27,320 | $ 517,704 |
| Shares issued to shareholders in reinvestment of distributions | 21,541 | 465,937 |
| Shares redeemed | (234,136) | (5,092,314) |
| Net increase (decrease) in shares outstanding before conversion | (185,275) | (4,108,673) |
| Shares converted from Class C (See Note 1) | (4,980) | (107,400) |
| Net increase (decrease) | (190,255) | $ (4,216,073) |
| Class I | Shares | Amount |
| Period ended April 30, 2021: | ||
| Shares sold | 952,566 | $ 29,731,308 |
| Shares issued in connection with the acquisition of MainStay Epoch U.S. All Cap Fund | 3,846,331 | 127,191,639 |
| Shares issued in connection with the acquisition of MainStay MacKay U.S. Equity Opportunities Fund | 1,443,561 | 47,736,105 |
| Shares issued to shareholders in reinvestment of distributions | 14,290 | 398,556 |
| Shares redeemed | (401,064) | (11,941,192) |
| Net increase (decrease) in shares outstanding before conversion | 5,855,684 | 193,116,416 |
| Shares converted from Class I (See Note 1) | (887,870) | (29,360,331) |
| Net increase (decrease) | 4,967,814 | $163,756,085 |
| Year ended October 31, 2020: | ||
| Shares sold | 209,862 | $ 4,279,265 |
| Shares issued to shareholders in reinvestment of distributions | 252,734 | 6,052,970 |
| Shares redeemed | (2,876,895) | (68,274,019) |
| Net increase (decrease) | (2,414,299) | $ (57,941,784) |
| Class R3 | Shares | Amount |
| Period ended April 30, 2021: | ||
| Shares sold | 351 | $ 10,091 |
| Shares issued to shareholders in reinvestment of distributions | 30 | 832 |
| Shares redeemed | (670) | (19,011) |
| Net increase (decrease) | (289) | $ (8,088) |
| Year ended October 31, 2020: | ||
| Shares sold | 2,143 | $ 50,963 |
| Shares issued to shareholders in reinvestment of distributions | 422 | 10,034 |
| Shares redeemed | (3,390) | (77,895) |
| Net increase (decrease) | (825) | $ (16,898) |
| Class R6 | Shares | Amount |
| Period ended April 30, 2021: (a) | ||
| Shares issued in connection with the acquisition of MainStay Epoch U.S. All Cap Fund | 8,858,124 | $292,923,086 |
| Net increase (decrease) in shares outstanding before conversion | 8,858,124 | 292,923,086 |
| Shares converted into Class R6 (See Note 1) | 887,869 | 29,360,331 |
| Net increase (decrease) | 9,745,993 | $322,283,417 |
| (a) | The inception of the class was April 26, 2021. |
| Before Reorganizations | After Reorganizations | ||||
| MainStay Epoch U.S. All Cap Fund | MainStay MacKay U.S. Equity Opportunities Fund | MainStay WMC Enduring Capital Fund | MainStay WMC Enduring Capital Fund | ||
| Net Assets: | |||||
| Class A | $ 50,867,461 | $62,650,579 | $87,142,173 | $200,660,213 | |
| Investor Class | 10,519,323 | 4,805,532 | 17,434,982 | 32,759,837 | |
| Class B | 1,683,892 | — | 4,099,234 | 5,783,126 | |
| Class C | 2,057,308 | 32,362,061 | 6,361,805 | 40,781,174 | |
| Class I | 127,191,639 | 47,736,105 | 72,422,410 | 247,350,154 | |
| Class R3 | — | — | 263,412 | 263,412 | |
| Class R6 | 292,923,086 | — | — | 292,923,086 | |
| Shares Outstanding: | |||||
| Class A | 3,212,607 | 10,880,048 | 2,648,143 | 6,097,816 | |
| Investor Class | 706,000 | 869,370 | 529,629 | 995,159 | |
| Class B | 184,739 | — | 138,242 | 195,029 | |
| Class C | 225,389 | 8,073,963 | 214,736 | 1,376,528 | |
| Class I | 6,191,031 | 8,105,427 | 2,190,089 | 7,479,981 | |
| Class R3 | — | — | 8,046 | 8,046 | |
| Class R6 | 14,258,883 | — | — | 8,858,124 | |
| Net Asset Value Per Share Outstanding: | |||||
| Class A | $ 15.83 | $ 5.76 | $ 32.91 | $ 32.91 | |
| Investor Class | $ 14.90 | $ 5.53 | $ 32.92 | $ 32.92 | |
| Class B | $ 9.12 | $ — | $ 29.65 | $ 29.65 | |
| Class C | $ 9.13 | $ 4.01 | $ 29.63 | $ 29.63 | |
| Class I | $ 20.54 | $ 5.89 | $ 33.07 | $ 33.07 | |
| Class R3 | $ — | $ — | $ 32.74 | $ 32.74 | |
| Class R6 | $ 20.54 | $ — | $ — | $ 33.07 | |
| Total distributable earnings (loss) | $ (7,922,696) | $68,192,157 | $71,750,878 | $111,850,923 | |
| Net investment income (loss) | $ 438,683 |
| Net realized and unrealized gain (loss) | 398,948,570 |
| Net change in net assets resulting from operations | $399,387,253 |
| 32 | MainStay WMC Enduring Capital Fund |
| Fund | Proceeds | Cost Basis |
| MainStay WMC Enduring Capital Fund | $751,774 | $729,369 |
| 34 | MainStay WMC Enduring Capital Fund |
| • | experience in providing investment advisory services; |
| • | experience in serving as advisor or subadvisor to other funds with similar strategies as those of the Fund, as repositioned, and the performance track record of those funds; |
| • | experience of investment advisory, senior management and administrative personnel; |
| • | overall legal and compliance environment, resources and history and policies and procedures in place with respect to matters that may involve conflicts of interest between the Fund’s investments and those of other accounts managed by Wellington; |
| • | New York Life Investments’ and Wellington’s belief that their respective compliance policies, procedures and systems are reasonably designed to prevent violation of the federal securities laws and their commitment to further developing and strengthening compliance programs relating to the MainStay Group of Funds generally and the Fund specifically; |
| • | ability to attract and retain qualified investment professionals and willingness to invest in personnel to service and support the Fund; |
| • | portfolio construction and risk management processes; |
| • | experience of the Fund’s proposed portfolio managers, including with respect to investment strategies similar to those of the Fund, the number of accounts managed by the portfolio managers and the method for compensating the portfolio managers; and |
| • | overall reputation, financial condition and assets under management. |
| 36 | MainStay WMC Enduring Capital Fund |
| 38 | MainStay WMC Enduring Capital Fund |
1.
| 2. | This Fund is registered for sale in CA, CT, DE, FL, MA, NJ, NY and VT. |
| 3. | An affiliate of New York Life Investment Management LLC. |
| 1737426MS071-21 | MSWEC10-06/21 |
please log in to newyorklifeinvestments.com/accounts.
| Not FDIC/NCUA Insured | Not a Deposit | May Lose Value | No Bank Guarantee | Not Insured by Any Government Agency |


President

| Average Annual Total Returns for the Period-Ended April 30, 20211 | ||||||||
| Class | Sales Charge | Inception Date | Six Months or Since Inception | One Year | Five Years | Ten Years | Gross Expense Ratio2 | |
| Class A Shares | Maximum 5.5% Initial Sales Charge | With sales charges | 6/9/1999 | 29.46% | 47.84% | 15.05% | 11.07% | 1.00% |
| Excluding sales charges | 36.99 | 56.44 | 16.36 | 11.70 | 1.00 | |||
| Investor Class Shares3 | Maximum 5% Initial Sales Charge | With sales charges | 2/28/2008 | 29.96 | 47.42 | 14.79 | 10.85 | 1.31 |
| Excluding sales charges | 36.80 | 56.00 | 16.09 | 11.47 | 1.31 | |||
| Class B Shares4 | Maximum 5% CDSC | With sales charges | 6/9/1999 | 31.27 | 49.82 | 14.99 | 10.64 | 2.06 |
| if Redeemed Within the First Six Years of Purchase | Excluding sales charges | 36.27 | 54.82 | 15.22 | 10.64 | 2.06 | ||
| Class C Shares | Maximum 1% CDSC | With sales charges | 6/9/1999 | 35.26 | 53.80 | 15.22 | 10.64 | 2.06 |
| if Redeemed Within One Year of Purchase | Excluding sales charges | 36.26 | 54.80 | 15.22 | 10.64 | 2.06 | ||
| Class I Shares | No Sales Charge | 1/21/1971 | 37.15 | 56.86 | 16.65 | 11.98 | 0.75 | |
| Class R1 Shares | No Sales Charge | 1/2/2004 | 37.09 | 56.68 | 16.54 | 11.87 | 0.85 | |
| Class R2 Shares | No Sales Charge | 1/2/2004 | 36.92 | 56.31 | 16.25 | 11.59 | 1.10 | |
| Class R3 Shares | No Sales Charge | 4/28/2006 | 36.74 | 55.90 | 15.95 | 11.31 | 1.35 | |
| Class R6 Shares | No Sales Charge | 4/26/2021 | 0.50 | N/A | N/A | N/A | 0.70 | |
| 1. | The Fund replaced its subadvisors, changed its investment objective and modified its principal investment strategies as of April 26, 2021. Therefore, the performance information shown in this report prior to April 26, 2021 reflects that of the Fund’s prior subadvisors, investment objective and principal investment strategies. |
| 2. | The gross expense ratios presented reflect the Fund’s “Total Annual Fund Operating Expenses” from the most recent Prospectus, as supplemented, and may differ from other expense ratios disclosed in this report. |
| 3. | Prior to June 30, 2020, the maximum initial sales charge was 5.5%, which is reflected in the average annual total return figures shown. |
| 4. | Class B shares are closed to all new purchases as well as additional investments by existing Class B shareholders. |
| Benchmark Performance | Six Months | One Year | Five Years | Ten Years |
| Russell 1000® Value Index1 | 36.30% | 45.92% | 12.15% | 11.13% |
| Russell 3000® Index2 | 31.08 | 50.92 | 17.67 | 14.03 |
| Morningstar Large Blend Category Average3 | 28.98 | 45.28 | 15.35 | 11.88 |
| 1. | The Fund has selected the Russell 1000® Value Index as its primary benchmark. The Russell 1000® Value Index measures the performance of the large-cap value segment of the U.S. equity universe. It includes those Russell 1000® Index companies with lower price-to-book ratios and lower expected growth values. Results assume reinvestment of all dividends and capital gains. An investment cannot be made directly in an index. |
| 2. | Prior to April 26, 2021, the Russell 3000® Index was the Fund’s primary broad-based securities market index for comparison purposes. The Russell 3000® Index measures the performance of the largest 3,000 U.S. companies representing approximately 98% of the investable U.S. equity market. Results assume reinvestment of all dividends and capital gains. An investment cannot be made directly in an index. |
| 3. | The Morningstar Large Blend Category Average is representative of funds that represent the overall U.S. stock market in size, growth rates and price. Stocks in the top 70% of the capitalization of the U.S. equity market are defined as large cap. The blend style is assigned to portfolios where neither growth nor value characteristics predominate. These portfolios tend to invest across the spectrum of U.S. industries, and owing to their broad exposure, the portfolios’ returns are often similar to those of the S&P 500® Index. Results are based on average total returns of similar funds with all dividends and capital gain distributions reinvested. |
| 6 | MainStay WMC Value Fund |
| Share Class | Beginning Account Value 11/1/20 | Ending Account Value (Based on Actual Returns and Expenses) 4/30/21 | Expenses Paid During Period1 | Ending Account Value (Based on Hypothetical 5% Annualized Return and Actual Expenses) 4/30/21 | Expenses Paid During Period1 | Net Expense Ratio During Period2 |
| Class A Shares | $1,000.00 | $1,369.90 | $ 6.40 | $1,019.39 | $ 5.46 | 1.09% |
| Investor Class Shares | $1,000.00 | $1,368.00 | $ 8.16 | $1,017.90 | $ 6.95 | 1.39% |
| Class B Shares | $1,000.00 | $1,362.70 | $12.54 | $1,014.18 | $10.69 | 2.14% |
| Class C Shares | $1,000.00 | $1,362.60 | $12.54 | $1,014.18 | $10.69 | 2.14% |
| Class I Shares | $1,000.00 | $1,371.50 | $ 5.00 | $1,020.58 | $ 4.26 | 0.85% |
| Class R1 Shares | $1,000.00 | $1,370.90 | $ 5.53 | $1,020.13 | $ 4.71 | 0.94% |
| Class R2 Shares | $1,000.00 | $1,369.20 | $ 6.99 | $1,018.89 | $ 5.96 | 1.19% |
| Class R3 Shares | $1,000.00 | $1,367.40 | $ 8.51 | $1,017.60 | $ 7.25 | 1.45% |
| Class R6 Shares 3, 4 | $1,000.00 | $1,005.00 | $ 0.10 | $1,000.59 | $ 0.10 | 0.70% |
| 1. | Expenses are equal to the Fund’s annualized expense ratio of each class multiplied by the average account value over the period, divided by 365 and multiplied by 181 (to reflect the six-month period) and 5 days for Class R6 (to reflect the since-inception period). The table above represents the actual expenses incurred during the six-month period. In addition to the fees and expenses which the Fund bears directly, it also indirectly bears a pro rata share of the fees and expenses of the underlying funds in which it invests. Such indirect expenses are not included in the above-reported expense figures. |
| 2. | Expenses are equal to the Fund's annualized expense ratio to reflect the six-month period. |
| 3. | Expenses paid during the period reflect ongoing costs for the period from inception through 4/30/21. Had these shares been offered for the full six-month period ended 4/30/21, and had the Fund provided a hypothetical 5% annualized return, expenses paid during the period would have been $3.51 for Class R6 shares and the ending account value would have been $1,019.91 for Class R6 shares. |
| 4. | The inception date was April 26, 2021. |
| Banks | 11.5% |
| Pharmaceuticals | 7.2 |
| Insurance | 6.6 |
| Aerospace & Defense | 5.4 |
| Health Care Providers & Services | 4.9 |
| Health Care Equipment & Supplies | 4.8 |
| Semiconductors & Semiconductor Equipment | 4.6 |
| Capital Markets | 4.5 |
| Communications Equipment | 3.8 |
| Equity Real Estate Investment Trusts | 3.7 |
| Specialty Retail | 3.1 |
| IT Services | 2.8 |
| Interactive Media & Services | 2.7 |
| Multi–Utilities | 2.7 |
| Media | 2.6 |
| Road & Rail | 2.6 |
| Chemicals | 2.6 |
| Oil, Gas & Consumable Fuels | 2.5 |
| Electric Utilities | 2.5 |
| Building Products | 2.4% |
| Electronic Equipment, Instruments & Components | 1.6 |
| Beverages | 1.4 |
| Food Products | 1.4 |
| Containers & Packaging | 1.4 |
| Household Durables | 1.3 |
| Electrical Equipment | 1.3 |
| Machinery | 1.3 |
| Real Estate Management & Development | 1.2 |
| Auto Components | 1.1 |
| Metals & Mining | 1.1 |
| Software | 1.0 |
| Hotels, Restaurants & Leisure | 1.0 |
| Biotechnology | 0.5 |
| Short–Term Investments | 1.8 |
| Other Assets, Less Liabilities | –0.9 |
| 100.0% |
| 1. | JPMorgan Chase & Co. |
| 2. | Bank of America Corp. |
| 3. | Alphabet, Inc., Class C |
| 4. | Comcast Corp., Class A |
| 5. | Cisco Systems, Inc. |
| 6. | Pfizer, Inc. |
| 7. | Anthem, Inc. |
| 8. | MetLife, Inc. |
| 9. | Medtronic plc |
| 10. | Chubb Ltd. |
| 8 | MainStay WMC Value Fund |
During the time Markston managed a portion of the Fund, the Pfizer, Moderna, and Johnson & Johnson vaccines became widely available, leading to a steep decline in COVID-19 cases and a reopening of the U.S. economy. The Markston portion of the Fund outperformed its primary benchmark, the Russell 3000® Index, primarily due to the Fund’s overweight position in the communication services sector, with much of outperformance coming from holdings in Alphabet, the parent company of online advertising services provider Google. Google’s share price rose as
During the time Epoch managed a portion of the Fund, the Epoch portion of the Fund outperformed the Russell 3000® Index primarily due to strong security selection in the energy, financials and information technology sectors.
During the time Wellington managed the Fund, the Fund outperformed its new primary benchmark, the Russell 1000® Value Index, primarily due to favorable security selection. Strong selection in communication services and industrials was partially offset by weaker selection in information technology. Sector allocation, a result of our bottom-up stock selection process, detracted from relative results. This negative allocation effect was driven by the Fund’s overweight positioning in information technology and health care, as well as underweight exposure to energy.
During the time Markston managed a portion of the Fund, the strongest positive contributions to relative performance in the Markston portion of the Fund came from the communication services and financials sector. (Contributions take weightings and total returns into account.) During the same period, the most significant detractors from relative performance were the consumer discretionary and health care sectors.
During the time Epoch managed a portion of the Fund, the energy, financials and information technology sectors were the strongest positive contributors to the relative performance of the Epoch portion of the Fund. During the same period, the weakest contributing sectors included consumer discretionary and health care.
| 1. | See page 5 for other share class returns, which may be higher or lower than Class I share returns. See page 6 for more information on benchmark and peer group returns. |
During the time Wellington managed the Fund, the communication services, industrials and consumer discretionary sectors provided the strongest positive contributions to relative performance. Over the same period, the information technology, health care and energy sectors detracted most from the Fund’s relative performance.
During the time Markston managed a portion of the Fund, the strongest contributions to absolute performance in the Markston portion of the Fund included holdings in online payment company PayPal, Alphabet (described above) and consumer electronics and services firm Apple.
| 10 | MainStay WMC Value Fund |
During the time Epoch managed a portion of the Fund, stocks making the strongest positive contributions to the absolute performance of the Epoch portion of the Fund included Texas Pacific Land, a land trust with both oil & gas and water interests, and several holdings in the banking industry.
During the time Wellington managed the Fund, the top two absolute contributors to the Fund at the issuer lever were Internet search and services provider Alphabet, and global financial services firm Bank of America. During the same period, the most significant detractors from the Fund’s absolute performance included F5 Networks, a provider of integrated Internet traffic management solutions, and Corning, a manufacturer of specialty glass and ceramics.
During the time Markston managed a portion of the Fund, the largest purchase in the Markston portion of the Fund was a new position in ETF iShares Russell 3000, an index fund seeking to track the performance of the Russell 3000® Index. The Markston portion of the Fund also increased its positions in China-based e-commerce giant Alibaba and social media company Facebook to take advantage of a temporary decline in the information technology sector.
During the time Epoch managed a portion of the Fund, the largest purchases in the Epoch portion of the Fund were positions in private mortgage insurance company Essent Group and independent oil and gas producer Diamondback Energy.
During the time Wellington managed the Fund, the largest purchases included new positions in metals and mining corporation Rio Tinto, and F5 Networks, the latter of which is described above. Rio Tinto is the second largest metals and mining company in the world and the largest producer of iron ore. In our view, the stock appeared attractively valued with minimal balance sheet and execution risk, and offered exposure to a cyclical recovery. In the case of F5 Networks, while the company has been widely viewed as focused on “legacy technology” hardware, we think its business model transition toward software and subscriptions has been underappreciated and that revenue has been reaccelerating.
During the time Markston managed a portion of the Fund the most significant sector weighting increases were in financials and cash. Over the same period, the Markston portion of the Fund decreased its sector exposure to information technology, health care and consumer staples.
During the time Epoch managed a portion of the Fund, the most significant sector weighting increases in the Epoch portion of the Fund included financials and energy. Over the same period, the Epoch portion of the Fund decreased its allocations to consumer staples and health care.
During the time Wellington managed the Fund, the largest increases in active weight were in the communication services, industrials and financials sectors, while the largest decreases were in the information technology, health care and energy sectors.
At the end of the period when Markston managed a portion of the Fund, the Markston portion of the Fund held its most overweight exposures relative to the Russell 3000® Index in shares of Apple, Alphabet and PayPal. As of the same date, the Markston portion of the Fund held no exposure to the real estate or utilities sectors, and no exposure to online retailer Amazon.com, all of which represented significant benchmark weights.
At the end of the period when Epoch managed a portion of the Fund, the Epoch portion of the Fund held its largest overweight benchmark-relative positions in the financials and communication services sectors. As of the same date, the Epoch portion of the Fund held its most significantly underweight positions in the information technology and consumer discretionary sectors.
As of April 30, 2021, the Fund’s largest overweight allocations relative to the Russell 1000® Value Index were to the health care, information technology and financials sectors. Conversely, the Fund’s most significantly underweight allocations were to consumer staples, communication services and energy.
| 12 | MainStay WMC Value Fund |
| Shares | Value | |
| Common Stocks 99.1% | ||
| Aerospace & Defense 5.4% | ||
| General Dynamics Corp. | 71,900 | $ 13,677,537 |
| L3Harris Technologies, Inc. | 67,200 | 14,060,256 |
| Lockheed Martin Corp. | 32,700 | 12,444,312 |
| Raytheon Technologies Corp. | 209,000 | 17,397,160 |
| 57,579,265 | ||
| Auto Components 1.1% | ||
| Gentex Corp. | 347,200 | 12,214,496 |
| Banks 11.5% | ||
| Bank of America Corp. | 762,370 | 30,898,856 |
| JPMorgan Chase & Co. | 270,550 | 41,613,296 |
| M&T Bank Corp. | 91,200 | 14,381,328 |
| PNC Financial Services Group, Inc. (The) | 98,213 | 18,360,920 |
| Truist Financial Corp. | 304,900 | 18,083,619 |
| 123,338,019 | ||
| Beverages 1.4% | ||
| Keurig Dr Pepper, Inc. | 435,900 | 15,627,015 |
| Biotechnology 0.5% | ||
| Biogen, Inc. (a) | 18,900 | 5,052,537 |
| Building Products 2.4% | ||
| Fortune Brands Home & Security, Inc. | 112,500 | 11,810,250 |
| Johnson Controls International plc | 221,807 | 13,827,448 |
| 25,637,698 | ||
| Capital Markets 4.5% | ||
| BlackRock, Inc. | 22,110 | 18,114,723 |
| Blackstone Group, Inc. (The) | 167,300 | 14,804,377 |
| LPL Financial Holdings, Inc. | 96,600 | 15,137,220 |
| 48,056,320 | ||
| Chemicals 2.6% | ||
| Celanese Corp. | 98,300 | 15,398,695 |
| FMC Corp. | 106,200 | 12,557,088 |
| 27,955,783 | ||
| Communications Equipment 3.8% | ||
| Cisco Systems, Inc. | 553,420 | 28,174,612 |
| F5 Networks, Inc. (a) | 66,001 | 12,326,347 |
| 40,500,959 | ||
| Containers & Packaging 1.4% | ||
| Sealed Air Corp. | 299,700 | 14,805,180 |
| Shares | Value | |
| Electric Utilities 2.5% | ||
| Entergy Corp. | 113,500 | $ 12,404,415 |
| Exelon Corp. | 321,600 | 14,452,704 |
| 26,857,119 | ||
| Electrical Equipment 1.3% | ||
| nVent Electric plc | 467,200 | 14,226,240 |
| Electronic Equipment, Instruments & Components 1.6% | ||
| Corning, Inc. | 384,478 | 16,997,772 |
| Equity Real Estate Investment Trusts 3.7% | ||
| Crown Castle International Corp. | 58,900 | 11,135,634 |
| Gaming and Leisure Properties, Inc. | 355,600 | 16,531,844 |
| Host Hotels & Resorts, Inc. | 645,300 | 11,718,648 |
| 39,386,126 | ||
| Food Products 1.4% | ||
| Mondelez International, Inc., Class A | 246,160 | 14,968,990 |
| Health Care Equipment & Supplies 4.8% | ||
| Becton Dickinson and Co. | 63,900 | 15,898,959 |
| Boston Scientific Corp. (a) | 340,100 | 14,828,360 |
| Medtronic plc | 163,680 | 21,428,986 |
| 52,156,305 | ||
| Health Care Providers & Services 4.9% | ||
| Anthem, Inc. | 61,096 | 23,179,211 |
| Centene Corp. (a) | 181,400 | 11,199,636 |
| UnitedHealth Group, Inc. | 46,087 | 18,379,496 |
| 52,758,343 | ||
| Hotels, Restaurants & Leisure 1.0% | ||
| Booking Holdings, Inc. (a) | 4,400 | 10,850,752 |
| Household Durables 1.3% | ||
| Lennar Corp., Class A | 137,649 | 14,260,436 |
| Insurance 6.6% | ||
| Assurant, Inc. | 97,600 | 15,186,560 |
| Chubb Ltd. | 115,619 | 19,839,064 |
| MetLife, Inc. | 354,702 | 22,569,688 |
| Progressive Corp. (The) | 130,600 | 13,156,644 |
| 70,751,956 | ||
| Interactive Media & Services 2.7% | ||
| Alphabet, Inc., Class C (a) | 12,047 | 29,034,716 |
| Shares | Value | |
| Common Stocks (continued) | ||
| IT Services 2.8% | ||
| Amdocs Ltd. | 193,600 | $ 14,856,864 |
| Global Payments, Inc. | 69,300 | 14,873,859 |
| 29,730,723 | ||
| Machinery 1.3% | ||
| Middleby Corp. (The) (a) | 74,700 | 13,544,604 |
| Media 2.6% | ||
| Comcast Corp., Class A | 507,515 | 28,496,967 |
| Metals & Mining 1.1% | ||
| Rio Tinto plc, Sponsored ADR (b) | 137,642 | 11,707,829 |
| Multi-Utilities 2.7% | ||
| Dominion Energy, Inc. | 193,900 | 15,492,610 |
| Sempra Energy | 97,900 | 13,468,103 |
| 28,960,713 | ||
| Oil, Gas & Consumable Fuels 2.5% | ||
| Phillips 66 | 166,100 | 13,439,151 |
| Pioneer Natural Resources Co. | 90,100 | 13,860,083 |
| 27,299,234 | ||
| Pharmaceuticals 7.2% | ||
| AstraZeneca plc, Sponsored (b) | 249,400 | 13,235,658 |
| Eli Lilly and Co. | 91,500 | 16,723,455 |
| Merck & Co., Inc. | 119,200 | 8,880,400 |
| Pfizer, Inc. | 709,713 | 27,430,408 |
| Roche Holding AG | 33,939 | 11,059,673 |
| 77,329,594 | ||
| Real Estate Management & Development 1.2% | ||
| CBRE Group, Inc., Class A (a) | 151,300 | 12,890,760 |
| Road & Rail 2.6% | ||
| Knight-Swift Transportation Holdings, Inc. | 306,200 | 14,428,144 |
| Union Pacific Corp. | 63,200 | 14,036,088 |
| 28,464,232 | ||
| Semiconductors & Semiconductor Equipment 4.6% | ||
| Analog Devices, Inc. | 77,900 | 11,931,164 |
| KLA Corp. | 31,300 | 9,870,455 |
| Micron Technology, Inc. (a) | 171,700 | 14,778,219 |
| Shares | Value | ||
| Semiconductors & Semiconductor Equipment (continued) | |||
| Qorvo, Inc. (a) | 68,900 | $ 12,964,913 | |
| 49,544,751 | |||
| Software 1.0% | |||
| VMware, Inc., Class A (a) | 68,600 | 11,032,938 | |
| Specialty Retail 3.1% | |||
| Home Depot, Inc. (The) | 60,626 | 19,622,817 | |
| TJX Cos., Inc. (The) | 194,600 | 13,816,600 | |
| 33,439,417 | |||
| Total Common Stocks (Cost $936,637,359) | 1,065,457,789 | ||
| Short-Term Investments 1.8% | |||
| Affiliated Investment Company 0.8% | |||
| MainStay U.S. Government Liquidity Fund, 0.01% (c) | 8,073,967 | 8,073,967 | |
| Unaffiliated Investment Company 1.0% | |||
| BlackRock Liquidity FedFund, 0.05% (c)(d) | 10,987,170 | 10,987,170 | |
| Total Short-Term Investments (Cost $19,061,137) | 19,061,137 | ||
| Total Investments (Cost $955,698,496) | 100.9% | 1,084,518,926 | |
| Other Assets, Less Liabilities | (0.9) | (10,092,896) | |
| Net Assets | 100.0% | $ 1,074,426,030 | |
| † | Percentages indicated are based on Fund net assets. |
| (a) | Non-income producing security. |
| (b) | All or a portion of this security was held on loan. As of April 30, 2021, the aggregate market value of securities on loan was $11,055,618; the total market value of collateral held by the Fund was $11,631,732. The market value of the collateral held included non-cash collateral in the form of U.S. Treasury securities with a value of $644,562. The Fund received cash collateral with a value of $10,987,170. (See Note 2(I)) |
| (c) | Current yield as of April 30, 2021. |
| (d) | Represents a security purchased with cash collateral received for securities on loan. |
| Abbreviation(s): |
| ADR—American Depositary Receipt |
| 14 | MainStay WMC Value Fund |
| Description | Quoted Prices in Active Markets for Identical Assets (Level 1) | Significant Other Observable Inputs (Level 2) | Significant Unobservable Inputs (Level 3) | Total | |||
| Asset Valuation Inputs | |||||||
| Investments in Securities (a) | |||||||
| Common Stocks | $ 1,065,457,789 | $ — | $ — | $ 1,065,457,789 | |||
| Short-Term Investments | |||||||
| Affiliated Investment Company | 8,073,967 | — | — | 8,073,967 | |||
| Unaffiliated Investment Company | 10,987,170 | — | — | 10,987,170 | |||
| Total Short-Term Investments | 19,061,137 | — | — | 19,061,137 | |||
| Total Investments in Securities | $ 1,084,518,926 | $ — | $ — | $ 1,084,518,926 |
| (a) | For a complete listing of investments and their industries, see the Portfolio of Investments. |
| Assets | |
| Investment in unaffiliated securities, at value (identified cost $947,624,529) including securities on loan of $11,055,618 | $1,076,444,959 |
| Investment in affiliated investment companies, at value (identified cost $8,073,967) | 8,073,967 |
| Receivables: | |
| Investment securities sold | 1,560,644 |
| Dividends and interest | 630,789 |
| Fund shares sold | 110,079 |
| Other assets | 129,076 |
| Total assets | 1,086,949,514 |
| Liabilities | |
| Cash collateral received for securities on loan | 10,987,170 |
| Due to custodian | 195,991 |
| Payables: | |
| Manager (See Note 3) | 647,286 |
| Fund shares redeemed | 326,493 |
| NYLIFE Distributors (See Note 3) | 144,481 |
| Transfer agent (See Note 3) | 139,127 |
| Professional fees | 40,665 |
| Shareholder communication | 36,965 |
| Custodian | 2,682 |
| Securities lending | 18 |
| Accrued expenses | 2,606 |
| Total liabilities | 12,523,484 |
| Net assets | $1,074,426,030 |
| Composition of Net Assets | |
| Shares of beneficial interest outstanding (par value of $.01 per share) unlimited number of shares authorized | $ 203,940 |
| Additional paid-in-capital | 355,182,963 |
| 355,386,903 | |
| Total distributable earnings (loss) | 719,039,127 |
| Net assets | $1,074,426,030 |
| Class A | |
| Net assets applicable to outstanding shares | $525,009,266 |
| Shares of beneficial interest outstanding | 10,075,755 |
| Net asset value per share outstanding | $ 52.11 |
| Maximum sales charge (5.50% of offering price) | 3.03 |
| Maximum offering price per share outstanding | $ 55.14 |
| Investor Class | |
| Net assets applicable to outstanding shares | $ 72,614,657 |
| Shares of beneficial interest outstanding | 1,394,920 |
| Net asset value per share outstanding | $ 52.06 |
| Maximum sales charge (5.00% of offering price) | 2.74 |
| Maximum offering price per share outstanding | $ 54.80 |
| Class B | |
| Net assets applicable to outstanding shares | $ 15,712,107 |
| Shares of beneficial interest outstanding | 352,188 |
| Net asset value and offering price per share outstanding | $ 44.61 |
| Class C | |
| Net assets applicable to outstanding shares | $ 12,126,498 |
| Shares of beneficial interest outstanding | 271,751 |
| Net asset value and offering price per share outstanding | $ 44.62 |
| Class I | |
| Net assets applicable to outstanding shares | $ 99,498,649 |
| Shares of beneficial interest outstanding | 1,838,857 |
| Net asset value and offering price per share outstanding | $ 54.11 |
| Class R1 | |
| Net assets applicable to outstanding shares | $ 53,086 |
| Shares of beneficial interest outstanding | 1,009 |
| Net asset value and offering price per share outstanding (a) | $ 52.63 |
| Class R2 | |
| Net assets applicable to outstanding shares | $ 985,915 |
| Shares of beneficial interest outstanding | 18,791 |
| Net asset value and offering price per share outstanding | $ 52.47 |
| Class R3 | |
| Net assets applicable to outstanding shares | $ 1,093,578 |
| Shares of beneficial interest outstanding | 20,968 |
| Net asset value and offering price per share outstanding | $ 52.15 |
| Class R6 | |
| Net assets applicable to outstanding shares | $347,332,274 |
| Shares of beneficial interest outstanding | 6,419,712 |
| Net asset value and offering price per share outstanding | $ 54.10 |
| (a) | The difference between the recalculated and stated NAV was caused by rounding. |
| 16 | MainStay WMC Value Fund |
| Investment Income (Loss) | |
| Income | |
| Dividends-unaffiliated (net of foreign tax withholding of $29,778) | $ 6,512,855 |
| Dividend distributions from affiliated investment companies | 53,870 |
| Securities lending | 8,845 |
| Dividends-affiliated | 465 |
| Interest | 365 |
| Other | 51 |
| Total income | 6,576,451 |
| Expenses | |
| Manager (See Note 3) | 3,847,125 |
| Distribution/Service—Class A (See Note 3) | 585,239 |
| Distribution/Service—Investor Class (See Note 3) | 91,551 |
| Distribution/Service—Class B (See Note 3) | 77,021 |
| Distribution/Service—Class C (See Note 3) | 74,314 |
| Distribution/Service—Class R2 (See Note 3) | 1,078 |
| Distribution/Service—Class R3 (See Note 3) | 3,432 |
| Transfer agent (See Note 3) | 381,652 |
| Professional fees | 59,118 |
| Registration | 56,506 |
| Shareholder communication | 37,083 |
| Custodian | 15,669 |
| Trustees | 10,541 |
| Insurance | 3,803 |
| Shareholder service (See Note 3) | 1,141 |
| Miscellaneous | 23,479 |
| Total expenses before waiver/reimbursement | 5,268,752 |
| Expense waiver/reimbursement from Manager (See Note 3) | (985) |
| Net expenses | 5,267,767 |
| Net investment income (loss) | 1,308,684 |
| Realized and Unrealized Gain (Loss) | |
| Net realized gain (loss) on: | |
| Unaffiliated investment transactions | 591,849,770 |
| Foreign currency transactions | (14,303) |
| Net realized gain (loss) | 591,835,467 |
| Net change in unrealized appreciation (depreciation) on investments | (276,388,882) |
| Net realized and unrealized gain (loss) | 315,446,585 |
| Net increase (decrease) in net assets resulting from operations | $ 316,755,269 |
for the six months ended April 30, 2021 (Unaudited) and the year ended October 31, 2020
| 2021 | 2020 | |
| Increase (Decrease) in Net Assets | ||
| Operations: | ||
| Net investment income (loss) | $ 1,308,684 | $ 6,017,232 |
| Net realized gain (loss) | 591,835,467 | 33,059,775 |
| Net change in unrealized appreciation (depreciation) | (276,388,882) | (14,979,349) |
| Net increase (decrease) in net assets resulting from operations | 316,755,269 | 24,097,658 |
| Distributions to shareholders: | ||
| Class A | (16,312,168) | (35,152,551) |
| Investor Class | (2,713,991) | (6,477,707) |
| Class B | (590,306) | (1,807,649) |
| Class C | (589,734) | (1,954,564) |
| Class I | (17,065,424) | (39,605,302) |
| Class R1 | (1,674) | (2,963) |
| Class R2 | (28,928) | (63,839) |
| Class R3 | (95,950) | (184,909) |
| Total distributions to shareholders | (37,398,175) | (85,249,484) |
| Capital share transactions: | ||
| Net proceeds from sales of shares | 17,186,669 | 56,997,188 |
| Net asset value of shares issued to shareholder in reinvestment of distributions | 36,435,923 | 83,179,267 |
| Cost of shares redeemed | (166,558,522) | (214,672,993) |
| Increase (decrease) in net assets derived from capital share transactions | (112,935,930) | (74,496,538) |
| Net increase (decrease) in net assets | 166,421,164 | (135,648,364) |
| Net Assets | ||
| Beginning of period | 908,004,866 | 1,043,653,230 |
| End of period | $1,074,426,030 | $ 908,004,866 |
| 18 | MainStay WMC Value Fund |
| Six months ended April 30, 2021* | Year Ended October 31, | ||||||||||
| Class A | 2020 | 2019 | 2018 | 2017 | 2016 | ||||||
| Net asset value at beginning of period | $ 39.49 | $ 42.24 | $ 41.20 | $ 43.76 | $ 35.92 | $ 43.32 | |||||
| Net investment income (loss) (a) | 0.04 | 0.21 | 0.26 | 0.23 | 0.21 | 0.33 | |||||
| Net realized and unrealized gain (loss) on investments | 14.25 | 0.55 | 4.88 | 1.78 | 8.50 | (0.63) | |||||
| Net realized and unrealized gain (loss) on foreign currency transactions | (0.00)‡ | 0.00‡ | 0.00‡ | 0.01 | 0.00‡ | (0.00)‡ | |||||
| Total from investment operations | 14.29 | 0.76 | 5.14 | 2.02 | 8.71 | (0.30) | |||||
| Less distributions: | |||||||||||
| From net investment income | (0.25) | (0.31) | (0.28) | (0.21) | (0.48) | (0.40) | |||||
| From net realized gain on investments | (1.42) | (3.20) | (3.82) | (4.37) | (0.39) | (6.70) | |||||
| Total distributions | (1.67) | (3.51) | (4.10) | (4.58) | (0.87) | (7.10) | |||||
| Net asset value at end of period | $ 52.11 | $ 39.49 | $ 42.24 | $ 41.20 | $ 43.76 | $ 35.92 | |||||
| Total investment return (b) | 36.99% | 1.66% | 13.54% | 4.88% | 24.73% | (0.57)% | |||||
| Ratios (to average net assets)/Supplemental Data: | |||||||||||
| Net investment income (loss) | 0.19%†† | 0.55% | 0.67% | 0.57% | 0.52% | 0.92% | |||||
| Net expenses (c) | 1.09%†† | 1.10% (d) | 1.11% | 1.10% | 1.10% (d) | 1.09% (d) | |||||
| Portfolio turnover rate | 7% | 16% | 20% | 15% | 15% | 42% | |||||
| Net assets at end of period (in 000’s) | $ 525,009 | $ 389,530 | $ 427,040 | $ 384,637 | $ 389,582 | $ 285,431 | |||||
| * | Unaudited. |
| ‡ | Less than one cent per share. |
| †† | Annualized. |
| (a) | Per share data based on average shares outstanding during the period. |
| (b) | Total investment return is calculated exclusive of sales charges and assumes the reinvestment of dividends and distributions. For periods of less than one year, total return is not annualized. |
| (c) | In addition to the fees and expenses which the Fund bears directly, it also indirectly bears a pro-rata share of the fees and expenses of the underlying funds in which it invests. Such indirect expenses are not included in the above expense ratios. |
| (d) | Net of interest expense which is less than one-tenth of a percent. (See Note 6) |
| Six months ended April 30, 2021* | Year Ended October 31, | ||||||||||
| Investor Class | 2020 | 2019 | 2018 | 2017 | 2016 | ||||||
| Net asset value at beginning of period | $ 39.40 | $ 42.17 | $ 41.15 | $ 43.68 | $ 35.85 | $ 43.27 | |||||
| Net investment income (loss) (a) | (0.02) | 0.10 | 0.18 | 0.17 | 0.14 | 0.25 | |||||
| Net realized and unrealized gain (loss) on investments | 14.23 | 0.53 | 4.86 | 1.78 | 8.49 | (0.63) | |||||
| Net realized and unrealized gain (loss) on foreign currency transactions‡ | (0.00) | 0.00 | 0.00 | (0.00) | 0.00 | (0.00) | |||||
| Total from investment operations | 14.21 | 0.63 | 5.04 | 1.95 | 8.63 | (0.38) | |||||
| Less distributions: | |||||||||||
| From net investment income | (0.13) | (0.20) | (0.20) | (0.11) | (0.41) | (0.34) | |||||
| From net realized gain on investments | (1.42) | (3.20) | (3.82) | (4.37) | (0.39) | (6.70) | |||||
| Total distributions | (1.55) | (3.40) | (4.02) | (4.48) | (0.80) | (7.04) | |||||
| Net asset value at end of period | $ 52.06 | $ 39.40 | $ 42.17 | $ 41.15 | $ 43.68 | $ 35.85 | |||||
| Total investment return (b) | 36.80% | 1.35% | 13.27% | 4.69% | 24.50% | (0.79)% | |||||
| Ratios (to average net assets)/Supplemental Data: | |||||||||||
| Net investment income (loss) | (0.08)%†† | 0.25% | 0.46% | 0.39% | 0.36% | 0.71% | |||||
| Net expenses (c) | 1.39%†† | 1.40% (d) | 1.33% | 1.29% | 1.29% (d) | 1.29% (d) | |||||
| Expenses (before waiver/reimbursement) | 1.39%†† | 1.41% | 1.38% | 1.31% | 1.29% | 1.29% | |||||
| Portfolio turnover rate | 7% | 16% | 20% | 15% | 15% | 42% | |||||
| Net assets at end of period (in 000’s) | $ 72,615 | $ 69,423 | $ 80,733 | $ 76,844 | $ 90,928 | $ 139,775 | |||||
| * | Unaudited. |
| ‡ | Less than one cent per share. |
| †† | Annualized. |
| (a) | Per share data based on average shares outstanding during the period. |
| (b) | Total investment return is calculated exclusive of sales charges and assumes the reinvestment of dividends and distributions. For periods of less than one year, total return is not annualized. |
| (c) | In addition to the fees and expenses which the Fund bears directly, it also indirectly bears a pro-rata share of the fees and expenses of the underlying funds in which it invests. Such indirect expenses are not included in the above expense ratios. |
| (d) | Net of interest expense which is less than one-tenth of a percent. (See Note 6) |
| 20 | MainStay WMC Value Fund |
| Six months ended April 30, 2021* | Year Ended October 31, | ||||||||||
| Class B | 2020 | 2019 | 2018 | 2017 | 2016 | ||||||
| Net asset value at beginning of period | $ 33.97 | $ 36.88 | $ 36.53 | $ 39.43 | $ 32.42 | $ 39.74 | |||||
| Net investment income (loss) (a) | (0.17) | (0.16) | (0.09) | (0.13) | (0.13) | (0.01) | |||||
| Net realized and unrealized gain (loss) on investments | 12.23 | 0.45 | 4.26 | 1.60 | 7.67 | (0.60) | |||||
| Net realized and unrealized gain (loss) on foreign currency transactions‡ | (0.00) | 0.00 | 0.00 | (0.00) | 0.00 | (0.00) | |||||
| Total from investment operations | 12.06 | 0.29 | 4.17 | 1.47 | 7.54 | (0.61) | |||||
| Less distributions: | |||||||||||
| From net investment income | — | — | — | — | (0.14) | (0.01) | |||||
| From net realized gain on investments | (1.42) | (3.20) | (3.82) | (4.37) | (0.39) | (6.70) | |||||
| Total distributions | (1.42) | (3.20) | (3.82) | (4.37) | (0.53) | (6.71) | |||||
| Net asset value at end of period | $ 44.61 | $ 33.97 | $ 36.88 | $ 36.53 | $ 39.43 | $ 32.42 | |||||
| Total investment return (b) | 36.27% | 0.57% | 12.45% | 3.91% | 23.55% | (1.52)% | |||||
| Ratios (to average net assets)/Supplemental Data: | |||||||||||
| Net investment income (loss) | (0.84)%†† | (0.48)% | (0.27)% | (0.35)% | (0.37)% | (0.03)% | |||||
| Net expenses (c) | 2.14%†† | 2.15% (d) | 2.08% | 2.04% | 2.05% (d) | 2.04% (d) | |||||
| Expenses (before waiver/reimbursement) | 2.14%†† | 2.16% | 2.13% | 2.06% | 2.05% | 2.04% | |||||
| Portfolio turnover rate | 7% | 16% | 20% | 15% | 15% | 42% | |||||
| Net assets at end of period (in 000’s) | $ 15,712 | $ 14,212 | $ 21,088 | $ 26,571 | $ 35,841 | $ 40,977 | |||||
| * | Unaudited. |
| ‡ | Less than one cent per share. |
| †† | Annualized. |
| (a) | Per share data based on average shares outstanding during the period. |
| (b) | Total investment return is calculated exclusive of sales charges and assumes the reinvestment of dividends and distributions. For periods of less than one year, total return is not annualized. |
| (c) | In addition to the fees and expenses which the Fund bears directly, it also indirectly bears a pro-rata share of the fees and expenses of the underlying funds in which it invests. Such indirect expenses are not included in the above expense ratios. |
| (d) | Net of interest expense which is less than one-tenth of a percent. (See Note 6) |
| Six months ended April 30, 2021* | Year Ended October 31, | ||||||||||
| Class C | 2020 | 2019 | 2018 | 2017 | 2016 | ||||||
| Net asset value at beginning of period | $ 33.98 | $ 36.88 | $ 36.53 | $ 39.43 | $ 32.42 | $ 39.73 | |||||
| Net investment income (loss) (a) | (0.16) | (0.16) | (0.07) | (0.14) | (0.13) | (0.01) | |||||
| Net realized and unrealized gain (loss) on investments | 12.22 | 0.46 | 4.24 | 1.61 | 7.67 | (0.59) | |||||
| Net realized and unrealized gain (loss) on foreign currency transactions‡ | (0.00) | 0.00 | 0.00 | (0.00) | 0.00 | (0.00) | |||||
| Total from investment operations | 12.06 | 0.30 | 4.17 | 1.47 | 7.54 | (0.60) | |||||
| Less distributions: | |||||||||||
| From net investment income | — | — | — | — | (0.14) | (0.01) | |||||
| From net realized gain on investments | (1.42) | (3.20) | (3.82) | (4.37) | (0.39) | (6.70) | |||||
| Total distributions | (1.42) | (3.20) | (3.82) | (4.37) | (0.53) | (6.71) | |||||
| Net asset value at end of period | $ 44.62 | $ 33.98 | $ 36.88 | $ 36.53 | $ 39.43 | $ 32.42 | |||||
| Total investment return (b) | 36.26% | 0.60% | 12.45% | 3.91% | 23.55% | (1.52)% | |||||
| Ratios (to average net assets)/Supplemental Data: | |||||||||||
| Net investment income (loss) | (0.82)%†† | (0.48)% | (0.22)% | (0.36)% | (0.37)% | (0.03)% | |||||
| Net expenses (c) | 2.14%†† | 2.15% (d) | 2.07% | 2.04% | 2.05% (d) | 2.04% (d) | |||||
| Expenses (before waiver/reimbursement) | 2.14%†† | 2.16% | 2.12% | 2.06% | 2.05% | 2.04% | |||||
| Portfolio turnover rate | 7% | 16% | 20% | 15% | 15% | 42% | |||||
| Net assets at end of period (in 000’s) | $ 12,126 | $ 14,315 | $ 22,933 | $ 65,288 | $ 79,665 | $ 92,457 | |||||
| * | Unaudited. |
| ‡ | Less than one cent per share. |
| †† | Annualized. |
| (a) | Per share data based on average shares outstanding during the period. |
| (b) | Total investment return is calculated exclusive of sales charges and assumes the reinvestment of dividends and distributions. For periods of less than one year, total return is not annualized. |
| (c) | In addition to the fees and expenses which the Fund bears directly, it also indirectly bears a pro-rata share of the fees and expenses of the underlying funds in which it invests. Such indirect expenses are not included in the above expense ratios. |
| (d) | Net of interest expense which is less than one-tenth of a percent. (See Note 6) |
| 22 | MainStay WMC Value Fund |
| Six months ended April 30, 2021* | Year Ended October 31, | ||||||||||
| Class I | 2020 | 2019 | 2018 | 2017 | 2016 | ||||||
| Net asset value at beginning of period | $ 40.99 | $ 43.71 | $ 42.51 | $ 45.00 | $ 36.92 | $ 44.35 | |||||
| Net investment income (loss) (a) | 0.11 | 0.32 | 0.38 | 0.36 | 0.34 | 0.43 | |||||
| Net realized and unrealized gain (loss) on investments | 14.78 | 0.57 | 5.02 | 1.84 | 8.70 | (0.65) | |||||
| Net realized and unrealized gain (loss) on foreign currency transactions‡ | (0.00) | 0.00 | 0.00 | (0.00) | 0.00 | (0.00) | |||||
| Total from investment operations | 14.89 | 0.89 | 5.40 | 2.20 | 9.04 | (0.22) | |||||
| Less distributions: | |||||||||||
| From net investment income | (0.35) | (0.41) | (0.38) | (0.32) | (0.57) | (0.51) | |||||
| From net realized gain on investments | (1.42) | (3.20) | (3.82) | (4.37) | (0.39) | (6.70) | |||||
| Total distributions | (1.77) | (3.61) | (4.20) | (4.69) | (0.96) | (7.21) | |||||
| Net asset value at end of period | $ 54.11 | $ 40.99 | $ 43.71 | $ 42.51 | $ 45.00 | $ 36.92 | |||||
| Total investment return (b) | 37.15% | 1.92% | 13.80% | 5.17% | 25.01% | (0.33)% | |||||
| Ratios (to average net assets)/Supplemental Data: | |||||||||||
| Net investment income (loss) | 0.46%†† | 0.81% | 0.93% | 0.83% | 0.84% | 1.17% | |||||
| Net expenses (c) | 0.85%†† | 0.85% (d) | 0.86% | 0.85% | 0.85% (d) | 0.84% (d) | |||||
| Portfolio turnover rate | 7% | 16% | 20% | 15% | 15% | 42% | |||||
| Net assets at end of period (in 000’s) | $ 99,499 | $ 417,329 | $ 488,730 | $ 484,839 | $ 634,730 | $ 807,694 | |||||
| * | Unaudited. |
| ‡ | Less than one cent per share. |
| †† | Annualized. |
| (a) | Per share data based on average shares outstanding during the period. |
| (b) | Total investment return is calculated exclusive of sales charges and assumes the reinvestment of dividends and distributions. Class I shares are not subject to sales charges. For periods of less than one year, total return is not annualized. |
| (c) | In addition to the fees and expenses which the Fund bears directly, it also indirectly bears a pro-rata share of the fees and expenses of the underlying funds in which it invests. Such indirect expenses are not included in the above expense ratios. |
| (d) | Net of interest expense which is less than one-tenth of a percent. (See Note 6) |
| Six months ended April 30, 2021* | Year Ended October 31, | ||||||||||
| Class R1 | 2020 | 2019 | 2018 | 2017 | 2016 | ||||||
| Net asset value at beginning of period | $ 39.90 | $ 42.64 | $ 41.53 | $ 44.07 | $ 36.16 | $ 43.57 | |||||
| Net investment income (loss) (a) | 0.08 | 0.27 | 0.33 | 0.37 | 0.27 | 0.38 | |||||
| Net realized and unrealized gain (loss) on investments | 14.39 | 0.56 | 4.91 | 1.73 | 8.56 | (0.63) | |||||
| Net realized and unrealized gain (loss) on foreign currency transactions‡ | (0.00) | 0.00 | 0.00 | (0.00) | 0.00 | (0.00) | |||||
| Total from investment operations | 14.47 | 0.83 | 5.24 | 2.10 | 8.83 | (0.25) | |||||
| Less distributions: | |||||||||||
| From net investment income | (0.32) | (0.37) | (0.31) | (0.27) | (0.53) | (0.46) | |||||
| From net realized gain on investments | (1.42) | (3.20) | (3.82) | (4.37) | (0.39) | (6.70) | |||||
| Total distributions | (1.74) | (3.57) | (4.13) | (4.64) | (0.92) | (7.16) | |||||
| Net asset value at end of period | $ 52.63 | $ 39.90 | $ 42.64 | $ 41.53 | $ 44.07 | $ 36.16 | |||||
| Total investment return (b) | 37.09% | 1.82% | 13.71% | 5.05% | 24.92% | (0.43)% | |||||
| Ratios (to average net assets)/Supplemental Data: | |||||||||||
| Net investment income (loss) | 0.34%†† | 0.69% | 0.83% | 0.88% | 0.67% | 1.06% | |||||
| Net expenses (c) | 0.94%†† | 0.95% (d) | 0.96% | 0.95% | 0.95% (d) | 0.94% (d) | |||||
| Portfolio turnover rate | 7% | 16% | 20% | 15% | 15% | 42% | |||||
| Net assets at end of period (in 000’s) | $ 53 | $ 38 | $ 35 | $ 30 | $ 3,208 | $ 2,500 | |||||
| * | Unaudited. |
| ‡ | Less than one cent per share. |
| †† | Annualized. |
| (a) | Per share data based on average shares outstanding during the period. |
| (b) | Total investment return is calculated exclusive of sales charges and assumes the reinvestment of dividends and distributions. Class R1 shares are not subject to sales charges. For periods of less than one year, total return is not annualized. |
| (c) | In addition to the fees and expenses which the Fund bears directly, it also indirectly bears a pro-rata share of the fees and expenses of the underlying funds in which it invests. Such indirect expenses are not included in the above expense ratios. |
| (d) | Net of interest expense which is less than one-tenth of a percent. (See Note 6) |
| 24 | MainStay WMC Value Fund |
| Six months ended April 30, 2021* | Year Ended October 31, | ||||||||||
| Class R2 | 2020 | 2019 | 2018 | 2017 | 2016 | ||||||
| Net asset value at beginning of period | $ 39.74 | $ 42.48 | $ 41.38 | $ 43.93 | $ 36.05 | $ 43.44 | |||||
| Net investment income (loss) (a) | 0.02 | 0.18 | 0.23 | 0.21 | 0.20 | 0.29 | |||||
| Net realized and unrealized gain (loss) on investments | 14.34 | 0.55 | 4.89 | 1.78 | 8.50 | (0.63) | |||||
| Net realized and unrealized gain (loss) on foreign currency transactions‡ | (0.00) | 0.00 | 0.00 | (0.00) | 0.00 | (0.00) | |||||
| Total from investment operations | 14.36 | 0.73 | 5.12 | 1.99 | 8.70 | (0.34) | |||||
| Less distributions: | |||||||||||
| From net investment income | (0.21) | (0.27) | (0.20) | (0.17) | (0.43) | (0.35) | |||||
| From net realized gain on investments | (1.42) | (3.20) | (3.82) | (4.37) | (0.39) | (6.70) | |||||
| Total distributions | (1.63) | (3.47) | (4.02) | (4.54) | (0.82) | (7.05) | |||||
| Net asset value at end of period | $ 52.47 | $ 39.74 | $ 42.48 | $ 41.38 | $ 43.93 | $ 36.05 | |||||
| Total investment return (b) | 36.92% | 1.57% | 13.42% | 4.77% | 24.60% | (0.68)% | |||||
| Ratios (to average net assets)/Supplemental Data: | |||||||||||
| Net investment income (loss) | 0.09%†† | 0.45% | 0.59% | 0.50% | 0.51% | 0.80% | |||||
| Net expenses (c) | 1.19%†† | 1.20% (d) | 1.21% | 1.20% | 1.20% (d) | 1.20% (d) | |||||
| Portfolio turnover rate | 7% | 16% | 20% | 15% | 15% | 42% | |||||
| Net assets at end of period (in 000’s) | $ 986 | $ 716 | $ 780 | $ 881 | $ 2,583 | $ 3,528 | |||||
| * | Unaudited. |
| ‡ | Less than one cent per share. |
| †† | Annualized. |
| (a) | Per share data based on average shares outstanding during the period. |
| (b) | Total investment return is calculated exclusive of sales charges and assumes the reinvestment of dividends and distributions. Class R2 shares are not subject to sales charges. For periods of less than one year, total return is not annualized. |
| (c) | In addition to the fees and expenses which the Fund bears directly, it also indirectly bears a pro-rata share of the fees and expenses of the underlying funds in which it invests. Such indirect expenses are not included in the above expense ratios. |
| (d) | Net of interest expense which is less than one-tenth of a percent. (See Note 6) |
| Six months ended April 30, 2021* | Year Ended October 31, | ||||||||||
| Class R3 | 2020 | 2019 | 2018 | 2017 | 2016 | ||||||
| Net asset value at beginning of period | $ 39.48 | $ 42.24 | $ 41.15 | $ 43.71 | $ 35.87 | $ 43.22 | |||||
| Net investment income (loss) (a) | (0.01) | 0.07 | 0.13 | 0.08 | 0.07 | 0.20 | |||||
| Net realized and unrealized gain (loss) on investments | 14.23 | 0.54 | 4.87 | 1.79 | 8.50 | (0.62) | |||||
| Net realized and unrealized gain (loss) on foreign currency transactions‡ | (0.00) | 0.00 | 0.00 | (0.00) | 0.00 | (0.00) | |||||
| Total from investment operations | 14.22 | 0.61 | 5.00 | 1.87 | 8.57 | (0.42) | |||||
| Less distributions: | |||||||||||
| From net investment income | (0.13) | (0.17) | (0.09) | (0.06) | (0.34) | (0.23) | |||||
| From net realized gain on investments | (1.42) | (3.20) | (3.82) | (4.37) | (0.39) | (6.70) | |||||
| Total distributions | (1.55) | (3.37) | (3.91) | (4.43) | (0.73) | (6.93) | |||||
| Net asset value at end of period | $ 52.15 | $ 39.48 | $ 42.24 | $ 41.15 | $ 43.71 | $ 35.87 | |||||
| Total investment return (b) | 36.74% | 1.29% | 13.14% | 4.51% | 24.29% | (0.91)% | |||||
| Ratios (to average net assets)/Supplemental Data: | |||||||||||
| Net investment income (loss) | (0.02)%†† | 0.19% | 0.32% | 0.20% | 0.17% | 0.57% | |||||
| Net expenses (c) | 1.45%†† | 1.45% (d) | 1.46% | 1.45% | 1.45% (d) | 1.44% (d) | |||||
| Portfolio turnover rate | 7% | 16% | 20% | 15% | 15% | 42% | |||||
| Net assets at end of period (in 000’s) | $ 1,094 | $ 2,442 | $ 2,314 | $ 1,931 | $ 1,004 | $ 806 | |||||
| * | Unaudited. |
| ‡ | Less than one cent per share. |
| †† | Annualized. |
| (a) | Per share data based on average shares outstanding during the period. |
| (b) | Total investment return is calculated exclusive of sales charges and assumes the reinvestment of dividends and distributions. Class R3 shares are not subject to sales charges. For periods of less than one year, total return is not annualized. |
| (c) | In addition to the fees and expenses which the Fund bears directly, it also indirectly bears a pro-rata share of the fees and expenses of the underlying funds in which it invests. Such indirect expenses are not included in the above expense ratios. |
| (d) | Net of interest expense which is less than one-tenth of a percent. (See Note 6) |
| April 26, 2021^ through April 30, 2021* | |
| Class R6 | |
| Net asset value at beginning of period | $ 53.83 |
| Net investment income (loss) (a) | 0.11 |
| Net realized and unrealized gain (loss) on investments | 0.16 |
| Net realized and unrealized gain (loss) on foreign currency transactions | 0.00‡ |
| Total from investment operations | 0.27 |
| Net asset value at end of period | $ 54.10 |
| Total investment return (b) | 0.50% |
| Ratios (to average net assets)/Supplemental Data: | |
| Net investment income (loss)†† | 0.47% |
| Net expenses†† (c) | 0.70% |
| Portfolio turnover rate | 7% |
| Net assets at end of period (in 000’s) | $ 347,332 |
| * | Unaudited. |
| ^ | Inception date. |
| ‡ | Less than one cent per share. |
| †† | Annualized. |
| (a) | Per share data based on average shares outstanding during the period. |
| (b) | Total investment return is calculated exclusive of sales charges and assumes the reinvestment of dividends and distributions. Class R6 shares are not subject to sales charges. For periods of less than one year, total return is not annualized. |
| (c) | In addition to the fees and expenses which the Fund bears directly, it also indirectly bears a pro-rata share of the fees and expenses of the underlying funds in which it invests. Such indirect expenses are not included in the above expense ratios. |
| 26 | MainStay WMC Value Fund |
| Class | Commenced Operations |
| Class A | June 9, 1999 |
| Investor Class | February 28, 2008 |
| Class B | June 9, 1999 |
| Class C | June 9, 1999 |
| Class I | January 21, 1971 |
| Class R1 | January 2, 2004 |
| Class R2 | January 2, 2004 |
| Class R3 | April 28, 2006 |
| Class R6 | April 26, 2021 |
| SIMPLE Class | N/A* |
| • | SIMPLE Class shares were registered for sale effective as of August 31, 2020 but have not yet commenced operations. |
| • | Level 1—quoted prices in active markets for an identical asset or liability |
| • | Level 2—other significant observable inputs (including quoted prices for a similar asset or liability in active markets, interest rates and yield curves, prepayment speeds, credit risk, etc.) |
| • | Level 3—significant unobservable inputs (including the Fund's own assumptions about the assumptions that market participants would use in measuring fair value of an asset or liability) |
| • Broker/dealer quotes | • Benchmark securities |
| • Two-sided markets | • Reference data (corporate actions or material event notices) |
| • Bids/offers | • Monthly payment information |
| • Industry and economic events | • Reported trades |
| 28 | MainStay WMC Value Fund |
| 30 | MainStay WMC Value Fund |
| Class R1 | $ 23 |
| Class R2 | 431 |
| Class R3 | 686 |
| Class | Expense | Waived |
| Class A | $105,826 | $— |
| Investor Class | 125,468 | — |
| Class B | 26,391 | — |
| Class C | 25,460 | — |
| Class I | 97,839 | — |
| Class R1 | 11 | — |
| Class R2 | 195 | — |
| Class R3 | 310 | — |
| Class R6 | 152 | — |
| 32 | MainStay WMC Value Fund |
| Affiliated Investment Companies | Value, Beginning of Period | Purchases at Cost | Proceeds from Sales | Net Realized Gain/(Loss) on Sales | Change in Unrealized Appreciation/ (Depreciation) | Value, End of Period | Dividend Income | Other Distributions | Shares End of Period |
| MainStay U.S. Government Liquidity Fund | $ 5,057 | $ 134,116 | $ (131,099) | $ — | $ — | $ 8,074 | $ —(a) | $ — | 8,074 |
| (a) | Less than $500. |
| Class R6 | $25,125 | 0.0%‡ |
| ‡ | Less than one-tenth of a percent. |
| Federal Tax Cost | Gross Unrealized Appreciation | Gross Unrealized (Depreciation) | Net Unrealized Appreciation/ (Depreciation) | |
| Investments | $958,623,728 | $133,750,329 | $(7,855,131) | $125,895,198 |
| 2020 | |
| Distributions paid from: | |
| Ordinary Income | $ 7,936,116 |
| Long-Term Capital Gains | 77,313,368 |
| Total | $85,249,484 |
| Class A | Shares | Amount |
| Period ended April 30, 2021: | ||
| Shares sold | 234,352 | $ 10,956,932 |
| Shares issued to shareholders in reinvestment of distributions | 356,089 | 15,628,734 |
| Shares redeemed | (819,985) | (38,436,672) |
| Net increase (decrease) in shares outstanding before conversion | (229,544) | (11,851,006) |
| Shares converted into Class A (See Note 1) | 442,983 | 20,465,549 |
| Shares converted from Class A (See Note 1) | (1,905) | (83,162) |
| Net increase (decrease) | 211,534 | $ 8,531,381 |
| Year ended October 31, 2020: | ||
| Shares sold | 529,300 | $ 20,239,103 |
| Shares issued to shareholders in reinvestment of distributions | 843,190 | 33,837,200 |
| Shares redeemed | (1,951,518) | (74,696,185) |
| Net increase (decrease) in shares outstanding before conversion | (579,028) | (20,619,882) |
| Shares converted into Class A (See Note 1) | 339,901 | 13,474,760 |
| Shares converted from Class A (See Note 1) | (7,078) | (251,232) |
| Net increase (decrease) | (246,205) | $ (7,396,354) |
| Investor Class | Shares | Amount |
| Period ended April 30, 2021: | ||
| Shares sold | 26,524 | $ 1,234,160 |
| Shares issued to shareholders in reinvestment of distributions | 61,674 | 2,707,491 |
| Shares redeemed | (83,015) | (3,869,318) |
| Net increase (decrease) in shares outstanding before conversion | 5,183 | 72,333 |
| Shares converted into Investor Class (See Note 1) | 20,850 | 984,580 |
| Shares converted from Investor Class (See Note 1) | (393,049) | (18,120,239) |
| Net increase (decrease) | (367,016) | $ (17,063,326) |
| Year ended October 31, 2020: | ||
| Shares sold | 96,681 | $ 3,654,326 |
| Shares issued to shareholders in reinvestment of distributions | 160,931 | 6,462,976 |
| Shares redeemed | (196,367) | (7,659,132) |
| Net increase (decrease) in shares outstanding before conversion | 61,245 | 2,458,170 |
| Shares converted into Investor Class (See Note 1) | 47,537 | 1,774,854 |
| Shares converted from Investor Class (See Note 1) | (261,205) | (10,496,913) |
| Net increase (decrease) | (152,423) | $ (6,263,889) |
| Class B | Shares | Amount |
| Period ended April 30, 2021: | ||
| Shares sold | 4,260 | $ 169,271 |
| Shares issued to shareholders in reinvestment of distributions | 15,616 | 589,371 |
| Shares redeemed | (36,669) | (1,462,090) |
| Net increase (decrease) in shares outstanding before conversion | (16,793) | (703,448) |
| Shares converted from Class B (See Note 1) | (49,367) | (1,973,037) |
| Net increase (decrease) | (66,160) | $ (2,676,485) |
| Year ended October 31, 2020: | ||
| Shares sold | 9,341 | $ 302,019 |
| Shares issued to shareholders in reinvestment of distributions | 51,808 | 1,806,015 |
| Shares redeemed | (100,807) | (3,293,066) |
| Net increase (decrease) in shares outstanding before conversion | (39,658) | (1,185,032) |
| Shares converted from Class B (See Note 1) | (113,870) | (3,737,122) |
| Net increase (decrease) | (153,528) | $ (4,922,154) |
| 34 | MainStay WMC Value Fund |
| Class C | Shares | Amount |
| Period ended April 30, 2021: | ||
| Shares sold | 5,851 | $ 236,319 |
| Shares issued to shareholders in reinvestment of distributions | 15,311 | 577,993 |
| Shares redeemed | (137,782) | (5,676,312) |
| Net increase (decrease) in shares outstanding before conversion | (116,620) | (4,862,000) |
| Shares converted from Class C (See Note 1) | (32,913) | (1,346,848) |
| Net increase (decrease) | (149,533) | $ (6,208,848) |
| Year ended October 31, 2020: | ||
| Shares sold | 48,129 | $ 1,523,344 |
| Shares issued to shareholders in reinvestment of distributions | 52,580 | 1,833,460 |
| Shares redeemed | (275,982) | (9,304,419) |
| Net increase (decrease) in shares outstanding before conversion | (175,273) | (5,947,615) |
| Shares converted from Class C (See Note 1) | (25,291) | (816,851) |
| Net increase (decrease) | (200,564) | $ (6,764,466) |
| Class I | Shares | Amount |
| Period ended April 30, 2021: | ||
| Shares sold | 93,131 | $ 4,493,177 |
| Shares issued to shareholders in reinvestment of distributions | 369,174 | 16,808,484 |
| Shares redeemed | (2,388,293) | (115,146,818) |
| Net increase (decrease) in shares outstanding before conversion | (1,925,988) | (93,845,157) |
| Shares converted into Class I (See Note 1) | 1,629 | 73,157 |
| Shares converted from Class I (See Note 1) | (6,419,247) | (345,548,082) |
| Net increase (decrease) | (8,343,606) | $(439,320,082) |
| Year ended October 31, 2020: | ||
| Shares sold | 991,315 | $ 30,868,280 |
| Shares issued to shareholders in reinvestment of distributions | 938,246 | 38,993,531 |
| Shares redeemed | (2,929,764) | (119,324,440) |
| Net increase (decrease) in shares outstanding before conversion | (1,000,203) | (49,462,629) |
| Shares converted into Class I (See Note 1) | 1,177 | 52,504 |
| Net increase (decrease) | (999,026) | $ (49,410,125) |
| Class R1 | Shares | Amount |
| Period ended April 30, 2021: | ||
| Shares sold | 12 | $ 548 |
| Shares issued to shareholders in reinvestment of distributions | 38 | 1,674 |
| Net increase (decrease) | 50 | $ 2,222 |
| Year ended October 31, 2020: | ||
| Shares sold | 58 | $ 2,266 |
| Shares issued to shareholders in reinvestment of distributions | 73 | 2,963 |
| Net increase (decrease) | 131 | $ 5,229 |
| Class R2 | Shares | Amount |
| Period ended April 30, 2021: | ||
| Shares sold | 752 | $ 35,138 |
| Shares issued to shareholders in reinvestment of distributions | 593 | 26,226 |
| Shares redeemed | (570) | (25,856) |
| Net increase (decrease) | 775 | $ 35,508 |
| Year ended October 31, 2020: | ||
| Shares sold | 2,112 | $ 80,909 |
| Shares issued to shareholders in reinvestment of distributions | 1,445 | 58,398 |
| Shares redeemed | (3,897) | (155,577) |
| Net increase (decrease) | (340) | $ (16,270) |
| Class R3 | Shares | Amount |
| Period ended April 30, 2021: | ||
| Shares sold | 783 | $ 36,124 |
| Shares issued to shareholders in reinvestment of distributions | 2,181 | 95,950 |
| Shares redeemed | (43,846) | (1,941,456) |
| Net increase (decrease) | (40,882) | $ (1,809,382) |
| Year ended October 31, 2020: | ||
| Shares sold | 8,700 | $ 326,941 |
| Shares issued to shareholders in reinvestment of distributions | 4,589 | 184,724 |
| Shares redeemed | (6,220) | (240,174) |
| Net increase (decrease) | 7,069 | $ 271,491 |
| Class R6(a) | Shares | Amount |
| Period ended April 30, 2021: | ||
| Shares sold | 465 | $ 25,000 |
| Net increase (decrease) in shares outstanding before conversion | 465 | 25,000 |
| Shares converted into Class R6 (See Note 1) | 6,419,247 | 345,548,082 |
| Net increase (decrease) | 6,419,712 | $ 345,573,082 |
| (a) | The inception of the class was April 26, 2021. |
| 36 | MainStay WMC Value Fund |
| 38 | MainStay WMC Value Fund |
| 40 | MainStay WMC Value Fund |
| 42 | MainStay WMC Value Fund |
| • | experience in providing investment advisory services; |
| • | experience in serving as advisor or subadvisor to other funds with similar strategies as those of the Fund, as repositioned, and the performance track record of those funds; |
| • | experience of investment advisory, senior management and administrative personnel; |
| • | overall legal and compliance environment, resources and history and policies and procedures in place with respect to matters that may involve conflicts of interest between the Fund’s investments and those of other accounts managed by Wellington; |
| • | New York Life Investments’ and Wellington’s belief that their respective compliance policies, procedures and systems are reasonably designed to prevent violation of the federal securities laws and their commitment to further developing and strengthening compliance programs relating to the MainStay Group of Funds generally and the Fund specifically; |
| • | ability to attract and retain qualified investment professionals and willingness to invest in personnel to service and support the Fund; |
| • | portfolio construction and risk management processes; |
| • | experience of the Fund’s proposed portfolio managers, including with respect to investment strategies similar to those of the Fund, the number of accounts managed by the portfolio managers and the method for compensating the portfolio managers; and |
| • | overall reputation, financial condition and assets under management. |
| 44 | MainStay WMC Value Fund |
| 46 | MainStay WMC Value Fund |
1.
| 2. | This Fund is registered for sale in CA, CT, DE, FL, MA, NJ, NY and VT. |
| 3. | An affiliate of New York Life Investment Management LLC. |
| 1738973MS071-21 | MSWV10-06/21 |
| Item 2. | Code of Ethics. |
Not applicable.
| Item 3. | Audit Committee Financial Expert. |
Not applicable.
| Item 4. | Principal Accountant Fees and Services. |
Not applicable.
| Item 5. | Audit Committee of Listed Registrants. |
Not applicable.
| Item 6. | Investments. |
The Schedule of Investments is included as part of Item 1 of this report.
| Item 7. | Disclosure of Proxy Voting Policies and Procedures for Closed-End Management Investment Companies. |
Not applicable.
| Item 8. | Portfolio Managers of Closed-End Management Investment Companies. |
Not applicable.
| Item 9. | Purchases of Equity Securities by Closed-End Management Investment Company and Affiliated Purchasers. |
Not applicable.
| Item 10. | Submission of Matters to a Vote of Security Holders. |
Since the Registrant’s last response to this Item, there have been no material changes to the procedures by which shareholders may recommend nominees to the Registrant’s Board of Trustees.
| Item 11. | Controls and Procedures. |
(a) Based on an evaluation of the Registrant’s Disclosure Controls and Procedures (as defined in Rule 30a-3(c) under the Investment Company Act of 1940) (the “Disclosure Controls”), as of a date within 90 days prior to the filing date (the “Filing Date”) of this Form N-CSR (the “Report”), the Registrant’s principal executive officer and principal financial officer have concluded that the Disclosure Controls are reasonably designed to ensure that information required to be disclosed by the Registrant in the Report is recorded, processed, summarized and reported by the Filing Date, including ensuring that information required to be disclosed in the Report is accumulated and communicated to the Registrant’s management, including the Registrant’s principal executive officer and principal financial officer, as appropriate to allow timely decisions regarding required disclosure.
(b) There were no changes in the Registrant’s internal control over financial reporting (as defined in Rule 30a-3(d)) under the Investment Company Act of 1940 that occurred during the period covered by this report that has materially affected, or is reasonably likely to materially affect, the Registrant’s internal control over financial reporting.
| Item 12. | Disclosure of Securities Lending Activities for Closed-End Management Investment Companies. |
Not applicable.
| Item 13. | Exhibits. |
| (a) |
| (b) |
SIGNATURES
Pursuant to the requirements of the Securities Exchange Act of 1934 and the Investment Company Act of 1940, the Registrant has duly caused this Report to be signed on its behalf by the undersigned, thereunto duly authorized.
| THE MAINSTAY FUNDS | ||
| By: | /s/ Kirk C. Lehneis | |
| Kirk C. Lehneis | ||
| President and Principal Executive Officer | ||
| Date: | July 9, 2021 | |
Pursuant to the requirements of the Securities Exchange Act of 1934 and the Investment Company Act of 1940, this Report has been signed below by the following persons on behalf of the Registrant and in the capacities and on the dates indicated.
| By: | /s/ Kirk C. Lehneis | |
| Kirk C. Lehneis | ||
| President and Principal Executive Officer | ||
| Date: | July 9, 2021 | |
| By: | /s/ Jack R. Benintende | |
| Jack R. Benintende | ||
| Treasurer and Principal Financial and Accounting Officer | ||
| Date: | July 9, 2021 | |
EXHIBIT INDEX
| (a) |
| (b) |