UNITED STATES
SECURITIES AND EXCHANGE COMMISSION
Washington, D.C. 20549
Form N-CSR
CERTIFIED SHAREHOLDER REPORT OF REGISTERED MANAGEMENT
INVESTMENT COMPANIES
Investment Company Act File Number 811-04550
THE MAINSTAY FUNDS
(Exact name of Registrant as specified in charter)
51 Madison Avenue, New York, NY 10010
(Address of principal executive offices) (Zip code)
J. Kevin Gao, Esq.
30 Hudson Street
Jersey City, New Jersey 07302
(Name and address of agent for service)
Registrant’s telephone number, including area code: (212) 576-7000
Date of fiscal year end: October 31
Date of reporting period: April 30, 2023
| Item 1. | Reports to Stockholders. |
please log in to newyorklifeinvestments.com/accounts.
| Not FDIC/NCUA Insured | Not a Deposit | May Lose Value | No Bank Guarantee | Not Insured by Any Government Agency |


President

| Average Annual Total Returns for the Period-Ended April 30, 2023 | ||||||||
| Class | Sales Charge | Inception Date1 | Six Months2 | One Year | Five Years | Ten Years | Gross Expense Ratio3 | |
| Class A Shares | Maximum 4.50% Initial Sales Charge | With sales charges | 6/1/1998 | 4.86% | -7.85% | -2.63% | -0.30% | 1.36% |
| Excluding sales charges | 9.80 | -3.51 | -1.73 | 0.16 | 1.36 | |||
| Investor Class Shares4 | Maximum 4.00% Initial Sales Charge | With sales charges | 2/28/2008 | 5.18 | -7.75 | -2.95 | -0.56 | 1.78 |
| Excluding sales charges | 9.57 | -3.91 | -2.05 | -0.10 | 1.78 | |||
| Class B Shares5 | Maximum 5.00% CDSC | With sales charges | 6/1/1998 | 4.21 | -9.16 | -3.12 | -0.85 | 2.52 |
| if Redeemed Within the First Six Years of Purchase | Excluding sales charges | 9.21 | -4.63 | -2.80 | -0.85 | 2.52 | ||
| Class C Shares | Maximum 1.00% CDSC | With sales charges | 9/1/1998 | 8.20 | -5.53 | -2.80 | -0.85 | 2.52 |
| if Redeemed Within One Year of Purchase | Excluding sales charges | 9.20 | -4.63 | -2.80 | -0.85 | 2.52 | ||
| Class I Shares | No Sales Charge | 8/31/2007 | 9.95 | -3.22 | -1.44 | 0.43 | 1.12 | |
| 1. | Prior to February 28, 2017, the Fund's primary investment strategies were changed. Effective June 21, 2019, the Fund replaced its prior subadvisor and modified its investment objective and principal investment strategies. The performance in the graph and table prior to those dates reflects its prior subadvisor's, investment objective and principal investment strategies. |
| 2. | Not annualized. |
| 3. | The gross expense ratios presented reflect the Fund’s “Total Annual Fund Operating Expenses” from the most recent Prospectus, as supplemented, and may differ from other expense ratios disclosed in this report. |
| 4. | Prior to June 30, 2020, the maximum initial sales charge was 4.50%, which is reflected in the applicable average annual total return figures shown. |
| 5. | Class B shares are closed to all new purchases as well as additional investments by existing Class B shareholders. |
| Benchmark Performance* | Six Months1 | One Year | Five Years | Ten Years |
| JPMorgan EMBI Global Diversified Index2 | 10.54% | -0.89% | -0.20% | 1.77% |
| Morningstar Emerging Markets Bond Category Average3 | 10.91 | -0.40 | -0.39 | 0.85 |
| * | Returns for indices reflect no deductions for fees, expenses or taxes, except for foreign withholding taxes where applicable. Results assume reinvestment of all dividends and capital gains. An investment cannot be made directly in an index. |
| 1. | Not annualized. |
| 2. | The JPMorgan EMBI Global Diversified Index is the Fund’s primary broad-based securities market index for comparison purposes. The JPMorgan EMBI Global Diversified Index is a market-capitalization weighted, total return index tracking the traded market for U.S. dollar-denominated Brady Bonds, Eurobonds, traded loans and local market debt instruments issued by sovereign and quasi-sovereign entities. |
| 3. | The Morningstar Emerging Markets Bond Category Average is representative of funds that invest more than 65% of their assets in foreign bonds from developing countries. The largest portion of the emerging-markets bond market comes from Latin America, followed by Eastern Europe. Africa, the Middle East, and Asia make up the rest. Results are based on average total returns of similar funds with all dividends and capital gain distributions reinvested. |
| 6 | MainStay Candriam Emerging Markets Debt Fund |
| Share Class | Beginning Account Value 11/1/22 | Ending Account Value (Based on Actual Returns and Expenses) 4/30/23 | Expenses Paid During Period1 | Ending Account Value (Based on Hypothetical 5% Annualized Return and Actual Expenses) 4/30/23 | Expenses Paid During Period1 | Net Expense Ratio During Period2 |
| Class A Shares | $1,000.00 | $1,098.00 | $ 5.98 | $1,019.09 | $ 5.76 | 1.15% |
| Investor Class Shares | $1,000.00 | $1,095.70 | $ 8.52 | $1,016.66 | $ 8.20 | 1.64% |
| Class B Shares | $1,000.00 | $1,092.10 | $12.40 | $1,012.94 | $11.93 | 2.39% |
| Class C Shares | $1,000.00 | $1,092.00 | $12.40 | $1,012.94 | $11.93 | 2.39% |
| Class I Shares | $1,000.00 | $1,099.50 | $ 4.42 | $1,020.58 | $ 4.26 | 0.85% |
| 1. | Expenses are equal to the Fund’s annualized expense ratio of each class multiplied by the average account value over the period, divided by 365 and multiplied by 181 (to reflect the six-month period). The table above represents the actual expenses incurred during the six-month period. In addition to the fees and expenses which the Fund bears directly, it also indirectly bears a pro rata share of the fees and expenses of the underlying funds in which it invests. Such indirect expenses are not included in the above-reported expense figures. |
| 2. | Expenses are equal to the Fund's annualized expense ratio to reflect the six-month period. |
| Mexico | 7.5% |
| Colombia | 5.8 |
| Saudi Arabia | 5.3 |
| Romania | 5.2 |
| Panama | 5.0 |
| Hungary | 4.8 |
| Dominican Republic | 4.4 |
| Brazil | 3.8 |
| United States | 3.6 |
| Indonesia | 3.1 |
| Argentina | 2.9 |
| Peru | 2.8 |
| South Africa | 2.8 |
| Poland | 2.6 |
| Nigeria | 2.4 |
| Senegal | 2.4 |
| Cote D'Ivoire | 2.2 |
| Chile | 2.2 |
| Azerbaijan | 2.1 |
| Ghana | 1.8 |
| Sri Lanka | 1.3 |
| Croatia | 1.3 |
| Zambia | 1.3 |
| Angola | 1.3 |
| Ukraine | 1.2% |
| Venezuela | 1.1 |
| Morocco | 1.1 |
| Tunisia | 1.0 |
| Oman | 1.0 |
| Montenegro | 1.0 |
| Jordan | 1.0 |
| Republic of the Congo | 0.9 |
| Iraq | 0.9 |
| United Arab Emirates | 0.8 |
| Cameroon | 0.8 |
| Georgia | 0.8 |
| Republic Of Serbia | 0.8 |
| Bahrain | 0.8 |
| Papua New Guinea | 0.8 |
| Philippines | 0.7 |
| Ecuador | 0.6 |
| Gabon | 0.5 |
| Republic of North Macedonia | 0.3 |
| Tajikistan | 0.3 |
| Lebanon | 0.2 |
| Other Assets, Less Liabilities | 5.5 |
| 100.0% |
| 1. | Romanian Government Bond, 3.00%-6.00%, due 11/25/27–6/15/48 |
| 2. | Colombia Government Bond, 4.50%-8.00%, due 1/28/26–5/15/49 |
| 3. | Dominican Republic Government Bond, 4.875%-6.40%, due 1/27/25–1/30/60 |
| 4. | Hungary Government Bond, 3.125%-7.625%, due 2/22/27–9/21/51 |
| 5. | Panama Government Bond, 3.87%-9.375%, due 4/1/29–1/19/63 |
| 6. | GACI First Investment Co., 4.75%-4.875%, due 2/14/30–2/14/35 |
| 7. | Mexico Government Bond, 3.50%-5.75%, due 2/12/34–10/12/10 |
| 8. | Pertamina Persero PT, 4.15%-6.00%, due 5/3/42–2/25/60 |
| 9. | South Africa Government Bond, 4.30%-7.30%, due 10/12/28–4/20/52 |
| 10. | Poland Government Bond, 3.875%-5.50%, due 2/14/33–4/4/53 |
| 8 | MainStay Candriam Emerging Markets Debt Fund |
| 1. | See "Investment and Performance Comparison" for other share class returns, which may be higher or lower than Class I share returns, and for more information on benchmark and peer group returns. |
| 2. | The terms “spread” and “yield spread” may refer to the difference in yield between a security or type of security and comparable U.S. Treasury issues. The terms may also refer to the difference in yield between two specific securities or types of securities at a given time. |
| 3. | Duration is a measure of the price sensitivity of a fixed-income investment to changes in interest rates. Duration is expressed as a number of years and is considered a more accurate sensitivity gauge than average maturity. Modified duration is inversely related to the approximate percentage change in price for a given change in yield. |
| 4. | An obligation rated ‘BBB’ by Standard & Poor’s (“S&P”) is deemed by S&P to exhibit adequate protection parameters. In the opinion of S&P, however, adverse economic conditions or changing circumstances are more likely to lead to a weakened capacity of the obligor to meet its financial commitment on the obligation. An obligation rated ‘BB’ by S&P is deemed by S&P to be less vulnerable to nonpayment than other speculative issues. In the opinion of S&P, however, the obligor faces major ongoing uncertainties or exposure to adverse business, financial or economic conditions which could lead to the obligor’s inadequate capacity to meet its financial commitment on the obligation. When applied to Fund holdings, ratings are based solely on the creditworthiness of the bonds in the portfolio and are not meant to represent the security or safety of the Fund. |
| 10 | MainStay Candriam Emerging Markets Debt Fund |
| Principal Amount | Value | |
| Long-Term Bonds 90.9% | ||
| Corporate Bonds 10.7% | ||
| Brazil 1.7% | ||
| Arcos Dorados BV | ||
| Series Reg S | ||
| 6.125%, due 5/27/29 | $ �� 300,000 | $ 285,943 |
| MARB BondCo plc | ||
| Series Reg S | ||
| 3.95%, due 1/29/31 | 500,000 | 367,224 |
| Rumo Luxembourg SARL | ||
| Series Reg S | ||
| 4.20%, due 1/18/32 | 500,000 | 404,230 |
| 1,057,397 | ||
| Georgia 0.8% | ||
| Georgian Railway JSC | ||
| Series Reg S | ||
| 4.00%, due 6/17/28 | 600,000 | 510,182 |
| Mexico 2.4% | ||
| Alpek SAB de CV | ||
| Series Reg S | ||
| 3.25%, due 2/25/31 | 750,000 | 611,226 |
| Cemex SAB de CV | ||
| Series Reg S | ||
| 3.875%, due 7/11/31 | 500,000 | 418,585 |
| Orbia Advance Corp. SAB de CV | ||
| Series Reg S | ||
| 5.875%, due 9/17/44 | 500,000 | 432,670 |
| 1,462,481 | ||
| Peru 0.9% | ||
| Lima Metro Line 2 Finance Ltd. | ||
| Series Reg S | ||
| 4.35%, due 4/5/36 | 630,745 | 567,197 |
| Saudi Arabia 4.7% | ||
| GACI First Investment Co. | ||
| Series Reg S | ||
| 4.75%, due 2/14/30 | 900,000 | 909,540 |
| Series Reg S | ||
| 4.875%, due 2/14/35 | 1,500,000 | 1,483,590 |
| Greensaif Pipelines Bidco SARL | ||
| Series Reg S | ||
| 6.129%, due 2/23/38 | 250,000 | 262,364 |
| Principal Amount | Value | |
| Saudi Arabia (continued) | ||
| TMS Issuer SARL | ||
| Series Reg S | ||
| 5.78%, due 8/23/32 | $ 250,000 | $ 262,055 |
| 2,917,549 | ||
| Venezuela 0.2% | ||
| Petroleos de Venezuela SA | ||
| 5.375%, due 4/12/27 (a)(b)(c) | 3,000,000 | 97,500 |
| Total Corporate Bonds (Cost $7,959,598) | 6,612,306 | |
| Foreign Government Bonds 80.2% | ||
| Angola 1.3% | ||
| Angola Government Bond | ||
| Series Reg S | ||
| 8.75%, due 4/14/32 | 500,000 | 413,210 |
| Series Reg S | ||
| 9.125%, due 11/26/49 | 500,000 | 372,442 |
| 785,652 | ||
| Argentina 2.9% | ||
| Argentina Government Bond | ||
| 3.50%, due 7/9/41 (d) | 3,900,000 | 971,966 |
| Buenos Aires Government Bond | ||
| Series Reg S | ||
| 5.25%, due 9/1/37 (d) | 2,700,000 | 835,169 |
| 1,807,135 | ||
| Azerbaijan 2.1% | ||
| Southern Gas Corridor CJSC | ||
| Series Reg S | ||
| 6.875%, due 3/24/26 | 700,000 | 719,194 |
| State Oil Co. of the Azerbaijan Republic | ||
| Series Reg S | ||
| 6.95%, due 3/18/30 | 550,000 | 569,536 |
| 1,288,730 | ||
| Bahrain 0.8% | ||
| Bahrain Government Bond | ||
| Series Reg S | ||
| 6.75%, due 9/20/29 | 500,000 | 497,450 |
| Brazil 2.1% | ||
| Brazil Government Bond | ||
| 4.75%, due 1/14/50 | 1,000,000 | 735,263 |
| 8.75%, due 2/4/25 (e) | 500,000 | 529,525 |
| 1,264,788 | ||
| 12 | MainStay Candriam Emerging Markets Debt Fund |
| Principal Amount | Value | |
| Foreign Government Bonds (continued) | ||
| Cameroon 0.8% | ||
| Cameroon Government Bond | ||
| Series Reg S | ||
| 5.95%, due 7/7/32 | EUR 425,000 | $ 326,982 |
| Series Reg S | ||
| 9.50%, due 11/19/25 | $ 200,000 | 191,288 |
| 518,270 | ||
| Chile 2.2% | ||
| Chile Government Bond | ||
| 3.10%, due 1/22/61 | 300,000 | 200,334 |
| 3.25%, due 9/21/71 | 600,000 | 399,106 |
| 3.50%, due 4/15/53 (e) | 550,000 | 417,893 |
| Corp. Nacional del Cobre de Chile | ||
| Series Reg S | ||
| 5.125%, due 2/2/33 | 350,000 | 354,305 |
| 1,371,638 | ||
| Colombia 5.8% | ||
| Colombia Government Bond | ||
| 4.50%, due 1/28/26 | 500,000 | 474,889 |
| 5.00%, due 6/15/45 | 300,000 | 201,254 |
| 5.20%, due 5/15/49 | 300,000 | 201,773 |
| 6.125%, due 1/18/41 | 500,000 | 395,011 |
| 7.50%, due 2/2/34 | 500,000 | 478,976 |
| 8.00%, due 4/20/33 (e) | 987,000 | 984,338 |
| Ecopetrol SA | ||
| 4.625%, due 11/2/31 | 700,000 | 525,080 |
| 8.875%, due 1/13/33 | 300,000 | 290,868 |
| 3,552,189 | ||
| Cote D'Ivoire 2.2% | ||
| Ivory Coast Government Bond | ||
| Series Reg S | ||
| 4.875%, due 1/30/32 | EUR 1,000,000 | 832,776 |
| Series Reg S | ||
| 5.75%, due 12/31/32 (d) | $ 596,945 | 549,190 |
| 1,381,966 | ||
| Croatia 1.3% | ||
| Croatia Government Bond | ||
| Series Reg S | ||
| 6.00%, due 1/26/24 | 800,000 | 804,374 |
| Dominican Republic 4.4% | ||
| Dominican Republic Government Bond | ||
| Series Reg S | ||
| 4.875%, due 9/23/32 | 300,000 | 258,297 |
| Principal Amount | Value | |
| Dominican Republic (continued) | ||
| Dominican Republic Government Bond (continued) | ||
| Series Reg S | ||
| 5.50%, due 1/27/25 | $ 500,000 | $ 494,771 |
| Series Reg S | ||
| 5.50%, due 2/22/29 | 300,000 | 285,469 |
| Series Reg S | ||
| 5.875%, due 1/30/60 | 1,000,000 | 761,933 |
| Series Reg S | ||
| 5.95%, due 1/25/27 | 500,000 | 495,769 |
| Series Reg S | ||
| 6.40%, due 6/5/49 (e) | 500,000 | 419,090 |
| 2,715,329 | ||
| Ecuador 0.6% | ||
| Ecuador Government Bond (d) | ||
| Series Reg S | ||
| 1.50%, due 7/31/40 | 800,000 | 260,000 |
| Series Reg S | ||
| 2.50%, due 7/31/35 | 344,321 | 125,912 |
| 385,912 | ||
| Gabon 0.5% | ||
| Gabon Government Bond | ||
| Series Reg S | ||
| 7.00%, due 11/24/31 | 400,000 | 295,040 |
| Ghana 1.8% | ||
| Ghana Government Bond (a)(c) | ||
| Series Reg S | ||
| 7.75%, due 4/7/29 | 700,000 | 255,640 |
| Series Reg S | ||
| 7.875%, due 2/11/35 | 900,000 | 332,280 |
| Series Reg S | ||
| 8.627%, due 6/16/49 | 1,500,000 | 525,000 |
| 1,112,920 | ||
| Hungary 4.8% | ||
| Hungary Government Bond | ||
| Series Reg S | ||
| 3.125%, due 9/21/51 | 1,000,000 | 618,014 |
| Series Reg S | ||
| 5.00%, due 2/22/27 | EUR 700,000 | 782,437 |
| Series Reg S | ||
| 6.25%, due 9/22/32 | $ 800,000 | 829,000 |
| 7.625%, due 3/29/41 | 300,000 | 340,815 |
| Principal Amount | Value | |
| Foreign Government Bonds (continued) | ||
| Hungary (continued) | ||
| Magyar Export-Import Bank Zrt. | ||
| Series Reg S | ||
| 6.125%, due 12/4/27 | $ 363,000 | $ 365,217 |
| 2,935,483 | ||
| Indonesia 3.1% | ||
| Pertamina Persero PT | ||
| Series Reg S | ||
| 4.15%, due 2/25/60 | 500,000 | 366,552 |
| 5.625%, due 5/20/43 (f) | 800,000 | 759,569 |
| Series Reg S | ||
| 6.00%, due 5/3/42 | 800,000 | 793,623 |
| 1,919,744 | ||
| Iraq 0.9% | ||
| Iraq Government Bond | ||
| Series Reg S | ||
| 5.80%, due 1/15/28 | 562,500 | 524,644 |
| Jordan 1.0% | ||
| Jordan Government Bond | ||
| Series Reg S | ||
| 7.50%, due 1/13/29 | 600,000 | 599,892 |
| Lebanon 0.2% | ||
| Lebanon Government Bond (a)(b)(c) | ||
| Series Reg S | ||
| 6.65%, due 4/22/24 | 1,014,000 | 58,812 |
| Series Reg S | ||
| 6.85%, due 3/23/27 | 1,000,000 | 57,040 |
| 115,852 | ||
| Mexico 5.1% | ||
| Comision Federal de Electricidad | ||
| Series Reg S | ||
| 3.875%, due 7/26/33 | 500,000 | 385,800 |
| Series Reg S | ||
| 4.677%, due 2/9/51 | 700,000 | 471,982 |
| Mexico Government Bond | ||
| 3.50%, due 2/12/34 | 500,000 | 429,415 |
| 3.75%, due 4/19/71 | 1,000,000 | 678,063 |
| 3.771%, due 5/24/61 | 800,000 | 550,903 |
| 5.75%, due 10/12/10 | 700,000 | 622,946 |
| 3,139,109 | ||
| Principal Amount | Value | |
| Montenegro 1.0% | ||
| Montenegro Government Bond | ||
| Series Reg S | ||
| 2.875%, due 12/16/27 | EUR 700,000 | $ 619,631 |
| Morocco 1.1% | ||
| Morocco Government Bond | ||
| Series Reg S | ||
| 5.95%, due 3/8/28 | $ 340,000 | 348,085 |
| Series Reg S | ||
| 6.50%, due 9/8/33 | 300,000 | 310,760 |
| 658,845 | ||
| Nigeria 2.4% | ||
| Nigeria Government Bond | ||
| Series Reg S | ||
| 7.625%, due 11/21/25 | 500,000 | 452,175 |
| Series Reg S | ||
| 7.625%, due 11/28/47 | 500,000 | 310,904 |
| Series Reg S | ||
| 7.875%, due 2/16/32 | 1,000,000 | 737,500 |
| 1,500,579 | ||
| Oman 1.0% | ||
| Oman Government Bond | ||
| Series Reg S | ||
| 6.75%, due 10/28/27 | 600,000 | 631,955 |
| Panama 5.0% | ||
| Aeropuerto Internacional de Tocumen SA | ||
| Series Reg S | ||
| 5.125%, due 8/11/61 | 727,000 | 559,645 |
| Panama Government Bond | ||
| 3.87%, due 7/23/60 | 500,000 | 333,800 |
| 4.50%, due 4/1/56 | 400,000 | 302,728 |
| 4.50%, due 1/19/63 | 800,000 | 588,536 |
| 6.40%, due 2/14/35 | 1,000,000 | 1,057,316 |
| 9.375%, due 4/1/29 | 200,000 | 243,804 |
| 3,085,829 | ||
| Papua New Guinea 0.8% | ||
| Papua New Guinea Government Bond | ||
| Series Reg S | ||
| 8.375%, due 10/4/28 | 525,000 | 466,198 |
| Peru 1.9% | ||
| Peru Government Bond | ||
| 3.23%, due 7/28/21 | 600,000 | 365,021 |
| 14 | MainStay Candriam Emerging Markets Debt Fund |
| Principal Amount | Value | |
| Foreign Government Bonds (continued) | ||
| Peru (continued) | ||
| Peru Government Bond (continued) | ||
| 3.60%, due 1/15/72 | $ 400,000 | $ 274,403 |
| 6.55%, due 3/14/37 | 500,000 | 556,372 |
| 1,195,796 | ||
| Philippines 0.7% | ||
| Philippine Government Bond | ||
| 4.20%, due 3/29/47 | 500,000 | 437,523 |
| Poland 2.6% | ||
| Poland Government Bond | ||
| Series Reg S | ||
| 3.875%, due 2/14/33 | EUR 800,000 | 869,931 |
| Series Reg S | ||
| 4.25%, due 2/14/43 | 500,000 | 532,444 |
| 5.50%, due 4/4/53 | $ 175,000 | 181,151 |
| 1,583,526 | ||
| Republic of North Macedonia 0.3% | ||
| North Macedonia Government Bond | ||
| Series Reg S | ||
| 6.96%, due 3/13/27 | EUR 183,000 | 204,168 |
| Republic Of Serbia 0.8% | ||
| Serbia Government Bond | ||
| Series Reg S | ||
| 6.25%, due 5/26/28 | $ 200,000 | 204,040 |
| Series Reg S | ||
| 6.50%, due 9/26/33 | 300,000 | 304,141 |
| 508,181 | ||
| Republic of the Congo 0.9% | ||
| Congo Government Bond | ||
| Series Reg S | ||
| 6.00%, due 6/30/29 (d) | 669,750 | 567,345 |
| Romania 5.2% | ||
| Romanian Government Bond | ||
| Series Reg S | ||
| 3.00%, due 2/14/31 | 300,000 | 250,230 |
| Series Reg S | ||
| 5.125%, due 6/15/48 | 900,000 | 756,000 |
| Series Reg S | ||
| 5.25%, due 11/25/27 | 600,000 | 593,340 |
| Principal Amount | Value | |
| Romania (continued) | ||
| Romanian Government Bond (continued) | ||
| Series Reg S | ||
| 6.00%, due 5/25/34 | $ 1,600,000 | $ 1,586,432 |
| 3,186,002 | ||
| Saudi Arabia 0.6% | ||
| Saudi Government Bond | ||
| Series Reg S | ||
| 3.45%, due 2/2/61 | 500,000 | 358,150 |
| Senegal 2.4% | ||
| Senegal Government Bond | ||
| Series Reg S | ||
| 5.375%, due 6/8/37 | EUR 1,358,000 | 947,209 |
| Series Reg S | ||
| 6.25%, due 5/23/33 (e) | $ 642,000 | 504,021 |
| 1,451,230 | ||
| South Africa 2.8% | ||
| South Africa Government Bond | ||
| 4.30%, due 10/12/28 | 500,000 | 448,385 |
| 5.75%, due 9/30/49 | 250,000 | 179,044 |
| 5.875%, due 4/20/32 | 800,000 | 725,600 |
| 7.30%, due 4/20/52 | 450,000 | 383,141 |
| 1,736,170 | ||
| Sri Lanka 1.3% | ||
| Sri Lanka Government Bond (a)(c) | ||
| Series Reg S | ||
| 6.20%, due 5/11/27 | 600,000 | 196,748 |
| Series Reg S | ||
| 6.825%, due 7/18/26 | 1,150,000 | 402,011 |
| Series Reg S | ||
| 7.55%, due 3/28/30 | 650,000 | 213,154 |
| 811,913 | ||
| Tajikistan 0.3% | ||
| Tajiskistan Government Bond | ||
| Series Reg S | ||
| 7.125%, due 9/14/27 | 202,000 | 156,085 |
| Tunisia 1.0% | ||
| Tunisian Republic | ||
| Series Reg S | ||
| 5.625%, due 2/17/24 | EUR 300,000 | 223,135 |
| Series Reg S | ||
| 5.75%, due 1/30/25 | $ 800,000 | 409,365 |
| 632,500 | ||
| Principal Amount | Value | |
| Foreign Government Bonds (continued) | ||
| Ukraine 1.2% | ||
| NPC Ukrenergo | ||
| Series Reg S | ||
| 6.875%, due 11/9/28 (a)(b)(c) | $ 1,150,000 | $ 184,000 |
| State Agency of Roads of Ukraine | ||
| Series Reg S | ||
| 6.25%, due 6/24/30 (a)(b)(c) | 2,227,000 | 356,632 |
| Ukraine Government Bond | ||
| Series Reg S | ||
| 7.253%, due 3/15/35 (a)(b)(c) | 1,300,000 | 213,148 |
| 753,780 | ||
| United Arab Emirates 0.8% | ||
| Finance Department Government of Sharjah | ||
| Series Reg S | ||
| 4.00%, due 7/28/50 | 800,000 | 519,000 |
| Venezuela 0.9% | ||
| Petroleos de Venezuela SA (a)(b)(c) | ||
| Series Reg S | ||
| 6.00%, due 5/16/24 | 2,500,000 | 81,250 |
| Series Reg S | ||
| 6.00%, due 11/15/26 (g) | 2,500,000 | 71,250 |
| Venezuela Government Bond | ||
| Series Reg S | ||
| 9.25%, due 5/7/28 (a)(b)(c) | 4,095,000 | 409,500 |
| 562,000 | ||
| Zambia 1.3% | ||
| Zambia Government Bond | ||
| Series Reg S | ||
| 8.97%, due 7/30/27 (a)(c) | 1,700,000 | 785,740 |
| Total Foreign Government Bonds (Cost $63,164,533) | 49,428,263 | |
| Total Long-Term Bonds (Cost $71,124,131) | 56,040,569 | |
| Shares | Value | ||
| Short-Term Investment 3.6% | |||
| Unaffiliated Investment Company 3.6% | |||
| United States 3.6% | |||
| Invesco Government & Agency Portfolio, 4.857% (h)(i) | 2,257,042 | $ 2,257,042 | |
| Total Short-Term Investment (Cost $2,257,042) | 2,257,042 | ||
| Total Investments (Cost $73,381,173) | 94.5% | 58,297,611 | |
| Other Assets, Less Liabilities | 5.5 | 3,362,155 | |
| Net Assets | 100.0% | $ 61,659,766 | |
| † | Percentages indicated are based on Fund net assets. |
| ^ | Industry classifications may be different than those used for compliance monitoring purposes. |
| (a) | Issue in default. |
| (b) | Illiquid security—As of April 30, 2023, the total market value deemed illiquid under procedures approved by the Board of Trustees was $1,529,132, which represented 2.5% of the Fund’s net assets. |
| (c) | Issue in non-accrual status. |
| (d) | Step coupon—Rate shown was the rate in effect as of April 30, 2023. |
| (e) | All or a portion of this security was held on loan. As of April 30, 2023, the aggregate market value of securities on loan was $2,192,173. The Fund received cash collateral with a value of $2,257,042. (See Note 2(J)) |
| (f) | May be sold to institutional investors only under Rule 144A or securities offered pursuant to Section 4(a)(2) of the Securities Act of 1933, as amended. |
| (g) | Coupon rate may change based on changes of the underlying collateral or prepayments of principal. Rate shown was the rate in effect as of April 30, 2023. |
| (h) | Current yield as of April 30, 2023. |
| (i) | Represents a security purchased with cash collateral received for securities on loan. |
| 16 | MainStay Candriam Emerging Markets Debt Fund |
| Currency Purchased | Currency Sold | Counterparty | Settlement Date | Unrealized Appreciation (Depreciation)2 | ||
| USD | 549,920 | EUR | 500,000 | Barclays Capital | 5/17/23 | $ (1,552) |
| USD | 1,612,850 | EUR | 1,500,000 | JPMorgan Chase Bank N.A. | 5/17/23 | (41,565) |
| USD | 3,488,659 | EUR | 3,200,000 | JPMorgan Chase Bank N.A. | 5/17/23 | (40,759) |
| Total Unrealized Depreciation | $ (83,876) | |||||
| 1. | Foreign Currency Forward Contracts are subject to limitations such that they cannot be “sold or repurchased,” although the Fund would be able to exit the transaction through other means, such as through the execution of an offsetting transaction. |
| 2. | As of April 30, 2023, cash in the amount of $270,000 was on deposit with a broker or forward commission merchant for forward transactions. |
| Type | Number of Contracts | Expiration Date | Value at Trade Date | Current Notional Amount | Unrealized Appreciation (Depreciation)2 |
| Long Contracts | |||||
| U.S. Treasury 5 Year Notes | 157 | June 2023 | $ 17,202,192 | $ 17,229,524 | $ 27,332 |
| Short Contracts | |||||
| Euro-Bund | (23) | June 2023 | (3,375,221) | (3,435,592) | (60,371) |
| Net Unrealized Depreciation | $ (33,039) |
| 1. | As of April 30, 2023, cash in the amount of $432,387 was on deposit with a broker or futures commission merchant for futures transactions. |
| 2. | Represents the difference between the value of the contracts at the time they were opened and the value as of April 30, 2023. |
| Abbreviation(s): |
| EUR—Euro |
| USD—United States Dollar |
| Description | Quoted Prices in Active Markets for Identical Assets (Level 1) | Significant Other Observable Inputs (Level 2) | Significant Unobservable Inputs (Level 3) | Total | |||
| Asset Valuation Inputs | |||||||
| Investments in Securities (a) | |||||||
| Long-Term Bonds | |||||||
| Corporate Bonds | $ — | $ 6,612,306 | $ — | $ 6,612,306 | |||
| Foreign Government Bonds | — | 49,428,263 | — | 49,428,263 | |||
| Total Long-Term Bonds | — | 56,040,569 | — | 56,040,569 | |||
| Short-Term Investment | |||||||
| Unaffiliated Investment Company | 2,257,042 | — | — | 2,257,042 | |||
| Total Investments in Securities | 2,257,042 | 56,040,569 | — | 58,297,611 | |||
| Other Financial Instruments | |||||||
| Futures Contracts (b) | 27,332 | — | — | 27,332 | |||
| Total Investments in Securities and Other Financial Instruments | $ 2,284,374 | $ 56,040,569 | $ — | $ 58,324,943 | |||
| Liability Valuation Inputs | |||||||
| Other Financial Instruments (b) | |||||||
| Foreign Currency Forward Contracts | $ — | $ (83,876) | $ — | $ (83,876) | |||
| Futures Contracts | (60,371) | — | — | (60,371) | |||
| Total Other Financial Instruments | $ (60,371) | $ (83,876) | $ — | $ (144,247) |
| (a) | For a complete listing of investments and their industries, see the Portfolio of Investments. |
| (b) | The value listed for these securities reflects unrealized appreciation (depreciation) as shown on the Portfolio of Investments. |
| 18 | MainStay Candriam Emerging Markets Debt Fund |
| Assets | |
| Investment in securities, at value (identified cost $73,381,173) including securities on loan of $2,192,173 | $ 58,297,611 |
| Cash | 2,724,950 |
| Cash denominated in foreign currencies (identified cost $88,566) | 89,406 |
| Cash collateral on deposit at broker for futures contracts | 432,387 |
| Cash collateral on deposit at broker for forward contracts | 270,000 |
| Due from custodian | 286,312 |
| Receivables: | |
| Variation margin on futures contracts | 1,742,680 |
| Interest | 878,753 |
| Fund shares sold | 58,286 |
| Investment securities sold | 11,160 |
| Securities lending | 1,798 |
| Other assets | 52,364 |
| Total assets | 64,845,707 |
| Liabilities | |
| Cash collateral received for securities on loan | 2,257,042 |
| Payables: | |
| Investment securities purchased | 646,557 |
| Fund shares redeemed | 60,048 |
| Professional fees | 31,354 |
| Transfer agent (See Note 3) | 29,696 |
| Manager (See Note 3) | 19,882 |
| Shareholder communication | 16,828 |
| Custodian | 13,817 |
| NYLIFE Distributors (See Note 3) | 12,891 |
| Trustees | 56 |
| Accrued expenses | 6,679 |
| Distributions payable | 7,215 |
| Unrealized depreciation on foreign currency forward contracts | 83,876 |
| Total liabilities | 3,185,941 |
| Net assets | $ 61,659,766 |
| Composition of Net Assets | |
| Shares of beneficial interest outstanding (par value of $.01 per share) unlimited number of shares authorized | $ 84,609 |
| Additional paid-in-capital | 109,303,332 |
| 109,387,941 | |
| Total distributable earnings (loss) | (47,728,175) |
| Net assets | $ 61,659,766 |
| Class A | |
| Net assets applicable to outstanding shares | $47,545,788 |
| Shares of beneficial interest outstanding | 6,532,726 |
| Net asset value per share outstanding | $ 7.28 |
| Maximum sales charge (4.50% of offering price) | 0.34 |
| Maximum offering price per share outstanding | $ 7.62 |
| Investor Class | |
| Net assets applicable to outstanding shares | $ 9,014,841 |
| Shares of beneficial interest outstanding | 1,223,869 |
| Net asset value per share outstanding | $ 7.37 |
| Maximum sales charge (4.00% of offering price) | 0.31 |
| Maximum offering price per share outstanding | $ 7.68 |
| Class B | |
| Net assets applicable to outstanding shares | $ 366,882 |
| Shares of beneficial interest outstanding | 51,618 |
| Net asset value and offering price per share outstanding | $ 7.11 |
| Class C | |
| Net assets applicable to outstanding shares | $ 1,084,084 |
| Shares of beneficial interest outstanding | 152,251 |
| Net asset value and offering price per share outstanding | $ 7.12 |
| Class I | |
| Net assets applicable to outstanding shares | $ 3,648,171 |
| Shares of beneficial interest outstanding | 500,432 |
| Net asset value and offering price per share outstanding | $ 7.29 |
| Investment Income (Loss) | |
| Income | |
| Interest | $ 2,151,990 |
| Securities lending, net | 12,623 |
| Total income | 2,164,613 |
| Expenses | |
| Manager (See Note 3) | 223,117 |
| Transfer agent (See Note 3) | 81,663 |
| Distribution/Service—Class A (See Note 3) | 61,475 |
| Distribution/Service—Investor Class (See Note 3) | 11,417 |
| Distribution/Service—Class B (See Note 3) | 2,035 |
| Distribution/Service—Class C (See Note 3) | 6,173 |
| Professional fees | 44,095 |
| Registration | 39,081 |
| Custodian | 19,896 |
| Shareholder communication | 1,003 |
| Trustees | 807 |
| Miscellaneous | 2,794 |
| Total expenses before waiver/reimbursement | 493,556 |
| Expense waiver/reimbursement from Manager (See Note 3) | (100,349) |
| Reimbursement from prior custodian(a) | (127) |
| Net expenses | 393,080 |
| Net investment income (loss) | 1,771,533 |
| Realized and Unrealized Gain (Loss) | |
| Net realized gain (loss) on: | |
| Unaffiliated investment transactions | (3,472,572) |
| Futures transactions | 158,689 |
| Foreign currency transactions | 43,113 |
| Foreign currency forward transactions | (65,950) |
| Net realized gain (loss) | (3,336,720) |
| Net change in unrealized appreciation (depreciation) on: | |
| Unaffiliated investments | 7,702,740 |
| Futures contracts | (34,263) |
| Foreign currency forward contracts | (83,876) |
| Translation of other assets and liabilities in foreign currencies | 14,026 |
| Net change in unrealized appreciation (depreciation) | 7,598,627 |
| Net realized and unrealized gain (loss) | 4,261,907 |
| Net increase (decrease) in net assets resulting from operations | $ 6,033,440 |
| (a) | Represents a refund for overbilling of custody fees. |
| 20 | MainStay Candriam Emerging Markets Debt Fund |
for the six months ended April 30, 2023 (Unaudited) and the year ended October 31, 2022
| Six months ended April 30, 2023 | Year ended October 31, 2022 | |
| Increase (Decrease) in Net Assets | ||
| Operations: | ||
| Net investment income (loss) | $ 1,771,533 | $ 3,647,283 |
| Net realized gain (loss) | (3,336,720) | (13,154,988) |
| Net change in unrealized appreciation (depreciation) | 7,598,627 | (13,895,370) |
| Net increase (decrease) in net assets resulting from operations | 6,033,440 | (23,403,075) |
| Distributions to shareholders: | ||
| Class A | (1,856,162) | (3,612,534) |
| Investor Class | (314,037) | (549,300) |
| Class B | (13,935) | (37,561) |
| Class C | (42,123) | (107,128) |
| Class I | (147,972) | (237,169) |
| (2,374,229) | (4,543,692) | |
| Distributions to shareholders from return of capital: | ||
| Class A | — | (277,063) |
| Investor Class | — | (42,129) |
| Class B | — | (2,881) |
| Class C | — | (8,216) |
| Class I | — | (18,190) |
| — | (348,479) | |
| Total distributions to shareholders | (2,374,229) | (4,892,171) |
| Capital share transactions: | ||
| Net proceeds from sales of shares | 10,548,270 | 12,957,410 |
| Net asset value of shares issued to shareholders in reinvestment of distributions | 2,270,893 | 4,663,688 |
| Cost of shares redeemed | (16,962,984) | (31,448,175) |
| Increase (decrease) in net assets derived from capital share transactions | (4,143,821) | (13,827,077) |
| Net increase (decrease) in net assets | (484,610) | (42,122,323) |
| Net Assets | ||
| Beginning of period | 62,144,376 | 104,266,699 |
| End of period | $ 61,659,766 | $ 62,144,376 |
| Six months ended April 30, 2023* | Year Ended October 31, | ||||||||||
| Class A | 2022 | 2021 | 2020 | 2019 | 2018 | ||||||
| Net asset value at beginning of period | $ 6.88 | $ 9.73 | $ 9.81 | $ 10.46 | $ 9.71 | $ 10.88 | |||||
| Net investment income (loss) (a) | 0.20 | 0.38 | 0.36 | 0.47 | 0.49 | 0.45 | |||||
| Net realized and unrealized gain (loss) | 0.47 | (2.73) | 0.04 | (0.67) | 0.76 | (1.19) | |||||
| Total from investment operations | 0.67 | (2.35) | 0.40 | (0.20) | 1.25 | (0.74) | |||||
| Less distributions: | |||||||||||
| From net investment income | (0.27) | (0.46) | (0.48) | (0.45) | (0.50) | (0.43) | |||||
| Return of capital | — | (0.04) | — | — | — | — | |||||
| Total distributions | (0.27) | (0.50) | (0.48) | (0.45) | (0.50) | (0.43) | |||||
| Net asset value at end of period | $ 7.28 | $ 6.88 | $ 9.73 | $ 9.81 | $ 10.46 | $ 9.71 | |||||
| Total investment return (b) | 9.80% | (24.93)% | 4.00% | (1.80)% | 13.05% | (6.95)% | |||||
| Ratios (to average net assets)/Supplemental Data: | |||||||||||
| Net investment income (loss) | 5.64%†† | 4.53% | 3.58% | 4.70% | 4.78% | 4.36% | |||||
| Net expenses (c) | 1.15%†† | 1.15% | 1.16% | 1.17% | 1.23% | 1.26% | |||||
| Expenses (before waiver/reimbursement) (c) | 1.46%†† | 1.36% | 1.31% | 1.33% | 1.26% | 1.26% | |||||
| Portfolio turnover rate | 80% | 116% | 112% | 102% | 102% | 44% | |||||
| Net assets at end of period (in 000’s) | $ 47,546 | $ 48,053 | $ 81,092 | $ 82,874 | $ 93,472 | $ 86,452 | |||||
| * | Unaudited. |
| †† | Annualized. |
| (a) | Per share data based on average shares outstanding during the period. |
| (b) | Total investment return is calculated exclusive of sales charges and assumes the reinvestment of dividends and distributions. For periods of less than one year, total return is not annualized. |
| (c) | In addition to the fees and expenses which the Fund bears directly, it also indirectly bears a pro-rata share of the fees and expenses of the underlying funds in which it invests. Such indirect expenses are not included in the above expense ratios. |
| Six months ended April 30, 2023* | Year Ended October 31, | ||||||||||
| Investor Class | 2022 | 2021 | 2020 | 2019 | 2018 | ||||||
| Net asset value at beginning of period | $ 6.96 | $ 9.84 | $ 9.91 | $ 10.57 | $ 9.80 | $ 10.98 | |||||
| Net investment income (loss) (a) | 0.19 | 0.35 | 0.33 | 0.44 | 0.47 | 0.43 | |||||
| Net realized and unrealized gain (loss) | 0.47 | (2.77) | 0.04 | (0.68) | 0.77 | (1.20) | |||||
| Total from investment operations | 0.66 | (2.42) | 0.37 | (0.24) | 1.24 | (0.77) | |||||
| Less distributions: | |||||||||||
| From net investment income | (0.25) | (0.43) | (0.44) | (0.42) | (0.47) | (0.41) | |||||
| Return of capital | — | (0.03) | — | — | — | — | |||||
| Total distributions | (0.25) | (0.46) | (0.44) | (0.42) | (0.47) | (0.41) | |||||
| Net asset value at end of period | $ 7.37 | $ 6.96 | $ 9.84 | $ 9.91 | $ 10.57 | $ 9.80 | |||||
| Total investment return (b) | 9.57% | (25.27)% | 3.70% | (2.20)% | 12.82% | (7.18)% | |||||
| Ratios (to average net assets)/Supplemental Data: | |||||||||||
| Net investment income (loss) | 5.16%†† | 4.14% | 3.21% | 4.38% | 4.50% | 4.15% | |||||
| Net expenses (c) | 1.64%†† | 1.56% | 1.53% | 1.49% | 1.52% | 1.47% | |||||
| Expenses (before waiver/reimbursement) (c) | 1.97%†† | 1.78% | 1.70% | 1.66% | 1.56% | 1.49% | |||||
| Portfolio turnover rate | 80% | 116% | 112% | 102% | 102% | 44% | |||||
| Net assets at end of period (in 000's) | $ 9,015 | $ 8,670 | $ 12,806 | $ 13,801 | $ 16,024 | $ 15,911 | |||||
| * | Unaudited. |
| †† | Annualized. |
| (a) | Per share data based on average shares outstanding during the period. |
| (b) | Total investment return is calculated exclusive of sales charges and assumes the reinvestment of dividends and distributions. For periods of less than one year, total return is not annualized. |
| (c) | In addition to the fees and expenses which the Fund bears directly, it also indirectly bears a pro-rata share of the fees and expenses of the underlying funds in which it invests. Such indirect expenses are not included in the above expense ratios. |
| 22 | MainStay Candriam Emerging Markets Debt Fund |
| Six months ended April 30, 2023* | Year Ended October 31, | ||||||||||
| Class B | 2022 | 2021 | 2020 | 2019 | 2018 | ||||||
| Net asset value at beginning of period | $ 6.72 | $ 9.52 | $ 9.61 | $ 10.26 | $ 9.52 | $ 10.69 | |||||
| Net investment income (loss) (a) | 0.16 | 0.27 | 0.24 | 0.36 | 0.38 | 0.34 | |||||
| Net realized and unrealized gain (loss) | 0.46 | (2.67) | 0.04 | (0.66) | 0.75 | (1.18) | |||||
| Total from investment operations | 0.62 | (2.40) | 0.28 | (0.30) | 1.13 | (0.84) | |||||
| Less distributions: | |||||||||||
| From net investment income | (0.23) | (0.37) | (0.37) | (0.35) | (0.39) | (0.33) | |||||
| Return of capital | — | (0.03) | — | — | — | — | |||||
| Total distributions | (0.23) | (0.40) | (0.37) | (0.35) | (0.39) | (0.33) | |||||
| Net asset value at end of period | $ 7.11 | $ 6.72 | $ 9.52 | $ 9.61 | $ 10.26 | $ 9.52 | |||||
| Total investment return (b) | 9.21% | (25.85)% | 2.87% | (2.91)% | 12.04% | (7.98)% | |||||
| Ratios (to average net assets)/Supplemental Data: | |||||||||||
| Net investment income (loss) | 4.40%†† | 3.31% | 2.49% | 3.66% | 3.76% | 3.37% | |||||
| Net expenses (c) | 2.39%†† | 2.31% | 2.28% | 2.24% | 2.27% | 2.22% | |||||
| Expenses (before waiver/reimbursement) (c) | 2.72%†† | 2.52% | 2.45% | 2.40% | 2.31% | 2.24% | |||||
| Portfolio turnover rate | 80% | 116% | 112% | 102% | 102% | 44% | |||||
| Net assets at end of period (in 000’s) | $ 367 | $ 426 | $ 1,129 | $ 1,789 | $ 2,663 | $ 3,660 | |||||
| * | Unaudited. |
| †† | Annualized. |
| (a) | Per share data based on average shares outstanding during the period. |
| (b) | Total investment return is calculated exclusive of sales charges and assumes the reinvestment of dividends and distributions. For periods of less than one year, total return is not annualized. |
| (c) | In addition to the fees and expenses which the Fund bears directly, it also indirectly bears a pro-rata share of the fees and expenses of the underlying funds in which it invests. Such indirect expenses are not included in the above expense ratios. |
| Six months ended April 30, 2023* | Year Ended October 31, | ||||||||||
| Class C | 2022 | 2021 | 2020 | 2019 | 2018 | ||||||
| Net asset value at beginning of period | $ 6.74 | $ 9.54 | $ 9.63 | $ 10.27 | $ 9.54 | $ 10.70 | |||||
| Net investment income (loss) (a) | 0.16 | 0.27 | 0.25 | 0.36 | 0.38 | 0.35 | |||||
| Net realized and unrealized gain (loss) | 0.45 | (2.67) | 0.03 | (0.66) | 0.74 | (1.18) | |||||
| Total from investment operations | 0.61 | (2.40) | 0.28 | (0.30) | 1.12 | (0.83) | |||||
| Less distributions: | |||||||||||
| From net investment income | (0.23) | (0.37) | (0.37) | (0.34) | (0.39) | (0.33) | |||||
| Return of capital | — | (0.03) | — | — | — | — | |||||
| Total distributions | (0.23) | (0.40) | (0.37) | (0.34) | (0.39) | (0.33) | |||||
| Net asset value at end of period | $ 7.12 | $ 6.74 | $ 9.54 | $ 9.63 | $ 10.27 | $ 9.54 | |||||
| Total investment return (b) | 9.20% | (25.90)% | 2.87% | (2.81)% | 11.91% | (7.88)% | |||||
| Ratios (to average net assets)/Supplemental Data: | |||||||||||
| Net investment income (loss) | 4.41%†† | 3.31% | 2.52% | 3.68% | 3.78% | 3.39% | |||||
| Net expenses (c) | 2.39%†† | 2.31% | 2.28% | 2.24% | 2.27% | 2.22% | |||||
| Expenses (before waiver/reimbursement) (c) | 2.72%†† | 2.52% | 2.45% | 2.40% | 2.31% | 2.24% | |||||
| Portfolio turnover rate | 80% | 116% | 112% | 102% | 102% | 44% | |||||
| Net assets at end of period (in 000’s) | $ 1,084 | $ 1,358 | $ 3,511 | $ 6,365 | $ 11,150 | $ 19,246 | |||||
| * | Unaudited. |
| †† | Annualized. |
| (a) | Per share data based on average shares outstanding during the period. |
| (b) | Total investment return is calculated exclusive of sales charges and assumes the reinvestment of dividends and distributions. For periods of less than one year, total return is not annualized. |
| (c) | In addition to the fees and expenses which the Fund bears directly, it also indirectly bears a pro-rata share of the fees and expenses of the underlying funds in which it invests. Such indirect expenses are not included in the above expense ratios. |
| Six months ended April 30, 2023* | Year Ended October 31, | ||||||||||
| Class I | 2022 | 2021 | 2020 | 2019 | 2018 | ||||||
| Net asset value at beginning of period | $ 6.89 | $ 9.75 | $ 9.82 | $ 10.48 | $ 9.72 | $ 10.90 | |||||
| Net investment income (loss) (a) | 0.22 | 0.40 | 0.39 | 0.51 | 0.52 | 0.48 | |||||
| Net realized and unrealized gain (loss) | 0.46 | (2.74) | 0.05 | (0.69) | 0.76 | (1.20) | |||||
| Total from investment operations | 0.68 | (2.34) | 0.44 | (0.18) | 1.28 | (0.72) | |||||
| Less distributions: | |||||||||||
| From net investment income | (0.28) | (0.48) | (0.51) | (0.48) | (0.52) | (0.46) | |||||
| Return of capital | — | (0.04) | — | — | — | — | |||||
| Total distributions | (0.28) | (0.52) | (0.51) | (0.48) | (0.52) | (0.46) | |||||
| Net asset value at end of period | $ 7.29 | $ 6.89 | $ 9.75 | $ 9.82 | $ 10.48 | $ 9.72 | |||||
| Total investment return (b) | 9.95% | (24.75)% | 4.42% | (1.59)% | 13.46% | (6.80)% | |||||
| Ratios (to average net assets)/Supplemental Data: | |||||||||||
| Net investment income (loss) | 5.94%†† | 4.89% | 3.86% | 5.09% | 4.99% | 4.60% | |||||
| Net expenses (c) | 0.85%†† | 0.85% | 0.85% | 0.85% | 0.94% | 1.01% | |||||
| Expenses (before waiver/reimbursement) (c) | 1.21%†† | 1.12% | 1.06% | 1.07% | 1.01% | 1.01% | |||||
| Portfolio turnover rate | 80% | 116% | 112% | 102% | 102% | 44% | |||||
| Net assets at end of period (in 000’s) | $ 3,648 | $ 3,637 | $ 5,729 | $ 6,687 | $ 17,100 | $ 10,428 | |||||
| * | Unaudited. |
| †† | Annualized. |
| (a) | Per share data based on average shares outstanding during the period. |
| (b) | Total investment return is calculated exclusive of sales charges and assumes the reinvestment of dividends and distributions. Class I shares are not subject to sales charges. For periods of less than one year, total return is not annualized. |
| (c) | In addition to the fees and expenses which the Fund bears directly, it also indirectly bears a pro-rata share of the fees and expenses of the underlying funds in which it invests. Such indirect expenses are not included in the above expense ratios. |
| 24 | MainStay Candriam Emerging Markets Debt Fund |
| Class | Commenced Operations |
| Class A | June 1, 1998 |
| Investor Class | February 28, 2008 |
| Class B | June 1, 1998 |
| Class C | September 1, 1998 |
| Class I | August 31, 2007 |
| • | Level 1—quoted prices (unadjusted) in active markets for an identical asset or liability |
| • | Level 2—other significant observable inputs (including quoted prices for a similar asset or liability in active markets, interest rates and yield curves, prepayment speeds, credit risk, etc.) |
| • | Level 3—significant unobservable inputs (including the Fund's own assumptions about the assumptions that market participants would use in measuring fair value of an asset or liability) |
| • Benchmark yields | • Reported trades |
| • Broker/dealer quotes | • Issuer spreads |
| • Two-sided markets | • Benchmark securities |
| • Bids/offers | • Reference data (corporate actions or material event notices) |
| • Industry and economic events | • Comparable bonds |
| • Monthly payment information |
| 26 | MainStay Candriam Emerging Markets Debt Fund |
| 28 | MainStay Candriam Emerging Markets Debt Fund |
| 30 | MainStay Candriam Emerging Markets Debt Fund |
| Asset Derivatives | Interest Rate Contracts Risk | Total |
| Futures Contracts - Net Assets—Net unrealized appreciation on futures contracts (a) | $27,332 | $27,332 |
| Total Fair Value | $27,332 | $27,332 |
| (a) | Includes cumulative appreciation (depreciation) of futures contracts as reported in the Portfolio of Investments. Only current day’s variation margin is reported within the Statement of Assets and Liabilities. |
| Liability Derivatives | Foreign Exchange Contracts Risk | Interest Rate Contracts Risk | Total |
| Futures Contracts - Net Assets—Net unrealized depreciation on futures contracts (a) | $ — | $(60,371) | $ (60,371) |
| Forward Contracts - Unrealized depreciation on foreign currency forward contracts | (83,876) | — | (83,876) |
| Total Fair Value | $(83,876) | $(60,371) | $(144,247) |
| (a) | Includes cumulative appreciation (depreciation) of futures contracts as reported in the Portfolio of Investments. Only current day’s variation margin is reported within the Statement of Assets and Liabilities. |
| Net Realized Gain (Loss) from: | Foreign Exchange Contracts Risk | Interest Rate Contracts Risk | Total |
| Futures Contracts | $ — | $158,689 | $158,689 |
| Forward Contracts | (65,950) | — | (65,950) |
| Total Net Realized Gain (Loss) | $(65,950) | $158,689 | $ 92,739 |
| Net Change in Unrealized Appreciation (Depreciation) | Foreign Exchange Contracts Risk | Interest Rate Contracts Risk | Total |
| Futures Contracts | $ — | $(34,263) | $ (34,263) |
| Forward Contracts | (83,876) | — | (83,876) |
| Total Net Change in Unrealized Appreciation (Depreciation) | $(83,876) | $(34,263) | $(118,139) |
| Average Notional Amount | Total |
| Futures Contracts Long (a) | $13,991,788 |
| Futures Contracts Short (a) | $ (2,935,717) |
| Forward Contracts Short (a) | $ (5,027,251) |
| (a) | Positions were open five months during the reporting period. |
| Class | Expense | Waived |
| Class A | $41,603 | $ — |
| Investor Class | 31,232 | (1,311) |
| Class B | 1,393 | (60) |
| Class C | 4,228 | (182) |
| Class I | 3,207 | — |
| Federal Tax Cost | Gross Unrealized Appreciation | Gross Unrealized (Depreciation) | Net Unrealized Appreciation/ (Depreciation) | |
| Investments in Securities | $73,632,199 | $214,407 | $(15,548,995) | $(15,334,588) |
| Capital Loss Available Through | Short-Term Capital Loss Amounts (000’s) | Long-Term Capital Loss Amounts (000’s) |
| Unlimited | $10,358 | $15,280 |
| 32 | MainStay Candriam Emerging Markets Debt Fund |
| 2022 | |
| Distributions paid from: | |
| Ordinary Income | $4,543,692 |
| Return of Capital | 348,479 |
| Total | $4,892,171 |
| Class A | Shares | Amount |
| Six-month period ended April 30, 2023: | ||
| Shares sold | 1,403,685 | $ 10,207,797 |
| Shares issued to shareholders in reinvestment of distributions | 241,644 | 1,760,830 |
| Shares redeemed | (2,120,514) | (15,480,843) |
| Net increase (decrease) in shares outstanding before conversion | (475,185) | (3,512,216) |
| Shares converted into Class A (See Note 1) | 31,743 | 230,702 |
| Shares converted from Class A (See Note 1) | (8,487) | (62,296) |
| Net increase (decrease) | (451,929) | $ (3,343,810) |
| Year ended October 31, 2022: | ||
| Shares sold | 1,316,634 | $ 10,780,850 |
| Shares issued to shareholders in reinvestment of distributions | 441,165 | 3,682,467 |
| Shares redeemed | (3,131,520) | (25,516,770) |
| Net increase (decrease) in shares outstanding before conversion | (1,373,721) | (11,053,453) |
| Shares converted into Class A (See Note 1) | 26,691 | 222,143 |
| Shares converted from Class A (See Note 1) | (813) | (7,369) |
| Net increase (decrease) | (1,347,843) | $(10,838,679) |
| Investor Class | Shares | Amount |
| Six-month period ended April 30, 2023: | ||
| Shares sold | 8,189 | $ 60,525 |
| Shares issued to shareholders in reinvestment of distributions | 41,914 | 309,132 |
| Shares redeemed | (66,843) | (495,977) |
| Net increase (decrease) in shares outstanding before conversion | (16,740) | (126,320) |
| Shares converted into Investor Class (See Note 1) | 13,437 | 99,382 |
| Shares converted from Investor Class (See Note 1) | (18,514) | (135,500) |
| Net increase (decrease) | (21,817) | $ (162,438) |
| Year ended October 31, 2022: | ||
| Shares sold | 24,505 | $ 206,699 |
| Shares issued to shareholders in reinvestment of distributions | 69,037 | 581,267 |
| Shares redeemed | (155,502) | (1,297,451) |
| Net increase (decrease) in shares outstanding before conversion | (61,960) | (509,485) |
| Shares converted into Investor Class (See Note 1) | 21,430 | 177,592 |
| Shares converted from Investor Class (See Note 1) | (15,482) | (131,527) |
| Net increase (decrease) | (56,012) | $ (463,420) |
| Class B | Shares | Amount |
| Six-month period ended April 30, 2023: | ||
| Shares sold | 95 | $ 674 |
| Shares issued to shareholders in reinvestment of distributions | 1,843 | 13,109 |
| Shares redeemed | (3,827) | (27,154) |
| Net increase (decrease) in shares outstanding before conversion | (1,889) | (13,371) |
| Shares converted from Class B (See Note 1) | (9,876) | (70,533) |
| Net increase (decrease) | (11,765) | $ (83,904) |
| Year ended October 31, 2022: | ||
| Shares sold | 1,003 | $ 8,854 |
| Shares issued to shareholders in reinvestment of distributions | 4,123 | 34,222 |
| Shares redeemed | (36,379) | (276,405) |
| Net increase (decrease) in shares outstanding before conversion | (31,253) | (233,329) |
| Shares converted from Class B (See Note 1) | (23,894) | (189,763) |
| Net increase (decrease) | (55,147) | $ (423,092) |
| Class C | Shares | Amount |
| Six-month period ended April 30, 2023: | ||
| Shares sold | 3,874 | $ 27,631 |
| Shares issued to shareholders in reinvestment of distributions | 5,907 | 42,071 |
| Shares redeemed | (38,424) | (274,329) |
| Net increase (decrease) in shares outstanding before conversion | (28,643) | (204,627) |
| Shares converted from Class C (See Note 1) | (20,761) | (147,044) |
| Net increase (decrease) | (49,404) | $ (351,671) |
| Year ended October 31, 2022: | ||
| Shares sold | 11,855 | $ 96,489 |
| Shares issued to shareholders in reinvestment of distributions | 13,736 | 114,445 |
| Shares redeemed | (182,507) | (1,497,503) |
| Net increase (decrease) in shares outstanding before conversion | (156,916) | (1,286,569) |
| Shares converted from Class C (See Note 1) | (9,547) | (78,445) |
| Net increase (decrease) | (166,463) | $ (1,365,014) |
| Class I | Shares | Amount |
| Six-month period ended April 30, 2023: | ||
| Shares sold | 34,565 | $ 251,643 |
| Shares issued to shareholders in reinvestment of distributions | 19,969 | 145,751 |
| Shares redeemed | (93,639) | (684,681) |
| Net increase (decrease) in shares outstanding before conversion | (39,105) | (287,287) |
| Shares converted into Class I (See Note 1) | 11,803 | 85,289 |
| Net increase (decrease) | (27,302) | $ (201,998) |
| Year ended October 31, 2022: | ||
| Shares sold | 238,664 | $ 1,864,518 |
| Shares issued to shareholders in reinvestment of distributions | 30,376 | 251,287 |
| Shares redeemed | (329,923) | (2,860,046) |
| Net increase (decrease) in shares outstanding before conversion | (60,883) | (744,241) |
| Shares converted into Class I (See Note 1) | 812 | 7,369 |
| Net increase (decrease) | (60,071) | $ (736,872) |
| 34 | MainStay Candriam Emerging Markets Debt Fund |
| 36 | MainStay Candriam Emerging Markets Debt Fund |
| 38 | MainStay Candriam Emerging Markets Debt Fund |
| 40 | MainStay Candriam Emerging Markets Debt Fund |
| 42 | MainStay Candriam Emerging Markets Debt Fund |
1.
| 2. | This Fund is registered for sale in CA, CT, DE, FL, MA, NJ, NY and VT. |
| 3. | An affiliate of New York Life Investment Management LLC. |
| 5022300MS043-23 | MSCEMD10-06/23 |
please log in to newyorklifeinvestments.com/accounts.
| Not FDIC/NCUA Insured | Not a Deposit | May Lose Value | No Bank Guarantee | Not Insured by Any Government Agency |


President

| Average Annual Total Returns for the Period-Ended April 30, 2023 | ||||||||
| Class | Sales Charge | Inception Date | Six Months1 | One Year | Five Years | Ten Years or Since Inception | Gross Expense Ratio2 | |
| Class A Shares3 | Maximum 3.00% Initial Sales Charge | With sales charges | 1/3/1995 | 4.45% | -3.20% | 2.71% | 4.19% | 1.02% |
| Excluding sales charges | 7.68 | -0.21 | 3.88 | 4.78 | 1.02 | |||
| Investor Class Shares4 | Maximum 2.50% Initial Sales Charge | With sales charges | 2/28/2008 | 4.86 | -2.91 | 2.53 | 4.01 | 1.20 |
| Excluding sales charges | 7.55 | -0.42 | 3.70 | 4.60 | 1.20 | |||
| Class B Shares5 | Maximum 5.00% CDSC | With sales charges | 12/29/1987 | 2.14 | -6.03 | 2.58 | 3.82 | 1.95 |
| if Redeemed Within the First Six Years of Purchase | Excluding sales charges | 7.14 | -1.17 | 2.93 | 3.82 | 1.95 | ||
| Class C Shares | Maximum 1.00% CDSC | With sales charges | 9/1/1998 | 6.16 | -2.15 | 2.92 | 3.82 | 1.95 |
| if Redeemed Within One Year of Purchase | Excluding sales charges | 7.16 | -1.18 | 2.92 | 3.82 | 1.95 | ||
| Class I Shares | No Sales Charge | 1/2/2004 | 7.78 | -0.01 | 4.13 | 5.04 | 0.77 | |
| Class R2 Shares | No Sales Charge | 2/27/2015 | 7.60 | -0.35 | 3.78 | 3.50 | 1.12 | |
| Class R3 Shares | No Sales Charge | 2/29/2016 | 7.44 | -0.61 | 3.50 | 5.08 | 1.37 | |
| Class R6 Shares | No Sales Charge | 2/28/2018 | 7.83 | 0.07 | 4.23 | 4.06 | 0.68 | |
| SIMPLE Class Shares | No Sales Charge | 8/31/2020 | 7.42 | -0.65 | N/A | 1.43 | 1.38 | |
| 1. | Not annualized. |
| 2. | The gross expense ratios presented reflect the Fund’s “Total Annual Fund Operating Expenses” from the most recent Prospectus, as supplemented, and may differ from other expense ratios disclosed in this report. |
| 3. | Prior to November 4, 2019, the maximum initial sales charge applicable was 5.50%, which is reflected in the applicable average annual total return figures shown. |
| 4. | Prior to June 30, 2020, the maximum initial sales charge was 3.00%, which is reflected in the applicable average annual total return figures shown. |
| 5. | Class B shares are closed to all new purchases as well as additional investments by existing Class B shareholders. |
| Benchmark Performance* | Six Months1 | One Year | Five Years | Ten Years |
| MSCI World Index (Net)2 | 12.26% | 3.18% | 8.14% | 8.71% |
| Bloomberg U.S. Aggregate Bond Index3 | 6.91 | -0.43 | 1.18 | 1.32 |
| Blended Benchmark Index4 | 10.14 | 1.99 | 5.65 | 5.94 |
| Morningstar Global Allocation Category Average5 | 8.65 | -0.75 | 3.26 | 3.94 |
| * | Returns for indices reflect no deductions for fees, expenses or taxes, except for foreign withholding taxes where applicable. Results assume reinvestment of all dividends and capital gains. An investment cannot be made directly in an index. |
| 1. | Not annualized. |
| 2. | The MSCI World Index (Net) is the Fund's primary broad-based securities market index for comparison purposes. The MSCI World Index (Net) is a free float-adjusted market capitalization weighted index that is designed to measure the equity market performance of developed markets. |
| 3. | The Fund has selected the Bloomberg U.S. Aggregate Bond Index as a secondary benchmark. The Bloomberg U.S. Aggregate Bond Index measures performance of the investment-grade, U.S. dollar-denominated, fixed-rate taxable bond market, including Treasurys, government-related and corporate securities, mortgage-backed securities (agency fixed-rate and hybrid adjustable-rate mortgage pass-throughs), asset-backed securities and commercial mortgage-backed securities. |
| 4. | The Fund has selected the Blended Benchmark Index as an additional benchmark. The Blended Benchmark Index consists of the 60% MSCI World Index and 40% of the Bloomberg U.S. Aggregate Bond Index, respectively. |
| 5. | Morningstar Global Allocation Category Average funds seek to provide both capital appreciation and income by investing in three major areas: stocks, bonds, and cash. While these funds do explore the whole world, most of them focus on the U.S., Canada, Japan, and the larger markets in Europe. It is rare for such funds to invest more than 10% of their assets in emerging markets. These funds typically have at least 10% of assets in bonds, less than 70% of assets in stocks, and at least 40% of assets in non-U.S. stocks or bonds. |
| 6 | MainStay Income Builder Fund |
| Share Class | Beginning Account Value 11/1/22 | Ending Account Value (Based on Actual Returns and Expenses) 4/30/23 | Expenses Paid During Period1 | Ending Account Value (Based on Hypothetical 5% Annualized Return and Actual Expenses) 4/30/23 | Expenses Paid During Period1 | Net Expense Ratio During Period2 |
| Class A Shares | $1,000.00 | $1,076.80 | $ 5.30 | $1,019.69 | $ 5.16 | 1.03% |
| Investor Class Shares | $1,000.00 | $1,075.50 | $ 6.54 | $1,018.50 | $ 6.36 | 1.27% |
| Class B Shares | $1,000.00 | $1,071.40 | $10.43 | $1,014.73 | $10.14 | 2.03% |
| Class C Shares | $1,000.00 | $1,071.60 | $10.43 | $1,014.73 | $10.14 | 2.03% |
| Class I Shares | $1,000.00 | $1,077.80 | $ 4.02 | $1,020.93 | $ 3.91 | 0.78% |
| Class R2 Shares | $1,000.00 | $1,076.00 | $ 5.82 | $1,019.19 | $ 5.66 | 1.13% |
| Class R3 Shares | $1,000.00 | $1,074.40 | $ 7.10 | $1,017.95 | $ 6.90 | 1.38% |
| Class R6 Shares | $1,000.00 | $1,078.30 | $ 3.56 | $1,021.37 | $ 3.46 | 0.69% |
| SIMPLE Class Shares | $1,000.00 | $1,074.20 | $ 7.25 | $1,017.80 | $ 7.05 | 1.41% |
| 1. | Expenses are equal to the Fund’s annualized expense ratio of each class multiplied by the average account value over the period, divided by 365 and multiplied by 181 (to reflect the six-month period). The table above represents the actual expenses incurred during the six-month period. In addition to the fees and expenses which the Fund bears directly, it also indirectly bears a pro rata share of the fees and expenses of the underlying funds in which it invests. Such indirect expenses are not included in the above-reported expense figures. |
| 2. | Expenses are equal to the Fund's annualized expense ratio to reflect the six-month period. |
| 1. | GNMA, (zero coupon)-7.993%, due 8/20/49–4/20/53 |
| 2. | U.S. Treasury Bonds, 3.875%, due 2/15/43 |
| 3. | UMBS, 30 Year, 3.50%-6.00%, due 8/1/48–3/1/53 |
| 4. | FHLMC STACR REMIC Trust, 6.665%-8.565%, due 8/25/33–12/25/50 |
| 5. | FNMA, (zero coupon)-10.77%, due 7/25/29–3/25/60 |
| 6. | Microsoft Corp. |
| 7. | Broadcom, Inc. |
| 8. | Analog Devices, Inc. |
| 9. | Apple, Inc. |
| 10. | JPMorgan Chase & Co. |
| 8 | MainStay Income Builder Fund |
| 1. | Effective May 9, 2023, Stephen R. Cianci no longer serves as a portfolio manager of the Fund. |
| 2. | See "Investment and Performance Comparison" for other share class returns, which may be higher or lower than Class I share returns, and for more information on benchmark and peer group returns. |
| 3. | Duration is a measure of the price sensitivity of a fixed-income investment to changes in interest rates. Duration is expressed as a number of years and is considered a more accurate sensitivity gauge than average maturity. |
| 4. | The yield curve is a line that plots the yields of various securities of similar quality—typically U.S. Treasury issues—across a range of maturities. The U.S. Treasury yield curve serves as a benchmark for other debt and is used in economic forecasting. |
| 10 | MainStay Income Builder Fund |
| 5. | The terms “spread” and “yield spread” may refer to the difference in yield between a security or type of security and comparable U.S. Treasury issues. The terms may also refer to the difference in yield between two specific securities or types of securities at a given time. The term “credit spread” typically refers to the difference in yield between corporate or municipal bonds (or a specific category of these bonds) and comparable U.S. Treasury issues. |
| 6. | The term “spread product” refers to asset classes that typically trade at a spread to comparable U.S. Treasury securities. |
| 7. | An obligation rated ‘BB’ by Standard & Poor’s (“S&P”) is deemed by S&P to be less vulnerable to nonpayment than other speculative issues. In the opinion of S&P, however, the obligor faces major ongoing uncertainties or exposure to adverse business, financial or economic conditions which could lead to the obligor’s inadequate capacity to meet its financial commitment on the obligation. When applied to Fund holdings, ratings are based solely on the creditworthiness of the bonds in the portfolio and are not meant to represent the security or safety of the Fund. Ratings from ‘AA’ to ‘CCC’ may be modified by the addition of a plus (+) or minus (–) sign to show relative standing within the major rating categories. |
| 8. | An obligation rated ‘BBB’ by S&P is deemed by S&P to exhibit adequate protection parameters. In the opinion of S&P, however, adverse economic conditions or changing circumstances are more likely to lead to a weakened capacity of the obligor to meet its financial commitment on the obligation. When applied to Fund holdings, ratings are based solely on the creditworthiness of the bonds in the portfolio and are not meant to represent the security or safety of the Fund. |
| 12 | MainStay Income Builder Fund |
| Principal Amount | Value | |
| Long-Term Bonds 42.7% | ||
| Asset-Backed Securities 4.5% | ||
| Automobile Asset-Backed Securities 1.4% | ||
| American Credit Acceptance Receivables Trust (a) | ||
| Series 2021-2, Class D | ||
| 1.34%, due 7/13/27 | $ 840,000 | $ 793,051 |
| Series 2021-3, Class D | ||
| 1.34%, due 11/15/27 | 1,665,000 | 1,556,385 |
| Series 2020-4, Class F | ||
| 5.22%, due 8/13/27 | 565,000 | 553,868 |
| Avis Budget Rental Car Funding AESOP LLC (a) | ||
| Series 2021-1A, Class A | ||
| 1.38%, due 8/20/27 | 1,530,000 | 1,368,055 |
| Series 2020-2A, Class A | ||
| 2.02%, due 2/20/27 | 660,000 | 607,662 |
| Series 2020-1A, Class A | ||
| 2.33%, due 8/20/26 | 635,000 | 596,478 |
| Series 2023-3A, Class A | ||
| 5.44%, due 2/22/28 | 1,065,000 | 1,073,181 |
| Carmax Auto Owner Trust | ||
| Series 2022-3, Class A3 | ||
| 3.97%, due 4/15/27 | 1,240,000 | 1,218,435 |
| Drive Auto Receivables Trust | ||
| Series 2021-2, Class D | ||
| 1.39%, due 3/15/29 | 1,200,000 | 1,126,722 |
| Flagship Credit Auto Trust (a) | ||
| Series 2021-1, Class D | ||
| 1.27%, due 3/15/27 | 1,220,000 | 1,120,756 |
| Series 2020-3, Class D | ||
| 2.50%, due 9/15/26 | 580,000 | 544,200 |
| Ford Credit Floorplan Master Owner Trust | ||
| Series 2018-4, Class A | ||
| 4.06%, due 11/15/30 | 875,000 | 848,326 |
| GLS Auto Receivables Issuer Trust | ||
| Series 2019-4A, Class D | ||
| 4.09%, due 8/17/26 (a) | 1,125,000 | 1,096,362 |
| Hertz Vehicle Financing III LP | ||
| Series 2021-2A, Class D | ||
| 4.34%, due 12/27/27 (a) | 2,070,000 | 1,786,523 |
| Hertz Vehicle Financing LLC | ||
| Series 2021-1A, Class B | ||
| 1.56%, due 12/26/25 (a) | 1,235,000 | 1,153,717 |
| JPMorgan Chase Bank NA | ||
| Series 2020-1, Class B | ||
| 0.991%, due 1/25/28 (a) | 64,811 | 64,194 |
| 15,507,915 | ||
| Principal Amount | Value | |
| Home Equity Asset-Backed Securities 0.0% ‡ | ||
| Equity One Mortgage Pass-Through Trust | ||
| Series 2003-3, Class AF4 | ||
| 5.495%, due 12/25/33 (b) | $ 7,823 | $ 7,782 |
| J.P. Morgan Mortgage Acquisition Trust | ||
| Series 2007-HE1, Class AF1 | ||
| 4.394% (1 Month LIBOR + 0.10%), due 3/25/47 (c) | 296,855 | 183,843 |
| Mastr Asset-Backed Securities Trust | ||
| Series 2006-HE4, Class A1 | ||
| 5.12% (1 Month LIBOR + 0.10%), due 11/25/36 (c) | 480,711 | 153,965 |
| 345,590 | ||
| Other Asset-Backed Securities 3.1% | ||
| American Airlines Pass-Through Trust | ||
| Series 2016-2, Class AA | ||
| 3.20%, due 6/15/28 | 489,260 | 446,780 |
| Series 2016-2, Class A | ||
| 3.65%, due 6/15/28 | 1,136,810 | 991,134 |
| AMSR Trust | ||
| Series 2020-SFR4, Class A | ||
| 1.355%, due 11/17/37 (a) | 2,643,000 | 2,409,501 |
| British Airways Pass-Through Trust | ||
| Series 2021-1, Class A | ||
| 2.90%, due 3/15/35 (United Kingdom) (a) | 1,929,245 | 1,646,402 |
| CF Hippolyta Issuer LLC (a) | ||
| Series 2021-1A, Class A1 | ||
| 1.53%, due 3/15/61 | 2,521,047 | 2,216,850 |
| Series 2020-1, Class A1 | ||
| 1.69%, due 7/15/60 | 1,236,746 | 1,122,214 |
| Series 2020-1, Class A2 | ||
| 1.99%, due 7/15/60 | 1,132,961 | 962,477 |
| Crown Castle Towers LLC | ||
| 4.241%, due 7/15/28 (a) | 1,680,000 | 1,596,667 |
| CVS Pass-Through Trust | ||
| 5.789%, due 1/10/26 (a) | 65,848 | 65,473 |
| DB Master Finance LLC (a) | ||
| Series 2021-1A, Class A23 | ||
| 2.791%, due 11/20/51 | 1,812,063 | 1,459,000 |
| Series 2019-1A, Class A23 | ||
| 4.352%, due 5/20/49 | 400,475 | 379,380 |
| FirstKey Homes Trust | ||
| Series 2020-SFR1, Class A | ||
| 1.339%, due 8/17/37 (a) | 2,465,220 | 2,255,296 |
| Principal Amount | Value | |
| Asset-Backed Securities (continued) | ||
| Other Asset-Backed Securities (continued) | ||
| Home Partners of America Trust (a) | ||
| Series 2021-2, Class A | ||
| 1.901%, due 12/17/26 | $ 660,812 | $ 588,594 |
| Series 2021-2, Class B | ||
| 2.302%, due 12/17/26 | 1,305,718 | 1,165,653 |
| Mosaic Solar Loan Trust | ||
| Series 2020-1A, Class A | ||
| 2.10%, due 4/20/46 (a) | 1,652,384 | 1,451,218 |
| Navient Private Education Refi Loan Trust (a) | ||
| Series 2021-BA, Class A | ||
| 0.94%, due 7/15/69 | 527,642 | 464,348 |
| Series 2020-EA, Class A | ||
| 1.69%, due 5/15/69 | 797,679 | 721,882 |
| Series 2021-EA, Class B | ||
| 2.03%, due 12/16/69 | 3,245,000 | 2,228,126 |
| New Economy Assets Phase 1 Sponsor LLC (a) | ||
| Series 2021-1, Class A1 | ||
| 1.91%, due 10/20/61 | 1,585,000 | 1,376,322 |
| Series 2021-1, Class B1 | ||
| 2.41%, due 10/20/61 | 1,535,000 | 1,294,039 |
| PFS Financing Corp. | ||
| Series 2022-D, Class A | ||
| 4.27%, due 8/15/27 (a) | 1,685,000 | 1,658,372 |
| Progress Residential Trust (a) | ||
| Series 2021-SFR1, Class A | ||
| 1.052%, due 4/17/38 | 1,556,542 | 1,379,131 |
| Series 2020-SFR3, Class A | ||
| 1.294%, due 10/17/27 | 1,578,462 | 1,443,666 |
| Series 2021-SFR4, Class B | ||
| 1.808%, due 5/17/38 | 1,780,000 | 1,581,056 |
| Taco Bell Funding LLC | ||
| Series 2021-1A, Class A23 | ||
| 2.542%, due 8/25/51 (a) | 1,412,125 | 1,112,512 |
| U.S. Airways Pass-Through Trust | ||
| Series 2012-1, Class A | ||
| 5.90%, due 10/1/24 | 902,109 | 897,746 |
| United Airlines Pass-Through Trust | ||
| Series 2020-1, Class A | ||
| 5.875%, due 10/15/27 | 1,415,806 | 1,415,534 |
| 34,329,373 | ||
| Total Asset-Backed Securities (Cost $55,516,718) | 50,182,878 | |
| Principal Amount | Value | |
| Corporate Bonds 17.7% | ||
| Agriculture 0.1% | ||
| BAT Capital Corp. | ||
| 3.734%, due 9/25/40 (United Kingdom) | $ 1,005,000 | $ 721,458 |
| BAT International Finance plc | ||
| 4.448%, due 3/16/28 (United Kingdom) | 615,000 | 590,768 |
| 1,312,226 | ||
| Airlines 0.6% | ||
| American Airlines, Inc. (a) | ||
| 5.50%, due 4/20/26 | 1,400,000 | 1,374,791 |
| 5.75%, due 4/20/29 | 850,000 | 807,742 |
| Delta Air Lines, Inc. (a) | ||
| 4.50%, due 10/20/25 | 900,000 | 882,594 |
| 4.75%, due 10/20/28 | 2,125,000 | 2,063,598 |
| Mileage Plus Holdings LLC | ||
| 6.50%, due 6/20/27 (a) | 1,581,000 | 1,578,471 |
| 6,707,196 | ||
| Auto Manufacturers 1.1% | ||
| Ford Motor Credit Co. LLC | ||
| 2.30%, due 2/10/25 | 200,000 | 186,198 |
| 2.70%, due 8/10/26 | 940,000 | 833,783 |
| 4.125%, due 8/17/27 | 1,050,000 | 963,437 |
| 6.80%, due 5/12/28 | 730,000 | 730,436 |
| 6.95%, due 3/6/26 | 660,000 | 666,057 |
| General Motors Financial Co., Inc. | ||
| 2.35%, due 1/8/31 | 810,000 | 639,504 |
| 2.70%, due 6/10/31 | 2,015,000 | 1,616,734 |
| 4.30%, due 4/6/29 | 1,125,000 | 1,048,468 |
| Hyundai Capital America | ||
| 5.80%, due 4/1/30 (a)(d) | 675,000 | 692,836 |
| Nissan Motor Acceptance Co. LLC (a) | ||
| 1.125%, due 9/16/24 | 1,935,000 | 1,799,088 |
| 1.85%, due 9/16/26 | 3,205,000 | 2,734,892 |
| Volkswagen Group of America Finance LLC | ||
| 4.60%, due 6/8/29 (Germany) (a) | 840,000 | 822,478 |
| 12,733,911 | ||
| Banks 6.1% | ||
| Banco Santander SA | ||
| 5.294%, due 8/18/27 (Spain) | 1,800,000 | 1,792,672 |
| Bank of America Corp. (e) | ||
| 2.087%, due 6/14/29 | 1,690,000 | 1,460,419 |
| 2.496%, due 2/13/31 | 1,600,000 | 1,350,730 |
| 2.572%, due 10/20/32 | 1,195,000 | 981,284 |
| 3.384%, due 4/2/26 | 1,115,000 | 1,075,188 |
| 14 | MainStay Income Builder Fund |
| Principal Amount | Value | |
| Corporate Bonds (continued) | ||
| Banks (continued) | ||
| Bank of America Corp. (e) (continued) | ||
| Series MM | ||
| 4.30%, due 1/28/25 (f) | $ 1,424,000 | $ 1,288,702 |
| Barclays plc (United Kingdom) (c)(f) | ||
| 4.375% (5 Year Treasury Constant Maturity Rate + 3.41%), due 3/15/28 | 2,000,000 | 1,324,844 |
| 8.00% (5 Year Treasury Constant Maturity Rate + 5.431%), due 3/15/29 | 1,035,000 | 906,556 |
| BNP Paribas SA (France) (a) | ||
| 3.052%, due 1/13/31 (e) | 1,170,000 | 1,011,870 |
| 4.625% (5 Year Treasury Constant Maturity Rate + 3.196%), due 1/12/27 (c)(f) | 1,450,000 | 1,138,105 |
| 4.625% (5 Year Treasury Constant Maturity Rate + 3.34%), due 2/25/31 (c)(f) | 2,090,000 | 1,482,646 |
| 7.75% (5 Year Treasury Constant Maturity Rate + 4.899%), due 8/16/29 (c)(f) | 550,000 | 525,250 |
| BPCE SA (France) (a) | ||
| 2.045%, due 10/19/27 (e) | 1,255,000 | 1,109,189 |
| 5.125%, due 1/18/28 | 910,000 | 911,444 |
| Citigroup, Inc. | ||
| 3.668%, due 7/24/28 (e) | 1,180,000 | 1,116,984 |
| 3.98%, due 3/20/30 (e) | 2,370,000 | 2,223,493 |
| Series Y | ||
| 4.15% (5 Year Treasury Constant Maturity Rate + 3.00%), due 11/15/26 (c)(f) | 1,760,000 | 1,447,600 |
| 6.625%, due 6/15/32 | 770,000 | 831,767 |
| Citizens Bank NA | ||
| 6.064%, due 10/24/25 (e) | 555,000 | 537,049 |
| Citizens Financial Group, Inc. | ||
| 2.638%, due 9/30/32 | 1,720,000 | 1,280,629 |
| Credit Agricole SA | ||
| 4.75% (5 Year Treasury Constant Maturity Rate + 3.237%), due 3/23/29 (France) (a)(c)(f) | 2,340,000 | 1,799,460 |
| Credit Suisse Group AG (Switzerland) (a)(e) | ||
| 3.091%, due 5/14/32 | 1,930,000 | 1,545,565 |
| 6.442%, due 8/11/28 | 365,000 | 361,248 |
| Deutsche Bank AG (Germany) | ||
| Series E | ||
| 0.962%, due 11/8/23 | 1,555,000 | 1,505,664 |
| Principal Amount | Value | |
| Banks (continued) | ||
| Deutsche Bank AG (Germany) (continued) | ||
| 3.035%, due 5/28/32 (e) | $ 600,000 | $ 478,594 |
| 5.371%, due 9/9/27 | 415,000 | 411,231 |
| 6.074% (SOFR + 1.219%), due 11/16/27 (c) | 1,945,000 | 1,748,944 |
| First Horizon Bank | ||
| 5.75%, due 5/1/30 | 1,555,000 | 1,469,758 |
| First Horizon Corp. | ||
| 4.00%, due 5/26/25 | 2,100,000 | 1,963,223 |
| Freedom Mortgage Corp. | ||
| 7.625%, due 5/1/26 (a) | 860,000 | 735,403 |
| Goldman Sachs Group, Inc. (The) | ||
| 1.431%, due 3/9/27 (e) | 1,255,000 | 1,126,706 |
| 1.948%, due 10/21/27 (e) | 1,435,000 | 1,285,029 |
| 1.992%, due 1/27/32 (e) | 1,165,000 | 932,772 |
| 6.75%, due 10/1/37 | 829,000 | 907,249 |
| HSBC Holdings plc | ||
| 3.973%, due 5/22/30 (United Kingdom) (e) | 1,350,000 | 1,242,045 |
| Intesa Sanpaolo SpA | ||
| 7.00%, due 11/21/25 (Italy) (a) | 585,000 | 597,712 |
| JPMorgan Chase & Co. | ||
| 2.182%, due 6/1/28 (e) | 1,800,000 | 1,616,842 |
| Series HH | ||
| 4.60%, due 2/1/25 (e)(f) | 647,000 | 600,092 |
| 6.03% (SOFR + 1.18%), due 2/24/28 (c)(d) | 1,995,000 | 1,997,021 |
| Lloyds Banking Group plc (United Kingdom) | ||
| 4.582%, due 12/10/25 | 1,038,000 | 993,631 |
| 4.65%, due 3/24/26 | 1,690,000 | 1,627,131 |
| 4.976% (1 Year Treasury Constant Maturity Rate + 2.30%), due 8/11/33 (c) | 870,000 | 843,418 |
| Macquarie Group Ltd. | ||
| 2.871%, due 1/14/33 (Australia) (a)(e) | 1,925,000 | 1,564,670 |
| Mizuho Financial Group, Inc. | ||
| 3.261% (1 Year Treasury Constant Maturity Rate + 1.25%), due 5/22/30 (Japan) (c) | 795,000 | 712,552 |
| Morgan Stanley | ||
| 2.484%, due 9/16/36 (e) | 2,115,000 | 1,625,612 |
| 2.511%, due 10/20/32 (e) | 1,530,000 | 1,259,596 |
| 5.00%, due 11/24/25 | 1,160,000 | 1,161,930 |
| Principal Amount | Value | |
| Corporate Bonds (continued) | ||
| Banks (continued) | ||
| NatWest Group plc | ||
| 3.073% (1 Year Treasury Constant Maturity Rate + 2.55%), due 5/22/28 (United Kingdom) (c) | $ 3,705,000 | $ 3,391,005 |
| Santander Holdings USA, Inc. | ||
| 6.499%, due 3/9/29 (e) | 735,000 | 738,802 |
| Societe Generale SA (France) (a)(c)(f) | ||
| 4.75% (5 Year Treasury Constant Maturity Rate + 3.931%), due 5/26/26 | 935,000 | 713,685 |
| 5.375% (5 Year Treasury Constant Maturity Rate + 4.514%), due 11/18/30 | 2,240,000 | 1,568,000 |
| Standard Chartered plc | ||
| 1.822% (1 Year Treasury Constant Maturity Rate + 0.95%), due 11/23/25 (United Kingdom) (a)(c) | 2,510,000 | 2,348,919 |
| UBS Group AG (Switzerland) (a)(c) | ||
| 4.375% (5 Year Treasury Constant Maturity Rate + 3.313%), due 2/10/31 (f) | 2,350,000 | 1,620,921 |
| 4.751% (1 Year Treasury Constant Maturity Rate + 1.75%), due 5/12/28 | 410,000 | 395,369 |
| Wachovia Corp. | ||
| 5.50%, due 8/1/35 | 315,000 | 316,810 |
| Wells Fargo & Co. | ||
| 3.35%, due 3/2/33 (e) | 935,000 | 816,124 |
| 4.90%, due 11/17/45 | 55,000 | 49,497 |
| Westpac Banking Corp. | ||
| 3.02% (5 Year Treasury Constant Maturity Rate + 1.53%), due 11/18/36 (Australia) (c) | 1,255,000 | 989,690 |
| 68,858,341 | ||
| Biotechnology 0.1% | ||
| Amgen, Inc. | ||
| 5.75%, due 3/2/63 | 540,000 | 559,306 |
| Chemicals 0.3% | ||
| Braskem Netherlands Finance BV | ||
| 4.50%, due 1/10/28 (Brazil) (a) | 1,535,000 | 1,404,753 |
| Huntsman International LLC | ||
| 4.50%, due 5/1/29 | 1,862,000 | 1,749,946 |
| 3,154,699 | ||
| Principal Amount | Value | |
| Commercial Services 0.1% | ||
| Ashtead Capital, Inc. | ||
| 4.00%, due 5/1/28 (United Kingdom) (a) | $ 935,000 | $ 877,248 |
| California Institute of Technology | ||
| 3.65%, due 9/1/19 | 898,000 | 637,592 |
| 1,514,840 | ||
| Computers 0.6% | ||
| Dell International LLC | ||
| 3.375%, due 12/15/41 (a) | 2,090,000 | 1,483,609 |
| 4.90%, due 10/1/26 | 1,199,000 | 1,199,597 |
| 5.30%, due 10/1/29 | 810,000 | 818,744 |
| 5.75%, due 2/1/33 (d) | 760,000 | 770,133 |
| 8.10%, due 7/15/36 | 1,242,000 | 1,457,919 |
| NCR Corp. | ||
| 5.00%, due 10/1/28 (a) | 1,756,000 | 1,531,534 |
| 7,261,536 | ||
| Diversified Financial Services 1.5% | ||
| AerCap Ireland Capital DAC | ||
| 2.45%, due 10/29/26 (Ireland) | 1,585,000 | 1,421,181 |
| Air Lease Corp. | ||
| 2.30%, due 2/1/25 | 1,915,000 | 1,811,802 |
| 4.25%, due 9/15/24 | 630,000 | 617,507 |
| Aircastle Ltd. | ||
| 5.25% (5 Year Treasury Constant Maturity Rate + 4.41%), due 6/15/26 (a)(c)(f) | 1,765,000 | 1,280,714 |
| Ally Financial, Inc. | ||
| 8.00%, due 11/1/31 | 1,685,000 | 1,777,366 |
| Aviation Capital Group LLC | ||
| 1.95%, due 1/30/26 (a) | 1,210,000 | 1,083,347 |
| Avolon Holdings Funding Ltd. (Ireland) (a) | ||
| 2.125%, due 2/21/26 | 1,515,000 | 1,346,976 |
| 2.875%, due 2/15/25 | 1,830,000 | 1,717,284 |
| Banco BTG Pactual SA (Brazil) (a) | ||
| 2.75%, due 1/11/26 | 2,170,000 | 1,975,785 |
| 4.50%, due 1/10/25 | 280,000 | 271,727 |
| Nomura Holdings, Inc. | ||
| 5.099%, due 7/3/25 (Japan) | 1,845,000 | 1,821,127 |
| OneMain Finance Corp. | ||
| 3.50%, due 1/15/27 | 885,000 | 755,896 |
| 6.125%, due 3/15/24 | 540,000 | 531,107 |
| Voya Financial, Inc. | ||
| 3.65%, due 6/15/26 | 690,000 | 662,321 |
| 17,074,140 | ||
| 16 | MainStay Income Builder Fund |
| Principal Amount | Value | |
| Corporate Bonds (continued) | ||
| Electric 1.9% | ||
| AEP Texas, Inc. | ||
| 4.70%, due 5/15/32 | $ 1,135,000 | $ 1,117,104 |
| Alabama Power Co. | ||
| 3.00%, due 3/15/52 | 785,000 | 539,835 |
| Arizona Public Service Co. | ||
| 2.20%, due 12/15/31 | 1,930,000 | 1,551,906 |
| Calpine Corp. | ||
| 5.125%, due 3/15/28 (a) | 615,000 | 568,081 |
| Duke Energy Carolinas LLC | ||
| 5.35%, due 1/15/53 | 675,000 | 708,256 |
| Duke Energy Progress LLC | ||
| 5.35%, due 3/15/53 | 845,000 | 879,086 |
| Duquesne Light Holdings, Inc. | ||
| 3.616%, due 8/1/27 (a) | 2,265,000 | 2,062,456 |
| Edison International | ||
| Series B | ||
| 5.00% (5 Year Treasury Constant Maturity Rate + 3.901%), due 12/15/26 (c)(f) | 2,140,000 | 1,829,305 |
| Entergy Louisiana LLC | ||
| 4.00%, due 3/15/33 | 1,615,000 | 1,529,649 |
| Florida Power & Light Co. | ||
| 5.30%, due 4/1/53 | 915,000 | 974,821 |
| Jersey Central Power & Light Co. | ||
| 2.75%, due 3/1/32 (a) | 1,655,000 | 1,403,930 |
| National Rural Utilities Cooperative Finance Corp. | ||
| 5.80%, due 1/15/33 | 1,065,000 | 1,147,161 |
| Nevada Power Co. | ||
| Series GG | ||
| 5.90%, due 5/1/53 | 530,000 | 594,347 |
| Ohio Power Co. | ||
| Series R | ||
| 2.90%, due 10/1/51 | 1,000,000 | 686,256 |
| Public Service Co. of Oklahoma | ||
| 5.25%, due 1/15/33 | 415,000 | 426,215 |
| Southern California Edison Co. | ||
| Series E | ||
| 3.70%, due 8/1/25 | 870,000 | 851,586 |
| 4.00%, due 4/1/47 | 1,320,000 | 1,090,959 |
| 5.70%, due 3/1/53 | 795,000 | 832,168 |
| Virginia Electric and Power Co. | ||
| 2.95%, due 11/15/51 | 1,035,000 | 711,915 |
| 5.45%, due 4/1/53 | 480,000 | 491,681 |
| Principal Amount | Value | |
| Electric (continued) | ||
| WEC Energy Group, Inc. | ||
| 6.976% (3 Month LIBOR + 2.113%), due 5/15/67 (c) | $ 1,095,000 | $ 900,201 |
| 20,896,918 | ||
| Entertainment 0.1% | ||
| Warnermedia Holdings, Inc. | ||
| 4.279%, due 3/15/32 (a) | 1,340,000 | 1,190,134 |
| Environmental Control 0.0% ‡ | ||
| Stericycle, Inc. | ||
| 3.875%, due 1/15/29 (a) | 280,000 | 251,916 |
| Food 0.2% | ||
| JBS USA LUX SA | ||
| 5.75%, due 4/1/33 (a) | 1,690,000 | 1,619,274 |
| Smithfield Foods, Inc. | ||
| 4.25%, due 2/1/27 (a) | 1,180,000 | 1,115,425 |
| 2,734,699 | ||
| Gas 0.2% | ||
| National Fuel Gas Co. | ||
| 2.95%, due 3/1/31 | 375,000 | 303,734 |
| Piedmont Natural Gas Co., Inc. | ||
| 5.05%, due 5/15/52 | 760,000 | 717,887 |
| Southern California Gas Co. | ||
| Series VV | ||
| 4.30%, due 1/15/49 | 845,000 | 743,861 |
| Southern Co. Gas Capital Corp. | ||
| Series 21A | ||
| 3.15%, due 9/30/51 | 1,180,000 | 816,775 |
| 2,582,257 | ||
| Insurance 0.6% | ||
| Peachtree Corners Funding Trust | ||
| 3.976%, due 2/15/25 (a) | 940,000 | 915,182 |
| Protective Life Corp. | ||
| 8.45%, due 10/15/39 | 1,195,000 | 1,445,691 |
| Reliance Standard Life Global Funding II | ||
| 2.50%, due 10/30/24 (a) | 2,420,000 | 2,305,266 |
| Willis North America, Inc. | ||
| 2.95%, due 9/15/29 | 1,735,000 | 1,535,964 |
| 3.875%, due 9/15/49 | 440,000 | 321,274 |
| 6,523,377 | ||
| Principal Amount | Value | |
| Corporate Bonds (continued) | ||
| Internet 0.0% ‡ | ||
| Expedia Group, Inc. | ||
| 5.00%, due 2/15/26 | $ 60,000 | $ 59,986 |
| Lodging 0.2% | ||
| Las Vegas Sands Corp. | ||
| 3.20%, due 8/8/24 | 1,415,000 | 1,370,450 |
| Sands China Ltd. | ||
| 5.625%, due 8/8/25 (Macao) (b) | 1,310,000 | 1,283,207 |
| 2,653,657 | ||
| Media 0.1% | ||
| CCO Holdings LLC | ||
| 4.75%, due 3/1/30 (a) | 335,000 | 288,233 |
| DISH DBS Corp. | ||
| 5.75%, due 12/1/28 (a) | 1,180,000 | 838,871 |
| Grupo Televisa SAB | ||
| 5.25%, due 5/24/49 (Mexico) | 350,000 | 328,372 |
| 1,455,476 | ||
| Mining 0.2% | ||
| Glencore Funding LLC | ||
| 1.625%, due 9/1/25 (Australia) (a) | 1,900,000 | 1,754,499 |
| Miscellaneous—Manufacturing 0.2% | ||
| Textron Financial Corp. | ||
| 6.599% (3 Month LIBOR + 1.735%), due 2/15/42 (a)(c) | 2,720,000 | 1,965,200 |
| Oil & Gas 0.1% | ||
| Gazprom PJSC Via Gaz Capital SA | ||
| 7.288%, due 8/16/37 (Russia) (a)(g) | 745,000 | 618,350 |
| Packaging & Containers 0.1% | ||
| Berry Global, Inc. | ||
| 4.875%, due 7/15/26 (a) | 200,000 | 195,557 |
| Owens-Brockway Glass Container, Inc. | ||
| 6.625%, due 5/13/27 (a)(d) | 731,000 | 733,558 |
| 929,115 | ||
| Pharmaceuticals 0.2% | ||
| Becton Dickinson & Co. | ||
| 4.669%, due 6/6/47 | 460,000 | 429,212 |
| Principal Amount | Value | |
| Pharmaceuticals (continued) | ||
| Teva Pharmaceutical Finance Netherlands III BV (Israel) | ||
| 3.15%, due 10/1/26 | $ 575,000 | $ 519,559 |
| 4.75%, due 5/9/27 | 1,335,000 | 1,250,276 |
| 2,199,047 | ||
| Pipelines 1.2% | ||
| Cheniere Corpus Christi Holdings LLC | ||
| 2.742%, due 12/31/39 | 1,580,000 | 1,295,792 |
| DT Midstream, Inc. | ||
| 4.30%, due 4/15/32 (a) | 1,375,000 | 1,245,555 |
| Enbridge, Inc. | ||
| 5.70%, due 3/8/33 (Canada) | 930,000 | 965,796 |
| Energy Transfer LP | ||
| 4.95%, due 6/15/28 | 415,000 | 413,202 |
| 5.35%, due 5/15/45 | 1,000,000 | 890,720 |
| EnLink Midstream LLC | ||
| 5.625%, due 1/15/28 (a) | 565,000 | 556,465 |
| Enterprise Products Operating LLC | ||
| 3.95%, due 1/31/60 | 1,460,000 | 1,138,002 |
| 4.20%, due 1/31/50 | 405,000 | 338,976 |
| Flex Intermediate Holdco LLC | ||
| 3.363%, due 6/30/31 (a) | 2,030,000 | 1,671,431 |
| Hess Midstream Operations LP (a) | ||
| 4.25%, due 2/15/30 | 320,000 | 284,509 |
| 5.50%, due 10/15/30 | 595,000 | 553,778 |
| Holly Energy Partners LP | ||
| 6.375%, due 4/15/27 (a) | 365,000 | 359,511 |
| MPLX LP | ||
| 2.65%, due 8/15/30 | 1,050,000 | 897,134 |
| Transcontinental Gas Pipe Line Co. LLC | ||
| 4.60%, due 3/15/48 | 2,070,000 | 1,824,438 |
| Western Midstream Operating LP | ||
| 5.50%, due 2/1/50 (b) | 860,000 | 729,601 |
| 13,164,910 | ||
| Real Estate Investment Trusts 0.9% | ||
| American Tower Corp. | ||
| 3.375%, due 10/15/26 (d) | 1,920,000 | 1,828,166 |
| 3.60%, due 1/15/28 | 1,025,000 | 970,949 |
| Digital Realty Trust LP | ||
| 4.45%, due 7/15/28 | 2,255,000 | 2,147,491 |
| GLP Capital LP | ||
| 3.35%, due 9/1/24 | 1,280,000 | 1,238,272 |
| Invitation Homes Operating Partnership LP | ||
| 2.00%, due 8/15/31 | 1,600,000 | 1,233,044 |
| 18 | MainStay Income Builder Fund |
| Principal Amount | Value | |
| Corporate Bonds (continued) | ||
| Real Estate Investment Trusts (continued) | ||
| Iron Mountain, Inc. | ||
| 5.25%, due 7/15/30 (a) | $ 830,000 | $ 764,452 |
| Starwood Property Trust, Inc. (a) | ||
| 3.75%, due 12/31/24 | 1,120,000 | 1,046,970 |
| 4.375%, due 1/15/27 | 940,000 | 810,496 |
| 10,039,840 | ||
| Retail 0.2% | ||
| AutoNation, Inc. | ||
| 4.75%, due 6/1/30 | 1,175,000 | 1,104,665 |
| Nordstrom, Inc. | ||
| 4.25%, due 8/1/31 | 1,260,000 | 935,676 |
| 2,040,341 | ||
| Software 0.1% | ||
| Fidelity National Information Services, Inc. | ||
| 5.10%, due 7/15/32 (d) | 655,000 | 645,130 |
| Telecommunications 0.7% | ||
| Altice France SA | ||
| 5.125%, due 7/15/29 (France) (a) | 2,100,000 | 1,552,626 |
| AT&T, Inc. | ||
| 3.50%, due 9/15/53 | 1,449,000 | 1,039,261 |
| 3.65%, due 9/15/59 | 880,000 | 622,661 |
| Sprint Spectrum Co. LLC | ||
| 4.738%, due 3/20/25 (a) | 1,807,506 | 1,795,526 |
| T-Mobile USA, Inc. | ||
| 2.625%, due 2/15/29 | 715,000 | 631,864 |
| Verizon Communications, Inc. | ||
| 5.964% (3 Month LIBOR + 1.10%), due 5/15/25 (c) | 2,705,000 | 2,722,644 |
| 8,364,582 | ||
| Total Corporate Bonds (Cost $223,847,238) | 199,245,629 | |
| Foreign Government Bonds 0.6% | ||
| Brazil 0.0% ‡ | ||
| Brazil Government Bond | ||
| 3.75%, due 9/12/31 (d) | 420,000 | 362,977 |
| Chile 0.1% | ||
| Empresa Nacional del Petroleo | ||
| 3.45%, due 9/16/31 (a) | 1,695,000 | 1,428,779 |
| Principal Amount | Value | |
| Colombia 0.2% | ||
| Colombia Government Bond | ||
| 3.25%, due 4/22/32 | $ 1,780,000 | $ 1,284,816 |
| 4.50%, due 1/28/26 (d) | 560,000 | 531,876 |
| 1,816,692 | ||
| Mexico 0.3% | ||
| Comision Federal de Electricidad | ||
| 3.875%, due 7/26/33 (a) | 2,755,000 | 2,125,758 |
| Mexico Government Bond | ||
| 3.75%, due 4/19/71 | 1,460,000 | 989,971 |
| 3,115,729 | ||
| Total Foreign Government Bonds (Cost $8,623,597) | 6,724,177 | |
| Loan Assignments 0.1% | ||
| Diversified/Conglomerate Service 0.1% | ||
| TruGreen LP (c) | ||
| First Lien Second Refinancing Term Loan | ||
| 9.082% (1 Month SOFR + 4.00%), due 11/2/27 | 750,510 | 690,094 |
| Second Lien Initial Term Loan | ||
| 13.773% (3 Month LIBOR + 8.50%), due 11/2/28 | 580,000 | 377,000 |
| 1,067,094 | ||
| Total Loan Assignments (Cost $1,317,308) | 1,067,094 | |
| Mortgage-Backed Securities 13.0% | ||
| Agency (Collateralized Mortgage Obligations) 5.7% | ||
| FHLMC | ||
| REMIC, Series 5021, Class SA | ||
| (zero coupon) (SOFR 30A + 3.55%), due 10/25/50 (c)(h) | 3,091,094 | 107,649 |
| REMIC, Series 5187, Class SA | ||
| (zero coupon) (SOFR 30A + 1.80%), due 1/25/52 (c)(h) | 2,374,706 | 33,418 |
| REMIC, Series 5200, Class SA | ||
| (zero coupon) (SOFR 30A + 3.50%), due 2/25/52 (c)(h) | 459,362 | 15,368 |
| REMIC, Series 4993, Class KS | ||
| 1.03% (1 Month LIBOR + 6.05%), due 7/25/50 (c)(h) | 3,374,075 | 510,752 |
| REMIC, Series 4994, Class TS | ||
| 1.08% (1 Month LIBOR + 6.10%), due 7/25/50 (c)(h) | 2,038,982 | 274,622 |
| Principal Amount | Value | |
| Mortgage-Backed Securities (continued) | ||
| Agency (Collateralized Mortgage Obligations) (continued) | ||
| FHLMC (continued) | ||
| REMIC, Series 4988, Class BA | ||
| 1.50%, due 6/25/50 | $ 478,957 | $ 376,166 |
| REMIC, Series 5038, Class KA | ||
| 1.50%, due 11/25/50 | 1,772,701 | 1,375,819 |
| REMIC, Series 5070, Class PI | ||
| 3.00%, due 8/25/50 (h) | 1,654,831 | 255,975 |
| REMIC, Series 5011, Class MI | ||
| 3.00%, due 9/25/50 (h) | 1,943,017 | 307,994 |
| REMIC, Series 5023, Class LI | ||
| 3.00%, due 10/25/50 (h) | 1,378,502 | 214,687 |
| REMIC, Series 5094, Class IP | ||
| 3.00%, due 4/25/51 (h) | 1,502,964 | 230,494 |
| REMIC, Series 5160 | ||
| 3.00%, due 10/25/51 (h) | 1,686,820 | 184,269 |
| REMIC, Series 5040 | ||
| 3.50%, due 11/25/50 (h) | 1,206,244 | 193,006 |
| REMIC, Series 5304, Class UB | ||
| 4.00%, due 2/25/52 | 1,439,347 | 1,397,072 |
| FHLMC, Strips | ||
| Series 311 | ||
| (zero coupon), due 8/15/43 | 692,525 | 533,830 |
| Series 311, Class S1 | ||
| 1.002% (1 Month LIBOR + 5.95%), due 8/15/43 (c)(h) | 1,975,074 | 230,266 |
| Series 389, Class C35 | ||
| 2.00%, due 6/15/52 (h) | 2,903,811 | 366,751 |
| FNMA | ||
| REMIC, Series 2022-5, Class SN | ||
| (zero coupon) (SOFR 30A + 1.80%), due 2/25/52 (c)(h) | 1,345,153 | 16,398 |
| REMIC, Series 2022-3, Class YS | ||
| (zero coupon) (SOFR 30A + 2.55%), due 2/25/52 (c)(h) | 9,584,090 | 147,364 |
| REMIC, Series 2021-40, Class SI | ||
| 0.93% (1 Month LIBOR + 5.95%), due 9/25/47 (c)(h) | 2,457,151 | 260,273 |
| REMIC, Series 2022-10, Class SA | ||
| 0.935% (SOFR 30A + 5.75%), due 2/25/52 (c)(h) | 1,964,652 | 271,273 |
| REMIC, Series 2016-57, Class SN | ||
| 1.03% (1 Month LIBOR + 6.05%), due 6/25/46 (c)(h) | 1,990,438 | 235,059 |
| REMIC, Series 2020-47, Class BD | ||
| 1.50%, due 7/25/50 | 427,983 | 336,183 |
| REMIC, Series 2021-12, Class JI | ||
| 2.50%, due 3/25/51 (h) | 1,359,349 | 201,399 |
| Principal Amount | Value | |
| Agency (Collateralized Mortgage Obligations) (continued) | ||
| FNMA (continued) | ||
| REMIC, Series 2021-10, Class LI | ||
| 2.50%, due 3/25/51 (h) | $ 924,015 | $ 134,640 |
| REMIC, Series 2021-34, Class MI | ||
| 2.50%, due 3/25/51 (h) | 3,861,307 | 469,309 |
| REMIC, Series 2021-54, Class HI | ||
| 2.50%, due 6/25/51 (h) | 619,262 | 75,908 |
| REMIC, Series 2013-77, Class CY | ||
| 3.00%, due 7/25/43 | 1,331,332 | 1,226,877 |
| REMIC, Series 2021-53, Class GI | ||
| 3.00%, due 7/25/48 (h) | 5,113,515 | 775,150 |
| REMIC, Series 2019-13, Class PE | ||
| 3.00%, due 3/25/49 | 760,877 | 704,681 |
| REMIC, Series 2021-85, Class BI | ||
| 3.00%, due 12/25/51 (h) | 3,763,278 | 613,310 |
| REMIC, Series 2021-12, Class GC | ||
| 3.50%, due 7/25/50 | 1,556,275 | 1,426,739 |
| REMIC, Series 2021-8, Class ID | ||
| 3.50%, due 3/25/51 (h) | 2,407,473 | 471,545 |
| REMIC, Series 2020-10, Class DA | ||
| 3.50%, due 3/25/60 | 1,497,942 | 1,415,365 |
| FNMA, Strips (h) | ||
| REMIC, Series 426, Class C32 | ||
| 1.50%, due 2/25/52 | 4,229,027 | 415,304 |
| REMIC, Series 427, Class C77 | ||
| 2.50%, due 9/25/51 | 3,504,740 | 515,863 |
| GNMA | ||
| Series 2019-136, Class YS | ||
| (zero coupon) (1 Month LIBOR + 2.83%), due 11/20/49 (c)(h) | 1,063,018 | 20,373 |
| Series 2020-1, Class YS | ||
| (zero coupon) (1 Month LIBOR + 2.83%), due 1/20/50 (c)(h) | 3,356,446 | 68,043 |
| Series 2021-77, Class SN | ||
| (zero coupon) (1 Month LIBOR + 2.60%), due 5/20/51 (c)(h) | 6,788,808 | 132,442 |
| Series 2021-97, Class SA | ||
| (zero coupon) (SOFR 30A + 2.60%), due 6/20/51 (c)(h) | 6,583,575 | 120,066 |
| Series 2021-136, Class SB | ||
| (zero coupon) (SOFR 30A + 3.20%), due 8/20/51 (c)(h) | 17,679,891 | 381,606 |
| Series 2021-158, Class SB | ||
| (zero coupon) (SOFR 30A + 3.70%), due 9/20/51 (c)(h) | 3,728,248 | 152,524 |
| Series 2021-205, Class DS | ||
| (zero coupon) (SOFR 30A + 3.20%), due 11/20/51 (c)(h) | 6,932,548 | 137,664 |
| 20 | MainStay Income Builder Fund |
| Principal Amount | Value | |
| Mortgage-Backed Securities (continued) | ||
| Agency (Collateralized Mortgage Obligations) (continued) | ||
| GNMA (continued) | ||
| Series 2022-19, Class SG | ||
| (zero coupon) (SOFR 30A + 2.45%), due 1/20/52 (c)(h) | $ 6,088,894 | $ 78,580 |
| Series 2022-24, Class SC | ||
| (zero coupon) (SOFR 30A + 2.37%), due 2/20/52 (c)(h) | 31,272,913 | 342,260 |
| Series 2023-56 | ||
| (zero coupon), due 7/20/52 | 1,690,000 | 1,499,981 |
| Series 2023-53 | ||
| (zero coupon), due 4/20/53 | 705,000 | 566,289 |
| Series 2020-97, Class HB | ||
| 1.00%, due 7/20/50 | 777,505 | 605,535 |
| Series 2020-146, Class YK | ||
| 1.00%, due 10/20/50 | 1,382,837 | 1,080,812 |
| Series 2020-166, Class CA | ||
| 1.00%, due 11/20/50 | 1,646,859 | 1,249,505 |
| Series 2020-34, Class SC | ||
| 1.097% (1 Month LIBOR + 6.05%), due 3/20/50 (c)(h) | 2,705,260 | 328,530 |
| Series 2020-146, Class SA | ||
| 1.347% (1 Month LIBOR + 6.30%), due 10/20/50 (c)(h) | 2,511,810 | 353,743 |
| Series 2021-179, Class SA | ||
| 1.347% (1 Month LIBOR + 6.30%), due 11/20/50 (c)(h) | 3,278,305 | 450,765 |
| Series 2020-167, Class SN | ||
| 1.347% (1 Month LIBOR + 6.30%), due 11/20/50 (c)(h) | 1,083,353 | 147,893 |
| Series 2020-189, Class NS | ||
| 1.347% (1 Month LIBOR + 6.30%), due 12/20/50 (c)(h) | 3,671,657 | 535,649 |
| Series 2020-189, Class SU | ||
| 1.347% (1 Month LIBOR + 6.30%), due 12/20/50 (c)(h) | 742,997 | 109,167 |
| Series 2021-57, Class SA | ||
| 1.347% (1 Month LIBOR + 6.30%), due 3/20/51 (c)(h) | 2,596,217 | 351,477 |
| Series 2021-57, Class SD | ||
| 1.347% (1 Month LIBOR + 6.30%), due 3/20/51 (c)(h) | 3,562,389 | 479,345 |
| Series 2021-46, Class TS | ||
| 1.347% (1 Month LIBOR + 6.30%), due 3/20/51 (c)(h) | 1,619,532 | 223,886 |
| Series 2021-96, Class NS | ||
| 1.347% (1 Month LIBOR + 6.30%), due 6/20/51 (c)(h) | 5,055,971 | 674,102 |
| Principal Amount | Value | |
| Agency (Collateralized Mortgage Obligations) (continued) | ||
| GNMA (continued) | ||
| Series 2021-96, Class SN | ||
| 1.347% (1 Month LIBOR + 6.30%), due 6/20/51 (c)(h) | $ 2,890,846 | $ 376,710 |
| Series 2021-122, Class HS | ||
| 1.347% (1 Month LIBOR + 6.30%), due 7/20/51 (c)(h) | 2,617,504 | 381,266 |
| Series 2022-137, Class S | ||
| 1.347% (1 Month LIBOR + 6.30%), due 7/20/51 (c)(h) | 2,983,961 | 397,723 |
| Series 2021-96, Class JS | ||
| 1.397% (1 Month LIBOR + 6.35%), due 6/20/51 (c)(h) | 2,323,779 | 267,661 |
| Series 2020-165, Class UD | ||
| 1.50%, due 11/20/50 | 594,022 | 489,632 |
| Series 2021-41, Class FS | ||
| 2.00% (SOFR 30A + 0.20%), due 10/20/50 (c)(h) | 3,609,854 | 347,635 |
| Series 2020-166, Class IC | ||
| 2.00%, due 11/20/50 (h) | 801,174 | 83,475 |
| Series 2020-188 | ||
| 2.00%, due 12/20/50 (h) | 3,838,538 | 402,453 |
| Series 2020-185, Class BI | ||
| 2.00%, due 12/20/50 (h) | 1,633,922 | 186,841 |
| Series 2022-10, Class IC | ||
| 2.00%, due 11/20/51 (h) | 2,340,602 | 284,754 |
| Series 2021-97, Class IN | ||
| 2.50%, due 8/20/49 (h) | 4,217,010 | 488,041 |
| Series 2019-159, Class P | ||
| 2.50%, due 9/20/49 | 1,425,859 | 1,264,629 |
| Series 2022-1, Class IA | ||
| 2.50%, due 6/20/50 (h) | 616,714 | 82,992 |
| Series 2020-122, Class IW | ||
| 2.50%, due 7/20/50 (h) | 2,056,264 | 270,718 |
| Series 2020-151, Class TI | ||
| 2.50%, due 10/20/50 (h) | 1,927,433 | 255,404 |
| Series 2020-173, Class EI | ||
| 2.50%, due 11/20/50 (h) | 2,152,565 | 295,883 |
| Series 2020-188, Class DI | ||
| 2.50%, due 12/20/50 (h) | 5,012,476 | 694,133 |
| Series 2021-1, Class PI | ||
| 2.50%, due 12/20/50 (h) | 1,018,840 | 130,927 |
| Series 2021-83, Class FM | ||
| 2.50% (SOFR 30A + 0.51%), due 5/20/51 (c) | 3,429,216 | 2,877,297 |
| Series 2021-188 | ||
| 2.50%, due 10/20/51 (h) | 4,006,070 | 630,959 |
| Principal Amount | Value | |
| Mortgage-Backed Securities (continued) | ||
| Agency (Collateralized Mortgage Obligations) (continued) | ||
| GNMA (continued) | ||
| Series 2021-177, Class CI | ||
| 2.50%, due 10/20/51 (h) | $ 2,213,824 | $ 293,324 |
| Series 2022-83 | ||
| 2.50%, due 11/20/51 (h) | 3,372,497 | 446,216 |
| Series 2021-1, Class IT | ||
| 3.00%, due 1/20/51 (h) | 2,310,993 | 346,546 |
| Series 2021-44, Class IQ | ||
| 3.00%, due 3/20/51 (h) | 3,832,021 | 574,556 |
| Series 2021-74, Class HI | ||
| 3.00%, due 4/20/51 (h) | 405,203 | 58,602 |
| Series 2021-97, Class FA | ||
| 3.00% (SOFR 30A + 0.40%), due 6/20/51 (c) | 802,388 | 695,682 |
| Series 2021-98, Class IN | ||
| 3.00%, due 6/20/51 (h) | 1,510,545 | 262,245 |
| Series 2021-98, Class KI | ||
| 3.00%, due 6/20/51 (h) | 4,097,481 | 649,605 |
| Series 2022-189, Class AT | ||
| 3.00%, due 7/20/51 | 2,386,627 | 2,148,840 |
| Series 2022-207 | ||
| 3.00%, due 8/20/51 (h) | 2,594,298 | 388,340 |
| Series 2021-139, Class IA | ||
| 3.00%, due 8/20/51 (h) | 5,224,456 | 818,527 |
| Series 2021-158, Class NI | ||
| 3.00%, due 9/20/51 (h) | 3,882,628 | 569,780 |
| Series 2021-177, Class IM | ||
| 3.00%, due 10/20/51 (h) | 3,441,365 | 465,084 |
| Series 2023-19, Class CI | ||
| 3.00%, due 11/20/51 (h) | 2,970,554 | 436,315 |
| Series 2022-207, Class NA | ||
| 3.00%, due 1/20/52 | 5,276,449 | 4,707,406 |
| Series 2022-206, Class CN | ||
| 3.00%, due 2/20/52 | 3,708,914 | 3,345,875 |
| Series 2023-1, Class MA | ||
| 3.50%, due 5/20/50 | 2,151,175 | 2,026,904 |
| Series 2021-146, Class IN | ||
| 3.50%, due 8/20/51 (h) | 2,557,243 | 398,099 |
| Series 2023-1, Class HD | ||
| 3.50%, due 1/20/52 | 2,829,396 | 2,660,402 |
| Series 2023-38, Class WT | ||
| 6.817%, due 12/20/51 (i) | 685,856 | 752,164 |
| Series 2023-59, Class YC | ||
| 6.897%, due 9/20/51 (i) | 1,515,000 | 1,683,041 |
| Series 2023-55, Class CG | ||
| 7.486%, due 7/20/51 (i) | 1,695,000 | 1,932,025 |
| Principal Amount | Value | |
| Agency (Collateralized Mortgage Obligations) (continued) | ||
| GNMA (continued) | ||
| Series 2023-55, Class LB | ||
| 7.993%, due 11/20/51 (i) | $ 1,900,000 | $ 2,207,226 |
| 64,486,952 | ||
| Commercial Mortgage Loans (Collateralized Mortgage Obligations) 3.3% | ||
| Bayview Commercial Asset Trust | ||
| Series 2006-4A, Class A1 | ||
| 5.365% (1 Month LIBOR + 0.345%), due 12/25/36 (a)(c) | 40,166 | 37,152 |
| Benchmark Mortgage Trust | ||
| Series 2020-B19, Class A2 | ||
| 1.691%, due 9/15/53 | 1,775,000 | 1,631,245 |
| BX Commercial Mortgage Trust (a) | ||
| Series 2020-VIV2, Class C | ||
| 3.66%, due 3/9/44 (j) | 2,325,000 | 1,934,684 |
| Series 2020-VIV3, Class B | ||
| 3.662%, due 3/9/44 (j) | 847,236 | 723,786 |
| Series 2020-VIVA, Class D | ||
| 3.667%, due 3/11/44 (j) | 675,000 | 545,120 |
| Series 2021-VOLT, Class C | ||
| 6.048% (1 Month LIBOR + 1.10%), due 9/15/36 (c) | 2,415,000 | 2,294,073 |
| BX Trust (a) | ||
| Series 2019-OC11, Class B | ||
| 3.605%, due 12/9/41 | 250,000 | 217,782 |
| Series 2019-OC11, Class C | ||
| 3.856%, due 12/9/41 | 570,000 | 491,744 |
| Series 2019-OC11, Class D | ||
| 4.075%, due 12/9/41 (j) | 975,000 | 825,604 |
| Series 2021-MFM1, Class C | ||
| 6.204% (1 Month SOFR + 1.314%), due 1/15/34 (c) | 764,087 | 735,304 |
| Series 2021-ARIA, Class E | ||
| 7.193% (1 Month LIBOR + 2.245%), due 10/15/36 (c) | 3,250,000 | 3,006,915 |
| BXHPP Trust | ||
| Series 2021-FILM, Class B | ||
| 5.848% (1 Month LIBOR + 0.90%), due 8/15/36 (a)(c) | 1,280,000 | 1,169,585 |
| Citigroup Commercial Mortgage Trust | ||
| Series 2016-GC36, Class A5 | ||
| 3.616%, due 2/10/49 | 560,000 | 533,804 |
| Extended Stay America Trust (a)(c) | ||
| Series 2021-ESH, Class C | ||
| 6.648% (1 Month LIBOR + 1.70%), due 7/15/38 | 2,259,885 | 2,180,649 |
| 22 | MainStay Income Builder Fund |
| Principal Amount | Value | |
| Mortgage-Backed Securities (continued) | ||
| Commercial Mortgage Loans (Collateralized Mortgage Obligations) (continued) | ||
| Extended Stay America Trust (a)(c) (continued) | ||
| Series 2021-ESH, Class D | ||
| 7.198% (1 Month LIBOR + 2.25%), due 7/15/38 | $ 1,557,027 | $ 1,494,637 |
| FREMF Mortgage Trust (a)(j) | ||
| Series 2019-K99, Class B | ||
| 3.765%, due 10/25/52 | 290,000 | 263,057 |
| Series 2019-K98, Class C | ||
| 3.863%, due 10/25/52 | 780,000 | 702,429 |
| Series 2017-K71, Class B | ||
| 3.881%, due 11/25/50 | 607,208 | 571,646 |
| Series 2019-K94, Class B | ||
| 4.101%, due 7/25/52 | 1,895,000 | 1,760,116 |
| Series 2018-K78, Class B | ||
| 4.267%, due 6/25/51 | 355,000 | 337,294 |
| Series 2018-K81, Class B | ||
| 4.315%, due 9/25/51 | 345,000 | 327,956 |
| Series 2018-K79, Class B | ||
| 4.351%, due 7/25/51 | 385,000 | 367,177 |
| Series 2018-K76, Class B | ||
| 4.352%, due 6/25/51 | 370,000 | 353,718 |
| Series 2018-K86, Class C | ||
| 4.437%, due 11/25/51 | 955,000 | 898,890 |
| Hudson Yards Mortgage Trust | ||
| Series 2019-30HY, Class A | ||
| 3.228%, due 7/10/39 (a) | 1,640,000 | 1,434,099 |
| Manhattan West Mortgage Trust | ||
| Series 2020-1MW, Class A | ||
| 2.13%, due 9/10/39 (a) | 2,910,000 | 2,517,463 |
| Morgan Stanley Bank of America Merrill Lynch Trust | ||
| Series 2016-C28, Class A4 | ||
| 3.544%, due 1/15/49 | 560,000 | 532,660 |
| Morgan Stanley Capital I Trust | ||
| Series 2015-UBS8, Class A4 | ||
| 3.809%, due 12/15/48 | 830,000 | 794,465 |
| Multifamily Connecticut Avenue Securities Trust (a)(c) | ||
| Series 2019-01, Class M10 | ||
| 8.27% (1 Month LIBOR + 3.25%), due 10/25/49 | 2,576,923 | 2,405,665 |
| Series 2020-01, Class M10 | ||
| 8.77% (1 Month LIBOR + 3.75%), due 3/25/50 | 455,000 | 427,729 |
| Principal Amount | Value | |
| Commercial Mortgage Loans (Collateralized Mortgage Obligations) (continued) | ||
| One Bryant Park Trust | ||
| Series 2019-OBP, Class A | ||
| 2.516%, due 9/15/54 (a) | $ 2,820,000 | $ 2,339,152 |
| SLG Office Trust (a) | ||
| Series 2021-OVA, Class A | ||
| 2.585%, due 7/15/41 | 540,000 | 439,022 |
| Series 2021-OVA, Class F | ||
| 2.851%, due 7/15/41 | 785,000 | 529,662 |
| Wells Fargo Commercial Mortgage Trust | ||
| Series 2018-AUS, Class A | ||
| 4.194%, due 8/17/36 (a)(j) | 1,745,000 | 1,587,141 |
| 36,411,425 | ||
| Whole Loan (Collateralized Mortgage Obligations) 4.0% | ||
| CIM Trust | ||
| Series 2021-J2, Class AIOS | ||
| 0.21%, due 4/25/51 (a)(h)(i) | 42,738,620 | 423,283 |
| FHLMC STACR REMIC Trust (a)(c) | ||
| Series 2022-DNA1, Class M1B | ||
| 6.665% (SOFR 30A + 1.85%), due 1/25/42 | 2,340,000 | 2,265,484 |
| Series 2020-DNA6, Class M2 | ||
| 6.815% (SOFR 30A + 2.00%), due 12/25/50 | 2,430,123 | 2,430,116 |
| Series 2021-HQA3, Class M2 | ||
| 6.915% (SOFR 30A + 2.10%), due 9/25/41 | 1,715,000 | 1,599,769 |
| Series 2021-HQA1, Class M2 | ||
| 7.065% (SOFR 30A + 2.25%), due 8/25/33 | 2,690,167 | 2,619,575 |
| Series 2022-DNA1, Class M2 | ||
| 7.315% (SOFR 30A + 2.50%), due 1/25/42 | 1,010,000 | 950,708 |
| Series 2022-DNA3, Class M1B | ||
| 7.715% (SOFR 30A + 2.90%), due 4/25/42 | 2,400,000 | 2,394,000 |
| Series 2021-HQA1, Class B1 | ||
| 7.815% (SOFR 30A + 3.00%), due 8/25/33 | 3,045,000 | 2,763,499 |
| Series 2021-DNA5, Class B1 | ||
| 7.865% (SOFR 30A + 3.05%), due 1/25/34 | 3,315,000 | 3,152,928 |
| Series 2021-HQA2, Class B1 | ||
| 7.965% (SOFR 30A + 3.15%), due 12/25/33 | 1,375,000 | 1,246,167 |
| Principal Amount | Value | |
| Mortgage-Backed Securities (continued) | ||
| Whole Loan (Collateralized Mortgage Obligations) (continued) | ||
| FHLMC STACR REMIC Trust (a)(c) (continued) | ||
| Series 2021-HQA3, Class B1 | ||
| 8.165% (SOFR 30A + 3.35%), due 9/25/41 | $ 2,615,000 | $ 2,443,404 |
| Series 2021-DNA6, Class B1 | ||
| 8.215% (SOFR 30A + 3.40%), due 10/25/41 | 450,000 | 439,033 |
| Series 2022-DNA2, Class M2 | ||
| 8.565% (SOFR 30A + 3.75%), due 2/25/42 | 2,120,000 | 2,077,600 |
| FHLMC STACR Trust (a)(c) | ||
| Series 2019-DNA3, Class B1 | ||
| 8.27% (1 Month LIBOR + 3.25%), due 7/25/49 | 695,000 | 713,554 |
| Series 2018-DNA2, Class B1 | ||
| 8.72% (1 Month LIBOR + 3.70%), due 12/25/30 | 1,340,000 | 1,383,442 |
| Series 2019-DNA1, Class B1 | ||
| 9.67% (1 Month LIBOR + 4.65%), due 1/25/49 | 2,055,000 | 2,215,378 |
| FHLMC Structured Agency Credit Risk Debt Notes | ||
| Series 2018-DNA1, Class B1 | ||
| 8.17% (1 Month LIBOR + 3.15%), due 7/25/30 (c) | 940,000 | 958,998 |
| Flagstar Mortgage Trust | ||
| Series 2021-6INV, Class A18 | ||
| 2.50%, due 8/25/51 (a)(i) | 99,492 | 78,637 |
| FNMA (c) | ||
| Series 2018-C01, Class 1B1 | ||
| 8.57% (1 Month LIBOR + 3.55%), due 7/25/30 | 2,640,000 | 2,814,703 |
| Series 2017-C05, Class 1B1 | ||
| 8.62% (1 Month LIBOR + 3.60%), due 1/25/30 | 2,299,558 | 2,425,705 |
| Series 2018-C03, Class 1B1 | ||
| 8.77% (1 Month LIBOR + 3.75%), due 10/25/30 | 1,435,000 | 1,538,848 |
| Series 2018-C04, Class 2B1 | ||
| 9.52% (1 Month LIBOR + 4.50%), due 12/25/30 | 1,280,000 | 1,386,150 |
| Series 2017-C01, Class 1B1 | ||
| 10.77% (1 Month LIBOR + 5.75%), due 7/25/29 | 500,000 | 563,534 |
| Principal Amount | Value | |
| Whole Loan (Collateralized Mortgage Obligations) (continued) | ||
| J.P. Morgan Mortgage Trust | ||
| Series 2021-LTV2, Class A1 | ||
| 2.519%, due 5/25/52 (a)(i) | $ 844,553 | $ 696,812 |
| New Residential Mortgage Loan Trust (a) | ||
| Series 2019-5A, Class B7 | ||
| 4.343%, due 8/25/59 (j) | 2,806,605 | 1,694,613 |
| Series 2019-2A, Class B6 | ||
| 4.862%, due 12/25/57 (i) | 939,242 | 612,696 |
| NewRez Warehouse Securitization Trust | ||
| Series 2021-1, Class A | ||
| 5.77% (1 Month LIBOR + 0.75%), due 5/25/55 (a)(c) | 793,000 | 784,860 |
| Sequoia Mortgage Trust | ||
| Series 2021-4, Class AIO1 | ||
| 0.169%, due 6/25/51 (a)(h)(j) | 28,125,338 | 235,038 |
| STACR Trust | ||
| Series 2018-HRP2, Class B1 | ||
| 9.22% (1 Month LIBOR + 4.20%), due 2/25/47 (a)(c) | 1,900,000 | 1,989,803 |
| 44,898,337 | ||
| Total Mortgage-Backed Securities (Cost $149,843,804) | 145,796,714 | |
| Municipal Bond 0.1% | ||
| California 0.1% | ||
| Regents of the University of California Medical Center, Pooled, Revenue Bonds | ||
| Series N | ||
| 3.006%, due 5/15/50 | 1,815,000 | 1,335,920 |
| Total Municipal Bond (Cost $1,815,000) | 1,335,920 | |
| U.S. Government & Federal Agencies 6.7% | ||
| Federal Home Loan Mortgage Corporation (Mortgage Pass-Through Securities) 0.8% | ||
| UMBS Pool, 30 Year | ||
| 3.50%, due 7/1/50 | 1,132,306 | 1,061,743 |
| 3.50%, due 7/1/52 | 1,690,461 | 1,571,167 |
| 4.50%, due 10/1/52 | 6,949,381 | 6,793,841 |
| 9,426,751 | ||
| 24 | MainStay Income Builder Fund |
| Principal Amount | Value | |
| U.S. Government & Federal Agencies (continued) | ||
| Federal National Mortgage Association (Mortgage Pass-Through Securities) 2.5% | ||
| UMBS, 30 Year | ||
| 3.50%, due 9/1/52 | $ 2,685,525 | $ 2,495,662 |
| 4.00%, due 8/1/48 | 1,605,405 | 1,558,518 |
| 4.00%, due 2/1/49 | 269,507 | 261,636 |
| 4.00%, due 6/1/52 | 2,048,612 | 1,958,372 |
| 4.00%, due 6/1/52 | 3,177,415 | 3,038,923 |
| 4.00%, due 6/1/52 | 1,471,947 | 1,407,789 |
| 5.00%, due 11/1/52 | 9,863,456 | 9,808,850 |
| 5.00%, due 3/1/53 | 1,920,554 | 1,909,669 |
| 5.00%, due 3/1/53 | 508,602 | 506,029 |
| 5.50%, due 11/1/52 | 751,402 | 757,634 |
| 5.50%, due 2/1/53 | 3,177,978 | 3,204,336 |
| 6.00%, due 3/1/53 | 1,276,306 | 1,300,155 |
| 28,207,573 | ||
| Government National Mortgage Association (Mortgage Pass-Through Securities) 0.0% ‡ | ||
| GNMA I, Single Family, 30 Year | ||
| 6.50%, due 4/15/29 | 7 | 7 |
| 6.50%, due 8/15/29 | 4 | 4 |
| 11 | ||
| United States Treasury Bonds 2.6% | ||
| U.S. Treasury Bonds | ||
| 3.875%, due 2/15/43 | 28,825,000 | 29,131,266 |
| United States Treasury Notes 0.8% | ||
| U.S. Treasury Notes | ||
| 3.50%, due 4/30/30 | 2,500,000 | 2,504,297 |
| 3.50%, due 2/15/33 | 3,555,000 | 3,576,107 |
| 3.875%, due 4/30/25 | 2,440,000 | 2,432,947 |
| 8,513,351 | ||
| Total U.S. Government & Federal Agencies (Cost $74,495,365) | 75,278,952 | |
| Total Long-Term Bonds (Cost $515,459,030) | 479,631,364 | |
| Shares | ||
| Common Stocks 54.8% | ||
| Aerospace & Defense 1.3% | ||
| BAE Systems plc (United Kingdom) | 352,593 | 4,493,250 |
| Lockheed Martin Corp. | 7,662 | 3,558,616 |
| Shares | Value | |
| Aerospace & Defense (continued) | ||
| Raytheon Technologies Corp. | 60,476 | $ 6,041,552 |
| 14,093,418 | ||
| Air Freight & Logistics 1.3% | ||
| Deutsche Post AG (Registered) (Germany) | 173,820 | 8,335,484 |
| Hyundai Glovis Co. Ltd. (Republic of Korea) | 5,595 | 684,326 |
| United Parcel Service, Inc., Class B | 28,345 | 5,096,714 |
| 14,116,524 | ||
| Automobile Components 0.7% | ||
| Bridgestone Corp. (Japan) | 104,900 | 4,186,915 |
| Cie Generale des Etablissements Michelin SCA (France) | 106,413 | 3,380,504 |
| 7,567,419 | ||
| Automobiles 0.3% | ||
| Toyota Motor Corp. (Japan) | 253,800 | 3,459,258 |
| Banks 3.7% | ||
| Bank of America Corp. | 213,958 | 6,264,690 |
| BAWAG Group AG (Austria) (a) | 86,525 | 4,210,298 |
| Columbia Banking System, Inc. | 231,302 | 4,940,611 |
| JPMorgan Chase & Co. | 60,826 | 8,408,586 |
| KeyCorp | 311,166 | 3,503,729 |
| PNC Financial Services Group, Inc. (The) | 27,769 | 3,616,912 |
| Royal Bank of Canada (Canada) | 31,299 | 3,107,376 |
| Truist Financial Corp. | 96,917 | 3,157,556 |
| U.S. Bancorp | 118,337 | 4,056,593 |
| 41,266,351 | ||
| Beverages 1.4% | ||
| Coca-Cola Co. (The) | 82,136 | 5,269,024 |
| Coca-Cola Europacific Partners plc (United Kingdom) | 170,018 | 10,961,061 |
| 16,230,085 | ||
| Biotechnology 0.6% | ||
| AbbVie, Inc. | 47,130 | 7,122,286 |
| Capital Markets 0.6% | ||
| Lazard Ltd., Class A | 107,906 | 3,377,458 |
| Schroders plc (United Kingdom) | 564,568 | 3,446,142 |
| 6,823,600 | ||
| Chemicals 2.5% | ||
| Air Products and Chemicals, Inc. | 15,185 | 4,469,856 |
| Shares | Value | |
| Common Stocks (continued) | ||
| Chemicals (continued) | ||
| Dow, Inc. | 62,990 | $ 3,426,656 |
| International Flavors & Fragrances, Inc. | 35,504 | 3,442,468 |
| Linde plc | 19,845 | 7,331,735 |
| LyondellBasell Industries NV, Class A | 46,252 | 4,375,902 |
| Nutrien Ltd. (Canada) | 74,890 | 5,197,366 |
| 28,243,983 | ||
| Commercial Services & Supplies 0.0% ‡ | ||
| Quad/Graphics, Inc. (k) | 10 | 35 |
| Communications Equipment 0.9% | ||
| Cisco Systems, Inc. | 219,752 | 10,383,282 |
| Construction & Engineering 0.4% | ||
| Vinci SA (France) | 39,775 | 4,917,510 |
| Consumer Staples Distribution & Retail 0.8% | ||
| Walmart, Inc. | 59,735 | 9,018,193 |
| Diversified REITs 0.3% | ||
| WP Carey, Inc. | 42,006 | 3,116,845 |
| Diversified Telecommunication Services 2.6% | ||
| AT&T, Inc. | 203,855 | 3,602,118 |
| Deutsche Telekom AG (Registered) (Germany) | 489,925 | 11,811,882 |
| Orange SA (France) | 406,697 | 5,295,215 |
| TELUS Corp. (Canada) | 169,801 | 3,599,428 |
| Verizon Communications, Inc. | 134,059 | 5,205,511 |
| 29,514,154 | ||
| Electric Utilities 2.9% | ||
| American Electric Power Co., Inc. | 81,304 | 7,514,116 |
| Duke Energy Corp. | 34,253 | 3,386,937 |
| Entergy Corp. | 38,172 | 4,106,544 |
| Evergy, Inc. | 75,030 | 4,660,113 |
| Fortis, Inc. (Canada) | 73,715 | 3,236,746 |
| NextEra Energy, Inc. | 83,577 | 6,404,505 |
| Pinnacle West Capital Corp. | 46,002 | 3,609,317 |
| 32,918,278 | ||
| Electrical Equipment 1.0% | ||
| Eaton Corp. plc | 36,791 | 6,148,512 |
| Emerson Electric Co. | 66,553 | 5,541,203 |
| 11,689,715 | ||
| Shares | Value | |
| Food Products 1.0% | ||
| Danone SA (France) (d) | 51,820 | $ 3,425,456 |
| Nestle SA (Registered) | 34,850 | 4,464,980 |
| Orkla ASA (Norway) | 532,702 | 3,828,918 |
| 11,719,354 | ||
| Gas Utilities 0.5% | ||
| China Resources Gas Group Ltd. (China) | 391,100 | 1,233,141 |
| Snam SpA (Italy) | 846,484 | 4,701,013 |
| 5,934,154 | ||
| Health Care Equipment & Supplies 0.8% | ||
| Medtronic plc | 101,421 | 9,224,240 |
| Health Care Providers & Services 1.1% | ||
| CVS Health Corp. | 45,090 | 3,305,548 |
| UnitedHealth Group, Inc. | 17,681 | 8,700,643 |
| 12,006,191 | ||
| Health Care REITs 0.4% | ||
| Welltower, Inc. | 50,023 | 3,962,822 |
| Hotels, Restaurants & Leisure 1.9% | ||
| McDonald's Corp. | 15,734 | 4,653,330 |
| Restaurant Brands International, Inc. (Canada) | 150,890 | 10,581,916 |
| Vail Resorts, Inc. | 26,519 | 6,378,350 |
| 21,613,596 | ||
| Household Durables 0.3% | ||
| Leggett & Platt, Inc. | 101,668 | 3,284,893 |
| Industrial Conglomerates 0.8% | ||
| Honeywell International, Inc. | 16,488 | 3,294,962 |
| Siemens AG (Registered) (Germany) | 35,001 | 5,742,716 |
| 9,037,678 | ||
| Insurance 2.9% | ||
| Allianz SE (Registered) (Germany) | 15,836 | 3,968,932 |
| AXA SA (France) | 216,466 | 7,053,151 |
| Manulife Financial Corp. (Canada) | 329,701 | 6,509,578 |
| MetLife, Inc. | 102,856 | 6,308,158 |
| Muenchener Rueckversicherungs-Gesellschaft AG (Registered) (Germany) | 12,647 | 4,745,116 |
| Travelers Cos., Inc. (The) | 18,628 | 3,374,276 |
| 31,959,211 | ||
| 26 | MainStay Income Builder Fund |
| Shares | Value | |
| Common Stocks (continued) | ||
| IT Services 1.0% | ||
| International Business Machines Corp. | 84,132 | $ 10,635,126 |
| Leisure Products 0.5% | ||
| Hasbro, Inc. | 85,723 | 5,076,516 |
| Machinery 0.5% | ||
| Cummins, Inc. | 23,372 | 5,493,355 |
| Media 0.9% | ||
| Comcast Corp., Class A | 134,517 | 5,564,968 |
| Omnicom Group, Inc. | 45,689 | 4,138,053 |
| 9,703,021 | ||
| Multi-Utilities 0.6% | ||
| NiSource, Inc. | 119,283 | 3,394,794 |
| WEC Energy Group, Inc. | 34,520 | 3,319,789 |
| 6,714,583 | ||
| Oil, Gas & Consumable Fuels 2.8% | ||
| Chevron Corp. | 21,624 | 3,645,374 |
| Enbridge, Inc. (Canada) | 93,470 | 3,716,447 |
| Enterprise Products Partners LP | 215,821 | 5,678,251 |
| Magellan Midstream Partners LP | 65,022 | 3,628,228 |
| MPLX LP | 117,782 | 4,121,192 |
| TotalEnergies SE (France) | 167,323 | 10,682,584 |
| 31,472,076 | ||
| Personal Care Products 0.3% | ||
| Unilever plc (United Kingdom) | 68,500 | 3,819,266 |
| Pharmaceuticals 5.6% | ||
| Astellas Pharma, Inc. (Japan) | 231,500 | 3,479,849 |
| AstraZeneca plc, Sponsored ADR (United Kingdom) | 126,776 | 9,282,539 |
| Bayer AG (Registered) (Germany) | 61,990 | 4,082,013 |
| Bristol-Myers Squibb Co. | 48,794 | 3,257,975 |
| Eli Lilly and Co. | 15,987 | 6,328,614 |
| GSK plc | 189,212 | 3,426,585 |
| Johnson & Johnson | 19,221 | 3,146,478 |
| Merck & Co., Inc. | 40,764 | 4,707,019 |
| Novartis AG (Registered) (Switzerland) | 97,575 | 9,947,989 |
| Pfizer, Inc. | 86,187 | 3,351,812 |
| Roche Holding AG | 12,316 | 3,862,830 |
| Sanofi | 76,831 | 8,466,008 |
| 63,339,711 | ||
| Shares | Value | |
| Retail REITs 0.4% | ||
| Realty Income Corp. | 66,613 | $ 4,185,961 |
| Semiconductors & Semiconductor Equipment 4.2% | ||
| Analog Devices, Inc. | 75,089 | 13,507,009 |
| Broadcom, Inc. | 21,931 | 13,739,772 |
| KLA Corp. | 19,863 | 7,677,844 |
| Taiwan Semiconductor Manufacturing Co. Ltd., Sponsored ADR (Taiwan) | 72,268 | 6,092,192 |
| Texas Instruments, Inc. | 38,433 | 6,425,998 |
| 47,442,815 | ||
| Software 1.3% | ||
| Microsoft Corp. | 48,130 | 14,788,424 |
| Specialized REITs 0.7% | ||
| Iron Mountain, Inc. | 135,541 | 7,487,285 |
| Specialty Retail 0.3% | ||
| Home Depot, Inc. (The) | 11,761 | 3,534,651 |
| Technology Hardware, Storage & Peripherals 2.3% | ||
| Apple, Inc. | 76,482 | 12,977,466 |
| Dell Technologies, Inc., Class C | 97,195 | 4,227,010 |
| NetApp, Inc. | 61,985 | 3,898,237 |
| Samsung Electronics Co. Ltd., GDR (Republic of Korea) | 3,436 | 4,240,024 |
| 25,342,737 | ||
| Tobacco 1.6% | ||
| British American Tobacco plc (United Kingdom) | 229,017 | 8,424,407 |
| Imperial Brands plc (United Kingdom) | 131,828 | 3,259,653 |
| Philip Morris International, Inc. | 66,324 | 6,630,410 |
| 18,314,470 | ||
| Trading Companies & Distributors 0.5% | ||
| MSC Industrial Direct Co., Inc., Class A | 58,644 | 5,320,770 |
| Wireless Telecommunication Services 0.3% | ||
| SK Telecom Co. Ltd. (Republic of Korea) | 87,465 | 3,117,215 |
| Total Common Stocks (Cost $492,894,640) | 615,011,057 | |
| Shares | Value | ||
| Short-Term Investments 1.3% | |||
| Affiliated Investment Company 0.7% | |||
| MainStay U.S. Government Liquidity Fund, 3.98% (l) | 8,349,914 | $ 8,349,914 | |
| Unaffiliated Investment Companies 0.6% | |||
| Goldman Sachs Financial Square Government Fund, 4.865% (l)(m) | 297,170 | 297,170 | |
| Invesco Government & Agency Portfolio, 4.857% (l)(m) | 6,315,262 | 6,315,262 | |
| Total Unaffiliated Investment Companies (Cost $6,612,432) | 6,612,432 | ||
| Total Short-Term Investments (Cost $14,962,346) | 14,962,346 | ||
| Total Investments (Cost $1,023,316,016) | 98.8% | 1,109,604,767 | |
| Other Assets, Less Liabilities | 1.2 | 13,580,144 | |
| Net Assets | 100.0% | $ 1,123,184,911 | |
| † | Percentages indicated are based on Fund net assets. |
| ^ | Industry classifications may be different than those used for compliance monitoring purposes. |
| ‡ | Less than one-tenth of a percent. |
| (a) | May be sold to institutional investors only under Rule 144A or securities offered pursuant to Section 4(a)(2) of the Securities Act of 1933, as amended. |
| (b) | Step coupon—Rate shown was the rate in effect as of April 30, 2023. |
| (c) | Floating rate—Rate shown was the rate in effect as of April 30, 2023. |
| (d) | All or a portion of this security was held on loan. As of April 30, 2023, the aggregate market value of securities on loan was $6,402,233. The Fund received cash collateral with a value of $6,612,432. (See Note 2(L)) |
| (e) | Fixed to floating rate—Rate shown was the rate in effect as of April 30, 2023. |
| (f) | Security is perpetual and, thus, does not have a predetermined maturity date. The date shown, if applicable, reflects the next call date. |
| (g) | Illiquid security—As of April 30, 2023, the total market value deemed illiquid under procedures approved by the Board of Trustees was $618,350, which represented 0.1% of the Fund’s net assets. |
| (h) | Collateralized Mortgage Obligation Interest Only Strip—Pays a fixed or variable rate of interest based on mortgage loans or mortgage pass-through securities. The principal amount of the underlying pool represents the notional amount on which the current interest was calculated. The value of these stripped securities may be particularly sensitive to changes in prevailing interest rates and are typically more sensitive to changes in prepayment rates than traditional mortgage-backed securities. |
| (i) | Coupon rate may change based on changes of the underlying collateral or prepayments of principal. Rate shown was the rate in effect as of April 30, 2023. |
| (j) | Collateral strip rate—A bond whose interest was based on the weighted net interest rate of the collateral. The coupon rate adjusts periodically based on a predetermined schedule. Rate shown was the rate in effect as of April 30, 2023. |
| (k) | Non-income producing security. |
| (l) | Current yield as of April 30, 2023. |
| (m) | Represents a security purchased with cash collateral received for securities on loan. |
| Affiliated Investment Companies | Value, Beginning of Period | Purchases at Cost | Proceeds from Sales | Net Realized Gain/(Loss) on Sales | Change in Unrealized Appreciation/ (Depreciation) | Value, End of Period | Dividend Income | Other Distributions | Shares End of Period |
| MainStay U.S. Government Liquidity Fund | $ 18,110 | $ 276,404 | $ (286,164) | $ — | $ — | $ 8,350 | $ 222 | $ — | 8,350 |
| 28 | MainStay Income Builder Fund |
| Currency Purchased | Currency Sold | Counterparty | Settlement Date | Unrealized Appreciation (Depreciation) | ||
| EUR | 13,249,000 | USD | 14,476,851 | JPMorgan Chase Bank N.A. | 5/9/23 | $ 128,648 |
| Total Unrealized Appreciation | 128,648 | |||||
| AUD | 23,293,000 | USD | 16,557,223 | JPMorgan Chase Bank N.A. | 5/9/23 | (1,139,890) |
| JPY | 2,564,705,000 | USD | 19,962,118 | JPMorgan Chase Bank N.A. | 5/9/23 | (1,117,932) |
| USD | 20,414,008 | EUR | 18,634,336 | JPMorgan Chase Bank N.A. | 5/9/23 | (128,204) |
| USD | 44,702 | GBP | 36,000 | JPMorgan Chase Bank N.A. | 5/9/23 | (549) |
| Total Unrealized Depreciation | (2,386,575) | |||||
| Net Unrealized Depreciation | $ (2,257,927) | |||||
| 1. | Foreign Currency Forward Contracts are subject to limitations such that they cannot be “sold or repurchased,” although the Fund would be able to exit the transaction through other means, such as through the execution of an offsetting transaction. |
| Type | Number of Contracts | Expiration Date | Value at Trade Date | Current Notional Amount | Unrealized Appreciation (Depreciation)2 |
| Long Contracts | |||||
| Russell 2000 E-Mini Index | 243 | June 2023 | $ 22,401,303 | $ 21,563,820 | $ (837,483) |
| S&P 500 E-Mini Index | 122 | June 2023 | 24,664,078 | 25,549,850 | 885,772 |
| U.S. Treasury 2 Year Notes | 236 | June 2023 | 48,167,404 | 48,654,719 | 487,315 |
| U.S. Treasury 5 Year Notes | 242 | June 2023 | 25,952,237 | 26,557,610 | 605,373 |
| U.S. Treasury 10 Year Notes | 407 | June 2023 | 45,936,436 | 46,887,672 | 951,236 |
| U.S. Treasury 10 Year Ultra Bonds | 333 | June 2023 | 39,262,346 | 40,443,891 | 1,181,545 |
| U.S. Treasury Ultra Bonds | 85 | June 2023 | 11,649,110 | 12,019,531 | 370,421 |
| E-Mini Materials Select Sector Index | 195 | June 2023 | 16,630,870 | 16,711,500 | 80,630 |
| E-Mini Energy Select Sector Index | 390 | June 2023 | 34,226,780 | 34,901,100 | 674,320 |
| E-Mini Health Care Select Sector Index | 118 | June 2023 | 15,020,563 | 15,987,820 | 967,257 |
| Yen Denominated Nikkei 225 Index | 472 | June 2023 | 48,793,042 | 50,345,627 | 1,552,585 |
| Total Long Contracts | 6,918,971 | ||||
| Short Contracts | |||||
| Euro STOXX 50 Index | (869) | June 2023 | (39,623,217) | (41,366,208) | (1,742,991) |
| FTSE 100 Index | (45) | June 2023 | (4,357,809) | (4,446,539) | (88,730) |
| S&P E-Mini Commercial Service Equity Index | (180) | June 2023 | (12,585,933) | (14,186,250) | (1,600,317) |
| U.S. Treasury Long Bonds | (12) | June 2023 | (1,594,471) | (1,579,875) | 14,596 |
| E-Mini Utilities Select Sector Index | (263) | June 2023 | (17,416,481) | (18,381,070) | (964,589) |
| Total Short Contracts | (4,382,031) | ||||
| Net Unrealized Appreciation | $ 2,536,940 |
| 1. | As of April 30, 2023, cash in the amount of $16,720,311 was on deposit with a broker or futures commission merchant for futures transactions. |
| 2. | Represents the difference between the value of the contracts at the time they were opened and the value as of April 30, 2023. |
| Abbreviation(s): |
| ADR—American Depositary Receipt |
| AUD—Australia Dollar |
| EUR—Euro |
| FHLMC—Federal Home Loan Mortgage Corp. |
| FNMA—Federal National Mortgage Association |
| FREMF—Freddie Mac Multifamily |
| FTSE—Financial Times Stock Exchange |
| GBP—British Pound Sterling |
| GDR—Global Depositary Receipt |
| GNMA—Government National Mortgage Association |
| JPY—Japanese Yen |
| LIBOR—London Interbank Offered Rate |
| REMIC—Real Estate Mortgage Investment Conduit |
| SOFR—Secured Overnight Financing Rate |
| UMBS—Uniform Mortgage Backed Securities |
| USD—United States Dollar |
| Description | Quoted Prices in Active Markets for Identical Assets (Level 1) | Significant Other Observable Inputs (Level 2) | Significant Unobservable Inputs (Level 3) | Total | |||
| Asset Valuation Inputs | |||||||
| Investments in Securities (a) | |||||||
| Long-Term Bonds | |||||||
| Asset-Backed Securities | $ — | $ 50,182,878 | $ — | $ 50,182,878 | |||
| Corporate Bonds | — | 199,245,629 | — | 199,245,629 | |||
| Foreign Government Bonds | — | 6,724,177 | — | 6,724,177 | |||
| Loan Assignments | — | 1,067,094 | — | 1,067,094 | |||
| Mortgage-Backed Securities | — | 145,796,714 | — | 145,796,714 | |||
| Municipal Bond | — | 1,335,920 | — | 1,335,920 | |||
| U.S. Government & Federal Agencies | — | 75,278,952 | — | 75,278,952 | |||
| Total Long-Term Bonds | — | 479,631,364 | — | 479,631,364 | |||
| Common Stocks | 615,011,057 | — | — | 615,011,057 | |||
| Short-Term Investments | |||||||
| Affiliated Investment Company | 8,349,914 | — | — | 8,349,914 | |||
| Unaffiliated Investment Companies | 6,612,432 | — | — | 6,612,432 | |||
| Total Short-Term Investments | 14,962,346 | — | — | 14,962,346 | |||
| Total Investments in Securities | 629,973,403 | 479,631,364 | — | 1,109,604,767 | |||
| Other Financial Instruments (b) | |||||||
| Foreign Currency Forward Contracts | — | 128,648 | — | 128,648 | |||
| Futures Contracts | 7,771,050 | — | — | 7,771,050 | |||
| Total Other Financial Instruments | 7,771,050 | 128,648 | — | 7,899,698 | |||
| Total Investments in Securities and Other Financial Instruments | $ 637,744,453 | $ 479,760,012 | $ — | $ 1,117,504,465 | |||
| Liability Valuation Inputs | |||||||
| Other Financial Instruments (b) | |||||||
| Foreign Currency Forward Contracts | $ — | $ (2,386,575) | $ — | $ (2,386,575) | |||
| Futures Contracts | (5,234,110) | — | — | (5,234,110) | |||
| Total Other Financial Instruments | $ (5,234,110) | $ (2,386,575) | $ — | $ (7,620,685) |
| (a) | For a complete listing of investments and their industries, see the Portfolio of Investments. |
| (b) | The value listed for these securities reflects unrealized appreciation (depreciation) as shown on the Portfolio of Investments. |
| 30 | MainStay Income Builder Fund |
| Assets | |
| Investment in unaffiliated securities, at value (identified cost $1,014,966,102) including securities on loan of $6,402,233 | $1,101,254,853 |
| Investment in affiliated investment companies, at value (identified cost $8,349,914) | 8,349,914 |
| Cash | 132,632 |
| Cash denominated in foreign currencies (identified cost $888,563) | 887,988 |
| Cash collateral on deposit at broker for futures contracts | 16,720,311 |
| Receivables: | |
| Investment securities sold | 7,099,043 |
| Dividends and interest | 5,982,645 |
| Variation margin on futures contracts | 2,446,375 |
| Fund shares sold | 685,856 |
| Securities lending | 16,529 |
| Unrealized appreciation on foreign currency forward contracts | 128,648 |
| Other assets | 141,971 |
| Total assets | 1,143,846,765 |
| Liabilities | |
| Cash collateral received for securities on loan | 6,612,432 |
| Due to custodian | 13,350 |
| Payables: | |
| Investment securities purchased | 9,190,487 |
| Fund shares redeemed | 950,642 |
| Manager (See Note 3) | 579,719 |
| Transfer agent (See Note 3) | 277,034 |
| NYLIFE Distributors (See Note 3) | 213,189 |
| Shareholder communication | 160,366 |
| Professional fees | 43,777 |
| Custodian | 20,128 |
| Trustees | 1,072 |
| Accrued expenses | 27,395 |
| Distributions payable | 185,688 |
| Unrealized depreciation on foreign currency forward contracts | 2,386,575 |
| Total liabilities | 20,661,854 |
| Net assets | $1,123,184,911 |
| Composition of Net Assets | |
| Shares of beneficial interest outstanding (par value of $.01 per share) unlimited number of shares authorized | $ 621,091 |
| Additional paid-in-capital | 1,157,047,958 |
| 1,157,669,049 | |
| Total distributable earnings (loss) | (34,484,138) |
| Net assets | $1,123,184,911 |
| Class A | |
| Net assets applicable to outstanding shares | $671,781,829 |
| Shares of beneficial interest outstanding | 37,286,753 |
| Net asset value per share outstanding | $ 18.02 |
| Maximum sales charge (3.00% of offering price) | 0.56 |
| Maximum offering price per share outstanding | $ 18.58 |
| Investor Class | |
| Net assets applicable to outstanding shares | $ 62,873,440 |
| Shares of beneficial interest outstanding | 3,486,065 |
| Net asset value per share outstanding | $ 18.04 |
| Maximum sales charge (2.50% of offering price) | 0.46 |
| Maximum offering price per share outstanding | $ 18.50 |
| Class B | |
| Net assets applicable to outstanding shares | $ 6,579,426 |
| Shares of beneficial interest outstanding | 361,964 |
| Net asset value and offering price per share outstanding | $ 18.18 |
| Class C | |
| Net assets applicable to outstanding shares | $ 66,679,291 |
| Shares of beneficial interest outstanding | 3,676,258 |
| Net asset value and offering price per share outstanding | $ 18.14 |
| Class I | |
| Net assets applicable to outstanding shares | $309,044,715 |
| Shares of beneficial interest outstanding | 16,954,358 |
| Net asset value and offering price per share outstanding | $ 18.23 |
| Class R2 | |
| Net assets applicable to outstanding shares | $ 952,440 |
| Shares of beneficial interest outstanding | 52,844 |
| Net asset value and offering price per share outstanding | $ 18.02 |
| Class R3 | |
| Net assets applicable to outstanding shares | $ 2,447,379 |
| Shares of beneficial interest outstanding | 135,861 |
| Net asset value and offering price per share outstanding | $ 18.01 |
| Class R6 | |
| Net assets applicable to outstanding shares | $ 2,791,516 |
| Shares of beneficial interest outstanding | 153,102 |
| Net asset value and offering price per share outstanding | $ 18.23 |
| SIMPLE Class | |
| Net assets applicable to outstanding shares | $ 34,875 |
| Shares of beneficial interest outstanding | 1,934 |
| Net asset value and offering price per share outstanding | $ 18.03 |
| Investment Income (Loss) | |
| Income | |
| Interest | $ 12,011,817 |
| Dividends-unaffiliated (net of foreign tax withholding of $431,197) | 11,031,292 |
| Dividends-affiliated | 222,010 |
| Securities lending, net | 101,675 |
| Total income | 23,366,794 |
| Expenses | |
| Manager (See Note 3) | 3,656,141 |
| Distribution/Service—Class A (See Note 3) | 839,083 |
| Distribution/Service—Investor Class (See Note 3) | 78,122 |
| Distribution/Service—Class B (See Note 3) | 38,223 |
| Distribution/Service—Class C (See Note 3) | 367,653 |
| Distribution/Service—Class R2 (See Note 3) | 2,027 |
| Distribution/Service—Class R3 (See Note 3) | 5,908 |
| Distribution/Service—SIMPLE Class (See Note 3) | 88 |
| Transfer agent (See Note 3) | 781,311 |
| Professional fees | 87,149 |
| Registration | 72,127 |
| Custodian | 58,207 |
| Shareholder communication | 35,961 |
| Trustees | 15,358 |
| Shareholder service (See Note 3) | 1,993 |
| Miscellaneous | 28,576 |
| Total expenses before waiver/reimbursement | 6,067,927 |
| Expense waiver/reimbursement from Manager (See Note 3) | (4,900) |
| Reimbursement from prior custodian(a) | (2,293) |
| Net expenses | 6,060,734 |
| Net investment income (loss) | 17,306,060 |
| Realized and Unrealized Gain (Loss) | |
| Net realized gain (loss) on: | |
| Unaffiliated investment transactions | (15,408,966) |
| Futures transactions | (15,325,987) |
| Foreign currency transactions | (278,227) |
| Foreign currency forward transactions | (55,806) |
| Net realized gain (loss) | (31,068,986) |
| Net change in unrealized appreciation (depreciation) on: | |
| Unaffiliated investments | 98,867,528 |
| Futures contracts | 3,104,437 |
| Foreign currency forward contracts | (162,760) |
| Translation of other assets and liabilities in foreign currencies | 1,264,603 |
| Net change in unrealized appreciation (depreciation) | 103,073,808 |
| Net realized and unrealized gain (loss) | 72,004,822 |
| Net increase (decrease) in net assets resulting from operations | $ 89,310,882 |
| (a) | Represents a refund for overbilling of custody fees. |
| 32 | MainStay Income Builder Fund |
for the six months ended April 30, 2023 (Unaudited) and the year ended October 31, 2022
| Six months ended April 30, 2023 | Year ended October 31, 2022 | |
| Increase (Decrease) in Net Assets | ||
| Operations: | ||
| Net investment income (loss) | $ 17,306,060 | $ 33,092,042 |
| Net realized gain (loss) | (31,068,986) | (82,264,026) |
| Net change in unrealized appreciation (depreciation) | 103,073,808 | (202,526,363) |
| Net increase (decrease) in net assets resulting from operations | 89,310,882 | (251,698,347) |
| Distributions to shareholders: | ||
| Class A | (9,495,869) | (59,730,525) |
| Investor Class | (807,019) | (5,452,199) |
| Class B | (67,739) | (979,036) |
| Class C | (651,837) | (8,023,824) |
| Class I | (4,863,850) | (35,876,071) |
| Class R2 | (19,717) | (207,016) |
| Class R3 | (29,582) | (151,022) |
| Class R6 | (328,858) | (8,154,514) |
| SIMPLE Class | (426) | (2,491) |
| (16,264,897) | (118,576,698) | |
| Distributions to shareholders from return of capital: | ||
| Class A | — | (465,612) |
| Investor Class | — | (42,501) |
| Class B | — | (7,632) |
| Class C | — | (62,547) |
| Class I | — | (279,661) |
| Class R2 | — | (1,614) |
| Class R3 | — | (1,177) |
| Class R6 | — | (63,566) |
| SIMPLE Class | — | (19) |
| — | (924,329) | |
| Total distributions to shareholders | (16,264,897) | (119,501,027) |
| Capital share transactions: | ||
| Net proceeds from sales of shares | 51,584,651 | 167,690,377 |
| Net asset value of shares issued to shareholders in reinvestment of distributions | 15,066,142 | 110,787,284 |
| Cost of shares redeemed | (261,100,889) | (328,996,310) |
| Increase (decrease) in net assets derived from capital share transactions | (194,450,096) | (50,518,649) |
| Net increase (decrease) in net assets | (121,404,111) | (421,718,023) |
| Six months ended April 30, 2023 | Year ended October 31, 2022 | |
| Net Assets | ||
| Beginning of period | $1,244,589,022 | $1,666,307,045 |
| End of period | $1,123,184,911 | $1,244,589,022 |
| Six months ended April 30, 2023* | Year Ended October 31, | ||||||||||
| Class A | 2022 | 2021 | 2020 | 2019 | 2018 | ||||||
| Net asset value at beginning of period | $ 16.97 | $ 21.75 | $ 18.61 | $ 19.96 | $ 18.51 | $ 19.97 | |||||
| Net investment income (loss) (a) | 0.26 | 0.42 | 0.43 | 0.44 | 0.54 | 0.52 | |||||
| Net realized and unrealized gain (loss) | 1.04 | (3.63) | 3.22 | (0.61) | 1.79 | (0.97) | |||||
| Total from investment operations | 1.30 | (3.21) | 3.65 | (0.17) | 2.33 | (0.45) | |||||
| Less distributions: | |||||||||||
| From net investment income | (0.25) | (0.42) | (0.51) | (0.42) | (0.56) | (0.52) | |||||
| From net realized gain on investments | — | (1.14) | — | (0.76) | (0.32) | (0.49) | |||||
| Return of capital | — | (0.01) | — | — | — | — | |||||
| Total distributions | (0.25) | (1.57) | (0.51) | (1.18) | (0.88) | (1.01) | |||||
| Net asset value at end of period | $ 18.02 | $ 16.97 | $ 21.75 | $ 18.61 | $ 19.96 | $ 18.51 | |||||
| Total investment return (b) | 7.68% | (15.75)% | 19.74% | (0.90)% | 13.09% | (2.38)% | |||||
| Ratios (to average net assets)/Supplemental Data: | |||||||||||
| Net investment income (loss) | 2.97%†† | 2.24% | 2.04% | 2.32% | 2.83% | 2.72% | |||||
| Net expenses (c) | 1.03%†† | 1.02% | 0.99% | 1.02% | 1.02% | 1.01% | |||||
| Portfolio turnover rate | 29% | 61% | 57%(d) | 65%(d) | 62%(d) | 44%(d) | |||||
| Net assets at end of period (in 000’s) | $ 671,782 | $ 664,734 | $ 818,764 | $ 638,250 | $ 625,049 | $ 571,206 | |||||
| * | Unaudited. |
| †† | Annualized. |
| (a) | Per share data based on average shares outstanding during the period. |
| (b) | Total investment return is calculated exclusive of sales charges and assumes the reinvestment of dividends and distributions. For periods of less than one year, total return is not annualized. |
| (c) | In addition to the fees and expenses which the Fund bears directly, it also indirectly bears a pro-rata share of the fees and expenses of the underlying funds in which it invests. Such indirect expenses are not included in the above expense ratios. |
| (d) | The portfolio turnover rates not including mortgage dollar rolls were 56%, 62%, 54% and 36% for the years ended October 31, 2021, 2020, 2019 and 2018, respectively. |
| 34 | MainStay Income Builder Fund |
| Six months ended April 30, 2023* | Year Ended October 31, | ||||||||||
| Investor Class | 2022 | 2021 | 2020 | 2019 | 2018 | ||||||
| Net asset value at beginning of period | $ 16.99 | $ 21.77 | $ 18.62 | $ 19.98 | $ 18.52 | $ 19.99 | |||||
| Net investment income (loss) (a) | 0.24 | 0.39 | 0.40 | 0.41 | 0.51 | 0.50 | |||||
| Net realized and unrealized gain (loss) | 1.04 | (3.63) | 3.22 | (0.62) | 1.80 | (0.98) | |||||
| Total from investment operations | 1.28 | (3.24) | 3.62 | (0.21) | 2.31 | (0.48) | |||||
| Less distributions: | |||||||||||
| From net investment income | (0.23) | (0.39) | (0.47) | (0.39) | (0.53) | (0.50) | |||||
| From net realized gain on investments | — | (1.14) | — | (0.76) | (0.32) | (0.49) | |||||
| Return of capital | — | (0.01) | — | — | — | — | |||||
| Total distributions | (0.23) | (1.54) | (0.47) | (1.15) | (0.85) | (0.99) | |||||
| Net asset value at end of period | $ 18.04 | $ 16.99 | $ 21.77 | $ 18.62 | $ 19.98 | $ 18.52 | |||||
| Total investment return (b) | 7.55% | (15.89)% | 19.56% | (1.11)% | 12.98% | (2.56)% | |||||
| Ratios (to average net assets)/Supplemental Data: | |||||||||||
| Net investment income (loss) | 2.73%†† | 2.05% | 1.88% | 2.16% | 2.70% | 2.59% | |||||
| Net expenses (c) | 1.27%†† | 1.20% | 1.18% | 1.17% | 1.16% | 1.13% | |||||
| Expenses (before waiver/reimbursement) (c) | 1.28%†† | 1.20% | 1.18% | 1.17% | 1.17% | 1.14% | |||||
| Portfolio turnover rate | 29% | 61% | 57%(d) | 65%(d) | 62%(d) | 44%(d) | |||||
| Net assets at end of period (in 000's) | $ 62,873 | $ 60,808 | $ 77,887 | $ 79,992 | $ 88,050 | $ 85,132 | |||||
| * | Unaudited. |
| †† | Annualized. |
| (a) | Per share data based on average shares outstanding during the period. |
| (b) | Total investment return is calculated exclusive of sales charges and assumes the reinvestment of dividends and distributions. For periods of less than one year, total return is not annualized. |
| (c) | In addition to the fees and expenses which the Fund bears directly, it also indirectly bears a pro-rata share of the fees and expenses of the underlying funds in which it invests. Such indirect expenses are not included in the above expense ratios. |
| (d) | The portfolio turnover rates not including mortgage dollar rolls were 56%, 62%, 54% and 36% for the years ended October 31, 2021, 2020, 2019 and 2018, respectively. |
| Six months ended April 30, 2023* | Year Ended October 31, | ||||||||||
| Class B | 2022 | 2021 | 2020 | 2019 | 2018 | ||||||
| Net asset value at beginning of period | $ 17.12 | $ 21.93 | $ 18.75 | $ 20.11 | $ 18.64 | $ 20.10 | |||||
| Net investment income (loss) (a) | 0.17 | 0.25 | 0.24 | 0.27 | 0.37 | 0.36 | |||||
| Net realized and unrealized gain (loss) | 1.05 | (3.67) | 3.25 | (0.62) | 1.81 | (0.98) | |||||
| Total from investment operations | 1.22 | (3.42) | 3.49 | (0.35) | 2.18 | (0.62) | |||||
| Less distributions: | |||||||||||
| From net investment income | (0.16) | (0.24) | (0.31) | (0.25) | (0.39) | (0.35) | |||||
| From net realized gain on investments | — | (1.14) | — | (0.76) | (0.32) | (0.49) | |||||
| Return of capital | — | (0.01) | — | — | — | — | |||||
| Total distributions | (0.16) | (1.39) | (0.31) | (1.01) | (0.71) | (0.84) | |||||
| Net asset value at end of period | $ 18.18 | $ 17.12 | $ 21.93 | $ 18.75 | $ 20.11 | $ 18.64 | |||||
| Total investment return (b) | 7.14% | (16.56)% | 18.69% | (1.84)% | 12.11% | (3.22)% | |||||
| Ratios (to average net assets)/Supplemental Data: | |||||||||||
| Net investment income (loss) | 1.95%†† | 1.28% | 1.13% | 1.42% | 1.96% | 1.85% | |||||
| Net expenses (c) | 2.02%†† | 1.95% | 1.93% | 1.92% | 1.91% | 1.88% | |||||
| Expenses (before waiver/reimbursement) (c) | 2.03%†† | 1.95% | 1.93% | 1.92% | 1.92% | 1.89% | |||||
| Portfolio turnover rate | 29% | 61% | 57%(d) | 65%(d) | 62%(d) | 44%(d) | |||||
| Net assets at end of period (in 000’s) | $ 6,579 | $ 8,591 | $ 16,789 | $ 19,409 | $ 26,396 | $ 30,343 | |||||
| * | Unaudited. |
| †† | Annualized. |
| (a) | Per share data based on average shares outstanding during the period. |
| (b) | Total investment return is calculated exclusive of sales charges and assumes the reinvestment of dividends and distributions. For periods of less than one year, total return is not annualized. |
| (c) | In addition to the fees and expenses which the Fund bears directly, it also indirectly bears a pro-rata share of the fees and expenses of the underlying funds in which it invests. Such indirect expenses are not included in the above expense ratios. |
| (d) | The portfolio turnover rates not including mortgage dollar rolls were 56%, 62%, 54% and 36% for the years ended October 31, 2021, 2020, 2019 and 2018, respectively. |
| 36 | MainStay Income Builder Fund |
| Six months ended April 30, 2023* | Year Ended October 31, | ||||||||||
| Class C | 2022 | 2021 | 2020 | 2019 | 2018 | ||||||
| Net asset value at beginning of period | $ 17.08 | $ 21.88 | $ 18.71 | $ 20.07 | $ 18.60 | $ 20.07 | |||||
| Net investment income (loss) (a) | 0.17 | 0.25 | 0.24 | 0.27 | 0.37 | 0.36 | |||||
| Net realized and unrealized gain (loss) | 1.05 | (3.66) | 3.24 | (0.62) | 1.81 | (0.99) | |||||
| Total from investment operations | 1.22 | (3.41) | 3.48 | (0.35) | 2.18 | (0.63) | |||||
| Less distributions: | |||||||||||
| From net investment income | (0.16) | (0.24) | (0.31) | (0.25) | (0.39) | (0.35) | |||||
| From net realized gain on investments | — | (1.14) | — | (0.76) | (0.32) | (0.49) | |||||
| Return of capital | — | (0.01) | — | — | — | — | |||||
| Total distributions | (0.16) | (1.39) | (0.31) | (1.01) | (0.71) | (0.84) | |||||
| Net asset value at end of period | $ 18.14 | $ 17.08 | $ 21.88 | $ 18.71 | $ 20.07 | $ 18.60 | |||||
| Total investment return (b) | 7.16% | (16.55)% | 18.68% | (1.85)% | 12.13% | (3.28)% | |||||
| Ratios (to average net assets)/Supplemental Data: | |||||||||||
| Net investment income (loss) | 1.96%†† | 1.29% | 1.13% | 1.42% | 1.95% | 1.85% | |||||
| Net expenses (c) | 2.02%†† | 1.95% | 1.93% | 1.92% | 1.91% | 1.88% | |||||
| Expenses (before waiver/reimbursement) (c) | 2.03%†† | 1.95% | 1.93% | 1.92% | 1.92% | 1.89% | |||||
| Portfolio turnover rate | 29% | 61% | 57%(d) | 65%(d) | 62%(d) | 44%(d) | |||||
| Net assets at end of period (in 000’s) | $ 66,679 | $ 76,894 | $ 132,596 | $ 148,220 | $ 191,737 | $ 212,400 | |||||
| * | Unaudited. |
| †† | Annualized. |
| (a) | Per share data based on average shares outstanding during the period. |
| (b) | Total investment return is calculated exclusive of sales charges and assumes the reinvestment of dividends and distributions. For periods of less than one year, total return is not annualized. |
| (c) | In addition to the fees and expenses which the Fund bears directly, it also indirectly bears a pro-rata share of the fees and expenses of the underlying funds in which it invests. Such indirect expenses are not included in the above expense ratios. |
| (d) | The portfolio turnover rates not including mortgage dollar rolls were 56%, 62%, 54% and 36% for the years ended October 31, 2021, 2020, 2019 and 2018, respectively. |
| Six months ended April 30, 2023* | Year Ended October 31, | ||||||||||
| Class I | 2022 | 2021 | 2020 | 2019 | 2018 | ||||||
| Net asset value at beginning of period | $ 17.17 | $ 21.99 | $ 18.80 | $ 20.16 | $ 18.68 | $ 20.15 | |||||
| Net investment income (loss) (a) | 0.29 | 0.48 | 0.49 | 0.49 | 0.59 | 0.58 | |||||
| Net realized and unrealized gain (loss) | 1.04 | (3.68) | 3.26 | (0.62) | 1.82 | (0.99) | |||||
| Total from investment operations | 1.33 | (3.20) | 3.75 | (0.13) | 2.41 | (0.41) | |||||
| Less distributions: | |||||||||||
| From net investment income | (0.27) | (0.47) | (0.56) | (0.47) | (0.61) | (0.57) | |||||
| From net realized gain on investments | — | (1.14) | — | (0.76) | (0.32) | (0.49) | |||||
| Return of capital | — | (0.01) | — | — | — | — | |||||
| Total distributions | (0.27) | (1.62) | (0.56) | (1.23) | (0.93) | (1.06) | |||||
| Net asset value at end of period | $ 18.23 | $ 17.17 | $ 21.99 | $ 18.80 | $ 20.16 | $ 18.68 | |||||
| Total investment return (b) | 7.78% | (15.55)% | 20.10% | (0.69)% | 13.41% | (2.17)% | |||||
| Ratios (to average net assets)/Supplemental Data: | |||||||||||
| Net investment income (loss) | 3.21%†† | 2.48% | 2.30% | 2.57% | 3.09% | 3.03% | |||||
| Net expenses (c) | 0.78%†† | 0.77% | 0.74% | 0.77% | 0.77% | 0.76% | |||||
| Portfolio turnover rate | 29% | 61% | 57%(d) | 65%(d) | 62%(d) | 44%(d) | |||||
| Net assets at end of period (in 000’s) | $ 309,045 | $ 339,868 | $ 505,806 | $ 448,922 | $ 484,614 | $ 499,675 | |||||
| * | Unaudited. |
| †† | Annualized. |
| (a) | Per share data based on average shares outstanding during the period. |
| (b) | Total investment return is calculated exclusive of sales charges and assumes the reinvestment of dividends and distributions. Class I shares are not subject to sales charges. For periods of less than one year, total return is not annualized. |
| (c) | In addition to the fees and expenses which the Fund bears directly, it also indirectly bears a pro-rata share of the fees and expenses of the underlying funds in which it invests. Such indirect expenses are not included in the above expense ratios. |
| (d) | The portfolio turnover rates not including mortgage dollar rolls were 56%, 62%, 54% and 36% for the years ended October 31, 2021, 2020, 2019 and 2018, respectively. |
| 38 | MainStay Income Builder Fund |
| Six months ended April 30, 2023* | Year Ended October 31, | ||||||||||
| Class R2 | 2022 | 2021 | 2020 | 2019 | 2018 | ||||||
| Net asset value at beginning of period | $ 16.97 | $ 21.75 | $ 18.61 | $ 19.95 | $ 18.50 | $ 19.96 | |||||
| Net investment income (loss) (a) | 0.25 | 0.41 | 0.41 | 0.42 | 0.52 | 0.50 | |||||
| Net realized and unrealized gain (loss) | 1.04 | (3.64) | 3.22 | (0.59) | 1.79 | (0.97) | |||||
| Total from investment operations | 1.29 | (3.23) | 3.63 | (0.17) | 2.31 | (0.47) | |||||
| Less distributions: | |||||||||||
| From net investment income | (0.24) | (0.40) | (0.49) | (0.41) | (0.54) | (0.50) | |||||
| From net realized gain on investments | — | (1.14) | — | (0.76) | (0.32) | (0.49) | |||||
| Return of capital | — | (0.01) | — | — | — | — | |||||
| Total distributions | (0.24) | (1.55) | (0.49) | (1.17) | (0.86) | (0.99) | |||||
| Net asset value at end of period | $ 18.02 | $ 16.97 | $ 21.75 | $ 18.61 | $ 19.95 | $ 18.50 | |||||
| Total investment return (b) | 7.60% | (15.84)% | 19.68% | (1.00)% | 12.98% | (2.48)% | |||||
| Ratios (to average net assets)/Supplemental Data: | |||||||||||
| Net investment income (loss) | 2.84%†† | 2.15% | 1.96% | 2.21% | 2.77% | 2.61% | |||||
| Net expenses (c) | 1.13%†† | 1.12% | 1.09% | 1.11% | 1.12% | 1.11% | |||||
| Portfolio turnover rate | 29% | 61% | 57%(d) | 65%(d) | 62%(d) | 44%(d) | |||||
| Net assets at end of period (in 000’s) | $ 952 | $ 1,713 | $ 2,961 | $ 3,044 | $ 2,524 | $ 3,587 | |||||
| * | Unaudited. |
| †† | Annualized. |
| (a) | Per share data based on average shares outstanding during the period. |
| (b) | Total investment return is calculated exclusive of sales charges and assumes the reinvestment of dividends and distributions. Class R2 shares are not subject to sales charges. For periods of less than one year, total return is not annualized. |
| (c) | In addition to the fees and expenses which the Fund bears directly, it also indirectly bears a pro-rata share of the fees and expenses of the underlying funds in which it invests. Such indirect expenses are not included in the above expense ratios. |
| (d) | The portfolio turnover rates not including mortgage dollar rolls were 56%, 62%, 54% and 36% for the years ended October 31, 2021, 2020, 2019 and 2018, respectively. |
| Six months ended April 30, 2023* | Year Ended October 31, | ||||||||||
| Class R3 | 2022 | 2021 | 2020 | 2019 | 2018 | ||||||
| Net asset value at beginning of period | $ 16.97 | $ 21.75 | $ 18.61 | $ 19.96 | $ 18.51 | $ 19.97 | |||||
| Net investment income (loss) (a) | 0.23 | 0.36 | 0.36 | 0.37 | 0.45 | 0.42 | |||||
| Net realized and unrealized gain (loss) | 1.03 | (3.64) | 3.22 | (0.60) | 1.82 | (0.94) | |||||
| Total from investment operations | 1.26 | (3.28) | 3.58 | (0.23) | 2.27 | (0.52) | |||||
| Less distributions: | |||||||||||
| From net investment income | (0.22) | (0.35) | (0.44) | (0.36) | (0.50) | (0.45) | |||||
| From net realized gain on investments | — | (1.14) | — | (0.76) | (0.32) | (0.49) | |||||
| Return of capital | — | (0.01) | — | — | — | — | |||||
| Total distributions | (0.22) | (1.50) | (0.44) | (1.12) | (0.82) | (0.94) | |||||
| Net asset value at end of period | $ 18.01 | $ 16.97 | $ 21.75 | $ 18.61 | $ 19.96 | $ 18.51 | |||||
| Total investment return (b) | 7.44% | (16.09)% | 19.39% | (1.24)% | 12.70% | (2.73)% | |||||
| Ratios (to average net assets)/Supplemental Data: | |||||||||||
| Net investment income (loss) | 2.62%†† | 1.90% | 1.70% | 1.97% | 2.34% | 2.19% | |||||
| Net expenses (c) | 1.38%†† | 1.37% | 1.34% | 1.37% | 1.36% | 1.35% | |||||
| Portfolio turnover rate | 29% | 61% | 57%(d) | 65%(d) | 62%(d) | 44%(d) | |||||
| Net assets at end of period (in 000’s) | $ 2,447 | $ 2,255 | $ 2,088 | $ 1,196 | $ 590 | $ 136 | |||||
| * | Unaudited. |
| †† | Annualized. |
| (a) | Per share data based on average shares outstanding during the period. |
| (b) | Total investment return is calculated exclusive of sales charges and assumes the reinvestment of dividends and distributions. Class R3 shares are not subject to sales charges. For periods of less than one year, total return is not annualized. |
| (c) | In addition to the fees and expenses which the Fund bears directly, it also indirectly bears a pro-rata share of the fees and expenses of the underlying funds in which it invests. Such indirect expenses are not included in the above expense ratios. |
| (d) | The portfolio turnover rates not including mortgage dollar rolls were 56%, 62%, 54% and 36% for the years ended October 31, 2021, 2020, 2019 and 2018, respectively. |
| 40 | MainStay Income Builder Fund |
| Six months ended April 30, 2023* | Year Ended October 31, | February 28, 2018^ through October 31, 2018 | |||||||||
| Class R6 | 2022 | 2021 | 2020 | 2019 | |||||||
| Net asset value at beginning of period | $ 17.17 | $ 21.99 | $ 18.80 | $ 20.16 | $ 18.68 | $ 19.19 | |||||
| Net investment income (loss) (a) | 0.29 | 0.49 | 0.51 | 0.51 | 0.61 | 0.33 | |||||
| Net realized and unrealized gain (loss) | 1.05 | (3.67) | 3.26 | (0.62) | 1.82 | (0.44) | |||||
| Total from investment operations | 1.34 | (3.18) | 3.77 | (0.11) | 2.43 | (0.11) | |||||
| Less distributions: | |||||||||||
| From net investment income | (0.28) | (0.49) | (0.58) | (0.49) | (0.63) | (0.40) | |||||
| From net realized gain on investments | — | (1.14) | — | (0.76) | (0.32) | — | |||||
| Return of capital | — | (0.01) | — | — | — | — | |||||
| Total distributions | (0.28) | (1.64) | (0.58) | (1.25) | (0.95) | (0.40) | |||||
| Net asset value at end of period | $ 18.23 | $ 17.17 | $ 21.99 | $ 18.80 | $ 20.16 | $ 18.68 | |||||
| Total investment return (b) | 7.83% | (15.48)% | 20.20% | (0.60)% | 13.52% | (0.61)% | |||||
| Ratios (to average net assets)/Supplemental Data: | |||||||||||
| Net investment income (loss) | 3.26%†† | 2.57% | 2.38% | 2.67% | 3.18% | 2.55%†† | |||||
| Net expenses (c) | 0.69%†† | 0.68% | 0.66% | 0.67% | 0.67% | 0.66%†† | |||||
| Portfolio turnover rate | 29% | 61% | 57%(d) | 65%(d) | 62%(d) | 44%(d) | |||||
| Net assets at end of period (in 000’s) | $ 2,792 | $ 89,692 | $ 109,387 | $ 91,551 | $ 101,685 | $ 94,869 | |||||
| * | Unaudited. |
| ^ | Inception date. |
| †† | Annualized. |
| (a) | Per share data based on average shares outstanding during the period. |
| (b) | Total investment return is calculated exclusive of sales charges and assumes the reinvestment of dividends and distributions. Class R6 shares are not subject to sales charges. For periods of less than one year, total return is not annualized. |
| (c) | In addition to the fees and expenses which the Fund bears directly, it also indirectly bears a pro-rata share of the fees and expenses of the underlying funds in which it invests. Such indirect expenses are not included in the above expense ratios. |
| (d) | The portfolio turnover rates not including mortgage dollar rolls were 56%, 62%, 54% and 36% for the years ended October 31, 2021, 2020, 2019 and 2018, respectively. |
| Six months ended April 30, 2023* | Year Ended October 31, | August 31, 2020^ through October 31, | |||||
| SIMPLE Class | 2022 | 2021 | 2020 | ||||
| Net asset value at beginning of period | $ 16.99 | $ 21.78 | $ 18.62 | $ 19.33 | |||
| Net investment income (loss) (a) | 0.23 | 0.20 | 0.34 | 0.04 | |||
| Net realized and unrealized gain (loss) | 1.03 | (3.50) | 3.24 | (0.69) | |||
| Total from investment operations | 1.26 | (3.30) | 3.58 | (0.65) | |||
| Less distributions: | |||||||
| From net investment income | (0.22) | (0.34) | (0.42) | (0.06) | |||
| From net realized gain on investments | — | (1.14) | — | — | |||
| Return of capital | — | (0.01) | — | — | |||
| Total distributions | (0.22) | (1.49) | (0.42) | (0.06) | |||
| Net asset value at end of period | $ 18.03 | $ 16.99 | $ 21.78 | $ 18.62 | |||
| Total investment return (b) | 7.42% | (16.10)% | 19.26% | (3.39)% | |||
| Ratios (to average net assets)/Supplemental Data: | |||||||
| Net investment income (loss) | 2.56%†† | 1.06% | 1.61% | 1.62%†† | |||
| Net expenses (c) | 1.41%†† | 1.45% | 1.43% | 1.43%†† | |||
| Portfolio turnover rate | 29% | 61% | 57%(d) | 65%(d) | |||
| Net assets at end of period (in 000’s) | $ 35 | $ 34 | $ 29 | $ 24 | |||
| * | Unaudited. |
| ^ | Inception date. |
| †† | Annualized. |
| (a) | Per share data based on average shares outstanding during the period. |
| (b) | Total investment return is calculated exclusive of sales charges and assumes the reinvestment of dividends and distributions. SIMPLE Class shares are not subject to sales charges. For periods of less than one year, total return is not annualized. |
| (c) | In addition to the fees and expenses which the Fund bears directly, it also indirectly bears a pro-rata share of the fees and expenses of the underlying funds in which it invests. Such indirect expenses are not included in the above expense ratios. |
| (d) | The portfolio turnover rates not including mortgage dollar rolls were 56% and 62% for the years ended October 31, 2021 and 2020 respectively. |
| 42 | MainStay Income Builder Fund |
| Class | Commenced Operations |
| Class A | January 3, 1995 |
| Investor Class | February 28, 2008 |
| Class B | December 29, 1987 |
| Class C | September 1, 1998 |
| Class I | January 2, 2004 |
| Class R2 | February 27, 2015 |
| Class R3 | February 29, 2016 |
| Class R6 | February 28, 2018 |
| SIMPLE Class | August 31, 2020 |
| • | Level 1—quoted prices (unadjusted) in active markets for an identical asset or liability |
| • | Level 2—other significant observable inputs (including quoted prices for a similar asset or liability in active markets, interest rates and yield curves, prepayment speeds, credit risk, etc.) |
| • | Level 3—significant unobservable inputs (including the Fund's own assumptions about the assumptions that market participants would use in measuring fair value of an asset or liability) |
| • Broker/dealer quotes | • Benchmark securities |
| • Two-sided markets | • Reference data (corporate actions or material event notices) |
| • Bids/offers | • Monthly payment information |
| • Industry and economic events | • Reported trades |
| 44 | MainStay Income Builder Fund |
| 46 | MainStay Income Builder Fund |
| 48 | MainStay Income Builder Fund |
| 50 | MainStay Income Builder Fund |
| Asset Derivatives | Foreign Exchange Contracts Risk | Equity Contracts Risk | Interest Rate Contracts Risk | Total |
| Futures Contracts - Net Assets—Net unrealized appreciation on futures contracts (a) | $ — | $4,160,564 | $3,610,486 | $7,771,050 |
| Forward Contracts - Unrealized appreciation on foreign currency forward contracts | 128,648 | — | — | 128,648 |
| Total Fair Value | $128,648 | $4,160,564 | $3,610,486 | $7,899,698 |
| (a) | Includes cumulative appreciation (depreciation) of futures contracts as reported in the Portfolio of Investments. Only current day’s variation margin is reported within the Statement of Assets and Liabilities. |
| Liability Derivatives | Foreign Exchange Contracts Risk | Equity Contracts Risk | Total |
| Futures Contracts - Net Assets—Net unrealized depreciation on futures contracts (a) | $ — | $(5,234,110) | $(5,234,110) |
| Forward Contracts - Unrealized depreciation on foreign currency forward contracts | (2,386,575) | — | (2,386,575) |
| Total Fair Value | $(2,386,575) | $(5,234,110) | $(7,620,685) |
| (a) | Includes cumulative appreciation (depreciation) of futures contracts as reported in the Portfolio of Investments. Only current day’s variation margin is reported within the Statement of Assets and Liabilities. |
| Net Realized Gain (Loss) from: | Foreign Exchange Contracts Risk | Equity Contracts Risk | Interest Rate Contracts Risk | Total |
| Futures Contracts | $ — | $(9,973,710) | $(5,352,277) | $(15,325,987) |
| Forward Contracts | (55,806) | — | — | (55,806) |
| Total Net Realized Gain (Loss) | $(55,806) | $(9,973,710) | $(5,352,277) | $(15,381,793) |
| Net Change in Unrealized Appreciation (Depreciation) | Foreign Exchange Contracts Risk | Equity Contracts Risk | Interest Rate Contracts Risk | Total |
| Futures Contracts | $ — | $(8,092,700) | $11,197,137 | $3,104,437 |
| Forward Contracts | (162,760) | — | — | (162,760) |
| Total Net Change in Unrealized Appreciation (Depreciation) | $(162,760) | $(8,092,700) | $11,197,137 | $2,941,677 |
| Average Notional Amount | Total |
| Futures Contracts Long | $354,774,260 |
| Futures Contracts Short | $ (92,368,151) |
| Forward Contracts Long | $ 46,625,818 |
| Forward Contracts Short | $ (29,164,770) |
| Class R2 | $ 811 |
| Class R3 | 1,182 |
| 52 | MainStay Income Builder Fund |
| Class | Expense | Waived |
| Class A | $352,799 | $ — |
| Investor Class | 111,221 | (2,089) |
| Class B | 13,626 | (273) |
| Class C | 130,954 | (2,538) |
| Class I | 170,035 | — |
| Class R2 | 854 | — |
| Class R3 | 1,242 | — |
| Class R6 | 539 | — |
| SIMPLE Class | 41 | — |
| Class R2 | $33,058 | 3.5% |
| Class R6 | 30,637 | 1.1 |
| SIMPLE Class | 25,910 | 74.3 |
| Federal Tax Cost | Gross Unrealized Appreciation | Gross Unrealized (Depreciation) | Net Unrealized Appreciation/ (Depreciation) | |
| Investments in Securities | $1,025,462,624 | $144,356,741 | $(60,214,598) | $84,142,143 |
| Capital Loss Available Through | Short-Term Capital Loss Amounts (000’s) | Long-Term Capital Loss Amounts (000’s) |
| Unlimited | $47,850 | $40,696 |
| 2022 | |
| Distributions paid from: | |
| Ordinary Income | $ 66,389,313 |
| Long-Term Capital Gains | 52,187,385 |
| Return of Capital | 924,329 |
| Total | $119,501,027 |
| Class A | Shares | Amount |
| Six-month period ended April 30, 2023: | ||
| Shares sold | 1,502,284 | $ 26,699,608 |
| Shares issued to shareholders in reinvestment of distributions | 504,502 | 9,030,707 |
| Shares redeemed | (4,001,472) | (71,059,454) |
| Net increase (decrease) in shares outstanding before conversion | (1,994,686) | (35,329,139) |
| Shares converted into Class A (See Note 1) | 147,006 | 2,596,790 |
| Shares converted from Class A (See Note 1) | (36,449) | (654,244) |
| Net increase (decrease) | (1,884,129) | $ (33,386,593) |
| Year ended October 31, 2022: | ||
| Shares sold | 4,935,609 | $ 96,706,936 |
| Shares issued to shareholders in reinvestment of distributions | 2,860,432 | 57,239,717 |
| Shares redeemed | (6,544,111) | (123,051,601) |
| Net increase (decrease) in shares outstanding before conversion | 1,251,930 | 30,895,052 |
| Shares converted into Class A (See Note 1) | 302,634 | 5,914,240 |
| Shares converted from Class A (See Note 1) | (20,489) | (355,945) |
| Net increase (decrease) | 1,534,075 | $ 36,453,347 |
| Investor Class | Shares | Amount |
| Six-month period ended April 30, 2023: | ||
| Shares sold | 58,546 | $ 1,050,640 |
| Shares issued to shareholders in reinvestment of distributions | 44,850 | 803,468 |
| Shares redeemed | (152,970) | (2,729,204) |
| Net increase (decrease) in shares outstanding before conversion | (49,574) | (875,096) |
| Shares converted into Investor Class (See Note 1) | 36,486 | 655,491 |
| Shares converted from Investor Class (See Note 1) | (80,311) | (1,416,869) |
| Net increase (decrease) | (93,399) | $ (1,636,474) |
| Year ended October 31, 2022: | ||
| Shares sold | 128,019 | $ 2,468,885 |
| Shares issued to shareholders in reinvestment of distributions | 272,544 | 5,471,647 |
| Shares redeemed | (291,315) | (5,532,511) |
| Net increase (decrease) in shares outstanding before conversion | 109,248 | 2,408,021 |
| Shares converted into Investor Class (See Note 1) | 57,030 | 1,086,744 |
| Shares converted from Investor Class (See Note 1) | (163,760) | (3,290,675) |
| Net increase (decrease) | 2,518 | $ 204,090 |
| 54 | MainStay Income Builder Fund |
| Class B | Shares | Amount |
| Six-month period ended April 30, 2023: | ||
| Shares sold | 385 | $ 6,952 |
| Shares issued to shareholders in reinvestment of distributions | 3,215 | 58,003 |
| Shares redeemed | (85,804) | (1,527,545) |
| Net increase (decrease) in shares outstanding before conversion | (82,204) | (1,462,590) |
| Shares converted from Class B (See Note 1) | (57,709) | (1,036,782) |
| Net increase (decrease) | (139,913) | $ (2,499,372) |
| Year ended October 31, 2022: | ||
| Shares sold | 10,687 | $ 217,721 |
| Shares issued to shareholders in reinvestment of distributions | 38,866 | 794,933 |
| Shares redeemed | (197,793) | (3,825,274) |
| Net increase (decrease) in shares outstanding before conversion | (148,240) | (2,812,620) |
| Shares converted from Class B (See Note 1) | (115,518) | (2,199,922) |
| Net increase (decrease) | (263,758) | $ (5,012,542) |
| Class C | Shares | Amount |
| Six-month period ended April 30, 2023: | ||
| Shares sold | 95,079 | $ 1,700,766 |
| Shares issued to shareholders in reinvestment of distributions | 34,701 | 624,715 |
| Shares redeemed | (902,325) | (16,143,681) |
| Net increase (decrease) in shares outstanding before conversion | (772,545) | (13,818,200) |
| Shares converted from Class C (See Note 1) | (52,628) | (940,566) |
| Net increase (decrease) | (825,173) | $ (14,758,766) |
| Year ended October 31, 2022: | ||
| Shares sold | 215,648 | $ 4,232,502 |
| Shares issued to shareholders in reinvestment of distributions | 380,683 | 7,762,048 |
| Shares redeemed | (2,070,323) | (39,389,776) |
| Net increase (decrease) in shares outstanding before conversion | (1,473,992) | (27,395,226) |
| Shares converted from Class C (See Note 1) | (84,014) | (1,597,417) |
| Net increase (decrease) | (1,558,006) | $ (28,992,643) |
| Class I | Shares | Amount |
| Six-month period ended April 30, 2023: | ||
| Shares sold | 1,087,808 | $ 19,607,529 |
| Shares issued to shareholders in reinvestment of distributions | 232,678 | 4,214,023 |
| Shares redeemed | (4,208,702) | (75,591,158) |
| Net increase (decrease) in shares outstanding before conversion | (2,888,216) | (51,769,606) |
| Shares converted into Class I (See Note 1) | 46,158 | 836,057 |
| Shares converted from Class I (See Note 1) | (2,186) | (39,877) |
| Net increase (decrease) | (2,844,244) | $ (50,973,426) |
| Year ended October 31, 2022: | ||
| Shares sold | 2,794,118 | $ 54,209,049 |
| Shares issued to shareholders in reinvestment of distributions | 1,544,583 | 31,269,065 |
| Shares redeemed | (7,570,244) | (144,284,186) |
| Net increase (decrease) in shares outstanding before conversion | (3,231,543) | (58,806,072) |
| Shares converted into Class I (See Note 1) | 28,295 | 491,409 |
| Shares converted from Class I (See Note 1) | (2,909) | (48,434) |
| Net increase (decrease) | (3,206,157) | $ (58,363,097) |
| Class R2 | Shares | Amount |
| Six-month period ended April 30, 2023: | ||
| Shares sold | 1,242 | $ 22,214 |
| Shares issued to shareholders in reinvestment of distributions | 507 | 9,091 |
| Shares redeemed | (49,828) | (871,185) |
| Net increase (decrease) | (48,079) | $ (839,880) |
| Year ended October 31, 2022: | ||
| Shares sold | 10,493 | $ 205,155 |
| Shares issued to shareholders in reinvestment of distributions | 2,953 | 59,140 |
| Shares redeemed | (48,655) | (863,716) |
| Net increase (decrease) | (35,209) | $ (599,421) |
| Class R3 | Shares | Amount |
| Six-month period ended April 30, 2023: | ||
| Shares sold | 28,884 | $ 514,530 |
| Shares issued to shareholders in reinvestment of distributions | 1,620 | 28,984 |
| Shares redeemed | (27,523) | (492,613) |
| Net increase (decrease) | 2,981 | $ 50,901 |
| Year ended October 31, 2022: | ||
| Shares sold | 40,831 | $ 769,068 |
| Shares issued to shareholders in reinvestment of distributions | 7,538 | 150,568 |
| Shares redeemed | (11,447) | (207,471) |
| Net increase (decrease) | 36,922 | $ 712,165 |
| Class R6 | Shares | Amount |
| Six-month period ended April 30, 2023: | ||
| Shares sold | 109,800 | $ 1,980,259 |
| Shares issued to shareholders in reinvestment of distributions | 16,297 | 296,725 |
| Shares redeemed | (5,196,837) | (92,681,774) |
| Net increase (decrease) | (5,070,740) | $ (90,404,790) |
| Year ended October 31, 2022: | ||
| Shares sold | 461,312 | $ 8,868,522 |
| Shares issued to shareholders in reinvestment of distributions | 398,256 | 8,037,656 |
| Shares redeemed | (609,827) | (11,840,855) |
| Net increase (decrease) | 249,741 | $ 5,065,323 |
| SIMPLE Class | Shares | Amount |
| Six-month period ended April 30, 2023: | ||
| Shares sold | 121 | $ 2,153 |
| Shares issued to shareholders in reinvestment of distributions | 24 | 426 |
| Shares redeemed | (235) | (4,275) |
| Net increase (decrease) | (90) | $ (1,696) |
| Year ended October 31, 2022: | ||
| Shares sold | 620 | $ 12,539 |
| Shares issued to shareholders in reinvestment of distributions | 125 | 2,510 |
| Shares redeemed | (44) | (920) |
| Net increase (decrease) | 701 | $ 14,129 |
| 56 | MainStay Income Builder Fund |
| 58 | MainStay Income Builder Fund |
| 60 | MainStay Income Builder Fund |
| 62 | MainStay Income Builder Fund |
1.
| 2. | This Fund is registered for sale in CA, CT, DE, FL, MA, NJ, NY and VT. |
| 3. | An affiliate of New York Life Investment Management LLC. |
| 5022189MS043-23 | MSIB10-06/23 |
please log in to newyorklifeinvestments.com/accounts.
| Not FDIC/NCUA Insured | Not a Deposit | May Lose Value | No Bank Guarantee | Not Insured by Any Government Agency |


President

| Average Annual Total Returns for the Period-Ended April 30, 2023 | ||||||||
| Class | Sales Charge | Inception Date | Six Months1 | One Year | Five Years | Ten Years | Gross Expense Ratio2 | |
| Class A Shares | Maximum 5.50% Initial Sales Charge | With sales charges | 1/3/1995 | -6.52% | -9.07% | 7.44% | 8.39% | 0.92% |
| Excluding sales charges | -1.08 | -3.78 | 8.66 | 9.00 | 0.92 | |||
| Investor Class Shares3 | Maximum 5.00% Initial Sales Charge | With sales charges | 2/28/2008 | -6.14 | -8.83 | 7.23 | 8.19 | 1.11 |
| Excluding sales charges | -1.20 | -4.03 | 8.46 | 8.80 | 1.11 | |||
| Class B Shares4 | Maximum 5.00% CDSC | With sales charges | 5/1/1986 | -6.31 | -9.32 | 7.35 | 7.99 | 1.86 |
| if Redeemed Within the First Six Years of Purchase | Excluding sales charges | -1.54 | -4.71 | 7.64 | 7.99 | 1.86 | ||
| Class C Shares | Maximum 1.00% CDSC | With sales charges | 9/1/1998 | -2.50 | -5.64 | 7.64 | 7.99 | 1.86 |
| if Redeemed Within One Year of Purchase | Excluding sales charges | -1.55 | -4.72 | 7.64 | 7.99 | 1.86 | ||
| Class I Shares | No Sales Charge | 11/28/2008 | -0.91 | -3.48 | 9.04 | 9.34 | 0.67 | |
| 1. | Not annualized. |
| 2. | The gross expense ratios presented reflect the Fund’s “Total Annual Fund Operating Expenses” from the most recent Prospectus, as supplemented, and may differ from other expense ratios disclosed in this report. |
| 3. | Prior to June 30, 2020, the maximum initial sales charge was 5.50%, which is reflected in the applicable average annual total return figures shown. |
| 4. | Class B shares are closed to all new purchases as well as additional investments by existing Class B shareholders. |
| Benchmark Performance* | Six Months1 | One Year | Five Years | Ten Years |
| ICE BofA U.S. Convertible Index2 | 0.65% | -5.37% | 9.31% | 9.28% |
| Morningstar Convertibles Category Average3 | 1.22 | -5.62 | 7.46 | 7.72 |
| * | Returns for indices reflect no deductions for fees, expenses or taxes, except for foreign withholding taxes where applicable. Results assume reinvestment of all dividends and capital gains. An investment cannot be made directly in an index. |
| 1. | Not annualized. |
| 2. | The ICE BofA U.S. Convertible Index is the Fund’s primary broad–based securities market index for comparison purposes. The ICE BofA U.S. Convertible Index is a market-capitalization weighted index of domestic corporate convertible securities. In order to be included in this Index, bonds and preferred stocks must be convertible only to common stock. |
| 3. | The Morningstar Convertibles Category Average is representative of funds that are designed to offer some of the capital-appreciation potential of stock funds while also supplying some of the safety and yield of bond funds. Results are based on average total returns of similar funds with all dividends and capital gain distributions reinvested. |
| 6 | MainStay MacKay Convertible Fund |
| Share Class | Beginning Account Value 11/1/22 | Ending Account Value (Based on Actual Returns and Expenses) 4/30/23 | Expenses Paid During Period1 | Ending Account Value (Based on Hypothetical 5% Annualized Return and Actual Expenses) 4/30/23 | Expenses Paid During Period1 | Net Expense Ratio During Period2 |
| Class A Shares | $1,000.00 | $989.20 | $4.64 | $1,020.13 | $4.71 | 0.94% |
| Investor Class Shares | $1,000.00 | $988.00 | $5.82 | $1,018.94 | $5.91 | 1.18% |
| Class B Shares | $1,000.00 | $984.60 | $9.50 | $1,015.22 | $9.64 | 1.93% |
| Class C Shares | $1,000.00 | $984.50 | $9.50 | $1,015.22 | $9.64 | 1.93% |
| Class I Shares | $1,000.00 | $990.90 | $3.01 | $1,021.77 | $3.06 | 0.61% |
| 1. | Expenses are equal to the Fund’s annualized expense ratio of each class multiplied by the average account value over the period, divided by 365 and multiplied by 181 (to reflect the six-month period). The table above represents the actual expenses incurred during the six-month period. In addition to the fees and expenses which the Fund bears directly, it also indirectly bears a pro rata share of the fees and expenses of the underlying funds in which it invests. Such indirect expenses are not included in the above-reported expense figures. |
| 2. | Expenses are equal to the Fund's annualized expense ratio to reflect the six-month period. |

| 1. | Palo Alto Networks, Inc., 0.375%-0.75%, due 7/1/23–6/1/25 |
| 2. | NICE Ltd., (zero coupon), due 9/15/25 |
| 3. | EQT Corp., 1.75%, due 5/1/26 |
| 4. | BioMarin Pharmaceutical, Inc., 1.25%, due 5/15/27 |
| 5. | Microchip Technology, Inc., 0.125%, due 11/15/24 |
| 6. | Pioneer Natural Resources Co., 0.25%, due 5/15/25 |
| 7. | Southwest Airlines Co., 1.25%, due 5/1/25 |
| 8. | Liberty Media Corp., 2.25%-3.75%, due 8/15/27–3/15/28 |
| 9. | Helix Energy Solutions Group, Inc., 6.75%, due 2/15/26 |
| 10. | Lantheus Holdings, Inc., 2.625%, due 12/15/27 |
| 8 | MainStay MacKay Convertible Fund |
| 1. | See "Investment and Performance Comparison" for other share class returns, which may be higher or lower than Class I share returns, and for more information on benchmark and peer group returns. |
| 2. | The S&P 500® Index is widely regarded as the standard index for measuring large-cap U.S. stock market performance. |
| 3. | The Russell 2000® Index measures the performance of the small-cap segment of the U.S. equity universe. It is a subset of the Russell 3000® Index and includes approximately 2,000 of the smallest securities based on a combination of their market cap and current index membership. Results assume reinvestment of all dividends and capital gains. An investment cannot be made directly in an index. |
| 10 | MainStay MacKay Convertible Fund |
| Principal Amount | Value | |
| Long-Term Bonds 1.7% | ||
| Corporate Bonds 1.7% | ||
| Biotechnology 0.3% | ||
| Bridgebio Pharma, Inc. | ||
| 2.50%, due 3/15/27 | $ 6,975,000 | $ 5,066,963 |
| Leisure Time 0.3% | ||
| NCL Corp. Ltd. | ||
| 5.375%, due 8/1/25 | 4,670,000 | 4,982,890 |
| Oil & Gas 0.1% | ||
| Valaris Ltd. | ||
| Series 1145 | ||
| 8.25% (8.25% Cash or 12.00% PIK), due 4/30/28 (a) | 1,461,000 | 1,518,709 |
| Oil & Gas Services 0.0% ‡ | ||
| Weatherford International Ltd. | ||
| 11.00%, due 12/1/24 (b) | 82,000 | 84,448 |
| Semiconductors 0.7% | ||
| Silicon Laboratories, Inc. | ||
| 0.625%, due 6/15/25 | 8,770,000 | 10,557,674 |
| Software 0.3% | ||
| Five9, Inc. | ||
| 0.50%, due 6/1/25 | 4,675,000 | 4,312,809 |
| Total Corporate Bonds (Cost $27,471,491) | 26,523,493 | |
| Total Long-Term Bonds (Cost $27,471,491) | 26,523,493 | |
| Convertible Securities 85.0% | ||
| Convertible Bonds 78.2% | ||
| Airlines 2.6% | ||
| American Airlines Group, Inc. | ||
| 6.50%, due 7/1/25 | 7,040,000 | 7,839,040 |
| JetBlue Airways Corp. | ||
| 0.50%, due 4/1/26 | 4,632,000 | 3,631,950 |
| Southwest Airlines Co. | ||
| 1.25%, due 5/1/25 | 27,566,000 | 29,612,775 |
| 41,083,765 | ||
| Auto Manufacturers 2.2% | ||
| Ford Motor Co. | ||
| (zero coupon), due 3/15/26 | 27,838,000 | 27,295,159 |
| Principal Amount | Value | |
| Auto Manufacturers (continued) | ||
| Rivian Automotive, Inc. | ||
| 4.625%, due 3/15/29 (b) | $ 8,144,000 | $ 7,565,776 |
| 34,860,935 | ||
| Beverages 1.5% | ||
| MGP Ingredients, Inc. | ||
| 1.875%, due 11/15/41 | 19,959,000 | 23,691,333 |
| Biotechnology 5.0% | ||
| Alnylam Pharmaceuticals, Inc. | ||
| 1.00%, due 9/15/27 (b) | 5,460,000 | 5,445,265 |
| BioMarin Pharmaceutical, Inc. | ||
| 1.25%, due 5/15/27 (c) | 34,659,000 | 35,943,013 |
| Guardant Health, Inc. | ||
| (zero coupon), due 11/15/27 | 7,026,000 | 4,746,123 |
| Halozyme Therapeutics, Inc. | ||
| 1.00%, due 8/15/28 (b) | 8,000,000 | 7,025,000 |
| Illumina, Inc. | ||
| (zero coupon), due 8/15/23 | 18,223,000 | 18,004,697 |
| Ionis Pharmaceuticals, Inc. | ||
| (zero coupon), due 4/1/26 | 9,349,000 | 8,589,394 |
| 79,753,492 | ||
| Commercial Services 3.8% | ||
| Alarm.com Holdings, Inc. | ||
| (zero coupon), due 1/15/26 | 3,775,000 | 3,199,329 |
| Block, Inc. | ||
| 0.125%, due 3/1/25 | 19,416,000 | 18,183,084 |
| Chegg, Inc. | ||
| (zero coupon), due 9/1/26 | 8,817,000 | 7,139,191 |
| Euronet Worldwide, Inc. | ||
| 0.75%, due 3/15/49 (c) | 11,900,000 | 11,548,950 |
| Repay Holdings Corp. | ||
| (zero coupon), due 2/1/26 (b) | 2,525,000 | 1,910,162 |
| Sabre GLBL, Inc. | ||
| 4.00%, due 4/15/25 | 1,835,000 | 1,616,357 |
| Shift4 Payments, Inc. | ||
| (zero coupon), due 12/15/25 | 14,428,000 | 15,805,874 |
| 59,402,947 | ||
| Computers 2.2% | ||
| Lumentum Holdings, Inc. | ||
| 0.50%, due 12/15/26 | 25,385,000 | 21,615,328 |
| Parsons Corp. | ||
| 0.25%, due 8/15/25 | 4,641,000 | 5,040,126 |
| Zscaler, Inc. | ||
| 0.125%, due 7/1/25 | 8,613,000 | 8,363,223 |
| 35,018,677 | ||
| Principal Amount | Value | |
| Convertible Bonds (continued) | ||
| Cosmetics & Personal Care 0.5% | ||
| Beauty Health Co. (The) | ||
| 1.25%, due 10/1/26 (b) | $ 10,567,000 | $ 8,691,358 |
| Electric 1.5% | ||
| NRG Energy, Inc. | ||
| 2.75%, due 6/1/48 | 23,454,000 | 24,216,255 |
| Energy-Alternate Sources 2.6% | ||
| Array Technologies, Inc. | ||
| 1.00%, due 12/1/28 | 7,636,000 | 8,025,436 |
| Enphase Energy, Inc. | ||
| (zero coupon), due 3/1/26 | 15,816,000 | 15,143,820 |
| NextEra Energy Partners LP | ||
| (zero coupon), due 11/15/25 (b) | 9,417,000 | 8,635,389 |
| SolarEdge Technologies, Inc. | ||
| (zero coupon), due 9/15/25 | 7,790,000 | 9,702,445 |
| 41,507,090 | ||
| Entertainment 2.2% | ||
| Live Nation Entertainment, Inc. | ||
| 3.125%, due 1/15/29 (b) | 5,685,000 | 5,508,765 |
| Marriott Vacations Worldwide Corp. | ||
| (zero coupon), due 1/15/26 | 3,110,000 | 3,024,475 |
| Vail Resorts, Inc. | ||
| (zero coupon), due 1/1/26 (c) | 28,521,000 | 25,936,284 |
| 34,469,524 | ||
| Food 1.0% | ||
| Chefs' Warehouse, Inc. (The) | ||
| 2.375%, due 12/15/28 (b) | 11,305,000 | 11,432,180 |
| Post Holdings, Inc. | ||
| 2.50%, due 8/15/27 (b) | 4,561,000 | 4,799,540 |
| 16,231,720 | ||
| Healthcare-Products 7.1% | ||
| CONMED Corp. | ||
| 2.25%, due 6/15/27 (b) | 23,095,000 | 25,092,717 |
| Exact Sciences Corp. | ||
| 0.375%, due 3/1/28 | 22,800,000 | 19,877,204 |
| Haemonetics Corp. | ||
| (zero coupon), due 3/1/26 | 9,226,000 | 7,905,743 |
| Integer Holdings Corp. | ||
| 2.125%, due 2/15/28 (b) | 12,673,000 | 14,447,220 |
| Integra LifeSciences Holdings Corp. | ||
| 0.50%, due 8/15/25 | 8,670,000 | 8,418,570 |
| Lantheus Holdings, Inc. | ||
| 2.625%, due 12/15/27 (b) | 20,577,000 | 27,358,198 |
| Principal Amount | Value | |
| Healthcare-Products (continued) | ||
| NuVasive, Inc. | ||
| 0.375%, due 3/15/25 | $ 8,085,000 | $ 7,260,330 |
| Omnicell, Inc. | ||
| 0.25%, due 9/15/25 | 2,760,000 | 2,605,440 |
| 112,965,422 | ||
| Healthcare-Services 1.0% | ||
| Teladoc Health, Inc. | ||
| 1.25%, due 6/1/27 | 19,458,000 | 15,618,013 |
| Internet 9.6% | ||
| Booking Holdings, Inc. | ||
| 0.75%, due 5/1/25 (c) | 10,000,000 | 14,954,919 |
| Etsy, Inc. | ||
| 0.25%, due 6/15/28 (c) | 25,139,000 | 20,608,889 |
| Expedia Group, Inc. | ||
| (zero coupon), due 2/15/26 | 2,822,000 | 2,500,990 |
| Match Group Financeco 2, Inc. | ||
| 0.875%, due 6/15/26 (b) | 12,450,000 | 11,008,439 |
| Okta, Inc. | ||
| 0.125%, due 9/1/25 | 5,611,000 | 5,027,456 |
| Palo Alto Networks, Inc. | ||
| 0.375%, due 6/1/25 | 9,385,000 | 17,381,020 |
| 0.75%, due 7/1/23 | 13,659,000 | 27,987,291 |
| Q2 Holdings, Inc. | ||
| 0.75%, due 6/1/26 | 4,395,000 | 3,579,728 |
| Snap, Inc. | ||
| (zero coupon), due 5/1/27 | 10,018,000 | 7,313,140 |
| 0.125%, due 3/1/28 | 12,073,000 | 8,360,552 |
| Uber Technologies, Inc. | ||
| (zero coupon), due 12/15/25 | 13,355,000 | 11,682,321 |
| Ziff Davis, Inc. | ||
| 1.75%, due 11/1/26 (b) | 5,220,000 | 5,000,760 |
| Zillow Group, Inc. | ||
| 2.75%, due 5/15/25 | 16,626,000 | 16,958,520 |
| 152,364,025 | ||
| Leisure Time 1.1% | ||
| Carnival Corp. | ||
| 5.75%, due 12/1/27 (b) | 7,758,000 | 8,006,256 |
| NCL Corp. Ltd. | ||
| 6.00%, due 5/15/24 | 2,849,000 | 3,451,108 |
| Royal Caribbean Cruises Ltd. | ||
| 6.00%, due 8/15/25 (b) | 3,620,000 | 5,540,410 |
| 16,997,774 | ||
| Machinery-Diversified 1.1% | ||
| Chart Industries, Inc. | ||
| 1.00%, due 11/15/24 | 7,336,000 | 17,125,892 |
| 12 | MainStay MacKay Convertible Fund |
| Principal Amount | Value | |
| Convertible Bonds (continued) | ||
| Media 2.4% | ||
| Liberty Broadband Corp. | ||
| 3.125%, due 3/31/53 (b) | $ 9,263,000 | $ 9,198,159 |
| Liberty Media Corp. (b) | ||
| 2.25%, due 8/15/27 (c) | 13,561,000 | 14,435,685 |
| 3.75%, due 3/15/28 | 13,850,000 | 14,057,750 |
| 37,691,594 | ||
| Oil & Gas 6.0% | ||
| EQT Corp. | ||
| 1.75%, due 5/1/26 | 15,238,000 | 36,433,152 |
| Permian Resources Operating LLC | ||
| 3.25%, due 4/1/28 | 14,317,000 | 26,457,816 |
| Pioneer Natural Resources Co. | ||
| 0.25%, due 5/15/25 | 13,761,000 | 31,409,482 |
| 94,300,450 | ||
| Oil & Gas Services 3.5% | ||
| Helix Energy Solutions Group, Inc. | ||
| 6.75%, due 2/15/26 | 21,575,000 | 28,466,922 |
| Oil States International, Inc. | ||
| 4.75%, due 4/1/26 | 25,301,000 | 26,478,942 |
| 54,945,864 | ||
| Pharmaceuticals 1.8% | ||
| Dexcom, Inc. | ||
| 0.25%, due 11/15/25 (c) | 16,375,000 | 17,950,736 |
| Pacira BioSciences, Inc. | ||
| 0.75%, due 8/1/25 | 11,078,000 | 10,482,558 |
| 28,433,294 | ||
| Real Estate Investment Trusts 0.7% | ||
| Summit Hotel Properties, Inc. | ||
| 1.50%, due 2/15/26 | 12,566,000 | 10,561,664 |
| Retail 2.8% | ||
| Burlington Stores, Inc. | ||
| 2.25%, due 4/15/25 | 19,158,000 | 21,672,487 |
| Cheesecake Factory, Inc. (The) | ||
| 0.375%, due 6/15/26 | 9,208,000 | 7,711,700 |
| Patrick Industries, Inc. | ||
| 1.75%, due 12/1/28 | 16,362,000 | 14,864,877 |
| 44,249,064 | ||
| Semiconductors 4.6% | ||
| Impinj, Inc. | ||
| 1.125%, due 5/15/27 | 4,665,000 | 5,045,392 |
| Microchip Technology, Inc. | ||
| 0.125%, due 11/15/24 | 33,300,000 | 35,443,688 |
| Principal Amount | Value | |
| Semiconductors (continued) | ||
| ON Semiconductor Corp. | ||
| 0.50%, due 3/1/29 (b) | $ 23,069,000 | $ 22,332,948 |
| Wolfspeed, Inc. | ||
| 0.25%, due 2/15/28 | 8,931,000 | 6,515,522 |
| 1.875%, due 12/1/29 (b) | 4,540,000 | 3,375,490 |
| 72,713,040 | ||
| Software 6.5% | ||
| Akamai Technologies, Inc. | ||
| 0.375%, due 9/1/27 | 16,529,000 | 15,644,699 |
| Bentley Systems, Inc. | ||
| 0.125%, due 1/15/26 | 3,570,000 | 3,376,306 |
| BILL Holdings, Inc. | ||
| (zero coupon), due 12/1/25 | 4,680,000 | 4,296,240 |
| Datadog, Inc. | ||
| 0.125%, due 6/15/25 | 9,636,000 | 10,088,892 |
| DigitalOcean Holdings, Inc. | ||
| (zero coupon), due 12/1/26 | 6,190,000 | 4,869,256 |
| Dropbox, Inc. | ||
| (zero coupon), due 3/1/28 | 11,036,000 | 9,474,406 |
| Envestnet, Inc. | ||
| 2.625%, due 12/1/27 (b) | 14,212,000 | 15,576,352 |
| Everbridge, Inc. | ||
| 0.125%, due 12/15/24 | 12,641,000 | 11,376,900 |
| Model N, Inc. | ||
| 1.875%, due 3/15/28 (b) | 10,589,000 | 10,359,970 |
| MongoDB, Inc. | ||
| 0.25%, due 1/15/26 | 7,075,000 | 9,337,939 |
| Splunk, Inc. | ||
| 1.125%, due 9/15/25 | 9,755,000 | 9,228,230 |
| 103,629,190 | ||
| Telecommunications 4.4% | ||
| Infinera Corp. | ||
| 2.50%, due 3/1/27 | 7,050,000 | 7,696,690 |
| InterDigital, Inc. | ||
| 2.00%, due 6/1/24 | 4,500,000 | 4,556,250 |
| NICE Ltd. | ||
| (zero coupon), due 9/15/25 (c) | 46,000,000 | 42,918,001 |
| Viavi Solutions, Inc. | ||
| 1.00%, due 3/1/24 | 14,679,000 | 14,183,584 |
| 69,354,525 | ||
| Trucking & Leasing 0.5% | ||
| Greenbrier Cos., Inc. (The) | ||
| 2.875%, due 4/15/28 | 8,991,000 | 7,345,647 |
| Total Convertible Bonds (Cost $1,234,038,319) | 1,237,222,554 | |
| Shares | Value | |
| Convertible Preferred Stocks 6.8% | ||
| Banks 1.7% | ||
| Bank of America Corp. | ||
| Series L | ||
| 7.25% (d) | 12,072 | $ 14,292,403 |
| Wells Fargo & Co. | ||
| Series L | ||
| 7.50% (d) | 11,552 | 13,493,083 |
| 27,785,486 | ||
| Capital Markets 0.7% | ||
| KKR Group Co., Inc. | ||
| Series C | ||
| 6.00% | 165,650 | 10,580,065 |
| Construction & Engineering 0.4% | ||
| Fluor Corp. | ||
| 6.50% (d) | 4,500 | 6,181,875 |
| Electric Utilities 2.3% | ||
| NextEra Energy, Inc. | ||
| 6.926% | 250,000 | 11,835,000 |
| PG&E Corp. | ||
| 5.50% | 160,900 | 24,117,301 |
| 35,952,301 | ||
| Health Care Equipment & Supplies 0.3% | ||
| Becton Dickinson & Co. | ||
| Series B | ||
| 6.00% | 86,450 | 4,370,912 |
| Independent Power and Renewable Electricity Producers 0.8% | ||
| AES Corp. (The) | ||
| 6.875% | 147,100 | 13,240,471 |
| Machinery 0.6% | ||
| Chart Industries, Inc. | ||
| Series B | ||
| 6.75% | 163,900 | 9,189,873 |
| Total Convertible Preferred Stocks (Cost $102,725,465) | 107,300,983 | |
| Total Convertible Securities (Cost $1,336,763,784) | 1,344,523,537 | |
| Common Stocks 2.5% | ||
| Energy Equipment & Services 1.1% | ||
| Weatherford International plc (e) | 272,914 | 17,638,432 |
| Shares | Value | ||
| Life Sciences Tools & Services 1.1% | |||
| Danaher Corp. | 73,404 | $ 17,390,141 | |
| Oil, Gas & Consumable Fuels 0.3% | |||
| Kosmos Energy Ltd. (e) | 731,525 | 4,681,760 | |
| Total Common Stocks (Cost $31,398,569) | 39,710,333 | ||
| Short-Term Investments 15.4% | |||
| Affiliated Investment Company 11.0% | |||
| MainStay U.S. Government Liquidity Fund, 3.98% (f)(g) | 172,945,094 | 172,945,094 | |
| Unaffiliated Investment Companies 4.4% | |||
| Goldman Sachs Financial Square Government Fund, 4.865% (g)(h) | 35,000,000 | 35,000,000 | |
| Invesco Government & Agency Portfolio, 4.857% (g)(h) | 15,047,553 | 15,047,553 | |
| RBC U.S. Government Money Market Fund, 4.829% (g)(h) | 20,000,000 | 20,000,000 | |
| Total Unaffiliated Investment Companies (Cost $70,047,553) | 70,047,553 | ||
| Total Short-Term Investments (Cost $242,992,647) | 242,992,647 | ||
| Total Investments (Cost $1,638,626,491) | 104.6% | 1,653,750,010 | |
| Other Assets, Less Liabilities | (4.6) | (73,215,217) | |
| Net Assets | 100.0% | $ 1,580,534,793 | |
| † | Percentages indicated are based on Fund net assets. |
| ^ | Industry classifications may be different than those used for compliance monitoring purposes. |
| ‡ | Less than one-tenth of a percent. |
| (a) | PIK ("Payment-in-Kind")—issuer may pay interest or dividends with additional securities and/or in cash. |
| (b) | May be sold to institutional investors only under Rule 144A or securities offered pursuant to Section 4(a)(2) of the Securities Act of 1933, as amended. |
| (c) | All or a portion of this security was held on loan. As of April 30, 2023, the aggregate market value of securities on loan was $68,643,403. The Fund received cash collateral with a value of $70,047,553. (See Note 2(G)) |
| (d) | Security is perpetual and, thus, does not have a predetermined maturity date. The date shown, if applicable, reflects the next call date. |
| (e) | Non-income producing security. |
| 14 | MainStay MacKay Convertible Fund |
| (f) | As of April 30, 2023, the Fund's ownership exceeds 5% of the outstanding shares of the Underlying Fund's share class. |
| (g) | Current yield as of April 30, 2023. |
| (h) | Represents a security purchased with cash collateral received for securities on loan. |
| Affiliated Investment Companies | Value, Beginning of Period | Purchases at Cost | Proceeds from Sales | Net Realized Gain/(Loss) on Sales | Change in Unrealized Appreciation/ (Depreciation) | Value, End of Period | Dividend Income | Other Distributions | Shares End of Period |
| MainStay U.S. Government Liquidity Fund | $ 90,286 | $ 298,123 | $ (215,464) | $ — | $ — | $ 172,945 | $ 2,344 | $ — | 172,945 |
| Description | Quoted Prices in Active Markets for Identical Assets (Level 1) | Significant Other Observable Inputs (Level 2) | Significant Unobservable Inputs (Level 3) | Total | |||
| Asset Valuation Inputs | |||||||
| Investments in Securities (a) | |||||||
| Long-Term Bonds | |||||||
| Corporate Bonds | $ — | $ 26,523,493 | $ — | $ 26,523,493 | |||
| Total Corporate Bonds | — | 26,523,493 | — | 26,523,493 | |||
| Convertible Securities | |||||||
| Convertible Bonds | — | 1,237,222,554 | — | 1,237,222,554 | |||
| Convertible Preferred Stocks | 101,119,108 | 6,181,875 | — | 107,300,983 | |||
| Total Convertible Securities | 101,119,108 | 1,243,404,429 | — | 1,344,523,537 | |||
| Common Stocks | 39,710,333 | — | — | 39,710,333 | |||
| Short-Term Investments | |||||||
| Affiliated Investment Company | 172,945,094 | — | — | 172,945,094 | |||
| Unaffiliated Investment Companies | 70,047,553 | — | — | 70,047,553 | |||
| Total Short-Term Investments | 242,992,647 | — | — | 242,992,647 | |||
| Total Investments in Securities | $ 383,822,088 | $ 1,269,927,922 | $ — | $ 1,653,750,010 |
| (a) | For a complete listing of investments and their industries, see the Portfolio of Investments. |
| Assets | |
| Investment in unaffiliated securities, at value (identified cost $1,465,681,397) including securities on loan of $68,643,403 | $1,480,804,916 |
| Investment in affiliated investment companies, at value (identified cost $172,945,094) | 172,945,094 |
| Due from custodian | 3,224,421 |
| Receivables: | |
| Dividends and interest | 5,086,442 |
| Fund shares sold | 1,239,931 |
| Securities lending | 192,127 |
| Other assets | 87,981 |
| Total assets | 1,663,580,912 |
| Liabilities | |
| Cash collateral received for securities on loan | 70,047,553 |
| Payables: | |
| Investment securities purchased | 9,998,320 |
| Fund shares redeemed | 1,754,902 |
| Manager (See Note 3) | 671,470 |
| Transfer agent (See Note 3) | 305,893 |
| NYLIFE Distributors (See Note 3) | 180,955 |
| Professional fees | 40,811 |
| Shareholder communication | 29,767 |
| Custodian | 10,939 |
| Trustees | 450 |
| Accrued expenses | 5,059 |
| Total liabilities | 83,046,119 |
| Net assets | $1,580,534,793 |
| Composition of Net Assets | |
| Shares of beneficial interest outstanding (par value of $.01 per share) unlimited number of shares authorized | $ 908,663 |
| Additional paid-in-capital | 1,547,189,619 |
| 1,548,098,282 | |
| Total distributable earnings (loss) | 32,436,511 |
| Net assets | $1,580,534,793 |
| Class A | |
| Net assets applicable to outstanding shares | $671,994,514 |
| Shares of beneficial interest outstanding | 38,663,118 |
| Net asset value per share outstanding | $ 17.38 |
| Maximum sales charge (5.50% of offering price) | 1.01 |
| Maximum offering price per share outstanding | $ 18.39 |
| Investor Class | |
| Net assets applicable to outstanding shares | $ 41,806,101 |
| Shares of beneficial interest outstanding | 2,406,448 |
| Net asset value per share outstanding | $ 17.37 |
| Maximum sales charge (5.00% of offering price) | 0.91 |
| Maximum offering price per share outstanding | $ 18.28 |
| Class B | |
| Net assets applicable to outstanding shares | $ 4,254,675 |
| Shares of beneficial interest outstanding | 251,488 |
| Net asset value and offering price per share outstanding | $ 16.92 |
| Class C | |
| Net assets applicable to outstanding shares | $ 33,724,440 |
| Shares of beneficial interest outstanding | 1,996,828 |
| Net asset value and offering price per share outstanding | $ 16.89 |
| Class I | |
| Net assets applicable to outstanding shares | $828,755,063 |
| Shares of beneficial interest outstanding | 47,548,431 |
| Net asset value and offering price per share outstanding | $ 17.43 |
| 16 | MainStay MacKay Convertible Fund |
| Investment Income (Loss) | |
| Income | |
| Interest | $ 7,488,445 |
| Dividends-unaffiliated | 3,942,707 |
| Dividends-affiliated | 2,343,738 |
| Securities lending, net | 1,739,704 |
| Total income | 15,514,594 |
| Expenses | |
| Manager (See Note 3) | 4,419,434 |
| Distribution/Service—Class A (See Note 3) | 860,498 |
| Distribution/Service—Investor Class (See Note 3) | 53,306 |
| Distribution/Service—Class B (See Note 3) | 25,383 |
| Distribution/Service—Class C (See Note 3) | 184,671 |
| Transfer agent (See Note 3) | 950,925 |
| Professional fees | 88,538 |
| Registration | 64,229 |
| Trustees | 20,024 |
| Shareholder communication | 17,634 |
| Custodian | 16,202 |
| Miscellaneous | 25,035 |
| Total expenses before waiver/reimbursement | 6,725,879 |
| Expense waiver/reimbursement from Manager (See Note 3) | (329,029) |
| Reimbursement from prior custodian(a) | (3,161) |
| Net expenses | 6,393,689 |
| Net investment income (loss) | 9,120,905 |
| Realized and Unrealized Gain (Loss) | |
| Net realized gain (loss) on unaffiliated investments | 28,693,550 |
| Net change in unrealized appreciation (depreciation) on unaffiliated investments | (54,152,849) |
| Net realized and unrealized gain (loss) | (25,459,299) |
| Net increase (decrease) in net assets resulting from operations | $(16,338,394) |
| (a) | Represents a refund for overbilling of custody fees. |
for the six months ended April 30, 2023 (Unaudited) and the year ended October 31, 2022
| Six months ended April 30, 2023 | Year ended October 31, 2022 | |
| Increase (Decrease) in Net Assets | ||
| Operations: | ||
| Net investment income (loss) | $ 9,120,905 | $ 8,774,161 |
| Net realized gain (loss) | 28,693,550 | 42,015,068 |
| Net change in unrealized appreciation (depreciation) | (54,152,849) | (273,994,065) |
| Net increase (decrease) in net assets resulting from operations | (16,338,394) | (223,204,836) |
| Distributions to shareholders: | ||
| Class A | (24,955,161) | (166,284,769) |
| Investor Class | (1,494,479) | (9,946,970) |
| Class B | (164,503) | (1,897,436) |
| Class C | (1,205,556) | (10,369,117) |
| Class I | (30,243,888) | (192,363,201) |
| Total distributions to shareholders | (58,063,587) | (380,861,493) |
| Capital share transactions: | ||
| Net proceeds from sales of shares | 200,900,475 | 509,415,950 |
| Net asset value of shares issued to shareholders in reinvestment of distributions | 54,376,216 | 348,922,823 |
| Cost of shares redeemed | (225,248,296) | (632,144,077) |
| Increase (decrease) in net assets derived from capital share transactions | 30,028,395 | 226,194,696 |
| Net increase (decrease) in net assets | (44,373,586) | (377,871,633) |
| Net Assets | ||
| Beginning of period | 1,624,908,379 | 2,002,780,012 |
| End of period | $1,580,534,793 | $1,624,908,379 |
| 18 | MainStay MacKay Convertible Fund |
| Six months ended April 30, 2023* | Year Ended October 31, | ||||||||||
| Class A | 2022 | 2021 | 2020 | 2019 | 2018 | ||||||
| Net asset value at beginning of period | $ 18.22 | $ 25.40 | $ 20.90 | $ 17.81 | $ 17.07 | $ 17.75 | |||||
| Net investment income (loss) (a) | 0.09 | 0.07 | 0.05 | 0.06 | 0.12 | 0.15 | |||||
| Net realized and unrealized gain (loss) | (0.28) | (2.50) | 6.01 | 3.47 | 1.60 | 0.40 | |||||
| Total from investment operations | (0.19) | (2.43) | 6.06 | 3.53 | 1.72 | 0.55 | |||||
| Less distributions: | |||||||||||
| From net investment income | (0.20) | (0.26) | (0.13) | (0.13) | (0.15) | (0.22) | |||||
| From net realized gain on investments | (0.45) | (4.49) | (1.43) | (0.31) | (0.83) | (1.01) | |||||
| Total distributions | (0.65) | (4.75) | (1.56) | (0.44) | (0.98) | (1.23) | |||||
| Net asset value at end of period | $ 17.38 | $ 18.22 | $ 25.40 | $ 20.90 | $ 17.81 | $ 17.07 | |||||
| Total investment return (b) | (1.08)% | (11.12)% | 30.06% | 20.27% | 10.75% | 3.28% | |||||
| Ratios (to average net assets)/Supplemental Data: | |||||||||||
| Net investment income (loss) | 1.01%†† | 0.37% | 0.19% | 0.33% | 0.67% | 0.87% | |||||
| Net expenses (c) | 0.94%†† | 0.93% | 0.91% | 0.96% | 0.98% | 0.98% | |||||
| Portfolio turnover rate | 17% | 14% | 49% | 46% | 23% | 43% | |||||
| Net assets at end of period (in 000’s) | $ 671,995 | $ 710,774 | $ 891,433 | $ 657,626 | $ 545,605 | $ 518,381 | |||||
| * | Unaudited. |
| †† | Annualized. |
| (a) | Per share data based on average shares outstanding during the period. |
| (b) | Total investment return is calculated exclusive of sales charges and assumes the reinvestment of dividends and distributions. For periods of less than one year, total return is not annualized. |
| (c) | In addition to the fees and expenses which the Fund bears directly, it also indirectly bears a pro-rata share of the fees and expenses of the underlying funds in which it invests. Such indirect expenses are not included in the above expense ratios. |
| Six months ended April 30, 2023* | Year Ended October 31, | ||||||||||
| Investor Class | 2022 | 2021 | 2020 | 2019 | 2018 | ||||||
| Net asset value at beginning of period | $ 18.21 | $ 25.39 | $ 20.90 | $ 17.80 | $ 17.07 | $ 17.75 | |||||
| Net investment income (loss) (a) | 0.07 | 0.03 | (0.00)‡ | 0.03 | 0.09 | 0.13 | |||||
| Net realized and unrealized gain (loss) | (0.28) | (2.50) | 6.00 | 3.47 | 1.59 | 0.39 | |||||
| Total from investment operations | (0.21) | (2.47) | 6.00 | 3.50 | 1.68 | 0.52 | |||||
| Less distributions: | |||||||||||
| From net investment income | (0.18) | (0.22) | (0.08) | (0.09) | (0.12) | (0.19) | |||||
| From net realized gain on investments | (0.45) | (4.49) | (1.43) | (0.31) | (0.83) | (1.01) | |||||
| Total distributions | (0.63) | (4.71) | (1.51) | (0.40) | (0.95) | (1.20) | |||||
| Net asset value at end of period | $ 17.37 | $ 18.21 | $ 25.39 | $ 20.90 | $ 17.80 | $ 17.07 | |||||
| Total investment return (b) | (1.20)% | (11.31)% | 29.77% | 20.08% | 10.50% | 3.12% | |||||
| Ratios (to average net assets)/Supplemental Data: | |||||||||||
| Net investment income (loss) | 0.77%†† | 0.17% | (0.01)% | 0.13% | 0.51% | 0.72% | |||||
| Net expenses (c) | 1.18%†† | 1.12% | 1.12% | 1.16% | 1.15% | 1.13% | |||||
| Expenses (before waiver/reimbursement) (c) | 1.18%†† | 1.12% | 1.12% | 1.16% | 1.17% | 1.14% | |||||
| Portfolio turnover rate | 17% | 14% | 49% | 46% | 23% | 43% | |||||
| Net assets at end of period (in 000's) | $ 41,806 | $ 43,581 | $ 53,738 | $ 57,829 | $ 59,242 | $ 52,723 | |||||
| * | Unaudited. |
| ‡ | Less than one cent per share. |
| †† | Annualized. |
| (a) | Per share data based on average shares outstanding during the period. |
| (b) | Total investment return is calculated exclusive of sales charges and assumes the reinvestment of dividends and distributions. For periods of less than one year, total return is not annualized. |
| (c) | In addition to the fees and expenses which the Fund bears directly, it also indirectly bears a pro-rata share of the fees and expenses of the underlying funds in which it invests. Such indirect expenses are not included in the above expense ratios. |
| Six months ended April 30, 2023* | Year Ended October 31, | ||||||||||
| Class B | 2022 | 2021 | 2020 | 2019 | 2018 | ||||||
| Net asset value at beginning of period | $ 17.75 | $ 24.95 | $ 20.67 | $ 17.68 | $ 16.98 | $ 17.67 | |||||
| Net investment income (loss) (a) | 0.00‡ | (0.11) | (0.18) | (0.11) | (0.04) | (0.01) | |||||
| Net realized and unrealized gain (loss) | (0.27) | (2.45) | 5.93 | 3.44 | 1.60 | 0.39 | |||||
| Total from investment operations | (0.27) | (2.56) | 5.75 | 3.33 | 1.56 | 0.38 | |||||
| Less distributions: | |||||||||||
| From net investment income | (0.11) | (0.15) | (0.04) | (0.03) | (0.03) | (0.06) | |||||
| From net realized gain on investments | (0.45) | (4.49) | (1.43) | (0.31) | (0.83) | (1.01) | |||||
| Total distributions | (0.56) | (4.64) | (1.47) | (0.34) | (0.86) | (1.07) | |||||
| Net asset value at end of period | $ 16.92 | $ 17.75 | $ 24.95 | $ 20.67 | $ 17.68 | $ 16.98 | |||||
| Total investment return (b) | (1.54)% | (11.97)% | 28.79% | 19.15% | 9.76% | 2.35% | |||||
| Ratios (to average net assets)/Supplemental Data: | |||||||||||
| Net investment income (loss) | 0.02%†† | (0.59)% | (0.76)% | (0.61)% | (0.23)% | (0.03)% | |||||
| Net expenses (c) | 1.93%†† | 1.87% | 1.87% | 1.91% | 1.90% | 1.88% | |||||
| Expenses (before waiver/reimbursement) (c) | 1.93%†† | 1.87% | 1.87% | 1.91% | 1.92% | 1.89% | |||||
| Portfolio turnover rate | 17% | 14% | 49% | 46% | 23% | 43% | |||||
| Net assets at end of period (in 000’s) | $ 4,255 | $ 6,170 | $ 10,226 | $ 10,454 | $ 11,786 | $ 15,051 | |||||
| * | Unaudited. |
| ‡ | Less than one cent per share. |
| †† | Annualized. |
| (a) | Per share data based on average shares outstanding during the period. |
| (b) | Total investment return is calculated exclusive of sales charges and assumes the reinvestment of dividends and distributions. For periods of less than one year, total return is not annualized. |
| (c) | In addition to the fees and expenses which the Fund bears directly, it also indirectly bears a pro-rata share of the fees and expenses of the underlying funds in which it invests. Such indirect expenses are not included in the above expense ratios. |
| Six months ended April 30, 2023* | Year Ended October 31, | ||||||||||
| Class C | 2022 | 2021 | 2020 | 2019 | 2018 | ||||||
| Net asset value at beginning of period | $ 17.72 | $ 24.92 | $ 20.64 | $ 17.65 | $ 16.96 | $ 17.65 | |||||
| Net investment income (loss) (a) | 0.00‡ | (0.11) | (0.18) | (0.11) | (0.04) | (0.00)‡ | |||||
| Net realized and unrealized gain (loss) | (0.27) | (2.45) | 5.93 | 3.44 | 1.59 | 0.38 | |||||
| Total from investment operations | (0.27) | (2.56) | 5.75 | 3.33 | 1.55 | 0.38 | |||||
| Less distributions: | |||||||||||
| From net investment income | (0.11) | (0.15) | (0.04) | (0.03) | (0.03) | (0.06) | |||||
| From net realized gain on investments | (0.45) | (4.49) | (1.43) | (0.31) | (0.83) | (1.01) | |||||
| Total distributions | (0.56) | (4.64) | (1.47) | (0.34) | (0.86) | (1.07) | |||||
| Net asset value at end of period | $ 16.89 | $ 17.72 | $ 24.92 | $ 20.64 | $ 17.65 | $ 16.96 | |||||
| Total investment return (b) | (1.55)% | (11.99)% | 28.84% | 19.18% | 9.71% | 2.35% | |||||
| Ratios (to average net assets)/Supplemental Data: | |||||||||||
| Net investment income (loss) | 0.02%†† | (0.58)% | (0.77)% | (0.61)% | (0.23)% | (0.03)% | |||||
| Net expenses (c) | 1.93%†† | 1.87% | 1.87% | 1.91% | 1.90% | 1.88% | |||||
| Expenses (before waiver/reimbursement) (c) | 1.93%†† | 1.87% | 1.87% | 1.91% | 1.92% | 1.89% | |||||
| Portfolio turnover rate | 17% | 14% | 49% | 46% | 23% | 43% | |||||
| Net assets at end of period (in 000’s) | $ 33,724 | $ 38,837 | $ 55,754 | $ 52,999 | $ 60,891 | $ 80,830 | |||||
| * | Unaudited. |
| ‡ | Less than one cent per share. |
| †† | Annualized. |
| (a) | Per share data based on average shares outstanding during the period. |
| (b) | Total investment return is calculated exclusive of sales charges and assumes the reinvestment of dividends and distributions. For periods of less than one year, total return is not annualized. |
| (c) | In addition to the fees and expenses which the Fund bears directly, it also indirectly bears a pro-rata share of the fees and expenses of the underlying funds in which it invests. Such indirect expenses are not included in the above expense ratios. |
| 20 | MainStay MacKay Convertible Fund |
| Six months ended April 30, 2023* | Year Ended October 31, | ||||||||||
| Class I | 2022 | 2021 | 2020 | 2019 | 2018 | ||||||
| Net asset value at beginning of period | $ 18.27 | $ 25.46 | $ 20.95 | $ 17.85 | $ 17.11 | $ 17.79 | |||||
| Net investment income (loss) (a) | 0.12 | 0.13 | 0.12 | 0.13 | 0.18 | 0.22 | |||||
| Net realized and unrealized gain (loss) | (0.28) | (2.51) | 6.02 | 3.48 | 1.60 | 0.39 | |||||
| Total from investment operations | (0.16) | (2.38) | 6.14 | 3.61 | 1.78 | 0.61 | |||||
| Less distributions: | |||||||||||
| From net investment income | (0.23) | (0.32) | (0.20) | (0.20) | (0.21) | (0.28) | |||||
| From net realized gain on investments | (0.45) | (4.49) | (1.43) | (0.31) | (0.83) | (1.01) | |||||
| Total distributions | (0.68) | (4.81) | (1.63) | (0.51) | (1.04) | (1.29) | |||||
| Net asset value at end of period | $ 17.43 | $ 18.27 | $ 25.46 | $ 20.95 | $ 17.85 | $ 17.11 | |||||
| Total investment return (b) | (0.91)% | (10.84)% | 30.43% | 20.71% | 11.14% | 3.65% | |||||
| Ratios (to average net assets)/Supplemental Data: | |||||||||||
| Net investment income (loss) | 1.34%†† | 0.69% | 0.49% | 0.68% | 1.04% | 1.25% | |||||
| Net expenses (c) | 0.61%†† | 0.61% | 0.61% | 0.61% | 0.61% | 0.61% | |||||
| Expenses (before waiver/reimbursement) (c) | 0.69%†† | 0.68% | 0.66% | 0.71% | 0.73% | 0.73% | |||||
| Portfolio turnover rate | 17% | 14% | 49% | 46% | 23% | 43% | |||||
| Net assets at end of period (in 000’s) | $ 828,755 | $ 825,546 | $ 991,630 | $ 852,739 | $ 773,865 | $ 683,594 | |||||
| * | Unaudited. |
| †† | Annualized. |
| (a) | Per share data based on average shares outstanding during the period. |
| (b) | Total investment return is calculated exclusive of sales charges and assumes the reinvestment of dividends and distributions. Class I shares are not subject to sales charges. For periods of less than one year, total return is not annualized. |
| (c) | In addition to the fees and expenses which the Fund bears directly, it also indirectly bears a pro-rata share of the fees and expenses of the underlying funds in which it invests. Such indirect expenses are not included in the above expense ratios. |
| Class | Commenced Operations |
| Class A | January 3, 1995 |
| Investor Class | February 28, 2008 |
| Class B | May 1, 1986 |
| Class C | September 1, 1998 |
| Class I | November 28, 2008 |
| 22 | MainStay MacKay Convertible Fund |
| • | Level 1—quoted prices (unadjusted) in active markets for an identical asset or liability |
| • | Level 2—other significant observable inputs (including quoted prices for a similar asset or liability in active markets, interest rates and yield curves, prepayment speeds, credit risk, etc.) |
| • | Level 3—significant unobservable inputs (including the Fund's own assumptions about the assumptions that market participants would use in measuring fair value of an asset or liability) |
| • Benchmark yields | • Reported trades |
| • Broker/dealer quotes | • Issuer spreads |
| • Two-sided markets | • Benchmark securities |
| • Bids/offers | • Reference data (corporate actions or material event notices) |
| • Industry and economic events | • Comparable bonds |
| • Monthly payment information |
| 24 | MainStay MacKay Convertible Fund |
| 26 | MainStay MacKay Convertible Fund |
| Class | Expense | Waived |
| Class A | $367,785 | $— |
| Investor Class | 72,863 | — |
| Class B | 8,671 | — |
| Class C | 63,103 | — |
| Class I | 438,503 | — |
| Class I | $3,187,052 | 0.4% |
| Federal Tax Cost | Gross Unrealized Appreciation | Gross Unrealized (Depreciation) | Net Unrealized Appreciation/ (Depreciation) | |
| Investments in Securities | $1,650,173,865 | $124,311,852 | $(120,735,707) | $3,576,145 |
| 2022 | |
| Distributions paid from: | |
| Ordinary Income | $ 65,835,785 |
| Long-Term Capital Gains | 315,025,708 |
| Total | $380,861,493 |
| Class A | Shares | Amount |
| Six-month period ended April 30, 2023: | ||
| Shares sold | 1,272,831 | $ 22,636,131 |
| Shares issued to shareholders in reinvestment of distributions | 1,387,118 | 24,275,012 |
| Shares redeemed | (3,074,450) | (54,455,074) |
| Net increase (decrease) in shares outstanding before conversion | (414,501) | (7,543,931) |
| Shares converted into Class A (See Note 1) | 126,900 | 2,240,958 |
| Shares converted from Class A (See Note 1) | (54,963) | (986,446) |
| Net increase (decrease) | (342,564) | $ (6,289,419) |
| Year ended October 31, 2022: | ||
| Shares sold | 3,750,826 | $ 74,532,551 |
| Shares issued to shareholders in reinvestment of distributions | 8,083,712 | 160,959,710 |
| Shares redeemed | (7,855,742) | (151,662,870) |
| Net increase (decrease) in shares outstanding before conversion | 3,978,796 | 83,829,391 |
| Shares converted into Class A (See Note 1) | 265,425 | 5,163,988 |
| Shares converted from Class A (See Note 1) | (335,288) | (5,961,835) |
| Net increase (decrease) | 3,908,933 | $ 83,031,544 |
| Investor Class | Shares | Amount |
| Six-month period ended April 30, 2023: | ||
| Shares sold | 43,281 | $ 768,163 |
| Shares issued to shareholders in reinvestment of distributions | 85,124 | 1,488,732 |
| Shares redeemed | (93,263) | (1,654,117) |
| Net increase (decrease) in shares outstanding before conversion | 35,142 | 602,778 |
| Shares converted into Investor Class (See Note 1) | 27,655 | 501,628 |
| Shares converted from Investor Class (See Note 1) | (48,954) | (853,304) |
| Net increase (decrease) | 13,843 | $ 251,102 |
| Year ended October 31, 2022: | ||
| Shares sold | 97,525 | $ 1,926,381 |
| Shares issued to shareholders in reinvestment of distributions | 497,142 | 9,905,355 |
| Shares redeemed | (214,831) | (4,107,217) |
| Net increase (decrease) in shares outstanding before conversion | 379,836 | 7,724,519 |
| Shares converted into Investor Class (See Note 1) | 52,537 | 1,002,519 |
| Shares converted from Investor Class (See Note 1) | (156,412) | (3,098,448) |
| Net increase (decrease) | 275,961 | $ 5,628,590 |
| Class B | Shares | Amount |
| Six-month period ended April 30, 2023: | ||
| Shares sold | 583 | $ 9,998 |
| Shares issued to shareholders in reinvestment of distributions | 9,271 | 157,986 |
| Shares redeemed | (34,099) | (588,753) |
| Net increase (decrease) in shares outstanding before conversion | (24,245) | (420,769) |
| Shares converted from Class B (See Note 1) | (71,812) | (1,252,580) |
| Net increase (decrease) | (96,057) | $ (1,673,349) |
| Year ended October 31, 2022: | ||
| Shares sold | 4,956 | $ 106,694 |
| Shares issued to shareholders in reinvestment of distributions | 90,227 | 1,763,027 |
| Shares redeemed | (52,530) | (974,121) |
| Net increase (decrease) in shares outstanding before conversion | 42,653 | 895,600 |
| Shares converted from Class B (See Note 1) | (105,008) | (1,946,782) |
| Net increase (decrease) | (62,355) | $ (1,051,182) |
| Class C | Shares | Amount |
| Six-month period ended April 30, 2023: | ||
| Shares sold | 134,439 | $ 2,320,552 |
| Shares issued to shareholders in reinvestment of distributions | 68,546 | 1,166,092 |
| Shares redeemed | (371,282) | (6,368,223) |
| Net increase (decrease) in shares outstanding before conversion | (168,297) | (2,881,579) |
| Shares converted from Class C (See Note 1) | (26,071) | (453,681) |
| Net increase (decrease) | (194,368) | $ (3,335,260) |
| Year ended October 31, 2022: | ||
| Shares sold | 347,776 | $ 6,600,757 |
| Shares issued to shareholders in reinvestment of distributions | 510,200 | 9,953,997 |
| Shares redeemed | (847,078) | (15,740,177) |
| Net increase (decrease) in shares outstanding before conversion | 10,898 | 814,577 |
| Shares converted from Class C (See Note 1) | (57,418) | (1,065,137) |
| Net increase (decrease) | (46,520) | $ (250,560) |
| 28 | MainStay MacKay Convertible Fund |
| Class I | Shares | Amount |
| Six-month period ended April 30, 2023: | ||
| Shares sold | 9,885,762 | $ 175,165,631 |
| Shares issued to shareholders in reinvestment of distributions | 1,555,416 | 27,288,394 |
| Shares redeemed | (9,114,926) | (162,182,129) |
| Net increase (decrease) in shares outstanding before conversion | 2,326,252 | 40,271,896 |
| Shares converted into Class I (See Note 1) | 54,729 | 985,028 |
| Shares converted from Class I (See Note 1) | (10,311) | (181,603) |
| Net increase (decrease) | 2,370,670 | $ 41,075,321 |
| Year ended October 31, 2022: | ||
| Shares sold | 21,817,856 | $ 426,249,567 |
| Shares issued to shareholders in reinvestment of distributions | 8,343,567 | 166,340,734 |
| Shares redeemed | (24,263,729) | (459,659,692) |
| Net increase (decrease) in shares outstanding before conversion | 5,897,694 | 132,930,609 |
| Shares converted into Class I (See Note 1) | 334,156 | 5,956,868 |
| Shares converted from Class I (See Note 1) | (2,889) | (51,173) |
| Net increase (decrease) | 6,228,961 | $ 138,836,304 |
| 30 | MainStay MacKay Convertible Fund |
| 32 | MainStay MacKay Convertible Fund |
| 34 | MainStay MacKay Convertible Fund |
| 36 | MainStay MacKay Convertible Fund |
1.
| 2. | This Fund is registered for sale in CA, CT, DE, FL, MA, NJ, NY and VT. |
| 3. | An affiliate of New York Life Investment Management LLC. |
| 5022168MS043-23 | MSC10-06/23 |
please log in to newyorklifeinvestments.com/accounts.
| Not FDIC/NCUA Insured | Not a Deposit | May Lose Value | No Bank Guarantee | Not Insured by Any Government Agency |


President

| Average Annual Total Returns for the Period-Ended April 30, 2023 | ||||||||
| Class | Sales Charge | Inception Date | Six Months1 | One Year | Five Years | Ten Years or Since Inception | Gross Expense Ratio2 | |
| Class A Shares | Maximum 4.50% Initial Sales Charge | With sales charges | 1/3/1995 | 1.24% | -2.54% | 2.28% | 3.39% | 0.95% |
| Excluding sales charges | 6.01 | 2.05 | 3.23 | 3.87 | 0.95 | |||
| Investor Class Shares3 | Maximum 4.00% Initial Sales Charge | With sales charges | 2/28/2008 | 1.64 | -1.99 | 2.18 | 3.32 | 1.09 |
| Excluding sales charges | 5.88 | 2.09 | 3.12 | 3.80 | 1.09 | |||
| Class B Shares4 | Maximum 5.00% CDSC | With sales charges | 5/1/1986 | 0.53 | -3.60 | 2.02 | 3.03 | 1.84 |
| if Redeemed Within the First Six Years of Purchase | Excluding sales charges | 5.53 | 1.26 | 2.34 | 3.03 | 1.84 | ||
| Class C Shares | Maximum 1.00% CDSC | With sales charges | 9/1/1998 | 4.53 | 0.29 | 2.34 | 3.01 | 1.84 |
| if Redeemed Within One Year of Purchase | Excluding sales charges | 5.53 | 1.26 | 2.34 | 3.01 | 1.84 | ||
| Class I Shares | No Sales Charge | 1/2/2004 | 6.14 | 2.31 | 3.47 | 4.12 | 0.70 | |
| Class R1 Shares | No Sales Charge | 6/29/2012 | 6.11 | 2.21 | 3.36 | 4.02 | 0.80 | |
| Class R2 Shares | No Sales Charge | 5/1/2008 | 5.96 | 1.94 | 3.13 | 3.75 | 1.05 | |
| Class R3 Shares | No Sales Charge | 2/29/2016 | 5.61 | 1.66 | 2.83 | 5.01 | 1.30 | |
| Class R6 Shares | No Sales Charge | 6/17/2013 | 6.23 | 2.47 | 3.62 | 4.45 | 0.57 | |
| SIMPLE Class Shares | No Sales Charge | 8/31/2020 | 5.81 | 1.69 | N/A | 1.49 | 1.27 | |
| 1. | Not annualized. |
| 2. | The gross expense ratios presented reflect the Fund’s “Total Annual Fund Operating Expenses” from the most recent Prospectus, as supplemented, and may differ from other expense ratios disclosed in this report. |
| 3. | Prior to June 30, 2020, the maximum initial sales charge was 4.50%, which is reflected in the applicable average annual total return figures shown. |
| 4. | Class B shares are closed to all new purchases as well as additional investments by existing Class B shareholders. |
| Benchmark Performance* | Six Months1 | One Year | Five Years | Ten Years |
| ICE BofA U.S. High Yield Constrained Index2 | 5.88% | 1.03% | 3.10% | 3.93% |
| Morningstar High Yield Bond Category Average3 | 5.59 | 0.55 | 2.62 | 3.15 |
| * | Returns for indices reflect no deductions for fees, expenses or taxes, except for foreign withholding taxes where applicable. Results assume reinvestment of all dividends and capital gains. An investment cannot be made directly in an index. |
| 1. | Not annualized. |
| 2. | The ICE BofA U.S. High Yield Constrained Index is the Fund's primary broad-based securities market index for comparison purposes.The ICE BofA U.S. High Yield Constrained Index is a market value-weighted index of all domestic and Yankee high-yield bonds, including deferred interest bonds and payment-in-kind securities. Issuers included in the Index have maturities of one year or more and have a credit rating lower than BBB-/Baa3, but are not in default. No single issuer may constitute greater than 2% of the Index. |
| 3. | The Morningstar High Yield Bond Category Average is representative of funds that concentrate on lower-quality bonds, which are riskier than those of higher-quality companies. These funds primarily invest in U.S. high-income debt securities where at least 65% or more of bond assets are not rated or are rated by a major agency such as Standard & Poor’s or Moody’s at the level of BB and below. Results are based on average total returns of similar funds with all dividends and capital gain distributions reinvested. |
| 6 | MainStay MacKay High Yield Corporate Bond Fund |
| Share Class | Beginning Account Value 11/1/22 | Ending Account Value (Based on Actual Returns and Expenses) 4/30/23 | Expenses Paid During Period1 | Ending Account Value (Based on Hypothetical 5% Annualized Return and Actual Expenses) 4/30/23 | Expenses Paid During Period1 | Net Expense Ratio During Period2 |
| Class A Shares | $1,000.00 | $1,060.10 | $4.90 | $1,020.03 | $4.81 | 0.96% |
| Investor Class Shares | $1,000.00 | $1,058.80 | $5.82 | $1,019.14 | $5.71 | 1.14% |
| Class B Shares | $1,000.00 | $1,055.30 | $9.63 | $1,015.42 | $9.44 | 1.89% |
| Class C Shares | $1,000.00 | $1,055.30 | $9.63 | $1,015.42 | $9.44 | 1.89% |
| Class I Shares | $1,000.00 | $1,061.40 | $3.63 | $1,021.27 | $3.56 | 0.71% |
| Class R1 Shares | $1,000.00 | $1,061.10 | $4.14 | $1,020.78 | $4.06 | 0.81% |
| Class R2 Shares | $1,000.00 | $1,059.60 | $5.41 | $1,019.54 | $5.31 | 1.06% |
| Class R3 Shares | $1,000.00 | $1,056.10 | $6.68 | $1,018.30 | $6.56 | 1.31% |
| Class R6 Shares | $1,000.00 | $1,062.30 | $2.91 | $1,021.97 | $2.86 | 0.57% |
| SIMPLE Class Shares | $1,000.00 | $1,058.10 | $6.43 | $1,018.55 | $6.31 | 1.26% |
| 1. | Expenses are equal to the Fund’s annualized expense ratio of each class multiplied by the average account value over the period, divided by 365 and multiplied by 181 (to reflect the six-month period). The table above represents the actual expenses incurred during the six-month period. In addition to the fees and expenses which the Fund bears directly, it also indirectly bears a pro rata share of the fees and expenses of the underlying funds in which it invests. Such indirect expenses are not included in the above-reported expense figures. |
| 2. | Expenses are equal to the Fund's annualized expense ratio to reflect the six-month period. |

| 1. | CCO Holdings LLC, 4.25%-5.375%, due 5/1/27–1/15/34 |
| 2. | Carnival Corp., 4.00%-10.50%, due 2/1/26–5/1/29 |
| 3. | TransDigm, Inc., 4.625%-7.50%, due 3/15/26–5/1/29 |
| 4. | HCA, Inc., 5.25%-8.36%, due 4/15/24–11/6/33 |
| 5. | Yum! Brands, Inc., 3.625%-5.375%, due 1/15/30–4/1/32 |
| 6. | IHO Verwaltungs GmbH, 4.75%-6.375%, due 9/15/26–5/15/29 |
| 7. | Sprint Capital Corp., 6.875%, due 11/15/28 |
| 8. | VICI Properties LP, 3.875%-5.75%, due 5/1/24–2/15/29 |
| 9. | Gulfport Energy Corp. |
| 10. | MSCI, Inc., 3.25%-4.00%, due 11/15/29–8/15/33 |
| 8 | MainStay MacKay High Yield Corporate Bond Fund |
| 1. | See "Investment and Performance Comparison" for other share class returns, which may be higher or lower than Class I share returns, and for more information on benchmark and peer group returns. |
| 2. | The terms “spread” and “yield spread” may refer to the difference in yield between a security or type of security and comparable U.S. Treasury issues. The terms may also refer to the difference in yield between two specific securities or types of securities at a given time. |
| 3. | An obligation rated ‘CCC’ by Standard & Poor’s (“S&P”) is deemed by S&P to be currently vulnerable to nonpayment and is dependent upon favorable business, financial and economic conditions for the obligor to meet its financial commitment on the obligation. It is the opinion of S&P that in the event of adverse business, financial or economic conditions, the obligor is not likely to have the capacity to meet its financial commitment on the obligation. When applied to Fund holdings, ratings are based solely on the creditworthiness of the bonds in the portfolio and are not meant to represent the security or safety of the Fund. |
| 4. | Duration is a measure of the price sensitivity of a fixed-income investment to changes in interest rates. Duration is expressed as a number of years and is considered a more accurate sensitivity gauge than average maturity. |
| 5. | Modified duration is inversely related to the approximate percentage change in price for a given change in yield. Duration to worst is the duration of a bond computed using the bond’s nearest call date or maturity, whichever comes first. This measure ignores future cash flow fluctuations due to embedded optionality |
| 10 | MainStay MacKay High Yield Corporate Bond Fund |
| Principal Amount | Value | |
| Long-Term Bonds 91.8% | ||
| Convertible Bonds 0.8% | ||
| Investment Companies 0.1% | ||
| Ares Capital Corp. | ||
| 4.625%, due 3/1/24 | $ 14,285,000 | $ 14,481,419 |
| Media 0.5% | ||
| DISH Network Corp. | ||
| 2.375%, due 3/15/24 | 37,079,000 | 32,212,381 |
| 3.375%, due 8/15/26 | 30,780,000 | 14,651,280 |
| 46,863,661 | ||
| Oil & Gas Services 0.2% | ||
| Forum Energy Technologies, Inc. | ||
| 6.25% (6.25% Cash and 2.75% PIK), due 8/4/25 (a) | 18,220,551 | 17,993,682 |
| Total Convertible Bonds (Cost $95,610,102) | 79,338,762 | |
| Corporate Bonds 86.5% | ||
| Advertising 1.1% | ||
| Lamar Media Corp. | ||
| 3.625%, due 1/15/31 | 35,590,000 | 30,656,692 |
| 3.75%, due 2/15/28 | 21,000,000 | 19,268,194 |
| 4.00%, due 2/15/30 | 24,100,000 | 21,621,315 |
| 4.875%, due 1/15/29 | 8,000,000 | 7,563,229 |
| Outfront Media Capital LLC (b) | ||
| 4.25%, due 1/15/29 | 2,000,000 | 1,713,008 |
| 4.625%, due 3/15/30 | 2,500,000 | 2,110,574 |
| 5.00%, due 8/15/27 | 19,500,000 | 18,004,545 |
| 6.25%, due 6/15/25 | 15,216,000 | 15,229,125 |
| 116,166,682 | ||
| Aerospace & Defense 2.0% | ||
| F-Brasile SpA | ||
| Series XR | ||
| 7.375%, due 8/15/26 (b) | 23,280,000 | 19,497,000 |
| Rolls-Royce plc | ||
| 5.75%, due 10/15/27 (b) | 7,000,000 | 6,985,752 |
| TransDigm UK Holdings plc | ||
| 6.875%, due 5/15/26 | 19,100,000 | 19,217,828 |
| TransDigm, Inc. | ||
| 4.625%, due 1/15/29 | 25,450,000 | 23,032,250 |
| 4.875%, due 5/1/29 | 18,920,000 | 17,193,614 |
| 6.25%, due 3/15/26 (b) | 84,230,000 | 84,628,169 |
| 6.75%, due 8/15/28 (b) | 27,890,000 | 28,323,438 |
| 7.50%, due 3/15/27 | 11,915,000 | 11,974,468 |
| 210,852,519 | ||
| Principal Amount | Value | |
| Agriculture 0.0% ‡ | ||
| Darling Ingredients, Inc. | ||
| 6.00%, due 6/15/30 (b) | $ 2,025,000 | $ 2,003,261 |
| Airlines 0.9% | ||
| American Airlines, Inc. (b) | ||
| 5.50%, due 4/20/26 | 14,000,000 | 13,747,913 |
| 5.75%, due 4/20/29 | 11,500,000 | 10,928,279 |
| Delta Air Lines, Inc. | ||
| 4.50%, due 10/20/25 (b) | 6,556,000 | 6,429,207 |
| 4.75%, due 10/20/28 (b) | 23,500,000 | 22,820,963 |
| 7.00%, due 5/1/25 (b) | 3,506,000 | 3,616,801 |
| 7.375%, due 1/15/26 | 7,000,000 | 7,377,783 |
| Mileage Plus Holdings LLC | ||
| 6.50%, due 6/20/27 (b) | 16,073,500 | 16,047,789 |
| Spirit Loyalty Cayman Ltd. (b) | ||
| 8.00%, due 9/20/25 | 4,487,951 | 4,529,954 |
| 8.00%, due 9/20/25 | 4,000,000 | 4,040,316 |
| 89,539,005 | ||
| Auto Manufacturers 1.8% | ||
| Ford Holdings LLC | ||
| 9.30%, due 3/1/30 | 30,695,000 | 34,915,562 |
| Ford Motor Co. | ||
| 6.10%, due 8/19/32 | 2,730,000 | 2,603,549 |
| Ford Motor Credit Co. LLC | ||
| 3.375%, due 11/13/25 | 10,000,000 | 9,286,594 |
| 4.00%, due 11/13/30 | 25,000,000 | 21,436,647 |
| 4.271%, due 1/9/27 | 7,500,000 | 6,943,310 |
| 4.389%, due 1/8/26 | 2,500,000 | 2,375,220 |
| 5.125%, due 6/16/25 | 13,000,000 | 12,654,716 |
| 5.584%, due 3/18/24 | 3,660,000 | 3,639,157 |
| 6.80%, due 5/12/28 | 14,830,000 | 14,838,869 |
| General Motors Financial Co., Inc. | ||
| 4.35%, due 4/9/25 | 5,000,000 | 4,894,952 |
| 5.25%, due 3/1/26 | 10,000,000 | 9,993,092 |
| JB Poindexter & Co., Inc. | ||
| 7.125%, due 4/15/26 (b) | 51,815,000 | 50,000,957 |
| PM General Purchaser LLC | ||
| 9.50%, due 10/1/28 (b) | 16,585,000 | 15,714,287 |
| 189,296,912 | ||
| Auto Parts & Equipment 2.1% | ||
| Adient Global Holdings Ltd. (b) | ||
| 4.875%, due 8/15/26 | 22,925,000 | 22,027,197 |
| 7.00%, due 4/15/28 | 4,300,000 | 4,409,353 |
| 8.25%, due 4/15/31 | 5,000,000 | 5,121,545 |
| Dealer Tire LLC | ||
| 8.00%, due 2/1/28 (b) | 20,540,000 | 19,050,850 |
| Principal Amount | Value | |
| Corporate Bonds (continued) | ||
| Auto Parts & Equipment (continued) | ||
| IHO Verwaltungs GmbH (a)(b) | ||
| 4.75% (4.75% Cash or 5.50% PIK), due 9/15/26 | $ 34,785,000 | $ 31,309,064 |
| 6.00% (6.00% Cash or 6.75% PIK), due 5/15/27 | 49,074,000 | 45,313,705 |
| 6.375% (6.375% Cash or 7.125% PIK), due 5/15/29 | 40,980,000 | 36,736,901 |
| Real Hero Merger Sub 2, Inc. | ||
| 6.25%, due 2/1/29 (b) | 38,625,000 | 29,065,313 |
| ZF North America Capital, Inc. (b) | ||
| 6.875%, due 4/14/28 | 8,000,000 | 8,233,478 |
| 7.125%, due 4/14/30 | 10,000,000 | 10,321,953 |
| 211,589,359 | ||
| Biotechnology 0.1% | ||
| Grifols Escrow Issuer SA | ||
| 4.75%, due 10/15/28 (b) | 11,595,000 | 9,298,359 |
| Building Materials 1.2% | ||
| Builders FirstSource, Inc. | ||
| 6.375%, due 6/15/32 (b) | 12,850,000 | 12,782,028 |
| James Hardie International Finance DAC | ||
| 5.00%, due 1/15/28 (b) | 31,840,000 | 30,000,974 |
| Knife River Holding Co. | ||
| 7.75%, due 5/1/31 (b) | 16,630,000 | 16,857,831 |
| New Enterprise Stone & Lime Co., Inc. | ||
| 5.25%, due 7/15/28 (b) | 10,300,000 | 9,218,500 |
| PGT Innovations, Inc. | ||
| 4.375%, due 10/1/29 (b) | 17,000,000 | 15,412,200 |
| Summit Materials LLC (b) | ||
| 5.25%, due 1/15/29 | 17,580,000 | 16,704,516 |
| 6.50%, due 3/15/27 | 22,730,000 | 22,616,350 |
| 123,592,399 | ||
| Chemicals 2.5% | ||
| ASP Unifrax Holdings, Inc. (b) | ||
| 5.25%, due 9/30/28 | 15,810,000 | 13,027,756 |
| 7.50%, due 9/30/29 | 21,280,000 | 15,206,736 |
| Avient Corp. (b) | ||
| 5.75%, due 5/15/25 | 8,550,000 | 8,543,783 |
| 7.125%, due 8/1/30 | 13,415,000 | 13,710,278 |
| CVR Partners LP | ||
| 6.125%, due 6/15/28 (b) | 6,175,000 | 5,575,630 |
| GPD Cos., Inc. | ||
| 10.125%, due 4/1/26 (b) | 35,822,000 | 32,760,442 |
| Principal Amount | Value | |
| Chemicals (continued) | ||
| Innophos Holdings, Inc. | ||
| 9.375%, due 2/15/28 (b) | $ 30,636,000 | $ 30,753,409 |
| Iris Holdings, Inc. | ||
| 8.75% (8.75% Cash or 9.50% PIK), due 2/15/26 (a)(b) | 21,105,000 | 19,408,079 |
| Mativ Holdings, Inc. | ||
| 6.875%, due 10/1/26 (b) | 12,500,000 | 11,390,965 |
| NOVA Chemicals Corp. (b) | ||
| 4.875%, due 6/1/24 | 9,810,000 | 9,654,096 |
| 5.25%, due 6/1/27 | 15,600,000 | 14,117,860 |
| Olympus Water US Holding Corp. | ||
| 7.125%, due 10/1/27 (b) | 7,400,000 | 7,053,812 |
| SCIH Salt Holdings, Inc. (b) | ||
| 4.875%, due 5/1/28 | 10,000,000 | 9,004,255 |
| 6.625%, due 5/1/29 | 29,460,000 | 24,561,061 |
| SCIL IV LLC | ||
| 5.375%, due 11/1/26 (b) | 15,000,000 | 13,809,717 |
| SK Invictus Intermediate II SARL | ||
| 5.00%, due 10/30/29 (b) | 27,890,000 | 23,746,104 |
| WR Grace Holdings LLC | ||
| 7.375%, due 3/1/31 (b) | 8,410,000 | 8,422,985 |
| 260,746,968 | ||
| Coal 0.1% | ||
| Coronado Finance Pty. Ltd. | ||
| 10.75%, due 5/15/26 (b) | 8,720,000 | 8,978,112 |
| Commercial Services 2.2% | ||
| Alta Equipment Group, Inc. | ||
| 5.625%, due 4/15/26 (b) | 5,075,000 | 4,680,005 |
| AMN Healthcare, Inc. | ||
| 4.625%, due 10/1/27 (b) | 2,000,000 | 1,864,754 |
| Ashtead Capital, Inc. | ||
| 4.25%, due 11/1/29 (b) | 4,000,000 | 3,731,408 |
| Gartner, Inc. (b) | ||
| 3.75%, due 10/1/30 | 19,870,000 | 17,351,857 |
| 4.50%, due 7/1/28 | 5,000,000 | 4,698,870 |
| Graham Holdings Co. | ||
| 5.75%, due 6/1/26 (b) | 39,695,000 | 39,198,812 |
| Korn Ferry | ||
| 4.625%, due 12/15/27 (b) | 10,685,000 | 10,148,079 |
| MPH Acquisition Holdings LLC (b) | ||
| 5.50%, due 9/1/28 | 8,000,000 | 6,115,603 |
| 5.75%, due 11/1/28 | 13,685,000 | 8,652,105 |
| NESCO Holdings II, Inc. | ||
| 5.50%, due 4/15/29 (b) | 30,734,000 | 27,769,859 |
| Service Corp. International | ||
| 3.375%, due 8/15/30 | 10,000,000 | 8,472,299 |
| 12 | MainStay MacKay High Yield Corporate Bond Fund |
| Principal Amount | Value | |
| Corporate Bonds (continued) | ||
| Commercial Services (continued) | ||
| United Rentals North America, Inc. | ||
| 3.75%, due 1/15/32 | $ 5,500,000 | $ 4,715,981 |
| 3.875%, due 2/15/31 | 16,675,000 | 14,676,810 |
| 4.875%, due 1/15/28 | 10,700,000 | 10,280,574 |
| 5.25%, due 1/15/30 | 2,500,000 | 2,418,020 |
| Williams Scotsman International, Inc. (b) | ||
| 4.625%, due 8/15/28 | 17,500,000 | 16,068,617 |
| 6.125%, due 6/15/25 | 17,550,000 | 17,462,985 |
| WW International, Inc. | ||
| 4.50%, due 4/15/29 (b) | 36,685,000 | 23,412,367 |
| 221,719,005 | ||
| Computers 0.2% | ||
| McAfee Corp. | ||
| 7.375%, due 2/15/30 (b) | 24,660,000 | 20,470,249 |
| Cosmetics & Personal Care 0.3% | ||
| Edgewell Personal Care Co. (b) | ||
| 4.125%, due 4/1/29 | 22,500,000 | 19,931,204 |
| 5.50%, due 6/1/28 | 13,505,000 | 12,924,589 |
| 32,855,793 | ||
| Distribution & Wholesale 0.7% | ||
| G-III Apparel Group Ltd. | ||
| 7.875%, due 8/15/25 (b) | 24,000,000 | 22,581,122 |
| H&E Equipment Services, Inc. | ||
| 3.875%, due 12/15/28 (b) | 7,855,000 | 6,806,829 |
| Ritchie Bros Holdings, Inc. (b) | ||
| 6.75%, due 3/15/28 | 14,290,000 | 14,790,150 |
| 7.75%, due 3/15/31 | 27,245,000 | 28,947,812 |
| 73,125,913 | ||
| Diversified Financial Services 2.2% | ||
| AG TTMT Escrow Issuer LLC | ||
| 8.625%, due 9/30/27 (b) | 27,150,000 | 27,911,557 |
| Credit Acceptance Corp. | ||
| 5.125%, due 12/31/24 (b) | 15,215,000 | 14,494,332 |
| 6.625%, due 3/15/26 | 32,875,000 | 31,417,432 |
| Enact Holdings, Inc. | ||
| 6.50%, due 8/15/25 (b) | 25,600,000 | 25,351,680 |
| Jefferies Finance LLC | ||
| 5.00%, due 8/15/28 (b) | 37,570,000 | 31,590,704 |
| LPL Holdings, Inc. (b) | ||
| 4.00%, due 3/15/29 | 27,810,000 | 24,978,239 |
| 4.375%, due 5/15/31 | 11,000,000 | 9,762,500 |
| 4.625%, due 11/15/27 | 15,750,000 | 14,875,718 |
| Principal Amount | Value | |
| Diversified Financial Services (continued) | ||
| Oxford Finance LLC | ||
| 6.375%, due 2/1/27 (b) | $ 2,500,000 | $ 2,322,643 |
| PennyMac Financial Services, Inc. (b) | ||
| 4.25%, due 2/15/29 | 11,150,000 | 9,162,748 |
| 5.75%, due 9/15/31 | 8,500,000 | 7,098,350 |
| PRA Group, Inc. | ||
| 7.375%, due 9/1/25 (b) | 16,400,000 | 16,295,722 |
| Radian Group, Inc. | ||
| 4.875%, due 3/15/27 | 5,000,000 | 4,754,950 |
| StoneX Group, Inc. | ||
| 8.625%, due 6/15/25 (b) | 9,196,000 | 9,310,950 |
| 229,327,525 | ||
| Electric 1.9% | ||
| Clearway Energy Operating LLC | ||
| 4.75%, due 3/15/28 (b) | 22,940,000 | 21,739,644 |
| DPL, Inc. | ||
| 4.125%, due 7/1/25 | 20,325,000 | 19,537,406 |
| Keystone Power Pass-Through Holders LLC | ||
| 13.00% (1.00% Cash and 12.00% PIK), due 6/1/24 (a)(b)(c) | 8,362,635 | 5,435,713 |
| Leeward Renewable Energy Operations LLC | ||
| 4.25%, due 7/1/29 (b) | 16,665,000 | 15,000,056 |
| NextEra Energy Operating Partners LP | ||
| 3.875%, due 10/15/26 (b) | 17,330,000 | 16,225,212 |
| NRG Energy, Inc. | ||
| 6.625%, due 1/15/27 | 3,220,000 | 3,229,087 |
| Pattern Energy Operations LP | ||
| 4.50%, due 8/15/28 (b) | 17,500,000 | 16,280,707 |
| PG&E Corp. | ||
| 5.00%, due 7/1/28 | 19,460,000 | 18,311,237 |
| 5.25%, due 7/1/30 | 13,000,000 | 11,981,386 |
| Talen Energy Supply LLC | ||
| 8.625%, due 6/1/30 (b) | 14,910,000 | 14,910,000 |
| TransAlta Corp. | ||
| 7.75%, due 11/15/29 | 14,150,000 | 14,858,632 |
| Principal Amount | Value | |
| Corporate Bonds (continued) | ||
| Electric (continued) | ||
| Vistra Corp. (b)(d)(e) | ||
| 7.00% (5 Year Treasury Constant Maturity Rate + 5.74%), due 12/15/26 | $ 11,280,000 | $ 10,116,225 |
| 8.00% (5 Year Treasury Constant Maturity Rate + 6.93%), due 10/15/26 (c) | 31,800,000 | 29,971,500 |
| 197,596,805 | ||
| Electrical Components & Equipment 0.1% | ||
| WESCO Distribution, Inc. | ||
| 7.125%, due 6/15/25 (b) | 6,665,000 | 6,777,652 |
| Engineering & Construction 0.5% | ||
| Great Lakes Dredge & Dock Corp. | ||
| 5.25%, due 6/1/29 (b) | 13,000,000 | 10,225,930 |
| Railworks Holdings LP | ||
| 8.25%, due 11/15/28 (b) | 9,425,000 | 8,947,506 |
| TopBuild Corp. | ||
| 4.125%, due 2/15/32 (b) | 12,000,000 | 10,311,847 |
| Weekley Homes LLC | ||
| 4.875%, due 9/15/28 (b) | 21,580,000 | 18,734,006 |
| 48,219,289 | ||
| Entertainment 3.3% | ||
| Affinity Interactive | ||
| 6.875%, due 12/15/27 (b) | 13,590,000 | 12,224,037 |
| Allen Media LLC | ||
| 10.50%, due 2/15/28 (b) | 14,870,000 | 7,961,175 |
| Boyne USA, Inc. | ||
| 4.75%, due 5/15/29 (b) | 9,465,000 | 8,573,432 |
| Caesars Entertainment, Inc. | ||
| 7.00%, due 2/15/30 (b) | 19,750,000 | 19,926,269 |
| CCM Merger, Inc. | ||
| 6.375%, due 5/1/26 (b) | 5,000,000 | 4,887,500 |
| CDI Escrow Issuer, Inc. | ||
| 5.75%, due 4/1/30 (b) | 20,000,000 | 19,284,524 |
| Churchill Downs, Inc. (b) | ||
| 4.75%, due 1/15/28 | 53,025,000 | 50,214,452 |
| 5.50%, due 4/1/27 | 38,727,000 | 37,780,040 |
| 6.75%, due 5/1/31 | 12,800,000 | 12,883,840 |
| International Game Technology plc | ||
| 6.25%, due 1/15/27 (b) | 25,700,000 | 26,053,375 |
| Jacobs Entertainment, Inc. (b) | ||
| 6.75%, due 2/15/29 | 25,354,000 | 22,057,980 |
| 6.75%, due 2/15/29 | 8,775,000 | 7,634,250 |
| Principal Amount | Value | |
| Entertainment (continued) | ||
| Live Nation Entertainment, Inc. | ||
| 6.50%, due 5/15/27 (b) | $ 41,280,000 | $ 41,745,473 |
| Merlin Entertainments Ltd. | ||
| 5.75%, due 6/15/26 (b) | 35,100,000 | 33,345,000 |
| Midwest Gaming Borrower LLC | ||
| 4.875%, due 5/1/29 (b) | 6,000,000 | 5,370,000 |
| Motion Bondco DAC | ||
| 6.625%, due 11/15/27 (b) | 16,100,000 | 14,573,249 |
| Vail Resorts, Inc. | ||
| 6.25%, due 5/15/25 (b) | 10,095,000 | 10,170,713 |
| 334,685,309 | ||
| Food 1.3% | ||
| B&G Foods, Inc. | ||
| 5.25%, due 4/1/25 | 24,770,000 | 23,403,947 |
| Kraft Heinz Foods Co. | ||
| 3.875%, due 5/15/27 | 2,500,000 | 2,440,733 |
| 6.50%, due 2/9/40 | 17,749,000 | 19,522,348 |
| 6.875%, due 1/26/39 | 21,000,000 | 23,995,613 |
| Land O'Lakes Capital Trust I | ||
| 7.45%, due 3/15/28 (b) | 18,956,000 | 17,866,030 |
| Nathan's Famous, Inc. | ||
| 6.625%, due 11/1/25 (b) | 2,132,000 | 2,126,670 |
| Simmons Foods, Inc. | ||
| 4.625%, due 3/1/29 (b) | 22,340,000 | 18,458,425 |
| United Natural Foods, Inc. | ||
| 6.75%, due 10/15/28 (b) | 26,018,000 | 24,696,286 |
| 132,510,052 | ||
| Food Service 0.3% | ||
| Aramark Services, Inc. | ||
| 6.375%, due 5/1/25 (b) | 26,315,000 | 26,315,000 |
| Forest Products & Paper 0.8% | ||
| Glatfelter Corp. | ||
| 4.75%, due 11/15/29 (b) | 10,550,000 | 7,511,072 |
| Mercer International, Inc. | ||
| 5.125%, due 2/1/29 | 44,710,000 | 37,335,819 |
| 5.50%, due 1/15/26 | 2,585,000 | 2,481,967 |
| Smurfit Kappa Treasury Funding DAC | ||
| 7.50%, due 11/20/25 | 36,120,000 | 37,963,072 |
| 85,291,930 | ||
| Gas 0.5% | ||
| AmeriGas Partners LP | ||
| 5.625%, due 5/20/24 | 15,106,000 | 14,996,051 |
| 14 | MainStay MacKay High Yield Corporate Bond Fund |
| Principal Amount | Value | |
| Corporate Bonds (continued) | ||
| Gas (continued) | ||
| AmeriGas Partners LP (continued) | ||
| 5.75%, due 5/20/27 | $ 13,560,000 | $ 12,803,167 |
| 5.875%, due 8/20/26 | 25,075,000 | 24,180,926 |
| 51,980,144 | ||
| Hand & Machine Tools 0.3% | ||
| Regal Rexnord Corp. (b) | ||
| 6.05%, due 2/15/26 | 7,250,000 | 7,352,346 |
| 6.05%, due 4/15/28 | 7,000,000 | 7,066,471 |
| 6.30%, due 2/15/30 | 5,000,000 | 5,094,058 |
| 6.40%, due 4/15/33 | 3,750,000 | 3,824,195 |
| Werner FinCo LP | ||
| 8.75%, due 7/15/25 (b) | 13,030,000 | 10,404,808 |
| 33,741,878 | ||
| Healthcare-Products 1.2% | ||
| Garden Spinco Corp. | ||
| 8.625%, due 7/20/30 (b) | 15,500,000 | 16,662,506 |
| Hologic, Inc. (b) | ||
| 3.25%, due 2/15/29 | 39,100,000 | 35,144,112 |
| 4.625%, due 2/1/28 | 10,205,000 | 9,922,105 |
| Teleflex, Inc. | ||
| 4.25%, due 6/1/28 (b) | 43,155,000 | 40,455,683 |
| 4.625%, due 11/15/27 | 4,300,000 | 4,138,750 |
| Varex Imaging Corp. | ||
| 7.875%, due 10/15/27 (b) | 17,202,000 | 17,029,980 |
| 123,353,136 | ||
| Healthcare-Services 4.7% | ||
| Acadia Healthcare Co., Inc. (b) | ||
| 5.00%, due 4/15/29 | 10,000,000 | 9,463,700 |
| 5.50%, due 7/1/28 | 10,840,000 | 10,463,869 |
| Catalent Pharma Solutions, Inc. (b) | ||
| 3.125%, due 2/15/29 | 25,000,000 | 21,275,667 |
| 3.50%, due 4/1/30 | 10,500,000 | 8,902,990 |
| 5.00%, due 7/15/27 | 13,395,000 | 12,859,200 |
| Centene Corp. | ||
| 3.00%, due 10/15/30 | 10,000,000 | 8,522,400 |
| 4.625%, due 12/15/29 | 15,070,000 | 14,203,475 |
| CHS/Community Health Systems, Inc. | ||
| 5.25%, due 5/15/30 (b) | 13,100,000 | 10,918,378 |
| DaVita, Inc. (b) | ||
| 3.75%, due 2/15/31 | 15,185,000 | 12,228,087 |
| 4.625%, due 6/1/30 | 16,790,000 | 14,625,249 |
| Encompass Health Corp. | ||
| 4.50%, due 2/1/28 | 25,720,000 | 24,250,241 |
| 4.625%, due 4/1/31 | 8,200,000 | 7,353,081 |
| Principal Amount | Value | |
| Healthcare-Services (continued) | ||
| Encompass Health Corp. (continued) | ||
| 4.75%, due 2/1/30 | $ 24,390,000 | $ 22,491,897 |
| HCA, Inc. | ||
| 5.25%, due 4/15/25 | 7,000,000 | 7,016,183 |
| 5.375%, due 2/1/25 | 26,525,000 | 26,538,105 |
| 5.625%, due 9/1/28 | 10,000,000 | 10,207,950 |
| 5.875%, due 2/15/26 | 20,750,000 | 21,072,920 |
| 7.50%, due 11/6/33 | 44,975,000 | 50,448,084 |
| 7.58%, due 9/15/25 | 11,020,000 | 11,310,635 |
| 7.69%, due 6/15/25 | 31,650,000 | 33,028,299 |
| 8.36%, due 4/15/24 | 4,524,000 | 4,657,885 |
| IQVIA, Inc. (b) | ||
| 5.00%, due 10/15/26 | 30,113,000 | 29,581,560 |
| 5.00%, due 5/15/27 | 5,000,000 | 4,878,406 |
| Legacy LifePoint Health LLC | ||
| 6.75%, due 4/15/25 (b) | 9,700,000 | 9,332,201 |
| LifePoint Health, Inc. | ||
| 5.375%, due 1/15/29 (b) | 17,978,000 | 11,269,610 |
| ModivCare Escrow Issuer, Inc. | ||
| 5.00%, due 10/1/29 (b) | 10,000,000 | 8,065,450 |
| ModivCare, Inc. | ||
| 5.875%, due 11/15/25 (b) | 8,410,000 | 8,035,923 |
| Molina Healthcare, Inc. (b) | ||
| 3.875%, due 11/15/30 | 12,250,000 | 10,806,127 |
| 3.875%, due 5/15/32 | 4,000,000 | 3,427,930 |
| 4.375%, due 6/15/28 | 6,335,000 | 5,937,246 |
| RegionalCare Hospital Partners Holdings, Inc. | ||
| 9.75%, due 12/1/26 (b) | 46,430,000 | 38,611,866 |
| Tenet Healthcare Corp. | ||
| 6.125%, due 6/15/30 (b) | 12,100,000 | 11,968,252 |
| �� | 483,752,866 | |
| Holding Companies-Diversified 0.6% | ||
| Benteler International AG | ||
| 10.50%, due 5/15/28 (b)(f) | 30,550,000 | 31,237,375 |
| Stena International SA | ||
| 6.125%, due 2/1/25 (b) | 34,995,000 | 33,910,155 |
| 65,147,530 | ||
| Home Builders 2.1% | ||
| Adams Homes, Inc. | ||
| 7.50%, due 2/15/25 (b) | 24,475,000 | 23,077,537 |
| Ashton Woods USA LLC | ||
| 6.625%, due 1/15/28 (b) | 4,000,000 | 3,790,000 |
| Brookfield Residential Properties, Inc. | ||
| 6.25%, due 9/15/27 (b) | 17,360,000 | 15,906,100 |
| Principal Amount | Value | |
| Corporate Bonds (continued) | ||
| Home Builders (continued) | ||
| Century Communities, Inc. | ||
| 3.875%, due 8/15/29 (b) | $ 16,245,000 | $ 14,206,318 |
| 6.75%, due 6/1/27 | 26,205,000 | 26,310,003 |
| Installed Building Products, Inc. | ||
| 5.75%, due 2/1/28 (b) | 25,430,000 | 24,005,373 |
| M/I Homes, Inc. | ||
| 3.95%, due 2/15/30 | 6,000,000 | 5,309,820 |
| 4.95%, due 2/1/28 | 7,500,000 | 7,023,076 |
| Meritage Homes Corp. | ||
| 3.875%, due 4/15/29 (b) | 21,415,000 | 19,273,045 |
| 5.125%, due 6/6/27 | 8,515,000 | 8,344,700 |
| Shea Homes LP | ||
| 4.75%, due 2/15/28 | 26,925,000 | 24,501,750 |
| 4.75%, due 4/1/29 | 9,875,000 | 8,792,416 |
| STL Holding Co. LLC | ||
| 7.50%, due 2/15/26 (b) | 12,000,000 | 10,580,761 |
| Winnebago Industries, Inc. | ||
| 6.25%, due 7/15/28 (b) | 30,155,000 | 29,159,885 |
| 220,280,784 | ||
| Household Products & Wares 0.3% | ||
| Central Garden & Pet Co. | ||
| 4.125%, due 10/15/30 | 15,620,000 | 13,387,908 |
| 4.125%, due 4/30/31 (b) | 12,525,000 | 10,547,787 |
| Spectrum Brands, Inc. | ||
| 5.75%, due 7/15/25 | 7,787,000 | 7,713,102 |
| 31,648,797 | ||
| Housewares 0.3% | ||
| Scotts Miracle-Gro Co. (The) | ||
| 4.00%, due 4/1/31 | 21,955,000 | 17,739,975 |
| 4.375%, due 2/1/32 | 7,430,000 | 6,005,335 |
| 4.50%, due 10/15/29 | 10,000,000 | 8,656,957 |
| 32,402,267 | ||
| Insurance 1.0% | ||
| BroadStreet Partners, Inc. | ||
| 5.875%, due 4/15/29 (b) | 11,800,000 | 10,236,820 |
| Fairfax Financial Holdings Ltd. | ||
| 8.30%, due 4/15/26 | 5,435,000 | 5,816,017 |
| Fidelity & Guaranty Life Holdings, Inc. | ||
| 5.50%, due 5/1/25 (b) | 14,850,000 | 14,718,254 |
| MGIC Investment Corp. | ||
| 5.25%, due 8/15/28 | 25,957,000 | 24,805,547 |
| NMI Holdings, Inc. | ||
| 7.375%, due 6/1/25 (b) | 16,000,000 | 16,223,360 |
| Principal Amount | Value | |
| Insurance (continued) | ||
| Ryan Specialty Group LLC | ||
| 4.375%, due 2/1/30 (b) | $ 4,700,000 | $ 4,212,375 |
| USI, Inc. | ||
| 6.875%, due 5/1/25 (b) | 27,670,000 | 27,389,471 |
| 103,401,844 | ||
| Internet 1.8% | ||
| Cars.com, Inc. | ||
| 6.375%, due 11/1/28 (b) | 22,300,000 | 21,013,761 |
| Gen Digital, Inc. (b) | ||
| 6.75%, due 9/30/27 | 10,000,000 | 10,077,196 |
| 7.125%, due 9/30/30 | 10,000,000 | 10,045,090 |
| Netflix, Inc. | ||
| 5.75%, due 3/1/24 | 24,961,000 | 25,053,356 |
| 5.875%, due 11/15/28 | 32,450,000 | 34,091,743 |
| Northwest Fiber LLC | ||
| 4.75%, due 4/30/27 (b) | 5,000,000 | 4,337,500 |
| Uber Technologies, Inc. (b) | ||
| 6.25%, due 1/15/28 | 4,125,000 | 4,162,537 |
| 7.50%, due 5/15/25 | 12,075,000 | 12,256,125 |
| 7.50%, due 9/15/27 | 23,710,000 | 24,456,486 |
| VeriSign, Inc. | ||
| 4.75%, due 7/15/27 | 18,744,000 | 18,434,586 |
| 5.25%, due 4/1/25 | 25,866,000 | 25,975,819 |
| 189,904,199 | ||
| Investment Companies 1.5% | ||
| Compass Group Diversified Holdings LLC (b) | ||
| 5.00%, due 1/15/32 | 12,250,000 | 9,943,977 |
| 5.25%, due 4/15/29 | 34,750,000 | 31,278,385 |
| FS Energy and Power Fund | ||
| 7.50%, due 8/15/23 (b) | 84,732,000 | 84,626,085 |
| Icahn Enterprises LP | ||
| 5.25%, due 5/15/27 | 13,130,000 | 12,373,260 |
| 6.25%, due 5/15/26 | 12,770,000 | 12,565,168 |
| 150,786,875 | ||
| Iron & Steel 1.2% | ||
| Allegheny Ludlum LLC | ||
| 6.95%, due 12/15/25 | 22,688,000 | 22,914,880 |
| Big River Steel LLC | ||
| 6.625%, due 1/31/29 (b) | 32,122,000 | 31,857,466 |
| Mineral Resources Ltd. (b) | ||
| 8.00%, due 11/1/27 | 3,500,000 | 3,564,348 |
| 8.125%, due 5/1/27 | 53,640,000 | 54,094,867 |
| 8.50%, due 5/1/30 | 6,929,000 | 7,050,257 |
| 119,481,818 | ||
| 16 | MainStay MacKay High Yield Corporate Bond Fund |
| Principal Amount | Value | |
| Corporate Bonds (continued) | ||
| Leisure Time 2.3% | ||
| Carnival Corp. (b) | ||
| 4.00%, due 8/1/28 | $ 30,000,000 | $ 26,005,332 |
| 5.75%, due 3/1/27 | 60,790,000 | 50,030,132 |
| 6.00%, due 5/1/29 | 33,500,000 | 26,294,116 |
| 7.625%, due 3/1/26 | 9,110,000 | 8,330,050 |
| 9.875%, due 8/1/27 | 31,843,000 | 32,646,463 |
| 10.50%, due 2/1/26 | 29,445,000 | 30,738,372 |
| Carnival Holdings Bermuda Ltd. | ||
| 10.375%, due 5/1/28 (b) | 16,575,000 | 17,819,517 |
| Royal Caribbean Cruises Ltd. (b) | ||
| 5.375%, due 7/15/27 | 11,400,000 | 10,120,935 |
| 5.50%, due 4/1/28 | 22,000,000 | 19,399,503 |
| 7.25%, due 1/15/30 | 18,215,000 | 18,266,221 |
| 239,650,641 | ||
| Lodging 1.8% | ||
| Boyd Gaming Corp. | ||
| 4.75%, due 12/1/27 | 38,570,000 | 37,223,301 |
| 4.75%, due 6/15/31 (b) | 47,500,000 | 43,489,879 |
| Hilton Domestic Operating Co., Inc. | ||
| 4.00%, due 5/1/31 (b) | 39,340,000 | 34,795,227 |
| 4.875%, due 1/15/30 | 34,110,000 | 32,384,387 |
| 5.375%, due 5/1/25 (b) | 5,000,000 | 4,984,659 |
| 5.75%, due 5/1/28 (b) | 12,500,000 | 12,469,744 |
| Hyatt Hotels Corp. (g) | ||
| 5.375%, due 4/23/25 | 5,000,000 | 5,018,838 |
| 5.75%, due 4/23/30 | 7,000,000 | 7,195,860 |
| Marriott International, Inc. | ||
| Series GG | ||
| 3.50%, due 10/15/32 | 2,200,000 | 1,928,460 |
| Station Casinos LLC | ||
| 4.50%, due 2/15/28 (b) | 7,000,000 | 6,436,010 |
| 185,926,365 | ||
| Machinery—Construction & Mining 0.3% | ||
| Terex Corp. | ||
| 5.00%, due 5/15/29 (b) | 9,000,000 | 8,370,997 |
| Vertiv Group Corp. | ||
| 4.125%, due 11/15/28 (b) | 27,420,000 | 24,751,620 |
| 33,122,617 | ||
| Machinery-Diversified 0.5% | ||
| Briggs & Stratton Corp. Escrow Claim Shares | ||
| 6.875%, due 12/15/20 (h)(i)(j) | 9,200,000 | — |
| Chart Industries, Inc. | ||
| 7.50%, due 1/1/30 (b) | 12,000,000 | 12,360,000 |
| Principal Amount | Value | |
| Machinery-Diversified (continued) | ||
| TK Elevator Holdco GmbH | ||
| 7.625%, due 7/15/28 (b) | $ 12,126,000 | $ 10,846,884 |
| TK Elevator U.S. Newco, Inc. | ||
| 5.25%, due 7/15/27 (b) | 34,910,000 | 32,636,190 |
| 55,843,074 | ||
| Media 5.7% | ||
| Block Communications, Inc. | ||
| 4.875%, due 3/1/28 (b) | 15,000,000 | 12,913,129 |
| Cable One, Inc. | ||
| 4.00%, due 11/15/30 (b) | 37,800,000 | 30,738,960 |
| CCO Holdings LLC | ||
| 4.25%, due 2/1/31 (b) | 36,815,000 | 30,151,883 |
| 4.25%, due 1/15/34 (b) | 28,050,000 | 21,366,816 |
| 4.50%, due 8/15/30 (b) | 42,430,000 | 35,628,450 |
| 4.50%, due 5/1/32 | 46,500,000 | 37,226,709 |
| 4.50%, due 6/1/33 (b) | 14,500,000 | 11,542,186 |
| 4.75%, due 3/1/30 (b) | 31,835,000 | 27,390,710 |
| 5.00%, due 2/1/28 (b) | 24,000,000 | 22,190,222 |
| 5.125%, due 5/1/27 (b) | 41,225,000 | 38,898,658 |
| 5.375%, due 6/1/29 (b) | 13,495,000 | 12,376,506 |
| CSC Holdings LLC (b) | ||
| 5.50%, due 4/15/27 | 3,750,000 | 3,206,277 |
| 5.75%, due 1/15/30 | 23,900,000 | 12,197,221 |
| 6.50%, due 2/1/29 | 14,230,000 | 11,881,097 |
| 7.50%, due 4/1/28 | 8,900,000 | 5,560,591 |
| 11.25%, due 5/15/28 | 15,585,000 | 15,532,011 |
| Diamond Sports Group LLC | ||
| 6.625%, due 8/15/27 (b)(i)(k) | 7,000,000 | 210,000 |
| DIRECTV Financing LLC | ||
| 5.875%, due 8/15/27 (b) | 37,250,000 | 32,689,472 |
| DISH DBS Corp. | ||
| 7.75%, due 7/1/26 | 18,675,000 | 10,788,357 |
| LCPR Senior Secured Financing DAC (b) | ||
| 5.125%, due 7/15/29 | 19,150,000 | 16,402,166 |
| 6.75%, due 10/15/27 | 55,712,000 | 52,920,128 |
| News Corp. (b) | ||
| 3.875%, due 5/15/29 | 43,330,000 | 38,469,674 |
| 5.125%, due 2/15/32 | 11,110,000 | 10,230,062 |
| Sirius XM Radio, Inc. (b) | ||
| 5.00%, due 8/1/27 | 8,000,000 | 7,358,432 |
| 5.50%, due 7/1/29 | 11,590,000 | 10,323,570 |
| Sterling Entertainment Enterprises LLC | ||
| 10.25%, due 1/15/25 (c)(h)(j) | 20,000,000 | 18,638,000 |
| Videotron Ltd. | ||
| 5.375%, due 6/15/24 (b) | 17,850,000 | 17,817,870 |
| Principal Amount | Value | |
| Corporate Bonds (continued) | ||
| Media (continued) | ||
| Virgin Media Finance plc | ||
| 5.00%, due 7/15/30 (b) | $ 19,275,000 | $ 16,242,628 |
| VZ Secured Financing BV | ||
| 5.00%, due 1/15/32 (b) | 18,020,000 | 15,038,022 |
| Ziggo BV | ||
| 4.875%, due 1/15/30 (b) | 7,500,000 | 6,456,981 |
| 582,386,788 | ||
| Metal Fabricate & Hardware 0.3% | ||
| Advanced Drainage Systems, Inc. (b) | ||
| 5.00%, due 9/30/27 | 18,315,000 | 17,513,719 |
| 6.375%, due 6/15/30 | 12,615,000 | 12,480,272 |
| Park-Ohio Industries, Inc. | ||
| 6.625%, due 4/15/27 | 3,500,000 | 2,782,500 |
| 32,776,491 | ||
| Mining 1.6% | ||
| Arconic Corp. | ||
| 6.00%, due 5/15/25 (b) | 8,695,000 | 8,644,658 |
| Century Aluminum Co. | ||
| 7.50%, due 4/1/28 (b) | 34,830,000 | 32,845,885 |
| Compass Minerals International, Inc. (b) | ||
| 4.875%, due 7/15/24 | 7,000,000 | 6,930,000 |
| 6.75%, due 12/1/27 | 31,535,000 | 30,239,778 |
| Constellium SE | ||
| 3.75%, due 4/15/29 (b) | 10,000,000 | 8,607,150 |
| Eldorado Gold Corp. | ||
| 6.25%, due 9/1/29 (b) | 5,000,000 | 4,650,000 |
| First Quantum Minerals Ltd. (b) | ||
| 6.875%, due 10/15/27 | 14,000,000 | 13,591,893 |
| 7.50%, due 4/1/25 | 5,000,000 | 4,987,250 |
| IAMGOLD Corp. | ||
| 5.75%, due 10/15/28 (b) | 37,525,000 | 29,645,500 |
| Novelis Corp. (b) | ||
| 3.875%, due 8/15/31 | 5,000,000 | 4,187,003 |
| 4.75%, due 1/30/30 | 20,208,000 | 18,285,686 |
| 162,614,803 | ||
| Miscellaneous—Manufacturing 0.9% | ||
| Amsted Industries, Inc. | ||
| 5.625%, due 7/1/27 (b) | 24,395,000 | 23,916,220 |
| EnPro Industries, Inc. | ||
| 5.75%, due 10/15/26 | 21,784,000 | 21,348,320 |
| Gates Global LLC | ||
| 6.25%, due 1/15/26 (b) | 6,750,000 | 6,682,500 |
| Principal Amount | Value | |
| Miscellaneous—Manufacturing (continued) | ||
| Hillenbrand, Inc. | ||
| 5.00%, due 9/15/26 (g) | $ 5,000,000 | $ 4,862,950 |
| 5.75%, due 6/15/25 | 7,000,000 | 6,981,100 |
| LSB Industries, Inc. | ||
| 6.25%, due 10/15/28 (b) | 31,805,000 | 27,990,776 |
| 91,781,866 | ||
| Office Furnishings 0.1% | ||
| Interface, Inc. | ||
| 5.50%, due 12/1/28 (b) | 16,952,000 | 13,586,943 |
| Oil & Gas 6.6% | ||
| Ascent Resources Utica Holdings LLC (b) | ||
| 7.00%, due 11/1/26 | 14,500,000 | 14,031,229 |
| 9.00%, due 11/1/27 | 11,295,000 | 13,963,444 |
| California Resources Corp. | ||
| 7.125%, due 2/1/26 (b) | 11,000,000 | 11,110,660 |
| Chevron USA, Inc. | ||
| 3.85%, due 1/15/28 | 5,560,000 | 5,550,933 |
| 3.90%, due 11/15/24 | 4,000,000 | 3,974,945 |
| Civitas Resources, Inc. | ||
| 5.00%, due 10/15/26 (b) | 5,500,000 | 5,170,000 |
| Comstock Resources, Inc. | ||
| 6.75%, due 3/1/29 (b) | 12,120,000 | 10,973,173 |
| Encino Acquisition Partners Holdings LLC | ||
| 8.50%, due 5/1/28 (b) | 41,705,000 | 36,978,586 |
| EQT Corp. | ||
| 6.125%, due 2/1/25 (g) | 14,749,000 | 14,788,380 |
| Gulfport Energy Corp. | ||
| 8.00%, due 5/17/26 | 1,362,721 | 1,366,128 |
| 8.00%, due 5/17/26 (b) | 30,637,302 | 30,713,895 |
| Gulfport Energy Operating Corp. Escrow Claim Shares (h)(i) | ||
| 6.00%, due 10/15/24 | 50,754,000 | — |
| 6.375%, due 5/15/25 | 24,354,000 | — |
| 6.375%, due 1/15/26 | 11,915,000 | — |
| 6.625%, due 5/1/23 | 17,072,000 | — |
| Hilcorp Energy I LP (b) | ||
| 5.75%, due 2/1/29 | 5,000,000 | 4,671,289 |
| 6.00%, due 4/15/30 | 8,000,000 | 7,455,856 |
| 6.25%, due 4/15/32 | 8,750,000 | 8,180,196 |
| Marathon Oil Corp. | ||
| 4.40%, due 7/15/27 | 6,825,000 | 6,664,668 |
| 6.80%, due 3/15/32 | 5,000,000 | 5,326,685 |
| Matador Resources Co. | ||
| 5.875%, due 9/15/26 | 24,545,000 | 24,069,504 |
| 18 | MainStay MacKay High Yield Corporate Bond Fund |
| Principal Amount | Value | |
| Corporate Bonds (continued) | ||
| Oil & Gas (continued) | ||
| Matador Resources Co. (continued) | ||
| 6.875%, due 4/15/28 (b) | $ 5,000,000 | $ 5,031,351 |
| Moss Creek Resources Holdings, Inc. | ||
| 7.50%, due 1/15/26 (b) | 9,465,000 | 8,847,818 |
| Noble Finance II LLC | ||
| 8.00%, due 4/15/30 (b) | 7,500,000 | 7,680,150 |
| Occidental Petroleum Corp. | ||
| 5.55%, due 3/15/26 | 30,505,000 | 30,760,937 |
| 5.875%, due 9/1/25 | 6,000,000 | 6,063,759 |
| 6.125%, due 1/1/31 | 3,000,000 | 3,136,110 |
| 6.375%, due 9/1/28 | 6,635,000 | 6,920,062 |
| 6.45%, due 9/15/36 | 6,850,000 | 7,269,562 |
| 6.625%, due 9/1/30 | 7,270,000 | 7,760,725 |
| 6.95%, due 7/1/24 | 6,672,000 | 6,788,760 |
| 7.15%, due 5/15/28 | 4,000,000 | 4,218,028 |
| Parkland Corp. (b) | ||
| 4.50%, due 10/1/29 | 24,035,000 | 21,060,669 |
| 4.625%, due 5/1/30 | 14,000,000 | 12,181,101 |
| 5.875%, due 7/15/27 | 14,025,000 | 13,657,096 |
| PDC Energy, Inc. | ||
| 6.125%, due 9/15/24 | 11,454,000 | 11,367,914 |
| Permian Resources Operating LLC (b) | ||
| 5.375%, due 1/15/26 | 18,867,000 | 17,957,652 |
| 6.875%, due 4/1/27 | 23,400,000 | 23,166,000 |
| 7.75%, due 2/15/26 | 20,645,000 | 20,877,256 |
| ROCC Holdings LLC | ||
| 9.25%, due 8/15/26 (b) | 9,795,000 | 10,505,136 |
| Rockcliff Energy II LLC | ||
| 5.50%, due 10/15/29 (b) | 42,725,000 | 38,637,072 |
| Southwestern Energy Co. | ||
| 5.375%, due 3/15/30 | 15,330,000 | 14,266,719 |
| 5.70%, due 1/23/25 (g) | 3,504,000 | 3,496,799 |
| Sunoco LP | ||
| 6.00%, due 4/15/27 | 18,965,000 | 18,861,162 |
| Talos Production, Inc. | ||
| 12.00%, due 1/15/26 | 81,465,000 | 86,149,237 |
| Transocean Poseidon Ltd. | ||
| 6.875%, due 2/1/27 (b) | 30,505,313 | 29,755,460 |
| Transocean, Inc. | ||
| 8.75%, due 2/15/30 (b) | 30,585,000 | 30,859,959 |
| Viper Energy Partners LP | ||
| 5.375%, due 11/1/27 (b) | 9,425,000 | 9,110,674 |
| Principal Amount | Value | |
| Oil & Gas (continued) | ||
| Vital Energy, Inc. | ||
| 7.75%, due 7/31/29 (b) | $ 17,830,000 | $ 15,740,324 |
| 10.125%, due 1/15/28 | 1,810,000 | 1,819,629 |
| 678,936,692 | ||
| Oil & Gas Services 0.9% | ||
| Bristow Group, Inc. | ||
| 6.875%, due 3/1/28 (b) | 30,000,000 | 28,623,552 |
| Nine Energy Service, Inc. | ||
| 13.00%, due 2/1/28 | 30,200,000 | 27,784,000 |
| Weatherford International Ltd. (b) | ||
| 6.50%, due 9/15/28 | 21,645,000 | 21,645,000 |
| 8.625%, due 4/30/30 | 14,595,000 | 14,866,763 |
| 92,919,315 | ||
| Packaging & Containers 0.5% | ||
| ARD Finance SA | ||
| 6.50% (6.50% Cash or 7.25% PIK), due 6/30/27 (a)(b) | 13,208,936 | 10,824,930 |
| Cascades, Inc. (b) | ||
| 5.125%, due 1/15/26 | 11,306,000 | 10,743,012 |
| 5.375%, due 1/15/28 | 23,385,000 | 22,187,220 |
| Sealed Air Corp. | ||
| 6.125%, due 2/1/28 (b) | 6,230,000 | 6,321,587 |
| 50,076,749 | ||
| Pharmaceuticals 2.9% | ||
| 1375209 BC Ltd. | ||
| 9.00%, due 1/30/28 (b) | 8,000,000 | 7,920,000 |
| 180 Medical, Inc. | ||
| 3.875%, due 10/15/29 (b) | 20,670,000 | 18,407,770 |
| Bausch Health Cos., Inc. (b) | ||
| 7.00%, due 1/15/28 | 7,000,000 | 3,202,500 |
| 7.25%, due 5/30/29 | 5,000,000 | 2,406,375 |
| 11.00%, due 9/30/28 | 20,687,000 | 16,678,894 |
| 14.00%, due 10/15/30 | 1,974,000 | 1,263,360 |
| BellRing Brands, Inc. | ||
| 7.00%, due 3/15/30 (b) | 18,880,000 | 19,342,148 |
| Jazz Securities DAC | ||
| 4.375%, due 1/15/29 (b) | 49,390,000 | 45,392,620 |
| Organon & Co. (b) | ||
| 4.125%, due 4/30/28 | 25,000,000 | 23,000,112 |
| 5.125%, due 4/30/31 | 20,000,000 | 17,820,870 |
| Owens & Minor, Inc. (b) | ||
| 4.50%, due 3/31/29 | 24,155,000 | 19,373,033 |
| 6.625%, due 4/1/30 | 42,780,000 | 37,218,600 |
| Par Pharmaceutical, Inc. | ||
| 7.50%, due 4/1/27 (b)(i)(k) | 53,067,000 | 37,600,890 |
| Principal Amount | Value | |
| Corporate Bonds (continued) | ||
| Pharmaceuticals (continued) | ||
| Prestige Brands, Inc. (b) | ||
| 3.75%, due 4/1/31 | $ 33,125,000 | $ 28,075,425 |
| 5.125%, due 1/15/28 | 26,650,000 | 25,847,035 |
| 303,549,632 | ||
| Pipelines 4.9% | ||
| ANR Pipeline Co. | ||
| 7.375%, due 2/15/24 | 2,555,000 | 2,569,270 |
| Antero Midstream Partners LP (b) | ||
| 5.375%, due 6/15/29 | 5,500,000 | 5,150,111 |
| 5.75%, due 3/1/27 | 4,000,000 | 3,869,270 |
| 5.75%, due 1/15/28 | 8,000,000 | 7,749,120 |
| CNX Midstream Partners LP | ||
| 4.75%, due 4/15/30 (b) | 3,500,000 | 2,930,329 |
| Crestwood Midstream Partners LP | ||
| 8.00%, due 4/1/29 (b) | 6,500,000 | 6,613,750 |
| DT Midstream, Inc. (b) | ||
| 4.125%, due 6/15/29 | 3,500,000 | 3,101,885 |
| 4.375%, due 6/15/31 | 12,205,000 | 10,612,428 |
| Energy Transfer LP | ||
| 4.40%, due 3/15/27 | 14,700,000 | 14,334,574 |
| 4.95%, due 5/15/28 | 16,000,000 | 15,859,793 |
| EnLink Midstream LLC | ||
| 6.50%, due 9/1/30 (b) | 6,220,000 | 6,283,257 |
| EQM Midstream Partners LP (b) | ||
| 4.50%, due 1/15/29 | 5,000,000 | 4,249,182 |
| 4.75%, due 1/15/31 | 10,000,000 | 8,195,711 |
| 6.00%, due 7/1/25 | 4,497,000 | 4,418,000 |
| 6.50%, due 7/1/27 | 8,900,000 | 8,677,577 |
| 7.50%, due 6/1/27 | 5,000,000 | 4,982,098 |
| 7.50%, due 6/1/30 | 4,935,000 | 4,790,236 |
| FTAI Infra Escrow Holdings LLC | ||
| 10.50%, due 6/1/27 (b) | 20,100,000 | 20,301,000 |
| Genesis Energy LP | ||
| 6.25%, due 5/15/26 | 13,670,000 | 13,170,830 |
| 7.75%, due 2/1/28 | 25,065,000 | 24,669,808 |
| 8.00%, due 1/15/27 | 31,684,000 | 31,618,069 |
| 8.875%, due 4/15/30 | 3,340,000 | 3,344,479 |
| Harvest Midstream I LP | ||
| 7.50%, due 9/1/28 (b) | 26,675,000 | 26,100,162 |
| Hess Midstream Operations LP (b) | ||
| 4.25%, due 2/15/30 | 4,000,000 | 3,556,360 |
| 5.625%, due 2/15/26 | 1,000,000 | 984,330 |
| Holly Energy Partners LP (b) | ||
| 5.00%, due 2/1/28 | 9,870,000 | 9,201,702 |
| 6.375%, due 4/15/27 | 10,625,000 | 10,465,212 |
| Principal Amount | Value | |
| Pipelines (continued) | ||
| ITT Holdings LLC | ||
| 6.50%, due 8/1/29 (b) | $ 22,620,000 | $ 18,780,707 |
| MPLX LP | ||
| 4.875%, due 12/1/24 | 12,000,000 | 11,953,944 |
| New Fortress Energy, Inc. | ||
| 6.50%, due 9/30/26 (b) | 12,930,000 | 11,906,337 |
| NGL Energy Operating LLC | ||
| 7.50%, due 2/1/26 (b) | 19,350,000 | 18,552,981 |
| NGPL PipeCo LLC | ||
| 4.875%, due 8/15/27 (b) | 5,000,000 | 4,868,922 |
| NuStar Logistics LP | ||
| 5.75%, due 10/1/25 | 3,000,000 | 2,942,199 |
| 6.00%, due 6/1/26 | 15,000,000 | 14,761,050 |
| Plains All American Pipeline LP | ||
| Series B | ||
| 8.974% (3 Month LIBOR + 4.11%), due 5/30/23 (c)(d)(e) | 45,303,000 | 39,866,640 |
| Rockies Express Pipeline LLC (b) | ||
| 3.60%, due 5/15/25 | 1,000,000 | 947,787 |
| 4.80%, due 5/15/30 | 13,780,000 | 12,260,943 |
| Summit Midstream Holdings LLC | ||
| 8.50%, due 10/15/26 (b) | 29,715,000 | 28,526,400 |
| Tallgrass Energy Partners LP (b) | ||
| 5.50%, due 1/15/28 | 5,000,000 | 4,625,839 |
| 6.00%, due 3/1/27 | 19,000,000 | 18,331,722 |
| 7.50%, due 10/1/25 | 8,500,000 | 8,564,775 |
| Targa Resources Partners LP | ||
| 6.50%, due 7/15/27 | 5,116,000 | 5,212,927 |
| TransMontaigne Partners LP | ||
| 6.125%, due 2/15/26 | 26,447,000 | 22,998,840 |
| Western Midstream Operating LP | ||
| 4.65%, due 7/1/26 | 5,000,000 | 4,861,001 |
| 4.75%, due 8/15/28 | 12,000,000 | 11,513,860 |
| 5.50%, due 2/1/50 (g) | 3,000,000 | 2,545,119 |
| 501,820,536 | ||
| Real Estate 0.6% | ||
| Howard Hughes Corp. (The) (b) | ||
| 4.125%, due 2/1/29 | 5,000,000 | 4,203,200 |
| 4.375%, due 2/1/31 | 5,000,000 | 4,050,710 |
| Newmark Group, Inc. | ||
| 6.125%, due 11/15/23 | 43,914,000 | 43,652,273 |
| Realogy Group LLC | ||
| 5.25%, due 4/15/30 (b) | 11,500,000 | 8,199,018 |
| 60,105,201 | ||
| Real Estate Investment Trusts 2.3% | ||
| CTR Partnership LP | ||
| 3.875%, due 6/30/28 (b) | 12,425,000 | 10,809,750 |
| 20 | MainStay MacKay High Yield Corporate Bond Fund |
| Principal Amount | Value | |
| Corporate Bonds (continued) | ||
| Real Estate Investment Trusts (continued) | ||
| GLP Capital LP | ||
| 5.25%, due 6/1/25 | $ 10,000,000 | $ 9,813,134 |
| 5.30%, due 1/15/29 | 14,080,000 | 13,580,019 |
| 5.375%, due 4/15/26 | 5,620,000 | 5,562,929 |
| Host Hotels & Resorts LP | ||
| Series I | ||
| 3.50%, due 9/15/30 | 9,090,000 | 7,739,585 |
| MPT Operating Partnership LP | ||
| 4.625%, due 8/1/29 | 14,240,000 | 10,779,998 |
| 5.00%, due 10/15/27 | 32,835,000 | 27,504,549 |
| 5.25%, due 8/1/26 | 10,000,000 | 8,905,452 |
| RHP Hotel Properties LP | ||
| 4.50%, due 2/15/29 (b) | 9,255,000 | 8,333,665 |
| 4.75%, due 10/15/27 | 28,050,000 | 26,367,000 |
| VICI Properties LP (b) | ||
| 3.875%, due 2/15/29 | 16,975,000 | 15,254,161 |
| 4.625%, due 6/15/25 | 13,000,000 | 12,627,769 |
| 5.625%, due 5/1/24 | 54,960,000 | 54,691,586 |
| 5.75%, due 2/1/27 | 26,800,000 | 26,627,906 |
| 238,597,503 | ||
| Retail 5.4% | ||
| 1011778 B.C. Unlimited Liability Co. (b) | ||
| 3.875%, due 1/15/28 | 26,885,000 | 25,216,460 |
| 4.00%, due 10/15/30 | 55,052,000 | 48,059,378 |
| Asbury Automotive Group, Inc. | ||
| 4.50%, due 3/1/28 | 23,137,000 | 21,018,492 |
| 4.625%, due 11/15/29 (b) | 13,005,000 | 11,574,597 |
| 4.75%, due 3/1/30 | 17,525,000 | 15,553,134 |
| 5.00%, due 2/15/32 (b) | 10,850,000 | 9,348,730 |
| CEC Entertainment LLC | ||
| 6.75%, due 5/1/26 (b) | 19,390,000 | 18,432,080 |
| Dave & Buster's, Inc. | ||
| 7.625%, due 11/1/25 (b) | 9,240,000 | 9,394,216 |
| Group 1 Automotive, Inc. | ||
| 4.00%, due 8/15/28 (b) | 17,000,000 | 15,085,140 |
| Ken Garff Automotive LLC | ||
| 4.875%, due 9/15/28 (b) | 26,535,000 | 23,175,002 |
| KFC Holding Co. | ||
| 4.75%, due 6/1/27 (b) | 18,287,000 | 17,990,751 |
| LCM Investments Holdings II LLC | ||
| 4.875%, due 5/1/29 (b) | 51,000,000 | 43,477,668 |
| Murphy Oil USA, Inc. | ||
| 4.75%, due 9/15/29 | 7,500,000 | 6,956,250 |
| 5.625%, due 5/1/27 | 10,417,000 | 10,260,745 |
| Principal Amount | Value | |
| Retail (continued) | ||
| NMG Holding Co., Inc. | ||
| 7.125%, due 4/1/26 (b) | $ 85,205,000 | $ 79,178,050 |
| Papa John's International, Inc. | ||
| 3.875%, due 9/15/29 (b) | 18,284,000 | 15,798,385 |
| Patrick Industries, Inc. (b) | ||
| 4.75%, due 5/1/29 | 6,760,000 | 5,881,200 |
| 7.50%, due 10/15/27 | 21,040,000 | 20,675,380 |
| Sonic Automotive, Inc. (b) | ||
| 4.625%, due 11/15/29 | 11,890,000 | 9,974,100 |
| 4.875%, due 11/15/31 | 10,795,000 | 8,716,962 |
| Ultra Resources, Inc. Escrow Claim Shares | ||
| 6.875%, due 4/15/22 (b)(c)(h)(i) | 28,880,000 | — |
| Yum! Brands, Inc. | ||
| 3.625%, due 3/15/31 | 40,870,000 | 36,100,561 |
| 4.625%, due 1/31/32 | 40,600,000 | 37,858,323 |
| 4.75%, due 1/15/30 (b) | 33,885,000 | 32,777,704 |
| 5.375%, due 4/1/32 | 30,000,000 | 29,263,152 |
| 551,766,460 | ||
| Software 3.8% | ||
| ACI Worldwide, Inc. | ||
| 5.75%, due 8/15/26 (b) | 13,784,000 | 13,732,310 |
| Camelot Finance SA | ||
| 4.50%, due 11/1/26 (b) | 16,990,000 | 16,090,871 |
| Central Parent, Inc. | ||
| 7.25%, due 6/15/29 (b) | 2,000,000 | 1,980,278 |
| Clarivate Science Holdings Corp. (b) | ||
| 3.875%, due 7/1/28 | 31,609,000 | 28,441,775 |
| 4.875%, due 7/1/29 | 57,521,000 | 51,802,935 |
| CWT Travel Group, Inc. (b) | ||
| 8.50%, due 11/19/26 | 10,580,000 | 7,460,001 |
| 8.50%, due 11/19/26 | 8,513,374 | 6,002,815 |
| Fair Isaac Corp. | ||
| 5.25%, due 5/15/26 (b) | 12,250,000 | 12,050,937 |
| MSCI, Inc. (b) | ||
| 3.25%, due 8/15/33 | 13,095,000 | 10,639,687 |
| 3.625%, due 9/1/30 | 28,645,000 | 24,711,182 |
| 3.625%, due 11/1/31 | 7,000,000 | 5,950,980 |
| 3.875%, due 2/15/31 | 39,000,000 | 34,164,780 |
| 4.00%, due 11/15/29 | 32,330,000 | 29,130,300 |
| Open Text Corp. (b) | ||
| 3.875%, due 2/15/28 | 19,385,000 | 17,177,242 |
| 3.875%, due 12/1/29 | 13,000,000 | 10,925,710 |
| 6.90%, due 12/1/27 | 12,340,000 | 12,745,406 |
| Open Text Holdings, Inc. | ||
| 4.125%, due 2/15/30 (b) | 31,547,000 | 26,937,422 |
| Principal Amount | Value | |
| Corporate Bonds (continued) | ||
| Software (continued) | ||
| PTC, Inc. (b) | ||
| 3.625%, due 2/15/25 | $ 11,000,000 | $ 10,608,216 |
| 4.00%, due 2/15/28 | 35,619,000 | 33,119,452 |
| SS&C Technologies, Inc. | ||
| 5.50%, due 9/30/27 (b) | 24,745,000 | 23,951,081 |
| Veritas US, Inc. | ||
| 7.50%, due 9/1/25 (b) | 19,585,000 | 14,861,384 |
| 392,484,764 | ||
| Telecommunications 3.1% | ||
| Connect Finco SARL | ||
| 6.75%, due 10/1/26 (b) | 56,200,000 | 53,561,579 |
| Frontier Communications Holdings LLC | ||
| 8.625%, due 3/15/31 (b) | 13,140,000 | 12,803,424 |
| Hughes Satellite Systems Corp. | ||
| 6.625%, due 8/1/26 | 8,000,000 | 7,555,920 |
| Sprint Capital Corp. | ||
| 6.875%, due 11/15/28 | 104,520,000 | 112,681,122 |
| Sprint LLC | ||
| 7.875%, due 9/15/23 | 46,900,000 | 47,279,660 |
| T-Mobile USA, Inc. | ||
| 2.625%, due 2/15/29 | 6,790,000 | 6,000,501 |
| 2.875%, due 2/15/31 | 13,275,000 | 11,502,660 |
| 4.75%, due 2/1/28 | 37,055,000 | 36,871,752 |
| 5.375%, due 4/15/27 | 33,000,000 | 33,305,976 |
| 321,562,594 | ||
| Toys, Games & Hobbies 0.2% | ||
| Mattel, Inc. | ||
| 5.875%, due 12/15/27 (b) | 22,275,000 | 22,302,421 |
| Transportation 0.7% | ||
| Seaspan Corp. | ||
| 5.50%, due 8/1/29 (b) | 23,615,000 | 18,892,000 |
| Watco Cos. LLC | ||
| 6.50%, due 6/15/27 (b) | 49,875,000 | 48,363,018 |
| XPO Escrow Sub LLC | ||
| 7.50%, due 11/15/27 (b) | 5,000,000 | 5,124,922 |
| 72,379,940 | ||
| Total Corporate Bonds (Cost $9,521,308,179) | 8,921,031,631 | |
| Principal Amount | Value | |
| Loan Assignments 4.5% | ||
| Automobile 0.1% | ||
| Dealer Tire Financial LLC | ||
| Term Loan B2 | ||
| 9.482% (1 Month SOFR + 4.50%), due 12/14/27 (d) | $ 10,972,500 | $ 10,899,346 |
| Beverage, Food & Tobacco 0.1% | ||
| United Natural Foods, Inc. | ||
| Initial Term Loan | ||
| 8.347% (1 Month SOFR + 3.25%), due 10/22/25 (d) | 10,714,378 | 10,714,378 |
| Chemicals, Plastics & Rubber 0.2% | ||
| Jazz Pharmaceuticals plc | ||
| Initial Dollar Term Loan | ||
| 8.525% (1 Month LIBOR + 3.50%), due 5/5/28 (d) | 20,690,121 | 20,656,168 |
| Electronics 0.1% | ||
| Camelot U.S. Acquisition 1 Co. (d) | ||
| Initial Term Loan | ||
| 8.025% (1 Month LIBOR + 3.00%), due 10/30/26 | 4,055,174 | 4,049,261 |
| Amendment No. 2 Incremental Term Loan | ||
| 8.025% (1 Month LIBOR + 3.00%), due 10/30/26 | 4,122,187 | 4,116,004 |
| 8,165,265 | ||
| Energy (Electricity) 0.1% | ||
| Talen Energy Supply LLC | ||
| Term Loan B | ||
| 9.59%, due 4/26/30 | 5,965,714 | 5,824,029 |
| Term Loan C | ||
| 9.59%, due 4/26/30 | 4,834,286 | 4,719,471 |
| 10,543,500 | ||
| Finance 0.3% | ||
| Aretec Group, Inc. | ||
| Incremental Term Loan | ||
| TBD, due 3/8/30 | 15,500,000 | 15,280,412 |
| RealTruck Group, Inc. | ||
| Initial Term Loan | ||
| 8.775% (1 Month LIBOR + 3.75%), due 1/31/28 (d) | 18,418,199 | 16,714,515 |
| 31,994,927 | ||
| 22 | MainStay MacKay High Yield Corporate Bond Fund |
| Principal Amount | Value | |
| Loan Assignments (continued) | ||
| Healthcare, Education & Childcare 0.5% | ||
| Endo Luxembourg Finance Co. I SARL | ||
| 2021 Term Loan | ||
| 14.00% (1 Month LIBOR + 6.00%), due 3/27/28 (d) | $ 10,000,000 | $ 7,312,500 |
| LifePoint Health, Inc. | ||
| First Lien Term Loan B | ||
| 9.023% (3 Month LIBOR + 3.75%), due 11/16/25 (d) | 35,503,924 | 33,344,113 |
| Organon & Co. | ||
| Dollar Term Loan | ||
| 8.00% (3 Month LIBOR + 3.00%), due 6/2/28 (d) | 9,322,500 | 9,299,194 |
| 49,955,807 | ||
| High Tech Industries 0.2% | ||
| Open Text Corp. | ||
| Term Loan B | ||
| 8.582% (1 Month SOFR + 3.50%), due 1/31/30 (d) | 20,448,750 | 20,423,189 |
| Insurance 0.2% | ||
| USI, Inc. | ||
| 2022 Incremental Term Loan | ||
| 8.648% (3 Month SOFR + 3.75%), due 11/22/29 (d) | 16,915,000 | 16,865,659 |
| Leisure, Amusement, Motion Pictures & Entertainment 0.0% ‡ | ||
| NASCAR Holdings LLC | ||
| Initial Term Loan | ||
| 7.34% (1 Month SOFR + 2.50%), due 10/19/26 (d) | 2,779,574 | 2,782,354 |
| Manufacturing 0.0% ‡ | ||
| Adient U.S. LLC | ||
| Term Loan B1 | ||
| 8.347% (1 Month SOFR + 3.25%), due 4/10/28 (d) | 6,443,411 | 6,436,362 |
| Media 0.4% | ||
| DIRECTV Financing LLC | ||
| Closing Date Term Loan | ||
| 10.025% (1 Month LIBOR + 5.00%), due 8/2/27 (d) | 43,160,768 | 41,506,286 |
| Principal Amount | Value | |
| Oil & Gas 0.5% | ||
| Ascent Resources Utica Holdings LLC | ||
| Second Lien Term Loan | ||
| 14.211% (3 Month LIBOR + 9.00%), due 11/1/25 (d) | $ 9,011,000 | $ 9,540,396 |
| Brazos Delaware II LLC | ||
| Initial Term Loan | ||
| 8.583% (1 Month SOFR + 3.75%), due 2/11/30 (d) | 2,000,000 | 1,971,876 |
| PetroQuest Energy LLC (c)(h) | ||
| Term Loan | ||
| 12.34% (12.07% PIK) (1 Month LIBOR + 7.50%), due 11/8/23 (a)(d) | 22,157,118 | 17,060,981 |
| Term Loan | ||
| 12.34% (1 Month LIBOR + 7.50%), due 1/1/28 (d) | 2,982,259 | 2,982,259 |
| 2020 Term Loan | ||
| 12.348% (12.13% PIK), due 9/19/26 (a) | 2,290,292 | 2,290,292 |
| TransMontaigne Operating Co. LP | ||
| Tranche Term Loan B 8.51% - 8.525% | ||
| (1 Month LIBOR + 3.50%), due 11/17/28 (d) | 14,405,900 | 14,239,339 |
| 48,085,143 | ||
| Retail 0.9% | ||
| Great Outdoors Group LLC | ||
| Term Loan B2 | ||
| 8.775% (1 Month LIBOR + 3.75%), due 3/6/28 (d) | 93,813,475 | 92,925,625 |
| Services: Business 0.2% | ||
| GIP II Blue Holding LP | ||
| Initial Term Loan | ||
| 9.659% (3 Month LIBOR + 4.50%), due 9/29/28 (d) | 16,082,372 | 16,028,769 |
| Icon plc (d) | ||
| Lux Term Loan | ||
| 7.41% (3 Month SOFR + 2.25%), due 7/3/28 | 2,799,576 | 2,796,077 |
| U.S. Term Loan | ||
| 7.41% (3 Month SOFR + 2.25%), due 7/3/28 | 697,516 | 696,645 |
| 19,521,491 | ||
| Principal Amount | Value | |
| Loan Assignments (continued) | ||
| Software 0.2% | ||
| Cloud Software Group, Inc. | ||
| First Lien Term Loan A | ||
| 9.498% (3 Month SOFR + 4.50%), due 9/29/28 (d) | $ 27,000,000 | $ 24,975,000 |
| Utilities 0.5% | ||
| PG&E Corp. | ||
| Term Loan | ||
| 8.063% (1 Month LIBOR + 3.00%), due 6/23/25 (d) | 48,291,010 | 48,140,101 |
| Total Loan Assignments (Cost $469,466,710) | 464,590,601 | |
| Total Long-Term Bonds (Cost $10,086,384,991) | 9,464,960,994 | |
| Shares | ||
| Common Stocks 2.3% | ||
| Consumer Staples Distribution & Retail 0.0% ‡ | ||
| ASG warrant Corp. (c)(h)(l) | 12,502 | — |
| Distributors 0.1% | ||
| ATD New Holdings, Inc. (l) | 142,545 | 6,414,525 |
| Electric Utilities 0.0% ‡ | ||
| Keycon Power Holdings LLC (c)(h)(l) | 38,880 | 389 |
| Electrical Equipment 0.1% | ||
| Energy Technologies, Inc. (c)(h)(l) | 16,724 | 7,107,700 |
| Energy Equipment & Services 0.1% | ||
| Forum Energy Technologies, Inc. (l) | 617,274 | 13,678,792 |
| Nine Energy Service, Inc. (l) | 148,500 | 573,210 |
| 14,252,002 | ||
| Hotels, Restaurants & Leisure 0.1% | ||
| Carlson Travel, Inc. (c)(j)(l) | 1,813,550 | 10,881,300 |
| Independent Power and Renewable Electricity Producers 0.3% | ||
| GenOn Energy, Inc. (j) | 386,241 | 35,727,292 |
| Metals & Mining 0.1% | ||
| Franco-Nevada Corp. | 65,000 | 9,865,700 |
| Shares | Value | |
| Oil, Gas & Consumable Fuels 1.5% | ||
| Chord Energy Corp. | 97,111 | $ 13,821,809 |
| Gulfport Energy Corp. (l) | 1,189,727 | 107,622,704 |
| PetroQuest Energy, Inc. (c)(h)(l) | 284,709 | — |
| Talos Energy, Inc. (l) | 2,074,193 | 28,271,251 |
| 149,715,764 | ||
| Total Common Stocks (Cost $292,007,941) | 233,964,672 | |
| Convertible Preferred Stock 0.1% | ||
| Hotels, Restaurants & Leisure 0.1% | ||
| CWT Travel Holdings, Inc., 15.00% (b)(c)(e)(l) | 97,040 | 7,763,200 |
| Total Convertible Preferred Stock (Cost $8,023,865) | 7,763,200 | |
| Preferred Stocks 0.5% | ||
| Electrical Equipment 0.3% | ||
| Energy Technologies Ltd. (c)(h)(l) | 37,258 | 29,806,400 |
| Oil, Gas & Consumable Fuels 0.2% | ||
| Gulfport Energy Operating Corp., 10.00%(10.00% Cash or 15.00% PIK) (a)(c)(l) | 4,201,000 | 25,142,985 |
| Total Preferred Stocks (Cost $39,168,071) | 54,949,385 | |
| Exchange-Traded Funds 0.4% | ||
| iShares Gold Trust (l) | 929,500 | 35,051,445 |
| SPDR Gold Shares (l) | 55,336 | 10,226,093 |
| Total Exchange-Traded Funds (Cost $33,598,418) | 45,277,538 | |
| Number of Warrants | ||
| Warrants 0.0% ‡ | ||
| Hotels, Restaurants & Leisure 0.0% ‡ | ||
| CWT Travel Holdings, Inc. (h)(l) | ||
| Expires 11/19/26 | 169,236 | 1,506 |
| Expires 11/19/28 | 178,143 | 8,248 |
| 9,754 | ||
| 24 | MainStay MacKay High Yield Corporate Bond Fund |
| Number of Warrants | Value | ||
| Warrants (continued) ‡ | |||
| Oil, Gas & Consumable Fuels 0.0% ‡ | |||
| California Resources Corp. | |||
| Expires 10/27/24 (l) | 36,093 | $ 343,606 | |
| Total Warrants (Cost $32,627,513) | 353,360 | ||
| Total Investments (Cost $10,491,810,799) | 95.1% | 9,807,269,149 | |
| Other Assets, Less Liabilities | 4.9 | 509,996,738 | |
| Net Assets | 100.0% | $ 10,317,265,887 | |
| † | Percentages indicated are based on Fund net assets. |
| ^ | Industry classifications may be different than those used for compliance monitoring purposes. |
| ‡ | Less than one-tenth of a percent. |
| (a) | PIK ("Payment-in-Kind")—issuer may pay interest or dividends with additional securities and/or in cash. |
| (b) | May be sold to institutional investors only under Rule 144A or securities offered pursuant to Section 4(a)(2) of the Securities Act of 1933, as amended. |
| (c) | Illiquid security—As of April 30, 2023, the total market value deemed illiquid under procedures approved by the Board of Trustees was $196,947,359, which represented 1.9% of the Fund’s net assets. |
| (d) | Floating rate—Rate shown was the rate in effect as of April 30, 2023. |
| (e) | Security is perpetual and, thus, does not have a predetermined maturity date. The date shown, if applicable, reflects the next call date. |
| (f) | Delayed delivery security. |
| (g) | Step coupon—Rate shown was the rate in effect as of April 30, 2023. |
| (h) | Security in which significant unobservable inputs (Level 3) were used in determining fair value. |
| (i) | Issue in non-accrual status. |
| (j) | Restricted security. (See Note 5) |
| (k) | Issue in default. |
| (l) | Non-income producing security. |
| Abbreviation(s): |
| LIBOR—London Interbank Offered Rate |
| SOFR—Secured Overnight Financing Rate |
| SPDR—Standard & Poor’s Depositary Receipt |
| TBD—To Be Determined |
| Description | Quoted Prices in Active Markets for Identical Assets (Level 1) | Significant Other Observable Inputs (Level 2) | Significant Unobservable Inputs (Level 3) | Total | |||
| Asset Valuation Inputs | |||||||
| Investments in Securities (a) | |||||||
| Long-Term Bonds | |||||||
| Convertible Bonds | $ — | $ 79,338,762 | $ — | $ 79,338,762 | |||
| Corporate Bonds | — | 8,902,393,631 | 18,638,000 | 8,921,031,631 | |||
| Loan Assignments | — | 442,257,069 | 22,333,532 | 464,590,601 | |||
| Total Long-Term Bonds | — | 9,423,989,462 | 40,971,532 | 9,464,960,994 | |||
| Common Stocks | 173,833,466 | 53,023,117 | 7,108,089 | 233,964,672 | |||
| Convertible Preferred Stock | — | 7,763,200 | — | 7,763,200 | |||
| Preferred Stocks | — | 25,142,985 | 29,806,400 | 54,949,385 | |||
| Exchange-Traded Funds | 45,277,538 | — | — | 45,277,538 | |||
| Warrants | 343,606 | — | 9,754 | 353,360 | |||
| Total Investments in Securities | $ 219,454,610 | $ 9,509,918,764 | $ 77,895,775 | $ 9,807,269,149 |
| (a) | For a complete listing of investments and their industries, see the Portfolio of Investments. |
| Assets | |
| Investment in securities, at value (identified cost $10,491,810,799) | $ 9,807,269,149 |
| Cash | 422,261,715 |
| Due from custodian | 1,412,905 |
| Receivables: | |
| Interest | 150,676,319 |
| Investment securities sold | 38,541,512 |
| Fund shares sold | 12,446,445 |
| Other assets | 2,018,987 |
| Total assets | 10,434,627,032 |
| Liabilities | |
| Payables: | |
| Investment securities purchased | 86,677,132 |
| Fund shares redeemed | 19,932,389 |
| Manager (See Note 3) | 4,595,704 |
| Transfer agent (See Note 3) | 1,662,595 |
| Shareholder communication | 778,162 |
| NYLIFE Distributors (See Note 3) | 761,245 |
| Professional fees | 134,768 |
| Custodian | 43,012 |
| Accrued expenses | 75,292 |
| Distributions payable | 2,700,846 |
| Total liabilities | 117,361,145 |
| Net assets | $10,317,265,887 |
| Composition of Net Assets | |
| Shares of beneficial interest outstanding (par value of $.01 per share) unlimited number of shares authorized | $ 20,491,585 |
| Additional paid-in-capital | 11,357,387,849 |
| 11,377,879,434 | |
| Total distributable earnings (loss) | (1,060,613,547) |
| Net assets | $10,317,265,887 |
| Class A | |
| Net assets applicable to outstanding shares | $3,045,279,581 |
| Shares of beneficial interest outstanding | 604,290,064 |
| Net asset value per share outstanding | $ 5.04 |
| Maximum sales charge (4.50% of offering price) | 0.24 |
| Maximum offering price per share outstanding | $ 5.28 |
| Investor Class | |
| Net assets applicable to outstanding shares | $ 117,545,218 |
| Shares of beneficial interest outstanding | 23,159,430 |
| Net asset value per share outstanding | $ 5.08 |
| Maximum sales charge (4.00% of offering price) | 0.21 |
| Maximum offering price per share outstanding | $ 5.29 |
| Class B | |
| Net assets applicable to outstanding shares | $ 9,940,905 |
| Shares of beneficial interest outstanding | 1,982,165 |
| Net asset value and offering price per share outstanding | $ 5.02 |
| Class C | |
| Net assets applicable to outstanding shares | $ 118,560,934 |
| Shares of beneficial interest outstanding | 23,620,133 |
| Net asset value and offering price per share outstanding | $ 5.02 |
| Class I | |
| Net assets applicable to outstanding shares | $3,161,867,686 |
| Shares of beneficial interest outstanding | 627,254,606 |
| Net asset value and offering price per share outstanding | $ 5.04 |
| Class R1 | |
| Net assets applicable to outstanding shares | $ 47,661 |
| Shares of beneficial interest outstanding | 9,478 |
| Net asset value and offering price per share outstanding | $ 5.03 |
| Class R2 | |
| Net assets applicable to outstanding shares | $ 7,002,615 |
| Shares of beneficial interest outstanding | 1,389,058 |
| Net asset value and offering price per share outstanding | $ 5.04 |
| Class R3 | |
| Net assets applicable to outstanding shares | $ 3,947,568 |
| Shares of beneficial interest outstanding | 784,079 |
| Net asset value and offering price per share outstanding | $ 5.03 |
| Class R6 | |
| Net assets applicable to outstanding shares | $3,853,029,186 |
| Shares of beneficial interest outstanding | 766,660,692 |
| Net asset value and offering price per share outstanding | $ 5.03 |
| SIMPLE Class | |
| Net assets applicable to outstanding shares | $ 44,533 |
| Shares of beneficial interest outstanding | 8,772 |
| Net asset value and offering price per share outstanding | $ 5.08 |
| 26 | MainStay MacKay High Yield Corporate Bond Fund |
| Investment Income (Loss) | |
| Income | |
| Interest | $307,208,994 |
| Dividends (net of foreign tax withholding of $17,275) | 1,266,045 |
| Other | 9,972,286 |
| Total income | 318,447,325 |
| Expenses | |
| Manager (See Note 3) | 27,388,235 |
| Transfer agent (See Note 3) | 5,059,749 |
| Distribution/Service—Class A (See Note 3) | 3,807,628 |
| Distribution/Service—Investor Class (See Note 3) | 145,672 |
| Distribution/Service—Class B (See Note 3) | 56,880 |
| Distribution/Service—Class C (See Note 3) | 629,694 |
| Distribution/Service—Class R2 (See Note 3) | 8,722 |
| Distribution/Service—Class R3 (See Note 3) | 9,125 |
| Distribution/Service—SIMPLE Class (See Note 3) | 94 |
| Professional fees | 368,422 |
| Shareholder communication | 276,123 |
| Registration | 126,165 |
| Trustees | 122,658 |
| Custodian | 60,630 |
| Shareholder service (See Note 3) | 5,337 |
| Miscellaneous | 134,175 |
| Total expenses before waiver/reimbursement | 38,199,309 |
| Reimbursement from prior custodian(a) | (19,662) |
| Net expenses | 38,179,647 |
| Net investment income (loss) | 280,267,678 |
| Realized and Unrealized Gain (Loss) | |
| Net realized gain (loss) on investments | (87,472,084) |
| Net change in unrealized appreciation (depreciation) on investments | 405,732,154 |
| Net realized and unrealized gain (loss) | 318,260,070 |
| Net increase (decrease) in net assets resulting from operations | $598,527,748 |
| (a) | Represents a refund for overbilling of custody fees. |
for the six months ended April 30, 2023 (Unaudited) and the year ended October 31, 2022
| Six months ended April 30, 2023 | Year ended October 31, 2022 | |
| Increase (Decrease) in Net Assets | ||
| Operations: | ||
| Net investment income (loss) | $ 280,267,678 | $ 529,759,959 |
| Net realized gain (loss) | (87,472,084) | (2,040,502) |
| Net change in unrealized appreciation (depreciation) | 405,732,154 | (1,544,808,534) |
| Net increase (decrease) in net assets resulting from operations | 598,527,748 | (1,017,089,077) |
| Distributions to shareholders: | ||
| Class A | (80,315,922) | (159,359,781) |
| Investor Class | (2,951,198) | (5,731,011) |
| Class B | (242,446) | (728,522) |
| Class C | (2,704,060) | (6,351,592) |
| Class I | (87,201,548) | (179,733,684) |
| Class R1 | (1,246) | (2,576) |
| Class R2 | (180,542) | (372,409) |
| Class R3 | (90,520) | (154,687) |
| Class R6 | (104,078,085) | (181,305,286) |
| SIMPLE Class | (940) | (1,390) |
| (277,766,507) | (533,740,938) | |
| Distributions to shareholders from return of capital: | ||
| Class A | — | (10,959,485) |
| Investor Class | — | (394,133) |
| Class B | — | (50,102) |
| Class C | — | (436,811) |
| Class I | — | (12,360,639) |
| Class R1 | — | (177) |
| Class R2 | — | (25,611) |
| Class R3 | — | (10,638) |
| Class R6 | — | (12,468,721) |
| SIMPLE Class | — | (96) |
| — | (36,706,413) | |
| Total distributions to shareholders | (277,766,507) | (570,447,351) |
| Capital share transactions: | ||
| Net proceeds from sales of shares | 1,360,954,776 | 3,247,300,040 |
| Net asset value of shares issued to shareholders in reinvestment of distributions | 261,329,803 | 531,741,895 |
| Cost of shares redeemed | (1,742,934,365) | (4,185,037,510) |
| Increase (decrease) in net assets derived from capital share transactions | (120,649,786) | (405,995,575) |
| Net increase (decrease) in net assets | 200,111,455 | (1,993,532,003) |
| Six months ended April 30, 2023 | Year ended October 31, 2022 | |
| Net Assets | ||
| Beginning of period | $10,117,154,432 | $12,110,686,435 |
| End of period | $10,317,265,887 | $10,117,154,432 |
| 28 | MainStay MacKay High Yield Corporate Bond Fund |
| Six months ended April 30, 2023* | Year Ended October 31, | ||||||||||
| Class A | 2022 | 2021 | 2020 | 2019 | 2018 | ||||||
| Net asset value at beginning of period | $ 4.88 | $ 5.63 | $ 5.41 | $ 5.61 | $ 5.52 | $ 5.77 | |||||
| Net investment income (loss) (a) | 0.13 | 0.24 | 0.25 | 0.29 | 0.29 | 0.29 | |||||
| Net realized and unrealized gain (loss) | 0.16 | (0.73) | 0.25 | (0.17) | 0.12 | (0.22) | |||||
| Total from investment operations | 0.29 | (0.49) | 0.50 | 0.12 | 0.41 | 0.07 | |||||
| Less distributions: | |||||||||||
| From net investment income | (0.13) | (0.24) | (0.25) | (0.29) | (0.29) | (0.29) | |||||
| Return of capital | — | (0.02) | (0.03) | (0.03) | (0.03) | (0.03) | |||||
| Total distributions | (0.13) | (0.26) | (0.28) | (0.32) | (0.32) | (0.32) | |||||
| Net asset value at end of period | $ 5.04 | $ 4.88 | $ 5.63 | $ 5.41 | $ 5.61 | $ 5.52 | |||||
| Total investment return (b) | 6.01% | (8.88)% | 9.37% | 2.26% | 7.58% | 1.29% | |||||
| Ratios (to average net assets)/Supplemental Data: | |||||||||||
| Net investment income (loss) | 5.34%†† | 4.58% | 4.38% | 5.35% | 5.21% | 5.15% | |||||
| Net expenses (c) | 0.96%†† | 0.95% | 0.95% | 0.97% | 0.99% | 0.99% | |||||
| Portfolio turnover rate | 10% | 16% | 40% | 38% | 30% | 30% | |||||
| Net assets at end of period (in 000’s) | $ 3,045,280 | $ 3,074,182 | $ 3,901,512 | $ 3,525,782 | $ 3,405,587 | $ 3,290,659 | |||||
| * | Unaudited. |
| †† | Annualized. |
| (a) | Per share data based on average shares outstanding during the period. |
| (b) | Total investment return is calculated exclusive of sales charges and assumes the reinvestment of dividends and distributions. For periods of less than one year, total return is not annualized. |
| (c) | In addition to the fees and expenses which the Fund bears directly, it also indirectly bears a pro-rata share of the fees and expenses of the underlying funds in which it invests. Such indirect expenses are not included in the above expense ratios. |
| Six months ended April 30, 2023* | Year Ended October 31, | ||||||||||
| Investor Class | 2022 | 2021 | 2020 | 2019 | 2018 | ||||||
| Net asset value at beginning of period | $ 4.92 | $ 5.67 | $ 5.45 | $ 5.65 | $ 5.57 | $ 5.82 | |||||
| Net investment income (loss) (a) | 0.13 | 0.24 | 0.24 | 0.29 | 0.29 | 0.29 | |||||
| Net realized and unrealized gain (loss) | 0.16 | (0.73) | 0.26 | (0.17) | 0.11 | (0.22) | |||||
| Total from investment operations | 0.29 | (0.49) | 0.50 | 0.12 | 0.40 | 0.07 | |||||
| Less distributions: | |||||||||||
| From net investment income | (0.13) | (0.24) | (0.25) | (0.29) | (0.29) | (0.29) | |||||
| Return of capital | — | (0.02) | (0.03) | (0.03) | (0.03) | (0.03) | |||||
| Total distributions | (0.13) | (0.26) | (0.28) | (0.32) | (0.32) | (0.32) | |||||
| Net asset value at end of period | $ 5.08 | $ 4.92 | $ 5.67 | $ 5.45 | $ 5.65 | $ 5.57 | |||||
| Total investment return (b) | 5.88% | (8.90)% | 9.25% | 2.24% | 7.33% | 1.29% | |||||
| Ratios (to average net assets)/Supplemental Data: | |||||||||||
| Net investment income (loss) | 5.16%†† | 4.45% | 4.26% | 5.27% | 5.15% | 5.12% | |||||
| Net expenses (c) | 1.14%†† | 1.09% | 1.08% | 1.06% | 1.05% | 1.03% | |||||
| Portfolio turnover rate | 10% | 16% | 40% | 38% | 30% | 30% | |||||
| Net assets at end of period (in 000's) | $ 117,545 | $ 116,961 | $ 139,214 | $ 149,726 | $ 162,260 | $ 159,970 | |||||
| * | Unaudited. |
| †† | Annualized. |
| (a) | Per share data based on average shares outstanding during the period. |
| (b) | Total investment return is calculated exclusive of sales charges and assumes the reinvestment of dividends and distributions. For periods of less than one year, total return is not annualized. |
| (c) | In addition to the fees and expenses which the Fund bears directly, it also indirectly bears a pro-rata share of the fees and expenses of the underlying funds in which it invests. Such indirect expenses are not included in the above expense ratios. |
| Six months ended April 30, 2023* | Year Ended October 31, | ||||||||||
| Class B | 2022 | 2021 | 2020 | 2019 | 2018 | ||||||
| Net asset value at beginning of period | $ 4.86 | $ 5.60 | $ 5.38 | $ 5.58 | $ 5.50 | $ 5.74 | |||||
| Net investment income (loss) (a) | 0.11 | 0.19 | 0.20 | 0.25 | 0.24 | 0.25 | |||||
| Net realized and unrealized gain (loss) | 0.16 | (0.72) | 0.25 | (0.18) | 0.11 | (0.21) | |||||
| Total from investment operations | 0.27 | (0.53) | 0.45 | 0.07 | 0.35 | 0.04 | |||||
| Less distributions: | |||||||||||
| From net investment income | (0.11) | (0.20) | (0.21) | (0.24) | (0.25) | (0.26) | |||||
| Return of capital | — | (0.01) | (0.02) | (0.03) | (0.02) | (0.02) | |||||
| Total distributions | (0.11) | (0.21) | (0.23) | (0.27) | (0.27) | (0.28) | |||||
| Net asset value at end of period | $ 5.02 | $ 4.86 | $ 5.60 | $ 5.38 | $ 5.58 | $ 5.50 | |||||
| Total investment return (b) | 5.53% | (9.61)% | 8.52% | 1.39% | 6.52% | 0.64% | |||||
| Ratios (to average net assets)/Supplemental Data: | |||||||||||
| Net investment income (loss) | 4.42%†† | 3.64% | 3.56% | 4.55% | 4.41% | 4.37% | |||||
| Net expenses (c) | 1.89%†† | 1.84% | 1.83% | 1.81% | 1.80% | 1.78% | |||||
| Portfolio turnover rate | 10% | 16% | 40% | 38% | 30% | 30% | |||||
| Net assets at end of period (in 000’s) | $ 9,941 | $ 13,032 | $ 26,622 | $ 45,661 | $ 63,517 | $ 81,221 | |||||
| * | Unaudited. |
| †† | Annualized. |
| (a) | Per share data based on average shares outstanding during the period. |
| (b) | Total investment return is calculated exclusive of sales charges and assumes the reinvestment of dividends and distributions. For periods of less than one year, total return is not annualized. |
| (c) | In addition to the fees and expenses which the Fund bears directly, it also indirectly bears a pro-rata share of the fees and expenses of the underlying funds in which it invests. Such indirect expenses are not included in the above expense ratios. |
| Six months ended April 30, 2023* | Year Ended October 31, | ||||||||||
| Class C | 2022 | 2021 | 2020 | 2019 | 2018 | ||||||
| Net asset value at beginning of period | $ 4.86 | $ 5.60 | $ 5.39 | $ 5.59 | $ 5.50 | $ 5.74 | |||||
| Net investment income (loss) (a) | 0.11 | 0.19 | 0.20 | 0.25 | 0.24 | 0.25 | |||||
| Net realized and unrealized gain (loss) | 0.16 | (0.72) | 0.24 | (0.18) | 0.12 | (0.21) | |||||
| Total from investment operations | 0.27 | (0.53) | 0.44 | 0.07 | 0.36 | 0.04 | |||||
| Less distributions: | |||||||||||
| From net investment income | (0.11) | (0.20) | (0.21) | (0.24) | (0.25) | (0.26) | |||||
| Return of capital | — | (0.01) | (0.02) | (0.03) | (0.02) | (0.02) | |||||
| Total distributions | (0.11) | (0.21) | (0.23) | (0.27) | (0.27) | (0.28) | |||||
| Net asset value at end of period | $ 5.02 | $ 4.86 | $ 5.60 | $ 5.39 | $ 5.59 | $ 5.50 | |||||
| Total investment return (b) | 5.53% | (9.62)% | 8.31% | 1.39% | 6.71% | 0.64% | |||||
| Ratios (to average net assets)/Supplemental Data: | |||||||||||
| Net investment income (loss) | 4.41%†† | 3.66% | 3.54% | 4.54% | 4.41% | 4.36% | |||||
| Net expenses (c) | 1.89%†† | 1.84% | 1.83% | 1.81% | 1.80% | 1.78% | |||||
| Portfolio turnover rate | 10% | 16% | 40% | 38% | 30% | 30% | |||||
| Net assets at end of period (in 000’s) | $ 118,561 | $ 133,295 | $ 214,696 | $ 297,431 | $ 373,760 | $ 550,819 | |||||
| * | Unaudited. |
| †† | Annualized. |
| (a) | Per share data based on average shares outstanding during the period. |
| (b) | Total investment return is calculated exclusive of sales charges and assumes the reinvestment of dividends and distributions. For periods of less than one year, total return is not annualized. |
| (c) | In addition to the fees and expenses which the Fund bears directly, it also indirectly bears a pro-rata share of the fees and expenses of the underlying funds in which it invests. Such indirect expenses are not included in the above expense ratios. |
| 30 | MainStay MacKay High Yield Corporate Bond Fund |
| Six months ended April 30, 2023* | Year Ended October 31, | ||||||||||
| Class I | 2022 | 2021 | 2020 | 2019 | 2018 | ||||||
| Net asset value at beginning of period | $ 4.88 | $ 5.63 | $ 5.41 | $ 5.61 | $ 5.53 | $ 5.78 | |||||
| Net investment income (loss) (a) | 0.14 | 0.25 | 0.26 | 0.30 | 0.30 | 0.31 | |||||
| Net realized and unrealized gain (loss) | 0.16 | (0.73) | 0.26 | (0.17) | 0.11 | (0.22) | |||||
| Total from investment operations | 0.30 | (0.48) | 0.52 | 0.13 | 0.41 | 0.09 | |||||
| Less distributions: | |||||||||||
| From net investment income | (0.14) | (0.25) | (0.27) | (0.30) | (0.30) | (0.31) | |||||
| Return of capital | — | (0.02) | (0.03) | (0.03) | (0.03) | (0.03) | |||||
| Total distributions | (0.14) | (0.27) | (0.30) | (0.33) | (0.33) | (0.34) | |||||
| Net asset value at end of period | $ 5.04 | $ 4.88 | $ 5.63 | $ 5.41 | $ 5.61 | $ 5.53 | |||||
| Total investment return (b) | 6.14% | (8.65)% | 9.65% | 2.56% | 7.68% | 1.57% | |||||
| Ratios (to average net assets)/Supplemental Data: | |||||||||||
| Net investment income (loss) | 5.59%†† | 4.82% | 4.62% | 5.60% | 5.45% | 5.40% | |||||
| Net expenses (c) | 0.71%†† | 0.70% | 0.70% | 0.72% | 0.74% | 0.74% | |||||
| Portfolio turnover rate | 10% | 16% | 40% | 38% | 30% | 30% | |||||
| Net assets at end of period (in 000’s) | $ 3,161,868 | $ 3,159,577 | $ 4,116,697 | $ 3,509,954 | $ 3,451,487 | $ 3,709,306 | |||||
| * | Unaudited. |
| †† | Annualized. |
| (a) | Per share data based on average shares outstanding during the period. |
| (b) | Total investment return is calculated exclusive of sales charges and assumes the reinvestment of dividends and distributions. Class I shares are not subject to sales charges. For periods of less than one year, total return is not annualized. |
| (c) | In addition to the fees and expenses which the Fund bears directly, it also indirectly bears a pro-rata share of the fees and expenses of the underlying funds in which it invests. Such indirect expenses are not included in the above expense ratios. |
| Six months ended April 30, 2023* | Year Ended October 31, | ||||||||||
| Class R1 | 2022 | 2021 | 2020 | 2019 | 2018 | ||||||
| Net asset value at beginning of period | $ 4.87 | $ 5.62 | $ 5.40 | $ 5.60 | $ 5.52 | $ 5.77 | |||||
| Net investment income (loss) (a) | 0.14 | 0.25 | 0.25 | 0.30 | 0.30 | 0.30 | |||||
| Net realized and unrealized gain (loss) | 0.15 | (0.73) | 0.26 | (0.17) | 0.11 | (0.22) | |||||
| Total from investment operations | 0.29 | (0.48) | 0.51 | 0.13 | 0.41 | 0.08 | |||||
| Less distributions: | |||||||||||
| From net investment income | (0.13) | (0.25) | (0.26) | (0.30) | (0.30) | (0.30) | |||||
| Return of capital | — | (0.02) | (0.03) | (0.03) | (0.03) | (0.03) | |||||
| Total distributions | (0.13) | (0.27) | (0.29) | (0.33) | (0.33) | (0.33) | |||||
| Net asset value at end of period | $ 5.03 | $ 4.87 | $ 5.62 | $ 5.40 | $ 5.60 | $ 5.52 | |||||
| Total investment return (b) | 6.11% | (8.77)% | 9.55% | 2.45% | 7.58% | 1.46% | |||||
| Ratios (to average net assets)/Supplemental Data: | |||||||||||
| Net investment income (loss) | 5.50%†† | 4.74% | 4.51% | 5.52% | 5.36% | 5.25% | |||||
| Net expenses (c) | 0.81%†† | 0.80% | 0.80% | 0.82% | 0.84% | 0.84% | |||||
| Portfolio turnover rate | 10% | 16% | 40% | 38% | 30% | 30% | |||||
| Net assets at end of period (in 000’s) | $ 48 | $ 52 | $ 62 | $ 51 | $ 53 | $ 72 | |||||
| * | Unaudited. |
| †† | Annualized. |
| (a) | Per share data based on average shares outstanding during the period. |
| (b) | Total investment return is calculated exclusive of sales charges and assumes the reinvestment of dividends and distributions. Class R1 shares are not subject to sales charges. For periods of less than one year, total return is not annualized. |
| (c) | In addition to the fees and expenses which the Fund bears directly, it also indirectly bears a pro-rata share of the fees and expenses of the underlying funds in which it invests. Such indirect expenses are not included in the above expense ratios. |
| Six months ended April 30, 2023* | Year Ended October 31, | ||||||||||
| Class R2 | 2022 | 2021 | 2020 | 2019 | 2018 | ||||||
| Net asset value at beginning of period | $ 4.88 | $ 5.63 | $ 5.41 | $ 5.61 | $ 5.52 | $ 5.77 | |||||
| Net investment income (loss) (a) | 0.13 | 0.23 | 0.24 | 0.29 | 0.28 | 0.29 | |||||
| Net realized and unrealized gain (loss) | 0.16 | (0.73) | 0.26 | (0.18) | 0.12 | (0.22) | |||||
| Total from investment operations | 0.29 | (0.50) | 0.50 | 0.11 | 0.40 | 0.07 | |||||
| Less distributions: | |||||||||||
| From net investment income | (0.13) | (0.23) | (0.25) | (0.28) | (0.29) | (0.29) | |||||
| Return of capital | — | (0.02) | (0.03) | (0.03) | (0.02) | (0.03) | |||||
| Total distributions | (0.13) | (0.25) | (0.28) | (0.31) | (0.31) | (0.32) | |||||
| Net asset value at end of period | $ 5.04 | $ 4.88 | $ 5.63 | $ 5.41 | $ 5.61 | $ 5.52 | |||||
| Total investment return (b) | 5.96% | (8.98)% | 9.28% | 2.17% | 7.49% | 1.20% | |||||
| Ratios (to average net assets)/Supplemental Data: | |||||||||||
| Net investment income (loss) | 5.24%†† | 4.45% | 4.28% | 5.26% | 5.10% | 5.06% | |||||
| Net expenses (c) | 1.06%†† | 1.05% | 1.05% | 1.07% | 1.09% | 1.09% | |||||
| Portfolio turnover rate | 10% | 16% | 40% | 38% | 30% | 30% | |||||
| Net assets at end of period (in 000’s) | $ 7,003 | $ 6,949 | $ 10,640 | $ 13,006 | $ 13,866 | $ 11,116 | |||||
| * | Unaudited. |
| †† | Annualized. |
| (a) | Per share data based on average shares outstanding during the period. |
| (b) | Total investment return is calculated exclusive of sales charges and assumes the reinvestment of dividends and distributions. Class R2 shares are not subject to sales charges. For periods of less than one year, total return is not annualized. |
| (c) | In addition to the fees and expenses which the Fund bears directly, it also indirectly bears a pro-rata share of the fees and expenses of the underlying funds in which it invests. Such indirect expenses are not included in the above expense ratios. |
| Six months ended April 30, 2023* | Year Ended October 31, | ||||||||||
| Class R3 | 2022 | 2021 | 2020 | 2019 | 2018 | ||||||
| Net asset value at beginning of period | $ 4.88 | $ 5.62 | $ 5.40 | $ 5.60 | $ 5.52 | $ 5.77 | |||||
| Net investment income (loss) (a) | 0.12 | 0.22 | 0.22 | 0.27 | 0.27 | 0.27 | |||||
| Net realized and unrealized gain (loss) | 0.15 | (0.72) | 0.26 | (0.17) | 0.11 | (0.22) | |||||
| Total from investment operations | 0.27 | (0.50) | 0.48 | 0.10 | 0.38 | 0.05 | |||||
| Less distributions: | |||||||||||
| From net investment income | (0.12) | (0.22) | (0.23) | (0.27) | (0.28) | (0.28) | |||||
| Return of capital | — | (0.02) | (0.03) | (0.03) | (0.02) | (0.02) | |||||
| Total distributions | (0.12) | (0.24) | (0.26) | (0.30) | (0.30) | (0.30) | |||||
| Net asset value at end of period | $ 5.03 | $ 4.88 | $ 5.62 | $ 5.40 | $ 5.60 | $ 5.52 | |||||
| Total investment return (b) | 5.61% | (9.07)% | 9.01% | 1.90% | 7.03% | 0.96% | |||||
| Ratios (to average net assets)/Supplemental Data: | |||||||||||
| Net investment income (loss) | 4.99%†† | 4.25% | 3.98% | 4.96% | 4.84% | 4.77% | |||||
| Net expenses (c) | 1.31%†† | 1.30% | 1.30% | 1.32% | 1.34% | 1.34% | |||||
| Portfolio turnover rate | 10% | 16% | 40% | 38% | 30% | 30% | |||||
| Net assets at end of period (in 000’s) | $ 3,948 | $ 3,482 | $ 3,630 | $ 1,924 | $ 1,281 | $ 606 | |||||
| * | Unaudited. |
| †† | Annualized. |
| (a) | Per share data based on average shares outstanding during the period. |
| (b) | Total investment return is calculated exclusive of sales charges and assumes the reinvestment of dividends and distributions. Class R3 shares are not subject to sales charges. For periods of less than one year, total return is not annualized. |
| (c) | In addition to the fees and expenses which the Fund bears directly, it also indirectly bears a pro-rata share of the fees and expenses of the underlying funds in which it invests. Such indirect expenses are not included in the above expense ratios. |
| 32 | MainStay MacKay High Yield Corporate Bond Fund |
| Six months ended April 30, 2023* | Year Ended October 31, | ||||||||||
| Class R6 | 2022 | 2021 | 2020 | 2019 | 2018 | ||||||
| Net asset value at beginning of period | $ 4.87 | $ 5.61 | $ 5.40 | $ 5.60 | $ 5.52 | $ 5.77 | |||||
| Net investment income (loss) (a) | 0.14 | 0.26 | 0.27 | 0.31 | 0.31 | 0.31 | |||||
| Net realized and unrealized gain (loss) | 0.16 | (0.72) | 0.24 | (0.17) | 0.11 | (0.21) | |||||
| Total from investment operations | 0.30 | (0.46) | 0.51 | 0.14 | 0.42 | 0.10 | |||||
| Less distributions: | |||||||||||
| From net investment income | (0.14) | (0.26) | (0.27) | (0.31) | (0.31) | (0.32) | |||||
| Return of capital | — | (0.02) | (0.03) | (0.03) | (0.03) | (0.03) | |||||
| Total distributions | (0.14) | (0.28) | (0.30) | (0.34) | (0.34) | (0.35) | |||||
| Net asset value at end of period | $ 5.03 | $ 4.87 | $ 5.61 | $ 5.40 | $ 5.60 | $ 5.52 | |||||
| Total investment return (b) | 6.23% | (8.36)% | 9.64% | 2.70% | 7.84% | 1.71% | |||||
| Ratios (to average net assets)/Supplemental Data: | |||||||||||
| Net investment income (loss) | 5.73%†† | 4.98% | 4.79% | 5.65% | 5.60% | 5.54% | |||||
| Net expenses (c) | 0.57%†† | 0.57% | 0.57% | 0.58% | 0.58% | 0.58% | |||||
| Portfolio turnover rate | 10% | 16% | 40% | 38% | 30% | 30% | |||||
| Net assets at end of period (in 000’s) | $ 3,853,029 | $ 3,609,591 | $ 3,697,586 | $ 4,420,424 | $ 2,180,977 | $ 904,028 | |||||
| * | Unaudited. |
| †† | Annualized. |
| (a) | Per share data based on average shares outstanding during the period. |
| (b) | Total investment return is calculated exclusive of sales charges and assumes the reinvestment of dividends and distributions. Class R6 shares are not subject to sales charges. For periods of less than one year, total return is not annualized. |
| (c) | In addition to the fees and expenses which the Fund bears directly, it also indirectly bears a pro-rata share of the fees and expenses of the underlying funds in which it invests. Such indirect expenses are not included in the above expense ratios. |
| Six months ended April 30, 2023* | Year Ended October 31, | August 31, 2020^ through October 31, | |||||
| SIMPLE Class | 2022 | 2021 | 2020 | ||||
| Net asset value at beginning of period | $ 4.92 | $ 5.67 | $ 5.45 | $ 5.54 | |||
| Net investment income (loss) (a) | 0.13 | 0.22 | 0.23 | 0.04 | |||
| Net realized and unrealized gain (loss) | 0.15 | (0.73) | 0.25 | (0.08) | |||
| Total from investment operations | 0.28 | (0.51) | 0.48 | (0.04) | |||
| Less distributions: | |||||||
| From net investment income | (0.12) | (0.22) | (0.23) | (0.05) | |||
| Return of capital | — | (0.02) | (0.03) | (0.00)‡ | |||
| Total distributions | (0.12) | (0.24) | (0.26) | (0.05) | |||
| Net asset value at end of period | $ 5.08 | $ 4.92 | $ 5.67 | $ 5.45 | |||
| Total investment return (b) | 5.81% | (9.14)% | 8.98% | (0.72)% | |||
| Ratios (to average net assets)/Supplemental Data: | |||||||
| Net investment income (loss) | 5.03%†† | 4.23% | 4.00% | 4.74%†† | |||
| Net expenses (c) | 1.26%†† | 1.34% | 1.33% | 1.30%†† | |||
| Portfolio turnover rate | 10% | 16% | 40% | 38% | |||
| Net assets at end of period (in 000’s) | $ 45 | $ 32 | $ 27 | $ 25 | |||
| * | Unaudited. |
| ^ | Inception date. |
| ‡ | Less than one cent per share. |
| †† | Annualized. |
| (a) | Per share data based on average shares outstanding during the period. |
| (b) | Total investment return is calculated exclusive of sales charges and assumes the reinvestment of dividends and distributions. SIMPLE Class shares are not subject to sales charges. For periods of less than one year, total return is not annualized. |
| (c) | In addition to the fees and expenses which the Fund bears directly, it also indirectly bears a pro-rata share of the fees and expenses of the underlying funds in which it invests. Such indirect expenses are not included in the above expense ratios. |
| Class | Commenced Operations |
| Class A | January 3, 1995 |
| Investor Class | February 28, 2008 |
| Class B | May 1, 1986 |
| Class C | September 1, 1998 |
| Class I | January 2, 2004 |
| Class R1 | June 29, 2012 |
| Class R2 | May 1, 2008 |
| Class R3 | February 29, 2016 |
| Class R6 | June 17, 2013 |
| SIMPLE Class | August 31, 2020 |
| 34 | MainStay MacKay High Yield Corporate Bond Fund |
| • | Level 1—quoted prices (unadjusted) in active markets for an identical asset or liability |
| • | Level 2—other significant observable inputs (including quoted prices for a similar asset or liability in active markets, interest rates and yield curves, prepayment speeds, credit risk, etc.) |
| • | Level 3—significant unobservable inputs (including the Fund's own assumptions about the assumptions that market participants would use in measuring fair value of an asset or liability) |
| • Benchmark yields | • Reported trades |
| • Broker/dealer quotes | • Issuer spreads |
| • Two-sided markets | • Benchmark securities |
| • Bids/offers | • Reference data (corporate actions or material event notices) |
| • Industry and economic events | • Comparable bonds |
| • Monthly payment information |
| 36 | MainStay MacKay High Yield Corporate Bond Fund |
| 38 | MainStay MacKay High Yield Corporate Bond Fund |
| Class R1 | $ 23 |
| Class R2 | 3,489 |
| Class R3 | 1,825 |
| Class | Expense | Waived |
| Class A | $2,241,165 | $— |
| Investor Class | 192,544 | — |
| Class B | 18,786 | — |
| Class C | 208,037 | — |
| Class I | 2,318,426 | — |
| Class R1 | 34 | — |
| Class R2 | 5,134 | — |
| Class R3 | 2,684 | — |
| Class R6 | 72,900 | — |
| SIMPLE Class | 39 | — |
| Class I | $10,356,074 | 0.3% |
| Class R1 | 41,053 | 86.1 |
| SIMPLE Class | 25,894 | 58.1 |
| Federal Tax Cost | Gross Unrealized Appreciation | Gross Unrealized (Depreciation) | Net Unrealized Appreciation/ (Depreciation) | |
| Investments in Securities | $10,466,012,659 | $188,382,266 | $(847,125,776) | $(658,743,510) |
| 40 | MainStay MacKay High Yield Corporate Bond Fund |
| Capital Loss Available Through | Short-Term Capital Loss Amounts (000’s) | Long-Term Capital Loss Amounts (000’s) |
| Unlimited | $22,588 | $291,351 |
| 2022 | |
| Distributions paid from: | |
| Ordinary Income | $533,740,938 |
| Return of Capital | 36,706,413 |
| Total | $570,447,351 |
| Security | Date(s) of Acquisition | Principal Amount/ Shares | Cost | 4/30/23 Value | Percent of Net Assets |
| Briggs & Stratton Corp. Escrow Claim Shares | |||||
| Corporate Bond 6.875%, due 12/15/20 | 2/26/21 | $ 9,200,000 | $ 9,323,706 | $ — | 0.0% |
| Carlson Travel, Inc. | |||||
| Common Stock | 9/4/20 - 12/23/21 | 1,813,550 | 33,833,387 | 10,881,300 | 0.1 |
| GenOn Energy, Inc. | |||||
| Common Stock | 12/14/18 | 386,241 | 43,250,890 | 35,727,292 | 0.3 |
| Sterling Entertainment Enterprises LLC | |||||
| Corporate Bond 10.25%, due 1/15/25 | 12/28/17 | $ 20,000,000 | 19,906,310 | 18,638,000 | 0.2 |
| Total | $106,314,293 | $ 65,246,592 | 0.6% | ||
| Class A | Shares | Amount |
| Six-month period ended April 30, 2023: | ||
| Shares sold | 51,180,662 | $ 254,641,303 |
| Shares issued to shareholders in reinvestment of distributions | 13,950,120 | 69,590,153 |
| Shares redeemed | (92,722,816) | (461,747,713) |
| Net increase (decrease) in shares outstanding before conversion | (27,592,034) | (137,516,257) |
| Shares converted into Class A (See Note 1) | 2,943,389 | 14,645,838 |
| Shares converted from Class A (See Note 1) | (676,026) | (3,398,674) |
| Net increase (decrease) | (25,324,671) | $ (126,269,093) |
| Year ended October 31, 2022: | ||
| Shares sold | 96,269,574 | $ 504,848,483 |
| Shares issued to shareholders in reinvestment of distributions | 28,431,851 | 148,029,559 |
| Shares redeemed | (193,311,873) | (1,015,581,405) |
| Net increase (decrease) in shares outstanding before conversion | (68,610,448) | (362,703,363) |
| Shares converted into Class A (See Note 1) | 5,071,164 | 26,422,459 |
| Shares converted from Class A (See Note 1) | (233,056) | (1,222,885) |
| Net increase (decrease) | (63,772,340) | $ (337,503,789) |
| Investor Class | Shares | Amount |
| Six-month period ended April 30, 2023: | ||
| Shares sold | 522,386 | $ 2,624,390 |
| Shares issued to shareholders in reinvestment of distributions | 564,811 | 2,839,145 |
| Shares redeemed | (1,337,729) | (6,711,390) |
| Net increase (decrease) in shares outstanding before conversion | (250,532) | (1,247,855) |
| Shares converted into Investor Class (See Note 1) | 288,327 | 1,446,472 |
| Shares converted from Investor Class (See Note 1) | (665,416) | (3,322,733) |
| Net increase (decrease) | (627,621) | $ (3,124,116) |
| Year ended October 31, 2022: | ||
| Shares sold | 1,314,685 | $ 7,006,900 |
| Shares issued to shareholders in reinvestment of distributions | 1,121,506 | 5,871,610 |
| Shares redeemed | (2,565,213) | (13,569,137) |
| Net increase (decrease) in shares outstanding before conversion | (129,022) | (690,627) |
| Shares converted into Investor Class (See Note 1) | 647,159 | 3,427,758 |
| Shares converted from Investor Class (See Note 1) | (1,299,262) | (6,923,010) |
| Net increase (decrease) | (781,125) | $ (4,185,879) |
| Class B | Shares | Amount |
| Six-month period ended April 30, 2023: | ||
| Shares sold | 8,849 | $ 43,809 |
| Shares issued to shareholders in reinvestment of distributions | 40,301 | 200,116 |
| Shares redeemed | (330,643) | (1,636,562) |
| Net increase (decrease) in shares outstanding before conversion | (281,493) | (1,392,637) |
| Shares converted from Class B (See Note 1) | (418,152) | (2,067,501) |
| Net increase (decrease) | (699,645) | $ (3,460,138) |
| Year ended October 31, 2022: | ||
| Shares sold | 51,684 | $ 276,043 |
| Shares issued to shareholders in reinvestment of distributions | 128,906 | 673,604 |
| Shares redeemed | (1,235,556) | (6,393,498) |
| Net increase (decrease) in shares outstanding before conversion | (1,054,966) | (5,443,851) |
| Shares converted from Class B (See Note 1) | (1,019,213) | (5,298,623) |
| Net increase (decrease) | (2,074,179) | $ (10,742,474) |
| 42 | MainStay MacKay High Yield Corporate Bond Fund |
| Class C | Shares | Amount |
| Six-month period ended April 30, 2023: | ||
| Shares sold | 759,751 | $ 3,755,481 |
| Shares issued to shareholders in reinvestment of distributions | 522,184 | 2,594,936 |
| Shares redeemed | (4,216,298) | (20,871,650) |
| Net increase (decrease) in shares outstanding before conversion | (2,934,363) | (14,521,233) |
| Shares converted from Class C (See Note 1) | (854,332) | (4,221,625) |
| Net increase (decrease) | (3,788,695) | $ (18,742,858) |
| Year ended October 31, 2022: | ||
| Shares sold | 1,972,074 | $ 10,211,162 |
| Shares issued to shareholders in reinvestment of distributions | 1,235,498 | 6,431,044 |
| Shares redeemed | (12,067,962) | (63,194,114) |
| Net increase (decrease) in shares outstanding before conversion | (8,860,390) | (46,551,908) |
| Shares converted from Class C (See Note 1) | (2,062,605) | (10,660,509) |
| Net increase (decrease) | (10,922,995) | $ (57,212,417) |
| Class I | Shares | Amount |
| Six-month period ended April 30, 2023: | ||
| Shares sold | 119,446,020 | $ 595,451,093 |
| Shares issued to shareholders in reinvestment of distributions | 16,571,549 | 82,696,825 |
| Shares redeemed | (156,267,902) | (776,869,162) |
| Net increase (decrease) in shares outstanding before conversion | (20,250,333) | (98,721,244) |
| Shares converted into Class I (See Note 1) | 690,804 | 3,473,178 |
| Shares converted from Class I (See Note 1) | (140,372) | (708,780) |
| Net increase (decrease) | (19,699,901) | $ (95,956,846) |
| Year ended October 31, 2022: | ||
| Shares sold | 287,464,303 | $ 1,510,050,594 |
| Shares issued to shareholders in reinvestment of distributions | 34,206,122 | 178,206,439 |
| Shares redeemed | (406,328,774) | (2,107,290,774) |
| Net increase (decrease) in shares outstanding before conversion | (84,658,349) | (419,033,741) |
| Shares converted into Class I (See Note 1) | 252,101 | 1,317,383 |
| Shares converted from Class I (See Note 1) | (115,407) | (559,921) |
| Net increase (decrease) | (84,521,655) | $ (418,276,279) |
| Class R1 | Shares | Amount |
| Six-month period ended April 30, 2023: | ||
| Shares sold | 510 | $ 2,563 |
| Shares issued to shareholders in reinvestment of distributions | 241 | 1,203 |
| Shares redeemed | (2,045) | (10,104) |
| Net increase (decrease) | (1,294) | $ (6,338) |
| Year ended October 31, 2022: | ||
| Shares sold | 2,588 | $ 12,727 |
| Shares issued to shareholders in reinvestment of distributions | 531 | 2,753 |
| Shares redeemed | (3,382) | (17,585) |
| Net increase (decrease) | (263) | $ (2,105) |
| Class R2 | Shares | Amount |
| Six-month period ended April 30, 2023: | ||
| Shares sold | 102,102 | $ 509,018 |
| Shares issued to shareholders in reinvestment of distributions | 26,014 | 129,813 |
| Shares redeemed | (161,745) | (807,534) |
| Net increase (decrease) | (33,629) | $ (168,703) |
| Year ended October 31, 2022: | ||
| Shares sold | 313,412 | $ 1,646,320 |
| Shares issued to shareholders in reinvestment of distributions | 57,136 | 298,793 |
| Shares redeemed | (831,012) | (4,462,692) |
| Net increase (decrease) in shares outstanding before conversion | (460,464) | (2,517,579) |
| Shares converted from Class R2 (See Note 1) | (7,330) | (35,801) |
| Net increase (decrease) | (467,794) | $ (2,553,380) |
| Class R3 | Shares | Amount |
| Six-month period ended April 30, 2023: | ||
| Shares sold | 106,308 | $ 528,801 |
| Shares issued to shareholders in reinvestment of distributions | 16,258 | 81,078 |
| Shares redeemed | (52,282) | (259,823) |
| Net increase (decrease) | 70,284 | $ 350,056 |
| Year ended October 31, 2022: | ||
| Shares sold | 196,243 | $ 1,015,558 |
| Shares issued to shareholders in reinvestment of distributions | 29,907 | 155,148 |
| Shares redeemed | (139,286) | (714,740) |
| Net increase (decrease) in shares outstanding before conversion | 86,864 | 455,966 |
| Shares converted from Class R3 (See Note 1) | (19,036) | (93,846) |
| Net increase (decrease) | 67,828 | $ 362,120 |
| Class R6 | Shares | Amount |
| Six-month period ended April 30, 2023: | ||
| Shares sold | 101,484,468 | $ 503,388,197 |
| Shares issued to shareholders in reinvestment of distributions | 20,724,644 | 103,195,594 |
| Shares redeemed | (95,618,033) | (474,020,427) |
| Net increase (decrease) in shares outstanding before conversion | 26,591,079 | 132,563,364 |
| Shares converted into Class R6 (See Note 1) | 9,706 | 49,014 |
| Shares converted from Class R6 (See Note 1) | (1,183,895) | (5,895,189) |
| Net increase (decrease) | 25,416,890 | $ 126,717,189 |
| Year ended October 31, 2022: | ||
| Shares sold | 234,416,558 | $ 1,212,223,525 |
| Shares issued to shareholders in reinvestment of distributions | 37,129,569 | 192,071,459 |
| Shares redeemed | (187,677,935) | (973,813,565) |
| Net increase (decrease) in shares outstanding before conversion | 83,868,192 | 430,481,419 |
| Shares converted into Class R6 (See Note 1) | 1,001 | 5,033 |
| Shares converted from Class R6 (See Note 1) | (1,230,526) | (6,378,038) |
| Net increase (decrease) | 82,638,667 | $ 424,108,414 |
| SIMPLE Class | Shares | Amount |
| Six-month period ended April 30, 2023: | ||
| Shares sold | 1,988 | $ 10,121 |
| Shares issued to shareholders in reinvestment of distributions | 187 | 940 |
| Net increase (decrease) | 2,175 | $ 11,061 |
| Year ended October 31, 2022: | ||
| Shares sold | 1,542 | $ 8,728 |
| Shares issued to shareholders in reinvestment of distributions | 285 | 1,486 |
| Net increase (decrease) | 1,827 | $ 10,214 |
| 44 | MainStay MacKay High Yield Corporate Bond Fund |
| 46 | MainStay MacKay High Yield Corporate Bond Fund |
| 48 | MainStay MacKay High Yield Corporate Bond Fund |
| 50 | MainStay MacKay High Yield Corporate Bond Fund |
1.
| 2. | This Fund is registered for sale in CA, CT, DE, FL, MA, NJ, NY and VT. |
| 3. | An affiliate of New York Life Investment Management LLC. |
| 5022742MS043-23 | MSHY10-06/23 |
please log in to newyorklifeinvestments.com/accounts.
| Not FDIC/NCUA Insured | Not a Deposit | May Lose Value | No Bank Guarantee | Not Insured by Any Government Agency |


President
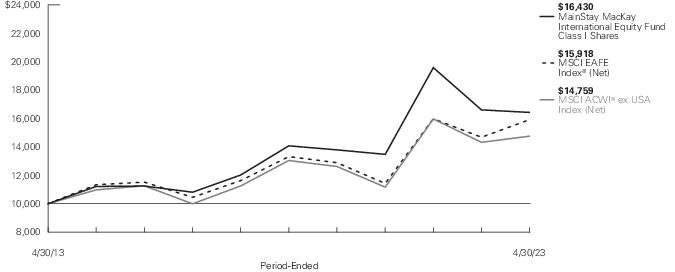
| Average Annual Total Returns for the Period-Ended April 30, 2023 | ||||||||
| Class | Sales Charge | Inception Date | Six Months1 | One Year | Five Years | Ten Years or Since Inception | Gross Expense Ratio2 | |
| Class A Shares | Maximum 5.50% Initial Sales Charge | With sales charges | 1/3/1995 | 8.49% | -6.89% | 1.63% | 4.19% | 1.38% |
| Excluding sales charges | 14.80 | -1.47 | 2.79 | 4.78 | 1.38 | |||
| Investor Class Shares3 | Maximum 5.00% Initial Sales Charge | With sales charges | 2/28/2008 | 8.83 | -6.69 | 1.26 | 3.82 | 1.72 |
| Excluding sales charges | 14.56 | -1.77 | 2.41 | 4.41 | 1.72 | |||
| Class B Shares4 | Maximum 5.00% CDSC | With sales charges | 9/13/1994 | 9.21 | -7.38 | 1.33 | 3.63 | 2.47 |
| if Redeemed Within the First Six Years of Purchase | Excluding sales charges | 14.21 | -2.50 | 1.65 | 3.63 | 2.47 | ||
| Class C Shares | Maximum 1.00% CDSC | With sales charges | 9/1/1998 | 13.12 | -3.55 | 1.63 | 3.61 | 2.47 |
| if Redeemed Within One Year of Purchase | Excluding sales charges | 14.12 | -2.58 | 1.63 | 3.61 | 2.47 | ||
| Class I Shares | No Sales Charge | 1/2/2004 | 15.05 | -1.08 | 3.14 | 5.09 | 1.13 | |
| Class R1 Shares | No Sales Charge | 1/2/2004 | 14.93 | -1.30 | 2.94 | 4.94 | 1.23 | |
| Class R2 Shares | No Sales Charge | 1/2/2004 | 14.76 | -1.56 | 2.68 | 4.67 | 1.48 | |
| Class R3 Shares | No Sales Charge | 4/28/2006 | 14.55 | -1.84 | 2.41 | 4.40 | 1.73 | |
| Class R6 Shares | No Sales Charge | 2/28/2019 | 15.05 | -1.07 | N/A | 5.16 | 1.01 | |
| 1. | Not annualized. |
| 2. | The gross expense ratios presented reflect the Fund’s “Total Annual Fund Operating Expenses” from the most recent Prospectus, as supplemented, and may differ from other expense ratios disclosed in this report. |
| 3. | Prior to June 30, 2020, the maximum initial sales charge was 5.50%, which is reflected in the applicable average annual total return figures shown. |
| 4. | Class B shares are closed to all new purchases as well as additional investments by existing Class B shareholders. |
| Benchmark Performance* | Six Months1 | One Year | Five Years | Ten Years |
| MSCI ACWI® ex USA Index (Net)2 | 20.65% | 3.05% | 2.50% | 3.97% |
| MSCI EAFE Index® (Net)3 | 24.19 | 8.42 | 3.63 | 4.76 |
| Morningstar Foreign Large Growth Category Average4 | 20.80 | 4.20 | 4.15 | 5.61 |
| * | Returns for indices reflect no deductions for fees, expenses or taxes, except for foreign withholding taxes where applicable. Results assume reinvestment of all dividends and capital gains. An investment cannot be made directly in an index. |
| 1. | Not annualized. |
| 2. | The Fund has selected the MSCI ACWI® (All Country World Index) ex USA Index (Net) as its primary benchmark. The MSCI ACWI® ex USA Index (Net) is a free float-adjusted market capitalization weighted index that is designed to measure the equity market performance of developed and emerging markets, excluding the U.S. |
| 3. | The MSCI EAFE® Index (Net) is the Fund's secondary benchmark. The MSCI EAFE® Index (Net) consists of international stocks representing the developed world outside of North America. |
| 4. | The Morningstar Foreign Large Growth Category Average is representative of funds that focus on high-priced growth stocks, mainly outside of the United States. Most of these funds divide their assets among a dozen or more developed markets, including Japan, Britain, France, and Germany. These funds primarily invest in stocks that have market caps in the top 70% of each economically integrated market and will have less than 20% of assets invested in U.S. stocks. Results are based on average total returns of similar funds with all dividends and capital gain distributions reinvested. |
| 6 | MainStay MacKay International Equity Fund |
| Share Class | Beginning Account Value 11/1/22 | Ending Account Value (Based on Actual Returns and Expenses) 4/30/23 | Expenses Paid During Period1 | Ending Account Value (Based on Hypothetical 5% Annualized Return and Actual Expenses) 4/30/23 | Expenses Paid During Period1 | Net Expense Ratio During Period2 |
| Class A Shares | $1,000.00 | $1,148.00 | $ 6.50 | $1,018.75 | $ 6.11 | 1.22% |
| Investor Class Shares | $1,000.00 | $1,145.60 | $ 8.46 | $1,016.91 | $ 7.95 | 1.59% |
| Class B Shares | $1,000.00 | $1,142.10 | $12.43 | $1,013.19 | $11.68 | 2.34% |
| Class C Shares | $1,000.00 | $1,141.20 | $12.42 | $1,013.19 | $11.68 | 2.34% |
| Class I Shares | $1,000.00 | $1,150.50 | $ 4.53 | $1,020.58 | $ 4.26 | 0.85% |
| Class R1 Shares | $1,000.00 | $1,149.30 | $ 5.70 | $1,019.49 | $ 5.36 | 1.07% |
| Class R2 Shares | $1,000.00 | $1,147.60 | $ 7.03 | $1,018.25 | $ 6.61 | 1.32% |
| Class R3 Shares | $1,000.00 | $1,145.50 | $ 8.35 | $1,017.01 | $ 7.85 | 1.57% |
| Class R6 Shares | $1,000.00 | $1,150.50 | $ 4.43 | $1,020.68 | $ 4.16 | 0.83% |
| 1. | Expenses are equal to the Fund’s annualized expense ratio of each class multiplied by the average account value over the period, divided by 365 and multiplied by 181 (to reflect the six-month period). The table above represents the actual expenses incurred during the six-month period. In addition to the fees and expenses which the Fund bears directly, it also indirectly bears a pro rata share of the fees and expenses of the underlying funds in which it invests. Such indirect expenses are not included in the above-reported expense figures. |
| 2. | Expenses are equal to the Fund's annualized expense ratio to reflect the six-month period. |
| United States | 16.5% |
| France | 14.2 |
| Japan | 10.3 |
| Switzerland | 10.0 |
| Germany | 9.8 |
| United Kingdom | 9.5 |
| India | 6.6 |
| Netherlands | 4.4 |
| Hong Kong | 3.6 |
| China | 3.0% |
| Israel | 2.7 |
| Denmark | 2.7 |
| Spain | 2.1 |
| Sweden | 2.0 |
| Italy | 1.1 |
| Other Assets, Less Liabilities | 1.5 |
| 100.0% |
| 1. | ICON plc |
| 2. | HDFC Bank Ltd. |
| 3. | Diageo plc |
| 4. | AIA Group Ltd. |
| 5. | MonotaRO Co. Ltd. |
| 6. | Symrise AG |
| 7. | Dassault Systemes SE |
| 8. | Teleperformance |
| 9. | IMCD NV |
| 10. | Lonza Group AG (Registered) |
| 8 | MainStay MacKay International Equity Fund |
| 1. | See "Investment and Performance Comparison" for other share class returns, which may be higher or lower than Class I share returns, and for more information on benchmark and peer group returns. |
| Shares | Value | |
| Common Stocks 96.7% | ||
| China 3.0% | ||
| Tencent Holdings Ltd. (Interactive Media & Services) | 220,399 | $ 9,669,911 |
| Denmark 2.7% | ||
| Chr Hansen Holding A/S (Chemicals) | 110,663 | 8,601,760 |
| France 14.2% | ||
| BioMerieux (Health Care Equipment & Supplies) | 67,155 | 7,022,419 |
| Dassault Systemes SE (Software) | 267,049 | 10,790,562 |
| Edenred (Financial Services) | 145,280 | 9,432,151 |
| Sartorius Stedim Biotech (Life Sciences Tools & Services) | 28,365 | 7,579,433 |
| Teleperformance (Professional Services) | 53,850 | 10,728,186 |
| 45,552,751 | ||
| Germany 9.8% | ||
| Deutsche Boerse AG (Capital Markets) | 38,255 | 7,288,286 |
| Nemetschek SE (Software) | 70,750 | 5,502,376 |
| Scout24 SE (Interactive Media & Services) (a) | 120,199 | 7,483,271 |
| Symrise AG (Chemicals) | 92,639 | 11,172,537 |
| 31,446,470 | ||
| Hong Kong 3.6% | ||
| AIA Group Ltd. (Insurance) | 1,078,000 | 11,666,265 |
| India 6.6% | ||
| HDFC Bank Ltd. (Banks) | 617,891 | 12,741,943 |
| Housing Development Finance Corp. Ltd. (Financial Services) | 246,631 | 8,364,863 |
| 21,106,806 | ||
| Israel 2.7% | ||
| NICE Ltd., Sponsored ADR (Software) (b)(c) | 42,502 | 8,670,833 |
| Italy 1.1% | ||
| Reply SpA (IT Services) | 29,704 | 3,453,103 |
| Japan 10.3% | ||
| Benefit One, Inc. (Professional Services) | 254,300 | 3,479,138 |
| Menicon Co. Ltd. (Health Care Equipment & Supplies) | 232,400 | 4,904,033 |
| MonotaRO Co. Ltd. (Trading Companies & Distributors) | 752,700 | 11,314,394 |
| Shares | Value | |
| Japan (continued) | ||
| Relo Group, Inc. (Real Estate Management & Development) | 264,400 | $ 4,092,771 |
| SMS Co. Ltd. (Professional Services) | 169,500 | 3,943,741 |
| TechnoPro Holdings, Inc. (Professional Services) | 204,400 | 5,550,883 |
| 33,284,960 | ||
| Netherlands 4.4% | ||
| Adyen NV (Financial Services) (a)(b) | 2,248 | 3,596,707 |
| IMCD NV (Trading Companies & Distributors) | 70,928 | 10,644,788 |
| 14,241,495 | ||
| Spain 2.1% | ||
| Amadeus IT Group SA (Hotels, Restaurants & Leisure) (b) | 97,237 | 6,829,451 |
| Sweden 2.0% | ||
| Hexagon AB, Class B (Electronic Equipment, Instruments & Components) (c) | 562,702 | 6,411,644 |
| Switzerland 10.0% | ||
| Alcon, Inc. (Health Care Equipment & Supplies) (b)(c) | 91,426 | 6,626,556 |
| Belimo Holding AG (Registered) (Building Products) | 10,479 | 5,038,736 |
| DSM-Firmenich AG (Pharmaceuticals) (b) | 55,227 | 7,227,096 |
| Lonza Group AG (Registered) (Life Sciences Tools & Services) | 16,559 | 10,259,411 |
| Straumann Holding AG (Health Care Equipment & Supplies) | 19,596 | 2,930,028 |
| 32,081,827 | ||
| United Kingdom 9.5% | ||
| Croda International plc (Chemicals) | 107,761 | 9,452,919 |
| Diageo plc (Beverages) | 274,795 | 12,508,527 |
| St James's Place plc (Capital Markets) | 577,551 | 8,757,226 |
| 30,718,672 | ||
| United States 14.7% | ||
| Accenture plc, Class A (IT Services) | 14,595 | 4,090,833 |
| Aon plc, Class A (Insurance) | 14,935 | 4,856,563 |
| Experian plc (Professional Services) | 269,019 | 9,500,319 |
| Globant SA (IT Services) (b) | 45,474 | 7,133,506 |
| ICON plc (Life Sciences Tools & Services) (b) | 72,114 | 13,895,647 |
| Linde plc (Chemicals) | 13,685 | 5,055,923 |
| 10 | MainStay MacKay International Equity Fund |
| Shares | Value | ||
| Common Stocks (continued) | |||
| United States (continued) | |||
| TE Connectivity Ltd. (Electronic Equipment, Instruments & Components) | 22,748 | $ 2,783,673 | |
| 47,316,464 | |||
| Total Common Stocks (Cost $282,601,323) | 311,052,412 | ||
| Short-Term Investments 1.8% | |||
| Affiliated Investment Company 0.3% | |||
| United States 0.3% | |||
| MainStay U.S. Government Liquidity Fund, 3.98% (d) | 865,024 | 865,024 | |
| Unaffiliated Investment Company 1.5% | |||
| United States 1.5% | |||
| Invesco Government & Agency Portfolio, 4.857% (d)(e) | 4,944,600 | 4,944,600 | |
| Total Short-Term Investments (Cost $5,809,624) | 5,809,624 | ||
| Total Investments (Cost $288,410,947) | 98.5% | 316,862,036 | |
| Other Assets, Less Liabilities | 1.5 | 4,965,622 | |
| Net Assets | 100.0% | $ 321,827,658 | |
| † | Percentages indicated are based on Fund net assets. |
| ^ | Industry classifications may be different than those used for compliance monitoring purposes. |
| (a) | May be sold to institutional investors only under Rule 144A or securities offered pursuant to Section 4(a)(2) of the Securities Act of 1933, as amended. |
| (b) | Non-income producing security. |
| (c) | All or a portion of this security was held on loan. As of April 30, 2023, the aggregate market value of securities on loan was $9,773,924; the total market value of collateral held by the Fund was $10,179,408. The market value of the collateral held included non-cash collateral in the form of U.S. Treasury securities with a value of $5,234,808. The Fund received cash collateral with a value of $4,944,600. (See Note 2(I)) |
| (d) | Current yield as of April 30, 2023. |
| (e) | Represents a security purchased with cash collateral received for securities on loan. |
| Affiliated Investment Companies | Value, Beginning of Period | Purchases at Cost | Proceeds from Sales | Net Realized Gain/(Loss) on Sales | Change in Unrealized Appreciation/ (Depreciation) | Value, End of Period | Dividend Income | Other Distributions | Shares End of Period |
| MainStay U.S. Government Liquidity Fund | $ 831 | $ 19,606 | $ (19,572) | $ — | $ — | $ 865 | $ 20 | $ — | 865 |
| Abbreviation(s): |
| ADR—American Depositary Receipt |
| Description | Quoted Prices in Active Markets for Identical Assets (Level 1) | Significant Other Observable Inputs (Level 2) | Significant Unobservable Inputs (Level 3) | Total | |||
| Asset Valuation Inputs | |||||||
| Investments in Securities (a) | |||||||
| Common Stocks | $ 311,052,412 | $ — | $ — | $ 311,052,412 | |||
| Short-Term Investments | |||||||
| Affiliated Investment Company | 865,024 | — | — | 865,024 | |||
| Unaffiliated Investment Company | 4,944,600 | — | — | 4,944,600 | |||
| Total Short-Term Investments | 5,809,624 | — | — | 5,809,624 | |||
| Total Investments in Securities | $ 316,862,036 | $ — | $ — | $ 316,862,036 |
| (a) | For a complete listing of investments and their industries, see the Portfolio of Investments. |
| 12 | MainStay MacKay International Equity Fund |
| Value | Percent †^ | ||
| Banks | $ 12,741,943 | 4.0% | |
| Beverages | 12,508,527 | 3.9 | |
| Building Products | 5,038,736 | 1.6 | |
| Capital Markets | 16,045,512 | 5.0 | |
| Chemicals | 34,283,139 | 10.6 | |
| Electronic Equipment, Instruments & Components | 9,195,317 | 2.9 | |
| Financial Services | 21,393,721 | 6.6 | |
| Health Care Equipment & Supplies | 21,483,036 | 6.7 | |
| Hotels, Restaurants & Leisure | 6,829,451 | 2.1 | |
| Insurance | 16,522,828 | 5.1 | |
| Interactive Media & Services | 17,153,182 | 5.3 | |
| IT Services | 14,677,442 | 4.6 | |
| Life Sciences Tools & Services | 31,734,491 | 9.9 | |
| Pharmaceuticals | 7,227,096 | 2.2 | |
| Professional Services | 33,202,267 | 10.3 | |
| Real Estate Management & Development | 4,092,771 | 1.3 | |
| Software | 24,963,771 | 7.8 | |
| Trading Companies & Distributors | 21,959,182 | 6.8 | |
| 311,052,412 | 96.7 | ||
| Short-Term Investments | 5,809,624 | 1.8 | |
| Other Assets, Less Liabilities | 4,965,622 | 1.5 | |
| Net Assets | $321,827,658 | 100.0% |
| † | Percentages indicated are based on Fund net assets. |
| ^ | Industry classifications may be different than those used for compliance monitoring purposes. |
| Assets | |
| Investment in unaffiliated securities, at value (identified cost $287,545,923) including securities on loan of $9,773,924 | $315,997,012 |
| Investment in affiliated investment companies, at value (identified cost $865,024) | 865,024 |
| Cash denominated in foreign currencies (identified cost $9,849,098) | 9,748,828 |
| Receivables: | |
| Dividends | 882,897 |
| Fund shares sold | 9,534 |
| Securities lending | 1,169 |
| Other assets | 73,958 |
| Total assets | 327,578,422 |
| Liabilities | |
| Cash collateral received for securities on loan | 4,944,600 |
| Payables: | |
| Foreign capital gains tax (See Note 2) | 335,412 |
| Manager (See Note 3) | 194,299 |
| Fund shares redeemed | 118,579 |
| Transfer agent (See Note 3) | 43,567 |
| Shareholder communication | 40,896 |
| Professional fees | 31,120 |
| Custodian | 20,647 |
| NYLIFE Distributors (See Note 3) | 17,297 |
| Accrued expenses | 4,347 |
| Total liabilities | 5,750,764 |
| Net assets | $321,827,658 |
| Composition of Net Assets | |
| Shares of beneficial interest outstanding (par value of $.01 per share) unlimited number of shares authorized | $ 201,994 |
| Additional paid-in-capital | 331,467,279 |
| 331,669,273 | |
| Total distributable earnings (loss) | (9,841,615) |
| Net assets | $321,827,658 |
| Class A | |
| Net assets applicable to outstanding shares | $ 58,846,087 |
| Shares of beneficial interest outstanding | 3,717,545 |
| Net asset value per share outstanding | $ 15.83 |
| Maximum sales charge (5.50% of offering price) | 0.92 |
| Maximum offering price per share outstanding | $ 16.75 |
| Investor Class | |
| Net assets applicable to outstanding shares | $ 15,181,353 |
| Shares of beneficial interest outstanding | 979,454 |
| Net asset value per share outstanding | $ 15.50 |
| Maximum sales charge (5.00% of offering price) | 0.82 |
| Maximum offering price per share outstanding | $ 16.32 |
| Class B | |
| Net assets applicable to outstanding shares | $ 715,209 |
| Shares of beneficial interest outstanding | 55,620 |
| Net asset value and offering price per share outstanding | $ 12.86 |
| Class C | |
| Net assets applicable to outstanding shares | $ 1,064,255 |
| Shares of beneficial interest outstanding | 82,797 |
| Net asset value and offering price per share outstanding | $ 12.85 |
| Class I | |
| Net assets applicable to outstanding shares | $ 30,935,144 |
| Shares of beneficial interest outstanding | 1,933,733 |
| Net asset value and offering price per share outstanding | $ 16.00 |
| Class R1 | |
| Net assets applicable to outstanding shares | $ 117,319 |
| Shares of beneficial interest outstanding | 7,388 |
| Net asset value and offering price per share outstanding | $ 15.88 |
| Class R2 | |
| Net assets applicable to outstanding shares | $ 179,818 |
| Shares of beneficial interest outstanding | 11,351 |
| Net asset value and offering price per share outstanding | $ 15.84 |
| Class R3 | |
| Net assets applicable to outstanding shares | $ 877,175 |
| Shares of beneficial interest outstanding | 56,539 |
| Net asset value and offering price per share outstanding | $ 15.51 |
| Class R6 | |
| Net assets applicable to outstanding shares | $213,911,298 |
| Shares of beneficial interest outstanding | 13,354,979 |
| Net asset value and offering price per share outstanding | $ 16.02 |
| 14 | MainStay MacKay International Equity Fund |
| Investment Income (Loss) | |
| Income | |
| Dividends-unaffiliated (net of foreign tax withholding of $113,805) | $ 2,063,092 |
| Dividends-affiliated | 20,099 |
| Securities lending, net | 1,574 |
| Total income | 2,084,765 |
| Expenses | |
| Manager (See Note 3) | 1,415,061 |
| Transfer agent (See Note 3) | 121,970 |
| Distribution/Service—Class A (See Note 3) | 72,220 |
| Distribution/Service—Investor Class (See Note 3) | 18,844 |
| Distribution/Service—Class B (See Note 3) | 4,032 |
| Distribution/Service—Class C (See Note 3) | 5,740 |
| Distribution/Service—Class R2 (See Note 3) | 217 |
| Distribution/Service—Class R3 (See Note 3) | 1,963 |
| Registration | 58,234 |
| Professional fees | 52,349 |
| Custodian | 26,538 |
| Shareholder communication | 8,621 |
| Trustees | 3,671 |
| Shareholder service (See Note 3) | 534 |
| Miscellaneous | 7,871 |
| Total expenses before waiver/reimbursement | 1,797,865 |
| Expense waiver/reimbursement from Manager (See Note 3) | (287,539) |
| Reimbursement from prior custodian(a) | (633) |
| Net expenses | 1,509,693 |
| Net investment income (loss) | 575,072 |
| Realized and Unrealized Gain (Loss) | |
| Net realized gain (loss) on: | |
| Unaffiliated investment transactions | 3,371,377 |
| Foreign currency transactions | 206,375 |
| Net realized gain (loss) | 3,577,752 |
| Net change in unrealized appreciation (depreciation) on: | |
| Unaffiliated investments(b) | 39,425,746 |
| Translation of other assets and liabilities in foreign currencies | 76,968 |
| Net change in unrealized appreciation (depreciation) | 39,502,714 |
| Net realized and unrealized gain (loss) | 43,080,466 |
| Net increase (decrease) in net assets resulting from operations | $43,655,538 |
| (a) | Represents a refund for overbilling of custody fees. |
| (b) | Net change in unrealized appreciation (depreciation) on investments recorded net of foreign capital gains tax in the amount of $(438,959). |
for the six months ended April 30, 2023 (Unaudited) and the year ended October 31, 2022
| Six months ended April 30, 2023 | Year ended October 31, 2022 | |
| Increase (Decrease) in Net Assets | ||
| Operations: | ||
| Net investment income (loss) | $ 575,072 | $ 485,054 |
| Net realized gain (loss) | 3,577,752 | (37,200,728) |
| Net change in unrealized appreciation (depreciation) | 39,502,714 | (107,317,164) |
| Net increase (decrease) in net assets resulting from operations | 43,655,538 | (144,032,838) |
| Distributions to shareholders: | ||
| Class A | (90,565) | (11,213,676) |
| Investor Class | — | (2,781,204) |
| Class B | — | (311,669) |
| Class C | — | (353,778) |
| Class I | (180,586) | (6,710,826) |
| Class R1 | (343) | (18,831) |
| Class R2 | (96) | (33,750) |
| Class R3 | — | (120,330) |
| Class R6 | (1,176,572) | (34,544,245) |
| Total distributions to shareholders | (1,448,162) | (56,088,309) |
| Capital share transactions: | ||
| Net proceeds from sales of shares | 7,823,022 | 38,368,459 |
| Net asset value of shares issued to shareholders in reinvestment of distributions | 1,445,906 | 55,903,961 |
| Cost of shares redeemed | (27,180,526) | (37,926,779) |
| Increase (decrease) in net assets derived from capital share transactions | (17,911,598) | 56,345,641 |
| Net increase (decrease) in net assets | 24,295,778 | (143,775,506) |
| Net Assets | ||
| Beginning of period | 297,531,880 | 441,307,386 |
| End of period | $321,827,658 | $ 297,531,880 |
| 16 | MainStay MacKay International Equity Fund |
| Six months ended April 30, 2023* | Year Ended October 31, | ||||||||||
| Class A | 2022 | 2021 | 2020 | 2019 | 2018 | ||||||
| Net asset value at beginning of period | $ 13.81 | $ 23.67 | $ 18.27 | $ 17.12 | $ 15.48 | $ 16.38 | |||||
| Net investment income (loss) (a) | 0.01 | (0.02) | 0.01 | (0.01) | 0.09 | 0.03 | |||||
| Net realized and unrealized gain (loss) | 2.03 | (6.87) | 6.13 | 1.68 | 1.70 | (0.84) | |||||
| Total from investment operations | 2.04 | (6.89) | 6.14 | 1.67 | 1.79 | (0.81) | |||||
| Less distributions: | |||||||||||
| From net investment income | (0.02) | (0.01) | — | (0.05) | — | (0.09) | |||||
| From net realized gain on investments | — | (2.96) | (0.74) | (0.47) | (0.15) | — | |||||
| Total distributions | (0.02) | (2.97) | (0.74) | (0.52) | (0.15) | (0.09) | |||||
| Net asset value at end of period | $ 15.83 | $ 13.81 | $ 23.67 | $ 18.27 | $ 17.12 | $ 15.48 | |||||
| Total investment return (b) | 14.80% | (32.87)% | 34.31% | 9.84% | 11.74% | (4.98)% | |||||
| Ratios (to average net assets)/Supplemental Data: | |||||||||||
| Net investment income (loss) | 0.10%†† | (0.11)% | 0.05% | (0.09)% | 0.57% | 0.17% | |||||
| Net expenses (c) | 1.22%†† | 1.19% | 1.18% | 1.21% | 1.21% | 1.32% | |||||
| Expenses (before waiver/reimbursement) (c) | 1.38%†† | 1.38% | 1.33% | 1.40% | 1.35% | 1.32% | |||||
| Portfolio turnover rate | 42% | 94% | 101% | 135% | 58% | 53% | |||||
| Net assets at end of period (in 000’s) | $ 58,846 | $ 53,873 | $ 89,076 | $ 61,795 | $ 57,566 | $ 59,304 | |||||
| * | Unaudited. |
| †† | Annualized. |
| (a) | Per share data based on average shares outstanding during the period. |
| (b) | Total investment return is calculated exclusive of sales charges and assumes the reinvestment of dividends and distributions. For periods of less than one year, total return is not annualized. |
| (c) | In addition to the fees and expenses which the Fund bears directly, it also indirectly bears a pro-rata share of the fees and expenses of the underlying funds in which it invests. Such indirect expenses are not included in the above expense ratios. |
| Six months ended April 30, 2023* | Year Ended October 31, | ||||||||||
| Investor Class | 2022 | 2021 | 2020 | 2019 | 2018 | ||||||
| Net asset value at beginning of period | $ 13.53 | $ 23.30 | $ 18.06 | $ 16.94 | $ 15.38 | $ 16.27 | |||||
| Net investment income (loss) (a) | (0.02) | (0.08) | (0.06) | (0.07) | 0.03 | (0.03) | |||||
| Net realized and unrealized gain (loss) | 1.99 | (6.73) | 6.04 | 1.66 | 1.68 | (0.83) | |||||
| Total from investment operations | 1.97 | (6.81) | 5.98 | 1.59 | 1.71 | (0.86) | |||||
| Less distributions: | |||||||||||
| From net investment income | — | — | — | — | — | (0.03) | |||||
| From net realized gain on investments | — | (2.96) | (0.74) | (0.47) | (0.15) | — | |||||
| Total distributions | — | (2.96) | (0.74) | (0.47) | (0.15) | (0.03) | |||||
| Net asset value at end of period | $ 15.50 | $ 13.53 | $ 23.30 | $ 18.06 | $ 16.94 | $ 15.38 | |||||
| Total investment return (b) | 14.56% | (33.07)% | 33.80% | 9.40% | 11.36% | (5.31)% | |||||
| Ratios (to average net assets)/Supplemental Data: | |||||||||||
| Net investment income (loss) | (0.28)%†† | (0.45)% | (0.30)% | (0.43)% | 0.21% | (0.19)% | |||||
| Net expenses (c) | 1.59%†† | 1.54% | 1.56% | 1.56% | 1.59% | 1.66% | |||||
| Expenses (before waiver/reimbursement) (c) | 1.87%†† | 1.72% | 1.71% | 1.75% | 1.75% | 1.70% | |||||
| Portfolio turnover rate | 42% | 94% | 101% | 135% | 58% | 53% | |||||
| Net assets at end of period (in 000's) | $ 15,181 | $ 13,856 | $ 21,990 | $ 21,699 | $ 23,870 | $ 21,679 | |||||
| * | Unaudited. |
| †† | Annualized. |
| (a) | Per share data based on average shares outstanding during the period. |
| (b) | Total investment return is calculated exclusive of sales charges and assumes the reinvestment of dividends and distributions. For periods of less than one year, total return is not annualized. |
| (c) | In addition to the fees and expenses which the Fund bears directly, it also indirectly bears a pro-rata share of the fees and expenses of the underlying funds in which it invests. Such indirect expenses are not included in the above expense ratios. |
| Six months ended April 30, 2023* | Year Ended October 31, | ||||||||||
| Class B | 2022 | 2021 | 2020 | 2019 | 2018 | ||||||
| Net asset value at beginning of period | $ 11.26 | $ 20.05 | $ 15.74 | $ 14.94 | $ 13.68 | $ 14.55 | |||||
| Net investment income (loss) (a) | (0.07) | (0.17) | (0.20) | (0.18) | (0.08) | (0.14) | |||||
| Net realized and unrealized gain (loss) | 1.67 | (5.66) | 5.25 | 1.45 | 1.49 | (0.73) | |||||
| Total from investment operations | 1.60 | (5.83) | 5.05 | 1.27 | 1.41 | (0.87) | |||||
| Less distributions: | |||||||||||
| From net realized gain on investments | — | (2.96) | (0.74) | (0.47) | (0.15) | — | |||||
| Net asset value at end of period | $ 12.86 | $ 11.26 | $ 20.05 | $ 15.74 | $ 14.94 | $ 13.68 | |||||
| Total investment return (b) | 14.21% | (33.62)% | 32.84% | 8.57% | 10.49% | (5.98)% | |||||
| Ratios (to average net assets)/Supplemental Data: | |||||||||||
| Net investment income (loss) | (1.06)%†† | (1.20)% | (1.06)% | (1.20)% | (0.59)% | (0.95)% | |||||
| Net expenses (c) | 2.34%†† | 2.29% | 2.31% | 2.31% | 2.35% | 2.41% | |||||
| Expenses (before waiver/reimbursement) (c) | 2.62%†† | 2.47% | 2.46% | 2.50% | 2.50% | 2.44% | |||||
| Portfolio turnover rate | 42% | 94% | 101% | 135% | 58% | 53% | |||||
| Net assets at end of period (in 000’s) | $ 715 | $ 871 | $ 2,192 | $ 2,368 | $ 3,345 | $ 4,404 | |||||
| * | Unaudited. |
| †† | Annualized. |
| (a) | Per share data based on average shares outstanding during the period. |
| (b) | Total investment return is calculated exclusive of sales charges and assumes the reinvestment of dividends and distributions. For periods of less than one year, total return is not annualized. |
| (c) | In addition to the fees and expenses which the Fund bears directly, it also indirectly bears a pro-rata share of the fees and expenses of the underlying funds in which it invests. Such indirect expenses are not included in the above expense ratios. |
| Six months ended April 30, 2023* | Year Ended October 31, | ||||||||||
| Class C | 2022 | 2021 | 2020 | 2019 | 2018 | ||||||
| Net asset value at beginning of period | $ 11.26 | $ 20.04 | $ 15.75 | $ 14.93 | $ 13.68 | $ 14.56 | |||||
| Net investment income (loss) (a) | (0.06) | (0.17) | (0.21) | (0.18) | (0.09) | (0.14) | |||||
| Net realized and unrealized gain (loss) | 1.65 | (5.65) | 5.24 | 1.47 | 1.49 | (0.74) | |||||
| Total from investment operations | 1.59 | (5.82) | 5.03 | 1.29 | 1.40 | (0.88) | |||||
| Less distributions: | |||||||||||
| From net realized gain on investments | — | (2.96) | (0.74) | (0.47) | (0.15) | — | |||||
| Net asset value at end of period | $ 12.85 | $ 11.26 | $ 20.04 | $ 15.75 | $ 14.93 | $ 13.68 | |||||
| Total investment return (b) | 14.12% | (33.58)% | 32.69% | 8.64% | 10.49% | (6.04)% | |||||
| Ratios (to average net assets)/Supplemental Data: | |||||||||||
| Net investment income (loss) | (1.05)%†† | (1.21)% | (1.12)% | (1.20)% | (0.65)% | (0.93)% | |||||
| Net expenses (c) | 2.34%†† | 2.29% | 2.31% | 2.31% | 2.35% | 2.41% | |||||
| Expenses (before waiver/reimbursement) (c) | 2.62%†† | 2.47% | 2.46% | 2.50% | 2.50% | 2.44% | |||||
| Portfolio turnover rate | 42% | 94% | 101% | 135% | 58% | 53% | |||||
| Net assets at end of period (in 000’s) | $ 1,064 | $ 1,153 | $ 2,470 | $ 2,952 | $ 3,915 | $ 6,960 | |||||
| * | Unaudited. |
| †† | Annualized. |
| (a) | Per share data based on average shares outstanding during the period. |
| (b) | Total investment return is calculated exclusive of sales charges and assumes the reinvestment of dividends and distributions. For periods of less than one year, total return is not annualized. |
| (c) | In addition to the fees and expenses which the Fund bears directly, it also indirectly bears a pro-rata share of the fees and expenses of the underlying funds in which it invests. Such indirect expenses are not included in the above expense ratios. |
| 18 | MainStay MacKay International Equity Fund |
| Six months ended April 30, 2023* | Year Ended October 31, | ||||||||||
| Class I | 2022 | 2021 | 2020 | 2019 | 2018 | ||||||
| Net asset value at beginning of period | $ 13.98 | $ 23.93 | $ 18.43 | $ 17.28 | $ 15.57 | $ 16.48 | |||||
| Net investment income (loss) (a) | 0.04 | 0.04 | 0.09 | 0.05 | 0.09 | 0.07 | |||||
| Net realized and unrealized gain (loss) | 2.06 | (6.94) | 6.17 | 1.69 | 1.78 | (0.85) | |||||
| Total from investment operations | 2.10 | (6.90) | 6.26 | 1.74 | 1.87 | (0.78) | |||||
| Less distributions: | |||||||||||
| From net investment income | (0.08) | (0.09) | (0.02) | (0.12) | (0.01) | (0.13) | |||||
| From net realized gain on investments | — | (2.96) | (0.74) | (0.47) | (0.15) | — | |||||
| Total distributions | (0.08) | (3.05) | (0.76) | (0.59) | (0.16) | (0.13) | |||||
| Net asset value at end of period | $ 16.00 | $ 13.98 | $ 23.93 | $ 18.43 | $ 17.28 | $ 15.57 | |||||
| Total investment return (b) | 15.05% | (32.66)% | 34.72% | 10.22% | 12.19% | (4.80)% | |||||
| Ratios (to average net assets)/Supplemental Data: | |||||||||||
| Net investment income (loss) | 0.47%†† | 0.23% | 0.39% | 0.27% | 0.55% | 0.42% | |||||
| Net expenses (c) | 0.85%†† | 0.85% | 0.85% | 0.85% | 0.92% | 1.07% | |||||
| Expenses (before waiver/reimbursement) (c) | 1.13%†† | 1.13% | 1.08% | 1.16% | 1.10% | 1.07% | |||||
| Portfolio turnover rate | 42% | 94% | 101% | 135% | 58% | 53% | |||||
| Net assets at end of period (in 000’s) | $ 30,935 | $ 31,033 | $ 53,914 | $ 35,880 | $ 43,280 | $ 213,030 | |||||
| * | Unaudited. |
| †† | Annualized. |
| (a) | Per share data based on average shares outstanding during the period. |
| (b) | Total investment return is calculated exclusive of sales charges and assumes the reinvestment of dividends and distributions. Class I shares are not subject to sales charges. For periods of less than one year, total return is not annualized. |
| (c) | In addition to the fees and expenses which the Fund bears directly, it also indirectly bears a pro-rata share of the fees and expenses of the underlying funds in which it invests. Such indirect expenses are not included in the above expense ratios. |
| Six months ended April 30, 2023* | Year Ended October 31, | ||||||||||
| Class R1 | 2022 | 2021 | 2020 | 2019 | 2018 | ||||||
| Net asset value at beginning of period | $ 13.86 | $ 23.75 | $ 18.31 | $ 17.15 | $ 15.48 | $ 16.38 | |||||
| Net investment income (loss) (a) | 0.02 | 0.01 | 0.05 | (0.01) | 0.05 | 0.05 | |||||
| Net realized and unrealized gain (loss) | 2.05 | (6.90) | 6.13 | 1.71 | 1.77 | (0.84) | |||||
| Total from investment operations | 2.07 | (6.89) | 6.18 | 1.70 | 1.82 | (0.79) | |||||
| Less distributions: | |||||||||||
| From net investment income | (0.05) | (0.04) | — | (0.07) | — | (0.11) | |||||
| From net realized gain on investments | — | (2.96) | (0.74) | (0.47) | (0.15) | — | |||||
| Total distributions | (0.05) | (3.00) | (0.74) | (0.54) | (0.15) | (0.11) | |||||
| Net asset value at end of period | $ 15.88 | $ 13.86 | $ 23.75 | $ 18.31 | $ 17.15 | $ 15.48 | |||||
| Total investment return (b) | 14.93% | (32.79)% | 34.46% | 10.05% | 11.93% | (4.86)% | |||||
| Ratios (to average net assets)/Supplemental Data: | |||||||||||
| Net investment income (loss) | 0.26%†† | 0.05% | 0.23% | (0.05)% | 0.33% | 0.29% | |||||
| Net expenses (c) | 1.07%†† | 1.04% | 1.03% | 1.06% | 1.11% | 1.17% | |||||
| Expenses (before waiver/reimbursement) (c) | 1.23%†† | 1.23% | 1.18% | 1.25% | 1.19% | 1.17% | |||||
| Portfolio turnover rate | 42% | 94% | 101% | 135% | 58% | 53% | |||||
| Net assets at end of period (in 000’s) | $ 117 | $ 97 | $ 157 | $ 143 | $ 265 | $ 2,109 | |||||
| * | Unaudited. |
| †† | Annualized. |
| (a) | Per share data based on average shares outstanding during the period. |
| (b) | Total investment return is calculated exclusive of sales charges and assumes the reinvestment of dividends and distributions. Class R1 shares are not subject to sales charges. For periods of less than one year, total return is not annualized. |
| (c) | In addition to the fees and expenses which the Fund bears directly, it also indirectly bears a pro-rata share of the fees and expenses of the underlying funds in which it invests. Such indirect expenses are not included in the above expense ratios. |
| 20 | MainStay MacKay International Equity Fund |
| Six months ended April 30, 2023* | Year Ended October 31, | ||||||||||
| Class R2 | 2022 | 2021 | 2020 | 2019 | 2018 | ||||||
| Net asset value at beginning of period | $ 13.81 | $ 23.68 | $ 18.30 | $ 17.15 | $ 15.52 | $ 16.42 | |||||
| Net investment income (loss) (a) | (0.00)‡ | (0.04) | (0.01) | (0.03) | 0.06 | (0.02) | |||||
| Net realized and unrealized gain (loss) | 2.04 | (6.87) | 6.13 | 1.68 | 1.72 | (0.80) | |||||
| Total from investment operations | 2.04 | (6.91) | 6.12 | 1.65 | 1.78 | (0.82) | |||||
| Less distributions: | |||||||||||
| From net investment income | (0.01) | — | — | (0.03) | — | (0.08) | |||||
| From net realized gain on investments | — | (2.96) | (0.74) | (0.47) | (0.15) | — | |||||
| Total distributions | (0.01) | (2.96) | (0.74) | (0.50) | (0.15) | (0.08) | |||||
| Net asset value at end of period | $ 15.84 | $ 13.81 | $ 23.68 | $ 18.30 | $ 17.15 | $ 15.52 | |||||
| Total investment return (b) | 14.76% | (32.95)% | 34.14% | 9.72% | 11.64% | (5.06)%(c) | |||||
| Ratios (to average net assets)/Supplemental Data: | |||||||||||
| Net investment income (loss) | (0.01)%†† | (0.22)% | (0.06)% | (0.18)% | 0.38% | (0.13)% | |||||
| Net expenses (d) | 1.32%†† | 1.29% | 1.28% | 1.31% | 1.31% | 1.42% | |||||
| Expenses (before waiver/reimbursement) (d) | 1.48%†��� | 1.48% | 1.43% | 1.50% | 1.45% | 1.42% | |||||
| Portfolio turnover rate | 42% | 94% | 101% | 135% | 58% | 53% | |||||
| Net assets at end of period (in 000’s) | $ 180 | $ 165 | $ 291 | $ 486 | $ 454 | $ 602 | |||||
| * | Unaudited. |
| ‡ | Less than one cent per share. |
| †† | Annualized. |
| (a) | Per share data based on average shares outstanding during the period. |
| (b) | Total investment return is calculated exclusive of sales charges and assumes the reinvestment of dividends and distributions. Class R2 shares are not subject to sales charges. For periods of less than one year, total return is not annualized. |
| (c) | Total investment return may reflect adjustments to conform to generally accepted accounting principles. |
| (d) | In addition to the fees and expenses which the Fund bears directly, it also indirectly bears a pro-rata share of the fees and expenses of the underlying funds in which it invests. Such indirect expenses are not included in the above expense ratios. |
| Six months ended April 30, 2023* | Year Ended October 31, | ||||||||||
| Class R3 | 2022 | 2021 | 2020 | 2019 | 2018 | ||||||
| Net asset value at beginning of period | $ 13.54 | $ 23.32 | $ 18.08 | $ 16.96 | $ 15.38 | $ 16.29 | |||||
| Net investment income (loss) (a) | (0.02) | (0.07) | (0.06) | (0.08) | 0.03 | (0.04) | |||||
| Net realized and unrealized gain (loss) | 1.99 | (6.75) | 6.04 | 1.67 | 1.70 | (0.83) | |||||
| Total from investment operations | 1.97 | (6.82) | 5.98 | 1.59 | 1.73 | (0.87) | |||||
| Less distributions: | |||||||||||
| From net investment income | — | — | — | — | — | (0.04) | |||||
| From net realized gain on investments | — | (2.96) | (0.74) | (0.47) | (0.15) | — | |||||
| Total distributions | — | (2.96) | (0.74) | (0.47) | (0.15) | (0.04) | |||||
| Net asset value at end of period | $ 15.51 | $ 13.54 | $ 23.32 | $ 18.08 | $ 16.96 | $ 15.38 | |||||
| Total investment return (b) | 14.55% | (33.09)% | 33.77% | 9.46% | 11.35% | (5.39)%(c) | |||||
| Ratios (to average net assets)/Supplemental Data: | |||||||||||
| Net investment income (loss) | (0.24)%†† | (0.45)% | (0.28)% | (0.46)% | 0.22% | (0.21)% | |||||
| Net expenses (d) | 1.57%†† | 1.54% | 1.53% | 1.56% | 1.56% | 1.67% | |||||
| Expenses (before waiver/reimbursement) (d) | 1.73%†† | 1.73% | 1.68% | 1.75% | 1.70% | 1.67% | |||||
| Portfolio turnover rate | 42% | 94% | 101% | 135% | 58% | 53% | |||||
| Net assets at end of period (in 000’s) | $ 877 | $ 696 | $ 942 | $ 1,140 | $ 1,154 | $ 1,057 | |||||
| * | Unaudited. |
| †† | Annualized. |
| (a) | Per share data based on average shares outstanding during the period. |
| (b) | Total investment return is calculated exclusive of sales charges and assumes the reinvestment of dividends and distributions. Class R3 shares are not subject to sales charges. For periods of less than one year, total return is not annualized. |
| (c) | Total investment return may reflect adjustments to conform to generally accepted accounting principles. |
| (d) | In addition to the fees and expenses which the Fund bears directly, it also indirectly bears a pro-rata share of the fees and expenses of the underlying funds in which it invests. Such indirect expenses are not included in the above expense ratios. |
| 22 | MainStay MacKay International Equity Fund |
| Six months ended April 30, 2023* | Year Ended October 31, | February 28, 2019^ through October 31, 2019 | |||||||
| Class R6 | 2022 | 2021 | 2020 | ||||||
| Net asset value at beginning of period | $ 14.00 | $ 23.95 | $ 18.45 | $ 17.28 | $ 16.13 | ||||
| Net investment income (loss) (a) | 0.04 | 0.04 | 0.09 | 0.05 | 0.15 | ||||
| Net realized and unrealized gain (loss) | 2.06 | (6.94) | 6.18 | 1.70 | 1.00 | ||||
| Total from investment operations | 2.10 | (6.90) | 6.27 | 1.75 | 1.15 | ||||
| Less distributions: | |||||||||
| From net investment income | (0.08) | (0.09) | (0.03) | (0.11) | — | ||||
| From net realized gain on investments | — | (2.96) | (0.74) | (0.47) | — | ||||
| Total distributions | (0.08) | (3.05) | (0.77) | (0.58) | — | ||||
| Net asset value at end of period | $ 16.02 | $ 14.00 | $ 23.95 | $ 18.45 | $ 17.28 | ||||
| Total investment return (b) | 15.05% | (32.64)% | 34.74% | 10.27% | 7.13% | ||||
| Ratios (to average net assets)/Supplemental Data: | |||||||||
| Net investment income (loss) | 0.48%†† | 0.26% | 0.40% | 0.31% | 1.37%†† | ||||
| Net expenses (c) | 0.83%†† | 0.83% | 0.83% | 0.83% | 0.83%†† | ||||
| Expenses (before waiver/reimbursement) (c) | 0.99%†† | 1.01% | 0.98% | 1.02% | 1.00%†† | ||||
| Portfolio turnover rate | 42% | 94% | 101% | 135% | 58% | ||||
| Net assets at end of period (in 000’s) | $ 213,911 | $ 195,790 | $ 270,274 | $ 201,210 | $ 177,483 | ||||
| * | Unaudited. |
| ^ | Inception date. |
| †† | Annualized. |
| (a) | Per share data based on average shares outstanding during the period. |
| (b) | Total investment return is calculated exclusive of sales charges and assumes the reinvestment of dividends and distributions. Class R6 shares are not subject to sales charges. For periods of less than one year, total return is not annualized. |
| (c) | In addition to the fees and expenses which the Fund bears directly, it also indirectly bears a pro-rata share of the fees and expenses of the underlying funds in which it invests. Such indirect expenses are not included in the above expense ratios. |
| Class | Commenced Operations |
| Class A | January 3, 1995 |
| Investor Class | February 28, 2008 |
| Class B | September 13, 1994 |
| Class C | September 1, 1998 |
| Class I | January 2, 2004 |
| Class R1 | January 2, 2004 |
| Class R2 | January 2, 2004 |
| Class R3 | April 28, 2006 |
| Class R6 | February 28, 2019 |
| 24 | MainStay MacKay International Equity Fund |
| • | Level 1—quoted prices (unadjusted) in active markets for an identical asset or liability |
| • | Level 2—other significant observable inputs (including quoted prices for a similar asset or liability in active markets, interest rates and yield curves, prepayment speeds, credit risk, etc.) |
| • | Level 3—significant unobservable inputs (including the Fund's own assumptions about the assumptions that market participants would use in measuring fair value of an asset or liability) |
| • Broker/dealer quotes | • Benchmark securities |
| • Two-sided markets | • Reference data (corporate actions or material event notices) |
| • Bids/offers | • Monthly payment information |
| • Industry and economic events | • Reported trades |
| 26 | MainStay MacKay International Equity Fund |
| 28 | MainStay MacKay International Equity Fund |
| Class R1 | $ 55 |
| Class R2 | 87 |
| Class R3 | 392 |
| Class | Expense | Waived |
| Class A | $40,961 | $ — |
| Investor Class | 47,372 | (8,775) |
| Class B | 2,546 | (477) |
| Class C | 3,618 | (675) |
| Class I | 22,508 | — |
| Class R1 | 78 | — |
| Class R2 | 123 | — |
| Class R3 | 556 | — |
| Class R6 | 4,208 | — |
| Class I | $ 12,661,691 | 40.9% |
| Class R6 | 163,045,911 | 76.2 |
| Federal Tax Cost | Gross Unrealized Appreciation | Gross Unrealized (Depreciation) | Net Unrealized Appreciation/ (Depreciation) | |
| Investments in Securities | $296,038,042 | $31,040,916 | $(10,216,922) | $20,823,994 |
| Capital Loss Available Through | Short-Term Capital Loss Amounts (000’s) | Long-Term Capital Loss Amounts (000’s) |
| Unlimited | $34,364 | $— |
| 2022 | |
| Distributions paid from: | |
| Ordinary Income | $22,641,609 |
| Long-Term Capital Gains | 33,446,700 |
| Total | $56,088,309 |
| 30 | MainStay MacKay International Equity Fund |
| Class A | Shares | Amount |
| Six-month period ended April 30, 2023: | ||
| Shares sold | 70,283 | $ 1,087,924 |
| Shares issued to shareholders in reinvestment of distributions | 5,740 | 89,200 |
| Shares redeemed | (293,477) | (4,480,790) |
| Net increase (decrease) in shares outstanding before conversion | (217,454) | (3,303,666) |
| Shares converted into Class A (See Note 1) | 33,593 | 515,568 |
| Net increase (decrease) | (183,861) | $ (2,788,098) |
| Year ended October 31, 2022: | ||
| Shares sold | 289,482 | $ 4,856,586 |
| Shares issued to shareholders in reinvestment of distributions | 560,771 | 11,086,447 |
| Shares redeemed | (753,863) | (12,494,554) |
| Net increase (decrease) in shares outstanding before conversion | 96,390 | 3,448,479 |
| Shares converted into Class A (See Note 1) | 43,392 | 762,030 |
| Shares converted from Class A (See Note 1) | (2,051) | (29,683) |
| Net increase (decrease) | 137,731 | $ 4,180,826 |
| Investor Class | Shares | Amount |
| Six-month period ended April 30, 2023: | ||
| Shares sold | 16,487 | $ 248,865 |
| Shares redeemed | (41,610) | (630,812) |
| Net increase (decrease) in shares outstanding before conversion | (25,123) | (381,947) |
| Shares converted into Investor Class (See Note 1) | 7,526 | 115,156 |
| Shares converted from Investor Class (See Note 1) | (27,357) | (411,477) |
| Net increase (decrease) | (44,954) | $ (678,268) |
| Year ended October 31, 2022: | ||
| Shares sold | 31,347 | $ 526,561 |
| Shares issued to shareholders in reinvestment of distributions | 142,976 | 2,776,584 |
| Shares redeemed | (83,625) | (1,399,796) |
| Net increase (decrease) in shares outstanding before conversion | 90,698 | 1,903,349 |
| Shares converted into Investor Class (See Note 1) | 15,324 | 257,757 |
| Shares converted from Investor Class (See Note 1) | (25,373) | (450,746) |
| Net increase (decrease) | 80,649 | $ 1,710,360 |
| Class B | Shares | Amount |
| Six-month period ended April 30, 2023: | ||
| Shares redeemed | (6,746) | $ (83,828) |
| Net increase (decrease) in shares outstanding before conversion | (6,746) | (83,828) |
| Shares converted from Class B (See Note 1) | (14,983) | (188,546) |
| Net increase (decrease) | (21,729) | $ (272,374) |
| Year ended October 31, 2022: | ||
| Shares sold | 1,124 | $ 15,284 |
| Shares issued to shareholders in reinvestment of distributions | 19,144 | 311,669 |
| Shares redeemed | (16,841) | (230,567) |
| Net increase (decrease) in shares outstanding before conversion | 3,427 | 96,386 |
| Shares converted from Class B (See Note 1) | (35,411) | (491,479) |
| Net increase (decrease) | (31,984) | $ (395,093) |
| Class C | Shares | Amount |
| Six-month period ended April 30, 2023: | ||
| Shares sold | 2,739 | $ 33,577 |
| Shares redeemed | (19,888) | (246,578) |
| Net increase (decrease) in shares outstanding before conversion | (17,149) | (213,001) |
| Shares converted from Class C (See Note 1) | (2,425) | (30,701) |
| Net increase (decrease) | (19,574) | $ (243,702) |
| Year ended October 31, 2022: | ||
| Shares sold | 10,958 | $ 160,195 |
| Shares issued to shareholders in reinvestment of distributions | 21,744 | 353,778 |
| Shares redeemed | (48,237) | (687,659) |
| Net increase (decrease) in shares outstanding before conversion | (15,535) | (173,686) |
| Shares converted from Class C (See Note 1) | (5,356) | (77,562) |
| Net increase (decrease) | (20,891) | $ (251,248) |
| Class I | Shares | Amount |
| Six-month period ended April 30, 2023: | ||
| Shares sold | 98,408 | $ 1,525,640 |
| Shares issued to shareholders in reinvestment of distributions | 11,464 | 179,759 |
| Shares redeemed | (395,629) | (6,099,546) |
| Net increase (decrease) | (285,757) | $ (4,394,147) |
| Year ended October 31, 2022: | ||
| Shares sold | 287,164 | $ 5,134,297 |
| Shares issued to shareholders in reinvestment of distributions | 334,732 | 6,681,247 |
| Shares redeemed | (657,717) | (11,940,886) |
| Net increase (decrease) in shares outstanding before conversion | (35,821) | (125,342) |
| Shares converted into Class I (See Note 1) | 2,027 | 29,683 |
| Net increase (decrease) | (33,794) | $ (95,659) |
| Class R1 | Shares | Amount |
| Six-month period ended April 30, 2023: | ||
| Shares sold | 496 | $ 7,689 |
| Shares issued to shareholders in reinvestment of distributions | 22 | 343 |
| Shares redeemed | (99) | (1,473) |
| Net increase (decrease) | 419 | $ 6,559 |
| Year ended October 31, 2022: | ||
| Shares sold | 1,471 | $ 24,401 |
| Shares issued to shareholders in reinvestment of distributions | 950 | 18,831 |
| Shares redeemed | (2,084) | (33,689) |
| Net increase (decrease) | 337 | $ 9,543 |
| Class R2 | Shares | Amount |
| Six-month period ended April 30, 2023: | ||
| Shares sold | 174 | $ 2,677 |
| Shares issued to shareholders in reinvestment of distributions | 2 | 32 |
| Shares redeemed | (749) | (11,377) |
| Net increase (decrease) | (573) | $ (8,668) |
| Year ended October 31, 2022: | ||
| Shares sold | 742 | $ 11,889 |
| Shares issued to shareholders in reinvestment of distributions | 577 | 11,421 |
| Shares redeemed | (1,689) | (36,585) |
| Net increase (decrease) | (370) | $ (13,275) |
| Class R3 | Shares | Amount |
| Six-month period ended April 30, 2023: | ||
| Shares sold | 7,194 | $ 106,708 |
| Shares redeemed | (2,056) | (29,689) |
| Net increase (decrease) | 5,138 | $ 77,019 |
| Year ended October 31, 2022: | ||
| Shares sold | 7,202 | $ 124,556 |
| Shares issued to shareholders in reinvestment of distributions | 6,160 | 119,739 |
| Shares redeemed | (2,370) | (36,864) |
| Net increase (decrease) | 10,992 | $ 207,431 |
| Class R6 | Shares | Amount |
| Six-month period ended April 30, 2023: | ||
| Shares sold | 310,386 | $ 4,809,942 |
| Shares issued to shareholders in reinvestment of distributions | 74,941 | 1,176,572 |
| Shares redeemed | (1,015,652) | (15,596,433) |
| Net increase (decrease) | (630,325) | $ (9,609,919) |
| Year ended October 31, 2022: | ||
| Shares sold | 1,629,080 | $ 27,514,690 |
| Shares issued to shareholders in reinvestment of distributions | 1,728,941 | 34,544,245 |
| Shares redeemed | (655,742) | (11,066,179) |
| Net increase (decrease) | 2,702,279 | $ 50,992,756 |
| 32 | MainStay MacKay International Equity Fund |
| 34 | MainStay MacKay International Equity Fund |
| 36 | MainStay MacKay International Equity Fund |
| 38 | MainStay MacKay International Equity Fund |
1.
| 2. | This Fund is registered for sale in CA, CT, DE, FL, MA, NJ, NY and VT. |
| 3. | An affiliate of New York Life Investment Management LLC. |
| 5022225MS043-23 | MSIE10-06/23 |
please log in to newyorklifeinvestments.com/accounts.
| Not FDIC/NCUA Insured | Not a Deposit | May Lose Value | No Bank Guarantee | Not Insured by Any Government Agency |


President

| Average Annual Total Returns for the Period-Ended April 30, 2023 | ||||||||
| Class | Sales Charge | Inception Date | Six Months1 | One Year | Five Years | Ten Years or Since Inception | Gross Expense Ratio2 | |
| Class A Shares | Maximum 4.50% Initial Sales Charge | With sales charges | 2/28/1997 | 1.68% | -3.62% | 0.71% | 1.36% | 1.03% |
| Excluding sales charges | 6.47 | 0.92 | 1.64 | 1.83 | 1.03 | |||
| Investor Class Shares3 | Maximum 4.00% Initial Sales Charge | With sales charges | 2/28/2008 | 2.16 | -3.30 | 0.62 | 1.29 | 1.17 |
| Excluding sales charges | 6.42 | 0.73 | 1.56 | 1.76 | 1.17 | |||
| Class B Shares4 | Maximum 5.00% CDSC | With sales charges | 2/28/1997 | 0.99 | -4.89 | 0.42 | 1.00 | 1.92 |
| if Redeemed Within the First Six Years of Purchase | Excluding sales charges | 5.99 | -0.03 | 0.79 | 1.00 | 1.92 | ||
| Class C Shares | Maximum 1.00% CDSC | With sales charges | 9/1/1998 | 5.13 | -0.88 | 0.81 | 1.01 | 1.92 |
| if Redeemed Within One Year of Purchase | Excluding sales charges | 6.13 | 0.09 | 0.81 | 1.01 | 1.92 | ||
| Class I Shares | No Sales Charge | 1/2/2004 | 6.64 | 1.26 | 1.93 | 2.10 | 0.78 | |
| Class R2 Shares | No Sales Charge | 2/28/2014 | 6.55 | 0.94 | 1.57 | 1.64 | 1.13 | |
| Class R3 Shares | No Sales Charge | 2/29/2016 | 6.42 | 0.68 | 1.28 | 2.78 | 1.38 | |
| Class R6 Shares | No Sales Charge | 2/28/2018 | 6.77 | 1.30 | 2.12 | 2.03 | 0.65 | |
| 1. | Not annualized. |
| 2. | The gross expense ratios presented reflect the Fund’s “Total Annual Fund Operating Expenses” from the most recent Prospectus, as supplemented, and may differ from other expense ratios disclosed in this report. |
| 3. | Prior to June 30, 2020, the maximum initial sales charge was 4.50%, which is reflected in the applicable average annual total return figures shown. |
| 4. | Class B shares are closed to all new purchases as well as additional investments by existing Class B shareholders. |
| Benchmark Performance* | Six Months1 | One Year | Five Years | Ten Years |
| Bloomberg U.S. Aggregate Bond Index2 | 6.91% | -0.43% | 1.18% | 1.32% |
| ICE BofA U.S. Dollar 3-Month Deposit Offered Rate Constant Maturity Index3 | 2.11 | 2.78 | 1.62 | 1.10 |
| Morningstar Nontraditional Bond Category Average4 | 3.87 | -0.39 | 1.26 | 1.56 |
| * | Returns for indices reflect no deductions for fees, expenses or taxes, except for foreign withholding taxes where applicable. Results assume reinvestment of all dividends and capital gains. An investment cannot be made directly in an index. |
| 1. | Not annualized. |
| 2. | The Bloomberg U.S. Aggregate Bond Index is the Fund's primary benchmark. The Bloomberg U.S. Aggregate Bond Index is a broad-based benchmark that measures performance of the investment-grade, U.S. dollar denominated, fixed-rate taxable bond market, including Treasurys, government-related and corporate securities, mortgage-backed securities (agency fixed-rate and hybrid adjustable-rate mortgage pass-throughs), asset-backed securities and commercial mortgage-backed securities. |
| 3. | The Fund has selected the ICE BofA U.S. Dollar 3-Month Deposit Offered Rate Constant Maturity Index as a secondary benchmark. The ICE BofA U.S. Dollar 3-Month Deposit Offered Rate Constant Maturity Index is unmanaged and tracks the performance of a synthetic asset paying a deposit offered rate to a stated maturity. The index is based on the assumed purchase at par of a synthetic instrument having exactly its stated maturity and with a coupon equal to that day’s fixing rate. That issue is assumed to be sold the following business day (priced at a yield equal to the current day fixing rate) and rolled into a new instrument. |
| 4. | The Fund has selected the Morningstar Nontraditional Bond Category Average as an additional benchmark. The Morningstar Nontraditional Bond Category Average contains funds that pursue strategies divergent in one or more ways from conventional practice in the broader bond-fund universe. Morningstar category averages are equal-weighted returns based on constituents of the category at the end of the period. |
| 6 | MainStay MacKay Strategic Bond Fund |
| Share Class | Beginning Account Value 11/1/22 | Ending Account Value (Based on Actual Returns and Expenses) 4/30/23 | Expenses Paid During Period1 | Ending Account Value (Based on Hypothetical 5% Annualized Return and Actual Expenses) 4/30/23 | Expenses Paid During Period1 | Net Expense Ratio During Period2 |
| Class A Shares | $1,000.00 | $1,064.70 | $ 5.32 | $1,019.64 | $5.21 | 1.04% |
| Investor Class Shares | $1,000.00 | $1,064.20 | $ 6.40 | $1,018.60 | $6.26 | 1.25% |
| Class B Shares | $1,000.00 | $1,059.90 | $10.21 | $1,014.88 | $9.99 | 2.00% |
| Class C Shares | $1,000.00 | $1,061.30 | $10.22 | $1,014.88 | $9.99 | 2.00% |
| Class I Shares | $1,000.00 | $1,066.40 | $ 3.59 | $1,021.32 | $3.51 | 0.70% |
| Class R2 Shares | $1,000.00 | $1,065.50 | $ 5.84 | $1,019.14 | $5.71 | 1.14% |
| Class R3 Shares | $1,000.00 | $1,064.20 | $ 7.11 | $1,017.90 | $6.95 | 1.39% |
| Class R6 Shares | $1,000.00 | $1,067.70 | $ 3.38 | $1,021.52 | $3.31 | 0.66% |
| 1. | Expenses are equal to the Fund’s annualized expense ratio of each class multiplied by the average account value over the period, divided by 365 and multiplied by 181 (to reflect the six-month period). The table above represents the actual expenses incurred during the six-month period. In addition to the fees and expenses which the Fund bears directly, it also indirectly bears a pro rata share of the fees and expenses of the underlying funds in which it invests. Such indirect expenses are not included in the above-reported expense figures. |
| 2. | Expenses are equal to the Fund's annualized expense ratio to reflect the six-month period. |
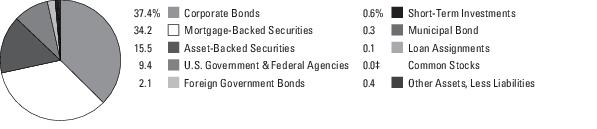
| 1. | FHLMC STACR REMIC Trust, 6.315%-8.565%, due 8/25/33–1/25/51 |
| 2. | UMBS, 30 Year, 4.00%-6.00%, due 6/1/52–3/1/53 |
| 3. | FNMA, (zero coupon)-10.77%, due 7/25/29–3/25/60 |
| 4. | GNMA, (zero coupon)-3.50%, due 8/20/49–4/20/53 |
| 5. | U.S. Treasury Notes, 3.50%-3.75%, due 4/15/26–2/15/33 |
| 6. | BX Trust, 3.605%-7.193%, due 2/15/28–12/9/41 |
| 7. | GLS Auto Receivables Issuer Trust, 1.08%-3.84%, due 11/17/25–1/18/28 |
| 8. | FREMF Mortgage Trust, 3.866%-4.528%, due 10/25/28–2/25/52 |
| 9. | FHLMC STACR Trust, 8.27%-16.02%, due 12/25/30–7/25/49 |
| 10. | Flagship Credit Auto Trust, 1.59%-4.98%, due 12/15/26–12/15/27 |
| 8 | MainStay MacKay Strategic Bond Fund |
| 1. | Effective May 9, 2023, Stephen R. Cianci no longer serves as a portfolio manager of the Fund. |
| 2. | See "Investment and Performance Comparison" for other share class returns, which may be higher or lower than Class I share returns, and for more information on benchmark and peer group returns. |
| 3. | Duration is a measure of the price sensitivity of a fixed-income investment to changes in interest rates. Duration is expressed as a number of years and is considered a more accurate sensitivity gauge than average maturity. |
| 4. | The terms “spread” and “yield spread” may refer to the difference in yield between a security or type of security and comparable U.S. Treasury issues. The terms may also refer to the difference in yield between two specific securities or types of securities at a given time. The term “credit spread” typically refers to the difference in yield between corporate or municipal bonds (or a specific category of these bonds) and comparable U.S. Treasury issues. |
| 5. | An obligation rated ‘BB’ by Standard & Poor’s (“S&P”) is deemed by S&P to be less vulnerable to nonpayment than other speculative issues. In the opinion of S&P, however, the obligor faces major ongoing uncertainties or exposure to adverse business, financial or economic conditions which could lead to the obligor’s inadequate capacity to meet its financial commitment on the obligation. When applied to Fund holdings, ratings are based solely on the creditworthiness of the bonds in the portfolio and are not meant to represent the security or safety of the Fund. Ratings from ‘AA’ to ‘CCC’ may be modified by the addition of a plus (+) or minus (–) sign to show relative standing within the major rating categories. |
| 6. | An obligation rated ‘BBB’ by S&P is deemed by S&P to exhibit adequate protection parameters. In the opinion of S&P, however, adverse economic conditions or changing circumstances are more likely to lead to a weakened capacity of the obligor to meet its financial commitment on the obligation. When applied to Fund holdings, ratings are based solely on the creditworthiness of the bonds in the portfolio and are not meant to represent the security or safety of the Fund. |
| 10 | MainStay MacKay Strategic Bond Fund |
| Principal Amount | Value | |
| Long-Term Bonds 99.0% | ||
| Asset-Backed Securities 15.5% | ||
| Automobile Asset-Backed Securities 8.3% | ||
| American Credit Acceptance Receivables Trust (a) | ||
| Series 2021-2, Class D | ||
| 1.34%, due 7/13/27 | $ 1,715,000 | $ 1,619,145 |
| Series 2021-4, Class D | ||
| 1.82%, due 2/14/28 | 1,520,000 | 1,434,353 |
| Series 2022-1, Class D | ||
| 2.46%, due 3/13/28 | 2,435,000 | 2,284,562 |
| Series 2020-2, Class C | ||
| 3.88%, due 4/13/26 | 898,774 | 896,110 |
| Avis Budget Rental Car Funding AESOP LLC (a) | ||
| Series 2021-1A, Class A | ||
| 1.38%, due 8/20/27 | 1,135,000 | 1,014,865 |
| Series 2020-2A, Class A | ||
| 2.02%, due 2/20/27 | 1,000,000 | 920,700 |
| Series 2020-1A, Class A | ||
| 2.33%, due 8/20/26 | 560,000 | 526,028 |
| Series 2023-3A, Class A | ||
| 5.44%, due 2/22/28 | 1,415,000 | 1,425,870 |
| CPS Auto Receivables Trust (a) | ||
| Series 2021-A, Class E | ||
| 2.53%, due 3/15/28 | 3,000,000 | 2,799,335 |
| Series 2021-C, Class E | ||
| 3.21%, due 9/15/28 | 1,720,000 | 1,466,567 |
| Series 2020-C, Class E | ||
| 4.22%, due 5/17/27 | 2,215,000 | 2,138,020 |
| Series 2019-C, Class E | ||
| 4.30%, due 7/15/25 | 1,030,000 | 1,018,047 |
| Drive Auto Receivables Trust | ||
| Series 2021-2, Class D | ||
| 1.39%, due 3/15/29 | 1,000,000 | 938,935 |
| Series 2021-1, Class D | ||
| 1.45%, due 1/16/29 | 2,215,000 | 2,089,063 |
| Exeter Automobile Receivables Trust | ||
| Series 2021-2A, Class D | ||
| 1.40%, due 4/15/27 | 1,605,000 | 1,491,879 |
| Series 2021-3A, Class E | ||
| 3.04%, due 12/15/28 (a) | 1,500,000 | 1,265,629 |
| Flagship Credit Auto Trust (a) | ||
| Series 2021-2, Class D | ||
| 1.59%, due 6/15/27 | 1,190,000 | 1,075,840 |
| Series 2021-3, Class D | ||
| 1.65%, due 9/15/27 | 1,192,000 | 1,063,231 |
| Series 2021-4, Class C | ||
| 1.96%, due 12/15/27 | 1,240,000 | 1,152,543 |
| Series 2021-4, Class D | ||
| 2.26%, due 12/15/27 | 2,352,000 | 2,109,322 |
| Principal Amount | Value | |
| Automobile Asset-Backed Securities (continued) | ||
| Flagship Credit Auto Trust (a) (continued) | ||
| Series 2020-1, Class E | ||
| 3.52%, due 6/15/27 | $ 2,590,000 | $ 2,372,324 |
| Series 2019-2, Class E | ||
| 4.52%, due 12/15/26 | 1,315,000 | 1,247,180 |
| Series 2020-3, Class E | ||
| 4.98%, due 12/15/27 | 1,090,000 | 991,335 |
| GLS Auto Receivables Issuer Trust (a) | ||
| Series 2021-2A, Class C | ||
| 1.08%, due 6/15/26 | 1,050,000 | 1,014,101 |
| Series 2021-2A, Class D | ||
| 1.42%, due 4/15/27 | 1,120,000 | 1,038,332 |
| Series 2021-3A, Class D | ||
| 1.48%, due 7/15/27 | 2,635,000 | 2,409,408 |
| Series 2021-4A, Class C | ||
| 1.94%, due 10/15/27 | 1,140,000 | 1,080,568 |
| Series 2021-4A, Class D | ||
| 2.48%, due 10/15/27 | 1,650,000 | 1,521,851 |
| Series 2020-1A, Class C | ||
| 2.72%, due 11/17/25 | 1,601,498 | 1,583,623 |
| Series 2021-1A, Class E | ||
| 3.14%, due 1/18/28 | 1,080,000 | 992,481 |
| Series 2020-1A, Class D | ||
| 3.68%, due 11/16/26 | 1,070,000 | 1,034,160 |
| Series 2019-3A, Class D | ||
| 3.84%, due 5/15/26 | 1,800,000 | 1,759,766 |
| Hertz Vehicle Financing III LP (a) | ||
| Series 2021-2A, Class A | ||
| 1.68%, due 12/27/27 | 675,000 | 600,141 |
| Series 2021-2A, Class C | ||
| 2.52%, due 12/27/27 | 3,285,000 | 2,853,491 |
| Series 2021-2A, Class D | ||
| 4.34%, due 12/27/27 | 2,450,000 | 2,114,484 |
| Hertz Vehicle Financing LLC | ||
| Series 2021-1A, Class C | ||
| 2.05%, due 12/26/25 (a) | 870,000 | 806,442 |
| Santander Drive Auto Receivables Trust | ||
| Series 2021-3, Class D | ||
| 1.33%, due 9/15/27 | 550,000 | 517,339 |
| Series 2021-4, Class D | ||
| 1.67%, due 10/15/27 | 2,385,000 | 2,229,100 |
| Series 2022-2, Class B | ||
| 3.44%, due 9/15/27 | 1,825,000 | 1,772,170 |
| 56,668,340 | ||
| Principal Amount | Value | |
| Asset-Backed Securities (continued) | ||
| Credit Card Asset-Backed Security 0.1% | ||
| Golden Credit Card Trust | ||
| Series 2021-1A, Class C | ||
| 1.74%, due 8/15/28 (a) | $ 510,000 | $ 454,197 |
| Home Equity Asset-Backed Securities 0.1% | ||
| First NLC Trust | ||
| Series 2007-1, Class A1 | ||
| 5.09% (1 Month LIBOR + 0.07%), due 8/25/37 (a)(b) | 235,504 | 120,034 |
| GSAA Home Equity Trust | ||
| Series 2007-8, Class A3 | ||
| 5.92% (1 Month LIBOR + 0.90%), due 8/25/37 (b) | 33,029 | 31,837 |
| J.P. Morgan Mortgage Acquisition Trust | ||
| Series 2007-HE1, Class AF1 | ||
| 4.394% (1 Month LIBOR + 0.10%), due 3/25/47 (b) | 82,238 | 50,931 |
| Mastr Asset-Backed Securities Trust | ||
| Series 2006-HE4, Class A1 | ||
| 5.12% (1 Month LIBOR + 0.10%), due 11/25/36 (b) | 67,892 | 21,745 |
| Morgan Stanley ABS Capital I, Inc. Trust (b) | ||
| Series 2007-HE4, Class A2A | ||
| 5.13% (1 Month LIBOR + 0.11%), due 2/25/37 | 72,039 | 23,686 |
| Series 2007-HE7, Class M1 | ||
| 7.02% (1 Month LIBOR + 2.00%), due 7/25/37 | 635,000 | 480,121 |
| 728,354 | ||
| Other Asset-Backed Securities 7.0% | ||
| American Airlines Pass-Through Trust | ||
| Series 2019-1, Class B | ||
| 3.85%, due 2/15/28 | 768,172 | 670,724 |
| Series 2021-1, Class B | ||
| 3.95%, due 7/11/30 | 1,165,100 | 1,027,838 |
| Series 2016-1, Class A | ||
| 4.10%, due 1/15/28 | 880,524 | 794,484 |
| AMSR Trust (a) | ||
| Series 2020-SFR4, Class A | ||
| 1.355%, due 11/17/37 | 3,775,000 | 3,441,493 |
| Series 2020-SFR5, Class A | ||
| 1.379%, due 11/17/37 | 1,518,000 | 1,383,729 |
| CF Hippolyta Issuer LLC (a) | ||
| Series 2020-1, Class A1 | ||
| 1.69%, due 7/15/60 | 1,029,872 | 934,499 |
| Principal Amount | Value | |
| Other Asset-Backed Securities (continued) | ||
| CF Hippolyta Issuer LLC (a) (continued) | ||
| Series 2021-1A, Class B1 | ||
| 1.98%, due 3/15/61 | $ 3,977,129 | $ 3,404,405 |
| Series 2020-1, Class A2 | ||
| 1.99%, due 7/15/60 | 1,446,501 | 1,228,836 |
| Series 2020-1, Class B1 | ||
| 2.28%, due 7/15/60 | 2,122,707 | 1,913,292 |
| Series 2020-1, Class B2 | ||
| 2.60%, due 7/15/60 | 2,401,537 | 2,029,489 |
| Crown Castle Towers LLC | ||
| 4.241%, due 7/15/28 (a) | 2,325,000 | 2,209,673 |
| CVS Pass-Through Trust | ||
| 5.789%, due 1/10/26 (a) | 20,995 | 20,875 |
| DB Master Finance LLC (a) | ||
| Series 2021-1A, Class A23 | ||
| 2.791%, due 11/20/51 | 1,224,500 | 985,918 |
| Series 2019-1A, Class A23 | ||
| 4.352%, due 5/20/49 | 1,399,250 | 1,325,546 |
| FirstKey Homes Trust (a) | ||
| Series 2020-SFR2, Class A | ||
| 1.266%, due 10/19/37 | 2,341,990 | 2,131,045 |
| Series 2020-SFR1, Class A | ||
| 1.339%, due 8/17/37 | 3,277,060 | 2,998,004 |
| Series 2021-SFR2, Class B | ||
| 1.607%, due 9/17/38 | 805,000 | 705,590 |
| Series 2021-SFR1, Class B | ||
| 1.788%, due 8/17/38 | 2,345,000 | 2,068,633 |
| Hilton Grand Vacations Trust | ||
| Series 2019-AA, Class B | ||
| 2.54%, due 7/25/33 (a) | 1,034,346 | 969,863 |
| Home Partners of America Trust | ||
| Series 2021-2, Class B | ||
| 2.302%, due 12/17/26 (a) | 1,707,105 | 1,523,984 |
| Mosaic Solar Loan Trust | ||
| Series 2021-2A, Class B | ||
| 2.09%, due 4/22/47 (a) | 1,689,647 | 1,335,161 |
| MVW LLC | ||
| Series 2021-1WA, Class B | ||
| 1.44%, due 1/22/41 (a) | 1,195,645 | 1,090,176 |
| Navient Private Education Refi Loan Trust (a) | ||
| Series 2021-BA, Class A | ||
| 0.94%, due 7/15/69 | 732,068 | 644,252 |
| Series 2021-EA, Class B | ||
| 2.03%, due 12/16/69 | 2,450,000 | 1,682,252 |
| Series 2020-GA, Class B | ||
| 2.50%, due 9/16/69 | 1,145,000 | 901,657 |
| Series 2020-HA, Class B | ||
| 2.78%, due 1/15/69 | 1,820,000 | 1,535,235 |
| 12 | MainStay MacKay Strategic Bond Fund |
| Principal Amount | Value | |
| Asset-Backed Securities (continued) | ||
| Other Asset-Backed Securities (continued) | ||
| New Economy Assets Phase 1 Sponsor LLC (a) | ||
| Series 2021-1, Class A1 | ||
| 1.91%, due 10/20/61 | $ 1,260,000 | $ 1,094,111 |
| Series 2021-1, Class B1 | ||
| 2.41%, due 10/20/61 | 1,215,000 | 1,024,272 |
| PFS Financing Corp. | ||
| Series 2022-D, Class B | ||
| 4.90%, due 8/15/27 (a) | 2,360,000 | 2,325,770 |
| Progress Residential Trust (a) | ||
| Series 2020-SFR3, Class B | ||
| 1.495%, due 10/17/27 | 1,400,000 | 1,274,036 |
| Series 2021-SFR4, Class B | ||
| 1.808%, due 5/17/38 | 1,340,000 | 1,190,233 |
| Taco Bell Funding LLC | ||
| Series 2021-1A, Class A23 | ||
| 2.542%, due 8/25/51 (a) | 1,071,437 | 844,108 |
| United Airlines Pass-Through Trust | ||
| Series 2020-1, Class A | ||
| 5.875%, due 10/15/27 | 1,095,992 | 1,095,781 |
| 47,804,964 | ||
| Total Asset-Backed Securities (Cost $113,413,707) | 105,655,855 | |
| Corporate Bonds 37.4% | ||
| Agriculture 0.2% | ||
| BAT Capital Corp. | ||
| 3.734%, due 9/25/40 | 1,095,000 | 786,066 |
| BAT International Finance plc | ||
| 4.448%, due 3/16/28 | 755,000 | 725,252 |
| 1,511,318 | ||
| Airlines 1.2% | ||
| American Airlines, Inc. (a) | ||
| 5.50%, due 4/20/26 | 1,100,000 | 1,080,193 |
| 5.75%, due 4/20/29 | 2,450,000 | 2,328,199 |
| Delta Air Lines, Inc. (a) | ||
| 4.50%, due 10/20/25 | 701,004 | 687,447 |
| 4.75%, due 10/20/28 | 2,665,000 | 2,587,994 |
| Mileage Plus Holdings LLC | ||
| 6.50%, due 6/20/27 (a) | 1,292,000 | 1,289,933 |
| 7,973,766 | ||
| Auto Manufacturers 1.8% | ||
| Ford Motor Credit Co. LLC | ||
| 2.30%, due 2/10/25 | 1,005,000 | 935,647 |
| 4.125%, due 8/17/27 | 1,295,000 | 1,188,239 |
| Principal Amount | Value | |
| Auto Manufacturers (continued) | ||
| Ford Motor Credit Co. LLC (continued) | ||
| 6.80%, due 5/12/28 | $ 2,105,000 | $ 2,106,259 |
| 6.95%, due 3/6/26 | 1,195,000 | 1,205,966 |
| General Motors Co. | ||
| 5.60%, due 10/15/32 (c) | 625,000 | 612,316 |
| General Motors Financial Co., Inc. | ||
| 2.35%, due 1/8/31 | 1,178,000 | 930,043 |
| 2.70%, due 6/10/31 | 1,525,000 | 1,223,583 |
| 4.30%, due 4/6/29 | 1,090,000 | 1,015,849 |
| Nissan Motor Acceptance Co. LLC | ||
| 1.85%, due 9/16/26 (a) | 3,610,000 | 3,080,487 |
| 12,298,389 | ||
| Auto Parts & Equipment 0.3% | ||
| Dana, Inc. | ||
| 4.50%, due 2/15/32 | 2,845,000 | 2,275,295 |
| Banks 11.9% | ||
| Banco Santander SA | ||
| 4.175% (1 Year Treasury Constant Maturity Rate + 2.00%), due 3/24/28 (b) | 2,400,000 | 2,281,784 |
| Bank of America Corp. | ||
| 2.087%, due 6/14/29 (d) | 1,275,000 | 1,101,795 |
| 3.384%, due 4/2/26 (d) | 1,700,000 | 1,639,300 |
| Series MM | ||
| 4.30%, due 1/28/25 (d)(e) | 1,516,000 | 1,371,961 |
| 4.948%, due 7/22/28 (d) | 1,640,000 | 1,634,366 |
| 8.57%, due 11/15/24 | 1,645,000 | 1,722,218 |
| Barclays plc (b)(e) | ||
| 4.375% (5 Year Treasury Constant Maturity Rate + 3.41%), due 3/15/28 | 2,380,000 | 1,576,564 |
| 8.00% (5 Year Treasury Constant Maturity Rate + 5.431%), due 3/15/29 | 1,315,000 | 1,151,809 |
| BNP Paribas SA (a) | ||
| 3.052%, due 1/13/31 (d) | 1,605,000 | 1,388,078 |
| 4.625% (5 Year Treasury Constant Maturity Rate + 3.196%), due 1/12/27 (b)(e) | 1,315,000 | 1,032,144 |
| 4.625% (5 Year Treasury Constant Maturity Rate + 3.34%), due 2/25/31 (b)(e) | 1,610,000 | 1,142,134 |
| 7.75% (5 Year Treasury Constant Maturity Rate + 4.899%), due 8/16/29 (b)(e) | 960,000 | 916,800 |
| Principal Amount | Value | |
| Corporate Bonds (continued) | ||
| Banks (continued) | ||
| BPCE SA (a) | ||
| 2.045%, due 10/19/27 (d) | $ 2,240,000 | $ 1,979,747 |
| 5.125%, due 1/18/28 | 1,235,000 | 1,236,960 |
| Citigroup, Inc. | ||
| 2.52%, due 11/3/32 (d) | 2,115,000 | 1,731,273 |
| Series Y | ||
| 4.15% (5 Year Treasury Constant Maturity Rate + 3.00%), due 11/15/26 (b)(e) | 1,395,000 | 1,147,388 |
| Series M | ||
| 6.30%, due 5/15/24 (d)(e) | 3,260,000 | 3,075,158 |
| Credit Agricole SA | ||
| 4.75% (5 Year Treasury Constant Maturity Rate + 3.237%), due 3/23/29 (a)(b)(e) | 2,370,000 | 1,822,530 |
| Credit Suisse Group AG (a)(d) | ||
| 3.091%, due 5/14/32 | 1,485,000 | 1,189,204 |
| 6.442%, due 8/11/28 | 1,325,000 | 1,311,381 |
| Deutsche Bank AG | ||
| 3.035%, due 5/28/32 (d) | 460,000 | 366,922 |
| 4.875% (USISDA05 + 2.553%), due 12/1/32 (b) | 3,390,000 | 2,822,737 |
| 5.371%, due 9/9/27 | 985,000 | 976,054 |
| First Horizon Bank | ||
| 5.75%, due 5/1/30 | 1,673,000 | 1,581,289 |
| Freedom Mortgage Corp. | ||
| 7.625%, due 5/1/26 (a) | 895,000 | 765,332 |
| Goldman Sachs Group, Inc. (The) | ||
| 1.948%, due 10/21/27 (d) | 3,260,000 | 2,919,300 |
| Series V | ||
| 4.125% (5 Year Treasury Constant Maturity Rate + 2.949%), due 11/10/26 (b)(e) | 980,000 | 821,453 |
| Intesa Sanpaolo SpA | ||
| 4.198% (1 Year Treasury Constant Maturity Rate + 2.60%), due 6/1/32 (a)(b) | 3,430,000 | 2,599,597 |
| JPMorgan Chase & Co. (d) | ||
| 1.764%, due 11/19/31 | 2,897,000 | 2,315,395 |
| Series HH | ||
| 4.60%, due 2/1/25 (e) | 842,000 | 780,955 |
| KeyBank NA | ||
| 4.15%, due 8/8/25 | 1,585,000 | 1,517,519 |
| Lloyds Banking Group plc | ||
| 4.582%, due 12/10/25 | 1,365,000 | 1,306,653 |
| 4.65%, due 3/24/26 | 1,985,000 | 1,911,157 |
| Principal Amount | Value | |
| Banks (continued) | ||
| Lloyds Banking Group plc (continued) | ||
| 4.976% (1 Year Treasury Constant Maturity Rate + 2.30%), due 8/11/33 (b) | $ 995,000 | $ 964,598 |
| Macquarie Group Ltd. | ||
| 2.871%, due 1/14/33 (a)(d) | 1,490,000 | 1,211,095 |
| Morgan Stanley (d) | ||
| 2.484%, due 9/16/36 | 2,170,000 | 1,667,886 |
| 2.511%, due 10/20/32 | 3,225,000 | 2,655,030 |
| NatWest Group plc (b) | ||
| 3.073% (1 Year Treasury Constant Maturity Rate + 2.55%), due 5/22/28 | 2,145,000 | 1,963,214 |
| 4.60% (5 Year Treasury Constant Maturity Rate + 3.10%), due 6/28/31 (c)(e) | 2,650,000 | 1,867,958 |
| 5.847% (1 Year Treasury Constant Maturity Rate + 1.35%), due 3/2/27 | 1,595,000 | 1,613,536 |
| Popular, Inc. | ||
| 6.125%, due 9/14/23 | 1,582,000 | 1,566,180 |
| Santander Holdings USA, Inc. | ||
| 6.499%, due 3/9/29 (d) | 1,315,000 | 1,321,802 |
| Societe Generale SA (a)(b)(e) | ||
| 4.75% (5 Year Treasury Constant Maturity Rate + 3.931%), due 5/26/26 | 1,240,000 | 946,492 |
| 5.375% (5 Year Treasury Constant Maturity Rate + 4.514%), due 11/18/30 | 1,920,000 | 1,344,000 |
| Sumitomo Mitsui Trust Bank Ltd. | ||
| 5.65%, due 3/9/26 (a) | 1,755,000 | 1,785,596 |
| Synchrony Bank | ||
| 5.40%, due 8/22/25 | 1,805,000 | 1,721,308 |
| Texas Capital Bancshares, Inc. | ||
| 4.00% (5 Year Treasury Constant Maturity Rate + 3.15%), due 5/6/31 (b) | 1,155,000 | 933,647 |
| UBS Group AG | ||
| 4.375% (5 Year Treasury Constant Maturity Rate + 3.313%), due 2/10/31 (a)(b)(e) | 2,555,000 | 1,762,320 |
| Wells Fargo & Co. (d) | ||
| 3.35%, due 3/2/33 | 2,330,000 | 2,033,762 |
| 3.584%, due 5/22/28 | 380,000 | 359,592 |
| Series S | ||
| 5.90%, due 6/15/24 (e) | 3,295,000 | 3,106,855 |
| 14 | MainStay MacKay Strategic Bond Fund |
| Principal Amount | Value | |
| Corporate Bonds (continued) | ||
| Banks (continued) | ||
| Westpac Banking Corp. | ||
| 3.02% (5 Year Treasury Constant Maturity Rate + 1.53%), due 11/18/36 (b) | $ 1,692,000 | $ 1,334,307 |
| 81,296,135 | ||
| Building Materials 0.4% | ||
| CEMEX Materials LLC | ||
| 7.70%, due 7/21/25 (a) | 2,490,000 | 2,508,675 |
| Chemicals 0.4% | ||
| Alpek SAB de CV | ||
| 3.25%, due 2/25/31 (a) | 1,255,000 | 1,022,785 |
| Braskem Netherlands Finance BV | ||
| 4.50%, due 1/10/28 (a) | 1,650,000 | 1,509,995 |
| 2,532,780 | ||
| Commercial Services 0.3% | ||
| Ashtead Capital, Inc. | ||
| 4.25%, due 11/1/29 (a) | 1,640,000 | 1,529,877 |
| California Institute of Technology | ||
| 3.65%, due 9/1/19 | 1,118,000 | 793,795 |
| 2,323,672 | ||
| Computers 0.9% | ||
| Dell International LLC | ||
| 5.25%, due 2/1/28 | 2,880,000 | 2,915,587 |
| 8.10%, due 7/15/36 | 879,000 | 1,031,812 |
| NCR Corp. | ||
| 5.00%, due 10/1/28 (a) | 2,339,000 | 2,040,010 |
| 5,987,409 | ||
| Diversified Financial Services 3.4% | ||
| AerCap Ireland Capital DAC | ||
| 3.00%, due 10/29/28 | 1,650,000 | 1,436,520 |
| Air Lease Corp. | ||
| 2.30%, due 2/1/25 | 3,275,000 | 3,098,512 |
| 3.25%, due 3/1/25 | 4,000,000 | 3,834,385 |
| Aircastle Ltd. | ||
| 5.25% (5 Year Treasury Constant Maturity Rate + 4.41%), due 6/15/26 (a)(b)(e) | 2,030,000 | 1,473,003 |
| Ally Financial, Inc. | ||
| 5.75%, due 11/20/25 | 3,820,000 | 3,711,842 |
| 8.00%, due 11/1/31 | 1,890,000 | 1,993,603 |
| Avolon Holdings Funding Ltd. | ||
| 3.25%, due 2/15/27 (a) | 2,125,000 | 1,897,616 |
| Principal Amount | Value | |
| Diversified Financial Services (continued) | ||
| Banco BTG Pactual SA | ||
| 2.75%, due 1/11/26 (a) | $ 3,095,000 | $ 2,817,998 |
| Nomura Holdings, Inc. | ||
| 5.099%, due 7/3/25 | 1,660,000 | 1,638,521 |
| OneMain Finance Corp. | ||
| 3.50%, due 1/15/27 | 1,100,000 | 939,532 |
| 22,841,532 | ||
| Electric 2.7% | ||
| AEP Texas, Inc. | ||
| 4.70%, due 5/15/32 | 1,175,000 | 1,156,474 |
| American Electric Power Co., Inc. | ||
| 5.625%, due 3/1/33 | 1,765,000 | 1,848,968 |
| Calpine Corp. | ||
| 5.125%, due 3/15/28 (a) | 1,185,000 | 1,094,595 |
| Dominion Energy, Inc. | ||
| Series C | ||
| 4.35% (5 Year Treasury Constant Maturity Rate + 3.195%), due 1/15/27 (b)(e) | 780,000 | 655,200 |
| Duke Energy Carolinas LLC | ||
| 4.95%, due 1/15/33 | 1,160,000 | 1,191,763 |
| Edison International | ||
| Series B | ||
| 5.00% (5 Year Treasury Constant Maturity Rate + 3.901%), due 12/15/26 (b)(e) | 2,690,000 | 2,299,453 |
| Ohio Power Co. | ||
| Series R | ||
| 2.90%, due 10/1/51 | 955,000 | 655,374 |
| Pacific Gas and Electric Co. | ||
| 3.50%, due 8/1/50 | 1,855,000 | 1,209,019 |
| Sempra Energy | ||
| 4.125% (5 Year Treasury Constant Maturity Rate + 2.868%), due 4/1/52 (b) | 2,150,000 | 1,741,160 |
| Southern California Edison Co. | ||
| 5.30%, due 3/1/28 | 2,245,000 | 2,305,601 |
| WEC Energy Group, Inc. | ||
| 6.976% (3 Month LIBOR + 2.113%), due 5/15/67 (b) | 5,495,000 | 4,517,445 |
| 18,675,052 | ||
| Electronics 0.3% | ||
| Arrow Electronics, Inc. | ||
| 6.125%, due 3/1/26 | 1,760,000 | 1,761,283 |
| Principal Amount | Value | |
| Corporate Bonds (continued) | ||
| Environmental Control 0.2% | ||
| Covanta Holding Corp. | ||
| 4.875%, due 12/1/29 (a) | $ 950,000 | $ 845,500 |
| Stericycle, Inc. | ||
| 3.875%, due 1/15/29 (a) | 630,000 | 566,812 |
| 1,412,312 | ||
| Food 0.6% | ||
| JBS USA LUX SA | ||
| 5.75%, due 4/1/33 (a) | 2,140,000 | 2,050,441 |
| Kraft Heinz Foods Co. | ||
| 5.00%, due 7/15/35 | 583,000 | 585,613 |
| Smithfield Foods, Inc. | ||
| 3.00%, due 10/15/30 (a) | 1,520,000 | 1,211,213 |
| 3,847,267 | ||
| Gas 0.5% | ||
| National Fuel Gas Co. | ||
| 2.95%, due 3/1/31 | 1,695,000 | 1,372,878 |
| Piedmont Natural Gas Co., Inc. | ||
| 5.05%, due 5/15/52 | 1,070,000 | 1,010,708 |
| Southern Co. Gas Capital Corp. | ||
| Series 21A | ||
| 3.15%, due 9/30/51 | 1,500,000 | 1,038,274 |
| 3,421,860 | ||
| Home Builders 0.3% | ||
| Toll Brothers Finance Corp. | ||
| 3.80%, due 11/1/29 | 1,780,000 | 1,623,262 |
| 4.35%, due 2/15/28 | 303,000 | 290,089 |
| 1,913,351 | ||
| Household Products & Wares 0.4% | ||
| Kronos Acquisition Holdings, Inc. | ||
| 5.00%, due 12/31/26 (a) | 2,770,000 | 2,563,469 |
| Insurance 0.9% | ||
| Lincoln National Corp. | ||
| 7.234% (3 Month LIBOR + 2.358%), due 5/17/66 (b) | 3,537,000 | 2,228,310 |
| NMI Holdings, Inc. | ||
| 7.375%, due 6/1/25 (a) | 685,000 | 694,563 |
| Protective Life Corp. | ||
| 8.45%, due 10/15/39 | 2,476,000 | 2,995,423 |
| Willis North America, Inc. | ||
| 3.875%, due 9/15/49 | 425,000 | 310,321 |
| 6,228,617 | ||
| Principal Amount | Value | |
| Internet 0.6% | ||
| Expedia Group, Inc. | ||
| 3.25%, due 2/15/30 | $ 2,345,000 | $ 2,060,863 |
| Match Group Holdings II LLC (a) | ||
| 3.625%, due 10/1/31 | 2,520,000 | 2,058,588 |
| 4.125%, due 8/1/30 (c) | 122,000 | 104,277 |
| 4,223,728 | ||
| Lodging 1.2% | ||
| Hyatt Hotels Corp. | ||
| 1.80%, due 10/1/24 | 3,920,000 | 3,726,185 |
| Marriott International, Inc. | ||
| 3.75%, due 10/1/25 | 4,253,000 | 4,112,649 |
| Series X | ||
| 4.00%, due 4/15/28 | 605,000 | 585,371 |
| 8,424,205 | ||
| Media 0.4% | ||
| CCO Holdings LLC | ||
| 4.75%, due 3/1/30 (a) | 435,000 | 374,272 |
| DISH DBS Corp. | ||
| 5.75%, due 12/1/28 (a) | 1,250,000 | 888,634 |
| Grupo Televisa SAB | ||
| 5.25%, due 5/24/49 | 1,335,000 | 1,252,507 |
| 2,515,413 | ||
| Miscellaneous—Manufacturing 0.3% | ||
| Textron Financial Corp. | ||
| 6.599% (3 Month LIBOR + 1.735%), due 2/15/42 (a)(b) | 2,905,000 | 2,098,863 |
| Oil & Gas 0.3% | ||
| EQT Corp. | ||
| 5.678%, due 10/1/25 | 1,610,000 | 1,605,674 |
| Gazprom PJSC Via Gaz Capital SA | ||
| 7.288%, due 8/16/37 (a)(f) | 850,000 | 705,500 |
| 2,311,174 | ||
| Packaging & Containers 0.3% | ||
| Berry Global, Inc. | ||
| 4.875%, due 7/15/26 (a) | 1,240,000 | 1,212,451 |
| Owens-Brockway Glass Container, Inc. | ||
| 6.625%, due 5/13/27 (a) | 840,000 | 842,940 |
| 2,055,391 | ||
| Pharmaceuticals 0.4% | ||
| Teva Pharmaceutical Finance Netherlands III BV | ||
| 3.15%, due 10/1/26 | 221,000 | 199,691 |
| 16 | MainStay MacKay Strategic Bond Fund |
| Principal Amount | Value | |
| Corporate Bonds (continued) | ||
| Pharmaceuticals (continued) | ||
| Teva Pharmaceutical Finance Netherlands III BV (continued) | ||
| 4.75%, due 5/9/27 | $ 2,345,000 | $ 2,196,177 |
| 7.875%, due 9/15/29 | 10,000 | 10,472 |
| 2,406,340 | ||
| Pipelines 4.4% | ||
| Cheniere Corpus Christi Holdings LLC | ||
| 2.742%, due 12/31/39 | 1,710,000 | 1,402,408 |
| CNX Midstream Partners LP | ||
| 4.75%, due 4/15/30 (a)(c) | 2,570,000 | 2,151,699 |
| DCP Midstream Operating LP | ||
| 3.25%, due 2/15/32 | 3,090,000 | 2,640,374 |
| DT Midstream, Inc. | ||
| 4.30%, due 4/15/32 (a) | 1,715,000 | 1,553,546 |
| Enbridge, Inc. | ||
| 5.70%, due 3/8/33 | 1,250,000 | 1,298,113 |
| 5.969%, due 3/8/26 | 2,355,000 | 2,364,114 |
| Energy Transfer LP | ||
| Series H | ||
| 6.50% (5 Year Treasury Constant Maturity Rate + 5.694%), due 11/15/26 (b)(e) | 2,520,000 | 2,230,200 |
| EnLink Midstream LLC | ||
| 5.625%, due 1/15/28 (a) | 750,000 | 738,671 |
| Enterprise Products Operating LLC | ||
| 3.95%, due 1/31/60 | 1,630,000 | 1,270,508 |
| 4.20%, due 1/31/50 | 520,000 | 435,229 |
| Flex Intermediate Holdco LLC | ||
| 3.363%, due 6/30/31 (a) | 1,540,000 | 1,267,982 |
| Hess Midstream Operations LP (a) | ||
| 4.25%, due 2/15/30 | 2,630,000 | 2,338,307 |
| 5.625%, due 2/15/26 | 367,000 | 361,249 |
| Holly Energy Partners LP | ||
| 6.375%, due 4/15/27 (a) | 545,000 | 536,804 |
| Kinder Morgan, Inc. | ||
| 7.75%, due 1/15/32 | 2,035,000 | 2,367,020 |
| MPLX LP | ||
| 4.00%, due 3/15/28 | 560,000 | 541,044 |
| Plains All American Pipeline LP | ||
| 3.80%, due 9/15/30 | 1,040,000 | 941,057 |
| Sabine Pass Liquefaction LLC | ||
| 5.75%, due 5/15/24 | 2,146,000 | 2,146,110 |
| Targa Resources Corp. | ||
| 4.20%, due 2/1/33 | 725,000 | 658,675 |
| Western Midstream Operating LP | ||
| 5.50%, due 2/1/50 (g) | 1,800,000 | 1,527,071 |
| Principal Amount | Value | |
| Pipelines (continued) | ||
| Williams Cos., Inc. (The) | ||
| 3.50%, due 10/15/51 | $ 1,425,000 | $ 1,015,762 |
| 29,785,943 | ||
| Real Estate 0.1% | ||
| Realogy Group LLC | ||
| 5.25%, due 4/15/30 (a)(c) | 1,060,000 | 755,736 |
| Real Estate Investment Trusts 0.9% | ||
| GLP Capital LP | ||
| 3.35%, due 9/1/24 | 1,535,000 | 1,484,959 |
| Iron Mountain, Inc. (a) | ||
| 4.875%, due 9/15/29 | 1,686,000 | 1,537,748 |
| 5.25%, due 7/15/30 | 395,000 | 363,805 |
| Starwood Property Trust, Inc. | ||
| 3.625%, due 7/15/26 (a) | 3,172,000 | 2,731,219 |
| 6,117,731 | ||
| Retail 0.5% | ||
| AutoNation, Inc. | ||
| 4.75%, due 6/1/30 | 1,545,000 | 1,452,517 |
| Nordstrom, Inc. | ||
| 4.25%, due 8/1/31 | 2,860,000 | 2,123,836 |
| 3,576,353 | ||
| Semiconductors 0.3% | ||
| Broadcom, Inc. (a) | ||
| 3.469%, due 4/15/34 | 2,040,000 | 1,685,380 |
| 3.75%, due 2/15/51 | 620,000 | 456,653 |
| 2,142,033 | ||
| Telecommunications 1.0% | ||
| Altice France SA | ||
| 5.125%, due 7/15/29 (a) | 2,405,000 | 1,778,127 |
| AT&T, Inc. | ||
| 3.65%, due 6/1/51 | 1,485,000 | 1,107,176 |
| Sprint LLC | ||
| 7.875%, due 9/15/23 | 3,620,000 | 3,649,304 |
| T-Mobile USA, Inc. | ||
| 2.625%, due 2/15/29 | 660,000 | 583,259 |
| 7,117,866 | ||
| Total Corporate Bonds (Cost $285,914,728) | 254,902,958 | |
| Foreign Government Bonds 2.1% | ||
| Brazil 0.1% | ||
| Brazil Government Bond | ||
| 3.75%, due 9/12/31 (c) | 525,000 | 453,721 |
| Principal Amount | Value | |
| Foreign Government Bonds (continued) | ||
| Chile 0.3% | ||
| Empresa Nacional del Petroleo | ||
| 3.45%, due 9/16/31 (a) | $ 2,540,000 | $ 2,141,060 |
| Colombia 0.3% | ||
| Colombia Government Bond | ||
| 3.25%, due 4/22/32 | 2,335,000 | 1,685,420 |
| 4.50%, due 1/28/26 (c) | 500,000 | 474,889 |
| 2,160,309 | ||
| Mexico 1.4% | ||
| Comision Federal de Electricidad (a) | ||
| 3.875%, due 7/26/33 | 2,385,000 | 1,840,266 |
| 4.677%, due 2/9/51 | 1,855,000 | 1,250,752 |
| Mexico Government Bond | ||
| 3.75%, due 4/19/71 | 1,480,000 | 1,003,533 |
| Petroleos Mexicanos | ||
| 6.50%, due 3/13/27 | 2,535,000 | 2,275,615 |
| 6.75%, due 9/21/47 | 4,835,000 | 2,979,658 |
| 9,349,824 | ||
| Total Foreign Government Bonds (Cost $18,839,182) | 14,104,914 | |
| Loan Assignments 0.1% | ||
| Diversified/Conglomerate Service 0.1% | ||
| TruGreen LP (b) | ||
| First Lien Second Refinancing Term Loan | ||
| 9.082% (1 Month SOFR + 4.00%), due 11/2/27 | 764,120 | 702,609 |
| Second Lien Initial Term Loan | ||
| 13.773% (3 Month LIBOR + 8.50%), due 11/2/28 | 450,000 | 292,500 |
| 995,109 | ||
| Total Loan Assignments (Cost $1,202,763) | 995,109 | |
| Mortgage-Backed Securities 34.2% | ||
| Agency (Collateralized Mortgage Obligations) 7.1% | ||
| FHLMC | ||
| REMIC, Series 5021, Class SA | ||
| (zero coupon) (SOFR 30A + 3.55%), due 10/25/50 (b)(h) | 3,331,989 | 116,038 |
| REMIC, Series 5200, Class SA | ||
| (zero coupon) (SOFR 30A + 3.50%), due 2/25/52 (b)(h) | 2,742,391 | 91,745 |
| Principal Amount | Value | |
| Agency (Collateralized Mortgage Obligations) (continued) | ||
| FHLMC (continued) | ||
| REMIC, Series 4839, Class WO | ||
| (zero coupon), due 8/15/56 | $ 1,075,887 | $ 781,870 |
| REMIC, Series 4993, Class KS | ||
| 1.03% (1 Month LIBOR + 6.05%), due 7/25/50 (b)(h) | 4,895,859 | 741,112 |
| REMIC, Series 5031, Class IQ | ||
| 2.50%, due 10/25/50 (h) | 1,637,501 | 228,528 |
| REMIC, Series 5038, Class IB | ||
| 2.50%, due 10/25/50 (h) | 1,077,556 | 163,467 |
| REMIC, Series 5149, Class LI | ||
| 2.50%, due 10/25/51 (h) | 4,007,700 | 518,623 |
| REMIC, Series 5205, Class KI | ||
| 3.00%, due 12/25/48 (h) | 1,897,001 | 203,617 |
| REMIC, Series 5152, Class BI | ||
| 3.00%, due 7/25/50 (h) | 3,703,094 | 599,665 |
| REMIC, Series 5023, Class LI | ||
| 3.00%, due 10/25/50 (h) | 1,389,501 | 216,400 |
| REMIC, Series 5094, Class IP | ||
| 3.00%, due 4/25/51 (h) | 1,846,136 | 283,123 |
| REMIC, Series 5155, Class KI | ||
| 3.00%, due 10/25/51 (h) | 4,673,509 | 665,187 |
| REMIC, Series 5160 | ||
| 3.00%, due 10/25/51 (h) | 2,294,908 | 250,696 |
| REMIC, Series 5167, Class GI | ||
| 3.00%, due 11/25/51 (h) | 4,280,674 | 639,251 |
| REMIC, Series 5191 | ||
| 3.50%, due 9/25/50 (h) | 2,362,314 | 385,178 |
| REMIC, Series 5036 | ||
| 3.50%, due 11/25/50 (h) | 2,713,617 | 537,658 |
| REMIC, Series 5040 | ||
| 3.50%, due 11/25/50 (h) | 1,472,027 | 235,533 |
| FHLMC, Strips | ||
| Series 311 | ||
| (zero coupon), due 8/15/43 | 741,622 | 571,677 |
| Series 311, Class S1 | ||
| 1.002% (1 Month LIBOR + 5.95%), due 8/15/43 (b)(h) | 2,275,685 | 265,313 |
| Series 389, Class C35 | ||
| 2.00%, due 6/15/52 (h) | 3,675,213 | 464,178 |
| FNMA | ||
| REMIC, Series 2013-110, Class CO | ||
| (zero coupon), due 12/25/39 | 1,246,388 | 1,050,263 |
| REMIC, Series 2013-105, Class QO | ||
| (zero coupon), due 5/25/40 | 381,324 | 320,077 |
| REMIC, Series 2013-105, Class KO | ||
| (zero coupon), due 10/25/43 | 389,153 | 344,758 |
| 18 | MainStay MacKay Strategic Bond Fund |
| Principal Amount | Value | |
| Mortgage-Backed Securities (continued) | ||
| Agency (Collateralized Mortgage Obligations) (continued) | ||
| FNMA (continued) | ||
| REMIC, Series 2013-110, Class DO | ||
| (zero coupon), due 11/25/43 | $ 565,090 | $ 471,065 |
| REMIC, Series 2021-81, Class SA | ||
| (zero coupon) (SOFR 30A + 2.60%), due 12/25/51 (b)(h) | 14,521,382 | 237,711 |
| REMIC, Series 2022-3, Class YS | ||
| (zero coupon) (SOFR 30A + 2.55%), due 2/25/52 (b)(h) | 8,365,440 | 128,626 |
| REMIC, Series 2022-5, Class SN | ||
| (zero coupon) (SOFR 30A + 1.80%), due 2/25/52 (b)(h) | 1,516,776 | 18,490 |
| REMIC, Series 2021-40, Class SI | ||
| 0.93% (1 Month LIBOR + 5.95%), due 9/25/47 (b)(h) | 3,025,135 | 320,437 |
| REMIC, Series 2022-10, Class SA | ||
| 0.935% (SOFR 30A + 5.75%), due 2/25/52 (b)(h) | 2,431,772 | 335,772 |
| REMIC, Series 2016-57, Class SN | ||
| 1.03% (1 Month LIBOR + 6.05%), due 6/25/46 (b)(h) | 2,304,307 | 272,125 |
| REMIC, Series 2019-32, Class SB | ||
| 1.03% (1 Month LIBOR + 6.05%), due 6/25/49 (b)(h) | 1,800,959 | 200,435 |
| REMIC, Series 2020-23, Class PS | ||
| 1.03% (1 Month LIBOR + 6.05%), due 2/25/50 (b)(h) | 2,754,725 | 354,067 |
| REMIC, Series 2021-7, Class EI | ||
| 2.50%, due 2/25/51 (h) | 2,785,558 | 376,285 |
| REMIC, Series 2021-10, Class LI | ||
| 2.50%, due 3/25/51 (h) | 1,629,697 | 237,466 |
| REMIC, Series 2021-12, Class JI | ||
| 2.50%, due 3/25/51 (h) | 1,959,421 | 290,305 |
| REMIC, Series 2021-95, Class KI | ||
| 2.50%, due 4/25/51 (h) | 5,606,308 | 766,962 |
| REMIC, Series 2021-54, Class HI | ||
| 2.50%, due 6/25/51 (h) | 759,386 | 93,084 |
| REMIC, Series 2021-85, Class BI | ||
| 3.00%, due 12/25/51 (h) | 4,161,325 | 678,181 |
| REMIC, Series 2021-8, Class ID | ||
| 3.50%, due 3/25/51 (h) | 2,536,800 | 496,876 |
| REMIC, Series 2020-10, Class DA | ||
| 3.50%, due 3/25/60 | 1,570,343 | 1,483,774 |
| FNMA, Strips (h) | ||
| REMIC, Series 426, Class C32 | ||
| 1.50%, due 2/25/52 | 5,694,579 | 559,226 |
| Principal Amount | Value | |
| Agency (Collateralized Mortgage Obligations) (continued) | ||
| FNMA, Strips (h) (continued) | ||
| REMIC, Series 427, Class C77 | ||
| 2.50%, due 9/25/51 | $ 4,655,261 | $ 685,208 |
| GNMA | ||
| Series 2019-136, Class YS | ||
| (zero coupon) (1 Month LIBOR + 2.83%), due 11/20/49 (b)(h) | 670,106 | 12,843 |
| Series 2020-1, Class YS | ||
| (zero coupon) (1 Month LIBOR + 2.83%), due 1/20/50 (b)(h) | 3,771,885 | 76,464 |
| Series 2020-129, Class SB | ||
| (zero coupon) (1 Month LIBOR + 3.20%), due 9/20/50 (b)(h) | 5,446,278 | 125,127 |
| Series 2021-97, Class SD | ||
| (zero coupon) (SOFR 30A + 2.60%), due 6/20/51 (b)(h) | 11,954,168 | 227,014 |
| Series 2021-158, Class SB | ||
| (zero coupon) (SOFR 30A + 3.70%), due 9/20/51 (b)(h) | 4,011,765 | 164,122 |
| Series 2021-205, Class DS | ||
| (zero coupon) (SOFR 30A + 3.20%), due 11/20/51 (b)(h) | 9,303,732 | 184,751 |
| Series 2021-213, Class ES | ||
| (zero coupon) (SOFR 30A + 1.70%), due 12/20/51 (b)(h) | 12,700,537 | 126,391 |
| Series 2022-19, Class SG | ||
| (zero coupon) (SOFR 30A + 2.45%), due 1/20/52 (b)(h) | 7,316,530 | 94,423 |
| Series 2022-24, Class SC | ||
| (zero coupon) (SOFR 30A + 2.37%), due 2/20/52 (b)(h) | 49,250,130 | 539,008 |
| Series 2022-121, Class SG | ||
| (zero coupon) (SOFR 30A + 3.97%), due 7/20/52 (b)(h) | 9,601,959 | 253,979 |
| Series 2023-56 | ||
| (zero coupon), due 7/20/52 | 2,235,000 | 1,983,703 |
| Series 2023-53 | ||
| (zero coupon), due 4/20/53 | 935,000 | 751,036 |
| Series 2020-166, Class CA | ||
| 1.00%, due 11/20/50 | 2,199,521 | 1,668,821 |
| Series 2020-34, Class SC | ||
| 1.097% (1 Month LIBOR + 6.05%), due 3/20/50 (b)(h) | 2,413,524 | 293,102 |
| Series 2020-146, Class SA | ||
| 1.347% (1 Month LIBOR + 6.30%), due 10/20/50 (b)(h) | 2,855,379 | 402,128 |
| Principal Amount | Value | |
| Mortgage-Backed Securities (continued) | ||
| Agency (Collateralized Mortgage Obligations) (continued) | ||
| GNMA (continued) | ||
| Series 2020-167, Class SN | ||
| 1.347% (1 Month LIBOR + 6.30%), due 11/20/50 (b)(h) | $ 1,454,307 | $ 198,533 |
| Series 2021-179, Class SA | ||
| 1.347% (1 Month LIBOR + 6.30%), due 11/20/50 (b)(h) | 4,358,033 | 599,227 |
| Series 2020-189, Class NS | ||
| 1.347% (1 Month LIBOR + 6.30%), due 12/20/50 (b)(h) | 4,629,153 | 675,335 |
| Series 2020-189, Class SU | ||
| 1.347% (1 Month LIBOR + 6.30%), due 12/20/50 (b)(h) | 908,909 | 133,544 |
| Series 2021-46, Class TS | ||
| 1.347% (1 Month LIBOR + 6.30%), due 3/20/51 (b)(h) | 2,132,672 | 294,824 |
| Series 2021-57, Class SA | ||
| 1.347% (1 Month LIBOR + 6.30%), due 3/20/51 (b)(h) | 3,394,089 | 459,493 |
| Series 2021-57, Class SD | ||
| 1.347% (1 Month LIBOR + 6.30%), due 3/20/51 (b)(h) | 4,460,821 | 600,236 |
| Series 2021-96, Class NS | ||
| 1.347% (1 Month LIBOR + 6.30%), due 6/20/51 (b)(h) | 6,414,558 | 855,240 |
| Series 2021-96, Class SN | ||
| 1.347% (1 Month LIBOR + 6.30%), due 6/20/51 (b)(h) | 3,778,790 | 492,419 |
| Series 2021-122, Class HS | ||
| 1.347% (1 Month LIBOR + 6.30%), due 7/20/51 (b)(h) | 3,519,944 | 512,715 |
| Series 2022-137, Class S | ||
| 1.347% (1 Month LIBOR + 6.30%), due 7/20/51 (b)(h) | 3,816,159 | 508,644 |
| Series 2021-96, Class JS | ||
| 1.397% (1 Month LIBOR + 6.35%), due 6/20/51 (b)(h) | 3,616,530 | 416,565 |
| Series 2020-146, Class LI | ||
| 2.00%, due 10/20/50 (h) | 7,303,860 | 814,599 |
| Series 2021-41, Class FS | ||
| 2.00% (SOFR 30A + 0.20%), due 10/20/50 (b)(h) | 4,440,664 | 427,644 |
| Series 2020-166, Class IC | ||
| 2.00%, due 11/20/50 (h) | 1,446,565 | 150,718 |
| Series 2020-176, Class AI | ||
| 2.00%, due 11/20/50 (h) | 8,455,013 | 858,707 |
| Principal Amount | Value | |
| Agency (Collateralized Mortgage Obligations) (continued) | ||
| GNMA (continued) | ||
| Series 2020-185, Class BI | ||
| 2.00%, due 12/20/50 (h) | $ 2,202,572 | $ 251,867 |
| Series 2020-188 | ||
| 2.00%, due 12/20/50 (h) | 3,397,199 | 356,180 |
| Series 2021-30, Class HI | ||
| 2.00%, due 2/20/51 (h) | 6,658,564 | 708,804 |
| Series 2021-57, Class AI | ||
| 2.00%, due 2/20/51 (h) | 4,686,990 | 477,700 |
| Series 2021-49, Class YI | ||
| 2.00%, due 3/20/51 (h) | 651,871 | 72,850 |
| Series 2021-205, Class GA | ||
| 2.00%, due 11/20/51 | 603,058 | 510,330 |
| Series 2021-97, Class IN | ||
| 2.50%, due 8/20/49 (h) | 5,189,865 | 600,631 |
| Series 2019-159, Class P | ||
| 2.50%, due 9/20/49 | 1,149,994 | 1,019,957 |
| Series 2022-1, Class IA | ||
| 2.50%, due 6/20/50 (h) | 764,916 | 102,935 |
| Series 2020-122, Class IW | ||
| 2.50%, due 7/20/50 (h) | 2,752,354 | 362,363 |
| Series 2020-151, Class TI | ||
| 2.50%, due 10/20/50 (h) | 2,581,735 | 342,105 |
| Series 2021-56, Class FE | ||
| 2.50% (SOFR 30A + 0.20%), due 10/20/50 (b)(h) | 4,391,604 | 492,258 |
| Series 2020-173, Class EI | ||
| 2.50%, due 11/20/50 (h) | 2,887,888 | 396,957 |
| Series 2021-1, Class PI | ||
| 2.50%, due 12/20/50 (h) | 1,309,936 | 168,334 |
| Series 2021-137, Class HI | ||
| 2.50%, due 8/20/51 (h) | 3,074,006 | 423,084 |
| Series 2021-149, Class CI | ||
| 2.50%, due 8/20/51 (h) | 3,945,909 | 547,858 |
| Series 2021-188 | ||
| 2.50%, due 10/20/51 (h) | 4,526,236 | 712,886 |
| Series 2022-83 | ||
| 2.50%, due 11/20/51 (h) | 3,558,347 | 470,806 |
| Series 2021-1, Class IT | ||
| 3.00%, due 1/20/51 (h) | 3,117,154 | 467,434 |
| Series 2021-74, Class HI | ||
| 3.00%, due 4/20/51 (h) | 550,762 | 79,653 |
| Series 2021-97, Class FA | ||
| 3.00% (SOFR 30A + 0.40%), due 6/20/51 (b) | 956,382 | 829,196 |
| Series 2021-98, Class IN | ||
| 3.00%, due 6/20/51 (h) | 1,702,714 | 295,608 |
| 20 | MainStay MacKay Strategic Bond Fund |
| Principal Amount | Value | |
| Mortgage-Backed Securities (continued) | ||
| Agency (Collateralized Mortgage Obligations) (continued) | ||
| GNMA (continued) | ||
| Series 2022-207 | ||
| 3.00%, due 8/20/51 (h) | $ 3,292,576 | $ 492,866 |
| Series 2021-158, Class NI | ||
| 3.00%, due 9/20/51 (h) | 4,710,373 | 691,253 |
| Series 2021-177, Class IM | ||
| 3.00%, due 10/20/51 (h) | 3,025,222 | 408,845 |
| Series 2023-19, Class CI | ||
| 3.00%, due 11/20/51 (h) | 4,001,655 | 587,763 |
| Series 2023-1, Class MA | ||
| 3.50%, due 5/20/50 | 1,588,936 | 1,497,145 |
| Series 2021-146, Class IN | ||
| 3.50%, due 8/20/51 (h) | 3,207,034 | 499,255 |
| Series 2023-1, Class HD | ||
| 3.50%, due 1/20/52 | 1,858,477 | 1,747,474 |
| 48,195,804 | ||
| Commercial Mortgage Loans (Collateralized Mortgage Obligations) 11.6% | ||
| BAMLL Commercial Mortgage Securities Trust (a)(b) | ||
| Series 2022-DKLX, Class E | ||
| 9.017% (1 Month SOFR + 4.127%), due 1/15/39 | 1,095,000 | 1,031,921 |
| Series 2022-DKLX, Class F | ||
| 9.847% (1 Month SOFR + 4.957%), due 1/15/39 | 1,650,000 | 1,542,639 |
| Bayview Commercial Asset Trust (a)(b) | ||
| Series 2005-3A, Class A1 | ||
| 5.34% (1 Month LIBOR + 0.48%), due 11/25/35 | 696,162 | 630,251 |
| Series 2006-4A, Class A1 | ||
| 5.365% (1 Month LIBOR + 0.345%), due 12/25/36 | 8,579 | 7,935 |
| BOCA Commercial Mortgage Trust | ||
| Series 2022-BOCA, Class A | ||
| 6.659% (1 Month SOFR + 1.77%), due 5/15/39 (a)(b) | 1,485,000 | 1,464,522 |
| BX Commercial Mortgage Trust (a) | ||
| Series 2020-VIV2, Class C | ||
| 3.66%, due 3/9/44 (i) | 1,560,000 | 1,298,111 |
| Series 2020-VIV3, Class B | ||
| 3.662%, due 3/9/44 (i) | 1,040,000 | 888,462 |
| Series 2020-VIVA, Class D | ||
| 3.667%, due 3/11/44 (i) | 1,375,000 | 1,110,430 |
| Series 2021-21M, Class A | ||
| 5.678% (1 Month LIBOR + 0.73%), due 10/15/36 (b) | 745,012 | 717,968 |
| Principal Amount | Value | |
| Commercial Mortgage Loans (Collateralized Mortgage Obligations) (continued) | ||
| BX Commercial Mortgage Trust (a) (continued) | ||
| Series 2021-VOLT, Class D | ||
| 6.598% (1 Month LIBOR + 1.65%), due 9/15/36 (b) | $ 1,450,000 | $ 1,371,951 |
| BX Trust (a) | ||
| Series 2019-OC11, Class B | ||
| 3.605%, due 12/9/41 | 205,000 | 178,581 |
| Series 2019-OC11, Class C | ||
| 3.856%, due 12/9/41 | 1,145,000 | 987,802 |
| Series 2019-OC11, Class D | ||
| 4.075%, due 12/9/41 (i) | 865,000 | 732,459 |
| Series 2019-OC11, Class E | ||
| 4.075%, due 12/9/41 (i) | 3,475,000 | 2,846,520 |
| Series 2021-RISE, Class A | ||
| 5.695% (1 Month LIBOR + 0.748%), due 11/15/36 (b) | 1,885,000 | 1,817,765 |
| Series 2023-LIFE, Class C | ||
| 5.884%, due 2/15/28 | 500,000 | 481,820 |
| Series 2018-GW, Class C | ||
| 6.168% (1 Month LIBOR + 1.22%), due 5/15/35 (b) | 940,000 | 916,351 |
| Series 2021-RISE, Class B | ||
| 6.198% (1 Month LIBOR + 1.25%), due 11/15/36 (b) | 1,650,000 | 1,592,697 |
| Series 2021-MFM1, Class C | ||
| 6.204% (1 Month SOFR + 1.314%), due 1/15/34 (b) | 2,034,552 | 1,957,910 |
| Series 2021-MFM1, Class D | ||
| 6.504% (1 Month SOFR + 1.614%), due 1/15/34 (b) | 1,641,205 | 1,567,019 |
| Series 2021-LBA, Class DV | ||
| 6.604% (1 Month SOFR + 1.714%), due 2/15/36 (b) | 1,270,000 | 1,181,826 |
| Series 2021-RISE, Class D | ||
| 6.698% (1 Month LIBOR + 1.75%), due 11/15/36 (b) | 2,590,000 | 2,468,753 |
| Series 2021-ARIA, Class E | ||
| 7.193% (1 Month LIBOR + 2.245%), due 10/15/36 (b) | 3,400,000 | 3,145,695 |
| BXHPP Trust (a)(b) | ||
| Series 2021-FILM, Class B | ||
| 5.848% (1 Month LIBOR + 0.90%), due 8/15/36 | 140,000 | 127,923 |
| Series 2021-FILM, Class C | ||
| 6.048% (1 Month LIBOR + 1.10%), due 8/15/36 | 1,745,000 | 1,561,516 |
| Principal Amount | Value | |
| Mortgage-Backed Securities (continued) | ||
| Commercial Mortgage Loans (Collateralized Mortgage Obligations) (continued) | ||
| BXHPP Trust (a)(b) (continued) | ||
| Series 2021-FILM, Class D | ||
| 6.448% (1 Month LIBOR + 1.50%), due 8/15/36 | $ 1,355,000 | $ 1,202,653 |
| BXSC Commercial Mortgage Trust | ||
| Series 2022-WSS, Class D | ||
| 8.078% (1 Month SOFR + 3.188%), due 3/15/35 (a)(b) | 1,320,000 | 1,280,283 |
| Commercial Mortgage Trust | ||
| Series 2012-CR4, Class AM | ||
| 3.251%, due 10/15/45 | 1,050,000 | 961,314 |
| CSMC WEST Trust | ||
| Series 2020-WEST, Class A | ||
| 3.04%, due 2/15/35 (a) | 1,925,000 | 1,458,480 |
| DROP Mortgage Trust | ||
| Series 2021-FILE, Class A | ||
| 6.10% (1 Month LIBOR + 1.15%), due 10/15/43 (a)(b) | 1,430,000 | 1,315,366 |
| Extended Stay America Trust (a)(b) | ||
| Series 2021-ESH, Class C | ||
| 6.648% (1 Month LIBOR + 1.70%), due 7/15/38 | 107,381 | 103,616 |
| Series 2021-ESH, Class D | ||
| 7.198% (1 Month LIBOR + 2.25%), due 7/15/38 | 3,694,888 | 3,546,835 |
| FREMF Mortgage Trust (a)(i) | ||
| Series 2016-K58, Class C | ||
| 3.866%, due 9/25/49 | 290,000 | 274,628 |
| Series 2018-K73, Class B | ||
| 3.986%, due 2/25/51 | 855,000 | 804,151 |
| Series 2017-K63, Class C | ||
| 4.011%, due 2/25/50 | 1,275,000 | 1,201,125 |
| Series 2018-K154, Class B | ||
| 4.162%, due 11/25/32 | 1,750,000 | 1,539,259 |
| Series 2018-K78, Class B | ||
| 4.267%, due 6/25/51 | 970,000 | 921,621 |
| Series 2018-K155, Class B | ||
| 4.308%, due 4/25/33 | 2,135,000 | 1,904,502 |
| Series 2018-K84, Class C | ||
| 4.314%, due 10/25/28 | 475,000 | 444,793 |
| Series 2018-K81, Class B | ||
| 4.315%, due 9/25/51 | 465,000 | 442,028 |
| Series 2018-K81, Class C | ||
| 4.315%, due 9/25/51 | 1,385,000 | 1,297,880 |
| Series 2018-K79, Class B | ||
| 4.351%, due 7/25/51 | 690,000 | 658,058 |
| Principal Amount | Value | |
| Commercial Mortgage Loans (Collateralized Mortgage Obligations) (continued) | ||
| FREMF Mortgage Trust (a)(i) (continued) | ||
| Series 2018-K76, Class B | ||
| 4.352%, due 6/25/51 | $ 360,000 | $ 344,158 |
| Series 2018-K80, Class C | ||
| 4.376%, due 8/25/50 | 1,000,000 | 941,041 |
| Series 2019-K88, Class C | ||
| 4.528%, due 2/25/52 | 1,505,000 | 1,410,822 |
| Hudson Yards Mortgage Trust | ||
| Series 2019-30HY, Class A | ||
| 3.228%, due 7/10/39 (a) | 2,595,000 | 2,269,200 |
| J.P. Morgan Chase Commercial Mortgage Securities Trust (a) | ||
| Series 2019-OSB, Class A | ||
| 3.397%, due 6/5/39 | 2,555,000 | 2,273,764 |
| Series 2018-AON, Class B | ||
| 4.379%, due 7/5/31 | 1,585,000 | 1,236,300 |
| Manhattan West Mortgage Trust | ||
| Series 2020-1MW, Class A | ||
| 2.13%, due 9/10/39 (a) | 2,061,000 | 1,782,987 |
| Multifamily Connecticut Avenue Securities Trust (a)(b) | ||
| Series 2019-01, Class M10 | ||
| 8.27% (1 Month LIBOR + 3.25%), due 10/25/49 | 3,292,996 | 3,074,150 |
| Series 2020-01, Class M10 | ||
| 8.77% (1 Month LIBOR + 3.75%), due 3/25/50 | 1,420,000 | 1,334,889 |
| One Bryant Park Trust | ||
| Series 2019-OBP, Class A | ||
| 2.516%, due 9/15/54 (a) | 4,665,000 | 3,869,554 |
| SLG Office Trust (a) | ||
| Series 2021-OVA, Class A | ||
| 2.585%, due 7/15/41 | 645,000 | 524,388 |
| Series 2021-OVA, Class F | ||
| 2.851%, due 7/15/41 | 1,510,000 | 1,018,841 |
| SMRT | ||
| Series 2022-MINI, Class D | ||
| 6.84% (1 Month SOFR + 1.95%), due 1/15/39 (a)(b) | 2,650,000 | 2,470,571 |
| UBS-Barclays Commercial Mortgage Trust | ||
| Series 2013-C6, Class B | ||
| 3.875%, due 4/10/46 (a)(j) | 1,680,000 | 1,672,310 |
| Wells Fargo Commercial Mortgage Trust | ||
| Series 2018-AUS, Class A | ||
| 4.194%, due 8/17/36 (a)(i) | 1,985,000 | 1,805,430 |
| WFRBS Commercial Mortgage Trust | ||
| Series 2014-C21, Class AS | ||
| 3.891%, due 8/15/47 | 2,175,000 | 2,079,723 |
| 79,093,547 | ||
| 22 | MainStay MacKay Strategic Bond Fund |
| Principal Amount | Value | |
| Mortgage-Backed Securities (continued) | ||
| Whole Loan (Collateralized Mortgage Obligations) 15.5% | ||
| Alternative Loan Trust | ||
| Series 2005-31, Class 1A1 | ||
| 5.58% (1 Month LIBOR + 0.56%), due 8/25/35 (b) | $ 1,773,294 | $ 1,543,559 |
| CIM Trust | ||
| Series 2021-J2, Class AIOS | ||
| 0.21%, due 4/25/51 (a)(h)(j) | 48,275,830 | 478,124 |
| Connecticut Avenue Securities Trust (a)(b) | ||
| Series 2020-R02, Class 2M2 | ||
| 7.02% (1 Month LIBOR + 2.00%), due 1/25/40 | 1,345,681 | 1,346,981 |
| Series 2021-R01, Class 1B1 | ||
| 7.915% (SOFR 30A + 3.10%), due 10/25/41 | 4,025,000 | 3,904,007 |
| Series 2022-R04, Class 1M2 | ||
| 7.915% (SOFR 30A + 3.10%), due 3/25/42 | 820,000 | 828,200 |
| Series 2020-SBT1, Class 1M2 | ||
| 8.67% (1 Month LIBOR + 3.65%), due 2/25/40 | 1,870,000 | 1,892,795 |
| FHLMC STACR REMIC Trust (a)(b) | ||
| Series 2021-DNA6, Class M2 | ||
| 6.315% (SOFR 30A + 1.50%), due 10/25/41 | 1,041,000 | 1,002,618 |
| Series 2022-DNA1, Class M1B | ||
| 6.665% (SOFR 30A + 1.85%), due 1/25/42 | 1,150,000 | 1,113,379 |
| Series 2020-DNA6, Class M2 | ||
| 6.815% (SOFR 30A + 2.00%), due 12/25/50 | 2,773,200 | 2,773,192 |
| Series 2021-HQA2, Class M2 | ||
| 6.865% (SOFR 30A + 2.05%), due 12/25/33 | 3,665,000 | 3,501,662 |
| Series 2021-HQA3, Class M2 | ||
| 6.915% (SOFR 30A + 2.10%), due 9/25/41 | 2,615,000 | 2,439,298 |
| Series 2021-HQA1, Class M2 | ||
| 7.065% (SOFR 30A + 2.25%), due 8/25/33 | 2,813,796 | 2,739,960 |
| Series 2020-HQA1, Class B1 | ||
| 7.37% (1 Month LIBOR + 2.35%), due 1/25/50 | 1,815,000 | 1,738,672 |
| Series 2021-DNA1, Class B1 | ||
| 7.465% (SOFR 30A + 2.65%), due 1/25/51 | 745,000 | 710,567 |
| Principal Amount | Value | |
| Whole Loan (Collateralized Mortgage Obligations) (continued) | ||
| FHLMC STACR REMIC Trust (a)(b) (continued) | ||
| Series 2020-DNA2, Class B1 | ||
| 7.52% (1 Month LIBOR + 2.50%), due 2/25/50 | $ 3,015,000 | $ 2,924,732 |
| Series 2022-DNA3, Class M1B | ||
| 7.715% (SOFR 30A + 2.90%), due 4/25/42 | 2,765,000 | 2,758,088 |
| Series 2021-HQA1, Class B1 | ||
| 7.815% (SOFR 30A + 3.00%), due 8/25/33 | 3,781,290 | 3,431,721 |
| Series 2020-DNA6, Class B1 | ||
| 7.815% (SOFR 30A + 3.00%), due 12/25/50 | 3,030,000 | 2,952,290 |
| Series 2021-DNA5, Class B1 | ||
| 7.865% (SOFR 30A + 3.05%), due 1/25/34 | 3,395,000 | 3,229,016 |
| Series 2021-HQA2, Class B1 | ||
| 7.965% (SOFR 30A + 3.15%), due 12/25/33 | 2,855,000 | 2,587,495 |
| Series 2021-HQA3, Class B1 | ||
| 8.165% (SOFR 30A + 3.35%), due 9/25/41 | 3,655,000 | 3,415,159 |
| Series 2021-DNA6, Class B1 | ||
| 8.215% (SOFR 30A + 3.40%), due 10/25/41 | 2,975,000 | 2,902,499 |
| Series 2022-DNA1, Class B1 | ||
| 8.215% (SOFR 30A + 3.40%), due 1/25/42 | 2,980,295 | 2,779,502 |
| Series 2021-DNA3, Class B1 | ||
| 8.315% (SOFR 30A + 3.50%), due 10/25/33 | 2,860,000 | 2,795,620 |
| Series 2022-DNA2, Class M2 | ||
| 8.565% (SOFR 30A + 3.75%), due 2/25/42 | 2,090,000 | 2,048,200 |
| FHLMC STACR Trust (a)(b) | ||
| Series 2019-DNA3, Class B1 | ||
| 8.27% (1 Month LIBOR + 3.25%), due 7/25/49 | 2,125,000 | 2,181,731 |
| Series 2018-DNA2, Class B1 | ||
| 8.72% (1 Month LIBOR + 3.70%), due 12/25/30 | 2,850,000 | 2,942,396 |
| Series 2019-DNA2, Class B1 | ||
| 9.37% (1 Month LIBOR + 4.35%), due 3/25/49 | 895,000 | 935,161 |
| Series 2019-DNA1, Class B1 | ||
| 9.67% (1 Month LIBOR + 4.65%), due 1/25/49 | 1,320,000 | 1,423,017 |
| Principal Amount | Value | |
| Mortgage-Backed Securities (continued) | ||
| Whole Loan (Collateralized Mortgage Obligations) (continued) | ||
| FHLMC STACR Trust (a)(b) (continued) | ||
| Series 2018-HQA2, Class B2 | ||
| 16.02% (1 Month LIBOR + 11.00%), due 10/25/48 | $ 2,220,000 | $ 2,584,675 |
| FHLMC Structured Agency Credit Risk Debt Notes (b) | ||
| Series 2018-DNA1, Class B1 | ||
| 8.17% (1 Month LIBOR + 3.15%), due 7/25/30 | 1,030,000 | 1,050,817 |
| Series 2021-DNA2, Class B1 | ||
| 8.215% (SOFR 30A + 3.40%), due 8/25/33 (a) | 1,365,000 | 1,335,045 |
| FNMA (b) | ||
| Series 2021-R02, Class 2M2 | ||
| 6.815% (SOFR 30A + 2.00%), due 11/25/41 (a) | 505,000 | 482,906 |
| Series 2021-R02, Class 2B1 | ||
| 8.115% (SOFR 30A + 3.30%), due 11/25/41 (a) | 1,450,000 | 1,397,438 |
| Series 2018-C01, Class 1B1 | ||
| 8.57% (1 Month LIBOR + 3.55%), due 7/25/30 | 3,460,000 | 3,688,967 |
| Series 2017-C05, Class 1B1 | ||
| 8.62% (1 Month LIBOR + 3.60%), due 1/25/30 | 1,935,000 | 2,041,148 |
| Series 2018-C03, Class 1B1 | ||
| 8.77% (1 Month LIBOR + 3.75%), due 10/25/30 | 1,735,000 | 1,860,558 |
| Series 2017-C07, Class 1B1 | ||
| 9.02% (1 Month LIBOR + 4.00%), due 5/25/30 | 3,190,000 | 3,396,722 |
| Series 2018-C06, Class 2B1 | ||
| 9.12% (1 Month LIBOR + 4.10%), due 3/25/31 | 2,015,000 | 2,178,330 |
| Series 2018-C05, Class 1B1 | ||
| 9.27% (1 Month LIBOR + 4.25%), due 1/25/31 | 2,096,000 | 2,286,799 |
| Series 2018-C04, Class 2B1 | ||
| 9.52% (1 Month LIBOR + 4.50%), due 12/25/30 | 2,237,000 | 2,422,514 |
| Series 2017-C03, Class 1B1 | ||
| 9.87% (1 Month LIBOR + 4.85%), due 10/25/29 | 1,712,000 | 1,878,478 |
| Series 2017-C01, Class 1B1 | ||
| 10.77% (1 Month LIBOR + 5.75%), due 7/25/29 | 998,840 | 1,125,761 |
| Principal Amount | Value | |
| Whole Loan (Collateralized Mortgage Obligations) (continued) | ||
| Galton Funding Mortgage Trust | ||
| Series 2018-2, Class A51 | ||
| 4.50%, due 10/25/58 (a)(j) | $ 375,984 | $ 365,158 |
| GreenPoint Mortgage Funding Trust | ||
| Series 2007-AR3, Class A1 | ||
| 5.46% (1 Month LIBOR + 0.44%), due 6/25/37 (b) | 359,529 | 310,944 |
| MASTR Alternative Loan Trust | ||
| Series 2005-6, Class 1A2 | ||
| 5.50%, due 12/25/35 | 1,230,222 | 882,124 |
| Series 2005-5, Class 3A1 | ||
| 5.75%, due 8/25/35 | 1,444,458 | 772,398 |
| New Residential Mortgage Loan Trust (a) | ||
| Series 2019-5A, Class B7 | ||
| 4.343%, due 8/25/59 (i) | 2,353,556 | 1,421,064 |
| Series 2019-4A, Class B6 | ||
| 4.647%, due 12/25/58 (j) | 2,337,050 | 1,441,014 |
| Series 2019-2A, Class B6 | ||
| 4.862%, due 12/25/57 (j) | 1,074,302 | 700,799 |
| Sequoia Mortgage Trust (a) | ||
| Series 2021-4, Class AIO1 | ||
| 0.169%, due 6/25/51 (h)(i) | 35,986,677 | 300,733 |
| Series 2018-7, Class B3 | ||
| 4.254%, due 9/25/48 (j) | 1,356,659 | 1,168,024 |
| STACR Trust (a)(b) | ||
| Series 2018-HRP2, Class M3 | ||
| 7.42% (1 Month LIBOR + 2.40%), due 2/25/47 | 2,068,330 | 2,065,618 |
| Series 2018-HRP2, Class B1 | ||
| 9.22% (1 Month LIBOR + 4.20%), due 2/25/47 | 2,995,000 | 3,136,557 |
| WaMu Mortgage Pass-Through Certificates Trust | ||
| Series 2006-AR9, Class 2A | ||
| 4.513% (12 Month Monthly Treasury Average Index + 1.048%), due 8/25/46 (b) | 537,384 | 434,294 |
| 106,048,526 | ||
| Total Mortgage-Backed Securities (Cost $240,572,677) | 233,337,877 | |
| 24 | MainStay MacKay Strategic Bond Fund |
| Principal Amount | Value | |
| Municipal Bond 0.3% | ||
| California 0.3% | ||
| Regents of the University of California Medical Center, Pooled Revenue Bonds | ||
| Series N | ||
| 3.006%, due 5/15/50 | $ 2,760,000 | $ 2,031,482 |
| Total Municipal Bond (Cost $2,760,000) | 2,031,482 | |
| U.S. Government & Federal Agencies 9.4% | ||
| Federal Home Loan Mortgage Corporation (Mortgage Pass-Through Security) 0.2% | ||
| UMBS Pool, 30 Year | ||
| 3.50%, due 7/1/52 | 1,355,283 | 1,259,643 |
| Federal National Mortgage Association (Mortgage Pass-Through Securities) 5.0% | ||
| UMBS, 30 Year | ||
| 4.00%, due 6/1/52 | 9,835,235 | 9,401,998 |
| 4.00%, due 7/1/52 | 3,208,095 | 3,067,768 |
| 5.00%, due 11/1/52 | 14,848,527 | 14,766,322 |
| 5.00%, due 3/1/53 | 1,757,207 | 1,747,249 |
| 5.00%, due 3/1/53 | 668,163 | 664,783 |
| 5.50%, due 11/1/52 | 984,095 | 992,257 |
| 5.50%, due 2/1/53 | 1,735,665 | 1,750,060 |
| 6.00%, due 3/1/53 | 1,680,632 | 1,712,036 |
| 34,102,473 | ||
| United States Treasury Bonds 0.4% | ||
| U.S. Treasury Bonds | ||
| 3.875%, due 2/15/43 | 2,280,000 | 2,304,225 |
| United States Treasury Notes 3.8% | ||
| U.S. Treasury Notes | ||
| 3.50%, due 4/30/30 | 1,720,000 | 1,722,956 |
| 3.50%, due 2/15/33 | 22,850,000 | 22,985,671 |
| 3.75%, due 4/15/26 | 1,425,000 | 1,425,445 |
| 26,134,072 | ||
| Total U.S. Government & Federal Agencies (Cost $63,244,845) | 63,800,413 | |
| Total Long-Term Bonds (Cost $725,947,902) | 674,828,608 | |
| Shares | Value | ||
| Common Stocks 0.0% ‡ | |||
| Commercial Services & Supplies 0.0% ‡ | |||
| Quad/Graphics, Inc. (k) | 14 | $ 49 | |
| Tobacco 0.0% ‡ | |||
| Turning Point Brands, Inc. | 6,802 | 161,819 | |
| Total Common Stocks (Cost $0) | 161,868 | ||
| Short-Term Investments 0.6% | |||
| Affiliated Investment Company 0.1% | |||
| MainStay U.S. Government Liquidity Fund, 3.98% (l) | 654,868 | 654,868 | |
| Unaffiliated Investment Companies 0.5% | |||
| Goldman Sachs Financial Square Government Fund, 4.865% (l)(m) | 177,000 | 177,000 | |
| Invesco Government & Agency Portfolio, 4.857% (l)(m) | 3,195,068 | 3,195,068 | |
| Total Unaffiliated Investment Companies (Cost $3,372,068) | 3,372,068 | ||
| Total Short-Term Investments (Cost $4,026,936) | 4,026,936 | ||
| Total Investments (Cost $729,974,838) | 99.6% | 679,017,412 | |
| Other Assets, Less Liabilities | 0.4 | 2,505,905 | |
| Net Assets | 100.0% | $ 681,523,317 | |
| † | Percentages indicated are based on Fund net assets. |
| ^ | Industry classifications may be different than those used for compliance monitoring purposes. |
| ‡ | Less than one-tenth of a percent. |
| (a) | May be sold to institutional investors only under Rule 144A or securities offered pursuant to Section 4(a)(2) of the Securities Act of 1933, as amended. |
| (b) | Floating rate—Rate shown was the rate in effect as of April 30, 2023. |
| (c) | All or a portion of this security was held on loan. As of April 30, 2023, the aggregate market value of securities on loan was $3,303,540. The Fund received cash collateral with a value of $3,372,068. (See Note 2(J)) |
| (d) | Fixed to floating rate—Rate shown was the rate in effect as of April 30, 2023. |
| (e) | Security is perpetual and, thus, does not have a predetermined maturity date. The date shown, if applicable, reflects the next call date. |
| (f) | Illiquid security—As of April 30, 2023, the total market value deemed illiquid under procedures approved by the Board of Trustees was $705,500, which represented 0.1% of the Fund’s net assets. |
| (g) | Step coupon—Rate shown was the rate in effect as of April 30, 2023. |
| (h) | Collateralized Mortgage Obligation Interest Only Strip—Pays a fixed or variable rate of interest based on mortgage loans or mortgage pass-through securities. The principal amount of the underlying pool represents the notional amount on which the current interest was calculated. The value of these stripped securities may be particularly sensitive to changes in prevailing interest rates and are typically more sensitive to changes in prepayment rates than traditional mortgage-backed securities. |
| (i) | Collateral strip rate—A bond whose interest was based on the weighted net interest rate of the collateral. The coupon rate adjusts periodically based on a predetermined schedule. Rate shown was the rate in effect as of April 30, 2023. |
| (j) | Coupon rate may change based on changes of the underlying collateral or prepayments of principal. Rate shown was the rate in effect as of April 30, 2023. |
| (k) | Non-income producing security. |
| (l) | Current yield as of April 30, 2023. |
| (m) | Represents a security purchased with cash collateral received for securities on loan. |
| Affiliated Investment Companies | Value, Beginning of Period | Purchases at Cost | Proceeds from Sales | Net Realized Gain/(Loss) on Sales | Change in Unrealized Appreciation/ (Depreciation) | Value, End of Period | Dividend Income | Other Distributions | Shares End of Period |
| MainStay U.S. Government Liquidity Fund | $ 10,062 | $ 116,679 | $ (126,086) | $ — | $ — | $ 655 | $ 118 | $ — | 655 |
| Type | Number of Contracts | Expiration Date | Value at Trade Date | Current Notional Amount | Unrealized Appreciation (Depreciation)2 |
| Long Contracts | |||||
| U.S. Treasury 10 Year Ultra Bonds | 627 | June 2023 | $ 73,570,270 | $ 76,151,110 | $ 2,580,840 |
| U.S. Treasury Long Bonds | 85 | June 2023 | 10,716,838 | 11,190,781 | 473,943 |
| Total Long Contracts | 3,054,783 | ||||
| Short Contracts | |||||
| U.S. Treasury 2 Year Notes | (277) | June 2023 | (56,757,869) | (57,107,445) | (349,576) |
| U.S. Treasury 5 Year Notes | (556) | June 2023 | (59,579,864) | (61,016,657) | (1,436,793) |
| U.S. Treasury 10 Year Notes | (230) | June 2023 | (25,751,196) | (26,496,719) | (745,523) |
| U.S. Treasury Ultra Bonds | (131) | June 2023 | (18,081,355) | (18,524,218) | (442,863) |
| Total Short Contracts | (2,974,755) | ||||
| Net Unrealized Appreciation | $ 80,028 |
| 1. | As of April 30, 2023, cash in the amount of $1,098,948 was on deposit with a broker or futures commission merchant for futures transactions. |
| 2. | Represents the difference between the value of the contracts at the time they were opened and the value as of April 30, 2023. |
| 26 | MainStay MacKay Strategic Bond Fund |
| Abbreviation(s): |
| FHLMC—Federal Home Loan Mortgage Corp. |
| FNMA—Federal National Mortgage Association |
| FREMF—Freddie Mac Multifamily |
| GNMA—Government National Mortgage Association |
| LIBOR—London Interbank Offered Rate |
| REMIC—Real Estate Mortgage Investment Conduit |
| SOFR—Secured Overnight Financing Rate |
| UMBS—Uniform Mortgage Backed Securities |
| USISDA—U.S. dollar International Swaps and Derivatives Association |
| Description | Quoted Prices in Active Markets for Identical Assets (Level 1) | Significant Other Observable Inputs (Level 2) | Significant Unobservable Inputs (Level 3) | Total | |||
| Asset Valuation Inputs | |||||||
| Investments in Securities (a) | |||||||
| Long-Term Bonds | |||||||
| Asset-Backed Securities | $ — | $ 105,655,855 | $ — | $ 105,655,855 | |||
| Corporate Bonds | — | 254,902,958 | — | 254,902,958 | |||
| Foreign Government Bonds | — | 14,104,914 | — | 14,104,914 | |||
| Loan Assignments | — | 995,109 | — | 995,109 | |||
| Mortgage-Backed Securities | — | 233,337,877 | — | 233,337,877 | |||
| Municipal Bond | — | 2,031,482 | — | 2,031,482 | |||
| U.S. Government & Federal Agencies | — | 63,800,413 | — | 63,800,413 | |||
| Total Long-Term Bonds | — | 674,828,608 | — | 674,828,608 | |||
| Common Stocks | 161,868 | — | — | 161,868 | |||
| Short-Term Investments | |||||||
| Affiliated Investment Company | 654,868 | — | — | 654,868 | |||
| Unaffiliated Investment Companies | 3,372,068 | �� — | — | 3,372,068 | |||
| Total Short-Term Investments | 4,026,936 | — | — | 4,026,936 | |||
| Total Investments in Securities | 4,188,804 | 674,828,608 | — | 679,017,412 | |||
| Other Financial Instruments | |||||||
| Futures Contracts (b) | 3,054,783 | — | — | 3,054,783 | |||
| Total Investments in Securities and Other Financial Instruments | $ 7,243,587 | $ 674,828,608 | $ — | $ 682,072,195 | |||
| Liability Valuation Inputs | |||||||
| Other Financial Instruments | |||||||
| Futures Contracts (b) | $ (2,974,755) | $ — | $ — | $ (2,974,755) |
| (a) | For a complete listing of investments and their industries, see the Portfolio of Investments. |
| (b) | The value listed for these securities reflects unrealized appreciation (depreciation) as shown on the Portfolio of Investments. |
| Assets | |
| Investment in unaffiliated securities, at value (identified cost $729,319,970) including securities on loan of $3,303,540 | $ 678,362,544 |
| Investment in affiliated investment companies, at value (identified cost $654,868) | 654,868 |
| Cash | 44,708 |
| Cash denominated in foreign currencies (identified cost $497) | 488 |
| Cash collateral on deposit at broker for futures contracts | 1,098,948 |
| Receivables: | |
| Dividends and interest | 4,642,670 |
| Investment securities sold | 2,638,059 |
| Fund shares sold | 1,059,790 |
| Variation margin on futures contracts | 155,170 |
| Securities lending | 2,431 |
| Other assets | 83,848 |
| Total assets | 688,743,524 |
| Liabilities | |
| Cash collateral received for securities on loan | 3,372,068 |
| Payables: | |
| Investment securities purchased | 2,021,568 |
| Fund shares redeemed | 899,315 |
| Manager (See Note 3) | 302,139 |
| Transfer agent (See Note 3) | 154,005 |
| NYLIFE Distributors (See Note 3) | 54,871 |
| Shareholder communication | 40,243 |
| Professional fees | 33,588 |
| Custodian | 17,792 |
| Distributions payable | 324,618 |
| Total liabilities | 7,220,207 |
| Net assets | $ 681,523,317 |
| Composition of Net Assets | |
| Shares of beneficial interest outstanding (par value of $.01 per share) unlimited number of shares authorized | $ 823,005 |
| Additional paid-in-capital | 915,652,414 |
| 916,475,419 | |
| Total distributable earnings (loss) | (234,952,102) |
| Net assets | $ 681,523,317 |
| Class A | |
| Net assets applicable to outstanding shares | $181,866,872 |
| Shares of beneficial interest outstanding | 21,980,083 |
| Net asset value per share outstanding | $ 8.27 |
| Maximum sales charge (4.50% of offering price) | 0.39 |
| Maximum offering price per share outstanding | $ 8.66 |
| Investor Class | |
| Net assets applicable to outstanding shares | $ 13,973,221 |
| Shares of beneficial interest outstanding | 1,673,054 |
| Net asset value per share outstanding | $ 8.35 |
| Maximum sales charge (4.00% of offering price) | 0.35 |
| Maximum offering price per share outstanding | $ 8.70 |
| Class B | |
| Net assets applicable to outstanding shares | $ 907,439 |
| Shares of beneficial interest outstanding | 110,218 |
| Net asset value and offering price per share outstanding | $ 8.23 |
| Class C | |
| Net assets applicable to outstanding shares | $ 16,171,716 |
| Shares of beneficial interest outstanding | 1,965,777 |
| Net asset value and offering price per share outstanding | $ 8.23 |
| Class I | |
| Net assets applicable to outstanding shares | $465,419,771 |
| Shares of beneficial interest outstanding | 56,187,380 |
| Net asset value and offering price per share outstanding | $ 8.28 |
| Class R2 | |
| Net assets applicable to outstanding shares | $ 1,084,900 |
| Shares of beneficial interest outstanding | 131,068 |
| Net asset value and offering price per share outstanding | $ 8.28 |
| Class R3 | |
| Net assets applicable to outstanding shares | $ 554,444 |
| Shares of beneficial interest outstanding | 66,989 |
| Net asset value and offering price per share outstanding | $ 8.28 |
| Class R6 | |
| Net assets applicable to outstanding shares | $ 1,544,954 |
| Shares of beneficial interest outstanding | 185,895 |
| Net asset value and offering price per share outstanding | $ 8.31 |
| 28 | MainStay MacKay Strategic Bond Fund |
| Investment Income (Loss) | |
| Income | |
| Interest | $ 17,598,698 |
| Dividends-affiliated | 117,707 |
| Securities lending, net | 32,937 |
| Dividends-unaffiliated | 850 |
| Total income | 17,750,192 |
| Expenses | |
| Manager (See Note 3) | 2,013,792 |
| Transfer agent (See Note 3) | 494,433 |
| Distribution/Service—Class A (See Note 3) | 225,099 |
| Distribution/Service—Investor Class (See Note 3) | 17,529 |
| Distribution/Service—Class B (See Note 3) | 5,525 |
| Distribution/Service—Class C (See Note 3) | 92,283 |
| Distribution/Service—Class R2 (See Note 3) | 1,288 |
| Distribution/Service—Class R3 (See Note 3) | 1,328 |
| Registration | 66,233 |
| Professional fees | 60,052 |
| Custodian | 29,847 |
| Shareholder communication | 14,785 |
| Trustees | 8,550 |
| Shareholder service (See Note 3) | 780 |
| Miscellaneous | 12,208 |
| Total expenses before waiver/reimbursement | 3,043,732 |
| Expense waiver/reimbursement from Manager (See Note 3) | (203,528) |
| Reimbursement from prior custodian(a) | (1,338) |
| Net expenses | 2,838,866 |
| Net investment income (loss) | 14,911,326 |
| Realized and Unrealized Gain (Loss) | |
| Net realized gain (loss) on: | |
| Unaffiliated investment transactions | (14,101,097) |
| Futures transactions | 900,095 |
| Swap transactions | 492,299 |
| Net realized gain (loss) | (12,708,703) |
| Net change in unrealized appreciation (depreciation) on: | |
| Unaffiliated investments | 42,402,580 |
| Futures contracts | (805,732) |
| Swap contracts | (564,729) |
| Translation of other assets and liabilities in foreign currencies | 51 |
| Net change in unrealized appreciation (depreciation) | 41,032,170 |
| Net realized and unrealized gain (loss) | 28,323,467 |
| Net increase (decrease) in net assets resulting from operations | $ 43,234,793 |
| (a) | Represents a refund for overbilling of custody fees. |
for the six months ended April 30, 2023 (Unaudited) and the year ended October 31, 2022
| Six months ended April 30, 2023 | Year ended October 31, 2022 | |
| Increase (Decrease) in Net Assets | ||
| Operations: | ||
| Net investment income (loss) | $ 14,911,326 | $ 20,275,770 |
| Net realized gain (loss) | (12,708,703) | 13,644,876 |
| Net change in unrealized appreciation (depreciation) | 41,032,170 | (111,167,582) |
| Net increase (decrease) in net assets resulting from operations | 43,234,793 | (77,246,936) |
| Distributions to shareholders: | ||
| Class A | (3,994,160) | (4,730,207) |
| Investor Class | (291,370) | (353,497) |
| Class B | (18,613) | (31,662) |
| Class C | (316,166) | (480,971) |
| Class I | (10,987,002) | (12,885,438) |
| Class R2 | (22,457) | (24,679) |
| Class R3 | (10,933) | (12,448) |
| Class R6 | (34,947) | (39,398) |
| Total distributions to shareholders | (15,675,648) | (18,558,300) |
| Capital share transactions: | ||
| Net proceeds from sales of shares | 126,195,363 | 301,260,901 |
| Net asset value of shares issued to shareholders in reinvestment of distributions | 13,592,908 | 16,426,709 |
| Cost of shares redeemed | (136,904,352) | (281,548,790) |
| Increase (decrease) in net assets derived from capital share transactions | 2,883,919 | 36,138,820 |
| Net increase (decrease) in net assets | 30,443,064 | (59,666,416) |
| Net Assets | ||
| Beginning of period | 651,080,253 | 710,746,669 |
| End of period | $ 681,523,317 | $ 651,080,253 |
| 30 | MainStay MacKay Strategic Bond Fund |
| Six months ended April 30, 2023* | Year Ended October 31, | ||||||||||
| Class A | 2022 | 2021 | 2020 | 2019 | 2018 | ||||||
| Net asset value at beginning of period | $ 7.94 | $ 9.10 | $ 8.80 | $ 8.74 | $ 8.65 | $ 8.90 | |||||
| Net investment income (loss) (a) | 0.17 | 0.24 | 0.22 | 0.22 | 0.23 | 0.24 | |||||
| Net realized and unrealized gain (loss) | 0.34 | (1.19) | 0.27 | 0.06 | 0.11 | (0.22) | |||||
| Total from investment operations | 0.51 | (0.95) | 0.49 | 0.28 | 0.34 | 0.02 | |||||
| Less distributions: | |||||||||||
| From net investment income | (0.18) | (0.21) | (0.18) | (0.21) | (0.25) | (0.27) | |||||
| Return of capital | — | — | (0.01) | (0.01) | — | (0.00)‡ | |||||
| Total distributions | (0.18) | (0.21) | (0.19) | (0.22) | (0.25) | (0.27) | |||||
| Net asset value at end of period | $ 8.27 | $ 7.94 | $ 9.10 | $ 8.80 | $ 8.74 | $ 8.65 | |||||
| Total investment return (b) | 6.47% | (10.51)% | 5.61% | 3.27% | 3.99% | 0.25% | |||||
| Ratios (to average net assets)/Supplemental Data: | |||||||||||
| Net investment income (loss) | 4.21%†† | 2.75% | 2.43% | 2.60% | 2.66% | 2.69% | |||||
| Net expenses (c) | 1.04%†† | 1.04% | 1.07%(d) | 1.18%(d) | 1.27%(d) | 1.25%(d) | |||||
| Portfolio turnover rate | 34% | 86% | 53% | 56%(e) | 50%(e) | 22% | |||||
| Net assets at end of period (in 000’s) | $ 181,867 | $ 178,508 | $ 192,190 | $ 175,682 | $ 197,686 | $ 220,618 | |||||
| * | Unaudited. |
| ‡ | Less than one cent per share. |
| †† | Annualized. |
| (a) | Per share data based on average shares outstanding during the period. |
| (b) | Total investment return is calculated exclusive of sales charges and assumes the reinvestment of dividends and distributions. For periods of less than one year, total return is not annualized. |
| (c) | In addition to the fees and expenses which the Fund bears directly, it also indirectly bears a pro-rata share of the fees and expenses of the underlying funds in which it invests. Such indirect expenses are not included in the above expense ratios. |
| (d) | The expense ratios presented below show the impact of short sales expense: |
| Period Ended | Net Expenses (excluding short sale expenses) | Short Sales Expenses | ||
| October 31, 2021 | 1.04% | 0.03% | ||
| October 31, 2020 | 1.07% | 0.11% | ||
| October 31, 2019 | 1.07% | 0.20% | ||
| October 31, 2018 | 1.03% | 0.22% |
| (e) | The portfolio turnover rate not including mortgage dollar rolls was 53% and 44% for the years ended October 31, 2020 and 2019, respectively. |
| Six months ended April 30, 2023* | Year Ended October 31, | ||||||||||
| Investor Class | 2022 | 2021 | 2020 | 2019 | 2018 | ||||||
| Net asset value at beginning of period | $ 8.01 | $ 9.18 | $ 8.88 | $ 8.81 | $ 8.72 | $ 8.97 | |||||
| Net investment income (loss) (a) | 0.16 | 0.22 | 0.21 | 0.22 | 0.23 | 0.24 | |||||
| Net realized and unrealized gain (loss) | 0.35 | (1.19) | 0.27 | 0.06 | 0.11 | (0.22) | |||||
| Total from investment operations | 0.51 | (0.97) | 0.48 | 0.28 | 0.34 | 0.02 | |||||
| Less distributions: | |||||||||||
| From net investment income | (0.17) | (0.20) | (0.17) | (0.20) | (0.25) | (0.27) | |||||
| Return of capital | — | — | (0.01) | (0.01) | — | (0.00)‡ | |||||
| Total distributions | (0.17) | (0.20) | (0.18) | (0.21) | (0.25) | (0.27) | |||||
| Net asset value at end of period | $ 8.35 | $ 8.01 | $ 9.18 | $ 8.88 | $ 8.81 | $ 8.72 | |||||
| Total investment return (b) | 6.42% | (10.65)% | 5.41% | 3.29% | 3.93% | 0.23% | |||||
| Ratios (to average net assets)/Supplemental Data: | |||||||||||
| Net investment income (loss) | 4.00%†† | 2.59% | 2.30% | 2.54% | 2.63% | 2.68% | |||||
| Net expenses (c) | 1.25%†† | 1.18% | 1.20%(d) | 1.24%(d) | 1.29%(d) | 1.27%(d) | |||||
| Expenses (before waiver/reimbursement) | 1.27%†† | 1.18% | 1.20% | 1.24% | 1.29% | 1.27% | |||||
| Portfolio turnover rate | 34% | 86% | 53% | 56%(e) | 50%(e) | 22% | |||||
| Net assets at end of period (in 000's) | $ 13,973 | $ 13,795 | $ 16,874 | $ 18,139 | $ 19,748 | $ 20,451 | |||||
| * | Unaudited. |
| ‡ | Less than one cent per share. |
| †† | Annualized. |
| (a) | Per share data based on average shares outstanding during the period. |
| (b) | Total investment return is calculated exclusive of sales charges and assumes the reinvestment of dividends and distributions. For periods of less than one year, total return is not annualized. |
| (c) | In addition to the fees and expenses which the Fund bears directly, it also indirectly bears a pro-rata share of the fees and expenses of the underlying funds in which it invests. Such indirect expenses are not included in the above expense ratios. |
| (d) | The expense ratios presented below show the impact of short sales expense: |
| Period Ended | Net Expenses (excluding short sale expenses) | Short Sales Expenses | ||
| October 31, 2021 | 1.17% | 0.03% | ||
| October 31, 2020 | 1.13% | 0.11% | ||
| October 31, 2019 | 1.09% | 0.20% | ||
| October 31, 2018 | 1.05% | 0.22% |
| (e) | The portfolio turnover rate not including mortgage dollar rolls was 53% and 44% for the years ended October 31, 2020 and 2019, respectively. |
| 32 | MainStay MacKay Strategic Bond Fund |
| Six months ended April 30, 2023* | Year Ended October 31, | ||||||||||
| Class B | 2022 | 2021 | 2020 | 2019 | 2018 | ||||||
| Net asset value at beginning of period | $ 7.90 | $ 9.06 | $ 8.76 | $ 8.70 | $ 8.61 | $ 8.86 | |||||
| Net investment income (loss) (a) | 0.13 | 0.15 | 0.14 | 0.15 | 0.16 | 0.17 | |||||
| Net realized and unrealized gain (loss) | 0.34 | (1.17) | 0.27 | 0.06 | 0.11 | (0.22) | |||||
| Total from investment operations | 0.47 | (1.02) | 0.41 | 0.21 | 0.27 | (0.05) | |||||
| Less distributions: | |||||||||||
| From net investment income | (0.14) | (0.14) | (0.10) | (0.15) | (0.18) | (0.20) | |||||
| Return of capital | — | — | (0.01) | (0.00)‡ | — | (0.00)‡ | |||||
| Total distributions | (0.14) | (0.14) | (0.11) | (0.15) | (0.18) | (0.20) | |||||
| Net asset value at end of period | $ 8.23 | $ 7.90 | $ 9.06 | $ 8.76 | $ 8.70 | $ 8.61 | |||||
| Total investment return (b) | 5.99% | (11.27)% | 4.57% | 2.44% | 3.20% | (0.52)% | |||||
| Ratios (to average net assets)/Supplemental Data: | |||||||||||
| Net investment income (loss) | 3.23%†† | 1.74% | 1.55% | 1.77% | 1.90% | 1.92% | |||||
| Net expenses (c) | 2.00%†† | 1.93% | 1.95%(d) | 2.00%(d) | 2.04%(d) | 2.02%(d) | |||||
| Expenses (before waiver/reimbursement) | 2.02%†† | 1.93% | 1.95% | 2.00% | 2.04% | 2.02% | |||||
| Portfolio turnover rate | 34% | 86% | 53% | 56%(e) | 50%(e) | 22% | |||||
| Net assets at end of period (in 000’s) | $ 907 | $ 1,327 | $ 3,191 | $ 4,872 | $ 7,970 | $ 11,015 | |||||
| * | Unaudited. |
| ‡ | Less than one cent per share. |
| †† | Annualized. |
| (a) | Per share data based on average shares outstanding during the period. |
| (b) | Total investment return is calculated exclusive of sales charges and assumes the reinvestment of dividends and distributions. For periods of less than one year, total return is not annualized. |
| (c) | In addition to the fees and expenses which the Fund bears directly, it also indirectly bears a pro-rata share of the fees and expenses of the underlying funds in which it invests. Such indirect expenses are not included in the above expense ratios. |
| (d) | The expense ratios presented below show the impact of short sales expense: |
| Period Ended | Net Expenses (excluding short sale expenses) | Short Sales Expenses | ||
| October 31, 2021 | 1.92% | 0.03% | ||
| October 31, 2020 | 1.89% | 0.11% | ||
| October 31, 2019 | 1.84% | 0.20% | ||
| October 31, 2018 | 1.80% | 0.22% |
| (e) | The portfolio turnover rate not including mortgage dollar rolls was 53% and 44% for the years ended October 31, 2020 and 2019, respectively. |
| Six months ended April 30, 2023* | Year Ended October 31, | ||||||||||
| Class C | 2022 | 2021 | 2020 | 2019 | 2018 | ||||||
| Net asset value at beginning of period | $ 7.89 | $ 9.05 | $ 8.75 | $ 8.69 | $ 8.60 | $ 8.85 | |||||
| Net investment income (loss) (a) | 0.13 | 0.15 | 0.14 | 0.15 | 0.16 | 0.17 | |||||
| Net realized and unrealized gain (loss) | 0.35 | (1.17) | 0.27 | 0.06 | 0.11 | (0.22) | |||||
| Total from investment operations | 0.48 | (1.02) | 0.41 | 0.21 | 0.27 | (0.05) | |||||
| Less distributions: | |||||||||||
| From net investment income | (0.14) | (0.14) | (0.10) | (0.15) | (0.18) | (0.20) | |||||
| Return of capital | — | — | (0.01) | (0.00)‡ | — | (0.00)‡ | |||||
| Total distributions | (0.14) | (0.14) | (0.11) | (0.15) | (0.18) | (0.20) | |||||
| Net asset value at end of period | $ 8.23 | $ 7.89 | $ 9.05 | $ 8.75 | $ 8.69 | $ 8.60 | |||||
| Total investment return (b) | 6.13% | (11.38)% | 4.69% | 2.45% | 3.21% | (0.52)% | |||||
| Ratios (to average net assets)/Supplemental Data: | |||||||||||
| Net investment income (loss) | 3.23%†† | 1.75% | 1.55% | 1.78% | 1.90% | 1.92% | |||||
| Net expenses (c) | 2.00%†† | 1.93% | 1.95%(d) | 2.00%(d) | 2.04%(d) | 2.02%(d) | |||||
| Expenses (before waiver/reimbursement) | 2.02%†† | 1.93% | 1.95% | 2.00% | 2.04% | 2.02% | |||||
| Portfolio turnover rate | 34% | 86% | 53% | 56%(e) | 50%(e) | 22% | |||||
| Net assets at end of period (in 000’s) | $ 16,172 | $ 20,804 | $ 46,537 | $ 65,158 | $ 91,598 | $ 128,279 | |||||
| * | Unaudited. |
| ‡ | Less than one cent per share. |
| †† | Annualized. |
| (a) | Per share data based on average shares outstanding during the period. |
| (b) | Total investment return is calculated exclusive of sales charges and assumes the reinvestment of dividends and distributions. For periods of less than one year, total return is not annualized. |
| (c) | In addition to the fees and expenses which the Fund bears directly, it also indirectly bears a pro-rata share of the fees and expenses of the underlying funds in which it invests. Such indirect expenses are not included in the above expense ratios. |
| (d) | The expense ratios presented below show the impact of short sales expense: |
| Period Ended | Net Expenses (excluding short sale expenses) | Short Sales Expenses | ||
| October 31, 2021 | 1.92% | 0.03% | ||
| October 31, 2020 | 1.89% | 0.11% | ||
| October 31, 2019 | 1.84% | 0.20% | ||
| October 31, 2018 | 1.80% | 0.22% |
| (e) | The portfolio turnover rate not including mortgage dollar rolls was 53% and 44% for the years ended October 31, 2020 and 2019, respectively. |
| 34 | MainStay MacKay Strategic Bond Fund |
| Six months ended April 30, 2023* | Year Ended October 31, | ||||||||||
| Class I | 2022 | 2021 | 2020 | 2019 | 2018 | ||||||
| Net asset value at beginning of period | $ 7.95 | $ 9.11 | $ 8.81 | $ 8.75 | $ 8.66 | $ 8.91 | |||||
| Net investment income (loss) (a) | 0.19 | 0.27 | 0.25 | 0.24 | 0.25 | 0.26 | |||||
| Net realized and unrealized gain (loss) | 0.33 | (1.19) | 0.27 | 0.06 | 0.11 | (0.22) | |||||
| Total from investment operations | 0.52 | (0.92) | 0.52 | 0.30 | 0.36 | 0.04 | |||||
| Less distributions: | |||||||||||
| From net investment income | (0.19) | (0.24) | (0.21) | (0.23) | (0.27) | (0.29) | |||||
| Return of capital | — | — | (0.01) | (0.01) | — | (0.00)‡ | |||||
| Total distributions | (0.19) | (0.24) | (0.22) | (0.24) | (0.27) | (0.29) | |||||
| Net asset value at end of period | $ 8.28 | $ 7.95 | $ 9.11 | $ 8.81 | $ 8.75 | $ 8.66 | |||||
| Total investment return (b) | 6.64% | (10.19)% | 5.88% | 3.53% | 4.24% | 0.51% | |||||
| Ratios (to average net assets)/Supplemental Data: | |||||||||||
| Net investment income (loss) | 4.55%†† | 3.09% | 2.70% | 2.83% | 2.91% | 2.94% | |||||
| Net expenses (c) | 0.70%†† | 0.70% | 0.79%(d) | 0.94%(d) | 1.02%(d) | 1.00%(d) | |||||
| Expenses (before waiver/reimbursement) (c) | 0.79%†† | 0.79% | 0.82% | 0.94% | 1.02% | 1.00% | |||||
| Portfolio turnover rate | 34% | 86% | 53% | 56%(e) | 50%(e) | 22% | |||||
| Net assets at end of period (in 000’s) | $ 465,420 | $ 433,814 | $ 448,881 | $ 404,964 | $ 604,981 | $ 717,129 | |||||
| * | Unaudited. |
| ‡ | Less than one cent per share. |
| †† | Annualized. |
| (a) | Per share data based on average shares outstanding during the period. |
| (b) | Total investment return is calculated exclusive of sales charges and assumes the reinvestment of dividends and distributions. Class I shares are not subject to sales charges. For periods of less than one year, total return is not annualized. |
| (c) | In addition to the fees and expenses which the Fund bears directly, it also indirectly bears a pro-rata share of the fees and expenses of the underlying funds in which it invests. Such indirect expenses are not included in the above expense ratios. |
| (d) | The expense ratios presented below show the impact of short sales expense: |
| Period Ended | Net Expenses (excluding short sale expenses) | Short Sales Expenses | ||
| October 31, 2021 | 0.76% | 0.03% | ||
| October 31, 2020 | 0.83% | 0.11% | ||
| October 31, 2019 | 0.82% | 0.20% | ||
| October 31, 2018 | 0.78% | 0.22% |
| (e) | The portfolio turnover rate not including mortgage dollar rolls was 53% and 44% for the years ended October 31, 2020 and 2019, respectively. |
| Six months ended April 30, 2023* | Year Ended October 31, | ||||||||||
| Class R2 | 2022 | 2021 | 2020 | 2019 | 2018 | ||||||
| Net asset value at beginning of period | $ 7.94 | $ 9.11 | $ 8.81 | $ 8.74 | $ 8.65 | $ 8.90 | |||||
| Net investment income (loss) (a) | 0.17 | 0.23 | 0.21 | 0.21 | 0.22 | 0.23 | |||||
| Net realized and unrealized gain (loss) | 0.35 | (1.19) | 0.27 | 0.07 | 0.11 | (0.22) | |||||
| Total from investment operations | 0.52 | (0.96) | 0.48 | 0.28 | 0.33 | 0.01 | |||||
| Less distributions: | |||||||||||
| From net investment income | (0.18) | (0.21) | (0.17) | (0.20) | (0.24) | (0.26) | |||||
| Return of capital | — | — | (0.01) | (0.01) | — | (0.00)‡ | |||||
| Total distributions | (0.18) | (0.21) | (0.18) | (0.21) | (0.24) | (0.26) | |||||
| Net asset value at end of period | $ 8.28 | $ 7.94 | $ 9.11 | $ 8.81 | $ 8.74 | $ 8.65 | |||||
| Total investment return (b) | 6.55% | (10.69)% | 5.49% | 3.27% | 3.89% | 0.16% | |||||
| Ratios (to average net assets)/Supplemental Data: | |||||||||||
| Net investment income (loss) | 4.12%†† | 2.64% | 2.33% | 2.49% | 2.54% | 2.67% | |||||
| Net expenses (c) | 1.14%†† | 1.14% | 1.17%(d) | 1.29%(d) | 1.37%(d) | 1.34%(d) | |||||
| Portfolio turnover rate | 34% | 86% | 53% | 56%(e) | 50%(e) | 22% | |||||
| Net assets at end of period (in 000’s) | $ 1,085 | $ 983 | $ 1,047 | $ 934 | $ 7,232 | $ 6,657 | |||||
| * | Unaudited. |
| ‡ | Less than one cent per share. |
| †† | Annualized. |
| (a) | Per share data based on average shares outstanding during the period. |
| (b) | Total investment return is calculated exclusive of sales charges and assumes the reinvestment of dividends and distributions. Class R2 shares are not subject to sales charges. For periods of less than one year, total return is not annualized. |
| (c) | In addition to the fees and expenses which the Fund bears directly, it also indirectly bears a pro-rata share of the fees and expenses of the underlying funds in which it invests. Such indirect expenses are not included in the above expense ratios. |
| (d) | The expense ratios presented below show the impact of short sales expense: |
| Period Ended | Net Expenses (excluding short sale expenses) | Short Sales Expenses | ||
| October 31, 2021 | 1.14% | 0.03% | ||
| October 31, 2020 | 1.18% | 0.11% | ||
| October 31, 2019 | 1.17% | 0.20% | ||
| October 31, 2018 | 1.14% | 0.20% |
| (e) | The portfolio turnover rate not including mortgage dollar rolls was 53% and 44% for the years ended October 31, 2020 and 2019, respectively. |
| 36 | MainStay MacKay Strategic Bond Fund |
| Six months ended April 30, 2023* | Year Ended October 31, | ||||||||||
| Class R3 | 2022 | 2021 | 2020 | 2019 | 2018 | ||||||
| Net asset value at beginning of period | $ 7.94 | $ 9.10 | $ 8.80 | $ 8.74 | $ 8.65 | $ 8.90 | |||||
| Net investment income (loss) (a) | 0.16 | 0.20 | 0.19 | 0.20 | 0.20 | 0.21 | |||||
| Net realized and unrealized gain (loss) | 0.35 | (1.18) | 0.27 | 0.05 | 0.11 | (0.22) | |||||
| Total from investment operations | 0.51 | (0.98) | 0.46 | 0.25 | 0.31 | (0.01) | |||||
| Less distributions: | |||||||||||
| From net investment income | (0.17) | (0.18) | (0.15) | (0.18) | (0.22) | (0.24) | |||||
| Return of capital | — | — | (0.01) | (0.01) | — | (0.00)‡ | |||||
| Total distributions | (0.17) | (0.18) | (0.16) | (0.19) | (0.22) | (0.24) | |||||
| Net asset value at end of period | $ 8.28 | $ 7.94 | $ 9.10 | $ 8.80 | $ 8.74 | $ 8.65 | |||||
| Total investment return (b) | 6.42% | (10.83)% | 5.21% | 2.90% | 3.63% | (0.09)% | |||||
| Ratios (to average net assets)/Supplemental Data: | |||||||||||
| Net investment income (loss) | 3.87%†† | 2.38% | 2.05% | 2.27% | 2.29% | 2.36% | |||||
| Net expenses (c) | 1.39%†† | 1.39% | 1.42%(d) | 1.52%(d) | 1.62%(d) | 1.60%(d) | |||||
| Portfolio turnover rate | 34% | 86% | 53% | 56%(e) | 50%(e) | 22% | |||||
| Net assets at end of period (in 000’s) | $ 554 | $ 501 | $ 619 | $ 276 | $ 218 | $ 190 | |||||
| * | Unaudited. |
| ‡ | Less than one cent per share. |
| †† | Annualized. |
| (a) | Per share data based on average shares outstanding during the period. |
| (b) | Total investment return is calculated exclusive of sales charges and assumes the reinvestment of dividends and distributions. Class R3 shares are not subject to sales charges. For periods of less than one year, total return is not annualized. |
| (c) | In addition to the fees and expenses which the Fund bears directly, it also indirectly bears a pro-rata share of the fees and expenses of the underlying funds in which it invests. Such indirect expenses are not included in the above expense ratios. |
| (d) | The expense ratios presented below show the impact of short sales expense: |
| Period Ended | Net Expenses (excluding short sale expenses) | Short Sales Expenses | ||
| October 31, 2021 | 1.39% | 0.03% | ||
| October 31, 2020 | 1.41% | 0.11% | ||
| October 31, 2019 | 1.42% | 0.20% | ||
| October 31, 2018 | 1.38% | 0.22% |
| (e) | The portfolio turnover rate not including mortgage dollar rolls was 53% and 44% for the years ended October 31, 2020 and 2019, respectively. |
| Six months ended April 30, 2023* | Year Ended October 31, | February 28, 2018^ through October 31, 2018 | |||||||||
| Class R6 | 2022 | 2021 | 2020 | 2019 | |||||||
| Net asset value at beginning of period | $ 7.97 | $ 9.14 | $ 8.84 | $ 8.75 | $ 8.66 | $ 8.83 | |||||
| Net investment income (loss) (a) | 0.19 | 0.27 | 0.26 | 0.25 | 0.27 | 0.19 | |||||
| Net realized and unrealized gain (loss) | 0.35 | (1.19) | 0.26 | 0.09 | 0.11 | (0.14) | |||||
| Total from investment operations | 0.54 | (0.92) | 0.52 | 0.34 | 0.38 | 0.05 | |||||
| Less distributions: | |||||||||||
| From net investment income | (0.20) | (0.25) | (0.21) | (0.24) | (0.29) | (0.22) | |||||
| Return of capital | — | — | (0.01) | (0.01) | — | (0.00)‡ | |||||
| Total distributions | (0.20) | (0.25) | (0.22) | (0.25) | (0.29) | (0.22) | |||||
| Net asset value at end of period | $ 8.31 | $ 7.97 | $ 9.14 | $ 8.84 | $ 8.75 | $ 8.66 | |||||
| Total investment return (b) | 6.77% | (10.23)% | 5.97% | 4.04% | 4.43% | 0.54% | |||||
| Ratios (to average net assets)/Supplemental Data: | |||||||||||
| Net investment income (loss) | 4.60%†† | 3.14% | 2.83% | 2.88% | 3.13% | 3.18%†† | |||||
| Net expenses (c) | 0.66%†† | 0.66% | 0.69%(d) | 0.82%(d) | 0.84%(d) | 0.85%††(d) | |||||
| Portfolio turnover rate | 34% | 86% | 53% | 56%(e) | 50%(e) | 22% | |||||
| Net assets at end of period (in 000’s) | $ 1,545 | $ 1,349 | $ 1,407 | $ 465 | $ 22,632 | $ 52,504 | |||||
| * | Unaudited. |
| ^ | Inception date. |
| ‡ | Less than one cent per share. |
| †† | Annualized. |
| (a) | Per share data based on average shares outstanding during the period. |
| (b) | Total investment return is calculated exclusive of sales charges and assumes the reinvestment of dividends and distributions. Class R6 shares are not subject to sales charges. For periods of less than one year, total return is not annualized. |
| (c) | In addition to the fees and expenses which the Fund bears directly, it also indirectly bears a pro-rata share of the fees and expenses of the underlying funds in which it invests. Such indirect expenses are not included in the above expense ratios. |
| (d) | The expense ratios presented below show the impact of short sales expense: |
| Six-month Period Ended | Net Expenses (excluding short sale expenses) | Short Sales Expenses | ||
| October 31, 2021 | 0.67% | 0.02% | ||
| October 31, 2020 | 0.66% | 0.16% | ||
| October 31, 2019 | 0.64% | 0.20% | ||
| October 31, 2018 | 0.62% | 0.23% |
| (e) | The portfolio turnover rate not including mortgage dollar rolls was 53% and 44% for the years ended October 31, 2020 and 2019, respectively. |
| 38 | MainStay MacKay Strategic Bond Fund |
| Class | Commenced Operations |
| Class A | February 28, 1997 |
| Investor Class | February 28, 2008 |
| Class B | February 28, 1997 |
| Class C | September 1, 1998 |
| Class I | January 2, 2004 |
| Class R2 | February 28, 2014 |
| Class R3 | February 29, 2016 |
| Class R6 | February 28, 2018 |
| • | Level 1—quoted prices (unadjusted) in active markets for an identical asset or liability |
| • | Level 2—other significant observable inputs (including quoted prices for a similar asset or liability in active markets, interest rates and yield curves, prepayment speeds, credit risk, etc.) |
| • | Level 3—significant unobservable inputs (including the Fund's own assumptions about the assumptions that market participants would use in measuring fair value of an asset or liability) |
| • Benchmark yields | • Reported trades |
| • Broker/dealer quotes | • Issuer spreads |
| • Two-sided markets | • Benchmark securities |
| • Bids/offers | • Reference data (corporate actions or material event notices) |
| • Industry and economic events | • Comparable bonds |
| • Monthly payment information |
| 40 | MainStay MacKay Strategic Bond Fund |
| 42 | MainStay MacKay Strategic Bond Fund |
| 44 | MainStay MacKay Strategic Bond Fund |
| Asset Derivatives | Interest Rate Contracts Risk | Total |
| Futures Contracts - Net Assets—Net unrealized appreciation on futures contracts (a) | $3,054,783 | $3,054,783 |
| Total Fair Value | $3,054,783 | $3,054,783 |
| (a) | Includes cumulative appreciation (depreciation) of futures contracts as reported in the Portfolio of Investments. Only current day’s variation margin is reported within the Statement of Assets and Liabilities. |
| Liability Derivatives | Interest Rate Contracts Risk | Total |
| Futures Contracts - Net Assets—Net unrealized depreciation on futures contracts (a) | $(2,974,755) | $(2,974,755) |
| Total Fair Value | $(2,974,755) | $(2,974,755) |
| (a) | Includes cumulative appreciation (depreciation) of futures contracts as reported in the Portfolio of Investments. Only current day’s variation margin is reported within the Statement of Assets and Liabilities. |
| Net Realized Gain (Loss) from: | Interest Rate Contracts Risk | Total |
| Futures Contracts | $ 900,095 | $ 900,095 |
| Swap Contracts | 492,299 | 492,299 |
| Total Net Realized Gain (Loss) | $1,392,394 | $1,392,394 |
| Net Change in Unrealized Appreciation (Depreciation) | Interest Rate Contracts Risk | Total |
| Futures Contracts | $ (805,732) | $ (805,732) |
| Swap Contracts | (564,729) | (564,729) |
| Total Net Change in Unrealized Appreciation (Depreciation) | $(1,370,461) | $(1,370,461) |
| 46 | MainStay MacKay Strategic Bond Fund |
| Average Notional Amount | Total |
| Futures Contracts Long | $ 81,200,487 |
| Futures Contracts Short | $(165,165,314) |
| Swap Contracts Long (a) | $ 81,000,000 |
| (a) | Positions were open for four months during the reporting period. |
| Class R2 | $515 |
| Class R3 | 265 |
| Class | Expense | Waived |
| Class A | $121,685 | $ — |
| Investor Class | 25,627 | (1,087) |
| Class B | 2,015 | (81) |
| Class C | 33,686 | (1,387) |
| Class I | 310,336 | — |
| Class R2 | 696 | — |
| Class R3 | 359 | — |
| Class R6 | 29 | — |
| Class I | $976,752 | 0.2% |
| Class R3 | 30,336 | 5.5 |
| Class R6 | 27,627 | 1.8 |
| Federal Tax Cost | Gross Unrealized Appreciation | Gross Unrealized (Depreciation) | Net Unrealized Appreciation/ (Depreciation) | |
| Investments in Securities | $730,782,425 | $4,634,251 | $(56,399,264) | $(51,765,013) |
| 48 | MainStay MacKay Strategic Bond Fund |
| Capital Loss Available Through | Short-Term Capital Loss Amounts (000’s) | Long-Term Capital Loss Amounts (000’s) |
| Unlimited | $23,746 | $145,627 |
| 2022 | |
| Distributions paid from: | |
| Ordinary Income | $18,558,300 |
| Class A | Shares | Amount |
| Six-month period ended April 30, 2023: | ||
| Shares sold | 1,681,416 | $ 13,784,855 |
| Shares issued to shareholders in reinvestment of distributions | 446,849 | 3,677,457 |
| Shares redeemed | (2,693,545) | (22,074,453) |
| Net increase (decrease) in shares outstanding before conversion | (565,280) | (4,612,141) |
| Shares converted into Class A (See Note 1) | 70,385 | 577,411 |
| Shares converted from Class A (See Note 1) | (11,278) | (92,892) |
| Net increase (decrease) | (506,173) | $ (4,127,622) |
| Year ended October 31, 2022: | ||
| Shares sold | 5,239,194 | $ 44,969,613 |
| Shares issued to shareholders in reinvestment of distributions | 516,644 | 4,347,022 |
| Shares redeemed | (4,555,605) | (38,840,159) |
| Net increase (decrease) in shares outstanding before conversion | 1,200,233 | 10,476,476 |
| Shares converted into Class A (See Note 1) | 194,631 | 1,666,342 |
| Shares converted from Class A (See Note 1) | (22,766) | (195,017) |
| Net increase (decrease) | 1,372,098 | $ 11,947,801 |
| Investor Class | Shares | Amount |
| Six-month period ended April 30, 2023: | ||
| Shares sold | 18,238 | $ 151,184 |
| Shares issued to shareholders in reinvestment of distributions | 34,528 | 286,721 |
| Shares redeemed | (111,472) | (926,701) |
| Net increase (decrease) in shares outstanding before conversion | (58,706) | (488,796) |
| Shares converted into Investor Class (See Note 1) | 40,275 | 334,025 |
| Shares converted from Investor Class (See Note 1) | (30,547) | (252,581) |
| Net increase (decrease) | (48,978) | $ (407,352) |
| Year ended October 31, 2022: | ||
| Shares sold | 72,504 | $ 632,849 |
| Shares issued to shareholders in reinvestment of distributions | 40,927 | 347,822 |
| Shares redeemed | (217,500) | (1,884,049) |
| Net increase (decrease) in shares outstanding before conversion | (104,069) | (903,378) |
| Shares converted into Investor Class (See Note 1) | 88,587 | 767,005 |
| Shares converted from Investor Class (See Note 1) | (100,049) | (872,203) |
| Net increase (decrease) | (115,531) | $ (1,008,576) |
| Class B | Shares | Amount |
| Six-month period ended April 30, 2023: | ||
| Shares sold | 170 | $ 1,394 |
| Shares issued to shareholders in reinvestment of distributions | 1,882 | 15,405 |
| Shares redeemed | (31,061) | (253,534) |
| Net increase (decrease) in shares outstanding before conversion | (29,009) | (236,735) |
| Shares converted from Class B (See Note 1) | (28,732) | (234,510) |
| Net increase (decrease) | (57,741) | $ (471,245) |
| Year ended October 31, 2022: | ||
| Shares sold | 11,822 | $ 106,766 |
| Shares issued to shareholders in reinvestment of distributions | 3,034 | 25,484 |
| Shares redeemed | (145,596) | (1,238,760) |
| Net increase (decrease) in shares outstanding before conversion | (130,740) | (1,106,510) |
| Shares converted from Class B (See Note 1) | (53,740) | (458,368) |
| Net increase (decrease) | (184,480) | $ (1,564,878) |
| Class C | Shares | Amount |
| Six-month period ended April 30, 2023: | ||
| Shares sold | 147,554 | $ 1,202,300 |
| Shares issued to shareholders in reinvestment of distributions | 36,965 | 302,190 |
| Shares redeemed | (799,734) | (6,522,554) |
| Net increase (decrease) in shares outstanding before conversion | (615,215) | (5,018,064) |
| Shares converted from Class C (See Note 1) | (54,787) | (447,883) |
| Net increase (decrease) | (670,002) | $ (5,465,947) |
| Year ended October 31, 2022: | ||
| Shares sold | 192,791 | $ 1,643,823 |
| Shares issued to shareholders in reinvestment of distributions | 55,328 | 463,896 |
| Shares redeemed | (2,628,674) | (22,246,426) |
| Net increase (decrease) in shares outstanding before conversion | (2,380,555) | (20,138,707) |
| Shares converted from Class C (See Note 1) | (126,672) | (1,073,171) |
| Net increase (decrease) | (2,507,227) | $ (21,211,878) |
| Class I | Shares | Amount |
| Six-month period ended April 30, 2023: | ||
| Shares sold | 13,488,905 | $ 110,693,961 |
| Shares issued to shareholders in reinvestment of distributions | 1,122,582 | 9,247,474 |
| Shares redeemed | (13,027,108) | (106,933,688) |
| Net increase (decrease) in shares outstanding before conversion | 1,584,379 | 13,007,747 |
| Shares converted into Class I (See Note 1) | 16,845 | 139,475 |
| Shares converted from Class I (See Note 1) | (2,768) | (23,045) |
| Net increase (decrease) | 1,598,456 | $ 13,124,177 |
| Year ended October 31, 2022: | ||
| Shares sold | 29,577,873 | $ 253,024,297 |
| Shares issued to shareholders in reinvestment of distributions | 1,323,433 | 11,171,084 |
| Shares redeemed | (25,595,708) | (216,538,337) |
| Net increase (decrease) in shares outstanding before conversion | 5,305,598 | 47,657,044 |
| Shares converted into Class I (See Note 1) | 23,007 | 197,262 |
| Shares converted from Class I (See Note 1) | (4,001) | (31,850) |
| Net increase (decrease) | 5,324,604 | $ 47,822,456 |
| 50 | MainStay MacKay Strategic Bond Fund |
| Class R2 | Shares | Amount |
| Six-month period ended April 30, 2023: | ||
| Shares sold | 7,629 | $ 62,998 |
| Shares issued to shareholders in reinvestment of distributions | 2,728 | 22,457 |
| Shares redeemed | (3,041) | (24,828) |
| Net increase (decrease) | 7,316 | $ 60,627 |
| Year ended October 31, 2022: | ||
| Shares sold | 13,401 | $ 116,403 |
| Shares issued to shareholders in reinvestment of distributions | 2,933 | 24,679 |
| Shares redeemed | (7,531) | (65,679) |
| Net increase (decrease) | 8,803 | $ 75,403 |
| Class R3 | Shares | Amount |
| Six-month period ended April 30, 2023: | ||
| Shares sold | 3,635 | $ 29,782 |
| Shares issued to shareholders in reinvestment of distributions | 767 | 6,318 |
| Shares redeemed | (462) | (3,738) |
| Net increase (decrease) | 3,940 | $ 32,362 |
| Year ended October 31, 2022: | ||
| Shares sold | 7,736 | $ 66,560 |
| Shares issued to shareholders in reinvestment of distributions | 874 | 7,363 |
| Shares redeemed | (13,572) | (114,643) |
| Net increase (decrease) | (4,962) | $ (40,720) |
| Class R6 | Shares | Amount |
| Six-month period ended April 30, 2023: | ||
| Shares sold | 32,460 | $ 268,889 |
| Shares issued to shareholders in reinvestment of distributions | 4,221 | 34,886 |
| Shares redeemed | (19,935) | (164,856) |
| Net increase (decrease) | 16,746 | $ 138,919 |
| Year ended October 31, 2022: | ||
| Shares sold | 82,311 | $ 700,590 |
| Shares issued to shareholders in reinvestment of distributions | 4,657 | 39,359 |
| Shares redeemed | (71,763) | (620,737) |
| Net increase (decrease) | 15,205 | $ 119,212 |
| 52 | MainStay MacKay Strategic Bond Fund |
| 54 | MainStay MacKay Strategic Bond Fund |
| 56 | MainStay MacKay Strategic Bond Fund |
| 58 | MainStay MacKay Strategic Bond Fund |
1.
| 2. | This Fund is registered for sale in CA, CT, DE, FL, MA, NJ, NY and VT. |
| 3. | An affiliate of New York Life Investment Management LLC. |
| 5022154MS043-23 | MSSB10-06/23 |
please log in to newyorklifeinvestments.com/accounts.
| Not FDIC/NCUA Insured | Not a Deposit | May Lose Value | No Bank Guarantee | Not Insured by Any Government Agency |


President

| Average Annual Total Returns for the Period-Ended April 30, 2023 | ||||||||
| Class | Sales Charge | Inception Date | Six Months1 | One Year | Five Years | Ten Years or Since Inception | Gross Expense Ratio2 | |
| Class A Shares3 | Maximum 3.00% Initial Sales Charge | With sales charges | 1/3/1995 | 4.90% | -2.49% | 0.93% | 1.95% | 0.75% |
| Excluding sales charges | 8.14 | 2.10 | 1.86 | 2.42 | 0.75 | |||
| Investor Class Shares4, 5 | Maximum 2.50% Initial Sales Charge | With sales charges | 2/28/2008 | 5.38 | -2.03 | 0.91 | 1.92 | 0.77 |
| Excluding sales charges | 8.08 | 2.06 | 1.85 | 2.39 | 0.77 | |||
| Class B Shares6 | Maximum 5.00% CDSC | With sales charges | 5/1/1986 | 2.99 | -3.13 | 1.23 | 2.15 | 1.02 |
| if Redeemed Within the First Six Years of Purchase | Excluding sales charges | 7.99 | 1.81 | 1.59 | 2.15 | 1.02 | ||
| Class C Shares | Maximum 1.00% CDSC | With sales charges | 9/1/1998 | 6.99 | 0.82 | 1.59 | 2.15 | 1.02 |
| if Redeemed Within One Year of Purchase | Excluding sales charges | 7.99 | 1.81 | 1.59 | 2.15 | 1.02 | ||
| Class C2 Shares | Maximum 1.00% CDSC | With sales charges | 8/31/2020 | 6.91 | 0.67 | N/A | -1.88 | 1.17 |
| if Redeemed Within One Year of Purchase | Excluding sales charges | 7.91 | 1.66 | N/A | -1.88 | 1.17 | ||
| Class I Shares | No Sales Charge | 12/21/2009 | 8.28 | 2.36 | 2.11 | 2.67 | 0.50 | |
| Class R6 Shares | No Sales Charge | 11/1/2019 | 8.29 | 2.41 | N/A | 0.34 | 0.44 | |
| 1. | Not annualized. |
| 2. | The gross expense ratios presented reflect the Fund’s “Total Annual Fund Operating Expenses” from the most recent Prospectus, as supplemented, and may differ from other expense ratios disclosed in this report. |
| 3. | Prior to August 10, 2022, the maximum initial sales charge was 4.50%, which is reflected in the applicable average annual total return figures shown. |
| 4. | Prior to June 30, 2020, the maximum initial sales charge was 4.50%, which is reflected in the applicable average annual total return figures shown. |
| 5. | Prior to August 10, 2022, the maximum initial sales charge was 4.00%, which is reflected in the applicable average annual total return figures shown. |
| 6. | Class B shares are closed to all new purchases as well as additional investments by existing Class B shareholders. |
| Benchmark Performance* | Six Months1 | One Year | Five Years | Ten Years |
| Bloomberg Municipal Bond Index2 | 7.65% | 2.87% | 2.06% | 2.25% |
| Morningstar Muni National Long Category Average3 | 8.56 | 1.30 | 1.59 | 2.03 |
| * | Returns for indices reflect no deductions for fees, expenses or taxes, except for foreign withholding taxes where applicable. Results assume reinvestment of all dividends and capital gains. An investment cannot be made directly in an index. |
| 1. | Not annualized. |
| 2. | The Bloomberg Municipal Bond Index is the Fund's primary broad-based securities market index for comparison purposes. The Bloomberg Municipal Bond Index is considered representative of the broad market for investment-grade, tax-exempt bonds with a maturity of at least one year. Bonds subject to the alternative minimum tax or with floating or zero coupons are excluded. |
| 3. | The Morningstar Muni National Long Category Average is representative of funds that invest in bonds issued by various state and local governments to fund public projects. The income from these bonds is generally free from federal taxes. These funds have durations of more than 7 years. Results are based on average total returns of similar funds with all dividends and capital gain distributions reinvested. |
| 6 | MainStay MacKay Tax Free Bond Fund |
| Share Class | Beginning Account Value 11/1/22 | Ending Account Value (Based on Actual Returns and Expenses) 4/30/23 | Expenses Paid During Period1 | Ending Account Value (Based on Hypothetical 5% Annualized Return and Actual Expenses) 4/30/23 | Expenses Paid During Period1 | Net Expense Ratio During Period2 |
| Class A Shares | $1,000.00 | $1,081.40 | $3.82 | $1,021.13 | $3.71 | 0.74% |
| Investor Class Shares | $1,000.00 | $1,080.80 | $4.02 | $1,020.93 | $3.91 | 0.78% |
| Class B Shares | $1,000.00 | $1,079.90 | $5.31 | $1,019.69 | $5.16 | 1.03% |
| Class C Shares | $1,000.00 | $1,079.90 | $5.31 | $1,019.69 | $5.16 | 1.03% |
| Class C2 Shares | $1,000.00 | $1,079.10 | $6.08 | $1,018.94 | $5.91 | 1.18% |
| Class I Shares | $1,000.00 | $1,082.80 | $2.53 | $1,022.37 | $2.46 | 0.49% |
| Class R6 Shares | $1,000.00 | $1,082.90 | $2.27 | $1,022.61 | $2.21 | 0.44% |
| 1. | Expenses are equal to the Fund’s annualized expense ratio of each class multiplied by the average account value over the period, divided by 365 and multiplied by 181 (to reflect the six-month period). The table above represents the actual expenses incurred during the six-month period. In addition to the fees and expenses which the Fund bears directly, it also indirectly bears a pro rata share of the fees and expenses of the underlying funds in which it invests. Such indirect expenses are not included in the above-reported expense figures. |
| 2. | Expenses are equal to the Fund's annualized expense ratio to reflect the six-month period. |
| New York | 16.8% |
| California | 16.7 |
| Texas | 9.1 |
| Illinois | 8.1 |
| Florida | 6.6 |
| Georgia | 4.1 |
| New Jersey | 3.8 |
| Massachusetts | 2.9 |
| Utah | 2.6 |
| Pennsylvania | 2.5 |
| District of Columbia | 2.3 |
| Colorado | 2.2 |
| Washington | 2.1 |
| Alabama | 1.7 |
| Ohio | 1.6 |
| Michigan | 1.6 |
| Nevada | 1.5 |
| South Carolina | 1.5 |
| Nebraska | 1.4 |
| Connecticut | 1.1 |
| Maryland | 1.1 |
| U.S. Virgin Islands | 1.0 |
| Kentucky | 0.9 |
| Indiana | 0.8 |
| Tennessee | 0.7 |
| Virginia | 0.6 |
| Arizona | 0.5 |
| Montana | 0.5 |
| Hawaii | 0.5% |
| Wisconsin | 0.5 |
| Minnesota | 0.4 |
| Puerto Rico | 0.3 |
| Missouri | 0.3 |
| Oregon | 0.3 |
| Arkansas | 0.3 |
| Guam | 0.2 |
| New Mexico | 0.2 |
| Iowa | 0.2 |
| Oklahoma | 0.2 |
| New Hampshire | 0.2 |
| Vermont | 0.2 |
| Alaska | 0.1 |
| Kansas | 0.1 |
| Idaho | 0.1 |
| Louisiana | 0.1 |
| South Dakota | 0.1 |
| North Carolina | 0.1 |
| Wyoming | 0.1 |
| Mississippi | 0.0‡ |
| Rhode Island | 0.0‡ |
| Delaware | 0.0‡ |
| Maine | 0.0‡ |
| Short–Term Investment | 0.2 |
| Other Assets, Less Liabilities | –1.0 |
| 100.0% |
| ‡ | Less than one–tenth of a percent. |
| 1. | State of California, 3.00%-5.25%, due 11/1/28–9/1/52 |
| 2. | New York State Dormitory Authority, 3.00%-5.75%, due 7/1/27–3/15/46 |
| 3. | Triborough Bridge & Tunnel Authority, 3.00%-5.50%, due 1/1/32–5/15/52 |
| 4. | New York City Transitional Finance Authority, 3.75%-5.50%, due 5/1/32–2/1/46 |
| 5. | Port Authority of New York & New Jersey, 4.00%-5.50%, due 9/1/27–8/1/52 |
| 6. | Metropolitan Transportation Authority, 3.773%-5.25%, due 11/15/26–11/15/49 |
| 7. | Commonwealth of Massachusetts, 3.00%-5.00%, due 7/1/30–10/1/52 |
| 8. | New Jersey Transportation Trust Fund Authority, (zero coupon)-5.754%, due 12/15/26–6/15/46 |
| 9. | State of Illinois, 4.00%-6.875%, due 11/1/23–3/1/47 |
| 10. | New York City Municipal Water Finance Authority, 3.00%-5.25%, due 6/15/28–6/15/52 |
| 8 | MainStay MacKay Tax Free Bond Fund |
| 1. | See "Investment and Performance Comparison" for other share class returns, which may be higher or lower than Class I share returns, and for more information on benchmark and peer group returns. |
| 2. | An obligation rated ‘AA’ by Standard & Poor’s (“S&P”) is deemed by S&P to differ from the highest-rated obligations only to a small degree. In the opinion of S&P, the obligor's capacity to meet its financial commitment on the obligation is very strong. When applied to Fund holdings, ratings are based solely on the creditworthiness of the bonds in the portfolio and are not meant to represent the security or safety of the Fund. |
| 3. | An obligation rated ‘A’ by S&P is deemed by S&P to be somewhat more susceptible to the adverse effects of changes in circumstances and economic conditions than obligations in higher-rated categories. In the opinion of S&P, however, the obligor's capacity to meet its financial commitment on the obligation is still strong. An obligation rated ‘BBB’ by S&P is deemed by S&P to exhibit adequate protection parameters. In the opinion of S&P, however, adverse economic conditions or changing circumstances are more likely to lead to a weakened capacity of the obligor to meet its financial commitment on the obligation. When applied to Fund holdings, ratings are based solely on the creditworthiness of the bonds in the portfolio and are not meant to represent the security or safety of the Fund. |
| 4. | Duration is a measure of the price sensitivity of a fixed-income investment to changes in interest rates. Duration is expressed as a number of years and is considered a more accurate sensitivity gauge than average maturity. |
| 5. | Modified duration is inversely related to the approximate percentage change in price for a given change in yield. Duration to worst is the duration of a bond computed using the bond’s nearest call date or maturity, whichever comes first. This measure ignores future cash flow fluctuations due to embedded optionality. |
| 6. | An obligation rated ‘AAA’ has the highest rating assigned by S&P, and in the opinion of S&P, the obligor’s capacity to meet its financial commitment on the obligation is extremely strong. When applied to Fund holdings, ratings are based solely on the creditworthiness of the bonds in the portfolio and are not meant to represent the security or safety of the Fund. |
| 10 | MainStay MacKay Tax Free Bond Fund |
| Principal Amount | Value | |
| Municipal Bonds 100.8% | ||
| Long-Term Municipal Bonds 93.5% | ||
| Alabama 1.2% | ||
| Black Belt Energy Gas District, Gas Project No.6, Revenue Bonds | ||
| Series B | ||
| 4.00%, due 10/1/52 (a) | $ 15,060,000 | $ 15,021,332 |
| Black Belt Energy Gas District, Gas Project No.7, Revenue Bonds | ||
| Series C-1 | ||
| 4.00%, due 10/1/52 (a) | 16,495,000 | 16,452,647 |
| Black Belt Energy Gas District, Revenue Bonds | ||
| Series B-1 | ||
| 4.00%, due 4/1/53 (a) | 12,750,000 | 12,703,501 |
| County of Jefferson, Sewer, Revenue Bonds, Sub. Lien | ||
| Series D | ||
| 6.00%, due 10/1/42 | 4,910,000 | 5,192,734 |
| Lower Alabama Gas District (The), Gas Project, Project No. 2, Revenue Bonds | ||
| 4.00%, due 12/1/50 (a) | 750,000 | 750,080 |
| Lower Alabama Gas District (The), Revenue Bonds | ||
| Series A | ||
| 5.00%, due 9/1/46 | 20,795,000 | 21,382,571 |
| Southeast Energy Authority, A Cooperative District, Project No. 1, Revenue Bonds | ||
| Series A | ||
| 4.00%, due 11/1/51 (a) | 6,600,000 | 6,563,907 |
| Southeast Energy Authority, A Cooperative District, Project No. 2, Revenue Bonds | ||
| Series B | ||
| 4.00%, due 12/1/51 (a) | 14,815,000 | 14,705,048 |
| Southeast Energy Authority, A Cooperative District, Project No. 4, Revenue Bonds | ||
| Series B-1 | ||
| 5.00%, due 5/1/53 (a) | 3,405,000 | 3,549,715 |
| 96,321,535 | ||
| Principal Amount | Value | |
| Alaska 0.1% | ||
| Alaska Housing Finance Corp., General Mortgage, Revenue Bonds | ||
| Series C-II, Insured: GNMA / FNMA / FHLMC | ||
| 5.75%, due 12/1/52 | $ 6,375,000 | $ 6,894,717 |
| Alaska Industrial Development & Export Authority, Greater Fairbanks Community Hospital Foundation Obligated Group, Revenue Bonds | ||
| 5.00%, due 4/1/32 | 3,050,000 | 3,055,739 |
| 9,950,456 | ||
| Arizona 0.5% | ||
| Arizona Board of Regents, Arizona State University, Revenue Bonds | ||
| Series A | ||
| 5.50%, due 7/1/48 (b) | 8,500,000 | 9,785,893 |
| Arizona Department of Transportation, State Highway Fund, Revenue Bonds | ||
| 5.00%, due 7/1/31 | 8,500,000 | 8,680,844 |
| Arizona Industrial Development Authority, Provident Group, NCCU Properties LLC, Central University Project, Revenue Bonds | ||
| Series A, Insured: BAM | ||
| 4.00%, due 6/1/44 | 570,000 | 561,281 |
| City of Phoenix, Unlimited General Obligation | ||
| 5.00%, due 7/1/26 | 3,250,000 | 3,482,041 |
| City of Phoenix Civic Improvement Corp., Airport, Revenue Bonds, Junior Lien | ||
| Series D | ||
| 5.00%, due 7/1/37 | 5,000,000 | 5,287,344 |
| City of Phoenix Civic Improvement Corp., Water System, Revenue Bonds, Junior Lien | ||
| Series A | ||
| 5.00%, due 7/1/44 | 10,180,000 | 11,180,990 |
| 38,978,393 | ||
| Arkansas 0.3% | ||
| Little Rock School District, Limited General Obligation | ||
| Series A, Insured: BAM State Aid Withholding | ||
| 3.00%, due 2/1/46 | 15,230,000 | 12,066,508 |
| Principal Amount | Value | |
| Long-Term Municipal Bonds (continued) | ||
| Arkansas (continued) | ||
| Little Rock School District, Limited General Obligation (continued) | ||
| Series A, Insured: BAM State Aid Withholding | ||
| 3.00%, due 2/1/50 | $ 6,450,000 | $ 4,954,264 |
| Series A, Insured: BAM State Aid Withholding | ||
| 3.00%, due 2/1/51 | 6,250,000 | 4,767,891 |
| State of Arkansas, Unlimited General Obligation | ||
| 3.00%, due 10/1/24 | 2,000,000 | 1,999,950 |
| University of Arkansas, UALR Campus, Revenue Bonds | ||
| 5.00%, due 10/1/31 | 1,205,000 | 1,271,389 |
| 25,060,002 | ||
| California 15.6% | ||
| Alameda Corridor Transportation Authority, Revenue Bonds | ||
| Series C, Insured: AGM | ||
| 5.00%, due 10/1/52 | 4,750,000 | 5,167,231 |
| Anaheim City School District, Election of 2010, Unlimited General Obligation | ||
| Insured: AGM | ||
| 5.00%, due 8/1/51 | 9,000,000 | 9,980,793 |
| Antelope Valley Community College District, Election of 2016, Unlimited General Obligation | ||
| Series B | ||
| 3.00%, due 8/1/50 | 3,750,000 | 2,870,492 |
| Bay Area Toll Authority, Revenue Bonds | ||
| Series F-1 | ||
| 5.25%, due 4/1/54 | 17,500,000 | 19,904,059 |
| Cabrillo Unified School District, Election of 2018, Unlimited General Obligation | ||
| Series B, Insured: AGM-CR | ||
| 5.00%, due 8/1/50 | 4,105,000 | 4,368,352 |
| California Community Choice Financing Authority, Clean Energy Project, Green Bond, Revenue Bonds | ||
| Series B-1 | ||
| 4.00%, due 2/1/52 (a) | 4,245,000 | 4,284,350 |
| Principal Amount | Value | |
| California (continued) | ||
| California Community Choice Financing Authority, Clean Energy Project, Revenue Bonds (a) | ||
| Series A-1 | ||
| 4.00%, due 5/1/53 | $ 4,555,000 | $ 4,603,429 |
| Series C | ||
| 5.25%, due 1/1/54 | 12,325,000 | 12,875,479 |
| California Health Facilities Financing Authority, CommonSpirit Health, Revenue Bonds | ||
| Series A | ||
| 3.00%, due 4/1/44 | 2,075,000 | 1,635,932 |
| Series A | ||
| 4.00%, due 4/1/49 | 5,000,000 | 4,667,019 |
| California Health Facilities Financing Authority, Stanford Health Care Obligated Group, Revenue Bonds | ||
| 4.00%, due 8/15/50 | 5,875,000 | 5,841,384 |
| California Health Facilities Financing Authority, Cedars-Sinai Medical Center Obligated Group, Revenue Bonds | ||
| Series A | ||
| 5.00%, due 8/15/41 | 9,000,000 | 9,978,406 |
| California Infrastructure & Economic Development Bank, Revenue Bonds | ||
| 4.00%, due 10/1/42 | 14,000,000 | 14,284,351 |
| California Infrastructure & Economic Development Bank, California State Teachers' Retirement System, Revenue Bonds | ||
| 5.00%, due 8/1/49 | 8,450,000 | 9,050,105 |
| California Municipal Finance Authority, Community Health System, Revenue Bonds | ||
| Series A, Insured: AGM-CR | ||
| 4.00%, due 2/1/41 | 2,500,000 | 2,481,696 |
| California Municipal Finance Authority, Southern California Institute of Architecture Project, Revenue Bonds | ||
| 5.00%, due 12/1/28 | 520,000 | 543,525 |
| California Municipal Finance Authority, CHF-Davis I LLC, West Village Student Housing Project, Revenue Bonds | ||
| 5.00%, due 5/15/32 | 1,570,000 | 1,674,543 |
| 12 | MainStay MacKay Tax Free Bond Fund |
| Principal Amount | Value | |
| Long-Term Municipal Bonds (continued) | ||
| California (continued) | ||
| California Municipal Finance Authority, CHF-Davis I LLC, West Village Student Housing Project, Revenue Bonds (continued) | ||
| Insured: BAM | ||
| 5.00%, due 5/15/36 | $ 3,400,000 | $ 3,645,480 |
| Insured: BAM | ||
| 5.00%, due 5/15/39 | 8,215,000 | 8,698,523 |
| California Public Finance Authority, Hoag Memorial Hospital Presbyterian, Revenue Bonds | ||
| Series A | ||
| 4.00%, due 7/15/51 | 19,075,000 | 18,778,567 |
| California State University, Systemwide, Revenue Bonds | ||
| Series C | ||
| 4.00%, due 11/1/45 | 9,500,000 | 9,355,767 |
| Series A | ||
| 5.00%, due 11/1/47 | 9,725,000 | 10,296,708 |
| Series A | ||
| 5.00%, due 11/1/48 | 12,895,000 | 13,896,743 |
| Carlsbad Unified School District, Election of 2018, Unlimited General Obligation | ||
| Series B | ||
| 3.00%, due 8/1/46 | 2,725,000 | 2,187,294 |
| Center Joint Unified School District, Election of 2008, Unlimited General Obligation | ||
| Series B, Insured: BAM | ||
| 3.00%, due 8/1/51 | 4,750,000 | 3,611,313 |
| City & County of San Francisco, Certificate of Participation | ||
| Series A | ||
| 4.00%, due 4/1/38 | 3,760,000 | 3,848,777 |
| City & County of San Francisco, South Van Ness Project, Certificate of Participation | ||
| Series A | ||
| 4.00%, due 4/1/43 | 4,250,000 | 4,257,565 |
| City of Escondido, Unlimited General Obligation | ||
| 5.00%, due 9/1/36 | 4,000,000 | 4,187,057 |
| City of Long Beach, Harbor, Revenue Bonds | ||
| Series A | ||
| 5.00%, due 5/15/44 | 7,070,000 | 7,674,897 |
| Principal Amount | Value | |
| California (continued) | ||
| City of Los Angeles, Department of Airports, Revenue Bonds (c) | ||
| Series D | ||
| 3.00%, due 5/15/39 | $ 170,000 | $ 168,966 |
| Series D | ||
| 3.00%, due 5/15/39 | 3,860,000 | 3,317,768 |
| Series D | ||
| 4.00%, due 5/15/40 | 2,200,000 | 2,159,962 |
| Series A | ||
| 5.00%, due 5/15/44 | 3,535,000 | 3,655,791 |
| 5.00%, due 5/15/49 | 8,450,000 | 8,997,554 |
| City of Los Angeles, Department of Airports, Revenue Bonds, Senior Lien | ||
| Series A | ||
| 4.75%, due 5/15/40 (c) | 6,000,000 | 6,026,458 |
| Series A | ||
| 5.00%, due 5/15/33 (c) | 3,330,000 | 3,424,787 |
| Series C | ||
| 5.00%, due 5/15/45 (c) | 3,250,000 | 3,425,546 |
| Series I | ||
| 5.00%, due 5/15/48 | 5,800,000 | 6,433,940 |
| Series H | ||
| 5.25%, due 5/15/47 (c) | 8,150,000 | 8,786,240 |
| Series G | ||
| 5.50%, due 5/15/36 (c) | 15,175,000 | 17,504,592 |
| Series G | ||
| 5.50%, due 5/15/37 (c) | 3,500,000 | 4,003,123 |
| Series G | ||
| 5.50%, due 5/15/40 (c) | 6,700,000 | 7,549,651 |
| City of Los Angeles, Wastewater System, Revenue Bonds | ||
| Series A | ||
| 5.00%, due 6/1/43 | 3,000,000 | 3,002,195 |
| Series A | ||
| 5.00%, due 6/1/48 | 8,550,000 | 9,151,399 |
| City of Sacramento, Transient Occupancy Tax, Revenue Bonds | ||
| Series A | ||
| 5.00%, due 6/1/30 | 3,920,000 | 4,315,218 |
| Series A | ||
| 5.00%, due 6/1/32 | 2,010,000 | 2,210,117 |
| Series A | ||
| 5.00%, due 6/1/33 | 1,225,000 | 1,345,670 |
| City of San Jose, Unlimited General Obligation | ||
| Series A | ||
| 5.00%, due 9/1/45 | 6,150,000 | 6,782,114 |
| Principal Amount | Value | |
| Long-Term Municipal Bonds (continued) | ||
| California (continued) | ||
| City of San Jose, Unlimited General Obligation (continued) | ||
| Series A | ||
| 5.00%, due 9/1/46 | $ 6,300,000 | $ 6,929,856 |
| Coachella Valley Unified School District, Election 2005, Unlimited General Obligation | ||
| Series F, Insured: BAM | ||
| 5.00%, due 8/1/46 | 12,180,000 | 12,778,720 |
| Compton Community Redevelopment Agency, Successor Agency, Tax Allocation | ||
| Series A, Insured: AGM | ||
| 5.00%, due 8/1/26 | 5,500,000 | 5,877,901 |
| Corona-Norco Unified School District, Election 2014, Unlimited General Obligation | ||
| Series C | ||
| 4.00%, due 8/1/49 | 7,650,000 | 7,495,257 |
| Cotati-Rohnert Park Unified School District, Election 2016, Unlimited General Obligation | ||
| Series C, Insured: AGM | ||
| 5.00%, due 8/1/42 | 2,365,000 | 2,476,450 |
| Desert Sands Unified School District, Unlimited General Obligation | ||
| 5.00%, due 8/1/40 | 3,250,000 | 3,492,480 |
| El Camino Community College District Foundation (The), Election of 2002, Unlimited General Obligation | ||
| Series C | ||
| (zero coupon), due 8/1/38 | 11,750,000 | 6,684,177 |
| Evergreen School District, Election of 2014, Unlimited General Obligation | ||
| 4.00%, due 8/1/41 | 3,750,000 | 3,758,879 |
| Fontana Public Facilities Financing Authority, City of Fontana, Revenue Bonds | ||
| Series A, Insured: BAM | ||
| 5.00%, due 9/1/32 | 1,320,000 | 1,348,909 |
| Fresno Unified School District, Unlimited General Obligation | ||
| Series B | ||
| 3.00%, due 8/1/43 | 7,500,000 | 6,248,638 |
| Principal Amount | Value | |
| California (continued) | ||
| Grossmont-Cuyamaca Community College District, Election of 2012, Unlimited General Obligation | ||
| Series B | ||
| 4.00%, due 8/1/47 | $ 5,750,000 | $ 5,740,034 |
| Irvine Facilities Financing Authority, Community Facilities District No. 2013-3, Special Tax | ||
| Series A, Insured: BAM | ||
| 5.00%, due 9/1/48 | 18,000,000 | 19,964,282 |
| Jurupa Unified School District, Election 2014, Unlimited General Obligation | ||
| Series C | ||
| 5.25%, due 8/1/43 | 4,450,000 | 4,890,964 |
| Live Oak Elementary School District, Certificate of Participation | ||
| Insured: AGM | ||
| 5.00%, due 8/1/39 | 2,455,000 | 2,589,340 |
| Long Beach Unified School District, Unlimited General Obligation | ||
| Series D-1 | ||
| (zero coupon), due 8/1/30 | 4,450,000 | 3,372,775 |
| Los Angeles Community College District, Unlimited General Obligation | ||
| 0.444%, due 8/1/23 | 3,785,000 | 3,741,121 |
| Los Angeles County Metropolitan Transportation Authority, Sales Tax, Revenue Bonds | ||
| Series A | ||
| 4.00%, due 6/1/36 | 4,750,000 | 5,093,093 |
| Los Angeles County Metropolitan Transportation Authority, Sales Tax, Revenue Bonds, Senior Lien | ||
| Series B | ||
| 5.00%, due 7/1/36 | 4,750,000 | 4,762,699 |
| Los Angeles County Public Works Financing Authority, Revenue Bonds | ||
| Series E-1 | ||
| 5.00%, due 12/1/44 | 3,325,000 | 3,640,552 |
| Los Angeles Department of Water & Power, Revenue Bonds | ||
| Series B | ||
| 5.00%, due 7/1/30 | 5,750,000 | 5,765,850 |
| Series B | ||
| 5.00%, due 7/1/33 | 5,250,000 | 5,262,466 |
| 14 | MainStay MacKay Tax Free Bond Fund |
| Principal Amount | Value | |
| Long-Term Municipal Bonds (continued) | ||
| California (continued) | ||
| Los Angeles Unified School District, Unlimited General Obligation | ||
| Series C | ||
| 4.00%, due 7/1/33 | $ 2,750,000 | $ 3,002,383 |
| Series C | ||
| 4.00%, due 7/1/38 | 5,750,000 | 5,920,109 |
| Series A | ||
| 5.00%, due 7/1/32 | 7,080,000 | 8,269,269 |
| Series A | ||
| 5.00%, due 7/1/33 | 7,620,000 | 8,886,815 |
| Los Angeles Unified School District, Election of 2008, Unlimited General Obligation | ||
| Series B-1, Insured: AGM-CR | ||
| 5.25%, due 7/1/42 | 41,155,000 | 44,946,203 |
| Moreno Valley Unified School District, Election 2014, Unlimited General Obligation | ||
| Series C, Insured: BAM | ||
| 3.00%, due 8/1/46 | 4,750,000 | 3,799,058 |
| Murrieta Valley Unified School District, Election of 2014, Unlimited General Obligation | ||
| 5.25%, due 9/1/51 | 9,700,000 | 10,833,609 |
| Napa Valley Community College District, Unlimited General Obligation | ||
| 4.00%, due 8/1/29 | 5,250,000 | 5,457,107 |
| 4.00%, due 8/1/32 | 5,250,000 | 5,425,769 |
| North Lake Tahoe Public Financing Authority, Health & Human Services Center, Revenue Bonds | ||
| 4.50%, due 12/1/52 | 4,395,000 | 4,543,199 |
| Oakland Unified School District, Alameda County, Unlimited General Obligation | ||
| Insured: AGM | ||
| 5.00%, due 8/1/27 | 1,160,000 | 1,219,674 |
| Insured: AGM | ||
| 5.00%, due 8/1/28 | 1,755,000 | 1,843,893 |
| Insured: AGM | ||
| 5.00%, due 8/1/29 | 2,285,000 | 2,403,078 |
| Ocean View School District of Orange County, Unlimited General Obligation | ||
| Series C, Insured: AGM | ||
| 3.00%, due 8/1/47 | 4,250,000 | 3,351,382 |
| Principal Amount | Value | |
| California (continued) | ||
| Ontario Montclair School District, Election of 2016, Unlimited General Obligation | ||
| Series A | ||
| 5.00%, due 8/1/46 | $ 3,250,000 | $ 3,439,762 |
| Orange County Sanitation District, Revenue Bonds | ||
| Series A | ||
| 5.00%, due 2/1/30 | 8,500,000 | 8,723,519 |
| Oxnard School District, Unlimited General Obligation | ||
| Series A, Insured: BAM | ||
| 5.00%, due 8/1/41 | 10,855,000 | 11,567,835 |
| Palomar Community College District, Election of 2006, Unlimited General Obligation | ||
| Series D | ||
| 5.25%, due 8/1/45 | 10,000,000 | 10,705,765 |
| Paramount Unified School District, Election of 2006, Unlimited General Obligation | ||
| Insured: BAM | ||
| (zero coupon), due 8/1/43 | 22,090,000 | 5,695,595 |
| Peninsula Corridor Joint Powers Board, Green Bond, Revenue Bonds | ||
| Series A | ||
| 5.00%, due 6/1/47 | 3,000,000 | 3,308,910 |
| Peralta Community College District, Unlimited General Obligation | ||
| Series A | ||
| 4.00%, due 8/1/39 | 4,250,000 | 4,264,078 |
| Port of Los Angeles, Revenue Bonds | ||
| Series A | ||
| 5.00%, due 8/1/35 (c) | 2,575,000 | 2,630,662 |
| Richmond Joint Powers Financing Authority, Civic Center Project, Revenue Bonds | ||
| Series A, Insured: AGM | ||
| 5.00%, due 11/1/36 | 2,750,000 | 3,033,360 |
| Riverside County Transportation Commission, Sales Tax, Revenue Bonds | ||
| Series B | ||
| 4.00%, due 6/1/36 | 16,950,000 | 17,547,274 |
| Principal Amount | Value | |
| Long-Term Municipal Bonds (continued) | ||
| California (continued) | ||
| Sacramento Area Flood Control Agency, Consolidated Capital Assessment District No. 2, Special Assessment | ||
| Series A | ||
| 5.00%, due 10/1/36 | $ 3,195,000 | $ 3,415,940 |
| Series A | ||
| 5.00%, due 10/1/41 | 12,250,000 | 12,925,782 |
| Sacramento City Unified School District, Election of 2020, Unlimited General Obligation | ||
| Series A, Insured: BAM | ||
| 5.50%, due 8/1/47 | 8,840,000 | 9,906,033 |
| Series A, Insured: BAM | ||
| 5.50%, due 8/1/52 | 14,920,000 | 16,665,932 |
| Sacramento Municipal Utility District, Revenue Bonds | ||
| Series H | ||
| 4.00%, due 8/15/45 | 5,200,000 | 5,222,062 |
| San Bernardino City Unified School District, Election 2012, Unlimited General Obligation | ||
| Series A, Insured: AGM | ||
| 5.00%, due 8/1/30 | 950,000 | 954,123 |
| San Diego County Regional Airport Authority, Revenue Bonds | ||
| Series B | ||
| 5.00%, due 7/1/33 (c) | 4,990,000 | 5,575,649 |
| San Diego County Water Authority, Revenue Bonds | ||
| Series A | ||
| 5.00%, due 5/1/47 | 3,750,000 | 4,195,036 |
| San Diego Public Facilities Financing Authority, Capital Improvement Projects, Revenue Bonds | ||
| Series A | ||
| 5.00%, due 10/15/44 | 2,250,000 | 2,339,432 |
| San Diego Unified School District, Election of 2012, Unlimited General Obligation | ||
| Series M-2 | ||
| 3.00%, due 7/1/50 | 10,000,000 | 7,776,731 |
| Series F | ||
| 5.00%, due 7/1/40 | 5,100,000 | 5,284,825 |
| Series I | ||
| 5.00%, due 7/1/41 | 3,750,000 | 4,008,330 |
| Principal Amount | Value | |
| California (continued) | ||
| San Francisco Bay Area Rapid Transit District, Election of 2004, Unlimited General Obligation | ||
| Series F-1 | ||
| 3.00%, due 8/1/37 | $ 2,440,000 | $ 2,270,479 |
| San Francisco Bay Area Rapid Transit District, Election of 2016, Unlimited General Obligation | ||
| Series C-1 | ||
| 3.00%, due 8/1/50 | 3,750,000 | 2,884,332 |
| San Francisco City & County Airport Commission, San Francisco International Airport, Revenue Bonds, Second Series | ||
| Series A | ||
| 5.00%, due 5/1/34 (c) | 7,350,000 | 8,173,319 |
| San Francisco City & County Airport Commission, San Francisco International Airport, Revenue Bonds | ||
| Series A | ||
| 5.00%, due 5/1/49 (c) | 52,055,000 | 53,811,258 |
| San Joaquin Hills Transportation Corridor Agency, Revenue Bonds, Junior Lien | ||
| Series B | ||
| 5.25%, due 1/15/49 | 5,000,000 | 5,078,939 |
| San Jose Evergreen Community College District, Election of 2016, Unlimited General Obligation | ||
| Series B | ||
| 3.00%, due 9/1/41 | 1,065,000 | 917,599 |
| San Leandro Unified School District, Election of 2020, Unlimited General Obligation | ||
| Series B | ||
| 5.25%, due 8/1/48 | 10,900,000 | 12,361,113 |
| San Marcos Schools Financing Authority, San Marcos Unified School District, Revenue Bonds | ||
| Insured: AGM | ||
| 5.00%, due 8/15/34 | 1,000,000 | 1,091,061 |
| Insured: AGM | ||
| 5.00%, due 8/15/35 | 1,000,000 | 1,085,707 |
| Insured: AGM | ||
| 5.00%, due 8/15/36 | 1,100,000 | 1,187,683 |
| 16 | MainStay MacKay Tax Free Bond Fund |
| Principal Amount | Value | |
| Long-Term Municipal Bonds (continued) | ||
| California (continued) | ||
| San Mateo Union High School District, Capital Appreciation, Election of 2010, Unlimited General Obligation | ||
| Series A | ||
| (zero coupon), due 9/1/41 | $ 6,750,000 | $ 6,574,478 |
| Santa Ana Unified School District, Capital Appreciation, Election 2008, Unlimited General Obligation | ||
| Series B, Insured: AGC | ||
| (zero coupon), due 8/1/33 | 14,955,000 | 10,210,157 |
| Santa Monica Community College District, Unlimited General Obligation | ||
| Series A | ||
| 5.00%, due 8/1/43 | 7,000,000 | 7,572,316 |
| Silicon Valley Clean Water, Revenue Bonds | ||
| Series A | ||
| 0.25%, due 3/1/24 | 7,300,000 | 6,968,489 |
| Simi Valley Unified School District, Unlimited General Obligation | ||
| Series C | ||
| 4.00%, due 8/1/50 | 7,500,000 | 7,368,542 |
| Southern California Public Power Authority, Southern Transmissional System Renewal Project, Revenue Bonds (b) | ||
| Series A-1 | ||
| 5.00%, due 7/1/48 | 47,750,000 | 53,313,739 |
| Series A-1 | ||
| 5.25%, due 7/1/53 | 27,000,000 | 30,632,877 |
| State of California, Various Purpose, Unlimited General Obligation | ||
| 3.00%, due 10/1/36 | 5,810,000 | 5,444,353 |
| 3.00%, due 10/1/37 | 8,565,000 | 7,918,725 |
| 4.00%, due 11/1/35 | 2,200,000 | 2,287,185 |
| 4.00%, due 3/1/36 | 30,200,000 | 31,860,834 |
| 4.00%, due 10/1/36 | 3,150,000 | 3,299,843 |
| 4.00%, due 10/1/37 | 10,800,000 | 11,179,215 |
| 4.00%, due 10/1/39 | 5,775,000 | 5,909,385 |
| 4.00%, due 3/1/46 | 12,500,000 | 12,519,060 |
| 5.00%, due 11/1/28 | 7,500,000 | 7,572,906 |
| 5.00%, due 11/1/30 | 4,250,000 | 4,290,893 |
| 5.00%, due 10/1/31 | 4,250,000 | 5,072,798 |
| 5.00%, due 10/1/32 | 5,950,000 | 6,130,459 |
| Series B | ||
| 5.00%, due 11/1/32 | 30,350,000 | 36,853,516 |
| Principal Amount | Value | |
| California (continued) | ||
| State of California, Various Purpose, Unlimited General Obligation (continued) | ||
| 5.00%, due 9/1/41 | $ 3,150,000 | $ 3,557,224 |
| 5.00%, due 4/1/42 | 3,250,000 | 3,678,483 |
| 5.00%, due 9/1/42 | 33,200,000 | 37,751,763 |
| 5.00%, due 8/1/46 | 6,160,000 | 6,478,304 |
| 5.00%, due 4/1/47 | 4,605,000 | 5,143,296 |
| 5.00%, due 9/1/52 | 7,500,000 | 8,333,716 |
| 5.25%, due 10/1/39 | 4,635,000 | 4,910,430 |
| Stockton Unified School District, Unlimited General Obligation | ||
| Series A, Insured: AGM | ||
| 5.00%, due 8/1/42 | 4,400,000 | 4,455,659 |
| Sunnyvale School District, Election of 2013, Unlimited General Obligation | ||
| Series C | ||
| 3.00%, due 9/1/44 | 6,750,000 | 5,578,648 |
| Tahoe-Truckee Unified School District, Election 2014, Unlimited General Obligation | ||
| Series B | ||
| 5.00%, due 8/1/41 | 1,950,000 | 2,061,181 |
| Temecula Valley Unified School District, Election 2012, Unlimited General Obligation | ||
| Series D | ||
| 3.00%, due 8/1/47 | 6,250,000 | 4,973,263 |
| Twin Rivers Unified School District, Election 2006, Unlimited General Obligation | ||
| Series 2008, Insured: AGM | ||
| (zero coupon), due 8/1/32 | 4,370,000 | 3,124,863 |
| University of California, Revenue Bonds | ||
| Series AO | ||
| 3.25%, due 5/15/29 | 6,750,000 | 6,808,040 |
| Series I | ||
| 5.00%, due 5/15/31 | 5,025,000 | 5,265,062 |
| Series AI | ||
| 5.00%, due 5/15/33 | 20,250,000 | 20,262,861 |
| Series AM | ||
| 5.25%, due 5/15/30 | 2,000,000 | 2,047,844 |
| Series AZ | ||
| 5.25%, due 5/15/58 | 4,755,000 | 5,126,893 |
| Series BN | ||
| 5.50%, due 5/15/40 | 14,250,000 | 17,180,293 |
| Principal Amount | Value | |
| Long-Term Municipal Bonds (continued) | ||
| California (continued) | ||
| Val Verde Unified School District, Election of 2012, Unlimited General Obligation | ||
| Series F, Insured: AGM | ||
| 3.00%, due 8/1/47 | $ 8,910,000 | $ 6,962,350 |
| Val Verde Unified School District, Election of 2020, Unlimited General Obligation | ||
| Series B, Insured: AGM | ||
| 4.00%, due 8/1/51 | 6,960,000 | 6,727,207 |
| Victor Valley Community College District, Unlimited General Obligation | ||
| Series A | ||
| 4.00%, due 8/1/39 | 7,705,000 | 7,750,674 |
| Series A | ||
| 4.00%, due 8/1/44 | 5,250,000 | 5,260,647 |
| Vista Unified School District, Unlimited General Obligation | ||
| Series B, Insured: BAM | ||
| 5.25%, due 8/1/48 | 6,000,000 | 6,768,945 |
| Walnut Valley Unified School District, Election of 2016, Unlimited General Obligation | ||
| Series C | ||
| 5.00%, due 8/1/45 | 4,035,000 | 4,557,745 |
| Westminster School District, Election 2008, Unlimited General Obligation | ||
| Series B, Insured: BAM | ||
| (zero coupon), due 8/1/48 | 13,650,000 | 2,424,538 |
| Yosemite Community College District, Unlimited General Obligation | ||
| Series D | ||
| (zero coupon), due 8/1/42 | 17,500,000 | 13,741,136 |
| 1,240,685,879 | ||
| Colorado 2.2% | ||
| City & County of Denver, Airport System, Revenue Bonds | ||
| Series A | ||
| 5.00%, due 12/1/25 (c) | 4,370,000 | 4,537,387 |
| Series A | ||
| 5.00%, due 12/1/34 (c) | 6,000,000 | 6,846,211 |
| Series A | ||
| 5.00%, due 12/1/36 (c) | 12,115,000 | 12,821,010 |
| Series A | ||
| 5.00%, due 12/1/43 (c) | 10,940,000 | 11,343,626 |
| Principal Amount | Value | |
| Colorado (continued) | ||
| City & County of Denver, Airport System, Revenue Bonds (continued) | ||
| 5.00%, due 12/1/48 (c) | $ 3,790,000 | $ 3,890,544 |
| Series A | ||
| 5.50%, due 11/15/27 (c) | 6,000,000 | 6,053,442 |
| Series A | ||
| 5.50%, due 11/15/35 | 5,250,000 | 6,123,863 |
| Series A | ||
| 5.50%, due 11/15/38 (c) | 7,350,000 | 8,402,716 |
| Series A | ||
| 5.50%, due 11/15/40 (c) | 6,430,000 | 7,270,040 |
| Series D | ||
| 5.75%, due 11/15/38 (c) | 3,000,000 | 3,505,236 |
| Series D | ||
| 5.75%, due 11/15/45 (c) | 7,100,000 | 8,066,105 |
| City & County of Denver, Convention Center Expansion Project, Certificate of Participation | ||
| Series A | ||
| 5.375%, due 6/1/43 | 4,250,000 | 4,456,240 |
| City of Colorado Springs, Utilities System, Revenue Bonds | ||
| Series A-2 | ||
| 5.00%, due 11/15/44 | 2,750,000 | 2,800,069 |
| Series B | ||
| 5.00%, due 11/15/47 | 11,150,000 | 12,415,509 |
| Colorado Health Facilities Authority, Intermountain Healthcare Obligated Group, Revenue Bonds | ||
| Series B | ||
| 4.00%, due 1/1/40 | 5,445,000 | 5,457,429 |
| Denver City & County School District No. 1, Unlimited General Obligation | ||
| Insured: State Aid Withholding | ||
| 4.00%, due 12/1/31 | 6,000,000 | 6,191,177 |
| Denver Convention Center Hotel Authority, Revenue Bonds, Senior Lien | ||
| 5.00%, due 12/1/36 | 1,000,000 | 1,010,411 |
| Regional Transportation District, Certificate of Participation | ||
| Series A | ||
| 4.50%, due 6/1/44 | 8,275,000 | 8,282,193 |
| 18 | MainStay MacKay Tax Free Bond Fund |
| Principal Amount | Value | |
| Long-Term Municipal Bonds (continued) | ||
| Colorado (continued) | ||
| Regional Transportation District Sales Tax, Fastracks Project, Revenue Bonds | ||
| Series A | ||
| 5.00%, due 11/1/31 | $ 6,500,000 | $ 7,758,206 |
| State of Colorado, Certificate of Participation | ||
| Series N | ||
| 5.00%, due 3/15/37 | 4,230,000 | 4,557,593 |
| 6.00%, due 12/15/39 | 4,560,000 | 5,563,161 |
| 6.00%, due 12/15/40 | 5,025,000 | 6,093,711 |
| Vista Ridge Metropolitan District, Unlimited General Obligation | ||
| Series A, Insured: BAM | ||
| 5.00%, due 12/1/31 | 1,250,000 | 1,334,304 |
| Weld County School District No. 6, Greeley, Unlimited General Obligation | ||
| Insured: State Aid Withholding | ||
| 4.00%, due 12/1/45 | 3,250,000 | 3,202,869 |
| Weld County School District No. RE-4, Unlimited General Obligation | ||
| Insured: State Aid Withholding | ||
| 5.25%, due 12/1/41 | 8,250,000 | 8,689,427 |
| Insured: State Aid Withholding | ||
| 5.25%, due 12/1/47 | 14,150,000 | 16,046,772 |
| 172,719,251 | ||
| Connecticut 1.1% | ||
| City of Bridgeport, Unlimited General Obligation | ||
| Series D, Insured: AGM | ||
| 5.00%, due 8/15/33 | 2,340,000 | 2,499,601 |
| Series D, Insured: AGM | ||
| 5.00%, due 8/15/34 | 2,340,000 | 2,494,148 |
| Series D, Insured: AGM | ||
| 5.00%, due 8/15/35 | 2,590,000 | 2,750,004 |
| Series D, Insured: AGM | ||
| 5.00%, due 8/15/36 | 2,590,000 | 2,738,106 |
| City of Hartford, Unlimited General Obligation | ||
| Series A, Insured: State Guaranteed | ||
| 5.00%, due 4/1/28 | 2,250,000 | 2,253,307 |
| Series A, Insured: State Guaranteed | ||
| 5.00%, due 4/1/29 | 895,000 | 896,358 |
| Principal Amount | Value | |
| Connecticut (continued) | ||
| City of Hartford, Unlimited General Obligation (continued) | ||
| Series A, Insured: AGM State Guaranteed | ||
| 5.00%, due 4/1/32 | $ 195,000 | $ 195,306 |
| Series C, Insured: AGM State Guaranteed | ||
| 5.00%, due 7/15/32 | 6,370,000 | 6,692,032 |
| Series C, Insured: AGM State Guaranteed | ||
| 5.00%, due 7/15/34 | 2,250,000 | 2,359,203 |
| State of Connecticut, Unlimited General Obligation | ||
| Series A | ||
| 3.00%, due 1/15/37 | 6,420,000 | 5,877,565 |
| Series A | ||
| 4.00%, due 4/15/38 | 2,300,000 | 2,337,022 |
| Series F | ||
| 5.00%, due 9/15/28 | 6,610,000 | 7,426,999 |
| Series A | ||
| 5.00%, due 3/15/29 | 5,300,000 | 5,512,409 |
| Series C | ||
| 5.00%, due 6/15/33 | 1,775,000 | 1,975,893 |
| Series A | ||
| 5.00%, due 4/15/35 | 5,000,000 | 5,381,410 |
| State of Connecticut, Transportation Infrastructure, Special Tax, Revenue Bonds | ||
| Series A | ||
| 5.00%, due 9/1/30 | 4,000,000 | 4,110,074 |
| Series A, Insured: BAM | ||
| 5.00%, due 9/1/31 | 12,120,000 | 13,005,978 |
| Series A | ||
| 5.00%, due 9/1/33 | 10,950,000 | 11,709,321 |
| State of Connecticut Clean Water Fund, State Revolving Fund, Revenue Bonds | ||
| Series A | ||
| 5.00%, due 5/1/33 | 2,250,000 | 2,467,576 |
| University of Connecticut, Revenue Bonds | ||
| Series A | ||
| 5.00%, due 11/1/35 | 3,240,000 | 3,558,997 |
| 86,241,309 | ||
| Principal Amount | Value | |
| Long-Term Municipal Bonds (continued) | ||
| Delaware 0.0% ‡ | ||
| Delaware State Health Facilities Authority, Christiana Care Health System, Revenue Bonds | ||
| Series A | ||
| 5.00%, due 10/1/36 | $ 3,185,000 | $ 3,501,641 |
| District of Columbia 2.3% | ||
| District of Columbia, Unlimited General Obligation | ||
| Series D | ||
| 5.00%, due 6/1/32 | 3,500,000 | 3,567,957 |
| 5.00%, due 10/15/44 | 12,000,000 | 12,986,987 |
| Series A | ||
| 5.25%, due 1/1/48 | 13,850,000 | 15,752,674 |
| District of Columbia, Revenue Bonds | ||
| Series C | ||
| 5.00%, due 12/1/32 | 5,750,000 | 6,990,790 |
| Series A | ||
| 5.00%, due 7/1/36 | 7,675,000 | 8,978,771 |
| Series A | ||
| 5.50%, due 7/1/47 | 29,230,000 | 33,643,882 |
| Metropolitan Washington Airports Authority, Dulles Toll Road, Metrorail & Capital Improvement Project, Revenue Bonds, Senior Lien | ||
| Series A, Insured: AGM | ||
| 4.00%, due 10/1/52 | 20,435,000 | 19,684,833 |
| Series B | ||
| 6.50%, due 10/1/44 | 6,040,000 | 6,869,285 |
| Metropolitan Washington Airports Authority, Dulles Toll Road, Metrorail & Capital Improvement Project, Revenue Bonds, Second Lien | ||
| Series C, Insured: AGC | ||
| 6.50%, due 10/1/41 | 6,730,000 | 7,560,835 |
| Metropolitan Washington Airports Authority, Revenue Bonds (c) | ||
| Series A | ||
| 5.00%, due 10/1/26 | 2,150,000 | 2,160,193 |
| Series A | ||
| 5.00%, due 10/1/27 | 2,600,000 | 2,611,872 |
| Series A | ||
| 5.00%, due 10/1/28 | 10,450,000 | 10,629,211 |
| Principal Amount | Value | |
| District of Columbia (continued) | ||
| Metropolitan Washington Airports Authority, Revenue Bonds (c) (continued) | ||
| Series A | ||
| 5.00%, due 10/1/28 | $ 2,250,000 | $ 2,260,011 |
| Series A | ||
| 5.00%, due 10/1/29 | 21,500,000 | 21,864,569 |
| Series A | ||
| 5.00%, due 10/1/35 | 3,955,000 | 4,276,782 |
| Series A | ||
| 5.00%, due 10/1/36 | 3,750,000 | 4,111,322 |
| Washington Metropolitan Area Transit Authority, Green bond, Revenue Bonds | ||
| Series A, Insured: BAM | ||
| 3.00%, due 7/15/36 | 5,175,000 | 4,878,172 |
| Series A | ||
| 5.50%, due 7/15/51 | 13,275,000 | 15,285,724 |
| 184,113,870 | ||
| Florida 6.4% | ||
| City of Cape Coral, Water & Sewer, Revenue Bonds | ||
| Insured: BAM | ||
| 4.00%, due 10/1/42 | 11,900,000 | 11,736,856 |
| City of Gainesville, Utilities System, Revenue Bonds | ||
| Series A | ||
| 5.00%, due 10/1/47 | 13,170,000 | 14,004,535 |
| City of Miami, Beach Parking, Revenue Bonds | ||
| Insured: BAM | ||
| 5.00%, due 9/1/40 | 2,250,000 | 2,302,387 |
| City of Miami Beach, Water & Sewer, Revenue Bonds | ||
| 5.00%, due 9/1/47 | 12,300,000 | 12,886,570 |
| City of Orlando, Tourist Development Tax, Revenue Bonds, Third Lien | ||
| Series C, Insured: AGC | ||
| 5.50%, due 11/1/38 | 1,145,000 | 1,146,816 |
| City of South Miami, Miami Health Facilities Authority, Inc., Revenue Bonds | ||
| 5.00%, due 8/15/42 | 17,115,000 | 17,617,680 |
| City of Tampa, Revenue Bonds | ||
| Series C, Insured: BAM | ||
| 3.00%, due 10/1/36 | 4,440,000 | 4,161,187 |
| 20 | MainStay MacKay Tax Free Bond Fund |
| Principal Amount | Value | |
| Long-Term Municipal Bonds (continued) | ||
| Florida (continued) | ||
| County of Broward, Tourist Development Tax, Revenue Bonds | ||
| 4.00%, due 9/1/40 | $ 5,000,000 | $ 4,986,135 |
| County of Broward, Convention Center Hotel, Revenue Bonds, First Tier | ||
| 5.50%, due 1/1/55 | 23,700,000 | 26,463,100 |
| County of Lee, Airport, Revenue Bonds (c) | ||
| Series A | ||
| 5.00%, due 10/1/24 | 3,785,000 | 3,841,842 |
| Series A | ||
| 5.00%, due 10/1/30 | 8,030,000 | 8,918,679 |
| Series B | ||
| 5.00%, due 10/1/37 | 3,750,000 | 4,040,107 |
| Series B | ||
| 5.00%, due 10/1/46 | 4,750,000 | 4,963,059 |
| County of Miami-Dade, Water & Sewer System, Revenue Bonds | ||
| Insured: BAM | ||
| 3.00%, due 10/1/36 | 2,100,000 | 1,906,268 |
| Series B | ||
| 4.00%, due 10/1/38 | 5,150,000 | 5,200,498 |
| Series B, Insured: BAM | ||
| 4.00%, due 10/1/49 | 39,630,000 | 39,063,735 |
| Series B | ||
| 5.00%, due 10/1/33 | 4,250,000 | 4,398,230 |
| County of Miami-Dade, Transit System, Revenue Bonds | ||
| Series A | ||
| 4.00%, due 7/1/49 | 7,500,000 | 7,198,991 |
| 5.00%, due 7/1/45 | 14,120,000 | 15,491,257 |
| 5.00%, due 7/1/46 | 10,440,000 | 11,437,753 |
| 5.00%, due 7/1/48 | 4,965,000 | 5,395,323 |
| 5.00%, due 7/1/50 | 12,250,000 | 13,245,461 |
| County of Miami-Dade, Aviation, Revenue Bonds | ||
| Series A | ||
| 5.00%, due 10/1/38 (c) | 4,650,000 | 4,712,702 |
| County of Pasco, State of Florida Cigarette Tax Revenue, Revenue Bonds | ||
| Series A, Insured: AGM | ||
| 5.75%, due 9/1/54 | 17,500,000 | 19,470,600 |
| County of Sarasota, Utility System, Revenue Bonds | ||
| 5.25%, due 10/1/47 | 15,000,000 | 16,917,316 |
| Principal Amount | Value | |
| Florida (continued) | ||
| Greater Orlando Aviation Authority, Revenue Bonds | ||
| Series A | ||
| 5.00%, due 10/1/33 (c) | $ 1,205,000 | $ 1,318,296 |
| Hillsborough County Aviation Authority, Tampa International Airport, Revenue Bonds | ||
| Series A | ||
| 5.00%, due 10/1/47 (c) | 7,000,000 | 7,355,678 |
| Miami-Dade County Health Facilities Authority, Nicklaus Children's Hospital Project, Revenue Bonds | ||
| Series A, Insured: AGM-CR | ||
| 4.00%, due 8/1/46 | 5,160,000 | 5,108,108 |
| Series A, Insured: AGM-CR | ||
| 4.00%, due 8/1/51 | 19,750,000 | 19,121,109 |
| North Broward Hospital District, Revenue Bonds | ||
| Series B | ||
| 5.00%, due 1/1/42 | 6,500,000 | 6,670,247 |
| North Sumter County Utility Dependent District, Sumter Water Conservation Authority Project, Revenue Bonds | ||
| Insured: AGM | ||
| 5.00%, due 10/1/52 | 7,200,000 | 7,632,245 |
| Orange County Health Facilities Authority, Presbyterian Retirement Communities, Inc., Revenue Bonds | ||
| 5.00%, due 8/1/31 | 1,250,000 | 1,290,581 |
| Putnam County Development Authority, Seminole Electric Cooperative, Inc., Revenue Bonds | ||
| Series A | ||
| 5.00%, due 3/15/42 | 8,500,000 | 8,904,421 |
| School Board of Miami-Dade County (The), Unlimited General Obligation | ||
| Series A, Insured: BAM | ||
| 5.00%, due 3/15/35 | 6,060,000 | 7,084,284 |
| Series A, Insured: BAM | ||
| 5.00%, due 3/15/39 | 8,445,000 | 9,533,638 |
| Series A, Insured: BAM | ||
| 5.00%, due 3/15/40 | 8,510,000 | 9,565,549 |
| Series A, Insured: BAM | ||
| 5.00%, due 3/15/47 | 13,995,000 | 15,499,814 |
| Series A, Insured: BAM | ||
| 5.00%, due 3/15/52 | 13,190,000 | 14,520,978 |
| Principal Amount | Value | |
| Long-Term Municipal Bonds (continued) | ||
| Florida (continued) | ||
| School District of Broward County, Certificate of Participation | ||
| Series A, Insured: AGM | ||
| 5.00%, due 7/1/27 | $ 3,750,000 | $ 3,905,311 |
| School District of Broward County, Unlimited General Obligation | ||
| 5.00%, due 7/1/46 | 6,600,000 | 7,230,763 |
| South Broward Hospital District, Revenue Bonds | ||
| Series A | ||
| 3.00%, due 5/1/51 | 8,000,000 | 6,046,494 |
| 4.00%, due 5/1/48 | 4,750,000 | 4,507,156 |
| South Florida Water Management District, Certificate of Participation | ||
| 5.00%, due 10/1/34 | 12,955,000 | 13,563,310 |
| State of Florida, Department of Transportation Turnpike System, Revenue Bonds | ||
| Series C | ||
| 3.00%, due 7/1/51 | 11,900,000 | 9,175,520 |
| Series A | ||
| 3.50%, due 7/1/29 | 7,250,000 | 7,330,308 |
| Series A | ||
| 4.00%, due 7/1/32 | 4,250,000 | 4,308,468 |
| State of Florida, Capital Outlay, Unlimited General Obligation | ||
| Series C | ||
| 3.15%, due 6/1/29 | 4,750,000 | 4,764,693 |
| Series C | ||
| 4.00%, due 6/1/32 | 3,400,000 | 3,583,237 |
| Series A | ||
| 5.00%, due 6/1/24 | 9,000,000 | 9,184,384 |
| Village Community Development District No. 8, Special Assessment | ||
| Insured: AGM | ||
| 3.50%, due 5/1/40 | 5,000,000 | 4,731,926 |
| Volusia County Educational Facility Authority, Embry-Riddle Aeronautical University, Revenue Bonds | ||
| 5.00%, due 10/15/49 | 4,750,000 | 4,969,661 |
| West Palm Beach Community Redevelopment Agency, City center community redevelopment, Tax Allocation | ||
| Insured: AGM-CR | ||
| 5.00%, due 3/1/34 | 8,450,000 | 9,589,335 |
| Principal Amount | Value | |
| Florida (continued) | ||
| West Palm Beach Community Redevelopment Agency, City center community redevelopment, Tax Allocation (continued) | ||
| Insured: AGM-CR | ||
| 5.00%, due 3/1/35 | $ 9,020,000 | $ 10,180,477 |
| Wildwood Utility Dependent District, Revenue Bonds (b) | ||
| Insured: AGM | ||
| 5.25%, due 10/1/43 | 10,250,000 | 11,321,817 |
| Insured: AGM | ||
| 5.50%, due 10/1/53 | 14,000,000 | 15,746,788 |
| 505,251,683 | ||
| Georgia 2.6% | ||
| Brookhaven Development Authority, Children's Healthcare of Atlanta, Revenue Bonds | ||
| Series A | ||
| 4.00%, due 7/1/44 | 23,935,000 | 23,667,699 |
| Series A | ||
| 4.00%, due 7/1/49 | 2,325,000 | 2,224,894 |
| City of Atlanta, Airport Passenger Facility Charge, Revenue Bonds, Sub. Lien | ||
| Series D | ||
| 4.00%, due 7/1/35 (c) | 13,820,000 | 14,060,326 |
| City of Atlanta, Water & Wastewater, Revenue Bonds | ||
| Series C | ||
| 4.00%, due 11/1/37 | 4,750,000 | 4,844,534 |
| 5.00%, due 11/1/29 | 4,250,000 | 4,446,868 |
| City of Atlanta, Department of Aviation, Revenue Bonds (c) | ||
| Series C | ||
| 5.00%, due 1/1/27 | 2,750,000 | 2,771,508 |
| Series C | ||
| 5.00%, due 1/1/28 | 2,250,000 | 2,267,529 |
| Series C | ||
| 5.00%, due 1/1/29 | 2,000,000 | 2,015,802 |
| City of Atlanta, Public Improvement, Unlimited General Obligation | ||
| Series A-1 | ||
| 5.00%, due 12/1/42 | 11,750,000 | 13,335,902 |
| City of Dalton (The), Georgia Combined Utilities, Revenue Bonds | ||
| 5.00%, due 3/1/30 | 2,055,000 | 2,175,562 |
| 22 | MainStay MacKay Tax Free Bond Fund |
| Principal Amount | Value | |
| Long-Term Municipal Bonds (continued) | ||
| Georgia (continued) | ||
| Cobb County Kennestone Hospital Authority, Wellstar Health System, Revenue Bonds | ||
| Series A, Insured: AGM-CR | ||
| 4.00%, due 4/1/52 | $ 10,395,000 | $ 9,919,548 |
| Georgia Ports Authority, Revenue Bonds | ||
| 4.00%, due 7/1/51 | 10,250,000 | 9,973,787 |
| 4.00%, due 7/1/52 | 5,000,000 | 4,867,842 |
| 5.25%, due 7/1/43 | 7,195,000 | 8,204,953 |
| 5.25%, due 7/1/52 | 4,750,000 | 5,295,290 |
| Main Street Natural Gas, Inc., Revenue Bonds | ||
| Series C | ||
| 4.00%, due 3/1/50 (a) | 2,500,000 | 2,497,998 |
| Series C | ||
| 4.00%, due 5/1/52 (a) | 6,960,000 | 6,936,748 |
| Series A | ||
| 4.00%, due 7/1/52 (a) | 8,500,000 | 8,540,958 |
| Series A | ||
| 4.00%, due 9/1/52 (a) | 21,190,000 | 21,108,209 |
| Series A | ||
| 5.00%, due 5/15/35 | 2,750,000 | 2,899,615 |
| Series A | ||
| 5.00%, due 5/15/36 | 2,950,000 | 3,075,975 |
| Series B | ||
| 5.00%, due 7/1/53 (a) | 12,500,000 | 13,362,960 |
| Municipal Electric Authority of Georgia, Project One Subordinated Bonds, Revenue Bonds | ||
| Series A, Insured: AGM-CR | ||
| 4.00%, due 1/1/41 | 2,545,000 | 2,542,368 |
| Series A | ||
| 5.00%, due 1/1/45 | 2,185,000 | 2,276,889 |
| Series A, Insured: BAM | ||
| 5.00%, due 1/1/45 | 3,050,000 | 3,223,056 |
| Municipal Electric Authority of Georgia, Revenue Bonds | ||
| Series A | ||
| 4.00%, due 1/1/49 | 4,850,000 | 4,571,190 |
| Series HH | ||
| 5.00%, due 1/1/36 | 3,515,000 | 3,731,106 |
| Series HH | ||
| 5.00%, due 1/1/44 | 2,700,000 | 2,768,739 |
| Principal Amount | Value | |
| Georgia (continued) | ||
| Municipal Electric Authority of Georgia, Plant Vogtle Units 3 & 4 Project, Revenue Bonds | ||
| Series A | ||
| 5.00%, due 1/1/37 | $ 1,000,000 | $ 1,058,619 |
| Series A | ||
| 5.50%, due 7/1/60 | 8,250,000 | 8,366,696 |
| Private Colleges & Universities Authority, Emory University, Revenue Bonds | ||
| Series B | ||
| 5.00%, due 9/1/30 | 5,200,000 | 6,102,109 |
| State of Georgia, Unlimited General Obligation | ||
| Series A | ||
| 5.00%, due 2/1/28 | 3,200,000 | 3,339,396 |
| 206,474,675 | ||
| Guam 0.2% | ||
| Antonio B Won Pat International Airport Authority, Revenue Bonds (c) | ||
| Series C, Insured: AGM | ||
| 6.125%, due 10/1/43 | 3,385,000 | 3,419,274 |
| Series C, Insured: AGM | ||
| 6.125%, due 10/1/43 | 925,000 | 934,366 |
| Guam Government Waterworks Authority, Water and Wastewater System, Revenue Bonds | ||
| 5.00%, due 1/1/46 | 6,000,000 | 6,084,193 |
| Series A | ||
| 5.00%, due 1/1/50 | 1,660,000 | 1,682,381 |
| 5.25%, due 7/1/33 | 950,000 | 952,859 |
| Guam Power Authority, Revenue Bonds | ||
| Series A, Insured: AGM | ||
| 5.00%, due 10/1/44 | 655,000 | 670,615 |
| 13,743,688 | ||
| Hawaii 0.5% | ||
| City & County of Honolulu, Wastewater System, Revenue Bonds, Senior Lien | ||
| Series B | ||
| 4.00%, due 7/1/29 | 8,450,000 | 8,705,614 |
| City & County of Honolulu, Unlimited General Obligation | ||
| Series C | ||
| 4.00%, due 10/1/31 | 5,500,000 | 5,709,627 |
| Principal Amount | Value | |
| Long-Term Municipal Bonds (continued) | ||
| Hawaii (continued) | ||
| State of Hawaii, Unlimited General Obligation | ||
| Series FH | ||
| 4.00%, due 10/1/30 | $ 12,250,000 | $ 12,723,461 |
| Series FB | ||
| 4.00%, due 4/1/31 | 6,300,000 | 6,519,403 |
| Series FK | ||
| 4.00%, due 5/1/32 | 4,300,000 | 4,492,588 |
| State of Hawaii Department of Budget & Finance, Hawaiian Electric Co., Inc., Revenue Bonds | ||
| Insured: AGM-CR | ||
| 3.50%, due 10/1/49 (c) | 5,900,000 | 4,941,447 |
| 43,092,140 | ||
| Idaho 0.1% | ||
| Idaho Housing & Finance Association, Federal Highway Trust Fund, Revenue Bonds | ||
| Series A | ||
| 5.00%, due 7/15/37 | 6,385,000 | 6,971,690 |
| Illinois 7.6% | ||
| Chicago Board of Education, Capital Appreciation, School Reform, Unlimited General Obligation | ||
| Series A, Insured: NATL-RE | ||
| (zero coupon), due 12/1/26 | 17,245,000 | 15,065,894 |
| Chicago Board of Education, Unlimited General Obligation | ||
| Series A, Insured: AGM | ||
| 5.00%, due 12/1/27 | 7,000,000 | 7,456,112 |
| Chicago Board of Education, Dedicated Capital Improvement, Revenue Bonds | ||
| 5.75%, due 4/1/48 | 16,250,000 | 17,927,860 |
| 6.00%, due 4/1/46 | 16,560,000 | 17,411,260 |
| Chicago O'Hare International Airport, General, Revenue Bonds, Senior Lien | ||
| Series A, Insured: AGM | ||
| 4.00%, due 1/1/36 | 8,100,000 | 8,291,771 |
| Series A, Insured: BAM | ||
| 4.00%, due 1/1/37 | 10,090,000 | 10,332,836 |
| Series D | ||
| 5.00%, due 1/1/52 (c) | 3,250,000 | 3,285,860 |
| Principal Amount | Value | |
| Illinois (continued) | ||
| Chicago O'Hare International Airport, General, Revenue Bonds, Senior Lien (continued) | ||
| Series A, Insured: AGM | ||
| 5.25%, due 1/1/45 (c) | $ 9,500,000 | $ 10,197,682 |
| Series A, Insured: AGM | ||
| 5.50%, due 1/1/53 (c) | 21,525,000 | 23,311,200 |
| Chicago O'Hare International Airport, General, Revenue Bonds | ||
| Series A | ||
| 5.00%, due 1/1/31 (c) | 8,500,000 | 8,668,754 |
| Series B | ||
| 5.00%, due 1/1/33 | 3,600,000 | 3,709,378 |
| Chicago O'Hare International Airport, Passenger Facility Charge, Revenue Bonds | ||
| Series A | ||
| 5.00%, due 1/1/30 | 2,665,000 | 2,668,445 |
| Series B | ||
| 5.00%, due 1/1/31 (c) | 2,000,000 | 2,001,438 |
| Chicago Park District, Personal Property Replacement Tax, Unlimited General Obligation | ||
| Series D, Insured: BAM | ||
| 4.00%, due 1/1/34 | 3,555,000 | 3,623,437 |
| Chicago Park District, Limited Tax, Limited General Obligation | ||
| Series B | ||
| 5.00%, due 1/1/25 | 2,140,000 | 2,163,736 |
| Series A | ||
| 5.00%, due 1/1/28 | 1,000,000 | 1,040,566 |
| Series A | ||
| 5.00%, due 1/1/31 | 1,000,000 | 1,042,845 |
| Series A | ||
| 5.00%, due 1/1/35 | 2,000,000 | 2,077,282 |
| Chicago Park District, Special Recreation Activity Alternate Revenue Source, Unlimited General Obligation | ||
| Insured: BAM | ||
| 5.00%, due 11/15/30 | 1,435,000 | 1,596,566 |
| Chicago Transit Authority Sales Tax Receipts Fund, Revenue Bonds, Second Lien | ||
| 5.00%, due 12/1/46 | 4,530,000 | 4,639,026 |
| 24 | MainStay MacKay Tax Free Bond Fund |
| Principal Amount | Value | |
| Long-Term Municipal Bonds (continued) | ||
| Illinois (continued) | ||
| City of Chicago, Unlimited General Obligation | ||
| Series A | ||
| 4.00%, due 1/1/35 | $ 2,050,000 | $ 2,021,746 |
| Series A | ||
| 4.00%, due 1/1/36 | 3,750,000 | 3,620,372 |
| Series B | ||
| 4.00%, due 1/1/38 | 4,750,000 | 4,422,620 |
| Series A | ||
| 5.00%, due 1/1/32 | 1,400,000 | 1,515,636 |
| Series A | ||
| 5.00%, due 1/1/33 | 1,425,000 | 1,540,698 |
| Series A | ||
| 5.50%, due 1/1/40 | 4,650,000 | 5,041,460 |
| Series A | ||
| 5.50%, due 1/1/49 | 8,550,000 | 8,911,892 |
| Series A | ||
| 6.00%, due 1/1/38 | 39,050,000 | 41,588,820 |
| Series A, Insured: BAM | ||
| 6.00%, due 1/1/38 | 5,000,000 | 5,347,261 |
| City of Chicago, Waterworks, Revenue Bonds, Second Lien | ||
| 4.00%, due 11/1/37 | 1,250,000 | 1,214,608 |
| Series 2, Insured: AGM | ||
| 5.00%, due 11/1/28 | 1,750,000 | 1,885,077 |
| 5.00%, due 11/1/29 | 1,700,000 | 1,736,014 |
| Series 2, Insured: AGM | ||
| 5.00%, due 11/1/30 | 2,250,000 | 2,416,977 |
| Series 2, Insured: AGM | ||
| 5.00%, due 11/1/32 | 4,000,000 | 4,312,126 |
| Series 2, Insured: AGM | ||
| 5.00%, due 11/1/33 | 8,550,000 | 9,181,628 |
| Series 2, Insured: AGM | ||
| 5.00%, due 11/1/38 | 2,750,000 | 2,873,290 |
| 5.00%, due 11/1/42 | 2,340,000 | 2,282,601 |
| Insured: AGM | ||
| 5.25%, due 11/1/33 | 4,000,000 | 4,337,054 |
| Insured: AGM | ||
| 5.25%, due 11/1/34 | 1,860,000 | 2,014,678 |
| Insured: AGM | ||
| 5.25%, due 11/1/35 | 2,275,000 | 2,451,949 |
| City of Chicago, Wastewater Transmission Project, Revenue Bonds, Second Lien | ||
| 5.00%, due 1/1/28 | 1,000,000 | 1,010,484 |
| Series B, Insured: AGM-CR | ||
| 5.00%, due 1/1/30 | 6,435,000 | 6,831,202 |
| Principal Amount | Value | |
| Illinois (continued) | ||
| City of Chicago, Wastewater Transmission Project, Revenue Bonds, Second Lien (continued) | ||
| 5.00%, due 1/1/33 | $ 1,750,000 | $ 1,762,064 |
| Insured: BAM | ||
| 5.00%, due 1/1/44 | 11,240,000 | 11,291,107 |
| Series A, Insured: AGM | ||
| 5.25%, due 1/1/42 | 3,750,000 | 3,879,412 |
| City of Chicago, Motor Fuel Tax, Revenue Bonds | ||
| Insured: AGM | ||
| 5.00%, due 1/1/33 | 3,770,000 | 3,811,687 |
| City of Chicago Heights, Unlimited General Obligation | ||
| Series B, Insured: BAM | ||
| 5.25%, due 12/1/34 | 1,865,000 | 2,078,360 |
| Cook County Community High School District No. 212 Leyden, Revenue Bonds | ||
| Series C, Insured: BAM | ||
| 5.00%, due 12/1/30 | 2,620,000 | 2,686,941 |
| Series C, Insured: BAM | ||
| 5.00%, due 12/1/31 | 2,360,000 | 2,419,931 |
| County of Cook, Unlimited General Obligation | ||
| Series A | ||
| 5.00%, due 11/15/24 | 3,750,000 | 3,836,303 |
| Du Page Cook & Will Counties Community College District No. 502, Unlimited General Obligation | ||
| Series A | ||
| 5.00%, due 6/1/26 | 3,850,000 | 3,854,587 |
| Illinois Finance Authority, University of Chicago (The), Revenue Bonds | ||
| Series A | ||
| 5.25%, due 5/15/54 | 6,000,000 | 6,752,006 |
| Illinois Municipal Electric Agency, Revenue Bonds | ||
| Series A | ||
| 4.00%, due 2/1/34 | 5,650,000 | 5,721,213 |
| Illinois Sports Facilities Authority (The), Revenue Bonds | ||
| Insured: AGM | ||
| 5.25%, due 6/15/31 | 4,000,000 | 4,067,066 |
| Principal Amount | Value | |
| Long-Term Municipal Bonds (continued) | ||
| Illinois (continued) | ||
| Illinois State Toll Highway Authority, Revenue Bonds, Senior Lien | ||
| Series B | ||
| 5.00%, due 1/1/34 | $ 3,250,000 | $ 3,288,392 |
| Series B | ||
| 5.00%, due 1/1/37 | 7,000,000 | 7,073,967 |
| Series B | ||
| 5.00%, due 1/1/41 | 6,000,000 | 6,229,144 |
| Illinois State Toll Highway Authority, Revenue Bonds | ||
| Series A | ||
| 5.00%, due 1/1/37 | 5,000,000 | 5,183,313 |
| Series A | ||
| 5.00%, due 1/1/40 | 5,000,000 | 5,122,216 |
| Metropolitan Pier & Exposition Authority, McCormick Place Expansion Project, Revenue Bonds | ||
| Insured: NATL-RE | ||
| (zero coupon), due 6/15/35 | 20,150,000 | 12,284,693 |
| Metropolitan Pier & Exposition Authority, McCormick Place Expansion Project, Capital Appreciation, Revenue Bonds | ||
| Series A, Insured: NATL-RE | ||
| (zero coupon), due 6/15/36 | 30,550,000 | 17,545,112 |
| Series B-1, Insured: AGM | ||
| (zero coupon), due 6/15/43 | 13,720,000 | 5,463,031 |
| Rock Island County Public Building Commission, County of Rock Island, Revenue Bonds | ||
| Insured: AGM | ||
| 5.00%, due 12/1/36 | 2,145,000 | 2,282,161 |
| Sales Tax Securitization Corp., Revenue Bonds | ||
| Series A, Insured: BAM | ||
| 4.00%, due 1/1/48 | 9,500,000 | 8,962,498 |
| Series A | ||
| 5.00%, due 1/1/28 | 3,685,000 | 4,002,952 |
| Series A | ||
| 5.00%, due 1/1/48 | 17,200,000 | 17,785,896 |
| Series C | ||
| 5.25%, due 1/1/34 | 7,500,000 | 8,245,087 |
| Series C, Insured: BAM | ||
| 5.25%, due 1/1/48 | 15,000,000 | 15,849,922 |
| Principal Amount | Value | |
| Illinois (continued) | ||
| Sales Tax Securitization Corp., Revenue Bonds, Second Lien | ||
| Series A | ||
| 5.00%, due 1/1/32 | $ 4,150,000 | $ 4,753,918 |
| Southern Illinois University, Housing & Auxiliary Facilities System, Revenue Bonds | ||
| Series B, Insured: BAM | ||
| 5.00%, due 4/1/26 | 1,175,000 | 1,209,842 |
| Series B, Insured: BAM | ||
| 5.00%, due 4/1/29 | 1,620,000 | 1,661,980 |
| Series B, Insured: BAM | ||
| 5.00%, due 4/1/30 | 1,000,000 | 1,024,981 |
| State of Illinois, Unlimited General Obligation | ||
| Series C | ||
| 4.00%, due 10/1/40 | 4,250,000 | 4,092,497 |
| Insured: BAM | ||
| 4.00%, due 6/1/41 | 6,450,000 | 6,263,783 |
| Series D | ||
| 5.00%, due 11/1/23 | 3,000,000 | 3,020,599 |
| Series D | ||
| 5.00%, due 11/1/26 | 7,375,000 | 7,787,158 |
| 5.00%, due 2/1/27 | 3,980,000 | 4,217,513 |
| Series D | ||
| 5.00%, due 11/1/27 | 10,000,000 | 10,724,773 |
| 5.00%, due 1/1/28 | 5,155,000 | 5,369,938 |
| Series D | ||
| 5.00%, due 11/1/28 | 6,280,000 | 6,744,509 |
| 5.00%, due 5/1/29 | 2,660,000 | 2,698,456 |
| Series A | ||
| 5.00%, due 12/1/34 | 4,500,000 | 4,768,613 |
| 5.25%, due 2/1/32 | 8,550,000 | 8,652,945 |
| 5.50%, due 5/1/39 | 12,725,000 | 13,937,966 |
| Series A | ||
| 5.50%, due 3/1/47 | 4,750,000 | 5,199,060 |
| 5.75%, due 5/1/45 | 4,250,000 | 4,656,469 |
| Series A | ||
| 6.00%, due 5/1/27 | 8,190,000 | 9,021,170 |
| State of Illinois, Sales Tax, Revenue Bonds, Junior Lien | ||
| Series C | ||
| 5.00%, due 6/15/30 | 3,000,000 | 3,289,686 |
| State of Illinois, Build America Bonds, Unlimited General Obligation | ||
| Insured: AGM-CR | ||
| 6.875%, due 7/1/25 | 9,500,000 | 9,715,990 |
| 26 | MainStay MacKay Tax Free Bond Fund |
| Principal Amount | Value | |
| Long-Term Municipal Bonds (continued) | ||
| Illinois (continued) | ||
| United City of Yorkville, Special Tax | ||
| Insured: AGM | ||
| 5.00%, due 3/1/32 | $ 3,017,000 | $ 3,149,565 |
| Village of Bellwood, Unlimited General Obligation | ||
| Insured: AGM | ||
| 5.00%, due 12/1/29 | 1,500,000 | 1,578,314 |
| Village of Rosemont, Corporate Purpose, Unlimited General Obligation | ||
| Series A, Insured: AGM | ||
| 5.00%, due 12/1/40 | 6,790,000 | 7,132,420 |
| Village of Schaumburg, Unlimited General Obligation | ||
| Series A | ||
| 4.00%, due 12/1/41 | 32,050,000 | 32,050,945 |
| Will County School District No. 114, Manhattan, Unlimited General Obligation | ||
| Insured: BAM | ||
| 5.50%, due 1/1/49 | 6,210,000 | 6,968,889 |
| 604,241,181 | ||
| Indiana 0.6% | ||
| Greater Clark Building Corp., Revenue Bonds | ||
| Insured: State Intercept | ||
| 6.00%, due 7/15/38 | 5,700,000 | 6,926,047 |
| Indiana Finance Authority, Indiana University Health, Inc. Obligated Group, Revenue Bonds | ||
| Series A | ||
| 4.00%, due 12/1/40 | 10,500,000 | 10,382,122 |
| Indiana Finance Authority, CWA Authority, Inc., Revenue Bonds, First Lien | ||
| Series B | ||
| 5.25%, due 10/1/47 | 4,695,000 | 5,155,241 |
| Series B | ||
| 5.25%, due 10/1/52 | 11,820,000 | 12,912,381 |
| Indiana Housing & Community Development Authority, Revenue Bonds | ||
| Series A-1, Insured: GNMA / FNMA / FHLMC | ||
| 5.75%, due 7/1/53 | 3,000,000 | 3,239,304 |
| Principal Amount | Value | |
| Indiana (continued) | ||
| Indianapolis Local Public Improvement Bond Bank, Revenue Bonds | ||
| Series C | ||
| 5.00%, due 1/1/52 | $ 6,350,000 | $ 6,879,938 |
| 45,495,033 | ||
| Iowa 0.2% | ||
| City of Coralville, Certificate of Participation | ||
| Series E | ||
| 4.00%, due 6/1/23 | 1,320,000 | 1,319,030 |
| Iowa Finance Authority, State Revolving Fund, Revenue Bonds | ||
| Series A | ||
| 5.00%, due 8/1/35 | 6,600,000 | 7,326,212 |
| PEFA, Inc., Revenue Bonds | ||
| 5.00%, due 9/1/49 (a) | 8,175,000 | 8,420,761 |
| 17,066,003 | ||
| Kansas 0.1% | ||
| City of Hutchinson, Hutchinson Regional Medical Center, Inc., Revenue Bonds | ||
| 5.00%, due 12/1/26 | 565,000 | 574,624 |
| 5.00%, due 12/1/28 | 410,000 | 416,006 |
| 5.00%, due 12/1/30 | 500,000 | 506,933 |
| University of Kansas Hospital Authority, KU Health System, Revenue Bonds | ||
| 5.00%, due 9/1/33 | 2,500,000 | 2,617,191 |
| 5.00%, due 9/1/35 | 2,550,000 | 2,648,895 |
| 5.00%, due 9/1/45 | 4,400,000 | 4,484,177 |
| 11,247,826 | ||
| Kentucky 0.6% | ||
| Kentucky Public Energy Authority, Gas Supply, Revenue Bonds (a) | ||
| Series A | ||
| 4.00%, due 4/1/48 | 14,450,000 | 14,464,122 |
| Series C | ||
| 4.00%, due 2/1/50 | 8,640,000 | 8,652,737 |
| Louisville & Jefferson County Visitors and Convention Commission, Revenue Bonds | ||
| Insured: AGM-CR | ||
| 4.00%, due 6/1/29 | 3,320,000 | 3,420,710 |
| Principal Amount | Value | |
| Long-Term Municipal Bonds (continued) | ||
| Kentucky (continued) | ||
| Louisville and Jefferson County Metropolitan Sewer District, Revenue Bonds | ||
| Series B | ||
| 5.00%, due 5/15/36 (b) | $ 10,000,000 | $ 11,819,161 |
| Louisville/Jefferson County Metropolitan Government, Unlimited General Obligation | ||
| Series A | ||
| 4.00%, due 4/1/35 | 3,750,000 | 4,018,197 |
| Louisville/Jefferson County Metropolitan Government, UofL Health Project, Revenue Bonds | ||
| Series A, Insured: AGM | ||
| 5.00%, due 5/15/47 | 8,450,000 | 8,977,249 |
| 51,352,176 | ||
| Louisiana 0.1% | ||
| City of New Orleans, Public Improvement, Unlimited General Obligation | ||
| Series A | ||
| 5.00%, due 12/1/40 | 4,750,000 | 5,109,290 |
| City of Shreveport, Unlimited General Obligation | ||
| Insured: BAM | ||
| 5.00%, due 8/1/30 | 4,355,000 | 4,655,937 |
| 9,765,227 | ||
| Maine 0.0% ‡ | ||
| Maine Municipal Bond Bank, Revenue Bonds | ||
| Series B | ||
| 3.50%, due 11/1/29 | 3,700,000 | 3,778,927 |
| Maryland 1.1% | ||
| County of Baltimore, Unlimited General Obligation | ||
| 3.50%, due 8/1/29 | 8,200,000 | 8,297,933 |
| 5.00%, due 2/1/41 | 2,500,000 | 2,613,443 |
| Maryland Stadium Authority, Baltimore City Public School Construction Financing Fund, Revenue Bonds | ||
| Insured: State Intercept | ||
| 5.00%, due 5/1/24 | 4,040,000 | 4,115,972 |
| Principal Amount | Value | |
| Maryland (continued) | ||
| Maryland Stadium Authority, Construction and Revitalization Program, Revenue Bonds | ||
| Series A, Insured: State Intercept | ||
| 5.00%, due 5/1/42 | $ 26,020,000 | $ 27,633,713 |
| State of Maryland, Department of Transportation, Revenue Bonds | ||
| Series A | ||
| 3.00%, due 10/1/33 | 5,325,000 | 5,337,947 |
| State of Maryland, Unlimited General Obligation, First Series | ||
| Series 1 | ||
| 4.00%, due 6/1/30 | 8,600,000 | 8,685,690 |
| State of Maryland, State and Local Facilities Loan, Unlimited General Obligation | ||
| Series A | ||
| 5.00%, due 6/1/33 | 4,250,000 | 5,131,195 |
| Series A | ||
| 5.00%, due 6/1/37 | 19,000,000 | 22,185,707 |
| 84,001,600 | ||
| Massachusetts 2.9% | ||
| City of Boston, Unlimited General Obligation | ||
| Series A | ||
| 5.00%, due 11/1/37 | 5,750,000 | 6,747,385 |
| Series A | ||
| 5.00%, due 11/1/41 | 11,750,000 | 13,534,948 |
| City of Worcester, Limited General Obligation | ||
| Insured: AGM | ||
| 3.00%, due 2/1/37 | 2,750,000 | 2,505,974 |
| Commonwealth of Massachusetts, Consolidated Loan, Limited General Obligation | ||
| Series D | ||
| 3.00%, due 5/1/35 | 5,540,000 | 5,266,490 |
| Series B | ||
| 3.00%, due 4/1/47 | 6,725,000 | 5,389,069 |
| Series B | ||
| 3.00%, due 2/1/48 | 30,270,000 | 24,108,166 |
| Series B | ||
| 3.00%, due 4/1/48 | 5,000,000 | 3,979,360 |
| Series C | ||
| 3.00%, due 3/1/49 | 13,250,000 | 10,468,792 |
| Series B | ||
| 3.00%, due 4/1/49 | 7,465,000 | 5,896,100 |
| 28 | MainStay MacKay Tax Free Bond Fund |
| Principal Amount | Value | |
| Long-Term Municipal Bonds (continued) | ||
| Massachusetts (continued) | ||
| Commonwealth of Massachusetts, Consolidated Loan, Limited General Obligation (continued) | ||
| Series B | ||
| 5.00%, due 7/1/30 | $ 2,750,000 | $ 3,221,145 |
| Series A | ||
| 5.00%, due 4/1/37 | 2,950,000 | 3,166,123 |
| Series F | ||
| 5.00%, due 11/1/39 | 8,100,000 | 8,713,093 |
| Series D | ||
| 5.00%, due 7/1/45 | 20,280,000 | 22,167,727 |
| Series E | ||
| 5.00%, due 11/1/50 | 4,050,000 | 4,407,318 |
| Commonwealth of Massachusetts, Consolidated Loan, Unlimited General Obligation | ||
| Series C | ||
| 5.00%, due 10/1/52 | 17,010,000 | 18,786,608 |
| Commonwealth of Massachusetts Transportation Fund, Rail Enhancement Program, Revenue Bonds | ||
| Series A | ||
| 4.00%, due 6/1/50 | 8,200,000 | 8,008,036 |
| Series A | ||
| 5.00%, due 6/1/50 | 17,300,000 | 18,928,139 |
| Series B | ||
| 5.00%, due 6/1/52 | 14,200,000 | 15,638,835 |
| Commonwealth of Massachusetts Transportation Fund, Accelerated Bridge Program, Revenue Bonds | ||
| Series A | ||
| 5.00%, due 6/1/44 | 4,750,000 | 4,805,164 |
| Massachusetts Development Finance Agency, WGBH Educational Foundation, Revenue Bonds | ||
| 4.00%, due 1/1/33 | 1,000,000 | 1,029,036 |
| Massachusetts Development Finance Agency, Partners Healthcare System Issue, Revenue Bonds | ||
| Series O-2 | ||
| 5.00%, due 7/1/27 | 4,700,000 | 4,922,291 |
| Massachusetts Development Finance Agency, Harvard University Issue, Revenue Bonds | ||
| Series B | ||
| 5.00%, due 11/15/32 | 11,735,000 | 14,414,615 |
| Principal Amount | Value | |
| Massachusetts (continued) | ||
| Massachusetts Development Finance Agency, Dana-Farber Cancer Institute, Revenue Bonds | ||
| Series N | ||
| 5.00%, due 12/1/41 | $ 6,500,000 | $ 6,726,060 |
| Massachusetts School Building Authority, Revenue Bonds | ||
| 4.00%, due 8/15/45 | 4,550,000 | 4,491,603 |
| Massachusetts School Building Authority, Revenue Bonds, Senior Lien | ||
| Series B | ||
| 5.00%, due 11/15/33 | 8,500,000 | 9,183,541 |
| Town of Natick, Qualified Municipal Purpose Loan, Limited General Obligation | ||
| 4.00%, due 7/15/36 | 3,280,000 | 3,384,582 |
| 229,890,200 | ||
| Michigan 1.6% | ||
| Byron Center Public Schools, Unlimited General Obligation | ||
| Series II, Insured: Q-SBLF | ||
| 5.25%, due 5/1/53 (b) | 7,570,000 | 8,301,446 |
| Downriver Utility Wastewater Authority, Revenue Bonds | ||
| Insured: AGM | ||
| 5.00%, due 4/1/31 | 1,600,000 | 1,760,877 |
| Flat Rock Community School District, Unlimited General Obligation | ||
| Insured: Q-SBLF | ||
| 5.25%, due 5/1/52 (b) | 5,785,000 | 6,294,425 |
| Great Lakes Water Authority, Water Supply System, Revenue Bonds, Second Lien | ||
| Series A | ||
| 5.00%, due 7/1/24 | 3,000,000 | 3,056,575 |
| Great Lakes Water Authority, Water Supply System, Revenue Bonds, Senior Lien | ||
| Series C | ||
| 5.25%, due 7/1/34 | 15,350,000 | 16,442,656 |
| Great Lakes Water Authority, Sewage Disposal System, Revenue Bonds, Senior Lien | ||
| Series B, Insured: AGM-CR | ||
| 5.00%, due 7/1/34 | 12,940,000 | 13,808,442 |
| Principal Amount | Value | |
| Long-Term Municipal Bonds (continued) | ||
| Michigan (continued) | ||
| Lincoln Consolidated School District, Unlimited General Obligation | ||
| Series A, Insured: AGM Q-SBLF | ||
| 5.00%, due 5/1/28 | $ 1,780,000 | $ 1,888,486 |
| Series A, Insured: AGM Q-SBLF | ||
| 5.00%, due 5/1/30 | 1,455,000 | 1,534,250 |
| Series A, Insured: AGM Q-SBLF | ||
| 5.00%, due 5/1/40 | 1,500,000 | 1,554,691 |
| Livonia Public Schools, Unlimited General Obligation | ||
| Series II, Insured: AGM | ||
| 5.00%, due 5/1/40 | 3,615,000 | 3,770,795 |
| Michigan Finance Authority, Wayne County Criminal Justice Center Project, Revenue Bonds, Senior Lien | ||
| 5.00%, due 11/1/25 | 1,000,000 | 1,053,760 |
| 5.00%, due 11/1/27 | 1,200,000 | 1,307,867 |
| Michigan Finance Authority, BHSH System Obligated Group, Revenue Bonds | ||
| 5.00%, due 4/15/28 | 6,600,000 | 7,270,420 |
| Michigan Finance Authority, Great Lakes Water Authority Sewage Disposal System, Revenue Bonds, Second Lien | ||
| Series C-7, Insured: NATL-RE | ||
| 5.00%, due 7/1/32 | 2,000,000 | 2,036,109 |
| Michigan Finance Authority, Great Lakes Water Authority Sewage Disposal System, Revenue Bonds, Senior Lien | ||
| Series C-3, Insured: AGM | ||
| 5.00%, due 7/1/33 | 2,500,000 | 2,543,129 |
| Michigan Finance Authority, Great Lakes Water Authority Water Supply System, Revenue Bonds | ||
| Series D-1, Insured: AGM | ||
| 5.00%, due 7/1/35 | 1,750,000 | 1,776,584 |
| Series D-6, Insured: NATL-RE | ||
| 5.00%, due 7/1/36 | 6,350,000 | 6,429,795 |
| Michigan State Housing Development Authority, Revenue Bonds | ||
| Series A | ||
| 3.75%, due 4/1/27 | 8,500,000 | 8,522,106 |
| Principal Amount | Value | |
| Michigan (continued) | ||
| State of Michigan, Trunk Line, Revenue Bonds | ||
| Series A | ||
| 4.00%, due 11/15/44 | $ 23,750,000 | $ 23,640,726 |
| Wayne County Airport Authority, Revenue Bonds | ||
| Series F | ||
| 5.00%, due 12/1/31 (c) | 11,000,000 | 11,331,462 |
| 124,324,601 | ||
| Minnesota 0.4% | ||
| City of Rochester, Mayo Clinic, Revenue Bonds | ||
| 4.00%, due 11/15/39 | 13,675,000 | 14,258,599 |
| County of Rice, Unlimited General Obligation | ||
| Series A, Insured: MN CRED PROG | ||
| 5.00%, due 2/1/44 | 4,750,000 | 5,355,515 |
| Metropolitan Council, Minneapolis-St.Paul Metropolitan Area, Unlimited General Obligation | ||
| Series A | ||
| 3.00%, due 3/1/29 | 5,500,000 | 5,522,796 |
| Minnesota Housing Finance Agency, Residential Housing Finance, Revenue Bonds | ||
| Series E, Insured: GNMA / FNMA / FHLMC | ||
| 4.25%, due 1/1/49 | 2,205,000 | 2,215,269 |
| White Bear Lake Independent School District No. 624, Unlimited General Obligation | ||
| Series A, Insured: SD CRED PROG | ||
| 3.00%, due 2/1/43 | 4,060,000 | 3,439,073 |
| 30,791,252 | ||
| Mississippi 0.0% ‡ | ||
| Mississippi Home Corp., Single Family Mortgage Housing, Revenue Bonds | ||
| Series A, Insured: GNMA / FNMA / FHLMC | ||
| 4.00%, due 12/1/44 | 1,065,000 | 1,063,223 |
| Missouri 0.3% | ||
| Health & Educational Facilities Authority of the State of Missouri, Mercy Health, Revenue Bonds | ||
| 4.00%, due 6/1/53 | 9,750,000 | 9,086,649 |
| 30 | MainStay MacKay Tax Free Bond Fund |
| Principal Amount | Value | |
| Long-Term Municipal Bonds (continued) | ||
| Missouri (continued) | ||
| Metropolitan St. Louis Sewer District, Revenue Bonds | ||
| Series B | ||
| 5.25%, due 5/1/52 | $ 8,300,000 | $ 9,319,504 |
| Missouri Housing Development Commission, First Place Homeownership Loan Program, Revenue Bonds | ||
| Series A, Insured: GNMA / FNMA / FHLMC | ||
| 4.25%, due 5/1/47 | 230,000 | 231,005 |
| Missouri Joint Municipal Electric Utility Commission, Prairie State Project, Revenue Bonds | ||
| 5.00%, due 12/1/31 | 3,000,000 | 3,097,434 |
| 21,734,592 | ||
| Montana 0.5% | ||
| Montana Board of Housing, Single Family Mortgage, Revenue Bonds | ||
| Series B | ||
| 3.40%, due 12/1/33 | 685,000 | 689,716 |
| Series B | ||
| 3.60%, due 6/1/37 | 890,000 | 873,816 |
| Montana Facility Finance Authority, Benefis Health System Obligated Group, Revenue Bonds | ||
| 5.00%, due 2/15/30 | 1,790,000 | 1,889,941 |
| 5.00%, due 2/15/31 | 1,500,000 | 1,580,964 |
| 5.00%, due 2/15/33 | 1,320,000 | 1,385,182 |
| 5.00%, due 2/15/34 | 1,200,000 | 1,257,266 |
| Montana State Board of Regents, University of Montana/Missoula, Revenue Bonds | ||
| Insured: AGM | ||
| 5.25%, due 11/15/52 | 15,200,000 | 16,875,894 |
| Silver Bow County School District No. 1, School Building, Unlimited General Obligation | ||
| 4.00%, due 7/1/32 | 1,945,000 | 2,040,398 |
| 4.00%, due 7/1/33 | 2,020,000 | 2,115,980 |
| Yellowstone County K-12, School District No. 26 Lockwood, Unlimited General Obligation | ||
| 5.00%, due 7/1/29 | 2,010,000 | 2,251,372 |
| 5.00%, due 7/1/30 | 2,000,000 | 2,240,358 |
| Principal Amount | Value | |
| Montana (continued) | ||
| Yellowstone County K-12, School District No. 26 Lockwood, Unlimited General Obligation (continued) | ||
| 5.00%, due 7/1/31 | $ 2,265,000 | $ 2,536,772 |
| 5.00%, due 7/1/32 | 2,550,000 | 2,854,264 |
| 38,591,923 | ||
| Nebraska 1.4% | ||
| Central Plains Energy, Nebraska Gas Project No. 4, Revenue Bonds | ||
| Series A | ||
| 5.00%, due 3/1/50 (a) | 42,065,000 | 42,375,663 |
| Metropolitan Utilities District of Omaha, Revenue Bonds | ||
| 3.30%, due 12/1/29 | 2,845,000 | 2,847,032 |
| 3.40%, due 12/1/30 | 7,000,000 | 7,021,837 |
| Nebraska Investment Finance Authority, Single Family Housing, Revenue Bonds | ||
| Series C | ||
| 4.00%, due 9/1/48 | 115,000 | 114,769 |
| Omaha Public Power District, Electric System, Revenue Bonds | ||
| Series A | ||
| 4.00%, due 2/1/51 | 16,400,000 | 15,712,137 |
| Series A | ||
| 5.00%, due 2/1/46 | 19,375,000 | 21,237,069 |
| Series A | ||
| 5.00%, due 2/1/47 | 19,000,000 | 21,109,188 |
| Omaha Public Power District, Revenue Bonds | ||
| Series C | ||
| 5.00%, due 2/1/43 | 4,500,000 | 4,587,494 |
| 115,005,189 | ||
| Nevada 1.5% | ||
| City of Reno, Capital Improvement, Revenue Bonds | ||
| Series A-1, Insured: AGM | ||
| 4.00%, due 6/1/46 | 1,600,000 | 1,500,879 |
| Clark County School District, Limited General Obligation | ||
| Series B, Insured: BAM | ||
| 3.00%, due 6/15/36 | 5,500,000 | 5,046,772 |
| Principal Amount | Value | |
| Long-Term Municipal Bonds (continued) | ||
| Nevada (continued) | ||
| County of Clark, Regional Transportation Commission of Southern Nevada Motor Fuel Tax, Revenue Bonds | ||
| Insured: AGM | ||
| 4.00%, due 7/1/40 | $ 16,500,000 | $ 16,289,486 |
| County of Clark, Limited General Obligation | ||
| Series A | ||
| 5.00%, due 6/1/43 | 7,500,000 | 8,001,388 |
| Las Vegas Convention & Visitors Authority, Convention Center Expansion, Revenue Bonds | ||
| Series B | ||
| 4.00%, due 7/1/49 | 28,845,000 | 26,910,199 |
| Series B | ||
| 5.00%, due 7/1/34 | 2,500,000 | 2,911,285 |
| Series B | ||
| 5.00%, due 7/1/43 | 25,635,000 | 26,892,507 |
| Series B | ||
| 5.25%, due 7/1/49 | 8,000,000 | 8,744,619 |
| Las Vegas Valley Water District, Limited General Obligation | ||
| 5.00%, due 6/1/33 | 7,600,000 | 7,811,924 |
| Las Vegas Valley Water District, Water Improvement, Limited General Obligation | ||
| Series A | ||
| 5.00%, due 6/1/46 | 14,265,000 | 14,769,201 |
| 118,878,260 | ||
| New Hampshire 0.2% | ||
| City of Manchester, General Airport, Revenue Bonds | ||
| Series A, Insured: AGM | ||
| 5.00%, due 1/1/26 | 1,800,000 | 1,802,508 |
| New Hampshire Business Finance Authority, Pennichuck Water Works, Inc., Revenue Bonds | ||
| Series A | ||
| 4.00%, due 4/1/50 (c) | 4,525,000 | 4,042,415 |
| New Hampshire Health and Education Facilities Authority Act, University System of New Hampshire, Revenue Bonds | ||
| 5.00%, due 7/1/40 | 7,250,000 | 7,427,696 |
| 13,272,619 | ||
| Principal Amount | Value | |
| New Jersey 3.2% | ||
| Atlantic County Improvement Authority (The), Stockton University, Revenue Bonds | ||
| Series A, Insured: AGM | ||
| 5.00%, due 7/1/31 | $ 1,920,000 | $ 2,051,330 |
| Series A, Insured: AGM | ||
| 5.00%, due 7/1/32 | 1,305,000 | 1,394,550 |
| Series A, Insured: AGM | ||
| 5.00%, due 7/1/33 | 1,395,000 | 1,489,670 |
| City of Atlantic City, Unlimited General Obligation | ||
| Series B, Insured: AGM State Aid Withholding | ||
| 5.00%, due 3/1/32 | 2,650,000 | 2,858,722 |
| New Brunswick Parking Authority, City Guaranteed Parking, Revenue Bonds | ||
| Series A, Insured: BAM MUN GOVT GTD | ||
| 5.00%, due 9/1/30 | 3,605,000 | 3,841,889 |
| Series A, Insured: BAM MUN GOVT GTD | ||
| 5.00%, due 9/1/31 | 5,680,000 | 6,052,239 |
| New Jersey Building Authority, Revenue Bonds | ||
| Series A, Insured: BAM | ||
| 5.00%, due 6/15/28 | 1,805,000 | 1,917,843 |
| New Jersey Economic Development Authority, The Goethals Bridge Replacement Project, Revenue Bonds (c) | ||
| 5.00%, due 1/1/28 | 1,000,000 | 1,007,156 |
| 5.50%, due 1/1/26 | 1,000,000 | 1,009,796 |
| New Jersey Economic Development Authority, State of New Jersey Motor Vehicle Surcharge, Revenue Bonds | ||
| Series A, Insured: BAM | ||
| 5.00%, due 7/1/28 | 2,000,000 | 2,163,039 |
| New Jersey Educational Facilities Authority, Stockton University, Revenue Bonds | ||
| Series A, Insured: BAM | ||
| 5.00%, due 7/1/29 | 3,775,000 | 3,970,131 |
| 32 | MainStay MacKay Tax Free Bond Fund |
| Principal Amount | Value | |
| Long-Term Municipal Bonds (continued) | ||
| New Jersey (continued) | ||
| New Jersey Health Care Facilities Financing Authority, Hackensack Meridian Health, Inc., Revenue Bonds | ||
| Series A | ||
| 5.00%, due 7/1/38 | $ 8,400,000 | $ 8,902,823 |
| New Jersey Transportation Trust Fund Authority, Transportation System, Revenue Bonds | ||
| Series C, Insured: NATL-RE | ||
| (zero coupon), due 12/15/27 | 7,960,000 | 6,847,372 |
| Series C, Insured: NATL-RE | ||
| (zero coupon), due 12/15/30 | 17,075,000 | 13,212,053 |
| Series C, Insured: AGM | ||
| (zero coupon), due 12/15/34 | 25,900,000 | 16,969,970 |
| Series A | ||
| 5.00%, due 12/15/26 | 3,500,000 | 3,724,243 |
| Series AA | ||
| 5.00%, due 6/15/44 | 11,355,000 | 11,364,319 |
| Series BB | ||
| 5.00%, due 6/15/44 | 11,555,000 | 12,125,559 |
| Series AA | ||
| 5.00%, due 6/15/46 | 6,115,000 | 6,401,909 |
| New Jersey Transportation Trust Fund Authority, Federal Highway Reimbursement, Revenue Bonds | ||
| Series A | ||
| 5.00%, due 6/15/28 | 4,050,000 | 4,280,855 |
| Series A | ||
| 5.00%, due 6/15/29 | 21,185,000 | 22,388,043 |
| New Jersey Transportation Trust Fund Authority, Transportation Program, Revenue Bonds | ||
| Series AA | ||
| 5.25%, due 6/15/43 | 8,655,000 | 9,207,838 |
| New Jersey Transportation Trust Fund Authority, Build America Bonds, Revenue Bonds | ||
| Series C | ||
| 5.754%, due 12/15/28 | 2,500,000 | 2,573,189 |
| New Jersey Turnpike Authority, Revenue Bonds | ||
| Series A | ||
| 5.00%, due 1/1/32 | 2,750,000 | 2,813,499 |
| Series B | ||
| 5.25%, due 1/1/52 | 40,755,000 | 45,645,914 |
| Principal Amount | Value | |
| New Jersey (continued) | ||
| State of New Jersey, COVID-19 General Obligation Emergency Bonds, Unlimited General Obligation | ||
| Series A | ||
| 4.00%, due 6/1/30 | $ 9,000,000 | $ 9,754,455 |
| 5.00%, due 6/1/24 | 6,165,000 | 6,289,322 |
| State of New Jersey, Various Purpose, Unlimited General Obligation | ||
| 5.00%, due 6/1/38 | 9,270,000 | 10,221,980 |
| 5.00%, due 6/1/41 | 11,100,000 | 12,085,835 |
| Tobacco Settlement Financing Corp., Revenue Bonds | ||
| Series A | ||
| 5.00%, due 6/1/30 | 1,815,000 | 1,975,289 |
| Series A | ||
| 5.00%, due 6/1/33 | 5,400,000 | 5,846,550 |
| Series A | ||
| 5.00%, due 6/1/34 | 1,500,000 | 1,617,661 |
| Series A | ||
| 5.00%, due 6/1/36 | 4,950,000 | 5,266,162 |
| Township of Edison, Unlimited General Obligation | ||
| 2.00%, due 3/15/36 | 4,545,000 | 3,709,171 |
| 250,980,376 | ||
| New Mexico 0.2% | ||
| Albuquerque Municipal School District No. 12, Unlimited General Obligation | ||
| Insured: State Aid Withholding | ||
| 5.00%, due 8/1/24 | 4,550,000 | 4,647,698 |
| New Mexico Hospital Equipment Loan Council, Presbyterian Healthcare Services, Revenue Bonds | ||
| Series A | ||
| 4.00%, due 8/1/37 | 3,650,000 | 3,653,051 |
| New Mexico Municipal Energy Acquisition Authority, Revenue Bonds | ||
| Series A | ||
| 5.00%, due 11/1/39 (a) | 8,800,000 | 9,016,525 |
| 17,317,274 | ||
| New York 16.0% | ||
| City of New York, Unlimited General Obligation | ||
| Series A, Insured: BAM | ||
| 3.00%, due 8/1/36 | 12,320,000 | 11,586,461 |
| Principal Amount | Value | |
| Long-Term Municipal Bonds (continued) | ||
| New York (continued) | ||
| City of New York, Unlimited General Obligation (continued) | ||
| Series A-1 | ||
| 4.00%, due 8/1/37 | $ 2,000,000 | $ 2,057,918 |
| Series A-1 | ||
| 4.00%, due 8/1/38 | 6,150,000 | 6,280,849 |
| Series D-1 | ||
| 4.00%, due 3/1/50 | 12,860,000 | 12,519,983 |
| Series A-1 | ||
| 5.00%, due 9/1/37 | 4,250,000 | 4,901,410 |
| Series C | ||
| 5.00%, due 8/1/42 | 2,160,000 | 2,366,904 |
| Series F-1 | ||
| 5.00%, due 3/1/43 | 4,315,000 | 4,745,553 |
| Series B-1 | ||
| 5.25%, due 10/1/33 | 6,260,000 | 6,986,763 |
| Series E | ||
| 5.50%, due 8/1/25 | 4,750,000 | 4,772,479 |
| County of Nassau, Limited General Obligation | ||
| Series A, Insured: AGM-CR | ||
| 5.00%, due 1/1/26 | 5,000,000 | 5,311,700 |
| County of Suffolk, Public Improvement, Limited General Obligation | ||
| Series A, Insured: BAM | ||
| 4.00%, due 4/1/32 | 4,030,000 | 4,174,581 |
| Hudson Yards Infrastructure Corp., Second Indenture, Revenue Bonds | ||
| Series A | ||
| 4.00%, due 2/15/37 | 2,175,000 | 2,227,397 |
| Series A | ||
| 5.00%, due 2/15/39 | 4,700,000 | 4,990,501 |
| Long Island Power Authority, Electric System, Revenue Bonds | ||
| 5.00%, due 9/1/37 | 2,000,000 | 2,189,882 |
| Series A, Insured: BAM | ||
| 5.00%, due 9/1/39 | 8,500,000 | 8,618,475 |
| Series A | ||
| 5.00%, due 9/1/44 | 5,875,000 | 5,937,862 |
| Series B | ||
| 5.00%, due 9/1/45 | 7,570,000 | 7,736,092 |
| Metropolitan Transportation Authority, Revenue Bonds | ||
| Series D-1 | ||
| 5.00%, due 11/15/26 | 2,285,000 | 2,368,188 |
| 5.00%, due 11/15/35 | 4,250,000 | 4,344,809 |
| Principal Amount | Value | |
| New York (continued) | ||
| Metropolitan Transportation Authority, Revenue Bonds (continued) | ||
| Series A-1 | ||
| 5.00%, due 11/15/37 | $ 1,300,000 | $ 1,316,677 |
| Series C | ||
| 5.00%, due 11/15/38 | 6,300,000 | 6,311,888 |
| Series A-1 | ||
| 5.00%, due 11/15/40 | 4,140,000 | 4,182,177 |
| Series C | ||
| 5.00%, due 11/15/42 | 8,525,000 | 8,541,087 |
| Series E | ||
| 5.00%, due 11/15/43 | 2,250,000 | 2,244,227 |
| Series C-1 | ||
| 5.25%, due 11/15/29 | 2,230,000 | 2,317,457 |
| Series B | ||
| 5.25%, due 11/15/35 | 2,370,000 | 2,391,573 |
| Series D-1 | ||
| 5.25%, due 11/15/44 | 6,355,000 | 6,403,742 |
| Metropolitan Transportation Authority, Dedicated Tax Fund, Revenue Bonds | ||
| Series B-1 | ||
| 5.00%, due 11/15/36 | 4,675,000 | 4,948,120 |
| Series A | ||
| 5.00%, due 11/15/46 | 12,290,000 | 13,498,619 |
| Series A | ||
| 5.00%, due 11/15/48 | 5,810,000 | 6,357,563 |
| Series A | ||
| 5.00%, due 11/15/49 | 5,250,000 | 5,737,307 |
| Metropolitan Transportation Authority, Green Bond, Revenue Bonds | ||
| Series A-1 | ||
| 5.00%, due 11/15/41 | 2,815,000 | 2,851,227 |
| Series D-1 | ||
| 5.00%, due 11/15/44 | 10,450,000 | 10,930,840 |
| Metropolitan Transportation Authority, Climate Certified Green Bond, Revenue Bonds | ||
| Series C, Insured: BAM | ||
| 5.00%, due 11/15/44 | 12,545,000 | 13,166,792 |
| New York City Housing Development Corp., Revenue Bonds | ||
| Series A-1 | ||
| 4.15%, due 11/1/38 | 16,230,000 | 16,077,401 |
| 34 | MainStay MacKay Tax Free Bond Fund |
| Principal Amount | Value | |
| Long-Term Municipal Bonds (continued) | ||
| New York (continued) | ||
| New York City Municipal Water Finance Authority, Water & Sewer System Second General Resolution, Revenue Bonds | ||
| Series BB-1, Insured: BAM | ||
| 3.00%, due 6/15/44 | $ 18,700,000 | $ 15,204,725 |
| Series DD-1 | ||
| 3.00%, due 6/15/50 | 4,515,000 | 3,468,097 |
| Series FF-2 | ||
| 4.00%, due 6/15/41 | 6,975,000 | 7,001,882 |
| Series AA-2 | ||
| 4.00%, due 6/15/42 | 3,665,000 | 3,671,632 |
| Series AA-2 | ||
| 4.00%, due 6/15/43 | 6,200,000 | 6,199,901 |
| Series AA-2 | ||
| 5.00%, due 6/15/28 | 1,000,000 | 1,075,428 |
| Series AA-2 | ||
| 5.00%, due 6/15/29 | 1,100,000 | 1,221,996 |
| Series AA-2 | ||
| 5.00%, due 6/15/32 | 1,000,000 | 1,186,947 |
| Series AA | ||
| 5.00%, due 6/15/37 | 3,750,000 | 4,044,449 |
| Series AA | ||
| 5.00%, due 6/15/38 | 3,750,000 | 4,036,464 |
| Series FF | ||
| 5.00%, due 6/15/38 | 4,565,000 | 4,965,009 |
| Series EE | ||
| 5.00%, due 6/15/40 | 6,905,000 | 7,468,488 |
| Series EE | ||
| 5.00%, due 6/15/45 | 3,750,000 | 4,149,377 |
| Series DD-1 | ||
| 5.00%, due 6/15/48 | 3,715,000 | 3,964,196 |
| Series GG-1 | ||
| 5.00%, due 6/15/48 | 4,350,000 | 4,701,768 |
| Series BB | ||
| 5.00%, due 6/15/49 | 7,000,000 | 7,497,965 |
| Series CC-1 | ||
| 5.00%, due 6/15/51 | 10,955,000 | 11,902,989 |
| Series AA-1 | ||
| 5.25%, due 6/15/52 | 6,915,000 | 7,747,673 |
| New York City Transitional Finance Authority, Building Aid, Revenue Bonds | ||
| Series S-1, Insured: State Aid Withholding | ||
| 3.00%, due 7/15/49 | 10,000,000 | 7,768,283 |
| Principal Amount | Value | |
| New York (continued) | ||
| New York City Transitional Finance Authority, Building Aid, Revenue Bonds (continued) | ||
| Series S-1, Insured: State Aid Withholding | ||
| 4.00%, due 7/15/35 | $ 4,070,000 | $ 4,312,950 |
| Series S-1A, Insured: State Aid Withholding | ||
| 4.00%, due 7/15/36 | 5,750,000 | 5,989,699 |
| Series S-1, Insured: State Aid Withholding | ||
| 4.00%, due 7/15/40 | 6,600,000 | 6,607,904 |
| Series S-1, Insured: State Aid Withholding | ||
| 5.00%, due 7/15/33 | 5,060,000 | 5,216,481 |
| Series S-1, Insured: State Aid Withholding | ||
| 5.00%, due 7/15/36 | 8,450,000 | 8,663,205 |
| Series S-1, Insured: State Aid Withholding | ||
| 5.00%, due 7/15/43 | 7,130,000 | 7,396,310 |
| New York City Transitional Finance Authority, Future Tax Secured, Revenue Bonds | ||
| Series E-1 | ||
| 4.00%, due 2/1/39 | 6,080,000 | 6,107,745 |
| Series C-1 | ||
| 4.00%, due 5/1/45 | 18,500,000 | 18,186,223 |
| Series E-1 | ||
| 4.00%, due 2/1/46 | 16,085,000 | 15,784,749 |
| Series F-1 | ||
| 5.00%, due 5/1/32 | 3,250,000 | 3,529,189 |
| Series A-1 | ||
| 5.00%, due 5/1/33 | 8,475,000 | 9,001,558 |
| Series A-2 | ||
| 5.00%, due 8/1/34 | 6,645,000 | 7,215,642 |
| Series A-1 | ||
| 5.00%, due 8/1/40 | 9,800,000 | 10,557,035 |
| Series E-1 | ||
| 5.00%, due 2/1/43 | 3,500,000 | 3,694,066 |
| Series A-1 | ||
| 5.25%, due 8/1/40 | 7,000,000 | 8,079,891 |
| Series D-1 | ||
| 5.50%, due 11/1/45 | 16,200,000 | 18,702,561 |
| Principal Amount | Value | |
| Long-Term Municipal Bonds (continued) | ||
| New York (continued) | ||
| New York Convention Center Development Corp., Hotel Unit Fee, Revenue Bonds, Sub. Lien | ||
| Series B, Insured: BAM | ||
| (zero coupon), due 11/15/36 | $ 4,800,000 | $ 2,773,172 |
| New York Liberty Development Corp., Bank of America Tower at One Bryant Park Project, Revenue Bonds | ||
| 2.45%, due 9/15/69 | 11,125,000 | 10,063,741 |
| New York Liberty Development Corp., 1 World Trade Center, Revenue Bonds | ||
| Insured: AGM-CR | ||
| 3.00%, due 2/15/42 | 14,750,000 | 11,826,000 |
| Insured: BAM | ||
| 4.00%, due 2/15/43 | 3,250,000 | 3,218,524 |
| Insured: AGM-CR | ||
| 4.00%, due 2/15/43 | 9,500,000 | 9,435,695 |
| New York Power Authority, Revenue Bonds | ||
| Series A | ||
| 4.00%, due 11/15/45 | 6,000,000 | 5,905,301 |
| Series A | ||
| 4.00%, due 11/15/50 | 14,400,000 | 13,990,863 |
| New York State Dormitory Authority, State Personal Income Tax, Revenue Bonds | ||
| Series A | ||
| 3.00%, due 3/15/39 | 17,500,000 | 15,169,338 |
| Series E | ||
| 3.00%, due 3/15/41 | 2,250,000 | 1,896,675 |
| Series A | ||
| 4.00%, due 3/15/36 | 6,750,000 | 6,986,093 |
| Series D | ||
| 4.00%, due 2/15/37 | 5,250,000 | 5,370,108 |
| Series A | ||
| 4.00%, due 3/15/37 | 4,000,000 | 4,104,259 |
| Series A | ||
| 4.00%, due 3/15/37 | 3,200,000 | 3,276,690 |
| Series D | ||
| 4.00%, due 2/15/39 | 4,750,000 | 4,777,754 |
| Series A | ||
| 4.00%, due 3/15/39 | 17,200,000 | 17,429,964 |
| Series E | ||
| 4.00%, due 3/15/39 | 5,815,000 | 5,892,747 |
| Principal Amount | Value | |
| New York (continued) | ||
| New York State Dormitory Authority, State Personal Income Tax, Revenue Bonds (continued) | ||
| Series A | ||
| 4.00%, due 3/15/41 | $ 3,180,000 | $ 3,182,461 |
| Series E | ||
| 4.00%, due 3/15/42 | 8,500,000 | 8,464,315 |
| Series E | ||
| 4.00%, due 3/15/45 | 2,550,000 | 2,517,677 |
| Series E | ||
| 5.00%, due 3/15/34 | 3,440,000 | 3,607,708 |
| Series E | ||
| 5.00%, due 2/15/35 | 2,905,000 | 3,296,993 |
| Series A | ||
| 5.00%, due 3/15/36 | 8,500,000 | 9,409,451 |
| Series A | ||
| 5.00%, due 3/15/46 | 4,750,000 | 5,206,694 |
| New York State Dormitory Authority, School Districts Financing Program, Revenue Bonds | ||
| Series A, Insured: AGM | ||
| 5.00%, due 10/1/34 | 5,000 | 5,637 |
| Series A, Insured: BAM | ||
| 5.00%, due 10/1/36 | 3,750,000 | 4,280,262 |
| New York State Dormitory Authority, University Facilities, Revenue Bonds | ||
| Series A | ||
| 5.00%, due 7/1/36 | 1,000,000 | 1,081,061 |
| New York State Dormitory Authority, Sales Tax, Revenue Bonds | ||
| Series A | ||
| 5.00%, due 3/15/39 | 8,500,000 | 9,017,264 |
| Series A | ||
| 5.00%, due 3/15/40 | 20,130,000 | 21,657,048 |
| Series C | ||
| 5.00%, due 3/15/40 | 12,600,000 | 13,555,827 |
| Series C | ||
| 5.00%, due 3/15/41 | 28,570,000 | 30,660,264 |
| 5.00%, due 3/15/42 | 4,750,000 | 5,083,459 |
| New York State Dormitory Authority, St. John's University, Revenue Bonds | ||
| 5.00%, due 7/1/39 | 7,450,000 | 8,371,125 |
| 5.00%, due 7/1/40 | 7,835,000 | 8,747,289 |
| 36 | MainStay MacKay Tax Free Bond Fund |
| Principal Amount | Value | |
| Long-Term Municipal Bonds (continued) | ||
| New York (continued) | ||
| New York State Dormitory Authority, New York University, Revenue Bonds | ||
| Series A, Insured: NATL-RE | ||
| 5.75%, due 7/1/27 | $ 3,200,000 | $ 3,378,454 |
| New York State Environmental Facilities Corp., Clean Water & Drinking Water, Revenue Bonds | ||
| Series B | ||
| 3.00%, due 6/15/38 | 8,100,000 | 7,334,171 |
| New York State Thruway Authority, Revenue Bonds | ||
| Series B | ||
| 4.00%, due 1/1/38 | 4,250,000 | 4,275,885 |
| Series N | ||
| 5.00%, due 1/1/36 | 13,910,000 | 15,635,142 |
| New York State Thruway Authority, Revenue Bonds, Junior Lien | ||
| Series A | ||
| 5.00%, due 1/1/41 | 5,440,000 | 5,633,973 |
| New York State Thruway Authority, General Revenue Junior Indebtedness Obligation, Revenue Bonds | ||
| Series B, Insured: BAM | ||
| 4.00%, due 1/1/39 | 14,180,000 | 14,209,051 |
| Series B, Insured: AGM | ||
| 4.00%, due 1/1/50 | 4,740,000 | 4,550,287 |
| New York State Thruway Authority, General Revenue Junior Indebtedness Obligation, Revenue Bonds, Junior Lien | ||
| Series B, Insured: BAM | ||
| 4.00%, due 1/1/45 | 4,650,000 | 4,537,103 |
| Series A | ||
| 5.00%, due 1/1/46 | 4,250,000 | 4,361,271 |
| New York State Thruway Authority, State Personal Income Tax, Revenue Bonds | ||
| Series A | ||
| 5.00%, due 3/15/34 | 16,050,000 | 19,172,574 |
| New York State Urban Development Corp., Sales Tax, Revenue Bonds | ||
| Series A | ||
| 3.00%, due 3/15/40 | 6,750,000 | 5,828,555 |
| Series A | ||
| 3.00%, due 3/15/41 | 1,750,000 | 1,489,419 |
| Principal Amount | Value | |
| New York (continued) | ||
| New York State Urban Development Corp., Sales Tax, Revenue Bonds (continued) | ||
| Series A | ||
| 3.00%, due 3/15/42 | $ 8,500,000 | $ 7,121,665 |
| Series A | ||
| 4.00%, due 3/15/37 | 14,250,000 | 14,641,697 |
| Series A | ||
| 4.00%, due 3/15/42 | 8,680,000 | 8,666,323 |
| Series A | ||
| 5.00%, due 3/15/36 | 5,360,000 | 5,994,364 |
| New York State Urban Development Corp., Personal Income Tax, Revenue Bonds | ||
| Series E | ||
| 4.00%, due 3/15/46 | 2,520,000 | 2,458,248 |
| Series A | ||
| 5.00%, due 3/15/30 | 10,450,000 | 11,099,494 |
| Series A | ||
| 5.00%, due 3/15/42 | 15,250,000 | 16,945,224 |
| Series C | ||
| 5.00%, due 3/15/50 | 4,750,000 | 5,137,124 |
| New York Transportation Development Corp., LaGuardia Airport Terminal B Redevelopment Project, Revenue Bonds (c) | ||
| Series A, Insured: AGM | ||
| 4.00%, due 7/1/35 | 10,730,000 | 10,731,788 |
| Series A, Insured: AGM | ||
| 4.00%, due 7/1/37 | 11,770,000 | 11,577,556 |
| New York Transportation Development Corp., Terminal 4 John F. Kennedy International Airport Project, Revenue Bonds (c) | ||
| Insured: AGM-CR | ||
| 5.00%, due 12/1/27 | 4,250,000 | 4,588,614 |
| Insured: AGM-CR | ||
| 5.00%, due 12/1/28 | 4,250,000 | 4,631,023 |
| Insured: AGM-CR | ||
| 5.00%, due 12/1/29 | 7,900,000 | 8,705,796 |
| 5.00%, due 12/1/30 | 1,700,000 | 1,856,076 |
| Onondaga County Trust for Cultural Resources, Syracuse University Project, Revenue Bonds | ||
| 5.00%, due 12/1/43 | 13,060,000 | 14,323,072 |
| 5.00%, due 12/1/45 | 5,640,000 | 6,158,215 |
| Principal Amount | Value | |
| Long-Term Municipal Bonds (continued) | ||
| New York (continued) | ||
| Port Authority of New York & New Jersey, Revenue Bonds (c) | ||
| 4.00%, due 3/15/30 | $ 16,000,000 | $ 16,496,794 |
| Series 223 | ||
| 4.00%, due 7/15/39 | 2,090,000 | 2,031,449 |
| Series 221 | ||
| 4.00%, due 7/15/40 | 2,750,000 | 2,660,054 |
| Series 223 | ||
| 4.00%, due 7/15/46 | 4,175,000 | 3,952,715 |
| Series 185 | ||
| 5.00%, due 9/1/27 | 6,200,000 | 6,313,056 |
| Series 178 | ||
| 5.00%, due 12/1/28 | 6,850,000 | 6,895,421 |
| Series 185 | ||
| 5.00%, due 9/1/31 | 6,750,000 | 6,846,713 |
| Series 185 | ||
| 5.00%, due 9/1/32 | 6,000,000 | 6,083,629 |
| Series 178 | ||
| 5.00%, due 12/1/32 | 4,750,000 | 4,779,592 |
| Series 178 | ||
| 5.00%, due 12/1/33 | 7,600,000 | 7,646,475 |
| Series 218 | ||
| 5.00%, due 11/1/44 | 2,750,000 | 2,890,083 |
| Series 234 | ||
| 5.25%, due 8/1/47 | 18,635,000 | 20,368,191 |
| Series 231 | ||
| 5.50%, due 8/1/39 | 7,600,000 | 8,745,912 |
| Series 231 | ||
| 5.50%, due 8/1/47 | 18,000,000 | 20,077,407 |
| Series 231 | ||
| 5.50%, due 8/1/52 | 3,415,000 | 3,786,043 |
| Series 234 | ||
| 5.50%, due 8/1/52 | 2,675,000 | 2,965,642 |
| Rensselaer City School District, Certificate of Participation | ||
| Insured: AGM State Aid Withholding | ||
| 5.00%, due 6/1/30 | 1,880,000 | 1,983,972 |
| Insured: AGM State Aid Withholding | ||
| 5.00%, due 6/1/32 | 2,000,000 | 2,108,801 |
| State of New York, Unlimited General Obligation | ||
| Series A | ||
| 3.00%, due 3/15/34 | 2,250,000 | 2,247,475 |
| Suffolk County Water Authority, Revenue Bonds | ||
| 3.00%, due 6/1/45 | 3,875,000 | 3,130,692 |
| Principal Amount | Value | |
| New York (continued) | ||
| Suffolk County Water Authority, Waterworks, Revenue Bonds | ||
| Series A | ||
| 3.75%, due 6/1/36 | $ 15,470,000 | $ 15,475,365 |
| Triborough Bridge & Tunnel Authority, Payroll Mobility Tax, Revenue Bonds, Senior Lien | ||
| Series C-3 | ||
| 3.00%, due 5/15/51 | 8,750,000 | 6,649,504 |
| Series D-2 | ||
| 4.50%, due 5/15/47 | 10,000,000 | 10,317,631 |
| Series D-2 | ||
| 5.25%, due 5/15/47 | 22,750,000 | 25,650,887 |
| Series C | ||
| 5.25%, due 5/15/52 | 5,000,000 | 5,575,554 |
| Series D-2 | ||
| 5.50%, due 5/15/52 | 28,550,000 | 32,753,748 |
| Triborough Bridge & Tunnel Authority, Payroll Mobility Tax, Revenue Bonds | ||
| Series C | ||
| 4.00%, due 11/15/42 | 4,335,000 | 4,310,686 |
| Triborough Bridge & Tunnel Authority, MTA Bridges & Tunnels, Revenue Bonds | ||
| Series C | ||
| 4.00%, due 11/15/41 | 10,250,000 | 10,256,951 |
| Series B | ||
| 5.00%, due 11/15/35 | 7,260,000 | 7,843,063 |
| Series B | ||
| 5.00%, due 11/15/37 | 2,850,000 | 3,057,201 |
| Series A | ||
| 5.00%, due 11/15/41 | 4,750,000 | 4,920,435 |
| Series A | ||
| 5.00%, due 11/15/42 | 5,005,000 | 5,390,011 |
| Series A | ||
| 5.00%, due 11/15/46 | 9,695,000 | 10,320,942 |
| Series A | ||
| 5.00%, due 11/15/46 | 2,250,000 | 2,316,397 |
| Triborough Bridge & Tunnel Authority, Sales Tax, Revenue Bonds | ||
| Series A | ||
| 5.25%, due 5/15/52 | 20,750,000 | 23,143,033 |
| Series A | ||
| 5.50%, due 5/15/63 | 4,340,000 | 4,881,203 |
| 38 | MainStay MacKay Tax Free Bond Fund |
| Principal Amount | Value | |
| Long-Term Municipal Bonds (continued) | ||
| New York (continued) | ||
| TSASC, Inc., Tobacco Settlement Bonds, Revenue Bonds | ||
| Series A | ||
| 5.00%, due 6/1/34 | $ 5,890,000 | $ 6,134,330 |
| Series A | ||
| 5.00%, due 6/1/35 | 2,365,000 | 2,451,596 |
| Utility Debt Securitization Authority, Revenue Bonds | ||
| Series TE | ||
| 5.00%, due 12/15/31 | 2,750,000 | 2,781,340 |
| Series E-1 | ||
| 5.00%, due 12/15/39 | 9,500,000 | 11,007,937 |
| 1,270,268,534 | ||
| North Carolina 0.1% | ||
| North Carolina Housing Finance Agency, Revenue Bonds | ||
| Series 49, Insured: GNMA / FNMA / FHLMC | ||
| 6.00%, due 7/1/53 | 8,500,000 | 9,304,317 |
| Ohio 1.0% | ||
| American Municipal Power, Inc., Prairie State Energy Campus Project, Revenue Bonds | ||
| Series A, Insured: BAM | ||
| 4.00%, due 2/15/34 | 23,160,000 | 24,330,134 |
| Series A, Insured: BAM | ||
| 5.00%, due 2/15/33 | 3,450,000 | 3,931,574 |
| Buckeye Tobacco Settlement Financing Authority, Revenue Bonds, Senior Lien | ||
| Series A-2, Class 1 | ||
| 5.00%, due 6/1/36 | 4,250,000 | 4,538,972 |
| Clermont County Port Authority, West Clermont Local School District Project, Revenue Bonds | ||
| Insured: BAM | ||
| 5.00%, due 12/1/32 | 2,200,000 | 2,299,780 |
| Insured: BAM | ||
| 5.00%, due 12/1/33 | 1,335,000 | 1,394,873 |
| Cleveland-Cuyahoga County Port Authority, Annual Appropriation Bonds, Revenue Bonds | ||
| 6.00%, due 11/15/25 | 1,260,000 | 1,262,461 |
| Principal Amount | Value | |
| Ohio (continued) | ||
| County of Franklin, Ohio Hospital, Revenue Bonds | ||
| 5.00%, due 5/15/40 | $ 5,750,000 | $ 5,866,922 |
| Ohio Higher Educational Facility Commission, Ashtabula County Medical Center Obligated Group, Revenue Bonds | ||
| 5.00%, due 1/1/30 | 210,000 | 226,958 |
| 5.00%, due 1/1/34 | 360,000 | 394,374 |
| 5.25%, due 1/1/36 | 495,000 | 542,308 |
| 5.25%, due 1/1/52 | 2,500,000 | 2,565,086 |
| Ohio Housing Finance Agency, Residential Mortgage, Revenue Bonds | ||
| Series A, Insured: GNMA / FNMA / FHLMC | ||
| 4.50%, due 9/1/48 | 2,570,000 | 2,594,163 |
| University of Cincinnati, Revenue Bonds | ||
| Series C | ||
| 5.00%, due 6/1/46 | 2,250,000 | 2,321,593 |
| Worthington City School District, Unlimited General Obligation | ||
| 5.50%, due 12/1/54 | 25,055,000 | 28,663,401 |
| 80,932,599 | ||
| Oklahoma 0.2% | ||
| Garfield County Educational Facilities Authority, Enid Public Schools Project, Revenue Bonds | ||
| Series A | ||
| 5.00%, due 9/1/28 | 4,000,000 | 4,225,485 |
| Lincoln County Educational Facilities Authority, Stroud Public Schools Project, Revenue Bonds | ||
| 5.00%, due 9/1/28 | 2,450,000 | 2,587,316 |
| 5.00%, due 9/1/29 | 2,120,000 | 2,234,703 |
| Oklahoma Turnpike Authority, Revenue Bonds, Second Series | ||
| Series C | ||
| 4.00%, due 1/1/42 | 4,250,000 | 4,270,814 |
| Weatherford Industrial Trust, Custer County Independent School District No. 26 Weatherford, Revenue Bonds | ||
| 5.00%, due 3/1/31 | 1,820,000 | 2,015,863 |
| 5.00%, due 3/1/33 | 2,000,000 | 2,208,760 |
| 17,542,941 | ||
| Principal Amount | Value | |
| Long-Term Municipal Bonds (continued) | ||
| Oregon 0.3% | ||
| Multnomah County School District No. 40, Unlimited General Obligation | ||
| Series B, Insured: School Bond Guaranty | ||
| 5.50%, due 6/15/53 | $ 8,875,000 | $ 10,180,189 |
| Port of Portland, Airport, Revenue Bonds | ||
| Series A | ||
| 5.00%, due 7/1/37 (c) | 8,850,000 | 9,479,500 |
| State of Oregon, Unlimited General Obligation | ||
| Series F | ||
| 5.00%, due 5/1/30 | 3,800,000 | 4,051,884 |
| 5.00%, due 5/1/42 | 2,795,000 | 2,949,526 |
| 26,661,099 | ||
| Pennsylvania 2.5% | ||
| City of Philadelphia, Unlimited General Obligation | ||
| Series A | ||
| 5.00%, due 5/1/32 | 3,750,000 | 4,358,603 |
| City of Philadelphia, Water & Wastewater, Revenue Bonds | ||
| Series C | ||
| 5.50%, due 6/1/52 | 11,400,000 | 12,684,535 |
| Commonwealth Financing Authority, Tobacco Master Settlement Payment, Revenue Bonds | ||
| Insured: AGM | ||
| 4.00%, due 6/1/39 | 5,000,000 | 4,923,823 |
| Insured: BAM | ||
| 5.00%, due 6/1/31 | 8,450,000 | 9,246,315 |
| Commonwealth Financing Authority, Revenue Bonds | ||
| Series C, Insured: AGM | ||
| 5.197%, due 6/1/26 | 7,990,000 | 7,988,193 |
| Commonwealth of Pennsylvania, Unlimited General Obligation, First Series | ||
| Series 1 | ||
| 4.00%, due 4/1/31 | 9,500,000 | 9,506,547 |
| Series 1 | ||
| 4.00%, due 4/1/32 | 20,600,000 | 20,617,129 |
| Delaware River Port Authority, Revenue Bonds | ||
| 5.00%, due 1/1/37 | 11,500,000 | 11,632,887 |
| Principal Amount | Value | |
| Pennsylvania (continued) | ||
| Lancaster County Hospital Authority, University of Pennsylvania Health System Obligated Group (The), Revenue Bonds | ||
| Series B | ||
| 5.00%, due 8/15/46 | $ 6,000,000 | $ 6,142,390 |
| Pennsylvania Economic Development Financing Authority, UPMC Obligated Group, Revenue Bonds | ||
| Series A | ||
| 4.00%, due 11/15/36 | 4,215,000 | 4,236,777 |
| Pennsylvania Economic Development Financing Authority, Penndot Major Bridges Project, Revenue Bonds | ||
| Insured: AGM | ||
| 5.75%, due 12/31/62 (c) | 24,960,000 | 27,640,614 |
| Pennsylvania Higher Educational Facilities Authority, University of Pennsylvania Health System, Revenue Bonds | ||
| 4.00%, due 8/15/49 | 19,640,000 | 18,882,177 |
| 5.00%, due 8/15/49 | 4,450,000 | 4,613,580 |
| Pennsylvania Housing Finance Agency, Revenue Bonds | ||
| Series A-141 | ||
| 5.75%, due 10/1/53 | 6,560,000 | 7,090,642 |
| Pennsylvania State University (The), Revenue Bonds | ||
| Series A | ||
| 5.00%, due 9/1/48 | 4,750,000 | 5,110,135 |
| Pennsylvania Turnpike Commission, Revenue Bonds | ||
| 5.00%, due 6/1/29 | 2,265,000 | 2,393,630 |
| Pennsylvania Turnpike Commission, Revenue Bonds, Second Series | ||
| 5.00%, due 12/1/35 | 2,500,000 | 2,690,909 |
| Philadelphia Authority for Industrial Development, St. Joseph's University Project, Revenue Bonds | ||
| 5.25%, due 11/1/52 | 3,250,000 | 3,484,214 |
| Philadelphia Gas Works Co., Revenue Bonds | ||
| Series A, Insured: AGM | ||
| 5.00%, due 8/1/50 | 3,080,000 | 3,281,011 |
| Pittsburgh Water & Sewer Authority, Revenue Bonds, First Lien | ||
| Series B | ||
| 5.25%, due 9/1/40 | 4,250,000 | 4,265,905 |
| 40 | MainStay MacKay Tax Free Bond Fund |
| Principal Amount | Value | |
| Long-Term Municipal Bonds (continued) | ||
| Pennsylvania (continued) | ||
| State Public School Building Authority, Philadelphia Community College, Revenue Bonds | ||
| Series A, Insured: BAM | ||
| 5.00%, due 6/15/28 | $ 4,505,000 | $ 4,647,955 |
| State Public School Building Authority, School District of Philadelphia (The), Revenue Bonds | ||
| Series A, Insured: AGM State Aid Withholding | ||
| 5.00%, due 6/1/31 | 25,475,000 | 27,077,319 |
| 202,515,290 | ||
| Puerto Rico 0.3% | ||
| Puerto Rico Commonwealth Aqueduct & Sewer Authority, Revenue Bonds, Senior Lien | ||
| Series A, Insured: AGC-ICC | ||
| 6.125%, due 7/1/24 | 290,000 | 292,655 |
| Puerto Rico Electric Power Authority, Revenue Bonds | ||
| Series DDD, Insured: AGM | ||
| 3.625%, due 7/1/23 | 2,865,000 | 2,859,538 |
| Series UU, Insured: AGC | ||
| 4.25%, due 7/1/27 | 2,345,000 | 2,294,221 |
| Series NN, Insured: NATL-RE | ||
| 4.75%, due 7/1/33 | 1,140,000 | 1,140,791 |
| Series PP, Insured: NATL-RE | ||
| 5.00%, due 7/1/23 | 855,000 | 854,999 |
| Series SS, Insured: NATL-RE | ||
| 5.00%, due 7/1/23 | 825,000 | 824,999 |
| Series UU, Insured: AGM | ||
| 5.00%, due 7/1/23 | 2,040,000 | 2,052,835 |
| Series PP, Insured: NATL-RE | ||
| 5.00%, due 7/1/24 | 2,415,000 | 2,417,121 |
| Series UU, Insured: AGM | ||
| 5.00%, due 7/1/24 | 3,915,000 | 3,939,632 |
| Series TT, Insured: AGM-CR | ||
| 5.00%, due 7/1/27 | 500,000 | 503,146 |
| Series SS, Insured: AGM | ||
| 5.00%, due 7/1/30 | 550,000 | 553,460 |
| Series VV, Insured: NATL-RE | ||
| 5.25%, due 7/1/26 | 1,575,000 | 1,582,986 |
| Series VV, Insured: NATL-RE | ||
| 5.25%, due 7/1/29 | 1,470,000 | 1,480,735 |
| Series VV, Insured: NATL-RE | ||
| 5.25%, due 7/1/32 | 1,225,000 | 1,230,659 |
| Principal Amount | Value | |
| Puerto Rico (continued) | ||
| Puerto Rico Electric Power Authority, Revenue Bonds (continued) | ||
| Series VV, Insured: NATL-RE | ||
| 5.25%, due 7/1/34 | $ 550,000 | $ 552,961 |
| Puerto Rico Municipal Finance Agency, Revenue Bonds | ||
| Series A, Insured: AGM | ||
| 5.00%, due 8/1/27 | 260,000 | 261,636 |
| Series A, Insured: AGM | ||
| 5.00%, due 8/1/30 | 1,440,000 | 1,449,060 |
| Series C, Insured: AGC | ||
| 5.25%, due 8/1/23 | 320,000 | 321,512 |
| Puerto Rico Sales Tax Financing Corp., Revenue Bonds | ||
| Insured: BHAC-CR | ||
| (zero coupon), due 8/1/54 | 98,098 | 20,050 |
| 24,632,996 | ||
| Rhode Island 0.0% ‡ | ||
| Providence Public Building Authority, Various Capital Projects, Revenue Bonds | ||
| Series A, Insured: AGM | ||
| 5.875%, due 6/15/26 | 1,285,000 | 1,287,520 |
| Rhode Island Health and Educational Building Corp., Public Schools Financing Program, Revenue Bonds | ||
| Series B | ||
| 5.00%, due 5/15/36 | 1,205,000 | 1,325,154 |
| 2,612,674 | ||
| South Carolina 1.5% | ||
| Beaufort County School District, Unlimited General Obligation | ||
| Series B, Insured: SCSDE | ||
| 3.50%, due 3/1/28 | 2,835,000 | 2,845,934 |
| Series B, Insured: SCSDE | ||
| 3.50%, due 3/1/29 | 2,500,000 | 2,510,248 |
| Series B, Insured: SCSDE | ||
| 3.50%, due 3/1/30 | 5,330,000 | 5,352,964 |
| Berkeley County School District, Unlimited General Obligation | ||
| Series C, Insured: SCSDE | ||
| 2.50%, due 3/1/24 | 4,110,000 | 4,024,103 |
| City of Columbia, Waterworks & Sewer System, Revenue Bonds | ||
| 5.25%, due 2/1/52 | 5,310,000 | 6,002,688 |
| Principal Amount | Value | |
| Long-Term Municipal Bonds (continued) | ||
| South Carolina (continued) | ||
| Patriots Energy Group Financing Agency, Gas Supply, Revenue Bonds | ||
| Series A | ||
| 4.00%, due 10/1/48 (a) | $ 16,520,000 | $ 16,549,746 |
| South Carolina Public Service Authority, Revenue Bonds | ||
| Series B, Insured: AGM-CR | ||
| 4.00%, due 12/1/29 | 4,167,000 | 4,367,223 |
| Series A, Insured: BAM | ||
| 4.00%, due 12/1/40 | 5,450,000 | 5,409,078 |
| Series A, Insured: AGM-CR | ||
| 5.00%, due 12/1/31 | 2,250,000 | 2,542,869 |
| Series A, Insured: AGM-CR | ||
| 5.00%, due 12/1/32 | 8,500,000 | 8,963,625 |
| Series A, Insured: AGM-CR | ||
| 5.00%, due 12/1/36 | 12,750,000 | 14,163,953 |
| Series E, Insured: AGM | ||
| 5.00%, due 12/1/52 | 14,250,000 | 15,133,044 |
| Series E, Insured: AGM | ||
| 5.50%, due 12/1/42 | 9,125,000 | 10,242,447 |
| South Carolina Public Service Authority, Santee Cooper Project, Revenue Bonds | ||
| Series B, Insured: BAM | ||
| 4.00%, due 12/1/55 | 3,000 | 2,798 |
| Series B | ||
| 5.00%, due 12/1/51 | 2,000,000 | 2,047,125 |
| South Carolina Transportation Infrastructure Bank, Revenue Bonds | ||
| Series A | ||
| 5.00%, due 10/1/36 | 12,950,000 | 14,008,091 |
| Sumter Two School Facilities, Inc., Sumter School District Project, Revenue Bonds | ||
| Series C, Insured: BAM | ||
| 5.00%, due 12/1/27 | 1,100,000 | 1,159,838 |
| 115,325,774 | ||
| South Dakota 0.1% | ||
| South Dakota Conservancy District, State Revolving Fund Program, Revenue Bonds | ||
| 5.00%, due 8/1/37 | 1,750,000 | 1,925,867 |
| 5.00%, due 8/1/38 | 2,250,000 | 2,465,347 |
| Principal Amount | Value | |
| South Dakota (continued) | ||
| South Dakota Housing Development Authority, Revenue Bonds | ||
| Series A, Insured: GNMA / FNMA / FHLMC | ||
| 6.00%, due 5/1/54 | $ 5,250,000 | $ 5,730,926 |
| 10,122,140 | ||
| Tennessee 0.7% | ||
| Metropolitan Government of Nashville & Davidson County, Unlimited General Obligation | ||
| Series A | ||
| 4.00%, due 1/1/40 | 4,500,000 | 4,582,399 |
| Metropolitan Nashville Airport Authority (The), Revenue Bonds (c) | ||
| Series B | ||
| 5.00%, due 7/1/44 | 10,225,000 | 10,668,768 |
| Series B | ||
| 5.25%, due 7/1/47 | 5,250,000 | 5,610,151 |
| Series B | ||
| 5.50%, due 7/1/40 | 2,000,000 | 2,228,166 |
| Series B | ||
| 5.50%, due 7/1/41 | 3,000,000 | 3,328,172 |
| Series B | ||
| 5.50%, due 7/1/52 | 7,000,000 | 7,587,770 |
| Tennessee Energy Acquisition Corp., Revenue Bonds (a) | ||
| 4.00%, due 11/1/49 | 1,250,000 | 1,250,450 |
| Series A | ||
| 5.00%, due 5/1/52 | 10,000,000 | 10,590,970 |
| Series A-1 | ||
| 5.00%, due 5/1/53 | 9,000,000 | 9,365,896 |
| Tennessee Housing Development Agency, Revenue Bonds | ||
| 4.50%, due 7/1/49 | 3,565,000 | 3,598,518 |
| 58,811,260 | ||
| Texas 8.2% | ||
| Aldine Independent School District, Unlimited General Obligation | ||
| Insured: PSF-GTD | ||
| 4.00%, due 2/15/31 | 11,000,000 | 11,185,602 |
| Argyle Independent School District, Unlimited General Obligation | ||
| Insured: PSF-GTD | ||
| 5.00%, due 8/15/47 | 16,275,000 | 18,039,975 |
| 42 | MainStay MacKay Tax Free Bond Fund |
| Principal Amount | Value | |
| Long-Term Municipal Bonds (continued) | ||
| Texas (continued) | ||
| Arlington Higher Education Finance Corp., Harmony Public Schools, Revenue Bonds | ||
| Series A, Insured: PSF-GTD | ||
| 5.00%, due 2/15/35 | $ 3,450,000 | $ 3,533,735 |
| Austin Independent School District, Unlimited General Obligation | ||
| 5.00%, due 8/1/43 | 3,750,000 | 4,264,182 |
| Bexar County Hospital District, Certificates of Obligation, Limited General Obligation | ||
| 4.00%, due 2/15/37 | 3,450,000 | 3,463,554 |
| Central Texas Turnpike System, Revenue Bonds | ||
| Series C | ||
| 5.00%, due 8/15/28 | 2,070,000 | 2,113,889 |
| Series C | ||
| 5.00%, due 8/15/34 | 5,200,000 | 5,302,709 |
| Series C | ||
| 5.00%, due 8/15/42 | 2,135,000 | 2,158,123 |
| City of Arlington, Special Tax, Special Tax, Senior Lien | ||
| Series A, Insured: AGM | ||
| 5.00%, due 2/15/48 | 7,500,000 | 7,847,577 |
| City of Austin, Water & Wastewater System, Revenue Bonds | ||
| Series A | ||
| 3.35%, due 5/15/29 | 4,250,000 | 4,252,817 |
| City of Austin, Airport System, Revenue Bonds | ||
| 5.00%, due 11/15/44 | 4,750,000 | 4,761,098 |
| 5.00%, due 11/15/52 | 10,750,000 | 11,224,781 |
| 5.25%, due 11/15/47 | 12,750,000 | 13,654,002 |
| City of Austin, Electric Utility, Revenue Bonds | ||
| 5.00%, due 11/15/45 | 5,070,000 | 5,186,379 |
| City of Celina, Limited General Obligation | ||
| 5.00%, due 9/1/47 | 7,600,000 | 8,326,622 |
| City of Dallas, Hotel Occupancy Tax, Revenue Bonds | ||
| 4.00%, due 8/15/36 | 1,150,000 | 1,150,802 |
| City of El Paso, Limited General Obligation | ||
| Insured: BAM | ||
| 4.00%, due 8/15/42 | 16,040,000 | 16,078,409 |
| Principal Amount | Value | |
| Texas (continued) | ||
| City of Georgetown, Utility System, Revenue Bonds | ||
| Insured: AGM | ||
| 5.25%, due 8/15/52 | $ 4,700,000 | $ 5,128,968 |
| City of Houston, Public Improvement, Limited General Obligation | ||
| Series A | ||
| 5.00%, due 3/1/28 | 3,445,000 | 3,749,808 |
| City of Houston, Hotel Occupancy Tax & Special Tax, Revenue Bonds | ||
| 5.00%, due 9/1/31 | 2,200,000 | 2,232,379 |
| 5.00%, due 9/1/34 | 1,550,000 | 1,566,785 |
| City of Lubbock, Electric Light & Power System, Revenue Bonds | ||
| 4.00%, due 4/15/46 | 8,150,000 | 7,814,214 |
| Insured: AGM-CR | ||
| 4.00%, due 4/15/51 | 6,290,000 | 6,114,888 |
| City of San Antonio, Electric & Gas Systems, Revenue Bonds | ||
| 4.00%, due 2/1/28 | 2,750,000 | 2,829,812 |
| 5.00%, due 2/1/26 | 4,000,000 | 4,232,014 |
| City of San Antonio, Electric & Gas Systems, Revenue Bonds, Junior Lien | ||
| 4.00%, due 2/1/43 | 5,755,000 | 5,631,232 |
| Cleburne Independent School District, Unlimited General Obligation | ||
| Insured: PSF-GTD | ||
| 5.00%, due 2/15/35 | 6,000,000 | 6,275,003 |
| Collin County Community College District, Limited General Obligation | ||
| 3.50%, due 8/15/37 | 4,250,000 | 4,100,058 |
| Conroe Independent School District, Unlimited General Obligation | ||
| Insured: PSF-GTD | ||
| 5.00%, due 2/15/24 | 2,380,000 | 2,413,784 |
| Corpus Christi Independent School District, Unlimited General Obligation | ||
| Insured: PSF-GTD | ||
| 5.00%, due 8/15/37 | 3,250,000 | 3,356,879 |
| County of Harris, Limited General Obligation | ||
| Series A | ||
| 5.00%, due 10/1/38 | 4,500,000 | 4,660,119 |
| Principal Amount | Value | |
| Long-Term Municipal Bonds (continued) | ||
| Texas (continued) | ||
| Cypress-Fairbanks Independent School District, Unlimited General Obligation | ||
| Series A, Insured: PSF-GTD | ||
| 3.30%, due 2/15/30 | $ 3,500,000 | $ 3,492,719 |
| Dallas Area Rapid Transit, Revenue Bonds, Senior Lien | ||
| Series A | ||
| 5.00%, due 12/1/45 | 6,980,000 | 7,568,548 |
| Dallas Fort Worth International Airport, Revenue Bonds | ||
| Series C | ||
| 0.632%, due 11/1/23 | 1,705,000 | 1,667,500 |
| Series B, Insured: BAM | ||
| 4.00%, due 11/1/35 | 19,790,000 | 20,448,734 |
| Series E | ||
| 5.25%, due 11/1/33 (c) | 3,220,000 | 3,238,631 |
| Fort Bend Grand Parkway Toll Road Authority, Revenue Bonds, Sub. Lien | ||
| 3.00%, due 3/1/46 | 6,250,000 | 4,901,800 |
| Fredericksburg Independent School District, Unlimited General Obligation | ||
| Insured: PSF-GTD | ||
| 5.00%, due 2/15/47 | 7,795,000 | 8,669,852 |
| Lamar Consolidated Independent School District, Unlimited General Obligation | ||
| Insured: AGM | ||
| 5.50%, due 2/15/58 | 50,450,000 | 57,443,974 |
| Leander Independent School District, Unlimited General Obligation | ||
| Series A, Insured: PSF-GTD | ||
| 5.00%, due 8/15/38 | 8,910,000 | 9,177,281 |
| Series A, Insured: PSF-GTD | ||
| 5.00%, due 8/15/39 | 6,575,000 | 6,762,040 |
| Love Field Airport Modernization Corp., Revenue Bonds | ||
| Insured: AGM | ||
| 4.00%, due 11/1/40 (c) | 5,750,000 | 5,608,532 |
| Lower Colorado River Authority, LCRA Transmission Services Corp., Revenue Bonds | ||
| Series A | ||
| 5.00%, due 5/15/50 | 4,400,000 | 4,680,085 |
| Principal Amount | Value | |
| Texas (continued) | ||
| Lower Colorado River Authority, LCRA Transmission Services Corp., Revenue Bonds (continued) | ||
| Insured: AGM-CR | ||
| 5.00%, due 5/15/51 | $ 6,270,000 | $ 6,697,457 |
| Insured: AGM | ||
| 5.50%, due 5/15/48 | 8,100,000 | 9,140,051 |
| Insured: AGM | ||
| 5.50%, due 5/15/53 | 26,875,000 | 30,100,215 |
| North Texas Municipal Water District, Sabine Creek Regional Wastewater System, Revenue Bonds | ||
| Insured: AGM | ||
| 4.375%, due 6/1/52 | 7,200,000 | 7,221,495 |
| North Texas Tollway Authority, Revenue Bonds, Second Tier | ||
| Series B | ||
| 3.00%, due 1/1/51 | 11,660,000 | 8,589,014 |
| Series B | ||
| 5.00%, due 1/1/39 | 4,500,000 | 4,729,956 |
| North Texas Tollway Authority, Revenue Bonds, First Tier | ||
| Series A | ||
| 4.125%, due 1/1/39 | 2,250,000 | 2,291,136 |
| Series A | ||
| 4.125%, due 1/1/40 | 4,750,000 | 4,795,901 |
| Series A | ||
| 5.00%, due 1/1/27 | 7,270,000 | 7,350,867 |
| Series A | ||
| 5.25%, due 1/1/38 | 6,700,000 | 7,599,797 |
| North Texas Tollway Authority, Revenue Bonds | ||
| Series A | ||
| 5.00%, due 1/1/34 | 1,400,000 | 1,445,266 |
| Series A | ||
| 5.00%, due 1/1/35 | 2,450,000 | 2,525,344 |
| Series A, Insured: BAM | ||
| 5.00%, due 1/1/38 | 8,175,000 | 8,376,036 |
| Series B | ||
| 5.00%, due 1/1/45 | 5,200,000 | 5,295,391 |
| Northwest Independent School District, Unlimited General Obligation | ||
| Series B, Insured: PSF-GTD | ||
| 5.00%, due 2/15/25 | 4,500,000 | 4,660,601 |
| 44 | MainStay MacKay Tax Free Bond Fund |
| Principal Amount | Value | |
| Long-Term Municipal Bonds (continued) | ||
| Texas (continued) | ||
| Prosper Independent School District, Unlimited General Obligation | ||
| Insured: PSF-GTD | ||
| 5.00%, due 2/15/48 | $ 4,750,000 | $ 4,995,535 |
| Rockwall Independent School District, Unlimited General Obligation | ||
| Insured: PSF-GTD | ||
| 5.25%, due 2/15/48 (b) | 11,000,000 | 12,475,266 |
| San Antonio Water System, Revenue Bonds, Junior Lien | ||
| Series B | ||
| 5.25%, due 5/15/52 | 42,750,000 | 46,812,541 |
| State of Texas, Unlimited General Obligation | ||
| Series A | ||
| 3.00%, due 8/1/27 | 2,075,000 | 2,072,827 |
| Series A | ||
| 3.30%, due 10/1/29 | 10,900,000 | 10,936,273 |
| Series D | ||
| 3.40%, due 5/15/31 | 2,000,000 | 2,007,963 |
| Series A | ||
| 5.00%, due 10/1/32 | 5,000,000 | 5,232,277 |
| 5.00%, due 4/1/33 | 10,500,000 | 11,046,783 |
| Series A | ||
| 5.00%, due 10/1/36 | 20,000,000 | 20,730,436 |
| Series A | ||
| 5.00%, due 4/1/37 | 4,525,000 | 4,714,447 |
| Series B | ||
| 5.00%, due 8/1/39 | 2,000,000 | 2,059,187 |
| Series B | ||
| 5.00%, due 8/1/41 | 4,750,000 | 4,875,061 |
| 5.00%, due 4/1/43 | 7,390,000 | 7,616,618 |
| Tarrant County Cultural Education Facilities Finance Corp., Buckner Retirement Services, Revenue Bonds | ||
| Series B | ||
| 5.00%, due 11/15/46 | 2,840,000 | 2,772,016 |
| Texas Department of Housing & Community Affairs, Residential Mortgage, Revenue Bonds | ||
| Series A, Insured: GNMA / FNMA | ||
| 4.75%, due 1/1/49 | 15,000 | 15,197 |
| Texas Department of Housing & Community Affairs, Revenue Bonds | ||
| Series B, Insured: GNMA | ||
| 6.00%, due 3/1/53 | 11,800,000 | 13,087,990 |
| Principal Amount | Value | |
| Texas (continued) | ||
| Texas Municipal Gas Acquisition & Supply Corp. III, Gas Supply, Revenue Bonds | ||
| 5.00%, due 12/15/25 | $ 1,525,000 | $ 1,548,120 |
| 5.00%, due 12/15/26 | 1,675,000 | 1,715,895 |
| 5.00%, due 12/15/27 | 8,430,000 | 8,707,953 |
| 5.00%, due 12/15/28 | 3,000,000 | 3,125,225 |
| 5.00%, due 12/15/31 | 10,075,000 | 10,605,489 |
| Texas Private Activity Bond Surface Transportation Corp., LBJ Infrastructure Group LLC, Revenue Bonds, Senior Lien | ||
| Series A | ||
| 4.00%, due 6/30/35 | 2,300,000 | 2,295,214 |
| Texas Public Finance Authority, Financing System-Texas Southern University, Revenue Bonds | ||
| Insured: BAM | ||
| 4.00%, due 5/1/31 | 1,000,000 | 1,024,258 |
| Insured: BAM | ||
| 4.00%, due 5/1/32 | 1,295,000 | 1,325,968 |
| Texas State Technical College, Revenue Bonds | ||
| Series A, Insured: AGM | ||
| 5.50%, due 8/1/42 | 3,750,000 | 4,283,250 |
| Texas Water Development Board, State Water Implementation Fund, Revenue Bonds | ||
| 4.65%, due 10/15/40 | 3,505,000 | 3,810,659 |
| Series A | ||
| 5.00%, due 10/15/45 | 2,750,000 | 2,832,144 |
| Texas Water Development Board, State Revolving Fund, Revenue Bonds | ||
| 5.00%, due 8/1/41 | 16,440,000 | 18,514,256 |
| Town of Prosper, Certificates Of Obligation, Limited General Obligation | ||
| 4.00%, due 2/15/31 | 1,235,000 | 1,306,305 |
| Upper Brushy Creek Water Control and Improvement District, Unlimited General Obligation | ||
| 3.00%, due 8/15/47 | 2,885,000 | 2,239,231 |
| Principal Amount | Value | |
| Long-Term Municipal Bonds (continued) | ||
| Texas (continued) | ||
| Van Alstyne Independent School District, Unlimited General Obligation | ||
| Insured: PSF-GTD | ||
| 5.00%, due 2/15/47 | $ 10,400,000 | $ 11,623,555 |
| 653,536,361 | ||
| U.S. Virgin Islands 1.0% | ||
| Matching Fund Special Purpose Securitization Corp., Revenue Bonds | ||
| Series A | ||
| 5.00%, due 10/1/28 | 5,000,000 | 5,097,434 |
| Series A | ||
| 5.00%, due 10/1/30 | 11,805,000 | 12,016,666 |
| Series A | ||
| 5.00%, due 10/1/32 | 11,805,000 | 11,981,476 |
| Series A | ||
| 5.00%, due 10/1/39 | 35,670,000 | 35,119,205 |
| Virgin Islands Public Finance Authority, Revenue Bonds | ||
| 5.00%, due 9/1/30 (d) | 4,700,000 | 4,808,165 |
| Series C, Insured: AGM-CR | ||
| 5.00%, due 10/1/39 | 7,575,000 | 7,653,920 |
| 76,676,866 | ||
| Utah 2.6% | ||
| City of Salt Lake City, Airport, Revenue Bonds | ||
| Series A, Insured: BAM | ||
| 4.00%, due 7/1/41 (c) | 7,250,000 | 7,059,609 |
| Series A | ||
| 5.00%, due 7/1/31 (c) | 6,155,000 | 6,871,387 |
| Series A | ||
| 5.00%, due 7/1/32 (c) | 3,750,000 | 4,168,640 |
| Series A | ||
| 5.00%, due 7/1/42 (c) | 11,090,000 | 11,398,748 |
| Series A, Insured: BAM | ||
| 5.00%, due 7/1/43 (c) | 19,305,000 | 20,014,472 |
| Series A | ||
| 5.00%, due 7/1/46 (c) | 4,750,000 | 4,957,674 |
| Series A | ||
| 5.00%, due 7/1/47 | 21,820,000 | 22,291,788 |
| Series A | ||
| 5.25%, due 7/1/48 (c) | 4,710,000 | 4,889,093 |
| Principal Amount | Value | |
| Utah (continued) | ||
| City of Salt Lake City, Public Utilities, Revenue Bonds | ||
| 5.00%, due 2/1/52 | $ 7,975,000 | $ 8,770,210 |
| County of Utah, IHC Health Services, Inc., Revenue Bonds | ||
| Series A | ||
| 5.00%, due 5/15/45 | 3,000,000 | 3,038,694 |
| Series B | ||
| 5.00%, due 5/15/46 | 7,090,000 | 7,287,240 |
| Intermountain Power Agency, Revenue Bonds | ||
| Series A | ||
| 4.00%, due 7/1/36 | 9,500,000 | 9,883,691 |
| Series A | ||
| 5.00%, due 7/1/32 | 3,250,000 | 3,841,144 |
| Series A | ||
| 5.00%, due 7/1/33 | 5,950,000 | 7,020,634 |
| Series A | ||
| 5.00%, due 7/1/43 | 2,000,000 | 2,211,390 |
| Series A | ||
| 5.00%, due 7/1/45 | 19,595,000 | 21,551,739 |
| State of Utah, Unlimited General Obligation | ||
| 3.00%, due 7/1/33 | 5,450,000 | 5,405,173 |
| Utah Board of Higher Education, Revenue Bonds | ||
| Series A, Insured: NATL-RE | ||
| 5.50%, due 4/1/29 | 5,700,000 | 6,361,448 |
| Utah Charter School Finance Authority, Spectrum Academy Project, Revenue Bonds | ||
| Insured: BAM UT CSCE | ||
| 4.00%, due 4/15/45 | 1,750,000 | 1,613,107 |
| Utah Housing Corp., Mortgage-Backed, Revenue Bonds | ||
| Series H, Insured: GNMA | ||
| 4.50%, due 10/21/48 | 579,546 | 574,125 |
| Series J, Insured: GNMA | ||
| 4.50%, due 12/21/48 | 543,937 | 538,849 |
| Series A, Insured: GNMA | ||
| 4.50%, due 1/21/49 | 1,520,247 | 1,506,028 |
| Series B, Insured: GNMA | ||
| 4.50%, due 2/21/49 | 1,192,699 | 1,181,543 |
| Series G2, Insured: GNMA | ||
| 5.00%, due 7/21/52 | 14,165,639 | 14,051,325 |
| Series G-2, Insured: GNMA | ||
| 5.00%, due 8/21/52 | 20,931,449 | 21,207,412 |
| 46 | MainStay MacKay Tax Free Bond Fund |
| Principal Amount | Value | |
| Long-Term Municipal Bonds (continued) | ||
| Utah (continued) | ||
| Utah Housing Corp., Mortgage-Backed, Revenue Bonds (continued) | ||
| Series C-G-2, Insured: GNMA | ||
| 5.50%, due 4/21/53 | $ 5,000,000 | $ 5,119,437 |
| Utah Infrastructure Agency, Revenue Bonds | ||
| 5.00%, due 10/15/38 | 1,990,000 | 2,150,995 |
| 5.00%, due 10/15/41 | 1,925,000 | 2,069,363 |
| 207,034,958 | ||
| Vermont 0.2% | ||
| University of Vermont and State Agricultural College, Revenue Bonds | ||
| 5.00%, due 10/1/40 | 14,000,000 | 14,331,663 |
| Virginia 0.6% | ||
| Arlington County Industrial Development Authority, Virginia Hospital Center, Revenue Bonds | ||
| 4.00%, due 7/1/45 | 4,750,000 | 4,662,074 |
| County of Fairfax, Unlimited General Obligation | ||
| Series B, Insured: State Aid Withholding | ||
| 3.00%, due 10/1/26 | 7,750,000 | 7,707,549 |
| Hampton Roads Transportation Accountability Commission, Revenue Bonds, Senior Lien | ||
| Series A | ||
| 5.00%, due 7/1/45 | 4,750,000 | 5,220,547 |
| Northern Virginia Transportation Authority, Revenue Bonds | ||
| 5.00%, due 6/1/33 | 2,000,000 | 2,036,053 |
| Roanoke Economic Development Authority, Carilion Clinic Obligated Group, Revenue Bonds | ||
| 3.00%, due 7/1/45 | 9,000,000 | 7,208,065 |
| Virginia College Building Authority, Revenue Bonds | ||
| Series D, Insured: State Intercept | ||
| 3.15%, due 2/1/28 | 6,000,000 | 6,004,272 |
| Virginia Commonwealth Transportation Board, Revenue Bonds | ||
| 5.00%, due 9/15/23 | 8,500,000 | 8,558,058 |
| Principal Amount | Value | |
| Virginia (continued) | ||
| Virginia Public Building Authority, Revenue Bonds | ||
| Series A | ||
| 3.30%, due 8/1/28 | $ 6,750,000 | $ 6,807,967 |
| 48,204,585 | ||
| Washington 2.1% | ||
| County of King, Limited General Obligation | ||
| 5.00%, due 1/1/37 | 4,125,000 | 4,565,209 |
| Energy Northwest, Bonneville Power Administration, Revenue Bonds | ||
| Series C | ||
| 5.00%, due 7/1/28 | 11,400,000 | 11,642,544 |
| Series A | ||
| 5.00%, due 7/1/35 | 4,250,000 | 4,858,483 |
| Series A | ||
| 5.00%, due 7/1/35 | 3,250,000 | 3,379,749 |
| Series A | ||
| 5.00%, due 7/1/36 | 6,100,000 | 7,109,495 |
| North Thurston Public Schools, Unlimited General Obligation | ||
| Insured: School Bond Guaranty | ||
| 3.50%, due 12/1/29 | 4,360,000 | 4,379,029 |
| Pierce County School District No. 402, Unlimited General Obligation | ||
| Insured: School Bond Guaranty | ||
| 5.00%, due 12/1/35 | 5,000,000 | 5,323,217 |
| Port of Seattle, Revenue Bonds (c) | ||
| 5.00%, due 4/1/27 | 6,835,000 | 7,256,647 |
| 5.00%, due 7/1/28 | 8,500,000 | 8,512,988 |
| 5.00%, due 7/1/29 | 6,585,000 | 6,593,643 |
| Series C | ||
| 5.00%, due 4/1/30 | 2,000,000 | 2,030,036 |
| Series C | ||
| 5.00%, due 4/1/31 | 3,460,000 | 3,511,485 |
| Series C | ||
| 5.00%, due 4/1/32 | 3,000,000 | 3,044,227 |
| Series C | ||
| 5.00%, due 4/1/34 | 4,400,000 | 4,460,022 |
| Port of Seattle, Intermediate Lien, Revenue Bonds | ||
| Series C | ||
| 5.00%, due 8/1/38 (c) | 8,965,000 | 9,684,879 |
| Snohomish County Public Utility District No. 1, Generation System, Revenue Bonds | ||
| 5.00%, due 12/1/45 | 6,200,000 | 6,343,500 |
| Principal Amount | Value | |
| Long-Term Municipal Bonds (continued) | ||
| Washington (continued) | ||
| Southwest Suburban Sewer District, Revenue Bonds | ||
| Series A | ||
| 3.00%, due 5/1/29 | $ 2,050,000 | $ 2,044,330 |
| State of Washington, Motor Fuel Tax, Unlimited General Obligation | ||
| Series R-2013D | ||
| 4.00%, due 7/1/29 | 5,700,000 | 5,710,386 |
| Series E | ||
| 5.00%, due 2/1/33 | 10,970,000 | 11,122,544 |
| State of Washington, Various Purpose, Unlimited General Obligation | ||
| Series R-C | ||
| 4.00%, due 8/1/36 | 3,250,000 | 3,415,868 |
| Series C | ||
| 5.00%, due 2/1/24 | 2,540,000 | 2,576,264 |
| Series C | ||
| 5.00%, due 2/1/29 | 5,900,000 | 6,711,685 |
| Series D | ||
| 5.00%, due 2/1/30 | 8,145,000 | 8,260,683 |
| Series A-1 | ||
| 5.00%, due 8/1/35 | 4,700,000 | 5,581,777 |
| Series A | ||
| 5.00%, due 8/1/40 | 4,250,000 | 4,667,254 |
| Series A | ||
| 5.00%, due 8/1/44 | 5,700,000 | 6,247,038 |
| Series A | ||
| 5.00%, due 8/1/44 | 7,100,000 | 7,941,354 |
| State of Washington, Unlimited General Obligation | ||
| Series B | ||
| 5.00%, due 2/1/29 | 4,750,000 | 5,403,476 |
| Washington Higher Education Facilities Authority, Seattle Pacific University Project, Revenue Bonds | ||
| Series A | ||
| 5.00%, due 10/1/45 | 910,000 | 896,936 |
| Washington State Housing Finance Commission, Single Family Program, Revenue Bonds | ||
| Series 1N | ||
| 4.00%, due 6/1/49 | 190,000 | 189,647 |
| 163,464,395 | ||
| Principal Amount | Value | |
| Wisconsin 0.4% | ||
| County of Milwaukee, Unlimited General Obligation | ||
| Series A | ||
| 3.00%, due 12/1/25 | $ 2,515,000 | $ 2,505,921 |
| State of Wisconsin, Unlimited General Obligation | ||
| Series A | ||
| 5.00%, due 5/1/24 | 3,580,000 | 3,649,092 |
| State of Wisconsin Environmental Improvement Fund, Clean Water Fund Leveraged Loan Portfolio, Revenue Bonds | ||
| Series A | ||
| 5.00%, due 6/1/35 | 8,750,000 | 9,898,220 |
| Waunakee Community School District, Unlimited General Obligation | ||
| 3.25%, due 4/1/28 | 13,000,000 | 12,996,115 |
| 29,049,348 | ||
| Wyoming 0.1% | ||
| Wyoming Community Development Authority, Revenue Bonds | ||
| Series 1 | ||
| 5.75%, due 6/1/53 | 5,200,000 | 5,618,414 |
| Total Long-Term Municipal Bonds (Cost $7,326,827,959) | 7,438,549,908 | |
| Short-Term Municipal Notes 7.3% | ||
| Alabama 0.5% | ||
| Black Belt Energy Gas District, Gas Project No.7, Revenue Bonds | ||
| Series C-2 | ||
| 4.21%, due 10/1/52 (e) | 43,700,000 | 42,131,402 |
| California 1.1% | ||
| California Community Choice Financing Authority, Clean Energy Project, Revenue Bonds | ||
| Series A-2 | ||
| 2.67%, due 12/1/53 (e) | 14,250,000 | 14,529,767 |
| California Infrastructure & Economic Development Bank, Brightline West Passenger Rail Project, Revenue Bonds | ||
| Series A | ||
| 3.65%, due 1/1/50 (c)(d)(e) | 10,000,000 | 9,978,623 |
| 48 | MainStay MacKay Tax Free Bond Fund |
| Principal Amount | Value | |
| Short-Term Municipal Notes (continued) | ||
| California (continued) | ||
| Los Angeles Department of Water & Power, Revenue Bonds | ||
| Series B-4 | ||
| 3.10%, due 7/1/35 (e) | $ 14,400,000 | $ 14,400,000 |
| Metropolitan Water District of Southern California, Waterworks, Revenue Bonds | ||
| Series C | ||
| 4.00%, due 7/1/47 (e) | 12,850,000 | 12,807,138 |
| Modesto Irrigation District, Domestic Water Project, Revenue Bonds | ||
| Series F, Insured: NATL-RE | ||
| 3.905%, due 9/1/27 (e) | 7,100,000 | 7,062,793 |
| University of California, Revenue Bonds | ||
| Series BP-1 | ||
| 3.20%, due 5/15/48 (e) | 30,000,000 | 30,000,000 |
| 88,778,321 | ||
| Florida 0.2% | ||
| City of Gainesville, Utilities System, Revenue Bonds | ||
| Series B | ||
| 3.80%, due 10/1/42 (e) | 11,330,000 | 11,330,000 |
| Georgia 1.5% | ||
| Bartow County Development Authority, Georgia Power Company Plant Bowen Project, Revenue Bonds, First Series | ||
| 4.05%, due 11/1/62 (c)(e) | 24,000,000 | 24,000,000 |
| Development Authority of Appling County, Oglethorpe Power Corp. Project, Revenue Bonds | ||
| Series A | ||
| 1.50%, due 1/1/38 (e) | 2,500,000 | 2,368,339 |
| Development Authority of Burke County (The), Oglethorpe Power Corp. Project, Revenue Bonds | ||
| Series A | ||
| 1.50%, due 1/1/40 (e) | 6,315,000 | 5,982,426 |
| Development Authority of Burke County (The), Georgia Power Co. Vogtle Project, Revenue Bonds, First Series | ||
| Series 1 | ||
| 3.95%, due 7/1/49 (e) | 42,810,000 | 42,810,000 |
| Principal Amount | Value | |
| Georgia (continued) | ||
| Development Authority of Burke County (The), Georgia Power Co. Vogtle Project, Revenue Bonds (e) | ||
| 4.10%, due 11/1/48 | $ 38,935,000 | $ 38,935,000 |
| 4.20%, due 11/1/52 | 4,700,000 | 4,700,000 |
| Development Authority of Monroe County (The), Oglethorpe Power Corp. Scherer Project, Revenue Bonds | ||
| Series A | ||
| 1.50%, due 1/1/39 (e) | 3,250,000 | 3,078,841 |
| 121,874,606 | ||
| Illinois 0.5% | ||
| Illinois Finance Authority, Northwestern Memorial Healthcare Obligated Group, Revenue Bonds | ||
| Series C | ||
| 3.72%, due 7/15/55 (e) | 34,500,000 | 34,500,000 |
| Indiana 0.2% | ||
| Indiana Finance Authority, Republic Services, Inc., Revenue Bonds (c)(e) | ||
| Series A | ||
| 4.00%, due 5/1/34 | 10,000,000 | 9,998,761 |
| 4.00%, due 12/1/37 | 5,000,000 | 4,999,380 |
| 14,998,141 | ||
| Kentucky 0.3% | ||
| Kentucky Public Energy Authority, Gas Supply, Revenue Bonds (e) | ||
| Series A-2 | ||
| 4.423%, due 8/1/52 | 18,960,000 | 18,062,163 |
| Series C-2 | ||
| 4.548%, due 12/1/49 | 5,750,000 | 5,763,828 |
| 23,825,991 | ||
| New Jersey 0.6% | ||
| New Jersey Turnpike Authority, Revenue Bonds | ||
| Series D-1 | ||
| 4.093%, due 1/1/24 (e) | 22,000,000 | 21,988,833 |
| Rib Floater Trust Various States, Unlimited General Obligation | ||
| Series 5 | ||
| 3.82%, due 4/4/24 (d)(e) | 25,000,000 | 25,000,000 |
| 46,988,833 | ||
| Principal Amount | Value | |
| Short-Term Municipal Notes (continued) | ||
| New York 0.8% | ||
| City of New York, Unlimited General Obligation | ||
| Series B-5 | ||
| 3.77%, due 10/1/46 (e) | $ 12,150,000 | $ 12,150,000 |
| Metropolitan Transportation Authority, Revenue Bonds | ||
| Series D-2B, Insured: AGM | ||
| 3.773%, due 11/1/32 (e) | 24,100,000 | 23,978,268 |
| New York City Transitional Finance Authority, Future Tax Secured, Revenue Bonds (e) | ||
| Series A-4 | ||
| 3.75%, due 8/1/45 | 6,000,000 | 6,000,000 |
| Series C-4 | ||
| 3.77%, due 11/1/44 | 18,500,000 | 18,500,000 |
| Triborough Bridge & Tunnel Authority, MTA Bridges & Tunnels, Revenue Bonds | ||
| Series B-4A | ||
| 3.596%, due 1/1/32 (e) | 2,440,000 | 2,419,455 |
| 63,047,723 | ||
| Ohio 0.6% | ||
| County of Montgomery, Premier Health Partners Obligated Group, Revenue Bonds | ||
| Series C | ||
| 3.77%, due 11/15/45 (e) | 17,255,000 | 17,255,000 |
| Ohio State University (The), Revenue Bonds | ||
| Series A-1 | ||
| 3.78%, due 6/1/43 (e) | 30,000,000 | 30,000,000 |
| 47,255,000 | ||
| Texas 0.9% | ||
| Alvin Independent School District, Unlimited General Obligation | ||
| Series B, Insured: PSF-GTD | ||
| 0.45%, due 2/15/36 (e) | 4,250,000 | 4,203,782 |
| Harris County Cultural Education Facilities Finance Corp., Houston Methodist Hospital Obligated Group, Revenue Bonds | ||
| Series B | ||
| 3.80%, due 12/1/59 (e) | 30,000,000 | 30,000,000 |
| Principal Amount | Value | ||
| Texas (continued) | |||
| Texas Municipal Gas Acquisition & Supply Corp. II, Revenue Bonds | |||
| Series C | |||
| 3.902%, due 9/15/27 (e) | $ 35,980,000 | $ 35,474,355 | |
| 69,678,137 | |||
| Wisconsin 0.1% | |||
| Nuveen AMT-Free Quality Municipal Income Fund | |||
| Series D | |||
| 4.31%, due 3/1/29 (e) | 10,600,000 | 10,600,000 | |
| Total Short-Term Municipal Notes (Cost $578,600,746) | 575,008,154 | ||
| Total Municipal Bonds (Cost $7,905,428,705) | 8,013,558,062 | ||
| Shares | |||
| Short-Term Investment 0.2% | |||
| Unaffiliated Investment Company 0.2% | |||
| BlackRock Liquidity Funds MuniCash, 3.461% (f) | 17,474,408 | 17,474,408 | |
| Total Short-Term Investment (Cost $17,474,408) | 17,474,408 | ||
| Total Investments (Cost $7,922,903,113) | 101.0% | 8,031,032,470 | |
| Other Assets, Less Liabilities | (1.0) | (75,745,380) | |
| Net Assets | 100.0% | $ 7,955,287,090 | |
| † | Percentages indicated are based on Fund net assets. |
| ^ | Industry classifications may be different than those used for compliance monitoring purposes. |
| ‡ | Less than one-tenth of a percent. |
| (a) | Coupon rate may change based on changes of the underlying collateral or prepayments of principal. Rate shown was the rate in effect as of April 30, 2023. |
| (b) | Delayed delivery security. |
| (c) | Interest on these securities was subject to alternative minimum tax. |
| (d) | May be sold to institutional investors only under Rule 144A or securities offered pursuant to Section 4(a)(2) of the Securities Act of 1933, as amended. |
| 50 | MainStay MacKay Tax Free Bond Fund |
| (e) | Variable-rate demand notes (VRDNs)—Provide the right to sell the security at face value on either that day or within the rate-reset period. VRDNs will normally trade as if the maturity is the earlier put date, even though stated maturity is longer. The interest rate is reset on the put date at a stipulated daily, weekly, monthly, quarterly, or other specified time interval to reflect current market conditions. These securities do not indicate a reference rate and spread in their description. The maturity date shown is the final maturity. |
| (f) | Current yield as of April 30, 2023. |
| Type | Number of Contracts | Expiration Date | Value at Trade Date | Current Notional Amount | Unrealized Appreciation (Depreciation)2 |
| Short Contracts | |||||
| U.S. Treasury 10 Year Ultra Bonds | (500) | June 2023 | $ (58,483,224) | $ (60,726,562) | $ (2,243,338) |
| U.S. Treasury Long Bonds | (250) | June 2023 | (31,335,363) | (32,914,063) | (1,578,700) |
| Net Unrealized Depreciation | $ (3,822,038) |
| 1. | As of April 30, 2023, cash in the amount of $2,600,000 was on deposit with a broker or futures commission merchant for futures transactions. |
| 2. | Represents the difference between the value of the contracts at the time they were opened and the value as of April 30, 2023. |
| Abbreviation(s): |
| AGC—Assured Guaranty Corp. |
| AGM—Assured Guaranty Municipal Corp. |
| BAM—Build America Mutual Assurance Co. |
| BHAC—Berkshire Hathaway Assurance Corp. |
| CR—Custodial Receipts |
| FHLMC—Federal Home Loan Mortgage Corp. |
| FNMA—Federal National Mortgage Association |
| GNMA—Government National Mortgage Association |
| ICC—Insured Custody Certificates |
| MN CRED PROG—Minnesota State Credit Enhancement Program |
| MUN GOVT GTD—Municipal Government Guaranteed |
| NATL-RE—National Public Finance Guarantee Corp. |
| PSF-GTD—Permanent School Fund Guaranteed |
| Q-SBLF—Qualified School Board Loan Fund |
| SCSDE—South Carolina State Department of Education |
| SD CRED PROG—School District Credit Enhancement Program |
| UT CSCE—Utah Charter School Credit Enhancement Program |
| Description | Quoted Prices in Active Markets for Identical Assets (Level 1) | Significant Other Observable Inputs (Level 2) | Significant Unobservable Inputs (Level 3) | Total | |||
| Asset Valuation Inputs | |||||||
| Investments in Securities (a) | |||||||
| Municipal Bonds | |||||||
| Long-Term Municipal Bonds | $ — | $ 7,438,549,908 | $ — | $ 7,438,549,908 | |||
| Short-Term Municipal Notes | — | 575,008,154 | — | 575,008,154 | |||
| Total Municipal Bonds | — | 8,013,558,062 | — | 8,013,558,062 | |||
| Short-Term Investment | |||||||
| Unaffiliated Investment Company | 17,474,408 | — | — | 17,474,408 | |||
| Total Investments in Securities | $ 17,474,408 | $ 8,013,558,062 | $ — | $ 8,031,032,470 | |||
| Liability Valuation Inputs | |||||||
| Other Financial Instruments | |||||||
| Futures Contracts (b) | $ (3,822,038) | $ — | $ — | $ (3,822,038) |
| (a) | For a complete listing of investments and their industries, see the Portfolio of Investments. |
| (b) | The value listed for these securities reflects unrealized appreciation (depreciation) as shown on the Portfolio of Investments. |
| 52 | MainStay MacKay Tax Free Bond Fund |
| Assets | |
| Investment in securities, at value (identified cost $7,922,903,113) | $8,031,032,470 |
| Cash collateral on deposit at broker for futures contracts | 2,600,000 |
| Due from custodian | 26,397,011 |
| Receivables: | |
| Interest | 96,260,181 |
| Investment securities sold | 28,929,143 |
| Fund shares sold | 28,013,952 |
| Other assets | 179,608 |
| Total assets | 8,213,412,365 |
| Liabilities | |
| Payables: | |
| Investment securities purchased | 233,269,324 |
| Fund shares redeemed | 13,233,736 |
| Manager (See Note 3) | 2,668,300 |
| Variation margin on futures contracts | 687,476 |
| Transfer agent (See Note 3) | 619,964 |
| NYLIFE Distributors (See Note 3) | 330,540 |
| Shareholder communication | 164,147 |
| Professional fees | 81,744 |
| Custodian | 58,477 |
| Accrued expenses | 37,270 |
| Distributions payable | 6,974,297 |
| Total liabilities | 258,125,275 |
| Net assets | $7,955,287,090 |
| Composition of Net Assets | |
| Shares of beneficial interest outstanding (par value of $.01 per share) unlimited number of shares authorized | $ 8,451,640 |
| Additional paid-in-capital | 8,686,789,472 |
| 8,695,241,112 | |
| Total distributable earnings (loss) | (739,954,022) |
| Net assets | $7,955,287,090 |
| Class A | |
| Net assets applicable to outstanding shares | $1,336,225,955 |
| Shares of beneficial interest outstanding | 141,994,001 |
| Net asset value per share outstanding | $ 9.41 |
| Maximum sales charge (3.00% of offering price) | 0.29 |
| Maximum offering price per share outstanding | $ 9.70 |
| Investor Class | |
| Net assets applicable to outstanding shares | $ 6,977,411 |
| Shares of beneficial interest outstanding | 738,087 |
| Net asset value per share outstanding | $ 9.45 |
| Maximum sales charge (2.50% of offering price) | 0.24 |
| Maximum offering price per share outstanding | $ 9.69 |
| Class B | |
| Net assets applicable to outstanding shares | $ 2,573,231 |
| Shares of beneficial interest outstanding | 273,515 |
| Net asset value and offering price per share outstanding | $ 9.41 |
| Class C | |
| Net assets applicable to outstanding shares | $ 123,840,989 |
| Shares of beneficial interest outstanding | 13,157,018 |
| Net asset value and offering price per share outstanding | $ 9.41 |
| Class C2 | |
| Net assets applicable to outstanding shares | $ 5,474,904 |
| Shares of beneficial interest outstanding | 582,047 |
| Net asset value and offering price per share outstanding | $ 9.41 |
| Class I | |
| Net assets applicable to outstanding shares | $6,024,746,638 |
| Shares of beneficial interest outstanding | 640,053,131 |
| Net asset value and offering price per share outstanding | $ 9.41 |
| Class R6 | |
| Net assets applicable to outstanding shares | $ 455,447,962 |
| Shares of beneficial interest outstanding | 48,366,153 |
| Net asset value and offering price per share outstanding | $ 9.42 |
| Investment Income (Loss) | |
| Income | |
| Interest | $137,336,307 |
| Expenses | |
| Manager (See Note 3) | 15,051,210 |
| Distribution/Service—Class A (See Note 3) | 1,703,523 |
| Distribution/Service—Investor Class (See Note 3) | 8,638 |
| Distribution/Service—Class B (See Note 3) | 8,432 |
| Distribution/Service—Class C (See Note 3) | 317,982 |
| Distribution/Service—Class C2 (See Note 3) | 15,582 |
| Transfer agent (See Note 3) | 1,931,485 |
| Professional fees | 234,302 |
| Registration | 203,318 |
| Custodian | 104,519 |
| Trustees | 83,816 |
| Shareholder communication | 61,332 |
| Miscellaneous | 90,472 |
| Total expenses before waiver/reimbursement | 19,814,611 |
| Reimbursement from prior custodian(a) | (14,394) |
| Net expenses | 19,800,217 |
| Net investment income (loss) | 117,536,090 |
| Realized and Unrealized Gain (Loss) | |
| Net realized gain (loss) on: | |
| Unaffiliated investment transactions | (98,338,442) |
| In-kind Transactions | 3,292,526 |
| Futures transactions | 16,450,597 |
| Net realized gain (loss) | (78,595,319) |
| Net change in unrealized appreciation (depreciation) on: | |
| Unaffiliated investments | 545,866,684 |
| Futures contracts | (35,275,493) |
| Net change in unrealized appreciation (depreciation) | 510,591,191 |
| Net realized and unrealized gain (loss) | 431,995,872 |
| Net increase (decrease) in net assets resulting from operations | $549,531,962 |
| (a) | Represents a refund for overbilling of custody fees. |
| 54 | MainStay MacKay Tax Free Bond Fund |
for the six months ended April 30, 2023 (Unaudited) and the year ended October 31, 2022
| Six months ended April 30, 2023 | Year ended October 31, 2022 | |
| Increase (Decrease) in Net Assets | ||
| Operations: | ||
| Net investment income (loss) | $ 117,536,090 | $ 179,472,941 |
| Net realized gain (loss) | (78,595,319) | (568,250,184) |
| Net change in unrealized appreciation (depreciation) | 510,591,191 | (795,183,757) |
| Net increase (decrease) in net assets resulting from operations | 549,531,962 | (1,183,961,000) |
| Distributions to shareholders: | ||
| Class A | (23,356,950) | (63,381,043) |
| Investor Class | (116,520) | (229,133) |
| Class B | (52,945) | (153,810) |
| Class C | (1,994,802) | (4,398,849) |
| Class C2 | (71,492) | (90,208) |
| Class I | (97,872,444) | (168,558,373) |
| Class R6 | (8,635,613) | (15,713,711) |
| Total distributions to shareholders | (132,100,766) | (252,525,127) |
| Capital share transactions: | ||
| Net proceeds from sales of shares | 3,124,553,794 | 6,084,451,250 |
| Net asset value of shares issued to shareholders in reinvestment of distributions | 94,807,613 | 183,548,070 |
| Cost of shares redeemed | (1,826,669,952) | (6,715,327,651) |
| Redemptions in-kind | (373,829,325) | (930,537,398) |
| Increase (decrease) in net assets derived from capital share transactions | 1,018,862,130 | (1,377,865,729) |
| Net increase (decrease) in net assets | 1,436,293,326 | (2,814,351,856) |
| Net Assets | ||
| Beginning of period | 6,518,993,764 | 9,333,345,620 |
| End of period | $ 7,955,287,090 | $ 6,518,993,764 |
| Six months ended April 30, 2023* | Year Ended October 31, | ||||||||||
| Class A | 2022 | 2021 | 2020 | 2019 | 2018 | ||||||
| Net asset value at beginning of period | $ 8.85 | $ 10.60 | $ 10.43 | $ 10.33 | $ 9.80 | $ 10.02 | |||||
| Net investment income (loss) | 0.14(a) | 0.20(a) | 0.17(a) | 0.26 | 0.30 | 0.31 | |||||
| Net realized and unrealized gain (loss) | 0.58 | (1.66) | 0.23 | 0.11 | 0.53 | (0.22) | |||||
| Total from investment operations | 0.72 | (1.46) | 0.40 | 0.37 | 0.83 | 0.09 | |||||
| Less distributions: | |||||||||||
| From net investment income | (0.16) | (0.26) | (0.23) | (0.27) | (0.30) | (0.31) | |||||
| From net realized gain on investments | — | (0.03) | — | — | — | — | |||||
| Total distributions | (0.16) | (0.29) | (0.23) | (0.27) | (0.30) | (0.31) | |||||
| Net asset value at end of period | $ 9.41 | $ 8.85 | $ 10.60 | $ 10.43 | $ 10.33 | $ 9.80 | |||||
| Total investment return (b) | 8.14% | (13.96)% | 3.84% | 3.66% | 8.55% | 0.94% | |||||
| Ratios (to average net assets)/Supplemental Data: | |||||||||||
| Net investment income (loss) | 3.03%†† | 2.03% | 1.63% | 2.04% | 2.93% | 3.15% | |||||
| Net expenses (c) | 0.74%†† | 0.75% | 0.73% | 0.75% | 0.78% | 0.80% | |||||
| Portfolio turnover rate | 29% (d)(e) | 127%���(d)(e) | 39%(d) | 72%(d) | 38%(d) | 40% | |||||
| Net assets at end of period (in 000’s) | $ 1,336,226 | $ 1,552,537 | $ 3,134,090 | $ 2,674,765 | $ 1,728,643 | $ 1,405,803 | |||||
| * | Unaudited. |
| †† | Annualized. |
| (a) | Per share data based on average shares outstanding during the period. |
| (b) | Total investment return is calculated exclusive of sales charges and assumes the reinvestment of dividends and distributions. For periods of less than one year, total return is not annualized. |
| (c) | In addition to the fees and expenses which the Fund bears directly, it also indirectly bears a pro-rata share of the fees and expenses of the underlying funds in which it invests. Such indirect expenses are not included in the above expense ratios. |
| (d) | The portfolio turnover rate includes variable rate demand notes. |
| (e) | The portfolio turnover rate excludes in-kind transactions. |
| 56 | MainStay MacKay Tax Free Bond Fund |
| Six months ended April 30, 2023* | Year Ended October 31, | ||||||||||
| Investor Class | 2022 | 2021 | 2020 | 2019 | 2018 | ||||||
| Net asset value at beginning of period | $ 8.89 | $ 10.65 | $ 10.48 | $ 10.38 | $ 9.84 | $ 10.06 | |||||
| Net investment income (loss) | 0.14(a) | 0.20(a) | 0.17(a) | 0.20 | 0.30 | 0.32 | |||||
| Net realized and unrealized gain (loss) | 0.58 | (1.67) | 0.23 | 0.17 | 0.54 | (0.22) | |||||
| Total from investment operations | 0.72 | (1.47) | 0.40 | 0.37 | 0.84 | 0.10 | |||||
| Less distributions: | |||||||||||
| From net investment income | (0.16) | (0.26) | (0.23) | (0.27) | (0.30) | (0.32) | |||||
| From net realized gain on investments | — | (0.03) | — | — | — | — | |||||
| Total distributions | (0.16) | (0.29) | (0.23) | (0.27) | (0.30) | (0.32) | |||||
| Net asset value at end of period | $ 9.45 | $ 8.89 | $ 10.65 | $ 10.48 | $ 10.38 | $ 9.84 | |||||
| Total investment return (b) | 8.08% | (14.01)% | 3.80% | 3.64% | 8.63% | 0.97% | |||||
| Ratios (to average net assets)/Supplemental Data: | |||||||||||
| Net investment income (loss) | 2.98%†† | 2.07% | 1.61% | 2.04% | 2.95% | 3.17% | |||||
| Net expenses (c) | 0.78%†† | 0.77% | 0.76% | 0.76% | 0.77% | 0.78% | |||||
| Portfolio turnover rate | 29% (d)(e) | 127% (d)(e) | 39%(d) | 72%(d) | 38%(d) | 40% | |||||
| Net assets at end of period (in 000's) | $ 6,977 | $ 6,622 | $ 9,027 | $ 9,334 | $ 9,815 | $ 9,690 | |||||
| * | Unaudited. |
| †† | Annualized. |
| (a) | Per share data based on average shares outstanding during the period. |
| (b) | Total investment return is calculated exclusive of sales charges and assumes the reinvestment of dividends and distributions. For periods of less than one year, total return is not annualized. |
| (c) | In addition to the fees and expenses which the Fund bears directly, it also indirectly bears a pro-rata share of the fees and expenses of the underlying funds in which it invests. Such indirect expenses are not included in the above expense ratios. |
| (d) | The portfolio turnover rate includes variable rate demand notes. |
| (e) | The portfolio turnover rate excludes in-kind transactions. |
| Six months ended April 30, 2023* | Year Ended October 31, | ||||||||||
| Class B | 2022 | 2021 | 2020 | 2019 | 2018 | ||||||
| Net asset value at beginning of period | $ 8.85 | $ 10.60 | $ 10.43 | $ 10.33 | $ 9.80 | $ 10.01 | |||||
| Net investment income (loss) | 0.13(a) | 0.18(a) | 0.15(a) | 0.12 | 0.27 | 0.29 | |||||
| Net realized and unrealized gain (loss) | 0.58 | (1.66) | 0.22 | 0.23 | 0.53 | (0.21) | |||||
| Total from investment operations | 0.71 | (1.48) | 0.37 | 0.35 | 0.80 | 0.08 | |||||
| Less distributions: | |||||||||||
| From net investment income | (0.15) | (0.24) | (0.20) | (0.25) | (0.27) | (0.29) | |||||
| From net realized gain on investments | — | (0.03) | — | — | — | — | |||||
| Total distributions | (0.15) | (0.27) | (0.20) | (0.25) | (0.27) | (0.29) | |||||
| Net asset value at end of period | $ 9.41 | $ 8.85 | $ 10.60 | $ 10.43 | $ 10.33 | $ 9.80 | |||||
| Total investment return (b) | 7.99% | (14.19)% | 3.56% | 3.38% | 8.28% | 0.81% | |||||
| Ratios (to average net assets)/Supplemental Data: | |||||||||||
| Net investment income (loss) | 2.74%†† | 1.80% | 1.38% | 1.80% | 2.71% | 2.92% | |||||
| Net expenses (c) | 1.03%†† | 1.02% | 1.01% | 1.01% | 1.02% | 1.03% | |||||
| Portfolio turnover rate | 29% (d)(e) | 127% (d)(e) | 39%(d) | 72%(d) | 38%(d) | 40% | |||||
| Net assets at end of period (in 000’s) | $ 2,573 | $ 3,959 | $ 7,006 | $ 9,286 | $ 12,354 | $ 14,704 | |||||
| * | Unaudited. |
| †† | Annualized. |
| (a) | Per share data based on average shares outstanding during the period. |
| (b) | Total investment return is calculated exclusive of sales charges and assumes the reinvestment of dividends and distributions. For periods of less than one year, total return is not annualized. |
| (c) | In addition to the fees and expenses which the Fund bears directly, it also indirectly bears a pro-rata share of the fees and expenses of the underlying funds in which it invests. Such indirect expenses are not included in the above expense ratios. |
| (d) | The portfolio turnover rate includes variable rate demand notes. |
| (e) | The portfolio turnover rate excludes in-kind transactions. |
| 58 | MainStay MacKay Tax Free Bond Fund |
| Six months ended April 30, 2023* | Year Ended October 31, | ||||||||||
| Class C | 2022 | 2021 | 2020 | 2019 | 2018 | ||||||
| Net asset value at beginning of period | $ 8.85 | $ 10.60 | $ 10.44 | $ 10.34 | $ 9.80 | $ 10.02 | |||||
| Net investment income (loss) | 0.13(a) | 0.18(a) | 0.15(a) | 0.18 | 0.27 | 0.29 | |||||
| Net realized and unrealized gain (loss) | 0.58 | (1.66) | 0.21 | 0.17 | 0.54 | (0.22) | |||||
| Total from investment operations | 0.71 | (1.48) | 0.36 | 0.35 | 0.81 | 0.07 | |||||
| Less distributions: | |||||||||||
| From net investment income | (0.15) | (0.24) | (0.20) | (0.25) | (0.27) | (0.29) | |||||
| From net realized gain on investments | — | (0.03) | — | — | — | — | |||||
| Total distributions | (0.15) | (0.27) | (0.20) | (0.25) | (0.27) | (0.29) | |||||
| Net asset value at end of period | $ 9.41 | $ 8.85 | $ 10.60 | $ 10.44 | $ 10.34 | $ 9.80 | |||||
| Total investment return (b) | 7.99% | (14.19)% | 3.46% | 3.38% | 8.39% | 0.71% | |||||
| Ratios (to average net assets)/Supplemental Data: | |||||||||||
| Net investment income (loss) | 2.74%†† | 1.81% | 1.37% | 1.79% | 2.69% | 2.92% | |||||
| Net expenses (c) | 1.03%†† | 1.02% | 1.01% | 1.01% | 1.02% | 1.03% | |||||
| Portfolio turnover rate | 29% (d)(e) | 127% (d)(e) | 39%(d) | 72%(d) | 38%(d) | 40% | |||||
| Net assets at end of period (in 000’s) | $ 123,841 | $ 125,521 | $ 194,545 | $ 220,146 | $ 225,762 | $ 213,883 | |||||
| * | Unaudited. |
| †† | Annualized. |
| (a) | Per share data based on average shares outstanding during the period. |
| (b) | Total investment return is calculated exclusive of sales charges and assumes the reinvestment of dividends and distributions. For periods of less than one year, total return is not annualized. |
| (c) | In addition to the fees and expenses which the Fund bears directly, it also indirectly bears a pro-rata share of the fees and expenses of the underlying funds in which it invests. Such indirect expenses are not included in the above expense ratios. |
| (d) | The portfolio turnover rate includes variable rate demand notes. |
| (e) | The portfolio turnover rate excludes in-kind transactions. |
| Six months ended April 30, 2023* | Year Ended October 31, | August 31, 2020^ through October 31, 2020 | |||||
| Class C2 | 2022 | 2021 | |||||
| Net asset value at beginning of period | $ 8.85 | $ 10.60 | $ 10.43 | $ 10.52 | |||
| Net investment income (loss) | 0.12(a) | 0.17(a) | 0.12(a) | 0.03 | |||
| Net realized and unrealized gain (loss) | 0.58 | (1.67) | 0.23 | (0.09) | |||
| Total from investment operations | 0.70 | (1.50) | 0.35 | (0.06) | |||
| Less distributions: | |||||||
| From net investment income | (0.14) | (0.22) | (0.18) | (0.03) | |||
| From net realized gain on investments | — | (0.03) | — | — | |||
| Total distributions | (0.14) | (0.25) | (0.18) | (0.03) | |||
| Net asset value at end of period | $ 9.41 | $ 8.85 | $ 10.60 | $ 10.43 | |||
| Total investment return (b) | 7.91% | (14.32)% | 3.39% | (0.54)% | |||
| Ratios (to average net assets)/Supplemental Data: | |||||||
| Net investment income (loss) | 2.58%†† | 1.75% | 1.12% | 1.02%†† | |||
| Net expenses (c) | 1.18%†† | 1.17% | 1.15% | 1.15%†† | |||
| Portfolio turnover rate (d) | 29%(e) | 127%(e) | 39% | 72% | |||
| Net assets at end of period (in 000’s) | $ 5,475 | $ 3,920 | $ 2,990 | $ 251 | |||
| * | Unaudited. |
| ^ | Inception date. |
| †† | Annualized. |
| (a) | Per share data based on average shares outstanding during the period. |
| (b) | Total investment return is calculated exclusive of sales charges and assumes the reinvestment of dividends and distributions. For periods of less than one year, total return is not annualized. |
| (c) | In addition to the fees and expenses which the Fund bears directly, it also indirectly bears a pro-rata share of the fees and expenses of the underlying funds in which it invests. Such indirect expenses are not included in the above expense ratios. |
| (d) | The portfolio turnover rate includes variable rate demand notes. |
| (e) | The portfolio turnover rate excludes in-kind transactions. |
| 60 | MainStay MacKay Tax Free Bond Fund |
| Six months ended April 30, 2023* | Year Ended October 31, | ||||||||||
| Class I | 2022 | 2021 | 2020 | 2019 | 2018 | ||||||
| Net asset value at beginning of period | $ 8.85 | $ 10.60 | $ 10.44 | $ 10.34 | $ 9.80 | $ 10.02 | |||||
| Net investment income (loss) | 0.15(a) | 0.23(a) | 0.20(a) | 0.29 | 0.32 | 0.34 | |||||
| Net realized and unrealized gain (loss) | 0.58 | (1.66) | 0.22 | 0.11 | 0.54 | (0.22) | |||||
| Total from investment operations | 0.73 | (1.43) | 0.42 | 0.40 | 0.86 | 0.12 | |||||
| Less distributions: | |||||||||||
| From net investment income | (0.17) | (0.29) | (0.26) | (0.30) | (0.32) | (0.34) | |||||
| From net realized gain on investments | — | (0.03) | — | — | — | — | |||||
| Total distributions | (0.17) | (0.32) | (0.26) | (0.30) | (0.32) | (0.34) | |||||
| Net asset value at end of period | $ 9.41 | $ 8.85 | $ 10.60 | $ 10.44 | $ 10.34 | $ 9.80 | |||||
| Total investment return (b) | 8.28% | (13.75)% | 4.00% | 3.91% | 8.93% | 1.19% | |||||
| Ratios (to average net assets)/Supplemental Data: | |||||||||||
| Net investment income (loss) | 3.27%†† | 2.33% | 1.87% | 2.28% | 3.14% | 3.40% | |||||
| Net expenses (c) | 0.49%†† | 0.50% | 0.48% | 0.50% | 0.52% | 0.55% | |||||
| Portfolio turnover rate | 29% (d)(e) | 127% (d)(e) | 39%(d) | 72%(d) | 38%(d) | 40% | |||||
| Net assets at end of period (in 000’s) | $ 6,024,747 | $ 4,357,422 | $ 5,709,408 | $ 4,430,985 | $ 2,866,903 | $ 1,320,591 | |||||
| * | Unaudited. |
| †† | Annualized. |
| (a) | Per share data based on average shares outstanding during the period. |
| (b) | Total investment return is calculated exclusive of sales charges and assumes the reinvestment of dividends and distributions. Class I shares are not subject to sales charges. For periods of less than one year, total return is not annualized. |
| (c) | In addition to the fees and expenses which the Fund bears directly, it also indirectly bears a pro-rata share of the fees and expenses of the underlying funds in which it invests. Such indirect expenses are not included in the above expense ratios. |
| (d) | The portfolio turnover rate includes variable rate demand notes. |
| (e) | The portfolio turnover rate excludes in-kind transactions. |
| Six months ended April 30, 2023* | Year Ended October 31, | November 1, 2019^ through October 31, | |||||
| Class R6 | 2022 | 2021 | 2020 | ||||
| Net asset value at beginning of period | $ 8.86 | $ 10.61 | $ 10.44 | $ 10.34 | |||
| Net investment income (loss) | 0.15(a) | 0.24(a) | 0.21(a) | 0.27 | |||
| Net realized and unrealized gain (loss) | 0.58 | (1.66) | 0.22 | 0.13 | |||
| Total from investment operations | 0.73 | (1.42) | 0.43 | 0.40 | |||
| Less distributions: | |||||||
| From net investment income | (0.17) | (0.30) | (0.26) | (0.30) | |||
| From net realized gain on investments | — | (0.03) | — | — | |||
| Total distributions | (0.17) | (0.33) | (0.26) | (0.30) | |||
| Net asset value at end of period | $ 9.42 | $ 8.86 | $ 10.61 | $ 10.44 | |||
| Total investment return (b) | 8.29% | (13.68)% | 4.15% | 3.95% | |||
| Ratios (to average net assets)/Supplemental Data: | |||||||
| Net investment income (loss) | 3.32%†† | 2.51% | 1.92% | 2.27% | |||
| Net expenses (c) | 0.44%†† | 0.44% | 0.43% | 0.44% | |||
| Portfolio turnover rate (d) | 29%(e) | 127%(e) | 39% | 72% | |||
| Net assets at end of period (in 000’s) | $ 455,448 | $ 469,013 | $ 276,280 | $ 197,746 | |||
| * | Unaudited. |
| ^ | Inception date. |
| †† | Annualized. |
| (a) | Per share data based on average shares outstanding during the period. |
| (b) | Total investment return is calculated exclusive of sales charges and assumes the reinvestment of dividends and distributions. Class R6 shares are not subject to sales charges. For periods of less than one year, total return is not annualized. |
| (c) | In addition to the fees and expenses which the Fund bears directly, it also indirectly bears a pro-rata share of the fees and expenses of the underlying funds in which it invests. Such indirect expenses are not included in the above expense ratios. |
| (d) | The portfolio turnover rate includes variable rate demand notes. |
| (e) | The portfolio turnover rate excludes in-kind transactions. |
| 62 | MainStay MacKay Tax Free Bond Fund |
| Class | Commenced Operations |
| Class A | January 3, 1995 |
| Investor Class | February 28, 2008 |
| Class B | May 1, 1986 |
| Class C | September 1, 1998 |
| Class C2 | August 31, 2020 |
| Class I | December 21, 2009 |
| Class R6 | November 1, 2019 |
| • | Level 1—quoted prices (unadjusted) in active markets for an identical asset or liability |
| • | Level 2—other significant observable inputs (including quoted prices for a similar asset or liability in active markets, interest rates and yield curves, prepayment speeds, credit risk, etc.) |
| • | Level 3—significant unobservable inputs (including the Fund's own assumptions about the assumptions that market participants would use in measuring fair value of an asset or liability) |
| • Benchmark yields | • Reported trades |
| • Broker/dealer quotes | • Issuer spreads |
| • Two-sided markets | • Benchmark securities |
| • Bids/offers | • Reference data (corporate actions or material event notices) |
| • Industry and economic events | • Comparable bonds |
| • Monthly payment information |
| 64 | MainStay MacKay Tax Free Bond Fund |
| 66 | MainStay MacKay Tax Free Bond Fund |
| Liability Derivatives | Interest Rate Contracts Risk | Total |
| Futures Contracts - Net Assets—Net unrealized depreciation on futures contracts (a) | $(3,822,038) | $(3,822,038) |
| Total Fair Value | $(3,822,038) | $(3,822,038) |
| (a) | Includes cumulative appreciation (depreciation) of futures contracts as reported in the Portfolio of Investments. Only current day’s variation margin is reported within the Statement of Assets and Liabilities. |
| Net Realized Gain (Loss) from: | Interest Rate Contracts Risk | Total |
| Futures Contracts | $16,450,597 | $16,450,597 |
| Total Net Realized Gain (Loss) | $16,450,597 | $16,450,597 |
| Net Change in Unrealized Appreciation (Depreciation) | Interest Rate Contracts Risk | Total |
| Futures Contracts | $(35,275,493) | $(35,275,493) |
| Total Net Change in Unrealized Appreciation (Depreciation) | $(35,275,493) | $(35,275,493) |
| Average Notional Amount | Total |
| Futures Contracts Short | $(378,273,438) |
| 68 | MainStay MacKay Tax Free Bond Fund |
| Class | Expense | Waived |
| Class A | $ 374,401 | $— |
| Investor Class | 3,276 | — |
| Class B | 1,603 | — |
| Class C | 60,315 | — |
| Class C2 | 2,271 | — |
| Class I | 1,480,316 | — |
| Class R6 | 9,303 | — |
| Class C2 | $23,709 | 0.4% |
| Class R6 | 25,223 | 0.0‡ |
| ‡ | Less than one-tenth of a percent. |
| Federal Tax Cost | Gross Unrealized Appreciation | Gross Unrealized (Depreciation) | Net Unrealized Appreciation/ (Depreciation) | |
| Investments in Securities | $7,979,214,706 | $91,538,881 | $(39,721,117) | $51,817,764 |
| Capital Loss Available Through | Short-Term Capital Loss Amounts (000’s) | Long-Term Capital Loss Amounts (000’s) |
| Unlimited | $435,013 | $227,693 |
| 2022 | |
| Distributions paid from: | |
| Ordinary Income | $ 3,636,127 |
| Long-Term Capital Gains | 26,911,851 |
| Exempt Interest Dividends | 221,977,149 |
| Total | $252,525,127 |
| Class A | Shares | Amount |
| Six-month period ended April 30, 2023: | ||
| Shares sold | 30,567,050 | $ 284,179,366 |
| Shares issued to shareholders in reinvestment of distributions | 1,986,097 | 18,600,355 |
| Shares redeemed | (26,005,079) | (242,067,627) |
| Shares redeemed in connection with in-kind transactions | (39,952,689) | (373,829,325) |
| Net increase (decrease) in shares outstanding before conversion | (33,404,621) | (313,117,231) |
| Shares converted into Class A (See Note 1) | 195,347 | 1,837,675 |
| Shares converted from Class A (See Note 1) | (214,380) | (1,980,951) |
| Net increase (decrease) | (33,423,654) | $ (313,260,507) |
| Year ended October 31, 2022: | ||
| Shares sold | 130,380,923 | $ 1,314,002,747 |
| Shares issued to shareholders in reinvestment of distributions | 5,421,368 | 53,611,172 |
| Shares redeemed | (167,369,579) | (1,665,629,660) |
| Shares redeemed in connection with in-kind transactions | (88,883,335) | (930,537,398) |
| Net increase (decrease) in shares outstanding before conversion | (120,450,623) | (1,228,553,139) |
| Shares converted into Class A (See Note 1) | 452,466 | 4,319,856 |
| Shares converted from Class A (See Note 1) | (241,624) | (2,235,525) |
| Net increase (decrease) | (120,239,781) | $(1,226,468,808) |
| Investor Class | Shares | Amount |
| Six-month period ended April 30, 2023: | ||
| Shares sold | 13,018 | $ 122,597 |
| Shares issued to shareholders in reinvestment of distributions | 11,779 | 110,896 |
| Shares redeemed | (30,922) | (291,229) |
| Net increase (decrease) in shares outstanding before conversion | (6,125) | (57,736) |
| Shares converted into Investor Class (See Note 1) | 16,240 | 151,593 |
| Shares converted from Investor Class (See Note 1) | (16,862) | (158,390) |
| Net increase (decrease) | (6,747) | $ (64,533) |
| Year ended October 31, 2022: | ||
| Shares sold | 47,829 | $ 477,956 |
| Shares issued to shareholders in reinvestment of distributions | 22,092 | 217,249 |
| Shares redeemed | (131,140) | (1,340,625) |
| Net increase (decrease) in shares outstanding before conversion | (61,219) | (645,420) |
| Shares converted into Investor Class (See Note 1) | 15,813 | 157,272 |
| Shares converted from Investor Class (See Note 1) | (57,552) | (572,273) |
| Net increase (decrease) | (102,958) | $ (1,060,421) |
| 70 | MainStay MacKay Tax Free Bond Fund |
| Class B | Shares | Amount |
| Six-month period ended April 30, 2023: | ||
| Shares sold | 10,116 | $ 91,993 |
| Shares issued to shareholders in reinvestment of distributions | 5,396 | 50,514 |
| Shares redeemed | (179,586) | (1,681,100) |
| Net increase (decrease) in shares outstanding before conversion | (164,074) | (1,538,593) |
| Shares converted from Class B (See Note 1) | (9,862) | (92,079) |
| Net increase (decrease) | (173,936) | $ (1,630,672) |
| Year ended October 31, 2022: | ||
| Shares sold | 4,936 | $ 47,640 |
| Shares issued to shareholders in reinvestment of distributions | 14,760 | 145,103 |
| Shares redeemed | (209,782) | (2,027,969) |
| Net increase (decrease) in shares outstanding before conversion | (190,086) | (1,835,226) |
| Shares converted from Class B (See Note 1) | (23,583) | (229,631) |
| Net increase (decrease) | (213,669) | $ (2,064,857) |
| Class C | Shares | Amount |
| Six-month period ended April 30, 2023: | ||
| Shares sold | 1,581,119 | $ 14,756,151 |
| Shares issued to shareholders in reinvestment of distributions | 168,485 | 1,579,300 |
| Shares redeemed | (2,720,942) | (25,396,251) |
| Net increase (decrease) in shares outstanding before conversion | (971,338) | (9,060,800) |
| Shares converted from Class C (See Note 1) | (50,851) | (475,112) |
| Net increase (decrease) | (1,022,189) | $ (9,535,912) |
| Year ended October 31, 2022: | ||
| Shares sold | 2,218,065 | $ 21,391,995 |
| Shares issued to shareholders in reinvestment of distributions | 352,474 | 3,461,431 |
| Shares redeemed | (6,602,650) | (64,058,583) |
| Net increase (decrease) in shares outstanding before conversion | (4,032,111) | (39,205,157) |
| Shares converted from Class C (See Note 1) | (136,858) | (1,334,457) |
| Net increase (decrease) | (4,168,969) | $ (40,539,614) |
| Class C2 | Shares | Amount |
| Six-month period ended April 30, 2023: | ||
| Shares sold | 250,441 | $ 2,341,583 |
| Shares issued to shareholders in reinvestment of distributions | 7,627 | 71,492 |
| Shares redeemed | (119,162) | (1,115,364) |
| Net increase (decrease) | 138,906 | $ 1,297,711 |
| Year ended October 31, 2022: | ||
| Shares sold | 226,213 | $ 2,213,594 |
| Shares issued to shareholders in reinvestment of distributions | 9,314 | 90,208 |
| Shares redeemed | (74,555) | (706,592) |
| Net increase (decrease) | 160,972 | $ 1,597,210 |
| Class I | Shares | Amount |
| Six-month period ended April 30, 2023: | ||
| Shares sold | 280,370,203 | $ 2,616,794,495 |
| Shares issued to shareholders in reinvestment of distributions | 7,866,092 | 73,758,936 |
| Shares redeemed | (140,556,894) | (1,307,622,477) |
| Net increase (decrease) in shares outstanding before conversion | 147,679,401 | 1,382,930,954 |
| Shares converted into Class I (See Note 1) | 222,152 | 2,054,172 |
| Shares converted from Class I (See Note 1) | (55,899) | (525,206) |
| Net increase (decrease) | 147,845,654 | $ 1,384,459,920 |
| Year ended October 31, 2022: | ||
| Shares sold | 355,933,328 | $ 3,455,802,105 |
| Shares issued to shareholders in reinvestment of distributions | 12,832,922 | 125,526,725 |
| Shares redeemed | (385,037,502) | (3,678,587,460) |
| Net increase (decrease) in shares outstanding before conversion | (16,271,252) | (97,258,630) |
| Shares converted into Class I (See Note 1) | 277,634 | 2,599,530 |
| Shares converted from Class I (See Note 1) | (30,259,512) | (303,254,838) |
| Net increase (decrease) | (46,253,130) | $ (397,913,938) |
| Class R6 | Shares | Amount |
| Six-month period ended April 30, 2023: | ||
| Shares sold | 22,304,657 | $ 206,267,609 |
| Shares issued to shareholders in reinvestment of distributions | 67,786 | 636,120 |
| Shares redeemed | (26,878,179) | (248,495,904) |
| Net increase (decrease) in shares outstanding before conversion | (4,505,736) | (41,592,175) |
| Shares converted into Class R6 (See Note 1) | 49,215 | 462,654 |
| Shares converted from Class R6 (See Note 1) | (135,093) | (1,274,356) |
| Net increase (decrease) | (4,591,614) | $ (42,403,877) |
| Year ended October 31, 2022: | ||
| Shares sold | 133,667,628 | $ 1,290,515,213 |
| Shares issued to shareholders in reinvestment of distributions | 52,050 | 496,182 |
| Shares redeemed | (136,777,292) | (1,302,976,762) |
| Net increase (decrease) in shares outstanding before conversion | (3,057,614) | (11,965,367) |
| Shares converted into Class R6 (See Note 1) | 30,237,243 | 303,054,035 |
| Shares converted from Class R6 (See Note 1) | (263,796) | (2,503,969) |
| Net increase (decrease) | 26,915,833 | $ 288,584,699 |
| 72 | MainStay MacKay Tax Free Bond Fund |
| 74 | MainStay MacKay Tax Free Bond Fund |
| 76 | MainStay MacKay Tax Free Bond Fund |
| 78 | MainStay MacKay Tax Free Bond Fund |
1.
| 2. | This Fund is registered for sale in CA, CT, DE, FL, MA, NJ, NY and VT. |
| 3. | An affiliate of New York Life Investment Management LLC. |
| 5022141MS043-23 | MST10-06/23 |
please log in to newyorklifeinvestments.com/accounts.
| Not FDIC/NCUA Insured | Not a Deposit | May Lose Value | No Bank Guarantee | Not Insured by Any Government Agency |


President
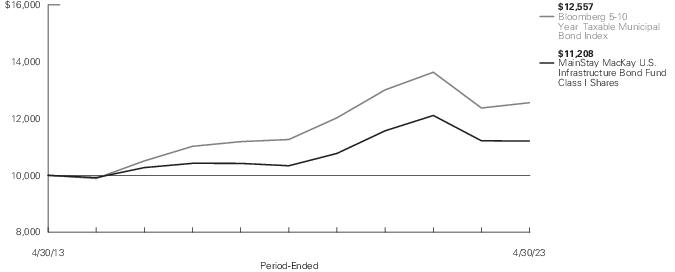
| Average Annual Total Returns for the Period-Ended April 30, 2023 | ||||||||
| Class | Sales Charge | Inception Date1 | Six Months2 | One Year | Five Years | Ten Years or Since Inception | Gross Expense Ratio3 | |
| Class A Shares4 | Maximum 3.00% Initial Sales Charge | With sales charges | 1/3/1995 | 4.01% | -4.68% | 0.49% | 0.44% | 0.98% |
| Excluding sales charges | 7.23 | -0.18 | 1.42 | 0.90 | 0.98 | |||
| Investor Class Shares5 | Maximum 2.50% Initial Sales Charge | With sales charges | 2/28/2008 | 4.21 | -4.56 | 0.18 | 0.15 | 1.25 |
| Excluding sales charges | 6.88 | -0.58 | 1.10 | 0.61 | 1.25 | |||
| Class B Shares6 | Maximum 5.00% CDSC | With sales charges | 5/1/1986 | 1.67 | -6.01 | -0.01 | -0.14 | 2.00 |
| if Redeemed Within the First Six Years of Purchase | Excluding sales charges | 6.67 | -1.19 | 0.36 | -0.14 | 2.00 | ||
| Class C Shares | Maximum 1.00% CDSC | With sales charges | 9/1/1998 | 5.53 | -2.28 | 0.34 | -0.14 | 2.00 |
| if Redeemed Within One Year of Purchase | Excluding sales charges | 6.53 | -1.32 | 0.34 | -0.14 | 2.00 | ||
| Class I Shares | No Sales Charge | 1/2/2004 | 7.28 | -0.07 | 1.63 | 1.15 | 0.73 | |
| Class R6 Shares | No Sales Charge | 11/1/2019 | 7.31 | 0.00 | N/A | -0.68 | 0.57 | |
| 1. | Effective February 28, 2019 and June 21, 2019, the Fund modified its principal investment strategies. The past performance in the bar chart and table prior to those dates reflects the Fund’s prior principal investment strategies. |
| 2. | Not annualized. |
| 3. | The gross expense ratios presented reflect the Fund’s “Total Annual Fund Operating Expenses” from the most recent Prospectus, as supplemented, and may differ from other expense ratios disclosed in this report. |
| 4. | Prior to August 10, 2022, the maximum initial sales charge was 4.50%, which is reflected in the applicable average annual total return figures shown. |
| 5. | Prior to August 10, 2022, the maximum initial sales charge was 4.00%, which is reflected in the applicable average annual total return figures shown. |
| 6. | Class B shares are closed to all new purchases as well as additional investments by existing Class B shareholders. |
| Benchmark Performance* | Six Months1 | One Year | Five Years | Ten Years |
| Bloomberg 5-10 Year Taxable Municipal Bond Index2 | 7.72% | 1.51% | 2.20% | 2.30% |
| Morningstar Intermediate Core Bond Category Average3 | 6.70 | -0.83 | 1.02 | 1.15 |
| * | Returns for indices reflect no deductions for fees, expenses or taxes, except for foreign withholding taxes where applicable. Results assume reinvestment of all dividends and capital gains. An investment cannot be made directly in an index. |
| 1. | Not annualized. |
| 2. | The Fund has selected the Bloomberg 5-10 Year Taxable Municipal Bond Index as its primary benchmark. The Bloomberg 5-10 Year Taxable Municipal Bond Index is the 5-10 year component of the Bloomberg Taxable Municipal Bond Index. |
| 3. | The Morningstar Intermediate Core Bond Category Average is representative of funds that invest primarily in investment-grade U.S. fixed-income issues including government, corporate, and securitized debt, and hold less than 5% in below-investment-grade exposures. Their durations (a measure of interest-rate sensitivity) typically range between 75% and 125% of the three-year average of the effective duration of the Morningstar Core Bond Index. Results are based on average total returns of similar funds with all dividends and capital gain distributions reinvested. |
| 6 | MainStay MacKay U.S. Infrastructure Bond Fund |
| Share Class | Beginning Account Value 11/1/22 | Ending Account Value (Based on Actual Returns and Expenses) 4/30/23 | Expenses Paid During Period1 | Ending Account Value (Based on Hypothetical 5% Annualized Return and Actual Expenses) 4/30/23 | Expenses Paid During Period1 | Net Expense Ratio During Period2 |
| Class A Shares | $1,000.00 | $1,072.30 | $4.37 | $1,020.58 | $4.26 | 0.85% |
| Investor Class Shares | $1,000.00 | $1,068.80 | $6.00 | $1,018.99 | $5.86 | 1.17% |
| Class B Shares | $1,000.00 | $1,066.70 | $9.84 | $1,015.27 | $9.59 | 1.92% |
| Class C Shares | $1,000.00 | $1,065.30 | $9.83 | $1,015.27 | $9.59 | 1.92% |
| Class I Shares | $1,000.00 | $1,072.80 | $3.08 | $1,021.82 | $3.01 | 0.60% |
| Class R6 Shares | $1,000.00 | $1,073.10 | $2.72 | $1,022.17 | $2.66 | 0.53% |
| 1. | Expenses are equal to the Fund’s annualized expense ratio of each class multiplied by the average account value over the period, divided by 365 and multiplied by 181 (to reflect the six-month period). The table above represents the actual expenses incurred during the six-month period. In addition to the fees and expenses which the Fund bears directly, it also indirectly bears a pro rata share of the fees and expenses of the underlying funds in which it invests. Such indirect expenses are not included in the above-reported expense figures. |
| 2. | Expenses are equal to the Fund's annualized expense ratio to reflect the six-month period. |
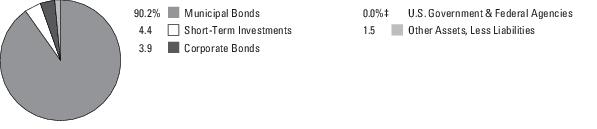
| 1. | Commonwealth of Massachusetts, 1.52%-4.91%, due 5/1/29–8/1/31 |
| 2. | Louisiana Local Government Environmental Facilities & Community Development Authority, 4.145%-5.198%, due 6/1/31–12/1/39 |
| 3. | State of Washington, 5.09%, due 8/1/33 |
| 4. | New York City Transitional Finance Authority, 1.55%-5.65%, due 5/1/28–11/1/35 |
| 5. | Oregon State Lottery, 1.641%-1.875%, due 4/1/28–4/1/29 |
| 6. | State of Rhode Island, 4.79%-4.90%, due 8/1/31–8/1/32 |
| 7. | Los Angeles Community College District, 7.53%, due 8/1/29 |
| 8. | California Community Choice Financing Authority, 4.00%-5.25%, due 5/1/53–1/1/54 |
| 9. | New York State Urban Development Corp., 1.75%-3.32%, due 3/15/28–3/15/29 |
| 10. | Alabama Federal Aid Highway Finance Authority, 1.727%-1.856%, due 9/1/28–9/1/29 |
| 8 | MainStay MacKay U.S. Infrastructure Bond Fund |
| 1. | See "Investment and Performance Comparison" for other share class returns, which may be higher or lower than Class I share returns, and for more information on benchmark and peer group returns. |
| 2. | An obligation rated ‘AA’ by Standard & Poor’s (“S&P”) is deemed by S&P to differ from the highest-rated obligations only to a small degree. In the opinion of S&P, the obligor's capacity to meet its financial commitment on the obligation is very strong. When applied to Fund holdings, ratings are based solely on the creditworthiness of the bonds in the portfolio and are not meant to represent the security or safety of the Fund. |
| 3. | An obligation rated ‘AAA’ has the highest rating assigned by S&P, and in the opinion of S&P, the obligor’s capacity to meet its financial commitment on the obligation is extremely strong. When applied to Fund holdings, ratings are based solely on the creditworthiness of the bonds in the portfolio and are not meant to represent the security or safety of the Fund. |
| 4. | Duration is a measure of the price sensitivity of a fixed-income investment to changes in interest rates. Duration is expressed as a number of years and is considered a more accurate sensitivity gauge than average maturity. |
| 5. | Modified duration is inversely related to the approximate percentage change in price for a given change in yield. Duration to worst is the duration of a bond computed using the bond’s nearest call date or maturity, whichever comes first. This measure ignores future cash flow fluctuations due to embedded optionality. |
| 6. | An obligation rated ‘BBB’ by S&P is deemed by S&P to exhibit adequate protection parameters. In the opinion of S&P, however, adverse economic conditions or changing circumstances are more likely to lead to a weakened capacity of the obligor to meet its financial commitment on the obligation. When applied to Fund holdings, ratings are based solely on the creditworthiness of the bonds in the portfolio and are not meant to represent the security or safety of the Fund. |
| 10 | MainStay MacKay U.S. Infrastructure Bond Fund |
| Principal Amount | Value | |
| Long-Term Bonds 94.1% | ||
| Corporate Bonds 3.9% | ||
| Commercial Services 2.8% | ||
| Chapman University | ||
| Series 2021 | ||
| 1.967%, due 4/1/30 | $ 2,630,000 | $ 2,197,504 |
| Series 2021 | ||
| 2.067%, due 4/1/31 | 2,680,000 | 2,164,492 |
| Emory University | ||
| Series 2020 | ||
| 2.143%, due 9/1/30 | 4,240,000 | 3,646,423 |
| Johns Hopkins University | ||
| Series A | ||
| 4.705%, due 7/1/32 | 8,472,000 | 8,691,829 |
| Yale University | ||
| Series 2020 | ||
| 1.482%, due 4/15/30 | 1,583,000 | 1,333,486 |
| 18,033,734 | ||
| Healthcare-Services 1.1% | ||
| CommonSpirit Health | ||
| 6.073%, due 11/1/27 | 4,750,000 | 4,941,883 |
| SSM Health Care Corp. | ||
| 4.894%, due 6/1/28 | 2,500,000 | 2,508,722 |
| 7,450,605 | ||
| Total Corporate Bonds (Cost $24,865,849) | 25,484,339 | |
| Municipal Bonds 90.2% | ||
| Alabama 1.9% | ||
| Alabama Federal Aid Highway Finance Authority Revenue Bonds | ||
| Series B | ||
| 1.727%, due 9/1/28 | 10,000,000 | 8,851,942 |
| Series B | ||
| 1.856%, due 9/1/29 | 2,160,000 | 1,883,894 |
| City of Birmingham Unlimited General Obligation | ||
| 1.968%, due 3/1/30 | 1,000,000 | 859,005 |
| City of Huntsville, Water System Revenue Bonds | ||
| Series B | ||
| 1.187%, due 11/1/27 | 1,000,000 | 872,069 |
| 12,466,910 | ||
| Principal Amount | Value | |
| Arizona 1.0% | ||
| Arizona Industrial Development Authority, Voyager Foundation Inc., Project Revenue Bonds | ||
| Series 2020 | ||
| 3.65%, due 10/1/29 | $ 1,115,000 | $ 974,088 |
| Series 2020 | ||
| 3.90%, due 10/1/34 | 1,900,000 | 1,478,247 |
| City of Phoenix Unlimited General Obligation | ||
| Series A | ||
| 5.269%, due 7/1/34 | 4,275,000 | 4,446,930 |
| 6,899,265 | ||
| California 18.3% | ||
| Anaheim Public Financing Authority, Convention Center Expansion Revenue Bonds | ||
| Series A, Insured: AGM | ||
| 2.971%, due 7/1/33 | 2,800,000 | 2,338,605 |
| California Community Choice Financing Authority, Clean Energy Project (a) Revenue Bonds | ||
| Series A-1 | ||
| 4.00%, due 5/1/53 | 5,405,000 | 5,462,466 |
| Series C | ||
| 5.25%, due 1/1/54 | 5,725,000 | 5,980,699 |
| California Educational Facilities Authority, Chapman University Revenue Bonds | ||
| Series A | ||
| 3.661%, due 4/1/33 | 3,300,000 | 2,956,490 |
| California Health Facilities Financing Authority Revenue Bonds, Senior Lien | ||
| 1.829%, due 6/1/29 | 2,500,000 | 2,148,918 |
| California Infrastructure & Economic Development Bank, Infrastructure State Revolving Fund Revenue Bonds | ||
| Series A | ||
| 1.466%, due 10/1/28 | 3,605,000 | 3,129,542 |
| California State University, Systemwide Revenue Bonds | ||
| Series B | ||
| 1.674%, due 11/1/29 | 2,710,000 | 2,300,348 |
| Series D | ||
| 1.69%, due 11/1/29 | 1,110,000 | 943,204 |
| Principal Amount | Value | |
| Municipal Bonds (continued) | ||
| California (continued) | ||
| California State University, Systemwide Revenue Bonds (continued) | ||
| Series B | ||
| 1.994%, due 11/1/32 | $ 1,000,000 | $ 809,528 |
| California Statewide Communities Development Authority, Front Porch Communities & Services Revenue Bonds | ||
| Series B | ||
| 2.14%, due 4/1/30 | 1,500,000 | 1,240,243 |
| California Statewide Communities Development Authority, Front Porch Communities & Services Obligated Group Revenue Bonds | ||
| Series B | ||
| 2.24%, due 4/1/31 | 3,250,000 | 2,624,834 |
| Central Basin Municipal Water District Revenue Bonds | ||
| Series B, Insured: BAM | ||
| 3.56%, due 8/1/33 | 1,345,000 | 1,223,136 |
| City of Los Angeles, Department of Airports Revenue Bonds | ||
| Series C | ||
| 1.613%, due 5/15/30 | 1,000,000 | 828,452 |
| City of Los Angeles, Department of Airports Customer Facility Charge Revenue Bonds | ||
| Series A, Insured: AGM | ||
| 3.258%, due 5/15/30 | 2,620,000 | 2,398,395 |
| Contra Costa Community College District Unlimited General Obligation | ||
| 1.75%, due 8/1/28 | 1,500,000 | 1,325,812 |
| Series B | ||
| 6.504%, due 8/1/34 | 2,270,000 | 2,589,727 |
| County of Alameda Unlimited General Obligation | ||
| Series B | ||
| 3.749%, due 8/1/32 | 2,000,000 | 1,920,546 |
| Cupertino Union School District Unlimited General Obligation | ||
| 2.65%, due 8/1/31 | 1,000,000 | 881,856 |
| Principal Amount | Value | |
| California (continued) | ||
| East Bay Municipal Utility District, Wastewater System Revenue Bonds | ||
| Series B | ||
| 5.026%, due 6/1/32 | $ 2,000,000 | $ 2,093,636 |
| Foothill-De Anza Community College District, Election of 2006 Unlimited General Obligation | ||
| Series E | ||
| 2.896%, due 8/1/31 | 1,025,000 | 931,187 |
| Glendale Community College District Unlimited General Obligation | ||
| 2.268%, due 8/1/30 | 1,500,000 | 1,303,395 |
| Long Beach Community College District Unlimited General Obligation | ||
| Series H | ||
| 2.387%, due 8/1/29 | 1,695,000 | 1,513,166 |
| Los Angeles Community College District, Election 2008 Unlimited General Obligation | ||
| Series B | ||
| 7.53%, due 8/1/29 | 10,000,000 | 11,475,644 |
| Los Angeles Unified School District Unlimited General Obligation | ||
| Series RY | ||
| 6.758%, due 7/1/34 | 2,360,000 | 2,751,273 |
| Marin Community College District, Election of 2016 Unlimited General Obligation | ||
| Series A-1 | ||
| 3.272%, due 8/1/27 | 1,425,000 | 1,380,835 |
| Oakland Unified School District, Alameda County Unlimited General Obligation | ||
| Insured: BAM | ||
| 2.774%, due 8/1/34 | 1,000,000 | 833,675 |
| Orange County Sanitation District Revenue Bonds | ||
| Series C | ||
| 6.35%, due 2/1/32 | 3,400,000 | 3,882,051 |
| Oxnard Financing Authority Revenue Bonds | ||
| Series B | ||
| 6.819%, due 6/1/30 | 5,500,000 | 5,924,602 |
| Port of Oakland Revenue Bonds, Senior Lien | ||
| Series R | ||
| 1.949%, due 5/1/28 | 6,260,000 | 5,556,498 |
| 12 | MainStay MacKay U.S. Infrastructure Bond Fund |
| Principal Amount | Value | |
| Municipal Bonds (continued) | ||
| California (continued) | ||
| Port of Oakland Revenue Bonds, Senior Lien (continued) | ||
| Series R | ||
| 2.099%, due 5/1/30 | $ 2,360,000 | $ 2,019,046 |
| Rancho Water District Financing Authority Revenue Bonds | ||
| Series A | ||
| 5.125%, due 8/1/30 | 2,670,000 | 2,798,287 |
| San Diego Community College District Unlimited General Obligation | ||
| 1.633%, due 8/1/27 | 2,290,000 | 2,074,873 |
| 2.113%, due 8/1/31 | 3,000,000 | 2,572,773 |
| San Diego County Regional Transportation Commission Revenue Bonds | ||
| Series A | ||
| 2.499%, due 4/1/30 | 1,570,000 | 1,398,939 |
| San Francisco City & County Public Utilities Commission, Wastewater Revenue Bonds | ||
| Series B | ||
| 5.60%, due 10/1/30 | 6,620,000 | 7,141,700 |
| San Francisco City & County Redevelopment Agency Successor Agency Tax Allocation, Third Lien | ||
| Series A, Insured: AGM | ||
| 2.543%, due 8/1/30 | 2,000,000 | 1,707,536 |
| Series A, Insured: AGM | ||
| 2.643%, due 8/1/31 | 1,780,000 | 1,498,979 |
| San Joaquin Delta Community College District Unlimited General Obligation | ||
| 1.874%, due 8/1/29 | 1,785,000 | 1,560,052 |
| San Jose Evergreen Community College District Unlimited General Obligation | ||
| 1.676%, due 9/1/28 | 1,120,000 | 981,612 |
| Series B-1 | ||
| 3.063%, due 9/1/45 | 1,000,000 | 751,492 |
| San Jose Unified School District Unlimited General Obligation | ||
| 1.847%, due 8/1/33 | 1,685,000 | 1,331,154 |
| Principal Amount | Value | |
| California (continued) | ||
| Santa Monica-Malibu Unified School District Unlimited General Obligation | ||
| 1.51%, due 7/1/30 | $ 2,510,000 | $ 2,083,941 |
| State of California, Various Purpose Unlimited General Obligation | ||
| 5.20%, due 3/1/43 | 5,000,000 | 5,071,350 |
| 5.25%, due 10/1/31 | 4,000,000 | 4,258,049 |
| State of California Department of Water Resources, Central Valley Project Revenue Bonds | ||
| Series BC | ||
| 1.16%, due 12/1/27 | 2,180,000 | 1,900,402 |
| Vacaville Unified School District Unlimited General Obligation | ||
| 1.639%, due 8/1/29 | 2,000,000 | 1,699,499 |
| 119,598,447 | ||
| Colorado 1.5% | ||
| City & County of Denver, Airport System Revenue Bonds | ||
| Series C | ||
| 2.237%, due 11/15/30 | 3,200,000 | 2,754,756 |
| Series C | ||
| 2.617%, due 11/15/33 | 3,000,000 | 2,517,897 |
| City & County of Denver, Pledged Excise Tax Revenue Bonds | ||
| Series B | ||
| 3.696%, due 8/1/28 | 4,670,000 | 4,529,714 |
| 9,802,367 | ||
| Connecticut 1.3% | ||
| State of Connecticut Unlimited General Obligation | ||
| Series A | ||
| 2.677%, due 7/1/30 | 3,805,000 | 3,445,880 |
| Series A | ||
| 3.85%, due 9/15/27 | 3,250,000 | 3,215,560 |
| State of Connecticut, Special Tax Revenue Bonds | ||
| Series B | ||
| 5.459%, due 11/1/30 | 1,860,000 | 1,930,331 |
| 8,591,771 | ||
| Principal Amount | Value | |
| Municipal Bonds (continued) | ||
| District of Columbia 1.0% | ||
| District of Columbia, Income Tax Revenue Bonds | ||
| Series B | ||
| 3.629%, due 7/1/28 | $ 5,000,000 | $ 4,839,947 |
| District of Columbia Revenue Bonds | ||
| Series B | ||
| 3.759%, due 7/1/29 | 1,870,000 | 1,811,428 |
| 6,651,375 | ||
| Florida 1.9% | ||
| County of Broward, Airport System Revenue Bonds | ||
| Series C | ||
| 2.504%, due 10/1/28 | 2,360,000 | 2,141,543 |
| County of Miami-Dade, Aviation Revenue Bonds | ||
| Series B | ||
| 2.137%, due 10/1/28 | 1,000,000 | 889,949 |
| Series B | ||
| 2.287%, due 10/1/29 | 1,000,000 | 876,597 |
| Series B | ||
| 3.406%, due 10/1/32 | 1,500,000 | 1,354,397 |
| Florida Development Finance Corp., UF Health Jacksonville Project Revenue Bonds | ||
| Series B, Insured: AGM | ||
| 3.223%, due 2/1/32 | 8,500,000 | 7,302,902 |
| 12,565,388 | ||
| Guam 1.7% | ||
| Antonio B Won Pat International Airport Authority Revenue Bonds | ||
| Series A | ||
| 2.699%, due 10/1/26 | 2,445,000 | 2,224,499 |
| Guam Government Waterworks Authority, Water and Wastewater System Revenue Bonds | ||
| Series B | ||
| 2.75%, due 7/1/30 | 6,500,000 | 5,640,711 |
| Series B | ||
| 3.25%, due 7/1/34 | 2,000,000 | 1,665,849 |
| Principal Amount | Value | |
| Guam (continued) | ||
| Port Authority of Guam Revenue Bonds | ||
| Series C | ||
| 4.532%, due 7/1/27 | $ 500,000 | $ 483,147 |
| Series C | ||
| 4.582%, due 7/1/28 | 1,000,000 | 958,312 |
| 10,972,518 | ||
| Hawaii 1.6% | ||
| City & County of Honolulu Unlimited General Obligation | ||
| Series D | ||
| 3.068%, due 10/1/30 | 1,980,000 | 1,815,283 |
| Series A | ||
| 5.668%, due 12/1/30 | 1,000,000 | 1,080,954 |
| State of Hawaii Unlimited General Obligation | ||
| Series FZ | ||
| 1.395%, due 8/1/30 | 5,970,000 | 4,919,830 |
| Series FZ | ||
| 1.595%, due 8/1/31 | 3,540,000 | 2,887,198 |
| 10,703,265 | ||
| Idaho 0.2% | ||
| Idaho Housing & Finance Association, Gem Prep: Meridian Project Revenue Bonds | ||
| Series A, Insured: School Bond Guaranty | ||
| 4.00%, due 5/1/42 | 1,320,000 | 1,220,126 |
| Illinois 3.1% | ||
| Chicago Board of Education Unlimited General Obligation | ||
| Series C, Insured: BAM | ||
| 6.319%, due 11/1/29 | 2,000,000 | 2,123,621 |
| City of Chicago Unlimited General Obligation | ||
| Series B, Insured: AGM-CR | ||
| 7.375%, due 1/1/33 | 1,200,000 | 1,374,566 |
| County of Cook Unlimited General Obligation | ||
| Series C | ||
| 5.79%, due 11/15/29 | 1,290,000 | 1,329,232 |
| Illinois Municipal Electric Agency Revenue Bonds | ||
| Series C | ||
| 6.832%, due 2/1/35 | 5,000,000 | 5,517,497 |
| 14 | MainStay MacKay U.S. Infrastructure Bond Fund |
| Principal Amount | Value | |
| Municipal Bonds (continued) | ||
| Illinois (continued) | ||
| Sales Tax Securitization Corp. Revenue Bonds | ||
| Series C | ||
| 3.23%, due 1/1/28 | $ 2,160,000 | $ 2,034,813 |
| State of Illinois, Sales Tax Revenue Bonds, Junior Lien | ||
| Series B | ||
| 2.159%, due 6/15/29 | 2,500,000 | 2,137,005 |
| Series B | ||
| 2.509%, due 6/15/32 | 1,000,000 | 818,425 |
| State of Illinois, Sales Tax Revenue Bonds | ||
| 3.45%, due 6/15/29 | 3,170,000 | 2,923,571 |
| State of Illinois, Build America Bonds Unlimited General Obligation | ||
| Series 5 | ||
| 7.35%, due 7/1/35 | 1,782,857 | 1,969,665 |
| 20,228,395 | ||
| Indiana 1.0% | ||
| Indianapolis Local Public Improvement Bond Bank Revenue Bonds | ||
| Series G-3 | ||
| 5.04%, due 1/1/29 | 1,115,000 | 1,136,728 |
| Series A-2 | ||
| 5.854%, due 1/15/30 | 5,325,000 | 5,596,875 |
| 6,733,603 | ||
| Kentucky 0.7% | ||
| Kenton County Airport Board, Customer Facility Charge Revenue Bonds | ||
| 4.489%, due 1/1/39 | 3,800,000 | 3,491,611 |
| Kentucky Economic Development Finance Authority, Louisville Arena Project Revenue Bonds | ||
| Series B, Insured: AGM | ||
| 4.255%, due 12/1/34 | 1,000,000 | 909,458 |
| 4,401,069 | ||
| Principal Amount | Value | |
| Louisiana 2.3% | ||
| Louisiana Local Government Environmental Facilities & Community Development Authority, Utilities Restoration Corp. Project Revenue Bonds | ||
| Series A | ||
| 4.145%, due 2/1/33 | $ 1,335,000 | $ 1,318,058 |
| 5.081%, due 6/1/31 | 3,000,000 | 3,027,504 |
| 5.197%, due 9/1/39 | 4,000,000 | 4,104,779 |
| 5.198%, due 12/1/39 | 4,830,000 | 5,048,502 |
| State of Louisiana Unlimited General Obligation | ||
| Series C-1 | ||
| 1.804%, due 6/1/31 | 1,650,000 | 1,377,828 |
| 14,876,671 | ||
| Maryland 0.5% | ||
| Maryland State Transportation Authority Revenue Bonds | ||
| Series B | ||
| 5.604%, due 7/1/30 | 3,000,000 | 3,147,173 |
| Massachusetts 4.8% | ||
| Commonwealth of Massachusetts Limited General Obligation | ||
| Series E | ||
| 1.52%, due 11/1/30 | 2,000,000 | 1,646,054 |
| Series D | ||
| 4.50%, due 8/1/31 | 1,320,000 | 1,334,983 |
| Commonwealth of Massachusetts, COVID-19 Recovery Assessment Revenue Bonds | ||
| Series A | ||
| 3.769%, due 7/15/29 | 4,710,000 | 4,577,879 |
| Series A | ||
| 3.881%, due 1/15/31 | 6,000,000 | 5,846,588 |
| Commonwealth of Massachusetts, Build America Bonds Limited General Obligation | ||
| Series A | ||
| 4.91%, due 5/1/29 | 6,805,000 | 7,021,632 |
| Massachusetts Bay Transportation Authority, Sales Tax Revenue Bonds | ||
| Series B | ||
| 2.235%, due 7/1/31 | 7,795,000 | 6,718,935 |
| Principal Amount | Value | |
| Municipal Bonds (continued) | ||
| Massachusetts (continued) | ||
| Massachusetts Development Finance Agency, Lesley University Revenue Bonds | ||
| Series B | ||
| 3.165%, due 7/1/32 | $ 1,705,000 | $ 1,467,830 |
| Massachusetts Port Authority Revenue Bonds | ||
| Series C | ||
| 1.579%, due 7/1/30 | 1,125,000 | 932,592 |
| Massachusetts Water Resources Authority Revenue Bonds | ||
| Series C | ||
| 1.94%, due 8/1/30 | 1,500,000 | 1,287,532 |
| Series C | ||
| 2.09%, due 8/1/31 | 1,055,000 | 897,088 |
| 31,731,113 | ||
| Michigan 2.0% | ||
| Michigan Finance Authority, Local Government Loan Program Revenue Bonds | ||
| Series E, Insured: State Aid Direct Deposit | ||
| 8.369%, due 11/1/35 | 715,000 | 879,023 |
| Michigan State Building Authority Revenue Bonds | ||
| Series II | ||
| 1.812%, due 10/15/31 | 2,000,000 | 1,630,683 |
| University of Michigan Revenue Bonds | ||
| Series B | ||
| 1.672%, due 4/1/30 | 5,120,000 | 4,325,548 |
| Series D | ||
| 5.183%, due 4/1/35 | 6,000,000 | 6,335,698 |
| 13,170,952 | ||
| Minnesota 0.1% | ||
| Western Minnesota Municipal Power Agency Revenue Bonds | ||
| Series A | ||
| 2.595%, due 1/1/29 | 1,000,000 | 919,670 |
| Principal Amount | Value | |
| Mississippi 1.0% | ||
| State of Mississippi Unlimited General Obligation | ||
| Series B | ||
| 1.699%, due 6/1/29 | $ 2,935,000 | $ 2,519,752 |
| Series B | ||
| 1.849%, due 6/1/30 | 1,400,000 | 1,185,174 |
| Series E | ||
| 1.887%, due 10/1/29 | 1,000,000 | 861,878 |
| Series E | ||
| 5.445%, due 11/1/35 | 1,575,000 | 1,706,673 |
| 6,273,477 | ||
| Missouri 1.1% | ||
| City of Kansas City Revenue Bonds | ||
| Series B | ||
| 1.802%, due 4/1/27 | 3,130,000 | 2,823,968 |
| Missouri Highway & Transportation Commission, Federal Reimbursement State Road Revenue Bonds | ||
| Series B | ||
| 5.445%, due 5/1/33 | 4,000,000 | 4,250,845 |
| 7,074,813 | ||
| Nebraska 0.4% | ||
| City of Lincoln, Electric System Revenue Bonds | ||
| Series B | ||
| 1.499%, due 9/1/30 | 3,000,000 | 2,460,990 |
| Nevada 0.2% | ||
| County of Clark Limited General Obligation | ||
| Series A | ||
| 2.70%, due 11/1/36 | 2,000,000 | 1,638,517 |
| New Hampshire 0.1% | ||
| State of New Hampshire, Build America Bonds Unlimited General Obligation | ||
| Series C | ||
| 4.25%, due 6/1/28 | 1,010,000 | 1,007,386 |
| 16 | MainStay MacKay U.S. Infrastructure Bond Fund |
| Principal Amount | Value | |
| Municipal Bonds (continued) | ||
| New Jersey 2.5% | ||
| New Jersey Economic Development Authority Revenue Bonds | ||
| Series A | ||
| 4.984%, due 3/1/27 | $ 1,750,000 | $ 1,764,824 |
| Series A | ||
| 5.064%, due 3/1/28 | 3,500,000 | 3,549,868 |
| New Jersey Turnpike Authority Revenue Bonds | ||
| Series B | ||
| 1.483%, due 1/1/28 | 2,000,000 | 1,749,048 |
| Series B | ||
| 1.713%, due 1/1/29 | 3,235,000 | 2,795,487 |
| State of New Jersey Unlimited General Obligation | ||
| Series A | ||
| 2.30%, due 6/1/27 | 1,000,000 | 923,442 |
| Series A | ||
| 2.85%, due 6/1/32 | 1,000,000 | 876,644 |
| Series A, Insured: BAM | ||
| 2.90%, due 6/1/33 | 5,180,000 | 4,520,191 |
| 16,179,504 | ||
| New York 9.6% | ||
| Brookhaven Local Development Corp., Long Island Community Hospital Project Revenue Bonds | ||
| Series B | ||
| 4.50%, due 10/1/25 | 2,045,000 | 2,024,259 |
| Brookhaven Local Development Corp., Long Island Community Hospital Health Care Services Foundation Revenue Bonds | ||
| Series B, Insured: AGM-CR | ||
| 6.00%, due 10/1/30 | 1,855,000 | 1,979,234 |
| City of New York Unlimited General Obligation | ||
| Series D | ||
| 1.723%, due 8/1/29 | 1,300,000 | 1,111,221 |
| Series D-2 | ||
| 1.75%, due 3/1/30 | 2,450,000 | 2,068,119 |
| Series D-3 | ||
| 2.05%, due 3/1/32 | 3,000,000 | 2,473,054 |
| Series C-3 | ||
| 2.36%, due 8/1/31 | 2,000,000 | 1,712,613 |
| Principal Amount | Value | |
| New York (continued) | ||
| City of New York Unlimited General Obligation (continued) | ||
| Series E-2 | ||
| 4.90%, due 4/1/34 | $ 2,000,000 | $ 2,051,476 |
| Metropolitan Transportation Authority Revenue Bonds | ||
| Series A-1 | �� | |
| 5.871%, due 11/15/39 | 3,195,000 | 3,247,064 |
| Series B-1 | ||
| 6.548%, due 11/15/31 | 2,950,000 | 3,174,975 |
| New York City Transitional Finance Authority, Future Tax Secured Revenue Bonds | ||
| Series C-2 | ||
| 1.55%, due 5/1/28 | 1,000,000 | 878,580 |
| Series B-3 | ||
| 3.00%, due 11/1/33 | 1,000,000 | 866,965 |
| Series C-3 | ||
| 3.35%, due 11/1/30 | 4,000,000 | 3,732,483 |
| Series D-3 | ||
| 5.65%, due 11/1/35 | 6,000,000 | 6,435,409 |
| New York State Dormitory Authority, State University of New York Dormitory Facilities Revenue Bonds | ||
| Series A | ||
| 2.462%, due 7/1/32 | 4,750,000 | 4,033,775 |
| New York State Environmental Facilities Corp., Municipal Water Finance Authority Project Revenue Bonds | ||
| Series B | ||
| 3.716%, due 6/15/32 | 2,000,000 | 1,892,583 |
| New York State Urban Development Corp., Sales Tax Revenue Bonds | ||
| Series B | ||
| 1.75%, due 3/15/28 | 3,580,000 | 3,169,508 |
| New York State Urban Development Corp., Personal Income Tax Revenue Bonds | ||
| Series B | ||
| 1.777%, due 3/15/28 | 3,500,000 | 3,098,530 |
| Series B | ||
| 3.32%, due 3/15/29 | 4,990,000 | 4,701,650 |
| Principal Amount | Value | |
| Municipal Bonds (continued) | ||
| New York (continued) | ||
| New York Transportation Development Corp., LaGuardia Airport Terminal B Redevelopment Project Revenue Bonds | ||
| Series B, Insured: AGM-CR | ||
| 3.473%, due 7/1/28 | $ 4,860,000 | $ 4,572,111 |
| State of New York Unlimited General Obligation | ||
| Series B | ||
| 2.45%, due 2/15/28 | 2,810,000 | 2,583,931 |
| Series B | ||
| 2.70%, due 2/15/31 | 2,120,000 | 1,877,190 |
| State of New York, Build America Bonds Unlimited General Obligation | ||
| Series C | ||
| 5.54%, due 3/1/30 | 5,000,000 | 5,294,067 |
| 62,978,797 | ||
| North Carolina 1.3% | ||
| County of Guilford, Public Improvement Unlimited General Obligation | ||
| Series B | ||
| 5.361%, due 8/1/28 | 2,250,000 | 2,369,778 |
| North Carolina Turnpike Authority Revenue Bonds | ||
| Series A-1 | ||
| 5.318%, due 1/1/31 | 5,720,000 | 5,949,740 |
| 8,319,518 | ||
| Ohio 1.7% | ||
| Ohio Higher Educational Facility Commission, Ashtabula County Medical Center Obligated Group Revenue Bonds | ||
| 5.25%, due 1/1/42 | 2,000,000 | 2,088,750 |
| Ohio State University (The), General Receipts Revenue Bonds | ||
| Series B | ||
| 3.673%, due 6/1/33 | 1,000,000 | 951,117 |
| State of Ohio Unlimited General Obligation | ||
| Series A | ||
| 1.78%, due 8/1/32 | 2,750,000 | 2,245,611 |
| Series A | ||
| 1.83%, due 9/15/33 | 1,000,000 | 802,486 |
| Principal Amount | Value | |
| Ohio (continued) | ||
| State of Ohio, Build America Bonds Unlimited General Obligation | ||
| Series B | ||
| 5.462%, due 9/1/30 | $ 2,000,000 | $ 2,165,039 |
| Summit County Development Finance Authority, Franciscan University of Steubenville Project Revenue Bonds | ||
| Series B | ||
| 5.125%, due 11/1/48 | 1,000,000 | 960,569 |
| Series A | ||
| 6.00%, due 11/1/48 (b) | 1,750,000 | 1,795,962 |
| 11,009,534 | ||
| Oklahoma 0.2% | ||
| Oklahoma Municipal Power Authority, Power Supply System Revenue Bonds | ||
| Series B, Insured: AGM | ||
| 2.251%, due 1/1/32 | 1,300,000 | 1,088,380 |
| Oregon 2.3% | ||
| Metro Unlimited General Obligation | ||
| 3.10%, due 6/1/31 | 1,000,000 | 902,496 |
| Oregon State Lottery Revenue Bonds | ||
| Series B | ||
| 1.641%, due 4/1/28 | 9,500,000 | 8,398,684 |
| Series B | ||
| 1.875%, due 4/1/29 | 3,900,000 | 3,408,821 |
| State of Oregon Unlimited General Obligation | ||
| Series C | ||
| 1.975%, due 5/1/31 | 1,000,000 | 846,319 |
| Series B | ||
| 4.677%, due 5/1/35 | 1,250,000 | 1,270,906 |
| 14,827,226 | ||
| Pennsylvania 2.8% | ||
| Authority Improvement Municipalities, Carlow University Revenue Bonds | ||
| Series B | ||
| 5.00%, due 11/1/53 | 750,000 | 552,302 |
| 18 | MainStay MacKay U.S. Infrastructure Bond Fund |
| Principal Amount | Value | |
| Municipal Bonds (continued) | ||
| Pennsylvania (continued) | ||
| City of Philadelphia Unlimited General Obligation | ||
| Series B, Insured: AGM | ||
| 1.618%, due 7/15/29 | $ 2,505,000 | $ 2,131,580 |
| Series B, Insured: AGM | ||
| 1.738%, due 7/15/30 | 2,250,000 | 1,882,639 |
| City of Philadelphia, Water & Wastewater Revenue Bonds | ||
| Series B | ||
| 2.034%, due 11/1/31 | 1,000,000 | 831,915 |
| Commonwealth of Pennsylvania Unlimited General Obligation | ||
| Series 1 | ||
| 2.05%, due 8/1/31 | 5,020,000 | 4,161,418 |
| Commonwealth of Pennsylvania Unlimited General Obligation, First Series | ||
| Series B | ||
| 5.45%, due 2/15/30 | 5,645,000 | 5,890,003 |
| County of Allegheny Unlimited General Obligation | ||
| Series C-79 | ||
| 1.786%, due 11/1/30 | 1,000,000 | 826,233 |
| University of Pittsburgh-of the Commonwealth System of Higher Education Revenue Bonds | ||
| Series B | ||
| 3.596%, due 9/15/30 | 2,000,000 | 1,894,484 |
| 18,170,574 | ||
| Rhode Island 1.8% | ||
| State of Rhode Island Unlimited General Obligation | ||
| Series B | ||
| 4.79%, due 8/1/31 | 4,000,000 | 4,064,825 |
| Series B | ||
| 4.90%, due 8/1/32 | 7,445,000 | 7,615,721 |
| 11,680,546 | ||
| Tennessee 0.5% | ||
| City of Memphis Unlimited General Obligation | ||
| Series F | ||
| 6.042%, due 7/1/34 | 2,000,000 | 2,266,006 |
| Principal Amount | Value | |
| Tennessee (continued) | ||
| Metropolitan Government of Nashville & Davidson County, Water & Sewer Revenue Bonds | ||
| Series B | ||
| 1.881%, due 7/1/30 | $ 1,000,000 | $ 844,594 |
| 3,110,600 | ||
| Texas 8.1% | ||
| Central Texas Regional Mobility Authority Revenue Bonds, Senior Lien | ||
| Series C | ||
| 2.635%, due 1/1/32 | 1,500,000 | 1,279,203 |
| City of Austin, Rental Car Special Facility Revenue Bonds | ||
| Insured: AGM | ||
| 1.475%, due 11/15/28 | 1,750,000 | 1,488,472 |
| City of Corpus Christi, Utility System Revenue Bonds, Junior Lien | ||
| Series B | ||
| 2.066%, due 7/15/31 | 4,325,000 | 3,617,484 |
| Series B | ||
| 2.166%, due 7/15/32 | 2,500,000 | 2,062,667 |
| City of Dallas, Waterworks & Sewer System Revenue Bonds | ||
| Series B | ||
| 3.648%, due 10/1/30 | 2,000,000 | 1,927,117 |
| City of Houston, Airport System Revenue Bonds, Sub. Lien | ||
| Series C | ||
| 2.385%, due 7/1/31 | 5,000,000 | 4,272,095 |
| Series C | ||
| 2.485%, due 7/1/32 | 1,470,000 | 1,242,898 |
| City of Houston, Combined Utility System Revenue Bonds, First Lien | ||
| Series B | ||
| 3.828%, due 5/15/28 | 2,575,000 | 2,537,768 |
| City of San Antonio, Electric & Gas Systems Limited General Obligation | ||
| 1.643%, due 2/1/30 | 1,595,000 | 1,362,789 |
| Dallas Area Rapid Transit Revenue Bonds, Senior Lien | ||
| Series D | ||
| 1.828%, due 12/1/29 | 3,600,000 | 3,092,073 |
| Principal Amount | Value | |
| Municipal Bonds (continued) | ||
| Texas (continued) | ||
| Dallas Area Rapid Transit Revenue Bonds | ||
| Series C | ||
| 1.946%, due 12/1/31 | $ 1,730,000 | $ 1,431,270 |
| Dallas Fort Worth International Airport Revenue Bonds | ||
| Series A | ||
| 2.354%, due 11/1/27 | 1,000,000 | 920,416 |
| Series A | ||
| 2.454%, due 11/1/29 | 1,000,000 | 892,256 |
| Dallas Independent School District Unlimited General Obligation | ||
| Series A, Insured: PSF-GTD | ||
| 2.533%, due 2/15/32 | 7,500,000 | 6,416,453 |
| Lamar Consolidated Independent School District Unlimited General Obligation | ||
| Insured: AGM | ||
| 5.50%, due 2/15/58 | 5,000,000 | 5,693,159 |
| Metropolitan Transit Authority of Harris County Revenue Bonds | ||
| Series A | ||
| 2.499%, due 11/1/34 | 1,000,000 | 819,002 |
| North Texas Tollway Authority Revenue Bonds, First Tier | ||
| Series B | ||
| 1.827%, due 1/1/29 | 3,300,000 | 2,891,477 |
| State of Texas Unlimited General Obligation | ||
| 2.526%, due 10/1/31 | 4,000,000 | 3,504,516 |
| Series C | ||
| 4.108%, due 10/1/35 | 1,325,000 | 1,281,468 |
| Series A | ||
| 4.631%, due 4/1/33 | 3,000,000 | 3,058,066 |
| Texas Natural Gas Securitization Finance Corp. Revenue Bonds | ||
| Series A-1 | ||
| 5.102%, due 4/1/35 | 2,000,000 | 2,101,756 |
| Texas Transportation Commission State Highway Fund Revenue Bonds, First Tier | ||
| 4.00%, due 10/1/33 | 1,165,000 | 1,132,323 |
| 53,024,728 | ||
| Principal Amount | Value | |
| U.S. Virgin Islands 0.9% | ||
| Matching Fund Special Purpose Securitization Corp. Revenue Bonds | ||
| Series B | ||
| 6.00%, due 10/1/25 | $ 5,875,000 | $ 5,893,755 |
| Utah 0.5% | ||
| County of Salt Lake, Convention Hotel Revenue Bonds | ||
| 5.25%, due 10/1/34 (b) | 3,610,000 | 3,355,620 |
| Virginia 2.3% | ||
| City of Alexandria Unlimited General Obligation | ||
| 1.50%, due 6/15/30 | 3,000,000 | 2,500,759 |
| Farmville Industrial Development Authority, Longwood University Student Housing Project Revenue Bonds | ||
| Series B | ||
| 5.00%, due 1/1/34 | 2,000,000 | 1,887,304 |
| Hampton Roads Sanitation District Revenue Bonds | ||
| Series B | ||
| 5.814%, due 11/1/29 | 4,775,000 | 5,031,165 |
| Virginia College Building Authority Revenue Bonds | ||
| Series B | ||
| 1.865%, due 2/1/31 | 5,000,000 | 4,156,277 |
| Virginia Commonwealth Transportation Board, Build America Bonds Revenue Bonds | ||
| Series A-2, Insured: State Appropriations | ||
| 5.35%, due 5/15/35 | 1,255,000 | 1,315,769 |
| 14,891,274 | ||
| Washington 6.1% | ||
| City of Seattle, Municipal Light & Power Revenue Bonds | ||
| Series A | ||
| 5.47%, due 2/1/30 | 9,000,000 | 9,496,552 |
| County of King, Sewer Revenue Bonds | ||
| Series B | ||
| 1.30%, due 1/1/28 | 2,140,000 | 1,869,245 |
| Series B | ||
| 1.86%, due 1/1/33 | 5,735,000 | 4,586,681 |
| 20 | MainStay MacKay U.S. Infrastructure Bond Fund |
| Principal Amount | Value | |
| Municipal Bonds (continued) | ||
| Washington (continued) | ||
| Energy Northwest, Bonneville Power Administration Revenue Bonds | ||
| Series B | ||
| 2.166%, due 7/1/32 | $ 2,740,000 | $ 2,271,968 |
| Pierce County School District No. 10, Tacoma Unlimited General Obligation | ||
| Insured: School Bond Guaranty | ||
| 1.733%, due 12/1/31 | 1,000,000 | 819,830 |
| Port of Seattle, Intermediate Lien Revenue Bonds | ||
| Series C | ||
| 3.913%, due 8/1/30 | 2,200,000 | 2,139,427 |
| Spokane Public Facilities District, Sales & Lodging tax Revenue Bonds | ||
| Series B | ||
| 1.996%, due 12/1/30 | 1,950,000 | 1,650,581 |
| State of Washington, Motor Vehicle Fuel Unlimited General Obligation | ||
| Series F | ||
| 5.09%, due 8/1/33 | 11,750,000 | 12,326,201 |
| University of Washington Revenue Bonds | ||
| Series B | ||
| 1.192%, due 4/1/28 | 3,450,000 | 2,994,742 |
| Washington State University Revenue Bonds | ||
| Series A | ||
| 1.899%, due 10/1/27 | 2,355,000 | 2,109,789 |
| 40,265,016 | ||
| West Virginia 0.4% | ||
| County of Ohio, Special District Excise Tax Revenue Bonds | ||
| Series A | ||
| 4.00%, due 3/1/40 | 3,500,000 | 2,620,762 |
| Wisconsin 1.5% | ||
| State of Wisconsin Unlimited General Obligation | ||
| Series 3 | ||
| 1.122%, due 5/1/28 | 5,100,000 | 4,402,293 |
| Series 4 | ||
| 1.902%, due 5/1/33 | 1,000,000 | 802,499 |
| Principal Amount | Value | |
| Wisconsin (continued) | ||
| State of Wisconsin Unlimited General Obligation (continued) | ||
| Series 2 | ||
| 2.614%, due 5/1/32 | $ 4,250,000 | $ 3,721,288 |
| Wisconsin Department of Transportation Revenue Bonds | ||
| Series 1 | ||
| 1.789%, due 7/1/33 | 1,000,000 | 786,804 |
| 9,712,884 | ||
| Total Municipal Bonds (Cost $580,115,304) | 590,263,979 | |
| U.S. Government & Federal Agencies 0.0% ‡ | ||
| Federal Home Loan Mortgage Corporation (Mortgage Pass-Through Securities) 0.0% ‡ | ||
| FHLMC Gold Pools, 30 Year | ||
| 4.00%, due 10/1/48 | 115,423 | 112,314 |
| 6.50%, due 4/1/37 | 22,704 | 24,193 |
| 136,507 | ||
| Government National Mortgage Association (Mortgage Pass-Through Security) 0.0% ‡ | ||
| GNMA I, 30 Year | ||
| 6.50%, due 4/15/31 | 76,527 | 78,509 |
| Total U.S. Government & Federal Agencies (Cost $216,451) | 215,016 | |
| Total Long-Term Bonds (Cost $605,197,604) | 615,963,334 | |
| Shares | ||
| Short-Term Investments 4.4% | ||
| Affiliated Investment Company 4.0% | ||
| MainStay U.S. Government Liquidity Fund, 3.98% (c) | 26,679,911 | 26,679,911 |
| Principal Amount | Value | ||
| Short-Term Municipal Note 0.4% | |||
| County of Sacramento Insured: AGM | |||
| 6.34%, due 7/10/30 (d) | $ 2,500,000 | $ 2,491,755 | |
| Total Short-Term Municipal Note (Cost $2,495,702) | 2,491,755 | ||
| Total Short-Term Investments (Cost $29,175,613) | 29,171,666 | ||
| Total Investments (Cost $634,373,217) | 98.5% | 645,135,000 | |
| Other Assets, Less Liabilities | 1.5 | 9,696,248 | |
| Net Assets | 100.0% | $ 654,831,248 | |
| † | Percentages indicated are based on Fund net assets. |
| ^ | Industry classifications may be different than those used for compliance monitoring purposes. |
| ‡ | Less than one-tenth of a percent. |
| (a) | Coupon rate may change based on changes of the underlying collateral or prepayments of principal. Rate shown was the rate in effect as of April 30, 2023. |
| (b) | May be sold to institutional investors only under Rule 144A or securities offered pursuant to Section 4(a)(2) of the Securities Act of 1933, as amended. |
| (c) | Current yield as of April 30, 2023. |
| (d) | Variable-rate demand notes (VRDNs)—Provide the right to sell the security at face value on either that day or within the rate-reset period. VRDNs will normally trade as if the maturity is the earlier put date, even though stated maturity is longer. The interest rate is reset on the put date at a stipulated daily, weekly, monthly, quarterly, or other specified time interval to reflect current market conditions. These securities do not indicate a reference rate and spread in their description. The maturity date shown is the final maturity. |
| Affiliated Investment Companies | Value, Beginning of Period | Purchases at Cost | Proceeds from Sales | Net Realized Gain/(Loss) on Sales | Change in Unrealized Appreciation/ (Depreciation) | Value, End of Period | Dividend Income | Other Distributions | Shares End of Period |
| MainStay U.S. Government Liquidity Fund | $ 40,537 | $ 426,720 | $ (440,577) | $ — | $ — | $ 26,680 | $ 419 | $ — | 26,680 |
| 22 | MainStay MacKay U.S. Infrastructure Bond Fund |
| Type | Number of Contracts | Expiration Date | Value at Trade Date | Current Notional Amount | Unrealized Appreciation (Depreciation)2 |
| Short Contracts | |||||
| U.S. Treasury 5 Year Notes | (18) | June 2023 | $ (1,963,226) | $ (1,975,359) | $ (12,133) |
| 1. | As of April 30, 2023, cash in the amount of $30,600 was on deposit with a broker or futures commission merchant for futures transactions. |
| 2. | Represents the difference between the value of the contracts at the time they were opened and the value as of April 30, 2023. |
| Abbreviation(s): |
| AGM—Assured Guaranty Municipal Corp. |
| BAM—Build America Mutual Assurance Co. |
| CR—Custodial Receipts |
| FHLMC—Federal Home Loan Mortgage Corp. |
| GNMA—Government National Mortgage Association |
| PSF-GTD—Permanent School Fund Guaranteed |
| Description | Quoted Prices in Active Markets for Identical Assets (Level 1) | Significant Other Observable Inputs (Level 2) | Significant Unobservable Inputs (Level 3) | Total | |||
| Asset Valuation Inputs | |||||||
| Investments in Securities (a) | |||||||
| Long-Term Bonds | |||||||
| Corporate Bonds | $ — | $ 25,484,339 | $ — | $ 25,484,339 | |||
| Municipal Bonds | — | 590,263,979 | — | 590,263,979 | |||
| U.S. Government & Federal Agencies | — | 215,016 | — | 215,016 | |||
| Total Long-Term Bonds | — | 615,963,334 | — | 615,963,334 | |||
| Short-Term Investments | |||||||
| Affiliated Investment Company | 26,679,911 | — | — | 26,679,911 | |||
| Short-Term Municipal Note | — | 2,491,755 | — | 2,491,755 | |||
| Total Short-Term Investments | 26,679,911 | 2,491,755 | — | 29,171,666 | |||
| Total Investments in Securities | $ 26,679,911 | $ 618,455,089 | $ — | $ 645,135,000 | |||
| Liability Valuation Inputs | |||||||
| Other Financial Instruments | |||||||
| Futures Contracts (b) | $ (12,133) | $ — | $ — | $ (12,133) |
| (a) | For a complete listing of investments and their industries, see the Portfolio of Investments. |
| (b) | The value listed for these securities reflects unrealized appreciation (depreciation) as shown on the Portfolio of Investments. |
| Assets | |
| Investment in unaffiliated securities, at value (identified cost $607,693,306) | $618,455,089 |
| Investment in affiliated investment companies, at value (identified cost $26,679,911) | 26,679,911 |
| Cash collateral on deposit at broker for futures contracts | 30,600 |
| Receivables: | |
| Fund shares sold | 7,926,634 |
| Dividends and interest | 6,489,547 |
| Investment securities sold | 3,699,352 |
| Other assets | 84,960 |
| Total assets | 663,366,093 |
| Liabilities | |
| Due to custodian | 2,330 |
| Payables: | |
| Investment securities purchased | 6,573,498 |
| Fund shares redeemed | 977,890 |
| Manager (See Note 3) | 204,120 |
| Transfer agent (See Note 3) | 137,069 |
| Professional fees | 29,091 |
| NYLIFE Distributors (See Note 3) | 24,110 |
| Custodian | 23,656 |
| Shareholder communication | 17,253 |
| Variation margin on futures contracts | 4,780 |
| Accrued expenses | 1,041 |
| Distributions payable | 540,007 |
| Total liabilities | 8,534,845 |
| Net assets | $654,831,248 |
| Composition of Net Assets | |
| Shares of beneficial interest outstanding (par value of $.01 per share) unlimited number of shares authorized | $ 857,040 |
| Additional paid-in-capital | 722,976,416 |
| 723,833,456 | |
| Total distributable earnings (loss) | (69,002,208) |
| Net assets | $654,831,248 |
| Class A | |
| Net assets applicable to outstanding shares | $ 78,853,230 |
| Shares of beneficial interest outstanding | 10,420,764 |
| Net asset value per share outstanding | $ 7.57 |
| Maximum sales charge (3.00% of offering price) | 0.23 |
| Maximum offering price per share outstanding | $ 7.80 |
| Investor Class | |
| Net assets applicable to outstanding shares | $ 14,266,123 |
| Shares of beneficial interest outstanding | 1,876,721 |
| Net asset value per share outstanding | $ 7.60 |
| Maximum sales charge (2.50% of offering price) | 0.19 |
| Maximum offering price per share outstanding | $ 7.79 |
| Class B | |
| Net assets applicable to outstanding shares | $ 500,205 |
| Shares of beneficial interest outstanding | 66,087 |
| Net asset value and offering price per share outstanding | $ 7.57 |
| Class C | |
| Net assets applicable to outstanding shares | $ 5,873,586 |
| Shares of beneficial interest outstanding | 776,619 |
| Net asset value and offering price per share outstanding | $ 7.56 |
| Class I | |
| Net assets applicable to outstanding shares | $445,689,082 |
| Shares of beneficial interest outstanding | 58,244,054 |
| Net asset value and offering price per share outstanding | $ 7.65 |
| Class R6 | |
| Net assets applicable to outstanding shares | $109,649,022 |
| Shares of beneficial interest outstanding | 14,319,760 |
| Net asset value and offering price per share outstanding | $ 7.66 |
| 24 | MainStay MacKay U.S. Infrastructure Bond Fund |
| Investment Income (Loss) | |
| Income | |
| Interest | $ 12,982,695 |
| Dividends-affiliated | 418,923 |
| Total income | 13,401,618 |
| Expenses | |
| Manager (See Note 3) | 1,398,353 |
| Transfer agent (See Note 3) | 464,283 |
| Distribution/Service—Class A (See Note 3) | 95,004 |
| Distribution/Service—Investor Class (See Note 3) | 17,684 |
| Distribution/Service—Class B (See Note 3) | 2,819 |
| Distribution/Service—Class C (See Note 3) | 31,015 |
| Registration | 54,828 |
| Professional fees | 52,098 |
| Custodian | 36,256 |
| Shareholder communication | 14,970 |
| Trustees | 6,655 |
| Miscellaneous | 14,422 |
| Total expenses before waiver/reimbursement | 2,188,387 |
| Expense waiver/reimbursement from Manager (See Note 3) | (354,175) |
| Reimbursement from prior custodian(a) | (1,101) |
| Net expenses | 1,833,111 |
| Net investment income (loss) | 11,568,507 |
| Realized and Unrealized Gain (Loss) | |
| Net realized gain (loss) on: | |
| Unaffiliated investment transactions | (16,030,897) |
| Futures transactions | 1,411,118 |
| Net realized gain (loss) | (14,619,779) |
| Net change in unrealized appreciation (depreciation) on: | |
| Unaffiliated investments | 42,976,758 |
| Futures contracts | (1,713,935) |
| Net change in unrealized appreciation (depreciation) | 41,262,823 |
| Net realized and unrealized gain (loss) | 26,643,044 |
| Net increase (decrease) in net assets resulting from operations | $ 38,211,551 |
| (a) | Represents a refund for overbilling of custody fees. |
for the six months ended April 30, 2023 (Unaudited) and the year ended October 31, 2022
| Six months ended April 30, 2023 | Year ended October 31, 2022 | |
| Increase (Decrease) in Net Assets | ||
| Operations: | ||
| Net investment income (loss) | $ 11,568,507 | $ 13,838,405 |
| Net realized gain (loss) | (14,619,779) | (64,129,820) |
| Net change in unrealized appreciation (depreciation) | 41,262,823 | (41,992,401) |
| Net increase (decrease) in net assets resulting from operations | 38,211,551 | (92,283,816) |
| Distributions to shareholders: | ||
| Class A | (1,513,717) | (2,991,990) |
| Investor Class | (258,241) | (464,952) |
| Class B | (8,218) | (21,454) |
| Class C | (90,552) | (166,814) |
| Class I | (7,452,926) | (10,840,872) |
| Class R6 | (2,291,491) | (4,569,870) |
| Total distributions to shareholders | (11,615,145) | (19,055,952) |
| Capital share transactions: | ||
| Net proceeds from sales of shares | 245,222,645 | 323,563,093 |
| Net asset value of shares issued to shareholders in reinvestment of distributions | 8,531,993 | 13,320,339 |
| Cost of shares redeemed | (130,775,930) | (336,252,102) |
| Increase (decrease) in net assets derived from capital share transactions | 122,978,708 | 631,330 |
| Net increase (decrease) in net assets | 149,575,114 | (110,708,438) |
| Net Assets | ||
| Beginning of period | 505,256,134 | 615,964,572 |
| End of period | $ 654,831,248 | $ 505,256,134 |
| 26 | MainStay MacKay U.S. Infrastructure Bond Fund |
| Six months ended April 30, 2023* | Year Ended October 31, | ||||||||||
| Class A | 2022 | 2021 | 2020 | 2019 | 2018 | ||||||
| Net asset value at beginning of period | $ 7.20 | $ 8.74 | $ 8.77 | $ 8.64 | $ 7.93 | $ 8.33 | |||||
| Net investment income (loss) (a) | 0.15 | 0.18 | 0.13 | 0.16 | 0.21 | 0.19 | |||||
| Net realized and unrealized gain (loss) | 0.37 | (1.47) | 0.07 | 0.14 | 0.71 | (0.40) | |||||
| Total from investment operations | 0.52 | (1.29) | 0.20 | 0.30 | 0.92 | (0.21) | |||||
| Less distributions: | |||||||||||
| From net investment income | (0.15) | (0.18) | (0.13) | (0.17) | (0.21) | (0.19) | |||||
| From net realized gain on investments | — | (0.07) | (0.10) | — | — | — | |||||
| Return of capital | — | — | — | — | (0.00)‡ | — | |||||
| Total distributions | (0.15) | (0.25) | (0.23) | (0.17) | (0.21) | (0.19) | |||||
| Net asset value at end of period | $ 7.57 | $ 7.20 | $ 8.74 | $ 8.77 | $ 8.64 | $ 7.93 | |||||
| Total investment return (b) | 7.23% | (14.98)% | 2.36% | 3.45% | 11.76% | (2.54)% | |||||
| Ratios (to average net assets)/Supplemental Data: | |||||||||||
| Net investment income (loss) | 3.97%†† | 2.20% | 1.49% | 1.84% | 2.52% | 2.31% | |||||
| Net expenses (c) | 0.85%†† | 0.85% | 0.85% | 0.85% | 0.89% | 1.00% | |||||
| Expenses (before waiver/reimbursement) (c) | 1.00%†† | 0.98% | 0.96% | 0.98% | 1.02% | 1.04% | |||||
| Portfolio turnover rate | 94%(d) | 170%(d) | 51%(d) | 89%(d) | 124%(d) | 58%(e) | |||||
| Net assets at end of period (in 000’s) | $ 78,853 | $ 75,780 | $ 111,626 | $ 103,475 | $ 84,513 | $ 68,269 | |||||
| * | Unaudited. |
| ‡ | Less than one cent per share. |
| †† | Annualized. |
| (a) | Per share data based on average shares outstanding during the period. |
| (b) | Total investment return is calculated exclusive of sales charges and assumes the reinvestment of dividends and distributions. For periods of less than one year, total return is not annualized. |
| (c) | In addition to the fees and expenses which the Fund bears directly, it also indirectly bears a pro-rata share of the fees and expenses of the underlying funds in which it invests. Such indirect expenses are not included in the above expense ratios. |
| (d) | The portfolio turnover rate includes variable rate demand notes. |
| (e) | The portfolio turnover rate not including mortgage dollar rolls was 52% for the year ended October 31, 2018. |
| Six months ended April 30, 2023* | Year Ended October 31, | ||||||||||
| Investor Class | 2022 | 2021 | 2020 | 2019 | 2018 | ||||||
| Net asset value at beginning of period | $ 7.24 | $ 8.78 | $ 8.81 | $ 8.68 | $ 7.97 | $ 8.36 | |||||
| Net investment income (loss) (a) | 0.13 | 0.16 | 0.10 | 0.14 | 0.19 | 0.16 | |||||
| Net realized and unrealized gain (loss) | 0.37 | (1.47) | 0.07 | 0.13 | 0.71 | (0.39) | |||||
| Total from investment operations | 0.50 | (1.31) | 0.17 | 0.27 | 0.90 | (0.23) | |||||
| Less distributions: | |||||||||||
| From net investment income | (0.14) | (0.16) | (0.10) | (0.14) | (0.19) | (0.16) | |||||
| From net realized gain on investments | — | (0.07) | (0.10) | — | — | — | |||||
| Return of capital | — | — | — | — | (0.00)‡ | — | |||||
| Total distributions | (0.14) | (0.23) | (0.20) | (0.14) | (0.19) | (0.16) | |||||
| Net asset value at end of period | $ 7.60 | $ 7.24 | $ 8.78 | $ 8.81 | $ 8.68 | $ 7.97 | |||||
| Total investment return (b) | 6.88% | (15.14)% | 2.02% | 3.14% | 11.36% | (2.72)% | |||||
| Ratios (to average net assets)/Supplemental Data: | |||||||||||
| Net investment income (loss) | 3.63%†† | 1.95% | 1.16% | 1.57% | 2.21% | 1.98% | |||||
| Net expenses (c) | 1.17%†† | 1.12% | 1.17% | 1.15% | 1.21% | 1.33% | |||||
| Expenses (before waiver/reimbursement) (c) | 1.38%†† | 1.25% | 1.33% | 1.28% | 1.35% | 1.44% | |||||
| Portfolio turnover rate | 94%(d) | 170%(d) | 51%(d) | 89%(d) | 124%(d) | 58%(e) | |||||
| Net assets at end of period (in 000's) | $ 14,266 | $ 13,974 | $ 17,994 | $ 19,459 | $ 20,520 | $ 21,012 | |||||
| * | Unaudited. |
| ‡ | Less than one cent per share. |
| †† | Annualized. |
| (a) | Per share data based on average shares outstanding during the period. |
| (b) | Total investment return is calculated exclusive of sales charges and assumes the reinvestment of dividends and distributions. For periods of less than one year, total return is not annualized. |
| (c) | In addition to the fees and expenses which the Fund bears directly, it also indirectly bears a pro-rata share of the fees and expenses of the underlying funds in which it invests. Such indirect expenses are not included in the above expense ratios. |
| (d) | The portfolio turnover rate includes variable rate demand notes. |
| (e) | The portfolio turnover rate not including mortgage dollar rolls was 52% for the year ended October 31, 2018. |
| 28 | MainStay MacKay U.S. Infrastructure Bond Fund |
| Six months ended April 30, 2023* | Year Ended October 31, | ||||||||||
| Class B | 2022 | 2021 | 2020 | 2019 | 2018 | ||||||
| Net asset value at beginning of period | $ 7.20 | $ 8.74 | $ 8.77 | $ 8.64 | $ 7.94 | $ 8.33 | |||||
| Net investment income (loss) (a) | 0.11 | 0.09 | 0.04 | 0.07 | 0.12 | 0.10 | |||||
| Net realized and unrealized gain (loss) | 0.37 | (1.46) | 0.07 | 0.14 | 0.70 | (0.39) | |||||
| Total from investment operations | 0.48 | (1.37) | 0.11 | 0.21 | 0.82 | (0.29) | |||||
| Less distributions: | |||||||||||
| From net investment income | (0.11) | (0.10) | (0.04) | (0.08) | (0.12) | (0.10) | |||||
| From net realized gain on investments | — | (0.07) | (0.10) | — | — | — | |||||
| Return of capital | — | — | — | — | (0.00)‡ | — | |||||
| Total distributions | (0.11) | (0.17) | (0.14) | (0.08) | (0.12) | (0.10) | |||||
| Net asset value at end of period | $ 7.57 | $ 7.20 | $ 8.74 | $ 8.77 | $ 8.64 | $ 7.94 | |||||
| Total investment return (b) | 6.67% | (15.84)% | 1.28% | 2.39% | 10.46% | (3.46)% | |||||
| Ratios (to average net assets)/Supplemental Data: | |||||||||||
| Net investment income (loss) | 2.90%†† | 1.11% | 0.42% | 0.85% | 1.46% | 1.23% | |||||
| Net expenses (c) | 1.92%†† | 1.87% | 1.92% | 1.90% | 1.96% | 2.08% | |||||
| Expenses (before waiver/reimbursement) (c) | 2.13%†† | 2.00% | 2.08% | 2.03% | 2.10% | 2.19% | |||||
| Portfolio turnover rate | 94%(d) | 170%(d) | 51%(d) | 89%(d) | 124%(d) | 58%(e) | |||||
| Net assets at end of period (in 000’s) | $ 500 | $ 623 | $ 1,343 | $ 1,902 | $ 2,621 | $ 3,224 | |||||
| * | Unaudited. |
| ‡ | Less than one cent per share. |
| †† | Annualized. |
| (a) | Per share data based on average shares outstanding during the period. |
| (b) | Total investment return is calculated exclusive of sales charges and assumes the reinvestment of dividends and distributions. For periods of less than one year, total return is not annualized. |
| (c) | In addition to the fees and expenses which the Fund bears directly, it also indirectly bears a pro-rata share of the fees and expenses of the underlying funds in which it invests. Such indirect expenses are not included in the above expense ratios. |
| (d) | The portfolio turnover rate includes variable rate demand notes. |
| (e) | The portfolio turnover rate not including mortgage dollar rolls was 52% for the year ended October 31, 2018. |
| Six months ended April 30, 2023* | Year Ended October 31, | ||||||||||
| Class C | 2022 | 2021 | 2020 | 2019 | 2018 | ||||||
| Net asset value at beginning of period | $ 7.20 | $ 8.74 | $ 8.77 | $ 8.64 | $ 7.93 | $ 8.32 | |||||
| Net investment income (loss) (a) | 0.11 | 0.11 | 0.04 | 0.08 | 0.12 | 0.10 | |||||
| Net realized and unrealized gain (loss) | 0.36 | (1.48) | 0.07 | 0.13 | 0.71 | (0.39) | |||||
| Total from investment operations | 0.47 | (1.37) | 0.11 | 0.21 | 0.83 | (0.29) | |||||
| Less distributions: | |||||||||||
| From net investment income | (0.11) | (0.10) | (0.04) | (0.08) | (0.12) | (0.10) | |||||
| From net realized gain on investments | — | (0.07) | (0.10) | — | — | — | |||||
| Return of capital | — | — | — | — | (0.00)‡ | — | |||||
| Total distributions | (0.11) | (0.17) | (0.14) | (0.08) | (0.12) | (0.10) | |||||
| Net asset value at end of period | $ 7.56 | $ 7.20 | $ 8.74 | $ 8.77 | $ 8.64 | $ 7.93 | |||||
| Total investment return (b) | 6.53% | (15.84)% | 1.27% | 2.38% | 10.59% | (3.46)% | |||||
| Ratios (to average net assets)/Supplemental Data: | |||||||||||
| Net investment income (loss) | 2.90%†† | 1.38% | 0.42% | 0.88% | 1.47% | 1.23% | |||||
| Net expenses (c) | 1.92%†† | 1.87% | 1.92% | 1.90% | 1.96% | 2.08% | |||||
| Expenses (before waiver/reimbursement) (c) | 2.13%†† | 2.00% | 2.08% | 2.02% | 2.10% | 2.19% | |||||
| Portfolio turnover rate | 94%(d) | 170%(d) | 51%(d) | 89%(d) | 124%(d) | 58%(e) | |||||
| Net assets at end of period (in 000’s) | $ 5,874 | $ 7,037 | $ 6,481 | $ 8,708 | $ 14,152 | $ 7,612 | |||||
| * | Unaudited. |
| ‡ | Less than one cent per share. |
| †† | Annualized. |
| (a) | Per share data based on average shares outstanding during the period. |
| (b) | Total investment return is calculated exclusive of sales charges and assumes the reinvestment of dividends and distributions. For periods of less than one year, total return is not annualized. |
| (c) | In addition to the fees and expenses which the Fund bears directly, it also indirectly bears a pro-rata share of the fees and expenses of the underlying funds in which it invests. Such indirect expenses are not included in the above expense ratios. |
| (d) | The portfolio turnover rate includes variable rate demand notes. |
| (e) | The portfolio turnover rate not including mortgage dollar rolls was 52% for the year ended October 31, 2018. |
| 30 | MainStay MacKay U.S. Infrastructure Bond Fund |
| Six months ended April 30, 2023* | Year Ended October 31, | ||||||||||
| Class I | 2022 | 2021 | 2020 | 2019 | 2018 | ||||||
| Net asset value at beginning of period | $ 7.28 | $ 8.84 | $ 8.87 | $ 8.73 | $ 8.02 | $ 8.42 | |||||
| Net investment income (loss) (a) | 0.16 | 0.20 | 0.15 | 0.17 | 0.24 | 0.21 | |||||
| Net realized and unrealized gain (loss) | 0.37 | (1.49) | 0.07 | 0.16 | 0.71 | (0.40) | |||||
| Total from investment operations | 0.53 | (1.29) | 0.22 | 0.33 | 0.95 | (0.19) | |||||
| Less distributions: | |||||||||||
| From net investment income | (0.16) | (0.20) | (0.15) | (0.19) | (0.24) | (0.21) | |||||
| From net realized gain on investments | — | (0.07) | (0.10) | — | — | — | |||||
| Return of capital | — | — | — | — | (0.00)‡ | — | |||||
| Total distributions | (0.16) | (0.27) | (0.25) | (0.19) | (0.24) | (0.21) | |||||
| Net asset value at end of period | $ 7.65 | $ 7.28 | $ 8.84 | $ 8.87 | $ 8.73 | $ 8.02 | |||||
| Total investment return (b) | 7.28% | (14.83)% | 2.58% | 3.78% | 11.95% | (2.26)% | |||||
| Ratios (to average net assets)/Supplemental Data: | |||||||||||
| Net investment income (loss) | 4.15%†† | 2.47% | 1.71% | 1.97% | 2.64% | 2.56% | |||||
| Net expenses (c) | 0.60%†† | 0.60% | 0.60% | 0.60% | 0.60% | 0.75% | |||||
| Expenses (before waiver/reimbursement) (c) | 0.75%†† | 0.73% | 0.71% | 0.72% | 0.74% | 0.79% | |||||
| Portfolio turnover rate | 94%(d) | 170%(d) | 51%(d) | 89%(d) | 124%(d) | 58%(e) | |||||
| Net assets at end of period (in 000’s) | $ 445,689 | $ 297,386 | $ 329,021 | $ 292,000 | $ 177,305 | $ 5,003 | |||||
| * | Unaudited. |
| ‡ | Less than one cent per share. |
| †† | Annualized. |
| (a) | Per share data based on average shares outstanding during the period. |
| (b) | Total investment return is calculated exclusive of sales charges and assumes the reinvestment of dividends and distributions. Class I shares are not subject to sales charges. For periods of less than one year, total return is not annualized. |
| (c) | In addition to the fees and expenses which the Fund bears directly, it also indirectly bears a pro-rata share of the fees and expenses of the underlying funds in which it invests. Such indirect expenses are not included in the above expense ratios. |
| (d) | The portfolio turnover rate includes variable rate demand notes. |
| (e) | The portfolio turnover rate not including mortgage dollar rolls was 52% for the year ended October 31, 2018. |
| Six months ended April 30, 2023* | Year Ended October 31, | November 1, 2019^ through October 31, | |||||
| Class R6 | 2022 | 2021 | 2020 | ||||
| Net asset value at beginning of period | $ 7.29 | $ 8.84 | $ 8.87 | $ 8.72 | |||
| Net investment income (loss) (a) | 0.16 | 0.20 | 0.16 | 0.19 | |||
| Net realized and unrealized gain (loss) | 0.37 | (1.47) | 0.07 | 0.15 | |||
| Total from investment operations | 0.53 | (1.27) | 0.23 | 0.34 | |||
| Less distributions: | |||||||
| From net investment income | (0.16) | (0.21) | (0.16) | (0.19) | |||
| From net realized gain on investments | — | (0.07) | (0.10) | — | |||
| Total distributions | (0.16) | (0.28) | (0.26) | (0.19) | |||
| Net asset value at end of period | $ 7.66 | $ 7.29 | $ 8.84 | $ 8.87 | |||
| Total investment return (b) | 7.31% | (14.66)% | 2.65% | 3.85% | |||
| Ratios (to average net assets)/Supplemental Data: | |||||||
| Net investment income (loss) | 4.23%†† | 2.50% | 1.77% | 2.16% | |||
| Net expenses (c) | 0.53%†† | 0.53% | 0.53% | 0.53% | |||
| Expenses (before waiver/reimbursement) (c) | 0.56%†† | 0.57% | 0.56% | 0.58% | |||
| Portfolio turnover rate (d) | 94% | 170% | 51% | 89% | |||
| Net assets at end of period (in 000’s) | $ 109,649 | $ 110,457 | $ 149,500 | $ 83,204 | |||
| * | Unaudited. |
| ^ | Inception date. |
| †† | Annualized. |
| (a) | Per share data based on average shares outstanding during the period. |
| (b) | Total investment return is calculated exclusive of sales charges and assumes the reinvestment of dividends and distributions. Class R6 shares are not subject to sales charges. For periods of less than one year, total return is not annualized. |
| (c) | In addition to the fees and expenses which the Fund bears directly, it also indirectly bears a pro-rata share of the fees and expenses of the underlying funds in which it invests. Such indirect expenses are not included in the above expense ratios. |
| (d) | The portfolio turnover rate includes variable rate demand notes. |
| 32 | MainStay MacKay U.S. Infrastructure Bond Fund |
| Class | Commenced Operations |
| Class A | January 3, 1995 |
| Investor Class | February 28, 2008 |
| Class B | May 1, 1986 |
| Class C | September 1, 1998 |
| Class I | January 2, 2004 |
| Class R6 | November 1, 2019 |
| • | Level 1—quoted prices (unadjusted) in active markets for an identical asset or liability |
| • | Level 2—other significant observable inputs (including quoted prices for a similar asset or liability in active markets, interest rates and yield curves, prepayment speeds, credit risk, etc.) |
| • | Level 3—significant unobservable inputs (including the Fund's own assumptions about the assumptions that market participants would use in measuring fair value of an asset or liability) |
| • Benchmark yields | • Reported trades |
| • Broker/dealer quotes | • Issuer spreads |
| • Two-sided markets | • Benchmark securities |
| • Bids/offers | • Reference data (corporate actions or material event notices) |
| • Industry and economic events | • Comparable bonds |
| • Monthly payment information |
| 34 | MainStay MacKay U.S. Infrastructure Bond Fund |
| 36 | MainStay MacKay U.S. Infrastructure Bond Fund |
| Liability Derivatives | Interest Rate Contracts Risk | Total |
| Futures Contracts - Net Assets—Net unrealized depreciation on futures contracts (a) | $(12,133) | $(12,133) |
| Total Fair Value | $(12,133) | $(12,133) |
| (a) | Includes cumulative appreciation (depreciation) of futures contracts as reported in the Portfolio of Investments. Only current day’s variation margin is reported within the Statement of Assets and Liabilities. |
| Net Realized Gain (Loss) from: | Interest Rate Contracts Risk | Total |
| Futures Contracts | $1,411,118 | $1,411,118 |
| Total Net Realized Gain (Loss) | $1,411,118 | $1,411,118 |
| Net Change in Unrealized Appreciation (Depreciation) | Interest Rate Contracts Risk | Total |
| Futures Contracts | $(1,713,935) | $(1,713,935) |
| Total Net Change in Unrealized Appreciation (Depreciation) | $(1,713,935) | $(1,713,935) |
| Average Notional Amount | Total |
| Futures Contracts Short (a) | $(16,252,728) |
| (a) | Positions were open five months during the reporting period. |
| 38 | MainStay MacKay U.S. Infrastructure Bond Fund |
| Class | Expense | Waived |
| Class A | $ 71,313 | $ — |
| Investor Class | 39,827 | (4,320) |
| Class B | 1,582 | (154) |
| Class C | 17,416 | (1,755) |
| Class I | 331,985 | — |
| Class R6 | 2,160 | — |
| Class R6 | $24,350 | 0.0%‡ |
| ‡ | Less than one-tenth of a percent. |
| Federal Tax Cost | Gross Unrealized Appreciation | Gross Unrealized (Depreciation) | Net Unrealized Appreciation/ (Depreciation) | |
| Investments in Securities | $636,303,098 | $13,364,381 | $(4,532,479) | $8,831,902 |
| Capital Loss Available Through | Short-Term Capital Loss Amounts (000’s) | Long-Term Capital Loss Amounts (000’s) |
| Unlimited | $34,774 | $26,758 |
| 2022 | |
| Distributions paid from: | |
| Ordinary Income | $16,251,597 |
| Long-Term Capital Gains | 2,804,355 |
| Total | $19,055,952 |
| Class A | Shares | Amount |
| Six-month period ended April 30, 2023: | ||
| Shares sold | 1,434,655 | $ 10,719,031 |
| Shares issued to shareholders in reinvestment of distributions | 183,937 | 1,371,861 |
| Shares redeemed | (1,782,257) | (13,266,839) |
| Net increase (decrease) in shares outstanding before conversion | (163,665) | (1,175,947) |
| Shares converted into Class A (See Note 1) | 69,118 | 515,792 |
| Shares converted from Class A (See Note 1) | (6,067) | (46,047) |
| Net increase (decrease) | (100,614) | $ (706,202) |
| Year ended October 31, 2022: | ||
| Shares sold | 1,339,045 | $ 10,623,586 |
| Shares issued to shareholders in reinvestment of distributions | 338,782 | 2,751,730 |
| Shares redeemed | (4,065,381) | (32,494,364) |
| Net increase (decrease) in shares outstanding before conversion | (2,387,554) | (19,119,048) |
| Shares converted into Class A (See Note 1) | 136,281 | 1,091,052 |
| Net increase (decrease) | (2,251,273) | $ (18,027,996) |
| 40 | MainStay MacKay U.S. Infrastructure Bond Fund |
| Investor Class | Shares | Amount |
| Six-month period ended April 30, 2023: | ||
| Shares sold | 23,710 | $ 178,312 |
| Shares issued to shareholders in reinvestment of distributions | 33,404 | 250,311 |
| Shares redeemed | (88,674) | (663,302) |
| Net increase (decrease) in shares outstanding before conversion | (31,560) | (234,679) |
| Shares converted into Investor Class (See Note 1) | 14,919 | 111,231 |
| Shares converted from Investor Class (See Note 1) | (37,954) | (284,996) |
| Net increase (decrease) | (54,595) | $ (408,444) |
| Year ended October 31, 2022: | ||
| Shares sold | 49,196 | $ 406,321 |
| Shares issued to shareholders in reinvestment of distributions | 55,770 | 453,075 |
| Shares redeemed | (211,433) | (1,711,769) |
| Net increase (decrease) in shares outstanding before conversion | (106,467) | (852,373) |
| Shares converted into Investor Class (See Note 1) | 24,384 | 197,255 |
| Shares converted from Investor Class (See Note 1) | (36,410) | (294,644) |
| Net increase (decrease) | (118,493) | $ (949,762) |
| Class B | Shares | Amount |
| Six-month period ended April 30, 2023: | ||
| Shares sold | 24 | $ 274 |
| Shares issued to shareholders in reinvestment of distributions | 1,063 | 7,930 |
| Shares redeemed | (4,717) | (35,170) |
| Net increase (decrease) in shares outstanding before conversion | (3,630) | (26,966) |
| Shares converted from Class B (See Note 1) | (16,719) | (124,268) |
| Net increase (decrease) | (20,349) | $ (151,234) |
| Year ended October 31, 2022: | ||
| Shares sold | 908 | $ 7,260 |
| Shares issued to shareholders in reinvestment of distributions | 2,398 | 19,643 |
| Shares redeemed | (31,334) | (256,127) |
| Net increase (decrease) in shares outstanding before conversion | (28,028) | (229,224) |
| Shares converted from Class B (See Note 1) | (39,207) | (316,544) |
| Net increase (decrease) | (67,235) | $ (545,768) |
| Class C | Shares | Amount |
| Six-month period ended April 30, 2023: | ||
| Shares sold | 70,381 | $ 525,226 |
| Shares issued to shareholders in reinvestment of distributions | 11,866 | 88,422 |
| Shares redeemed | (271,490) | (2,006,654) |
| Net increase (decrease) in shares outstanding before conversion | (189,243) | (1,393,006) |
| Shares converted from Class C (See Note 1) | (11,553) | (85,640) |
| Net increase (decrease) | (200,796) | $ (1,478,646) |
| Year ended October 31, 2022: | ||
| Shares sold | 1,674,506 | $ 13,419,612 |
| Shares issued to shareholders in reinvestment of distributions | 19,536 | 155,146 |
| Shares redeemed | (1,432,935) | (11,189,460) |
| Net increase (decrease) in shares outstanding before conversion | 261,107 | 2,385,298 |
| Shares converted from Class C (See Note 1) | (25,380) | (202,703) |
| Net increase (decrease) | 235,727 | $ 2,182,595 |
| Class I | Shares | Amount |
| Six-month period ended April 30, 2023: | ||
| Shares sold | 28,214,934 | $ 213,158,449 |
| Shares issued to shareholders in reinvestment of distributions | 890,178 | 6,721,238 |
| Shares redeemed | (11,696,346) | (88,032,713) |
| Net increase (decrease) in shares outstanding before conversion | 17,408,766 | 131,846,974 |
| Shares converted into Class I (See Note 1) | 5,996 | 46,047 |
| Net increase (decrease) | 17,414,762 | $ 131,893,021 |
| Year ended October 31, 2022: | ||
| Shares sold | 30,421,882 | $ 247,802,802 |
| Shares issued to shareholders in reinvestment of distributions | 1,184,397 | 9,631,745 |
| Shares redeemed | (27,984,055) | (225,779,233) |
| Net increase (decrease) in shares outstanding before conversion | 3,622,224 | 31,655,314 |
| Shares converted into Class I (See Note 1) | 1,613 | 12,578 |
| Shares converted from Class I (See Note 1) | (27,235) | (204,537) |
| Net increase (decrease) | 3,596,602 | $ 31,463,355 |
| Class R6 | Shares | Amount |
| Six-month period ended April 30, 2023: | ||
| Shares sold | 2,744,455 | $ 20,641,353 |
| Shares issued to shareholders in reinvestment of distributions | 12,225 | 92,231 |
| Shares redeemed | (3,574,034) | (26,771,252) |
| Net increase (decrease) in shares outstanding before conversion | (817,354) | (6,037,668) |
| Shares converted from Class R6 (See Note 1) | (17,505) | (132,119) |
| Net increase (decrease) | (834,859) | $ (6,169,787) |
| Year ended October 31, 2022: | ||
| Shares sold | 6,403,249 | $ 51,303,512 |
| Shares issued to shareholders in reinvestment of distributions | 36,712 | 309,000 |
| Shares redeemed | (8,157,515) | (64,821,149) |
| Net increase (decrease) in shares outstanding before conversion | (1,717,554) | (13,208,637) |
| Shares converted from Class R6 (See Note 1) | (33,326) | (282,457) |
| Net increase (decrease) | (1,750,880) | $ (13,491,094) |
| 42 | MainStay MacKay U.S. Infrastructure Bond Fund |
| 44 | MainStay MacKay U.S. Infrastructure Bond Fund |
| 46 | MainStay MacKay U.S. Infrastructure Bond Fund |
| 48 | MainStay MacKay U.S. Infrastructure Bond Fund |
1.
| 2. | This Fund is registered for sale in CA, CT, DE, FL, MA, NJ, NY and VT. |
| 3. | An affiliate of New York Life Investment Management LLC. |
| 5022150MS043-23 | MSINF10-06/23 |
please log in to newyorklifeinvestments.com/accounts.
| Not FDIC/NCUA Insured | Not a Deposit | May Lose Value | No Bank Guarantee | Not Insured by Any Government Agency |


President

| Average Annual Total Returns for the Period-Ended April 30, 2023 | ||||||||
| Class | Sales Charge | Inception Date | Six Months1 | One Year | Five Years | Ten Years or Since Inception | Gross Expense Ratio2 | |
| Class A Shares3 | No Sales Charge | 1/3/1995 | 1.95% | 2.66% | 1.14% | 0.65% | 0.52% | |
| Investor Class Shares3 | No Sales Charge | 2/28/2008 | 1.81 | 2.37 | 0.99 | 0.55 | 0.84 | |
| Class B Shares3, 4 | No Sales Charge | 5/1/1986 | 1.81 | 2.37 | 0.99 | 0.55 | 0.84 | |
| Class C Shares3 | No Sales Charge | 9/1/1998 | 1.80 | 2.37 | 0.99 | 0.55 | 0.84 | |
| SIMPLE Class Shares3 | No Sales Charge | 8/31/2020 | 1.85 | 2.41 | N/A | 0.91 | 0.65 | |
| 1. | Not annualized. |
| 2. | The gross expense ratios presented reflect the Fund’s “Total Annual Fund Operating Expenses” from the most recent Prospectus, as supplemented, and may differ from other expense ratios disclosed in this report. |
| 3. | As of April 30, 2023, MainStay Money Market Fund had an effective 7-day yield of 4.42% for Class A, 4.14% for Investor Class, 4.14% for Class B, 4.14% for Class C and 4.33% for SIMPLE Class shares. The 7-day current yield was 4.33% for Class A, 4.06% for Investor Class, 4.05% for Class B, 4.05% for Class C and 4.24% for SIMPLE Class shares. These yields reflect certain expense limitations. Had these expense limitations not been in effect, the effective 7-day yield would have been 4.42%, 4.05%, 4.04%, 4.04% and 4.33%, for Class A, Investor Class, Class B, Class C and SIMPLE Class shares, respectively, and the 7-day current yield would have been 4.33%, 3.96%, 3.96%, 3.96% and 4.24%, for Class A, Investor Class, Class B, Class C and SIMPLE Class shares, respectively. The current yield reflects the Fund’s earnings better than the Fund’s total return. |
| 4. | Class B shares are closed to all new purchases as well as additional investments by existing Class B shareholders. |
| Benchmark Performance* | Six Months1 | One Year | Five Years | Ten Years |
| Average Lipper Money Market Fund2 | 1.97% | 2.75% | 1.22% | 0.73% |
| * | Returns for indices reflect no deductions for fees, expenses or taxes, except for foreign withholding taxes where applicable. Results assume reinvestment of all dividends and capital gains. An investment cannot be made directly in an index. |
| 1. | Not annualized. |
| 2. | The Average Lipper Money Market Fund is an equally weighted performance average adjusted for capital gains distributions and income dividends of all of the money market funds in the Lipper Universe. Lipper Inc., a wholly-owned subsidiary of Reuters Group PLC, is an independent monitor of mutual fund performance. Lipper averages are not class specific. Lipper returns are unaudited. Results are based on average total returns of similar funds with all dividend and capital gain distributions reinvested. |
| 6 | MainStay Money Market Fund |
| Share Class | Beginning Account Value 11/1/22 | Ending Account Value (Based on Actual Returns and Expenses) 4/30/23 | Expenses Paid During Period1 | Ending Account Value (Based on Hypothetical 5% Annualized Return and Actual Expenses) 4/30/23 | Expenses Paid During Period1 | Net Expense Ratio During Period2 |
| Class A Shares | $1,000.00 | $1,019.50 | $2.60 | $1,022.22 | $2.61 | 0.52% |
| Investor Class Shares | $1,000.00 | $1,018.10 | $4.00 | $1,020.83 | $4.01 | 0.80% |
| Class B Shares | $1,000.00 | $1,018.10 | $4.00 | $1,020.83 | $4.01 | 0.80% |
| Class C Shares | $1,000.00 | $1,018.00 | $4.00 | $1,020.83 | $4.01 | 0.80% |
| SIMPLE Class Shares | $1,000.00 | $1,018.50 | $3.30 | $1,021.52 | $3.31 | 0.66% |
| 1. | Expenses are equal to the Fund’s annualized expense ratio of each class multiplied by the average account value over the period, divided by 365 and multiplied by 181 (to reflect the six-month period). The table above represents the actual expenses incurred during the six-month period. In addition to the fees and expenses which the Fund bears directly, it also indirectly bears a pro rata share of the fees and expenses of the underlying funds in which it invests. Such indirect expenses are not included in the above-reported expense figures. |
| 2. | Expenses are equal to the Fund's annualized expense ratio to reflect the six-month period. |
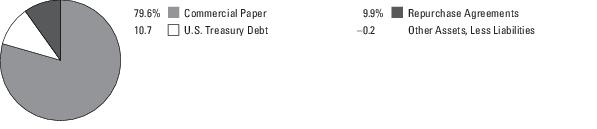
| 8 | MainStay Money Market Fund |
| 1. | See "Investment and Performance Comparison" for other share class returns, which may be higher or lower than Class A share returns, and for more information on peer group returns. |
| 2. | The yield curve is a line that plots the yields of various securities of similar quality—typically U.S. Treasury issues—across a range of maturities. The U.S. Treasury yield curve serves as a benchmark for other debt and is used in economic forecasting. |
| 3. | The effective federal funds rate (EFFR) is calculated as the effective median interest rate of overnight federal funds transactions during the previous business day. It is published daily by the Federal Reserve Bank of New York. |
| 4. | Duration is a measure of the price sensitivity of a fixed-income investment to changes in interest rates. Duration is expressed as a number of years and is considered a more accurate sensitivity gauge than average maturity. |
| 5. | The Bloomberg 1 Month T-Bill Index is represents a hypothetical one-month T-bill curve. |
| 6. | Tier 1 commercial paper may carry A-1 or above ratings from Standard & Poor’s, P-1 from Moody’s and/or F1 or above from Fitch. |
| Principal Amount | Value | |
| Short-Term Investments 100.2% | ||
| Commercial Paper 79.6% | ||
| Alabama Power Co. | ||
| 5.01%, due 5/5/23 | $ 20,000,000 | $ 19,988,889 |
| American Transmission Co. LLC | ||
| 4.949%, due 5/24/23 | 20,000,000 | 19,937,005 |
| Analog Devices, Inc. | ||
| 5.015%, due 5/18/23 | 20,000,000 | 19,952,778 |
| Archer-Daniels-Midland Co. | ||
| 4.825%, due 5/1/23 | 20,000,000 | 20,000,000 |
| Caterpillar Financial Services Corp. | ||
| 4.849%, due 5/10/23 | 20,000,000 | 19,975,800 |
| Cummins, Inc. | ||
| 5.029%, due 5/17/23 | 20,000,000 | 19,955,555 |
| Henkel Corp. | ||
| 5.061%, due 5/25/23 | 20,000,000 | 19,932,800 |
| Hershey Co. (The) | ||
| 4.897%, due 5/22/23 | 20,000,000 | 19,943,067 |
| Illinois Tool Works, Inc. | ||
| 4.854%, due 5/18/23 | 20,000,000 | 19,954,289 |
| John Deere Canada ULC | ||
| 4.871%, due 5/5/23 | 20,000,000 | 19,989,200 |
| Kenvue, Inc. | ||
| 4.873%, due 5/16/23 | 20,000,000 | 19,959,500 |
| Massachusetts Mutual Life Insurance Co. | ||
| 4.919%, due 5/25/23 | 20,000,000 | 19,934,667 |
| National Rural Utilities Cooperative Finance Corp. | ||
| 5.008%, due 5/2/23 | 15,000,000 | 14,997,917 |
| Natixis SA | ||
| 5.005%, due 5/17/23 | 20,000,000 | 19,955,644 |
| Province of Quebec Canada | ||
| 4.889%, due 5/10/23 | 20,000,000 | 19,975,600 |
| Rockwell Automation, Inc. | ||
| 4.804%, due 5/1/23 | 20,000,000 | 20,000,000 |
| Southern California Gas Co. | ||
| 4.794%, due 5/2/23 | 20,000,000 | 19,997,339 |
| Sumitomo Mitsui Trust Bank Ltd. | ||
| 4.897%, due 5/8/23 | 20,000,000 | 19,980,983 |
| TotalEnergies Capital Canada Ltd. | ||
| 4.863%, due 5/10/23 | 20,000,000 | 19,975,750 |
| Toyota Motor Credit Corp. | ||
| 5.129%, due 8/8/23 | 20,000,000 | 19,725,000 |
| Total Commercial Paper (Cost $394,131,783) | 394,131,783 | |
| Principal Amount | Value | ||
| Repurchase Agreements 9.9% | |||
| Bofa Securities, Inc. 4.80%, dated 4/28/23 due 5/1/23 Proceeds at Maturity $20,000,053 (Collateralized by United States Treasury security with a rate of 0.25% and with maturity date of 07/15/29, with a Principal Amount of $18,405,800 and a Market Value of $20,400,054) | 20,000,000 | $ 20,000,000 | |
| RBC Capital Markets LLC 4.75%, dated 4/28/23 due 5/1/23 Proceeds at Maturity $3,989,656 (Collateralized by United States Treasury securities with rates between 0.50% and 0.625% and maturity dates between 02/28/26 and 12/03/27, with a Principal Amount of $4,489,700 and a Market Value of $4,069,449) | 3,988,000 | 3,988,000 | |
| TD Securities, Inc. 4.77%, dated 4/28/23 due 5/1/23 Proceeds at Maturity $25,000,040 (Collateralized by United States Treasury securities with rates between 0.75% and 2.875% and maturity dates between 02/28/25 and 05/15/32, with a Principal Amount of $27,571,300 and a Market Value of $25,500,040) | 25,000,000 | 25,000,000 | |
| Total Repurchase Agreements (Cost $48,988,000) | 48,988,000 | ||
| U.S. Treasury Debt 10.7% | |||
| U.S. Treasury Bills | |||
| 3.971%, due 5/9/23 (a) | $ 53,000,000 | 52,953,344 | |
| Total U.S. Treasury Debt (Cost $52,953,344) | 52,953,344 | ||
| Total Short-Term Investments (Cost $496,073,127) | 100.2% | 496,073,127 | |
| Other Assets, Less Liabilities | (0.2) | (964,212) | |
| Net Assets | 100.0% | $ 495,108,915 | |
| † | Percentages indicated are based on Fund net assets. |
| ^ | Industry classifications may be different than those used for compliance monitoring purposes. |
| (a) | Interest rate shown represents yield to maturity. |
| 10 | MainStay Money Market Fund |
| Description | Quoted Prices in Active Markets for Identical Assets (Level 1) | Significant Other Observable Inputs (Level 2) | Significant Unobservable Inputs (Level 3) | Total | |||
| Asset Valuation Inputs | |||||||
| Investments in Securities (a) | |||||||
| Short-Term Investments | |||||||
| Commercial Paper | $ — | $ 394,131,783 | $ — | $ 394,131,783 | |||
| Repurchase Agreements | — | 48,988,000 | — | 48,988,000 | |||
| U.S. Treasury Debt | — | 52,953,344 | — | 52,953,344 | |||
| Total Investments in Securities | $ — | $ 496,073,127 | $ — | $ 496,073,127 |
| (a) | For a complete listing of investments and their industries, see the Portfolio of Investments. |
| Assets | |
| Investment in securities, at value (amortized cost $447,085,127) | $447,085,127 |
| Repurchase agreements, at value (amortized cost $48,988,000) | 48,988,000 |
| Cash | 326 |
| Receivables: | |
| Fund shares sold | 60,154 |
| Interest | 19,516 |
| Other assets | 81,150 |
| Total assets | 496,234,273 |
| Liabilities | |
| Payables: | |
| Fund shares redeemed | 788,779 |
| Manager (See Note 3) | 158,049 |
| Transfer agent (See Note 3) | 102,794 |
| Professional fees | 25,683 |
| Shareholder communication | 15,974 |
| Custodian | 6,694 |
| Accrued expenses | 401 |
| Dividends payable | 26,984 |
| Total liabilities | 1,125,358 |
| Net assets | $495,108,915 |
| Composition of Net Assets | |
| Shares of beneficial interest outstanding (par value of $.01 per share) unlimited number of shares authorized | $ 4,951,229 |
| Additional paid-in-capital | 490,131,263 |
| 495,082,492 | |
| Total distributable earnings (loss) | 26,423 |
| Net assets | $495,108,915 |
| Class A | |
| Net assets applicable to outstanding shares | $437,090,628 |
| Shares of beneficial interest outstanding | 437,091,610 |
| Net asset value and offering price per share outstanding | $ 1.00 |
| Investor Class | |
| Net assets applicable to outstanding shares | $ 18,240,878 |
| Shares of beneficial interest outstanding | 18,250,574 |
| Net asset value and offering price per share outstanding | $ 1.00 |
| Class B | |
| Net assets applicable to outstanding shares | $ 22,720,693 |
| Shares of beneficial interest outstanding | 22,724,071 |
| Net asset value and offering price per share outstanding | $ 1.00 |
| Class C | |
| Net assets applicable to outstanding shares | $ 16,680,474 |
| Shares of beneficial interest outstanding | 16,680,418 |
| Net asset value and offering price per share outstanding | $ 1.00 |
| SIMPLE Class | |
| Net assets applicable to outstanding shares | $ 376,242 |
| Shares of beneficial interest outstanding | 376,242 |
| Net asset value and offering price per share outstanding | $ 1.00 |
| 12 | MainStay Money Market Fund |
| Investment Income (Loss) | |
| Income | |
| Interest | $10,632,093 |
| Expenses | |
| Manager (See Note 3) | 964,038 |
| Transfer agent (See Note 3) | 266,076 |
| Registration | 58,703 |
| Professional fees | 45,549 |
| Custodian | 11,223 |
| Trustees | 5,583 |
| Shareholder communication | 2,458 |
| Miscellaneous | 4,006 |
| Total expenses before waiver/reimbursement | 1,357,636 |
| Expense waiver/reimbursement from Manager (See Note 3) | (25,223) |
| Reimbursement from prior custodian(a) | (934) |
| Net expenses | 1,331,479 |
| Net investment income (loss) | 9,300,614 |
| Realized Gain (Loss) | |
| Net realized gain (loss) on investments | 2,505 |
| Net increase (decrease) in net assets resulting from operations | $ 9,303,119 |
| (a) | Represents a refund for overbilling of custody fees. |
for the six months ended April 30, 2023 (Unaudited) and the year ended October 31, 2022
| Six months ended April 30, 2023 | Year ended October 31, 2022 | |
| Increase (Decrease) in Net Assets | ||
| Operations: | ||
| Net investment income (loss) | $ 9,300,614 | $ 3,266,263 |
| Net realized gain (loss) | 2,505 | (8,910) |
| Net increase (decrease) in net assets resulting from operations | 9,303,119 | 3,257,353 |
| Distributions to shareholders: | ||
| Class A | (8,233,908) | (2,920,592) |
| Investor Class | (336,259) | (109,797) |
| Class B | (414,287) | (132,408) |
| Class C | (312,569) | (103,073) |
| SIMPLE Class | (3,590) | (394) |
| Total distributions to shareholders | (9,300,613) | (3,266,264) |
| Capital share transactions: | ||
| Net proceeds from sales of shares | 226,353,254 | 533,186,206 |
| Net asset value of shares issued to shareholders in reinvestment of distributions | 9,051,803 | 3,179,577 |
| Cost of shares redeemed | (229,237,561) | (467,932,037) |
| Increase (decrease) in net assets derived from capital share transactions | 6,167,496 | 68,433,746 |
| Net increase (decrease) in net assets | 6,170,002 | 68,424,835 |
| Net Assets | ||
| Beginning of period | 488,938,913 | 420,514,078 |
| End of period | $ 495,108,915 | $ 488,938,913 |
| 14 | MainStay Money Market Fund |
| Six months ended April 30, 2023* | Year Ended October 31, | ||||||||||
| Class A | 2022 | 2021 | 2020 | 2019 | 2018 | ||||||
| Net asset value at beginning of period | $ 1.00 | $ 1.00 | $ 1.00 | $ 1.00 | $ 1.00 | $ 1.00 | |||||
| Net investment income (loss) (a) | 0.02 | 0.01 | 0.00‡ | 0.00‡ | 0.02 | 0.01 | |||||
| Net realized and unrealized gain (loss) | 0.00‡ | 0.00‡ | 0.00‡ | 0.00‡ | 0.00‡ | (0.00)‡ | |||||
| Total from investment operations | 0.02 | 0.01 | 0.00‡ | 0.00‡ | 0.02 | 0.01 | |||||
| Less distributions: | |||||||||||
| From net investment income | (0.02) | (0.01) | (0.00)‡ | (0.00)‡ | (0.02) | (0.01) | |||||
| Net asset value at end of period | $ 1.00 | $ 1.00 | $ 1.00 | $ 1.00 | $ 1.00 | $ 1.00 | |||||
| Total investment return (b) | 1.95% | 0.70% | 0.01% | 0.45% | 1.84% | 1.21% | |||||
| Ratios (to average net assets)/Supplemental Data: | |||||||||||
| Net investment income (loss) | 3.89%†† | 0.75% | 0.01% | 0.37% | 1.82% | 1.20% | |||||
| Net expenses | 0.52%†† | 0.37% | 0.12% | 0.39% | 0.56% | 0.57% | |||||
| Expenses (before waiver/reimbursement) | 0.52%†† | 0.52% | 0.54% | 0.55% | 0.56% | 0.57% | |||||
| Net assets at end of period (in 000’s) | $ 437,091 | $ 427,378 | $ 354,743 | $ 415,041 | $ 290,421 | $ 235,855 | |||||
| * | Unaudited. |
| ‡ | Less than one cent per share. |
| †† | Annualized. |
| (a) | Per share data based on average shares outstanding during the period. |
| (b) | Total investment return is calculated exclusive of sales charges and assumes the reinvestment of distributions. For periods of less than one year, total return is not annualized. |
| Six months ended April 30, 2023* | Year Ended October 31, | ||||||||||
| Investor Class | 2022 | 2021 | 2020 | 2019 | 2018 | ||||||
| Net asset value at beginning of period | $ 1.00 | $ 1.00 | $ 1.00 | $ 1.00 | $ 1.00 | $ 1.00 | |||||
| Net investment income (loss) (a) | 0.02 | 0.01 | 0.00‡ | 0.00‡ | 0.02 | 0.01 | |||||
| Net realized and unrealized gain (loss) | 0.00‡ | 0.00‡ | 0.00‡ | 0.00‡ | 0.00‡ | (0.00)‡ | |||||
| Total from investment operations | 0.02 | 0.01 | 0.00‡ | 0.00‡ | 0.02 | 0.01 | |||||
| Less distributions: | |||||||||||
| From net investment income | (0.02) | (0.01) | (0.00)‡ | (0.00)‡ | (0.02) | (0.01) | |||||
| Net asset value at end of period | $ 1.00 | $ 1.00 | $ 1.00 | $ 1.00 | $ 1.00 | $ 1.00 | |||||
| Total investment return (b) | 1.81% | 0.56% | 0.01% | 0.35% | 1.59% | 0.98% | |||||
| Ratios (to average net assets)/Supplemental Data: | |||||||||||
| Net investment income (loss) | 3.61%†† | 0.53% | 0.01% | 0.33% | 1.58% | 0.97% | |||||
| Net expenses | 0.80%†† | 0.49% | 0.12% | 0.51% | 0.80% | 0.80% | |||||
| Expenses (before waiver/reimbursement) | 0.89%†† | 0.84% | 0.96% | 0.91% | 0.88% | 0.84% | |||||
| Net assets at end of period (in 000's) | $ 18,241 | $ 19,327 | $ 22,096 | $ 28,427 | $ 28,133 | $ 26,548 | |||||
| * | Unaudited. |
| ‡ | Less than one cent per share. |
| †† | Annualized. |
| (a) | Per share data based on average shares outstanding during the period. |
| (b) | Total investment return is calculated exclusive of sales charges and assumes the reinvestment of distributions. For periods of less than one year, total return is not annualized. |
| Six months ended April 30, 2023* | Year Ended October 31, | ||||||||||
| Class B | 2022 | 2021 | 2020 | 2019 | 2018 | ||||||
| Net asset value at beginning of period | $ 1.00 | $ 1.00 | $ 1.00 | $ 1.00 | $ 1.00 | $ 1.00 | |||||
| Net investment income (loss) (a) | 0.02 | 0.01 | 0.00‡ | 0.00‡ | 0.02 | 0.01 | |||||
| Net realized and unrealized gain (loss) | 0.00‡ | 0.00‡ | 0.00‡ | 0.00‡ | 0.00‡ | (0.00)‡ | |||||
| Total from investment operations | 0.02 | 0.01 | 0.00‡ | 0.00‡ | 0.02 | 0.01 | |||||
| Less distributions: | |||||||||||
| From net investment income | (0.02) | (0.01) | (0.00)‡ | (0.00)‡ | (0.02) | (0.01) | |||||
| Net asset value at end of period | $ 1.00 | $ 1.00 | $ 1.00 | $ 1.00 | $ 1.00 | $ 1.00 | |||||
| Total investment return (b) | 1.81% | 0.56% | 0.01% | 0.35% | 1.59% | 0.98% | |||||
| Ratios (to average net assets)/Supplemental Data: | |||||||||||
| Net investment income (loss) | 3.61%†† | 0.54% | 0.01% | 0.35% | 1.59% | 0.96% | |||||
| Net expenses | 0.80%†† | 0.49% | 0.12% | 0.52% | 0.80% | 0.80% | |||||
| Expenses (before waiver/reimbursement) | 0.89%†† | 0.84% | 0.97% | 0.90% | 0.88% | 0.84% | |||||
| Net assets at end of period (in 000’s) | $ 22,721 | $ 23,696 | $ 25,709 | $ 30,215 | $ 32,981 | $ 37,284 | |||||
| * | Unaudited. |
| ‡ | Less than one cent per share. |
| †† | Annualized. |
| (a) | Per share data based on average shares outstanding during the period. |
| (b) | Total investment return is calculated exclusive of sales charges and assumes the reinvestment of distributions. For periods of less than one year, total return is not annualized. |
| Six months ended April 30, 2023* | Year Ended October 31, | ||||||||||
| Class C | 2022 | 2021 | 2020 | 2019 | 2018 | ||||||
| Net asset value at beginning of period | $ 1.00 | $ 1.00 | $ 1.00 | $ 1.00 | $ 1.00 | $ 1.00 | |||||
| Net investment income (loss) (a) | 0.02 | 0.01 | 0.00‡ | 0.00‡ | 0.02 | 0.01 | |||||
| Net realized and unrealized gain (loss) | 0.00‡ | 0.00‡ | 0.00‡ | 0.00‡ | 0.00‡ | (0.00)‡ | |||||
| Total from investment operations | 0.02 | 0.01 | 0.00‡ | 0.00‡ | 0.02 | 0.01 | |||||
| Less distributions: | |||||||||||
| From net investment income | (0.02) | (0.01) | (0.00)‡ | (0.00)‡ | (0.02) | (0.01) | |||||
| Net asset value at end of period | $ 1.00 | $ 1.00 | $ 1.00 | $ 1.00 | $ 1.00 | $ 1.00 | |||||
| Total investment return (b) | 1.80% | 0.56% | 0.01% | 0.35% | 1.60% | 0.98% | |||||
| Ratios (to average net assets)/Supplemental Data: | |||||||||||
| Net investment income (loss) | 3.60%†† | 0.55% | 0.01% | 0.27% | 1.59% | 0.94% | |||||
| Net expenses | 0.80%†† | 0.52% | 0.12% | 0.50% | 0.80% | 0.80% | |||||
| Expenses (before waiver/reimbursement) | 0.89%†† | 0.84% | 0.96% | 0.90% | 0.88% | 0.84% | |||||
| Net assets at end of period (in 000’s) | $ 16,680 | $ 18,464 | $ 17,941 | $ 28,171 | $ 20,308 | $ 22,983 | |||||
| * | Unaudited. |
| ‡ | Less than one cent per share. |
| †† | Annualized. |
| (a) | Per share data based on average shares outstanding during the period. |
| (b) | Total investment return is calculated exclusive of sales charges and assumes the reinvestment of distributions. For periods of less than one year, total return is not annualized. |
| 16 | MainStay Money Market Fund |
| Six months ended April 30, 2023* | Year Ended October 31, | August 31, 2020^ through October 31, | |||||
| SIMPLE Class | 2022 | 2021 | 2020 | ||||
| Net asset value at beginning of period | $ 1.00 | $ 1.00 | $ 1.00 | $ 1.00 | |||
| Net investment income (loss) (a) | 0.02 | 0.01 | 0.00‡ | (0.00)‡ | |||
| Net realized and unrealized gain (loss) | 0.00‡ | 0.00‡ | 0.00‡ | 0.00‡ | |||
| Total from investment operations | 0.02 | 0.01 | 0.00‡ | 0.00‡ | |||
| Less distributions: | |||||||
| From net investment income | (0.02) | (0.01) | (0.00)‡ | (0.00)‡ | |||
| Net asset value at end of period | $ 1.00 | $ 1.00 | $ 1.00 | $ 1.00 | |||
| Total investment return (b) | 1.85% | 0.56% | 0.01% | 0.00%‡‡ | |||
| Ratios (to average net assets)/Supplemental Data: | |||||||
| Net investment income (loss) | 3.91%†† | 0.58% | 0.01% | (0.02)%†† | |||
| Net expenses | 0.66%††(c) | 0.51% | 0.12% | 0.19%†† | |||
| Expenses (before waiver/reimbursement) | 0.66%†† | 0.84% | 0.97% | 0.95%†† | |||
| Net assets at end of period (in 000’s) | $ 376 | $ 74 | $ 25 | $ 25 | |||
| * | Unaudited. |
| ^ | Inception date. |
| ‡ | Less than one cent per share. |
| ‡‡ | Less than one-tenth percent. |
| †† | Annualized. |
| (a) | Per share data based on average shares outstanding during the period. |
| (b) | Total investment return is calculated exclusive of sales charges and assumes the reinvestment of dividends and distributions. SIMPLE Class shares are not subject to sales charges. For periods of less than one year, total return is not annualized. |
| (c) | Expense waiver/reimbursement less than 0.01%. |
| Class | Commenced Operations |
| Class A | January 3, 1995 |
| Investor Class | February 28, 2008 |
| Class B | May 1, 1986 |
| Class C | September 1, 1998 |
| SIMPLE Class | August 31, 2020 |
| 18 |
| • | Level 1—quoted prices (unadjusted) in active markets for an identical asset or liability |
| • | Level 2—other significant observable inputs (including quoted prices for a similar asset or liability in active markets, interest rates and yield curves, prepayment speeds, credit risk, etc.) |
| • | Level 3—significant unobservable inputs (including the Fund's own assumptions about the assumptions that market participants would use in measuring fair value of an asset or liability) |
| • Benchmark yields | • Reported trades |
| • Broker/dealer quotes | • Issuer spreads |
| • Two-sided markets | • Benchmark securities |
| • Bids/offers | • Reference data (corporate actions or material event notices) |
| • Industry and economic events | • Comparable bonds |
| • Monthly payment information |
| 20 |
| Class | Expense | Waived |
| Class A | $138,421 | $— |
| Investor Class | 40,336 | — |
| Class B | 49,631 | — |
| Class C | 37,494 | — |
| SIMPLE Class | 194 | — |
| SIMPLE Class | $25,522 | 6.8% |
| Capital Loss Available Through | Short-Term Capital Loss Amounts (000’s) | Long-Term Capital Loss Amounts (000’s) |
| Unlimited | $9 | $— |
| 22 |
| 2022 | |
| Distributions paid from: | |
| Ordinary Income | $3,266,264 |
| Class A (at $1 per share) | Shares |
| Six-month period ended April 30, 2023: | |
| Shares sold | 216,076,884 |
| Shares issued to shareholders in reinvestment of distributions | 8,002,648 |
| Shares redeemed | (217,003,340) |
| Shares converted into Class A (See Note 1) | 2,710,208 |
| Shares converted from Class A (See Note 1) | (76,698) |
| Net increase (decrease) | 9,709,702 |
| Year ended October 31, 2022: | |
| Shares sold | 501,242,230 |
| Shares issued to shareholders in reinvestment of distributions | 2,840,624 |
| Shares redeemed | (437,742,190) |
| Net increase (decrease) in shares outstanding before conversion | 66,340,664 |
| Shares converted into Class A (See Note 1) | 6,333,245 |
| Shares converted from Class A (See Note 1) | (31,127) |
| Net increase (decrease) | 72,642,782 |
| Investor Class (at $1 per share) | Shares |
| Six-month period ended April 30, 2023: | |
| Shares sold | 5,044,508 |
| Shares issued to shareholders in reinvestment of distributions | 327,480 |
| Shares redeemed | (3,912,239) |
| Shares converted into Investor Class (See Note 1) | 77,317 |
| Shares converted from Investor Class (See Note 1) | (2,622,861) |
| Net increase (decrease) | (1,085,795) |
| Year ended October 31, 2022: | |
| Shares sold | 15,993,287 |
| Shares issued to shareholders in reinvestment of distributions | 106,552 |
| Shares redeemed | (12,623,425) |
| Net increase (decrease) in shares outstanding before conversion | 3,476,414 |
| Shares converted into Investor Class (See Note 1) | 54,453 |
| Shares converted from Investor Class (See Note 1) | (6,299,663) |
| Net increase (decrease) | (2,768,796) |
| Class B (at $1 per share) | Shares |
| Six-month period ended April 30, 2023: | |
| Shares sold | 520,017 |
| Shares issued to shareholders in reinvestment of distributions | 409,950 |
| Shares redeemed | (1,840,044) |
| Shares converted into Class B (See Note 1) | 20,761 |
| Shares converted from Class B (See Note 1) | (86,249) |
| Net increase (decrease) | (975,565) |
| Year ended October 31, 2022: | |
| Shares sold | 1,717,725 |
| Shares issued to shareholders in reinvestment of distributions | 130,661 |
| Shares redeemed | (3,810,689) |
| Net increase (decrease) in shares outstanding before conversion | (1,962,303) |
| Shares converted from Class B (See Note 1) | (50,239) |
| Net increase (decrease) | (2,012,542) |
| Class C (at $1 per share) | Shares |
| Six-month period ended April 30, 2023: | |
| Shares sold | 4,351,445 |
| Shares issued to shareholders in reinvestment of distributions | 308,168 |
| Shares redeemed | (6,420,627) |
| Shares converted from Class C (See Note 1) | (22,478) |
| Net increase (decrease) | (1,783,492) |
| Year ended October 31, 2022: | |
| Shares sold | 14,098,553 |
| Shares issued to shareholders in reinvestment of distributions | 101,346 |
| Shares redeemed | (13,669,897) |
| Net increase (decrease) in shares outstanding before conversion | 530,002 |
| Shares converted from Class C (See Note 1) | (6,668) |
| Net increase (decrease) | 523,334 |
| SIMPLE Class (at $1 per share) | Shares |
| Six-month period ended April 30, 2023: | |
| Shares sold | 360,162 |
| Shares issued to shareholders in reinvestment of distributions | 3,558 |
| Shares redeemed | (61,305) |
| Net increase (decrease) | 302,415 |
| Year ended October 31, 2022: | |
| Shares sold | 134,386 |
| Shares issued to shareholders in reinvestment of distributions | 393 |
| Shares redeemed | (85,956) |
| Net increase (decrease) | 48,823 |
| 24 |
| 26 | MainStay Money Market Fund |
| 28 | MainStay Money Market Fund |
1.
| 2. | This Fund is registered for sale in CA, CT, DE, FL, MA, NJ, NY and VT. |
| 3. | An affiliate of New York Life Investment Management LLC. |
| 5022273MS043-23 | MSMM10-06/23 |
please log in to newyorklifeinvestments.com/accounts.
| Not FDIC/NCUA Insured | Not a Deposit | May Lose Value | No Bank Guarantee | Not Insured by Any Government Agency |


President

| Average Annual Total Returns for the Period-Ended April 30, 2023 | ||||||||
| Class | Sales Charge | Inception Date | Six Months1 | One Year | Five Years | Ten Years or Since Inception | Gross Expense Ratio2 | |
| Class A Shares | Maximum 5.50% Initial Sales Charge | With sales charges | 7/1/1995 | 6.26% | -4.13% | 9.86% | 12.31% | 0.96% |
| Excluding sales charges | 12.44 | 1.45 | 11.11 | 12.95 | 0.96 | |||
| Investor Class Shares3 | Maximum 5.00% Initial Sales Charge | With sales charges | 2/28/2008 | 6.56 | -3.94 | 9.69 | 12.20 | 1.11 |
| Excluding sales charges | 12.17 | 1.12 | 10.93 | 12.84 | 1.11 | |||
| Class B Shares4 | Maximum 5.00% CDSC | With sales charges | 4/1/2005 | 7.31 | -3.64 | 9.95 | 12.00 | 1.86 |
| if Redeemed Within the First Six Years of Purchase | Excluding sales charges | 11.83 | 0.42 | 10.11 | 12.00 | 1.86 | ||
| Class C Shares | Maximum 1.00% CDSC | With sales charges | 4/1/2005 | 10.98 | -0.38 | 10.13 | 12.01 | 1.86 |
| if Redeemed Within One Year of Purchase | Excluding sales charges | 11.88 | 0.43 | 10.13 | 12.01 | 1.86 | ||
| Class I Shares | No Sales Charge | 4/1/2005 | 12.59 | 1.60 | 11.39 | 13.23 | 0.71 | |
| Class R1 Shares | No Sales Charge | 4/1/2005 | 12.53 | 1.46 | 11.27 | 13.13 | 0.81 | |
| Class R2 Shares | No Sales Charge | 4/1/2005 | 12.20 | 1.22 | 10.97 | 12.83 | 1.06 | |
| Class R3 Shares | No Sales Charge | 4/28/2006 | 12.21 | 0.97 | 10.69 | 12.55 | 1.31 | |
| Class R6 Shares | No Sales Charge | 6/17/2013 | 12.64 | 1.77 | 11.48 | 13.26 | 0.64 | |
| SIMPLE Class Shares | No Sales Charge | 8/31/2020 | 12.27 | 1.02 | N/A | -0.40 | 1.33 | |
| 1. | Not annualized. |
| 2. | The gross expense ratios presented reflect the Fund’s “Total Annual Fund Operating Expenses” from the most recent Prospectus, as supplemented, and may differ from other expense ratios disclosed in this report. |
| 3. | Prior to June 30, 2020, the maximum initial sales charge was 5.50%, which is reflected in the applicable average annual total return figures shown. |
| 4. | Class B shares are closed to all new purchases as well as additional investments by existing Class B shareholders. |
| Benchmark Performance* | Six Months1 | One Year | Five Years | Ten Years |
| Russell 1000® Growth Index2 | 11.51% | 2.34% | 13.80% | 14.46% |
| S&P 500® Index3 | 8.63 | 2.66 | 11.45 | 12.20 |
| Morningstar Large Growth Category Average4 | 9.82 | -0.09 | 10.26 | 12.03 |
| * | Returns for indices reflect no deductions for fees, expenses or taxes, except for foreign withholding taxes where applicable. Results assume reinvestment of all dividends and capital gains. An investment cannot be made directly in an index. |
| 1. | Not annualized. |
| 2. | The Russell 1000® Growth Index is the Fund's primary benchmark. The Russell 1000® Growth Index is a broad-based benchmark that measures the performance of the large-cap growth segment of the U.S. equity universe. It includes those Russell 1000® Index companies with higher price-to-book ratios and higher forecasted growth values. |
| 3. | The S&P 500® Index is the Fund's secondary benchmark. “S&P 500® " is a trademark of The McGraw-Hill Companies, Inc. The S&P 500® Index is widely regarded as the standard index for measuring large-cap U.S. stock market performance. |
| 4. | The Morningstar Large Growth Category Average is representative of funds that invest primarily in big U.S. companies that are projected to grow faster than other large-cap stocks. Stocks in the top 70% of the capitalization of the U.S. equity market are defined as large cap. Growth is defined based on fast growth and high valuations. Most of these funds focus on companies in rapidly expanding industries. Results are based on average total returns of similar funds with all dividends and capital gain distributions reinvested. |
| 6 | MainStay Winslow Large Cap Growth Fund |
| Share Class | Beginning Account Value 11/1/22 | Ending Account Value (Based on Actual Returns and Expenses) 4/30/23 | Expenses Paid During Period1 | Ending Account Value (Based on Hypothetical 5% Annualized Return and Actual Expenses) 4/30/23 | Expenses Paid During Period1 | Net Expense Ratio During Period2 |
| Class A Shares | $1,000.00 | $1,124.40 | $ 5.21 | $1,019.89 | $4.96 | 0.99% |
| Investor Class Shares | $1,000.00 | $1,121.70 | $ 6.37 | $1,018.79 | $6.06 | 1.21% |
| Class B Shares | $1,000.00 | $1,118.30 | $10.29 | $1,015.08 | $9.79 | 1.96% |
| Class C Shares | $1,000.00 | $1,118.80 | $10.30 | $1,015.08 | $9.79 | 1.96% |
| Class I Shares | $1,000.00 | $1,125.90 | $ 3.90 | $1,021.13 | $3.71 | 0.74% |
| Class R1 Shares | $1,000.00 | $1,125.30 | $ 4.43 | $1,020.63 | $4.21 | 0.84% |
| Class R2 Shares | $1,000.00 | $1,122.00 | $ 5.73 | $1,019.39 | $5.46 | 1.09% |
| Class R3 Shares | $1,000.00 | $1,122.10 | $ 7.05 | $1,018.15 | $6.71 | 1.34% |
| Class R6 Shares | $1,000.00 | $1,126.40 | $ 3.37 | $1,021.62 | $3.21 | 0.64% |
| SIMPLE Class Shares | $1,000.00 | $1,122.70 | $ 7.00 | $1,018.20 | $6.66 | 1.33% |
| 1. | Expenses are equal to the Fund’s annualized expense ratio of each class multiplied by the average account value over the period, divided by 365 and multiplied by 181 (to reflect the six-month period). The table above represents the actual expenses incurred during the six-month period. In addition to the fees and expenses which the Fund bears directly, it also indirectly bears a pro rata share of the fees and expenses of the underlying funds in which it invests. Such indirect expenses are not included in the above-reported expense figures. |
| 2. | Expenses are equal to the Fund's annualized expense ratio to reflect the six-month period. |
| Software | 21.8% |
| Semiconductors & Semiconductor Equipment | 12.9 |
| Hotels, Restaurants & Leisure | 8.4 |
| Interactive Media & Services | 6.9 |
| Technology Hardware, Storage & Peripherals | 6.8 |
| Financial Services | 6.1 |
| Health Care Equipment & Supplies | 4.8 |
| Consumer Staples Distribution & Retail | 4.5 |
| Health Care Providers & Services | 4.5 |
| Life Sciences Tools & Services | 2.6 |
| Broadline Retail | 2.5 |
| Capital Markets | 2.4 |
| Chemicals | 2.3 |
| Health Care Technology | 2.1% |
| Machinery | 2.0 |
| Textiles, Apparel & Luxury Goods | 2.0 |
| Specialty Retail | 1.7 |
| Ground Transportation | 1.6 |
| Biotechnology | 1.2 |
| IT Services | 1.1 |
| Pharmaceuticals | 1.0 |
| Automobiles | 0.4 |
| Short–Term Investment | 1.1 |
| Other Assets, Less Liabilities | –0.7 |
| 100.0% |
| 1. | Microsoft Corp. |
| 2. | Apple, Inc. |
| 3. | Alphabet, Inc. |
| 4. | NVIDIA Corp. |
| 5. | UnitedHealth Group, Inc. |
| 6. | Chipotle Mexican Grill, Inc. |
| 7. | Intuitive Surgical, Inc. |
| 8. | ServiceNow, Inc. |
| 9. | Mastercard, Inc., Class A |
| 10. | Visa, Inc., Class A |
| 8 | MainStay Winslow Large Cap Growth Fund |
| 1. | See "Investment and Performance Comparison" for other share class returns, which may be higher or lower than Class I share returns, and for more information on benchmark and peer group returns. |
| 2. | Multiple compression is an effect which occurs when a company's earnings increase but its stock price does not move in response. |
| 10 | MainStay Winslow Large Cap Growth Fund |
| Shares | Value | |
| Common Stocks 99.6% | ||
| Automobiles 0.4% | ||
| Tesla, Inc. (a) | 260,300 | $ 42,769,893 |
| Biotechnology 1.2% | ||
| Vertex Pharmaceuticals, Inc. (a) | 416,900 | 142,050,337 |
| Broadline Retail 2.5% | ||
| Amazon.com, Inc. (a) | 2,780,100 | 293,161,545 |
| Capital Markets 2.4% | ||
| Moody's Corp. | 450,450 | 141,044,904 |
| MSCI, Inc. | 288,000 | 138,945,600 |
| 279,990,504 | ||
| Chemicals 2.3% | ||
| Linde plc | 733,530 | 271,002,659 |
| Consumer Staples Distribution & Retail 4.5% | ||
| Costco Wholesale Corp. | 674,400 | 339,371,568 |
| Dollar Tree, Inc. (a) | 1,273,900 | 195,811,169 |
| 535,182,737 | ||
| Financial Services 6.1% | ||
| Mastercard, Inc., Class A | 987,900 | 375,431,637 |
| Visa, Inc., Class A | 1,492,600 | 347,372,798 |
| 722,804,435 | ||
| Ground Transportation 1.6% | ||
| Uber Technologies, Inc. (a) | 5,943,500 | 184,545,675 |
| Health Care Equipment & Supplies 4.8% | ||
| IDEXX Laboratories, Inc. (a) | 281,700 | 138,641,472 |
| Intuitive Surgical, Inc. (a) | 1,418,490 | 427,277,558 |
| 565,919,030 | ||
| Health Care Providers & Services 4.5% | ||
| UnitedHealth Group, Inc. | 1,075,700 | 529,341,213 |
| Health Care Technology 2.1% | ||
| Veeva Systems, Inc., Class A (a) | 1,411,550 | 252,780,374 |
| Hotels, Restaurants & Leisure 8.4% | ||
| Chipotle Mexican Grill, Inc. (a) | 226,970 | 469,287,712 |
| Hilton Worldwide Holdings, Inc. | 943,100 | 135,825,262 |
| McDonald's Corp. | 802,200 | 237,250,650 |
| Shares | Value | |
| Hotels, Restaurants & Leisure (continued) | ||
| Starbucks Corp. | 1,334,100 | $ 152,474,289 |
| 994,837,913 | ||
| Interactive Media & Services 6.9% | ||
| Alphabet, Inc. (a) | ||
| Class A | 2,991,320 | 321,088,289 |
| Class C | 2,636,220 | 285,291,728 |
| Meta Platforms, Inc., Class A (a) | 856,300 | 205,786,016 |
| 812,166,033 | ||
| IT Services 1.1% | ||
| Gartner, Inc. (a) | 411,640 | 124,504,634 |
| Life Sciences Tools & Services 2.6% | ||
| Agilent Technologies, Inc. | 1,355,200 | 183,534,736 |
| Danaher Corp. | 535,300 | 126,817,923 |
| 310,352,659 | ||
| Machinery 2.0% | ||
| Deere & Co. | 163,400 | 61,768,468 |
| Parker-Hannifin Corp. | 539,900 | 175,402,712 |
| 237,171,180 | ||
| Pharmaceuticals 1.0% | ||
| AstraZeneca plc, Sponsored ADR | 1,580,500 | 115,724,210 |
| Semiconductors & Semiconductor Equipment 12.9% | ||
| Analog Devices, Inc. | 1,910,340 | 343,631,959 |
| ASML Holding NV (Registered) | 500,270 | 318,601,952 |
| Lam Research Corp. | 547,090 | 286,718,927 |
| NVIDIA Corp. | 2,068,550 | 574,001,940 |
| 1,522,954,778 | ||
| Software 21.8% | ||
| Atlassian Corp., Class A (a) | 733,900 | 108,367,674 |
| Intuit, Inc. | 710,210 | 315,297,730 |
| Microsoft Corp. | 4,068,230 | 1,250,004,349 |
| Palo Alto Networks, Inc. (a) | 802,500 | 146,424,150 |
| ServiceNow, Inc. (a) | 886,610 | 407,326,366 |
| Synopsys, Inc. (a) | 386,500 | 143,515,180 |
| Workday, Inc., Class A (a) | 1,037,000 | 193,027,180 |
| 2,563,962,629 | ||
| Specialty Retail 1.7% | ||
| O'Reilly Automotive, Inc. (a) | 211,900 | 194,377,989 |
| Technology Hardware, Storage & Peripherals 6.8% | ||
| Apple, Inc. | 4,744,180 | 804,992,462 |
| Shares | Value | ||
| Common Stocks (continued) | |||
| Textiles, Apparel & Luxury Goods 2.0% | |||
| Lululemon Athletica, Inc. (a) | 604,800 | $ 229,781,664 | |
| Total Common Stocks (Cost $8,625,756,559) | 11,730,374,553 | ||
| Short-Term Investment 1.1% | |||
| Affiliated Investment Company 1.1% | |||
| MainStay U.S. Government Liquidity Fund, 3.98% (b)(c) | 132,206,459 | 132,206,459 | |
| Total Short-Term Investment (Cost $132,206,459) | 132,206,459 | ||
| Total Investments (Cost $8,757,963,018) | 100.7% | 11,862,581,012 | |
| Other Assets, Less Liabilities | (0.7) | (87,014,945) | |
| Net Assets | 100.0% | $ 11,775,566,067 | |
| † | Percentages indicated are based on Fund net assets. |
| ^ | Industry classifications may be different than those used for compliance monitoring purposes. |
| (a) | Non-income producing security. |
| (b) | As of April 30, 2023, the Fund's ownership exceeds 5% of the outstanding shares of the Underlying Fund's share class. |
| (c) | Current yield as of April 30, 2023. |
| Affiliated Investment Companies | Value, Beginning of Period | Purchases at Cost | Proceeds from Sales | Net Realized Gain/(Loss) on Sales | Change in Unrealized Appreciation/ (Depreciation) | Value, End of Period | Dividend Income | Other Distributions | Shares End of Period |
| MainStay U.S. Government Liquidity Fund | $ 209,899 | $ 1,198,886 | $ (1,276,579) | $ — | $ — | $ 132,206 | $ 1,379 | $ — | 132,206 |
| Abbreviation(s): |
| ADR—American Depositary Receipt |
| 12 | MainStay Winslow Large Cap Growth Fund |
| Description | Quoted Prices in Active Markets for Identical Assets (Level 1) | Significant Other Observable Inputs (Level 2) | Significant Unobservable Inputs (Level 3) | Total | |||
| Asset Valuation Inputs | |||||||
| Investments in Securities (a) | |||||||
| Common Stocks | $ 11,730,374,553 | $ — | $ — | $ 11,730,374,553 | |||
| Short-Term Investment | |||||||
| Affiliated Investment Company | 132,206,459 | — | — | 132,206,459 | |||
| Total Investments in Securities | $ 11,862,581,012 | $ — | $ — | $ 11,862,581,012 |
| (a) | For a complete listing of investments and their industries, see the Portfolio of Investments. |
| Assets | |
| Investment in unaffiliated securities, at value (identified cost $8,625,756,559) | $11,730,374,553 |
| Investment in affiliated investment companies, at value (identified cost $132,206,459) | 132,206,459 |
| Receivables: | |
| Investment securities sold | 402,817,536 |
| Fund shares sold | 7,382,945 |
| Dividends | 1,325,882 |
| Other assets | 377,310 |
| Total assets | 12,274,484,685 |
| Liabilities | |
| Payables: | |
| Investment securities purchased | 474,792,747 |
| Fund shares redeemed | 15,987,609 |
| Manager (See Note 3) | 5,915,239 |
| Transfer agent (See Note 3) | 1,387,227 |
| NYLIFE Distributors (See Note 3) | 395,729 |
| Shareholder communication | 187,108 |
| Professional fees | 141,190 |
| Custodian | 39,963 |
| Accrued expenses | 71,806 |
| Total liabilities | 498,918,618 |
| Net assets | $11,775,566,067 |
| Composition of Net Assets | |
| Shares of beneficial interest outstanding (par value of $.01 per share) unlimited number of shares authorized | $ 13,045,414 |
| Additional paid-in-capital | 7,982,840,954 |
| 7,995,886,368 | |
| Total distributable earnings (loss) | 3,779,679,699 |
| Net assets | $11,775,566,067 |
| Class A | |
| Net assets applicable to outstanding shares | $1,124,134,608 |
| Shares of beneficial interest outstanding | 142,598,317 |
| Net asset value per share outstanding | $ 7.88 |
| Maximum sales charge (5.50% of offering price) | 0.46 |
| Maximum offering price per share outstanding | $ 8.34 |
| Investor Class | |
| Net assets applicable to outstanding shares | $ 65,817,458 |
| Shares of beneficial interest outstanding | 8,671,400 |
| Net asset value per share outstanding | $ 7.59 |
| Maximum sales charge (5.00% of offering price) | 0.40 |
| Maximum offering price per share outstanding | $ 7.99 |
| Class B | |
| Net assets applicable to outstanding shares | $ 7,930,572 |
| Shares of beneficial interest outstanding | 1,664,281 |
| Net asset value and offering price per share outstanding | $ 4.77 |
| Class C | |
| Net assets applicable to outstanding shares | $ 42,177,256 |
| Shares of beneficial interest outstanding | 8,887,860 |
| Net asset value and offering price per share outstanding | $ 4.75 |
| Class I | |
| Net assets applicable to outstanding shares | $6,254,605,894 |
| Shares of beneficial interest outstanding | 676,558,074 |
| Net asset value and offering price per share outstanding | $ 9.24 |
| Class R1 | |
| Net assets applicable to outstanding shares | $ 797,004,810 |
| Shares of beneficial interest outstanding | 91,023,898 |
| Net asset value and offering price per share outstanding | $ 8.76 |
| Class R2 | |
| Net assets applicable to outstanding shares | $ 107,547,815 |
| Shares of beneficial interest outstanding | 13,856,078 |
| Net asset value and offering price per share outstanding | $ 7.76 |
| Class R3 | |
| Net assets applicable to outstanding shares | $ 36,427,644 |
| Shares of beneficial interest outstanding | 5,333,019 |
| Net asset value and offering price per share outstanding | $ 6.83 |
| Class R6 | |
| Net assets applicable to outstanding shares | $3,339,619,214 |
| Shares of beneficial interest outstanding | 355,908,480 |
| Net asset value and offering price per share outstanding | $ 9.38 |
| 14 | MainStay Winslow Large Cap Growth Fund |
| SIMPLE Class | |
| Net assets applicable to outstanding shares | $300,796 |
| Shares of beneficial interest outstanding | 39,976 |
| Net asset value and offering price per share outstanding | $ 7.52 |
| Investment Income (Loss) | |
| Income | |
| Dividends-unaffiliated (net of foreign tax withholding of $221,748) | $ 40,269,956 |
| Dividends-affiliated | 1,378,949 |
| Securities lending, net | 13 |
| Total income | 41,648,918 |
| Expenses | |
| Manager (See Note 3) | 35,125,215 |
| Transfer agent (See Note 3) | 4,200,860 |
| Distribution/Service—Class A (See Note 3) | 1,336,900 |
| Distribution/Service—Investor Class (See Note 3) | 81,206 |
| Distribution/Service—Class B (See Note 3) | 42,324 |
| Distribution/Service—Class C (See Note 3) | 216,694 |
| Distribution/Service—Class R2 (See Note 3) | 130,074 |
| Distribution/Service—Class R3 (See Note 3) | 92,494 |
| Distribution/Service—SIMPLE Class (See Note 3) | 633 |
| Shareholder service (See Note 3) | 444,832 |
| Professional fees | 357,488 |
| Registration | 206,106 |
| Trustees | 140,046 |
| Shareholder communication | 77,561 |
| Custodian | 47,734 |
| Miscellaneous | 147,589 |
| Total expenses before waiver/reimbursement | 42,647,756 |
| Expense waiver/reimbursement from Manager (See Note 3) | (50,958) |
| Reimbursement from prior custodian(a) | (22,061) |
| Net expenses | 42,574,737 |
| Net investment income (loss) | (925,819) |
| Realized and Unrealized Gain (Loss) | |
| Net realized gain (loss) on: | |
| Unaffiliated investment transactions | 739,805,704 |
| Foreign currency transactions | 17 |
| Net realized gain (loss) | 739,805,721 |
| Net change in unrealized appreciation (depreciation) on unaffiliated investments | 600,243,315 |
| Net realized and unrealized gain (loss) | 1,340,049,036 |
| Net increase (decrease) in net assets resulting from operations | $1,339,123,217 |
| (a) | Represents a refund for overbilling of custody fees. |
| 16 | MainStay Winslow Large Cap Growth Fund |
for the six months ended April 30, 2023 (Unaudited) and the year ended October 31, 2022
| Six months ended April 30, 2023 | Year ended October 31, 2022 | |
| Increase (Decrease) in Net Assets | ||
| Operations: | ||
| Net investment income (loss) | $ (925,819) | $ (18,381,730) |
| Net realized gain (loss) | 739,805,721 | 1,364,007,827 |
| Net change in unrealized appreciation (depreciation) | 600,243,315 | (6,575,829,012) |
| Net increase (decrease) in net assets resulting from operations | 1,339,123,217 | (5,230,202,915) |
| Distributions to shareholders: | ||
| Class A | (137,076,160) | (364,397,755) |
| Investor Class | (8,619,202) | (22,722,175) |
| Class B | (1,794,965) | (5,810,514) |
| Class C | (8,883,388) | (25,393,609) |
| Class I | (674,639,763) | (1,557,071,002) |
| Class R1 | (86,323,034) | (230,113,135) |
| Class R2 | (13,562,024) | (37,915,929) |
| Class R3 | (5,552,262) | (14,198,963) |
| Class R6 | (369,612,028) | (894,224,087) |
| SIMPLE Class | (30,895) | (16,490) |
| Total distributions to shareholders | (1,306,093,721) | (3,151,863,659) |
| Capital share transactions: | ||
| Net proceeds from sales of shares | 904,223,344 | 3,411,138,066 |
| Net asset value of shares issued to shareholders in reinvestment of distributions | 1,210,861,649 | 2,914,756,292 |
| Cost of shares redeemed | (1,727,096,157) | (3,229,423,183) |
| Increase (decrease) in net assets derived from capital share transactions | 387,988,836 | 3,096,471,175 |
| Net increase (decrease) in net assets | 421,018,332 | (5,285,595,399) |
| Net Assets | ||
| Beginning of period | 11,354,547,735 | 16,640,143,134 |
| End of period | $11,775,566,067 | $11,354,547,735 |
| Six months ended April 30, 2023* | Year Ended October 31, | ||||||||||
| Class A | 2022 | 2021 | 2020 | 2019 | 2018 | ||||||
| Net asset value at beginning of period | $ 8.03 | $ 14.92 | $ 11.08 | $ 9.59 | $ 9.95 | $ 10.41 | |||||
| Net investment income (loss) (a) | (0.01) | (0.04) | (0.07) | (0.03) | (0.02) | (0.02) | |||||
| Net realized and unrealized gain (loss) | 0.91 | (3.74) | 4.55 | 2.58 | 1.48 | 1.12 | |||||
| Total from investment operations | 0.90 | (3.78) | 4.48 | 2.55 | 1.46 | 1.10 | |||||
| Less distributions: | |||||||||||
| From net investment income | — | — | — | — | — | (0.00)‡ | |||||
| From net realized gain on investments | (1.05) | (3.11) | (0.64) | (1.06) | (1.82) | (1.56) | |||||
| Total distributions | (1.05) | (3.11) | (0.64) | (1.06) | (1.82) | (1.56) | |||||
| Net asset value at end of period | $ 7.88 | $ 8.03 | $ 14.92 | $ 11.08 | $ 9.59 | $ 9.95 | |||||
| Total investment return (b) | 12.44% | (31.71)% | 42.16% | 29.44% | 17.05% | 12.36% | |||||
| Ratios (to average net assets)/Supplemental Data: | |||||||||||
| Net investment income (loss) | (0.25)%†† | (0.37)% | (0.53)% | (0.31)% | (0.20)% | (0.21)% | |||||
| Net expenses (c) | 0.99%††(d) | 0.96% | 0.93% | 0.97% | 0.99% | 0.97% | |||||
| Expenses (before waiver/reimbursement) (c) | 0.99%†† | 0.96%(d) | 0.94% | 0.97% | 0.99% | 0.98% | |||||
| Portfolio turnover rate | 47% | 77% | 66% | 44% | 54% | 52% | |||||
| Net assets at end of period (in 000’s) | $ 1,124,135 | $ 1,065,870 | $ 1,745,833 | $ 1,341,381 | $ 1,008,608 | $ 1,092,962 | |||||
| * | Unaudited. |
| ‡ | Less than one cent per share. |
| †† | Annualized. |
| (a) | Per share data based on average shares outstanding during the period. |
| (b) | Total investment return is calculated exclusive of sales charges and assumes the reinvestment of dividends and distributions. For periods of less than one year, total return is not annualized. |
| (c) | In addition to the fees and expenses which the Fund bears directly, it also indirectly bears a pro-rata share of the fees and expenses of the underlying funds in which it invests. Such indirect expenses are not included in the above expense ratios. |
| (d) | Expense waiver/reimbursement less than 0.01%. |
| Six months ended April 30, 2023* | Year Ended October 31, | ||||||||||
| Investor Class | 2022 | 2021 | 2020 | 2019 | 2018 | ||||||
| Net asset value at beginning of period | $ 7.78 | $ 14.56 | $ 10.84 | $ 9.42 | $ 9.81 | $ 10.30 | |||||
| Net investment income (loss) (a) | (0.02) | (0.05) | (0.08) | (0.04) | (0.03) | (0.03) | |||||
| Net realized and unrealized gain (loss) | 0.88 | (3.62) | 4.44 | 2.52 | 1.46 | 1.10 | |||||
| Total from investment operations | 0.86 | (3.67) | 4.36 | 2.48 | 1.43 | 1.07 | |||||
| Less distributions: | |||||||||||
| From net realized gain on investments | (1.05) | (3.11) | (0.64) | (1.06) | (1.82) | (1.56) | |||||
| Net asset value at end of period | $ 7.59 | $ 7.78 | $ 14.56 | $ 10.84 | $ 9.42 | $ 9.81 | |||||
| Total investment return (b) | 12.17% | (31.75)% | 41.98% | 29.19% | 16.96% | 12.19% | |||||
| Ratios (to average net assets)/Supplemental Data: | |||||||||||
| Net investment income (loss) | (0.47)%†† | (0.52)% | (0.67)% | (0.43)% | (0.31)% | (0.30)% | |||||
| Net expenses (c) | 1.21%††(d) | 1.11% | 1.08% | 1.10% | 1.09% | 1.06% | |||||
| Expenses (before waiver/reimbursement) (c) | 1.21%†† | 1.11%(d) | 1.09% | 1.10% | 1.10% | 1.07% | |||||
| Portfolio turnover rate | 47% | 77% | 66% | 44% | 54% | 52% | |||||
| Net assets at end of period (in 000's) | $ 65,817 | $ 64,065 | $ 106,354 | $ 110,831 | $ 109,236 | $ 103,987 | |||||
| * | Unaudited. |
| †† | Annualized. |
| (a) | Per share data based on average shares outstanding during the period. |
| (b) | Total investment return is calculated exclusive of sales charges and assumes the reinvestment of dividends and distributions. For periods of less than one year, total return is not annualized. |
| (c) | In addition to the fees and expenses which the Fund bears directly, it also indirectly bears a pro-rata share of the fees and expenses of the underlying funds in which it invests. Such indirect expenses are not included in the above expense ratios. |
| (d) | Expense waiver/reimbursement less than 0.01%. |
| 18 | MainStay Winslow Large Cap Growth Fund |
| Six months ended April 30, 2023* | Year Ended October 31, | ||||||||||
| Class B | 2022 | 2021 | 2020 | 2019 | 2018 | ||||||
| Net asset value at beginning of period | $ 5.28 | $ 10.96 | $ 8.37 | $ 7.55 | $ 8.26 | $ 8.98 | |||||
| Net investment income (loss) (a) | (0.03) | (0.08) | (0.13) | (0.09) | (0.08) | (0.09) | |||||
| Net realized and unrealized gain (loss) | 0.57 | (2.49) | 3.36 | 1.97 | 1.19 | 0.93 | |||||
| Total from investment operations | 0.54 | (2.57) | 3.23 | 1.88 | 1.11 | 0.84 | |||||
| Less distributions: | |||||||||||
| From net realized gain on investments | (1.05) | (3.11) | (0.64) | (1.06) | (1.82) | (1.56) | |||||
| Net asset value at end of period | $ 4.77 | $ 5.28 | $ 10.96 | $ 8.37 | $ 7.55 | $ 8.26 | |||||
| Total investment return (b) | 11.83% | (32.29)% | 40.80% | 28.37% | 15.96% | 11.28%(c) | |||||
| Ratios (to average net assets)/Supplemental Data: | |||||||||||
| Net investment income (loss) | (1.20)%†† | (1.27)% | (1.42)% | (1.17)% | (1.05)% | (1.04)% | |||||
| Net expenses (d) | 1.96%††(e) | 1.86% | 1.83% | 1.85% | 1.84% | 1.81% | |||||
| Expenses (before waiver/reimbursement) (d) | 1.96%†† | 1.86%(e) | 1.84% | 1.85% | 1.85% | 1.82% | |||||
| Portfolio turnover rate | 47% | 77% | 66% | 44% | 54% | 52% | |||||
| Net assets at end of period (in 000’s) | $ 7,931 | $ 9,408 | $ 20,533 | $ 20,172 | $ 21,015 | $ 25,685 | |||||
| * | Unaudited. |
| †† | Annualized. |
| (a) | Per share data based on average shares outstanding during the period. |
| (b) | Total investment return is calculated exclusive of sales charges and assumes the reinvestment of dividends and distributions. For periods of less than one year, total return is not annualized. |
| (c) | Total investment return may reflect adjustments to conform to generally accepted accounting principles. |
| (d) | In addition to the fees and expenses which the Fund bears directly, it also indirectly bears a pro-rata share of the fees and expenses of the underlying funds in which it invests. Such indirect expenses are not included in the above expense ratios. |
| (e) | Expense waiver/reimbursement less than 0.01%. |
| Six months ended April 30, 2023* | Year Ended October 31, | ||||||||||
| Class C | 2022 | 2021 | 2020 | 2019 | 2018 | ||||||
| Net asset value at beginning of period | $ 5.26 | $ 10.93 | $ 8.35 | $ 7.53 | $ 8.25 | $ 8.96 | |||||
| Net investment income (loss) (a) | (0.03) | (0.08) | (0.13) | (0.09) | (0.07) | (0.09) | |||||
| Net realized and unrealized gain (loss) | 0.57 | (2.48) | 3.35 | 1.97 | 1.17 | 0.94 | |||||
| Total from investment operations | 0.54 | (2.56) | 3.22 | 1.88 | 1.10 | 0.85 | |||||
| Less distributions: | |||||||||||
| From net realized gain on investments | (1.05) | (3.11) | (0.64) | (1.06) | (1.82) | (1.56) | |||||
| Net asset value at end of period | $ 4.75 | $ 5.26 | $ 10.93 | $ 8.35 | $ 7.53 | $ 8.25 | |||||
| Total investment return (b) | 11.88% | (32.29)% | 40.77% | 28.46% | 15.97% | 11.42% | |||||
| Ratios (to average net assets)/Supplemental Data: | |||||||||||
| Net investment income (loss) | (1.21)%†† | (1.27)% | (1.42)% | (1.17)% | (1.04)% | (1.05)% | |||||
| Net expenses (c) | 1.96%††(d) | 1.86% | 1.83% | 1.85% | 1.84% | 1.81% | |||||
| Expenses (before waiver/reimbursement) (c) | 1.96%†† | 1.86%(d) | 1.84% | 1.85% | 1.85% | 1.82% | |||||
| Portfolio turnover rate | 47% | 77% | 66% | 44% | 54% | 52% | |||||
| Net assets at end of period (in 000’s) | $ 42,177 | $ 46,833 | $ 90,377 | $ 95,761 | $ 131,945 | $ 197,231 | |||||
| * | Unaudited. |
| †† | Annualized. |
| (a) | Per share data based on average shares outstanding during the period. |
| (b) | Total investment return is calculated exclusive of sales charges and assumes the reinvestment of dividends and distributions. For periods of less than one year, total return is not annualized. |
| (c) | In addition to the fees and expenses which the Fund bears directly, it also indirectly bears a pro-rata share of the fees and expenses of the underlying funds in which it invests. Such indirect expenses are not included in the above expense ratios. |
| (d) | Expense waiver/reimbursement less than 0.01%. |
| Six months ended April 30, 2023* | Year Ended October 31, | ||||||||||
| Class I | 2022 | 2021 | 2020 | 2019 | 2018 | ||||||
| Net asset value at beginning of period | $ 9.24 | $ 16.66 | $ 12.28 | $ 10.49 | $ 10.69 | $ 11.06 | |||||
| Net investment income (loss) (a) | 0.00‡ | (0.01) | (0.04) | (0.01) | 0.00‡ | 0.00‡ | |||||
| Net realized and unrealized gain (loss) | 1.06 | (4.30) | 5.06 | 2.86 | 1.62 | 1.20 | |||||
| Total from investment operations | 1.06 | (4.31) | 5.02 | 2.85 | 1.62 | 1.20 | |||||
| Less distributions: | |||||||||||
| From net investment income | (0.01) | — | — | — | — | (0.01) | |||||
| From net realized gain on investments | (1.05) | (3.11) | (0.64) | (1.06) | (1.82) | (1.56) | |||||
| Total distributions | (1.06) | (3.11) | (0.64) | (1.06) | (1.82) | (1.57) | |||||
| Net asset value at end of period | $ 9.24 | $ 9.24 | $ 16.66 | $ 12.28 | $ 10.49 | $ 10.69 | |||||
| Total investment return (b) | 12.59% | (31.55)% | 42.46% | 29.80% | 17.29% | 12.54%(c) | |||||
| Ratios (to average net assets)/Supplemental Data: | |||||||||||
| Net investment income (loss) | 0.00%††(d) | (0.11)% | (0.28)% | (0.06)% | 0.05% | 0.04% | |||||
| Net expenses (e) | 0.74%††(f) | 0.71% | 0.68% | 0.72% | 0.74% | 0.72% | |||||
| Expenses (before waiver/reimbursement) (e) | 0.74%†† | 0.71%(f) | 0.69% | 0.72% | 0.74% | 0.73% | |||||
| Portfolio turnover rate | 47% | 77% | 66% | 44% | 54% | 52% | |||||
| Net assets at end of period (in 000’s) | $ 6,254,606 | $ 6,016,574 | $ 8,434,291 | $ 6,824,224 | $ 6,080,320 | $ 6,275,780 | |||||
| * | Unaudited. |
| ‡ | Less than one cent per share. |
| †† | Annualized. |
| (a) | Per share data based on average shares outstanding during the period. |
| (b) | Total investment return is calculated exclusive of sales charges and assumes the reinvestment of dividends and distributions. Class I shares are not subject to sales charges. For periods of less than one year, total return is not annualized. |
| (c) | Total investment return may reflect adjustments to conform to generally accepted accounting principles. |
| (d) | Less than 0.01%. |
| (e) | In addition to the fees and expenses which the Fund bears directly, it also indirectly bears a pro-rata share of the fees and expenses of the underlying funds in which it invests. Such indirect expenses are not included in the above expense ratios. |
| (f) | Expense waiver/reimbursement less than 0.01%. |
| 20 | MainStay Winslow Large Cap Growth Fund |
| Six months ended April 30, 2023* | Year Ended October 31, | ||||||||||
| Class R1 | 2022 | 2021 | 2020 | 2019 | 2018 | ||||||
| Net asset value at beginning of period | $ 8.80 | $ 16.03 | $ 11.85 | $ 10.17 | $ 10.43 | $ 10.83 | |||||
| Net investment income (loss) (a) | (0.00)‡ | (0.02) | (0.05) | (0.02) | (0.00)‡ | (0.01) | |||||
| Net realized and unrealized gain (loss) | 1.01 | (4.10) | 4.87 | 2.76 | 1.56 | 1.17 | |||||
| Total from investment operations | 1.01 | (4.12) | 4.82 | 2.74 | 1.56 | 1.16 | |||||
| Less distributions: | |||||||||||
| From net investment income | (0.00)‡ | — | — | — | — | — | |||||
| From net realized gain on investments | (1.05) | (3.11) | (0.64) | (1.06) | (1.82) | (1.56) | |||||
| Total distributions | (1.05) | (3.11) | (0.64) | (1.06) | (1.82) | (1.56) | |||||
| Net asset value at end of period | $ 8.76 | $ 8.80 | $ 16.03 | $ 11.85 | $ 10.17 | $ 10.43 | |||||
| Total investment return (b) | 12.53% | (31.62)% | 42.30% | 29.64% | 17.25% | 12.46% | |||||
| Ratios (to average net assets)/Supplemental Data: | |||||||||||
| Net investment income (loss) | (0.10)%†† | (0.22)% | (0.38)% | (0.15)% | (0.04)% | (0.06)% | |||||
| Net expenses (c) | 0.84%††(d) | 0.81% | 0.78% | 0.82% | 0.84% | 0.82% | |||||
| Expenses (before waiver/reimbursement) (c) | 0.84%†† | 0.81%(d) | 0.79% | 0.82% | 0.84% | 0.83% | |||||
| Portfolio turnover rate | 47% | 77% | 66% | 44% | 54% | 52% | |||||
| Net assets at end of period (in 000’s) | $ 797,005 | $ 721,142 | $ 1,207,903 | $ 914,359 | $ 919,236 | $ 1,102,423 | |||||
| * | Unaudited. |
| ‡ | Less than one cent per share. |
| †† | Annualized. |
| (a) | Per share data based on average shares outstanding during the period. |
| (b) | Total investment return is calculated exclusive of sales charges and assumes the reinvestment of dividends and distributions. Class R1 shares are not subject to sales charges. For periods of less than one year, total return is not annualized. |
| (c) | In addition to the fees and expenses which the Fund bears directly, it also indirectly bears a pro-rata share of the fees and expenses of the underlying funds in which it invests. Such indirect expenses are not included in the above expense ratios. |
| (d) | Expense waiver/reimbursement less than 0.01%. |
| Six months ended April 30, 2023* | Year Ended October 31, | ||||||||||
| Class R2 | 2022 | 2021 | 2020 | 2019 | 2018 | ||||||
| Net asset value at beginning of period | $ 7.93 | $ 14.78 | $ 10.99 | $ 9.53 | $ 9.90 | $ 10.38 | |||||
| Net investment income (loss) (a) | (0.01) | (0.04) | (0.08) | (0.04) | (0.03) | (0.03) | |||||
| Net realized and unrealized gain (loss) | 0.89 | (3.70) | 4.51 | 2.56 | 1.48 | 1.11 | |||||
| Total from investment operations | 0.88 | (3.74) | 4.43 | 2.52 | 1.45 | 1.08 | |||||
| Less distributions: | |||||||||||
| From net realized gain on investments | (1.05) | (3.11) | (0.64) | (1.06) | (1.82) | (1.56) | |||||
| Net asset value at end of period | $ 7.76 | $ 7.93 | $ 14.78 | $ 10.99 | $ 9.53 | $ 9.90 | |||||
| Total investment return (b) | 12.20% | (31.74)% | 42.04% | 29.29% | 16.89% | 12.17%(c) | |||||
| Ratios (to average net assets)/Supplemental Data: | |||||||||||
| Net investment income (loss) | (0.35)%†† | (0.47)% | (0.63)% | (0.40)% | (0.29)% | (0.31)% | |||||
| Net expenses (d) | 1.09%††(e) | 1.06% | 1.03% | 1.07% | 1.09% | 1.07% | |||||
| Expenses (before waiver/reimbursement) (d) | 1.09%†† | 1.06%(e) | 1.04% | 1.07% | 1.09% | 1.08% | |||||
| Portfolio turnover rate | 47% | 77% | 66% | 44% | 54% | 52% | |||||
| Net assets at end of period (in 000’s) | $ 107,548 | $ 106,414 | $ 188,790 | $ 159,297 | $ 163,288 | $ 227,298 | |||||
| * | Unaudited. |
| †† | Annualized. |
| (a) | Per share data based on average shares outstanding during the period. |
| (b) | Total investment return is calculated exclusive of sales charges and assumes the reinvestment of dividends and distributions. Class R2 shares are not subject to sales charges. For periods of less than one year, total return is not annualized. |
| (c) | Total investment return may reflect adjustments to conform to generally accepted accounting principles. |
| (d) | In addition to the fees and expenses which the Fund bears directly, it also indirectly bears a pro-rata share of the fees and expenses of the underlying funds in which it invests. Such indirect expenses are not included in the above expense ratios. |
| (e) | Expense waiver/reimbursement less than 0.01%. |
| Six months ended April 30, 2023* | Year Ended October 31, | ||||||||||
| Class R3 | 2022 | 2021 | 2020 | 2019 | 2018 | ||||||
| Net asset value at beginning of period | $ 7.10 | $ 13.60 | $ 10.19 | $ 8.93 | $ 9.41 | $ 9.96 | |||||
| Net investment income (loss) (a) | (0.02) | (0.06) | (0.10) | (0.06) | (0.05) | (0.05) | |||||
| Net realized and unrealized gain (loss) | 0.80 | (3.33) | 4.15 | 2.38 | 1.39 | 1.06 | |||||
| Total from investment operations | 0.78 | (3.39) | 4.05 | 2.32 | 1.34 | 1.01 | |||||
| Less distributions: | |||||||||||
| From net realized gain on investments | (1.05) | (3.11) | (0.64) | (1.06) | (1.82) | (1.56) | |||||
| Net asset value at end of period | $ 6.83 | $ 7.10 | $ 13.60 | $ 10.19 | $ 8.93 | $ 9.41 | |||||
| Total investment return (b) | 12.21% | (31.98)% | 41.60% | 28.99% | 16.69% | 11.97% | |||||
| Ratios (to average net assets)/Supplemental Data: | |||||||||||
| Net investment income (loss) | (0.59)%†† | (0.72)% | (0.88)% | (0.65)% | (0.55)% | (0.55)% | |||||
| Net expenses (c) | 1.34%††(d) | 1.31% | 1.28% | 1.32% | 1.34% | 1.32% | |||||
| Expenses (before waiver/reimbursement) (c) | 1.34%†† | 1.31%(d) | 1.29% | 1.32% | 1.34% | 1.33% | |||||
| Portfolio turnover rate | 47% | 77% | 66% | 44% | 54% | 52% | |||||
| Net assets at end of period (in 000’s) | $ 36,428 | $ 38,027 | $ 63,195 | $ 56,657 | $ 57,283 | $ 61,850 | |||||
| * | Unaudited. |
| †† | Annualized. |
| (a) | Per share data based on average shares outstanding during the period. |
| (b) | Total investment return is calculated exclusive of sales charges and assumes the reinvestment of dividends and distributions. Class R3 shares are not subject to sales charges. For periods of less than one year, total return is not annualized. |
| (c) | In addition to the fees and expenses which the Fund bears directly, it also indirectly bears a pro-rata share of the fees and expenses of the underlying funds in which it invests. Such indirect expenses are not included in the above expense ratios. |
| (d) | Expense waiver/reimbursement less than 0.01%. |
| 22 | MainStay Winslow Large Cap Growth Fund |
| Six months ended April 30, 2023* | Year Ended October 31, | ||||||||||
| Class R6 | 2022 | 2021 | 2020 | 2019 | 2018 | ||||||
| Net asset value at beginning of period | $ 9.37 | $ 16.84 | $ 12.39 | $ 10.58 | $ 10.76 | $ 11.12 | |||||
| Net investment income (loss) (a) | 0.00‡ | (0.00)‡ | (0.03) | 0.00‡ | 0.01 | 0.01 | |||||
| Net realized and unrealized gain (loss) | 1.08 | (4.36) | 5.12 | 2.88 | 1.63 | 1.21 | |||||
| Total from investment operations | 1.08 | (4.36) | 5.09 | 2.88 | 1.64 | 1.22 | |||||
| Less distributions: | |||||||||||
| From net investment income | (0.02) | — | — | (0.01) | — | (0.02) | |||||
| From net realized gain on investments | (1.05) | (3.11) | (0.64) | (1.06) | (1.82) | (1.56) | |||||
| Total distributions | (1.07) | (3.11) | (0.64) | (1.07) | (1.82) | (1.58) | |||||
| Net asset value at end of period | $ 9.38 | $ 9.37 | $ 16.84 | $ 12.39 | $ 10.58 | $ 10.76 | |||||
| Total investment return (b) | 12.64% | (31.50)% | 42.65% | 29.83% | 17.49% | 12.72% | |||||
| Ratios (to average net assets)/Supplemental Data: | |||||||||||
| Net investment income (loss) | 0.10%†† | (0.04)% | (0.22)% | 0.02% | 0.13% | 0.13% | |||||
| Net expenses (c) | 0.64%††(d) | 0.63% | 0.62% | 0.64% | 0.64% | 0.63% | |||||
| Expenses (before waiver/reimbursement) (c) | 0.64%†† | 0.64% | 0.63% | 0.64% | 0.64% | 0.64% | |||||
| Portfolio turnover rate | 47% | 77% | 66% | 44% | 54% | 52% | |||||
| Net assets at end of period (in 000’s) | $ 3,339,619 | $ 3,285,993 | $ 4,782,798 | $ 3,981,812 | $ 3,148,459 | $ 2,463,405 | |||||
| * | Unaudited. |
| ‡ | Less than one cent per share. |
| †† | Annualized. |
| (a) | Per share data based on average shares outstanding during the period. |
| (b) | Total investment return is calculated exclusive of sales charges and assumes the reinvestment of dividends and distributions. Class R6 shares are not subject to sales charges. For periods of less than one year, total return is not annualized. |
| (c) | In addition to the fees and expenses which the Fund bears directly, it also indirectly bears a pro-rata share of the fees and expenses of the underlying funds in which it invests. Such indirect expenses are not included in the above expense ratios. |
| (d) | Expense waiver/reimbursement less than 0.01%. |
| Six months ended April 30, 2023* | Year Ended October 31, | August 31, 2020^ through October 31, | |||||
| SIMPLE Class | 2022 | 2021 | 2020 | ||||
| Net asset value at beginning of period | $ 7.72 | $ 14.52 | $ 10.84 | $ 11.84** | |||
| Net investment income (loss) (a) | (0.02) | (0.07) | (0.12) | (0.02) | |||
| Net realized and unrealized gain (loss) | 0.87 | (3.62) | 4.44 | (0.98) | |||
| Total from investment operations | 0.85 | (3.69) | 4.32 | (1.00) | |||
| Less distributions: | |||||||
| From net realized gain on investments | (1.05) | (3.11) | (0.64) | — | |||
| Net asset value at end of period | $ 7.52 | $ 7.72 | $ 14.52 | $ 10.84 | |||
| Total investment return (b) | 12.27% | (32.02)% | 41.59% | (8.45)% | |||
| Ratios (to average net assets)/Supplemental Data: | |||||||
| Net investment income (loss) | (0.61)%†† | (0.77)% | (0.96)% | (1.00)%†† | |||
| Net expenses (c) | 1.33%††(d) | 1.37% | 1.33% | 1.32%†† | |||
| Expenses (before waiver/reimbursement) (c) | 1.33%†† | 1.38% | 1.34% | 1.33%†† | |||
| Portfolio turnover rate | 47% | 77% | 66% | 44% | |||
| Net assets at end of period (in 000’s) | $ 301 | $ 220 | $ 71 | $ 23 | |||
| * | Unaudited. |
| ^ | Inception date. |
| ** | Based on the net asset value of Investor Class as of August 31, 2020. |
| †† | Annualized. |
| (a) | Per share data based on average shares outstanding during the period. |
| (b) | Total investment return is calculated exclusive of sales charges and assumes the reinvestment of dividends and distributions. SIMPLE Class shares are not subject to sales charges. For periods of less than one year, total return is not annualized. |
| (c) | In addition to the fees and expenses which the Fund bears directly, it also indirectly bears a pro-rata share of the fees and expenses of the underlying funds in which it invests. Such indirect expenses are not included in the above expense ratios. |
| (d) | Expense waiver/reimbursement less than 0.01%. |
| 24 | MainStay Winslow Large Cap Growth Fund |
| Class | Commenced Operations |
| Class A | July 1, 1995 |
| Investor Class | February 28, 2008 |
| Class B | April 1, 2005 |
| Class C | April 1, 2005 |
| Class I | April 1, 2005 |
| Class R1 | April 1, 2005 |
| Class R2 | April 1, 2005 |
| Class R3 | April 28, 2006 |
| Class R6 | June 17, 2013 |
| SIMPLE Class | August 31, 2020 |
| • | Level 1—quoted prices (unadjusted) in active markets for an identical asset or liability |
| • | Level 2—other significant observable inputs (including quoted prices for a similar asset or liability in active markets, interest rates and yield curves, prepayment speeds, credit risk, etc.) |
| • | Level 3—significant unobservable inputs (including the Fund's own assumptions about the assumptions that market participants would use in measuring fair value of an asset or liability) |
| • Broker/dealer quotes | • Benchmark securities |
| • Two-sided markets | • Reference data (corporate actions or material event notices) |
| • Bids/offers | • Monthly payment information |
| • Industry and economic events | • Reported trades |
| 26 | MainStay Winslow Large Cap Growth Fund |
| 28 | MainStay Winslow Large Cap Growth Fund |
| Class R1 | $374,303 |
| Class R2 | 52,030 |
| Class R3 | 18,499 |
| Class | Expense | Waived |
| Class A | $ 531,298 | $— |
| Investor Class | 103,768 | — |
| Class B | 13,552 | — |
| Class C | 69,338 | — |
| Class I | 2,976,089 | — |
| Class R1 | 371,642 | — |
| Class R2 | 51,733 | — |
| Class R3 | 18,406 | — |
| Class R6 | 64,792 | — |
| SIMPLE Class | 242 | — |
| SIMPLE Class | $24,733 | 8.2% |
| Federal Tax Cost | Gross Unrealized Appreciation | Gross Unrealized (Depreciation) | Net Unrealized Appreciation/ (Depreciation) | |
| Investments in Securities | $8,821,775,545 | $3,095,479,767 | $(54,674,300) | $3,040,805,467 |
| 2022 | |
| Distributions paid from: | |
| Ordinary Income | $ 549,987,364 |
| Long-Term Capital Gains | 2,601,876,295 |
| Total | $3,151,863,659 |
| 30 | MainStay Winslow Large Cap Growth Fund |
| Class A | Shares | Amount |
| Six-month period ended April 30, 2023: | ||
| Shares sold | 8,426,528 | $ 63,736,814 |
| Shares issued to shareholders in reinvestment of distributions | 17,290,324 | 125,354,136 |
| Shares redeemed | (16,338,508) | (123,113,574) |
| Net increase (decrease) in shares outstanding before conversion | 9,378,344 | 65,977,376 |
| Shares converted into Class A (See Note 1) | 551,967 | 4,099,061 |
| Shares converted from Class A (See Note 1) | (72,274) | (548,456) |
| Net increase (decrease) | 9,858,037 | $ 69,527,981 |
| Year ended October 31, 2022: | ||
| Shares sold | 16,625,935 | $ 171,252,843 |
| Shares issued to shareholders in reinvestment of distributions | 28,541,804 | 330,514,092 |
| Shares redeemed | (30,234,090) | (288,975,973) |
| Net increase (decrease) in shares outstanding before conversion | 14,933,649 | 212,790,962 |
| Shares converted into Class A (See Note 1) | 906,871 | 9,104,942 |
| Shares converted from Class A (See Note 1) | (118,111) | (1,203,240) |
| Net increase (decrease) | 15,722,409 | $ 220,692,664 |
| Investor Class | Shares | Amount |
| Six-month period ended April 30, 2023: | ||
| Shares sold | 290,029 | $ 2,124,433 |
| Shares issued to shareholders in reinvestment of distributions | 1,231,574 | 8,608,706 |
| Shares redeemed | (963,058) | (7,007,864) |
| Net increase (decrease) in shares outstanding before conversion | 558,545 | 3,725,275 |
| Shares converted into Investor Class (See Note 1) | 78,638 | 597,057 |
| Shares converted from Investor Class (See Note 1) | (204,214) | (1,471,868) |
| Net increase (decrease) | 432,969 | $ 2,850,464 |
| Year ended October 31, 2022: | ||
| Shares sold | 766,345 | $ 7,074,265 |
| Shares issued to shareholders in reinvestment of distributions | 2,020,849 | 22,694,134 |
| Shares redeemed | (1,515,150) | (12,951,150) |
| Net increase (decrease) in shares outstanding before conversion | 1,272,044 | 16,817,249 |
| Shares converted into Investor Class (See Note 1) | 122,735 | 1,084,686 |
| Shares converted from Investor Class (See Note 1) | (458,718) | (4,837,943) |
| Net increase (decrease) | 936,061 | $ 13,063,992 |
| Class B | Shares | Amount |
| Six-month period ended April 30, 2023: | ||
| Shares sold | 9,449 | $ 42,240 |
| Shares issued to shareholders in reinvestment of distributions | 401,754 | 1,767,718 |
| Shares redeemed | (175,775) | (826,425) |
| Net increase (decrease) in shares outstanding before conversion | 235,428 | 983,533 |
| Shares converted from Class B (See Note 1) | (354,634) | (1,612,737) |
| Net increase (decrease) | (119,206) | $ (629,204) |
| Year ended October 31, 2022: | ||
| Shares sold | 32,973 | $ 228,304 |
| Shares issued to shareholders in reinvestment of distributions | 739,284 | 5,677,697 |
| Shares redeemed | (322,522) | (2,010,001) |
| Net increase (decrease) in shares outstanding before conversion | 449,735 | 3,896,000 |
| Shares converted from Class B (See Note 1) | (539,254) | (3,347,320) |
| Net increase (decrease) | (89,519) | $ 548,680 |
| Class C | Shares | Amount |
| Six-month period ended April 30, 2023: | ||
| Shares sold | 488,211 | $ 2,200,819 |
| Shares issued to shareholders in reinvestment of distributions | 1,816,650 | 7,956,928 |
| Shares redeemed | (2,158,883) | (10,056,983) |
| Net increase (decrease) in shares outstanding before conversion | 145,978 | 100,764 |
| Shares converted from Class C (See Note 1) | (164,050) | (752,603) |
| Net increase (decrease) | (18,072) | $ (651,839) |
| Year ended October 31, 2022: | ||
| Shares sold | 1,531,291 | $ 10,262,438 |
| Shares issued to shareholders in reinvestment of distributions | 2,934,389 | 22,448,071 |
| Shares redeemed | (3,524,833) | (22,771,338) |
| Net increase (decrease) in shares outstanding before conversion | 940,847 | 9,939,171 |
| Shares converted from Class C (See Note 1) | (300,459) | (1,784,533) |
| Net increase (decrease) | 640,388 | $ 8,154,638 |
| Class I | Shares | Amount |
| Six-month period ended April 30, 2023: | ||
| Shares sold | 49,751,009 | $ 436,755,890 |
| Shares issued to shareholders in reinvestment of distributions | 72,242,661 | 614,062,619 |
| Shares redeemed | (96,309,663) | (849,963,318) |
| Net increase (decrease) in shares outstanding before conversion | 25,684,007 | 200,855,191 |
| Shares converted into Class I (See Note 1) | 65,691 | 585,020 |
| Shares converted from Class I (See Note 1) | (105,794) | (927,477) |
| Net increase (decrease) | 25,643,904 | $ 200,512,734 |
| Year ended October 31, 2022: | ||
| Shares sold | 206,773,027 | $ 2,304,009,295 |
| Shares issued to shareholders in reinvestment of distributions | 104,600,432 | 1,391,185,741 |
| Shares redeemed | (166,738,192) | (1,848,655,608) |
| Net increase (decrease) in shares outstanding before conversion | 144,635,267 | 1,846,539,428 |
| Shares converted into Class I (See Note 1) | 101,332 | 1,181,298 |
| Shares converted from Class I (See Note 1) | (21,339) | (189,065) |
| Net increase (decrease) | 144,715,260 | $ 1,847,531,661 |
| Class R1 | Shares | Amount |
| Six-month period ended April 30, 2023: | ||
| Shares sold | 7,953,012 | $ 67,110,642 |
| Shares issued to shareholders in reinvestment of distributions | 10,722,851 | 86,318,947 |
| Shares redeemed | (9,570,204) | (80,416,201) |
| Net increase (decrease) in shares outstanding before conversion | 9,105,659 | 73,013,388 |
| Shares converted into Class R1 (See Note 1) | 6,011 | 49,230 |
| Net increase (decrease) | 9,111,670 | $ 73,062,618 |
| Year ended October 31, 2022: | ||
| Shares sold | 12,545,711 | $ 128,752,543 |
| Shares issued to shareholders in reinvestment of distributions | 18,146,768 | 230,101,018 |
| Shares redeemed | (24,117,145) | (264,354,356) |
| Net increase (decrease) in shares outstanding before conversion | 6,575,334 | 94,499,205 |
| Shares converted from Class R1 (See Note 1) | (856) | (8,825) |
| Net increase (decrease) | 6,574,478 | $ 94,490,380 |
| 32 | MainStay Winslow Large Cap Growth Fund |
| Class R2 | Shares | Amount |
| Six-month period ended April 30, 2023: | ||
| Shares sold | 1,408,477 | $ 10,309,033 |
| Shares issued to shareholders in reinvestment of distributions | 1,391,973 | 9,938,687 |
| Shares redeemed | (2,368,520) | (17,897,082) |
| Net increase (decrease) in shares outstanding before conversion | 431,930 | 2,350,638 |
| Shares converted from Class R2 (See Note 1) | (2,389) | (17,227) |
| Net increase (decrease) | 429,541 | $ 2,333,411 |
| Year ended October 31, 2022: | ||
| Shares sold | 2,804,293 | $ 27,795,594 |
| Shares issued to shareholders in reinvestment of distributions | 2,370,271 | 27,115,902 |
| Shares redeemed | (4,522,072) | (46,339,701) |
| Net increase (decrease) | 652,492 | $ 8,571,795 |
| Class R3 | Shares | Amount |
| Six-month period ended April 30, 2023: | ||
| Shares sold | 412,345 | $ 2,676,423 |
| Shares issued to shareholders in reinvestment of distributions | 870,215 | 5,473,601 |
| Shares redeemed | (1,302,424) | (8,401,457) |
| Net increase (decrease) | (19,864) | $ (251,433) |
| Year ended October 31, 2022: | ||
| Shares sold | 904,543 | $ 7,708,409 |
| Shares issued to shareholders in reinvestment of distributions | 1,354,080 | 13,919,943 |
| Shares redeemed | (1,551,868) | (13,129,182) |
| Net increase (decrease) | 706,755 | $ 8,499,170 |
| Class R6 | Shares | Amount |
| Six-month period ended April 30, 2023: | ||
| Shares sold | 35,749,231 | $ 319,204,347 |
| Shares issued to shareholders in reinvestment of distributions | 40,759,793 | 351,349,412 |
| Shares redeemed | (71,237,786) | (629,400,589) |
| Net increase (decrease) | 5,271,238 | $ 41,153,170 |
| Year ended October 31, 2022: | ||
| Shares sold | 68,050,104 | $ 753,843,263 |
| Shares issued to shareholders in reinvestment of distributions | 64,620,416 | 871,083,204 |
| Shares redeemed | (66,095,061) | (730,228,554) |
| Net increase (decrease) | 66,575,459 | $ 894,697,913 |
| SIMPLE Class | Shares | Amount |
| Six-month period ended April 30, 2023: | ||
| Shares sold | 8,760 | $ 62,703 |
| Shares issued to shareholders in reinvestment of distributions | 4,458 | 30,895 |
| Shares redeemed | (1,769) | (12,664) |
| Net increase (decrease) | 11,449 | $ 80,934 |
| Year ended October 31, 2022: | ||
| Shares sold | 22,996 | $ 211,112 |
| Shares issued to shareholders in reinvestment of distributions | 1,475 | 16,490 |
| Shares redeemed | (826) | (7,320) |
| Net increase (decrease) | 23,645 | $ 220,282 |
| 34 | MainStay Winslow Large Cap Growth Fund |
| 36 | MainStay Winslow Large Cap Growth Fund |
| 38 | MainStay Winslow Large Cap Growth Fund |
| 40 | MainStay Winslow Large Cap Growth Fund |
1.
| 2. | This Fund is registered for sale in CA, CT, DE, FL, MA, NJ, NY and VT. |
| 3. | An affiliate of New York Life Investment Management LLC. |
| 5022118MS043-23 | MSLG10-06/23 |
please log in to newyorklifeinvestments.com/accounts.
| Not FDIC/NCUA Insured | Not a Deposit | May Lose Value | No Bank Guarantee | Not Insured by Any Government Agency |


President
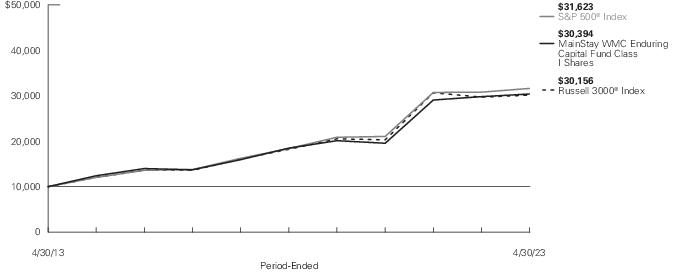
| Average Annual Total Returns for the Period-Ended April 30, 2023 | ||||||||
| Class | Sales Charge | Inception Date1 | Six Months2 | One Year | Five Years | Ten Years or Since Inception | Gross Expense Ratio3 | |
| Class A Shares | Maximum 5.50% Initial Sales Charge | With sales charges | 6/1/1998 | -1.25% | -3.91% | 8.93% | 10.85% | 0.94% |
| Excluding sales charges | 4.50 | 1.69 | 10.17 | 11.48 | 0.94 | |||
| Investor Class Shares4 | Maximum 5.00% Initial Sales Charge | With sales charges | 2/28/2008 | -0.81 | -3.57 | 8.67 | 10.57 | 1.11 |
| Excluding sales charges | 4.41 | 1.50 | 9.90 | 11.19 | 1.11 | |||
| Class B Shares5 | Maximum 5.00% CDSC | With sales charges | 6/1/1998 | -0.99 | -4.12 | 8.79 | 10.36 | 1.86 |
| if Redeemed Within the First Six Years of Purchase | Excluding sales charges | 4.00 | 0.72 | 9.08 | 10.36 | 1.86 | ||
| Class C Shares | Maximum 1.00% CDSC | With sales charges | 9/1/1998 | 3.00 | -0.25 | 9.08 | 10.36 | 1.86 |
| if Redeemed Within One Year of Purchase | Excluding sales charges | 4.00 | 0.72 | 9.08 | 10.36 | 1.86 | ||
| Class I Shares | No Sales Charge | 12/28/2004 | 4.63 | 1.94 | 10.46 | 11.76 | 0.69 | |
| Class R3 Shares | No Sales Charge | 2/29/2016 | 4.32 | 1.32 | 9.78 | 11.84 | 1.30 | |
| Class R6 Shares | No Sales Charge | 4/26/2021 | 4.66 | 1.99 | N/A | 2.39 | 0.63 | |
| 1. | Effective March 5, 2021, the Fund replaced its subadvisor and modified its principal investment strategies. The past performance in the graph and table prior to March 5, 2021 reflects the Fund's prior subadvisor and principal investment strategies. |
| 2. | Not annualized. |
| 3. | The gross expense ratios presented reflect the Fund’s “Total Annual Fund Operating Expenses” from the most recent Prospectus, as supplemented, and may differ from other expense ratios disclosed in this report. |
| 4. | Prior to June 30, 2020, the maximum initial sales charge was 5.50%, which is reflected in the applicable average annual total return figures shown. |
| 5. | Class B shares are closed to all new purchases as well as additional investments by existing Class B shareholders. |
| Benchmark Performance* | Six Months1 | One Year | Five Years | Ten Years |
| S&P 500® Index2 | 8.63% | 2.66% | 11.45% | 12.20% |
| Russell 3000® Index3 | 7.30 | 1.50 | 10.60 | 11.67 |
| Morningstar Large Blend Category Average4 | 7.23 | 1.80 | 9.94 | 10.81 |
| * | Returns for indices reflect no deductions for fees, expenses or taxes, except for foreign withholding taxes where applicable. Results assume reinvestment of all dividends and capital gains. An investment cannot be made directly in an index. |
| 1. | Not annualized. |
| 2. | The S&P 500® Index is the Fund's primary benchmark. S&P 500® is a trademark of The McGraw-Hill Companies, Inc. The S&P 500® Index is widely regarded as the standard index for measuring large-cap U.S. stock market performance. |
| 3. | The Russell 3000® Index is the Fund's secondary benchmark. The Russell 3000® Index measures the performance of the largest 3,000 U.S. companies representing approximately 98% of the investable U.S. equity market. |
| 4. | The Morningstar Large Blend Category Average is representative of funds that represent the overall U.S. stock market in size, growth rates and price. Stocks in the top 70% of the capitalization of the U.S. equity market are defined as large cap. The blend style is assigned to funds where neither growth nor value characteristics predominate. These funds tend to invest across the spectrum of U.S. industries, and owing to their broad exposure, the funds' returns are often similar to those of the S&P 500® Index. Results are based on average total returns of similar funds with all dividends and capital gain distributions reinvested. |
| 6 | MainStay WMC Enduring Capital Fund |
| Share Class | Beginning Account Value 11/1/22 | Ending Account Value (Based on Actual Returns and Expenses) 4/30/23 | Expenses Paid During Period1 | Ending Account Value (Based on Hypothetical 5% Annualized Return and Actual Expenses) 4/30/23 | Expenses Paid During Period1 | Net Expense Ratio During Period2 |
| Class A Shares | $1,000.00 | $1,045.00 | $4.72 | $1,020.18 | $4.66 | 0.93% |
| Investor Class Shares | $1,000.00 | $1,044.10 | $5.88 | $1,019.04 | $5.81 | 1.16% |
| Class B Shares | $1,000.00 | $1,040.00 | $9.66 | $1,015.32 | $9.54 | 1.91% |
| Class C Shares | $1,000.00 | $1,040.00 | $9.66 | $1,015.32 | $9.54 | 1.91% |
| Class I Shares | $1,000.00 | $1,046.30 | $3.45 | $1,021.42 | $3.41 | 0.68% |
| Class R3 Shares | $1,000.00 | $1,043.20 | $6.48 | $1,018.45 | $6.41 | 1.28% |
| Class R6 Shares | $1,000.00 | $1,046.60 | $3.04 | $1,021.82 | $3.01 | 0.60% |
| 1. | Expenses are equal to the Fund’s annualized expense ratio of each class multiplied by the average account value over the period, divided by 365 and multiplied by 181 (to reflect the six-month period). The table above represents the actual expenses incurred during the six-month period. In addition to the fees and expenses which the Fund bears directly, it also indirectly bears a pro rata share of the fees and expenses of the underlying funds in which it invests. Such indirect expenses are not included in the above-reported expense figures. |
| 2. | Expenses are equal to the Fund's annualized expense ratio to reflect the six-month period. |
| Machinery | 11.7% |
| Commercial Services & Supplies | 11.3 |
| Insurance | 9.3 |
| Chemicals | 7.1 |
| Software | 6.8 |
| Ground Transportation | 6.4 |
| Capital Markets | 5.1 |
| Household Durables | 4.9 |
| Specialized REITs | 4.3 |
| Financial Services | 4.2 |
| Trading Companies & Distributors | 4.0 |
| Air Freight & Logistics | 4.0 |
| Consumer Staples Distribution & Retail | 3.3% |
| Banks | 3.0 |
| Electric Utilities | 2.7 |
| Media | 2.7 |
| Containers & Packaging | 2.7 |
| Life Sciences Tools & Services | 2.6 |
| Health Care Providers & Services | 2.5 |
| Short–Term Investments | 1.6 |
| Other Assets, Less Liabilities | –0.2 |
| 100.0% |
| 1. | Constellation Software, Inc. |
| 2. | Copart, Inc. |
| 3. | NVR, Inc. |
| 4. | Markel Corp. |
| 5. | PACCAR, Inc. |
| 6. | Progressive Corp. (The) |
| 7. | Berkshire Hathaway, Inc., Class B |
| 8. | Linde plc |
| 9. | Watsco, Inc. |
| 10. | Expeditors International of Washington, Inc. |
| 8 | MainStay WMC Enduring Capital Fund |
| 1. | See "Investment and Performance Comparison" for other share class returns, which may be higher or lower than Class I share returns, and for more information on benchmark and peer group returns. |
| 10 | MainStay WMC Enduring Capital Fund |
| Shares | Value | |
| Common Stocks 98.6% | ||
| Air Freight & Logistics 4.0% | ||
| Expeditors International of Washington, Inc. | 212,311 | $ 24,169,484 |
| Banks 3.0% | ||
| M&T Bank Corp. | 146,151 | 18,385,796 |
| Capital Markets 5.1% | ||
| Brookfield Asset Management Ltd., Class A (a) | 209,282 | 7,021,411 |
| Brookfield Corp. | 317,151 | 10,294,721 |
| Charles Schwab Corp. (The) | 256,377 | 13,393,135 |
| 30,709,267 | ||
| Chemicals 7.1% | ||
| Linde plc | 68,594 | 25,342,053 |
| Sherwin-Williams Co. (The) | 75,531 | 17,941,634 |
| 43,283,687 | ||
| Commercial Services & Supplies 11.3% | ||
| Cintas Corp. | 39,877 | 18,174,740 |
| Copart, Inc. (b) | 396,593 | 31,350,677 |
| Waste Connections, Inc. | 137,729 | 19,164,990 |
| 68,690,407 | ||
| Consumer Staples Distribution & Retail 3.3% | ||
| Costco Wholesale Corp. | 40,230 | 20,244,541 |
| Containers & Packaging 2.7% | ||
| Ball Corp. | 302,086 | 16,064,933 |
| Electric Utilities 2.7% | ||
| NextEra Energy, Inc. | 212,098 | 16,253,070 |
| Financial Services 4.2% | ||
| Berkshire Hathaway, Inc., Class B (b) | 77,249 | 25,380,159 |
| Ground Transportation 6.4% | ||
| Canadian National Railway Co. | 161,832 | 19,290,599 |
| Old Dominion Freight Line, Inc. | 61,415 | 19,676,752 |
| 38,967,351 | ||
| Health Care Providers & Services 2.5% | ||
| UnitedHealth Group, Inc. | 30,949 | 15,229,693 |
| Household Durables 4.9% | ||
| NVR, Inc. (b) | 5,105 | 29,813,200 |
| Shares | Value | |
| Insurance 9.3% | ||
| Brookfield Reinsurance Ltd. | 3,730 | $ 121,225 |
| Markel Corp. (b) | 21,711 | 29,712,155 |
| Progressive Corp. (The) | 193,490 | 26,392,036 |
| 56,225,416 | ||
| Life Sciences Tools & Services 2.6% | ||
| Danaher Corp. | 67,671 | 16,031,937 |
| Machinery 11.7% | ||
| Deere & Co. | 35,195 | 13,304,414 |
| Fortive Corp. | 209,604 | 13,223,916 |
| IDEX Corp. | 86,718 | 17,891,658 |
| PACCAR, Inc. | 357,804 | 26,724,381 |
| 71,144,369 | ||
| Media 2.7% | ||
| Cable One, Inc. | 21,411 | 16,238,316 |
| Software 6.8% | ||
| Constellation Software, Inc. | 20,546 | 40,214,263 |
| Lumine Group, Inc. (b) | 61,645 | 830,366 |
| 41,044,629 | ||
| Specialized REITs 4.3% | ||
| American Tower Corp. | 66,148 | 13,519,990 |
| Public Storage | 42,303 | 12,472,193 |
| 25,992,183 | ||
| Trading Companies & Distributors 4.0% | ||
| Watsco, Inc. | 70,405 | 24,386,884 |
| Total Common Stocks (Cost $525,178,438) | 598,255,322 | |
| Short-Term Investments 1.6% | ||
| Affiliated Investment Company 1.5% | ||
| MainStay U.S. Government Liquidity Fund, 3.98% (c) | 8,958,070 | 8,958,070 |
| Shares | Value | ||
| Short-Term Investments (continued) | |||
| Unaffiliated Investment Company 0.1% | |||
| Invesco Government & Agency Portfolio, 4.857% (c)(d) | 900,689 | $ 900,689 | |
| Total Short-Term Investments (Cost $9,858,759) | 9,858,759 | ||
| Total Investments (Cost $535,037,197) | 100.2% | 608,114,081 | |
| Other Assets, Less Liabilities | (0.2) | (1,091,427) | |
| Net Assets | 100.0% | $ 607,022,654 | |
| † | Percentages indicated are based on Fund net assets. |
| ^ | Industry classifications may be different than those used for compliance monitoring purposes. |
| (a) | All or a portion of this security was held on loan. As of April 30, 2023, the aggregate market value of securities on loan was $882,622. The Fund received cash collateral with a value of $900,689. (See Note 2(I)) |
| (b) | Non-income producing security. |
| (c) | Current yield as of April 30, 2023. |
| (d) | Represents a security purchased with cash collateral received for securities on loan. |
| Affiliated Investment Companies | Value, Beginning of Period | Purchases at Cost | Proceeds from Sales | Net Realized Gain/(Loss) on Sales | Change in Unrealized Appreciation/ (Depreciation) | Value, End of Period | Dividend Income | Other Distributions | Shares End of Period |
| MainStay U.S. Government Liquidity Fund | $ 148 | $ 101,550 | $ (92,740) | $ — | $ — | $ 8,958 | $ 107 | $ — | 8,958 |
| 12 | MainStay WMC Enduring Capital Fund |
| Description | Quoted Prices in Active Markets for Identical Assets (Level 1) | Significant Other Observable Inputs (Level 2) | Significant Unobservable Inputs (Level 3) | Total | |||
| Asset Valuation Inputs | |||||||
| Investments in Securities (a) | |||||||
| Common Stocks | $ 598,255,322 | $ — | $ — | $ 598,255,322 | |||
| Short-Term Investments | |||||||
| Affiliated Investment Company | 8,958,070 | — | — | 8,958,070 | |||
| Unaffiliated Investment Company | 900,689 | — | — | 900,689 | |||
| Total Short-Term Investments | 9,858,759 | — | — | 9,858,759 | |||
| Total Investments in Securities | $ 608,114,081 | $ — | $ — | $ 608,114,081 |
| (a) | For a complete listing of investments and their industries, see the Portfolio of Investments. |
| Assets | |
| Investment in unaffiliated securities, at value (identified cost $526,079,127) including securities on loan of $882,622 | $599,156,011 |
| Investment in affiliated investment companies, at value (identified cost $8,958,070) | 8,958,070 |
| Cash denominated in foreign currencies (identified cost $11) | 11 |
| Receivables: | |
| Fund shares sold | 378,972 |
| Dividends | 98,175 |
| Securities lending | 20 |
| Other assets | 87,366 |
| Total assets | 608,678,625 |
| Liabilities | |
| Cash collateral received for securities on loan | 900,689 |
| Payables: | |
| Manager (See Note 3) | 269,318 |
| Fund shares redeemed | 167,396 |
| Shareholder communication | 133,775 |
| NYLIFE Distributors (See Note 3) | 65,189 |
| Transfer agent (See Note 3) | 52,257 |
| Professional fees | 51,626 |
| Custodian | 8,325 |
| Accrued expenses | 7,396 |
| Total liabilities | 1,655,971 |
| Net assets | $607,022,654 |
| Composition of Net Assets | |
| Shares of beneficial interest outstanding (par value of $.01 per share) unlimited number of shares authorized | $ 201,429 |
| Additional paid-in-capital | 552,262,287 |
| 552,463,716 | |
| Total distributable earnings (loss) | 54,558,938 |
| Net assets | $607,022,654 |
| Class A | |
| Net assets applicable to outstanding shares | $204,268,730 |
| Shares of beneficial interest outstanding | 6,766,113 |
| Net asset value per share outstanding | $ 30.19 |
| Maximum sales charge (5.50% of offering price) | 1.76 |
| Maximum offering price per share outstanding | $ 31.95 |
| Investor Class | |
| Net assets applicable to outstanding shares | $ 23,025,761 |
| Shares of beneficial interest outstanding | 763,288 |
| Net asset value per share outstanding | $ 30.17 |
| Maximum sales charge (5.00% of offering price) | 1.59 |
| Maximum offering price per share outstanding | $ 31.76 |
| Class B | |
| Net assets applicable to outstanding shares | $ 2,191,093 |
| Shares of beneficial interest outstanding | 83,065 |
| Net asset value and offering price per share outstanding | $ 26.38 |
| Class C | |
| Net assets applicable to outstanding shares | $ 20,661,729 |
| Shares of beneficial interest outstanding | 784,064 |
| Net asset value and offering price per share outstanding | $ 26.35 |
| Class I | |
| Net assets applicable to outstanding shares | $ 96,693,369 |
| Shares of beneficial interest outstanding | 3,181,934 |
| Net asset value and offering price per share outstanding | $ 30.39 |
| Class R3 | |
| Net assets applicable to outstanding shares | $ 753,521 |
| Shares of beneficial interest outstanding | 25,208 |
| Net asset value and offering price per share outstanding | $ 29.89 |
| Class R6 | |
| Net assets applicable to outstanding shares | $259,428,451 |
| Shares of beneficial interest outstanding | 8,539,221 |
| Net asset value and offering price per share outstanding | $ 30.38 |
| 14 | MainStay WMC Enduring Capital Fund |
| Investment Income (Loss) | |
| Income | |
| Dividends-unaffiliated (net of foreign tax withholding of $42,896) | $ 4,558,176 |
| Dividends-affiliated | 106,936 |
| Securities lending, net | 1,547 |
| Total income | 4,666,659 |
| Expenses | |
| Manager (See Note 3) | 1,603,784 |
| Distribution/Service—Class A (See Note 3) | 253,046 |
| Distribution/Service—Investor Class (See Note 3) | 29,091 |
| Distribution/Service—Class B (See Note 3) | 12,665 |
| Distribution/Service—Class C (See Note 3) | 109,424 |
| Distribution/Service—Class R3 (See Note 3) | 1,703 |
| Transfer agent (See Note 3) | 192,365 |
| Professional fees | 60,480 |
| Registration | 56,219 |
| Shareholder communication | 23,237 |
| Custodian | 11,821 |
| Trustees | 6,080 |
| Shareholder service (See Note 3) | 341 |
| Miscellaneous | 6,398 |
| Total expenses before waiver/reimbursement | 2,366,654 |
| Reimbursement from prior custodian(a) | (2,079) |
| Net expenses | 2,364,575 |
| Net investment income (loss) | 2,302,084 |
| Realized and Unrealized Gain (Loss) | |
| Net realized gain (loss) on: | |
| Unaffiliated investment transactions | (19,940,355) |
| Foreign currency transactions | 13,838 |
| Net realized gain (loss) | (19,926,517) |
| Net change in unrealized appreciation (depreciation) on: | |
| Unaffiliated investments | 41,373,025 |
| Translation of other assets and liabilities in foreign currencies | 342 |
| Net change in unrealized appreciation (depreciation) | 41,373,367 |
| Net realized and unrealized gain (loss) | 21,446,850 |
| Net increase (decrease) in net assets resulting from operations | $ 23,748,934 |
| (a) | Represents a refund for overbilling of custody fees. |
for the six months ended April 30, 2023 (Unaudited) and the year ended October 31, 2022
| Six months ended April 30, 2023 | Year ended October 31, 2022 | |
| Increase (Decrease) in Net Assets | ||
| Operations: | ||
| Net investment income (loss) | $ 2,302,084 | $ 1,692,280 |
| Net realized gain (loss) | (19,926,517) | 19,226,663 |
| Net change in unrealized appreciation (depreciation) | 41,373,367 | (87,315,486) |
| Net increase (decrease) in net assets resulting from operations | 23,748,934 | (66,396,543) |
| Distributions to shareholders: | ||
| Class A | (7,743,520) | (19,185,374) |
| Investor Class | (859,939) | (2,404,448) |
| Class B | (113,221) | (453,565) |
| Class C | (929,434) | (3,325,977) |
| Class I | (3,690,395) | (10,230,592) |
| Class R3 | (21,276) | (40,016) |
| Class R6 | (8,289,276) | (22,407,486) |
| Total distributions to shareholders | (21,647,061) | (58,047,458) |
| Capital share transactions: | ||
| Net proceeds from sales of shares | 108,804,294 | 86,455,226 |
| Net asset value of shares issued to shareholders in reinvestment of distributions | 21,396,272 | 57,355,353 |
| Cost of shares redeemed | (42,153,912) | (201,267,040) |
| Increase (decrease) in net assets derived from capital share transactions | 88,046,654 | (57,456,461) |
| Net increase (decrease) in net assets | 90,148,527 | (181,900,462) |
| Net Assets | ||
| Beginning of period | 516,874,127 | 698,774,589 |
| End of period | $607,022,654 | $ 516,874,127 |
| 16 | MainStay WMC Enduring Capital Fund |
| Six months ended April 30, 2023* | Year Ended October 31, | ||||||||||
| Class A | 2022 | 2021 | 2020 | 2019 | 2018 | ||||||
| Net asset value at beginning of period | $ 30.01 | $ 36.76 | $ 24.95 | $ 24.92 | $ 26.31 | $ 24.56 | |||||
| Net investment income (loss) (a) | 0.10 | 0.06 | 0.06 | 0.16 | 0.26 | 0.24 | |||||
| Net realized and unrealized gain (loss) | 1.26 | (3.74) | 11.99 | 1.36 | 1.28 | 1.74 | |||||
| Total from investment operations | 1.36 | (3.68) | 12.05 | 1.52 | 1.54 | 1.98 | |||||
| Less distributions: | |||||||||||
| From net investment income | (0.08) | (0.04) | (0.24) | (0.27) | (0.22) | (0.23) | |||||
| From net realized gain on investments | (1.10) | (3.03) | — | (1.22) | (2.71) | — | |||||
| Total distributions | (1.18) | (3.07) | (0.24) | (1.49) | (2.93) | (0.23) | |||||
| Net asset value at end of period | $ 30.19 | $ 30.01 | $ 36.76 | $ 24.95 | $ 24.92 | $ 26.31 | |||||
| Total investment return (b) | 4.50% | (10.96)% | 48.53% | 6.42% | 6.80% | 8.07% | |||||
| Ratios (to average net assets)/Supplemental Data: | |||||||||||
| Net investment income (loss) | 0.66%†† | 0.18% | 0.19% | 0.64% | 1.08% | 0.90% | |||||
| Net expenses (c) | 0.93%†† | 0.94% | 0.91% | 0.99% | 0.97% | 0.97% | |||||
| Portfolio turnover rate | 3% | 2% | 24% | 166% | 164% | 137% | |||||
| Net assets at end of period (in 000’s) | $ 204,269 | $ 196,218 | $ 228,700 | $ 62,611 | $ 63,814 | $ 63,956 | |||||
| * | Unaudited. |
| †† | Annualized. |
| (a) | Per share data based on average shares outstanding during the period. |
| (b) | Total investment return is calculated exclusive of sales charges and assumes the reinvestment of dividends and distributions. For periods of less than one year, total return is not annualized. |
| (c) | In addition to the fees and expenses which the Fund bears directly, it also indirectly bears a pro-rata share of the fees and expenses of the underlying funds in which it invests. Such indirect expenses are not included in the above expense ratios. |
| Six months ended April 30, 2023* | Year Ended October 31, | ||||||||||
| Investor Class | 2022 | 2021 | 2020 | 2019 | 2018 | ||||||
| Net asset value at beginning of period | $ 29.97 | $ 36.73 | $ 24.92 | $ 24.90 | $ 26.29 | $ 24.53 | |||||
| Net investment income (loss) (a) | 0.06 | 0.01 | (0.01) | 0.08 | 0.20 | 0.18 | |||||
| Net realized and unrealized gain (loss) | 1.26 | (3.74) | 11.98 | 1.37 | 1.27 | 1.74 | |||||
| Total from investment operations | 1.32 | (3.73) | 11.97 | 1.45 | 1.47 | 1.92 | |||||
| Less distributions: | |||||||||||
| From net investment income | (0.02) | — | (0.16) | (0.21) | (0.15) | (0.16) | |||||
| From net realized gain on investments | (1.10) | (3.03) | — | (1.22) | (2.71) | — | |||||
| Total distributions | (1.12) | (3.03) | (0.16) | (1.43) | (2.86) | (0.16) | |||||
| Net asset value at end of period | $ 30.17 | $ 29.97 | $ 36.73 | $ 24.92 | $ 24.90 | $ 26.29 | |||||
| Total investment return (b) | 4.41% | (11.13)% | 48.22% | 6.05% | 6.51% | 7.82% | |||||
| Ratios (to average net assets)/Supplemental Data: | |||||||||||
| Net investment income (loss) | 0.43%†† | 0.03% | (0.02)% | 0.35% | 0.82% | 0.68% | |||||
| Net expenses (c) | 1.16%†† | 1.11% | 1.19% | 1.30% | 1.23% | 1.21% | |||||
| Expenses (before waiver/reimbursement) (c) | 1.16%†† | 1.11% | 1.19% | 1.31% | 1.27% | 1.23% | |||||
| Portfolio turnover rate | 3% | 2% | 24% | 166% | 164% | 137% | |||||
| Net assets at end of period (in 000's) | $ 23,026 | $ 22,977 | $ 29,293 | $ 15,544 | $ 17,203 | $ 16,580 | |||||
| * | Unaudited. |
| †† | Annualized. |
| (a) | Per share data based on average shares outstanding during the period. |
| (b) | Total investment return is calculated exclusive of sales charges and assumes the reinvestment of dividends and distributions. For periods of less than one year, total return is not annualized. |
| (c) | In addition to the fees and expenses which the Fund bears directly, it also indirectly bears a pro-rata share of the fees and expenses of the underlying funds in which it invests. Such indirect expenses are not included in the above expense ratios. |
| Six months ended April 30, 2023* | Year Ended October 31, | ||||||||||
| Class B | 2022 | 2021 | 2020 | 2019 | 2018 | ||||||
| Net asset value at beginning of period | $ 26.41 | $ 32.96 | $ 22.40 | $ 22.50 | $ 24.04 | $ 22.46 | |||||
| Net investment income (loss) (a) | (0.04) | (0.21) | (0.22) | (0.08) | 0.02 | (0.02) | |||||
| Net realized and unrealized gain (loss) | 1.11 | (3.31) | 10.78 | 1.22 | 1.15 | 1.60 | |||||
| Total from investment operations | 1.07 | (3.52) | 10.56 | 1.14 | 1.17 | 1.58 | |||||
| Less distributions: | |||||||||||
| From net investment income | — | — | — | (0.02) | — | — | |||||
| From net realized gain on investments | (1.10) | (3.03) | — | (1.22) | (2.71) | — | |||||
| Total distributions | (1.10) | (3.03) | — | (1.24) | (2.71) | — | |||||
| Net asset value at end of period | $ 26.38 | $ 26.41 | $ 32.96 | $ 22.40 | $ 22.50 | $ 24.04 | |||||
| Total investment return (b) | 4.00% | (11.79)% | 47.14%(c) | 5.28% | 5.71% | 7.03% | |||||
| Ratios (to average net assets)/Supplemental Data: | |||||||||||
| Net investment income (loss) | (0.32)%†† | (0.72)% | (0.77)% | (0.39)% | 0.10% | (0.07)% | |||||
| Net expenses (d) | 1.91%†† | 1.86% | 1.95% | 2.05% | 1.98% | 1.96% | |||||
| Expenses (before waiver/reimbursement) (d) | 1.91%†† | 1.86% | 1.95% | 2.06% | 2.02% | 1.98% | |||||
| Portfolio turnover rate | 3% | 2% | 24% | 166% | 164% | 137% | |||||
| Net assets at end of period (in 000’s) | $ 2,191 | $ 2,824 | $ 5,007 | $ 3,666 | $ 4,718 | $ 5,855 | |||||
| * | Unaudited. |
| †† | Annualized. |
| (a) | Per share data based on average shares outstanding during the period. |
| (b) | Total investment return is calculated exclusive of sales charges and assumes the reinvestment of dividends and distributions. For periods of less than one year, total return is not annualized. |
| (c) | Total investment return may reflect adjustments to conform to generally accepted accounting principles. |
| (d) | In addition to the fees and expenses which the Fund bears directly, it also indirectly bears a pro-rata share of the fees and expenses of the underlying funds in which it invests. Such indirect expenses are not included in the above expense ratios. |
| Six months ended April 30, 2023* | Year Ended October 31, | ||||||||||
| Class C | 2022 | 2021 | 2020 | 2019 | 2018 | ||||||
| Net asset value at beginning of period | $ 26.39 | $ 32.93 | $ 22.38 | $ 22.48 | $ 24.02 | $ 22.45 | |||||
| Net investment income (loss) (a) | (0.04) | (0.21) | (0.24) | (0.08) | 0.02 | (0.02) | |||||
| Net realized and unrealized gain (loss) | 1.10 | (3.30) | 10.79 | 1.22 | 1.15 | 1.59 | |||||
| Total from investment operations | 1.06 | (3.51) | 10.55 | 1.14 | 1.17 | 1.57 | |||||
| Less distributions: | |||||||||||
| From net investment income | — | — | — | (0.02) | — | — | |||||
| From net realized gain on investments | (1.10) | (3.03) | — | (1.22) | (2.71) | — | |||||
| Total distributions | (1.10) | (3.03) | — | (1.24) | (2.71) | — | |||||
| Net asset value at end of period | $ 26.35 | $ 26.39 | $ 32.93 | $ 22.38 | $ 22.48 | $ 24.02 | |||||
| Total investment return (b) | 4.00% | (11.80)% | 47.14%(c) | 5.29% | 5.72% | 6.99% | |||||
| Ratios (to average net assets)/Supplemental Data: | |||||||||||
| Net investment income (loss) | (0.32)%†† | (0.72)% | (0.80)% | (0.38)% | 0.10% | (0.08)% | |||||
| Net expenses (d) | 1.91%†† | 1.86% | 1.89% | 2.05% | 1.98% | 1.96% | |||||
| Expenses (before waiver/reimbursement) (d) | 1.91%†† | 1.86% | 1.89% | 2.06% | 2.02% | 1.98% | |||||
| Portfolio turnover rate | 3% | 2% | 24% | 166% | 164% | 137% | |||||
| Net assets at end of period (in 000’s) | $ 20,662 | $ 23,500 | $ 37,234 | $ 6,641 | $ 10,946 | $ 14,964 | |||||
| * | Unaudited. |
| †† | Annualized. |
| (a) | Per share data based on average shares outstanding during the period. |
| (b) | Total investment return is calculated exclusive of sales charges and assumes the reinvestment of dividends and distributions. For periods of less than one year, total return is not annualized. |
| (c) | Total investment return may reflect adjustments to conform to generally accepted accounting principles. |
| (d) | In addition to the fees and expenses which the Fund bears directly, it also indirectly bears a pro-rata share of the fees and expenses of the underlying funds in which it invests. Such indirect expenses are not included in the above expense ratios. |
| 18 | MainStay WMC Enduring Capital Fund |
| Six months ended April 30, 2023* | Year Ended October 31, | ||||||||||
| Class I | 2022 | 2021 | 2020 | 2019 | 2018 | ||||||
| Net asset value at beginning of period | $ 30.24 | $ 36.99 | $ 25.09 | $ 25.05 | $ 26.44 | $ 24.67 | |||||
| Net investment income (loss) (a) | 0.14 | 0.15 | 0.16 | 0.23 | 0.32 | 0.31 | |||||
| Net realized and unrealized gain (loss) | 1.27 | (3.77) | 12.03 | 1.37 | 1.28 | 1.74 | |||||
| Total from investment operations | 1.41 | (3.62) | 12.19 | 1.60 | 1.60 | 2.05 | |||||
| Less distributions: | |||||||||||
| From net investment income | (0.16) | (0.10) | (0.29) | (0.34) | (0.28) | (0.28) | |||||
| From net realized gain on investments | (1.10) | (3.03) | — | (1.22) | (2.71) | — | |||||
| Total distributions | (1.26) | (3.13) | (0.29) | (1.56) | (2.99) | (0.28) | |||||
| Net asset value at end of period | $ 30.39 | $ 30.24 | $ 36.99 | $ 25.09 | $ 25.05 | $ 26.44 | |||||
| Total investment return (b) | 4.63% | (10.72)% | 48.97% | 6.66% | 7.06% | 8.36% | |||||
| Ratios (to average net assets)/Supplemental Data: | |||||||||||
| Net investment income (loss) | 0.92%†† | 0.45% | 0.48% | 0.96% | 1.34% | 1.16% | |||||
| Net expenses (c) | 0.68%†† | 0.69% | 0.66% | 0.74% | 0.72% | 0.71% | |||||
| Portfolio turnover rate | 3% | 2% | 24% | 166% | 164% | 137% | |||||
| Net assets at end of period (in 000’s) | $ 96,693 | $ 73,935 | $ 135,219 | $ 37,491 | $ 97,903 | $ 98,395 | |||||
| * | Unaudited. |
| †† | Annualized. |
| (a) | Per share data based on average shares outstanding during the period. |
| (b) | Total investment return is calculated exclusive of sales charges and assumes the reinvestment of dividends and distributions. Class I shares are not subject to sales charges. For periods of less than one year, total return is not annualized. |
| (c) | In addition to the fees and expenses which the Fund bears directly, it also indirectly bears a pro-rata share of the fees and expenses of the underlying funds in which it invests. Such indirect expenses are not included in the above expense ratios. |
| Six months ended April 30, 2023* | Year Ended October 31, | ||||||||||
| Class R3 | 2022 | 2021 | 2020 | 2019 | 2018 | ||||||
| Net asset value at beginning of period | $ 29.71 | $ 36.51 | $ 24.78 | $ 24.77 | $ 26.17 | $ 24.48 | |||||
| Net investment income (loss) (a) | 0.04 | (0.05) | (0.04) | 0.07 | 0.17 | 0.14 | |||||
| Net realized and unrealized gain (loss) | 1.25 | (3.72) | 11.91 | 1.36 | 1.28 | 1.73 | |||||
| Total from investment operations | 1.29 | (3.77) | 11.87 | 1.43 | 1.45 | 1.87 | |||||
| Less distributions: | |||||||||||
| From net investment income | (0.01) | — | (0.14) | (0.20) | (0.14) | (0.18) | |||||
| From net realized gain on investments | (1.10) | (3.03) | — | (1.22) | (2.71) | — | |||||
| Total distributions | (1.11) | (3.03) | (0.14) | (1.42) | (2.85) | (0.18) | |||||
| Net asset value at end of period | $ 29.89 | $ 29.71 | $ 36.51 | $ 24.78 | $ 24.77 | $ 26.17 | |||||
| Total investment return (b) | 4.32% | (11.29)% | 48.07% | 6.02% | 6.42% | 7.66% | |||||
| Ratios (to average net assets)/Supplemental Data: | |||||||||||
| Net investment income (loss) | 0.30%†† | (0.17)% | (0.13)% | 0.30% | 0.70% | 0.52% | |||||
| Net expenses (c) | 1.28%†† | 1.30% | 1.28% | 1.34% | 1.32% | 1.32% | |||||
| Portfolio turnover rate | 3% | 2% | 24% | 166% | 164% | 137% | |||||
| Net assets at end of period (in 000’s) | $ 754 | $ 561 | $ 479 | $ 207 | $ 227 | $ 137 | |||||
| * | Unaudited. |
| †† | Annualized. |
| (a) | Per share data based on average shares outstanding during the period. |
| (b) | Total investment return is calculated exclusive of sales charges and assumes the reinvestment of dividends and distributions. Class R3 shares are not subject to sales charges. For periods of less than one year, total return is not annualized. |
| (c) | In addition to the fees and expenses which the Fund bears directly, it also indirectly bears a pro-rata share of the fees and expenses of the underlying funds in which it invests. Such indirect expenses are not included in the above expense ratios. |
| Six months ended April 30, 2023* | Year Ended October 31, | April 26, 2021^ through October 31, | |||
| Class R6 | 2022 | 2021 | |||
| Net asset value at beginning of period | $ 30.24 | $ 37.00 | $ 33.07 | ||
| Net investment income (loss) (a) | 0.15 | 0.16 | 0.14 | ||
| Net realized and unrealized gain (loss) | 1.27 | (3.77) | 3.79 | ||
| Total from investment operations | 1.42 | (3.61) | 3.93 | ||
| Less distributions: | |||||
| From net investment income | (0.18) | (0.12) | — | ||
| From net realized gain on investments | (1.10) | (3.03) | — | ||
| Total distributions | (1.28) | (3.15) | — | ||
| Net asset value at end of period | $ 30.38 | $ 30.24 | $ 37.00 | ||
| Total investment return (b) | 4.66% | (10.69)% | 11.88% | ||
| Ratios (to average net assets)/Supplemental Data: | |||||
| Net investment income (loss) | 0.98%†† | 0.50% | 0.44%†† | ||
| Net expenses (c) | 0.61%†† | 0.63% | 0.60%†† | ||
| Portfolio turnover rate | 3% | 2% | 24% | ||
| Net assets at end of period (in 000’s) | $ 259,428 | $ 196,860 | $ 262,843 |
| * | Unaudited. |
| ^ | Inception date. |
| †† | Annualized. |
| (a) | Per share data based on average shares outstanding during the period. |
| (b) | Total investment return is calculated exclusive of sales charges and assumes the reinvestment of dividends and distributions. Class R6 shares are not subject to sales charges. For periods of less than one year, total return is not annualized. |
| (c) | In addition to the fees and expenses which the Fund bears directly, it also indirectly bears a pro-rata share of the fees and expenses of the underlying funds in which it invests. Such indirect expenses are not included in the above expense ratios. |
| 20 | MainStay WMC Enduring Capital Fund |
| Class | Commenced Operations |
| Class A | June 1, 1998 |
| Investor Class | February 28, 2008 |
| Class B | June 1, 1998 |
| Class C | September 1, 1998 |
| Class I | December 28, 2004 |
| Class R3 | February 29, 2016 |
| Class R6 | April 26, 2021 |
| • | Level 1—quoted prices (unadjusted) in active markets for an identical asset or liability |
| • | Level 2—other significant observable inputs (including quoted prices for a similar asset or liability in active markets, interest rates and yield curves, prepayment speeds, credit risk, etc.) |
| • | Level 3—significant unobservable inputs (including the Fund's own assumptions about the assumptions that market participants would use in measuring fair value of an asset or liability) |
| • Broker/dealer quotes | • Benchmark securities |
| • Two-sided markets | • Reference data (corporate actions or material event notices) |
| • Bids/offers | • Monthly payment information |
| • Industry and economic events | • Reported trades |
| 22 | MainStay WMC Enduring Capital Fund |
| 24 | MainStay WMC Enduring Capital Fund |
| Class R3 | $341 |
| Class | Expense | Waived |
| Class A | $77,805 | $— |
| Investor Class | 35,978 | — |
| Class B | 3,911 | — |
| Class C | 33,805 | — |
| Class I | 35,730 | — |
| Class R3 | 262 | — |
| Class R6 | 4,874 | — |
| Class R3 | $55,753 | 7.4% |
| Class R6 | 39,654 | 0.0‡ |
| ‡ | Less than one-tenth of a percent. |
| Federal Tax Cost | Gross Unrealized Appreciation | Gross Unrealized (Depreciation) | Net Unrealized Appreciation/ (Depreciation) | |
| Investments in Securities | $535,412,626 | $105,831,099 | $(33,129,644) | $72,701,455 |
| 2022 | |
| Distributions paid from: | |
| Ordinary Income | $24,964,525 |
| Long-Term Capital Gains | 33,082,933 |
| Total | $58,047,458 |
| 26 | MainStay WMC Enduring Capital Fund |
| Class A | Shares | Amount |
| Six-month period ended April 30, 2023: | ||
| Shares sold | 458,224 | $ 13,917,612 |
| Shares issued to shareholders in reinvestment of distributions | 247,479 | 7,533,253 |
| Shares redeemed | (518,307) | (15,724,838) |
| Net increase (decrease) in shares outstanding before conversion | 187,396 | 5,726,027 |
| Shares converted into Class A (See Note 1) | 40,468 | 1,194,067 |
| Shares converted from Class A (See Note 1) | (151) | (4,661) |
| Net increase (decrease) | 227,713 | $ 6,915,433 |
| Year ended October 31, 2022: | ||
| Shares sold | 964,328 | $ 31,211,920 |
| Shares issued to shareholders in reinvestment of distributions | 549,149 | 18,594,184 |
| Shares redeemed | (1,313,198) | (41,861,145) |
| Net increase (decrease) in shares outstanding before conversion | 200,279 | 7,944,959 |
| Shares converted into Class A (See Note 1) | 118,908 | 3,952,416 |
| Shares converted from Class A (See Note 1) | (2,122) | (64,560) |
| Net increase (decrease) | 317,065 | $ 11,832,815 |
| Investor Class | Shares | Amount |
| Six-month period ended April 30, 2023: | ||
| Shares sold | 15,868 | $ 478,536 |
| Shares issued to shareholders in reinvestment of distributions | 28,225 | 859,163 |
| Shares redeemed | (36,794) | (1,114,439) |
| Net increase (decrease) in shares outstanding before conversion | 7,299 | 223,260 |
| Shares converted into Investor Class (See Note 1) | 9,920 | 311,945 |
| Shares converted from Investor Class (See Note 1) | (20,682) | (609,051) |
| Net increase (decrease) | (3,463) | $ (73,846) |
| Year ended October 31, 2022: | ||
| Shares sold | 35,401 | $ 1,145,205 |
| Shares issued to shareholders in reinvestment of distributions | 70,920 | 2,401,347 |
| Shares redeemed | (70,871) | (2,264,176) |
| Net increase (decrease) in shares outstanding before conversion | 35,450 | 1,282,376 |
| Shares converted into Investor Class (See Note 1) | 21,377 | 677,516 |
| Shares converted from Investor Class (See Note 1) | (87,635) | (2,969,099) |
| Net increase (decrease) | (30,808) | $ (1,009,207) |
| Class B | Shares | Amount |
| Six-month period ended April 30, 2023: | ||
| Shares issued to shareholders in reinvestment of distributions | 4,112 | $ 109,752 |
| Shares redeemed | (9,656) | (249,926) |
| Net increase (decrease) in shares outstanding before conversion | (5,544) | (140,174) |
| Shares converted from Class B (See Note 1) | (18,319) | (489,085) |
| Net increase (decrease) | (23,863) | $ (629,259) |
| Year ended October 31, 2022: | ||
| Shares sold | 1,841 | $ 53,478 |
| Shares issued to shareholders in reinvestment of distributions | 14,748 | 443,192 |
| Shares redeemed | (23,125) | (653,846) |
| Net increase (decrease) in shares outstanding before conversion | (6,536) | (157,176) |
| Shares converted from Class B (See Note 1) | (38,436) | (1,074,180) |
| Net increase (decrease) | (44,972) | $ (1,231,356) |
| Class C | Shares | Amount |
| Six-month period ended April 30, 2023: | ||
| Shares sold | 21,892 | $ 580,073 |
| Shares issued to shareholders in reinvestment of distributions | 34,072 | 908,718 |
| Shares redeemed | (147,486) | (3,915,645) |
| Net increase (decrease) in shares outstanding before conversion | (91,522) | (2,426,854) |
| Shares converted from Class C (See Note 1) | (15,064) | (393,636) |
| Net increase (decrease) | (106,586) | $ (2,820,490) |
| Year ended October 31, 2022: | ||
| Shares sold | 24,436 | $ 690,062 |
| Shares issued to shareholders in reinvestment of distributions | 108,949 | 3,270,638 |
| Shares redeemed | (352,310) | (10,083,915) |
| Net increase (decrease) in shares outstanding before conversion | (218,925) | (6,123,215) |
| Shares converted from Class C (See Note 1) | (21,155) | (586,653) |
| Net increase (decrease) | (240,080) | $ (6,709,868) |
| Class I | Shares | Amount |
| Six-month period ended April 30, 2023: | ||
| Shares sold | 972,488 | $ 29,616,100 |
| Shares issued to shareholders in reinvestment of distributions | 120,167 | 3,678,308 |
| Shares redeemed | (355,306) | (10,814,408) |
| Net increase (decrease) in shares outstanding before conversion | 737,349 | 22,480,000 |
| Shares converted into Class I (See Note 1) | 150 | 4,661 |
| Shares converted from Class I (See Note 1) | (466) | (14,240) |
| Net increase (decrease) | 737,033 | $ 22,470,421 |
| Year ended October 31, 2022: | ||
| Shares sold | 981,052 | $ 32,552,040 |
| Shares issued to shareholders in reinvestment of distributions | 299,886 | 10,205,117 |
| Shares redeemed | (2,493,569) | (85,095,425) |
| Net increase (decrease) in shares outstanding before conversion | (1,212,631) | (42,338,268) |
| Shares converted into Class I (See Note 1) | 2,107 | 64,560 |
| Net increase (decrease) | (1,210,524) | $(42,273,708) |
| Class R3 | Shares | Amount |
| Six-month period ended April 30, 2023: | ||
| Shares sold | 6,029 | $ 179,258 |
| Shares issued to shareholders in reinvestment of distributions | 590 | 17,802 |
| Shares redeemed | (276) | (8,222) |
| Net increase (decrease) | 6,343 | $ 188,838 |
| Year ended October 31, 2022: | ||
| Shares sold | 8,459 | $ 246,328 |
| Shares issued to shareholders in reinvestment of distributions | 993 | 33,389 |
| Shares redeemed | (3,717) | (113,830) |
| Net increase (decrease) | 5,735 | $ 165,887 |
| Class R6 | Shares | Amount |
| Six-month period ended April 30, 2023: | ||
| Shares sold | 2,095,234 | $ 64,032,715 |
| Shares issued to shareholders in reinvestment of distributions | 270,980 | 8,289,276 |
| Shares redeemed | (336,999) | (10,326,434) |
| Net increase (decrease) | 2,029,215 | $ 61,995,557 |
| Year ended October 31, 2022: | ||
| Shares sold | 628,462 | $ 20,556,193 |
| Shares issued to shareholders in reinvestment of distributions | 658,656 | 22,407,486 |
| Shares redeemed | (1,881,346) | (61,194,703) |
| Net increase (decrease) | (594,228) | $(18,231,024) |
| 28 | MainStay WMC Enduring Capital Fund |
| 30 | MainStay WMC Enduring Capital Fund |
| 32 | MainStay WMC Enduring Capital Fund |
| 34 | MainStay WMC Enduring Capital Fund |
| 36 | MainStay WMC Enduring Capital Fund |
1.
| 2. | This Fund is registered for sale in CA, CT, DE, FL, MA, NJ, NY and VT. |
| 3. | An affiliate of New York Life Investment Management LLC. |
| 5022305MS043-23 | MSWEC10-06/23 |
please log in to newyorklifeinvestments.com/accounts.
| Not FDIC/NCUA Insured | Not a Deposit | May Lose Value | No Bank Guarantee | Not Insured by Any Government Agency |


President
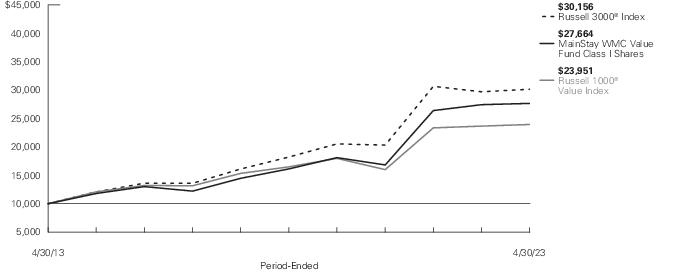
| Average Annual Total Returns for the Period-Ended April 30, 2023 | ||||||||
| Class | Sales Charge | Inception Date1 | Six Months2 | One Year | Five Years | Ten Years or Since Inception | Gross Expense Ratio3 | |
| Class A Shares | Maximum 5.50% Initial Sales Charge | With sales charges | 6/9/1999 | -4.56% | -5.00% | 9.83% | 9.80% | 1.02% |
| Excluding sales charges | 1.00 | 0.53 | 11.08 | 10.42 | 1.02 | |||
| Investor Class Shares4 | Maximum 5.00% Initial Sales Charge | With sales charges | 2/28/2008 | -4.20 | -4.74 | 9.55 | 9.56 | 1.26 |
| Excluding sales charges | 0.84 | 0.27 | 10.80 | 10.18 | 1.26 | |||
| Class B Shares5 | Maximum 5.00% CDSC | With sales charges | 6/9/1999 | -4.21 | -5.10 | 9.82 | 9.36 | 2.01 |
| if Redeemed Within the First Six Years of Purchase | Excluding sales charges | 0.47 | -0.46 | 9.96 | 9.36 | 2.01 | ||
| Class C Shares | Maximum 1.00% CDSC | With sales charges | 6/9/1999 | -0.47 | -1.39 | 9.97 | 9.36 | 2.01 |
| if Redeemed Within One Year of Purchase | Excluding sales charges | 0.47 | -0.46 | 9.97 | 9.36 | 2.01 | ||
| Class I Shares | No Sales Charge | 1/21/1971 | 1.13 | 0.83 | 11.39 | 10.71 | 0.77 | |
| Class R1 Shares | No Sales Charge | 1/2/2004 | 1.05 | 0.66 | 11.25 | 10.59 | 0.87 | |
| Class R2 Shares | No Sales Charge | 1/2/2004 | 0.95 | 0.42 | 10.97 | 10.31 | 1.12 | |
| Class R3 Shares | No Sales Charge | 4/28/2006 | 0.81 | 0.17 | 10.69 | 10.03 | 1.37 | |
| Class R6 Shares | No Sales Charge | 4/26/2021 | 1.13 | 0.83 | N/A | 2.61 | 0.70 | |
| 1. | Effective April 26, 2021, the Fund replaced its subadvisor, changed its investment objective and modified its principal investment strategies. Therefore, the performance information shown in this report prior to April 26, 2021, reflects that of the Fund’s prior subadvisor, investment objective and principal investment strategies. |
| 2. | Not annualized. |
| 3. | The gross expense ratios presented reflect the Fund’s “Total Annual Fund Operating Expenses” from the most recent Prospectus, as supplemented, and may differ from other expense ratios disclosed in this report. |
| 4. | Prior to June 30, 2020, the maximum initial sales charge was 5.50%, which is reflected in the applicable average annual total return figures shown. |
| 5. | Class B shares are closed to all new purchases as well as additional investments by existing Class B shareholders. |
| Benchmark Performance* | Six Months1 | One Year | Five Years | Ten Years |
| Russell 1000® Value Index2 | 4.54% | 1.21% | 7.75% | 9.13% |
| Morningstar Large Value Category Average3 | 3.89 | 1.38 | 7.89 | 9.02 |
| * | Returns for indices reflect no deductions for fees, expenses or taxes, except for foreign withholding taxes where applicable. Results assume reinvestment of all dividends and capital gains. An investment cannot be made directly in an index. |
| 1. | Not annualized. |
| 2. | The Fund has selected the Russell 1000® Value Index as its primary benchmark as a replacement for the Russell 3000® Index because it believes that the Russell 1000® Value Index is more reflective of its principal investment strategies. The Russell 1000® Value Index measures the performance of the large-cap value segment of the U.S. equity universe. It includes those Russell 1000® Index companies with lower price-to-book ratios and lower expected growth values. |
| 3. | The Morningstar Large Value Category Average is representative of funds that invest primarily in big U.S. companies that are less expensive or growing more slowly than other large-cap stocks. Results are based on average total returns of similar funds with all dividends and capital gain distributions reinvested. |
| 6 | MainStay WMC Value Fund |
| Share Class | Beginning Account Value 11/1/22 | Ending Account Value (Based on Actual Returns and Expenses) 4/30/23 | Expenses Paid During Period1 | Ending Account Value (Based on Hypothetical 5% Annualized Return and Actual Expenses) 4/30/23 | Expenses Paid During Period1 | Net Expense Ratio During Period2 |
| Class A Shares | $1,000.00 | $1,010.00 | $ 5.13 | $1,019.69 | $ 5.16 | 1.03% |
| Investor Class Shares | $1,000.00 | $1,008.40 | $ 6.47 | $1,018.35 | $ 6.51 | 1.30% |
| Class B Shares | $1,000.00 | $1,004.70 | $10.19 | $1,014.63 | $10.24 | 2.05% |
| Class C Shares | $1,000.00 | $1,004.70 | $10.19 | $1,014.63 | $10.24 | 2.05% |
| Class I Shares | $1,000.00 | $1,011.30 | $ 3.49 | $1,021.32 | $ 3.51 | 0.70% |
| Class R1 Shares | $1,000.00 | $1,010.50 | $ 4.39 | $1,020.43 | $ 4.41 | 0.88% |
| Class R2 Shares | $1,000.00 | $1,009.50 | $ 5.63 | $1,019.19 | $ 5.66 | 1.13% |
| Class R3 Shares | $1,000.00 | $1,008.10 | $ 6.87 | $1,017.95 | $ 6.90 | 1.38% |
| Class R6 Shares | $1,000.00 | $1,011.30 | $ 3.49 | $1,021.32 | $ 3.51 | 0.70% |
| 1. | Expenses are equal to the Fund’s annualized expense ratio of each class multiplied by the average account value over the period, divided by 365 and multiplied by 181 (to reflect the six-month period). The table above represents the actual expenses incurred during the six-month period. In addition to the fees and expenses which the Fund bears directly, it also indirectly bears a pro rata share of the fees and expenses of the underlying funds in which it invests. Such indirect expenses are not included in the above-reported expense figures. |
| 2. | Expenses are equal to the Fund's annualized expense ratio to reflect the six-month period. |
| Pharmaceuticals | 9.2% |
| Banks | 8.1 |
| Oil, Gas & Consumable Fuels | 7.5 |
| Capital Markets | 6.6 |
| Health Care Providers & Services | 5.4 |
| Insurance | 5.2 |
| Semiconductors & Semiconductor Equipment | 4.2 |
| Aerospace & Defense | 4.2 |
| Communications Equipment | 3.8 |
| Health Care Equipment & Supplies | 3.1 |
| Building Products | 2.9 |
| Food Products | 2.9 |
| Interactive Media & Services | 2.5 |
| Specialty Retail | 2.2 |
| Health Care REITs | 1.8 |
| Electronic Equipment, Instruments & Components | 1.6 |
| Specialized REITs | 1.5 |
| Entertainment | 1.5 |
| Personal Care Products | 1.5 |
| Multi–Utilities | 1.5 |
| Electric Utilities | 1.4 |
| Distributors | 1.3% |
| Gas Utilities | 1.3 |
| Automobile Components | 1.3 |
| Machinery | 1.2 |
| Real Estate Management & Development | 1.2 |
| Chemicals | 1.2 |
| Electrical Equipment | 1.2 |
| Diversified Consumer Services | 1.2 |
| Financial Services | 1.2 |
| IT Services | 1.1 |
| Hotel & Resort REITs | 1.1 |
| Household Durables | 1.1 |
| Independent Power and Renewable Electricity Producers | 1.1 |
| Beverages | 1.1 |
| Media | 1.1 |
| Containers & Packaging | 1.0 |
| Ground Transportation | 1.0 |
| Short–Term Investment | 1.5 |
| Other Assets, Less Liabilities | 0.2 |
| 100.0% |
| 1. | JPMorgan Chase & Co. |
| 2. | Pfizer, Inc. |
| 3. | Cisco Systems, Inc. |
| 4. | Alphabet, Inc., Class C |
| 5. | Merck & Co., Inc. |
| 6. | ConocoPhillips |
| 7. | Elevance Health, Inc. |
| 8. | MetLife, Inc. |
| 9. | M&T Bank Corp. |
| 10. | Raytheon Technologies Corp. |
| 8 | MainStay WMC Value Fund |
| 1. | See "Investment and Performance Comparison" for other share class returns, which may be higher or lower than Class I share returns, and for more information on benchmark and peer group returns. |
| Shares | Value | |
| Common Stocks 98.3% | ||
| Aerospace & Defense 4.2% | ||
| General Dynamics Corp. | 58,973 | $ 12,876,165 |
| L3Harris Technologies, Inc. | 60,051 | 11,718,952 |
| Raytheon Technologies Corp. | 185,993 | 18,580,701 |
| 43,175,818 | ||
| Automobile Components 1.3% | ||
| Gentex Corp. | 467,233 | 12,890,958 |
| Banks 8.1% | ||
| JPMorgan Chase & Co. | 257,316 | 35,571,364 |
| M&T Bank Corp. | 150,905 | 18,983,849 |
| New York Community Bancorp, Inc. | 941,200 | 10,061,428 |
| PNC Financial Services Group, Inc. (The) | 140,272 | 18,270,428 |
| 82,887,069 | ||
| Beverages 1.1% | ||
| Keurig Dr Pepper, Inc. | 333,312 | 10,899,302 |
| Building Products 2.9% | ||
| Fortune Brands Innovations, Inc. | 193,113 | 12,492,480 |
| Johnson Controls International plc | 296,590 | 17,747,946 |
| 30,240,426 | ||
| Capital Markets 6.6% | ||
| Ares Management Corp. | 187,367 | 16,411,476 |
| Blackstone, Inc. | 110,539 | 9,874,449 |
| LPL Financial Holdings, Inc. | 43,550 | 9,094,982 |
| Morgan Stanley | 198,058 | 17,819,278 |
| Raymond James Financial, Inc. | 155,455 | 14,073,341 |
| 67,273,526 | ||
| Chemicals 1.2% | ||
| Axalta Coating Systems Ltd. (a) | 391,654 | 12,364,517 |
| Communications Equipment 3.8% | ||
| Cisco Systems, Inc. | 546,773 | 25,835,024 |
| F5, Inc. (a) | 94,606 | 12,711,262 |
| 38,546,286 | ||
| Containers & Packaging 1.0% | ||
| Sealed Air Corp. | 221,289 | 10,619,659 |
| Distributors 1.3% | ||
| LKQ Corp. | 235,015 | 13,567,416 |
| Shares | Value | |
| Diversified Consumer Services 1.2% | ||
| H&R Block, Inc. | 359,641 | $ 12,195,426 |
| Electric Utilities 1.4% | ||
| Exelon Corp. | 338,788 | 14,378,163 |
| Electrical Equipment 1.2% | ||
| Emerson Electric Co. | 146,743 | 12,217,822 |
| Electronic Equipment, Instruments & Components 1.6% | ||
| Corning, Inc. | 500,952 | 16,641,625 |
| Entertainment 1.5% | ||
| Electronic Arts, Inc. | 121,884 | 15,513,396 |
| Financial Services 1.2% | ||
| Global Payments, Inc. | 105,450 | 11,885,270 |
| Food Products 2.9% | ||
| Archer-Daniels-Midland Co. | 175,574 | 13,708,818 |
| Mondelez International, Inc., Class A | 206,511 | 15,843,524 |
| 29,552,342 | ||
| Gas Utilities 1.3% | ||
| Atmos Energy Corp. | 115,908 | 13,229,739 |
| Ground Transportation 1.0% | ||
| Knight-Swift Transportation Holdings, Inc. | 187,910 | 10,583,091 |
| Health Care Equipment & Supplies 3.1% | ||
| Becton Dickinson & Co. | 64,807 | 17,129,138 |
| Boston Scientific Corp. (a) | 283,839 | 14,793,689 |
| 31,922,827 | ||
| Health Care Providers & Services 5.4% | ||
| Centene Corp. (a) | 258,564 | 17,822,817 |
| Elevance Health, Inc. | 43,967 | 20,605,135 |
| UnitedHealth Group, Inc. | 34,961 | 17,203,958 |
| 55,631,910 | ||
| Health Care REITs 1.8% | ||
| Welltower, Inc. | 228,388 | 18,092,897 |
| Hotel & Resort REITs 1.1% | ||
| Host Hotels & Resorts, Inc. | 705,060 | 11,400,820 |
| 10 | MainStay WMC Value Fund |
| Shares | Value | |
| Common Stocks (continued) | ||
| Household Durables 1.1% | ||
| Lennar Corp., Class A | 99,758 | $ 11,253,700 |
| Independent Power and Renewable Electricity Producers 1.1% | ||
| AES Corp. (The) | 467,894 | 11,070,372 |
| Insurance 5.2% | ||
| American International Group, Inc. | 317,967 | 16,864,970 |
| Chubb Ltd. | 85,274 | 17,187,827 |
| MetLife, Inc. | 316,896 | 19,435,232 |
| 53,488,029 | ||
| Interactive Media & Services 2.5% | ||
| Alphabet, Inc., Class C (a) | 238,378 | 25,797,267 |
| IT Services 1.1% | ||
| Amdocs Ltd. | 128,724 | 11,746,065 |
| Machinery 1.2% | ||
| Middleby Corp. (The) (a) | 89,359 | 12,588,896 |
| Media 1.1% | ||
| Omnicom Group, Inc. | 119,426 | 10,816,413 |
| Multi-Utilities 1.5% | ||
| Sempra Energy | 97,365 | 15,139,284 |
| Oil, Gas & Consumable Fuels 7.5% | ||
| ConocoPhillips | 202,209 | 20,805,284 |
| Coterra Energy, Inc. | 565,042 | 14,465,075 |
| Diamondback Energy, Inc. | 84,822 | 12,061,689 |
| EOG Resources, Inc. | 115,936 | 13,850,874 |
| Phillips 66 | 163,839 | 16,220,061 |
| 77,402,983 | ||
| Personal Care Products 1.5% | ||
| Unilever plc, Sponsored ADR | 276,700 | 15,365,151 |
| Pharmaceuticals 9.2% | ||
| AstraZeneca plc, Sponsored ADR | 210,136 | 15,386,158 |
| Eli Lilly and Co. | 45,573 | 18,040,528 |
| Shares | Value | ||
| Pharmaceuticals (continued) | |||
| Merck & Co., Inc. | 203,807 | $ 23,533,594 | |
| Pfizer, Inc. | 674,812 | 26,243,439 | |
| Roche Holding AG | 35,626 | 11,173,853 | |
| 94,377,572 | |||
| Real Estate Management & Development 1.2% | |||
| CBRE Group, Inc., Class A (a) | 162,299 | 12,441,841 | |
| Semiconductors & Semiconductor Equipment 4.2% | |||
| Analog Devices, Inc. | 96,666 | 17,388,280 | |
| NXP Semiconductors NV | 69,880 | 11,442,151 | |
| QUALCOMM, Inc. | 126,432 | 14,767,258 | |
| 43,597,689 | |||
| Specialized REITs 1.5% | |||
| Gaming and Leisure Properties, Inc. | 304,629 | 15,840,708 | |
| Specialty Retail 2.2% | |||
| Home Depot, Inc. (The) | 53,908 | 16,201,510 | |
| Victoria's Secret & Co. (a) | 218,087 | 6,762,878 | |
| 22,964,388 | |||
| Total Common Stocks (Cost $928,905,752) | 1,009,600,663 | ||
| Short-Term Investment 1.5% | |||
| Affiliated Investment Company 1.5% | |||
| MainStay U.S. Government Liquidity Fund, 3.98% (b) | 15,243,503 | 15,243,503 | |
| Total Short-Term Investment (Cost $15,243,503) | 15,243,503 | ||
| Total Investments (Cost $944,149,255) | 99.8% | 1,024,844,166 | |
| Other Assets, Less Liabilities | 0.2 | 2,274,025 | |
| Net Assets | 100.0% | $ 1,027,118,191 | |
| † | Percentages indicated are based on Fund net assets. |
| ^ | Industry classifications may be different than those used for compliance monitoring purposes. |
| (a) | Non-income producing security. |
| (b) | Current yield as of April 30, 2023. |
| Affiliated Investment Companies | Value, Beginning of Period | Purchases at Cost | Proceeds from Sales | Net Realized Gain/(Loss) on Sales | Change in Unrealized Appreciation/ (Depreciation) | Value, End of Period | Dividend Income | Other Distributions | Shares End of Period |
| MainStay U.S. Government Liquidity Fund | $ 41,010 | $ 69,240 | $ (95,006) | $ — | $ — | $ 15,244 | $ 369 | $ — | 15,244 |
| Abbreviation(s): |
| ADR—American Depositary Receipt |
| Description | Quoted Prices in Active Markets for Identical Assets (Level 1) | Significant Other Observable Inputs (Level 2) | Significant Unobservable Inputs (Level 3) | Total | |||
| Asset Valuation Inputs | |||||||
| Investments in Securities (a) | |||||||
| Common Stocks | $ 1,009,600,663 | $ — | $ — | $ 1,009,600,663 | |||
| Short-Term Investment | |||||||
| Affiliated Investment Company | 15,243,503 | — | — | 15,243,503 | |||
| Total Investments in Securities | $ 1,024,844,166 | $ — | $ — | $ 1,024,844,166 |
| (a) | For a complete listing of investments and their industries, see the Portfolio of Investments. |
| 12 | MainStay WMC Value Fund |
| Assets | |
| Investment in unaffiliated securities, at value (identified cost $928,905,752) | $1,009,600,663 |
| Investment in affiliated investment companies, at value (identified cost $15,243,503) | 15,243,503 |
| Cash | 63 |
| Receivables: | |
| Investment securities sold | 11,982,123 |
| Fund shares sold | 1,302,864 |
| Dividends | 1,070,912 |
| Other assets | 119,152 |
| Total assets | 1,039,319,280 |
| Liabilities | |
| Payables: | |
| Investment securities purchased | 10,827,319 |
| Manager (See Note 3) | 540,915 |
| Fund shares redeemed | 460,880 |
| NYLIFE Distributors (See Note 3) | 136,392 |
| Transfer agent (See Note 3) | 117,811 |
| Shareholder communication | 77,138 |
| Professional fees | 33,691 |
| Custodian | 6,560 |
| Securities lending | 329 |
| Accrued expenses | 54 |
| Total liabilities | 12,201,089 |
| Net assets | $1,027,118,191 |
| Composition of Net Assets | |
| Shares of beneficial interest outstanding (par value of $.01 per share) unlimited number of shares authorized | $ 374,846 |
| Additional paid-in-capital | 948,305,335 |
| 948,680,181 | |
| Total distributable earnings (loss) | 78,438,010 |
| Net assets | $1,027,118,191 |
| Class A | |
| Net assets applicable to outstanding shares | $523,212,545 |
| Shares of beneficial interest outstanding | 19,507,417 |
| Net asset value per share outstanding | $ 26.82 |
| Maximum sales charge (5.50% of offering price) | 1.56 |
| Maximum offering price per share outstanding | $ 28.38 |
| Investor Class | |
| Net assets applicable to outstanding shares | $ 54,616,779 |
| Shares of beneficial interest outstanding | 2,035,145 |
| Net asset value per share outstanding | $ 26.84 |
| Maximum sales charge (5.00% of offering price) | 1.41 |
| Maximum offering price per share outstanding | $ 28.25 |
| Class B | |
| Net assets applicable to outstanding shares | $ 6,319,240 |
| Shares of beneficial interest outstanding | 332,688 |
| Net asset value and offering price per share outstanding | $ 18.99 |
| Class C | |
| Net assets applicable to outstanding shares | $ 15,348,168 |
| Shares of beneficial interest outstanding | 807,517 |
| Net asset value and offering price per share outstanding | $ 19.01 |
| Class I | |
| Net assets applicable to outstanding shares | $159,139,723 |
| Shares of beneficial interest outstanding | 5,501,367 |
| Net asset value and offering price per share outstanding | $ 28.93 |
| Class R1 | |
| Net assets applicable to outstanding shares | $ 170,473 |
| Shares of beneficial interest outstanding | 6,236 |
| Net asset value and offering price per share outstanding | $ 27.34 |
| Class R2 | |
| Net assets applicable to outstanding shares | $ 1,046,040 |
| Shares of beneficial interest outstanding | 38,455 |
| Net asset value and offering price per share outstanding | $ 27.20 |
| Class R3 | |
| Net assets applicable to outstanding shares | $ 1,319,267 |
| Shares of beneficial interest outstanding | 49,088 |
| Net asset value and offering price per share outstanding | $ 26.88 |
| Class R6 | |
| Net assets applicable to outstanding shares | $265,945,956 |
| Shares of beneficial interest outstanding | 9,206,729 |
| Net asset value and offering price per share outstanding | $ 28.89 |
| Investment Income (Loss) | |
| Income | |
| Dividends-unaffiliated (net of foreign tax withholding of $73,912) | $12,945,033 |
| Dividends-affiliated | 369,385 |
| Securities lending, net | 3,023 |
| Other | 12 |
| Total income | 13,317,453 |
| Expenses | |
| Manager (See Note 3) | 3,369,895 |
| Distribution/Service—Class A (See Note 3) | 653,822 |
| Distribution/Service—Investor Class (See Note 3) | 69,154 |
| Distribution/Service—Class B (See Note 3) | 35,873 |
| Distribution/Service—Class C (See Note 3) | 73,611 |
| Distribution/Service—Class R2 (See Note 3) | 1,292 |
| Distribution/Service—Class R3 (See Note 3) | 3,787 |
| Transfer agent (See Note 3) | 401,106 |
| Registration | 95,156 |
| Professional fees | 66,993 |
| Shareholder communication | 16,990 |
| Trustees | 11,880 |
| Custodian | 8,520 |
| Shareholder service (See Note 3) | 1,360 |
| Miscellaneous | 15,429 |
| Total expenses before waiver/reimbursement | 4,824,868 |
| Expense waiver/reimbursement from Manager (See Note 3) | (72,312) |
| Reimbursement from prior custodian(a) | (2,055) |
| Net expenses | 4,750,501 |
| Net investment income (loss) | 8,566,952 |
| Realized and Unrealized Gain (Loss) | |
| Net realized gain (loss) on: | |
| Unaffiliated investment transactions | (4,514,376) |
| Foreign currency transactions | 1,144 |
| Net realized gain (loss) | (4,513,232) |
| Net change in unrealized appreciation (depreciation) on: | |
| Unaffiliated investments | 6,267,766 |
| Translation of other assets and liabilities in foreign currencies | 9,794 |
| Net change in unrealized appreciation (depreciation) | 6,277,560 |
| Net realized and unrealized gain (loss) | 1,764,328 |
| Net increase (decrease) in net assets resulting from operations | $10,331,280 |
| (a) | Represents a refund for overbilling of custody fees. |
| 14 | MainStay WMC Value Fund |
for the six months ended April 30, 2023 (Unaudited) and the year ended October 31, 2022
| Six months ended April 30, 2023 | Year ended October 31, 2022 | |
| Increase (Decrease) in Net Assets | ||
| Operations: | ||
| Net investment income (loss) | $ 8,566,952 | $ 13,384,235 |
| Net realized gain (loss) | (4,513,232) | 43,070,782 |
| Net change in unrealized appreciation (depreciation) | 6,277,560 | (83,059,547) |
| Net increase (decrease) in net assets resulting from operations | 10,331,280 | (26,604,530) |
| Distributions to shareholders: | ||
| Class A | (29,416,342) | (254,684,263) |
| Investor Class | (3,013,210) | (30,552,543) |
| Class B | (545,950) | (7,017,069) |
| Class C | (977,214) | (6,589,112) |
| Class I | (8,145,019) | (44,509,475) |
| Class R1 | (9,920) | (21,242) |
| Class R2 | (56,602) | (492,154) |
| Class R3 | (81,173) | (528,702) |
| Class R6 | (14,701,579) | (161,084,996) |
| Total distributions to shareholders | (56,947,009) | (505,479,556) |
| Capital share transactions: | ||
| Net proceeds from sales of shares | 91,372,134 | 167,876,878 |
| Net asset value of shares issued to shareholders in reinvestment of distributions | 55,817,971 | 492,255,863 |
| Cost of shares redeemed | (87,131,074) | (213,638,603) |
| Increase (decrease) in net assets derived from capital share transactions | 60,059,031 | 446,494,138 |
| Net increase (decrease) in net assets | 13,443,302 | (85,589,948) |
| Net Assets | ||
| Beginning of period | 1,013,674,889 | 1,099,264,837 |
| End of period | $1,027,118,191 | $1,013,674,889 |
| Six months ended April 30, 2023* | Year Ended October 31, | ||||||||||
| Class A | 2022 | 2021 | 2020 | 2019 | 2018 | ||||||
| Net asset value at beginning of period | $ 28.11 | $ 55.21 | $ 39.49 | $ 42.24 | $ 41.20 | $ 43.76 | |||||
| Net investment income (loss) (a) | 0.21 | 0.36 | 0.30 | 0.21 | 0.26 | 0.23 | |||||
| Net realized and unrealized gain (loss) | 0.08 | (1.68) | 17.09 | 0.55 | 4.88 | 1.79 | |||||
| Total from investment operations | 0.29 | (1.32) | 17.39 | 0.76 | 5.14 | 2.02 | |||||
| Less distributions: | |||||||||||
| From net investment income | (0.42) | (0.38) | (0.25) | (0.31) | (0.28) | (0.21) | |||||
| From net realized gain on investments | (1.16) | (25.40) | (1.42) | (3.20) | (3.82) | (4.37) | |||||
| Total distributions | (1.58) | (25.78) | (1.67) | (3.51) | (4.10) | (4.58) | |||||
| Net asset value at end of period | $ 26.82 | $ 28.11 | $ 55.21 | $ 39.49 | $ 42.24 | $ 41.20 | |||||
| Total investment return (b) | 1.00% | (2.68)% | 45.14% | 1.66% | 13.54% | 4.88% | |||||
| Ratios (to average net assets)/Supplemental Data: | |||||||||||
| Net investment income (loss) | 1.58%†† | 1.21% | 0.60% | 0.55% | 0.67% | 0.57% | |||||
| Net expenses (c) | 1.03%††(d) | 1.02%(d) | 1.06% | 1.10%(e) | 1.11% | 1.10% | |||||
| Portfolio turnover rate | 14% | 37% | 23% | 16% | 20% | 15% | |||||
| Net assets at end of period (in 000’s) | $ 523,213 | $ 522,937 | $ 547,299 | $ 389,530 | $ 427,040 | $ 384,637 | |||||
| * | Unaudited. |
| †† | Annualized. |
| (a) | Per share data based on average shares outstanding during the period. |
| (b) | Total investment return is calculated exclusive of sales charges and assumes the reinvestment of dividends and distributions. For periods of less than one year, total return is not annualized. |
| (c) | In addition to the fees and expenses which the Fund bears directly, it also indirectly bears a pro-rata share of the fees and expenses of the underlying funds in which it invests. Such indirect expenses are not included in the above expense ratios. |
| (d) | Expense waiver/reimbursement less than 0.01%. |
| (e) | Net of interest expense which is less than one-tenth of a percent. |
| 16 | MainStay WMC Value Fund |
| Six months ended April 30, 2023* | Year Ended October 31, | ||||||||||
| Investor Class | 2022 | 2021 | 2020 | 2019 | 2018 | ||||||
| Net asset value at beginning of period | $ 28.09 | $ 55.08 | $ 39.40 | $ 42.17 | $ 41.15 | $ 43.68 | |||||
| Net investment income (loss) (a) | 0.18 | 0.29 | 0.14 | 0.10 | 0.18 | 0.17 | |||||
| Net realized and unrealized gain (loss) | 0.08 | (1.69) | 17.09 | 0.53 | 4.86 | 1.78 | |||||
| Total from investment operations | 0.26 | (1.40) | 17.23 | 0.63 | 5.04 | 1.95 | |||||
| Less distributions: | |||||||||||
| From net investment income | (0.35) | (0.19) | (0.13) | (0.20) | (0.20) | (0.11) | |||||
| From net realized gain on investments | (1.16) | (25.40) | (1.42) | (3.20) | (3.82) | (4.37) | |||||
| Total distributions | (1.51) | (25.59) | (1.55) | (3.40) | (4.02) | (4.48) | |||||
| Net asset value at end of period | $ 26.84 | $ 28.09 | $ 55.08 | $ 39.40 | $ 42.17 | $ 41.15 | |||||
| Total investment return (b) | 0.84% | (2.91)% | 44.73% | 1.35% | 13.27% | 4.69% | |||||
| Ratios (to average net assets)/Supplemental Data: | |||||||||||
| Net investment income (loss) | 1.31%†† | 0.97% | 0.28% | 0.25% | 0.46% | 0.39% | |||||
| Net expenses (c) | 1.30%††(d) | 1.26% | 1.36% | 1.40%(e) | 1.33% | 1.29% | |||||
| Expenses (before waiver/reimbursement) (c) | 1.30%†† | 1.26%(d) | 1.36% | 1.41% | 1.38% | 1.31% | |||||
| Portfolio turnover rate | 14% | 37% | 23% | 16% | 20% | 15% | |||||
| Net assets at end of period (in 000's) | $ 54,617 | $ 56,061 | $ 66,193 | $ 69,423 | $ 80,733 | $ 76,844 | |||||
| * | Unaudited. |
| †† | Annualized. |
| (a) | Per share data based on average shares outstanding during the period. |
| (b) | Total investment return is calculated exclusive of sales charges and assumes the reinvestment of dividends and distributions. For periods of less than one year, total return is not annualized. |
| (c) | In addition to the fees and expenses which the Fund bears directly, it also indirectly bears a pro-rata share of the fees and expenses of the underlying funds in which it invests. Such indirect expenses are not included in the above expense ratios. |
| (d) | Expense waiver/reimbursement less than 0.01%. |
| (e) | Net of interest expense which is less than one-tenth of a percent. |
| Six months ended April 30, 2023* | Year Ended October 31, | ||||||||||
| Class B | 2022 | 2021 | 2020 | 2019 | 2018 | ||||||
| Net asset value at beginning of period | $ 20.29 | $ 47.03 | $ 33.97 | $ 36.88 | $ 36.53 | $ 39.43 | |||||
| Net investment income (loss) (a) | 0.05 | 0.05 | (0.20) | (0.16) | (0.09) | (0.13) | |||||
| Net realized and unrealized gain (loss) | 0.06 | (1.39) | 14.68 | 0.45 | 4.26 | 1.60 | |||||
| Total from investment operations | 0.11 | (1.34) | 14.48 | 0.29 | 4.17 | 1.47 | |||||
| Less distributions: | |||||||||||
| From net investment income | (0.25) | — | — | — | — | — | |||||
| From net realized gain on investments | (1.16) | (25.40) | (1.42) | (3.20) | (3.82) | (4.37) | |||||
| Total distributions | (1.41) | (25.40) | (1.42) | (3.20) | (3.82) | (4.37) | |||||
| Net asset value at end of period | $ 18.99 | $ 20.29 | $ 47.03 | $ 33.97 | $ 36.88 | $ 36.53 | |||||
| Total investment return (b) | 0.47% | (3.66)% | 43.67% | 0.57% | 12.45% | 3.91% | |||||
| Ratios (to average net assets)/Supplemental Data: | |||||||||||
| Net investment income (loss) | 0.57%†† | 0.23% | (0.47)% | (0.48)% | (0.27)% | (0.35)% | |||||
| Net expenses (c) | 2.05%††(d) | 2.01% | 2.11% | 2.15%(e) | 2.08% | 2.04% | |||||
| Expenses (before waiver/reimbursement) (c) | 2.05%†† | 2.01%(d) | 2.11% | 2.16% | 2.13% | 2.06% | |||||
| Portfolio turnover rate | 14% | 37% | 23% | 16% | 20% | 15% | |||||
| Net assets at end of period (in 000’s) | $ 6,319 | $ 8,045 | $ 13,100 | $ 14,212 | $ 21,088 | $ 26,571 | |||||
| * | Unaudited. |
| †† | Annualized. |
| (a) | Per share data based on average shares outstanding during the period. |
| (b) | Total investment return is calculated exclusive of sales charges and assumes the reinvestment of dividends and distributions. For periods of less than one year, total return is not annualized. |
| (c) | In addition to the fees and expenses which the Fund bears directly, it also indirectly bears a pro-rata share of the fees and expenses of the underlying funds in which it invests. Such indirect expenses are not included in the above expense ratios. |
| (d) | Expense waiver/reimbursement less than 0.01%. |
| (e) | Net of interest expense which is less than one-tenth of a percent. |
| 18 | MainStay WMC Value Fund |
| Six months ended April 30, 2023* | Year Ended October 31, | ||||||||||
| Class C | 2022 | 2021 | 2020 | 2019 | 2018 | ||||||
| Net asset value at beginning of period | $ 20.30 | $ 47.04 | $ 33.98 | $ 36.88 | $ 36.53 | $ 39.43 | |||||
| Net investment income (loss) (a) | 0.05 | 0.05 | (0.21) | (0.16) | �� | (0.07) | (0.14) | ||||
| Net realized and unrealized gain (loss) | 0.07 | (1.39) | 14.69 | 0.46 | 4.24 | 1.61 | |||||
| Total from investment operations | 0.12 | (1.34) | 14.48 | 0.30 | 4.17 | 1.47 | |||||
| Less distributions: | |||||||||||
| From net investment income | (0.25) | — | — | — | — | — | |||||
| From net realized gain on investments | (1.16) | (25.40) | (1.42) | (3.20) | (3.82) | (4.37) | |||||
| Total distributions | (1.41) | (25.40) | (1.42) | (3.20) | (3.82) | (4.37) | |||||
| Net asset value at end of period | $ 19.01 | $ 20.30 | $ 47.04 | $ 33.98 | $ 36.88 | $ 36.53 | |||||
| Total investment return (b) | 0.47% | (3.66)% | 43.65% | 0.60% | 12.45% | 3.91% | |||||
| Ratios (to average net assets)/Supplemental Data: | |||||||||||
| Net investment income (loss) | 0.56%†† | 0.22% | (0.50)% | (0.48)% | (0.22)% | (0.36)% | |||||
| Net expenses (c) | 2.05%††(d) | 2.00% | 2.11% | 2.15%(e) | 2.07% | 2.04% | |||||
| Expenses (before waiver/reimbursement) (c) | 2.05%†† | 2.01% | 2.11% | 2.16% | 2.12% | 2.06% | |||||
| Portfolio turnover rate | 14% | 37% | 23% | 16% | 20% | 15% | |||||
| Net assets at end of period (in 000’s) | $ 15,348 | $ 14,564 | $ 11,119 | $ 14,315 | $ 22,933 | $ 65,288 | |||||
| * | Unaudited. |
| †† | Annualized. |
| (a) | Per share data based on average shares outstanding during the period. |
| (b) | Total investment return is calculated exclusive of sales charges and assumes the reinvestment of dividends and distributions. For periods of less than one year, total return is not annualized. |
| (c) | In addition to the fees and expenses which the Fund bears directly, it also indirectly bears a pro-rata share of the fees and expenses of the underlying funds in which it invests. Such indirect expenses are not included in the above expense ratios. |
| (d) | Expense waiver/reimbursement less than 0.01%. |
| (e) | Net of interest expense which is less than one-tenth of a percent. |
| Six months ended April 30, 2023* | Year Ended October 31, | ||||||||||
| Class I | 2022 | 2021 | 2020 | 2019 | 2018 | ||||||
| Net asset value at beginning of period | $ 30.24 | $ 57.43 | $ 40.99 | $ 43.71 | $ 42.51 | $ 45.00 | |||||
| Net investment income (loss) (a) | 0.28 | 0.48 | 0.30 | 0.32 | 0.38 | 0.36 | |||||
| Net realized and unrealized gain (loss) | 0.08 | (1.76) | 17.91 | 0.57 | 5.02 | 1.84 | |||||
| Total from investment operations | 0.36 | (1.28) | 18.21 | 0.89 | 5.40 | 2.20 | |||||
| Less distributions: | |||||||||||
| From net investment income | (0.51) | (0.51) | (0.35) | (0.41) | (0.38) | (0.32) | |||||
| From net realized gain on investments | (1.16) | (25.40) | (1.42) | (3.20) | (3.82) | (4.37) | |||||
| Total distributions | (1.67) | (25.91) | (1.77) | (3.61) | (4.20) | (4.69) | |||||
| Net asset value at end of period | $ 28.93 | $ 30.24 | $ 57.43 | $ 40.99 | $ 43.71 | $ 42.51 | |||||
| Total investment return (b) | 1.13% | (2.37)% | 45.57% | 1.92% | 13.80% | 5.17% | |||||
| Ratios (to average net assets)/Supplemental Data: | |||||||||||
| Net investment income (loss) | 1.91%†† | 1.51% | 0.61% | 0.81% | 0.93% | 0.83% | |||||
| Net expenses (c) | 0.70%†† | 0.70% | 0.82% | 0.85%(d) | 0.86% | 0.85% | |||||
| Expenses (before waiver/reimbursement) (c) | 0.78%†† | 0.77% | 0.83% | 0.85% | 0.86% | 0.85% | |||||
| Portfolio turnover rate | 14% | 37% | 23% | 16% | 20% | 15% | |||||
| Net assets at end of period (in 000’s) | $ 159,140 | $ 137,117 | $ 102,714 | $ 417,329 | $ 488,730 | $ 484,839 | |||||
| * | Unaudited. |
| †† | Annualized. |
| (a) | Per share data based on average shares outstanding during the period. |
| (b) | Total investment return is calculated exclusive of sales charges and assumes the reinvestment of dividends and distributions. Class I shares are not subject to sales charges. For periods of less than one year, total return is not annualized. |
| (c) | In addition to the fees and expenses which the Fund bears directly, it also indirectly bears a pro-rata share of the fees and expenses of the underlying funds in which it invests. Such indirect expenses are not included in the above expense ratios. |
| (d) | Net of interest expense which is less than one-tenth of a percent. |
| 20 | MainStay WMC Value Fund |
| Six months ended April 30, 2023* | Year Ended October 31, | ||||||||||
| Class R1 | 2022 | 2021 | 2020 | 2019 | 2018 | ||||||
| Net asset value at beginning of period | $ 28.67 | $ 55.81 | $ 39.90 | $ 42.64 | $ 41.53 | $ 44.07 | |||||
| Net investment income (loss) (a) | 0.24 | 0.37 | 0.38 | 0.27 | 0.33 | 0.37 | |||||
| Net realized and unrealized gain (loss) | 0.08 | (1.67) | 17.27 | 0.56 | 4.91 | 1.73 | |||||
| Total from investment operations | 0.32 | (1.30) | 17.65 | 0.83 | 5.24 | 2.10 | |||||
| Less distributions: | |||||||||||
| From net investment income | (0.49) | (0.44) | (0.32) | (0.37) | (0.31) | (0.27) | |||||
| From net realized gain on investments | (1.16) | (25.40) | (1.42) | (3.20) | (3.82) | (4.37) | |||||
| Total distributions | (1.65) | (25.84) | (1.74) | (3.57) | (4.13) | (4.64) | |||||
| Net asset value at end of period | $ 27.34 | $ 28.67 | $ 55.81 | $ 39.90 | $ 42.64 | $ 41.53 | |||||
| Total investment return (b) | 1.05% | (2.54)% | 45.37% | 1.82% | 13.71% | 5.05% | |||||
| Ratios (to average net assets)/Supplemental Data: | |||||||||||
| Net investment income (loss) | 1.72%†† | 1.24% | 0.75% | 0.69% | 0.83% | 0.88% | |||||
| Net expenses (c) | 0.88%††(d) | 0.87%(d) | 0.91% | 0.95%(e) | 0.96% | 0.95% | |||||
| Portfolio turnover rate | 14% | 37% | 23% | 16% | 20% | 15% | |||||
| Net assets at end of period (in 000’s) | $ 170 | $ 172 | $ 57 | $ 38 | $ 35 | $ 30 | |||||
| * | Unaudited. |
| †† | Annualized. |
| (a) | Per share data based on average shares outstanding during the period. |
| (b) | Total investment return is calculated exclusive of sales charges and assumes the reinvestment of dividends and distributions. Class R1 shares are not subject to sales charges. For periods of less than one year, total return is not annualized. |
| (c) | In addition to the fees and expenses which the Fund bears directly, it also indirectly bears a pro-rata share of the fees and expenses of the underlying funds in which it invests. Such indirect expenses are not included in the above expense ratios. |
| (d) | Expense waiver/reimbursement less than 0.01%. |
| (e) | Net of interest expense which is less than one-tenth of a percent. |
| Six months ended April 30, 2023* | Year Ended October 31, | ||||||||||
| Class R2 | 2022 | 2021 | 2020 | 2019 | 2018 | ||||||
| Net asset value at beginning of period | $ 28.47 | $ 55.57 | $ 39.74 | $ 42.48 | $ 41.38 | $ 43.93 | |||||
| Net investment income (loss) (a) | 0.20 | 0.33 | 0.25 | 0.18 | 0.23 | 0.21 | |||||
| Net realized and unrealized gain (loss) | 0.08 | (1.70) | 17.21 | 0.55 | 4.89 | 1.78 | |||||
| Total from investment operations | 0.28 | (1.37) | 17.46 | 0.73 | 5.12 | 1.99 | |||||
| Less distributions: | |||||||||||
| From net investment income | (0.39) | (0.33) | (0.21) | (0.27) | (0.20) | (0.17) | |||||
| From net realized gain on investments | (1.16) | (25.40) | (1.42) | (3.20) | (3.82) | (4.37) | |||||
| Total distributions | (1.55) | (25.73) | (1.63) | (3.47) | (4.02) | (4.54) | |||||
| Net asset value at end of period | $ 27.20 | $ 28.47 | $ 55.57 | $ 39.74 | $ 42.48 | $ 41.38 | |||||
| Total investment return (b) | 0.95% | (2.79)% | 45.01% | 1.57% | 13.42% | 4.77% | |||||
| Ratios (to average net assets)/Supplemental Data: | |||||||||||
| Net investment income (loss) | 1.48%†† | 1.10% | 0.50% | 0.45% | 0.59% | 0.50% | |||||
| Net expenses (c) | 1.13%††(d) | 1.12%(d) | 1.16% | 1.20%(e) | 1.21% | 1.20% | |||||
| Portfolio turnover rate | 14% | 37% | 23% | 16% | 20% | 15% | |||||
| Net assets at end of period (in 000’s) | $ 1,046 | $ 1,034 | $ 1,066 | $ 716 | $ 780 | $ 881 | |||||
| * | Unaudited. |
| †† | Annualized. |
| (a) | Per share data based on average shares outstanding during the period. |
| (b) | Total investment return is calculated exclusive of sales charges and assumes the reinvestment of dividends and distributions. Class R2 shares are not subject to sales charges. For periods of less than one year, total return is not annualized. |
| (c) | In addition to the fees and expenses which the Fund bears directly, it also indirectly bears a pro-rata share of the fees and expenses of the underlying funds in which it invests. Such indirect expenses are not included in the above expense ratios. |
| (d) | Expense waiver/reimbursement less than 0.01%. |
| (e) | Net of interest expense which is less than one-tenth of a percent. |
| 22 | MainStay WMC Value Fund |
| Six months ended April 30, 2023* | Year Ended October 31, | ||||||||||
| Class R3 | 2022 | 2021 | 2020 | 2019 | 2018 | ||||||
| Net asset value at beginning of period | $ 28.14 | $ 55.17 | $ 39.48 | $ 42.24 | $ 41.15 | $ 43.71 | |||||
| Net investment income (loss) (a) | 0.17 | 0.25 | 0.12 | 0.07 | 0.13 | 0.08 | |||||
| Net realized and unrealized gain (loss) | 0.08 | (1.69) | 17.12 | 0.54 | 4.87 | 1.79 | |||||
| Total from investment operations | 0.25 | (1.44) | 17.24 | 0.61 | 5.00 | 1.87 | |||||
| Less distributions: | |||||||||||
| From net investment income | (0.35) | (0.19) | (0.13) | (0.17) | (0.09) | (0.06) | |||||
| From net realized gain on investments | (1.16) | (25.40) | (1.42) | (3.20) | (3.82) | (4.37) | |||||
| Total distributions | (1.51) | (25.59) | (1.55) | (3.37) | (3.91) | (4.43) | |||||
| Net asset value at end of period | $ 26.88 | $ 28.14 | $ 55.17 | $ 39.48 | $ 42.24 | $ 41.15 | |||||
| Total investment return (b) | 0.81% | (3.03)% | 44.66% | 1.29% | 13.14% | 4.51% | |||||
| Ratios (to average net assets)/Supplemental Data: | |||||||||||
| Net investment income (loss) | 1.26%†† | 0.85% | 0.25% | 0.19% | 0.32% | 0.20% | |||||
| Net expenses (c) | 1.38%††(d) | 1.37%(d) | 1.42% | 1.45%(e) | 1.46% | 1.45% | |||||
| Portfolio turnover rate | 14% | 37% | 23% | 16% | 20% | 15% | |||||
| Net assets at end of period (in 000’s) | $ 1,319 | $ 1,471 | $ 1,137 | $ 2,442 | $ 2,314 | $ 1,931 | |||||
| * | Unaudited. |
| †† | Annualized. |
| (a) | Per share data based on average shares outstanding during the period. |
| (b) | Total investment return is calculated exclusive of sales charges and assumes the reinvestment of dividends and distributions. Class R3 shares are not subject to sales charges. For periods of less than one year, total return is not annualized. |
| (c) | In addition to the fees and expenses which the Fund bears directly, it also indirectly bears a pro-rata share of the fees and expenses of the underlying funds in which it invests. Such indirect expenses are not included in the above expense ratios. |
| (d) | Expense waiver/reimbursement less than 0.01%. |
| (e) | Net of interest expense which is less than one-tenth of a percent. |
| Six months ended April 30, 2023* | Year Ended October 31, | April 26, 2021^ through October 31, | |||
| Class R6 | 2022 | 2021 | |||
| Net asset value at beginning of period | $ 30.20 | $ 57.42 | $ 53.83** | ||
| Net investment income (loss) (a) | 0.28 | 0.49 | 0.65 | ||
| Net realized and unrealized gain (loss) | 0.08 | (1.77) | 2.94 | ||
| Total from investment operations | 0.36 | (1.28) | 3.59 | ||
| Less distributions: | |||||
| From net investment income | (0.51) | (0.54) | — | ||
| From net realized gain on investments | (1.16) | (25.40) | — | ||
| Total distributions | (1.67) | (25.94) | — | ||
| Net asset value at end of period | $ 28.89 | $ 30.20 | $ 57.42 | ||
| Total investment return (b) | 1.13% | (2.37)% | 6.67% | ||
| Ratios (to average net assets)/Supplemental Data: | |||||
| Net investment income (loss) | 1.91%†† | 1.52% | 1.25%†† | ||
| Net expenses (c) | 0.70%†† | 0.70% | 0.72%†† | ||
| Expenses (before waiver/reimbursement) (c) | 0.71%†† | 0.71% | 0.72%†† | ||
| Portfolio turnover rate | 14% | 37% | 23% | ||
| Net assets at end of period (in 000’s) | $ 265,946 | $ 272,274 | $ 356,580 |
| * | Unaudited. |
| ** | Based on the net asset value of Class I as of April 26, 2021. |
| ^ | Inception date. |
| †† | Annualized. |
| (a) | Per share data based on average shares outstanding during the period. |
| (b) | Total investment return is calculated exclusive of sales charges and assumes the reinvestment of dividends and distributions. Class R6 shares are not subject to sales charges. For periods of less than one year, total return is not annualized. |
| (c) | In addition to the fees and expenses which the Fund bears directly, it also indirectly bears a pro-rata share of the fees and expenses of the underlying funds in which it invests. Such indirect expenses are not included in the above expense ratios. |
| 24 | MainStay WMC Value Fund |
| Class | Commenced Operations |
| Class A | June 9, 1999 |
| Investor Class | February 28, 2008 |
| Class B | June 9, 1999 |
| Class C | June 9, 1999 |
| Class I | January 21, 1971 |
| Class R1 | January 2, 2004 |
| Class R2 | January 2, 2004 |
| Class R3 | April 28, 2006 |
| Class R6 | April 26, 2021 |
| • | Level 1—quoted prices (unadjusted) in active markets for an identical asset or liability |
| • | Level 2—other significant observable inputs (including quoted prices for a similar asset or liability in active markets, interest rates and yield curves, prepayment speeds, credit risk, etc.) |
| • | Level 3—significant unobservable inputs (including the Fund's own assumptions about the assumptions that market participants would use in measuring fair value of an asset or liability) |
| • Broker/dealer quotes | • Benchmark securities |
| • Two-sided markets | • Reference data (corporate actions or material event notices) |
| • Bids/offers | • Monthly payment information |
| • Industry and economic events | • Reported trades |
| 26 | MainStay WMC Value Fund |
| 28 | MainStay WMC Value Fund |
| Class R1 | $ 86 |
| Class R2 | 517 |
| Class R3 | 757 |
| Class | Expense | Waived |
| Class A | $200,177 | $ — |
| Investor Class | 97,226 | (688) |
| Class B | 12,627 | (99) |
| Class C | 25,852 | (169) |
| Class I | 58,880 | — |
| Class R1 | 66 | — |
| Class R2 | 395 | — |
| Class R3 | 578 | — |
| Class R6 | 5,305 | — |
| Class R6 | $26,331 | 0.0%‡ |
| ‡ | Less than one-tenth of a percent. |
| Federal Tax Cost | Gross Unrealized Appreciation | Gross Unrealized (Depreciation) | Net Unrealized Appreciation/ (Depreciation) | |
| Investments in Securities | $947,160,488 | $131,881,281 | $(54,197,603) | $77,683,678 |
| 2022 | |
| Distributions paid from: | |
| Ordinary Income | $ 44,602,455 |
| Long-Term Capital Gains | 460,877,101 |
| Total | $505,479,556 |
| Sales (000's) | Realized Gain / (Loss) (000's) |
| $1,455 | $194 |
| 30 | MainStay WMC Value Fund |
| Class A | Shares | Amount |
| Six-month period ended April 30, 2023: | ||
| Shares sold | 1,103,619 | $ 29,969,756 |
| Shares issued to shareholders in reinvestment of distributions | 1,052,369 | 28,540,315 |
| Shares redeemed | (1,332,653) | (36,191,174) |
| Net increase (decrease) in shares outstanding before conversion | 823,335 | 22,318,897 |
| Shares converted into Class A (See Note 1) | 89,323 | 2,368,977 |
| Shares converted from Class A (See Note 1) | (9,163) | (253,237) |
| Net increase (decrease) | 903,495 | $ 24,434,637 |
| Year ended October 31, 2022: | ||
| Shares sold | 2,574,874 | $ 75,162,709 |
| Shares issued to shareholders in reinvestment of distributions | 8,653,260 | 244,714,188 |
| Shares redeemed | (2,898,457) | (85,207,197) |
| Net increase (decrease) in shares outstanding before conversion | 8,329,677 | 234,669,700 |
| Shares converted into Class A (See Note 1) | 365,434 | 10,680,993 |
| Shares converted from Class A (See Note 1) | (3,901) | (117,088) |
| Net increase (decrease) | 8,691,210 | $245,233,605 |
| Investor Class | Shares | Amount |
| Six-month period ended April 30, 2023: | ||
| Shares sold | 34,729 | $ 940,599 |
| Shares issued to shareholders in reinvestment of distributions | 110,738 | 3,007,651 |
| Shares redeemed | (83,532) | (2,274,869) |
| Net increase (decrease) in shares outstanding before conversion | 61,935 | 1,673,381 |
| Shares converted into Investor Class (See Note 1) | 17,910 | 505,690 |
| Shares converted from Investor Class (See Note 1) | (40,485) | (1,075,475) |
| Net increase (decrease) | 39,360 | $ 1,103,596 |
| Year ended October 31, 2022: | ||
| Shares sold | 99,246 | $ 2,910,829 |
| Shares issued to shareholders in reinvestment of distributions | 1,076,017 | 30,472,806 |
| Shares redeemed | (160,132) | (4,790,100) |
| Net increase (decrease) in shares outstanding before conversion | 1,015,131 | 28,593,535 |
| Shares converted into Investor Class (See Note 1) | 38,738 | 1,108,283 |
| Shares converted from Investor Class (See Note 1) | (259,839) | (7,693,164) |
| Net increase (decrease) | 794,030 | $ 22,008,654 |
| Class B | Shares | Amount |
| Six-month period ended April 30, 2023: | ||
| Shares sold | 1,093 | $ 21,497 |
| Shares issued to shareholders in reinvestment of distributions | 28,265 | 544,951 |
| Shares redeemed | (18,967) | (363,327) |
| Net increase (decrease) in shares outstanding before conversion | 10,391 | 203,121 |
| Shares converted from Class B (See Note 1) | (74,181) | (1,420,914) |
| Net increase (decrease) | (63,790) | $ (1,217,793) |
| Year ended October 31, 2022: | ||
| Shares sold | 13,232 | $ 270,904 |
| Shares issued to shareholders in reinvestment of distributions | 340,527 | 7,014,860 |
| Shares redeemed | (71,258) | (1,533,977) |
| Net increase (decrease) in shares outstanding before conversion | 282,501 | 5,751,787 |
| Shares converted from Class B (See Note 1) | (164,591) | (3,396,152) |
| Net increase (decrease) | 117,910 | $ 2,355,635 |
| Class C | Shares | Amount |
| Six-month period ended April 30, 2023: | ||
| Shares sold | 185,204 | $ 3,578,283 |
| Shares issued to shareholders in reinvestment of distributions | 50,505 | 974,235 |
| Shares redeemed | (125,553) | (2,455,219) |
| Net increase (decrease) in shares outstanding before conversion | 110,156 | 2,097,299 |
| Shares converted from Class C (See Note 1) | (19,976) | (385,823) |
| Net increase (decrease) | 90,180 | $ 1,711,476 |
| Year ended October 31, 2022: | ||
| Shares sold | 430,915 | $ 9,751,926 |
| Shares issued to shareholders in reinvestment of distributions | 317,250 | 6,538,534 |
| Shares redeemed | (233,253) | (4,957,547) |
| Net increase (decrease) in shares outstanding before conversion | 514,912 | 11,332,913 |
| Shares converted from Class C (See Note 1) | (33,962) | (698,007) |
| Net increase (decrease) | 480,950 | $ 10,634,906 |
| Class I | Shares | Amount |
| Six-month period ended April 30, 2023: | ||
| Shares sold | 1,774,949 | $ 52,396,595 |
| Shares issued to shareholders in reinvestment of distributions | 270,746 | 7,908,495 |
| Shares redeemed | (1,087,950) | (31,608,414) |
| Net increase (decrease) in shares outstanding before conversion | 957,745 | 28,696,676 |
| Shares converted into Class I (See Note 1) | 8,756 | 260,782 |
| Net increase (decrease) | 966,501 | $ 28,957,458 |
| Year ended October 31, 2022: | ||
| Shares sold | 2,456,778 | $ 75,283,479 |
| Shares issued to shareholders in reinvestment of distributions | 1,366,048 | 41,432,227 |
| Shares redeemed | (1,080,081) | (35,831,216) |
| Net increase (decrease) in shares outstanding before conversion | 2,742,745 | 80,884,490 |
| Shares converted into Class I (See Note 1) | 3,574 | 115,135 |
| Net increase (decrease) | 2,746,319 | $ 80,999,625 |
| Class R1 | Shares | Amount |
| Six-month period ended April 30, 2023: | ||
| Shares sold | 50 | $ 1,369 |
| Shares issued to shareholders in reinvestment of distributions | 359 | 9,920 |
| Shares redeemed | (184) | (5,096) |
| Net increase (decrease) | 225 | $ 6,193 |
| Year ended October 31, 2022: | ||
| Shares sold | 4,530 | $ 124,674 |
| Shares issued to shareholders in reinvestment of distributions | 738 | 21,242 |
| Shares redeemed | (272) | (13,072) |
| Net increase (decrease) | 4,996 | $ 132,844 |
| Class R2 | Shares | Amount |
| Six-month period ended April 30, 2023: | ||
| Shares sold | 801 | $ 21,994 |
| Shares issued to shareholders in reinvestment of distributions | 1,922 | 52,887 |
| Shares redeemed | (596) | (16,295) |
| Net increase (decrease) | 2,127 | $ 58,586 |
| Year ended October 31, 2022: | ||
| Shares sold | 3,099 | $ 92,709 |
| Shares issued to shareholders in reinvestment of distributions | 15,637 | 448,308 |
| Shares redeemed | (1,597) | (49,958) |
| Net increase (decrease) | 17,139 | $ 491,059 |
| Class R3 | Shares | Amount |
| Six-month period ended April 30, 2023: | ||
| Shares sold | 10,694 | $ 286,697 |
| Shares issued to shareholders in reinvestment of distributions | 2,864 | 77,938 |
| Shares redeemed | (16,748) | (436,441) |
| Net increase (decrease) | (3,190) | $ (71,806) |
| Year ended October 31, 2022: | ||
| Shares sold | 14,878 | $ 418,071 |
| Shares issued to shareholders in reinvestment of distributions | 18,616 | 528,702 |
| Shares redeemed | (1,823) | (50,952) |
| Net increase (decrease) | 31,671 | $ 895,821 |
| Class R6 | Shares | Amount |
| Six-month period ended April 30, 2023: | ||
| Shares sold | 144,242 | $ 4,155,344 |
| Shares issued to shareholders in reinvestment of distributions | 503,997 | 14,701,579 |
| Shares redeemed | (458,429) | (13,780,239) |
| Net increase (decrease) | 189,810 | $ 5,076,684 |
| Year ended October 31, 2022: | ||
| Shares sold | 125,655 | $ 3,861,577 |
| Shares issued to shareholders in reinvestment of distributions | 5,318,092 | 161,084,996 |
| Shares redeemed | (2,637,087) | (81,204,584) |
| Net increase (decrease) | 2,806,660 | $ 83,741,989 |
| 32 | MainStay WMC Value Fund |
| 34 | MainStay WMC Value Fund |
| 36 | MainStay WMC Value Fund |
| 38 | MainStay WMC Value Fund |
| 40 | MainStay WMC Value Fund |
1.
| 2. | This Fund is registered for sale in CA, CT, DE, FL, MA, NJ, NY and VT. |
| 3. | An affiliate of New York Life Investment Management LLC. |
| 5022253MS043-23 | MSWV10-06/23 |
| Item 2. | Code of Ethics. |
Not applicable.
| Item 3. | Audit Committee Financial Expert. |
Not applicable.
| Item 4. | Principal Accountant Fees and Services. |
Not applicable.
| Item 5. | Audit Committee of Listed Registrants. |
Not applicable.
| Item 6. | Investments. |
The Schedule of Investments is included as part of Item 1 of this report.
| Item 7. | Disclosure of Proxy Voting Policies and Procedures for Closed-End Management Investment Companies. |
Not applicable.
| Item 8. | Portfolio Managers of Closed-End Management Investment Companies. |
Not applicable.
| Item 9. | Purchases of Equity Securities by Closed-End Management Investment Company and Affiliated Purchasers. |
Not applicable.
| Item 10. | Submission of Matters to a Vote of Security Holders. |
Since the Registrant’s last response to this Item, there have been no material changes to the procedures by which shareholders may recommend nominees to the Registrant’s Board of Trustees.
| Item 11. | Controls and Procedures. |
(a) Based on an evaluation of the Registrant’s Disclosure Controls and Procedures (as defined in Rule 30a-3(c) under the Investment Company Act of 1940) (the “Disclosure Controls”), as of a date within 90 days prior to the filing date (the “Filing Date”) of this Form N-CSR (the “Report”), the Registrant’s principal executive officer and principal financial officer have concluded that the Disclosure Controls are reasonably designed to ensure that information required to be disclosed by the Registrant in the Report is recorded, processed, summarized and reported by the Filing Date, including ensuring that information required to be disclosed in the Report is accumulated and communicated to the Registrant’s management, including the Registrant’s principal executive officer and principal financial officer, as appropriate to allow timely decisions regarding required disclosure.
(b) There were no changes in the Registrant’s internal control over financial reporting (as defined in Rule 30a-3(d)) under the Investment Company Act of 1940 that occurred during the period covered by this report that has materially affected, or is reasonably likely to materially affect, the Registrant’s internal control over financial reporting.
| Item 12. | Disclosure of Securities Lending Activities for Closed-End Management Investment Companies. |
Not applicable.
| Item 13. | Exhibits. |
| (a) |
| (b) |
SIGNATURES
Pursuant to the requirements of the Securities Exchange Act of 1934 and the Investment Company Act of 1940, the Registrant has duly caused this Report to be signed on its behalf by the undersigned, thereunto duly authorized.
THE MAINSTAY FUNDS
By: | /s/ Kirk C. Lehneis | |
Kirk C. Lehneis President and Principal Executive Officer | ||
| Date: | July 6, 2023 | |
Pursuant to the requirements of the Securities Exchange Act of 1934 and the Investment Company Act of 1940, this Report has been signed below by the following persons on behalf of the Registrant and in the capacities and on the dates indicated.
| By: | /s/ Kirk C. Lehneis | |
Kirk C. Lehneis President and Principal Executive Officer | ||
| Date: | July 6, 2023 | |
| By: | /s/ Jack Benintende | |
Jack R. Benintende Treasurer and Principal Financial and Accounting Officer | ||
| Date: | July 6, 2023 | |