As filed with the SEC on January 7, 2005.
| | | |
| UNITED STATES | |
| SECURITIES AND EXCHANGE COMMISSION | |
| Washington, D.C. 20549 | |
FORM N-CSR
CERTIFIED SHAREHOLDER REPORT OF REGISTERED
MANAGEMENT INVESTMENT COMPANIES
Investment Company Act file number | 811-4556 |
|
TRANSAMERICA IDEX MUTUAL FUNDS |
(Exact name of registrant as specified in charter) |
|
570 Carillon Parkway, St. Petersburg, Florida | | 33716 |
(Address of principal executive offices) | | (Zip code) |
|
John K. Carter, Esq. P.O. Box 5068, Clearwater, Florida 33758-5068 |
(Name and address of agent for service) |
|
Registrant’s telephone number, including area code: | (727) 299-1800 | |
|
Date of fiscal year end: | October 31 | |
|
Date of reporting period: | November 1, 2003 - October 31, 2004 | |
| | | | | | | | |
Form N-CSR is to be used by management investment companies to file reports with the Commission not later than 10 days after the transmission to stockholders of any report that is required to be transmitted to stockholders under Rule 30e-1 under the Investment Company Act of 1940 (17 CFR 270.30e-1). The Commission may use the information provided on Form N-CSR in its regulatory, disclosure review, inspection, and policymaking roles.
A registrant is required to disclose the information specified by Form N-CSR, and the Commission will make this information public. A registrant is not required to respond to the collection of information contained in Form N-CSR unless the Form displays a currently valid Office of Management and Budget (“OMB”) control number. Please direct comments concerning the accuracy of the information collection burden estimate and any suggestions for reducing the burden to Secretary, Securities and Exchange Commission, 450 Fifth Street, NW, Washington, DC 20549-0609. The OMB has reviewed this collection of information under the clearance requirements of 44 U.S.C. §3507.
Item 1: Report(s) to Shareholders. The Annual Report is attached.

Annual Report
October 31, 2004
www.idexfunds.com
P.O. Box 9012 • Clearwater, FL 33758-9012
Distributor: AFSG Securities Corporation, Member NASD
Investor Services 1-888-233-IDEX (4339)
Dear Fellow Shareholder,
On behalf of Transamerica IDEX Mutual Funds, I would like to thank you for your continued support and confidence in our products as we look forward to continuing to serve you and your financial advisor in the future.
A financial professional can help you build a comprehensive picture of your current and future financial needs. What's more, financial advisors are familiar with the market's history, including long-term returns and volatility of various asset classes. With your financial advisor, you can develop an investment program that incorporates factors such as your goals, your investment timeline, and your risk tolerance.
The Securities and Exchange Commission requires that a semi-annual report be sent to all shareholders. The following pages provide a comprehensive review of the investments of each fund as well as the detailed accounting data. The report also provides a discussion of the accounting policies for the funds in addition to any matters presented to the shareholders that may have required their vote.
Please contact your financial advisor if you have any questions about the contents of this report.
Sincerely,
Brian C. Scott
President
Transamerica IDEX Mutual Funds
The views expressed in this report reflect those of the portfolio managers only and may not necessarily represent the views of Transamerica IDEX Mutual Funds. These views are subject to change based upon market conditions. These views should not be relied on as investment advice and are not indicative of a trading intent on behalf of the Transamerica IDEX Mutual Funds.
TA IDEX American Century International
MARKET ENVIRONMENT
The twelve months ended October 31, 2004, provided both challenges and opportunities for international investors, with many of the world's equity markets advancing. But their gains were restrained by record-high oil prices, rising interest rates, continued violence in Iraq and the threat of terrorism. Those issues provided solid headwinds for the global economy, and they created uncertainty among investors and concern about corporate profits.
Against this backdrop, TA IDEX American Century International advanced but underperformed its benchmark, the Morgan Stanley Capital International EAFE Index ("MSCI EAFE"). Nine of the ten sectors in which we were invested advanced, with our complement of financial holdings posting the largest contribution to absolute return. On a relative basis, the portfolio's telecommunications services and consumer staples sectors outperformed, but a variety of sectors, notably health care and industrials, underperformed the MSCI EAFE, ultimately causing the portfolio to lag the benchmark.
PERFORMANCE
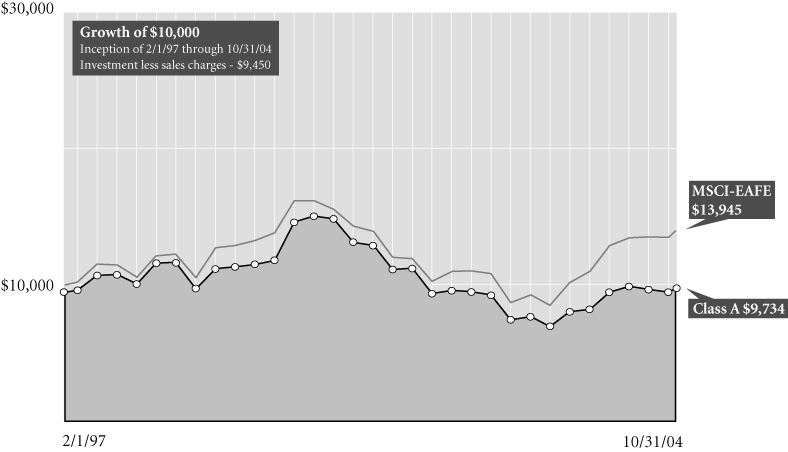
For the year ended October 31, 2004, TA IDEX American Century International, Class A returned 9.95%. By comparison its benchmark, the MSCI EAFE, returned 19.27%.
STRATEGY REVIEW
The best performance versus the benchmark came from TA IDEX American Century International's stake in the telecommunication services sector. We had exposure to several mobile-phone companies that advanced and are not in the MSCI EAFE. They include Mobile TeleSystems OJSC, Russia's largest mobile-phone company, which registered the portfolio's third-best relative performance, and America Movil SA, which provides wireless services in Mexico. Both companies benefited from a growing number of subscribers for wireless services. The portfolio's stake in the telecommunication services sector also registered the period's second-best absolute performance.
The second-best performance against the benchmark came from the consumer staples sector, which also contributed to the portfolio's return. The portfolio's stake in the food and staples retailing industry led the advance, with Canada's Shoppers Drug Mart Corporation topping the list of relative contributors in that group.
The health care sector, however, registered the period's worst relative performance. The portfolio's underweight pharmaceutical holdings detracted most, as Teva Pharmaceutical Industries Ltd., a generic drug maker in the portfolio but not the MSCI EAFE, declined. The portfolio's overweight stake in the health care equipment and supplies industry also underperformed.
The industrials sector turned in the second-worst performance against the MSCI EAFE, with holdings in the commercial services and supplies industry detracting most. Switzerland's Adecco SA ("Adecco"), one of the world's largest providers of temporary workers, led the retreat. Adecco came under investigation during the period for potential accounting irregularities. We eliminated the position, but it was among the period's top detractors from the portfolio's relative performance.
TA IDEX American Century International's financial holdings, the portfolio's largest sector stake on average during the period, contributed most to absolute performance. The advance came mostly on the strength of commercial banks, which represented the portfolio's heaviest average industry weighting. Austria's Erste Bank der Oesterreichischen Sparkassen AG led the contributors among banks. Our holdings in the insurance, diversified financial services and consumer finance industries also contributed to total return. However, the financial sector underperformed the MSCI EAFE, with holdings in the capital markets industry detracting most from relative performance.
Energy holdings also contributed to the portfolio's absolute performance, led by France's Total SA, Europe's biggest oil refiner. The company benefited from high oil prices and its potential for increased oil and gas production.
Regarding countries, investments in Mexico, France and Austria made the largest contribution relative to the MSCI EAFE, while those in the United Kingdom, Japan and Switzerland detracted most.
Henrik Strabo
Mark S. Kopinski
Keith Creveling, CFA
Co-Fund Managers
American Century Investment Management, Inc.
Transamerica IDEX Mutual Funds
Annual Report 2004
1
TA IDEX American Century International
Comparison of change in value of $10,000 investment in Class A shares and its comparative index.
Average Annual Total Return for Periods Ended 10/31/04
| | | 1 year | | 5 years | | From
Inception | | Inception
Date | |
| Class A (NAV) | | | 9.95 | % | | | (4.46 | )% | | | 0.38 | % | | 2/1/97 | |
| Class A (POP) | | | 3.90 | % | | | (5.53 | )% | | | (0.35 | )% | | 2/1/97 | |
| MSCI-EAFE1 | | | 19.27 | % | | | (0.58 | )% | | | 4.39 | % | | 2/1/97 | |
| Class B (NAV) | | | 9.46 | % | | | (5.07 | )% | | | (0.26 | )% | | 2/1/97 | |
| Class B (POP) | | | 4.46 | % | | | (5.26 | )% | | | (0.26 | )% | | 2/1/97 | |
| Class C (NAV) | | | 9.33 | % | | | – | | | | 12.06 | % | | 11/11/02 | |
| Class C (POP) | | | 8.33 | % | | | – | | | | 12.06 | % | | 11/11/02 | |
NOTES
1 The Morgan Stanley Capital International – Europe, Asia, and Far East (MSCI-EAFE) Index is an unmanaged index used as a general measure of market performance. Calculations assume dividends and capital gains are reinvested and do not include any managerial expenses. From inception calculation is based on life of Class A shares. Source: Standard & Poor's Micropal®© Micropal, Inc. 2004 – 1-800-596-5323 – http://www.micropal.com.
The performance data presented represents past performance, future results may vary. Performance data does not reflect the deduction of taxes that would be paid on fund distributions or the redemption of fund shares. Investment return and principal value will fluctuate so that an investor's shares, when redeemed, may be worth more or less than their original cost. Current performance may be lower or higher than performance quoted.
Public Offering Price (POP) returns include the reinvestment of dividends and capital gains and reflect the maximum sales charge of 5.5% for A shares or the maximum applicable contingent deferred sales charge (5% in the 1st year, decreasing to 0% after 6 years) for Class B shares and 1% (during the first 12 months) for Class C shares. Shares purchased prior to March 1, 2004 are subject to a maximum applicable contingent deferred sales charge (5% in the 1st year, decreasing to 0% after 7 years) for Class B shares and (2% in the 1st year, decreasing to 0% after 2 years) for Class C shares. Net Asset Value (NAV) returns include the reinvestment of dividends and capital gains but do not reflect any sales charges.
International investing involves special risks including currency fluctuations, political instability, and different financial accounting standards.
This material must be preceded or accompanied by a current prospectus, which includes specific contents regarding the investment objectives and policies of this fund.
Transamerica IDEX Mutual Funds
Annual Report 2004
2
TA IDEX American Century International
UNDERSTANDING YOUR FUND'S EXPENSES (unaudited)
SHAREHOLDER EXPENSES
The following Example is intended to help you understand your ongoing costs (in dollars and cents) of investing in a Fund and to compare these costs with the ongoing costs of investing in other funds.
The Example is based on an investment of $1,000 invested at the beginning of the period and held for the entire period from May 1, 2004 to October 31, 2004.
ACTUAL EXPENSES
The first line in the table below provides information about actual account values and actual expenses. You may use the information in this line, together with the amount you invested, to estimate the expenses that you paid over the period. Simply divide your account value by $1,000 (for example, an $8,600 account value divided by $1,000 = 8.6), then multiply the result by the number in the first line of your Fund un der the heading entitled "Expenses Paid During Period" to estimate the expenses you paid on your account during this period.
HYPOTHETICAL EXAMPLE FOR COMPARISON PURPOSES
The second line in the table below provides information about hypothetical account values and hypothetical expenses based on each Fund's actual expense ratio and an assumed rate of return of 5% per year before expenses, which is not the Fund's actual return. The hypothetical account values and expenses may not be used to estimate the actual ending account balance or expenses you paid for the period. You may use this information to compare the ongoing costs of investing in your Fund and other funds. To do so, compa re this 5% hypothetical example with the 5% hypothetical examples that appear in the shareholder reports of the other funds.
Please note that the expenses shown in the table are meant to highlight your ongoing costs only and do not reflect any transactional costs, such as sales charges, redemption fees, brokerage commissions paid on purchases and sales of fund shares. Therefore, the second line under each Fund in the table is useful in comparing on going costs only, and will not help you determine the relative total costs of owning different funds. In addition, note that the expenses shown in the table are meant to highlight your ongoing costs and do not reflect any transaction costs.
| | | Beginning
Account
Value | | Ending
Account
Value | | Annualized
Expense
Ratio | | Expenses Paid
During Period (a) | |
| Class A | |
| Actual | | $ | 1,000.00 | | | $ | 1,020.70 | | | | 1.71 | % | | $ | 8.69 | | |
| Hypothetical (b) | | | 1,000.00 | | | | 1,016.54 | | | | 1.71 | | | | 8.67 | | |
| Class B | |
| Actual | | | 1,000.00 | | | | 1,019.20 | | | | 2.04 | | | | 10.35 | | |
| Hypothetical (b) | | | 1,000.00 | | | | 1,014.88 | | | | 2.04 | | | | 10.33 | | |
| Class C | |
| Actual | | | 1,000.00 | | | | 1,018.00 | | | | 2.60 | | | | 13.19 | | |
| Hypothetical (b) | | | 1,000.00 | | | | 1,012.07 | | | | 2.60 | | | | 13.15 | | |
(a) Expenses are calculated using each Fund's annualized expense ratio (as disclosed in the table), multiplied by the average account value for the period, multiplied by number of days in the period (184 days), and divided by the number of days in the year (366 days).
(b) 5% return per year before expenses.
GRAPHIC PRESENTATION OF SCHEDULE OF INVESTMENTS
By Region
At October 31, 2004

This chart shows the percentage breakdown by region of the Fund's total investment securities.
Transamerica IDEX Mutual Funds
Annual Report 2004
3
TA IDEX American Century International
SCHEDULE OF INVESTMENTS
At October 31, 2004
(all amounts except share amounts in thousands)
| | | Shares | | Value | |
| CONVERTIBLE PREFERRED STOCKS ( 0.7%) | | | |
| Switzerland (0.7%) | | | |
| Compagnie Financiere Richemont AG–Class A | | | 50,860 | | | $ | 1,437 | | |
| Total Convertible Preferred Stocks (cost: $1,256) | | | | | | | 1,437 | | |
| COMMON STOCKS ( 96.7%) | | | |
| Australia (4.8%) | | | |
| Amcor, Ltd. | | | 157,280 | | | | 897 | | |
| BHP Billiton, Ltd. | | | 482,914 | | | | 4,998 | | |
| Commonwealth Bank of Australia | | | 110,500 | | | | 2,651 | | |
| QBE Insurance Group, Ltd. | | | 185,480 | | | | 1,903 | | |
| Austria (1.8%) | | | |
| Erste Bank der Oesterreichischen Sparkassen AG | | | 88,842 | | | | 3,943 | | |
| Belgium (0.6%) | | | |
| KBC Bancassurance Holding | | | 18,640 | | | | 1,362 | | |
| Bermuda (2.7%) | | | |
| Accenture, Ltd.–Class A (b) | | | 50,900 | | | | 1,232 | | |
| Esprit Holdings, Ltd. | | | 328,000 | | | | 1,753 | | |
| Tyco International, Ltd. (a) | | | 89,950 | | | | 2,802 | | |
| Canada (2.3%) | | | |
| EnCana Corp. | | | 61,790 | | | | 3,060 | | |
| Shoppers Drug Mart Corp. | | | 63,706 | | | | 1,935 | | |
| Denmark (0.5%) | | | |
| AP Moller-Maersk A/S | | | 160 | | | | 1,178 | | |
| France (14.1%) | | | |
| AXA | | | 153,088 | | | | 3,285 | | |
| Cie Generale D'Optique Essilor International SA | | | 20,230 | | | | 1,369 | | |
| Credit Agricole SA | | | 116,229 | | | | 3,396 | | |
| Lafarge SA | | | 29,620 | | | | 2,696 | | |
| Pernod-Ricard | | | 15,780 | | | | 2,178 | | |
| Schneider Electric SA | | | 33,100 | | | | 2,185 | | |
| Societe Generale–Class A | | | 29,877 | | | | 2,763 | | |
| Total SA | | | 31,070 | | | | 6,442 | | |
| Vinci SA | | | 23,213 | | | | 2,756 | | |
| Vivendi Universal SA (b) | | | 133,010 | | | | 3,622 | | |
| Germany (8.0%) | | | |
| Adidas-Salomon AG | | | 8,450 | | | | 1,177 | | |
| BASF AG | | | 30,720 | | | | 1,911 | | |
| Continental AG | | | 39,930 | | | | 2,174 | | |
| Deutsche Telekom AG | | | 66,110 | | | | 1,263 | | |
| E.ON AG | | | 22,370 | | | | 1,815 | | |
| Fresenius Medical Care AG | | | 17,240 | | | | 1,316 | | |
| Metro AG | | | 35,840 | | | | 1,706 | | |
| Puma AG Rudolf Dassler Sport | | | 9,227 | | | | 2,304 | | |
| SAP AG | | | 21,577 | | | | 3,665 | | |
| | | Shares | | Value | |
| Greece (1.4%) | | | |
| Alpha Bank A.E. | | | 62,000 | | | $ | 1,759 | | |
| OPAP SA | | | 59,274 | | | | 1,203 | | |
| Ireland (1.1%) | | | |
| Anglo Irish Bank Corp. PLC | | | 126,010 | | | | 2,388 | | |
| Israel (0.4%) | | | |
Teva Pharmaceutical Industries, Ltd.,
Sponsored ADR (a) | | | 35,536 | | | | 924 | | |
| Italy (2.3%) | | | |
| ENI-Ente Nazionale Idrocarburi SpA | | | 123,090 | | | | 2,787 | | |
| Terna SpA Rights | | | 931,009 | | | | 2,264 | | |
| Japan (17.4%) | | | |
| Aiful Corp. | | | 15,900 | | | | 1,585 | | |
| Bank of Yokohama, Ltd. (The) | | | 239,000 | | | | 1,427 | | |
| Canon, Inc. | | | 18,409 | | | | 907 | | |
| Chugai Pharmaceutical Co., Ltd. | | | 112,899 | | | | 1,765 | | |
| Daikin Industries, Ltd. | | | 39,000 | | | | 948 | | |
| Fast Retailing Co., Ltd. | | | 13,600 | | | | 863 | | |
| Hoya Corp. | | | 34,864 | | | | 3,573 | | |
| Komatsu, Ltd. | | | 196,000 | | | | 1,309 | | |
| Matsushita Electric Industrial Co., Ltd. | | | 91,000 | | | | 1,318 | | |
| Mitsubishi Tokyo Financial Group, Inc. | | | 160 | | | | 1,356 | | |
| Mitsui & Co., Ltd. | | | 408,000 | | | | 3,424 | | |
| Omron Corp. | | | 52,000 | | | | 1,178 | | |
| ORIX Corp. | | | 28,400 | | | | 3,325 | | |
| Rakuten, Inc. | | | 160 | | | | 1,198 | | |
| Sharp Corp. | | | 79,000 | | | | 1,089 | | |
| Shin-Etsu Chemical Co., Ltd. | | | 28,000 | | | | 1,063 | | |
| Sumitomo Metal Mining Co., Ltd. | | | 155,000 | | | | 1,044 | | |
| Sumitomo Mitsui Financial Group, Inc. (a) | | | 340 | | | | 2,207 | | |
| Toray Industries, Inc. | | | 441,000 | | | | 2,056 | | |
| Toto, Ltd. | | | 106,000 | | | | 949 | | |
| Toyota Motor Corp. | | | 82,900 | | | | 3,225 | | |
| Trend Micro, Inc. | | | 23,000 | | | | 1,101 | | |
| Yamaha Motor Co., Ltd. | | | 58,900 | | | | 895 | | |
| Luxembourg (0.7%) | | | |
| Arcelor | | | 77,710 | | | | 1,447 | | |
| Mexico (1.2%) | | | |
| America Movil SA de CV–Class L, ADR (a) | | | 60,087 | | | | 2,644 | | |
| Netherlands (3.3%) | | | |
| ING Groep NV | | | 145,414 | | | | 3,838 | | |
| Royal Numico NV | | | 67,510 | | | | 2,269 | | |
| Schlumberger, Ltd. | | | 15,550 | | | | 979 | | |
The notes to the financial statements are an integral part of this report.
Transamerica IDEX Mutual Funds
Annual Report 2004
4
TA IDEX American Century International
SCHEDULE OF INVESTMENTS (continued)
At October 31, 2004
(all amounts except share amounts in thousands)
| | | Shares | | Value | |
| Norway (3.5%) | | | |
| DnB Nor ASA | | | 168,810 | | | $ | 1,427 | | |
| Norsk Hydro ASA | | | 33,980 | | | | 2,495 | | |
| Statoil ASA | | | 146,670 | | | | 2,118 | | |
| Telenor ASA | | | 184,920 | | | | 1,469 | | |
| Russia (0.6%) | | | |
| Mobile Telesystems, Sponsored ADR | | | 8,709 | | | | 1,264 | | |
| South Korea (0.7%) | | | |
| Hyundai Motor Co. | | | 32,120 | | | | 1,559 | | |
| Spain (3.5%) | | | |
| ACS Actividades de Construccion y Servicios SA | | | 82,387 | | | | 1,592 | | |
| Gamesa Corp. Tecnologica SA | | | 23,250 | | | | 320 | | |
| Grupo Ferrovial SA | | | 43,720 | | | | 1,930 | | |
| Telefonica SA | | | 233,257 | | | | 3,839 | | |
| Sweden (2.4%) | | | |
| Autoliv, Inc., SDR | | | 30,145 | | | | 1,276 | | |
| Telefonaktiebolaget LM Ericsson–Class B | | | 602,010 | | | | 1,744 | | |
| Volvo AB–Class B | | | 57,325 | | | | 2,165 | | |
| Switzerland (5.9%) | | | |
| ABB, Ltd. | | | 116,070 | | | | 669 | | |
| Novartis AG | | | 97,530 | | | | 4,635 | | |
| Roche Holding AG | | | 42,227 | | | | 4,302 | | |
| UBS AG | | | 45,136 | | | | 3,242 | | |
| United Kingdom (16.4%) | | | |
| Amdocs, Ltd. (b) | | | 52,150 | | | | 1,312 | | |
| BP PLC | | | 691,241 | | | | 6,684 | | |
| HSBC Holdings PLC | | | 147,590 | | | | 2,379 | | |
| Legal & General Group PLC | | | 1,363,570 | | | | 2,474 | | |
| mmO2 PLC | | | 64,709 | | | | 125 | | |
| Next PLC | | | 92,740 | | | | 2,839 | | |
| Pearson PLC | | | 177,290 | | | | 1,943 | | |
| Reckitt Benckiser PLC | | | 130,283 | | | | 3,568 | | |
| Royal Bank of Scotland Group PLC | | | 111,938 | | | | 3,293 | | |
| Smith & Nephew PLC | | | 250,475 | | | | 2,123 | | |
| Tesco PLC | | | 757,720 | | | | 3,986 | | |
| Vodafone Group PLC | | | 1,341,680 | | | | 3,431 | | |
| Wolseley PLC | | | 77,490 | | | | 1,337 | | |
| United States (1.1%) | | | |
| iShares MSCI EAFE Index Fund (a) | | | 5,000 | | | | 732 | | |
| Synthes, Inc. | | | 14,720 | | | | 1,563 | | |
| Total Common Stocks (cost: $188,415) | | | | | | | 209,879 | | |
| | | Principal | | Value | |
| SECURITY LENDING COLLATERAL ( 2.8%) | |
| Debt (2.6%) | |
| Bank Notes (0.5%) | |
Bank of America
1.77%, due 12/03/2004 | | $ | 299 | | | $ | 299 | | |
| 1.77%, due 01/18/2005 | | | 200 | | | | 200 | | |
| 1.88%, due 12/23/2004 | | | 100 | | | | 100 | | |
Canadian Imperial Bank of Commerce
1.86%, due 11/04/2004 | | | 449 | | | | 449 | | |
Credit Suisse First Boston Corp.
1.83%, due 09/09/2005 | | | 50 | | | | 50 | | |
| Commercial Paper (0.3%) | |
Clipper Receivables Corp.
1.79%, due 11/12/2004 | | | 149 | | | | 149 | | |
Delaware Funding Corp. 144A
1.85%, due 11/19/2004 | | | 50 | | | | 50 | | |
Falcon Asset Securitization Corp. 144A
1.75%, due 11/10/2004 | | | 200 | | | | 200 | | |
| 1.78%, due 11/04/2004 | | | 149 | | | | 149 | | |
Galaxy Funding 144A
1.88%, due 11/22/2004 | | | 50 | | | | 50 | | |
| Euro Dollar Terms (1.2%) | |
Bank of Montreal
1.88%, due 11/24/2004 | | | 473 | | | | 473 | | |
BNP Paribas
1.77%, due 11/10/2004 | | | 249 | | | | 249 | | |
| 1.80%, due 11/23/2004 | | | 200 | | | | 200 | | |
| 1.98%, due 12/27/2004 | | | 200 | | | | 200 | | |
Calyon
1.70%, due 11/24/2004 | | | 26 | | | | 26 | | |
Citigroup
2.06%, due 01/25/2005 | | | 499 | | | | 499 | | |
Den Danske Bank
1.82%, due 11/19/2004 | | | 250 | | | | 250 | | |
Dexia Group
2.04%, due 01/21/2005 | | | 116 | | | | 116 | | |
HBOS Halifax Bank of Scotland
2.03%, due 01/21/2005 | | | 100 | | | | 100 | | |
Royal Bank of Scotland
2.01%, due 01/20/2005 | | | 200 | | | | 200 | | |
Toronto Dominion Bank
1.70%, due 11/08/2004 | | | 100 | | | | 100 | | |
Wells Fargo
1.87%, due 11/22/2004 | | | 250 | | | | 250 | | |
The notes to the financial statements are an integral part of this report.
Transamerica IDEX Mutual Funds
Annual Report 2004
5
TA IDEX American Century International
SCHEDULE OF INVESTMENTS (continued)
At October 31, 2004
(all amounts except share amounts in thousands)
| | | Principal | | Value | |
| Promissory Notes (0.2%) | |
Goldman Sachs Group Inc.
1.88%, due 01/27/2005 | | $ | 349 | | | $ | 349 | | |
| 1.90%, due 12/29/2004 | | | 210 | | | | 210 | | |
| Repurchase Agreements (0.4%) | |
Merrill Lynch & Co., 1.92% Repurchase
Agreement dated 10/29/04 to be repurchased
at $799 on 11/01/04 (c) | | | 799 | | | | 799 | | |
| | | Shares | | Value | |
| Investment Companies (0.2%) | |
| Money Market Funds (0.2%) | |
Merrill Lynch Premier Institutional Fund
1-day yield of 1.71% | | | 245,648 | | | | $245 | | |
Merrimac Cash Fund, Premium Class
1-day yield of 1.46% | | | 179,763 | | | | 180 | | |
| Total Security Lending Collateral (cost: $6,142) | | | | | | | 6,142 | | |
| Total Investment Securities (cost: $195,813) | | | | | | $ | 217,458 | | |
| | | | | Value | |
| SUMMARY: | |
| Investments, at value | | | 100.2 | % | | $ | 217,458 | | |
| Liabilities in excess of other assets | | | (0.2 | )% | | | (531 | ) | |
| Net assets | | | 100.0 | % | | $ | 216,927 | | |
NOTES TO SCHEDULE OF INVESTMENTS:
(a) At October 31, 2004, all or a portion of this security is on loan (see Note 1). The value at October 31, 2004, of all securities on loan is $5,816.
(b) No dividends were paid during the preceding twelve months.
(c) Cash collateral for the Repurchase Agreements, valued at $815, that serve as collateral for securities lending are invested in corporate bonds with interest rates and maturity dates ranging from 0.00%–9.75% and 05/15/2005–9/15/2033, respectively.
DEFINITIONS:
144A 144A Securities are registered pursuant to the rule 144A of the Securities Act of 1933. These securities are deemed to be liquid for purposes of compliance limitations on holdings of illiquid securities and may be resold as transactions exempt from registration normally, to qualified institutional buyers. At October 31, 2004 these securities aggregated $449 or 0.2% of the net assets of the Fund.
ADR American Depositary Receipt
SDR Special Drawing Rights
The notes to the financial statements are an integral part of this report.
Transamerica IDEX Mutual Funds
Annual Report 2004
6
TA IDEX American Century International
SCHEDULE OF INVESTMENTS (continued)
At October 31, 2004
(all amounts except share amounts in thousands)
| | | Percentage of
Net Assets | | Value | |
| INVESTMENTS BY INDUSTRY: | |
| Commercial Banks | | | 15.5 | % | | $ | 33,593 | | |
| Petroleum Refining | | | 8.2 | % | | | 17,739 | | |
| Telecommunications | | | 6.5 | % | | | 14,035 | | |
| Pharmaceuticals | | | 5.3 | % | | | 11,626 | | |
| Automotive | | | 3.8 | % | | | 8,225 | | |
| Computer & Data Processing Services | | | 3.4 | % | | | 7,276 | | |
| Life Insurance | | | 3.3 | % | | | 7,123 | | |
| Oil & Gas Extraction | | | 3.2 | % | | | 6,826 | | |
| Chemicals & Allied Products | | | 3.1 | % | | | 6,542 | | |
| Wholesale Trade Durable Goods | | | 3.0 | % | | | 6,514 | | |
| Construction | | | 2.9 | % | | | 6,278 | | |
| Metal Mining | | | 2.8 | % | | | 6,042 | | |
| Rubber & Misc. Plastic Products | | | 2.6 | % | | | 5,655 | | |
| Radio & Television Broadcasting | | | 2.6 | % | | | 5,565 | | |
| Electronic Components & Accessories | | | 2.3 | % | | | 5,069 | | |
| Medical Instruments & Supplies | | | 2.3 | % | | | 5,002 | | |
| Instruments & Related Products | | | 2.3 | % | | | 4,942 | | |
| Industrial Machinery & Equipment | | | 2.0 | % | | | 4,442 | | |
| Electric Services | | | 1.9 | % | | | 4,399 | | |
| Insurance | | | 2.0 | % | | | 4,377 | | |
| Food Stores | | | 1.8 | % | | | 3,986 | | |
| Shoe Stores | | | 1.7 | % | | | 3,702 | | |
| Business Credit Institutions | | | 1.5 | % | | | 3,325 | | |
| Communications Equipment | | | 1.4 | % | | | 3,062 | | |
| Stone, Clay & Glass Products | | | 1.2 | % | | | 2,696 | | |
| Food & Kindred Products | | | 1.0 | % | | | 2,269 | | |
| Beer, Wine & Distilled Beverages | | | 1.0 | % | | | 2,178 | | |
| Textile Mill Products | | | 1.0 | % | | | 2,056 | | |
| Drug Stores & Proprietary Stores | | | 0.9 | % | | | 1,935 | | |
| Department Stores | | | 0.8 | % | | | 1,706 | | |
| Personal Credit Institutions | | | 0.7 | % | | | 1,585 | | |
| Primary Metal Industries | | | 0.7 | % | | | 1,447 | | |
| Retail Trade | | | 0.7 | % | | | 1,437 | | |
| Management Services | | | 0.6 | % | | | 1,232 | | |
| Amusement & Recreation Services | | | 0.6 | % | | | 1,203 | | |
| Water Transportation | | | 0.5 | % | | | 1,178 | | |
| Furniture & Fixtures | | | 0.4 | % | | | 949 | | |
| Computer & Office Equipment | | | 0.4 | % | | | 907 | | |
| Metal Cans & Shipping Containers | | | 0.4 | % | | | 897 | | |
| Transportation Equipment | | | 0.4 | % | | | 895 | | |
| Investment Companies | | | 0.4 | % | | | 732 | | |
| Engineering & Management Services | | | 0.3 | % | | | 669 | | |
| Investments, at value | | | 97.4 | % | | | 211,316 | | |
| Short-term investments | | | 2.8 | % | | | 6,142 | | |
| Liabilities in excess of other assets | | | (0.2 | )% | | | (531 | ) | |
| Net assets | | | 100.0 | % | | $ | 216,927 | | |
The notes to the financial statements are an integral part of this report.
Transamerica IDEX Mutual Funds
Annual Report 2004
7
TA IDEX American Century International
STATEMENT OF ASSETS AND LIABILITIES
At October 31, 2004
(all amounts except per share amounts in thousands)
| Assets: | | | |
Investment securities, at value (cost: $195,813)
(including securities loaned of $5,816) | | $ | 217,458 | | |
| Cash | | | 6,246 | | |
| Receivables: | |
| Investment securities sold | | | 1,446 | | |
| Shares of beneficial interest sold | | | 26 | | |
| Interest | | | 4 | | |
| Dividends | | | 193 | | |
| Dividend reclaims receivable | | | 161 | | |
| Other | | | 6 | | |
| | | | 225,540 | | |
| Liabilities: | | | |
| Investment securities purchased | | | 1,980 | | |
| Accounts payable and accrued liabilities: | |
| Shares of beneficial interest redeemed | | | 95 | | |
| Management and advisory fees | | | 185 | | |
| Distribution fees | | | 80 | | |
| Transfer agent fees | | | 43 | | |
| Payable for collateral for securities on loan | | | 6,142 | | |
| Other | | | 88 | | |
| | | | 8,613 | | |
| Net Assets | | $ | 216,927 | | |
| Net Assets Consist of: | | | |
Shares of beneficial interest, unlimited shares
authorized, no par value | | $ | 214,625 | | |
| Accumulated net investment income (loss) | | | 229 | | |
Accumulated net realized gain (loss) from investment
securities and foreign currency transactions | | | (19,585 | ) | |
| Net unrealized appreciation (depreciation) on: | |
| Investment securities | | | 21,645 | | |
Translation of assets and liabilites denominated in
foreign currencies | | | 13 | | |
| Net Assets | | $ | 216,927 | | |
| Net Assets by Class: | | | |
| Class A | | $ | 187,608 | | |
| Class B | | | 20,153 | | |
| Class C | | | 9,166 | | |
| Shares Outstanding: | | | |
| Class A | | | 21,287 | | |
| Class B | | | 2,396 | | |
| Class C | | | 1,092 | | |
| Net Asset Value Per Share: | | | |
| Class A | | $ | 8.81 | | |
| Class B | | | 8.41 | | |
| Class C | | | 8.40 | | |
| Maximum Offering Price Per Share (a): | | | |
| Class A | | $ | 9.32 | | |
(a) Includes the maximum selling commission (represented as a percentage of offering price) which is reduced on certain levels of sales as set forth in the Prospectus. Net asset value per share for Classes B and C shares represents offering price. The redemption price for Classes B and C shares equals net asset value less any applicable contingent deferred sales charge.
STATEMENT OF OPERATIONS
For the year ended October 31, 2004
(all amounts in thousands)
| Investment Income: | | | |
| Interest | | $ | 16 | | |
| Dividends | | | 3,968 | | |
| Income from loaned securities–net | | | 25 | | |
| Less withholding taxes on foreign dividends | | | (413 | ) | |
| | | | 3,596 | | |
| Expenses: | | | |
| Management and advisory fees | | | 2,040 | | |
| Transfer agent fees: | |
| Class A | | | 198 | | |
| Class B | | | 2 | | |
| Class C | | | – | | |
| Class C2 | | | 5 | | |
| Class M | | | 3 | | |
| Printing and shareholder reports | | | 30 | | |
| Custody fees | | | 281 | | |
| Administration fees | | | 35 | | |
| Legal fees | | | 8 | | |
| Audit and accounting fees | | | 25 | | |
| Trustees fees | | | 14 | | |
| Registration fees: | |
| Class A | | | 41 | | |
| Class B | | | – | | |
| Class C | | | 11 | | |
| Class C2 | | | 1 | | |
| Class M | | | 1 | | |
| Other | | | 13 | | |
| Distribution and service fees: | |
| Class A | | | 661 | | |
| Class B | | | 212 | | |
| Class C | | | 31 | | |
| Class C2 | | | 37 | | |
| Class M | | | 26 | | |
| Total expenses | | | 3,675 | | |
| Reimbursement of class expenses: | | | | | |
| Class C | | | (3 | ) | |
| Net expenses | | | 3,672 | | |
| Net Investment Income (Loss) | | | (76 | ) | |
| Net Realized Gain (Loss) from: | | | |
| Investment securities | | | 17,792 | | |
| Foreign currency transactions | | | (1,636 | ) | |
| | | | 16,156 | | |
| Net Increase (Decrease) in Unrealized Appreciation on: | | | |
| Investment securities | | | 4,501 | | |
Translation of assets and liabilities denominated in
foreign currencies | | | 5 | | |
| | | | 4,506 | | |
Net Gain (Loss) on Investments and Foreign
Currency Transactions | | | 20,662 | | |
Net Increase (Decrease) in Net Assets Resulting
from Operations | | $ | 20,586 | | |
The notes to the financial statements are an integral part of this report.
Transamerica IDEX Mutual Funds
Annual Report 2004
8
TA IDEX American Century International
STATEMENTS OF CHANGES IN NET ASSETS
For the years ended
(all amounts in thousands)
| | | October 31,
2004 | | October 31,
2003 | |
| Increase (Decrease) in Net Assets From: | | | |
| Operations: | | | |
| Net investment income (loss) | | $ | (76 | ) | | $ | 37 | | |
Net realized gain (loss) from
investment securities and foreign
currency transactions | | | 16,156 | | | | (8,282 | ) | |
Net unrealized appreciation
(depreciation) on investment
securities and foreign currency
transactions | | | 4,506 | | | | 27,819 | | |
| | | | 20,586 | | | | 19,574 | | |
| Distributions to Shareholders: | | | |
| From net investment income: | |
| Class A | | | (410 | ) | | | – | | |
| Class B | | | (47 | ) | | | – | | |
| Class C | | | (2 | ) | | | – | | |
| Class C2 | | | (12 | ) | | | – | | |
| Class M | | | (7 | ) | | | – | | |
| | | | (478 | ) | | | – | | |
| Capital Share Transactions: | | | |
| Proceeds from shares sold: | |
| Class A | | | 43,204 | | | | 166,990 | | |
| Class B | | | 2,535 | | | | 6,031 | | |
| Class C | | | 920 | | | | 499 | | |
| Class C2 | | | 476 | | | | 3,919 | | |
| Class M | | | 358 | | | | 1,197 | | |
| | | | 47,493 | | | | 178,636 | | |
| Proceeds from fund acquisition: | |
| Class A | | | – | | | | 11,819 | | |
| Class B | | | – | | | | 15,256 | | |
| Class C | | | – | | | | 43 | | |
| Class C2 | | | – | | | | 5,043 | | |
| Class M | | | – | | | | 2,412 | | |
| | | | – | | | | 34,573 | | |
Dividends and distributions
reinvested: | |
| Class A | | | 409 | | | | – | | |
| Class B | | | 44 | | | | – | | |
| Class C | | | 2 | | | | – | | |
| Class C2 | | | 11 | | | | – | | |
| Class M | | | 7 | | | | – | | |
| | | | 473 | | | | – | | |
| Cost of shares redeemed: | |
| Class A | | | (25,540 | ) | | | (63,205 | ) | |
| Class B | | | (5,662 | ) | | | (5,349 | ) | |
| Class C | | | (842 | ) | | | (119 | ) | |
| Class C2 | | | (1,501 | ) | | | (2,519 | ) | |
| Class M | | | (879 | ) | | | (770 | ) | |
| | | | (34,424 | ) | | | (71,962 | ) | |
| Class level exchanges: | |
| Class C | | | 8,249 | | | | – | | |
| Class C2 | | | (5,368 | ) | | | – | | |
| Class M | | | (2,881 | ) | | | – | | |
| | | | – | | | | – | | |
| Automatic conversions: | |
| Class A | | | 9 | | | | – | | |
| Class B | | | (9 | ) | | | – | | |
| | | | – | | | | – | | |
| | | | 13,542 | | | | 141,247 | | |
| Net increase (decrease) in net assets | | | 33,650 | | | | 160,821 | | |
| | | October 31,
2004 | | October 31,
2003 | |
| Net Assets: | | | |
| Beginning of year | | | 183,277 | | | | 22,456 | | |
| End of year | | $ | 216,927 | | | $ | 183,277 | | |
Accumulated Net Investment Income
(Loss) | | $ | 229 | | | $ | (2 | ) | |
| Share Activity: | | | |
| Shares issued: | |
| Class A | | | 5,293 | | | | 24,009 | | |
| Class B | | | 308 | | | | 332 | | |
| Class C | | | 112 | | | | 84 | | |
| Class C2 | | | 58 | | | | 134 | | |
| Class M | | | 43 | | | | 18 | | |
| | | | 5,814 | | | | 24,577 | | |
| Shares issued on fund acquisition: | |
| Class A | | | – | | | | 1,824 | | |
| Class B | | | – | | | | 2,449 | | |
| Class C | | | – | | | | 7 | | |
| Class C2 | | | – | | | | 809 | | |
| Class M | | | – | | | | 387 | | |
| | | | – | | | | 5,476 | | |
Shares issued–reinvested from
distributions: | |
| Class A | | | 47 | | | | – | | |
| Class B | | | 5 | | | | – | | |
| Class C2 | | | 1 | | | | – | | |
| Class M | | | 1 | | | | – | | |
| | | | 54 | | | | – | | |
| Shares redeemed: | |
| Class A | | | (2,998 | ) | | | (9,020 | ) | |
| Class B | | | (698 | ) | | | (787 | ) | |
| Class C | | | (103 | ) | | | (17 | ) | |
| Class C2 | | | (183 | ) | | | (369 | ) | |
| Class M | | | (105 | ) | | | (113 | ) | |
| | | | (4,087 | ) | | | (10,306 | ) | |
| Class level exchanges: | |
| Class C | | | 1,009 | | | | – | | |
| Class C2 | | | (654 | ) | | | – | | |
| Class M | | | (353 | ) | | | – | | |
| | | | 2 | | | | – | | |
| Automatic conversions: | |
| Class A | | | 1 | | | | – | | |
| Class B | | | (1 | ) | | | – | | |
| | | | – | | | | – | | |
Net increase (decrease) in shares
outstanding: | |
| Class A | | | 2,343 | | | | 16,813 | | |
| Class B | | | (386 | ) | | | 1,994 | | |
| Class C | | | 1,018 | | | | 74 | | |
| Class C2 | | | (778 | ) | | | 574 | | |
| Class M | | | (414 | ) | | | 292 | | |
| | | | 1,783 | | | | 19,747 | | |
The notes to the financial statements are an integral part of this report.
Transamerica IDEX Mutual Funds
Annual Report 2004
9
TA IDEX American Century International
FINANCIAL HIGHLIGHTS
| | | | | For a share of beneficial interest outstanding throughout each period | |
| | | | | Net Asset | | Investment Operations | | Distributions | | Net Asset | |
| | | For the
Period
Ended (d)(g) | | Value,
Beginning
of Period | | Net
Investment
Income (Loss) | | Net Realized
and Unrealized
Gain (Loss) | | Total
Operations | | From Net
Investment
Income | | From Net
Realized
Gains | | Total
Distributions | | Value,
End
of Period | |
| Class A | | 10/31/2004 | | $ | 8.03 | | | $ | – | | | $ | 0.80 | | | $ | 0.80 | | | $ | (0.02 | ) | | $ | – | | | $ | (0.02 | ) | | $ | 8.81 | | |
| | | 10/31/2003 | | | 7.00 | | | | 0.02 | | | | 1.01 | | | | 1.03 | | | | – | | | | – | | | | – | | | | 8.03 | | |
| | | 10/31/2002 | | | 8.38 | | | | 0.01 | | | | (1.39 | ) | | | (1.38 | ) | | | – | | | | – | | | | – | | | | 7.00 | | |
| | | 10/31/2001 | | | 12.76 | | | | 0.05 | | | | (3.05 | ) | | | (3.00 | ) | | | – | | | | (1.38 | ) | | | (1.38 | ) | | | 8.38 | | |
| | | 10/31/2000 | | | 12.85 | | | | 0.05 | | | | 0.35 | | | | 0.40 | | | | – | | | | (0.49 | ) | | | (0.49 | ) | | | 12.76 | | |
| Class B | | 10/31/2004 | | | 7.70 | | | | (0.04 | ) | | | 0.77 | | | | 0.73 | | | | (0.02 | ) | | | – | | | | (0.02 | ) | | | 8.41 | | |
| | | 10/31/2003 | | | 6.76 | | | | (0.03 | ) | | | 0.97 | | | | 0.94 | | | | – | | | | – | | | | – | | | | 7.70 | | |
| | | 10/31/2002 | | | 8.15 | | | | (0.04 | ) | | | (1.35 | ) | | | (1.39 | ) | | | – | | | | – | | | | – | | | | 6.76 | | |
| | | 10/31/2001 | | | 12.53 | | | | (0.02 | ) | | | (2.98 | ) | | | (3.00 | ) | | | – | | | | (1.38 | ) | | | (1.38 | ) | | | 8.15 | | |
| | | 10/31/2000 | | | 12.70 | | | | (0.03 | ) | | | 0.35 | | | | 0.32 | | | | – | | | | (0.49 | ) | | | (0.49 | ) | | | 12.53 | | |
| Class C | | 10/31/2004 | | | 7.70 | | | | (0.09 | ) | | | 0.81 | | | | 0.72 | | | | (0.02 | ) | | | – | | | | (0.02 | ) | | | 8.40 | | |
| | | 10/31/2003 | | | 6.73 | | | | (0.03 | ) | | | 1.00 | | | | 0.97 | | | | – | | | | – | | | | – | | | | 7.70 | | |
| | | | | | | Ratios/Supplemental Data | |
| | | For the
Period | | Total | | Net Assets,
End of
Period | | Ratio of Expenses
to Average
Net Assets (a) | | Net Investment
Income (Loss)
to Average | | Portfolio
Turnover | |
| | | Ended (g) | | Return (c) | | (000's) | | Net (e) | | Total (f) | | Net Assets (a) | | Rate (b) | |
| Class A | | 10/31/2004 | | | 9.95 | % | | $ | 187,608 | | | | 1.59 | % | | | 1.59 | % | | | (0.05 | )% | | | 159 | % | |
| | | 10/31/2003 | | | 14.71 | | | | 152,086 | | | | 1.78 | | | | 2.39 | | | | 0.23 | | | | 220 | | |
| | | 10/31/2002 | | | (16.49 | ) | | | 14,921 | | | | 1.87 | | | | 3.68 | | | | 0.22 | | | | 241 | | |
| | | 10/31/2001 | | | (26.43 | ) | | | 5,209 | | | | 1.55 | | | | 2.77 | | | | 0.47 | | | | 129 | | |
| | | 10/31/2000 | | | 2.74 | | | | 6,977 | | | | 1.62 | | | | 3.56 | | | | 0.09 | | | | 108 | | |
| Class B | | 10/31/2004 | | | 9.46 | | | | 20,153 | | | | 2.09 | | | | 2.09 | | | | (0.46 | ) | | | 159 | | |
| | | 10/31/2003 | | | 13.91 | | | | 21,421 | | | | 2.44 | | | | 3.05 | | | | (0.42 | ) | | | 220 | | |
| | | 10/31/2002 | | | (17.09 | ) | | | 5,328 | | | | 2.52 | | | | 4.33 | | | | (0.43 | ) | | | 241 | | |
| | | 10/31/2001 | | | (26.96 | ) | | | 5,003 | | | | 2.20 | | | | 3.42 | | | | (0.18 | ) | | | 129 | | |
| | | 10/31/2000 | | | 2.09 | | | | 4,407 | | | | 2.27 | | | | 4.21 | | | | (0.56 | ) | | | 108 | | |
| Class C | | 10/31/2004 | | | 9.33 | | | | 9,166 | | | | 2.40 | | | | 2.49 | | | | (1.07 | ) | | | 159 | | |
| | | 10/31/2003 | | | 14.41 | | | | 568 | | | | 2.44 | | | | 3.04 | | | | (0.42 | ) | | | 220 | | |
NOTES TO FINANCIAL HIGHLIGHTS
(a) Annualized.
(b) Not annualized for periods of less than one year.
(c) Total Return has been calculated for the applicable period without deduction of a sales load, if any, on an initial purchase. Periods of less than one year are not annualized.
(d) Per share information is calculated based on average number of shares outstanding for the years ended 10/31/2001, 10/31/2002, 10/31/2003 and 10/31/2004.
(e) Ratio of Net Expenses to Average Net Assets is net of fee waivers and reimbursements by the investment adviser, if any (see note 2).
(f) Ratio of Total Expenses to Average Net Assets includes all expenses before fee waivers and reimbursements by the investment adviser.
(g) The inception date for the Fund's offering of share Class L was November 11, 2002. Class L was renamed Class C on March 1, 2004 (see note 1).
The notes to the financial statements are an integral part of this report.
Transamerica IDEX Mutual Funds
Annual Report 2004
10
TA IDEX American Century International
NOTES TO FINANCIAL STATEMENTS
At October 31, 2004
(all amounts in thousands)
NOTE 1. ORGANIZATION AND SIGNIFICANT ACCOUNTING POLICIES
Transamerica IDEX Mutual Funds, formerly IDEX Mutual Funds, is a Massachusetts business trust registered under the Investment Company Act of 1940, as amended (the "1940 Act"), as an open-end management investment company. TA IDEX American Century International ("the Fund"), part of Transamerica IDEX Mutual Funds, began operations on February 1, 1997.
On March 1, 2004, the Fund changed its name from IDEX American Century International to TA IDEX American Century International.
On March 1, 2003, the Fund acquired all the net assets of IDEX Gabelli Global Growth pursuant to a plan of reorganization approved by shareholders of IDEX Gabelli Growth on February 12, 2003. The acquisition was accomplished by a tax-free exchange of 5,476 shares of the Fund for the 6,190 shares of IDEX Gabelli Growth outstanding on February 28, 2003. IDEX Gabelli Global Growth's net assets at that date ($34,573), including ($10,073) of unrealized depreciation, were combined with those of the Fund. Proceeds in connection with the acquisition were as follows:
| | | Shares | | Amount | |
| Proceeds in connection with the acquisition | |
| Class A | | | 1,824 | | | $ | 11,819 | | |
| Class B | | | 2,449 | | | | 15,256 | | |
| Class C | | | 7 | | | | 43 | | |
| Class C2 | | | 809 | | | | 5,043 | | |
| Class M | | | 387 | | | | 2,412 | | |
| | | | | | | $ | 34,573 | | |
In the normal course of business, the Fund enters into contracts that contain a variety of representations and warranties, which provide general indemnifications. The Fund's maximum exposure under these arrangements is unknown, as this would involve future claims that may be made against the Fund and/or its affiliates that have not yet occurred. However, based on experience, the Fund expects the risk of loss to be remote.
See the Prospectus and Statement of Additional Information for a description of the Fund's investment objective.
In preparing the Fund's financial statements in accordance with accounting principles generally accepted in the United States of America ("GAAP"), estimates or assumptions (which could differ from actual results) may be used that affect reported amounts and disclosures. The following policies were consistently followed by the Fund, in accordance with GAAP.
Multiple class operations and expenses: The Fund currently offers three classes of shares, each with a public offering price that reflects different sales charges, if any, and expense levels. All shares designated as Class C shares prior to March 1, 2004, were renamed as Class C2 shares on that date. All shares designated as Class L shares prior to March 1, 2004, were renamed as Class C shares with different sales charges than the previous Class L shares. On June 15, 2004, Class C2 shares merged into Class C. On September 24, 2004, Class M shares merged into Class C. Class B shares will convert to Class A shares eight years after purchase. Income, non-class specific expenses and realized and unrealized gains and losses, are allo cated daily to each class, based upon the value of shares outstanding method as permitted under Rule 18f-3 of the 1940 Act. Each class bears its own specific expenses as well as a portion of general, common expenses.
Pricing of shares: The Fund prices its shares on the basis of the net asset value of each class of shares of the Fund, which is determined as of the close of the New York Stock Exchange ("NYSE") (generally 4:00 p.m. Eastern Time) on each day on which the NYSE is open for trading (other than a day on which there are insufficient changes in the value of the Fund's portfolio securities to materially affect the Fund's net asset value or a day on which no shares are tendered for redemption and no order to purchase any shares is received).
Security valuations: Fund investments traded on an exchange are valued at the closing price on the day of valuation on the exchange where the security is principally traded. With respect to securities traded on NASDAQ NMS, such closing price may be the last reported sales price or the NASDAQ Official Closing Price.
Securities traded in the over-the-counter market and listed securities for which no sale was reported on that date are valued at the last quoted bid price.
Debt securities are valued by independent pricing services; however, those that mature in sixty days or less are valued at amortized cost, which approximates market.
Investment company securities are valued at net asset value of the underlying portfolio.
Foreign securities generally are valued based on quotations from the primary market in which they are traded and are translated from the local currency into U.S. dollars using closing exchange rates. Many foreign securities markets are open for trading at times when the U.S. markets are closed for trading, and many foreign securities markets close for trading before the close of the NYSE. The value of foreign securities may be affected significantly on a day that the NYSE is closed and an investor is unable to purchase or redeem shares. If a significant market event impacting the value of a portfolio security (e.g., natural disaster, company announcement, market volatility) occurs subsequent to the close of trading in the security, but prior to the calculation of the Fund's net asset value per share, market quotations for that security may be determined to be unreliable and, accordingly, not "readily
Transamerica IDEX Mutual Funds
Annual Report 2004
11
TA IDEX American Century International
NOTES TO FINANCIAL STATEMENTS (continued)
At October 31, 2004
(all amounts in thousands)
NOTE 1.–(continued)
available." If market quotations are not readily available, and the impact of such a significant market event materially effects the net asset value per share of the Fund, an affected portfolio security will be valued at fair market value as determined in good faith using guidelines adopted by the Board of Trustees of the Fund, under the supervision of the Fund's Valuation Committee. Factors that may be considered to value foreign securities at fair market value may include, among others: the value of other securities traded on other markets, foreign currency exchange activity and the trading of financial products tied to foreign securities.
Other securities for which quotations are not readily available are valued at fair market value as determined in good faith using guidelines adopted by the Board of Trustees of the Fund, under the supervision of the Fund's Valuation Committee.
The Fund values its investment securities at fair value based upon procedures approved by the Board of Trustees on days when significant events occur after the close of the principal exchange on which the securities are traded, and as a result, are expected to materially effect the value of investments.
Cash: The Fund may leave cash overnight in its cash account with the custodian, Investors Bank & Trust Company ("IBT"). IBT has been contracted on behalf of the Fund to invest the excess cash into a savings account, which at October 31, 2004, was paying an interest rate of 1.30%.
Throughout the year, the Fund may have a cash overdraft balance. A fee is incurred on this overdraft, calculated by multiplying the overdraft by a rate based on the federal funds rate. This fee is included in Custody fees in the Statement of Operations.
Repurchase agreements: The Fund is authorized to enter into repurchase agreements. The Fund, through IBT, receives delivery of the underlying securities, the value of which at the time of purchase is required to be an amount equal to at least 100% of the resale price. Repurchase agreements involve the risk that the seller will fail to repurchase the security, as agreed. In that case, the Fund will bear the risk of value fluctuations until the security can be sold and may encounter delays and incur costs in liquidating the security. In the event of bankruptcy or insolvency of the seller, delays and costs may be incurred.
Securities lending: The Fund may lend securities to enhance fund earnings from investing cash collateral in making such loans to qualified borrowers (typically broker/dealers). The Fund has engaged its custodian bank, IBT, as a lending agent to administer its securities lending program. IBT earned $11 of program income for its services. When the Fund makes a security loan, it receives cash collateral as protection against the risk that the borrower will default on the loan, and records an asset for the cash invested collateral and a liability for the return of the collateral.
Securities on loan are included in Investment securities at value in the Statement of Assets and Liabilities and remain on the Schedule of Investments.
Loans of securities are required to be secured by collateral at least equal to 102% of the value of the securities at inception of the loan, and not less then 100% thereafter. The Fund may invest cash collateral in short-term money market instruments including: U.S. Treasury Bills, U.S. agency obligations, commercial paper, money market mutual funds, repurchase agreements and other highly rated, liquid investments. During the life of securities loans, the collateral and securities loaned remain subject to fluctuation in value. IBT marks to market securities loaned and the collateral each business day. If additional collateral is due (at least $1), IBT collects additional cash collateral from the borrowers. Although securities loaned will be fully collateralized at all times, IBT may experience delays in, or may be prevented from, recovering the collateral on behalf of the Fund. The Fund may recall a loa ned security position at any time from the borrower through IBT. In the event the borrower fails to timely return a recalled security, IBT may indemnify the Fund by purchasing replacement securities for the Fund at its own expense and claiming the collateral to fund such a purchase. IBT absorbs the loss if the collateral value is not sufficient to cover the cost of the replacement securities. If replacement securities are not available, IBT will credit the equivalent cash value to the Fund.
While a security is on loan, the Fund does not have the right to vote that security. However, if time permits, the Fund will attempt to recall a security on loan and vote the proxy.
Income from securities lending is included in the Statement of Operations. The amount of collateral and value of securities on loan are included in the Statement of Assets and Liabilities as well as in the Schedule of Investments.
Security transactions and investment income: Security transactions are recorded on the trade date. Security gains and losses are calculated on the specific identification basis. Dividend income is recorded on the ex-dividend date or, in the case of foreign securities, as soon as the Fund is informed of the ex-dividend date. Interest income, including accretion of discounts and amortization of premiums, is recorded on the accrual basis commencing on the settlement date.
Foreign currency denominated investments: The accounting records of the Fund are maintained in U.S. dollars. Securities and other assets and liabilities denominated in foreign currencies are translated into U.S. dollars at the closing exchange rate each day. The cost of foreign securities is translated at the exchange rate in effect when the investment was acquired. The Fund combines fluctuations from currency exchange rates and fluctuations in value when computing net realized and unrealized gains or losses from investments.
Transamerica IDEX Mutual Funds
Annual Report 2004
12
TA IDEX American Century International
NOTES TO FINANCIAL STATEMENTS (continued)
At October 31, 2004
(all amounts in thousands)
NOTE 1.–(continued)
Net foreign currency gains and losses resulting from changes in exchange rates include: 1) foreign currency fluctuations between trade date and settlement date of investment security transactions; 2) gains and losses on forward foreign currency contracts; and 3) the difference between the receivable amounts of interest and dividends recorded in the accounting records in U.S. dollars and the amounts actually received.
Foreign currency denominated assets may involve risks not typically associated with domestic transactions, including unanticipated movements in exchange currency rates, the degree of government supervision and regulation of security markets, and the possibility of political or economic instability.
Foreign capital gains taxes: The Fund may be subject to taxes imposed by countries in which it invests, with respect to its investment in issuers existing or operating in such countries. Such taxes are generally based on income earned or repatriated and capital gains realized on the sale of such investments. The Fund accrues such taxes when the related income or capital gains are earned. Some countries require governmental approval for the repatriation of investment income, capital or the proceeds of sales earned by foreign investors. In addition, if there is deterioration in a country's balance of payments or for other reasons, a country may impose temporary restrictions on foreign capital remittances abroad.
Forward foreign currency contracts: The Fund may enter into forward foreign currency contracts to hedge against exchange rate risk arising from investments in securities denominated in foreign currencies. Contracts are valued at the contractual forward rate and are marked to market daily, with the change in value recorded as an unrealized gain or loss. When the contracts are closed a realized gain or loss is incurred. Risks may arise from changes in market value of the underlying currencies and from the possible inability of counterparties to meet the terms of their contracts.
Account maintenance fees: If the shareholder account balance falls below $1 by either shareholder action or as a result of market action, a $25 (not in thousands) fee is assessed every year until the balance reaches $1. The fee is assessed by redeeming shares in the shareholder's account.
No fee will be charged under the following conditions:
• accounts opened within the preceding 24 months
• accounts with an active monthly Automatic Investment Plan ($50 (not in thousands) minimum per fund)
• accounts owned by an individual which, when combined by social security number, have a balance of $5 or more
• accounts owned by individuals in the same household (by address) that have a combined balance of $5 or more
• UTMA/UGMA accounts
• Fiduciary accounts
• B-share accounts whose shares have started to convert to A-shares accounts (as long as combined value of both accounts is at least $1)
For the year ended October 31, 2004, this fee totaled $1. These fees are included in Paid in Capital in the Statement of Assets and Liabilities.
Redemption fees: A short-term trading redemption fee may be assessed on any fund shares in a fund account that are sold during the first five (5) New York Stock Exchange trading days following their purchase date. This redemption fee will equal 2% of the amount redeemed and shares held the longest will be treated as being redeemed first and shares held the shortest as being redeemed last. For the year ended October 31, 2004, the Fund received no redemption fees.
Dividend distributions: Distributions to shareholders are recorded on the ex-dividend date and are determined in accordance with Federal income tax regulations which may differ from GAAP.
NOTE 2. RELATED PARTY TRANSACTIONS
AEGON/Transamerica Fund Advisers, Inc. ("ATFA") is the Fund's investment adviser. AEGON/Transamerica Fund Services, Inc. ("ATFS") is the Fund's administrator. AFSG Securities Corp. ("AFSG") is the Fund's distributor/principal underwriter. AEGON/Transamerica Investor Services, Inc. ("ATIS") is the Fund's transfer agent. ATIS and AFSG are 100% owned by AUSA Holding Company ("AUSA"). ATFA is a directly owned subsidiary of Western Reserve Life Assurance Co. of Ohio (78%) ("WRL") and AUSA (22%). ATFS is a wholly owned subsidiary of WRL. AUSA and WRL are wholly owned indirect subsidiaries of AEGON NV, a Netherlands corporation.
The following schedule reflects the percentage of fund assets owned by affiliated mutual funds (i.e.: through the assets allocation funds):
| | | Net
Assets | | % of
Net Assets | |
TA IDEX Asset Allocation–
Growth Portfolio | | $ | 49,765 | | | | 23 | % | |
TA IDEX Asset Allocation–
Moderate Growth Portfolio | | | 88,854 | | | | 41 | % | |
TA IDEX Asset Allocation–
Moderate Portfolio | | | 35,186 | | | | 16 | % | |
| Total | | $ | 173,805 | | | | 80 | % | |
Transamerica IDEX Mutual Funds
Annual Report 2004
13
TA IDEX American Century International
NOTES TO FINANCIAL STATEMENTS (continued)
At October 31, 2004
(all amounts in thousands)
NOTE 2.–(continued)
Investment advisory fee: The Fund pays management fees to ATFA based on average daily net assets ("ANA") at the following breakpoints:
1.00% of the first $50 million of ANA
0.95% of the next $100 million of ANA
0.90% of the next $350 million of ANA
0.85% of the next $500 million of ANA
0.80% of ANA over $1 billion
ATFA has contractually agreed to waive its advisory fee and will reimburse the Fund to the extent that operating expenses, excluding 12b-1 fees, exceed the following stated annual limit:
1.40% Expense Limit
If total fund expenses fall below the annual expense limitation agreement agreed to by the adviser within the succeeding three years, the Fund may be required to pay that adviser a portion or all of the waived advisory fees.
| | | Advisory Fee
Waived | | Available for
Recapture Through | |
| Fiscal Year 2003 | | $ | 473 | | | 10/31/2006 | |
If total class expenses fall below the annual expense limitation agreement agreed to by the adviser within the succeeding three years, the Fund may be required to pay that adviser a portion or all of the reimbursed class expenses.
Reimbursement
Fiscal Year 2004 | | Available for
of Class Expenses | | Recapture Through | |
| Class C | | | 3 | | | 10/31/2007 | |
Distribution and service fees: The Fund has a 12b-1 distribution plan under the 1940 Act pursuant to which an annual fee, based on average daily net assets, is paid to the distributor for various disbursements such as broker-dealer account servicing fees and other promotional expenses of the Fund. The Fund is authorized under the 12b-1 plan to pay fees on each class up to the following limits:
| Class A | | | 0.35 | % | |
| Class B | | | 1.00 | % | |
| Class C | | | 1.00 | % | |
| Class C2 | | | 1.00 | % | |
| Class M | | | 0.90 | % | |
Class C2 and Class M merged into Class C on June 15, 2004 and September 24, 2004, respectively.
In the case the Fund or a class of shares of the Fund is closed to new investors or investments, the Fund is authorized to pay 12b-1 fees for past sales and distribution efforts and present and past investor services.
Underwriter commissions relate to front-end sales charges imposed for Class A and M shares and contingent deferred sales charges from Classes B, C, M and certain A share redemptions. For the year ended October 31, 2004, the underwriter commissions were as follows:
| Received by Underwriter | | $ | 245 | | |
| Retained by Underwriter | | | 9 | | |
| Contingent Deferred Sales Charge | | | 70 | | |
Administrative services: The Fund has entered into an agreement with ATFS for financial and legal fund administration services, which includes such items as compliance, expenses, financial statements and other reporting, distributions, tax returns, prospectus preparation, board of trustees meeting support and other legal matters. The Fund pays ATFS an annual fee of 0.015% of average net assets. The Legal fees on the Statement of Operations are for fees paid to external legal counsel.
The Fund paid ATFS $35 for the year ended October 31, 2004.
Transfer agent fees: The Fund pays ATIS an annual per-account charge of $20 (not in thousands) for each open account and $1.63 (not in thousands) for each closed account. There is no new account charge. The transfer agent fees on the Statement of Operations are made up of fees paid to ATIS and costs associated with shareholder statements. The Fund paid ATIS $208 for the year ended October 31, 2004.
Deferred compensation plan: Each eligible Fund Trustee may elect participation in the Deferred Compensation Plan ("the Plan"). Under the Plan, such Trustees may defer payment of a percentage of their total fees earned as a Fund Trustee. These deferred amounts may be invested in any Transamerica IDEX Mutual Fund. At October 31, 2004, the value of invested plan amounts was $5. Invested plan amounts and the total liability for deferred compensation to the Trustees under the Plan at October 31, 2004, are included in the accompanying Statement of Assets and Liabilities.
NOTE 3. INVESTMENT TRANSACTIONS
The cost of securities purchased and proceeds from securities sold (excluding short-term securities) for the year ended October 31, 2004, were as follows:
| Purchases of securities: | | | |
| Long-Term excluding U.S. Government | | $ | 354,768 | | |
| U.S. Government | | | – | | |
| Proceeds from maturities and sales of securities | | | |
| Long-Term excluding U.S. Government | | | 341,689 | | |
| U.S. Government | | | – | | |
Transamerica IDEX Mutual Funds
Annual Report 2004
14
TA IDEX American Century International
NOTES TO FINANCIAL STATEMENTS (continued)
At October 31, 2004
(all amounts in thousands)
NOTE 4. FEDERAL INCOME TAX MATTERS
The Fund has not made any provision for federal income or excise taxes due to its policy to distribute all of its taxable income and capital gains to its shareholders and otherwise qualify as a regulated investment company under the Internal Revenue Code. Income and capital gain distributions are determined in accordance with income tax regulations, which may differ from GAAP. These differences are primarily due to differing treatment for items including, but not limited to, wash sales, passive foreign investment companies and capital loss carryforwards.
Reclassifications between Undistributed net investment income (loss), Undistributed net realized capital gains (loss) and Shares of beneficial interest are made to reflect income and gains available for distribution under federal tax regulations. Results of operations and net assets are not effected by these reclassifications. These reclassifications are as follows:
Shares of beneficial interest, unlimited
shares authorized | | $ | (2 | ) | |
| Undistributed net investment income (loss) | | | 785 | | |
Accumulated net realized gain (loss) from investment
securities and foreign currency transactions | | | (783 | ) | |
The capital loss carryforwards are available to offset future realized capital gains through the period listed:
Capital Loss
Carryforward | | Available through | |
| $ | 7,221 | | | October 31, 2009 | |
| | 4,182 | | | October 31, 2010 | |
| | 8,018 | | | October 31, 2011 | |
The capital loss carryforward utilized during the year ended October 31, 2004 was $14,986. The capital loss carryforward was limited due to capital loss carryforward limitations related to fund acquisitions.
The tax character of distributions paid may differ from the character of distributions shown in the Statement of Changes in Net Assets due to short-term gains being treated as ordinary income for tax purposes. The tax character of distributions paid during 2003 and 2004 was as follows:
| 2003 Distributions paid from: | | | |
| Ordinary Income | | $ | – | | |
| Long-term capital gain | | | – | | |
| 2004 Distributions paid from: | | | |
| Ordinary Income | | $ | 478 | | |
| Long-term capital gain | | | – | | |
The tax basis components of distributable earnings as of October 31, 2004, are as follows:
| Undistributed Ordinary Income | | $ | 937 | | |
| Undistributed Long-term Capital Gains | | $ | – | | |
| Capital Loss Carryforward | | $ | (19,421 | ) | |
| Net Unrealized Appreciation (Depreciation) | | $ | 20,787 | * | |
* Amount includes unrealized appreciation (depreciation) from foreign currency and deferred compensation.
The aggregate cost of investments and composition of unrealized appreciation (depreciation) for federal income tax purposes as of October 31, 2004, are as follows:
| Federal Tax Cost Basis | | $ | 196,684 | | |
| Unrealized Appreciation | | $ | 20,774 | | |
| Unrealized (Depreciation) | | | – | | |
| Net Unrealized Appreciation (Depreciation) | | $ | 20,774 | | |
NOTE 5. OTHER MATTERS
Transamerica IDEX Mutual Funds ("TA IDEX"), and certain of its affiliated entities, have received requests for information from the Staff of the Securities and Exchange Commission in connection with market timing and late trading within the funds. TA IDEX and the affiliated entities have voluntarily cooperated in the investigation and have been providing the information as requested.
Transamerica IDEX Mutual Funds
Annual Report 2004
15
Report of Independent Registered Certified Public Accounting Firm
To the Board of Trustees and Shareholders of
TA IDEX American Century International
In our opinion, the accompanying statement of assets and liabilities, including the schedule of investments, and the related statements of operations and of changes in net assets and the financial highlights present fairly, in all material respects, the financial position of TA IDEX American Century International (the "Fund") (one of the portfolios constituting the Transamerica IDEX Mutual Funds) at October 31, 2004, the results of its operations for the year then ended, the changes in its net assets for each of the two years in the period then ended and the financial highlights for each of the periods indicated, in conformity with accounting principles generally accepted in the United States of America. These financial statements and financial highlights (hereafter referred to as "financial statements") are the responsibility of the Fund's management; our responsibility is to express an opinion on these financial statements based on our audits. We conducted our audits of these financial statements in accordance with the standards of the Public Company Accounting Oversight Board (United States). Those standards require that we plan and perform the audit to obtain reasonable assurance about whether the financial statements are free of material misstatement. An audit includes examining, on a test basis, evidence supporting the amounts and disclosures in the financial statements, assessing the accounting principles used and significant estimates made by management, and evaluating the overall financial statement presentation. We believe that our audits, which included confirmation of securities at October 31, 2004 by correspondence with the custodian and brokers, provide a reasonable basis for our opinion.

PricewaterhouseCoopers LLP
Tampa, Florida
December 28, 2004
Transamerica IDEX Mutual Funds
Annual Report 2004
16
TA IDEX American Century International
SUPPLEMENTAL INFORMATION (unaudited)
TAX INFORMATION
For dividends paid during the year ended October 31, 2004, the Fund designated $331 of qualified dividend income.
The information and distributions reported herein may differ from the information and distributions taxable to the shareholders for the calendar year ending December 31, 2004. Complete information will be computed and reported in conjunction with your 2004 Form 1099-DIV.
RESULTS OF SHAREHOLDER PROXY
At a special meeting of Class M shareholders of each series of Transamerica IDEX (except TA IDEX Federated Tax Exempt and TA IDEX Protected Principal Stock), as listed above, held on September 2, 2004, the results of the Proposal were as follows:
Proposal 1: Approval of a conversion of Class M shares into Class C shares of the Funds, which will result in bearing the distribution and service fees payable under the 12b-1 Plan of Distribution for the Class C shares of the Funds.
| For | | Against | | Abstentions/Broker Non-Votes | |
| | 81.95 | % | | | 2.71 | % | | | 15.34 | % | |
Transamerica IDEX Mutual Funds
Annual Report 2004
17
TA IDEX American Century Large Company Value
MARKET ENVIRONMENT
The major U.S. stock indices posted single-digit returns for the fiscal year ended October 31, 2004. Early on, the major indices jumped 10% to levels not seen since 2001. They were boosted by corporate earnings that reached 10-year highs in the fourth quarter of 2003 as the government reported strong economic growth and low inflation. But stock market gains eroded as the price of crude oil jumped 78% to $51.78 a barrel, short-term interest rates climbed, and the annual real rate of economic growth slipped from 8.2% in the third quarter of 2003 to 3.3% and 3.7%, respectively, in the second and third quarters of 2004.
In that environment, we remained true to our discipline of seeking fundamentally sound businesses that, because of transitory issues, are selling at prices we believe are below fair market value. Our investment process led us into each corner of the market, and TA IDEX American Century Large Company Value received positive contributions from all ten sectors in which it was invested.
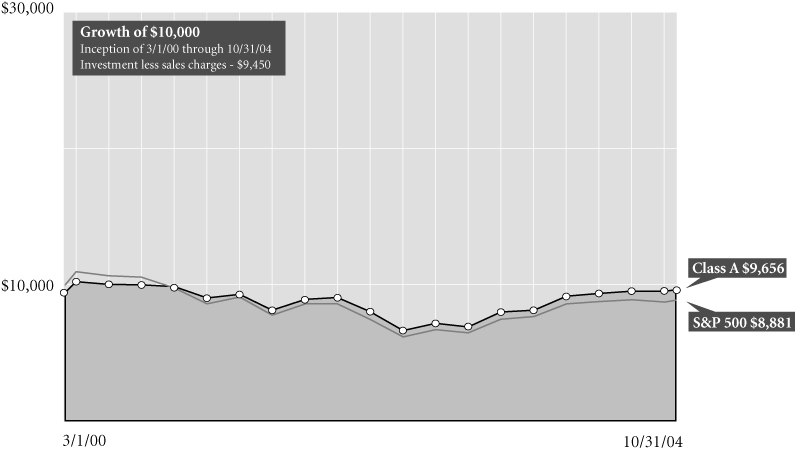
PERFORMANCE
For the year ended October 31, 2004, TA IDEX American Century Large Company Value, Class A returned 12.38%. By comparison its benchmark, the Standard and Poor's 500 Composite Stock Index, returned 9.41%.
STRATEGY REVIEW
Energy: The Strongest Finish-Investments in the energy sector provided the greatest contribution to performance during the fiscal year. Anxiety over the tightening oil supply was generated by the increase in global demand, the continued conflict in Iraq in addition to the political turbulence in Nigeria, Africa's top oil exporter. These factors were powerful catalysts that sent oil prices to record highs and underpinned gains for major oil and gas companies. Though nearly all of our holdings advanced, ChevronTexaco Corporation ranked among the portfolio's top stocks. Exxon Mobil Corporation and Sunoco, Inc. also made substantial contributions.
Financials Provide Lift-The financials sector, our largest single stake on average, provided considerable lift. Much of this position was devoted to commercial banks, which produced a number of top contributors, including Bank of America Corporation and Wells Fargo & Company. Insurance companies also added value overall, and in that group, Fidelity National Financial, Inc. was a noteworthy name. However, late in the period, several companies in this industry came under regulatory and legal scrutiny, and some of our holdings were swept lower in the ensuing sell-off. Marsh & McLennan Companies, Inc. ranked among the portfolio's top-detracting stocks.
Consumer Stocks: Another Bright Spot-TA IDEX American Century Large Company Value's interest in the consumer discretionary sector also delivered a significant contribution to performance. Media companies were the strongest performers. One success from that group was The Walt Disney Company ("Disney"), which benefited from growth in each of its business segments. During the period, Disney enjoyed a 32% increase in revenues from its parks and resorts division driven by higher attendance and occupancy at Walt Disney World. Strength in its cable networks, including ESPN and The Disney Channel, also bolstered Disney's overall results.
Utilities Add Value-Our bottom-up strategy led us to select companies in the utilities sector. Electric utilities paced gains in the group, and Exelon Corporation and Edison International finished among the top contributors for the period.
Some Setbacks-Despite positive contributions overall from each of our sector positions, there were individual setbacks along the way, and some of our holdings retreated in this otherwise upbeat environment. One that fell short was Intel Corporation, the world's largest chipmaker, which reported second- and third-quarter earnings that were robust but slightly below forecasts. Hewlett-Packard Company also detracted during the period.
We will remain focused on our discipline of searching for large, fundamentally sound businesses that, for temporary reasons, are selling at a discount to what we believe are fair market values.
Mark Mallon
Charles A. Ritter
Brendan Healy, CFA
Co-Fund Managers
American Century Investment Management, Inc.
Transamerica IDEX Mutual Funds
Annual Report 2004
1
TA IDEX American Century Large Company Value
Comparison of change in value of $10,000 investment in Class A shares and its comparative index.
Average Annual Total Return for Periods Ended 10/31/04
| | | 1 year | | From
Inception | | Inception
Date | |
| Class A (NAV) | | | 12.38 | % | | | 0.46 | % | | 3/1/00 | |
| Class A (POP) | | | 6.19 | % | | | (0.75 | )% | | 3/1/00 | |
| S&P 5001 | | | 9.41 | % | | | (2.51 | )% | | 3/1/00 | |
| Class B (NAV) | | | 11.54 | % | | | (0.23 | )% | | 3/1/00 | |
| Class B (POP) | | | 6.54 | % | | | (0.44 | )% | | 3/1/00 | |
| Class C (NAV) | | | 11.38 | % | | | 16.42 | % | | 11/11/02 | |
| Class C (POP) | | | 10.38 | % | | | 16.42 | % | | 11/11/02 | |
NOTES
1 The Standard & Poor's 500 Composite Stock (S&P 500) Index is an unmanaged index used as a general measure of market performance. Calculations assume dividends and capital gains are reinvested and do not include any managerial expenses. From inception calculation is based on life of Class A shares. Source: Standard & Poor's Micropal®© Micropal, Inc. 2004 – 1-800-596-5323 – http://www.micropal.com.
The performance data presented represents past performance, future results may vary. Performance data does not reflect the deduction of taxes that would be paid on fund distributions or the redemption of fund shares. Investment return and principal value will fluctuate so that an investor's shares, when redeemed, may be worth more or less than their original cost. Current performance may be lower or higher than performance quoted.
Public Offering Price (POP) returns include the reinvestment of dividends and capital gains and reflect the maximum sales charge of 5.5% for A shares or the maximum applicable contingent deferred sales charge (5% in the 1st year, decreasing to 0% after 6 years) for Class B shares and 1% (during the first 12 months) for Class C shares. Shares purchased prior to March 1, 2004 are subject to a maximum applicable contingent deferred sales charge (5% in the 1st year, decreasing to 0% after 7 years) for Class B shares and (2% in the 1st year, decreasing to 0% after 2 years) for Class C shares. Net Asset Value (NAV) returns include the reinvestment of dividends and capital gains but do not reflect any sales charges.
This material must be preceded or accompanied by a current prospectus, which includes specific contents regarding the investment objectives and policies of this fund.
Transamerica IDEX Mutual Funds
Annual Report 2004
2
TA IDEX American Century Large Company Value
UNDERSTANDING YOUR FUND'S EXPENSES (unaudited)
SHAREHOLDER EXPENSES
The following Example is intended to help you understand your ongoing costs (in dollars and cents) of investing in a Fund and to compare these costs with the ongoing costs of investing in other funds.
The Example is based on an investment of $1,000 invested at the beginning of the period and held for the entire period from May 1, 2004 to October 31, 2004.
ACTUAL EXPENSES
The first line in the table below provides information about actual account values and actual expenses. You may use the information in this line, together with the amount you invested, to estimate the expenses that you paid over the period. Simply divide your account value by $1,000 (for example, an $8,600 account value divided by $1,000 = 8.6), then multiply the result by the number in the first line of your Fund under the heading entitled "Expenses Paid During Period" to estimate the expenses you paid on your account during this period.
HYPOTHETICAL EXAMPLE FOR COMPARISON PURPOSES
The second line in the table below provides information about hypothetical account values and hypothetical expenses based on each Fund's actual expense ratio and an assumed rate of return of 5% per year before expenses, which is not the Fund's actual return. The hypothetical account values and expenses may not be used to estimate the actual ending account balance or expenses you paid for the period. You may use this information to compare the ongoing costs of investing in your Fund and other funds. To do so, compare this 5% hypothetical example with the 5% hypothetical examples that appear in the shareholder reports of the other funds.
Please note that the expenses shown in the table are meant to highlight your ongoing costs only and do not reflect any transactional costs, such as sales charges, redemption fees, brokerage commissions paid on purchases and sales of fund shares. Therefore, the second line under each Fund in the table is useful in comparing ongoing costs only, and will not help you determine the relative total costs of owning different funds. In addition, note that the expenses shown in the table are meant to highlight your ongoing costs and do not reflect any transaction costs.
| | | Beginning
Account
Value | | Ending
Account
Value | | Annualized
Expense
Ratio | | Expenses Paid
During Period (a) | |
| Class A | | | |
| Actual | | $ | 1,000.00 | | | $ | 1,042.70 | | | | 1.50 | % | | $ | 7.70 | | |
| Hypothetical (b) | | | 1,000.00 | | | | 1,017.60 | | | | 1.50 | | | | 7.61 | | |
| Class B | | | |
| Actual | | | 1,000.00 | | | | 1,039.60 | | | | 2.16 | | | | 11.07 | | |
| Hypothetical (b) | | | 1,000.00 | | | | 1,014.28 | | | | 2.16 | | | | 10.94 | | |
| Class C | | | |
| Actual | | | 1,000.00 | | | | 1,037.00 | | | | 2.51 | | | | 12.85 | | |
| Hypothetical (b) | | | 1,000.00 | | | | 1,012.52 | | | | 2.51 | | | | 12.70 | | |
(a) Expenses are calculated using each Fund's annualized expense ratio (as disclosed in the table), multiplied by the average account value for the period, multiplied by number of days in the period (184 days), and divided by the number of days in the year (366 days).
(b) 5% return per year before expenses.
GRAPHIC PRESENTATION OF SCHEDULE OF INVESTMENTS
By Sector
At October 31, 2004
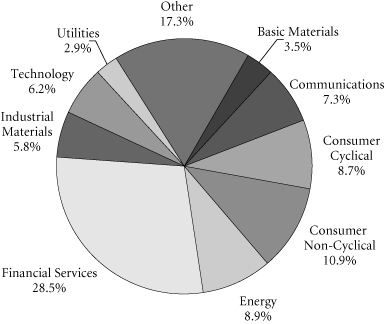
This chart shows the percentage breakdown by sector of the Fund's total investment securities.
Transamerica IDEX Mutual Funds
Annual Report 2004
3
TA IDEX American Century Large Company Value
SCHEDULE OF INVESTMENTS
At October 31, 2004
(all amounts except share amounts in thousands)
| | | Shares | | Value | |
| COMMON STOCKS (95.6%) | |
| Aerospace (0.7%) | |
| Boeing Co. (The) | | | 25,000 | | | $ | 1,247 | | |
| Amusement & Recreation Services (0.6%) | |
| Harrah's Entertainment, Inc. | | | 20,300 | | | | 1,188 | | |
| Apparel & Accessory Stores (0.6%) | |
| Ltd. Brands | | | 46,800 | | | | 1,160 | | |
| Apparel Products (1.4%) | |
| Liz Claiborne, Inc. | | | 30,900 | | | | 1,263 | | |
| VF Corp. | | | 23,000 | | | | 1,238 | | |
| Automotive (1.7%) | |
| General Motors Corp. (a) | | | 22,700 | | | | 875 | | |
| Lear Corp. | | | 19,700 | | | | 1,062 | | |
| Toyota Motor Corp., Sponsored ADR | | | 14,200 | | | | 1,102 | | |
| Beverages (1.7%) | |
| Adolph Coors Co.–Class B | | | 13,400 | | | | 894 | | |
| Coca-Cola Co. (The) | | | 26,900 | | | | 1,094 | | |
| Pepsi Bottling Group, Inc. | | | 43,800 | | | | 1,228 | | |
| Chemicals & Allied Products (1.2%) | |
| PPG Industries, Inc. | | | 34,400 | | | | 2,193 | | |
| Commercial Banks (17.4%) | |
| Bank of America Corp. | | | 133,600 | | | | 5,984 | | |
| Citigroup, Inc. | | | 188,400 | | | | 8,359 | | |
| JPMorgan Chase & Co. | | | 80,100 | | | | 3,092 | | |
| KeyCorp (a) | | | 43,800 | | | | 1,471 | | |
| National City Corp. | | | 53,500 | | | | 2,085 | | |
| PNC Financial Services Group, Inc. | | | 38,200 | | | | 1,998 | | |
| US Bancorp | | | 85,300 | | | | 2,440 | | |
| Wachovia Corp. | | | 52,000 | | | | 2,559 | | |
| Wells Fargo & Co. | | | 64,600 | | | | 3,858 | | |
| Computer & Data Processing Services (3.6%) | |
| Computer Sciences Corp. (b) | | | 33,400 | | | | 1,659 | | |
| Electronic Data Systems Corp. | | | 53,700 | | | | 1,142 | | |
| Fiserv, Inc. (a)(b) | | | 33,200 | | | | 1,180 | | |
| Microsoft Corp. | | | 96,600 | | | | 2,704 | | |
| Computer & Office Equipment (2.7%) | |
| Hewlett-Packard Co. | | | 186,600 | | | | 3,482 | | |
| International Business Machines Corp. | | | 17,500 | | | | 1,571 | | |
| Department Stores (1.6%) | |
| May Department Stores Co. (The) (a) | | | 78,100 | | | | 2,035 | | |
| Sears Roebuck & Co. (a) | | | 27,100 | | | | 948 | | |
| Drug Stores & Proprietary Stores (0.7%) | |
| CVS Corp. | | | 28,600 | | | | 1,243 | | |
| | | Shares | | Value | |
| Electric Services (1.2%) | | | |
| PPL Corp. | | | 41,000 | | | $ | 2,132 | | |
| Electric, Gas & Sanitary Services (2.1%) | | | |
| Exelon Corp. (a) | | | 68,300 | | | | 2,706 | | |
| NiSource, Inc. | | | 50,800 | | | | 1,090 | | |
| Electronic & Other Electric Equipment (1.6%) | | | |
| General Electric Co. | | | 62,400 | | | | 2,129 | | |
| Whirlpool Corp. (a) | | | 15,000 | | | | 881 | | |
| Electronic Components & Accessories (1.5%) | | | |
| Intel Corp. | | | 49,400 | | | | 1,100 | | |
| Tyco International, Ltd. (a) | | | 54,400 | | | | 1,695 | | |
| Environmental Services (0.7%) | | | |
| Waste Management, Inc. | | | 44,000 | | | | 1,253 | | |
| Fabricated Metal Products (0.8%) | | | |
| Parker Hannifin Corp. (a) | | | 19,700 | | | | 1,391 | | |
| Finance (2.0%) | | | |
| SPDR Trust Series 1 (a) | | | 31,900 | | | | 3,617 | | |
| Food & Kindred Products (3.7%) | | | |
| Altria Group, Inc. | | | 51,000 | | | | 2,471 | | |
| HJ Heinz Co. | | | 42,700 | | | | 1,552 | | |
| Sara Lee Corp. | | | 52,100 | | | | 1,213 | | |
| Unilever NV, ADR | | | 25,700 | | | | 1,498 | | |
| Food Stores (0.7%) | | | |
| Kroger Co. (b) | | | 83,200 | | | | 1,257 | | |
| Health Services (0.7%) | | | |
| HCA, Inc. | | | 33,100 | | | | 1,216 | | |
| Industrial Machinery & Equipment (2.1%) | | | |
| Black & Decker Corp. (a) | | | 11,200 | | | | 899 | | |
| Dover Corp. | | | 30,100 | | | | 1,182 | | |
| Ingersoll-Rand Co.–Class A (a) | | | 25,100 | | | | 1,718 | | |
| Instruments & Related Products (0.3%) | | | |
| Snap-On, Inc. | | | 18,000 | | | | 529 | | |
| Insurance (4.6%) | | | |
| Allstate Corp. (The) (a) | | | 50,800 | | | | 2,443 | | |
| American International Group, Inc. | | | 29,900 | | | | 1,815 | | |
| Cigna Corp. | | | 17,600 | | | | 1,117 | | |
| Loews Corp. | | | 33,300 | | | | 1,995 | | |
| MGIC Investment Corp. (a) | | | 16,200 | | | | 1,042 | | |
| Insurance Agents, Brokers & Service (1.6%) | | | |
| Hartford Financial Services Group, Inc. (a) | | | 33,800 | | | | 1,977 | | |
| Marsh & McLennan Cos., Inc. | | | 32,800 | | | | 907 | | |
| Life Insurance (0.8%) | | | |
| Torchmark Corp. | | | 26,800 | | | | 1,448 | | |
The notes to the financial statements are an integral part of this report.
Transamerica IDEX Mutual Funds
Annual Report 2004
4
TA IDEX American Century Large Company Value
SCHEDULE OF INVESTMENTS (continued)
At October 31, 2004
(all amounts except share amounts in thousands)
| | | Shares | | Value | |
| Lumber & Wood Products (1.3%) | | | |
| Weyerhaeuser Co. | | | 37,100 | | | $ | 2,324 | | |
| Medical Instruments & Supplies (0.8%) | | | |
| Baxter International, Inc. | | | 50,400 | | | | 1,550 | | |
| Motion Pictures (1.6%) | | | |
| Blockbuster, Inc.–Calss B (b) | | | 46,400 | | | | 301 | | |
| Time Warner, Inc. (b) | | | 154,100 | | | | 2,564 | | |
| Petroleum Refining (10.1%) | | | |
| ChevronTexaco Corp. | | | 62,300 | | | | 3,306 | | |
| ConocoPhillips | | | 33,100 | | | | 2,791 | | |
| Exxon Mobil Corp. | | | 153,600 | | | | 7,560 | | |
| Royal Dutch Petroleum Co., NY Shares (a) | | | 88,800 | | | | 4,817 | | |
| Pharmaceuticals (4.1%) | | | |
| Abbott Laboratories | | | 49,200 | | | | 2,097 | | |
| AmerisourceBergen Corp. (a) | | | 22,200 | | | | 1,222 | | |
| Bristol-Myers Squibb Co. | | | 69,900 | | | | 1,638 | | |
| Johnson & Johnson | | | 35,700 | | | | 2,084 | | |
| Merck & Co., Inc. | | | 15,000 | | | | 470 | | |
| Primary Metal Industries (1.5%) | | | |
| Alcoa, Inc. | | | 48,000 | | | | 1,560 | | |
| Nucor Corp. (a) | | | 26,900 | | | | 1,136 | | |
| Printing & Publishing (1.6%) | | | |
| Gannett Co., Inc. | | | 22,300 | | | | 1,850 | | |
| RR Donnelley & Sons Co. | | | 37,700 | | | | 1,186 | | |
| Restaurants (1.4%) | | | |
| McDonald's Corp. | | | 89,300 | | | | 2,603 | | |
| Rubber & Misc. Plastic Products (1.2%) | | | |
| Newell Rubbermaid, Inc. (a) | | | 60,700 | | | | 1,309 | | |
| Reebok International, Ltd. (a) | | | 24,500 | | | | 906 | | |
| Savings Institutions (1.3%) | | | |
| Washington Mutual, Inc. | | | 62,400 | | | | 2,415 | | |
| Security & Commodity Brokers (2.7%) | | | |
| Merrill Lynch & Co., Inc. | | | 48,400 | | | | 2,611 | | |
| Morgan Stanley | | | 47,800 | | | | 2,442 | | |
| Telecommunications (5.9%) | | | |
| Alltel Corp. | | | 27,400 | | | | 1,505 | | |
| AT&T Corp. (a)(c) | | | 40,000 | | | | 684 | | |
| BellSouth Corp. (a) | | | 69,600 | | | | 1,856 | | |
| SBC Communications, Inc. | | | 96,700 | | | | 2,443 | | |
| Sprint Corp.–FON Group | | | 85,500 | | | | 1,791 | | |
| Verizon Communications, Inc. | | | 32,700 | | | | 1,279 | | |
| Vodafone Group PLC, Sponsored ADR | | | 49,100 | | | | 1,266 | | |
| U.S. Government Agencies (3.8%) | | | |
| Freddie Mac | | | 104,900 | | | | 6,986 | | |
| Total Common Stocks (cost: $170,390) | | | | | | | 175,179 | | |
| | | Principal | | Value | |
| SECURITY LENDING COLLATERAL (17.6%) | |
| Debt (16.4%) | |
| Bank Notes (3.2%) | |
Bank of America
1.77%, due 12/03/2004 | | $ | 1,574 | | | $ | 1,574 | | |
| 1.88%, due 12/23/2004 | | | 525 | | | | 525 | | |
| 1.77%, due 01/18/2005 | | | 1,049 | | | | 1,049 | | |
Canadian Imperial Bank of Commerce
1.86%, due 11/04/2004 | | | 2,361 | | | | 2,361 | | |
Credit Suisse First Boston Corp.
1.83%, due 09/09/2005 | | | 262 | | | | 262 | | |
| Commercial Paper (1.7%) | |
Clipper Receivables Corp.
1.79%, due 11/12/2004 | | | 781 | | | | 781 | | |
Delaware Funding Corp. 144A
1.85%, due 11/19/2004 | | | 262 | | | | 262 | | |
Falcon Asset Securitization Corp. 144A
1.78%, due 11/04/2004 | | | 783 | | | | 783 | | |
| 1.75%, due 11/10/2004 | | | 1,049 | | | | 1,049 | | |
Galaxy Funding 144A
1.88%, due 11/22/2004 | | | 262 | | | | 262 | | |
| Euro Dollar Terms (7.6%) | |
Bank of Montreal
1.88%, due 11/24/2004 | | | 2,485 | | | | 2,485 | | |
BNP Paribas
1.77%, due 11/10/2004 | | | 1,312 | | | | 1,312 | | |
| 1.80%, due 11/23/2004 | | | 1,050 | | | | 1,050 | | |
| 1.98%, due 12/27/2004 | | | 1,050 | | | | 1,050 | | |
Calyon
1.70%, due 11/24/2004 | | | 139 | | | | 139 | | |
Citigroup
2.06%, due 01/25/2005 | | | 2,624 | | | | 2,624 | | |
Den Danske Bank
1.82%, due 11/19/2004 | | | 1,312 | | | | 1,312 | | |
Dexia Group
2.04%, due 01/21/2005 | | | 609 | | | | 609 | | |
HBOS Halifax Bank of Scotland
2.03%, due 01/21/2005 | | | 525 | | | | 525 | | |
Royal Bank of Scotland
2.01%, due 01/20/2005 | | | 1,050 | | | | 1,050 | | |
Toronto Dominion Bank
1.70%, due 11/08/2004 | | | 525 | | | | 525 | | |
Wells Fargo
1.87%, due 11/22/2004 | | | 1,312 | | | | 1,312 | | |
The notes to the financial statements are an integral part of this report.
Transamerica IDEX Mutual Funds
Annual Report 2004
5
TA IDEX American Century Large Company Value
SCHEDULE OF INVESTMENTS (continued)
At October 31, 2004
(all amounts except share amounts in thousands)
| | | Principal | | Value | |
| Promissory Notes (1.6%) | | | |
| Goldman Sachs Group Inc. | |
| 1.90%, due 12/29/2004 | | $ | 1,102 | | | $ | 1,102 | | |
| 1.88%, due 01/27/2005 | | | 1,837 | | | | 1,837 | | |
| Repurchase Agreements (2.3%) | | | |
| Merrill Lynch & Co. (c) | |
1.92% Repurchase Agreement dated
10/29/2004 to be repurchased at $4,198 on
11/1/2004 | | | 4,198 | | | | 4,198 | | |
| | | Shares | | Value | |
| Investment Companies (1.2%) | |
| Money Market Funds (1.2%) | |
| Merrill Lynch Premier Institutional Fund | |
| 1-day yield of 1.71% | | | 1,290,782 | | | $ | 1,291 | | |
| Merrimac Cash Fund, Premium Class | |
| 1-day yield of 1.46% | | | 944,580 | | | | 945 | | |
| Total Security Lending Collateral (cost: $32,274) | | | | | | | 32,274 | | |
| Total Investment Securities (cost: $202,664) | | | | | | $ | 207,453 | | |
| SUMMARY: | |
| Investments, at value | | | 113.2 | % | | $ | 207,453 | | |
| Liabilities in excess of other assets | | | (13.2 | )% | | | (24,152 | ) | |
| Net assets | | | 100.0 | % | | $ | 183,301 | | |
NOTES TO SCHEDULE OF INVESTMENTS:
(a) At October 31, 2004, all or a portion of this security is on loan (see Note 1). The value at October 31, 2004, of all securities on loan is $31,307.
(b) No dividends were paid during the preceding twelve months.
(c) Cash collateral for the Repurchase Agreements, valued at $4,296, that serve as collateral for securities lending are invested in corporate bonds with interest rates and maturity dates ranging from 0.00%–9.75% and 05/15/2005–9/15/2033, respectively.
DEFINITIONS:
144A 144A Securities are registered pursuant to rule 144A of the Securities Act of 1933. These securities are deemed to be liquid for purposes of compliance limitations on holdings of illiquid securities and may be resold as transactions exempt from registration normally to qualified institutional buyers. At October 31, 2004, these securities aggregated $2,356 or 1.29% of the net assets of the Fund.
ADR American Depositary Receipt
The notes to the financial statements are an integral part of this report.
Transamerica IDEX Mutual Funds
Annual Report 2004
6
TA IDEX American Century Large Company Value
STATEMENT OF ASSETS AND LIABILITIES
At October 31, 2004
(all amounts except per share amounts in thousands)
| Assets: | | | |
Investment securities, at value (cost: $202,664)
(including securities loaned of $31,307) | | $ | 207,453 | | |
| Cash | | | 11,278 | | |
| Receivables: | |
| Shares of beneficial interest sold | | | 911 | | |
| Interest | | | 13 | | |
| Dividends | | | 344 | | |
| Dividend reclaims receivable | | | 2 | | |
| Other | | | 2 | | |
| | | | 220,003 | | |
| Liabilities: | | | |
| Investment securities purchased | | | 4,022 | | |
| Accounts payable and accrued liabilities: | |
| Shares of beneficial interest redeemed | | | 56 | | |
| Management and advisory fees | | | 164 | | |
| Distribution fees | | | 65 | | |
| Transfer agent fees | | | 46 | | |
| Payable for collateral for securities on loan | | | 32,274 | | |
| Other | | | 75 | | |
| | | | 36,702 | | |
| Net Assets | | $ | 183,301 | | |
| Net Assets Consist of: | | | |
Shares of beneficial interest, unlimited shares
authorized, no par value | | $ | 180,988 | | |
| Undistributed net investment income (loss) | | | 539 | | |
Accumulated net realized gain (loss) from investment
securities and futures contracts | | | (3,014 | ) | |
Net unrealized appreciation (depreciation) on
investment securities | | | 4,788 | | |
| Net Assets | | $ | 183,301 | | |
| Net Assets by Class: | | | |
| Class A | | $ | 157,103 | | |
| Class B | | | 18,612 | | |
| Class C | | | 7,586 | | |
| Shares Outstanding: | | | |
| Class A | | | 15,410 | | |
| Class B | | | 1,884 | | |
| Class C | | | 769 | | |
| Net Asset Value Per Share: | | | |
| Class A | | $ | 10.20 | | |
| Class B | | | 9.88 | | |
| Class C | | | 9.86 | | |
| Maximum Offering Price Per Share (a): | | | |
| Class A | | $ | 10.79 | | |
(a) Includes the maximum selling commission (represented as a percentage of offering price) which is reduced on certain levels of sales as set forth in the Prospectus. Net asset value per share for Classes B and C shares represents offering price. The redemption price for Classes B and C shares equals net asset value less any applicable contingent deferred sales charge.
STATEMENT OF OPERATIONS
For the year ended October 31, 2004
(all amounts in thousands)
| Investment Income: | | | |
| Interest | | $ | 26 | | |
| Dividends | | | 1,995 | | |
| Income from loaned securities–net | | | 13 | | |
| Less withholding taxes on foreign dividends | | | (17 | ) | |
| | | | 2,017 | | |
| Expenses: | | | |
| Management and advisory fees | | | 683 | | |
| Transfer agent fees: | |
| Class A | | | 78 | | |
| Class B | | | 27 | | |
| Class C | | | 5 | | |
| Class C2 | | | 6 | | |
| Class M | | | 3 | | |
| Printing and shareholder reports | | | 14 | | |
| Custody fees | | | 49 | | |
| Administration fees | | | 17 | | |
| Legal fees | | | 2 | | |
| Audit and accounting fees | | | 11 | | |
| Trustees fees | | | 3 | | |
| Registration fees: | |
| Class A | | | 42 | | |
| Class B | | | 8 | | |
| Class C | | | 14 | | |
| Class C2 | | | 2 | | |
| Class M | | | 2 | | |
| Other | | | 2 | | |
| Distribution and service fees: | |
| Class A | | | 174 | | |
| Class B | | | 187 | | |
| Class C | | | 34 | | |
| Class C2 | | | 34 | | |
| Class M | | | 17 | | |
| Total expenses | | | 1,414 | | |
| Less: | |
| Reimbursement of class expenses: | |
| Class C | | | (1 | ) | |
| Net expenses | | | 1,413 | | |
| Net Investment Income (Loss) | | | 604 | | |
| Net Realized Gain (Loss) from: | | | |
| Investment securities | | | 4,608 | | |
| Futures contracts | | | 9 | | |
| | | | 4,617 | | |
| Net Increase (Decrease) in Unrealized Appreciation on: | | | |
| Investment securities | | | 2,677 | | |
| Futures contracts | | | (6 | ) | |
| | | | 2,671 | | |
| Net Gain (Loss) on Investments and Futures Contracts | | | 7,288 | | |
Net Increase (Decrease) in Net Assets Resulting
from Operations | | $ | 7,892 | | |
The notes to the financial statements are an integral part of this report.
Transamerica IDEX Mutual Funds
Annual Report 2004
7
TA IDEX American Century Large Company Value
STATEMENTS OF CHANGES IN NET ASSETS
For the years ended
(all amounts in thousands)
| | | October 31,
2004 | | October 31,
2003 | |
| Increase (Decrease) in Net Assets From: | |
| Operations: | |
| Net investment income (loss) | | $ | 604 | | | $ | 16 | | |
Net realized gain (loss) from
investment securities and
futures contracts | | | 4,617 | | | | (2,307 | ) | |
Net unrealized appreciation
(depreciation) on investment
securities and futures contracts | | | 2,671 | | | | 7,571 | | |
| | | | 7,892 | | | | 5,280 | | |
| Distributions to Shareholders: | |
| From net investment income: | |
| Class A | | | (39 | ) | | | – | | |
| Class B | | | (27 | ) | | | – | | |
| Class C | | | (2 | ) | | | – | | |
| Class C2 | | | (8 | ) | | | – | | |
| Class M | | | (3 | ) | | | – | | |
| | | | (79 | ) | | | – | | |
| Capital Share Transactions: | |
| Proceeds from shares sold: | |
| Class A | | | 147,090 | | | | 3,664 | | |
| Class B | | | 3,766 | | | | 4,673 | | |
| Class C | | | 1,077 | | | | 1,169 | | |
| Class C2 | | | 427 | | | | 1,954 | | |
| Class M | | | 269 | | | | 333 | | |
| | | | 152,629 | | | | 11,793 | | |
Dividends and distributions
reinvested: | |
| Class A | | | 38 | | | | – | | |
| Class B | | | 25 | | | | – | | |
| Class C | | | 1 | | | | – | | |
| Class C2 | | | 7 | | | | – | | |
| Class M | | | 3 | | | | – | | |
| | | | 74 | | | | – | | |
| Cost of shares redeemed: | |
| Class A | | | (3,949 | ) | | | (4,031 | ) | |
| Class B | | | (4,402 | ) | | | (4,466 | ) | |
| Class C | | | (2,320 | ) | | | (17 | ) | |
| Class C2 | | | (1,018 | ) | | | (1,462 | ) | |
| Class M | | | (674 | ) | | | (1,030 | ) | |
| | | | (12,363 | ) | | | (11,006 | ) | |
| Class level exchanges: | |
| Class C | | | 7,377 | | | | – | | |
| Class C2 | | | (5,388 | ) | | | – | | |
| Class M | | | (1,989 | ) | | | – | | |
| | | | – | | | | – | | |
| Automatic conversions: | |
| Class A | | | 10 | | | | – | | |
| Class B | | | (10 | ) | | | – | | |
| | | | – | | | | – | | |
| | | | 140,340 | | | | 787 | | |
| Net increase (decrease) in net assets | | | 148,153 | | | | 6,067 | | |
| | | October 31,
2004 | | October 31,
2003 | |
| Net Assets: | | | |
| Beginning of year | | | 35,148 | | | | 29,081 | | |
| End of year | | $ | 183,301 | | | $ | 35,148 | | |
Undistributed Net Investment Income
(Loss) | | $ | 539 | | | $ | 15 | | |
| Share Activity: | | | |
| Shares issued: | |
| Class A | | | 14,819 | | | | 445 | | |
| Class B | | | 396 | | | | 576 | | |
| Class C | | | 112 | | | | 141 | | |
| Class C2 | | | 45 | | | | 243 | | |
| Class M | | | 28 | | | | 42 | | |
| | | | 15,400 | | | | 1,447 | | |
Shares issued–reinvested from
distributions: | |
| Class A | | | 4 | | | | – | | |
| Class B | | | 3 | | | | – | | |
| Class C | | | – | | | | – | | |
| Class C2 | | | 1 | | | | – | | |
| Class M | | | – | | | | – | | |
| | | | 8 | | | | – | | |
| Shares redeemed: | |
| Class A | | | (403 | ) | | | (503 | ) | |
| Class B | | | (459 | ) | | | (580 | ) | |
| Class C | | | (243 | ) | | | (2 | ) | |
| Class C2 | | | (109 | ) | | | (193 | ) | |
| Class M | | | (71 | ) | | | (134 | ) | |
| | | | (1,285 | ) | | | (1,412 | ) | |
| Class level exchanges: | |
| Class C | | | 761 | | | | – | | |
| Class C2 | | | (557 | ) | | | – | | |
| Class M | | | (203 | ) | | | – | | |
| | | | 1 | | | | – | | |
| Automatic conversions: | |
| Class A | | | 1 | | | | – | | |
| Class B | | | (1 | ) | | | – | | |
| | | | – | | | | – | | |
Net increase (decrease) in shares
outstanding: | |
| Class A | | | 14,421 | | | | (58 | ) | |
| Class B | | | (61 | ) | | | (4 | ) | |
| Class C | | | 630 | | | | 139 | | |
| Class C2 | | | (620 | ) | | | 50 | | |
| Class M | | | (246 | ) | | | (92 | ) | |
| | | | 14,124 | | | | 35 | | |
The notes to the financial statements are an integral part of this report.
Transamerica IDEX Mutual Funds
Annual Report 2004
8
TA IDEX American Century Large Company Value
FINANCIAL HIGHLIGHTS
| | | | | For a share of beneficial interest outstanding throughout each period | |
| | | | | Net Asset | | Investment Operations | | Distributions | | Net Asset | |
| | | For the
Period
Ended (d)(g) | | Value,
Beginning
of Period | | Net
Investment
Income (Loss) | | Net Realized
and Unrealized
Gain (Loss) | | Total
Operations | | From Net
Investment
Income | | From Net
Realized
Gains | | Total
Distributions | | Value,
End
of Period | |
| Class A | | 10/31/2004 | | $ | 9.09 | | | $ | 0.11 | | | $ | 1.01 | | | $ | 1.12 | | | $ | (0.01 | ) | | $ | – | | | $ | (0.01 | ) | | $ | 10.20 | | |
| | | 10/31/2003 | | | 7.55 | | | | 0.04 | | | | 1.50 | | | | 1.54 | | | | – | | | | – | | | | – | | | | 9.09 | | |
| | | 10/31/2002 | | | 8.79 | | | | 0.01 | | | | (1.25 | ) | | | (1.24 | ) | | | – | | | | – | | | | – | | | | 7.55 | | |
| | | 10/31/2001 | | | 10.83 | | | | (0.03 | ) | | | (2.01 | ) | | | (2.04 | ) | | | – | | | | – | | | | – | | | | 8.79 | | |
| | | 10/31/2000 | | | 10.00 | | | | – | | | | 0.83 | | | | 0.83 | | | | – | | | | – | | | | – | | | | 10.83 | | |
| Class B | | 10/31/2004 | | | 8.87 | | | | 0.02 | | | | 1.00 | | | | 1.02 | | | | (0.01 | ) | | | – | | | | (0.01 | ) | | | 9.88 | | |
| | | 10/31/2003 | | | 7.41 | | | | (0.01 | ) | | | 1.47 | | | | 1.46 | | | | – | | | | – | | | | – | | | | 8.87 | | |
| | | 10/31/2002 | | | 8.69 | | | | (0.05 | ) | | | (1.23 | ) | | | (1.28 | ) | | | – | | | | – | | | | – | | | | 7.41 | | |
| | | 10/31/2001 | | | 10.79 | | | | (0.10 | ) | | | (2.00 | ) | | | (2.10 | ) | | | – | | | | – | | | | – | | | | 8.69 | | |
| | | 10/31/2000 | | | 10.00 | | | | (0.04 | ) | | | 0.83 | | | | 0.79 | | | | – | | | | – | | | | – | | | | 10.79 | | |
| Class C | | 10/31/2004 | | | 8.87 | | | | – | | | | 1.00 | | | | 1.00 | | | | (0.01 | ) | | | – | | | | (0.01 | ) | | | 9.86 | | |
| | | 10/31/2003 | | | 7.32 | | | | (0.01 | ) | | | 1.56 | | | | 1.55 | | | | – | | | | – | | | | – | | | | 8.87 | | |
| | | | | | | Ratios/Supplemental Data | |
| | | For the
Period | | Total | | Net Assets,
End of
Period | | Ratio of Expenses
to Average
Net Assets (a) | | Net Investment
Income (Loss)
to Average | | Portfolio
Turnover | |
| | | Ended (g) | | Return (c) | | (000's) | | Net (e) | | Total (f) | | Net Assets (a) | | Rate (b) | |
| Class A | | 10/31/2004 | | | 12.38 | % | | $ | 157,103 | | | | 1.54 | % | | | 1.54 | % | | | 1.11 | % | | | 61 | % | |
| | | 10/31/2003 | | | 20.40 | | | | 8,988 | | | | 1.85 | | | | 2.56 | | | | 0.53 | | | | 76 | | |
| | | 10/31/2002 | | | (14.15 | ) | | | 7,908 | | | | 1.80 | | | | 2.43 | | | | 0.09 | | | | 161 | | |
| | | 10/31/2001 | | | (18.80 | ) | | | 5,183 | | | | 1.55 | | | | 2.49 | | | | (0.28 | ) | | | 113 | | |
| | | 10/31/2000 | | | 8.30 | | | | 2,974 | | | | 1.55 | | | | 6.85 | | | | (0.42 | ) | | | 111 | | |
| Class B | | 10/31/2004 | | | 11.54 | | | | 18,612 | | | | 2.32 | | | | 2.32 | | | | 0.20 | | | | 61 | | |
| | | 10/31/2003 | | | 19.70 | | | | 17,245 | | | | 2.50 | | | | 3.21 | | | | (0.12 | ) | | | 76 | | |
| | | 10/31/2002 | | | (14.76 | ) | | | 14,446 | | | | 2.45 | | | | 3.08 | | | | (0.56 | ) | | | 161 | | |
| | | 10/31/2001 | | | (19.41 | ) | | | 11,623 | | | | 2.20 | | | | 3.14 | | | | (0.93 | ) | | | 113 | | |
| | | 10/31/2000 | | | 7.86 | | | | 3,635 | | | | 2.20 | | | | 7.50 | | | | (1.07 | ) | | | 111 | | |
| Class C | | 10/31/2004 | | | 11.38 | | | | 7,586 | | | | 2.50 | | | | 2.54 | | | | 0.04 | | | | 61 | | |
| | | 10/31/2003 | | | 21.17 | | | | 1,230 | | | | 2.50 | | | | 3.21 | | | | (0.12 | ) | | | 76 | | |
NOTES TO FINANCIAL HIGHLIGHTS
(a) Annualized.
(b) Not annualized for periods of less than one year.
(c) Total Return has been calculated for the applicable period without deduction of a sales load, if any, on an initial purchase. Periods of less than one year are not annualized.
(d) Per share information is calculated based on average number of shares outstanding for the years ended 10/31/2001, 10/31/2002, 10/31/2003 and 10/31/2004.
(e) Ratio of Net Expenses to Average Net Assets is net of fee waivers and reimbursements by the investment adviser, if any (see note 2).
(f) Ratio of Total Expenses to Average Net Assets includes all expenses before fee waivers and reimbursements by the investment adviser.
(g) TA IDEX American Century Large Company Value ("the Fund") commenced operations on March 1, 2000. The inception date for the Fund's offering of share Class L was November 11, 2002. Class L was renamed Class C on March 1, 2004. (see note 1)
The notes to the financial statements are an integral part of this report.
Transamerica IDEX Mutual Funds
Annual Report 2004
9
TA IDEX American Century Large Company Value
NOTES TO FINANCIAL STATEMENTS
At October 31, 2004
(all amounts in thousands)
NOTE 1. ORGANIZATION AND SIGNIFICANT ACCOUNTING POLICIES
Transamerica IDEX Mutual Funds, formerly IDEX Mutual Funds, is a Massachusetts business trust registered under the Investment Company Act of 1940, as amended (the "1940 Act"), as an open-end management investment company. TA IDEX American Century Large Company Value ("the Fund"), part of Transamerica IDEX Mutual Funds, began operations on March 1, 2000.
On March 1, 2004, the Fund changed its name from IDEX American Century Income and Growth to TA IDEX American Century Large Company Value.
In the normal course of business, the Fund enters into contracts that contain a variety of representations and warranties, which provide general indemnifications. The Fund's maximum exposure under these arrangements is unknown, as this would involve future claims that may be made against the Fund and/or its affiliates that have not yet occurred. However, based on experience, the Fund expects the risk of loss to be remote.
See the Prospectus and Statement of Additional Information for a description of the Fund's investment objective.
In preparing the Fund's financial statements in accordance with accounting principles generally accepted in the United States of America ("GAAP"), estimates or assumptions (which could differ from actual results) may be used that affect reported amounts and disclosures. The following policies were consistently followed by the Fund, in accordance with GAAP.
Multiple class operations and expenses: The Fund currently offers three classes of shares, each with a public offering price that reflects different sales charges, if any, and expense levels. All shares designated as Class C shares prior to March 1, 2004, were renamed as Class C2 shares on that date. All shares designated as Class L shares prior to March 1, 2004, were renamed as Class C shares with different sales charges than the previous Class L shares. On June 15, 2004, Class C2 shares merged into Class C. On September 24, 2004, Class M shares merged into Class C. Class B shares will convert to Class A shares eight years after purchase. Income, non-class specific expenses and realized and unrealized gains and losses, are allo cated daily to each class, based upon the value of shares outstanding method as permitted under Rule 18f-3 of the 1940 Act. Each class bears its own specific expenses as well as a portion of general, common expenses.
Pricing of shares: The Fund prices its shares on the basis of the net asset value of each class of shares of the Fund, which is determined as of the close of the New York Stock Exchange ("NYSE") (generally
4:00 p.m. Eastern Time) on each day on which the NYSE is open for trading (other than a day on which there are insufficient changes in the value of the Fund's portfolio securities to materially affect the Fund's net asset value or a day on which no shares are tendered for redemption and no order to purchase any shares is received).
Security valuations: Fund investments traded on an exchange are valued at the closing price on the day of valuation on the exchange where the security is principally traded. With respect to securities traded on NASDAQ NMS, such closing price may be the last reported sales price or the NASDAQ Official Closing Price.
Securities traded in the over-the-counter market and listed securities for which no sale was reported on that date are valued at the last quoted bid price.
Debt securities are valued by independent pricing services; however, those that mature in sixty days or less are valued at amortized cost, which approximates market.
Investment Companies are valued at net asset value of the underlying portfolio.
Other securities for which quotations are not readily available are valued at fair market value as determined in good faith using guidelines adopted by the Board of Trustees of the Fund, under the supervision of the Fund's Valuation Committee.
Cash: The Fund may leave cash overnight in its cash account with the custodian, Investors Bank & Trust Company ("IBT"). IBT has been contracted on behalf of the Fund to invest the excess cash into a savings account, which at October 31, 2004, was paying an interest rate of 1.30%.
Throughout the year, the Fund may have a cash overdraft balance. A fee is incurred on this overdraft, calculated by multiplying the overdraft by a rate based on the federal funds rate. This fee is included in Custody fees in the Statement of Operations.
Repurchase agreements: The Fund is authorized to enter into repurchase agreements. The Fund, through IBT, receives delivery of the underlying securities, the value of which at the time of purchase is required to be an amount equal to at least 100% of the resale price. Repurchase agreements involve the risk that the seller will fail to repurchase the security, as agreed. In that case, the Fund will bear the risk of value fluctuations until the security can be sold and may encounter delays and incur costs in liquidating the security. In the event of bankruptcy or insolvency of the seller, delays and costs may be incurred.
Securities lending: The Fund may lend securities to enhance fund earnings from investing cash collateral in making such loans to qualified borrowers (typically broker/dealers). The Fund has engaged its custodian bank, IBT, as a lending agent to administer its securities lending program. IBT earned $5 of program income for its services. When the Fund makes a security loan, it receives cash collateral as
Transamerica IDEX Mutual Funds
Annual Report 2004
10
TA IDEX American Century Large Company Value
NOTES TO FINANCIAL STATEMENTS (continued)
At October 31, 2004
(all amounts in thousands)
NOTE 1.–(continued)
protection against the risk that the borrower will default on the loan, and records an asset for the cash invested collateral and a liability for the return of the collateral.
Securities on loan are included in Investment securities at value in the Statement of Assets and Liabilities and remain on the Schedule of Investments.
Loans of securities are required to be secured by collateral at least equal to 102% of the value of the securities at inception of the loan, and not less then 100% thereafter. The Fund may invest cash collateral in short-term money market instruments including: U.S. Treasury Bills, U.S. agency obligations, commercial paper, money market mutual funds, repurchase agreements and other highly rated, liquid investments. During the life of securities loans, the collateral and securities loaned remain subject to fluctuation in value. IBT marks to market securities loaned and the collateral each business day. If additional collateral is due (at least $1), IBT collects additional cash collateral from the borrowers. Although securities loaned will be fully collateralized at all times, IBT may experience delays in, or may be prevented from, recovering the collateral on behalf of the Fund. The Fund may recall a loa ned security position at any time from the borrower through IBT. In the event the borrower fails to timely return a recalled security, IBT may indemnify the Fund by purchasing replacement securities for the Fund at its own expense and claiming the collateral to fund such a purchase. IBT absorbs the loss if the collateral value is not sufficient to cover the cost of the replacement securities. If replacement securities are not available, IBT will credit the equivalent cash value to the Fund.
While a security is on loan, the Fund does not have the right to vote that security. However, if time permits, the Fund will attempt to recall a security on loan and vote the proxy.
Income from securities lending is included in the Statement of Operations. The amount of collateral and value of securities on loan are included in the Statement of Assets and Liabilities as well as in the Schedule of Investments.
Real Estate Investment Trusts ("REITs"): There are certain additional risks involved in investing in REITs. These include, but are not limited to, economic conditions, changes in zoning laws, real estate values, property taxes and interest rates.
Futures contracts: The Fund may enter into futures contracts to manage exposure to market, interest rate or currency fluctuations. Futures contracts are valued at the settlement price established each day by the board of trade or exchange on which they are traded. The primary risks associated with futures contracts are imperfect correlation between the change in market value of the securities held and the prices of futures contracts; the possibility of an illiquid market and inability of the counterparty to meet the contract terms.
Security transactions and investment income: Security transactions are recorded on the trade date. Security gains and losses are calculated on the specific identification basis. Dividend income is recorded on the ex-dividend date or, in the case of foreign securities, as soon as the Fund is informed of the ex-dividend date. Interest income, including accretion of discounts and amortization of premiums, is recorded on the accrual basis commencing on the settlement date.
Account maintenance fees: If the shareholder account balance falls below $1 by either shareholder action or as a result of market action, a $25 (not in thousands) fee is assessed every year until the balance reaches $1. The fee is assessed by redeeming shares in the shareholder's account.
No fee will be charged under the following conditions:
• accounts opened within the preceding 24 months
• accounts with an active monthly Automatic Investment Plan ($50 (not in thousands) minimum per fund)
• accounts owned by an individual which, when combined by social security number, have a balance of $5 or more
• accounts owned by individuals in the same household (by address) that have a combined balance of $5 or more
• UTMA/UGMA accounts
• Fiduciary accounts
• B-share accounts whose shares have started to convert to A-shares accounts (as long as combined value of both accounts is at least $1)
For the year ended October 31, 2004, this fee totaled $1. These fees are included in Paid in Capital in the Statement of Assets and Liabilities.
Redemption fees: A short-term trading redemption fee may be assessed on any fund shares in a fund account that are sold during the first five (5) New York Stock Exchange trading days following their purchase date. This redemption fee will equal 2% of the amount redeemed and shares held the longest will be treated as being redeemed first and shares held the shortest as being redeemed last. For the year ended October 31, 2004, the Fund received no redemption fees.
Dividend distributions: Distributions to shareholders are recorded on the ex-dividend date and are determined in accordance with Federal income tax regulations which may differ from GAAP.
Transamerica IDEX Mutual Funds
Annual Report 2004
11
TA IDEX American Century Large Company Value
NOTES TO FINANCIAL STATEMENTS (continued)
At October 31, 2004
(all amounts in thousands)
NOTE 2. RELATED PARTY TRANSACTIONS
AEGON/Transamerica Fund Advisers, Inc. ("ATFA") is the Fund's investment adviser. AEGON/Transamerica Fund Services, Inc. ("ATFS") is the Fund's administrator. AFSG Securities Corp. ("AFSG") is the Fund's distributor/principal underwriter. AEGON/Transamerica Investor Services, Inc. ("ATIS") is the Fund's transfer agent. ATIS and AFSG are 100% owned by AUSA Holding Company ("AUSA"). ATFA is a directly owned subsidiary of Western Reserve Life Assurance Co. of Ohio (78%) ("WRL") and AUSA (22%). ATFS is a wholly owned subsidiary of WRL. AUSA and WRL are wholly owned indirect subsidiaries of AEGON NV, a Netherlands corporation.
The following schedule reflects the percentage of fund assets owned by affiliated mutual funds (ie: through the assets allocation funds):
| | | Net
Assets | | % of
Net Assets | |
TA IDEX Asset Allocation-Conservative
Portfolio | | $ | 15,597 | | | | 9 | % | |
TA IDEX Asset Allocation-Moderate
Growth Portfolio | | | 86,801 | | | | 47 | % | |
TA IDEX Asset Allocation-Moderate
Portfolio | | | 44,307 | | | | 24 | % | |
| Total | | $ | 146,705 | | | | 80 | % | |
Investment advisory fee: The Fund pays management fees to ATFA based on average daily net assets ("ANA") at the following breakpoints:
0.90% of the first $100 million of ANA
0.85% of the next $150 million of ANA
0.80% of ANA over $250 million
ATFA has contractually agreed to waive its advisory fee and will reimburse the Fund to the extent that operating expenses, excluding 12b-1 fees, exceed the following stated annual limit:
1.50% Expense Limit
If total fund expenses fall below the annual expense limitation agreement agreed to by the adviser within the succeeding three years, the Fund may be required to pay that adviser a portion or all of the waived advisory fees.
| | | Advisory Fee
Waived | | Available for
Recapture
Through | |
| Fiscal Year 2003 | | | 207 | | | 10/31/2006 | |
There were no amounts recaptured during the fiscal year ended October 31, 2004.
If total class expenses fall below the annual expense limitation agreement agreed to by the adviser within the succeeding three years, the Fund may be required to pay that adviser a portion or all of the reimbursed class expenses.
| | | Reimbursement
of Class
Expenses | | Available for
Recapture
Through | |
Fiscal Year 2004
Class C | | | 1 | | | | 10/31/07 | | |
Distribution and service fees: The Fund has a 12b-1 distribution plan under the 1940 Act pursuant to which an annual fee, based on average daily net assets, is paid to the distributor for various disbursements such as broker-dealer account servicing fees and other promotional expenses of the Fund. The Fund is authorized under the 12b-1 plan to pay fees on each class up to the following limits:
| Class A | | | 0.35 | % | |
| Class B | | | 1.00 | % | |
| Class C | | | 1.00 | % | |
| Class C2 | | | 1.00 | % | |
| Class M | | | 0.90 | % | |
Class C2 and Class M merged into Class C on June 15, 2004 and September 24, 2004, respectively.
In the case the Fund or a class of shares of the Fund is closed to new investors or investments, the Fund is authorized to pay 12b-1 fees for past sales and distribution efforts and present and past investor services.
Underwriter commissions relate to front-end sales charges imposed for Class A and M shares and contingent deferred sales charges from Classes B, C, M and certain A share redemptions. For the year ended October 31, 2004, the underwriter commissions were as follows:
| Received by Underwriter | | $ | 211 | | |
| Retained by Underwriter | | | 8 | | |
| Contingent Deferred Sales Charge | | | 54 | | |
Administrative services: The Fund has entered into an agreement with ATFS for financial and legal fund administration services, which includes such items as compliance, expenses, financial statements and other reporting, distributions, tax returns, prospectus preparation, board of trustees meeting support and other legal matters. The Fund pays ATFS an annual fee of 0.015% of average net assets. The Legal fees on the Statement of Operations are for fees paid to external legal counsel.
The Fund paid ATFS $17 for the year ended October 31, 2004.
Transfer agent fees: The Fund pays ATIS an annual per-account charge of $20 (not in thousands) for each open account and $1.63 (not in thousands) for each closed account. There is no new account charge. The transfer agent fees on the Statement of Operations are made up of fees paid to ATIS and costs associated with shareholder statements. The Fund paid ATIS $119 for the year ended October 31, 2004.
Transamerica IDEX Mutual Funds
Annual Report 2004
12
TA IDEX American Century Large Company Value
NOTES TO FINANCIAL STATEMENTS (continued)
At October 31, 2004
(all amounts in thousands)
NOTE 2.–(continued)
Deferred compensation plan: Each eligible Fund Trustee may elect participation in the Deferred Compensation Plan ("the Plan"). Under the Plan, such Trustees may defer payment of a percentage of their total fees earned as a Fund Trustee. These deferred amounts may be invested in any Transamerica IDEX Mutual Fund. At October 31, 2004, the value of invested plan amount was $2. Invested plan amounts and the total liability for deferred compensation to the Trustees under the Plan at October 31, 2004, are included in the accompanying Statement of Assets and Liabilities.
NOTE 3. INVESTMENT TRANSACTIONS
The cost of securities purchased and proceeds from securities sold (excluding short-term securities) for the year ended October 31, 2004, were as follows:
| Purchases of securities: | | | |
| Long-Term excluding U.S. Government | | $ | 179,748 | | |
| U.S. Government | | | – | | |
| Proceeds from maturities and sales of securities | | | |
| Long-Term excluding U.S. Government | | | 46,731 | | |
| U.S. Government | | | – | | |
NOTE 4. FEDERAL INCOME TAX MATTERS
The Fund has not made any provision for federal income or excise taxes due to its policy to distribute all of its taxable income and capital gains to its shareholders and otherwise qualify as a regulated investment company under the Internal Revenue Code. Income and capital gain distributions are determined in accordance with income tax regulations, which may differ from GAAP. These differences are primarily due to differing treatment for items including, but not limited to, wash sales, net operating losses and capital loss carryforwards.
Reclassifications between Undistributed net investment income (loss), Accumulated net realized capital gains (loss) and Shares of beneficial interest are made to reflect income and gains available for distribution under federal tax regulations. Results of operations and net assets are not effected by these reclassifications. These reclassifications are as follows:
| Undistributed net investment income (loss) | | $ | (1 | ) | |
Accumulated net realized gain (loss) from
investment securities and futures contracts | | | 1 | | |
The tax character of distributions paid may differ from the character of distributions shown in the Statements of Changes in Net Assets due to short-term gains being treated as ordinary income for tax purposes.
The tax character of distributions paid during 2003 and 2004 was as follows:
| 2003 Distributions paid from: | | | |
| Ordinary Income | | $ | – | | |
| Long-term capital gain | | | – | | |
| 2004 Distributions paid from: | | | |
| Ordinary Income | | $ | 79 | | |
| Long-term capital gain | | | – | | |
The tax basis components of distributable earnings as of October 31, 2004, are as follows:
| Undistributable Ordinary Income | | $ | 539 | | |
| Undistributable Long-term Capital Gains | | $ | – | | |
| Capital Loss Carryforward | | $ | 2,425 | | |
| Net Unrealized Appreciation (Depreciation) | | $ | 4,202 | | |
The capital loss carryforwards are available to offset future realized capital gains through the period listed:
Capital Loss
Carryforward | | Available through | |
| $ | 2,425 | | | October 31, 2011 | |
The capital loss carryforward utilized during the year ended October 31, 2004 was $4,267.
The aggregate cost of investments and composition of unrealized appreciation (depreciation) for federal income tax purposes as of October 31, 2004, are as follows:
| Federal Tax Cost Basis $ | | | 203,251 | | |
| Unrealized Appreciation | | $ | 7,306 | | |
| Unrealized (Depreciation) | | | (3,104 | ) | |
| Net Unrealized Appreciation (Depreciation) | | $ | 4,202 | | |
NOTE 5. OTHER MATTERS
Transamerica IDEX Mutual Funds ("TA IDEX"), and certain of its affiliated entities, have received requests for information from the Staff of the Securities and Exchange Commission in connection with market timing and late trading within the funds. TA IDEX and the affiliated entities have voluntarily cooperated in the investigation and have been providing the information as requested.
Transamerica IDEX Mutual Funds
Annual Report 2004
13
Report of Independent Registered Certified Public Accounting Firm
To the Board of Trustees and Shareholders of
TA IDEX American Century Large Company Value
In our opinion, the accompanying statement of assets and liabilities, including the schedule of investments, and the related statements of operations and of changes in net assets and the financial highlights present fairly, in all material respects, the financial position of TA IDEX American Century Large Company Value (the "Fund") (one of the portfolios constituting the Transamerica IDEX Mutual Funds) at October 31, 2004, the results of its operations for the year then ended, the changes in its net assets for each of the two years in the period then ended and the financial highlights for each of the periods indicated, in conformity with accounting principles generally accepted in the United States of America. These financial statements and financial highlights (hereafter referred to as "financial statements") are the responsibility of the Fund's management; our responsibility is to express an opinion on these financial statements based on our audits. We conducted our audits of these financial statements in accordance with the standards of the Public Company Accounting Oversight Board (United States). Those standards require that we plan and perform the audit to obtain reasonable assurance about whether the financial statements are free of material misstatement. An audit includes examining, on a test basis, evidence supporting the amounts and disclosures in the financial statements, assessing the accounting principles used and significant estimates made by management, and evaluating the overall financial statement presentation. We believe that our audits, which included confirmation of securities at October 31, 2004 by correspondence with the custodian and brokers, provide a reasonable basis for our opinion.

PricewaterhouseCoopers LLP
Tampa, Florida
December 28, 2004
Transamerica IDEX Mutual Funds
Annual Report 2004
14
TA IDEX American Century Large Company Value
SUPPLEMENTAL INFORMATION (unaudited)
TAX INFORMATION
For dividends paid during the year ended October 31, 2004, the Fund designated $652 as qualified dividend income.
For corporate shareholders, 100% of investment income (dividend income plus short-term gains, if any) qualifies for the dividends received deduction.
The information and distributions reported herein may differ from the information and distributions taxable to the shareholders for the calendar year ending December 31, 2004. Complete information will be computed and reported in conjunction with your 2004 Form 1099-DIV.
RESULTS OF SHAREHOLDER PROXY
At a special meeting of Class M shareholders of each series of Transamerica IDEX (except TA IDEX Federated Tax Exempt and TA IDEX Protected Principal Stock) held on September 2, 2004, the results of the Proposal were as follows:
Proposal 1: Approval of a conversion of Class M shares into Class C shares of the Funds, which will result in bearing the distribution and service fees payable under the 12b-1 Plan of Distribution for the Class C shares of the Funds.
| For | | Against | | Abstentions/Broker Non-Votes | |
| | 84.63 | % | | | 6.41 | % | | | 8.96 | % | |
Transamerica IDEX Mutual Funds
Annual Report 2004
15
TA IDEX Asset Allocation–Conservative Portfolio
MARKET ENVIRNONMENT
The last 12 months were a volatile period in the global securities market, but overall provided solid gains to well-diversified investors. Domestic stocks led the way early in the year, continuing to rally off their 2002 lows, but since then the U.S. stock market has been choppy, with little net change.
The markets indecisiveness seemed driven by a profusion of uncertainty. Economic indicators turned mixed over the summer after seeming to point clearly upward in the spring. The presidential election loomed, with the polls offering little clarity as to which candidate might win. Oil prices hovered near historic highs, and the situation in Iraq remained extremely tense. And amid all this, the Federal Reserve Board ("Fed") raised interest rates three times and signaled more hikes would be on the way.
At least the strong gains early in the year persisted through this uncertainty, with the Standard and Poor's 500 Composite Stock Index up 9.41% for the last 12 month period, all of which came in the first five months of the year. The big winners were small-cap stocks, though, with the Standard and Poor's SmallCap 600 up nearly 25%.
Interest rates were surprisingly supportive of equity prices. The dominant perception through March was that slow payroll growth would keep a lid on Fed interest rate hikes, and the Madrid terrorist attacks sparked renewed interest in safe Treasuries among both foreign and U.S. investors. However, a much stronger-than-expected March jobs report was the turning point for the bond market, leading to the first sharp upward spike in interest rates. However, since then bonds pulled off an impressive reversal. Even as the Fed raised short rates three times, long-term yields fell and the yield curve flattened through the summer and fall. Over the 12-month period, the Lehman Brothers Aggregate Bond Index ("LBAB") managed a 5.53% gain, and the equity sensitive Lehman Brothers High Yield Index gained 12.32%.
Many of the same market trends were evident in foreign markets. Gains were well distributed across foreign markets, consistent with the view of an improving world economy. In addition, unhedged foreign funds and indexes were buoyed by generally strong foreign currencies relative to the dollar, with the Morgan Stanley Capital International (EAFE) Index ("MSCI EAFE") up more than 19% converted back into dollar terms.
PERFORMANCE
For the year ended October 31, 2004, TA IDEX Asset Allocation–Conservative Portfolio, Class A returned 8.97%. By comparison its benchmark, the LBAB returned 5.53%.
STRATEGY REVIEW
How did you manage the portfolio in this market environment?
The TA IDEX Asset Allocation–Conservative Portfolio is designed to moderate volatility by investing primarily in fixed income funds and using equity exposure to provide modest growth. Nevertheless, it remains broadly diversified across the financial markets. The portfolio performed well relative to its benchmark and peers, with a 8.97% gain over the last 12 months, landing in the top quartile of Morningstar's Co nservative Allocation category, and beating the LBAB by a wide margin.
The portfolio benefited strongly from its exposure to small and mid-cap stocks over this period, as those were the strongest performing parts of the domestic equity market. Over the course of the year, cash flows into the portfolio were generally used to increase the portfolio's exposure to Treasury-Inflation Protected Securities ("TIPS") and large-cap value stocks. TIPS performed especially well for the portfolio, w ith TA IDEX PIMCO Real Return TIPS up 7.94%.
How did credit quality and duration impact the portfolio?
The portfolio's 55% stake in fixed-income did well due to its exposure to credit-sensitive bonds such as convertibles and high-yield. The best fixed-income performer was the 11.5% stake in TA IDEX Transamerica Convertible Securities, which gained 7.06%. TA IDEX Transamerica Conservative High Yield Bond, amounting to nearly 17% of assets, added a gain of 9.23%. The portfolio also profited substantially from its exposure to inflation-protected securities, as real rates declined more than nominal rates. TA IDEX PIMCO Real Return TIPS , the portfolio's largest holding with nearly 19% of assets managed a 7.94% gain, beating TA IDEX PIMCO Total Return, which amounts to just 5% of assets by over 3%. All three of the portfolio's largest bond holdings, amounting to more than 47% of assets substantially outperformed the LBAG's gain of 5.53% for the period.
Over the course of the year this portfolio's exposure to credit-sensitive bonds was gradually reduced, because that sector has rallied so strongly since late 2002. Instead those assets were directed into TA IDEX PIMCO Real Return TIPS.
Which individual holdings had the greatest positive impact on performance?
The portfolio's niche equity holdings paid off well. TA IDEX Transamerica Small/Mid CapValue added 20.61%; and TA IDEX Clarion Real Estate Securities gained 29.30%. These two winners accounted for 25% of the portfolio's assets invested in equity funds at the end of October.
Transamerica IDEX Mutual Funds
Annual Report 2004
1
TA IDEX Asset Allocation–Conservative Portfolio (continued)
Which individual holdings had the greatest negative impact on performance?
The portfolio's international equity exposure should have helped more than it did. TA IDEX American Century International, the portfolio's largest international equity holding and the only pure international investment available in the TA IDEX lineup, gained 9.95% over the last 12 months, though its MSCI EAFE benchmark added 19.27%. As a result of its persistent underperformance, that investment was gradually liquidated over the course of the year, which helped reduce the negative effect of TA IDEX American Century's underperformance to a limited extent.
TA IDEX T. Rowe Price Tax-Efficient Growth and TA IDEX T. Rowe Price Small Cap were also underperformers for the period. However, since both positions were little more than 1% of total net assets, they did not have a large negative impact on performance.
Which sectors/industries had the greatest impact on performance?
The portfolio had 6% of total assets in TA IDEX Clarion Real Estate Securities, which primarily owns real estate investment trusts ("REITs"). The real estate sector was one of the best performing sectors across the U.S. stock market, and as a result the TA IDEX Clarion Real Estate Securities was up 29.30% for the period.
Which countries had the greatest impact on performance?
Because of the poor relative performance of TA IDEX American Century International, over the course of the year the portfolio's foreign exposure was reduced to a minimal level.
Investment Committee
AEGON/Transamerica Fund Advisers, Inc.
Transamerica IDEX Mutual Funds
Annual Report 2004
2
TA IDEX Asset Allocation–Conservative Portfolio
Comparison of change in value of $10,000 investment in Class A shares and its comparative index.
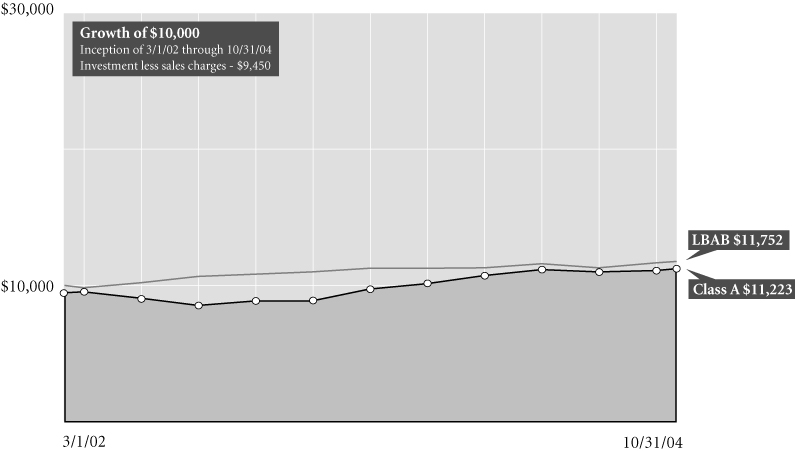
Average Annual Total Return for Periods Ended 10/31/04
| | | 1 year | | From
Inception | | Inception
Date | |
| Class A (NAV) | | | 8.97 | % | | | 6.65 | % | | 3/1/02 | |
| Class A (POP) | | | 2.98 | % | | | 4.41 | % | | 3/1/02 | |
| LBAB1 | | | 5.53 | % | | | 6.24 | % | | 3/1/02 | |
| Class B (NAV) | | | 8.21 | % | | | 5.92 | % | | 3/1/02 | |
| Class B (POP) | | | 3.21 | % | | | 4.89 | % | | 3/1/02 | |
| Class C (NAV) | | | 8.26 | % | | | 12.90 | % | | 11/11/02 | |
| Class C (POP) | | | 7.26 | % | | | 12.90 | % | | 11/11/02 | |
NOTES
1 The Lehman Brothers Aggregate Bond (LBAB) Index is an unmanaged index used as a general measure of market performance. Calculations assume dividends and capital gains are reinvested and do not include any managerial expenses. From inception calculation is based on life of Class A shares. Source: Standard & Poor's Micropal®© Micropal, Inc. 2004 – 1-800-596-5323 – http://www.micropal.com.
The performance data presented represents past performance, future results may vary. Performance data does not reflect the deduction of taxes that would be paid on fund distributions or the redemption of fund shares. Investment return and principal value will fluctuate so that an investor's shares, when redeemed, may be worth more or less than their original cost. Current performance may be lower or higher than performance quoted.
Public Offering Price (POP) returns include the reinvestment of dividends and capital gains and reflect the maximum sales charge of 5.5% for A shares or the maximum applicable contingent deferred sales charge (5% in the 1st year, decreasing to 0% after 6 years) for Class B shares and 1% (during the first 12 months) for Class C shares. Shares purchased prior to March 1, 2004 are subject to a maximum applicable contingent deferred sales charge (5% in the 1st year, decreasing to 0% after 7 years) for Class B shares and (2% in the 1st year, decreasing to 0% after 2 years) for Class C shares. Ne t Asset Value (NAV) returns include the reinvestment of dividends and capital gains but do not reflect any sales charges.
This material must be preceded or accompanied by a current prospectus, which includes specific contents regarding the investment objectives and policies of this fund.
Transamerica IDEX Mutual Funds
Annual Report 2004
3
TA IDEX Asset Allocation–Conservative Portfolio
UNDERSTANDING YOUR FUND'S EXPENSES (unaudited)
SHAREHOLDER EXPENSES
The following Example is intended to help you understand your ongoing costs (in dollars and cents) of investing in a Fund and to compare these costs with the ongoing costs of investing in other funds.
The Example is based on an investment of $1,000 invested at the beginning of the period and held for the entire period from May 1, 2004 to October 31, 2004.
ACTUAL EXPENSES
The first line in the table below provides information about actual account values and actual expenses. You may use the information in this line, together with the amount you invested, to estimate the expenses that you paid over the period. Simply divide your account value by $1,000 (for example, an $8,600 account value divided by $1,000 = 8.6), then multiply the result by the number in the first line of your Fund un der the heading entitled "Expenses Paid During Period" to estimate the expenses you paid on your account during this period.
HYPOTHETICAL EXAMPLE FOR COMPARISON PURPOSES
The second line in the table below provides information about hypothetical account values and hypothetical expenses based on each Fund's actual expense ratio and an assumed rate of return of 5% per year before expenses, which is not the Fund's actual return. The hypothetical account values and expenses may not be used to estimate the actual ending account balance or expenses you paid for the period. You may use this information to compare the ongoing costs of investing in your Fund and other funds. To do so, compare this 5% hypothetical example with the 5% hypothetical examples that appear in the shareholder reports of the other funds.
Please note that the expenses shown in the table are meant to highlight your ongoing costs only and do not reflect any transactional costs, such as sales charges, redemption fees, brokerage commissions paid on purchases and sales of fund shares. Therefore, the second line under each Fund in the table is useful in comparing ongoing costs only, and will not help you determine the relative total costs of owning different funds. In addition, note that the expenses shown in the table are meant to highlight your ongoing costs and do not reflect any transaction costs.
| | | Beginning
Account
Value | | Ending
Account
Value | | Annualized
Expense
Ratio | |
Expenses Paid
During Period (a) | |
| Class A | | | |
| Actual | | $ | 1,000.00 | | | $ | 1,040.60 | | | | 0.31 | % | | $ | 1.59 | | |
| Hypothetical (b) | | | 1,000.00 | | | | 1,023.58 | | | | 0.31 | | | | 1.58 | | |
| Class B | | | |
| Actual | | | 1,000.00 | | | | 1,037.50 | | | | 0.94 | | | | 4.81 | | |
| Hypothetical (b) | | | 1,000.00 | | | | 1,020.41 | | | | 0.94 | | | | 4.77 | | |
| Class C | | | |
| Actual | | | 1,000.00 | | | | 1,038.00 | | | | 0.95 | | | | 4.87 | | |
| Hypothetical (b) | | | 1,000.00 | | | | 1,020.36 | | | | 0.95 | | | | 4.82 | | |
(a) Expenses are calculated using each Fund's annualized expense ratio (as disclosed in the table), multiplied by the average account value for the period, multiplied by number of days in the period (184 days), and divided by the number of days in the year (366 days).
(b) 5% return per year before expenses.
GRAPHIC PRESENTATION OF SCHEDULE OF INVESTMENT
By Asset Type
At October 31, 2004
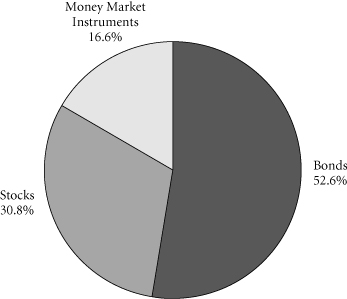
This chart shows the percentage breakdown by asset type of the Fund's total investment securities. Asset type is calculated based on the aggregate portfolio holdings in the underlying funds in which the Fund invests. The security lending collateral in the underlying funds is excluded from this calculation.
Transamerica IDEX Mutual Funds
Annual Report 2004
4
TA IDEX Asset Allocation–Conservative Portfolio
SCHEDULE OF INVESTMENTS
At October 31, 2004
(all amounts except share amounts in thousands)
| | | Shares | | Value | |
| INVESTMENT COMPANIES (99.9%) (b) | |
| Agressive Equity (9.7%) | |
| TA IDEX T. Rowe Price Health Sciences | | | 1,377,391 | | | $ | 14,931 | | |
| TA IDEX T. Rowe Price Small Cap (a) | | | 361,916 | | | | 3,923 | | |
TA IDEX Transamerica Growth
Opportunities (a) | | | 973,722 | | | | 6,436 | | |
TA IDEX Transamerica
Small/Mid Cap Value | | | 857,673 | | | | 12,282 | | |
| Capital Preservation (7.0%) | |
| TA IDEX Transamerica Money Market | | | 27,237,552 | | | | 27,238 | | |
| Fixed-Income (56.3%) | |
| TA IDEX PIMCO Real Return TIPS | | | 7,022,512 | | | | 73,596 | | |
| TA IDEX PIMCO Total Return | | | 1,937,349 | | | | 20,304 | | |
TA IDEX Transamerica Conservative
High-Yield Bond | | | 7,001,361 | | | | 65,603 | | |
TA IDEX Transamerica
Convertible Securities | | | 4,068,014 | | | | 44,748 | | |
| TA IDEX Transamerica Flexible Income | | | 1,505,620 | | | | 14,574 | | |
| | | Shares | | Value | |
| Growth Equity (19.5%) | | | |
TA IDEX American Century
Large Company Value | | | 1,529,137 | | | | $15,597 | | |
| TA IDEX Great Companies–TechnologySM (a) | | | 1,985,093 | | | | 7,543 | | |
| TA IDEX Janus Growth | | | 223,754 | | | | 4,824 | | |
| TA IDEX Salomon All Cap (a) | | | 982,407 | | | | 14,540 | | |
| TA IDEX Salomon Investors Value | | | 1,984,685 | | | | 26,396 | | |
TA IDEX T Rowe Price
Tax-Efficient Growth | | | 396,771 | | | | 3,944 | | |
| TA IDEX Transamerica Equity | | | 398,156 | | | | 2,966 | | |
| Speciality–Real Estate (5.9%) | | | |
| TA IDEX Clarion Real Estate Securities | | | 1,651,983 | | | | 23,095 | | |
| World Equity (1.5%) | | | |
TA IDEX Templeton
Great Companies Global (a) | | | 248,531 | | | | 5,617 | | |
| Total Investment Companies (cost: $361,980) | | | | | | | 388,157 | | |
| Total Investment Securities (cost: $361,980) | | | | | | $ | 388,157 | | |
| SUMMARY: | | | |
| Investments, at value | | | 99.9 | % | | $ | 388,157 | | |
| Other assets in excess of liabilities | | | 0.1 | % | | | 367 | | |
| Net assets | | | 100.0 | % | | $ | 388,524 | | |
NOTES TO SCHEDULE OF INVESTMENTS:
(a) No dividends were paid during the preceding twelve months.
(b) The Fund invests its assets in Class A shares of the underlying TA IDEX Mutual Funds, which are affiliates of the Fund.
The notes to the financial statements are an integral part of this report.
Transamerica IDEX Mutual Funds
Annual Report 2004
5
TA IDEX Asset Allocation–Conservative Portfolio
STATEMENT OF ASSETS AND LIABILITIES
At October 31, 2004
(all amounts except per share amounts in thousands)
| Assets: | | | |
Investment in affiliated mutual funds, at value
(cost: $361,980) | | $ | 388,157 | | |
| Cash | | | 84 | | |
| Receivables: | |
| Shares of beneficial interest sold | | | 1,457 | | |
| Other | | | 7 | | |
| | | | 389,705 | | |
| Liabilities: | | | |
| Investment securities purchased | | | 84 | | |
| Accounts payable and accrued liabilities: | |
| Shares of beneficial interest redeemed | | | 727 | | |
| Management and advisory fees | | | 66 | | |
| Distribution fees | | | 157 | | |
| Transfer agent fees | | | 25 | | |
| Other | | | 122 | | |
| | | | 1,181 | | |
| Net Assets | | $ | 388,524 | | |
| Net Assets Consist of: | | | |
Shares of beneficial interest, unlimited shares
authorized, no par value | | $ | 355,605 | | |
| Undistributed net investment income (loss) | | | – | | |
Undistributed accumulated net realized gain (loss)
from investment in affiliated mutual funds | | | 6,742 | | |
Net unrealized appreciation (depreciation) on
investment in affiliated mutual funds | | | 26,177 | | |
| Net Assets | | $ | 388,524 | | |
| Net Assets by Class: | | | |
| Class A | | $ | 99,811 | | |
| Class B | | | 106,601 | | |
| Class C | | | 182,112 | | |
| Shares Outstanding: | | | |
| Class A | | | 9,017 | | |
| Class B | | | 9,643 | | |
| Class C | | | 16,474 | | |
| Net Asset Value Per Share: | | | |
| Class A | | $ | 11.07 | | |
| Class B | | | 11.05 | | |
| Class C | | | 11.05 | | |
| Maximum Offering Price Per Share (a): | | | |
| Class A | | $ | 11.71 | | |
(a) Includes the maximum selling commission (represented as a percentage of offering price) which is reduced on certain levels of sales as set forth in the Prospectus. Net asset value per share for Classes B and C shares represents offering price. The redemption price for Classes B and C shares equals net asset value less any applicable contingent deferred sales charge.
STATEMENT OF OPERATIONS
For the year ended October 31, 2004
(all amounts in thousands)
| Investment Income: | | | |
| Interest | | $ | 2 | | |
| Dividend income | | | 5 | | |
| Dividends from affiliated mutual funds | | | 6,038 | | |
| | | | 6,045 | | |
| Expenses: | | | |
| Management and advisory fees | | | 328 | | |
| Transfer agent fees | |
| Class A | | | 64 | | |
| Class B | | | 81 | | |
| Class C | | | 105 | | |
| Class C2 | | | 7 | | |
| Class M | | | 4 | | |
| Printing and shareholder reports | | | 17 | | |
| Custody fees | | | 33 | | |
| Administration fees | | | 50 | | |
| Legal fees | | | 11 | | |
| Audit and accounting fees | | | 26 | | |
| Trustees fees | | | 18 | | |
| Registration fees | |
| Class A | | | 35 | | |
| Class B | | | 27 | | |
| Class C | | | 56 | | |
| Class C2 | | | 4 | | |
| Class M | | | 2 | | |
| Other | | | 14 | | |
| Distribution and service fees: | |
| Class B | | | 634 | | |
| Class C | | | 880 | | |
| Class C2 | | | 70 | | |
| Class M | | | 37 | | |
| Total expenses before recapture of waived expenses | | | 2,503 | | |
| Recaptured expenses | | | 33 | | |
| Total expenses | | | 2,536 | | |
| Net Investment Income (Loss) | | | 3,509 | | |
| Net Realized and Unrealized Gain (Loss): | | | |
Realized gain (loss) from investment in affiliated
mutual funds | | | 6,584 | | |
Realized gain distributions from investment
in affiliated mutual funds | | | 9,938 | | |
Increase (decrease) in unrealized appreciation
(depreciation) on investment in affiliated
mutual funds | | | 4,037 | | |
| Net Gain (Loss) on Investment in Affiliated Mutual Funds | | | 20,559 | | |
Net Increase (Decrease) in Net Assets Resulting
from Operations | | $ | 24,068 | | |
The notes to the financial statements are an integral part of this report.
Transamerica IDEX Mutual Funds
Annual Report 2004
6
TA IDEX Asset Allocation–Conservative Portfolio
STATEMENTS OF CHANGES IN NET ASSETS
For the years ended
(all amounts in thousands)
| | | October 31,
2004 | | October 31,
2003 | |
| Increase (Decrease) in Net Assets From: | |
| Operations: | |
| Net investment income (loss) | | $ | 3,509 | | | $ | 1,755 | | |
Net realized gain (loss) from
investment in affiliated mutual funds | | | 16,522 | | | | 581 | | |
Net unrealized appreciation
(depreciation) on investment in
affiliated mutual funds | | | 4,037 | | | | 22,911 | | |
| | | | 24,068 | | | | 25,247 | | |
| Distributions to Shareholders: | |
| From net investment income: | |
| Class A | | | (3,504 | ) | | | (442 | ) | |
| Class B | | | (3,870 | ) | | | (509 | ) | |
| Class C | | | (5,152 | ) | | | (228 | ) | |
| Class C2 | | | (672 | ) | | | (162 | ) | |
| Class M | | | (306 | ) | | | (78 | ) | |
| | | | (13,504 | ) | | | (1,419 | ) | |
| From net realized gains: | |
| Class A | | | (137 | ) | | | – | | |
| Class B | | | (216 | ) | | | – | | |
| Class C | | | (232 | ) | | | – | | |
| Class C2 | | | (39 | ) | | | – | | |
| Class M | | | (18 | ) | | | – | | |
| | | | (642 | ) | | | – | | |
| Capital Share Transactions: | |
| Proceeds from shares sold: | |
| Class A | | | 65,052 | | | | 58,579 | | |
| Class B | | | 35,549 | | | | 66,574 | | |
| Class C | | | 106,542 | | | | 83,907 | | |
| Class C2 | | | 5,538 | | | | 10,727 | | |
| Class M | | | 1,592 | | | | 3,386 | | |
| | | | 214,273 | | | | 223,173 | | |
Dividends and distributions
reinvested: | |
| Class A | | | 3,046 | | | | 383 | | |
| Class B | | | 3,317 | | | | 420 | | |
| Class C | | | 3,961 | | | | 156 | | |
| Class C2 | | | 184 | | | | 127 | | |
| Class M | | | 288 | | | | 69 | | |
| | | | 10,796 | | | | 1,155 | | |
| Cost of shares redeemed: | |
| Class A | | | (30,060 | ) | | | (13,815 | ) | |
| Class B | | | (20,630 | ) | | | (14,758 | ) | |
| Class C | | | (40,681 | ) | | | (6,938 | ) | |
| Class C2 | | | (3,918 | ) | | | (9,371 | ) | |
| Class M | | | (2,031 | ) | | | (2,144 | ) | |
| | | | (97,320 | ) | | | (47,026 | ) | |
| Class level exchanges: | |
| Class C | | | 25,151 | | | | – | | |
| Class C2 | | | (17,719 | ) | | | – | | |
| Class M | | | (7,432 | ) | | | – | | |
| | | | – | | | | – | | |
| | | October 31,
2004 | | October 31,
2003 | |
| Automatic conversions: | |
| Class A | | | 128 | | | | – | | |
| Class B | | | (128 | ) | | | – | | |
| | | | – | | | | – | | |
| | | | 127,749 | | | | 177,302 | | |
| Net increase (decrease) in net assets | | | 137,671 | | | | 201,130 | | |
| Net Assets: | |
| Beginning of year | | | 250,853 | | | | 49,723 | | |
| End of year | | $ | 388,524 | | | $ | 250,853 | | |
Undistributed Net Investment Income
(Loss) | | $ | – | | | $ | 377 | | |
| Share Activity: | |
| Shares issued: | |
| Class A | | | 5,924 | | | | 5,870 | | |
| Class B | | | 3,244 | | | | 6,893 | | |
| Class C | | | 9,685 | | | | 8,469 | | |
| Class C2 | | | 501 | | | | 1,125 | | |
| Class M | | | 146 | | | | 356 | | |
| | | | 19,500 | | | | 22,713 | | |
Shares issued–reinvested from
distributions: | |
| Class A | | | 283 | | | | 39 | | |
| Class B | | | 309 | | | | 43 | | |
| Class C | | | 369 | | | | 15 | | |
| Class C2 | | | 17 | | | | 13 | | |
| Class M | | | 27 | | | | 7 | | |
| | | | 1,005 | | | | 117 | | |
| Shares redeemed: | |
| Class A | | | (2,753 | ) | | | (1,387 | ) | |
| Class B | | | (1,882 | ) | | | (1,484 | ) | |
| Class C | | | (3,715 | ) | | | (685 | ) | |
| Class C2 | | | (354 | ) | | | (949 | ) | |
| Class M | | | (186 | ) | | | (220 | ) | |
| | | | (8,890 | ) | | | (4,725 | ) | |
| Class level exchanges: | |
| Class C | | | 2,336 | | | | – | | |
| Class C2 | | | (1,654 | ) | | | – | | |
| Class M | | | (682 | ) | | | – | | |
| | | | – | | | | – | | |
| Automatic conversions: | |
| Class A | | | 12 | | | | – | | |
| Class B | | | (12 | ) | | | – | | |
| | | | – | | | | – | | |
Net increase (decrease) in shares
outstanding: | |
| Class A | | | 3,466 | | | | 4,522 | | |
| Class B | | | 1,659 | | | | 5,452 | | |
| Class C | | | 8,675 | | | | 7,799 | | |
| Class C2 | | | (1,490 | ) | | | 189 | | |
| Class M | | | (695 | ) | | | 143 | | |
| | | | 11,615 | | | | 18,105 | | |
The notes to the financial statements are an integral part of this report.
Transamerica IDEX Mutual Funds
Annual Report 2004
7
TA IDEX Asset Allocation–Conservative Portfolio
FINANCIAL HIGHLIGHTS
| | | | | For a share of beneficial interest outstanding throughout each period | |
| | | | | Net Asset | | Investment Operations | | Distributions | | Net Asset | |
| | | For the
Period
Ended (d)(g) | | Value,
Beginning
of Period | | Net
Investment
Income (Loss) | | Net Realized
and Unrealized
Gain (Loss) | | Total
Operations | | From Net
Investment
Income | | From Net
Realized
Gains | | Total
Distributions | | Value,
End
of Period | |
| Class A | | 10/31/2004 | | $ | 10.67 | | | $ | 0.17 | | | $ | 0.77 | | | $ | 0.94 | | | $ | (0.51 | ) | | $ | (0.03 | ) | | $ | (0.54 | ) | | $ | 11.07 | | |
| | | 10/31/2003 | | | 9.22 | | | | 0.18 | | | | 1.47 | | | | 1.65 | | | | (0.20 | ) | | | – | | | | (0.20 | ) | | | 10.67 | | |
| | | 10/31/2002 | | | 10.00 | | | | 0.07 | | | | (0.85 | ) | | | (0.78 | ) | | | – | | | | – | | | | – | | | | 9.22 | | |
| Class B | | 10/31/2004 | | | 10.66 | | | | 0.10 | | | | 0.76 | | | | 0.86 | | | | (0.44 | ) | | | (0.03 | ) | | | (0.47 | ) | | | 11.05 | | |
| | | 10/31/2003 | | | 9.18 | | | | 0.11 | | | | 1.47 | | | | 1.58 | | | | (0.10 | ) | | | – | | | | (0.10 | ) | | | 10.66 | | |
| | | 10/31/2002 | | | 10.00 | | | | 0.03 | | | | (0.85 | ) | | | (0.82 | ) | | | – | | | | – | | | | – | | | | 9.18 | | |
| Class C | | 10/31/2004 | | | 10.66 | | | | 0.10 | | | | 0.76 | | | | 0.86 | | | | (0.44 | ) | | | (0.03 | ) | | | (0.47 | ) | | | 11.05 | | |
| | | 10/31/2003 | | | 9.19 | | | | 0.11 | | | | 1.46 | | | | 1.57 | | | | (0.10 | ) | | | – | | | | (0.10 | ) | | | 10.66 | | |
| | | | | | | Ratios/Supplemental Data | |
| | | For the
Period | | Total | | Net Assets,
End of
Period | | Ratio of Expenses
to Average
Net Assets | | Net Investment
Income (Loss)
to Average | | Portfolio
Turnover | |
| | | Ended (g) | | Return (c) | | (000's) | | Net (e) | | Total (f) | | Net Assets (a) | | Rate (b) | |
| Class A | | 10/31/2004 | | | 8.97 | % | | $ | 99,811 | | | | 0.29 | % | | | 0.28 | % | | | 1.55 | % | | | 11 | % | |
| | | 10/31/2003 | | | 18.18 | | | | 59,250 | | | | 0.41 | | | | 0.41 | | | | 1.80 | | | | 22 | | |
| | | 10/31/2002 | | | (7.80 | ) | | | 9,482 | | | | 0.45 | | | | 1.21 | | | | 1.27 | | | | 8 | | |
| Class B | | 10/31/2004 | | | 8.21 | | | | 106,601 | | | | 0.92 | | | | 0.91 | | | | 0.93 | | | | 11 | | |
| | | 10/31/2003 | | | 17.38 | | | | 85,134 | | | | 1.06 | | | | 1.06 | | | | 1.15 | | | | 22 | | |
| | | 10/31/2002 | | | (8.20 | ) | | | 23,229 | | | | 1.10 | | | | 1.86 | | | | 0.62 | | | | 8 | | |
| Class C | | 10/31/2004 | | | 8.26 | | | | 182,112 | | | | 0.93 | | | | 0.92 | | | | 0.89 | | | | 11 | | |
| | | 10/31/2003 | | | 17.25 | | | | 83,165 | | | | 1.06 | | | | 1.06 | | | | 1.15 | | | | 22 | | |
NOTES TO FINANCIAL HIGHLIGHTS
(a) Annualized.
(b) Not annualized for periods of less than one year.
(c) Total Return has been calculated for the applicable period without deduction of a sales load, if any, on an initial purchase. Periods of less than one year are not annualized.
(d) Per share information is calculated based on average number of shares outstanding.
(e) Ratio of Net Expenses to Average Net Assets is net of fee waivers and reimbursements by the investment adviser, if any, and includes the recapture of previously waived expenses (see note 2).
(f) Ratio of Total Expenses to Average Net Assets includes all expenses before fee waivers, reimbursements by the investment adviser and recapture of previously waived expenses.
(g) TA IDEX Asset Allocation–Conservative Portfolio ("the Fund") commenced operations on March 1, 2002. The inception date for the Fund's offering of share Class L was November 11, 2002. Class L was renamed Class C on March 1, 2004 (see note 1).
The notes to the financial statements are an integral part of this report.
Transamerica IDEX Mutual Funds
Annual Report 2004
8
TA IDEX Asset Allocation–Conservative Portfolio
NOTES TO FINANCIAL STATEMENTS
At October 31, 2004
(all amounts in thousands)
NOTE 1. ORGANIZATION AND SIGNIFICANT ACCOUNTING POLICIES
Transamerica IDEX Mutual Funds, formerly IDEX Mutual Funds, is a Massachusetts business trust registered under the Investment Company Act of 1940, as amended (the "1940 Act"), as an open-end management investment company. TA IDEX Asset Allocation–Conservative Portfolio ("the Fund"), part of Transamerica IDEX Mutual Funds, began operations on March 1, 2002.
On March 1, 2004, the Fund changed its name from IDEX Asset Allocation–Conservative Portfolio to TA IDEX Asset Allocation–Conservative Portfolio.
In the normal course of business, the Fund enters into contracts that contain a variety of representations and warranties, which provide general indemnifications. The Fund's maximum exposure under these arrangements is unknown, as this would involve future claims that may be made against the Fund and/or its affiliates that have not yet occurred. However, based on experience, the Fund expects the risk of loss to be remote.
See the Prospectus and Statement of Additional Information for a description of the Fund's investment objective.
In preparing the Fund's financial statements in accordance with accounting principles generally accepted in the United States of America ("GAAP"), estimates or assumptions (which could differ from actual results) may be used that affect reported amounts and disclosures. The following policies were consistently followed by the Fund, in accordance with GAAP.
Multiple class operations and expenses: The Fund currently offers three classes of shares, each with a public offering price that reflects different sales charges, if any, and expense levels. All shares designated as Class C shares prior to March 1, 2004, were renamed as Class C2 shares on that date. All shares designated as Class L shares prior to March 1, 2004, were renamed as Class C shares with different sales charges than the previous Class L shares. On June 15, 2004, Class C2 shares merged into Class C. On September 24, 2004, Class M shares merged into Class C. Class B shares will convert to Class A shares eight years after purchase. Income, non-class specific expenses and realized and unrealized gains and losses, are allocated dail y to each class, based upon the value of shares outstanding method as permitted under Rule 18f-3 of the 1940 Act. Each class bears its own specific expenses as well as a portion of general, common expenses.
Pricing of shares: The Fund prices its shares on the basis of the net asset value of each class of shares of the Fund, which is determined as of the close of the New York Stock Exchange ("NYSE") (generally 4:00 p.m. Eastern Time) on each day on which the NYSE is open for
trading (other than a day on which there are insufficient changes in the value of the Fund's portfolio securities to materially affect the Fund's net asset value or a day on which no shares are tendered for redemption and no order to purchase any shares is received).
Security valuations: The Fund's investments are valued at the net asset values of the underlying portfolios of Transamerica IDEX Mutual Funds. The net asset values of the underlying portfolios are determined at the close of the NYSE (generally 4:00 p.m. eastern time) on the valuation date.
Cash: The Fund may leave cash overnight in its cash account with the custodian, Investors Bank & Trust Company ("IBT"). IBT has been contracted on behalf of the Fund to invest the excess cash into a savings account, which at October 31, 2004, was paying an interest rate of 1.30%.
Throughout the year, the Fund may have a cash overdraft balance. A fee is incurred on this overdraft, calculated by multiplying the overdraft by a rate based on the federal funds rate. This fee is included in Custody fees in the Statement of Operations.
Security transactions and investment income: Security transactions are recorded on the trade date. Security gains and losses are calculated on the specific identification basis. Interest income, including accretion of discounts and amortization of premiums, is recorded on the accrual basis commencing on the settlement date. Dividend income is recorded on the ex-dividend date, dividends and net realized gain (loss) from investment securities for the Fund are from investments in shares of affiliated companies.
Account maintenance fees: If the shareholder account balance falls below $1 by either shareholder action or as a result of market action, a $25 (not in thousands) fee is assessed every year until the balance reaches $1. The fee is assessed by redeeming shares in the shareholder's account.
No fee will be charged under the following conditions:
• accounts opened within the preceding 24 months
• accounts with an active monthly Automatic Investment Plan ($50 (not in thousands) minimum per fund)
• accounts owned by an individual which, when combined by social security number, have a balance of $5 or more
• accounts owned by individuals in the same household (by address) that have a combined balance of $5 or more
• UTMA/UGMA accounts
• Fiduciary accounts
• B-share accounts whose shares have started to convert to A-shares accounts (as long as combined value of both accounts is at least $1)
Transamerica IDEX Mutual Funds
Annual Report 2004
9
TA IDEX Asset Allocation–Conservative Portfolio
NOTES TO FINANCIAL STATEMENTS (continued)
At October 31, 2004
(all amounts in thousands)
NOTE 1.–(continued)
For the year ended October 31, 2004, there were no fees. These fees are included in Paid in Capital in the Statement of Assets and Liabilities.
Redemption fees: A short-term trading redemption fee may be assessed on any fund shares in a fund account that are sold during the first five (5) New York Stock Exchange trading days following their purchase date. This redemption fee will equal 2% of the amount redeemed and shares held the longest will be treated as being redeemed first and shares held the shortest as being redeemed last. For the year ended October 31, 2004, the Fund received no redemption fees.
Dividend distributions: Distributions to shareholders are recorded on the ex-dividend date and are determined in accordance with Federal income tax regulations which may differ from GAAP.
NOTE 2. RELATED PARTY TRANSACTIONS
AEGON/Transamerica Fund Advisers, Inc. ("ATFA") is the Fund's investment adviser. AEGON/Transamerica Fund Services, Inc. ("ATFS") is the Fund's administrator. AFSG Securities Corp. ("AFSG") is the Fund's distributor/principal underwriter. AEGON/Transamerica Investor Services, Inc. ("ATIS") is the Fund's transfer agent. ATIS and AFSG are 100% owned by AUSA Holding Company ("AUSA"). ATFA is a directly owned subsidiary of Western Reserve Life Assurance Co. of Ohio (78%) ("WRL") and AUSA (22%). ATFS is a wholly owned subsidiary of WRL. AUSA and WRL are wholly owned indirect subsidiaries of AEGON NV, a Netherlands corporation.
ATFA has entered into an agreement with Morningstar Associates, LLC to provide investment services to the Fund. ATFA compensates Morningstar Associates, LLC as described in the Prospectus.
Transamerica Investment Management, LLC and Great Companies, LLC are affiliates of the Fund and are sub-advisers to other funds within Transamerica IDEX Mutual Funds.
Investment advisory fees: The Fund pays management fees to ATFA based on average daily net assets ("ANA") at the following rate:
0.10% of ANA
ATFA has contractually agreed to waive its advisory fee and will reimburse the Fund to the extent that operating expenses, excluding 12b-1 fees, exceed the following stated annual limit:
0.45% Expense Limit
If total fund expenses fall below the annual expense limitations agreed to by the adviser within the succeeding three years, the Fund may be required to pay the adviser a portion or all of the waived advisory fees.
| | | Expense
Recaptured
by Advisor | | Increase in Total
Expenses to
Average Net Assets | |
| Recaptured in 2004 | | $ | 33 | | | | 0.01 | % | |
There are no other expenses subject to recapture at October 31, 2004.
Distribution and service fees: The Fund has a 12b-1 distribution plan under the 1940 Act pursuant to which an annual fee, based on average daily net assets, is paid to the distributor for various disbursements such as broker-dealer account servicing fees and other promotional expenses of the Fund. The Fund was authorized under the 12b-1 plan to pay fees on each class up to the following limits:
| Class A | | | N/A | | |
| Class B | | | 0.65 | % | |
| Class C | | | 0.65 | % | |
| Class C2 | | | 0.65 | % | |
| Class M | | | 0.55 | % | |
Class C2 and Class M merged into Class C on June 15, 2004 and September 24, 2004, respectively.
In addition, the underlying funds' Class A shares in which the Fund invests impose a 0.35% 12b-1 fee. To avoid duplication of the 12b-1 fees, each class of fund shares of the Fund has reduced the 12b-1 fees by the amount of the underlying funds' Class A 12b-1 fees.
In the case the Fund or a class of shares of the Fund is closed to new investors or investments, the Fund is authorized to pay 12b-1 fees for past sales and distribution efforts and present and past investor services.
Underwriter commissions relate to front-end sales charges imposed for Class A and M shares and contingent deferred sales charges from Classes B, C, M and certain A share redemptions. For the year ended October 31, 2004, the underwriter commissions were as follows:
| Received by Underwriter | | $ | 9,208 | | |
| Retained by Underwriter | | | 459 | | |
| Contingent Deferred Sales Charge | | | 481 | | |
Administrative services: The Fund has entered into an agreement with ATFS for financial and legal fund administration services, which includes such items as compliance, expenses, financial statements and other reporting, distributions, tax returns, prospectus preparation, board of trustees meeting support and other legal matters. The Fund pays ATFS an annual fee of 0.015% of average net assets. The Legal fees on the Statement of Operations are for fees paid to external legal counsel.
The Fund paid ATFS $50 for the year ended October 31, 2004.
Transfer agent fees: The Fund pays ATIS an annual per-account charge of $20 (not in thousands) for each open account and $1.63 (not in
Transamerica IDEX Mutual Funds
Annual Report 2004
10
TA IDEX Asset Allocation–Conservative Portfolio
NOTES TO FINANCIAL STATEMENTS (continued)
At October 31, 2004
(all amounts in thousands)
NOTE 2.–(continued)
thousands) for each closed account. There is no new account charge. The transfer agent fees on the Statement of Operations are made up of fees paid to ATIS and costs associated with shareholder statements. The Fund paid ATIS $261 for the year ended October 31, 2004.
Deferred compensation plan: Each eligible Fund Trustee may elect participation in the Deferred Compensation Plan ("the Plan"). Under the Plan, such Trustees may defer payment of a percentage of their total fees earned as a Fund Trustee. These deferred amounts may be invested in any Transamerica IDEX Mutual Fund. At October 31, 2004, the value of invested plan amounts was $6. Invested plan amounts and the total liability for deferred compensation to the Trustees under the Plan at October 31, 2004, are included in the accompanying Statement of Assets and Liabilities.
NOTE 3. INVESTMENT TRANSACTIONS
The cost of securities purchased and proceeds from securities sold (excluding short-term securities) for the year ended October 31, 2004, were as follows:
| Purchases of securities: | | | |
| Long-Term excluding U.S. Government | | $ | 164,025 | | |
| U.S. Government | | | – | | |
| Proceeds from maturities and sales of securities | | | |
| Long-Term excluding U.S. Government | | | 35,117 | | |
| U.S. Government | | | – | | |
NOTE 4. FEDERAL INCOME TAX MATTERS
The Fund has not made any provision for federal income or excise taxes due to its policy to distribute all of its taxable income and capital gains to its shareholders and otherwise qualify as a regulated investment company under the Internal Revenue Code. Income and capital gain distributions are determined in accordance with income tax regulations, which may differ from GAAP. These differences are primarily due to differing treatment for items including, but not limited to, wash sales and distribution reclass from mutual funds.
Reclassifications between Undistributed net investment income (loss), Undistributed net realized capital gains (loss) and Shares of
Transamerica IDEX Mutual Funds
beneficial interest are made to reflect income and gains available for distribution under federal tax regulations. Results of operations and net assets are not effected by these reclassifications. These reclassifications are as follows:
Shares of beneficial interest, unlimited
shares authorized | | $ | – | | |
| Undistributed net investment income (loss) | | | 9,618 | | |
Undistributed net realized gain (loss) from
investment in affiliated mutual funds | | | (9,618 | ) | |
The tax character of distributions paid may differ from the character of distributions shown in the Statements of Changes in Net Assets due to short-term gains being treated as ordinary income for tax purposes. The tax character of distributions paid during 2003 and 2004 was as follows:
| 2003 Distributions paid from: | | | |
| Ordinary Income | | $ | 1,419 | | |
| Long-term capital gain | | | – | | |
| 2004 Distributions paid from: | | | |
| Ordinary Income | | | 14,141 | | |
| Long-term capital gain | | | 5 | | |
The tax basis components of distributable earnings as of October 31, 2004, are as follows:
| Undistributed Ordinary Income | | $ | 2,018 | | |
| Undistributed Long-term Capital Gains | | $ | 4,825 | | |
| Capital Loss Carryforward | | $ | – | | |
| Net Unrealized Appreciation (Depreciation) | | $ | 26,076 | | |
The aggregate cost of investments and composition of unrealized appreciation (depreciation) for federal income tax purposes as of October 31, 2004, are as follows:
| Federal Tax Cost Basis | | $ | 362,081 | | |
| Unrealized Appreciation | | $ | 26,342 | | |
| Unrealized (Depreciation) | | | (266 | ) | |
| Net Unrealized Appreciation (Depreciation) | | $ | 26,076 | | |
NOTE 5. OTHER MATTERS
Transamerica IDEX Mutual Funds ("TA IDEX"), and certain of its affiliated entities, have received requests for information from the Staff of the Securities and Exchange Commission in connection with market timing and late trading within the funds. TA IDEX and the affiliated entities have voluntarily cooperated in the investigation and have been providing the information as requested.
Annual Report 2004
11
Report of Independent Registered Certified Public Accounting Firm
To the Board of Trustees and Shareholders of
TA IDEX Asset Allocation–Conservative Portfolio
In our opinion, the accompanying statement of assets and liabilities, including the schedule of investments, and the related statements of operations and of changes in net assets and the financial highlights present fairly, in all material respects, the financial position of TA IDEX Asset Allocation–Conservative Portfolio (the "Fund") (one of the portfolios constituting the Transamerica IDEX Mutual Funds) at October 31, 2004, the results of its operations for the year then ended, the changes in its net assets for each of the two years in the period then ended and the financial highlights for each of the periods indicated, in conformity with accounting principles generally accepted in the United States of America. These financial statements and financial highlights (hereafter referred to as "financial statements") are the responsibility of the Fund's management; our responsibility is to ex press an opinion on these financial statements based on our audits. We conducted our audits of these financial statements in accordance with the standards of the Public Company Accounting Oversight Board (United States). Those standards require that we plan and perform the audit to obtain reasonable assurance about whether the financial statements are free of material misstatement. An audit includes examining, on a test basis, evidence supporting the amounts and disclosures in the financial statements, assessing the accounting principles used and significant estimates made by management, and evaluating the overall financial statement presentation. We believe that our audits, which included confirmation of securities at October 31, 2004 by correspondence with the custodian, provide a reasonable basis for our opinion.

PricewaterhouseCoopers LLP
Tampa, Florida
December 28, 2004
Transamerica IDEX Mutual Funds
Annual Report 2004
12
TA IDEX Asset Allocation–Conservative Portfolio
SUPPLEMENTAL INFORMATION (unaudited)
TAX INFORMATION
For tax purposes, the Fund has made a Long-Term Capital Gain Designation of $5 for the year ended October 31, 2004.
For dividends paid during the year ended October 31, 2004, the Fund designates qualified dividend income to the maximum extent allowable.
The information and distributions reported herein may differ from the information and distributions taxable to the shareholders for the calendar year ending December 31, 2004. Complete information will be computed and reported in conjunction with your 2004 Form 1099-DIV.
RESULTS OF SHAREHOLDER PROXY
At a special meeting of Class M shareholders of each series of Transamerica IDEX (except TA IDEX Federated Tax Exempt and TA IDEX Protected Principal Stock) held on September 2, 2004, the results of the Proposal were as follows:
Proposal 1: Approval of a conversion of Class M shares into Class C shares of the Funds, which will result in bearing the distribution and service fees payable under the 12b-1 Plan of Distribution for the Class C shares of the Funds.
| For | | Against | | Abstentions/Broker Non-Votes | |
| | 81.40 | % | | | 4.51 | % | | | 14.09 | % | |
Transamerica IDEX Mutual Funds
Annual Report 2004
13
TA IDEX Asset Allocation–Growth Portfolio
MARKET ENVIRONMENT
The last 12 months were a volatile period in the global securities market, but overall provided solid gains to well-diversified investors. Domestic stocks led the way early in the year, continuing to rally off their 2002 lows, but since then the U.S. stock market has been choppy, with little net change.
The markets indecisiveness seemed driven by a profusion of uncertainty. Economic indicators turned mixed over the summer after seeming to point clearly upward in the spring. The presidential election loomed, with the polls offering little clarity as to which candidate might win. Oil prices hovered near historic highs, and the situation in Iraq remained extremely tense. And amid all this, the Federal Reserve Board ("Fed") raised interest rates three times and signaled more hikes would be on the way.
At least the strong gains early in the year persisted through this uncertainty, with the Standard and Poor's 500 Composite Stock Index up 9.41% for the last 12 month period, all of which came in the first five months of the year. The big winners were small-cap stocks, though, with the Standard and Poor's SmallCap 600 up nearly 25%.
Interest rates were surprisingly supportive of equity prices. The dominant perception through March was that slow payroll growth would keep a lid on Fed interest rate hikes, and the Madrid terrorist attacks sparked renewed interest in safe Treasuries among both foreign and U.S. investors. However, a much stronger-than-expected March jobs report was the turning point for the bond market, leading to the first sharp upward spike in interest rates. However, since then bonds pulled off an impressive reversal. Even as the Fed raised short rates three times, long-term yields fell and the yield curve flattened through the summer and fall. Over the 12-month period, the Lehman Brothers Aggregate Bond Index managed a 5.53% gain, and the equity sensitive Lehman Brothers High Yield Index gained 12.32%.
Many of the same market trends were evident in foreign markets. Gains were well distributed across foreign markets, consistent with the view of an improving world economy. In addition, unhedged foreign funds and indexes were buoyed by generally strong foreign currencies relative to the dollar, with the Morgan Stanley Capital International (EAFE) Index ("MSCI EAFE") up 19.27% converted back into dollar terms.
PERFORMANCE
For the year ended October 31, 2004, TA IDEX Asset Allocation – Growth Portfolio, Class A returned 9.57%. By comparison its benchmark, the Dow Jones Wilshire 5000 Total Market Index, returned 8.26%.
STRATEGY REVIEW
How did you manage the portfolio in this market environment?
We maintained our strategy of persistent diversification across the equity market, which was the source of the portfolio's strong relative performance. The portfolio performed well relative to both its benchmark and peers. The portfolio was up 9.47% over the last 12 months, versus 8.26% for the Dow Jones Wilshire 5000 Total Market (DJ Wilshire 5000). Moreover it landed in the top quartile of Morningstar's Large Blend category.
The portfolio benefited strongly from its exposure to small and mid-cap stocks over this period, as those were the strongest performing parts of the domestic equity market. Over the course of the year, cash flows into the portfolio were generally used to increase its exposure to large-cap stocks.
Which individual holdings had the greatest positive impact on performance?
The portfolio's niche equity holdings paid off well. TA IDEX Transamerica Small/Mid Cap Value added 20.61%; and TA IDEX Clarion Real Estate Securities gained 29.30%. These two winners accounted for more than 16% of the portfolio's total net assets at the end of October.
Which individual holdings had the greatest negative impact on performance?
The portfolio's international equity exposure should have helped more than it did. TA IDEX American Century International, the portfolio's largest international equity holding and the only pure international investment available in the TA IDEX lineup, gained 9.95% over the last 12 months, though its MSCI EAFE benchmark added 19.27%. As a result of the its persistent underperformance, that investment was gradually reduced over the course of the year to 7.2% of assets at the end of October, which helped reduce the negative effect of TA IDEX American Century International's underperformance to a limited extent.
TA IDEX Salomon All Cap, the largest equity holding in the lineup at 16.7% of assets, underperformed the S&P 500 by almost 3.5%. TA IDEX T. Rowe Price Small Cap underperformed by over 6.0% for the period. It had a bit more than 5% of total net assets.
Which sectors/industries had the greatest impact on performance?
The portfolio had 1.4% of total assets in TA IDEX Clarion Real Estate Securities, which primarily owns real estate investment trusts ("REITs"). The real estate sector was one of the best performing sectors across the U.S. stock market, and as a result TA IDEX Clarion Real Estate Securities was up 29.30% for the period.
The greatest negative impact on performance was from the technology sector. TA IDEX Great Companies-TechnologySM, 4% weight in the portfolio, gained 5.26% for the year, while the S&P 500 added 9.41%.
Which countries had the greatest impact on performance?
Because of the poor relative performance of TA IDEX American Century International, over the course of the year the portfolio's foreign exposure was reduced to significantly below its target level. The largest international exposure of the fund was to the eurozone.
Investment Committee
AEGON/Transamerica Fund Advisers, Inc.
Transamerica IDEX Mutual Funds
Annual Report 2004
TA IDEX Asset Allocation–Growth Portfolio
Comparison of change in value of $10,000 investment in Class A shares and its comparative index.
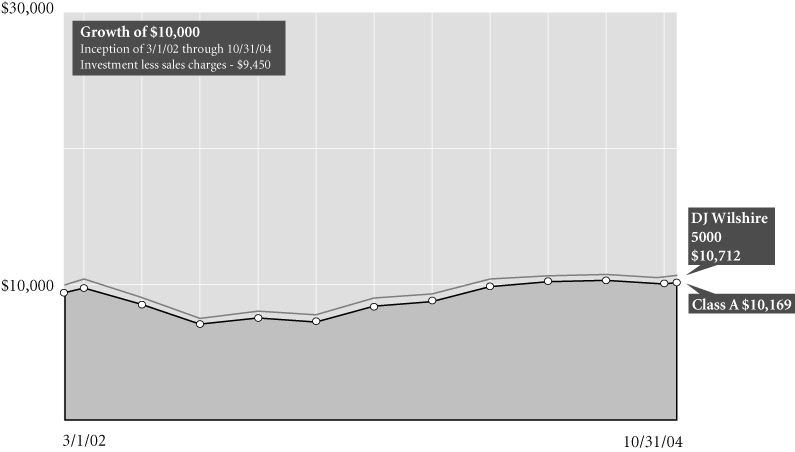
Average Annual Total Return for Periods Ended 10/31/04
| | | 1 year | | From
Inception | | Inception
Date | |
| Class A (NAV) | | | 9.47 | % | | | 2.74 | % | | 3/1/02 | |
| Class A (POP) | | | 3.45 | % | | | 0.59 | % | | 3/1/02 | |
| DJ Wilshire 50001 | | | 8.26 | % | | | 2.61 | % | | 3/1/02 | |
| Class B (NAV) | | | 8.96 | % | | | 2.14 | % | | 3/1/02 | |
| Class B (POP) | | | 3.96 | % | | | 1.04 | % | | 3/1/02 | |
| Class C (NAV) | | | 8.86 | % | | | 16.26 | % | | 11/11/02 | |
| Class C (POP) | | | 7.86 | % | | | 16.26 | % | | 11/11/02 | |
NOTES
1 The Dow Jones Wilshire 5000 Total Market (DJ Wilshire 5000) Index is an unmanaged index used as a general measure of market performance. Calculations assume dividends and capital gains are reinvested and do not include any managerial expenses. From inception calculation is based on life of Class A shares. Source: Standard & Poor's Micropal®© Micropal, Inc. 2004 – 1-800-596-5323 – http://www.micropal.com.
The performance data presented represents past performance, future results may vary. Performance data does not reflect the deduction of taxes that would be paid on fund distributions or the redemption of fund shares. Investment return and principal value will fluctuate so that an investor's shares, when redeemed, may be worth more or less than their original cost. Current performance may be lower or higher than performance quoted.
Public Offering Price (POP) returns include the reinvestment of dividends and capital gains and reflect the maximum sales charge of 5.5% for A shares or the maximum applicable contingent deferred sales charge (5% in the 1st year, decreasing to 0% after 6 years) for Class B shares and 1% (during the first 12 months) for Class C shares. Shares purchased prior to March 1, 2004 are subject to a maximum applicable contingent deferred sales charge (5% in the 1st year, decreasing to 0% after 7 years) for Class B shares and (2% in the 1st year, decreasing to 0% after 2 years) for Class C shares. Net Asset Value (NAV) returns include the reinvestment of dividends and capital gains but do not reflect any sales charges.
This material must be preceded or accompanied by a current prospectus, which includes specific contents regarding the investment objectives and policies of this fund.
Transamerica IDEX Mutual Funds
Annual Report 2004
2
TA IDEX Asset Allocation–Growth Portfolio
UNDERSTANDING YOUR FUND'S EXPENSES (unaudited)
SHAREHOLDER EXPENSES
The following Example is intended to help you understand your ongoing costs (in dollars and cents) of investing in a Fund and to compare these costs with the ongoing costs of investing in other funds.
The Example is based on an investment of $1,000 invested at the beginning of the period and held for the entire period from May 1, 2004 to October 31, 2004.
ACTUAL EXPENSES
The first line in the table below provides information about actual account values and actual expenses. You may use the information in this line, together with the amount you invested, to estimate the expenses that you paid over the period. Simply divide your account value by $1,000 (for example, an $8,600 account value divided by $1,000 = 8.6), then multiply the result by the number in the first line of your Fund un der the heading entitled "Expenses Paid During Period" to estimate the expenses you paid on your account during this period.
HYPOTHETICAL EXAMPLE FOR COMPARISON PURPOSES
The second line in the table below provides information about hypothetical account values and hypothetical expenses based on each Fund's actual expense ratio and an assumed rate of return of 5% per year before expenses, which is not the Fund's actual return. The hypothetical account values and expenses may not be used to estimate the actual ending account balance or expenses you paid for the period. You may use this information to compare the ongoing costs of investing in your Fund and other funds. To do so, compare this 5% hypothetical example with the 5% hypothetical examples that appear in the shareholder reports of the other funds.
Please note that the expenses shown in the table are meant to highlight your ongoing costs only and do not reflect any transactional costs, such as sales charges, redemption fees, brokerage commissions paid on purchases and sales of fund shares. Therefore, the second line under each Fund in the table is useful in comparing ongoing costs only, and will not help you determine the relative total costs of owning different funds. In addition, note that the expenses shown in the table are meant to highlight your ongoing costs and do not reflect any transaction costs.
| | | Beginning
Account
Value | | Ending
Account
Value | | Annualized
Expense
Ratio | | Expenses Paid
During Period(a) | |
| Class A | | | |
| Actual | | $ | 1,000.00 | | | $ | 1,016.10 | | | | 0.56 | % | | $ | 2.84 | | |
| Hypothetical (b) | | | 1,000.00 | | | | 1,022.32 | | | | 0.56 | | | | 2.85 | | |
| Class B | | | |
| Actual | | | 1,000.00 | | | | 1,014.40 | | | | 1.17 | | | | 5.92 | | |
| Hypothetical (b) | | | 1,000.00 | | | | 1,019.25 | | | | 1.17 | | | | 5.94 | | |
| Class C | | | |
| Actual | | | 1,000.00 | | | | 1,013.40 | | | | 1.06 | | | | 5.36 | | |
| Hypothetical (b) | | | 1,000.00 | | | | 1,019.81 | | | | 1.06 | | | | 5.38 | | |
(a) Expenses are calculated using each Fund's annualized expense ratio (as disclosed in the table), multiplied by the average account value for the period, multiplied by number of days in the period (184 days), and divided by the number of days in the year (366 days).
(b) 5% return per year before expenses
GRAPHIC PRESENTATION OF SCHEDULE OF INVESTMENTS
By Asset Type
At October 31, 2004
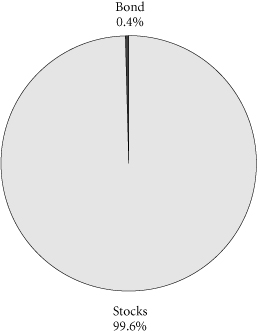
This chart shows the percentage breakdown by asset type of the Fund's total investment securities. Asset type is calculated based on the aggregate portfolio holdings in the underlying funds in which the Fund invests. The security lending collateral in the underlying funds is excluded from this calculation.
Transamerica IDEX Mutual Funds
Annual Report 2004
3
TA IDEX Asset Allocation–Growth Portfolio
SCHEDULE OF INVESTMENTS
At October 31, 2004
(all amounts except share amounts in thousands)
| | | Shares | | Value | |
| Investment Companies (99.7%) (b) | |
| Agressive Equity (32.7%) | |
| TA IDEX T. Rowe Price Health Sciences | | | 2,997,678 | | | $ | 32,495 | | |
| TA IDEX T. Rowe Price Small Cap (a) | | | 3,552,855 | | | | 38,513 | | |
TA IDEX Transamerica Growth
Opportunities (a) | | | 7,336,464 | | | | 48,494 | | |
TA IDEX Transamerica
Small/Mid Cap Value | | | 7,395,731 | | | | 105,907 | | |
| Growth Equity (48.4%) | |
| TA IDEX Great Companies–Technology (a) | | | 7,797,471 | | | | 29,630 | | |
| TA IDEX Janus Growth | | | 1,782,751 | | | | 38,436 | | |
| TA IDEX Salomon All Cap (a) | | | 7,742,907 | | | | 114,595 | | |
| TA IDEX Salomon Investors Value | | | 8,167,581 | | | | 108,629 | | |
| TA IDEX Transamerica Equity | | | 5,685,211 | | | | 42,355 | | |
| | | Shares | | Value | |
| Investment Companies (13.3%) | |
| TA IDEX American Century International | | | 5,648,732 | | | $ | 49,765 | | |
| TA IDEX Jennison Growth (a) | | | 4,361,082 | | | | 41,518 | | |
| Speciality–Real Estate (1.4%) | |
| TA IDEX Clarion Real Estate Securities | | | 683,824 | | | | 9,560 | | |
| World Equity (3.9%) | |
TA IDEX Templeton Great
Companies Global (a) | | | 1,194,522 | | | | 26,996 | | |
| Total Investment Companies (cost: $637,735) | | | | | | | 686,893 | | |
| Total Investment Securities (cost: $637,735) | | | | | | $ | 686,893 | | |
| SUMMARY: | |
| Investments, at value | | | 99.7 | % | | | 686,893 | | |
| Other assets in excess of liabilities | | | 0.3 | % | | | 2,317 | | |
| Net assets | | | 100.0 | % | | $ | 689,210 | | |
NOTES TO SCHEDULE OF INVESTMENTS:
(a) No dividends were paid during the preceding twelve months.
(b) The Fund invests its assets in Class A shares of the underlying IDEX Mutual Funds, which are affiliates of the Fund.
The notes to the financial statements are an integral part of this report.
Transamerica IDEX Mutual Funds
Annual Report 2004
4
TA IDEX Asset Allocation–Growth Portfolio
STATEMENT OF ASSETS AND LIABILITIES
At October 31, 2004
(all amounts except per share amounts in thousands)
| Assets: | | | |
Investment in affiliated mutual funds,
at value (cost: $637,735) | | $ | 686,893 | | |
| Cash | | | 599 | | |
| Receivables: | |
| Shares of beneficial interest sold | | | 3,760 | | |
| Interest | | | 1 | | |
| Other | | | 7 | | |
| | | | 691,260 | | |
| Liabilities: | | | |
| Investment securities purchased | | | 599 | | |
| Accounts payable and accrued liabilities: | |
| Shares of beneficial interest redeemed | | | 493 | | |
| Management and advisory fees | | | 360 | | |
| Distribution fees | | | 280 | | |
| Transfer agent fees | | | 198 | | |
| Other | | | 120 | | |
| | | | 2,050 | | |
| Net Assets | | $ | 689,210 | | |
| Net Assets Consist of: | | | |
Shares of beneficial interest, unlimited shares
authorized, no par value | | $ | 633,179 | | |
| Undistributed net investment income (loss) | | | 3,077 | | |
Accumulated net realized gain (loss) from investment
in affiliated mutual funds | | | 3,796 | | |
Net unrealized appreciation (depreciation) on
investment in affiliated mutual funds | | | 49,158 | | |
| Net Assets | | $ | 689,210 | | |
| Net Assets by Class: | | | |
| Class A | | $ | 171,708 | | |
| Class B | | | 160,959 | | |
| Class C | | | 356,543 | | |
| Shares Outstanding: | | | |
| Class A | | | 15,971 | | |
| Class B | | | 15,232 | | |
| Class C | | | 33,723 | | |
| Net Asset Value Per Share: | | | |
| Class A | | $ | 10.75 | | |
| Class B | | | 10.57 | | |
| Class C | | | 10.57 | | |
| Maximum Offering Price Per Share (a): | | | |
| Class A | | $ | 11.38 | | |
(a) Includes the maximum selling commission (represented as a percentage of offering price) which is reduced on certain levels of sales as set forth in the Prospectus. Net asset value per share for Classes B and C shares represents offering price. The redemption price for Classes B and C shares equals net asset value less any applicable contingent deferred sales charge.
STATEMENT OF OPERATIONS
For the year ended October 31, 2004
(all amounts in thousands)
| Investment Income: | | | |
| Interest | | $ | 5 | | |
| Dividends from affiliated mutual funds | | | 1,158 | | |
| | | | 1,163 | | |
| Expenses: | | | |
| Management and advisory fees | | | 522 | | |
| Transfer agent fees | |
| Class A | | | 240 | | |
| Class B | | | 234 | | |
| Class C | | | 287 | | |
| Class C2 | | | 5 | | |
| Class M | | | 6 | | |
| Printing and shareholder reports | | | 38 | | |
| Custody fees | | | 39 | | |
| Administration fees | | | 78 | | |
| Legal fees | | | 15 | | |
| Audit and accounting fees | | | 26 | | |
| Trustees fees | | | 27 | | |
| Registration fees | |
| Class A | | | 46 | | |
| Class B | | | 32 | | |
| Class C | | | 69 | | |
| Class C2 | | | 2 | | |
| Class M | | | 3 | | |
| Other | | | 16 | | |
| Distribution and service fees: | |
| Class B | | | 857 | | |
| Class C | | | 1,640 | | |
| Class C2 | | | 55 | | |
| Class M | | | 44 | | |
| Total expenses before recapture of waived expenses | | | 4,281 | | |
| Recaptured Expenses | | | 279 | | |
| Net expenses | | | 4,560 | | |
| Net Investment Income (Loss) | | | (3,397 | ) | |
| Net Realized and Unrealized Gain (Loss) | | | |
Realized gain (loss) from investment in
affiliated mutual funds | | | 39 | | |
Realized gain distributions from investment in
affiliated mutual funds | | | 11,178 | | |
Increase (decrease) in unrealized appreciation
(depreciation) on investment in
affiliated mutual funds | | | 23,549 | | |
Net Gain (Loss) on Investments in
Affiliated Mutual Funds | | | 34,766 | | |
Net Increase (Decrease) in Net Assets Resulting
from Operations | | $ | 31,369 | | |
The notes to the financial statements are an integral part of this report.
Transamerica IDEX Mutual Funds
Annual Report 2004
5
TA IDEX Asset Allocation–Growth Portfolio
STATEMENTS OF CHANGES IN NET ASSETS
For the years ended
(all amounts in thousands)
| | | October 31,
2004 | | October 31,
2003 | |
| Increase (Decrease) in Net Assets From: | | | |
| Operations: | | | |
| Net investment income (loss) | | $ | (3,397 | ) | | $ | (848 | ) | |
Net realized gain (loss) from
investment in affiliated mutual funds | | | 11,217 | | | | (298 | ) | |
Net unrealized appreciation
(depreciation) on investment
in affiliated mutual funds | | | 23,549 | | | | 28,567 | | |
| | | | 31,369 | | | | 27,421 | | |
| Capital Share Transactions: | | | |
| Proceeds from shares sold: | |
| Class A | | | 132,291 | | | | 45,941 | | |
| Class B | | | 84,889 | | | | 65,588 | | |
| Class C | | | 228,642 | | | | 110,485 | | |
| Class C2 | | | 6,081 | | | | 6,479 | | |
| Class M | | | 2,709 | | | | 3,340 | | |
| | | | 454,612 | | | | 231,833 | | |
| Cost of shares redeemed: | |
| Class A | | | (23,172 | ) | | | (4,869 | ) | |
| Class B | | | (14,563 | ) | | | (3,326 | ) | |
| Class C | | | (28,450 | ) | | | (2,504 | ) | |
| Class C2 | | | (3,211 | ) | | | (4,559 | ) | |
| Class M | | | (1,183 | ) | | | (1,359 | ) | |
| | | | (70,579 | ) | | | (16,617 | ) | |
| Class level exchanges: | |
| Class C | | | 25,301 | | | | – | | |
| Class C2 | | | (15,616 | ) | | | – | | |
| Class M | | | (9,685 | ) | | | – | | |
| | | | – | | | | – | | |
| Automatic conversions: | |
| Class A | | | 69 | | | | – | | |
| Class B | | | (69 | ) | | | – | | |
| | | | – | | | | – | | |
| | | | 384,033 | | | | 215,216 | | |
| Net increase (decrease) in net assets | | | 415,402 | | | | 242,637 | | |
| Net Assets: | | | |
| Beginning of year | | | 273,808 | | | | 31,171 | | |
| End of year | | $ | 689,210 | | | $ | 273,808 | | |
Undistributed Net Investment
Income (Loss) | | $ | 3,077 | | | $ | – | | |
| | | October 31,
2004 | | October 31,
2003 | |
| Share Activity: | |
| Shares issued: | |
| Class A | | | 12,550 | | | | 5,117 | | |
| Class B | | | 8,165 | | | | 7,537 | | |
| Class C | | | 22,002 | | | | 12,323 | | |
| Class C2 | | | 585 | | | | 752 | | |
| Class M | | | 261 | | | | 389 | | |
| | | | 43,563 | | | | 26,118 | | |
| Shares redeemed: | |
| Class A | | | (2,207 | ) | | | (548 | ) | |
| Class B | | | (1,402 | ) | | | (384 | ) | |
| Class C | | | (2,738 | ) | | | (281 | ) | |
| Class C2 | | | (305 | ) | | | (550 | ) | |
| Class M | | | (114 | ) | | | (164 | ) | |
| | | | (6,766 | ) | | | (1,927 | ) | |
| Class level exchanges: | |
| Class C | | | 2,417 | | | | – | | |
| Class C2 | | | (1,487 | ) | | | – | | |
| Class M | | | (928 | ) | | | – | | |
| | | | 2 | | | | – | | |
| Automatic conversions: | |
| Class A | | | 6 | | | | – | | |
| Class B | | | (6 | ) | | | – | | |
| | | | – | | | | – | | |
Net increase (decrease) in
shares outstanding: | |
| Class A | | | 10,349 | | | | 4,569 | | |
| Class B | | | 6,757 | | | | 7,153 | | |
| Class C | | | 21,681 | | | | 12,042 | | |
| Class C2 | | | (1,207 | ) | | | 202 | | |
| Class M | | | (781 | ) | | | 225 | | |
| | | | 36,799 | | | | 24,191 | | |
The notes to the financial statements are an integral part of this report.
Transamerica IDEX Mutual Funds
Annual Report 2004
6
TA IDEX Asset Allocation–Growth Portfolio
FINANCIAL HIGHLIGHTS
| | | | | For a share of beneficial interest outstanding throughout each period | |
| | | | | Net Asset | | Investment Operations | | Distributions | | Net Asset | |
| | | For the
Period
Ended (d)(g) | | Value,
Beginning
of Period | | Net
Investment
Income (Loss) | | Net Realized
and Unrealized
Gain (Loss) | | Total
Operations | | From Net
Investment
Income | | From Net
Realized
Gains | | Total
Distributions | | Value,
End
of Period | |
| Class A | | 10/31/2004 | | $ | 9.82 | | | $ | (0.02 | ) | | $ | 0.95 | | | $ | 0.93 | | | $ | – | | | $ | – | | | $ | – | | | $ | 10.75 | | |
| | | 10/31/2003 | | | 7.95 | | | | (0.03 | ) | | | 1.90 | | | | 1.87 | | | | – | | | | – | | | | – | | | | 9.82 | | |
| | | 10/31/2002 | | | 10.00 | | | | (0.02 | ) | | | (2.03 | ) | | | (2.05 | ) | | | – | | | | – | | | | – | | | | 7.95 | | |
| Class B | | 10/31/2004 | | | 9.71 | | | | (0.09 | ) | | | 0.95 | | | | 0.86 | | | | – | | | | – | | | | – | | | | 10.57 | | |
| | | 10/31/2003 | | | 7.91 | | | | (0.08 | ) | | | 1.88 | | | | 1.80 | | | | – | | | | – | | | | – | | | | 9.71 | | |
| | | 10/31/2002 | | | 10.00 | | | | (0.06 | ) | | | (2.03 | ) | | | (2.09 | ) | | | – | | | | – | | | | – | | | | 7.91 | | |
| Class C | | 10/31/2004 | | | 9.71 | | | | (0.08 | ) | | | 0.94 | | | | 0.86 | | | | – | | | | – | | | | – | | | | 10.57 | | |
| | | 10/31/2003 | | | 7.86 | | | | (0.08 | ) | | | 1.93 | | | | 1.85 | | | | – | | | | – | | | | – | | | | 9.71 | | |
| | | | | | | Ratios/Supplemental Data | |
| | | For the
Period | | Total | | Net Assets,
End of
Period | | Ratio of Expenses
to Average
Net Assets (a) | | Net Investment
Income (Loss)
to Average | | Portfolio
Turnover | |
| | | Ended (g) | | Return (c) | | (000's) | | Net (e) | | Total (f) | | Net Assets (a) | | Rate (b) | |
| Class A | | 10/31/2004 | | | 9.47 | % | | $ | 171,708 | | | | 0.43 | % | | | 0.38 | % | | | (0.22 | )% | | | 5 | % | |
| | | 10/31/2003 | | | 23.52 | | | | 55,209 | | | | 0.45 | | | | 0.60 | | | | (0.30 | ) | | | 25 | | |
| | | 10/31/2002 | | | (20.50 | ) | | | 8,368 | | | | 0.45 | | | | 1.65 | | | | (0.44 | ) | | | 31 | | |
| Class B | | 10/31/2004 | | | 8.96 | | | | 160,959 | | | | 1.05 | | | | 1.00 | | | | (0.82 | ) | | | 5 | | |
| | | 10/31/2003 | | | 22.76 | | | | 82,318 | | | | 1.10 | | | | 1.25 | | | | (0.95 | ) | | | 25 | | |
| | | 10/31/2002 | | | (20.90 | ) | | | 10,452 | | | | 1.10 | | | | 2.30 | | | | (1.09 | ) | | | 31 | | |
| Class C | | 10/31/2004 | | | 8.86 | | | | 356,543 | | | | 0.99 | | | | 0.94 | | | | (0.78 | ) | | | 5 | | |
| | | 10/31/2003 | | | 23.54 | | | | 116,956 | | | | 1.10 | | | | 1.25 | | | | (0.95 | ) | | | 25 | | |
NOTES TO FINANCIAL HIGHLIGHTS
(a) Annualized.
(b) Not annualized for periods of less than one year.
(c) Total Return has been calculated for the applicable period without deduction of a sales load, if any, on an initial purchase. Periods of less than one year are not annualized.
(d) Per share information is calculated based on the average number of shares outstanding.
(e) Ratio of Net Expenses to Average Net Assets is net of fee waivers and reimbursements by the investment adviser, if any and includes the recapture of previously waived expenses (see note 2).
(f) Ratio of Total Expenses to Average Net Assets includes all expenses before fee waivers, reimbursements by the investment adviser and recapture of previously waived expenses.
(g) TA IDEX Asset Allocation–Growth Portfolio ("the Fund") commenced operations on March 1, 2002. The inception date for the Fund's offering of share Class L was November 11, 2002. Class L was renamed Class C on March 1, 2004. (see note 1)
The notes to the financial statements are an integral part of this report.
Transamerica IDEX Mutual Funds
Annual Report 2004
7
TA IDEX Asset Allocation–Growth Portfolio
NOTES TO FINANCIAL STATEMENTS
At October 31, 2004
(all amounts in thousands)
NOTE 1. ORGANIZATION AND SIGNIFICANT ACCOUNTING POLICIES
Transamerica IDEX Mutual Funds, formerly IDEX Mutual Funds, is a Massachusetts business trust registered under the Investment Company Act of 1940, as amended (the "1940 Act"), as an open-end management investment company. TA IDEX Asset Allocation–Growth Portfolio ("the Fund"), part of Transamerica IDEX Mutual Funds, began operations on March 1, 2002.
On March 1, 2004, the Fund changed its name from IDEX Asset Allocation–Growth Portfolio to TA IDEX Asset Allocation–Growth Portfolio.
In the normal course of business, the Fund enters into contracts that contain a variety of representations and warranties, which provide general indemnifications. The Fund's maximum exposure under these arrangements is unknown, as this would involve future claims that may be made against the Fund and/or its affiliates that have not yet occurred. However, based on experience, the Fund expects the risk of loss to be remote.
See the Prospectus and Statement of Additional Information for a description of the Fund's investment objective.
In preparing the Fund's financial statements in accordance with accounting principles generally accepted in the United States of America ("GAAP"), estimates or assumptions (which could differ from actual results) may be used that affect reported amounts and disclosures. The following policies were consistently followed by the Fund, in accordance with GAAP.
Multiple class operations and expenses: The Fund currently offers three classes of shares, each with a public offering price that reflects different sales charges, if any, and expense levels. All shares designated as Class C shares prior to March 1, 2004, were renamed as Class C2 shares on that date. All shares designated as Class L shares prior to March 1, 2004, were renamed as Class C shares with sales charges than the previous Class L shares. On June 15, 2004, Class C2 shares merged into Class C. On September 24, 2004, Class M shares merged into Class C. Class B shares will convert to class A shares eight years after purchase. Income, non-class specific expenses and realized and unrealized gains and losses, are allocated daily to each class, based upon the value of shares outstanding method as permitted under Rule 18f-3 of the 1940 Act. Each class bears its own specific expenses as well as a portion of general, common expenses.
Pricing of shares: The Fund prices its shares on the basis of the net asset value of each class of shares of the Fund, which is determined as of the close of the New York Stock Exchange ("NYSE") (generally 4:00 p.m. Eastern Time) on each day on which the NYSE is open for
trading (other than a day on which there are insufficient changes in the value of the Fund's portfolio securities to materially affect the Fund's net asset value or a day on which no shares are tendered for redemption and no order to purchase any shares is received).
Security valuations: The Fund's investments are valued at the net asset values of the underlying portfolios of Transamerica IDEX Mutual Funds. The net asset values of the underlying portfolios are determined at the close of the NYSE (generally 4:00 p.m. eastern time) on the valuation date.
Cash: The Fund may leave cash overnight in its cash account with the custodian, Investors Bank & Trust Company ("IBT"). IBT has been contracted on behalf of the Fund to invest the excess cash into a savings account, which at October 31, 2004, was paying an interest rate of 1.30%.
Throughout the year, the Fund may have a cash overdraft balance. A fee is incurred on this overdraft, calculated by multiplying the overdraft by a rate based on the federal funds rate. This fee is included in Custody fees in the Statement of Operations.
Security transactions and investment income: Security transactions are recorded on the trade date. Security gains and losses are calculated on the specific identification basis. Interest income, including accretion of discounts and amortization of premiums, is recorded on the accrual basis commencing on the settlement date. Dividend income is recorded on the ex-dividend date, dividends and net realized gain (loss) from investment securities for the Fund are from investments in shares of affiliated companies.
Account maintenance fees: If the shareholder account balance falls below $1 by either shareholder action or as a result of market action, a $25 (not in thousands) fee is assessed every year until the balance reaches $1. The fee is assessed by redeeming shares in the shareholder's account.
No fee will be charged under the following conditions:
• accounts opened within the preceding 24 months
• accounts with an active monthly Automatic Investment Plan ($50 (not in thousands) minimum per fund)
• accounts owned by an individual which, when combined by social security number, have a balance of $5 or more
• accounts owned by individuals in the same household (by address) that have a combined balance of $5 or more
• UTMA/UGMA accounts
• Fiduciary accounts
• B-share accounts whose shares have started to convert to A-shares accounts (as long as combined value of both accounts is at least $1)
Transamerica IDEX Mutual Funds
Annual Report 2004
8
TA IDEX Asset Allocation–Growth Portfolio
NOTES TO FINANCIAL STATEMENTS (continued)
At October 31, 2004
(all amounts in thousands)
NOTE 1.–(continued)
For the year ended October 31, 2004, there were no fees. These fees are included in Paid in Capital in the Statement of Assets and Liabilities.
Redemption fees: A short-term trading redemption fee may be assessed on any fund shares in a fund account that are sold during the first five (5) New York Stock Exchange trading days following their purchase date. This redemption fee will equal 2% of the amount redeemed and shares held the longest will be treated as being redeemed first and shares held the shortest as being redeemed last. For the year ended October 31, 2004, the Fund received no redemption fees.
Dividend distributions: Distributions to shareholders are recorded on the ex-dividend date and are determined in accordance with Federal income tax regulations which may differ from GAAP.
NOTE 2. RELATED PARTY TRANSACTIONS
AEGON/Transamerica Fund Advisers, Inc. ("ATFA") is the Fund's investment adviser. AEGON/Transamerica Fund Services, Inc. ("ATFS") is the Fund's administrator. AFSG Securities Corp. ("AFSG") is the Fund's distributor/principal underwriter. AEGON/Transamerica Investor Services, Inc. ("ATIS") is the Fund's transfer agent. ATIS and AFSG are 100% owned by AUSA Holding Company ("AUSA"). ATFA is a directly owned subsidiary of Western Reserve Life Assurance Co. of Ohio (78%) ("WRL") and AUSA (22%). ATFS is a wholly owned subsidiary of WRL. AUSA and WRL are wholly owned indirect subsidiaries of AEGON NV, a Netherlands corporation.
ATFA has entered into an agreement with Morningstar Associates, LLC to provide investment services to the Fund. ATFA compensates Morningstar Associates, LLC as described in the Prospectus.
Transamerica Investment Management, LLC and Great Companies, LLC are affiliates of the Fund and are sub-advisers to other funds within Transamerica IDEX Mutual Funds.
Investment advisory fees: The Fund pays management fees to ATFA based on average daily net assets ("ANA") at the following rate:
0.10% of ANA
ATFA has contractually agreed to waive its advisory fee and will reimburse the Fund to the extent that operating expenses, excluding 12b-1 fees, exceed the following stated annual limit:
0.45% Expense Limit
If total fund expenses fall below the annual expense limitation agreement agreed to by the adviser within the succeeding three years, the Fund may be required to pay that adviser a portion or all of the waived advisory fees.
The Fund recaptured $279 of advisory fees previously waived during the year ended October 31, 2004. There are no additional expenses available for recapture on October 31, 2004.
Distribution and service fees: The Fund has a 12b-1 distribution plan under the 1940 Act pursuant to which an annual fee, based on average daily net assets, is paid to the distributor for various disbursements such as broker-dealer account servicing fees and other promotional expenses of the Fund. The Fund is authorized under the 12b-1 plan to pay fees on each class up to the following limits:
| Class A | | | N/A | | |
| Class B | | | 0.65 | % | |
| Class C | | | 0.65 | % | |
| Class C2 | | | 0.65 | % | |
| Class M | | | 0.55 | % | |
Class C2 and Class M merged into Class C on June 15, 2004 and September 24, 2004, respectively.
In addition, the underlying funds' Class A shares in which the Fund invests impose a 0.35% 12b-1 fee. To avoid duplication of the 12b-1 fees, each class of fund shares of the Fund has reduced the 12b-1 fees by the amount of the underlying funds' Class A 12b-1 fees.
In the case the Fund or a class of shares of the Fund is closed to new investors or investments, the Fund is authorized to pay 12b-1 fees for past sales and distribution efforts and present and past investor services.
Underwriter commissions relate to front-end sales charges imposed for Class A and M shares and contingent deferred sales charges from Classes B, C, M and certain A share redemptions. For the year ended October 31, 2004, the underwriter commissions were as follows:
| Received by Underwriter | | $ | 23,921 | | |
| Retained by Underwriter | | | 868 | | |
| Contingent Deferred Sales Charge | | | 486 | | |
Administrative services: The Fund has entered into an agreement with ATFS for financial and legal fund administration services, which includes such items as compliance, expenses, financial statements and other reporting, distributions, tax returns, prospectus preparation, board of trustees meeting support and other legal matters. The Fund pays ATFS an annual fee of 0.015% of average net assets. The Legal fees on the Statement of Operations are for fees paid to external legal counsel.
The Fund paid ATFS $78 for the year ended October 31, 2004.
Transfer agent fees: The Fund pays ATIS an annual per-account charge of $20 (not in thousands) for each open account and $1.63 (not in thousands) for each closed account. There is no new account charge. The transfer agent fees on the Statement of Operations are made up of fees paid to ATIS and costs associated with shareholder statements. The Fund paid ATIS $772 for the year ended October 31, 2004.
Deferred compensation plan: Each eligible Fund Trustee may elect participation in the Deferred Compensation Plan ("the Plan"). Under the Plan, such Trustees may defer payment of a percentage of their total
Transamerica IDEX Mutual Funds
Annual Report 2004
9
TA IDEX Asset Allocation–Growth Portfolio
NOTES TO FINANCIAL STATEMENTS (continued)
At October 31, 2004
(all amounts in thousands)
NOTE 2.–(continued)
fees earned as a Fund Trustee. These deferred amounts may be invested in any Transamerica IDEX Mutual Fund. At October 31, 2004, the value of invested plan amounts was $6. Invested plan amounts and the total liability for deferred compensation to the Trustees under the Plan at October 31, 2004, are included in the accompanying Statement of Assets and Liabilities.
NOTE 3. INVESTMENT TRANSACTIONS
The cost of securities purchased and proceeds from securities sold (excluding short-term securities) for the year ended October 31, 2004, were as follows:
| Purchases of securities: | | | |
| Long-Term excluding U.S. Government | | $ | 420,163 | | |
| U.S. Government | | | – | | |
| Proceeds from maturities and sales of securities: | | | |
| Long-Term excluding U.S. Government | | | 23,851 | | |
| U.S. Government | | | – | | |
NOTE 4. FEDERAL INCOME TAX MATTERS
The Fund has not made any provision for federal income or excise taxes due to its policy to distribute all of its taxable income and capital gains to its shareholders and otherwise qualify as a regulated investment company under the Internal Revenue Code. Income and capital gain distributions are determined in accordance with income tax regulations, which may differ from GAAP. These differences are primarily due to differing treatment for items including, but not limited to, wash sales and distribution reclasses from mutual funds.
Reclassifications between Undistributed net investment income (loss), Undistributed net realized capital gains (loss) and Shares of beneficial interest are made to reflect income and gains available for distribution under federal tax regulations. Results of operations and net assets are not effected by these reclassifications. These reclassifications are as follows:
| Undistributed net investment income (loss) | | $ | 6,474 | | |
Accumulated net realized gain (loss) from investment
securities | | | (6,474 | ) | |
The capital loss carryforwards utilized during the year ended October 31, 2004 were $135.
The tax character of distributions paid may differ from the character of distributions shown in the Statements of Changes in Net Assets due to short-term gains being treated as ordinary income for tax purposes.
The tax basis components of distributable earnings as of October 31, 2004, are as follows:
| Undistributed Ordinary Income | | $ | 3,077 | | |
| Undistributed Long-term Capital Gains | | $ | 4,606 | | |
| Capital Loss Carryforward | | $ | 0 | | |
| Net Unrealized Appreciation (Depreciation) | | $ | 48,348 | | |
The aggregate cost of investments and composition of unrealized appreciation (depreciation) for federal income tax purposes as of October 31, 2004, are as follows:
| Federal Tax Cost Basis | | $ | 638,545 | | |
| Unrealized Appreciation | | $ | 48,348 | | |
| Unrealized (Depreciation) | | | – | | |
| Net Unrealized Appreciation (Depreciation) | | $ | 48,348 | | |
NOTE 5. OTHER MATTERS
Transamerica IDEX Mutual Funds ("TA IDEX"), and certain of its affiliated entities, have received requests for information from the Staff of the Securities and Exchange Commission in connection with market timing and late trading within the funds. TA IDEX and the affiliated entities have voluntarily cooperated in the investigation and have been providing the information as requested.
Transamerica IDEX Mutual Funds
Annual Report 2004
10
Report of Independent Registered Certified Public Accounting Firm
To the Board of Trustees and Shareholders of
TA IDEX Asset Allocation–Growth Portfolio
In our opinion, the accompanying statement of assets and liabilities, including the schedule of investments, and the related statements of operations and of changes in net assets and the financial highlights present fairly, in all material respects, the financial position of TA IDEX Asset Allocation–Growth Portfolio (the "Fund") (one of the portfolios constituting the Transamerica IDEX Mutual Funds) at October 31, 2004, the results of its operations for the year then ended, the changes in its net assets for each of the two years in the period then ended and the financial highlights for each of the periods indicated, in conformity with accounting principles generally accepted in the United States of America. These financial statements and financial highlights (hereafter referred to as "financial statements") are the responsibility of the Fund's management; our responsibility is to express an opinion on these financial statements based on our audits. We conducted our audits of these financial statements in accordance with the standards of the Public Company Accounting Oversight Board (United States). Those standards require that we plan and perform the audit to obtain reasonable assurance about whether the financial statements are free of material misstatement. An audit includes examining, on a test basis, evidence supporting the amounts and disclosures in the financial statements, assessing the accounting principles used and significant estimates made by management, and evaluating the overall financial statement presentation. We believe that our audits, which included confirmation of securities at October 31, 2004 by correspondence with the custodian, provide a reasonable basis for our opinion.

PricewaterhouseCoopers LLP
Tampa, Florida
December 28, 2004
Transamerica IDEX Mutual Funds
Annual Report 2004
11
TA IDEX Asset Allocation–Growth Portfolio
SUPPLEMENTAL INFORMATION
RESULTS OF SHAREHOLDER PROXY (unaudited)
At a special meeting of Class M shareholders of each series of Transamerica IDEX (except TA IDEX Federated Tax Exempt and TA IDEX Protected Principal Stock), as listed above, held on September 2, 2004, the results of the Proposal were as follows:
Proposal 1: Approval of a conversion of Class M shares into Class C shares of the Funds, which will result in bearing the distribution and service fees payable under the 12b-1 Plan of Distribution for the Class C shares of the Funds.
| For | | Against | | Abstentions/Broker Non-Votes | |
| | 86.95 | % | | | 5.03 | % | | | 8.02 | % | |
Transamerica IDEX Mutual Funds
Annual Report 2004
12
TA IDEX Asset Allocation–Moderate Portfolio
MARKET ENVIRNOMENT
The last 12 months were a volatile period in the global securities market, but overall provided solid gains to well-diversified investors. Domestic stocks led the way early in the year, continuing to rally off their 2002 lows, but since then the U.S. stock market has been choppy, with little net change.
The markets indecisiveness seemed driven by a profusion of uncertainty. Economic indicators turned mixed over the summer after seeming to point clearly upward in the spring. The presidential election loomed, with the polls offering little clarity as to which candidate might win. Oil prices hovered near historic highs, and the situation in Iraq remained extremely tense. And amid all this, the Federal Reserve Board ("Fed") raised interest rates three times and signaled more hikes would be on the way.
At least the strong gains early in the year persisted through this uncertainty, with the Standard and Poor's 500 Composite Stock Index up 9.41% for the last 12 month period, all of which came in the first five months of the year. The big winners were small-cap stocks, though, with the Standard and Poor's SmallCap 600 up nearly 25%.
Interest rates were surprisingly supportive of equity prices. The dominant perception through March was that slow payroll growth would keep a lid on Fed interest rate hikes, and the Madrid terrorist attacks sparked renewed interest in safe Treasuries among both foreign and U.S. investors. However, a much stronger-than-expected March jobs report was the turning point for the bond market, leading to the first sharp upward spike in interest rates. However, since then bonds pulled off an impressive reversal. Even as the Fed raised short rates three times, long-term yields fell and the yield curve flattened through the summer and fall. Over the 12 month period, the Lehman Brothers Aggregate Bond Index managed a 5.53% gain, and the equity sensitive Lehman Brothers High Yield Index gained 12.32%.
Many of the same market trends were evident in foreign markets. Gains were well distributed across foreign markets, consistent with the view of an improving world economy. In addition, unhedged foreign funds and indexes were buoyed by generally strong foreign currencies relative to the dollar, with the Morgan Stanley Capital International (EAFE) Index ("MSCI EAFE") up more than 19% converted back into dollar terms.
PERFORMANCE
For the year ended October 31, 2004, TA IDEX Asset Allocation–Moderate Portfolio, Class A returned 9.32%. By comparison its primary and secondary benchmarks, the Dow Jones Wilshire 5000 Total Market Index and the Lehman Brothers Aggregate Bond Index ("LBAB"), returned 8.26% and 5.53%, respectively.
STRATEGY REVIEW
Q. How did you manage the portfolio in this market environment?
The TA IDEX Asset Allocation–Moderate Portfolio is designed to tame the risk of equity and fixed income investing by splitting its allocation between them. But that persistent diversification across asset classes, styles, and sectors also paid off through strong relative performance in the last 12 months. The portfolio performed well relative to its peers, with a 9.32% gain over the last 12 months, landing in the top quartile of Morningstar's Moderate Allocation category.
The portfolio benefited strongly from its exposure to small and mid-cap stocks over this period, as those were the strongest performing parts of the domestic equity market. Over the course of the year, cash flows into the portfolio were generally used to increase the portfolio's exposure to Treasury-Inflation Protected Securities ("TIPS") and large-cap value stocks. TIPS performed especially well for the portfolio, with the PIMCO Real Return TIPS up 7.94%.
Q. How did credit quality and duration impact the portfolio?
The portfolio's 40% stake in fixed-income did well due to its exposure to credit-sensitive bonds, such as convertibles and high-yield. The best fixed-income performer was the 8% stake in Transamerica Convertible Securities, which gained 7.06%. Transamerica Conservative High-Yield Bond, amounting to nearly 13% of assets, added a gain of 9.23%. The portfolio also profited substantially from its exposure to inflation-protected securities, as real rates declined more than nominal rates. PIMCO Real Return TIPS, the portfolio's largest holding with nearly 15% of assets, managed a 7.94% gain, beating PIMCO Total Return, which amounts to just 5% of assets, by over 3%. All three of the portfolio's largest bond holdings, amounting to more than 36% of assets substantially outperformed the LBAB gain of 5.53% for the period.
Over the course of the year the portfolio's exposure to credit-sensitive bonds was gradually reduced, because those sectors
Transamerica IDEX Mutual Funds
Annual Report 2004
1
TA IDEX Asset Allocation–Moderate Portfolio (continued)
have rallied so strongly since late 2002. Instead those assets were directed into the PIMCO Real Return TIPS.
Q. Which individual holdings had the greatest positive impact on performance?
The portfolio's niche equity holdings paid off well. TA IDEX Transamerica Small/Mid Cap Value added 20.61%; and TA IDEX Clarion Real Estate Securities gained 29.30%. These two winners accounted for 20% of the portfolio's assets invested in equity funds at the end of October.
Q. Which individual holdings had the greatest negative impact on performance?
The portfolio's international equity exposure should have helped more than it did. TA IDEX American Century International, the portfolio's largest international equity holding and the only pure international investment available in the TA IDEX lineup, gained 9.95% over the last 12 months, though its MSCI EAFE benchmark added 19.27%. As a result of the portfolio's persistent underperformance, that investment was gradually reduced over the course of the year to 3.50% of assets at the end of October, which helped reduce the negative effect of TA IDEX American Century International's underperformance to a limited extent.
TA IDEX T. Rowe Price Small Cap was also an underperformer for the period. However, since it had little more than 2% of total net assets, it did not have a large negative impact on performance.
Q. Which sectors/industries had the greatest impact on performance?
The portfolio had 5% of total assets in TA IDEX Clarion Real Estate Securities, which primarily owns real estate investment trusts ("REITs"). The real estate sector was one of the best performing sectors across the U.S. stock market, and as a result TA IDEX Clarion Real Estate Securities was up 29.30% for the period.
Q. Which countries had the greatest impact on performance?
Because of the poor relative performance of TA IDEX American Century International, over the course of the year this fund's foreign exposure was reduced to significantly below its target level. The largest international exposure of the fund was to the eurozone.
Investment Committee
AEGON/Transamerica Fund Advisers, Inc.
Transamerica IDEX Mutual Funds
Annual Report 2004
2
TA IDEX Asset Allocation–Moderate Portfolio
Comparison of change in value of $10,000 investment in Class A shares and its comparative index.
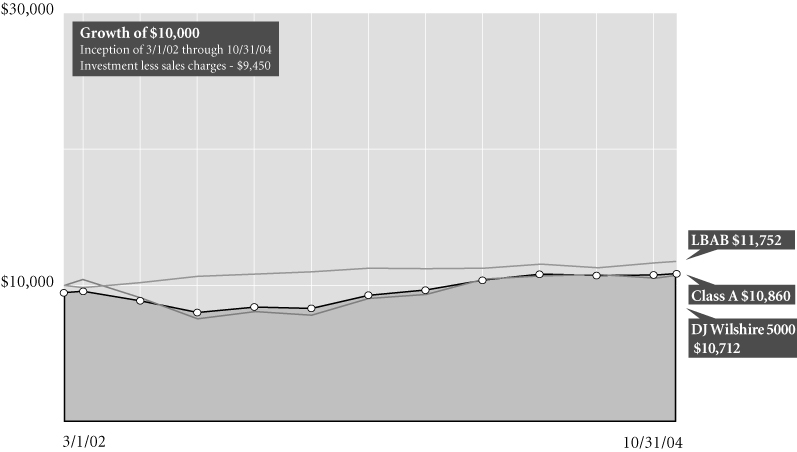
Average Annual Total Return for Periods Ended 10/31/04
| | | 1 year | | From
Inception | | Inception
Date | |
| Class A (NAV) | | | 9.32 | % | | | 5.35 | % | | 3/1/02 | |
| Class A (POP) | | | 3.31 | % | | | 3.13 | % | | 3/1/02 | |
| DJ Wilshire 50001 | | | 8.26 | % | | | 2.61 | % | | 3/1/02 | |
| LBAB1 | | | 5.53 | % | | | 6.24 | % | | 3/1/02 | |
| Class B (NAV) | | | 8.62 | % | | | 4.67 | % | | 3/1/02 | |
| Class B (POP) | | | 3.62 | % | | | 3.62 | % | | 3/1/02 | |
| Class C (NAV) | | | 8.67 | % | | | 14.16 | % | | 11/11/02 | |
| Class C (POP) | | | 7.67 | % | | | 14.16 | % | | 11/11/02 | |
NOTES
1 The Dow Jones Wilshire 5000 Total Market (DJ Wilshire 5000) Index and Lehman Brothers Aggregate Bond (LBAB) Index are unmanaged indices used as a general measure of market performance. Calculations assume dividends and capital gains are reinvested and do not include any managerial expenses. From inception calculation is based on life of Class A shares. Source: Standard & Poor's Micropal®© Micropal, Inc. 2004 – 1-800-596-5323 – http://www.micropal.com.
The performance data presented represents past performance, future results may vary. Performance data does not reflect the deduction of taxes that would be paid on fund distributions or the redemption of fund shares. Investment return and principal value will fluctuate so that an investor's shares, when redeemed, may be worth more or less than their original cost. Current performance may be lower or higher than performance quoted.
Public Offering Price (POP) returns include the reinvestment of dividends and capital gains and reflect the maximum sales charge of 5.5% for A shares or the maximum applicable contingent deferred sales charge (5% in the 1st year, decreasing to 0% after 6 years) for Class B shares and 1% (during the first 12 months) for Class C shares. Shares purchased prior to March 1, 2004 are subject to a maximum applicable contingent deferred sales charge (5% in the 1st year, decreasing to 0% after 7 years) for Class B shares and (2% in the 1st year, decreasing to 0% after 2 years) for Class C shares. Net Asset Value (NAV) returns include the reinvestment of dividends and capital gains but do not reflect any sales charges.
This material must be preceded or accompanied by a current prospectus, which includes specific contents regarding the investment objectives and policies of this fund.
Transamerica IDEX Mutual Funds
Annual Report 2004
3
TA IDEX Asset Allocation–Moderate Portfolio
UNDERSTANDING YOUR FUND'S EXPENSES (unaudited)
SHAREHOLDER EXPENSES
The following Example is intended to help you understand your ongoing costs (in dollars and cents) of investing in a Fund and to compare these costs with the ongoing costs of investing in other funds.
The Example is based on an investment of $1,000 invested at the beginning of the period and held for the entire period from May 1, 2004 to October 31, 2004.
ACTUAL EXPENSES
The first line in the table below provides information about actual account values and actual expenses. You may use the information in this line, together with the amount you invested, to estimate the expenses that you paid over the period. Simply divide your account value by $1,000 (for example, an $8,600 account value divided by $1,000 = 8.6), then multiply the result by the number in the first line of your Fund under the heading entitled "Expenses Paid During Period" to estimate the expenses you paid on your account during this period.
HYPOTHETICAL EXAMPLE FOR COMPARISON PURPOSES
The second line in the table below provides information about hypothetical account values and hypothetical expenses based on each Fund's actual expense ratio and an assumed rate of return of 5% per year before expenses, which is not the Fund's actual return. The hypothetical account values and expenses may not be used to estimate the actual ending account balance or expenses you paid for the period. You may use this information to compare the ongoing costs of investing in your Fund and other funds. To do so, compare this 5% hypothetical example with the 5% hypothetical examples that appear in the shareholder reports of the other funds.
Please note that the expenses shown in the table are meant to highlight your ongoing costs only and do not reflect any transactional costs, such as sales charges, redemption fees, brokerage commissions paid on purchases and sales of fund shares. Therefore, the second line under each Fund in the table is useful in comparing ongoing costs only, and will not help you determine the relative total costs of owning different funds. In addition, note that the expenses shown in the table are meant to highlight your ongoing costs and do not reflect any transaction costs.
| | | Beginning
Account
Value | | Ending
Account
Value | | Annualized
Expense
Ratio | | Expenses Paid
During Period (a) | |
| Class A | | | |
| Actual | | $ | 1,000.00 | | | $ | 1,036.00 | | | | 0.29 | % | | $ | 1.48 | | |
| Hypothetical (b) | | | 1,000.00 | | | | 1,023.68 | | | | 0.29 | | | | 1.48 | | |
| Class B | | | |
| Actual | | | 1,000.00 | | | | 1,032.80 | | | | 0.93 | | | | 4.75 | | |
| Hypothetical (b) | | | 1,000.00 | | | | 1,020.46 | | | | 0.93 | | | | 4.72 | | |
| Class C | | | |
| Actual | | | 1,000.00 | | | | 1,033.30 | | | | 0.91 | | | | 4.65 | | |
| Hypothetical (b) | | | 1,000.00 | | | | 1,020.56 | | | | 0.91 | | | | 4.62 | | |
(a) Expenses are calculated using each Fund's annualized expense ratio (as disclosed in the table), multiplied by the average account value for the period, multiplied by number of days in the period (184 days), and divided by the number of days in the year (366 days).
(b) 5% return per year before expenses.
GRAPHIC PRESENTATION OF SCHEDULE OF INVESTMENTS
By Asset Type
At October 31, 2004
This chart shows the percentage breakdown by asset type of the Fund's total investment securities. Asset type is calculated based on the aggregate portfolio holdings in the underlying funds in which the Fund invests. The security lending collateral in the underlying funds is excluded from this calculation.
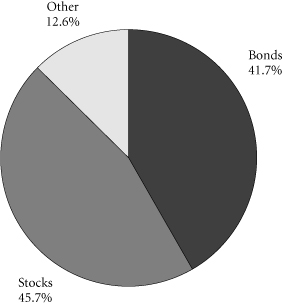
Transamerica IDEX Mutual Funds
Annual Report 2004
4
TA IDEX Asset Allocation–Moderate Portfolio
SCHEDULE OF INVESTMENTS
At October 31, 2004
(all amounts except share amounts in thousands)
| | | Shares | | Value | |
| INVESTMENT COMPANIES (99.7%) (b) | |
| Agressive Equity (16.8%) | |
| TA IDEX T. Rowe Price Health Sciences | | | 4,166,509 | | | $ | 45,165 | | |
| TA IDEX T. Rowe Price Small Cap (a) | | | 2,143,374 | | | | 23,234 | | |
TA IDEX Transamerica Growth
Opportunities (a) | | | 5,188,487 | | | | 34,296 | | |
TA IDEX Transamerica Small/Mid Cap
Value | | | 4,690,882 | | | | 67,173 | | |
| Capital Preservation (4.2%) | |
| TA IDEX Transamerica Money Market | | | 42,898,330 | | | | 42,898 | | |
| Fixed-Income (42.2%) | |
| TA IDEX PIMCO Real Return TIPS | | | 14,730,192 | | | | 154,372 | | |
| TA IDEX PIMCO Total Return | | | 3,814,966 | | | | 39,981 | | |
TA IDEX Transamerica Conservative
High-Yield Bond | | | 13,785,912 | | | | 129,174 | | |
TA IDEX Transamerica Convertible
Securities | | | 7,311,596 | | | | 80,428 | | |
| TA IDEX Transamerica Flexible Income | | | 2,488,404 | | | | 24,088 | | |
| Growth Equity (27.4%) | |
TA IDEX American Century Large
Company Value | | | 4,343,819 | | | | 44,307 | | |
| TA IDEX Great Companies–TechnologySM (a) | | | 6,487,464 | | | | 24,652 | | |
| | | Shares | | Value | |
| Growth Equity (continued) | | | |
| TA IDEX Janus Growth | | | 675,306 | | | $ | 14,560 | | |
| TA IDEX Marsico Growth (a) | | | 1,199,843 | | | | 10,979 | | |
| TA IDEX Salomon All Cap (a) | | | 4,374,433 | | | | 64,742 | | |
| TA IDEX Salomon Investors Value | | | 7,178,280 | | | | 95,471 | | |
| TA IDEX Transamerica Equity | | | 3,109,864 | | | | 23,168 | | |
| Speciality–Real Estate (5.1%) | | | |
| TA IDEX Clarion Real Estate Securities | | | 3,661,150 | | | | 51,183 | | |
| World Equity (4.0%) | | | |
| TA IDEX American Century International | | | 3,993,929 | | | | 35,186 | | |
TA IDEX Templeton Great Companies
Global (a) | | | 238,387 | | | | 5,388 | | |
| Total Investment Companies (cost: $927,053) | | | | | | | 1,010,445 | | |
| Total Investment Securities (cost: $927,053) | | | | | | $ | 1,010,445 | | |
| SUMMARY: | | | |
| Investments, at value | | | 99.7 | % | | $ | 1,010,445 | | |
| Other assets in excess of liabilities | | | 0.3 | % | | | 2,602 | | |
| Net assets | | | 100.0 | % | | $ | 1,013,047 | | |
NOTES TO SCHEDULE OF INVESTMENTS:
(a) No dividends were paid during the preceding twelve months.
(b) The Fund invests its assets in Class A shares of the underlying TA IDEX Mutual Funds, which are affiliates of the Fund.
The notes to the financial statements are an integral part of this report.
Transamerica IDEX Mutual Funds
Annual Report 2004
5
TA IDEX Asset Allocation–Moderate Portfolio
STATEMENT OF ASSETS AND LIABILITIES
At October 31, 2004
(all amounts except per share amounts in thousands)
| Assets: | | | |
Investment in affiliated mutual funds, at value
(cost: $927,053) | | $ | 1,010,445 | | |
| Cash | | | 1,244 | | |
| Receivables: | |
| Shares of beneficial interest sold | | | 4,112 | | |
| Interest | | | 1 | | |
| Other | | | 17 | | |
| | | | 1,015,819 | | |
| Liabilities: | | | |
| Investment securities purchased | | | 1,289 | | |
| Accounts payable and accrued liabilities: | |
| Shares of beneficial interest redeemed | | | 616 | | |
| Management and advisory fees | | | 85 | | |
| Distribution fees | | | 423 | | |
| Transfer agent fees | | | 179 | | |
| Other | | | 180 | | |
| | | | 2,772 | | |
| Net Assets | | $ | 1,013,047 | | |
| Net Assets Consist of: | | | |
Shares of beneficial interest, unlimited shares
authorized, no par value | | $ | 905,489 | | |
| Undistributed net investment income (loss) | | | 18,282 | | |
Accumulated net realized gain (loss) from investment
in affiliated mutual funds | | | 5,884 | | |
Net unrealized appreciation (depreciation) on
investment securities in affiliated mutual funds | | | 83,392 | | |
| Net Assets | | $ | 1,013,047 | | |
| Net Assets by Class: | | | |
| Class A | | $ | 232,748 | | |
| Class B | | | 261,772 | | |
| Class C | | | 518,527 | | |
| Shares Outstanding: | | | |
| Class A | | | 20,724 | | |
| Class B | | | 23,452 | | |
| Class C | | | 46,431 | | |
| Net Asset Value Per Share: | | | |
| Class A | | $ | 11.23 | | |
| Class B | | | 11.16 | | |
| Class C | | | 11.17 | | |
| Maximum Offering Price Per Share (a): | | | |
| Class A | | $ | 11.88 | | |
(a) Includes the maximum selling commission (represented as a percentage of offering price) which is reduced on certain levels of sales as set forth in the Prospectus. Net asset value per share for Classes B and C shares represents offering price. The redemption price for Classes B and C shares equals net asset value less any applicable contingent deferred sales charge.
STATEMENT OF OPERATIONS
For the year ended October 31, 2004
(all amounts in thousands)
| Investment Income: | | | |
| Interest | | $ | 5 | | |
| Dividends from affiliated mutual funds | | | 11,786 | | |
| | | | 11,791 | | |
| Expenses: | | | |
| Management and advisory fees | | | 835 | | |
| Transfer agent fees: | |
| Class A | | | 200 | | |
| Class B | | | 286 | | |
| Class C | | | 326 | | |
| Class C2 | | | 17 | | |
| Class M | | | 10 | | |
| Printing and shareholder reports | | | 45 | | |
| Custody fees | | | 42 | | |
| Administration fees | | | 117 | | |
| Legal fees | | | 26 | | |
| Audit and accounting fees | | | 28 | | |
| Trustees fees | | | 46 | | |
| Registration fees: | |
| Class A | | | 52 | | |
| Class B | | | 45 | | |
| Class C | | | 74 | | |
| Class C2 | | | 6 | | |
| Class M | | | 4 | | |
| Other | | | 29 | | |
| Distribution and service fees: | |
| Class B | | | 1,522 | | |
| Class C | | | 2,438 | | |
| Class C2 | | | 198 | | |
| Class M | | | 87 | | |
| Net expenses | | | 6,433 | | |
| Net Investment Income (Loss) | | | 5,358 | | |
| Net Realized and Unrealized Gain (Loss): | | | |
Realized Gain (Loss) from investment in affiliated
mutual funds | | | 587 | | |
Realized gain distributions from investments in
affiliated mutual funds | | | 23,604 | | |
Increase (decrease) in unrealized appreciation
(depreciation) on investment in affiliated
mutual funds | | | 31,585 | | |
Net Gain (Loss) on Investments in Affiliated
Mutual Funds | | | 55,776 | | |
Net Increase (Decrease) in Net Assets Resulting
from Operations | | $ | 61,134 | | |
The notes to the financial statements are an integral part of this report.
Transamerica IDEX Mutual Funds
Annual Report 2004
6
TA IDEX Asset Allocation–Moderate Portfolio
STATEMENTS OF CHANGES IN NET ASSETS
For the years ended
(all amounts in thousands)
| | | October 31,
2004 | | October 31,
2003 | |
| Increase (Decrease) in Net Assets From: | | | |
| Operations: | | | |
| Net investment income (loss) | | $ | 5,358 | | | $ | 1,935 | | |
Net realized gain (loss) from
investment securities in affiliated
mutual funds | | | 24,191 | | | | 251 | | |
Net unrealized appreciation
(depreciation) on investment
securities in affiliated mutual funds | | | 31,585 | | | | 55,947 | | |
| | | | 61,134 | | | | 58,133 | | |
| Distributions to Shareholders: | | | |
| From net investment income: | |
| Class A | | | (1,929 | ) | | | (219 | ) | |
| Class B | | | (1,796 | ) | | | (148 | ) | |
| Class C | | | (2,222 | ) | | | (21 | ) | |
| Class C2 | | | (412 | ) | | | (85 | ) | |
| Class M | | | (167 | ) | | | (44 | ) | |
| | | | (6,526 | ) | | | (517 | ) | |
| Capital Share Transactions: | | | |
| Proceeds from shares sold: | |
| Class A | | | 136,942 | | | | 102,381 | | |
| Class B | | | 93,601 | | | | 137,237 | | |
| Class C | | | 277,155 | | | | 193,572 | | |
| Class C2 | | | 8,303 | | | | 20,189 | | |
| Class M | | | 3,239 | | | | 7,305 | | |
| | | | 519,240 | | | | 460,684 | | |
Dividends and distributions
reinvested: | |
| Class A | | | 1,710 | | | | 200 | | |
| Class B | | | 1,484 | | | | 123 | | |
| Class C | | | 1,515 | | | | 18 | | |
| Class C2 | | | 324 | | | | 61 | | |
| Class M | | | 152 | | | | 41 | | |
| | | | 5,185 | | | | 443 | | |
| Cost of shares redeemed: | |
| Class A | | | (34,420 | ) | | | (14,662 | ) | |
| Class B | | | (32,173 | ) | | | (14,226 | ) | |
| Class C | | | (52,508 | ) | | | (8,858 | ) | |
| Class C2 | | | (5,376 | ) | | | (7,862 | ) | |
| Class M | | | (3,146 | ) | | | (4,553 | ) | |
| | | | (127,623 | ) | | | (50,161 | ) | |
| Class level exchanges: | |
| Class C | | | 67,248 | | | | – | | |
| Class C2 | | | (49,594 | ) | | | – | | |
| Class M | | | (17,654 | ) | | | – | | |
| | | | – | | | | – | | |
| | | October 31,
2004 | | October 31,
2003 | |
| Automatic conversions: | |
| Class A | | | 95 | | | | – | | |
| Class B | | | (95 | ) | | | – | | |
| | | | – | | | | – | | |
| | | | 396,802 | | | | 410,966 | | |
| Net increase (decrease) in net assets | | | 451,410 | | | | 468,582 | | |
| Net Assets: | | | |
| Beginning of year | | | 561,637 | | | | 93,055 | | |
| End of year | | $ | 1,013,047 | | | $ | 561,637 | | |
Undistributed Net Investment Income
(Loss) | | $ | 18,282 | | | $ | 1,370 | | |
| Share Activity: | | | |
| Shares issued: | |
| Class A | | | 12,569 | | | | 10,668 | | |
| Class B | | | 8,625 | | | | 14,694 | | |
| Class C | | | 25,497 | | | | 20,375 | | |
| Class C2 | | | 768 | | | | 2,174 | | |
| Class M | | | 299 | | | | 794 | | |
| | | | 47,758 | | | | 48,705 | | |
Shares issued–reinvested from
distributions: | |
| Class A | | | 162 | | | | 23 | | |
| Class B | | | 140 | | | | 14 | | |
| Class C | | | 143 | | | | 2 | | |
| Class C2 | | | 31 | | | | 7 | | |
| Class M | | | 14 | | | | 5 | | |
| | | | 490 | | | | 51 | | |
| Shares redeemed: | |
| Class A | | | (3,153 | ) | | | (1,554 | ) | |
| Class B | | | (2,959 | ) | | | (1,525 | ) | |
| Class C | | | (4,828 | ) | | | (929 | ) | |
| Class C2 | | | (496 | ) | | | (838 | ) | |
| Class M | | | (289 | ) | | | (496 | ) | |
| | | | (11,725 | ) | | | (5,342 | ) | |
| Class level exchanges: | |
| Class C | | | 6,171 | | | | – | | |
| Class C2 | | | (4,566 | ) | | | – | | |
| Class M | | | (1,603 | ) | | | – | | |
| | | | 2 | | | | – | | |
| Automatic conversions: | |
| Class A | | | 9 | | | | – | | |
| Class B | | | (9 | ) | | | – | | |
| | | | – | | | | – | | |
Net increase (decrease) in shares
outstanding: | |
| Class A | | | 9,587 | | | | 9,137 | | |
| Class B | | | 5,797 | | | | 13,183 | | |
| Class C | | | 26,983 | | | | 19,448 | | |
| Class C2 | | | (4,263 | ) | | | 1,343 | | |
| Class M | | | (1,579 | ) | | | 303 | | |
| | | | 36,525 | | | | 43,414 | | |
The notes to the financial statements are an integral part of this report.
Transamerica IDEX Mutual Funds
Annual Report 2004
7
TA IDEX Asset Allocation–Moderate Portfolio
FINANCIAL HIGHLIGHTS
| | | | | For a share of beneficial interest outstanding throughout each period | |
| | | | | Net Asset | | Investment Operations | | Distributions | | Net Asset | |
| | | For the
Period
Ended (d)(g) | | Value,
Beginning
of Period | | Net
Investment
Income (Loss) | | Net Realized
and Unrealized
Gain (Loss) | | Total
Operations | | From Net
Investment
Income | | From Net
Realized
Gains | | Total
Distributions | | Value,
End
of Period | |
| Class A | | 10/31/2004 | | $ | 10.42 | | | $ | 0.12 | | | $ | 0.84 | | | $ | 0.96 | | | $ | (0.15 | ) | | $ | – | | | $ | (0.15 | ) | | $ | 11.23 | | |
| | | 10/31/2003 | | | 8.76 | | | | 0.12 | | | | 1.62 | | | | 1.74 | | | | (0.08 | ) | | | – | | | | (0.08 | ) | | | 10.42 | | |
| | | 10/31/2002 | | | 10.00 | | | | 0.04 | | | | (1.28 | ) | | | (1.24 | ) | | | – | | | | – | | | | – | | | | 8.76 | | |
| Class B | | 10/31/2004 | | | 10.37 | | | | 0.05 | | | | 0.83 | | | | 0.88 | | | | (0.09 | ) | | | – | | | | (0.09 | ) | | | 11.16 | | |
| | | 10/31/2003 | | | 8.71 | | | | 0.05 | | | | 1.63 | | | | 1.68 | | | | (0.02 | ) | | | – | | | | (0.02 | ) | | | 10.37 | | |
| | | 10/31/2002 | | | 10.00 | | | | 0.01 | | | | (1.30 | ) | | | (1.29 | ) | | | – | | | | – | | | | – | | | | 8.71 | | |
| Class C | | 10/31/2004 | | | 10.37 | | | | 0.05 | | | | 0.84 | | | | 0.89 | | | | (0.09 | ) | | | – | | | | (0.09 | ) | | | 11.17 | | |
| | | 10/31/2003 | | | 8.71 | | | | 0.05 | | | | 1.63 | | | | 1.68 | | | | (0.02 | ) | | | – | | | | (0.02 | ) | | | 10.37 | | |
| | | | | | | Ratios/Supplemental Data | |
| | | For the
Period | | Total | | Net Assets,
End of
Period | | Ratio of Expenses
to Average
Net Assets (a) | | Net Investment
Income (Loss)
to Average | | Portfolio
Turnover | |
| | | Ended (g) | | Return (c) | | (000's) | | Net (e) | | Total (f) | | Net Assets (a) | | Rate (b) | |
| Class A | | 10/31/2004 | | | 9.32 | % | | $ | 232,748 | | | | 0.28 | % | | | 0.28 | % | | | 1.13 | % | | | 1 | % | |
| | | 10/31/2003 | | | 19.98 | | | | 116,102 | | | | 0.37 | | | | 0.37 | | | | 1.22 | | | | 18 | | |
| | | 10/31/2002 | | | (12.40 | ) | | | 17,517 | | | | 0.45 | | | | 0.78 | | | | 0.83 | | | | 12 | | |
| Class B | | 10/31/2004 | | | 8.62 | | | | 261,772 | | | | 0.93 | | | | 0.93 | | | | 0.48 | | | | 1 | | |
| | | 10/31/2003 | | | 19.39 | | | | 183,148 | | | | 1.02 | | | | 1.02 | | | | 0.57 | | | | 18 | | |
| | | 10/31/2002 | | | (12.90 | ) | | | 38,969 | | | | 1.10 | | | | 1.43 | | | | 0.18 | | | | 12 | | |
| Class C | | 10/31/2004 | | | 8.67 | | | | 518,527 | | | | 0.89 | | | | 0.89 | | | | 0.50 | | | | 1 | | |
| | | 10/31/2003 | | | 19.39 | | | | 201,774 | | | | 1.02 | | | | 1.02 | | | | 0.57 | | | | 18 | | |
NOTES TO FINANCIAL HIGHLIGHTS
(a) Annualized.
(b) Not annualized for periods of less than one year.
(c) Total Return has been calculated for the applicable period without deduction of a sales load, if any, on an initial purchase. Periods of less than one year are not annualized.
(d) Per share information is calculated based on average number of shares outstanding.
(e) Ratio of Net Expenses to Average Net Assets is net of fee waivers and reimbursements by the investment adviser, if any (see note 2).
(f) Ratio of Total Expenses to Average Net Assets includes all expenses before fee waivers and reimbursements by the investment adviser.
(g) TA IDEX Asset Allocation–Moderate Portfolio ("the Fund") commenced operations on March 1, 2002. The inception date for the Fund's offering of share Class L was November 11, 2002. Class L was renamed Class C on March 1, 2004 (see note 1).
The notes to the financial statements are an integral part of this report.
Transamerica IDEX Mutual Funds
Annual Report 2004
8
TA IDEX Asset Allocation–Moderate Portfolio
NOTES TO FINANCIAL STATEMENTS
At October 31, 2004
(all amounts in thousands)
NOTE 1. ORGANIZATION AND SIGNIFICANT ACCOUNTING POLICIES
Transamerica IDEX Mutual Funds, formerly IDEX Mutual Funds, is a Massachusetts business trust registered under the Investment Company Act of 1940, as amended (the "1940 Act"), as an open-end management investment company. TA IDEX Asset Allocation–Moderate Portfolio ("the Fund"), part of Transamerica IDEX Mutual Funds, began operations on March 1, 2002.
On March 1, 2004, the Fund changed its name from IDEX Asset Allocation–Moderate Portfolio to TA IDEX Asset Allocation–Moderate Portfolio.
In the normal course of business, the Fund enters into contracts that contain a variety of representations and warranties, which provide general indemnifications. The Fund's maximum exposure under these arrangements is unknown, as this would involve future claims that may be made against the Fund and/or its affiliates that have not yet occurred. However, based on experience, the Fund expects the risk of loss to be remote.
See the Prospectus and Statement of Additional Information for a description of the Fund's investment objective.
In preparing the Fund's financial statements in accordance with accounting principles generally accepted in the United States of America ("GAAP"), estimates or assumptions (which could differ from actual results) may be used that affect reported amounts and disclosures. The following policies were consistently followed by the Fund, in accordance with GAAP.
Multiple class operations and expenses: The Fund currently offers three classes of shares, each with a public offering price that reflects different sales charges, if any, and expense levels. All shares designated as Class C shares prior to March 1, 2004, were renamed as Class C2 shares on that date. All shares designated as Class L shares prior to March 1, 2004, were renamed as Class C shares with different sales charges than the previous Class L shares. On June 15, 2004, Class C2 shares merged into Class C. On September 24, 2004, Class M shares merged into Class C. Class B shares will convert to class A shares eight years after purchase. Income, non-class specific expenses and realized and unrealized gains and losses, are allocated daily to each class, based upon the value of shares outstanding method as permitted under Rule 18f-3 of the 1940 Act. Each class bears its own specific expenses as well as a portion of general, common expenses.
Pricing of shares: The Fund prices its shares on the basis of the net asset value of each class of shares of the Fund, which is determined as of the close of the New York Stock Exchange ("NYSE") (generally 4:00 p.m. Eastern Time) on each day on which the NYSE is open for trading (other than a day on which there are insufficient changes in the value of the Fund's portfolio securities to materially affect the Fund's net asset value or a day on which no shares are tendered for redemption and no order to purchase any shares is received).
Security valuations: The Fund's investments are valued at the net asset values of the underlying portfolios of Transamerica IDEX Mutual Funds. The net asset values of the underlying portfolios are determined at the close of the NYSE (generally 4:00 p.m. eastern time) on the valuation date.
Cash: The Fund may leave cash overnight in its cash account with the custodian, Investors Bank & Trust Company ("IBT"). IBT has been contracted on behalf of the Fund to invest the excess cash into a savings account, which at October 31, 2004, was paying an interest rate of 1.30%.
Throughout the year, the Fund may have a cash overdraft balance. A fee is incurred on this overdraft, calculated by multiplying the overdraft by a rate based on the federal funds rate. This fee is included in Custody fees in the Statement of Operations.
Security transactions and investment income: Security transactions are recorded on the trade date. Security gains and losses are calculated on the specific identification basis. Interest income, including accretion of discounts and amortization of premiums, is recorded on the accrual basis commencing on the settlement date. Dividend income is recorded on the ex-dividend date, dividends and net realized gain (loss) from investment securities for the Fund are from investments in shares of affiliated companies.
Account maintenance fees: If the shareholder account balance falls below $1 by either shareholder action or as a result of market action, a $25 (not in thousands) fee is assessed every year until the balance reaches $1. The fee is assessed by redeeming shares in the shareholder's account.
No fee will be charged under the following conditions:
• accounts opened within the preceding 24 months
• accounts with an active monthly Automatic Investment Plan ($50 (not in thousands) minimum per fund)
• accounts owned by an individual which, when combined by social security number, have a balance of $5 or more
• accounts owned by individuals in the same household (by address) that have a combined balance of $5 or more
• UTMA/UGMA accounts
• Fiduciary accounts
• B-share accounts whose shares have started to convert to A-shares accounts (as long as combined value of both accounts is at least $1)
For the year ended October 31, 2004, there were no fees. These fees are included in Paid in Capital in the Statement of Assets and Liabilities.
Transamerica IDEX Mutual Funds
Annual Report 2004
9
TA IDEX Asset Allocation–Moderate Portfolio
NOTES TO FINANCIAL STATEMENTS (continued)
At October 31, 2004
(all amounts in thousands)
NOTE 1.–(continued)
Redemption fees: A short-term trading redemption fee may be assessed on any fund shares in a fund account that are sold during the first five (5) New York Stock Exchange trading days following their purchase date. This redemption fee will equal 2% of the amount redeemed and shares held the longest will be treated as being redeemed first and shares held the shortest as being redeemed last. For the year ended October 31, 2004, the Fund received no redemption fees.
Dividend distributions: Distributions to shareholders are recorded on the ex-dividend date and are determined in accordance with Federal income tax regulations which may differ from GAAP.
NOTE 2. RELATED PARTY TRANSACTIONS
AEGON/Transamerica Fund Advisers, Inc. ("ATFA") is the Fund's investment adviser. AEGON/Transamerica Fund Services, Inc. ("ATFS") is the Fund's administrator. AFSG Securities Corp. ("AFSG") is the Fund's distributor/principal underwriter. AEGON/Transamerica Investor Services, Inc. ("ATIS") is the Fund's transfer agent. ATIS and AFSG are 100% owned by AUSA Holding Company ("AUSA"). ATFA is a directly owned subsidiary of Western Reserve Life Assurance Co. of Ohio (78%) ("WRL") and AUSA (22%). ATFS is a wholly owned subsidiary of WRL. AUSA and WRL are wholly owned indirect subsidiaries of AEGON NV, a Netherlands corporation.
ATFA has entered into an agreement with Morningstar Associates, LLC to provide investment services to the Fund. ATFA compensates Morningstar Associates, LLC as described in the Prospectus.
Transamerica Investment Management, LLC and Great Companies, LLC are affiliates of the Fund and are sub-advisers to other funds within Transamerica IDEX Mutual Funds.
Investment advisory fee: The Fund pays management fees to ATFA based on average daily net assets ("ANA") at the following rate:
0.10% of ANA
ATFA has contractually agreed to waive its advisory fee and will reimburse the Fund to the extent that operating expenses, excluding 12b-1 fees, exceed the following stated annual limit:
0.45% Expense Limit
If total fund expenses fall below the annual expense limitation agreement agreed to by the adviser within the succeeding three years, the Fund may be required to pay that adviser a portion or all of the waived advisory fees.
There were no amounts recaptured during the fiscal year ended October 31, 2004.
Distribution and service fees: The Fund has a 12b-1 distribution plan under the 1940 Act pursuant to which an annual fee, based on average daily net assets, is paid to the distributor for various disbursements such as broker-dealer account servicing fees and other promotional expenses of the Fund. The Fund was authorized under the 12b-1 plan to pay fees on each class up to the following limits:
| Class A | | | N/A | | |
| Class B | | | 0.65 | % | |
| Class C | | | 0.65 | % | |
| Class C2 | | | 0.65 | % | |
| Class M | | | 0.55 | % | |
Class C2 and Class M merged into Class C on June 15, 2004 and September 24, 2004, respectively.
In addition, the underlying funds' Class A shares in which the Fund invests impose a 0.35% 12b-1 fee. To avoid duplication of the 12b-1 fees, each class of fund shares of the Fund has reduced the 12b-1 fees by the amount of the underlying funds' Class A 12b-1 fees.
In the case the Fund or a class of shares of the Fund is closed to new investors or investments, the Fund is authorized to pay 12b-1 fees for past sales and distribution efforts and present and past investor services.
Underwriter commissions relate to front-end sales charges imposed for Class A and M shares and contingent deferred sales charges from Classes B, C, M and certain A share redemptions. For the year ended October 31, 2004, the underwriter commissions were as follows:
| Received by Underwriter | | $ | 26,584 | | |
| Retained by Underwriter | | | 1,084 | | |
| Contingent Deferred Sales Charge | | | 861 | | |
Administrative services: The Fund has entered into an agreement with ATFS for financial and legal fund administration services, which includes such items as compliance, expenses, financial statements and other reporting, distributions, tax returns, prospectus preparation, board of trustees meeting support and other legal matters. The Fund pays ATFS an annual fee of 0.015% of average net assets. The Legal fees on the Statement of Operations are for fees paid to external legal counsel.
The Fund paid ATFS $117 for the year ended October 31, 2004.
Transfer agent fees: The Fund pays ATIS an annual per-account charge of $20 (not in thousands) for each open account and $1.63 (not in thousands) for each closed account. There is no new account charge. The transfer agent fees on the Statement of Operations are made up of fees paid to ATIS and costs associated with shareholder statements. The Fund paid ATIS $839 for the year ended October 31, 2004.
Transamerica IDEX Mutual Funds
Annual Report 2004
10
TA IDEX Asset Allocation–Moderate Portfolio
NOTES TO FINANCIAL STATEMENTS (continued)
At October 31, 2004
(all amounts in thousands)
NOTE 2.–(continued)
Deferred compensation plan: Each eligible Fund Trustee may elect participation in the Deferred Compensation Plan ("the Plan"). Under the Plan, such Trustees may defer payment of a percentage of their total fees earned as a Fund Trustee. These deferred amounts may be invested in any Transamerica IDEX Mutual Fund. At October 31, 2004, the value of invested plan amount was $5. Invested plan amounts and the total liability for deferred compensation to the Trustees under the Plan at October 31, 2004, are included in the accompanying Statement of Assets and Liabilities.
NOTE 3. INVESTMENT TRANSACTIONS
The cost of securities purchased and proceeds from securities sold (excluding short-term securities) for the year ended October 31, 2004, were as follows:
| Purchases of securities: | | | |
| Long-Term excluding U.S. Government | | $ | 429,027 | | |
| U.S. Government | | | – | | |
| Proceeds from maturities and sales of securities | | | |
| Long-Term excluding U.S. Government | | | 5,542 | | |
| U.S. Government | | | – | | |
NOTE 4. FEDERAL INCOME TAX MATTERS
The Fund has not made any provision for federal income or excise taxes due to its policy to distribute all of its taxable income and capital gains to its shareholders and otherwise qualify as a regulated investment company under the Internal Revenue Code. Income and capital gain distributions are determined in accordance with income tax regulations, which may differ from GAAP. These differences are primarily due to differing treatment for items including, but not limited to distribution reclass from mutual funds and wash sales.
Reclassifications between Undistributed net investment income (loss), Accumulated net realized capital gains (loss) and Shares of beneficial interest are made to reflect income and gains available for distribution under federal tax regulations. Results of operations and net assets are not effected by these reclassifications. These reclassifications are as follows:
Shares of beneficial interest, unlimited
shares authorized | | $ | – | | |
| Undistributed net investment income (loss) | | | 18,080 | | |
Accumulated net realized gain (loss) from
investment in affiliated mutual funds | | | (18,080 | ) | |
The capital loss carryforward utilized during the year ended October 31, 2004 was $57.
The tax character of distributions paid may differ from the character of distributions shown in the Statements of Changes in Net Assets due to short-term gains being treated as ordinary income for tax purposes. The tax character of distributions paid during 2003 and 2004 was as follows:
| 2003 Distributions paid from: | | | |
| Ordinary Income | | $ | 517 | | |
| Long-term capital gain | | | – | | |
| 2004 Distributions paid from: | | | |
| Ordinary Income | | $ | 6,526 | | |
| Long-term capital gain | | | – | | |
The tax basis components of distributable earnings as of October 31, 2004, are as follows:
| Undistributed Ordinary Income | | $ | 18,282 | | |
| Undistributed Long-term Capital Gains | | $ | 6,053 | | |
| Capital Loss Carryforward | | $ | – | | |
| Net Unrealized Appreciation (Depreciation) | | $ | 83,222 | | |
The aggregate cost of investments and composition of unrealized appreciation (depreciation) for federal income tax purposes as of October 31, 2004, are as follows:
| Federal Tax Cost Basis | | $ | 927,223 | | |
| Unrealized Appreciation | | $ | 83,642 | | |
| Unrealized (Depreciation) | | | (420 | ) | |
| Net Unrealized Appreciation (Depreciation) | | $ | 83,222 | | |
NOTE 5. OTHER MATTERS
Transamerica IDEX Mutual Funds ("TA IDEX"), and certain of its affiliated entities, have received requests for information from the Staff of the Securities and Exchange Commission in connection with market timing and late trading within the funds. TA IDEX and the affiliated entities have voluntarily cooperated in the investigation and have been providing the information as requested.
Transamerica IDEX Mutual Funds
Annual Report 2004
11
Report of Independent Registered Certified Public Accounting Firm
To the Board of Trustees and Shareholders of
TA IDEX Asset Allocation–Moderate Portfolio
In our opinion, the accompanying statement of assets and liabilities, including the schedule of investments, and the related statements of operations and of changes in net assets and the financial highlights present fairly, in all material respects, the financial position of TA IDEX Asset Allocation–Moderate Portfolio (the "Fund") (one of the portfolios constituting the Transamerica IDEX Mutual Funds) at October 31, 2004, the results of its operations for the year then ended, the changes in its net assets for each of the two years in the period then ended and the financial highlights for each of the periods indicated, in conformity with accounting principles generally accepted in the United States of America. These financial statements and financial highlights (hereafter referred to as "financial statements") are the responsibility of the Fund's management; our responsibility is to expres s an opinion on these financial statements based on our audits. We conducted our audits of these financial statements in accordance with the standards of the Public Company Accounting Oversight Board (United States). Those standards require that we plan and perform the audit to obtain reasonable assurance about whether the financial statements are free of material misstatement. An audit includes examining, on a test basis, evidence supporting the amounts and disclosures in the financial statements, assessing the accounting principles used and significant estimates made by management, and evaluating the overall financial statement presentation. We believe that our audits, which included confirmation of securities at October 31, 2004 by correspondence with the custodian and brokers, provide a reasonable basis for our opinion.

PricewaterhouseCoopers LLP
Tampa, Florida
December 28, 2004
Transamerica IDEX Mutual Funds
Annual Report 2004
12
TA IDEX Asset Allocation–Moderate Portfolio
SUPPLEMENTAL INFORMATION
RESULTS OF SHAREHOLDER PROXY (unaudited)
At a special meeting of Class M shareholders of each series of Transamerica IDEX (except TA IDEX Federated Tax Exempt and TA IDEX Protected Principal Stock) held on September 2, 2004, the results of the Proposal were as follows:
Proposal 1: Approval of a conversion of Class M shares into Class C shares of the Funds, which will result in bearing the distribution and service fees payable under the 12b-1 Plan of Distribution for the Class C shares of the Funds.
| For | | Against | | Abstentions/Broker Non-Votes | |
| | 81.69 | % | | | 7.05 | % | | | 11.26 | % | |
Transamerica IDEX Mutual Funds
Annual Report 2004
13
TA IDEX Asset Allocation–Moderate Growth Portfolio
MARKET ENVIRONMENT
The last 12 months were a volatile period in the global securities market, but overall provided solid gains to well-diversified investors. Domestic stocks led the way early in the year, continuing to rally off their 2002 lows, but since then the U.S. stock market has been choppy, with little net change.
The markets indecisiveness seemed driven by a profusion of uncertainty. Economic indicators turned mixed over the summer after seeming to point clearly upward in the spring. The presidential election loomed, with the polls offering little clarity as to which candidate might win. Oil prices hovered near historic highs, and the situation in Iraq remained extremely tense. And amid all this, the Federal Reserve Board ("Fed") raised interest rates three times and signaled more hikes would be on the way.
At least the strong gains early in the year persisted through this uncertainty, with the Standard and Poor's 500 Composite Stock Index ("S&P 500") up 9.41% for the last 12 month period, all of which came in the first five months of the year. The big winners were small-cap stocks, though, with the Standard and Poor's SmallCap 600 Index up nearly 25%.
Interest rates were surprisingly supportive of equity prices. The dominant perception through March was that slow payroll growth would keep a lid on Fed interest rate hikes, and the Madrid terrorist attacks sparked renewed interest in safe Treasuries among both foreign and U.S. investors. However, a much stronger-than-expected March jobs report was the turning point for the bond market, leading to the first sharp upward spike in interest rates. However, since then bonds pulled off an impressive reversal. Even as the Fed raised short rates three times, long-term yields fell and the yield curve flattened through the summer and fall. Over the 12-month period, the Lehman Brothers Aggregate Bond Index managed a 5.53% gain, and the equity sensitive Lehman Brothers High Yield Index gained 12.32%.
Many of the same market trends were evident in foreign markets. Gains were well distributed across foreign markets, consistent with the view of an improving world economy. In addition, unhedged foreign funds and indexes were buoyed by generally strong foreign currencies relative to the dollar, with the Morgan Stanley Capital International (EAFE) Index ("MSCI EAFE") up more than 19% converted back into dollar terms.
PERFORMANCE
For the year ended October 31, 2004, TA IDEX Asset Allocation– Moderate Growth Portfolio, Class A returned 9.09%. By comparison its benchmark, the Dow Jones Wilshire 5000 Market Index ("DJ Wilshire 5000"), returned 8.26%.
STRATEGY REVIEW
How did you manage the portfolio in this market environment?
Persistent diversification was the guiding principle behind TA IDEX Asset Allocation–Moderate Growth Portfolio's management. And it was the diversifying asset classes that paid off. The portfolio performed well relative to its benchmark and peers. The portfolio's A share class was up 9.09% over the last 12 months, landing in the top quartile of Morningstar's Moderate Allocation category.
The portfolio benefited strongly from its exposure to small and mid-cap stocks over this period, as those were the strongest performing parts of the domestic equity market. Over the course of the year, cash flows into the portfolio were generally used to increase the portfolio's exposure to large-cap value stocks.
How did credit quality and duration impact the portfolio?
The portfolio's 20% stake in fixed-income did well due to its exposure to credit-sensitive bonds, such as convertibles and high-yield. The best fixed-income performer was the 4% stake in Transamerica Convertible Securities, which gained 7.06%. Transamerica Conservative High Yield, amounting to 5.7% of assets, added a gain of 9.23%. The portfolio also profited substantially from its exposure to inflation-protected securities, as real rates declined more than nominal rates. PIMCO Real Return TIPS, the portfolio's largest bond holding with 7% of assets managed a 7.94% gain, beating the PIMCO Total Return, which amounts to just 2.5% of assets by over 3%. All three of the portfolio's largest bond holdings, amounting to 80% of fixed-income assets substantially outperformed the Lehman Brothers Aggregate Bond Index's gain of 5.53% for the period.
Over the course of the year the portfolio's exposure to credit-sensitive bonds was gradually reduced, because those sectors have rallied so strongly since late 2002. Instead those assets were directed into the PIMCO Real Return TIPS.
Which individual holdings had the greatest positive impact on performance?
The portfolio's niche equity holdings paid off well. TA IDEX Transamerica Small/Mid Cap Value added 20.61%; and TA IDEX Clarion Real Estate Securities gained 29.30%. These two winners accounted for 11% of the portfolio's total net assets at the end of October.
Which individual holdings had the greatest negative impact on performance?
The portfolio's international equity exposure should have helped more than it did. TA IDEX American Century International, the portfolio's largest international equity holding and the only pure international investment available in the TA IDEX lineup, gained 9.95% over the last 12 months, though its MSCI EAFE benchmark added 19.27%. As a result of the portfolio's persistent underperformance, that investment was gradually reduced over the course of the year to 6.5% of assets at the end of October, which helped reduce the negative effect of TA IDEX American Century International's underperformance to a limited extent.
Salomon All-Cap, the largest equity holding in the lineup at 13% of assets, underperformed the S&P 500 by almost 3.5%.
T. Rowe Price Small Cap underperformed the DJ Wilshire 5000 by over 600 basis points for the period. However, since it had little more than 4% of total net assets, it did not have a large negative impact on performance.
Which sectors/industries had the greatest impact on performance?
The portfolio had 2.70% of total assets in TA IDEX Clarion Real Estate Securities, which primarily owns real estate investment trusts ("REITs"). The real estate sector was one of the best performing sectors across the U.S. stock market, and as a result TA IDEX Clarion Real Estate Securities was up 29.30% for the period.
Which countries had the greatest impact on performance?
Because of the poor relative performance of TA IDEX American Century International, over the course of the year this fund's foreign exposure was reduced to significantly below its target level. The largest international exposure of the fund was to the eurozone.
Investment Committee
AEGON/Transamerica Fund Advisers, Inc.
Transamerica IDEX Mutual Funds
Annual Report 2004
1
TA IDEX Asset Allocation–Moderate Growth Portfolio
Comparison of change in value of $10,000 investment in Class A shares and its comparative index.

Average Annual Total Return for Periods Ended 10/31/04
| | | 1 year | | From
Inception | | Inception
Date | |
| Class A (NAV) | | | 9.09 | % | | | 4.06 | % | | 3/1/02 | |
| Class A (POP) | | | 3.09 | % | | | 1.88 | % | | 3/1/02 | |
| DJ Wilshire 50001 | | | 8.26 | % | | | 2.61 | % | | 3/1/02 | |
| Class B (NAV) | | | 8.25 | % | | | 3.36 | % | | 3/1/02 | |
| Class B (POP) | | | 3.25 | % | | | 2.29 | % | | 3/1/02 | |
| Class C (NAV) | | | 8.35 | % | | | 14.98 | % | | 11/11/02 | |
| Class C (POP) | | | 7.35 | % | | | 14.98 | % | | 11/11/02 | |
NOTES
1 The Dow Jones Wilshire 5000 Total Market (DJ Wilshire 5000) Index is an unmanaged index used as a general measure of market performance. Calculations assume dividends and capital gains are reinvested and do not include any managerial expenses. From inception calculation is based on life of Class A shares. Source: Standard & Poor's Micropal®© Micropal, Inc. 2004 – 1-800-596-5323 – http://www.micropal.com.
The performance data presented represents past performance, future results may vary. Performance data does not reflect the deduction of taxes that would be paid on fund distributions or the redemption of fund shares. Investment return and principal value will fluctuate so that an investor's shares, when redeemed, may be worth more or less than their original cost. Current performance may be lower or higher than performance quoted.
Public Offering Price (POP) returns include the reinvestment of dividends and capital gains and reflect the maximum sales charge of 5.5% for A shares or the maximum applicable contingent deferred sales charge (5% in the 1st year, decreasing to 0% after 6 years) for Class B shares and 1% (during the first 12) months for Class C shares. Shares purchased prior to March 1, 2004 are subject to a maximum applicable contingent deferred sales charge (5% in the 1st year, decreasing to 0% after 7 years) for Class B shares and (2% in the 1st year, decreasing to 0% after 2 years) for Class C shares. Class C shares do not impose a sales charge. Net Asset Value (NAV) returns include the reinvestment of dividends and capital gains but do not reflect any sales charges.
This material must be preceded or accompanied by a current prospectus, which includes specific contents regarding the investment objectives and policies of this fund.
Transamerica IDEX Mutual Funds
Annual Report 2004
2
TA IDEX Asset Allocation–Moderate Growth Portfolio
UNDERSTANDING YOUR FUND'S EXPENSES (unaudited)
SHAREHOLDER EXPENSES
The following Example is intended to help you understand your ongoing costs (in dollars and cents) of investing in a Fund and to compare these costs with the ongoing costs of investing in other funds.
The Example is based on an investment of $1,000 invested at the beginning of the period and held for the entire period from May 1, 2004 to October 31, 2004.
ACTUAL EXPENSES
The first line in the table below provides information about actual account values and actual expenses. You may use the information in this line, together with the amount you invested, to estimate the expenses that you paid over the period. Simply divide your account value by $1,000 (for example, an $8,600 account value divided by $1,000 = 8.6), then multiply the result by the number in the first line of your Fund under the heading entitled "Expenses Paid During Period" to estimate the expenses you paid on your account during this period.
HYPOTHETICAL EXAMPLE FOR COMPARISON PURPOSES
The second line in the table below provides information about hypothetical account values and hypothetical expenses based on each Fund's actual expense ratio and an assumed rate of return of 5% per year before expenses, which is not the Fund's actual return. The hypothetical account values and expenses may not be used to estimate the actual ending account balance or expenses you paid for the period. You may use this information to compare the ongoing costs of investing in your Fund and other funds. To do so, compare this 5% hypothetical example with the 5% hypothetical examples that appear in the shareholder reports of the other funds.
Please note that the expenses shown in the table are meant to highlight your ongoing costs only and do not reflect any transactional costs, such as sales charges, redemption fees, brokerage commissions paid on purchases and sales of fund shares. Therefore, the second line under each Fund in the table is useful in comparing ongoing costs only, and will not help you determine the relative total costs of owning different funds. In addition, note that the expenses shown in the table are meant to highlight your ongoing costs and do not reflect any transaction costs.
| | | Beginning
Account
Value | | Ending
Account
Value | | Annualized
Expense
Ratio | | Expenses Paid
During Period (a) | |
| Class A | |
| Actual | | $ | 1,000.00 | | | $ | 1,024.30 | | | | 0.38 | % | | $ | 1.93 | | |
| Hypothetical (b) | �� | | 1,000.00 | | | | 1,023.23 | | | | 0.38 | | | | 1.93 | | |
| Class B | |
| Actual | | | 1,000.00 | | | | 1,020.60 | | | | 1.05 | | | | 5.33 | | |
| Hypothetical (b) | | | 1,000.00 | | | | 1,019.86 | | | | 1.05 | | | | 5.33 | | |
| Class C | |
| Actual | | | 1,000.00 | | | | 1,021.50 | | | | 0.95 | | | | 4.83 | | |
| Hypothetical (b) | | | 1,000.00 | | | | 1,020.36 | | | | 0.95 | | | | 4.82 | | |
(a) Expenses are calculated using each Fund's annualized expense ratio (as disclosed in the table), multiplied by the average account value for the period, multiplied by number of days in the period (184 days), and divided by the number of days in the year (366 days).
(b) 5% return per year before expenses
GRAPHIC PRESENTATION OF SCHEDULE OF INVESTMENTS
By Asset Type
At October 31, 2004
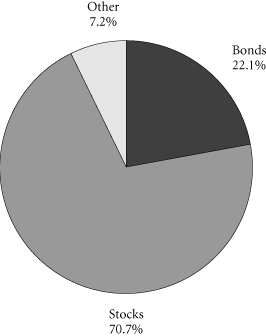
This chart shows the percentage breakdown by asset type of the Fund's total investment securities. Asset type is based on the aggregate portfolio holdings in the underlying funds in which the Fund invests. The security lending collateral in the underlying funds is excluded from this calculation.
Transamerica IDEX Mutual Funds
Annual Report 2004
3
TA IDEX Asset Allocation–Moderate Growth Portfolio
SCHEDULE OF INVESTMENTS
At October 31, 2004
(all amounts except share amounts in thousands)
| | | Shares | | Value | |
| INVESTMENT COMPANIES (99.7%) (b) | | | |
| Agressive Equity (22.7%) | | | |
| TA IDEX T. Rowe Price Health Sciences | | | 5,436,039 | | | $ | 58,927 | | |
| TA IDEX T. Rowe Price Small Cap (a) | | | 5,033,212 | | | | 54,560 | | |
TA IDEX Transamerica Growth
Opportunities (a) | | | 11,903,561 | | | | 78,682 | | |
TA IDEX Transamerica
Small/Mid Cap Value | | | 8,163,986 | | | | 116,908 | | |
| Capital Preservation (2.5%) | | | |
| TA IDEX Transamerica Money Market | | | 33,797,735 | | | | 33,798 | | |
| Fixed-Income (20.7%) | | | |
| TA IDEX PIMCO Real Return TIPS | | | 9,312,702 | | | | 97,597 | | |
| TA IDEX PIMCO Total Return | | | 3,346,444 | | | | 35,071 | | |
TA IDEX Transamerica Conservative
High-Yield Bond | | | 8,270,734 | | | | 77,497 | | |
TA IDEX Transamerica Convertible
Securities | | | 5,205,944 | | | | 57,265 | | |
| TA IDEX Transamerica Flexible Income | | | 1,471,479 | | | | 14,244 | | |
| Growth Equity (41.7%) | | | |
TA IDEX American Century Large
Company Value | | | 8,509,907 | | | | 86,801 | | |
TA IDEX Great
Companies–TechnologySM (a) | | | 12,767,853 | | | | 48,518 | | |
| TA IDEX Janus Growth | | | 1,780,344 | | | | 38,384 | | |
| | | Shares | | Value | |
| Growth Equity (continued) | |
| TA IDEX Jennison Growth (a) | | | 22,211 | | | $ | 211 | | |
| TA IDEX Marsico Growth (a) | | | 1,508,041 | | | | 13,799 | | |
| TA IDEX Salomon All Cap (a) | | | 11,910,242 | | | | 176,272 | | |
| TA IDEX Salomon Investors Value | | | 12,228,914 | | | | 162,644 | | |
| TA IDEX Transamerica Equity | | | 5,481,490 | | | | 40,837 | | |
| Speciality–Real Estate (2.7%) | |
| TA IDEX Clarion Real Estate Securities | | | 2,641,615 | | | | 36,930 | | |
| World Equity (9.4%) | |
TA IDEX American Century
International | | | 10,085,612 | | | | 88,854 | | |
TA IDEX Templeton Great
Companies Global (a) | | | 1,761,941 | | | | 39,820 | | |
| Total Investment Companies (cost: $1,258,714) | | | | | | | 1,357,619 | | |
| Total Investment Securities (cost: $1,258,714) | | | | | | $ | 1,357,619 | | |
| SUMMARY: | |
| Investments, at value | | | 99.7 | % | | $ | 1,357,619 | | |
| Other assets in excess of liabilities | | | 0.3 | % | | | 4,328 | | |
| Net assets | | | 100.0 | % | | $ | 1,361,947 | | |
NOTES TO SCHEDULE OF INVESTMENTS:
(a) No dividends were paid during the preceding twelve months.
(b) The Fund invests its assets in Class A shares of the underlying TA IDEX Mutual Funds, which are affiliates of the Fund.
The notes to the financial statements are an integral part of this report.
Transamerica IDEX Mutual Funds
Annual Report 2004
4
TA IDEX Asset Allocation–Moderate Growth Portfolio
STATEMENT OF ASSETS AND LIABILITIES
At October 31, 2004
(all amounts except per share amounts in thousands)
| Assets: | | | |
Investment in affiliated mutual funds, at value
(cost: $1,258,714) | | $ | 1,357,619 | | |
| Cash | | | 1,161 | | |
| Receivables: | |
| Shares of beneficial interest sold | | | 7,303 | | |
| Interest | | | 1 | | |
| Other | | | 15 | | |
| | | | 1,366,099 | | |
| Liabilities: | | | |
| Investment securities purchased | | | 1,161 | | |
| Accounts payable and accrued liabilities: | |
| Shares of beneficial interest redeemed | | | 1,712 | | |
| Management and advisory fees | | | 205 | | |
| Distribution fees | | | 545 | | |
| Transfer agent fees | | | 293 | | |
| Other | | | 236 | | |
| | | | 4,152 | | |
| Net Assets | | $ | 1,361,947 | | |
| Net Assets Consist of: | | | |
Shares of beneficial interest, unlimited shares
authorized, no par value | | $ | 1,243,253 | | |
| Undistributed net investment income (loss) | | | 13,420 | | |
Accumulated net realized gain (loss) from investment
in affiliated mutual funds | | | 6,370 | | |
Net unrealized appreciation (depreciation) on
investment in affiliated mutual funds | | | 98,904 | | |
| Net Assets | | $ | 1,361,947 | | |
| Net Assets by Class: | | | |
| Class A | | $ | 352,852 | | |
| Class B | | | 333,533 | | |
| Class C | | | 675,562 | | |
| Shares Outstanding: | | | |
| Class A | | | 32,171 | | |
| Class B | | | 30,592 | | |
| Class C | | | 61,926 | | |
| Net Asset Value Per Share: | | | |
| Class A | | $ | 10.97 | | |
| Class B | | | 10.90 | | |
| Class C | | | 10.91 | | |
| Maximum Offering Price Per Share (a): | | | |
| Class A | | $ | 11.61 | | |
(a) Includes the maximum selling commission (represented as a percentage of offering price) which is reduced on certain levels of sales as set forth in the Prospectus. Net asset value per share for Classes B and C shares represents offering price. The redemption price for Classes B and C shares equals net asset value less any applicable contingent deferred sales charge.
STATEMENT OF OPERATIONS
For the year ended October 31, 2004
(all amounts in thousands)
| Investment Income: | | | |
| Interest | | $ | 9 | | |
| Dividends from affiliated mutual funds | | | 8,152 | | |
| | | | 8,161 | | |
| Expenses: | | | |
| Management and advisory fees | | | 1,054 | | |
| Transfer agent fees | |
| Class A | | | 364 | | |
| Class B | | | 432 | | |
| Class C | | | 489 | | |
| Class C2 | | | 13 | | |
| Class M | | | 13 | | |
| Printing and shareholder reports | | | 54 | | |
| Custody fees | | | 51 | | |
| Administration fees | | | 148 | | |
| Legal fees | | | 32 | | |
| Audit and accounting fees | | | 28 | | |
| Trustees fees | | | 56 | | |
| Registration fees | |
| Class A | | | 88 | | |
| Class B | | | 58 | | |
| Class C | | | 98 | | |
| Class C2 | | | 4 | | |
| Class M | | | 3 | | |
| Other | | | 29 | | |
| Distribution and service fees: | |
| Class B | | | 1,809 | | |
| Class C | | | 3,112 | | |
| Class C2 | | | 136 | | |
| Class M | | | 100 | | |
| Total expenses before recapture of waived expenses | | | 8,171 | | |
| Recaptured expenses | | | 79 | | |
| Net expenses | | | 8,250 | | |
| Net Investment Income (Loss) | | | (89 | ) | |
| Net Realized and Unrealized Gain (Loss): | | | |
Realized gain (loss) from investment in affiliated
mutual funds | | | 171 | | |
Realized gain distributions from investments in
affiliated mutual funds | | | 23,217 | | |
Increase (decrease) in unrealized appreciation
(depreciation) on investment in affiliated
mutual funds | | | 43,855 | | |
Net Gain (Loss) on Investments in Affiliated
Mutual Funds | | | 67,243 | | |
Net Increase (Decrease) in Net Assets Resulting
from Operations | | $ | | 67,154 | |
The notes to the financial statements are an integral part of this report.
Transamerica IDEX Mutual Funds
Annual Report 2004
5
TA IDEX Asset Allocation–Moderate Growth Portfolio
STATEMENTS OF CHANGES IN NET ASSETS
For the years ended
(all amounts in thousands)
| | | October 31,
2004 | | October 31,
2003 | |
| Increase (Decrease) in Net Assets From: | |
| Operations: | |
| Net investment income (loss) | | $ | (89 | ) | | $ | (95 | ) | |
Net realized gain (loss) from
investment in affiliated
mutual funds | | | 23,388 | | | | 26 | | |
Net unrealized appreciation
(depreciation) on investment
in affiliated mutual funds | | | 43,855 | | | | 60,689 | | |
| | | | 67,154 | | | | 60,620 | | |
| Distributions to Shareholders: | |
| From net investment income: | |
| Class A | | | (1,243 | ) | | | (161 | ) | |
| Class B | | | (452 | ) | | | (6 | ) | |
| Class C | | | (639 | ) | | | (1 | ) | |
| Class C2 | | | (66 | ) | | | (3 | ) | |
| Class M | | | (55 | ) | | | (15 | ) | |
| | | | (2,455 | ) | | | (186 | ) | |
| Capital Share Transactions: | |
| Proceeds from shares sold: | |
| Class A | | | 244,152 | | | | 113,138 | | |
| Class B | | | 153,748 | | | | 147,200 | | |
| Class C | | | 410,207 | | | | 227,401 | | |
| Class C2 | | | 6,869 | | | | 14,858 | | |
| Class M | | | 4,667 | | | | 6,649 | | |
| | | | 819,643 | | | | 509,246 | | |
Dividends and distributions
reinvested: | |
| Class A | | | 1,112 | | | | 148 | | |
| Class B | | | 375 | | | | 6 | | |
| Class C | | | 455 | | | | 1 | | |
| Class C2 | | | 49 | | | | 2 | | |
| Class M | | | 51 | | | | 14 | | |
| | | | 2,042 | | | | 171 | | |
| Cost of shares redeemed: | |
| Class A | | | (44,420 | ) | | | (9,689 | ) | |
| Class B | | | (29,188 | ) | | | (11,490 | ) | |
| Class C | | | (57,323 | ) | | | (7,570 | ) | |
| Class C2 | | | (3,856 | ) | | | (7,390 | ) | |
| Class M | | | (3,241 | ) | | | (4,373 | ) | |
| | | | (138,028 | ) | | | (40,512 | ) | |
| Class level exchanges: | |
| Class C | | | 55,381 | | | | – | | |
| Class C2 | | | (34,726 | ) | | | – | | |
| Class M | | | (20,655 | ) | | | – | | |
| | | | – | | | | – | | |
| | | October 31,
2004 | | October 31,
2003 | |
| Automatic conversions: | |
| Class A | | | 128 | | | | – | | |
| Class B | | | (128 | ) | | | – | | |
| | | | – | | | | – | | |
| | | | 683,657 | | | | 468,905 | | |
| Net increase (decrease) in net assets | | | 748,356 | | | | 529,339 | | |
| Net Assets: | | | |
| Beginning of year | | | 613,591 | | | | 84,252 | | |
| End of year | | $ | 1,361,947 | | | $ | 613,591 | | |
Undistributed Net Investment Income
(Loss) | | $ | 13,420 | | | $ | – | | |
| Share Activity: | | | |
| Shares issued: | |
| Class A | | | 22,751 | | | | 12,021 | | |
| Class B | | | 14,399 | | | | 16,189 | | |
| Class C | | | 38,386 | | | | 24,504 | | |
| Class C2 | | | 646 | | | | 1,666 | | |
| Class M | | | 439 | | | | 745 | | |
| | | | 76,621 | | | | 55,125 | | |
Shares issued–reinvested from
distributions: | |
| Class A | | | 107 | | | | 17 | | |
| Class B | | | 36 | | | | 1 | | |
| Class C | | | 44 | | | | – | | |
| Class C2 | | | 5 | | | | – | | |
| Class M | | | 5 | | | | 2 | | |
| | | | 197 | | | | 20 | | |
| Shares redeemed: | |
| Class A | | | (4,149 | ) | | | (1,058 | ) | |
| Class B | | | (2,732 | ) | | | (1,280 | ) | |
| Class C | | | (5,358 | ) | | | (805 | ) | |
| Class C2 | | | (359 | ) | | | (851 | ) | |
| Class M | | | (303 | ) | | | (481 | ) | |
| | | | (12,901 | ) | | | (4,475 | ) | |
| Class level exchanges: | |
| Class C | | | 5,155 | | | | – | | |
| Class C2 | | | (3,233 | ) | | | – | | |
| Class M | | | (1,920 | ) | | | – | | |
| | | | 2 | | | | – | | |
| Automatic conversions: | |
| Class A | | | 12 | | | | – | | |
| Class B | | | (12 | ) | | | – | | |
| | | | – | | | | – | | |
Net increase (decrease) in shares
outstanding: | |
| Class A | | | 18,721 | | | | 10,980 | | |
| Class B | | | 11,692 | | | | 14,910 | | |
| Class C | | | 38,227 | | | | 23,699 | | |
| Class C2 | | | (2,942 | ) | | | 815 | | |
| Class M | | | (1,779 | ) | | | 266 | | |
| | | | 63,919 | | | | 50,670 | | |
The notes to the financial statements are an integral part of this report.
Transamerica IDEX Mutual Funds
Annual Report 2004
6
TA IDEX Asset Allocation–Moderate Growth Portfolio
FINANCIAL HIGHLIGHTS
| | | | | For a share of beneficial interest outstanding throughout each period | |
| | | | | Net Asset | | Investment Operations | | Distributions | | Net Asset | |
| | | For the
Period
Ended (d)(g) | | Value,
Beginning
of Period | | Net
Investment
Income (Loss) | | Net Realized
and Unrealized
Gain (Loss) | | Total
Operations | | From Net
Investment
Income | | From Net
Realized
Gains | | Total
Distributions | | Value,
End
of Period | |
| Class A | | 10/31/2004 | | $ | 10.13 | | | $ | 0.05 | | | $ | 0.87 | | | $ | 0.92 | | | $ | (0.08 | ) | | $ | – | | | $ | (0.08 | ) | | $ | 10.97 | | |
| | | 10/31/2003 | | | 8.37 | | | | 0.04 | | | | 1.77 | | | | 1.81 | | | | (0.05 | ) | | | – | | | | (0.05 | ) | | | 10.13 | | |
| | | 10/31/2002 | | | 10.00 | | | | 0.02 | | | | (1.65 | ) | | | (1.63 | ) | | | – | | | | – | | | | – | | | | 8.37 | | |
| Class B | | 10/31/2004 | | | 10.09 | | | | (0.02 | ) | | | 0.85 | | | | 0.83 | | | | (0.02 | ) | | | – | | | | (0.02 | ) | | | 10.90 | | |
| | | 10/31/2003 | | | 8.33 | | | | (0.02 | ) | | | 1.78 | | | | 1.76 | | | | – | | | | – | | | | – | | | | 10.09 | | |
| | | 10/31/2002 | | | 10.00 | | | | (0.01 | ) | | | (1.66 | ) | | | (1.67 | ) | | | – | | | | – | | | | – | | | | 8.33 | | |
| Class C | | 10/31/2004 | | | 10.09 | | | | (0.02 | ) | | | 0.86 | | | | 0.84 | | | | (0.02 | ) | | | – | | | | (0.02 | ) | | | 10.91 | | |
| | | 10/31/2003 | | | 8.31 | | | | (0.02 | ) | | | 1.80 | | | | 1.78 | | | | – | | | | – | | | | – | | | | 10.09 | | |
| | | | | | | Ratios/Supplemental Data | |
| | | For the
Period | | Total | | Net Assets,
End of
Period | | Ratio of Expenses
to Average
Net Assets (a) | | Net Investment
Income (Loss)
to Average | | Portfolio
Turnover | |
| | | Ended (g) | | Return (c) | | (000's) | | Net (e) | | Total (f) | | Net Assets (a) | | Rate (b) | |
| Class A | | 10/31/2004 | | | 9.09 | % | | $ | 352,852 | | | | 0.32 | % | | | 0.31 | % | | | 0.45 | % | | | 3 | % | |
| | | 10/31/2003 | | | 21.79 | | | | 136,295 | | | | 0.44 | | | | 0.44 | | | | 0.48 | | | | 15 | | |
| | | 10/31/2002 | | | (16.30 | ) | | | 20,681 | | | | 0.45 | | | | 0.90 | | | | 0.41 | | | | 21 | | |
| Class B | | 10/31/2004 | | | 8.25 | | | | 333,533 | | | | 0.97 | | | | 0.96 | | | | (0.19 | ) | | | 3 | | |
| | | 10/31/2003 | | | 21.15 | | | | 190,621 | | | | 1.09 | | | | 1.09 | | | | (0.17 | ) | | | 15 | | |
| | | 10/31/2002 | | | (16.70 | ) | | | 33,241 | | | | 1.10 | | | | 1.55 | | | | (0.24 | ) | | | 21 | | |
| Class C | | 10/31/2004 | | | 8.35 | | | | 675,562 | | | | 0.92 | | | | 0.91 | | | | (0.15 | ) | | | 3 | | |
| | | 10/31/2003 | | | 21.44 | | | | 239,043 | | | | 1.09 | | | | 1.09 | | | | (0.17 | ) | | | 15 | | |
NOTES TO FINANCIAL HIGHLIGHTS
(a) Annualized.
(b) Not annualized for periods of less than one year.
(c) Total Return has been calculated for the applicable period without deduction of a sales load, if any, on an initial purchase. Periods of less that one year are not annualized.
(d) Per share information is calculated based on average number of shares outstanding.
(e) Ratio of Net Expenses to Average Net Assets is net of fee waivers and reimbursements by the investment adviser, if any and includes the recapture of previously waived expenses (see note 2).
(f) Ratio of Total Expenses to Average Net Assets includes all expenses before fee waivers, reimbursements by the investment adviser and recapture of previously waived expenses.
(g) TA IDEX Asset Allocation–Moderate Growth Portfolio ("the Fund") commenced operations on March 1, 2002. The inception date for the Fund's offering of share Class L was November 11, 2002. Class L was renamed Class C on March 1, 2004. (see note 1).
The notes to the financial statements are an integral part of this report.
Transamerica IDEX Mutual Funds
Annual Report 2004
7
TA IDEX Asset Allocation–Moderate Growth Portfolio
NOTES TO FINANCIAL STATEMENTS
At October 31, 2004
(all amounts in thousands)
NOTE 1. ORGANIZATION AND SIGNIFICANT ACCOUNTING POLICIES
Transamerica IDEX Mutual Funds, formerly IDEX Mutual Funds, is a Massachusetts business trust registered under the Investment Company Act of 1940, as amended (the "1940 Act"), as an open-end management investment company. TA IDEX Asset Allocation–Moderate Growth Portfolio ("the Fund"), part of Transamerica IDEX Mutual Funds, began operations on March 1, 2002.
On March 1, 2004, the Fund changed its name from IDEX Asset Allocation–Moderate Growth Portfolio to TA IDEX Asset Allocation–Moderate Growth Portfolio.
In the normal course of business, the Fund enters into contracts that contain a variety of representations and warranties, which provide general indemnifications. The Fund's maximum exposure under these arrangements is unknown, as this would involve future claims that may be made against the Fund and/or its affiliates that have not yet occurred. However, based on experience, the Fund expects the risk of loss to be remote.
See the Prospectus and Statement of Additional Information for a description of the Fund's investment objective.
In preparing the Fund's financial statements in accordance with accounting principles generally accepted in the United States of America ("GAAP"), estimates or assumptions (which could differ from actual results) may be used that affect reported amounts and disclosures. The following policies were consistently followed by the Fund, in accordance with GAAP.
Multiple class operations and expenses: The Fund currently offers three classes of shares, each with a public offering price that reflects different sales charges, if any, and expense levels. All shares designated as Class C shares prior to March 1, 2004, were renamed as Class C2 shares on that date. All shares designated as Class L shares prior to March 1, 2004, were renamed as Class C shares with different sales charges than the previous Class L shares. On June 15, 2004, Class C2 shares merged into Class C. On September 24, 2004, Class M shares merged into Class C. Class B shares will convert to class A shares eight years after purchase. Income, non-class specific expenses and realized and unrealized gains and losses, are allocated daily to each class, based upon the value of shares outstanding method as permitted under Rule 18f-3 of the 1940 Act. Each class bears its own specific expenses as well as a portion of general, common expenses.
Pricing of shares: The Fund prices its shares on the basis of the net asset value of each class of shares of the Fund, which is determined as of the close of the New York Stock Exchange ("NYSE") (generally 4:00 p.m. Eastern Time) on each day on which the NYSE is open for trading (other than a day on which there are insufficient changes in the value of the Fund's portfolio securities to materially affect the Fund's net asset value or a day on which no shares are tendered for redemption and no order to purchase any shares is received).
Security valuations: The Fund's investments are valued at the net asset values of the underlying portfolios of Transamerica IDEX Mutual Funds. The net asset values of the underlying portfolios are determined at the close of the NYSE (generally 4:00 p.m. eastern time) on the valuation date.
Cash: The Fund may leave cash overnight in its cash account with the custodian, Investors Bank & Trust Company ("IBT"). IBT has been contracted on behalf of the Fund to invest the excess cash into a savings account, which at October 31, 2004, was paying an interest rate of 1.30%.
Throughout the year, the Fund may have a cash overdraft balance. A fee is incurred on this overdraft, calculated by multiplying the overdraft by a rate based on the federal funds rate. This fee is included in Custody fees in the Statement of Operations.
Security transactions and investment income: Security transactions are recorded on the trade date. Security gains and losses are calculated on the specific identification basis. Interest income, including accretion of discounts and amortization of premiums, is recorded on the accrual basis commencing on the settlement date. Dividend income is recorded on the ex-dividend date, dividends and net realized gain (loss) from investment securities for the Fund are from investments in shares of affiliated companies.
Account maintenance fees: If the shareholder account balance falls below $1 by either shareholder action or as a result of market action, a $25 (not in thousands) fee is assessed every year until the balance reaches $1. The fee is assessed by redeeming shares in the shareholder's account.
No fee will be charged under the following conditions:
• accounts opened within the preceding 24 months
• accounts with an active monthly Automatic Investment Plan ($50 (not in thousands) minimum per fund)
• accounts owned by an individual which, when combined by social security number, have a balance of $5 or more
• accounts owned by individuals in the same household (by address) that have a combined balance of $5 or more
• UTMA/UGMA accounts
• Fiduciary accounts
• B-share accounts whose shares have started to convert to A-shares accounts (as long as combined value of both accounts is at least $1)
For the year ended October 31, 2004, this fee totaled less than $1. These fees are included in Paid in Capital in the Statement of Assets and Liabilities.
Transamerica IDEX Mutual Funds
Annual Report 2004
8
TA IDEX Asset Allocation–Moderate Growth Portfolio
NOTES TO FINANCIAL STATEMENTS (continued)
At October 31, 2004
(all amounts in thousands)
NOTE 1.–(continued)
Redemption fees: A short-term trading redemption fee may be assessed on any fund shares in a fund account that are sold during the first five (5) New York Stock Exchange trading days following their purchase date. This redemption fee will equal 2% of the amount redeemed and shares held the longest will be treated as being redeemed first and shares held the shortest as being redeemed last. For the year ended October 31, 2004, the Fund received no redemption fees.
Dividend distributions: Distributions to shareholders are recorded on the ex-dividend date and are determined in accordance with Federal income tax regulations which may differ from GAAP.
NOTE 2. RELATED PARTY TRANSACTIONS
AEGON/Transamerica Fund Advisers, Inc. ("ATFA") is the Fund's investment adviser. AEGON/Transamerica Fund Services, Inc. ("ATFS") is the Fund's administrator. AFSG Securities Corp. ("AFSG") is the Fund's distributor/principal underwriter. AEGON/Transamerica Investor Services, Inc. ("ATIS") is the Fund's transfer agent. ATIS and AFSG are 100% owned by AUSA Holding Company ("AUSA"). ATFA is a directly owned subsidiary of Western Reserve Life Assurance Co. of Ohio (78%) ("WRL") and AUSA (22%). ATFS is a wholly owned subsidiary of WRL. AUSA and WRL are wholly owned indirect subsidiaries of AEGON NV, a Netherlands corporation.
ATFA has entered into an agreement with Morningstar Associates, LLC to provide investment services to the Fund. ATFA compensates Morningstar Associates, LLC as described in the Prospectus.
Transamerica Investment Management, LLC and Great Companies, LLC are affiliates of the Fund and are sub-advisers to other funds within Transamerica IDEX Mutual Funds.
Investment advisory fee: The Fund pays management fees to ATFA based on average daily net assets ("ANA") at the following rate:
0.10% of ANA
ATFA has contractually agreed to waive its advisory fee and will reimburse the Fund to the extent that operating expenses, excluding 12b-1 fees, exceed the following stated annual limit:
0.45% Expense Limit
If total fund expenses fall below the annual expense limitation agreement agreed to by the adviser within the succeeding three years, the Fund may be required to pay that adviser a portion or all of the waived advisory fees.
| | | Expense
Recaptured
by Advisor | | Increase in
Expense to
Average Net Assets | |
| Recaptured in 2004 | | | 79 | | | | 0.01 | % | |
There are no other expenses subject to recapture at October 31, 2004.
Distribution and service fees: The Fund has a 12b-1 distribution plan under the 1940 Act pursuant to which an annual fee, based on average daily net assets, is paid to the distributor for various disbursements such as broker-dealer account servicing fees and other promotional expenses of the Fund. The Fund was authorized under the 12b-1 plan to pay fees on each class up to the following limits:
| Class A | | | N/A | | |
| Class B | | | 0.65 | % | |
| Class C | | | 0.65 | % | |
| Class C2 | | | 0.65 | % | |
| Class M | | | 0.55 | % | |
Class C2 and Class M merged into Class C on June 15, 2004 and September 24, 2004, respectively.
In addition, the underlying funds' Class A shares in which the Fund invests impose a 0.35% 12b-1 fee. To avoid duplication of the 12b-1 fees, each class of fund shares of the Fund has reduced the 12b-1 fees by the amount of the underlying funds' Class A 12b-1 fees.
In the case the Fund or a class of shares of the Fund is closed to new investors or investments, the Fund is authorized to pay 12b-1 fees for past sales and distribution efforts and present and past investor services.
Underwriter commissions relate to front-end sales charges imposed for Class A and M shares and contingent deferred sales charges from Classes B, C, M and certain A share redemptions. For the year ended October 31, 2004, the underwriter commissions were as follows:
| Received by Underwriter | | $ | 44,890 | | |
| Retained by Underwriter | | | 1,946 | | |
| Contingent Deferred Sales Charge | | | 960 | | |
Administrative services: The Fund has entered into an agreement with ATFS for financial and legal fund administration services, which includes such items as compliance, expenses, financial statements and other reporting, distributions, tax returns, prospectus preparation, board of trustees meeting support and other legal matters. The Fund pays ATFS an annual fee of 0.015% of average net assets. The Legal fees on the Statement of Operations are for fees paid to external legal counsel.
The Fund paid ATFS $148 for the year ended October 31, 2004.
Transfer agent fees: The Fund pays ATIS an annual per-account charge of $20 (not in thousands) for each open account and $1.63 (not in thousands) for each closed account. There is no new account charge. The transfer agent fees on the Statement of Operations are made up of
Transamerica IDEX Mutual Funds
Annual Report 2004
9
TA IDEX Asset Allocation–Moderate Growth Portfolio
NOTES TO FINANCIAL STATEMENTS (continued)
At October 31, 2004
(all amounts in thousands)
NOTE 3. INVESTMENT TRANSACTIONS
fees paid to ATIS and costs associated with shareholder statements. The Fund paid ATIS $1,311 for the year ended October 31, 2004.
Deferred compensation plan: Each eligible Fund Trustee may elect participation in the Deferred Compensation Plan ("the Plan"). Under the Plan, such Trustees may defer payment of a percentage of their total fees earned as a Fund Trustee. These deferred amounts may be invested in any Transamerica IDEX Mutual Fund. At October 31, 2004, the value of invested plan amount was $5. Invested plan amounts and the total liability for deferred compensation to the Trustees under the Plan at October 31, 2004, are included in the accompanying Statement of Assets and Liabilities.
The cost of securities purchased and proceeds from securities sold (excluding short-term securities) for the year ended October 31, 2004, were as follows:
| Purchases of securities: | | | |
| Long-Term excluding U.S. Government | | $ | 746,062 | | |
| U.S. Government | | | – | | |
| Proceeds from maturities and sales of securities: | | | |
| Long-Term excluding U.S. Government | | | 34,595 | | |
| U.S. Government | | | – | | |
NOTE 4. FEDERAL INCOME TAX MATTERS
The Fund has not made any provision for federal income or excise taxes due to its policy to distribute all of its taxable income and capital gains to its shareholders and otherwise qualify as a regulated investment company under the Internal Revenue Code. Income and capital gain distributions are determined in accordance with income tax regulations, which may differ from GAAP. These differences are primarily due to differing treatment for items including, but not limited to, distributions from Mutual Funds and wash sales.
Reclassifications between Undistributed net investment income (loss), Accumulated net realized capital gains (loss) and Shares of beneficial interest are made to reflect income and gains available for distribution under federal tax regulations. Results of operations and net assets are not effected by these reclassifications. These reclassifications are as follows:
| Undistributed net investment income (loss) | | $ | 15,964 | | |
Accumulated net realized gain (loss) from
investment in affiliated mutual funds | | | (15,964 | ) | |
The Capital loss carryforward utilized during the period ended October 31, 2004 was $978.
The tax character of distributions paid may differ from the character of distributions shown in the Statements of Changes in Net Assets due to short-term gains being treated as ordinary income for tax purposes. The tax character of distributions paid during 2003 and 2004 was as follows:
| 2004 Distributions paid from: | | | |
| Ordinary Income | | $ | 2,455 | | |
| Long-term capital gain | | | – | | |
| 2003 Distributions paid from: | | | |
| Ordinary Income | | | 186 | | |
| Long-term capital gain | | | – | | |
The tax basis components of distributable earnings as of October 31, 2004, are as follows:
| Undistributed Ordinary Income | | $ | 13,420 | | |
| Undistributed Long-term Capital Gains | | $ | 6,446 | | |
| Capital Loss Carryforward | | $ | – | | |
| Net Unrealized Appreciation (Depreciation) | | $ | 98,829 | | |
The aggregate cost of investments and composition of unrealized appreciation (depreciation) for federal income tax purposes as of October 31, 2004, are as follows:
| Federal Tax Cost Basis | | $ | 1,258,790 | | |
| Unrealized Appreciation | | $ | 99,051 | | |
| Unrealized (Depreciation) | | | (222 | ) | |
| Net Unrealized Appreciation (Depreciation) | | $ | 98,829 | | |
NOTE 5. OTHER MATTERS
Transamerica IDEX Mutual Funds ("TA IDEX"), and certain of its affiliated entities, have received requests for information from the Staff of the Securities and Exchange Commission in connection with market timing and late trading within the funds. TA IDEX and the affiliated entities have voluntarily cooperated in the investigation and have been providing the information as requested.
Transamerica IDEX Mutual Funds
Annual Report 2004
10
Report of Independent Registered Certified Public Accounting Firm
To the Board of Trustees and Shareholders of
TA IDEX Asset Allocation–Moderate Growth Portfolio
In our opinion, the accompanying statement of assets and liabilities, including the schedule of investments, and the related statements of operations and of changes in net assets and the financial highlights present fairly, in all material respects, the financial position of TA IDEX Asset Allocation–Moderate Growth Portfolio (the "Fund") (one of the portfolios constituting the Transamerica IDEX Mutual Funds) at October 31, 2004, the results of its operations for the year then ended, the changes in its net assets for each of the two years in the period then ended and the financial highlights for each of the periods indicated, in conformity with accounting principles generally accepted in the United States of America. These financial statements and financial highlights (hereafter referred to as "financial statements") are the responsibility of the Fund's management; our responsibility is to express an opinion on these financial statements based on our audits. We conducted our audits of these financial statements in accordance with the standards of the Public Company Accounting Oversight Board (United States). Those standards require that we plan and perform the audit to obtain reasonable assurance about whether the financial statements are free of material misstatement. An audit includes examining, on a test basis, evidence supporting the amounts and disclosures in the financial statements, assessing the accounting principles used and significant estimates made by management, and evaluating the overall financial statement presentation. We believe that our audits, which included confirmation of securities at October 31, 2004 by correspondence with the custodian provide a reasonable basis for our opinion.

PricewaterhouseCoopers LLP
Tampa, Florida
December 28, 2004
Transamerica IDEX Mutual Funds
Annual Report 2004
11
TA IDEX Asset Allocation–Moderate Growth Portfolio
SUPPLEMENTAL INFORMATION
RESULTS OF SHAREHOLDER PROXY (unaudited)
At a special meeting of Class M shareholders of each series of Transamerica IDEX (except TA IDEX Federated Tax Exempt and TA IDEX Protected Principal Stock) held on September 2, 2004, the results of the Proposal were as follows:
Proposal 1: Approval of a conversion of Class M shares into Class C shares of the Funds, which will result in bearing the distribution and service fees payable under the 12b-1 Plan of Distribution for the Class C shares of the Funds.
| For | | Against | | Abstentions/Broker Non-Votes | |
| | 83.57 | % | | | 9.58 | % | | | 6.85 | % | |
Transamerica IDEX Mutual Funds
Annual Report 2004
12
TA IDEX Clarion Real Estate Securities
MARKET ENVIRONMENT
Real estate stocks have delivered a strong performance over the last year, with the Dow Jones Wilshire Real Estate Securities Index ("DJWRE") returning 31.33% since October 31, 2003. For 2004, the year-to-date performance for the DJWRE is 22.00%. Real estate stocks have benefited from strong funds flow, a benign interest rate environment, and a dearth of attractive alternatives in the broader market. The flow of funds to the Real Estate Investment Trust ("REITs") dedicated mutual funds has been impressive. During the first ten months of 2004, real estate mutual funds have garnered $4.9 billion of new funds. In an environment where investors are revising their return expectations for stocks to be in the single-digits and for bonds to be only around 5%, real estate is garnering an increasing share of asset allocations. Real estate securities offer a very attractive (and liquid) alternative for getting exposure to commercial real estate assets for investors of all shapes and sizes.
PERFORMANCE
For the year ended October 31, 2004, TA IDEX Clarion Real Estate Securities, Class A returned 29.30%. By comparison its benchmark, DJWRE, returned 31.33%.
STRATEGY REVIEW
The inception date of TA IDEX Clarion Real Estate Securities was March 1, 2003. Since inception, the portfolio has returned 32.60%, which is approximately 4.6 percent below the DJWRE. For the year ending October 31, 2004, the portfolio is approximately 2 percent below the benchmark. At inception, the portfolio was contemplated to be an "Income Focused Fund," which in the real estate securities universe means a significant focus on high dividend yield, low earnings growth common stocks plus a reasonable portion of the portfolio invested in preferred stocks. In a bull market for REITs, this income-focused approach has proven to be an under-performing strategy for beating the benchmark. Some of the best performing stocks in the REIT universe since the inception of the portfolio have been stocks with low current dividend yields, but significant future earnings growth potential in an improving economy.
The portfolio's total return investment philosophy is to own a concentrated portfolio (+/- 30 stocks) of real estate stocks with the goal of outperforming the DJWRE through proprietary real estate market research and knowledge. We seek to own attractively priced stocks that offer favorable underlying real estate fundamentals from both a property type and geographic perspective.
Real estate fundamentals continue to be soft, although a consensus is building that operating fundamentals are currently bottoming and that 2005 will be the year of improving market conditions. The sober operating news gleaned from our numerous contacts within the real estate industry is that weak demand persists in many parts of the country and across most property types. Accordingly, many companies have offered modest and conservative earnings growth forecasts for 2005.
T. Ritson Ferguson, CFA
Joseph P. Smith, CFA
Co-Fund Managers
ING Clarion CRA Securities L.P.
Transamerica IDEX Mutual Funds
Annual Report 2004
1
TA IDEX Clarion Real Estate Securities
Comparison of change in value of $10,000 investment in Class A shares and its comparative index.
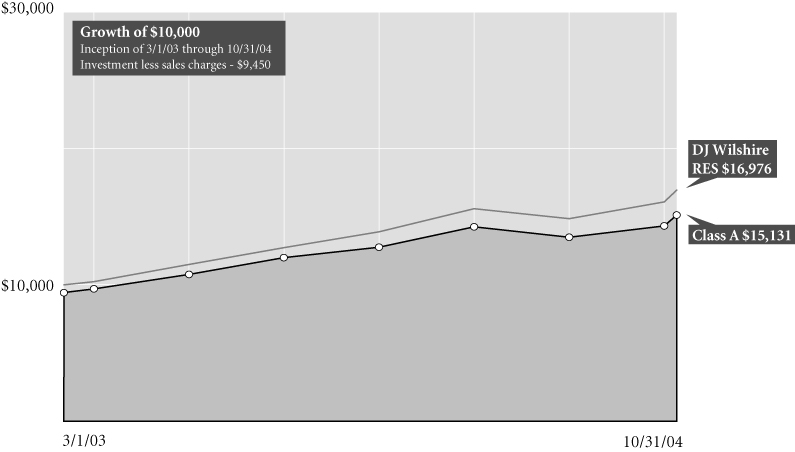
Average Annual Total Return for Periods Ended 10/31/04
| | | 1 year | | From
Inception | | Inception
Date | |
| Class A (NAV) | | | 29.30 | % | | | 32.60 | % | | 3/1/03 | |
| Class A (POP) | | | 22.19 | % | | | 28.17 | % | | 3/1/03 | |
| DJ Wilshire RES1 | | | 31.33 | % | | | 69.76 | % | | 3/1/03 | |
| Class B (NAV) | | | 28.96 | % | | | 32.09 | % | | 3/1/03 | |
| Class B (POP) | | | 23.96 | % | | | 30.09 | % | | 3/1/03 | |
| Class C (NAV) | | | 28.32 | % | | | 31.61 | % | | 3/1/03 | |
| Class C (POP) | | | 27.32 | % | | | 31.61 | % | | 3/1/03 | |
NOTES
1 The Dow Jones Wilshire Real Estate Securities (DJ Wilshire RES) Index is an unmanaged index used as a general measure of market performance. Calculations assume dividends and capital gains are reinvested and do not include any managerial expenses. From inception calculation is based on life of Class A shares.
The performance data presented represents past performance, future results may vary. Performance data does not reflect the deduction of taxes that would be paid on fund distributions or the redemption of fund shares. Investment return and principal value will fluctuate so that an investor's shares, when redeemed, may be worth more or less than their original cost. Current performance may be lower or higher than performance quoted.
Public Offering Price (POP) returns include the reinvestment of dividends and capital gains and reflect the maximum sales charge of 5.5% for A shares or the maximum applicable contingent deferred sales charge (5% in the 1st year, decreasing to 0% after 6 years) for Class B shares and 1% (during the first 12 months) for Class C shares. Shares purchased prior to March 1, 2004 are subject to a maximum applicable contingent deferred sales charge (5% in the 1st year, decreasing to 0% after 7 years) for Class B shares and (2% in the 1st year, decreasing to 0% after 2 years) for Class C shares. Net Asset Value (NAV) returns include the reinvestment of dividends and capital gains but do not reflect any sales charges.
Investments in a "non-diversified" fund may be subject to specific risks such as susceptibility to single economic political or regulatory events and may be subject to greater loss than investments in a diversified fund.
The risks of investing in REITs are similar to investing directly in real estate. Investing in real estate presents its own risks, including declining property values, overbuilding, low occupancy rates from commercial properties, rising operating expenses and interest rates, as well as taxes and other regulatory issues.
This material must be preceded or accompanied by a current prospectus, which includes specific contents regarding the investment objectives and policies of this fund.
Transamerica IDEX Mutual Funds
Annual Report 2004
2
TA IDEX Clarion Real Estate Securities
UNDERSTANDING YOUR FUND'S EXPENSES (unaudited)
SHAREHOLDER EXPENSES
The following Example is intended to help you understand your ongoing costs (in dollars and cents) of investing in a Fund and to compare these costs with the ongoing costs of investing in other funds.
The Example is based on an investment of $1,000 invested at the beginning of the period and held for the entire period from May 1, 2004 to October 31, 2004.
ACTUAL EXPENSES
The first line in the table below provides information about actual account values and actual expenses. You may use the information in this line, together with the amount you invested, to estimate the expenses that you paid over the period. Simply divide your account value by $1,000 (for example, an $8,600 account value divided by $1,000 = 8.6), then multiply the result by the number in the first line of your Fund under the heading entitled "Expenses Paid During Period" to estimate the expenses you paid on your account during this period.
HYPOTHETICAL EXAMPLE FOR COMPARISON PURPOSES
The second line in the table below provides information about hypothetical account values and hypothetical expenses based on each Fund's actual expense ratio and an assumed rate of return of 5% per year before expenses, which is not the Fund's actual return. The hypothetical account values and expenses may not be used to estimate the actual ending account balance or expenses you paid for the period. You may use this information to compare the ongoing costs of investing in your Fund and other funds. To do so, compare this 5% hypothetical example with the 5% hypothetical examples that appear in the shareholder reports of the other funds.
Please note that the expenses shown in the table are meant to highlight your ongoing costs only and do not reflect any transactional costs, such as sales charges, redemption fees, brokerage commissions paid on purchases and sales of fund shares. Therefore, the second line under each Fund in the table is useful in comparing ongoing costs only, and will not help you determine the relative total costs of owning different funds. In addition, note that the expenses shown in the table are meant to highlight your ongoing costs and do not reflect any transaction costs.
| | | Beginning
Account
Value | | Ending
Account
Value | | Annualized
Expense
Ratio | | Expenses Paid
During Period (a) | |
| Class A | |
| Actual | | $ | 1,000.00 | | | $ | 1,241.80 | | | | 1.28 | % | | $ | 7.21 | | |
| Hypothetical (b) | | | 1,000.00 | | | | 1,018.70 | | | | 1.28 | | | | 6.50 | | |
| Class B | |
| Actual | | | 1,000.00 | | | | 1,242.20 | | | | 1.17 | | | | 6.59 | | |
| Hypothetical (b) | | | 1,000.00 | | | | 1,019.25 | | | | 1.17 | | | | 5.94 | | |
| Class C | |
| Actual | | | 1,000.00 | | | | 1,236.10 | | | | 2.40 | | | | 13.49 | | |
| Hypothetical (b) | | | 1,000.00 | | | | 1,013.07 | | | | 2.40 | | | | 12.14 | | |
(a) Expenses are calculated using each Fund's annualized expense ratio (as disclosed in the table), multiplied by the average account value for the period, multiplied by number of days in the period (184 days), and divided by the number of days in the year (366 days).
(b) 5% return per year before expenses.
GRAPHIC PRESENTATION OF SCHEDULE OF INVESTMENTS
By Real Estate Property Breakdown
At October 31, 2004
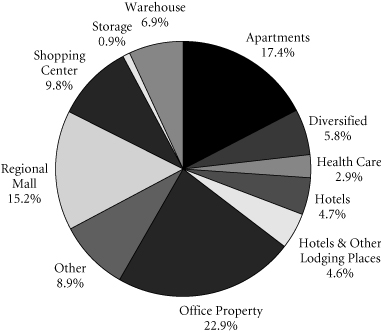
This chart shows the percentage breakdown by Real Estate property type of the Fund's total investment securities.
Transamerica IDEX Mutual Funds
Annual Report 2004
3
TA IDEX Clarion Real Estate Securities
SCHEDULE OF INVESTMENTS
At October 31, 2004
(all amounts except share amounts in thousands)
| | | Shares | | Value | |
| COMMON STOCKS (99.7%) | |
| Apartments (19.1%) | |
Apartment Investment &
Management Co.–Class A (a) | | | 72,800 | | | $ | 2,671 | | |
| Archstone-Smith Trust (a) | | | 204,000 | | | | 6,844 | | |
| AvalonBay Communities, Inc. (a) | | | 61,700 | | | | 4,040 | | |
| Camden Property Trust | | | 107,760 | | | | 4,892 | | |
| Essex Property Trust, Inc. | | | 29,200 | | | | 2,291 | | |
| United Dominion Realty Trust, Inc. (a) | | | 234,400 | | | | 4,941 | | |
| Diversified (6.3%) | |
| American Campus Communities, Inc. (b) | | | 68,000 | | | | 1,285 | | |
| Liberty Property Trust | | | 113,049 | | | | 4,584 | | |
| Vornado Realty Trust | | | 39,100 | | | | 2,628 | | |
| Health Care (3.2%) | |
| Health Care, Inc. | | | 53,590 | | | | 1,929 | | |
| Omega Healthcare Investors, Inc. | | | 204,900 | | | | 2,309 | | |
| Hotels (5.1%) | |
| Host Marriott Corp. (a)(b) | | | 275,400 | | | | 4,007 | | |
| LaSalle Hotel Properties (a) | | | 49,700 | | | | 1,427 | | |
| Strategic Hotel Capital, Inc. | | | 104,300 | | | | 1,496 | | |
| Hotels & Other Lodging Places (5.0%) | |
| Starwood Hotels & Resorts Worldwide, Inc. | | | 142,200 | | | | 6,787 | | |
| Office Property (25.1%) | |
| Arden Realty, Inc. | | | 117,150 | | | | 3,993 | | |
| BioMed Realty Trust, Inc. | | | 71,200 | | | | 1,294 | | |
| Boston Properties, Inc. (a) | | | 115,900 | | | | 6,922 | | |
| Corporate Office Properties Trust | | | 92,100 | | | | 2,525 | | |
| Mack-Cali Realty Corp. | | | 78,750 | | | | 3,478 | | |
| Maguire Properties, Inc. | | | 170,000 | | | | 4,446 | | |
| Prentiss Properties Trust | | | 88,460 | | | | 3,183 | | |
| SL Green Realty Corp. | | | 86,100 | | | | 4,720 | | |
| Trizec Properties, Inc. | | | 208,000 | | | | 3,318 | | |
| Regional Mall (16.6%) | |
| CBL & Associates Properties, Inc. | | | 41,980 | | | | 2,752 | | |
| General Growth Properties, Inc. | | | 81,400 | | | | 2,685 | | |
General Growth Properties, Inc.
Warrants, Expires TBD | | | 3,420 | | | | 3 | | |
| Macerich Co. (The) | | | 80,400 | | | | 4,804 | | |
| Mills Corp. (The) | | | 98,400 | | | | 5,456 | | |
| Simon Property Group, Inc. | | | 115,200 | | | | 6,718 | | |
| Shopping Center (10.7%) | |
| Acadia Realty Trust | | | 90,600 | | | | 1,395 | | |
| Cedar Shopping Centers, Inc. | | | 23,700 | | | | 321 | | |
| Developers Diversified Realty Corp. (a) | | | 99,800 | | | | 4,172 | | |
| Pan Pacific Retail Properties, Inc. | | | 71,300 | | | | 4,039 | | |
| Regency Centers Corp. | | | 92,600 | | | | 4,524 | | |
| | | Shares | | Value | |
| Storage (1.0%) | | | |
| Extra Space Storage, Inc. (a) | | | 100,100 | | | $ | 1,387 | | |
| Warehouse (7.6%) | | | |
| Catellus Development Corp. | | | 118,103 | | | | 3,406 | | |
| Prologis | | | 173,900 | | | | 6,779 | | |
| Total Common Stocks (cost: $115,675) | | | | | | | 134,451 | | |
| | | Principal | | Value | |
| SECURITY LENDING COLLATERAL (9.9%) | | | |
| Debt (9.2%) | | | |
| Bank Notes (1.8%) | | | |
Bank of America
1.77%, due 12/03/2004 | | $ | 649 | | | $ | 649 | | |
| 1.88%, due 12/23/2004 | | | 216 | | | | 216 | | |
| 1.77%, due 01/18/2005 | | | 432 | | | | 432 | | |
Canadian Imperial Bank of Commerce
1.86%, due 11/04/2004 | | | 973 | | | | 973 | | |
Credit Suisse First Boston Corp.
1.83%, due 09/09/2005 | | | 108 | | | | 108 | | |
| Commercial Paper (0.9%) | | | |
Clipper Receivables Corp.
1.79%, due 11/12/2004 | | | 322 | | | | 322 | | |
Delaware Funding Corp. 144A
1.85%, due 11/19/2004 | | | 108 | | | | 108 | | |
Falcon Asset Securitization Corp. 144A
1.78%, due 11/04/2004 | | | 323 | | | | 323 | | |
| 1.75%, due 11/10/2004 | | | 432 | | | | 432 | | |
Galaxy Funding 144A
1.88%, due 11/22/2004 | | | 108 | | | | 108 | | |
| Euro Dollar Terms (4.3%) | | | |
Bank of Montreal
1.88%, due 11/24/2004 | | | 1,024 | | | | 1,024 | | |
BNP Paribas
1.77%, due 11/10/2004 | | | 541 | | | | 541 | | |
| 1.80%, due 11/23/2004 | | | 432 | | | | 432 | | |
| 1.98%, due 12/27/2004 | | | 432 | | | | 432 | | |
Calyon
1.70%, due 11/24/2004 | | | 57 | | | | 57 | | |
Citigroup
2.06%, due 01/25/2005 | | | 1,081 | | | | 1,081 | | |
Den Danske Bank
1.82%, due 11/19/2004 | | | 541 | | | | 541 | | |
Dexia Group
2.04%, due 01/21/2005 | | | 251 | | | | 251 | | |
HBOS Halifax Bank of Scotland
2.03%, due 01/21/2005 | | | 216 | | | | 216 | | |
Royal Bank of Scotland
2.01%, due 01/20/2005 | | | 432 | | | | 432 | | |
The notes to the financial statements are an integral part of this report.
Transamerica IDEX Mutual Funds
Annual Report 2004
4
TA IDEX Clarion Real Estate Securities
SCHEDULE OF INVESTMENTS (continued)
At October 31, 2004
(all amounts except share amounts in thousands)
| | | Principal | | Value | |
| Euro Dollar Terms (continued) | | | |
Toronto Dominion Bank
1.70%, due 11/08/2004 | | $ | 216 | | | $ | 216 | | |
Wells Fargo
1.87%, due 11/22/2004 | | | 540 | | | | 540 | | |
| Promissory Notes (0.9%) | | | |
Goldman Sachs Group Inc.
1.90%, due 12/29/2004 | | | 454 | | | | 454 | | |
| 1.88%, due 01/27/2005 | | | 757 | | | | 757 | | |
| Repurchase Agreements (1.3%) | | | |
Merrill Lynch & Co., Inc.
1.92% Repurchase Agreement dated
10/31/04 to be repurchased at $1,729
on 11/01/04 (c) | | | 1,729 | | | | 1,729 | | |
| | | Shares | | Value | |
| Investment Companies (0.7%) | |
| Money Market Funds (0.7%) | |
Merrill Lynch Premier Institutional Fund
1-day yield of 1.71% | | | 531,718 | | | $ | 532 | | |
Merrimac Cash Fund,
Premium Class
1-day yield of 1.46% | | | 389,106 | | | | 389 | | |
| Total Security Lending Collateral (cost: $13,295) | | | | | | | 13,295 | | |
| Total Investment Securities (cost: $128,970) | | | | | | $ | 147,746 | | |
| SUMMARY: | |
| Investments, at value | | | 109.6 | % | | $ | 147,746 | | |
| Liabilities in excess of other assets | | | (9.6 | )% | | | (12,956 | ) | |
| Net assets | | | 100.0 | % | | $ | 134,790 | | |
NOTES TO SCHEDULE OF INVESTMENTS:
(a) At October 31, 2004, all or a portion of this security is on loan (see Note 1). The value at October 31, 2004, of all securities on loan is $12,780.
(b) No dividends were paid during the preceding twelve months.
(c) Cash collateral for the Repurchase Agreements, valued at $1,770, that serve as collateral for securities lending are invested in corporate bonds with interest rates and maturity dates ranging from 0.00%–9.75% and 05/15/2005–9/15/2033, respectively.
DEFINITIONS:
144A 144A Securities are registered pursuant to the rule 144A of the Securities Act of 1933. These securities are deemed to be liquid for purposes of compliance limitations on holdings of illiquid securities and may be resold as transactions exempt from registration normally to qualified institutional buyers. At October 31, 2004 these securities aggregated $971 or 0.7% of the net assets of the Fund.
The notes to the financial statements are an integral part of this report.
Transamerica IDEX Mutual Funds
Annual Report 2004
5
TA IDEX Clarion Real Estate Securities
STATEMENT OF ASSETS AND LIABILITIES
At October 31, 2004
(all amounts except per share amounts in thousands)
| Assets: | | | |
Investment securities, at value (cost: $128,970)
(including securities loaned of $12,780) | | $ | 147,746 | | |
| Cash | | | 1,894 | | |
| Receivables: | |
| Investment securities sold | | | 619 | | |
| Shares of beneficial interest sold | | | 122 | | |
| Interest | | | 5 | | |
| Dividends | | | 366 | | |
| Other | | | 2 | | |
| | | | 150,754 | | |
| Liabilities: | | | |
| Investment securities purchased | | | 2,452 | | |
| Accounts payable and accrued liabilities: | |
| Shares of beneficial interest redeemed | | | 10 | | |
| Management and advisory fees | | | 91 | | |
| Distribution fees | | | 44 | | |
| Transfer agent fees | | | 3 | | |
| Payable for collateral for securities on loan | | | 13,295 | | |
| Other | | | 69 | | |
| | | | 15,964 | | |
| Net Assets | | $ | 134,790 | | |
| Net Assets Consist of: | | | |
Shares of beneficial interest, unlimited shares
authorized, no par value | | $ | 114,470 | | |
| Undistributed net investment income (loss) | | | – | | |
Undistributed net realized gain (loss) from investment
securities | | | 1,544 | | |
Net unrealized appreciation (depreciation) on
investment securities | | | 18,776 | | |
| Net Assets | | $ | 134,790 | | |
| Net Assets by Class: | | | |
| Class A | | $ | 125,423 | | |
| Class B | | | 4,042 | | |
| Class C | | | 5,325 | | |
| Shares Outstanding: | | | |
| Class A | | | 8,966 | | |
| Class B | | | 289 | | |
| Class C | | | 383 | | |
| Net Asset Value Per Share: | | | |
| Class A | | $ | 13.99 | | |
| Class B | | | 13.99 | | |
| Class C | | | 13.92 | | |
| Maximum Offering Price Per Share (a): | | | |
| Class A | | $ | 14.80 | | |
(a) Includes the maximum selling commission (represented as a percentage of offering price) which is reduced on certain levels of sales as set forth in the Prospectus. Net asset value per share for Classes B and C shares represents offering price. The redemption price for Classes B and C shares equals net asset value less any applicable contingent deferred sales charge.
STATEMENT OF OPERATIONS
For the year ended October 31, 2004
(all amounts in thousands)
| Investment Income: | | | |
| Interest | | $ | 11 | | |
| Dividends | | | 3,584 | | |
| Income from loaned securities–net | | | 8 | | |
| | | | 3,603 | | |
| Expenses: | | | |
| Management and advisory fees | | | 832 | | |
| Transfer agent fees: | |
| Class A | | | 15 | | |
| Class B | | | 3 | | |
| Class C | | | 1 | | |
| Class C2 | | | – | | |
| Class M | | | – | | |
| Custody fees | | | 17 | | |
| Administration fees | | | 20 | | |
| Legal fees | | | 3 | | |
| Audit and accounting fees | | | 13 | | |
| Trustees fees | | | 6 | | |
| Registration fees: | |
| Class A | | | 57 | | |
| Class B | | | – | | |
| Class C | | | 11 | | |
| Class C2 | | | – | | |
| Class M | | | 1 | | |
| Other | | | 4 | | |
| Distribution and service fees: | |
| Class A | | | 342 | | |
| Class B | | | 27 | | |
| Class C | | | 33 | | |
| Class C2 | | | 2 | | |
| Class M | | | 3 | | |
| Total expenses | | | 1,390 | | |
| Net Investment Income (Loss) | | | 2,213 | | |
| Net Realized and Unrealized Gain (Loss) | | | |
| Realized gain (loss) from investment securities | | | 7,514 | | |
Increase (decrease) in unrealized appreciation
(depreciation) on investment securities | | | 15,478 | | |
| Net Gain (Loss) on Investments | | | 22,992 | | |
Net Increase (Decrease) in Net Assets Resulting
from Operations | | $ | 25,205 | | |
The notes to the financial statements are an integral part of this report.
Transamerica IDEX Mutual Funds
Annual Report 2004
6
TA IDEX Clarion Real Estate Securities
STATEMENTS OF CHANGES IN NET ASSETS
For the periods ended
(all amounts in thousands)
| | | October 31,
2004 | | October 31,
2003 (a) | |
| Increase (Decrease) In Net Assets From: | | | |
| Operations: | | | |
| Net investment income (loss) | | $ | 2,213 | | | $ | 1,172 | | |
Net realized gain (loss) from
investment securities | | | 7,514 | | | | 3,100 | | |
Net unrealized appreciation
(depreciation) on investment
securities | | | 15,478 | | | | 3,298 | | |
| | | | 25,205 | | | | 7,570 | | |
| Distributions to Shareholders: | | | |
| From net investment income: | |
| Class A | | | (3,781 | ) | | | (583 | ) | |
| Class B | | | (88 | ) | | | (13 | ) | |
| Class C | | | (106 | ) | | | (14 | ) | |
| Class C2 | | | (7 | ) | | | (2 | ) | |
| Class M | | | (13 | ) | | | (2 | ) | |
| | | | (3,995 | ) | | | (614 | ) | |
| From net realized gains: | |
| Class A | | | (7,237 | ) | | | – | | |
| Class B | | | (192 | ) | | | – | | |
| Class C | | | (228 | ) | | | – | | |
| Class C2 | | | (21 | ) | | | – | | |
| Class M | | | (28 | ) | | | – | | |
| | | | (7,706 | ) | | | – | | |
| Capital Share Transactions: | | | |
| Proceeds from shares sold: | |
| Class A | | | 39,247 | | | | 57,510 | | |
| Class B | | | 2,642 | | | | 1,793 | | |
| Class C | | | 2,662 | | | | 1,816 | | |
| Class C2 | | | 101 | | | | 200 | | |
| Class M | | | 202 | | | | 215 | | |
| | | | 44,854 | | | | 61,534 | | |
Dividends and distributions
reinvested: | |
| Class A | | | 11,008 | | | | 582 | | |
| Class B | | | 226 | | | | 11 | | |
| Class C | | | 240 | | | | 11 | | |
| Class C2 | | | 27 | | | | 2 | | |
| Class M | | | 29 | | | | 1 | | |
| | | | 11,530 | | | | 607 | | |
| Cost of shares redeemed: | |
| Class A | | | (1,533 | ) | | | (610 | ) | |
| Class B | | | (1,021 | ) | | | (139 | ) | |
| Class C | | | (714 | ) | | | (54 | ) | |
| Class C2 | | | (91 | ) | | | (6 | ) | |
| Class M | | | (22 | ) | | | (5 | ) | |
| | | | (3,381 | ) | | | (814 | ) | |
| Class level exchanges: | |
| Class C | | | 736 | | | | – | | |
| Class C2 | | | (256 | ) | | | – | | |
| Class M | | | (480 | ) | | | – | | |
| | | | – | | | | – | | |
(a) Commenced operations March 1, 2003.
| | | October 31,
2004 | | October 31,
2003 (a) | |
| Automatic conversions: | |
| Class A | | $ | 4 | | | $ | – | | |
| Class B | | | (4 | ) | | | – | | |
| | | | – | | | | – | | |
| | | | 53,003 | | | | 61,327 | | |
| Net increase (decrease) in net assets | | | 66,507 | | | | 68,283 | | |
| Net Assets: | | | |
| Beginning of year | | | 68,283 | | | | – | | |
| End of year | | $ | 134,790 | | | $ | 68,283 | | |
Undistributed Net Investment Income
(Loss) | | $ | – | | | $ | 576 | | |
| Share Activity: | | | |
| Shares issued: | |
| Class A | | | 2,967 | | | | 5,238 | | |
| Class B | | | 204 | | | | 159 | | |
| Class C | | | 205 | | | | 160 | | |
| Class C2 | | | 8 | | | | 19 | | |
| Class M | | | 17 | | | | 20 | | |
| | | | 3,401 | | | | 5,596 | | |
Shares issued–reinvested from
distributions: | |
| Class A | | | 887 | | | | 49 | | |
| Class B | | | 18 | | | | 1 | | |
| Class C | | | 19 | | | | 1 | | |
| Class C2 | | | 2 | | | | – | | |
| Class M | | | 2 | | | | – | | |
| | | | 928 | | | | 51 | | |
| Shares redeemed: | |
| Class A | | | (121 | ) | | | (55 | ) | |
| Class B | | | (81 | ) | | | (12 | ) | |
| Class C | | | (56 | ) | | | (4 | ) | |
| Class C2 | | | (7 | ) | | | – | | |
| Class M | | | (2 | ) | | | – | | |
| | | | (267 | ) | | | (71 | ) | |
| Class level exchanges: | |
| Class C | | | 58 | | | | – | | |
| Class C2 | | | (21 | ) | | | – | | |
| Class M | | | (37 | ) | | | – | | |
| | | | – | | | | – | | |
Net increase (decrease) in shares
outstanding: | |
| Class A | | | 3,733 | | | | 5,232 | | |
| Class B | | | 141 | | | | 148 | | |
| Class C | | | 226 | | | | 157 | | |
| Class C2 | | | (18 | ) | | | 19 | | |
| Class M | | | (20 | ) | | | 20 | | |
| | | | 4,062 | | | | 5,576 | | |
The notes to the financial statements are an integral part of this report.
Transamerica IDEX Mutual Funds
Annual Report 2004
7
TA IDEX Clarion Real Estate Securities
FINANCIAL HIGHLIGHTS
| | | | | For a share of beneficial interest outstanding throughout each period | |
| | | | | Net Asset | | Investment Operations | | Distributions | | Net Asset | |
| | | For the
Period
Ended (d)(g) | | Value,
Beginning
of Period | | Net
Investment
Income (Loss) | | Net Realized
and Unrealized
Gain (Loss) | | Total
Operations | | From Net
Investment
Income | | From Net
Realized
Gains | | Total
Distributions | | Value,
End
of Period | |
| Class A | | 10/31/2004 | | $ | 12.25 | | | $ | 0.28 | | | $ | 3.05 | | | $ | 3.33 | | | $ | (0.53 | ) | | $ | (1.06 | ) | | $ | (1.59 | ) | | $ | 13.99 | | |
| | | 10/31/2003 | | | 10.00 | | | | 0.43 | | | | 1.95 | | | | 2.38 | | | | (0.13 | ) | | | – | | | | (0.13 | ) | | | 12.25 | | |
| Class B | | 10/31/2004 | | | 12.22 | | | | 0.25 | | | | 3.03 | | | | 3.28 | | | | (0.45 | ) | | | (1.06 | ) | | | (1.51 | ) | | | 13.99 | | |
| | | 10/31/2003 | | | 10.00 | | | | 0.38 | | | | 1.95 | | | | 2.33 | | | | (0.11 | ) | | | – | | | | (0.11 | ) | | | 12.22 | | |
| Class C | | 10/31/2004 | | | 12.22 | | | | 0.17 | | | | 3.04 | | | | 3.21 | | | | (0.45 | ) | | | (1.06 | ) | | | (1.51 | ) | | | 13.92 | | |
| | | 10/31/2003 | | | 10.00 | | | | 0.38 | | | | 1.95 | | | | 2.33 | | | | (0.11 | ) | | | – | | | | (0.11 | ) | | | 12.22 | | |
| | | | | | | Ratios/Supplemental Data | |
| | | For the
Period | | Total | | Net Assets,
End of
Period | | Ratio of Expenses
to Average
Net Assets (a) | | Net Investment
Income (Loss)
to Average | | Portfolio
Turnover | |
| | | Ended (g) | | Return (c) | | (000's) | | Net (e) | | Total (f) | | Net Assets (a) | | Rate (b) | |
| Class A | | 10/31/2004 | | | 29.30 | % | | $ | 125,423 | | | | 1.30 | % | | | 1.30 | % | | | 2.16 | % | | | 73 | % | |
| | | 10/31/2003 | | | 23.80 | | | | 64,090 | | | | 1.75 | | | | 1.76 | | | | 5.55 | | | | 95 | | |
| Class B | | 10/31/2004 | | | 28.96 | | | | 4,042 | | | | 1.51 | | | | 1.51 | | | | 1.97 | | | | 73 | | |
| | | 10/31/2003 | | | 23.33 | | | | 1,804 | | | | 2.40 | | | | 2.41 | | | | 4.91 | | | | 95 | | |
| Class C | | 10/31/2004 | | | 28.32 | | | | 5,325 | | | | 2.22 | | | | 2.22 | | | | 1.32 | | | | 73 | | |
| | | 10/31/2003 | | | 23.33 | | | | 1,913 | | | | 2.40 | | | | 2.41 | | | | 4.91 | | | | 95 | | |
NOTES TO FINANCIAL HIGHLIGHTS
(a) Annualized.
(b) Not annualized for periods of less than one year.
(c) Total Return has been calculated for the applicable period without deduction of a sales load, if any, on an initial purchase. Periods of less than one year are not annualized.
(d) Per share information is calculated based on average number of shares outstanding.
(e) Ratio of Net Expenses to Average Net Assets shows the net expense ratio, which is total expenses less reimbursement by the investment adviser, if any (see note 2).
(f) Ratio of Total Expenses to Average Net Assets does not take into account reimbursements by the investment adviser or affiliated brokerage and custody earnings credits, if any.
(g) TA IDEX Clarion Real Estate Securities commenced operations on March 1, 2003.
The notes to the financial statements are an integral part of this report.
Transamerica IDEX Mutual Funds
Annual Report 2004
8
TA IDEX Clarion Real Estate Securities
NOTES TO FINANCIAL STATEMENTS
At October 31, 2004
(all amounts in thousands)
NOTE 1. ORGANIZATION AND SIGNIFICANT ACCOUNTING POLICIES
Transamerica IDEX Mutual Funds, formerly IDEX Mutual Funds, is a Massachusetts business trust registered under the Investment Company Act of 1940, as amended (the "1940 Act"), as an open-end management investment company. TA IDEX Clarion Real Estate Securities ("the Fund"), part of Transamerica IDEX Mutual Funds, began operations on March 1, 2003. The Fund is "non-diversified" under the 1940 Act.
On March 1, 2004, the Fund changed its name from IDEX Clarion Real Estate Securities to TA IDEX Clarion Real Estate Securities.
In the normal course of business, the Fund enters into contracts that contain a variety of representations and warranties, which provide general indemnifications. The Fund's maximum exposure under these arrangements is unknown, as this would involve future claims that may be made against the Fund and/or its affiliates that have not yet occurred. However, based on experience, the Fund expects the risk of loss to be remote.
See the Prospectus and Statement of Additional Information for a description of the Fund's investment objective.
In preparing the Fund's financial statements in accordance with accounting principles generally accepted in the United States of America ("GAAP"), estimates or assumptions (which could differ from actual results) may be used that affect reported amounts and disclosures. The following policies were consistently followed by the Fund, in accordance with GAAP.
Multiple class operations and expenses: The Fund currently offers three classes of shares, each with a public offering price that reflects different sales charges, if any, and expense levels. All shares designated as Class C shares prior to March 1, 2004, were renamed as Class C2 shares on that date. All shares designated as Class L shares prior to March 1, 2004, were renamed as Class C shares with different sales charges than the previous Class L shares. On June 15, 2004, Class C2 shares merged into Class C. On September 24, 2004, Class M shares merged into Class C. Class B shares will convert to Class A shares eight years after purchase. Income, non-class specific expenses and realized and unrealized gains and losses, are allocated daily to each class, based upon the value of shares outstanding method as permitted under Rule 18f-3 of the 1940 Act. Each class bears its own specific expenses as well as a portion of general, common expenses.
Pricing of shares: The Fund prices its shares on the basis of the net asset value of each class of shares of the Fund, which is determined as of the close of the New York Stock Exchange ("NYSE") (generally 4:00 p.m. Eastern Time) on each day on which the NYSE is open for trading (other than a day on which there are insufficient changes in the value of the Fund's portfolio securities to materially affect the Fund's net asset value or a day on which no shares are tendered for redemption and no order to purchase any shares is received).
Security valuations: Fund investments traded on an exchange are valued at the closing price on the day of valuation on the exchange where the security is principally traded. With respect to securities traded on NASDAQ NMS, such closing price may be the last reported sales price or the NASDAQ Official Closing Price.
Securities traded in the over-the-counter market and listed securities for which no sale was reported on that date are valued at the last quoted bid price.
Debt securities are valued by independent pricing services; however, those that mature in sixty days or less are valued at amortized cost, which approximates market.
Investment company securities are valued at net asset value of the underlying portfolio.
Other securities for which quotations are not readily available are valued at fair market value as determined in good faith using guidelines adopted by the Board of Trustees of the Fund, under the supervision of the Fund's Valuation Committee.
Cash: The Fund may leave cash overnight in its cash account with the custodian, Investors Bank & Trust Company ("IBT"). IBT has been contracted on behalf of the Fund to invest the excess cash into a savings account, which at October 31, 2004, was paying an interest rate of 1.30%.
Throughout the year, the Fund may have a cash overdraft balance. A fee is incurred on this overdraft, calculated by multiplying the overdraft by a rate based on the federal funds rate. This fee is included in custody fees in the Statement of Operations.
Repurchase agreements: The Fund is authorized to enter into repurchase agreements. The Fund, through IBT, receives delivery of the underlying securities, the value of which at the time of purchase is required to be an amount equal to at least 100% of the resale price. Repurchase agreements involve the risk that the seller will fail to repurchase the security, as agreed. In that case, the Fund will bear the risk of value fluctuations until the security can be sold and may encounter delays and incur costs in liquidating the security. In the event of bankruptcy or insolvency of the seller, delays and costs may be incurred.
Commission Recapture: The sub-adviser, to the extent consistent with the best execution and usual commission rate policies and practices, may place security transactions of the Fund with broker/dealers with which Transamerica IDEX Mutual Funds has established a Commission Recapture Program. A Commission Recapture Program is any arrangement under which a broker/dealer applies a portion of the commissions received by such broker/dealer on the security transactions to the Fund. In no event will commissions paid by the Fund be used to pay expenses that would otherwise be borne by any other funds within Transamerica IDEX Mutual Funds, or by any other party.
Transamerica IDEX Mutual Funds
Annual Report 2004
9
TA IDEX Clarion Real Estate Securities
NOTES TO FINANCIAL STATEMENTS (continued)
At October 31, 2004
(all amounts in thousands)
NOTE 1.–(continued)
Recaptured commissions during the year ended October 31, 2004, of $66 are included in net realized gains in the Statement of Operations.
Securities lending: The Fund may lend securities to enhance fund earnings from investing cash collateral in making such loans to qualified borrowers (typically broker/dealers). The Fund has engaged its custodian bank, IBT, as a lending agent to administer its securities lending program. IBT earned $4 of program income for its services. When the Fund makes a security loan, it receives cash collateral as protection against the risk that the borrower will default on the loan, and records an asset for the cash invested collateral and a liability for the return of the collateral.
Securities on loan are included in Investment securities at value in the Statement of Assets and Liabilities and remain on the Schedule of Investments.
Loans of securities are required to be secured by collateral at least equal to 102% of the value of the securities at inception of the loan, and not less then 100% thereafter. The Fund may invest cash collateral in short-term money market instruments including: U.S. Treasury Bills, U.S. agency obligations, commercial paper, money market mutual funds, repurchase agreements and other highly rated, liquid investments. During the life of securities loans, the collateral and securities loaned remain subject to fluctuation in value. IBT marks to market securities loaned and the collateral each business day. If additional collateral is due (at least $1), IBT collects additional cash collateral from the borrowers. Although securities loaned will be fully collateralized at all times, IBT may experience delays in, or may be prevented from, recovering the collateral on behalf of the Fund. The Fund may recall a loa ned security position at any time from the borrower through IBT. In the event the borrower fails to timely return a recalled security, IBT may indemnify the Fund by purchasing replacement securities for the Fund at its own expense and claiming the collateral to fund such a purchase. IBT absorbs the loss if the collateral value is not sufficient to cover the cost of the replacement securities. If replacement securities are not available, IBT will credit the equivalent cash value to the Fund.
While a security is on loan, the Fund does not have the right to vote that security. However, if time permits, the Fund will attempt to recall a security on loan and vote the proxy.
Income from securities lending is included in the Statement of Operations. The amount of collateral and value of securities on loan are included in the Statement of Assets and Liabilities as well as in the Schedule of Investments.
Real Estate Investment Trusts ("REITs"): There are certain additional risks involved in investing in REITs. These include, but are not limited to, economic conditions, changes in zoning laws, real estate values, property taxes and interest rates. Since the Fund invests primarily in real estate securities, the value of its share may fluctuate more widely than the value of shares of a fund that invests in a broad range of industries.
Security transactions and investment income: Security transactions are recorded on the trade date. Security gains and losses are calculated on the specific identification basis. Dividend income is recorded on the ex-dividend date or, in the case of foreign securities, as soon as the Fund is informed of the ex-dividend date. Interest income, including accretion of discounts and amortization of premiums, is recorded on the accrual basis commencing on the settlement date.
Account maintenance fees: If the shareholder account balance falls below $1 by either shareholder action or as a result of market action, a $25 (not in thousands) fee is assessed every year until the balance reaches $1. The fee is assessed by redeeming shares in the shareholder's account.
No fee will be charged under the following conditions:
• accounts opened within the preceding 24 months
• accounts with an active monthly Automatic Investment Plan ($50 (not in thousands) minimum per fund)
• accounts owned by an individual which, when combined by social security number, have a balance of $5 or more
• accounts owned by individuals in the same household (by address) that have a combined balance of $5 or more
• UTMA/UGMA accounts
• Fiduciary accounts
• B-share accounts whose shares have started to convert to A-shares accounts (as long as combined value of both accounts is at least $1)
For the year ended October 31, 2004, there were no fees. These fees are included in Paid in Capital in the Statement of Assets and Liabilities.
Redemption fees: A short-term trading redemption fee may be assessed on any fund shares in a fund account that are sold during the first five (5) New York Stock Exchange trading days following their purchase date. This redemption fee will equal 2% of the amount redeemed and shares held the longest will be treated as being redeemed first and shares held the shortest as being redeemed last. For the year ended October 31, 2004, the Fund received no redemption fees.
Dividend distributions: Distributions to shareholders are recorded on the ex-dividend date and are determined in accordance with Federal income tax regulations which may differ from GAAP.
Transamerica IDEX Mutual Funds
Annual Report 2004
10
TA IDEX Clarion Real Estate Securities
NOTES TO FINANCIAL STATEMENTS (continued)
At October 31, 2004
(all amounts in thousands)
NOTE 2. RELATED PARTY TRANSACTIONS
AEGON/Transamerica Fund Advisers, Inc. ("ATFA") is the Fund's investment adviser. AEGON/Transamerica Fund Services, Inc. ("ATFS") is the Fund's administrator. AFSG Securities Corp. ("AFSG") is the Fund's distributor/principal underwriter. AEGON/Transamerica Investor Services, Inc. ("ATIS") is the Fund's transfer agent. ATIS and AFSG are 100% owned by AUSA Holding Company ("AUSA"). ATFA is a directly owned subsidiary of Western Reserve Life Assurance Co. of Ohio (78%) ("WRL") and AUSA (22%). ATFS is a wholly owned subsidiary of WRL. AUSA and WRL are wholly owned indirect subsidiaries of AEGON NV, a Netherlands corporation.
The following schedule reflects the percentage of fund assets owned by affiliated mutual funds (i.e., through the assets allocation funds):
| | | Net
Assets | | % of
Net Assets | |
TA IDEX Asset Allocation–
Conservative Portfolio | | $ | 23,095 | | | | 17 | % | |
TA IDEX Asset Allocation–Growth
Portfolio | | | 9,560 | | | | 7 | % | |
TA IDEX Asset Allocation–Moderate
Growth Portfolio | | | 36,930 | | | | 27 | % | |
TA IDEX Asset Allocation–Moderate
Portfolio | | | 51,183 | | | | 38 | % | |
| Total | | $ | 120,768 | | | | 89 | % | |
Investment advisory fee: The Fund pays management fees to ATFA based on average daily net assets ("ANA") at the following breakpoints:
0.80% of the first $250 million of ANA
0.775% of the next $250 million of ANA
0.70% of the next $500 million of ANA
0.65% of ANA over $1 billion
ATFA has contractually agreed to waive its advisory fee and will reimburse the Fund to the extent that operating expenses, excluding 12b-1 fees, exceed the following stated annual limit:
1.40% Expense Limit
If total fund expenses fall below the annual expense limitation agreement agreed to by the adviser within the succeeding three years, the Fund may be required to pay that adviser a portion or all of the waived advisory fees. There were no expenses subject to recapture at October 31, 2004.
Distribution and service fees: The Fund has a 12b-1 distribution plan under the 1940 Act pursuant to which an annual fee, based on average daily net assets, is paid to the distributor for various disbursements such as broker-dealer account servicing fees and other promotional expenses of the Fund. The Fund is authorized under the 12b-1 plan to pay fees on each class up to the following limits:
| Class A | | | 0.35 | % | |
| Class B | | | 1.00 | % | |
| Class C | | | 1.00 | % | |
| Class C2 | | | 1.00 | % | |
| Class M | | | 0.90 | % | |
Class C2 and Class M merged into Class C on June 15, 2004 and September 24, 2004, respectively.
In the case the Fund or a class of shares of the Fund is closed to new investors or investments, the Fund is authorized to pay 12b-1 fees for past sales and distribution efforts and present and past investor services.
Underwriter commissions relate to front-end sales charges imposed for Class A and M shares and contingent deferred sales charges from Classes B, C, M and certain A share redemptions. For the year ended October 31, 2004, the underwriter commissions were as follows:
| Received by Underwriter | | $ | 221 | | |
| Retained by Underwriter | | | 9 | | |
| Contingent Deferred Sales Charge | | | 12 | | |
Administrative services: The Fund has entered into an agreement with ATFS for financial and legal fund administration services, which includes such items as compliance, expenses, financial statements and other reporting, distributions, tax returns, prospectus preparation, board of trustees meeting support and other legal matters. The Fund pays ATFS an annual fee of 0.015% of average net assets. The Legal fees on the Statement of Operations are for fees paid to external legal counsel.
The Fund paid ATFS $20 for the year ended October 31, 2004.
Transfer agent fees: The Fund pays ATIS an annual per-account charge of $20 (not in thousands) for each open account and $1.63 (not in thousands) for each closed account. There is no new account charge. The transfer agent fees on the Statement of Operations are made up of fees paid to ATIS and costs associated with shareholder statements. The Fund paid ATIS $9 for the year ended October 31, 2004.
Deferred compensation plan: Each eligible Fund Trustee may elect participation in the Deferred Compensation Plan ("the Plan"). Under the Plan, such Trustees may defer payment of a percentage of their total fees earned as a Fund Trustee. These deferred amounts may be invested in any Transamerica IDEX Mutual Fund. At October 31, 2004, the value of invested plan amount was $2. Invested plan amounts and the total liability for deferred compensation to the Trustees under the Plan at October 31, 2004, are included in the accompanying Statement of Assets and Liabilities.
Transamerica IDEX Mutual Funds
Annual Report 2004
11
TA IDEX Clarion Real Estate Securities
NOTES TO FINANCIAL STATEMENTS (continued)
At October 31, 2004
(all amounts in thousands)
NOTE 4. INVESTMENT TRANSACTIONS
The cost of securities purchased and proceeds from securities sold (excluding short-term securities) for the year ended October 31, 2004, were as follows:
| Purchases of securities: | | | |
| Long-Term excluding U.S. Government | | $ | 120,876 | | |
| U.S. Government | | | – | | |
| Proceeds from maturities and sales of securities: | | | |
| Long-Term excluding U.S. Government | | | 75,300 | | |
| U.S. Government | | | – | | |
NOTE 4. FEDERAL INCOME TAX MATTERS
The Fund has not made any provision for federal income or excise taxes due to its policy to distribute all of its taxable income and capital gains to its shareholders and otherwise qualify as a regulated investment company under the Internal Revenue Code. Income and capital gain distributions are determined in accordance with income tax regulations, which may differ from GAAP. These differences are primarily due to differing treatment for items including, but not limited to, wash sales and distributions from REITs.
Reclassifications between Undistributed net investment income (loss), Undistributed net realized capital gains (loss) and Shares of beneficial interest are made to reflect income and gains available for distribution under federal tax regulations. Results of operations and net assets are not effected by these reclassifications. These reclassifications are as follows:
Shares of beneficial interest, unlimited
shares authorized | | $ | 158 | | |
| Undistributed net investment income (loss) | | | 1,206 | | |
Accumulated net realized gain (loss) from investment
securities | | | (1,364 | ) | |
The tax character of distributions paid may differ from the character of distributions shown in the Statements of Changes in Net Assets due to short-term gains being treated as ordinary income for tax purposes. The tax character of distributions paid during 2003 and 2004 was as follows:
| 2003 Distributions paid from: | |
| Ordinary Income | | $ | 614 | | |
| Long-term capital gain | | | – | | |
| 2004 Distributions paid from: | |
| Ordinary Income | | | 10,339 | | |
| Long-term capital gain | | | 1,362 | | |
The tax basis components of distributable earnings as of October 31, 2004, are as follows:
| Undistributed Ordinary Income | | $ | – | | |
| Undistributed Long-term Capital Gains | | $ | 1,745 | | |
| Capital Loss Carryforward | | $ | – | | |
| Net Unrealized Appreciation (Depreciation) | | $ | 18,850 | | |
The aggregate cost of investments and composition of unrealized appreciation (depreciation) for federal income tax purposes as of October 31, 2004, are as follows:
| Federal Tax Cost Basis | | $ | 128,896 | | |
| Unrealized Appreciation | | $ | 18,850 | | |
| Unrealized (Depreciation) | | | – | | |
| Net Unrealized Appreciation (Depreciation) | | $ | 18,850 | | |
NOTE 5. OTHER MATTERS
Transamerica IDEX Mutual Funds ("TA IDEX"), and certain of its affiliated entities, have received requests for information from the Staff of the Securities and Exchange Commission in connection with market timing and late trading within the funds. TA IDEX and the affiliated entities have voluntarily cooperated in the investigation and have beeen providing the information as requested.
Transamerica IDEX Mutual Funds
Annual Report 2004
12
Report of Independent Registered Certified Public Accounting Firm
To the Board of Trustees and Shareholders of
TA IDEX Clarion Real Estate Securities
In our opinion, the accompanying statement of assets and liabilities, including the schedule of investments, and the related statements of operations and of changes in net assets and the financial highlights present fairly, in all material respects, the financial position of TA IDEX Clarion Real Estate Securities (the "Fund") (one of the portfolios constituting the Transamerica IDEX Mutual Funds) at October 31, 2004, the results of its operations for the year then ended, and the changes in its net assets and the financial highlights for the year then ended and for the period March 1, 2003 (commencement of operations) through October 31, 2004, in conformity with accounting principles generally accepted in the United States of America. These financial statements and financial highlights (hereafter referred to as "financial statements") are the responsibility of the Fund's management; our respons ibility is to express an opinion on these financial statements based on our audits. We conducted our audits of these financial statements in accordance with the standards of the Public Company Accounting Oversight Board (United States). Those standards require that we plan and perform the audit to obtain reasonable assurance about whether the financial statements are free of material misstatement. An audit includes examining, on a test basis, evidence supporting the amounts and disclosures in the financial statements, assessing the accounting principles used and significant estimates made by management, and evaluating the overall financial statement presentation. We believe that our audits, which included confirmation of securities at October 31, 2004 by correspondence with the custodian and brokers, provide a reasonable basis for our opinion.

PricewaterhouseCoopers LLP
Tampa, Florida
December 28, 2004
Transamerica IDEX Mutual Funds
Annual Report 2004
13
TA IDEX Clarion Real Estate Securities
SUPPLEMENTAL INFORMATION (unaudited)
TAX INFORMATION
For tax purposes, the Fund has made a Long-Term Capital Gain Designation of $327 for the year ended October 31, 2004.
For dividends paid during the year ended October 31, 2004, the Fund designates qualified dividend income to the maximum extent allowable.
The information and distributions reported herein may differ from the information and distributions taxable to the shareholders for the calendar year ending December 31, 2004. Complete information will be computed and reported in conjunction with your 2004 Form 1099-DIV.
RESULTS OF SHAREHOLDER PROXY
At a special meeting of Class M shareholders of each series of Transamerica IDEX (except TA IDEX Federated Tax Exempt and TA IDEX Protected Principal Stock) held on September 2, 2004, the results of the Proposal were as follows:
Proposal 1: Approval of a conversion of Class M shares into Class C shares of the Funds, which will result in bearing the distribution and service fees payable under the 12b-1 Plan of Distribution for the Class C shares of the Funds.
| For | | Against | | Abstentions/Broker Non-Votes | |
| | 94.42 | % | | | 0.38 | % | | | 5.20 | % | |
Transamerica IDEX Mutual Funds
Annual Report 2004
14
TA IDEX Federated Tax Exempt
MARKET ENVIRONMENT
The municipal marketplace experienced a number of ups and downs during the 12 month reporting period. Increases in yields in the latter part of 2003 and the early months of 2004 were driven by an improving labor market, an accelerating economy, mild concern over inflation risks, and tightening of interest rates by the Federal Reserve Board. A soft patch, caused by spiking oil prices and terrorism risks that emerged in the summer months of 2004, prompted intermediate- and long-term yields to retrace late in the reporting period. This resulted in an overall flattening of the yield curve.
The portfolio's investment strategy focused on: (a) the effective duration of its portfolio (which indicates the portfolio's sensitivity to changes in interest rates); (b) the selection of securities with different maturities (expressed by a "yield curve" showing the relative yield of similar securities with different maturities); (c) the allocation of the portfolio among securities of similar issuers (referred to as "sectors"); and (d) the credit ratings of portfolio securities (which indicates the risk that securities will default). These were the most significant factors affecting the portfolio's performance relative to its benchmark index. In addition, the portfolio's total return reflected actual cash flows, transaction costs and other expenses, which were not reflected in the total return of the Lehman Brothers Municipal Bond Index ("LBMB"), the portfolio's benchmark index.
PERFORMANCE
For the year ended October 31, 2004, TA IDEX Federated Tax Exempt, Class A returned 5.61%. By comparison its benchmark, the LBMB, returned 6.03%.
STRATEGY REVIEW
Sector-During the reporting period, as compared to its benchmark index, the portfolio allocated more of its portfolio to securities issued by hospitals, industrial development projects, resource recovery and electric power sectors. The portfolio also allocated less of its securities to general obligation bonds issued by cities, states and school districts. These allocations helped the portfolio's performance due to the higher yields available in the over-weighted sectors and the smaller increase in the price of general obligation bonds as compared to other sectors.
Credit Quality-Credit spreads, or the yield difference between the AAA municipal bonds and bonds of lower credit quality and similar maturity, decreased during the reporting period. This decrease in credit spreads was the result of both improving economic activity and the demand for securities with higher yields.
Non-investment grade bonds outperformed the investment grade portion of the municipal market during the reporting period. However, the portfolio, unlike its benchmark index, concentrated in investment grade securities. As a result, the portfolio did not participate in the outperformance of lower quality municipal debt.
Maturity and Yield Curve-The most attractive segment of the municipal yield curve consisted of bonds with maturities of 10 to 20 years. Concentrated buying of municipal bonds with maturities of 10 to 20 years created increased volatility in the municipal bond market during the reporting period. The portfolio's concentration on purchasing municipal bonds with maturities of 10 to 20 years during the reporting period generally benefited the performance relative to the LBMB. In addition, the relative dearth of municipal debt issued during the reporting period caused municipal bonds to increase in value and helped to improve the portfolio's performance versus most taxable bond alternatives.
Duration-The portfolio's dollar-weighted average duration during the reporting period was 5.21 years. Duration management is a significant component of the portfolio's investment strategy. The portfolio maintained duration close to the LBMB and to the portfolio's peer groups, as interest rates were expected to rise during the reporting period. The neutral duration of the portfolio did not have a significant impact on the portfolio's performance. The portfolio's use of Treasury futures contracts, which did not perform well, to adjust portfolio duration primarily during the second half of the reporting period contributed to the portfolio's performance being less than its benchmark index.
J. Scott Albrecht, CFA
Mary Jo Ochson, CFA
Co-Fund Managers
Federated Investment Management Company
Transamerica IDEX Mutual Funds
Annual Report 2004
1
TA IDEX Federated Tax Exempt
Comparison of change in value of $10,000 investment in Class A shares and its comparative index.
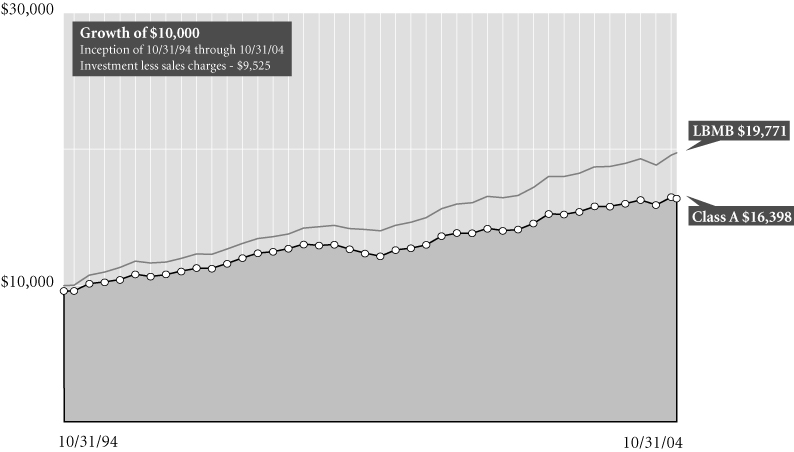
Average Annual Total Return for Periods Ended 10/31/04
| | | 1 year | | 5 years | | 10 years | | From
Inception | | Inception
Date | |
| Class A (NAV) | | | 5.61 | % | | | 6.48 | % | | | 5.71 | % | | | 6.94 | % | | 4/1/85 | |
| Class A (POP) | | | 0.59 | % | | | 5.45 | % | | | 5.20 | % | | | 6.67 | % | | 4/1/85 | |
| LBMB1 | | | 6.03 | % | | | 7.18 | % | | | 7.06 | % | | | 8.20 | % | | 4/1/85 | |
| Class B (NAV) | | | 4.93 | % | | | 5.80 | % | | | – | | | | 4.60 | % | | 10/1/95 | |
| Class B (POP) | | | (0.07 | )% | | | 5.64 | % | | | – | | | | 4.60 | % | | 10/1/95 | |
| Class C (NAV) | | | 4.95 | % | | | – | | | | – | | | | 4.43 | % | | 11/11/02 | |
| Class C (POP) | | | 3.95 | % | | | – | | | | – | | | | 4.43 | % | | 11/11/02 | |
| Class M (NAV) | | | 5.31 | % | | | 6.22 | % | | | 5.44 | % | | | 4.70 | % | | 11/11/02 | |
| Class M (POP) | | | 3.25 | % | | | 6.01 | % | | | 5.33 | % | | | 4.60 | % | | 11/11/02 | |
NOTES
1 The Lehman Brothers Municipal Bond (LBMB) Index is an unmanaged index used as a general measure of market performance. Calculations assume dividends and capital gains are reinvested and do not include any managerial expenses. From inception calculation is based on life of Class A shares. Source: Standard & Poor's Micropal®© Micropal, Inc. 2004 – 1-800-596-5323 – http://www.micropal.com.
The performance data presented represents past performance, future results may vary. Performance data does not reflect the deduction of taxes that would be paid on fund distributions or the redemption of fund shares. Investment return and principal value will fluctuate so that an investor's shares, when redeemed, may be worth more or less than their original cost. Current performance may be lower or higher than performance quoted.
Public Offering Price (POP) returns include the reinvestment of dividends and capital gains and reflect the maximum sales charge of 4.75% for A shares and 1% for M shares or the maximum applicable contingent deferred sales charge (5% in the 1st year, decreasing to 0% after 6 years) for Class B shares and 1% (during the first 12 months) for Class C shares. Shares purchased prior to March 1, 2004 are subject to a maximum applicable contingent deferred sales charge (5% in the 1st year, decreasing to 0% after 7 years) for Class B shares and (2% in the 1st year, decreasing to 0% after 2 years) for Class C shares. Net Asset Value (NAV) returns include the reinvestment of dividends and capital gains but do not reflect any sales charges.
Income derived from this fund may be subject to federal alternative minimum tax, as well as state and/or local taxes.
This material must be preceded or accompanied by a current prospectus, which includes specific contents regarding the investment objectives and policies of this fund.
Transamerica IDEX Mutual Funds
Annual Report 2004
2
TA IDEX Federated Tax Exempt
UNDERSTANDING YOUR FUND'S EXPENSES (unaudited)
SHAREHOLDER EXPENSES
The following Example is intended to help you understand your ongoing costs (in dollars and cents) of investing in a Fund and to compare these costs with the ongoing costs of investing in other funds.
The Example is based on an investment of $1,000 invested at the beginning of the period and held for the entire period from May 1, 2004 to October 31, 2004.
ACTUAL EXPENSES
The first line in the table below provides information about actual account values and actual expenses. You may use the information in this line, together with the amount you invested, to estimate the expenses that you paid over the period. Simply divide your account value by $1,000 (for example, an $8,600 account value divided by $1,000 = 8.6), then multiply the result by the number in the first line of your Fund under the heading entitled "Expenses Paid During Period" to estimate the expenses you paid on your account during this period.
HYPOTHETICAL EXAMPLE FOR COMPARISON PURPOSES
The second line in the table below provides information about hypothetical account values and hypothetical expenses based on each Fund's actual expense ratio and an assumed rate of return of 5% per year before expenses, which is not the Fund's actual return. The hypothetical account values and expenses may not be used to estimate the actual ending account balance or expenses you paid for the period. You may use this information to compare the ongoing costs of investing in your Fund and other funds. To do so, compare this 5% hypothetical example with the 5% hypothetical examples that appear in the shareholder reports of the other funds.
Please note that the expenses shown in the table are meant to highlight your ongoing costs only and do not reflect any transactional costs, such as sales charges, redemption fees, brokerage commissions paid on purchases and sales of fund shares. Therefore, the second line under each Fund in the table is useful in comparing ongoing costs only, and will not help you determine the relative total costs of owning different funds. In addition, note that the expenses shown in the table are meant to highlight your ongoing costs and do not reflect any transaction costs.
| | | Beginning
Account
Value | | Ending
Account
Value | | Annualized
Expense
Ratio | |
Expenses Paid
During Period (a) | |
| Class A | | | |
| Actual | | $ | 1,000.00 | | | $ | 1,043.00 | | | | 1.37 | % | | $ | 7.04 | | |
| Hypothetical (b) | | | 1,000.00 | | | | 1,018.25 | | | | 1.37 | | | | 6.95 | | |
| Class B | |
| Actual | | | 1,000.00 | | | | 1,039.70 | | | | 2.02 | | | | 10.36 | | |
| Hypothetical (b) | | | 1,000.00 | | | | 1,014.98 | | | | 2.02 | | | | 10.23 | | |
| Class C | |
| Actual | | | 1,000.00 | | | | 1,039.90 | | | | 2.01 | | | | 10.31 | | |
| Hypothetical (b) | | | 1,000.00 | | | | 1,015.03 | | | | 2.01 | | | | 10.18 | | |
| Class M | |
| Actual | | | 1,000.00 | | | | 1,042.30 | | | | 0.54 | | | | 2.77 | | |
| Hypothetical (b) | | | 1,000.00 | | | | 1,022.42 | | | | 0.54 | | | | 2.75 | | |
(a) Expenses are calculated using each Fund's annualized expense ratio (as disclosed in the table), multiplied by the average account value for the period, multiplied by number of days in the period (184 days), and divided by the number of days in the year (366 days).
(b) 5% return per year before expenses.
GRAPHIC PRESENTATION OF SCHEDULE OF INVESTMENTS
By Municipal Bond Type
At October 31, 2004
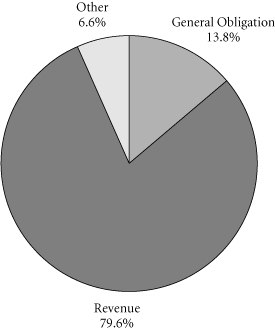
This chart shows the percentage breakdown by municipal bond type of the Fund's total investment securities.
Transamerica IDEX Mutual Funds
Annual Report 2004
3
TA IDEX Federated Tax Exempt
SCHEDULE OF INVESTMENTS
At October 31, 2004
(all amounts except share amounts in thousands)
| | | Principal | | Value | |
| LONG-TERM MUNICIPAL BONDS (97.6%) | |
| Alabama (1.8%) | |
Alabama Water Pollution Control Authority,
Revenue Bonds,
5.50%, due 08/15/2023 | | $ 500 | | $ | 556 | | |
| Arkansas (1.7%) | |
Jefferson County, AR, (Jefferson Hospital
Association, Inc.), Revenue Bonds, Series B,
5.80%, due 06/01/2021 | | 500 | | | 537 | | |
| California (4.1%) | |
California Health Facilities Financing Authority,
(Catholic Healthcare West),
Revenue Bonds, Series I, (a)
4.95%, due 07/01/2026 | | 145 | | | 152 | | |
California State, General Obligation Bonds,
5.25%, due 02/01/2014 | | 500 | | | 557 | | |
Torrance, CA, (Torrance Memorial Medical
Center), Revenue Bonds, Series A,
6.00%, due 06/01/2022 | | 500 | | | 559 | | |
| Colorado (1.8%) | |
Colorado Department of Transportation,
Revenue Bonds, Series A,
5.50%, due 06/15/2015 | | 500 | | | 576 | | |
| District of Columbia (1.9%) | |
District of Columbia Water & Sewer Authority,
Revenue Bonds,
5.50%, due 10/01/2017 | | 500 | | | 589 | | |
| Illinois (8.7%) | |
Illinois Educational Facilities Authority,
(Loyola University), Revenue Bonds, Series A,
5.00%, due 07/01/2026 | | 500 | | | 510 | | |
Illinois State Partnership, Department of
Central Management, Public Improvements,
General Obligations Bonds,
5.65%, due 07/01/2017 | | 1,000 | | | 1,076 | | |
McHenry County, IL, Community Unit School
District No. 200, Prerefunded, Series A,
5.85%, due 01/01/2016 | | 770 | | | 855 | | |
McHenry County, IL, Community Unit School
District No. 200, Unrefunded, Series A,
5.85%, due 01/01/2016 | | 230 | | | 252 | | |
| Indiana (6.3%) | |
Indiana Health Facility Financing Authority,
(Community Foundation Northwest, IN),
Revenue Bonds,
6.25%, due 03/01/2025 | | 300 | | | 310 | | |
| | | Principal | | Value | |
| Indiana (continued) | | | |
Indiana State Development Finance Authority,
(USX Corp./Marathon Oil Co.),
Revenue Bonds, (a)
5.25%, due 12/01/2022 | | $ 500 | | $ | 552 | | |
Indianapolis, IN, (Distribution System),
Revenue Bonds, Series A,
5.25%, due 08/15/2012 | | 1,000 | | | 1,096 | | |
| Iowa (1.7%) | | | |
Iowa State, Certificates of Participation,
Revenue Bonds,
6.50%, due 07/01/2006 | | 535 | | | 537 | | |
| Louisiana (1.7%) | | | |
Sabine River Authority, (International Paper Co.),
Water Facilities, Revenue Bonds,
6.20%, due 02/01/2025 | | 500 | | | 530 | | |
| Massachusetts (1.8%) | | | |
Massachusetts State Development Finance
Agency, (Massachusetts College of
Pharmacy & Allied Health Services),
Revenue Bonds,
6.38%, due 07/01/2023 | | 500 | | | 557 | | |
| Michigan (3.6%) | | | |
Cornell Township, MI, Economic
Development Corp.,
(MeadWestvaco/Mead Corp.),
Revenue Bonds,
5.88%, due 05/01/2018 | | 500 | | | 536 | | |
Michigan Municipal Bond Authority,
Revenue Bonds,
5.50%, due 10/01/2022 | | 500 | | | 575 | | |
| Minnesota (1.7%) | | | |
Minneapolis & St. Paul, MN, Housing &
Redevelopment Authority,
(Group Health Plan, Inc.), Revenue Bonds,
6.00%, due 12/01/2019 | | 500 | | | 536 | | |
| Mississippi (1.9%) | | | |
Lowndes County, MS, Solid Waste Disposal &
Pollution Control, (Weyerhaeuser Co.),
Revenue Bonds,
6.70%, due 04/01/2022 | | 500 | | | 594 | | |
| Nevada (3.0%) | | | |
Clark County, NV, Industrial Development,
(Southwest Gas Corp.), Revenue Bonds, (a)
5.45%, due 03/01/2038 | | 400 | | | 423 | | |
The notes to the financial statements are an integral part of this report.
Transamerica IDEX Mutual Funds
Annual Report 2004
4
TA IDEX Federated Tax Exempt
SCHEDULE OF INVESTMENTS (continued)
At October 31, 2004
(all amounts except share amounts in thousands)
| | | Principal | | Value | |
| Nevada (continued) | |
Clark County, NV, School District, General
Obligations Bonds, Series F,
5.00%, due 06/15/2006 | | $ 500 | | $ | 524 | | |
| New Hampshire (0.4%) | |
New Hampshire State Housing Finance
Authority, Single Family Mortgage,
Revenue Bonds, Series C,
6.13%, due 01/01/2020 | | 110 | | | 112 | | |
| New Jersey (0.7%) | |
New Jersey Economic Development Authority,
(Winchester Gardens/Marcus L Ward Home),
Revenue Bonds, Series A,
5.80%, due 11/01/2031 | | 200 | | | 203 | | |
| New Mexico (0.7%) | |
New Mexico Mortgage Finance Authority,
Revenue Bonds,
6.05%, due 09/01/2021 | | 195 | | | 207 | | |
| New York (15.7%) | |
Hempstead Town, NY, Industrial Development
Agency, (Hofstra University), Revenue Bonds,
4.63%, due 07/01/2021 | | 500 | | | 506 | | |
New York City, NY, City Industrial Development
Agency, (New York University), Revenue Bonds,
5.38%, due 07/01/2017 | | 250 | | | 278 | | |
New York State Dormitory Authority,
(New York Methodist Hospital),
Revenue Bonds, Series A,
5.25%, due 07/01/2024 | | 500 | | | 524 | | |
New York State Mortgage Agency, Revenue Bonds,
Series 95,
5.50%, due 10/01/2017 | | 500 | | | 536 | | |
New York, NY, City Industrial Development
Agency, (General Motors Corp.),
Revenue Bonds,
5.13%, due 12/30/2023 | | 500 | | | 500 | | |
New York, NY, City Transitional Finance
Authority, Revenue Bonds,
5.50%, due 02/15/2019 | | 360 | | | 411 | | |
New York, NY, City Transitional Finance
Authority, Revenue Bonds,
5.50%, due 02/15/2019 | | 640 | | | 713 | | |
Niagara County, NY, Industrial Development
Agency, (American Ref-Fuel Co. LLC),
Revenue Bonds, Series D, (a)
5.55%, due 11/15/2024 | | 500 | | | 535 | | |
| | | Principal | | Value | |
| New York (continued) | |
United Nations Development Corp.,
Revenue Bonds, Series A,
5.25%, due 07/01/2024 | | $ 250 | | $ | 266 | | |
Warwick Valley Central School District, NY,
General Obligations Bonds,
5.50%, due 01/15/2017 | | 570 | | | 638 | | |
| North Carolina (3.9%) | |
North Carolina Eastern Municipal Power Agency,
Revenue Bonds, Series A,
5.50%, due 01/01/2012 | | 500 | | | 550 | | |
North Carolina Medical Care Commission,
(Arc of North Carolina),
5.50%, due 10/01/2024 | | 240 | | | 243 | | |
North Carolina State Housing Finance Agency,
Revenue Bonds,
5.25%, due 01/01/2022 | | 420 | | | 436 | | |
| North Dakota (0.9%) | |
North Dakota State Housing Finance Agency,
Revenue Bonds, Series C,
6.00%, due 07/01/2020 | | 275 | | | 282 | | |
| Ohio (6.2%) | |
Cleveland, OH, Municipal School District,
5.25%, due 12/01/2024 | | 300 | | | 324 | | |
Ohio State Air Quality Development Authority,
(Cleveland Electric Illumination),
Revenue Bonds,
6.00%, due 12/01/2013 | | 500 | | | 528 | | |
Ohio State, General Obligations Bonds, Series A,
5.38%, due 09/15/2017 | | 500 | | | 561 | | |
Ohio State, Highway Improvement,
Revenue Bonds,
5.00%, due 06/15/2006 | | 500 | | | 524 | | |
| Pennsylvania (4.6%) | |
Pennsylvania State Higher Educational Facilities
Authority, (LaSalle University), Revenue Bonds,
5.25%, due 05/01/2023 | | 350 | | | 361 | | |
Pennsylvania State Higher Educational Facilities
Authority, (UPMC Health System),
Revenue Bonds,
6.00%, due 01/15/2022 | | 500 | | | 535 | | |
Sayre, PA, Health Care Facilities Authority,
(Guthrie Healthcare System), Revenue Bonds,
5.75%, due 12/01/2021 | | 500 | | | 533 | | |
The notes to the financial statements are an integral part of this report.
Transamerica IDEX Mutual Funds
Annual Report 2004
5
TA IDEX Federated Tax Exempt
SCHEDULE OF INVESTMENTS (continued)
At October 31, 2004
(all amounts except share amounts in thousands)
| | | Principal | | Value | |
| Rhode Island (5.3%) | | | |
Providence, RI, Public Building Authority,
Revenue Bonds, Series A,
5.70%, due 12/15/2015 | | $ 500 | | $ | 576 | | |
Rhode Island Clean Water Finance Agency,
(Triton Ocean LLC), Revenue Bonds,
5.80%, due 09/01/2022 | | 1,000 | | | 1,085 | | |
| South Dakota (1.7%) | | | |
South Dakota Housing Development Authority,
Revenue Bonds, Series C,
5.35%, due 05/01/2022 | | 500 | | | 530 | | |
| Tennessee (3.4%) | | | |
Memphis-Shelby County, TN, Airport Authority,
(Federal Express Corp.), Revenue Bonds,
5.00%, due 09/01/2009 | | 500 | | | 536 | | |
Tennessee Housing Development Agency,
Revenue Bonds,
5.38%, due 01/01/2018 | | 495 | | | 530 | | |
| Texas (4.0%) | | | |
Kingsbridge, TX, Municipal Utility District,
General Obligations Bonds,
5.38%, due 03/01/2015 | | 500 | | | 533 | | |
Port Houston Authority, Harris County, General
Obligation Bonds, Series A,
5.50%, due 10/01/2024 | | 500 | | | 551 | | |
Sabine River Authority, (TXU Energy Co. LLC),
Revenue Bonds, Series A,
5.80%, due 07/01/2022 | | 165 | | | 170 | | |
| | | Principal | | Value | |
| Washington (3.7%) | |
Energy Northwest, WA, Electric, (Bonneville
Power Administration), Revenue Bonds,
Series A,
5.75%, due 07/01/2018 | | | $ 500 | | | $ | 573 | | |
University of Washington, Student Facilities
Improvements, Revenue Bonds,
5.88%, due 06/01/2016 | | | 500 | | | | 572 | | |
| Wisconsin (0.9%) | |
Wisconsin State Health & Educational Facilities
Authority, (Agnesian Healthcare, Inc.),
Revenue Bonds,
6.00%, due 07/01/2021 | | | 250 | | | | 266 | | |
| Wyoming (3.8%) | |
Wyoming State Farm Loan Board, Capital
Facilities, Revenue Bonds,
5.75%, due 10/01/2020 | | | 1,000 | | | | 1,189 | | |
| Total Long-Term Municipal Bonds (cost: $28,188) | | | | | | | 30,406 | | |
| SHORT-TERM MUNICIPAL BONDS (1.3%) | |
Indiana Health Facility Financing Authority,
(Clarian Health Partners), Revenue Bonds, (a)
1.72%, due 03/01/2030 | | | 400 | | | | 400 | | |
| Total Short-Term Municipal Bonds (cost: $400) | | | | | | | 400 | | |
| Total Investment Securities (cost: $28,588) | | | | | | $ | 30,806 | | |
| SUMMARY: | |
| Investments, at value | | | 98.9 | % | | $ | 30,806 | | |
| Other assets in excess of liabilities | | | 1.1 | % | | | 341 | | |
| Net assets | | | 100.0 | % | | $ | 31,147 | | |
NOTES TO SCHEDULE OF INVESTMENTS:
(a) Floating or variable rate note. Rate is listed as of October 31, 2004.
The notes to the financial statements are an integral part of this report.
Transamerica IDEX Mutual Funds
Annual Report 2004
6
TA IDEX Federated Tax Exempt
STATEMENT OF ASSETS AND LIABILITIES
At October 31, 2004
(all amounts except per share amounts in thousands)
| Assets: | | | |
| Investment securities, at value (cost: $28,588) | | $ | 30,806 | | |
| Cash | | | 53 | | |
| Receivables: | |
| Interest | | | 449 | | |
| Other | | | 5 | | |
| | | | 31,313 | | |
| Liabilities: | | | |
| Accounts payable and accrued liabilities: | |
| Shares of beneficial interest redeemed | | | 27 | | |
| Management and advisory fees | | | 49 | | |
| Distribution fees | | | 16 | | |
| Transfer agent fees | | | 11 | | |
| Other | | | 63 | | |
| | | | 166 | | |
| Net Assets | | $ | 31,147 | | |
| Net Assets Consist of: | | | |
Shares of beneficial interest, unlimited shares
authorized, no par value | | $ | 29,505 | | |
| Undistributed net investment income (loss) | | | 12 | | |
Accumulated net realized gain (loss) from investment
securities and futures contracts | | | (587 | ) | |
Net unrealized appreciation (depreciation) on
investment securities | | | 2,217 | | |
| Net Assets | | $ | 31,147 | | |
| Net Assets by Class: | | | |
| Class A | | $ | 17,244 | | |
| Class B | | | 7,597 | | |
| Class C | | | 4,924 | | |
| Class M | | | 1,382 | | |
| Shares Outstanding: | | | |
| Class A | | | 1,450 | | |
| Class B | | | 639 | | |
| Class C | | | 414 | | |
| Class M | | | 116 | | |
| Net Asset Value Per Share: | | | |
| Class A | | $ | 11.90 | | |
| Class B | | | 11.89 | | |
| Class C | | | 11.89 | | |
| Class M | | | 11.89 | | |
| Maximum Offering Price Per Share (a): | | | |
| Class A | | $ | 12.49 | | |
| Class M | | | 12.01 | | |
(a) Includes the maximum selling commission (represented as a percentage of offering price) which is reduced on certain levels of sales as set forth in the Prospectus. Net asset value per share for Classes B and C shares represents offering price. The redemption price for Classes B, C and M shares equals net asset value less any applicable contingent deferred sales charge.
STATEMENT OF OPERATIONS
For the year ended October 31, 2004
(all amounts in thousands)
| Investment Income: | | | |
| Interest | | $ | 1,692 | | |
| Expenses: | | | |
| Management and advisory fees | | | 204 | | |
| Transfer agent fees: | |
| Class A | | | 21 | | |
| Class B | | | 9 | | |
| Class C | | | 3 | | |
| Class C2 | | | 5 | | |
| Class M | | | 1 | | |
| Printing and shareholder reports | | | 5 | | |
| Custody fees | | | 21 | | |
| Administration fees | | | 12 | | |
| Legal fees | | | 1 | | |
| Audit and accounting fees | | | 24 | | |
| Trustees fees | | | 2 | | |
| Registration fees: | |
| Class A | | | 21 | | |
| Class B | | | 11 | | |
| Class C | | | 14 | | |
| Class C2 | | | 3 | | |
| Class M | | | 9 | | |
| Other | | | 3 | | |
| Distribution and service fees: | |
| Class A | | | 64 | | |
| Class B | | | 85 | | |
| Class C | | | 31 | | |
| Class C2 | | | 25 | | |
| Class M | | | 9 | | |
| Total expenses | | | 583 | | |
| Less: | |
| Reimbursement of Class expenses: | |
| Class A | | | (6 | ) | |
| Class B | | | (3 | ) | |
| Class C | | | (11 | ) | |
| Class M | | | (8 | ) | |
| Net expenses | | | 555 | | |
| Net Investment Income (Loss) | | | 1,137 | | |
| Net Realized Gain (Loss) from: | | | |
| Investment securities | | | 318 | | |
| Futures contracts | | | 9 | | |
| | | | 327 | | |
Increase (decrease) in unrealized appreciation
(depreciation) on investment securities | | | 211 | | |
| Net Gain (Loss) on Investments and Futures Contracts | | | 538 | | |
Net Increase (Decrease) in Net Assets Resulting
from Operations | | $ | 1,675 | | |
The notes to the financial statements are an integral part of this report.
Transamerica IDEX Mutual Funds
Annual Report 2004
7
TA IDEX Federated Tax Exempt
STATEMENTS OF CHANGES IN NET ASSETS
For the years ended
(all amounts in thousands)
| | | October 31,
2004 | | October 31,
2003 | |
| Increase (Decrease) in Net Assets From: | | | |
| Operations: | | | |
| Net investment income (loss) | | $ | 1,137 | | | $ | 1,310 | | |
Net realized gain (loss) from
investment securities
and futures contracts | | | 327 | | | | 102 | | |
Net unrealized appreciation
(depreciation) on investment
securities | | | 211 | | | | 553 | | |
| | | | 1,675 | | | | 1,965 | | |
| Distributions to Shareholders: | | | |
| From net investment income: | |
| Class A | | | (692 | ) | | | (704 | ) | |
| Class B | | | (266 | ) | | | (338 | ) | |
| Class C | | | (95 | ) | | | (31 | ) | |
| Class C2 | | | (81 | ) | | | (141 | ) | |
| Class M | | | (56 | ) | | | (80 | ) | |
| | | | (1,190 | ) | | | (1,294 | ) | |
| Capital Share Transactions: | | | |
| Proceeds from shares sold: | |
| Class A | | | 1,066 | | | | 12,413 | | |
| Class B | | | 825 | | | | 2,696 | | |
| Class C | | | 1,802 | | | | 2,135 | | |
| Class C2 | | | 634 | | | | 1,764 | | |
| Class M | | | 9 | | | | 168 | | |
| | | | 4,336 | | | | 19,176 | | |
Dividends and distributions
reinvested: | |
| Class A | | | 526 | | | | 533 | | |
| Class B | | | 168 | | | | 225 | | |
| Class C | | | 60 | | | | 21 | | |
| Class C2 | | | 31 | | | | 73 | | |
| Class M | | | 48 | | | | 65 | | |
| | | | 833 | | | | 917 | | |
| Cost of shares redeemed: | |
| Class A | | | (3,582 | ) | | | (14,819 | ) | |
| Class B | | | (3,427 | ) | | | (5,234 | ) | |
| Class C | | | (1,927 | ) | | | (533 | ) | |
| Class C2 | | | (1,523 | ) | | | (2,980 | ) | |
| Class M | | | (565 | ) | | | (1,294 | ) | |
| | | | (11,024 | ) | | | (24,860 | ) | |
| Class level exchanges: | |
| Class C | | | 3,266 | | | | – | | |
| Class C2 | | | (3,266 | ) | | | – | | |
| | | | – | | | | – | | |
| | | | (5,855 | ) | | | (4,767 | ) | |
| Net increase (decrease) in net assets | | | (5,370 | ) | | | (4,096 | ) | |
| Net Assets: | | | |
| Beginning of year | | | 36,517 | | | | 40,613 | | |
| End of year | | $ | 31,147 | | | $ | 36,517 | | |
Undistributed Net Investment Income
(Loss) | | $ | 12 | | | $ | 64 | | |
| | | October 31,
2004 | | October 31,
2003 | |
| Share Activity: | | | |
| Shares issued: | |
| Class A | | | 90 | | | | 1,067 | | |
| Class B | | | 70 | | | | 231 | | |
| Class C | | | 151 | | | | 183 | | |
| Class C2 | | | 53 | | | | 152 | | |
| Class M | | | 1 | | | | 14 | | |
| | | | 365 | | | | 1,647 | | |
Shares issued–reinvested from
distributions: | |
| Class A | | | 45 | | | | 46 | | |
| Class B | | | 14 | | | | 20 | | |
| Class C | | | 5 | | | | 2 | | |
| Class C2 | | | 3 | | | | 6 | | |
| Class M | | | 4 | | | | 6 | | |
| | | | 71 | | | | 80 | | |
| Shares redeemed: | |
| Class A | | | (304 | ) | | | (1,272 | ) | |
| Class B | | | (291 | ) | | | (448 | ) | |
| Class C | | | (165 | ) | | | (46 | ) | |
| Class C2 | | | (130 | ) | | | (256 | ) | |
| Class M | | | (49 | ) | | | (110 | ) | |
| | | | (939 | ) | | | (2,132 | ) | |
| Class level exchanges: | |
| Class C | | | 284 | | | | – | | |
| Class C2 | | | (284 | ) | | | – | | |
| | | | – | | | | – | | |
Net increase (decrease) in shares
outstanding: | |
| Class A | | | (169 | ) | | | (159 | ) | |
| Class B | | | (207 | ) | | | (197 | ) | |
| Class C | | | 275 | | | | 139 | | |
| Class C2 | | | (358 | ) | | | (98 | ) | |
| Class M | | | (44 | ) | | | (90 | ) | |
| | | | (503 | ) | | | (405 | ) | |
The notes to the financial statements are an integral part of this report.
Transamerica IDEX Mutual Funds
Annual Report 2004
8
TA IDEX Federated Tax Exempt
FINANCIAL HIGHLIGHTS
| | | | | For a share of beneficial interest outstanding throughout each period | |
| | | | | Net Asset | | Investment Operations | | Distributions | | Net Asset | |
| | | For the
Period
Ended (d)(g) | | Value,
Beginning
of Period | | Net
Investment
Income (Loss) | | Net Realized
and Unrealized
Gain (Loss) | | Total
Operations | | From Net
Investment
Income | | From Net
Realized
Gains | | Total
Distributions | | Value,
End
of Period | |
| Class A | | 10/31/2004 | | $ | 11.70 | | | $ | 0.43 | | | $ | 0.22 | | | $ | 0.65 | | | $ | (0.45 | ) | | $ | – | | | $ | (0.45 | ) | | $ | 11.90 | | |
| | | 10/31/2003 | | | 11.51 | | | | 0.41 | | | | 0.19 | | | | 0.60 | | | | (0.41 | ) | | | – | | | | (0.41 | ) | | | 11.70 | | |
| | | 10/31/2002 | | | 11.44 | | | | 0.38 | | | | 0.14 | | | | 0.52 | | | | (0.45 | ) | | | – | | | | (0.45 | ) | | | 11.51 | | |
| | | 10/31/2001 | | | 10.91 | | | | 0.40 | | | | 0.56 | | | | 0.96 | | | | (0.43 | ) | | | – | | | | (0.43 | ) | | | 11.44 | | |
| | | 10/31/2000 | | | 10.60 | | | | 0.44 | | | | 0.42 | | | | 0.86 | | | | (0.44 | ) | | | (0.11 | ) | | | (0.55 | ) | | | 10.91 | | |
| Class B | | 10/31/2004 | | | 11.69 | | | | 0.35 | | | | 0.22 | | | | 0.57 | | | | (0.37 | ) | | | – | | | | (0.37 | ) | | | 11.89 | | |
| | | 10/31/2003 | | | 11.51 | | | | 0.34 | | | | 0.17 | | | | 0.51 | | | | (0.33 | ) | | | – | | | | (0.33 | ) | | | 11.69 | | |
| | | 10/31/2002 | | | 11.44 | | | | 0.30 | | | | 0.11 | | | | 0.41 | | | | (0.34 | ) | | | – | | | | (0.34 | ) | | | 11.51 | | |
| | | 10/31/2001 | | | 10.90 | | | | 0.34 | | | | 0.56 | | | | 0.90 | | | | (0.36 | ) | | | – | | | | (0.36 | ) | | | 11.44 | | |
| | | 10/31/2000 | | | 10.59 | | | | 0.37 | | | | 0.42 | | | | 0.79 | | | | (0.37 | ) | | | (0.11 | ) | | | (0.48 | ) | | | 10.90 | | |
| Class C | | 10/31/2004 | | | 11.69 | | | | 0.35 | | | | 0.22 | | | | 0.57 | | | | (0.37 | ) | | | – | | | | (0.37 | ) | | | 11.89 | | |
| | | 10/31/2003 | | | 11.59 | | | | 0.33 | | | | 0.10 | | | | 0.43 | | | | (0.33 | ) | | | – | | | | (0.33 | ) | | | 11.69 | | |
| Class M | | 10/31/2004 | | | 11.70 | | | | 0.40 | | | | 0.21 | | | | 0.61 | | | | (0.42 | ) | | | – | | | | (0.42 | ) | | | 11.89 | | |
| | | 10/31/2003 | | | 11.51 | | | | 0.38 | | | | 0.19 | | | | 0.57 | | | | (0.38 | ) | | | – | | | | (0.38 | ) | | | 11.70 | | |
| | | 10/31/2002 | | | 11.44 | | | | 0.36 | | | | 0.09 | | | | 0.45 | | | | (0.38 | ) | | | – | | | | (0.38 | ) | | | 11.51 | | |
| | | 10/31/2001 | | | 10.91 | | | | 0.40 | | | | 0.53 | | | | 0.93 | | | | (0.40 | ) | | | – | | | | (0.40 | ) | | | 11.44 | | |
| | | 10/31/2000 | | | 10.59 | | | | 0.42 | | | | 0.42 | | | | 0.84 | | | | (0.41 | ) | | | (0.11 | ) | | | (0.52 | ) | | | 10.91 | | |
| | | | | | | Ratios/Supplemental Data | |
| | | For the
Period | | Total | | Net Assets,
End of
Period | | Ratio of Expenses
to Average
Net Assets (a) | | Net Investment
Income (Loss)
to Average | | Portfolio
Turnover | |
| | | Ended (g) | | Return (c) | | (000's) | | Net (e) | | Total (f) | | Net Assets (a) | | Rate (b) | |
| Class A | | 10/31/2004 | | | 5.61 | % | | $ | 17,244 | | | | 1.35 | % | | | 1.38 | % | | | 3.63 | % | | | 16 | % | |
| | | 10/31/2003 | | | 5.26 | | | | 18,948 | | | | 1.35 | | | | 1.52 | | | | 3.53 | | | | 22 | | |
| | | 10/31/2002 | | | 4.26 | | | | 20,469 | | | | 1.35 | | | | 1.46 | | | | 3.63 | | | | 55 | | |
| | | 10/31/2001 | | | 8.99 | | | | 23,190 | | | | 1.35 | | | | 1.48 | | | | 3.80 | | | | 35 | | |
| | | 10/31/2000 | | | 8.38 | | | | 16,999 | | | | 1.35 | | | | 1.68 | | | | 4.14 | | | | 67 | | |
| Class B | | 10/31/2004 | | | 4.93 | | | | 7,597 | | | | 2.00 | | | | 2.03 | | | | 2.98 | | | | 16 | | |
| | | 10/31/2003 | | | 4.48 | | | | 9,897 | | | | 2.00 | | | | 2.17 | | | | 2.88 | | | | 22 | | |
| | | 10/31/2002 | | | 3.63 | | | | 12,019 | | | | 2.00 | | | | 2.11 | | | | 2.98 | | | | 55 | | |
| | | 10/31/2001 | | | 8.32 | | | | 6,276 | | | | 2.00 | | | | 2.13 | | | | 3.15 | | | | 35 | | |
| | | 10/31/2000 | | | 7.72 | | | | 1,728 | | | | 2.00 | | | | 2.33 | | | | 3.49 | | | | 67 | | |
| Class C | | 10/31/2004 | | | 4.95 | | | | 4,924 | | | | 2.00 | | | | 2.33 | | | | 2.99 | | | | 16 | | |
| | | 10/31/2003 | | | 3.76 | | | | 1,621 | | | | 2.00 | | | | 2.17 | | | | 2.88 | | | | 22 | | |
| Class M | | 10/31/2004 | | | 5.31 | | | | 1,382 | | | | 1.60 | | | | 2.10 | | | | 3.38 | | | | 16 | | |
| | | 10/31/2003 | | | 5.00 | | | | 1,869 | | | | 1.60 | | | | 1.77 | | | | 3.28 | | | | 22 | | |
| | | 10/31/2002 | | | 4.02 | | | | 2,878 | | | | 1.60 | | | | 1.71 | | | | 3.38 | | | | 55 | | |
| | | 10/31/2001 | | | 8.73 | | | | 2,413 | | | | 1.60 | | | | 1.73 | | | | 3.55 | | | | 35 | | |
| | | 10/31/2000 | | | 8.13 | | | | 2,014 | | | | 1.60 | | | | 1.93 | | | | 3.89 | | | | 67 | | |
The notes to the financial statements are an integral part of this report.
Transamerica IDEX Mutual Funds
Annual Report 2004
9
TA IDEX Federated Tax Exempt
FINANCIAL HIGHLIGHTS (continued)
NOTES TO FINANCIAL HIGHLIGHTS
(a) Annualized.
(b) Not annualized for periods of less than one year.
(c) Total Return has been calculated for the applicable period without deduction of a sales load, if any, on an initial purchase. Periods of less than one year are not annualized.
(d) Per share information is calculated based on average number of shares outstanding for the years ended 10/31/2001, 10/31/2002, 10/31/2003 and 10/31/2004.
(e) Ratio of Net Expenses to Average Net Assets is net of fee waivers and reimbursements by the investment adviser, if any (see note 2).
(f) Ratio of Total Expenses to Average Net Assets includes all expenses before fee waivers and reimbursements by the investment adviser.
(g) The inception date for the Fund's offering of share Class L was November 11, 2002. Class L was renamed Class C on March 1, 2004 (see note 1).
The notes to the financial statements are an integral part of this report.
Transamerica IDEX Mutual Funds
Annual Report 2004
10
TA IDEX Federated Tax Exempt
NOTES TO FINANCIAL STATEMENTS
At October 31, 2004
(all amounts in thousands)
NOTE 1. ORGANIZATION AND SIGNIFICANT ACCOUNTING POLICIES
Transamerica IDEX Mutual Funds, formerly IDEX Mutual Funds, is a Massachusetts business trust registered under the Investment Company Act of 1940, as amended (the "1940 Act"), as an open-end management investment company. TA IDEX Federated Tax Exempt ("the Fund"), part of the Transamerica IDEX Mutual Funds, began operations on April 1, 1985.
On March 1, 2004, the Fund changed its name from IDEX Federated Tax Exempt to TA IDEX Federated Tax Exempt.
In the normal course of business, the Fund enters into contracts that contain a variety of representations and warranties, which provide general indemnifications. The Fund's maximum exposure under these arrangements is unknown, as this would involve future claims that may be made against the Fund and/or its affiliates that have not yet occurred. However, based on experience, the Fund expects the risk of loss to be remote.
See the Prospectus and Statement of Additional Information for a description of the Fund's investment objective.
In preparing the Fund's financial statements in accordance with accounting principles generally accepted in the United States of America ("GAAP"), estimates or assumptions (which could differ from actual results) may be used that affect reported amounts and disclosures. The following policies were consistently followed by the Fund, in accordance with GAAP.
Multiple class operations and expenses: The Fund currently offers four classes of shares, each with a public offering price that reflects different sales charges, if any, and expense levels. All shares designated as Class C shares prior to March 1, 2004, were renamed as Class C2 shares on that date. All shares designated as Class L shares prior to March 1, 2004, were renamed as class C shares with different sales charges than previous Class L shares. On June 15, 2004, Class C2 shares merged into Class C. Class B shares will convert to Class A shares eight years after purchase. Income, non-class specific expenses and realized and unrealized gains and losses, are allocated daily to each class, based upon the value of shares outstanding method permitted under Rule&n bsp;18f-3 of the 1940 Act. Each class bears its own specific expenses as well as a portion of general, common expenses.
Pricing of shares: The Fund prices its shares on the basis of the net asset value of each class of shares of the Fund, which is determined as of the close of the New York Stock Exchange ("NYSE") (generally 4:00 p.m. Eastern Time) on each day on which the NYSE is open for trading (other than a day on which there are insufficient changes in the value of the Fund's portfolio securities to materially affect the Fund's net asset value or a day on which no shares are tendered for redemption and no order to purchase any shares is received).
Security valuations: Fund investments traded on an exchange are valued at the closing price on the day of valuation on the exchange where the security is principally traded.
Securities traded in the over-the-counter market and listed securities for which no sale was reported on that date are valued at the last quoted bid price.
Debt securities are valued by independent pricing services; however, those that mature in sixty days or less are valued at amortized cost, which approximates market.
Other securities for which quotations are not readily available are valued at fair market value as determined in good faith using guidelines adopted by the Board of Trustees of the Fund, under the supervision of the Fund's Valuation Committee.
Cash: The Fund may leave cash overnight in its cash account with the custodian, Investors Bank & Trust Company ("IBT"). IBT has been contracted on behalf of the Fund to invest the excess cash into a savings account, which at October 31, 2004, was paying an interest rate of 1.30%.
Throughout the year, the Fund may have a cash overdraft balance. A fee is incurred on this overdraft, calculated by multiplying the overdraft by a rate based on the federal funds rate. This fee is included in Custody fees in the Statement of Operations.
Security transactions and investment income: Security transactions are recorded on the trade date. Security gains and losses are calculated on the specific identification basis. Interest income, including accretion of discounts and amortization of premiums, is recorded on the accrual basis commencing on the settlement date.
Futures contracts: The Fund may enter into futures contracts to manage exposure to market, interest rate or currency fluctuations. Futures contracts are valued at the settlement price established each day by the board of trade or exchange on which they are traded. The primary risks associated with futures contracts are imperfect correlation between the change in market value of the securities held and the prices of futures contracts; the possibility of an illiquid market and inability of the counterparty to meet the contract terms.
At October 31, 2004, there were no outstanding futures contracts.
Account maintenance fees: If the shareholder account balance falls below $1 by either shareholder action or as a result of market action, a $25 (not in thousands) fee is assessed every year until the balance reaches $1. The fee is assessed by redeeming shares in the shareholder's account.
Transamerica IDEX Mutual Funds
Annual Report 2004
11
TA IDEX Federated Tax Exempt
NOTES TO FINANCIAL STATEMENTS (continued)
At October 31, 2004
(all amounts in thousands)
NOTE 1.–(continued)
No fee will be charged under the following conditions:
• accounts opened within the preceding 24 months
• accounts with an active monthly Automatic Investment Plan ($50 (not in thousands) minimum per fund)
• accounts owned by an individual which, when combined by social security number, have a balance of $5 or more
• accounts owned by individuals in the same household (by address) that have a combined balance of $5 or more
• UTMA/UGMA accounts
• Fiduciary accounts
• B-share accounts whose shares have started to convert to A-shares accounts (as long as combined value of both accounts is at least $1)
For the year ended October 31, 2004, This fee totaled less than $1. These fees are included in Paid in Capital in the Statement of Assets and Liabilities.
Redemption fees: A short-term trading redemption fee may be assessed on any fund shares in a fund account that are sold during the first five (5) New York Stock Exchange trading days following their purchase date. This redemption fee will equal 2% of the amount redeemed and shares held the longest will be treated as being redeemed first and shares held the shortest as being redeemed last. For the year ended October 31, 2004, the Fund received no redemption fees.
Dividend distributions: Distributions to shareholders are recorded on the ex-dividend date and are determined in accordance with Federal income tax regulations which may differ from GAAP.
NOTE 2. RELATED PARTY TRANSACTIONS
AEGON/Transamerica Fund Advisers, Inc. ("ATFA") is the Fund's investment adviser. AEGON/Transamerica Fund Services, Inc. ("ATFS") is the Fund's administrator. AFSG Securities Corp. ("AFSG") is the Fund's distributor/principal underwriter. AEGON/Transamerica Investor Services, Inc. ("ATIS") is the Fund's transfer agent. ATIS and AFSG are 100% owned by AUSA Holding Company ("AUSA"). ATFA is a directly owned subsidiary of Western Reserve Life Assurance Co. of Ohio (78%) ("WRL") and AUSA (22%). ATFS is a wholly owned subsidiary of WRL. AUSA and WRL are wholly owned indirect subsidiaries of AEGON NV, a Netherlands corporation.
Investment advisory fee: The Fund pays management fees to ATFA based on average daily net assets ("ANA") at the following rate:
0.60% of ANA
ATFA has contractually agreed to waive its advisory fee and will reimburse the Fund to the extent that operating expenses, excluding 12b-1 fees, exceed the following stated annual limit:
1.00% Expense Limit
If total fund expenses fall below the annual expense limitation agreement agreed to by the adviser within the succeeding three years, the Fund may be required to pay that adviser a portion or all of the waived advisory fees.
If total class expenses fall below the annual expense limitation agreement agreed to by the adviser within the succeeding three years, the Fund may be required to pay that adviser a portion or all of the reimbursed class expenses.
| | | Reimbursement
of Class
Expenses | | Available
for Recapture
Through | |
| Fiscal Year 2004 | |
| Class A | | | 6 | | | 10/31/2007 | |
| Class B | | | 3 | | | 10/31/2007 | |
| Class C | | | 11 | | | 10/31/2007 | |
| Class M | | | 8 | | | 10/31/2007 | |
There were no amounts recaptured during the fiscal year ended October 31, 2004.
Distribution and service fees: The Fund has a 12b-1 distribution plan under the 1940 Act pursuant to which an annual fee, based on average daily net assets, is paid to the distributor for various disbursements such as broker-dealer account servicing fees and other promotional expenses of the Fund. The Fund is authorized under the 12b-1 plan to pay fees on each class up to the following limits:
| Class A | | | 0.35 | % | |
| Class B | | | 1.00 | % | |
| Class C | | | 1.00 | % | |
| Class C2 | | | 1.00 | % | |
| Class M | | | 0.60 | % | |
Class C2 merged into Class C on June 15, 2004.
In the case the Fund or a class of shares of the Fund is closed to new investors or investments, the Fund is authorized to pay 12b-1 fees for past sales and distribution efforts and present and past investor services.
Underwriter commissions relate to front-end sales charges imposed for Class A and M shares and contingent deferred sales charges from
Transamerica IDEX Mutual Funds
Annual Report 2004
12
TA IDEX Federated Tax Exempt
NOTES TO FINANCIAL STATEMENTS (continued)
At October 31, 2004
(all amounts in thousands)
NOTE 2.–(continued)
Classes B, C, M and certain A share redemptions. For the year ended October 31, 2004, the underwriter commissions were as follows:
| Received by Underwriter | | $ | 83 | | |
| Retained by Underwriter | | | 5 | | |
| Contingent Deferred Sales Charge | | | 47 | | |
Administrative services: The Fund has entered into an agreement with ATFS for financial and legal fund administration services, which includes such items as compliance, expenses, financial statements and other reporting, distributions, tax returns, prospectus preparation, board of trustees meeting support and other legal matters. The Fund pays ATFS an annualized fee of 0.015% of average net assets. The Legal fees on the Statement of Operations are for fees paid to external legal counsel.
The Fund paid ATFS $12 for the year ended October 31, 2004.
Transfer agent fees: The Fund pays ATIS an annul per-account charge of $20 (not in thousands) for each open account and $1.63 (not in thousands) for each closed account. There is no new account charge. The Fund paid ATIS $39 for the year ended October 31, 2004.
Deferred compensation plan: Each eligible Fund Trustee may elect participation in the Deferred Compensation Plan ("the Plan"). Under the Plan, such Trustees may defer payment of a percentage of their total fees earned as a Fund Trustee. These deferred amounts may be invested in any Transamerica IDEX Mutual Fund. At October 31, 2004, the value of invested plan amounts was $5. Invested plan amounts and the total liability for deferred compensation to the Trustees under the Plan at October 31, 2004, are included in the accompanying Statement of Assets and Liabilities.
NOTE 3. INVESTMENT TRANSACTIONS
The cost of securities purchased and proceeds from securities sold (excluding short-term securities) for the year ended October 31, 2004, were as follows:
| Purchases of securities: | | | |
| Long-Term excluding U.S. Government | | $ | 5,443 | | |
| U.S. Government | | | – | | |
| Proceeds from maturities and sales of securities: | | | |
| Long-Term excluding U.S. Government | | | 11,096 | | |
| U.S. Government | | | – | | |
NOTE 4. FEDERAL INCOME TAX MATTERS
The Fund has not made any provision for federal income or excise taxes due to its policy to distribute all of its taxable income and capital gains to its shareholders and otherwise qualify as a regulated investment company under the Internal Revenue Code. Income and capital gain distributions are determined in accordance with income tax regulations, which may differ from GAAP. These differences are primarily due to differing treatment for items including, but not limited to, wash sales, net operating losses and capital loss carryforwards.
Reclassifications between Undistributed net investment income (loss), Undistributed net realized capital gains (loss) and Shares of beneficial interest are made to reflect income and gains available for distribution under federal tax regulations. Results of operations and net assets are not effected by these reclassifications. These reclassifications are as follows:
Shares of beneficial interest, unlimited
shares authorized | | $ | (1 | ) | |
| Undistributed net investment income (loss) | | | 1 | | |
The capital loss carryforward is available to offset future realized capital gains through the period listed:
Capital Loss
Carryforward | | Available through | |
| $ | 587 | | | October 31, 2008 | |
The capital loss carryforward utilized during the year ended October 31, 2004 was $327.
The tax character of distributions paid may differ from the character of distributions shown in the Statements of Changes in Net Assets due to short-term gains being treated as ordinary income for tax purposes. The tax character of distributions paid during 2003 and 2004 was as follows:
| 2003 Distributions paid from: | |
| Tax Exempt Income | | $ | 1,294 | | |
| Long-term capital gain | | | – | | |
| 2004 Distributions paid from: | |
| Tax Exempt Income | | $ | 1,190 | | |
| Long-term capital gain | | | – | | |
The tax basis components of distributable earnings as of October 31, 2004, are as follows:
| Undistributed Tax Exempt Income | | $ | 19 | | |
| Undistributed Long-term Capital Gains | | $ | – | | |
| Capital Loss Carryforward | | $ | (587 | ) | |
| Net Unrealized Appreciation (Depreciation) | | $ | 2,218 | | |
Transamerica IDEX Mutual Funds
Annual Report 2004
13
TA IDEX Federated Tax Exempt
NOTES TO FINANCIAL STATEMENTS (continued)
At October 31, 2004
(all amounts in thousands)
NOTE 4.–(continued)
The aggregate cost of investments and composition of unrealized appreciation (depreciation) for federal income tax purposes as of October 31, 2004, are as follows:
| Federal Tax Cost Basis | | $ | 28,588 | | |
| Unrealized Appreciation | | $ | 2,223 | | |
| Unrealized (Depreciation) | | | (5 | ) | |
| Net Unrealized Appreciation (Depreciation) | | $ | 2,218 | | |
NOTE 5. OTHER MATTERS
Transamerica IDEX Mutual Funds ("TA IDEX"), and certain of its affiliated entities, have received requests for information from the Staff of the Securities and Exchange Commission in connection with market timing and late trading within the funds. TA IDEX and the affiliated entities have voluntarily cooperated in the investigation and have been providing the information as requested.
Transamerica IDEX Mutual Funds
Annual Report 2004
14
Report of Independent Registered Certified Public Accounting Firm
To the Board of Trustees and Shareholders of
TA IDEX Federated Tax Exempt
In our opinion, the accompanying statement of assets and liabilities, including the schedule of investments, and the related statements of operations and of changes in net assets and the financial highlights present fairly, in all material respects, the financial position of TA IDEX Federated Tax Exempt (the "Fund") (one of the portfolios constituting the Transamerica IDEX Mutual Funds) at October 31, 2004, the results of its operations for the year then ended, the changes in its net assets for each of the two years in the period then ended and the financial highlights for each of the periods indicated, in conformity with accounting principles generally accepted in the United States of America. These financial statements and financial highlights (hereafter referred to as "financial statements") are the responsibility of the Fund's management; our responsibility is to express an opinion on thes e financial statements based on our audits. We conducted our audits of these financial statements in accordance with the standards of the Public Company Accounting Oversight Board (United States). Those standards require that we plan and perform the audit to obtain reasonable assurance about whether the financial statements are free of material misstatement. An audit includes examining, on a test basis, evidence supporting the amounts and disclosures in the financial statements, assessing the accounting principles used and significant estimates made by management, and evaluating the overall financial statement presentation. We believe that our audits, which included confirmation of securities at October 31, 2004 by correspondence with the custodian and brokers, provide a reasonable basis for our opinion.

PricewaterhouseCoopers LLP
Tampa, Florida
December 28, 2004
Transamerica IDEX Mutual Funds
Annual Report 2004
15
TA IDEX Great Companies–AmericaSM
MARKET ENVIRONMENT
The market environment over the past twelve months has not been ideal for equities. The market likes certainty, and these times have been anything but certain. The major events negatively impacting the market have included:
• The uncertainties of the Presidential election-investors always question who will win and how stocks will be affected.
• The continued rise in the price of oil-there is an inverse relationship between oil prices and equity prices, and as oil prices rose, stock markets declined.
• The Spitzer investigations-Mr. Spitzer's (attorney general of New York State) investigations have highlighted poor corporate governance both in individual companies and mutual funds which has dampened investor enthusiasm for equities.
• The war in Iraq-the costs of the war and the loss of American lives has caused many people to question the value of this war.
• The rising real estate market-has attracted investors who sold stocks and invested in real estate.
• A major budget deficit-while necessary because of 9/11, the large deficit has become a long-term concern.
The positive factors have included the following:
• A low interest rate environment-with very little inflation.
• A growing economy-although growth is tepid, the economy is expanding.
Compared to 1999 when initial public offerings ("IPO's") and day trading were the talk of the day, many people are down on equities. This has resulted in many stocks in TA IDEX Great Companies–AmericaSM trading well below their intrinsic values.
PERFORMANCE
For the year ended October 31, 2004, TA IDEX Great Companies–AmericaSM, Class A returned 0.93%. By comparison its benchmark, the Standard and Poor's 500 Composite Stock Index, returned 9.41%.
STRATEGY REVIEW
In this environment, the stocks that have outperformed have included cyclical stocks, with oil and gas stocks, and utilities leading the way. While these two sectors tend to under-perform the market over the long-term, in the short-term they performed better than the market.
The stocks in the portfolio that outperformed included General Electric Company (+20.55), Johnson & Johnson (+18.25) and First Data Corporation (+15.85). Underperformers included Texas Instruments Incorporated (-15.16), Colgate-Palmolive Company (-14.53) and Wyeth (-7.97).
We have continued to follow our disciplined approach of carefully analyzing stocks before adding to or deleting them from the portfolio. Stocks that are trading well below their intrinsic values are given additional weighting in the portfolio. As of October 31, 2004 the average stock in the portfolio was trading at a 21% discount to its intrinsic value. For some time now, large-cap blue chip stocks have underperformed the market. Because of the discounts that exist, we believe that these stocks will once again return to favor in the near future.
Jim Huguet
Gerry Bollman, CFA
Matt Stephani, CFA, CPA
Co-Fund Managers
Great Companies, L.L.C.
Transamerica IDEX Mutual Funds
Annual Report 2004
1
TA IDEX Great Companies–AmericaSM
Comparison of change in value of $10,000 investment in Class A shares and its comparative index.
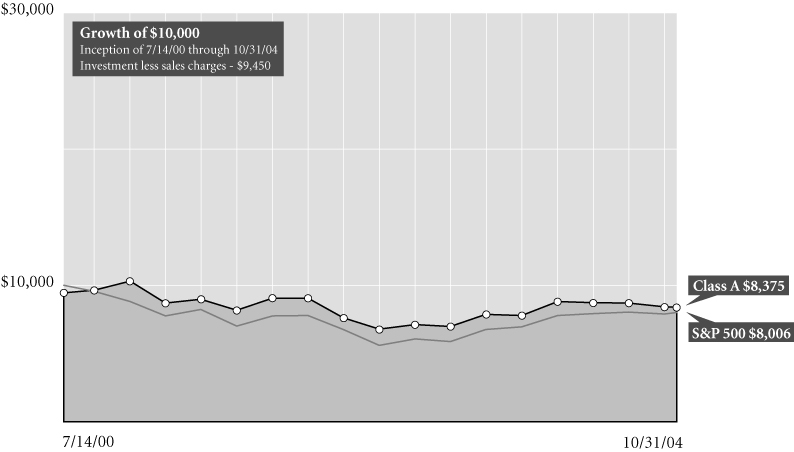
Average Annual Total Return for Periods Ended 10/31/04
| | | 1 year | | From
Inception | | Inception
Date | |
| Class A (NAV) | | | 0.93 | % | | | (2.80 | )% | | 7/14/00 | |
| Class A (POP) | | | (4.62 | )% | | | (4.07 | )% | | 7/14/00 | |
| S&P 5001 | | | 9.41 | % | | | (5.05 | )% | | 7/14/00 | |
| Class B (NAV) | | | 0.35 | % | | | (3.45 | )% | | 7/14/00 | |
| Class B (POP) | | | (4.65 | )% | | | (3.68 | )% | | 7/14/00 | |
| Class C (NAV) | | | 0.23 | % | | | 7.07 | % | | 11/11/02 | |
| Class C (POP) | | | (0.77 | )% | | | 7.07 | % | | 11/11/02 | |
NOTES
1 The Standard & Poor's 500 Composite Stock (S&P 500) Index is an unmanaged index used as a general measure of market performance. Calculations assume dividends and capital gains are reinvested and do not include any managerial expenses. From inception calculation is based on life of Class A shares. Source: Standard & Poor's Micropal®© Micropal, Inc. 2004 – 1-800-596-5323 – http://www.micropal.com.
The performance data presented represents past performance, future results may vary. Performance data does not reflect the deduction of taxes that would be paid on fund distributions or the redemption of fund shares. Investment return and principal value will fluctuate so that an investor's shares, when redeemed, may be worth more or less than their original cost. Current performance may be lower or higher than performance quoted.
Public Offering Price (POP) returns include the reinvestment of dividends and capital gains and reflect the maximum sales charge of 5.5% for A shares or the maximum applicable contingent deferred sales charge (5% in the 1st year, decreasing to 0% after 6 years) for Class B shares and 1% (during the first 12 months) for Class C shares. Shares purchased prior to March 1, 2004 are subject to a maximum applicable contingent deferred sales charge (5% in the 1st year, decreasing to 0% after 7 years) for Class B shares and (2% in the 1st year, decreasing to 0% after 2 years) for Class C shares.&nb sp;Net Asset Value (NAV) returns include the reinvestment of dividends and capital gains but do not reflect any sales charges.
Investments in a "non-diversified" fund may be subject to specific risks such as susceptibility to single economic political, or regulatory events, and may be subject to greater loss than investments in a diversified fund.
The management of this fund is based on a specific philosophy and on proprietary systems and methodology. There is no guarantee the fund will achieve its objectives.
This material must be preceded or accompanied by a current prospectus, which includes specific contents regarding the investment objectives and policies of this fund.
Transamerica IDEX Mutual Funds
Annual Report 2004
2
TA IDEX Great Companies–AmericaSM
UNDERSTANDING YOUR FUND'S EXPENSES (unaudited)
SHAREHOLDER EXPENSES
The following Example is intended to help you understand your ongoing costs (in dollars and cents) of investing in a Fund and to compare these costs with the ongoing costs of investing in other funds.
The Example is based on an investment of $1,000 invested at the beginning of the period and held for the entire period from May 1, 2004 to October 31, 2004.
ACTUAL EXPENSES
The first line in the table below provides information about actual account values and actual expenses. You may use the information in this line, together with the amount you invested, to estimate the expenses that you paid over the period. Simply divide your account value by $1,000 (for example, an $8,600 account value divided by $1,000 = 8.6), then multiply the result by the number in the first line of your Fund under the heading entitled "Expenses Paid During Period" to estimate the expenses you paid on your account during this period.
HYPOTHETICAL EXAMPLE FOR COMPARISON PURPOSES
The second line in the table below provides information about hypothetical account values and hypothetical expenses based on each Fund's actual expense ratio and an assumed rate of return of 5% per year before expenses, which is not the Fund's actual return. The hypothetical account values and expenses may not be used to estimate the actual ending account balance or expenses you paid for the period. You may use this information to compare the ongoing costs of investing in your Fund and other funds. To do so, compare this 5% hypothetical example with the 5% hypothetical examples that appear in the shareholder reports of the other funds.
Please note that the expenses shown in the table are meant to highlight your ongoing costs only and do not reflect any transactional costs, such as sales charges, redemption fees, brokerage commissions paid on purchases and sales of fund shares. Therefore, the second line under each Fund in the table is useful in comparing ongoing costs only, and will not help you determine the relative total costs of owning different funds. In addition, note that the expenses shown in the table are meant to highlight your ongoing costs and do not reflect any transaction costs.
| | | Beginning
Account
Value | | Ending
Account
Value | | Annualized
Expense
Ratio | | Expenses Paid
During Period (a) | |
| Class A | | | |
| Actual | | $ | 1,000.00 | | | $ | 963.20 | | | | 1.56 | % | | $ | 7.70 | | |
| Hypothetical (b) | | | 1,000.00 | | | | 1,017.29 | | | | 1.56 | | | | 7.91 | | |
| Class B | | | |
| Actual | | | 1,000.00 | | | | 960.90 | | | | 2.16 | | | | 10.65 | | |
| Hypothetical (b) | | | 1,000.00 | | | | 1,014.28 | | | | 2.16 | | | | 10.94 | | |
| Class C | | | |
| Actual | | | 1,000.00 | | | | 959.80 | | | | 2.22 | | | | 10.94 | | |
| Hypothetical (b) | | | 1,000.00 | | | | 1,013.98 | | | | 2.22 | | | | 11.24 | | |
(a) Expenses are calculated using each Fund's annualized expense ratio (as disclosed in the table), multiplied by the average account value for the period, multiplied by number of days in the period (184 days), and divided by the number of days in the year (366 days).
(b) 5% return per year before expenses.
GRAPHIC PRESENTATION OF SCHEDULE OF INVESTMENTS
By Sector
At October 31, 2004
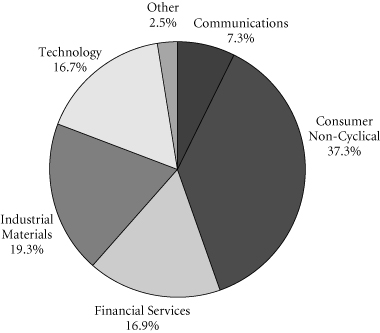
This chart shows the percentage breakdown by sector of the Fund's total investment securities.
Transamerica IDEX Mutual Funds
Annual Report 2004
3
TA IDEX Great Companies–AmericaSM
SCHEDULE OF INVESTMENTS
At October 31, 2004
(all amounts except share amounts in thousands)
| | | Shares | | Value | |
| COMMON STOCKS (98.2%) | | | |
| Aerospace (7.3%) | | | |
| United Technologies Corp. | | | 98,302 | | | $ | 9,125 | | |
| Beverages (4.7%) | | | |
| PepsiCo, Inc. | | | 120,000 | | | | 5,950 | | |
| Business Services (13.6%) | | | |
| First Data Corp. | | | 190,900 | | | | 7,880 | | |
| Omnicom Group, Inc. (a) | | | 116,300 | | | | 9,176 | | |
| Chemicals & Allied Products (9.2%) | | | |
| Colgate-Palmolive Co. | | | 131,800 | | | | 5,881 | | |
| Procter & Gamble Co. | | | 110,400 | | | | 5,650 | | |
| Commercial Banks (4.9%) | | | |
| Citigroup, Inc. | | | 139,700 | | | | 6,199 | | |
| Computer & Office Equipment (5.4%) | | | |
| International Business Machines Corp. | | | 74,800 | | | | 6,713 | | |
| Electronic & Other Electric Equipment (7.7%) | | | |
| General Electric Co. | | | 283,300 | | | | 9,666 | | |
| Electronic Components & Accessories (5.2%) | | | |
| Texas Instruments, Inc. | | | 265,001 | | | | 6,479 | | |
| Insurance (4.2%) | | | |
| American International Group, Inc. | | | 85,700 | | | | 5,203 | | |
| Medical Instruments & Supplies (9.7%) | | | |
| Medtronic, Inc. | | | 184,100 | | | | 9,409 | | |
| Zimmer Holdings, Inc. (b) | | | 35,200 | | | | 2,731 | | |
| Paper & Allied Products (4.4%) | | | |
| 3M Co. | | | 71,100 | | | | 5,515 | | |
| Pharmaceuticals (14.0%) | | | |
| Abbott Laboratories | | | 154,700 | | | | 6,596 | | |
| Johnson & Johnson | | | 50,300 | | | | 2,936 | | |
| Pfizer, Inc. | | | 192,900 | | | | 5,585 | | |
| Wyeth | | | 59,500 | | | | 2,359 | | |
| Security & Commodity Brokers (7.9%) | | | |
| Goldman Sachs Group, Inc. | | | 27,000 | | | | 2,656 | | |
| Lehman Brothers Holdings, Inc. | | | 39,600 | | | | 3,253 | | |
| Merrill Lynch & Co., Inc. | | | 74,600 | | | | 4,024 | | |
| Total Common Stocks (cost: $115,206) | | | | | | | 122,986 | | |
| | | Principal | | Value | |
| SECURITY LENDING COLLATERAL (2.5%) | | | |
| Debt (2.3%) | | | |
| Bank Notes (0.5%) | | | |
Bank of America
1.77%, due 12/03/2004 | | $ | 153 | | | |
$153 | | |
| 1.88%, due 12/23/2004 | | | 51 | | | | 51 | | |
| 1.77%, due 01/18/2005 | | | 102 | | | | 102 | | |
| | | Principal | | Value | |
| Bank Notes (continued) | |
Canadian Imperial Bank of Commerce
1.86%, due 11/04/2004 | | $230 | | $230 | |
Credit Suisse First Boston Corp.
1.83%, due 09/09/2005 | | 26 | | 26 | |
| Commercial Paper (0.2%) | |
Clipper Receivables Corp.
1.79%, due 11/12/2004 | | 76 | | 76 | |
Delaware Funding Corp. 144A
1.85%, due 11/19/2004 | | 26 | | 26 | |
Falcon Asset Securitization Corp. 144A
1.78%, due 11/04/2004
1.75%, due 11/10/2004 | | 76
102 | | 76
102 | |
Galaxy Funding 144A
1.88%, due 11/22/2004 | | 26 | | 26 | |
| Euro Dollar Terms (1.1%) | |
Bank of Montreal
1.88%, due 11/24/2004 | | 242 | | 242 | |
BNP Paribas
1.77%, due 11/10/2004
1.80%, due 11/23/2004
1.98%, due 12/27/2004 | | 128
102
102 | | 128
102
102 | |
Calyon
1.70%, due 11/24/2004 | | 13 | | 13 | |
Citigroup
2.06%, due 01/25/2005 | | 256 | | 256 | |
Den Danske Bank
1.82%, due 11/19/2004 | | 128 | | 128 | |
Dexia Group
2.04%, due 01/21/2005 | | 59 | | 59 | |
HBOS Halifax Bank of Scotland
2.03%, due 01/21/2005 | | 51 | | 51 | |
Royal Bank of Scotland
2.01%, due 01/20/2005 | | 102 | | 102 | |
Toronto Dominion Bank
1.70%, due 11/08/2004 | | 51 | | 51 | |
Wells Fargo
1.87%, due 11/22/2004 | | 128 | | 128 | |
| Promissory Notes (0.2%) | |
Goldman Sachs Group Inc.
1.90%, due 12/29/2004
1.88%, due 01/27/2005 | | 107
179 | | 107
179 | |
| Repurchase Agreements (0.3%) | |
Merrill Lynch & Co., Inc. (c)
1.92% Repurchase Agreement dated
10/29/2004 to be repurchased at $409 on
11/01/2004 | | 409 | | 409 | |
The notes to the financial statements are an integral part of this report.
Transamerica IDEX Mutual Funds
Annual Report 2004
4
TA IDEX Great Companies–AmericaSM
SCHEDULE OF INVESTMENTS (continued)
At October 31, 2004
(all amounts except share amounts in thousands)
| | | Shares | | Value | |
| Investment Companies (0.2%) | | | |
| Money Market Funds (0.2%) | |
Merrill Lynch Premier Institutional Fund
1-day yield of 1.71% | | | 125,696 | | | $ | 126 | | |
Merrimac Cash Fund, Premium Class
1-day yield of 1.46% | | | 91,983 | | | | 92 | | |
| Total Security Lending Collateral (cost: $3,143) | | | | | 3,143 | | |
| Total Investment Securities (cost: $118,349) | | | | $ | 126,129 | | |
| | | | | Value | |
| SUMMARY: | |
| Investments, at value | | | 100.7 | % | | $ | 126,129 | | |
| Liabilities in excess of other assets | | | (0.7 | )% | | | (913 | ) | |
| Net assets | | | 100.0 | % | | $ | 125,216 | | |
NOTES TO SCHEDULE OF INVESTMENTS:
(a) At October 31, 2004, all or a portion of this security is on loan (see Note 1). The value at October 31, 2004, of all securities on loan is $3,075.
(b) No dividends were paid during the preceding twelve months.
(c) Cash collateral for the Repurchase Agreements, valued at $418, that serve as collateral for securities lending are invested in corporate bonds with interest rates and maturity dates ranging from 0.00%–9.75% and 05/15/2005–9/15/2033, respectively.
DEFINITIONS:
144A 144A Securities are registered pursuant to rule 144A of the Securities Act of 1933. These securities are deemed to be liquid for purposes of compliance limitations on holdings of illiquid securities and may be resold as transactions exempt from registration normally to qualified institutional buyers. At October 31, 2004, these securities aggregated $230 or 0.2% of the net assets of the Fund.
The notes to the financial statements are an integral part of this report.
Transamerica IDEX Mutual Funds
Annual Report 2004
5
TA IDEX Great Companies–AmericaSM
STATEMENT OF ASSETS AND LIABILITIES
At October 31, 2004
(all amounts except per share amounts in thousands)
| Assets: | | | |
Investment securities, at value (cost: $118,349)
(including securities loaned of $3,075) | | $ | 126,129 | | |
| Cash | | | 2,887 | | |
| Receivables: | |
| Shares of beneficial interest sold | | | 18 | | |
| Interest | | | 3 | | |
| Dividends | | | 206 | | |
| Other | | | 7 | | |
| | | | 129,250 | | |
| Liabilities: | | | |
| Accounts payable and accrued liabilities: | |
| Shares of beneficial interest redeemed | | | 509 | | |
| Management and advisory fees | | | 170 | | |
| Distribution fees | | | 64 | | |
| Transfer agent fees | | | 73 | | |
| Payable for collateral for securities on loan | | | 3,143 | | |
| Other | | | 75 | | |
| | | | 4,034 | | |
| Net Assets | | $ | 125,216 | | |
| Net Assets Consist of: | | | |
Shares of beneficial interest, unlimited shares
authorized, no par value | | $ | 140,240 | | |
| Accumulated net investment income (loss) | | | (2 | ) | |
Accumulated net realized gain (loss) from investment
securities | | | (22,801 | ) | |
Net unrealized appreciation (depreciation) on
investment securities | | | 7,779 | | |
| Net Assets | | $ | 125,216 | | |
| Net Assets by Class: | | | |
| Class A | | $ | 44,056 | | |
| Class B | | | 54,460 | | |
| Class C | | | 26,700 | | |
| Shares Outstanding: | | | |
| Class A | | | 4,977 | | |
| Class B | | | 6,335 | | |
| Class C | | | 3,107 | | |
| Net Asset Value Per Share: | | | |
| Class A | | $ | 8.85 | | |
| Class B | | | 8.60 | | |
| Class C | | | 8.59 | | |
| Maximum Offering Price Per Share (a): | | | |
| Class A | | $ | 9.37 | | |
(a) Includes the maximum selling commission (represented as a percentage of offering price) which is reduced on certain levels of sales as set forth in the Prospectus. Net asset value per share for Classes B and C shares represents offering price. The redemption price for Classes B and C shares equals net asset value less any applicable contingent deferred sales charge.
STATEMENT OF OPERATIONS
For the year ended October 31, 2004
(all amounts in thousands)
| Investment Income: | | | |
| Interest | | $ | 19 | | |
| Dividends | | | 2,163 | | |
| Income from loaned securities–net | | | 4 | | |
| | | | 2,186 | | |
| Expenses: | | | |
| Management and advisory fees | | | 1,117 | | |
| Transfer agent fees: | |
| Class A | | | 135 | | |
| Class B | | | 163 | | |
| Class C | | | 32 | | |
| Class C2 | | | 32 | | |
| Class M | | | 24 | | |
| Printing and shareholder reports | | | 45 | | |
| Custody fees | | | 18 | | |
| Administration fees | | | 24 | | |
| Legal fees | | | 5 | | |
| Audit and accounting fees | | | 13 | | |
| Trustees fees | | | 9 | | |
| Registration fees: | |
| Class A | | | 24 | | |
| Class B | | | 12 | | |
| Class C | | | 16 | | |
| Class C2 | | | 4 | | |
| Class M | | | 3 | | |
| Other | | | 7 | | |
| Distribution and service fees: | |
| Class A | | | 175 | | |
| Class B | | | 609 | | |
| Class C | | | 122 | | |
| Class C2 | | | 102 | | |
| Class M | | | 68 | | |
| Total expenses | | | 2,759 | | |
| Less: | |
Reimbursement of class expenses:
Class A | | | (2 | ) | |
| Class C | | | (7 | ) | |
| Net expenses | | | 2,750 | | |
| Net Investment Income (Loss) | | | (564 | ) | |
| Net Realized and Unrealized Gain (Loss): | | | |
| Realized gain (loss) from investment securities | | | 1,147 | | |
Increase (decrease) in unrealized appreciation
(depreciation) on investment securities | | | 439 | | |
| Net Gain (Loss) on Investment Securities | | | 1,586 | | |
Net Increase (Decrease) in Net Assets Resulting
from Operations | | $ | 1,022 | | |
The notes to the financial statements are an integral part of this report.
Transamerica IDEX Mutual Funds
Annual Report 2004
6
TA IDEX Great Companies–AmericaSM
STATEMENTS OF CHANGES IN NET ASSETS
For the years ended
(all amounts in thousands)
| | | October 31,
2004 | | October 31,
2003 | |
| Increase (Decrease) In Net Assets From: | | | |
| Operations: | | | |
| Net investment income (loss) | | $ | (564 | ) | | $ | (461 | ) | |
Net realized gain (loss) from
investment securities | | | 1,147 | | | | (12,017 | ) | |
Net unrealized appreciation
(depreciation) on investment
securities | | | 439 | | | | 31,487 | | |
| | | | 1,022 | | | | 19,009 | | |
| Capital Share Transactions: | | | |
| Proceeds from shares sold: | |
| Class A | | | 10,563 | | | | 24,736 | | |
| Class B | | | 4,872 | | | | 14,569 | | |
| Class C | | | 4,740 | | | | 4,415 | | |
| Class C2 | | | 652 | | | | 2,235 | | |
| Class M | | | 718 | | | | 1,696 | | |
| | | | 21,545 | | | | 47,651 | | |
| Cost of shares redeemed: | |
| Class A | | | (16,054 | ) | | | (39,467 | ) | |
| Class B | | | (12,938 | ) | | | (12,855 | ) | |
| Class C | | | (3,961 | ) | | | (261 | ) | |
| Class C2 | | | (3,142 | ) | | | (4,009 | ) | |
| Class M | | | (2,627 | ) | | | (2,623 | ) | |
| | | | (38,722 | ) | | | (59,215 | ) | |
| Class level exchanges: | |
| Class C | | | 22,151 | | | | – | | |
| Class C2 | | | (15,042 | ) | | | – | | |
| Class M | | | (7,109 | ) | | | – | | |
| | | | – | | | | – | | |
| Automatic conversions: | |
| Class A | | | 20 | | | | – | | |
| Class B | | | (20 | ) | | | – | | |
| | | | – | | | | – | | |
| | | | (17,177 | ) | | | (11,564 | ) | |
| Net increase (decrease) in net assets | | | (16,155 | ) | | | 7,445 | | |
| Net Assets: | | | |
| Beginning of year | | | 141,371 | | | | 133,926 | | |
| End of year | | $ | 125,216 | | | $ | 141,371 | | |
Accumulated Net Investment Income
(Loss) | | $ | (2 | ) | | $ | (2 | ) | |
| | | October 31,
2004 | | October 31,
2003 | |
| Share Activity: | | | |
| Shares issued: | |
| Class A | | | 1,161 | | | | 3,165 | | |
| Class B | | | 547 | | | | 1,828 | | |
| Class C | | | 534 | | | | 554 | | |
| Class C2 | | | 73 | | | | 284 | | |
| Class M | | | 81 | | | | 216 | | |
| | | | 2,396 | | | | 6,047 | | |
| Shares redeemed: | |
| Class A | | | (1,775 | ) | | | (4,833 | ) | |
| Class B | | | (1,466 | ) | | | (1,654 | ) | |
| Class C | | | (452 | ) | | | (32 | ) | |
| Class C2 | | | (349 | ) | | | (520 | ) | |
| Class M | | | (294 | ) | | | (335 | ) | |
| | | | (4,336 | ) | | | (7,374 | ) | |
| Class level exchanges: | |
| Class C | | | 2,503 | | | | – | | |
| Class C2 | | | (1,676 | ) | | | – | | |
| Class M | | | (823 | ) | | | – | | |
| | | | 4 | | | | – | | |
| Automatic conversions: | |
| Class A | | | 2 | | | | – | | |
| Class B | | | (2 | ) | | | – | | |
| | | | – | | | | – | | |
Net increase (decrease) in shares
outstanding: | |
| Class A | | | (612 | ) | | | (1,668 | ) | |
| Class B | | | (921 | ) | | | 174 | | |
| Class C | | | 2,585 | | | | 522 | | |
| Class C2 | | | (1,952 | ) | | | (236 | ) | |
| Class M | | | (1,036 | ) | | | (119 | ) | |
| | | | (1,936 | ) | | | (1,327 | ) | |
The notes to the financial statements are an integral part of this report.
Transamerica IDEX Mutual Funds
Annual Report 2004
7
TA IDEX Great Companies–AmericaSM
FINANCIAL HIGHLIGHTS
| | | | | For a share of beneficial interest outstanding throughout each period | |
| | | | | Net Asset | | Investment Operations | | Distributions | | Net Asset | |
| | | For the
Period
Ended (d)(g) | | Value,
Beginning
of Period | | Net
Investment
Income (Loss) | | Net Realized
and Unrealized
Gain (Loss) | | Total
Operations | | From Net
Investment
Income | | From Net
Realized
Gains | | Total
Distributions | | Value,
End
of Period | |
| Class A | | 10/31/2004 | | $ | 8.77 | | | $ | – | | | $ | 0.08 | | | $ | 0.08 | | | $ | – | | | $ | – | | | $ | – | | | $ | 8.85 | | |
| | | 10/31/2003 | | | 7.65 | | | | – | | | | 1.12 | | | | 1.12 | | | | – | | | | – | | | | – | | | | 8.77 | | |
| | | 10/31/2002 | | | 8.96 | | | | (0.01 | ) | | | (1.30 | ) | | | (1.31 | ) | | | – | | | | – | | | | – | | | | 7.65 | | |
| | | 10/31/2001 | | | 10.58 | | | | (0.02 | ) | | | (1.60 | ) | | | (1.62 | ) | | | – | | | | – | | | | – | | | | 8.96 | | |
| | | 10/31/2000 | | | 10.00 | | | | – | | | | 0.58 | | | | 0.58 | | | | – | | | | – | | | | – | | | | 10.58 | | |
| Class B | | 10/31/2004 | | | 8.57 | | | | (0.06 | ) | | | 0.09 | | | | 0.03 | | | | – | | | | – | | | | – | | | | 8.60 | | |
| | | 10/31/2003 | | | 7.52 | | | | (0.05 | ) | | | 1.10 | | | | 1.05 | | �� | | – | | | | – | | | | – | | | | 8.57 | | |
| | | 10/31/2002 | | | 8.87 | | | | (0.08 | ) | | | (1.27 | ) | | | (1.35 | ) | | | – | | | | – | | | | – | | | | 7.52 | | |
| | | 10/31/2001 | | | 10.56 | | | | (0.08 | ) | | | (1.61 | ) | | | (1.69 | ) | | | – | | | | – | | | | – | | | | 8.87 | | |
| | | 10/31/2000 | | | 10.00 | | | | (0.02 | ) | | | 0.58 | | | | 0.56 | | | | – | | | | – | | | | – | | | | 10.56 | | |
| Class C | | 10/31/2004 | | | 8.57 | | | | (0.06 | ) | | | 0.08 | | | | 0.02 | | | | – | | | | – | | | | – | | | | 8.59 | | |
| | | 10/31/2003 | | | 7.51 | | | | (0.05 | ) | | | 1.11 | | | | 1.06 | | | | – | | | | – | | | | – | | | | 8.57 | | |
| | | | | | | Ratios/Supplemental Data | |
| | | For the
Period | | Total | | Net Assets,
End of
Period | | Ratio of Expenses
to Average
Net Assets (a) | | Net Investment
Income (Loss)
to Average | | Portfolio
Turnover | |
| | | Ended (g) | | Return (c) | | (000's) | | Net (e) | | Total (f) | | Net Assets (a) | | Rate (b) | |
| Class A | | 10/31/2004 | | | 0.93 | % | | $ | 44,056 | | | | 1.55 | % | | | 1.55 | % | | | 0.00 | % | | | 23 | % | |
| | | 10/31/2003 | | | 14.64 | | | | 49,040 | | | | 1.55 | | | | 1.66 | | | | 0.05 | | | | 54 | | |
| | | 10/31/2002 | | | (14.59 | ) | | | 55,508 | | | | 1.55 | | | | 1.66 | | | | (0.16 | ) | | | 28 | | |
| | | 10/31/2001 | | | (15.35 | ) | | | 38,345 | | | | 1.55 | | | | 1.78 | | | | (0.18 | ) | | | 65 | | |
| | | 10/31/2000 | | | 5.81 | | | | 13,377 | | | | 1.55 | | | | 3.38 | | | | (0.08 | ) | | | 2 | | |
| Class B | | 10/31/2004 | | | 0.35 | | | | 54,460 | | | | 2.17 | | | | 2.17 | | | | (0.62 | ) | | | 23 | | |
| | | 10/31/2003 | | | 13.96 | | | | 62,205 | | | | 2.20 | | | | 2.31 | | | | (0.60 | ) | | | 54 | | |
| | | 10/31/2002 | | | (15.26 | ) | | | 53,256 | | | | 2.20 | | | | 2.31 | | | | (0.81 | ) | | | 28 | | |
| | | 10/31/2001 | | | (15.98 | ) | | | 40,769 | | | | 2.20 | | | | 2.43 | | | | (0.83 | ) | | | 65 | | |
| | | 10/31/2000 | | | 5.62 | | | | 7,839 | | | | 2.20 | | | | 4.03 | | | | (0.73 | ) | | | 2 | | |
| Class C | | 10/31/2004 | | | 0.23 | | | | 26,700 | | | | 2.20 | | | | 2.26 | | | | (0.64 | ) | | | 23 | | |
| | | 10/31/2003 | | | 14.11 | | | | 4,474 | | | | 2.20 | | | | 2.31 | | | | (0.60 | ) | | | 54 | | |
NOTES TO FINANCIAL HIGHLIGHTS
(a) Annualized.
(b) Not annualized for the periods of less than one year.
(c) Total Return has been calculated for the applicable period without deduction of a sales load, if any, on an initial purchase. Periods of less than one year are not annualized.
(d) Per share information is calculated based on average number of shares outstanding for the years ended 10/31/2001, 10/31/2002, 10/31/2003 and 10/31/2004.
(e) Ratio of Net Expenses to Average Net Assets is net of fee waivers and reimbursements by the investment adviser, if any (see note 2).
(f) Ratio of Total Expenses to Average Net Assets includes all expenses before fee waivers and reimbursements by the investment adviser.
(g) TA IDEX Great Companies–America ("the Fund") commenced operations on July 14, 2000. The inception date for the Fund's offering of share Class L was November 11, 2002. Class L was renamed Class C on March 1, 2004 (see note 1)
The notes to the financial statements are an integral part of this report.
Transamerica IDEX Mutual Funds
Annual Report 2004
8
TA IDEX Great Companies–AmericaSM
NOTES TO FINANCIAL STATEMENTS
At October 31, 2004
(all amounts in thousands)
NOTE 1. ORGANIZATION AND SIGNIFICANT ACCOUNTING POLICIES
Transamerica IDEX Mutual Funds, formerly IDEX Mutual Funds, is a Massachusetts business trust registered under the Investment Company Act of 1940, as amended (the "1940 Act"), as an open-end management investment company. TA IDEX Great Companies–AmericaSM ("the Fund"), part of Transamerica IDEX Mutual Funds, began operations on July 14, 2000. The Fund is "non-diversified" under the 1940 Act.
On March 1, 2004, the Fund changed its name from IDEX Great Companies–AmericaSM to TA IDEX Great Companies–AmericaSM.
In the normal course of business, the Fund enters into contracts that contain a variety of representations and warranties, which provide general indemnifications. The Fund's maximum exposure under these arrangements is unknown, as this would involve future claims that may be made against the Fund and/or its affiliates that have not yet occurred. However, based on experience, the Fund expects the risk of loss to be remote.
See the Prospectus and Statement of Additional Information for a description of the Fund's investment objective.
In preparing the Fund's financial statements in accordance with accounting principles generally accepted in the United States of America ("GAAP"), estimates or assumptions (which could differ from actual results) may be used that affect reported amounts and disclosures. The following policies were consistently followed by the Fund, in accordance with GAAP.
Multiple class operations and expenses: The Fund currently offers three classes of shares, each with a public offering price that reflects different sales charges, if any, and expense levels. All shares designated as Class C shares prior to March 1, 2004, were renamed as Class C2 shares on that date. All shares designated as Class L shares prior to March 1, 2004, were renamed as Class C shares with different sales charges than the previous Class L shares. On June 15, 2004, Class C2 shares merged into Class C. On September 24, 2004, Class M shares merged into Class C. Class B shares will convert to Class A shares eight years after purchase. Income, non-class specific expenses and realized and unrealized gains and losses, are allocated daily to each class, based upon the value of shares outstanding method as permitted under Rule 18f-3 of the 1940 Act. Each class bears its own specific expenses as well as a portion of general, common expenses.
Pricing of shares: The Fund prices its shares on the basis of the net asset value of each class of shares of the Fund, which is determined as of the close of the New York Stock Exchange ("NYSE") (generally 4:00 p.m. Eastern Time) on each day on which the NYSE is open for trading (other than a day on which there are insufficient changes in the value of the Fund's portfolio securities to materially affect the Fund's net asset value or a day on which no shares are tendered for redemption and no order to purchase any shares is received).
Security valuations: Fund investments traded on an exchange are valued at the closing price on the day of valuation on the exchange where the security is principally traded. With respect to securities traded on NASDAQ NMS, such closing price may be the last reported sales price or the NASDAQ Official Closing Price.
Securities traded in the over-the-counter market and listed securities for which no sale was reported on that date are valued at the last quoted bid price.
Debt securities are valued by independent pricing services; however, those that mature in sixty days or less are valued at amortized cost, which approximates market.
Other securities for which quotations are not readily available are valued at fair market value as determined in good faith using guidelines adopted by the Board of Trustees of the Fund, under the supervision of the Fund's Valuation Committee.
Cash: The Fund may leave cash overnight in its cash account with the custodian, Investors Bank & Trust Company ("IBT"). IBT has been contracted on behalf of the Fund to invest the excess cash into a savings account, which at October 31, 2004, was paying an interest rate of 1.30%.
Throughout the year, the Fund may have a cash overdraft balance. A fee is incurred on this overdraft, calculated by multiplying the overdraft by a rate based on the federal funds rate. This fee is included in Custody fees in the Statement of Operations.
Commission recapture: The sub-adviser, to the extent consistent with the best execution and usual commission rate policies and practices, may place security transactions of the Fund with broker/dealers with which Transamerica IDEX Mutual Funds has established a Commission Recapture Program. A Commission Recapture Program is my arrangement under which a broker/dealer applies a portion of the commissions received by such broker/dealer on the security transactions to the Fund. In no event will commissions paid by the Fund be used to pay expenses that would otherwise be borne by any other funds within Transamerica IDEX Mutual Funds, or by any other party.
Recaptured commissions during the year ended October 31, 2004, of $1 are included in net realized gains in the Statement of Operations.
Repurchase agreements: The Fund is authorized to enter into repurchase agreements. The Fund, through IBT, receives delivery of the underlying securities, the value of which at the time of purchase is required to be an amount equal to at least 100% of the resale price. Repurchase agreements involve the risk that the seller will fail to repurchase the security, as agreed. In that case, the Fund will bear the risk of value fluctuations until the security can be sold and may encounter delays and incur costs in liquidating the security. In the event of bankruptcy or insolvency of the seller, delays and costs may be incurred.
Transamerica IDEX Mutual Funds
Annual Report 2004
9
TA IDEX Great Companies–AmericaSM
NOTES TO FINANCIAL STATEMENTS (continued)
At October 31, 2004
(all amounts in thousands)
NOTE 1.–(continued)
Securities lending: The Fund may lend securities to enhance fund earnings from investing cash collateral in making such loans to qualified borrowers (typically broker/dealers). The Fund has engaged its custodian bank, IBT, as a lending agent to administer its securities lending program. IBT earned $2 of program income for its services. When the Fund makes a security loan, it receives cash collateral as protection against the risk that the borrower will default on the loan, and records an asset for the cash invested collateral and a liability for the return of the collateral.
Securities on loan are included in Investment securities at value in the Statement of Assets and Liabilities and remain on the Schedule of Investments.
Loans of securities are required to be secured by collateral at least equal to 102% of the value of the securities at inception of the loan, and not less then 100% thereafter. The Fund may invest cash collateral in short-term money market instruments including: U.S. Treasury Bills, U.S. agency obligations, commercial paper, money market mutual funds, repurchase agreements and other highly rated, liquid investments. During the life of securities loans, the collateral and securities loaned remain subject to fluctuation in value. IBT marks to market securities loaned and the collateral each business day. If additional collateral is due (at least $1), IBT collects additional cash collateral from the borrowers. Although securities loaned will be fully collateralized at all times, IBT may experience delays in, or may be prevented from, recovering the collateral on behalf of the Fund. The Fund may recall a loa ned security position at any time from the borrower through IBT. In the event the borrower fails to timely return a recalled security, IBT may indemnify the Fund by purchasing replacement securities for the Fund at its own expense and claiming the collateral to fund such a purchase. IBT absorbs the loss if the collateral value is not sufficient to cover the cost of the replacement securities. If replacement securities are not available, IBT will credit the equivalent cash value to the Fund.
While a security is on loan, the Fund does not have the right to vote that security. However, if time permits, the Fund will attempt to recall a security on loan and vote the proxy.
Income from securities lending is included in the Statement of Operations. The amount of collateral and value of securities on loan are included in the Statement of Assets and Liabilities as well as in the Schedule of Investments.
Security transactions and investment income: Security transactions are recorded on the trade date. Security gains and losses are calculated on the specific identification basis. Dividend income is recorded on the ex-dividend date or, in the case of foreign securities, as soon as the Fund is informed of the ex-dividend date. Interest income, including accretion of discounts and amortization of premiums, is recorded on the accrual basis commencing on the settlement date.
Account maintenance fees: If the shareholder account balance falls below $1 by either shareholder action or as a result of market action, a $25 (not in thousands) fee is assessed every year until the balance reaches $1. The fee is assessed by redeeming shares in the shareholder's account.
No fee will be charged under the following conditions:
• accounts opened within the preceding 24 months
• accounts with an active monthly Automatic Investment Plan ($50 (not in thousands) minimum per fund)
• accounts owned by an individual which, when combined by social security number, have a balance of $5 or more
• accounts owned by individuals in the same household (by address) that have a combined balance of $5 or more
• UTMA/UGMA accounts
• Fiduciary accounts
• B-share accounts whose shares have started to convert to A-shares accounts (as long as combined value of both accounts is at least $1)
For the year ended October 31, 2004, this fee totaled $3. These fees are included in Paid in Capital in the Statement of Assets and Liabilities.
Redemption fees: A short-term trading redemption fee may be assessed on any fund shares in a fund account that are sold during the first five (5) New York Stock Exchange trading days following their purchase date. This redemption fee will equal 2% of the amount redeemed and shares held the longest will be treated as being redeemed first and shares held the shortest as being redeemed last. For the year ended October 31, 2004, the Fund received no redemption fees.
Dividend distributions: Distributions to shareholders are recorded on the ex-dividend date and are determined in accordance with Federal income tax regulations which may differ from GAAP.
NOTE 2. RELATED PARTY TRANSACTIONS
AEGON/Transamerica Fund Advisers, Inc. ("ATFA") is the Fund's investment adviser. AEGON/Transamerica Fund Services, Inc. ("ATFS") is the Fund's administrator. AFSG Securities Corp. ("AFSG") is the Fund's distributor/principal underwriter. AEGON/Transamerica Investor Services, Inc. ("ATIS") is the Fund's transfer agent. ATIS and AFSG are 100% owned by AUSA Holding Company ("AUSA"). ATFA is a directly owned subsidiary of Western Reserve Life Assurance Co. of Ohio (78%) ("WRL") and AUSA (22%). ATFS is a wholly owned
Transamerica IDEX Mutual Funds
Annual Report 2004
10
TA IDEX Great Companies–AmericaSM
NOTES TO FINANCIAL STATEMENTS (continued)
At October 31, 2004
(all amounts in thousands)
NOTE 2.–(continued)
subsidiary of WRL. AUSA and WRL are wholly owned indirect subsidiaries of AEGON NV, a Netherlands corporation.
Great Companies, LLC is both an affiliate of the Fund and a sub-adviser to the Fund.
Investment advisory fee: The Fund pays management fees to ATFA based on average daily net assets ("ANA") at the following breakpoints:
0.80% of the first $500 million of ANA
0.70 of ANA over $500 million
ATFA has contractually agreed to waive its advisory fee and will reimburse the Fund to the extent that operating expenses, excluding 12b-1 fees, exceed the following stated annual limit:
1.20% Expense Limit
If total fund expenses fall below the annual expense limitation agreement agreed to by the adviser within the succeeding three years, the Fund may be required to pay that adviser a portion or all of the reimbursed class expenses.
| | | Advisory Fee
Waived | | Available for
Recapture Through | |
| Fiscal Year 2003 | | $ | 148 | | | 10/31/2006 | |
| Fiscal Year 2002 | | | 146 | | | 10/31/2005 | |
If total class expenses fall below the annual expense limitation agreement agreed to by the adviser within the succeeding three years, the Fund may be required to pay that adviser a portion or all of the reimbursed expenses.
| | | Reimbursement of
Class Expenses | | Available for
Recapture Through | |
Fiscal Year 2004:
Class A | | $ | 2 | | | 10/31/2007 | |
| Class C | | | 7 | | | 10/31/2007 | |
Distribution and service fees: The Fund has a 12b-1 distribution plan under the 1940 Act pursuant to which an annual fee, based on average daily net assets, is paid to the distributor for various disbursements such as broker-dealer account servicing fees and other promotional expenses of the Fund. The Fund is authorized under the 12b-1 plan to pay fees on each class up to the following limits:
| Class A | | | 0.35 | % | |
| Class B | | | 1.00 | % | |
| Class C | | | 1.00 | % | |
| Class C2 | | | 1.00 | % | |
| Class M | | | 0.90 | % | |
Class C2 and Class M merged into Class C on June 15, 2004 and September 24, 2004, respectively.
In the case the Fund or a class of shares of the Fund is closed to new investors or investments, the Fund is authorized to pay 12b-1 fees for past sales and distribution efforts and present and past investor services.
Underwriter commissions relate to front-end sales charges imposed for Class A and M shares and contingent deferred sales charges from Classes B, C, M and certain A share redemptions. For the year ended October 31, 2004, the underwriter commissions were as follows:
| Received by Underwriter | | $ | 778 | | |
| Retained by Underwriter | | | 35 | | |
| Contingent Deferred Sales Charge | | | 194 | | |
Administrative services: The Fund has entered into an agreement with ATFS for financial and legal fund administration services, which includes such items as compliance, expenses, financial statements and other reporting, distributions, tax returns, prospectus preparation, board of trustees meeting support and other legal matters. The Fund pays ATFS an annual fee of 0.015% of average net assets. The Legal fees on the Statement of Operations are for fees paid to external legal counsel.
The Fund paid ATFS $24 for the year ended October 31, 2004.
Transfer agent fees: The Fund pays ATIS an annual per-account charge of $20 (not in thousands) for each open account and $1.63 (not in thousands) for each closed account. There is no new account charge. The transfer agent fees on the Statement of Operations are made up of fees paid to ATIS and costs associated with shareholder statements. The Fund paid ATIS $385 for the year ended October 31, 2004.
Deferred compensation plan: Each eligible Fund Trustee may elect participation in the Deferred Compensation Plan ("the Plan"). Under the Plan, such Trustees may defer payment of a percentage of their total fees earned as a Fund Trustee. These deferred amounts may be invested in any Transamerica IDEX Mutual Fund. At October 31, 2004, the value of invested plan amount was $6. Invested plan amounts and the total liability for deferred compensation to the Trustees under the Plan at October 31, 2004, are included in the accompanying Statement of Assets and Liabilities.
Transamerica IDEX Mutual Funds
Annual Report 2004
11
TA IDEX Great Companies–AmericaSM
NOTES TO FINANCIAL STATEMENTS (continued)
At October 31, 2004
(all amounts in thousands)
NOTE 3. INVESTMENT TRANSACTIONS
The cost of securities purchased and proceeds from securities sold (excluding short-term securities) for the year ended October 31, 2004, were as follows:
| Purchases of securities: | | | |
| Long-Term excluding U.S. Government | | $ | 31,997 | | |
| U.S. Government | | | – | | |
| Proceeds from maturities and sales of securities: | | | |
| Long-Term excluding U.S. Government | | | 48,082 | | |
| U.S. Government | | | – | | |
NOTE 4. FEDERAL INCOME TAX MATTERS
The Fund has not made any provision for federal income or excise taxes due to its policy to distribute all of its taxable income and capital gains to its shareholders and otherwise qualify as a regulated investment company under the Internal Revenue Code. Income and capital gain distributions are determined in accordance with income tax regulations, which may differ from GAAP. These differences are primarily due to differing treatment for items including, but not limited to, wash sales, net operating losses and capital loss carryforwards.
Reclassifications between Undistributed net investment income (loss), Undistributed net realized capital gains (loss) and Shares of beneficial interest are made to reflect income and gains available for distribution under federal tax regulations. Results of operations and net assets are not effected by these reclassifications. These reclassifications are as follows:
Shares of beneficial interest, unlimited
shares authorized | | $ | (564 | ) | |
| Undistributed net investment income (loss) | | | 564 | | |
The capital loss carryforwards are available to offset future realized capital gains through the periods listed:
Capital Loss
Carryforward | | Available through | |
| $ | 3,191 | | | October 31, 2009 | |
| | 6,883 | | | October 31, 2010 | |
| | 10,217 | | | October 31, 2011 | |
The capital loss carryover utilized during the year ended October 31, 2004 was $922.
The tax basis components of distributable earnings as of October 31, 2004, are as follows:
| Undistributed Ordinary Income | | $ | – | | |
| Undistributed Long-term Capital Gains | | $ | – | | |
| Capital Loss Carryforward | | $ | (20,291 | ) | |
| Net Unrealized Appreciation (Depreciation) | | $ | 5,270 | | |
The aggregate cost of investments and composition of unrealized appreciation (depreciation) for federal income tax purposes as of October 31, 2004, are as follows:
| Federal Tax Cost Basis | | $ | 120,859 | | |
| Unrealized Appreciation | | $ | 9,923 | | |
| Unrealized (Depreciation) | | | (4,653 | ) | |
| Net Unrealized Appreciation (Depreciation) | | $ | 5,270 | | |
NOTE 5. OTHER MATTERS
Transamerica IDEX Mutual Funds ("TA IDEX"), and certain of its affiliated entities, have received requests for information from the Staff of the Securities and Exchange Commission in connection with market timing and late trading within the funds. TA IDEX and the affiliated entities have voluntarily cooperated in the investigation and have been providing the information as requested.
Transamerica IDEX Mutual Funds
Annual Report 2004
12
Report of Independent Registered Certified Public Accounting Firm
To the Board of Trustees and Shareholders of
TA IDEX Great Companies–America
In our opinion, the accompanying statement of assets and liabilities, including the schedule of investments, and the related statements of operations and of changes in net assets and the financial highlights present fairly, in all material respects, the financial position of TA IDEX Great Companies–America (the "Fund") (one of the portfolios constituting the Transamerica IDEX Mutual Funds) at October 31, 2004, the results of its operations for the year then ended, the changes in its net assets for each of the two years in the period then ended and the financial highlights for each of the periods indicated, in conformity with accounting principles generally accepted in the United States of America. These financial statements and financial highlights (hereafter referred to as "financial statements") are the responsibility of the Fund's management; our responsibility is to express an op inion on these financial statements based on our audits. We conducted our audits of these financial statements in accordance with the standards of the Public Company Accounting Oversight Board (United States). Those standards require that we plan and perform the audit to obtain reasonable assurance about whether the financial statements are free of material misstatement. An audit includes examining, on a test basis, evidence supporting the amounts and disclosures in the financial statements, assessing the accounting principles used and significant estimates made by management, and evaluating the overall financial statement presentation. We believe that our audits, which included confirmation of securities at October 31, 2004 by correspondence with the custodian and brokers, provide a reasonable basis for our opinion.
PricewaterhouseCoopers LLP
Tampa, Florida
December 28, 2004
Transamerica IDEX Mutual Funds
Annual Report 2004
13
TA IDEX Great Companies–AmericaSM
SUPPLEMENTAL INFORMATION
RESULTS OF SHAREHOLDER PROXY (unaudited)
At a special meeting of Class M shareholders of each series of Transamerica IDEX (except TA IDEX Federated Tax Exempt and TA IDEX Protected Principal Stock) held on September 2, 2004, the results of the Proposal were as follows:
Proposal 1: Approval of a conversion of Class M shares into Class C shares of the Funds, which will result in bearing the distribution and service fees payable under the 12b-1 Plan of Distribution for the Class C shares of the Funds.
| For | | Against | | Abstentions/Broker Non-Votes | |
| | 80.89 | % | | | 7.07 | % | | | 12.04 | % | |
Transamerica IDEX Mutual Funds
Annual Report 2004
14
TA IDEX Great Companies–TechnologySM
MARKET ENVIRONMENT
After tremendous returns in the previous year, this past year has seen modest returns and rising anxiety on a number of fronts. The political uncertainty of a close race, the rising relative price of energy, and the worries about global terror have all depressed investors' optimism of last autumn. However, we have had tremendous fundamental expansion as a backdrop too. As each of the concerns begins to wane, we expect that market conditions will improve substantially.
PERFORMANCE
For the year ended October 31, 2004, TA IDEX Great Companies – TechnologySM, Class A returned 5.26%. By comparison its primary and secondary benchmarks, the NASDAQ 100 Index ("NASDAQ 100") and the NASDAQ Composite Index, returned 4.97% and 2.21%, respectively.
STRATEGY REVIEW
Our selection of outperforming stocks such as the security software company Symantec Corporation, which posted a one year gain in excess of 70%, has helped offset weakness in many of the technology related stocks and lead to out-performance of our portfolio on the whole. Internet stocks such as eBay Inc. and Yahoo! Inc., posted gains of 75% and 66%, respectively over the last one year period, offsetting weakness in semiconductor and semiconductor capital equipment stocks such as Intel Corporation, which declined by -32% over the last year.
Over the past year, the semiconductor industry and its capital goods suppliers have both experienced a downturn brought about by investor concerns over supplies and inventories, and for this reason their stock prices have suffered. As a result, long term reasonable estimates of growth and profitability show great potential in these sectors when this adjustment period is over, and we factor this into our management strategy.
As additional capacity for energy and other commodity production eases concerns about adequacy of raw material supplies, we believe growth rates in the Far East will resume above-average levels and much of the current concern with global growth will fade.
As in the past, we have occasionally trimmed positions in stocks that have advanced in price above our estimate of intrinsic value and we tend to redeploy the proceeds in stocks that exhibit discounts from their intrinsic values. We also look carefully at fundamental progress in each of our companies, trying to distinguish whether short-term deviations from sales, margin or earnings trends are aberrations or a true change in trend. We seek to increase positions where aberrations create valuation opportunities and discard positions in companies where the fundamentals are deteriorating in a more permanent way.
Jim Huguet
Gerry Bollman, CFA
Matt Stephani, CFA, CPA
Co-Fund Managers
Great Companies, L.L.C.
Transamerica IDEX Mutual Funds
Annual Report 2004
1
TA IDEX Great Companies–TechnologySM
Comparison of change in value of $10,000 investment in Class A shares and its comparative index.
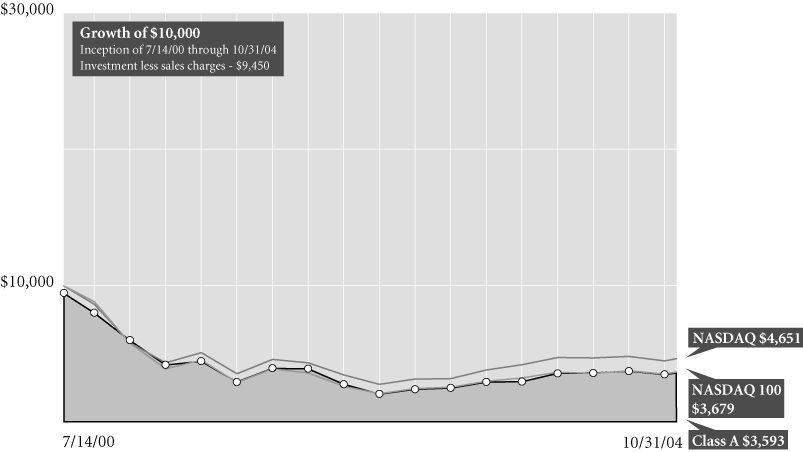
Average Annual Total Return for Periods Ended 10/31/04
| | | 1 year | | From
Inception | | Inception
Date | |
| Class A (NAV) | | | 5.26 | % | | | (26.18 | )% | | 7/14/00 | |
| Class A (POP) | | | (0.53 | )% | | | (21.22 | )% | | 7/14/00 | |
| NASDAQ 1001 | | | 4.97 | % | | | (20.78 | )% | | 7/14/00 | |
| NASDAQ Composite1 | | | 2.21 | % | | | (16.33 | )% | | 7/14/00 | |
| Class B (NAV) | | | 4.84 | % | | | (20.77 | )% | | 7/14/00 | |
| Class B (POP) | | | (0.16 | )% | | | (20.96 | )% | | 7/14/00 | |
| Class C (NAV) | | | 4.56 | % | | | 22.82 | % | | 11/11/02 | |
| Class C (POP) | | | 3.56 | % | | | 22.82 | % | | 11/11/02 | |
NOTES
1 The NASDAQ 100 Index (NASDAQ 100) and the NASDAQ Composite (NASDAQ Composite) Index are unmanaged indices used as a general measure of market
performance. Calculations assume dividends and capital gains are reinvested and do not include any managerial expenses. From inception calculation is based on life of Class A shares. Source: Standard & Poor's Micropal®© Mic ropal, Inc. 2004 – 1-800-596-5323 – http://www.micropal.com.
The performance data presented represents past performance, future results may vary. Performance data does not reflect the deduction of taxes that would be paid on fund distributions or the redemption of fund shares. Investment return and principal value will fluctuate so that an investor's shares, when redeemed, may be worth more or less than their original cost. Current performance may be lower or higher than performance quoted.
Public Offering Price (POP) returns include the reinvestment of dividends and capital gains and reflect the maximum sales charge of 5.5% for A shares or the maximum applicable contingent deferred sales charge (5% in the 1st year, decreasing to 0% after 6 years) for Class B shares and 1% (during the first 12 months) for Class C shares. Shares purchased prior to March 1, 2004 are subject to a maximum applicable contingent deferred sales charge (5% in the 1st year, decreasing to 0% after 7 years) for Class B shares and (2% in the 1st year, decreasing to 0% after 2 years) for Class C shares.&nb sp;Net Asset Value (NAV) returns include the reinvestment of dividends and
capital gains but do not reflect any sales charges.
Investing in technology stocks generally involves greater volatility and risks, so an investment in the fund may not be appropriate for everyone.
Investments in a "non-diversified" fund may be subject to specific risks such as susceptibility to single economic political, or regulatory events, and may be subject to greater loss than investments in a diversified fund.
The management of this fund is based on a specific philosophy and on proprietary systems and methodology. There is no guarantee the fund will achieve its objectives.
This material must be preceded or accompanied by a current prospectus, which includes specific contents regarding the investment objectives and policies of this fund.
Transamerica IDEX Mutual Funds
Annual Report 2004
2
TA IDEX Great Companies–TechnologySM
UNDERSTANDING YOUR FUND'S EXPENSES (unaudited)
SHAREHOLDER EXPENSES
The following Example is intended to help you understand your ongoing costs (in dollars and cents) of investing in a Fund and to compare these costs with the ongoing costs of investing in other funds.
The Example is based on an investment of $1,000 invested at the beginning of the period and held for the entire period from May 1, 2004 to October 31, 2004.
ACTUAL EXPENSES
The first line in the table below provides information about actual account values and actual expenses. You may use the information in this line, together with the amount you invested, to estimate the expenses that you paid over the period. Simply divide your account value by $1,000 (for example, an $8,600 account value divided by $1,000 = 8.6), then multiply the result by the number in the first line of your Fund under the heading entitled "Expenses Paid During Period" to estimate the expenses you paid on your account during this period.
HYPOTHETICAL EXAMPLE FOR COMPARISON PURPOSES
The second line in the table below provides information about hypothetical account values and hypothetical expenses based on each Fund's actual expense ratio and an assumed rate of return of 5% per year before expenses, which is not the Fund's actual return. The hypothetical account values and expenses may not be used to estimate the actual ending account balance or expenses you paid for the period. You may use this information to compare the ongoing costs of investing in your Fund and other funds. To do so, compare this 5% hypothetical example with the 5% hypothetical examples that appear in the shareholder reports of the other funds.
Please note that the expenses shown in the table are meant to highlight your ongoing costs only and do not reflect any transactional costs, such as sales charges, redemption fees, brokerage commissions paid on purchases and sales of fund shares. Therefore, the second line under each Fund in the table is useful in comparing ongoing costs only, and will not help you determine the relative total costs of owning different funds. In addition, note that the expenses shown in the table are meant to highlight your ongoing costs and do not reflect any transaction costs.
| | | Beginning
Account
Value | | Ending
Account
Value | | Annualized
Expense
Ratio | | Expenses Paid
During Period (a) | |
| Class A | | | |
| Actual | | $ | 1,000.00 | | | $ | 1,027.00 | | | | 1.46 | % | | $ | 7.44 | | |
| Hypothetical (b) | | | 1,000.00 | | | | 1,017.80 | | | | 1.46 | | | | 7.41 | | |
| Class B | | | |
| Actual | | | 1,000.00 | | | | 1,027.90 | | | | 1.90 | | | | 9.69 | | |
| Hypothetical (b) | | | 1,000.00 | | | | 1,015.58 | | | | 1.90 | | | | 9.63 | | |
| Class C | | | |
| Actual | | | 1,000.00 | | | | 1,025.10 | | | | 2.39 | | | | 12.17 | | |
| Hypothetical (b) | | | 1,000.00 | | | | 1,013.12 | | | | 2.39 | | | | 12.09 | | |
(a) Expenses are calculated using each Fund's annualized expense ratio (as disclosed in the table), multiplied by the average account value for the period, multiplied by number of days in the period (184 days), and divided by the number of days in the year (366 days).
(b) 5% return per year before expenses.
GRAPHIC PRESENTATION OF SCHEDULE OF INVESTMENTS
By Industry
At October 31, 2004

This chart shows the percentage breakdown by Industry of the Fund's total investment securities.
Transamerica IDEX Mutual Funds
Annual Report 2004
3
TA IDEX Great Companies–TechnologySM
SCHEDULE OF INVESTMENTS
At October 31, 2004
(all amounts except share amounts in thousands)
| | | Shares | | Value | |
| COMMON STOCKS (92.1%) | | | |
| Business Services (10.1%) | | | |
| eBay, Inc. (a) | | | 46,300 | | | $ | 4,519 | | |
| First Data Corp. | | | 209,083 | | | | 8,631 | | |
| Communications Equipment (5.4%) | | | |
| QUALCOMM, Inc. | | | 169,500 | | | | 7,087 | | |
| Computer & Data Processing Services (21.1%) | | | |
| Electronic Arts, Inc. (a)(b) | | | 103,100 | | | | 4,631 | | |
| Microsoft Corp. | | | 393,500 | | | | 11,014 | | |
| Symantec Corp. (a)(b) | | | 141,900 | | | | 8,080 | | |
| Yahoo!, Inc. (a) | | | 106,520 | | | | 3,855 | | |
| Computer & Office Equipment (23.9%) | | | |
| Cisco Systems, Inc. (a) | | | 313,600 | | | | 6,024 | | |
| Dell, Inc. (a) | | | 245,900 | | | | 8,621 | | |
| EMC Corp. (a) | | | 770,000 | | | | 9,910 | | |
| International Business Machines Corp. | | | 74,700 | | | | 6,704 | | |
| Electronic Components & Accessories (21.6%) | | | |
| Analog Devices, Inc. (b) | | | 152,700 | | | | 6,148 | | |
| Intel Corp. | | | 203,024 | | | | 4,519 | | |
| Maxim Integrated Products, Inc. | | | 123,900 | | | | 5,451 | | |
| Texas Instruments, Inc. | | | 242,300 | | | | 5,924 | | |
| Xilinx, Inc. | | | 203,100 | | | | 6,215 | | |
| Industrial Machinery & Equipment (2.9%) | | | |
| Applied Materials, Inc. (a) | | | 235,100 | | | | 3,785 | | |
| Instruments & Related Products (2.5%) | | | |
| Waters Corp. (a) | | | 79,400 | | | | 3,279 | | |
| Pharmaceuticals (4.6%) | | | |
| Amgen, Inc. (a) | | | 106,300 | | | | 6,038 | | |
| Total Common Stocks (cost: $109,104) | | | | | | | 120,435 | | |
| | | Principal | | Value | |
| SECURITY LENDING COLLATERAL (6.3%) | | | |
| Debt (5.9%) | | | |
| Bank Notes (1.1%) | | | |
Bank of America
1.77%, due 12/03/2004 | | $ | 404 | | | |
$404 | | |
| 1.88%, due 12/23/2004 | | | 135 | | | | 135 | | |
| 1.77%, due 01/18/2005 | | | 269 | | | | 269 | | |
Canadian Imperial Bank of Commerce
1.86%, due 11/04/2004 | | | 606 | | | | 606 | | |
Credit Suisse First Boston Corp.
1.83%, due 09/09/2005 | | | 67 | | | | 67 | | |
| Commercial Paper (0.6%) | | | |
Clipper Receivables Corp.
1.79%, due 11/12/2004 | | | 200 | | | | 200 | | |
| | | Principal | | Value | |
| Commercial Paper (continued) | |
Delaware Funding Corp. 144A
1.85%, due 11/19/2004 | | $67 | | $67 | |
Falcon Asset Securitization Corp. 144A
1.78%, due 11/04/2004
1.75%, due 11/10/2004 | | 201
269 | | 201
269 | |
Galaxy Funding 144A
1.88%, due 11/22/2004 | | 67 | | 67 | |
| Euro Dollar Terms (2.8%) | |
Bank of Montreal
1.88%, due 11/24/2004 | | 637 | | 637 | |
BNP Paribas
1.77%, due 11/10/2004
1.80%, due 11/23/2004
1.98%, due 12/27/2004 | | 336
269
269 | | 336
269
269 | |
Calyon
1.70%, due 11/24/2004 | | 36 | | 36 | |
Citigroup
2.06%, due 01/25/2005 | | 673 | | 673 | |
Den Danske Bank
1.82%, due 11/19/2004 | | 336 | | 336 | |
Dexia Group
2.04%, due 01/21/2005 | | 156 | | 156 | |
HBOS Halifax Bank of Scotland
2.03%, due 01/21/2005 | | 135 | | 135 | |
Royal Bank of Scotland
2.01%, due 01/20/2005 | | 269 | | 269 | |
Toronto Dominion Bank
1.70%, due 11/08/2004 | | 135 | | 135 | |
Wells Fargo
1.87%, due 11/22/2004 | | 336 | | 336 | |
| Promissory Notes (0.6%) | |
Goldman Sachs Group Inc.
1.90%, due 12/29/2004
1.88%, due 01/27/2005 | | 283
471 | | 283
471 | |
| Repurchase Agreements (0.8%) | |
Merrill Lynch & Co., Inc.
1.92% Repurchase Agreement dated
10/29/04 to be repurchased at $1,076
on 11/01/04 (c) | | 1,076 | | 1,076 | |
| | | Shares | | Value | |
| Investment Companies (0.4%) | |
| Money Market Funds (0.4%) | |
Merrill Lynch Premier Institutional Fund
1-day yield of 1.71% | | 330,975 | | $331 | |
The notes to the financial statements are an integral part of this report.
Transamerica IDEX Mutual Funds
Annual Report 2004
4
TA IDEX Great Companies–TechnologySM
SCHEDULE OF INVESTMENTS (continued)
At October 31, 2004
(all amounts except share amounts in thousands)
| | | Shares | | Value | |
| Money Market Funds (continued) | |
Merrimac Cash Fund, Premium Class
1-day yield of 1.46% | | 242,204 | | $242 | |
| Total Security Lending Collateral (cost: $8,275) | | | | | 8,275 | | |
| Total Investment Securities (cost: $117,379) | | | | $ | 128,710 | | |
| | | | | Value | |
| SUMMARY: | | | |
| Investments, at value | | | 98.3 | % | | $ | 128,710 | | |
| Other assets in excess of liabilities | | | 1.7 | % | | | 2,238 | | |
| Net assets | | | 100.0 | % | | $ | 130,948 | | |
NOTES TO SCHEDULE OF INVESTMENTS:
(a) No dividends were paid during the preceding twelve months.
(b) At October 31, 2004, all or a portion of this security is on loan (see Note 1). The value at October 31, 2004, of all securities on loan is $8,032.
(c) Cash collateral for the Repurchase Agreements, valued at $1,098, that serve as collateral for securities lending are invested in corporate bonds with interest rates and maturity dates ranging from 0.00%–9.75% and 05/15/2005–9/15/2033, respectively.
DEFINITIONS:
144A 144A Securities are registered pursuant to Rule 144A of the Securities Act of 1933. These securities are deemed to be liquid for purposes of compliance limitations on holdings of illiquid securities and may be resold as transactions exempt from registration normally to qualified institutional buyers. At October 31, 2004, these securities aggregated $604 or 0.5% of the net assets of the Fund.
The notes to the financial statements are an integral part of this report.
Transamerica IDEX Mutual Funds
Annual Report 2004
5
TA IDEX Great Companies–TechnologySM
STATEMENT OF ASSETS AND LIABILITIES
At October 31, 2004
(all amounts except per share amounts in thousands)
| Assets: | | | |
Investment securities, at value (cost: $117,379)
(including securities loaned of 8,032) | | $ | 128,710 | | |
| Cash | | | 10,724 | | |
| Receivables: | |
| Shares of beneficial interest sold | | | 2 | | |
| Interest | | | 10 | | |
| Dividends | | | 6 | | |
| Other | | | 2 | | |
| | | | 139,454 | | |
| Liabilities: | | | |
| Accounts payable and accrued liabilities: | |
| Shares of beneficial interest redeemed | | | 19 | | |
| Management and advisory fees | | | 84 | | |
| Distribution fees | | | 41 | | |
| Transfer agent fees | | | 19 | | |
| Payable for collateral for securities on loan | | | 8,275 | | |
| Other | | | 68 | | |
| | | | 8,506 | | |
| Net Assets | | $ | 130,948 | | |
| Net Assets Consist of: | | | |
Shares of beneficial interest, unlimited shares
authorized, no par value | | $ | 128,833 | | |
| Accumulated net investment income (loss) | | | – | | |
Accumulated net realized gain (loss) from
investment securities | | | (9,216 | ) | |
Net unrealized appreciation (depreciation) on
investment securities | | | 11,331 | | |
| Net Assets | | $ | 130,948 | | |
| Net Assets by Class: | | | |
| Class A | | $ | 119,985 | | |
| Class B | | | 6,874 | | |
| Class C | | | 4,089 | | |
| Shares Outstanding: | | | |
| Class A | | | 31,539 | | |
| Class B | | | 1,871 | | |
| Class C | | | 1,115 | | |
| Net Asset Value Per Share: | | | |
| Class A | | $ | 3.80 | | |
| Class B | | | 3.68 | | |
| Class C | | | 3.67 | | |
| Maximum Offering Price Per Share (a): | | | |
| Class A | | $ | 4.02 | | |
(a) Includes the maximum selling commission (represented as a percentage of offering price) which is reduced on certain levels of sales as set forth in the Prospectus. Net asset value per share for Classes B and C shares represents offering price. The redemption price for Classes B and C shares equals net asset value less any applicable contingent deferred sales charge.
STATEMENT OF OPERATIONS
For the year ended October 31, 2004
(all amounts in thousands)
| Investment Income: | | | |
| Interest | | $ | 51 | | |
| Dividends | | | 223 | | |
| Income from loaned securities–net | | | 8 | | |
| | | | 282 | | |
| Expenses: | | | |
| Management and advisory fees | | | 950 | | |
| Transfer agent fees | |
| Class A | | | 102 | | |
| Class B | | | 4 | | |
| Class C | | | – | | |
| Class C2 | | | 2 | | |
| Class M | | | 1 | | |
| Printing and shareholder reports | | | 11 | | |
| Custody fees | | | 17 | | |
| Administration fees | | | 22 | | |
| Legal fees | | | 4 | | |
| Audit and accounting fees | | | 12 | | |
| Trustees fees | | | 7 | | |
| Registration fees | |
| Class A | | | 52 | | |
| Class B | | | – | | |
| Class C | | | 14 | | |
| Class C2 | | | 1 | | |
| Class M | | | 1 | | |
| Other | | | 6 | | |
| Distribution and service fees: | |
| Class A | | | 372 | | |
| Class B | | | 76 | | |
| Class C | | | 19 | | |
| Class C2 | | | 15 | | |
| Class M | | | 11 | | |
| Total expenses | | | 1,699 | | |
Less:
Reimbursement of class expenses:
Class C | | | (7 | ) | |
| Net expenses | | | 1,692 | | |
| Net Investment Income (Loss) | | | (1,410 | ) | |
| Net Realized and Unrealized Gain (Loss): | | | |
| Realized gain (loss) from investment securities | | | 7,229 | | |
Increase (decrease) in unrealized appreciation
(depreciation) on investment securities | | | (596 | ) | |
| Net Gain (Loss) on Investment Securities | | | 6,633 | | |
Net Increase (Decrease) in Net Assets Resulting
from Operations | | $ | 5,223 | | |
The notes to the financial statements are an integral part of this report.
Transamerica IDEX Mutual Funds
Annual Report 2004
6
TA IDEX Great Companies–TechnologySM
STATEMENTS OF CHANGES IN NET ASSETS
For the years ended
(all amounts in thousands)
| | | October 31,
2004 | | October 31,
2003 | |
| Increase (Decrease) in Net Assets From: | |
| Operations: | |
| Net investment income (loss) | | $ | (1,410 | ) | | $ | (545 | ) | |
Net realized gain (loss) from
investment securities | | | 7,229 | | | | (1,484 | ) | |
Net unrealized appreciation
(depreciation) on investment
securities | | | (596 | ) | | | 17,809 | | |
| | | | 5,223 | | | | 15,780 | | |
| Capital Share Transactions: | |
| Proceeds from shares sold: | |
| Class A | | | 43,251 | | | | 63,338 | | |
| Class B | | | 1,211 | | | | 3,041 | | |
| Class C | | | 1,072 | | | | 733 | | |
| Class C2 | | | 217 | | | | 989 | | |
| Class M | | | 169 | | | | 669 | | |
| | | | 45,920 | | | | 68,770 | | |
| Cost of shares redeemed: | |
| Class A | | | (6,253 | ) | | | (4,133 | ) | |
| Class B | | | (2,528 | ) | | | (1,512 | ) | |
| Class C | | | (1,125 | ) | | | (39 | ) | |
| Class C2 | | | (485 | ) | | | (538 | ) | |
| Class M | | | (584 | ) | | | (776 | ) | |
| | | | (10,975 | ) | | | (6,998 | ) | |
| Class level exchanges: | |
| Class C | | | 3,369 | | | | – | | |
| Class C2 | | | (2,246 | ) | | | – | | |
| Class M | | | (1,123 | ) | | | – | | |
| | | | – | | | | – | | |
| Automatic conversions: | |
| Class A | | | 5 | | | | – | | |
| Class B | | | (5 | ) | | | – | | |
| | | | – | | | | – | | |
| | | | 34,945 | | | | 61,772 | | |
| Net increase (decrease) in net assets | | | 40,168 | | | | 77,552 | | |
| Net Assets: | |
| Beginning of year | | | 90,780 | | | | 13,228 | | |
| End of year | | $ | 130,948 | | | $ | 90,780 | | |
Accumulated Net Investment Income
(Loss) | | $ | – | | | $ | – | | |
| | | October 31,
2004 | | October 31,
2003 | |
| Share Activity: | | | |
| Shares issued: | |
| Class A | | | 11,526 | | | | 20,626 | | |
| Class B | | | 335 | | | | 1,020 | | |
| Class C | | | 299 | | | | 222 | | |
| Class C2 | | | 60 | | | | 359 | | |
| Class M | | | 47 | | | | 226 | | |
| | | | 12,267 | | | | 22,453 | | |
| Shares redeemed: | |
| Class A | | | (1,667 | ) | | | (1,465 | ) | |
| Class B | | | (705 | ) | | | (516 | ) | |
| Class C | | | (316 | ) | | | (11 | ) | |
| Class C2 | | | (133 | ) | | | (181 | ) | |
| Class M | | | (161 | ) | | | (268 | ) | |
| | | | (2,982 | ) | | | (2,441 | ) | |
| Class level exchanges: | |
| Class C | | | 921 | | | | – | | |
| Class C2 | | | (602 | ) | | | – | | |
| Class M | | | (318 | ) | | | – | | |
| | | | 1 | | | | – | | |
| Automatic conversions: | |
| Class A | | | 1 | | | | – | | |
| Class B | | | (1 | ) | | | – | | |
| | | | – | | | | – | | |
Net increase (decrease) in shares
outstanding: | |
| Class A | | | 9,860 | | | | 19,161 | | |
| Class B | | | (371 | ) | | | 504 | | |
| Class C | | | 904 | | | | 211 | | |
| Class C2 | | | (675 | ) | | | 178 | | |
| Class M | | | (432 | ) | | | (42 | ) | |
| | | | 9,286 | | | | 20,012 | | |
The notes to the financial statements are an integral part of this report.
Transamerica IDEX Mutual Funds
Annual Report 2004
7
TA IDEX Great Companies–TechnologySM
FINANCIAL HIGHLIGHTS
| | | | | For a share of beneficial interest outstanding throughout each period | |
| | | | | Net Asset | | Investment Operations | | Distributions | | Net Asset | |
| | | For the
Period
Ended (d)(g) | | Value,
Beginning
of Period | | Net
Investment
Income (Loss) | | Net Realized
and Unrealized
Gain (Loss) | | Total
Operations | | From Net
Investment
Income | | From Net
Realized
Gains | | Total
Distributions | | Value,
End
of Period | |
| Class A | | 10/31/2004 | | $ | 3.61 | | | $ | (0.04 | ) | | $ | 0.23 | | | $ | 0.19 | | | $ | – | | | $ | – | | | $ | – | | | $ | 3.80 | | |
| | | 10/31/2003 | | | 2.56 | | | | (0.04 | ) | | | 1.09 | | | | 1.05 | | | | – | | | | – | | | | – | | | | 3.61 | | |
| | | 10/31/2002 | | | 3.63 | | | | (0.05 | ) | | | (1.02 | ) | | | (1.07 | ) | | | – | | | | – | | | | – | | | | 2.56 | | |
| | | 10/31/2001 | | | 7.93 | | | | (0.06 | ) | | | (4.24 | ) | | | (4.30 | ) | | | – | | | | – | | | | – | | | | 3.63 | | |
| | | 10/31/2000 | | | 10.00 | | | | – | | | | (2.07 | ) | | | (2.07 | ) | | | – | | | | – | | | | – | | | | 7.93 | | |
| Class B | | 10/31/2004 | | | 3.51 | | | | (0.06 | ) | | | 0.23 | | | | 0.17 | | | | – | | | | – | | | | – | | | | 3.68 | | |
| | | 10/31/2003 | | | 2.50 | | | | (0.06 | ) | | | 1.07 | | | | 1.01 | | | | – | | | | – | | | | – | | | | 3.51 | | |
| | | 10/31/2002 | | | 3.58 | | | | (0.08 | ) | | | (1.00 | ) | | | (1.08 | ) | | | – | | | | – | | | | – | | | | 2.50 | | |
| | | 10/31/2001 | | | 7.91 | | | | (0.10 | ) | | | (4.23 | ) | | | (4.33 | ) | | | – | | | | – | | | | – | | | | 3.58 | | |
| | | 10/31/2000 | | | 10.00 | | | | (0.02 | ) | | | (2.07 | ) | | | (2.09 | ) | | | – | | | | – | | | | – | | | | 7.91 | | |
| Class C | | 10/31/2004 | | | 3.51 | | | | (0.07 | ) | | | 0.23 | | | | 0.16 | | | | – | | | | – | | | | – | | | | 3.67 | | |
| | | 10/31/2003 | | | 2.45 | | | | (0.06 | ) | | | 1.12 | | | | 1.06 | | | | – | | | | – | | | | – | | | | 3.51 | | |
| | | | | | | Ratios/Supplemental Data | |
| | | For the
Period | | Total | | Net Assets,
End of
Period | | Ratio of Expenses
to Average
Net Assets (a) | | Net Investment
Income (Loss)
to Average | | Portfolio
Turnover | |
| | | Ended (g) | | Return (c) | | (000's) | | Net (e) | | Total (f) | | Net Assets (a) | | Rate (b) | |
| Class A | | 10/31/2004 | | | 5.26 | % | | $ | 119,985 | | | | 1.36 | % | | | 1.36 | % | | | (1.12 | )% | | | 41 | % | |
| | | 10/31/2003 | | | 41.02 | | | | 78,289 | | | | 1.55 | | | | 1.90 | | | | (1.23 | ) | | | 24 | | |
| | | 10/31/2002 | | | (29.45 | ) | | | 6,445 | | | | 1.55 | | | | 2.61 | | | | (1.40 | ) | | | 64 | | |
| | | 10/31/2001 | | | (54.26 | ) | | | 7,106 | | | | 1.55 | | | | 2.68 | | | | (1.04 | ) | | | 58 | | |
| | | 10/31/2000 | | | (20.66 | ) | | | 6,322 | | | | 1.55 | | | | 5.55 | | | | (0.64 | ) | | | 11 | | |
| Class B | | 10/31/2004 | | | 4.84 | | | | 6,874 | | | | 1.91 | | | | 1.91 | | | | (1.68 | ) | | | 41 | | |
| | | 10/31/2003 | | | 40.40 | | | | 7,864 | | | | 2.20 | | | | 2.55 | | | | (1.88 | ) | | | 24 | | |
| | | 10/31/2002 | | | (30.12 | ) | | | 4,348 | | | | 2.20 | | | | 3.26 | | | | (2.05 | ) | | | 64 | | |
| | | 10/31/2001 | | | (54.80 | ) | | | 5,938 | | | | 2.20 | | | | 3.33 | | | | (1.69 | ) | | | 58 | | |
| | | 10/31/2000 | | | (20.86 | ) | | | 3,295 | | | | 2.20 | | | | 6.20 | | | | (1.29 | ) | | | 11 | | |
| Class C | | 10/31/2004 | | | 4.56 | | | | 4,089 | | | | 2.20 | | | | 2.60 | | | | (1.94 | ) | | | 41 | | |
| | | 10/31/2003 | | | 43.27 | | | | 739 | | | | 2.20 | | | | 2.55 | | | | (1.88 | ) | | | 24 | | |
NOTES TO FINANCIAL HIGHLIGHTS
(a) Annualized.
(b) Not annualized for periods of less than one year.
(c) Total Return has been calculated for the applicable periods without deduction of a sales load, if any, on an initial purchase. Periods of less than one year are not annualized.
(d) Per share information is calculated based on average number of shares outstanding for the years ended 10/31/2001, 10/31/2002, 10/31/2003
and 10/31/2004.
(e) Ratio of Net Expenses to Average Net Assets is net of fee waivers and reimbursements by the investment adviser, if any (see note 2).
(f) Ratio of Total Expenses to Average Net Assets includes all expenses before fee waivers and reimbursements by the investment adviser.
(g) TA IDEX Great Companies–Technology ("the Fund") commenced operations on July 14, 2000. The inception date for the Fund's offering of share Class L was November 11, 2002. Class L was renamed Class C on March 1, 2004. (see note 1).
The notes to the financial statements are an integral part of this report.
Transamerica IDEX Mutual Funds
Annual Report 2004
8
TA IDEX Great Companies–TechnologySM
NOTES TO FINANCIAL STATEMENTS
At October 31, 2004
(all amounts in thousands)
NOTE 1. ORGANIZATION AND SIGNIFICANT ACCOUNTING POLICIES
Transamerica IDEX Mutual Funds, formerly IDEX Mutual Funds, is a Massachusetts business trust registered under the Investment Company Act of 1940, as amended (the "1940 Act"), as an open-end management investment company. TA IDEX Great Companies–TechnologySM ("the Fund"), part of Transamerica IDEX Mutual Funds, began operations on July 14, 2000. The Fund is "non-diversified" under the 1940 Act.
On March 1, 2004, the Fund changed its name from IDEX Great Companies–TechnologySM to TA IDEX Great Companies–TechnologySM.
In the normal course of business, the Fund enters into contracts that contain a variety of representations and warranties, which provide general indemnifications. The Fund's maximum exposure under these arrangements is unknown, as this would involve future claims that may be made against the Fund and/or its affiliates that have not yet occurred. However, based on experience, the Fund expects the risk of loss to be remote.
See the Prospectus and Statement of Additional Information for a description of the Fund's investment objective.
In preparing the Fund's financial statements in accordance with accounting principles generally accepted in the United States of America ("GAAP"), estimates or assumptions (which could differ from actual results) may be used that affect reported amounts and disclosures. The following policies were consistently followed by the Fund, in accordance with GAAP.
Multiple class operations and expenses: The Fund currently offers three classes of shares, each with a public offering price that reflects different sales charges, if any, and expense levels. All shares designated as Class C shares prior to March 1, 2004, were renamed as Class C2 shares on that date. All shares designated as Class L shares prior to March 1, 2004, were renamed as Class C shares with different sales charges than the previous Class L shares. On June 15, 2004, Class C2 shares merged into Class C. On September 24, 2004, Class M shares merged into Class C. Class B shares will convert to Class A shares eight years after purchase. Income, non-class specific expenses and realized and unrealized gains and losses, are allocated daily to each class, based upon the value of shares outstanding method as permitted under Rule 18f-3 of the 1940 Act. Each class bears its own specific expenses as well as a portion of general, common expenses.
Pricing of shares: The Fund prices its shares on the basis of the net asset value of each class of shares of the Fund, which is determined as of the close of the New York Stock Exchange ("NYSE") (generally 4:00 p.m. Eastern Time) on each day on which the NYSE is open for trading (other than a day on which there are insufficient changes in the value of the Fund's portfolio securities to materially affect the Fund's net asset value or a day on which no shares are tendered for redemption and no order to purchase any shares is received).
Security valuations: Fund investments traded on an exchange are valued at the closing price on the day of valuation on the exchange where the security is principally traded. With respect to securities traded on NASDAQ NMS, such closing price may be the last reported sales price or the NASDAQ Official Closing Price.
Securities traded in the over-the-counter market and listed securities for which no sale was reported on that date are valued at the last quoted bid price.
Debt securities are valued by independent pricing services; however, those that mature in sixty days or less are valued at amortized cost, which approximates market.
Investment company securities are valued at net asset value of the underlying portfolio.
Other securities for which quotations are not readily available are valued at fair market value as determined in good faith using guidelines adopted by the Board of Trustees of the Fund, under the supervision of the Fund's Valuation Committee.
Cash: The Fund may leave cash overnight in its cash account with the custodian, Investors Bank & Trust Company ("IBT"). IBT has been contracted on behalf of the Fund to invest the excess cash into a savings account, which at October 31, 2004, was paying an interest rate of 1.30%.
Throughout the year, the Fund may have a cash overdraft balance. A fee is incurred on this overdraft, calculated by multiplying the overdraft by a rate based on the federal funds rate. This fee is included in Custody fees in the Statement of Operations.
Repurchase agreements: The Fund is authorized to enter into repurchase agreements. The Fund, through IBT, receives delivery of the underlying securities, the value of which at the time of purchase is required to be an amount equal to at least 100% of the resale price. Repurchase agreements involve the risk that the seller will fail to repurchase the security, as agreed. In that case, the Fund will bear the risk of value fluctuations until the security can be sold and may encounter delays and incur costs in liquidating the security. In the event of bankruptcy or insolvency of the seller, delays and costs may be incurred.
Commission Recapture: The sub-adviser, to the extent consistent with the best execution and usual commission rate policies and practices, may place security transactions of the Fund with broker/dealers with which Transamerica IDEX Mutual Funds has established a Commission Recapture Program. A Commission Recapture Program is any arrangement under which a broker/dealer applies a portion of the commissions received by such broker/dealer on the security transactions
Transamerica IDEX Mutual Funds
Annual Report 2004
9
TA IDEX Great Companies–TechnologySM
NOTES TO FINANCIAL STATEMENTS (continued)
At October 31, 2004
(all amounts in thousands)
NOTE 1.–(continued)
to the Fund. In no event will commissions paid by the Fund be used to pay expenses that would otherwise be borne by any other funds within Transamerica IDEX Mutual Funds, or by any other party.
Recaptured commissions during the year ended October 31, 2004, of $11 are included in net realized gains in the Statement of Operations.
Securities lending: The Fund may lend securities to enhance fund earnings from investing cash collateral in making such loans to qualified borrowers (typically broker/dealers). The Fund has engaged its custodian bank, IBT, as a lending agent to administer its securities lending program. IBT earned $3 of program income for its services. When the Fund makes a security loan, it receives cash collateral as protection against the risk that the borrower will default on the loan, and records an asset for the cash invested collateral and a liability for the return of the collateral.
Securities on loan are included in Investment securities at value in the Statement of Assets and Liabilities and remain on the Schedule of Investments.
Loans of securities are required to be secured by collateral at least equal to 102% of the value of the securities at inception of the loan, and not less then 100% thereafter. The Fund may invest cash collateral in short-term money market instruments including: U.S. Treasury Bills, U.S. agency obligations, commercial paper, money market mutual funds, repurchase agreements and other highly rated, liquid investments. During the life of securities loans, the collateral and securities loaned remain subject to fluctuation in value. IBT marks to market securities loaned and the collateral each business day. If additional collateral is due (at least $1), IBT collects additional cash collateral from the borrowers. Although securities loaned will be fully collateralized at all times, IBT may experience delays in, or may be prevented from, recovering the collateral on behalf of the Fund. The Fund may recall a loaned security position at any time from the borrower through IBT. In the event the borrower fails to timely return a recalled security, IBT may indemnify the Fund by purchasing replacement securities for the Fund at its own expense and claiming the collateral to fund such a purchase. IBT absorbs the loss if the collateral value is not sufficient to cover the cost of the replacement securities. If replacement securities are not available, IBT will credit the equivalent cash value to the Fund.
While a security is on loan, the Fund does not have the right to vote that security. However, if time permits, the Fund will attempt to recall a security on loan and vote the proxy.
Income from securities lending is included in the Statement of Operations. The amount of collateral and value of securities on loan are included in the Statement of Assets and Liabilities as well as in the Schedule of Investments.
Security transactions and investment income: Security transactions are recorded on the trade date. Security gains and losses are calculated on the specific identification basis. Dividend income is recorded on the ex-dividend date or, in the case of foreign securities, as soon as the Fund is informed of the ex-dividend date. Interest income, including accretion of discounts and amortization of premiums, is recorded on the accrual basis commencing on the settlement date.
Account maintenance fees: If the shareholder account balance falls below $1 by either shareholder action or as a result of market action, a $25 (not in thousands) fee is assessed every year until the balance reaches $1. The fee is assessed by redeeming shares in the shareholder's account.
No fee will be charged under the following conditions:
• accounts opened within the preceding 24 months
• accounts with an active monthly Automatic Investment Plan ($50 (not in thousands) minimum per fund)
• accounts owned by an individual which, when combined by social security number, have a balance of $5 or more
• accounts owned by individuals in the same household (by address) that have a combined balance of $5 or more
• UTMA/UGMA accounts
• Fiduciary accounts
• B-share accounts whose shares have started to convert to A-shares accounts (as long as combined value of both accounts is at least $1)
For the year ended October 31, 2004, this fee totaled $1. These fees are included in Paid in Capital in the Statement of Assets and Liabilities.
Redemption fees: A short-term trading redemption fee may be assessed on any fund shares in a fund account that are sold during the first five (5) New York Stock Exchange trading days following their purchase date. This redemption fee will equal 2% of the amount redeemed and shares held the longest will be treated as being redeemed first and shares held the shortest as being redeemed last. For the year ended October 31, 2004, the Fund received no redemption fees.
Dividend distributions: Distributions to shareholders are recorded on the ex-dividend date and are determined in accordance with Federal income tax regulations which may differ from GAAP.
Transamerica IDEX Mutual Funds
Annual Report 2004
10
TA IDEX Great Companies–TechnologySM
NOTES TO FINANCIAL STATEMENTS (continued)
At October 31, 2004
(all amounts in thousands)
NOTE 2. RELATED PARTY TRANSACTIONS
AEGON/Transamerica Fund Advisers, Inc. ("ATFA") is the Fund's investment adviser. AEGON/Transamerica Fund Services, Inc. ("ATFS") is the Fund's administrator. AFSG Securities Corp. ("AFSG") is the Fund's distributor/principal underwriter. AEGON/Transamerica Investor Services, Inc. ("ATIS") is the Fund's transfer agent. ATIS and AFSG are 100% owned by AUSA Holding Company ("AUSA"). ATFA is a directly owned subsidiary of Western Reserve Life Assurance Co. of Ohio (78%) ("WRL") and AUSA (22%). ATFS is a wholly owned subsidiary of WRL. AUSA and WRL are wholly owned indirect subsidiaries of AEGON NV, a Netherlands corporation.
Great Companies, LLC is both an affiliate of the Fund and a sub-adviser to the Fund.
The following schedule reflects the percentage of fund assets owned by affiliated mutual funds (i.e., through the assets allocation funds):
| | | Net
Assets | | % of
Net Assets | |
TA IDEX Asset Allocation–
Conservative Portfolio | | $ | 7,543 | | | | 6 | % | |
TA IDEX Asset Allocation–
Growth Portfolio | | | 29,630 | | | | 23 | % | |
TA IDEX Asset Allocation–
Moderate Growth Portfolio | | | 48,518 | | | | 37 | % | |
TA IDEX Asset Allocation–
Moderate Portfolio | | | 24,652 | | | | 19 | % | |
| Total | | $ | 110,343 | | | | 85 | % | |
Investment advisory fees: The Fund pays management fees to ATFA based on average daily net assets ("ANA") at the following breakpoints:
0.80% of the first $500 million of ANA
0.70% of ANA over $500 million
ATFA has contractually agreed to waive its advisory fee and will reimburse the Fund to the extent that operating expenses, excluding 12b-1 fees, exceed the following stated annual limit:
1.20% Expense Limit
If total fund expenses fall below the annual expense limitation agreement agreed to by the adviser within the succeeding three years, the Fund may be required to pay that adviser a portion or all of the waived advisory fees.
| | | Advisory Fee
Waived | | Available for
Recapture Through | |
| Fiscal Year 2003 | | $ | 138 | | | 10/31/2006 | |
| Fiscal Year 2002 | | | 193 | | | 10/31/2005 | |
If total class expenses fall below the annual expense limitation agreement agreed to by the adviser within the succeeding three years, the Fund may be required to pay that adviser a portion or all of the reimbursed class expenses.
| | | Reimbursement
of Class Expenses | | Available for
Recapture Through | |
Fiscal Year 2004
Class C | | | 7 | | | 10/31/2007 | |
Distribution and service fees: The Fund has a 12b-1 distribution plan under the 1940 Act pursuant to which an annual fee, based on average daily net assets, is paid to the distributor for various disbursements such as broker-dealer account servicing fees and other promotional expenses of the Fund. The Fund is authorized under the 12b-1 plan to pay fees on each class up to the following limits:
| Class A | | | 0.35 | % | |
| Class B | | | 1.00 | % | |
| Class C | | | 1.00 | % | |
| Class C2 | | | 1.00 | % | |
| Class M | | | 0.90 | % | |
Class C2 and Class M merged into Class C on June 15, 2004 and September 24, 2004, respectively.
In the case the Fund or a class of shares of the Fund is closed to new investors or investments, the Fund is authorized to pay 12b-1 fees for past sales and distribution efforts and present and past investor services.
Underwriter commissions relate to front-end sales charges imposed for Class A and M shares and contingent deferred sales charges from Classes B, C, M and certain A share redemptions. For the year ended October 31, 2004, the underwriter commissions were as follows:
| Received by Underwriter | | $ | 137 | | |
| Retained by Underwriter | | | 6 | | |
| Contingent Deferred Sales Charge | | | 24 | | |
Administrative services: The Fund has entered into an agreement with ATFS for financial and legal fund administration services, which includes such items as compliance, expenses, financial statements and other reporting, distributions, tax returns, prospectus preparation, board of trustees meeting support and other legal matters. The Fund pays ATFS an annual fee of 0.015% of average net assets. The Legal fees on the Statement of Operations are for fees paid to external legal counsel.
The Fund paid ATFS $22 for the year ended October 31, 2004.
Transfer agent fees: The Fund pays ATIS an annual per-account charge of $20 (not in thousands) for each open account and $1.63 (not in thousands) for each closed account. There is no new account charge. The transfer agent fees on the Statement of Operations are made up of fees paid to ATIS and costs associated with shareholder statements. The Fund paid ATIS $109 for the year ended October 31, 2004.
Transamerica IDEX Mutual Funds
Annual Report 2004
11
TA IDEX Great Companies–TechnologySM
NOTES TO FINANCIAL STATEMENTS (continued)
At October 31, 2004
(all amounts in thousands)
NOTE 2.–(continued)
Deferred compensation plan: Each eligible Fund Trustee may elect participation in the Deferred Compensation Plan ("the Plan"). Under the Plan, such Trustees may defer payment of a percentage of their total fees earned as a Fund Trustee. These deferred amounts may be invested in any Transamerica IDEX Mutual Fund. At October 31, 2004, the value of invested plan amount was $2. Invested plan amounts and the total liability for deferred compensation to the Trustees under the Plan at October 31, 2004, are included in the accompanying Statement of Assets and Liabilities.
NOTE 3. INVESTMENT TRANSACTIONS
The cost of securities purchased and proceeds from securities sold (excluding short-term securities) for the year ended October 31, 2004, were as follows:
| Purchases of securities: | | | |
| Long-Term excluding U.S. Government | | $ | 74,989 | | |
| U.S. Government | | | – | | |
| Proceeds from maturities and sales of securities: | | | |
| Long-Term excluding U.S. Government | | | 43,618 | | |
| U.S. Government | | | – | | |
NOTE 4. FEDERAL INCOME TAX MATTERS
The Fund has not made any provision for federal income or excise taxes due to its policy to distribute all of its taxable income and capital gains to its shareholders and otherwise qualify as a regulated investment company under the Internal Revenue Code. Income and capital gain distributions are determined in accordance with income tax regulations, which may differ from GAAP. These differences are primarily due to differing treatment for items including, but not limited to, wash sales, net operating losses and capital loss carryforwards.
Reclassifications between Undistributed net investment income (loss), Undistributed net realized capital gains (loss) and Shares of beneficial interest are made to reflect income and gains available for distribution under federal tax regulations. Results of operations and net assets are not effected by these reclassifications. These reclassifications are as follows:
Shares of beneficial interest, unlimited
shares authorized | | $ | (1,410 | ) | |
| Undistributed net investment income (loss) | | | 1,410 | | |
The capital loss carryforwards are available to offset future realized capital gains through the periods listed:
Capital Loss
Carryforward | | Available through | |
| $ | 6,163 | | | October 31, 2010 | |
| | 1,294 | | | October 31, 2011 | |
The capital loss utilized during the year ended October 31, 2004 was $7,204.
The tax basis components of distributable earnings as of October 31, 2004, are as follows:
| Undistributed Ordinary Income | | $ | – | | |
| Undistributed Long-term Capital Gains | | $ | – | | |
| Capital Loss Carryforward | | $ | (7,457 | ) | |
| Net Unrealized Appreciation (Depreciation) | | $ | 9,572 | | |
The aggregate cost of investments and composition of unrealized appreciation (depreciation) for federal income tax purposes as of October 31, 2004, are as follows:
| Federal Tax Cost Basis | | $ | 119,138 | | |
| Unrealized Appreciation | | $ | 11,494 | | |
| Unrealized (Depreciation) | | | (1,922 | ) | |
| Net Unrealized Appreciation (Depreciation) | | $ | 9,572 | | |
NOTE 5. OTHER MATTERS
Transamerica IDEX Mutual Funds ("TA IDEX"), and certain of its affiliated entities, have received requests for information from the Staff of the Securities and Exchange Commission in connection with market timing and late trading within the funds. TA IDEX and the affiliated entities have voluntarily cooperated in the investigation and have been providing the information as requested.
Transamerica IDEX Mutual Funds
Annual Report 2004
12
Report of Independent Registered Certified Public Accounting Firm
To the Board of Trustees and Shareholders of
TA IDEX Great Companies–TechnologySM
In our opinion, the accompanying statement of assets and liabilities, including the schedule of investments, and the related statements of operations and of changes in net assets and the financial highlights present fairly, in all material respects, the financial position of TA IDEX Great Companies–TechnologySM (the "Fund") (one of the portfolios constituting the Transamerica IDEX Mutual Funds) at October 31, 2004, the results of its operations for the year then ended, the changes in its net assets for each of the two years in the period then ended and the financial highlights for each of the periods indicated, in conformity with accounting principles generally accepted in the United States of America. These financial statements and financial highlights (hereafter referred to as "financial statements") are the responsibility of the Fund's management; our responsibility is to express an opinion on these financial statements based on our audits. We conducted our audits of these financial statements in accordance with the standards of the Public Company Accounting Oversight Board (United States). Those standards require that we plan and perform the audit to obtain reasonable assurance about whether the financial statements are free of material misstatement. An audit includes examining, on a test basis, evidence supporting the amounts and disclosures in the financial statements, assessing the accounting principles used and significant estimates made by management, and evaluating the overall financial statement presentation. We believe that our audits, which included confirmation of securities at October 31, 2004 by correspondence with the custodian and brokers, provide a reasonable basis for our opinion.

PricewaterhouseCoopers LLP
Tampa, Florida
December 28, 2004
Transamerica IDEX Mutual Funds
Annual Report 2004
13
TA IDEX Great Companies–TechnologySM
SUPPLEMENTAL INFORMATION
RESULTS OF SHAREHOLDER PROXY (unaudited)
TA IDEX Great Companies-Technology
At a special meeting of Class M shareholders of each series of Transamerica IDEX (except TA IDEX Federated Tax Exempt and TA IDEX Protected Principal Stock) held on September 2, 2004, the results of the Proposal were as follows:
Proposal 1: Approval of a conversion of Class M shares into Class C shares of the Funds, which will result in bearing the distribution and service fees payable under the 12b-1 Plan of Distribution for the Class C shares of the Funds.
| For | | Against | | Abstentions/Broker Non-Votes | |
| | 85.43 | % | | | 8.27 | % | | | 6.30 | % | |
Transamerica IDEX Mutual Funds
Annual Report 2004
14
TA IDEX Janus Growth
PERFORMANCE
For the year ended October 31, 2004, TA IDEX Janus Growth Class A returned 9.28%. By comparison its benchmark, the Standard and Poor's 500 Composite Stock Index ("S&P 500"), returned 9.41%.
STRATEGY REVIEW
The difference in performance between the portfolio and its benchmark can be attributed in part to the portfolio's lack of exposure to the energy industry, which was an exceptionally strong area of the market and one of the biggest contributors to the S&P 500's return during the period. The portfolio's gains were also restrained by a small weighting relative to its benchmark in the industrials sector, another area of strength in the market. However, two areas of strength in the portfolio were the healthcare and information technology ("IT") sectors, groups in which we made particularly strong stock selection and had substantial exposure.
We remained focused on large-cap companies that we believe have dominant and differentiated franchises and that generate sustainable top and bottom-line earnings growth. These are generally businesses that have a dynamic new product or service and great secular growth characteristics. We also continue to be very particular about what we pay for a stock, especially when it comes to old-world economy businesses, which are typically in mature industries in which secular growth is a thing of the past. This explains the portfolio's current lack of exposure to the energy sector and limited exposure to industrials. We tend to buy companies in these industries only if there's been a profound change in their business opportunity that enables them to meet the criteria we mentioned above–leading-edge product, market dominance, etc.
In biotechnology, Celgene Corporation posted strong results, driven by excitement over the cancer therapy specialists Thalomid and Revlimid. Thalomid has shown great promise in treating a common form of blood cancer known as multiple myeloma. Already approved by the Food and Drug Administration ("FDA") to help heal skin lesions caused by leprosy, Thalomid has been used "off label" since 1998 to treat multiple myeloma and other cancers. We believe that the FDA's approval of Thalomid for the treatment of multiple myeloma, which is expected to take place during the first half of 2005, should propel sales even higher and power earnings well into the future.
Mandalay Resort Group certainly delivered positive results for the period and rose above the competition in more ways than one. Earlier this year, the Las Vegas hotel-casino resort operator opened THEhotel at Mandalay Bay, a 43-story, 1,120-suite tower, catering to visitors desiring a luxurious experience unlike what the desert gambling mecca typically offers. Additionally, the resort's 1.4-million-square-foot convention center continues to attract business and fill up rooms at very attractive rates. The crowning achievement, however, was when MGM Mirage stepped in this past June 4th and made a bid for the company at $71 a share, a 30% premium over the previous day's closing price.
As the market's tolerance for risk declined during the period, so did the stock price of Amazon.com, Inc. ("Amazon"). Key to the online retailer's success has been its ability to attract more active customers and to then persuade them to buy more products. Despite this winning business strategy, the company recently announced that earnings for the upcoming quarter would likely be lower than investors anticipated due to costs associated with opening a new distribution center in Europe and hiring additional IT staff. Consequently, though we find Amazon to be a great long-term growth story, we decided to reduce our stake.
Radio broadcaster and billboard advertising company Clear Channel Communications. Inc. ("Clear Channel") also traded lower. Watching the stock slide has been a frustrating experience, particularly because the company has made all the right moves to grow revenues in a persistently weak advertising environment. Management has resolutely controlled expenses and has reduced its leverage by paying down debt. Plus, Clear Channel is aggressively buying back its stock in a billion-dollar repurchase program. In spite of its troubles, a new strategy the firm is pursuing has convinced us to stand by the name. Clear Channel's radio stations are reducing the time allocated every hour for station identification and self-promotion announcements so that listeners can enjoy more of what they tune in for–music. We believe this approach will boost ratings, which, in turn, will translate into stronger advertising pri cing in 2005.
Edward Keely, CFA
Fund Manager
Janus Capital Management LLC
Transamerica IDEX Mutual Funds
Annual Report 2004
1
TA IDEX Janus Growth
Comparison of change in value of $10,000 investment in Class A shares and its comparative index.
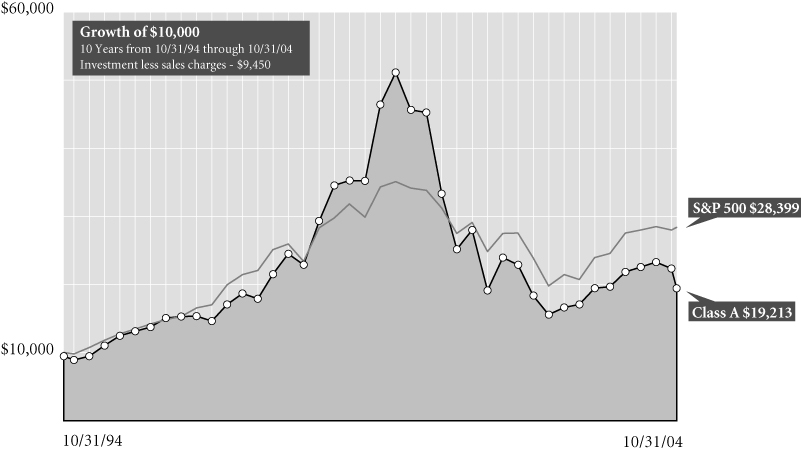
Average Annual Total Return for Periods Ended 10/31/04
| | | 1 year | | 5 years | | 10 years | | From
Inception | | Inception
Date | |
| Class A (NAV) | | | 9.28 | % | | | (9.95 | %) | | | 9.13 | % | | | 11.47 | % | | 5/8/86 | |
| Class A (POP) | | | 3.27 | % | | | (10.96 | %) | | | 8.51 | % | | | 11.13 | % | | 5/8/86 | |
| S&P 5001 | | | 9.41 | % | | | (2.21 | %) | | | 11.01 | % | | | 11.49 | % | | 5/8/86 | |
| Class B (NAV) | | | 8.62 | % | | | (10.58 | %) | | | – | | | | 6.22 | % | | 10/1/95 | |
| Class B (POP) | | | 3.62 | % | | | (10.72 | %) | | | – | | | | 6.22 | % | | 10/1/95 | |
| Class C (NAV) | | | 8.62 | % | | | – | | | | – | | | | 16.91 | % | | 11/11/02 | |
| Class C (POP) | | | 7.62 | % | | | – | | | | – | | | | 16.91 | % | | 11/11/02 | |
| Class T (NAV) | | | 9.49 | % | | | (9.62 | %) | | | 9.46 | % | | | 12.24 | % | | 6/4/85 | |
| Class T (POP) | | | 0.18 | % | | | (11.21 | %) | | | 8.49 | % | | | 11.73 | % | | 6/4/85 | |
NOTES
1 The Standard & Poor's 500 Composite Stock (S&P 500) Index is an unmanaged index used as a general measure of market performance. Calculations assume dividends and capital gains are reinvested and do not include any managerial expenses. From inception calculation is based on life of Class A shares. Source: Standard & Poor's Micropal®© Micropal, Inc. 2004 – 1-800-596-5323 – http://www.micropal.com.
The performance data presented represents past performance, future results may vary. Performance data does not reflect the deduction of taxes that would be paid on fund distributions or the redemption of fund shares. Investment return and principal value will fluctuate so that an investor's shares, when redeemed, may be worth more or less than their original cost. Current performance may be lower or higher than performance quoted.
Public Offering Price (POP) returns include the reinvestment of dividends and capital gains and reflect the maximum sales charge of 5.5% for A shares and 8.5% for T Shares or the maximum applicable contingent deferred sales charge (5% in the 1st year, decreasing to 0% after 6 years) for Class B shares and 1% (during the first 12 months) for Class C shares. Shares purchased prior to March 1, 2004 are subject to a maximum applicable contingent deferred sales charge (5% in the 1st year, decreasing to 0% after 7 years) for Class B shares and (2% in the 1st year, decreasing to 0% after 2 years) for Class C shares. Net Asset Value (NAV) returns include the reinvestment of dividends and capital gains but do not reflect any sales charges.
This material must be preceded or accompanied by a current prospectus, which includes specific contents regarding the investment objectives and policies of this fund.
Transamerica IDEX Mutual Funds
Annual Report 2004
2
TA IDEX Janus Growth
UNDERSTANDING YOUR FUND'S EXPENSES (unaudited)
SHAREHOLDER EXPENSES
The following Example is intended to help you understand your ongoing costs (in dollars and cents) of investing in a Fund and to compare these costs with the ongoing costs of investing in other funds.
The Example is based on an investment of $1,000 invested at the beginning of the period and held for the entire period from May 1, 2004 to October 31, 2004.
ACTUAL EXPENSES
The first line in the table below provides information about actual account values and actual expenses. You may use the information in this line, together with the amount you invested, to estimate the expenses that you paid over the period. Simply divide your account value by $1,000 (for example, an $8,600 account value divided by $1,000 = 8.6), then multiply the result by the number in the first line of your Fund under the heading entitled "Expenses Paid During Period" to estimate the expenses you paid on your account during this period.
HYPOTHETICAL EXAMPLE FOR COMPARISON PURPOSES
The second line in the table below provides information about hypothetical account values and hypothetical expenses based on each Fund's actual expense ratio and an assumed rate of return of 5% per year before expenses, which is not the Fund's actual return. The hypothetical account values and expenses may not be used to estimate the actual ending account balance or expenses you paid for the period. You may use this information to compare the ongoing costs of investing in your Fund and other funds. To do so, compare this 5% hypothetical example with the 5% hypothetical examples that appear in the shareholder reports of the other funds.
Please note that the expenses shown in the table are meant to highlight your ongoing costs only and do not reflect any transactional costs, such as sales charges, redemption fees, brokerage commissions paid on purchases and sales of fund shares. Therefore, the second line under each Fund in the table is useful in comparing ongoing costs only, and will not help you determine the relative total costs of owning different funds. In addition, note that the expenses shown in the table are meant to highlight your ongoing costs and do not reflect any transaction costs.
| | | Beginning
Account
Value | | Ending
Account
Value | | Annualized
Expense
Ratio | | Expenses Paid
During
Period (a) | |
| Class A | |
| Actual | | $ | 1,000.00 | | | $ | 1,020.80 | | | | 1.51 | % | | $ | 7.67 | | |
| Hypothetical (b) | | | 1,000.00 | | | | 1,017.80 | | | | 1.51 | | | | 7.66 | | |
| Class B | |
| Actual | | | 1,000.00 | | | | 1,014.58 | | | | 2.10 | | | | 10.65 | | |
| Hypothetical (b) | | | 1,000.00 | | | | 1,014.58 | | | | 2.10 | | | | 10.63 | | |
| Class C | |
| Actual | | | 1,000.00 | | | | 1,017.80 | | | | 2.07 | | | | 10.50 | | |
| Hypothetical (b) | | | 1,000.00 | | | | 1,014.73 | | | | 2.07 | | | | 10.48 | | |
| Class T | |
| Actual | | | 1,000.00 | | | | 1,021.00 | | | | 1.45 | | | | 7.37 | | |
| Hypothetical (b) | | | 1,000.00 | | | | 1,017.85 | | | | 1.45 | | | | 7.35 | | |
(a) Expenses are calculated using each Fund's annualized expense ratio (as disclosed in the table), multiplied by the average account value for the period, multiplied by number of days in the period (184 days), and divided by the number of days in the year (366 days).
(b) 5% return per year before expenses.
GRAPHIC PRESENTATION OF SCHEDULE OF INVESTMENTS
By Sector
At October 31, 2004
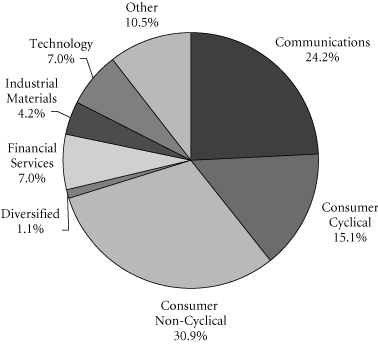
This chart shows the percentage breakdown by sector of the Fund's total investment securities.
Transamerica IDEX Mutual Funds
Annual Report 2004
3
TA IDEX Janus Growth
SCHEDULE OF INVESTMENTS
At October 31, 2004
(all amounts except share amounts in thousands)
| | | Shares | | Value | |
| COMMON STOCKS (88.7%) | | | |
| Air Transportation (2.8%) | | | |
| FedEx Corp. (a) | | | 331,750 | | | $ | 30,229 | | |
| Beer, Wine & Distilled Beverages (1.1%) | | | |
| LVMH Moet Hennessy Louis Vuitton SA | | | 182,673 | | | | 12,478 | | |
| Business Services (6.1%) | | | |
| Clear Channel Communications, Inc. | | | 1,365,840 | | | | 45,619 | | |
| eBay, Inc. (b) | | | 220,085 | | | | 21,482 | | |
| Chemicals & Allied Products (1.6%) | | | |
| Procter & Gamble Co. | | | 332,230 | | | | 17,004 | | |
| Commercial Banks (5.7%) | | | |
| Citigroup, Inc. | | | 437,245 | | | | 19,401 | | |
| MBNA Corp. | | | 1,136,430 | | | | 29,127 | | |
| Providian Financial Corp. (b) | | | 887,380 | | | | 13,799 | | |
| Communication (5.5%) | | | |
| Liberty Media Corp.–Class A | | | 3,847,411 | | | | 34,319 | | |
Liberty Media International,
Inc.–Class A (b) | | | 308,598 | | | | 11,125 | | |
XM Satellite Radio Holdings,
Inc.–Class A (a)(b) | | | 457,380 | | | | 14,782 | | |
| Communications Equipment (3.0%) | | | |
| Motorola, Inc. | | | 955,860 | | | | 16,498 | | |
| Research In Motion, Ltd. (a)(b) | | | 181,835 | | | | 16,038 | | |
| Computer & Data Processing Services (9.0%) | | | |
Check Point Software
Technologies, Ltd. (a)(b) | | | 212,230 | | | | 4,801 | | |
| Checkfree Corp. (a)(b) | | | 409,200 | | | | 12,685 | | |
| Electronic Arts, Inc. (a)(b) | | | 59,810 | | | | 2,687 | | |
| Yahoo!, Inc. (a)(b) | | | 2,149,240 | | | | 77,781 | | |
| Computer & Office Equipment (2.8%) | | | |
| Cisco Systems, Inc. (b) | | | 870,197 | | | | 16,716 | | |
| Lexmark International, Inc. (a)(b) | | | 160,530 | | | | 13,342 | | |
| Electronic Components & Accessories (4.0%) | | | |
| Advanced Micro Devices, Inc. (a)(b) | | | 1,949,010 | | | | 32,782 | | |
| Maxim Integrated Products, Inc. | | | 255,510 | | | | 11,240 | | |
| Furniture & Fixtures (2.2%) | | | |
| Kinetic Concepts, Inc. (b) | | | 493,170 | | | | 24,575 | | |
| Hotels & Other Lodging Places (5.2%) | | | |
| Four Seasons Hotels, Inc. (a) | | | 105,455 | | | | 7,131 | | |
| Marriott International, Inc.–Class A | | | 426,930 | | | | 23,263 | | |
| MGM Mirage, Inc. (a)(b) | | | 31,170 | | | | 1,677 | | |
| Starwood Hotels & Resorts Worldwide, Inc. | | | 529,140 | | | | 25,256 | | |
| | | Shares | | Value | |
| Instruments & Related Products (1.4%) | |
| Alcon, Inc. (a) | | | 210,710 | | | $ | 15,003 | | |
| Insurance (5.0%) | |
| Aetna, Inc. | | | 59,385 | | | | 5,642 | | |
| UnitedHealth Group, Inc. | | | 683,775 | | | | 49,505 | | |
| Medical Instruments & Supplies (9.9%) | |
| Biomet, Inc. (a) | | | 358,670 | | | | 16,743 | | |
| Boston Scientific Corp. (b) | | | 705,005 | | | | 24,887 | | |
| Medtronic, Inc. (a) | | | 1,300,245 | | | | 66,456 | | |
| Paper & Allied Products (1.4%) | |
| 3M Co. | | | 194,355 | | | | 15,076 | | |
| Personal Credit Institutions (1.2%) | |
| SLM Corp. | | | 294,480 | | | | 13,328 | | |
| Pharmaceuticals (10.5%) | |
| Amgen, Inc. (b) | | | 144,110 | | | | 8,185 | | |
| Celgene Corp. (a)(b) | | | 613,580 | | | | 18,174 | | |
| Elan Corp. PLC, Sponsored ADR (a)(b) | | | 410,290 | | | | 10,585 | | |
| Genentech, Inc. (b) | | | 997,505 | | | | 45,416 | | |
| Roche Holding AG | | | 323,715 | | | | 32,978 | | |
| Restaurants (2.2%) | |
| McDonald's Corp. | | | 836,080 | | | | 24,372 | | |
| Retail Trade (3.4%) | |
| Amazon.Com, Inc. (a)(b) | | | 202,260 | | | | 6,903 | | |
| Staples, Inc. | | | 1,031,315 | | | | 30,671 | | |
| Water Transportation (4.7%) | |
| Carnival Corp. | | | 350,540 | | | | 17,723 | | |
| Royal Caribbean Cruises, Ltd. (a) | | | 730,160 | | | | 34,025 | | |
| Total Common Stocks (cost: $779,422) | | | | | | | 971,509 | | |
| | | Principal | | Value | |
| SECURITY LENDING COLLATERAL (10.4%) | |
| Debt (9.7%) | |
| Bank Notes (1.9%) | |
Bank of America
1.77%, due 12/03/2004 | | | $5,538 | | | | $5,538 | | |
| 1.88%, due 12/23/2004 | | | 1,846 | | | | 1,846 | | |
| 1.77%, due 01/18/2005 | | | 3,692 | | | | 3,692 | | |
Canadian Imperial Bank of Commerce
1.86%, due 11/04/2004 | | | 8,307 | | | | 8,307 | | |
Credit Suisse First Boston Corp.
1.83%, due 09/09/2005 | | | 923 | | | | 923 | | |
| Commercial Paper (1.0%) | |
Clipper Receivables Corp.
1.79%, due 11/12/2004 | | | 2,749 | | | | 2,749 | | |
Delaware Funding Corp. 144A
1.85%, due 11/19/2004 | | | 923 | | | | 923 | | |
The notes to the financial statements are an integral part of this report.
Transamerica IDEX Mutual Funds
Annual Report 2004
4
TA IDEX Janus Growth
SCHEDULE OF INVESTMENTS (continued)
At October 31, 2004
(all amounts except share amounts in thousands)
| | | Principal | | Value | |
| Commercial Paper (continued) | |
Falcon Asset Securitization Corp. 144A
1.78%, due 11/04/2004 | | $2,754 | | $2,754 | |
| 1.75%, due 11/10/2004 | | | 3,692 | | | | 3,692 | | |
Galaxy Funding 144A
1.88%, due 11/22/2004 | | 923 | | 923 | |
| Euro Dollar Terms (4.5%) | |
Bank of Montreal
1.88%, due 11/24/2004 | | 8,744 | | 8,744 | |
BNP Paribas
1.77%, due 11/10/2004
1.80%, due 11/23/2004
1.98%, due 12/27/2004 | | 4,615
3,692
3,692 | | 4,615
3,692
3,692 | |
Calyon
1.70%, due 11/24/2004 | | 487 | | 487 | |
Citigroup
2.06%, due 01/25/2005 | | 9,231 | | 9,231 | |
Den Danske Bank
1.82%, due 11/19/2004 | | 4,615 | | 4,615 | |
Dexia Group
2.04%, due 01/21/2005 | | 2,142 | | 2,142 | |
HBOS Halifax Bank of Scotland
2.03%, due 01/21/2005 | | 1,846 | | 1,846 | |
Royal Bank of Scotland
2.01%, due 01/20/2005 | | 3,692 | | 3,692 | |
Toronto Dominion Bank
1.70%, due 11/08/2004 | | 1,846 | | 1,846 | |
Wells Fargo
1.87%, due 11/22/2004 | | 4,615 | | 4,615 | |
| | | Principal | | Value | |
| Promissory Notes (0.9%) | |
Goldman Sachs Group Inc.
1.90%, due 12/29/2004 | | | $3,877 | | | | $3,877 | | |
| 1.88%, due 01/27/2005 | | | 6,461 | | | | 6,461 | | |
| Repurchase Agreements (1.4%) | |
Merrill Lynch & Co., Inc.
1.92% Repurchase Agreement dated
10/29/2004 to be repurchased at
$14,771 on 11/01/2004 (c) | | | 14,769 | | | | 14,769 | | |
| | | Shares | | Value | |
| Investment Companies (0.7%) | |
| Money Market Funds (0.7%) | |
Merrill Lynch Premier Institutional Fund
1-day yield of 1.71% | | | 4,540,851 | | | | $4,541 | | |
Merrimac Cash Fund, Premium Class
1-day yield of 1.46% | | | 3,322,947 | | | | 3,323 | | |
Total Security Lending Collateral
(cost: $113,535) | | | | | | | 113,535 | | |
| Total Investment Securities (cost: $892,957) | | | | | | $ | 1,085,044 | | |
| SUMMARY: | |
| Investments, at value | | | 99.2 | % | | $ | 1,085,044 | | |
| Other assets in excess of liabilities | | | 0.8 | % | | | 9,252 | | |
| Net assets | | | 100.0 | % | | $ | 1,094,296 | | |
NOTES TO SCHEDULE OF INVESTMENTS:
(a) At October 31, 2004, all or a portion of this security is on loan (see Note 1). The value at October 31, 2004, of all securities on loan is $108,498.
(b) No dividends were paid during the preceding twelve months.
(c) Cash collateral for the Repurchase Agreements, valued at $15,064, that serve as collateral for securities lending are invested in corporate bonds with interest rates and maturity dates ranging from 0.00%–9.75% and 05/15/2005–9/15/2033, respectively.
DEFINITIONS:
144A 144A Securities are registered pursuant to the rule 144A of the Securities Act of 1933. These securities are deemed to be liquid for purposes of compliance limitations on holdings of illiquid securities and may be resold as transactions exempt from registration normally, to qualified institutional buyers. At October 31, 2004 these securities aggregated $7,369 or 0.7% of the net assets of the Fund.
ADR American Depositary Receipt
The notes to the financial statements are an integral part of this report.
Transamerica IDEX Mutual Funds
Annual Report 2004
5
TA IDEX Janus Growth
STATEMENT OF ASSETS AND LIABILITIES
At October 31, 2004
(all amounts except per share amounts in thousands)
| Assets: | | | |
Investment securities, at value (cost: $892,957)
(including securities loaned of $108,498) | | $ | 1,085,044 | | |
| Cash | | | 129,240 | | |
| Receivables: | |
| Investment securities sold | | | 1,180 | | |
| Shares of beneficial interest sold | | | 426 | | |
| Interest | | | 122 | | |
| Dividends | | | 367 | | |
| Dividend reclaims receivable | | | 62 | | |
| Other | | | 320 | | |
| | | | 1,216,761 | | |
| Liabilities: | | | |
| Investment securities purchased | | | 4,624 | | |
| Accounts payable and accrued liabilities: | |
| Shares of beneficial interest redeemed | | | 1,489 | | |
| Management and advisory fees | | | 896 | | |
| Distribution fees | | | 400 | | |
| Transfer agent fees | | | 1,047 | | |
| Payable for collateral for securities on loan | | | 113,535 | | |
| Other | | | 474 | | |
| | | | 122,465 | | |
| Net Assets | | $ | 1,094,296 | | |
| Net Assets Consist of: | | | |
Shares of beneficial interest, unlimited shares
authorized, no par value | | $ | 1,779,491 | | |
| Accumulated net investment income (loss) | | | (344 | ) | |
Accumulated net realized gain (loss) from investment
securities and foreign currency transactions | | | (876,868 | ) | |
| Net unrealized appreciation (depreciation) on: | |
| Investment securities | | | 192,012 | | |
Translation of assets and liabilites denominated
in foreign currencies | | | 5 | | |
| Net Assets | | $ | 1,094,296 | | |
| Net Assets by Class: | | | |
| Class A | | $ | 573,640 | | |
| Class B | | | 203,408 | | |
| Class C | | | 71,196 | | |
| Class T | | | 246,052 | | |
| Shares Outstanding: | | | |
| Class A | | | 26,606 | | |
| Class B | | | 10,150 | | |
| Class C | | | 3,555 | | |
| Class T | | | 10,991 | | |
| Net Asset Value Per Share: | | | |
| Class A | | $ | 21.56 | | |
| Class B | | | 20.04 | | |
| Class C | | | 20.03 | | |
| Class T | | | 22.39 | | |
| Maximum Offering Price Per Share (a): | | | |
| Class A | | $ | 22.81 | | |
| Class T | | | 24.47 | | |
(a) Includes the maximum selling commission (represented as a percentage of offering price) which is reduced on certain levels of sales as set forth in the Prospectus. Net asset value per share for Classes B and C shares represents offering price. The redemption price for Classes B and C shares equals net asset value less any applicable contingent deferred sales charge.
STATEMENT OF OPERATIONS
For the year ended October 31, 2004
(all amounts in thousands)
| Investment Income: | |
| Interest | | $ | 419 | | |
| Dividends | | | 6,954 | | |
| Less withholding taxes on foreign dividends | | | (176 | ) | |
| Income from loaned securities–net | | | 145 | | |
| | | | 7,342 | | |
| Expenses: | |
| Management and advisory fees | | | 10,966 | | |
| Transfer agent fees: | |
| Class A | | | 1,669 | | |
| Class B | | | 595 | | |
| Class C | | | 20 | | |
| Class T | | | 1,542 | | |
| Class C2 | | | 66 | | |
| Class M | | | 162 | | |
| Printing and shareholder reports | | | 413 | | |
| Custody fees | | | 145 | | |
| Administration fees | | | 160 | | |
| Legal fees | | | 45 | | |
| Audit and accounting fees | | | 17 | | |
| Trustees fees | | | 78 | | |
| Registration fees: | |
| Class A | | | 28 | | |
| Class B | | | 5 | | |
| Class C | | | 12 | | |
| Class T | | | 24 | | |
| Class C2 | | | 1 | | |
| Class M | | | 3 | | |
| Other | | | 54 | | |
| Distribution and service fees: | |
| Class A | | | 2,013 | | |
| Class B | | | 2,225 | | |
| Class C | | | 151 | | |
| Class C2 | | | 184 | | |
| Class M | | | 430 | | |
| Total expenses | | | 21,008 | | |
| Net Investment Income (Loss) | | | (13,666 | ) | |
| Net Realized Gain (Loss) from: | |
| Investment securities | | | 106,529 | | |
| Foreign currency transactions | | | 15 | | |
| | | | 106,544 | | |
Net Increase (Decrease) in Unrealized Appreciation
(Depreciation) on: | |
| Investment securities | | | 16,807 | | |
Translation of assets and liabilities
denominated in foreign currencies | | | 5 | | |
| | | | 16,812 | | |
Net Gain (Loss) on Investments and Foreign
Currency Transactions | | | 123,356 | | |
Net Increase (Decrease) in Net Assets Resulting
from Operations | | $ | 109,690 | | |
The notes to the financial statements are an integral part of this report.
Transamerica IDEX Mutual Funds
Annual Report 2004
6
TA IDEX Janus Growth
STATEMENTS OF CHANGES IN NET ASSETS
For the years ended
(all amounts in thousands)
| | | October 31,
2004 | | October 31,
2003 | |
| Increase (Decrease) in Net Assets From: | | | |
| Operations: | | | |
| Net investment income (loss) | | $ | (13,666 | ) | | $ | (15,691 | ) | |
Net realized gain (loss) from
investment securities and
foreign currency transactions | | | 106,544 | | | | (89,352 | ) | |
Net unrealized appreciation
(depreciation) on investment
securities and foreign
currency transactions | | | 16,812 | | | | 372,706 | | |
| | | | 109,690 | | | | 267,663 | | |
| Capital Share Transactions: | | | |
| Proceeds from shares sold: | |
| Class A | | | 67,910 | | | | 97,031 | | |
| Class B | | | 10,284 | | | | 16,501 | | |
| Class C | | | 1,430 | | | | 925 | | |
| Class C2 | | | 1,299 | | | | 3,457 | | |
| Class M | | | 1,439 | | | | 2,730 | | |
| Class T | | | 16,270 | | | | 26,507 | | |
| | | | 98,632 | | | | 147,151 | | |
| Cost of shares redeemed: | |
| Class A | | | (131,454 | ) | | | (136,363 | ) | |
| Class B | | | (57,915 | ) | | | (54,092 | ) | |
| Class C | | | (5,449 | ) | | | (248 | ) | |
| Class C2 | | | (7,522 | ) | | | (11,227 | ) | |
| Class M | | | (17,120 | ) | | | (17,848 | ) | |
| Class T | | | (218,736 | ) | | | (62,594 | ) | |
| | | | (438,196 | ) | | | (282,372 | ) | |
| Class level exchanges: | |
| Class C | | | 73,690 | | | | – | | |
| Class C2 | | | (27,543 | ) | | | – | | |
| Class M | | | (46,147 | ) | | | – | | |
| | | | – | | | | – | | |
| Automatic conversions: | |
| Class A | | | 1,347 | | | | – | | |
| Class B | | | (1,347 | ) | | | – | | |
| | | | – | | | | – | | |
| | | | (339,564 | ) | | | (135,221 | ) | |
| Net increase (decrease) in net assets | | | (229,874 | ) | | | 132,442 | | |
| Net Assets: | | | |
| Beginning of year | | | 1,324,170 | | | | 1,191,728 | | |
| End of year | | $ | 1,094,296 | | | $ | 1,324,170 | | |
Accumulated Net Investment
Income (Loss) | | $ | (344 | ) | | $ | (342 | ) | |
| | | October 31,
2004 | | October 31,
2003 | |
| Share Activity: | |
| Shares issued: | |
| Class A | | | 3,230 | | | | 5,565 | | |
| Class B | | | 524 | | | | 999 | | |
| Class C | | | 73 | | | | 54 | | |
| Class C2 | | | 66 | | | | 215 | | |
| Class M | | | 73 | | | | 164 | | |
| Class T | | | 750 | | | | 1,445 | | |
| | | | 4,716 | | | | 8,442 | | |
| Shares redeemed: | |
| Class A | | | (6,266 | ) | | | (7,843 | ) | |
| Class B | | | (2,972 | ) | | | (3,354 | ) | |
| Class C | | | (278 | ) | | | (14 | ) | |
| Class C2 | | | (385 | ) | | | (687 | ) | |
| Class M | | | (867 | ) | | | (1,099 | ) | |
| Class T | | | (10,137 | ) | | | (3,528 | ) | |
| | | | (20,905 | ) | | | (16,525 | ) | |
| Class level exchanges: | |
| Class C | | | 3,720 | | | | – | | |
| Class C2 | | | (1,363 | ) | | | – | | |
| Class M | | | (2,331 | ) | | | – | | |
| | | | 26 | | | | – | | |
| Automatic conversions: | |
| Class A | | | 63 | | | | – | | |
| Class B | | | (68 | ) | | | – | | |
| | | | (5 | ) | | | – | | |
Net increase (decrease) in shares
outstanding: | |
| Class A | | | (2,973 | ) | | | (2,278 | ) | |
| Class B | | | (2,516 | ) | | | (2,355 | ) | |
| Class C | | | 3,515 | | | | 40 | | |
| Class C2 | | | (1,682 | ) | | | (472 | ) | |
| Class M | | | (3,125 | ) | | | (935 | ) | |
| Class T | | | (9,387 | ) | | | (2,083 | ) | |
| | | | (16,168 | ) | | | (8,083 | ) | |
The notes to the financial statements are an integral part of this report.
Transamerica IDEX Mutual Funds
Annual Report 2004
7
TA IDEX Janus Growth
FINANCIAL HIGHLIGHTS
| | | | | For a share of beneficial interest outstanding throughout each period | |
| | | | | Net Asset | | Investment Operations | | Distributions | | Net Asset | |
| | | For the
Period
Ended (d)(g) | | Value,
Beginning
of Period | | Net
Investment
Income (Loss) | | Net Realized
and Unrealized
Gain (Loss) | | Total
Operations | | From Net
Investment
Income | | From Net
Realized
Gains | | Total
Distributions | | Value,
End
of Period | |
| Class A | | 10/31/2004 | | $ | 19.73 | | | $ | (0.21 | ) | | $ | 2.04 | | | $ | 1.83 | | | $ | – | | | $ | – | | | $ | – | | | $ | 21.56 | | |
| | | 10/31/2003 | | | 15.87 | | | | (0.21 | ) | | | 4.07 | | | | 3.86 | | | | – | | | | – | | | | – | | | | 19.73 | | |
| | | 10/31/2002 | | | 19.64 | | | | (0.22 | ) | | | (3.55 | ) | | | (3.77 | ) | | | – | | | | – | | | | – | | | | 15.87 | | |
| | | 10/31/2001 | | | 43.81 | | | | (0.24 | ) | | | (20.80 | ) | | | (21.04 | ) | | | – | | | | (3.13 | ) | | | (3.13 | ) | | | 19.64 | | |
| | | 10/31/2000 | | | 46.72 | | | | 0.03 | | | | 5.35 | | | | 5.38 | | | | – | | | | (8.29 | ) | | | (8.29 | ) | | | 43.81 | | |
| Class B | | 10/31/2004 | | | 18.45 | | | | (0.32 | ) | | | 1.91 | | | | 1.59 | | | | – | | | | – | | | | – | | | | 20.04 | | |
| | | 10/31/2003 | | | 14.93 | | | | (0.31 | ) | | | 3.83 | | | | 3.52 | | | | – | | | | – | | | | – | | | | 18.45 | | |
| | | 10/31/2002 | | | 18.63 | | | | (0.34 | ) | | | (3.36 | ) | | | (3.70 | ) | | | – | | | | – | | | | – | | | | 14.93 | | |
| | | 10/31/2001 | | | 42.08 | | | | (0.41 | ) | | | (19.91 | ) | | | (20.32 | ) | | | – | | | | (3.13 | ) | | | (3.13 | ) | | | 18.63 | | |
| | | 10/31/2000 | | | 45.38 | | | | (0.36 | ) | | | 5.35 | | | | 4.99 | | | | – | | | | (8.29 | ) | | | (8.29 | ) | | | 42.08 | | |
| Class C | | 10/31/2004 | | | 18.45 | | | | (0.30 | ) | | | 1.88 | | | | 1.58 | | | | – | | | | – | | | | – | | | | 20.03 | | |
| | | 10/31/2003 | | | 14.74 | | | | (0.32 | ) | | | 4.03 | | | | 3.71 | | | | – | | | | – | | | | – | | | | 18.45 | | |
| Class T | | 10/31/2004 | | | 20.45 | | | | (0.16 | ) | | | 2.10 | | | | 1.94 | | | | – | | | | – | | | | – | | | | 22.39 | | |
| | | 10/31/2003 | | | 16.40 | | | | (0.16 | ) | | | 4.21 | | | | 4.05 | | | | – | | | | – | | | | – | | | | 20.45 | | |
| | | 10/31/2002 | | | 20.20 | | | | (0.16 | ) | | | (3.64 | ) | | | (3.80 | ) | | | – | | | | – | | | | – | | | | 16.40 | | |
| | | 10/31/2001 | | | 44.76 | | | | (0.14 | ) | | | (21.29 | ) | | | (21.43 | ) | | | – | | | | (3.13 | ) | | | (3.13 | ) | | | 20.20 | | |
| | | 10/31/2000 | | | 47.45 | | | | 0.25 | | | | 5.35 | | | | 5.60 | | | | – | | | | (8.29 | ) | | | (8.29 | ) | | | 44.76 | | |
| | | | | | | Ratios/Supplemental Data | |
| | | For the
Period | | Total | | Net Assets,
End of
Period | | Ratio of Expenses
to Average
Net Assets (a) | | Net Investment
Income (Loss)
to Average | | Portfolio
Turnover | |
| | | Ended (g) | | Return (c) | | (000's) | | Net (e) | | Total (f) | | Net Assets (a) | | Rate (b) | |
| Class A | | 10/31/2004 | | | 9.28 | % | | $ | 573,640 | | | | 1.60 | % | | | 1.60 | % | | | (1.01 | )% | | | 41 | % | |
| | | 10/31/2003 | | | 24.32 | | | | 583,674 | | | | 1.70 | | | | 1.72 | | | | (1.22 | ) | | | 62 | | |
| | | 10/31/2002 | | | (19.21 | ) | | | 505,704 | | | | 1.66 | | | | 1.69 | | | | (1.10 | ) | | | 62 | | |
| | | 10/31/2001 | | | (51.31 | ) | | | 770,590 | | | | 1.49 | | | | 1.49 | | | | (0.83 | ) | | | 64 | | |
| | | 10/31/2000 | | | 10.82 | | | | 1,727,573 | | | | 1.39 | | | | 1.42 | | | | (0.61 | ) | | | 41 | | |
| Class B | | 10/31/2004 | | | 8.62 | | | | 203,408 | | | | 2.22 | | | | 2.22 | | | | (1.59 | ) | | | 41 | | |
| | | 10/31/2003 | | | 23.58 | | | | 233,731 | | | | 2.35 | | | | 2.37 | | | | (1.87 | ) | | | 62 | | |
| | | 10/31/2002 | | | (19.86 | ) | | | 224,348 | | | | 2.31 | | | | 2.35 | | | | (1.75 | ) | | | 62 | | |
| | | 10/31/2001 | | | (51.74 | ) | | | 354,949 | | | | 2.14 | | | | 2.14 | | | | (1.48 | ) | | | 64 | | |
| | | 10/31/2000 | | | 10.11 | | | | 775,252 | | | | 2.04 | | | | 2.07 | | | | (1.26 | ) | | | 41 | | |
| Class C | | 10/31/2004 | | | 8.62 | | | | 71,196 | | | | 2.08 | | | | 2.08 | | | | (1.44 | ) | | | 41 | | |
| | | 10/31/2003 | | | 25.17 | | | | 735 | | | | 2.35 | | | | 2.37 | | | | (1.88 | ) | | | 62 | | |
| Class T | | 10/31/2004 | | | 9.49 | | | | 246,052 | | | | 1.38 | | | | 1.38 | | | | (0.75 | ) | | | 41 | | |
| | | 10/31/2003 | | | 24.70 | | | | 416,719 | | | | 1.35 | | | | 1.37 | | | | (0.87 | ) | | | 62 | | |
| | | 10/31/2002 | | | (18.82 | ) | | | 368,301 | | | | 1.31 | | | | 1.34 | | | | (0.75 | ) | | | 62 | | |
| | | 10/31/2001 | | | (51.07 | ) | | | 546,317 | | | | 1.14 | | | | 1.14 | | | | (0.48 | ) | | | 64 | | |
| | | 10/31/2000 | | | 11.20 | | | | 1,232,295 | | | | 1.04 | | | | 1.07 | | | | (0.26 | ) | | | 41 | | |
The notes to the financial statements are an integral part of this report.
Transamerica IDEX Mutual Funds
Annual Report 2004
8
TA IDEX Janus Growth
FINANCIAL HIGHLIGHTS (continued)
NOTES TO FINANCIAL HIGHLIGHTS
(a) Annualized.
(b) Not annualized for periods of less than one year.
(c) Total Return has been calculated for the applicable period without deduction of a sales load, if any, on an initial purchase. Periods of less than one year are not annualized.
(d) Per share information is calculated based on average number of shares outstanding for the years ended 10/31/2001, 10/31/2002, 10/31/2003 and 10/31/2004.
(e) Ratio of Net Expenses to Average Net Assets is net of fee waivers and reimbursements by the investment adviser, if any (see note 2).
(f) Ratio of Total Expenses to Average Net Assets includes all expenses before fee waivers and reimbursements by the investment adviser.
(g) The inception date for the Fund's offering of share Class L was November 11, 2002. Class L was renamed Class C on March 1, 2004. (see note 1)
The notes to the financial statements are an integral part of this report.
Transamerica IDEX Mutual Funds
Annual Report 2004
9
TA IDEX Janus Growth
NOTES TO FINANCIAL STATEMENTS
At October 31, 2004
(all amounts in thousands)
NOTE 1. ORGANIZATION AND SIGNIFICANT ACCOUNTING POLICIES
Transamerica IDEX Mutual Funds, formerly IDEX Mutual Funds, is a Massachusetts business trust registered under the Investment Company Act of 1940, as amended (the "1940 Act"), as an open-end management investment company. TA IDEX Janus Growth ("the Fund"), part of Transamerica IDEX Mutual Funds, began operations on May 8, 1986.
On March 1, 2004, the Fund changed its name from IDEX Janus Growth to TA IDEX Janus Growth.
In the normal course of business, the Fund enters into contracts that contain a variety of representations and warranties, which provide general indemnifications. The Fund's maximum exposure under these arrangements is unknown, as this would involve future claims that may be made against the Fund and/or its affiliates that have not yet occurred. However, based on experience, the Fund expects the risk of loss to be remote.
See the Prospectus and Statement of Additional Information for a description of the Fund's investment objective.
In preparing the Fund's financial statements in accordance with accounting principles generally accepted in the United States of America ("GAAP"), estimates or assumptions (which could differ from actual results) may be used that affect reported amounts and disclosures. The following policies were consistently followed by the Fund, in accordance with GAAP.
Multiple class operations and expenses: The Fund currently offers four classes of shares, each with a public offering price that reflects different sales charges, if any, and expense levels. Class T shares are not available to new investors. All shares designated as Class C shares prior to March 1, 2004, were renamed as Class C2 shares on that date. All shares designated as Class L shares prior to March 1, 2004, were renamed as Class C shares with different sales charges than the previous Class L shares. On June 15, 2004, Class C2 shares merged into Class C. On September 24, 2004, Class M shares merged into Class C. Class B shares will convert to Class A shares eight years after purchase. Income, non-class specific exp enses and realized and unrealized gains and losses, are allocated daily to each class, based upon the value of shares outstanding method as permitted under Rule 18f-3 of the 1940 Act. Each class bears its own specific expenses as well as a portion of general, common expenses.
Pricing of shares: The Fund prices its shares on the basis of the net asset value of each class of shares of the Fund, which is determined as of the close of the New York Stock Exchange ("NYSE") (generally 4:00 p.m. Eastern Time) on each day on which the NYSE is open for
trading (other than a day on which there are insufficient changes in the value of the Fund's portfolio securities to materially affect the Fund's net asset value or a day on which no shares are tendered for redemption and no order to purchase any shares is received).
Security valuations: Fund investments traded on an exchange are valued at the closing price on the day of valuation on the exchange where the security is principally traded. With respect to securities traded on NASDAQ NMS, such closing price may be the last reported sales price or the NASDAQ Official Closing Price.
Securities traded in the over-the-counter market and listed securities for which no sale was reported on that date are valued at the last quoted bid price.
Debt securities are valued by independent pricing services; however, those that mature in sixty days or less are valued at amortized cost, which approximates market.
Investment company securities are valued at net asset value of the underlying portfolio.
Foreign securities generally are valued based on quotations from the primary market in which they are traded and are translated from the local currency into U.S. dollars using closing exchange rates. Many foreign securities markets are open for trading at times when the U.S. markets are closed for trading, and many foreign securities markets close for trading before the close of the NYSE. The value of foreign securities may be affected significantly on a day that the NYSE is closed and an investor is unable to purchase or redeem shares. If a significant market event impacting the value of a portfolio security (e.g., natural disaster, company announcement, market volatility) occurs subsequent to the close of trading in the security, but prior to the calculation of the Fund's net asset value per share, market quotations for that security may be determined to be unreliable and, accordingly, not "readily av ailable." If market quotations are not readily available, and the impact of such a significant market event materially effects the net asset value per share of the Fund, an affected portfolio security will be valued at fair market value as determined in good faith using guidelines adopted by the Board of Trustees of the Fund, under the supervision of the Fund's Valuation Committee. Factors that may be considered to value foreign securities at fair market value may include, among others: the value of other securities traded on other markets, foreign currency exchange activity and the trading of financial products tied to foreign securities.
Other securities for which quotations are not readily available are valued at fair market value as determined in good faith using guidelines adopted by the Board of Trustees of the Fund, under the supervision of the Fund's Valuation Committee.
Cash: The Fund may leave cash overnight in its cash account with the custodian, Investors Bank & Trust Company ("IBT"). IBT has been contracted on behalf of the Fund to invest the excess cash into a savings account, which at October 31, 2004, was paying an interest rate of 1.30%.
Transamerica IDEX Mutual Funds
Annual Report 2004
10
TA IDEX Janus Growth
NOTES TO FINANCIAL STATEMENTS (continued)
At October 31, 2004
(all amounts in thousands)
NOTE 1.–(continued)
Throughout the year, the Fund may have a cash overdraft balance. A fee is incurred on this overdraft, calculated by multiplying the overdraft by a rate based on the federal funds rate. This fee is included in Custody fees in the Statement of Operations.
Repurchase agreements: The Fund is authorized to enter into repurchase agreements. The Fund, through IBT, receives delivery of the underlying securities, the value of which at the time of purchase is required to be an amount equal to at least 100% of the resale price. Repurchase agreements involve the risk that the seller will fail to repurchase the security, as agreed. In that case, the Fund will bear the risk of value fluctuations until the security can be sold and may encounter delays and incur costs in liquidating the security. In the event of bankruptcy or insolvency of the seller, delays and costs may be incurred.
Commission recapture: The sub-adviser, to the extent consistent with the best execution and usual commission rate policies and practices, may place security transactions of the Fund with broker/dealers with which Transamerica IDEX Mutual Funds has established a Commission Recapture Program. A Commission Recapture Program is any arrangement under which a broker/dealer applies a portion of the commissions received by such broker/dealer on the security transactions to the Fund. In no event will commissions paid by the Fund be used to pay expenses that would otherwise be borne by any other funds within Transamerica IDEX Mutual Funds, or by any other party.
Recaptured commissions during the year ended October 31, 2004, of $269 are included in net realized gains in the Statement of Operations.
Securities lending: The Fund may lend securities to enhance fund earnings from investing cash collateral in making such loans to qualified borrowers (typically broker/dealers). The Fund has engaged its custodian bank, IBT, as a lending agent to administer its securities lending program. IBT earned $62 of program income for its services. When the Fund makes a security loan, it received cash collateral as protection against the risk that the borrower will default on the loan, and records an asset for the cash invested collateral and a liability for the return of the collateral.
Securities on loan are included in Investment securities at value in the Statement of Assets and Liabilities and remain on the Schedule of Investments.
Loans of securities are required to be secured by collateral at least equal to 102% of the value of the securities at inception of the loan, and not less then 100% thereafter. The Fund may invest cash collateral in short-term money market instruments including: U.S. Treasury Bills, U.S.
agency obligations, commercial paper, money market mutual funds, repurchase agreements and other highly rated, liquid investments. During the life of securities loans, the collateral and securities loaned remain subject to fluctuation in value. IBT marks to market securities loaned and the collateral each business day. If additional collateral is due (at least $1), IBT collects additional cash collateral from the borrowers. Although securities loaned will be fully collateralized at all times, IBT may experience delays in, or may be prevented from, recovering the collateral on behalf of the Fund. The Fund may recall a loaned security position at any time from the borrower through IBT. In the event the borrower fails to timely return a recalled security, IBT may indemnify the Fund by purchasing replacement securities for the Fund at its own expense and claiming the collateral to fund such a purchase. IBT absorbs the loss if the collateral value is not sufficient to cover the cost of the replacement securities. If replacement securities are not available, IBT will credit the equivalent cash value to the Fund.
While a security is on loan, the Fund does not have the right to vote that security. However, if time permits, the Fund will attempt to recall a security on loan and vote the proxy.
Income from securities lending is included in the Statement of Operations. The amount of collateral and value of securities on loan are included in the Statement of Assets and Liabilities as well as in the Schedule of Investments.
Security transactions and investment income: Security transactions are recorded on the trade date. Security gains and losses are calculated on the specific identification basis. Dividend income is recorded on the ex-dividend date or, in the case of foreign securities, as soon as the Fund is informed of the ex-dividend date. Interest income, including accretion of discounts and amortization of premiums, is recorded on the accrual basis commencing on the settlement date.
Foreign currency denominated investments: The accounting records of the Fund are maintained in U.S. dollars. Securities and other assets and liabilities denominated in foreign currencies are translated into U.S. dollars at the closing exchange rate each day. The cost of foreign securities is translated at the exchange rate in effect when the investment was acquired. The Fund combines fluctuations from currency exchange rates and fluctuations in value when computing net realized and unrealized gains or losses from investments.
Net foreign currency gains and losses resulting from changes in exchange rates include: 1) foreign currency fluctuations between trade date and settlement date of investment security transactions; 2) gains and losses on forward foreign currency contracts; and 3) the difference between the receivable amounts of interest and dividends recorded in the accounting records in U.S. dollars and the amounts actually received.
Foreign currency denominated assets may involve risks not typically associated with domestic transactions, including unanticipated movements in exchange currency rates, the degree of government supervision
Transamerica IDEX Mutual Funds
Annual Report 2004
11
TA IDEX Janus Growth
NOTES TO FINANCIAL STATEMENTS (continued)
At October 31, 2004
(all amounts in thousands)
NOTE 1.–(continued)
and regulation of security markets, and the possibility of political or economic instability.
Foreign capital gains taxes: The Fund may be subject to taxes imposed by countries in which it invests, with respect to its investment in issuers existing or operating in such countries. Such taxes are generally based on income earned or repatriated and capital gains realized on the sale of such investments. The Fund accrues such taxes when the related income or capital gains are earned. Some countries require governmental approval for the repatriation of investment income, capital or the proceeds of sales earned by foreign investors. In addition, if there is deterioration in a country's balance of payments or for other reasons, a country may impose temporary restrictions on foreign capital remittances abroad.
Forward foreign currency contracts: The Fund may enter into forward foreign currency contracts to hedge against exchange rate risk arising from investments in securities denominated in foreign currencies. Contracts are valued at the contractual forward rate and are marked to market daily, with the change in value recorded as an unrealized gain or loss. When the contracts are closed a realized gain or loss is incurred. Risks may arise from changes in market value of the underlying currencies and from the possible inability of counterparties to meet the terms of their contracts.
Account maintenance fees: If the shareholder account balance falls below $1 by either shareholder action or as a result of market action, a $25 (not in thousands) fee is assessed every year until the balance reaches $1. The fee is assessed by redeeming shares in the shareholder's account.
No fee will be charged under the following conditions:
• accounts opened within the preceding 24 months
• accounts with an active monthly Automatic Investment Plan ($50 (not in thousands) minimum per fund)
• accounts owned by an individual which, when combined by social security number, have a balance of $5 or more
• accounts owned by individuals in the same household (by address) that have a combined balance of $5 or more
• UTMA/UGMA accounts
• Fiduciary accounts
• B-share accounts whose shares have started to convert to A-shares accounts (as long as combined value of both accounts is at least $1)
For the year ended October 31, 2004, this fee totaled $41. These fees are included in Paid in Capital in the Statement of Assets and Liabilities.
Redemption fees: A short-term trading redemption fee may be assessed on any fund shares in a fund account that are sold during the first five (5) New York Stock Exchange trading days following their purchase date. This redemption fee will equal 2% of the amount redeemed and shares held the longest will be treated as being redeemed first and shares held the shortest as being redeemed last. For the year ended October 31, 2004, the Fund received no redemption fees.
Dividend distributions: Distributions to shareholders are recorded on the ex-dividend date and are determined in accordance with Federal income tax regulations which may differ from GAAP.
NOTE 2. RELATED PARTY TRANSACTIONS
AEGON/Transamerica Fund Advisers, Inc. ("ATFA") is the Fund's investment adviser. AEGON/Transamerica Fund Services, Inc. ("ATFS") is the Fund's administrator. AFSG Securities Corp. ("AFSG") is the Fund's distributor/principal underwriter. AEGON/Transamerica Investor Services, Inc. ("ATIS") is the Fund's transfer agent. ATIS and AFSG are 100% owned by AUSA Holding Company ("AUSA"). ATFA is a directly owned subsidiary of Western Reserve Life Assurance Co. of Ohio (78%) ("WRL") and AUSA (22%). ATFS is a wholly owned subsidiary of WRL. AUSA and WRL are wholly owned indirect subsidiaries of AEGON NV, a Netherlands corporation.
The following schedule reflects the percentage of fund assets owned by affiliated mutual funds (i.e., through the assets allocation funds):
| | | Net
Assets | | % of
Net Assets | |
TA IDEX Asset Allocation–
Conservative Portfolio | | $ | 4,824 | | | | 0 | % | |
TA IDEX Asset Allocation–
Growth Portfolio | | | 38,436 | | | | 4 | % | |
TA IDEX Asset Allocation–
Moderate Growth Portfolio | | | 38,384 | | | | 4 | % | |
TA IDEX Asset Allocation–
Moderate Portfolio | | | 14,560 | | | | 1 | % | |
| Total | | $ | 96,204 | | | | 9 | % | |
Investment advisory fee: The Fund pays management fees to ATFA based on average daily net assets ("ANA") at the following breakpoints:
1.00% of the first $250 million of ANA
0.90 of the next $500 million of ANA
0.80% of the next $750 million of ANA
0.70% of ANA over $1.5 billion
Transamerica IDEX Mutual Funds
Annual Report 2004
12
TA IDEX Janus Growth
NOTES TO FINANCIAL STATEMENTS (continued)
At October 31, 2004
(all amounts in thousands)
NOTE 2.–(continued)
ATFA has contractually agreed to waive its advisory fee and will reimburse the Fund to the extent that operating expenses, excluding 12b-1 fees, exceed the following stated annual limit:
1.50% Expense Limit
The sub-adviser, Janus Capital Management, LLC, has agreed to a pricing discount based on the aggregate assets that they manage in the AEGON/Transamerica Series Fund, Inc. and Transamerica IDEX Mutual Funds. The amount of the discount received by the Fund for the year ended October 31, 2004 was $27 and is reflected as a reduction of management and advisory fees in the Statement of Operations.
Distribution and service fees: The Fund has a 12b-1 distribution plan under the 1940 Act pursuant to which an annual fee, based on average daily net assets, is paid to the distributor for various disbursements such as broker-dealer account servicing fees and other promotional expenses of the Fund, excluding Class T. The 12b-1 fee for the Fund is comprised of a 0.25% service fee and the remaining amount is an asset-based sales charge/distribution fee. The Fund is authorized under the 12b-1 plan to pay fees on each class up to the following limits:
| Class A | | | 0.35 | % | |
| Class B | | | 1.00 | % | |
| Class C | | | 1.00 | % | |
| Class C2 | | | 1.00 | % | |
| Class M | | | 0.90 | % | |
| Class T | | | N/A | | |
Class C2 and Class M merged into Class C on June 15, 2004 and September 24, 2004, respectively.
In the case the Fund or a class of shares of the Fund is closed to new investors or investments, the Fund is authorized to pay 12b-1 fees for past sales and distribution efforts and present and past investor services.
Underwriter commissions relate to front-end sales charges imposed for Class A, T and M shares and contingent deferred sales charges from Classes B, C, T, M and certain A share redemptions. For the year ended October 31, 2004, the underwriter commissions were as follows:
| Received by Underwriter | | $ | 1,519 | | |
| Retained by Underwriter | | | 114 | | |
| Contingent Deferred Sales Charge | | | 498 | | |
Administrative services: The Fund has entered into an agreement with ATFS for financial and legal fund administration services, which includes such items as compliance, expenses, financial statements and other reporting, distributions, tax returns, prospectus preparation, board of trustees meeting support and other legal matters. The Fund pays ATFS
an annual fee of 0.015% of average net assets. The Legal fees on the Statement of Operations are for fees paid to external legal counsel.
The Fund paid ATFS $160 for the year ended October 31, 2004.
Transfer agent fees: The Fund pays ATIS an annual per-account charge of $20 (not in thousands) for each open account and $1.63 (not in thousands) for each closed account. There is no new account charge. The transfer agent fees on the Statement of Operations are made up of fees paid to ATIS and costs associated with shareholder statements. The Fund paid ATIS $4,054 for the year ended October 31, 2004.
Deferred compensation plan: Each eligible Fund Trustee may elect participation in the Deferred Compensation Plan ("the Plan"). Under the Plan, such Trustees may defer payment of a percentage of their total fees earned as a Fund Trustee. These deferred amounts may be invested in any Transamerica IDEX Mutual Fund. At October 31, 2004, the value of invested plan amount was $320. Invested plan amounts and the total liability for deferred compensation to the Trustees under the Plan at October 31, 2004, are included in the accompanying Statement of Assets and Liabilities.
NOTE 3. INVESTMENT TRANSACTIONS
The cost of securities purchased and proceeds from securities sold (excluding short-term securities) for the year ended October 31, 2004, were as follows:
| Purchases of securities: | | | |
| Long-Term excluding U.S. Government | | $ | 467,668 | | |
| U.S. Government | | | 664 | | |
| Proceeds from maturities and sales of securities: | | | |
| Long-Term excluding U.S. Government | | | 818,873 | | |
| U.S. Government | | | – | | |
NOTE 4. FEDERAL INCOME TAX MATTERS
The Fund has not made any provision for federal income or excise taxes due to its policy to distribute all of its taxable income and capital gains to its shareholders and otherwise qualify as a regulated investment company under the Internal Revenue Code. Income and capital gain distributions are determined in accordance with income tax regulations, which may differ from GAAP. These differences are primarily due to differing treatment for items including, but not limited to, wash sales, foreign currency transactions, net operating losses and capital loss carryforwards.
Transamerica IDEX Mutual Funds
Annual Report 2004
13
TA IDEX Janus Growth
NOTES TO FINANCIAL STATEMENTS (continued)
At October 31, 2004
(all amounts in thousands)
NOTE 4.–(continued)
Reclassifications between Accumulated net investment income (loss), Accumulated net realized capital gains (loss) and Shares of beneficial interest are made to reflect income and gains available for distribution under federal tax regulations. Results of operations and net assets are not effected by these reclassifications. These reclassifications are as follows:
Shares of beneficial interest, unlimited
shares authorized | | $ | (13,763 | ) | |
| Accumulated net investment income (loss) | | | 13,664 | | |
Accumulated net realized gain (loss) from
investment securities and futures contracts | | | 99 | | |
The capital loss carryforwards are available to offset future realized capital gains through the period listed:
Capital Loss
Carryforward | | Available through | |
| $ | 527,580 | | | October 31, 2009 | |
| | 259,422 | | | October 31, 2010 | |
| | 86,859 | | | October 31, 2011 | |
The capital loss carryforward utilized during the year ended October 31, 2004 was $105,644.
The tax basis components of distributable earnings as of October 31, 2004, are as follows:
| Undistributed Ordinary Income | | $ | – | | |
| Undistributed Long-term Capital Gains | | $ | – | | |
| Capital Loss Carryforward | | $ | (873,861 | ) | |
| Net Unrealized Appreciation (Depreciation) | | $ | 189,010 | * | |
* Amount includes unrealized appreciation (depreciation) from foreign currency and deferred compensation.
The aggregate cost of investments and composition of unrealized appreciation (depreciation) for federal income tax purposes as of October 31, 2004, are as follows:
| Federal Tax Cost Basis | | $ | 895,964 | | |
| Unrealized Appreciation | | $ | 218,281 | | |
| Unrealized (Depreciation) | | | (29,201 | ) | |
| Net Unrealized Appreciation (Depreciation) | | $ | 189,080 | | |
NOTE 5. OTHER MATTERS
Transamerica IDEX Mutual Funds ("TA IDEX"), and certain of its affiliated entities, have received requests for information from the Staff of the Securities and Exchange Commission in connection with market
timing and late trading within the funds. TA IDEX and the affiliated entities have voluntarily cooperated in the investigation and have been providing the information as requested.
Transamerica IDEX Mutual Funds
Annual Report 2004
14
Report of Independent Registered Certified Public Accounting Firm
To the Board of Trustees and Shareholders of
TA IDEX Janus Growth
In our opinion, the accompanying statement of assets and liabilities, including the schedule of investments, and the related statements of operations and of changes in net assets and the financial highlights present fairly, in all material respects, the financial position of TA IDEX Janus Growth (the "Fund") (one of the portfolios constituting the Transamerica IDEX Mutual Funds) at October 31, 2004, the results of its operations for the year then ended, the changes in its net assets for each of the two years in the period then ended and the financial highlights for each of the periods indicated, in conformity with accounting principles generally accepted in the United States of America. These financial statements and financial highlights (hereafter referred to as "financial statements") are the responsibility of the Fund's management; our responsibility is to express an opinion on these financ ial statements based on our audits. We conducted our audits of these financial statements in accordance with the standards of the Public Company Accounting Oversight Board (United States). Those standards require that we plan and perform the audit to obtain reasonable assurance about whether the financial statements are free of material misstatement. An audit includes examining, on a test basis, evidence supporting the amounts and disclosures in the financial statements, assessing the accounting principles used and significant estimates made by management, and evaluating the overall financial statement presentation. We believe that our audits, which included confirmation of securities at October 31, 2004 by correspondence with the custodian and brokers, provide a reasonable basis for our opinion.

PricewaterhouseCoopers LLP
Tampa, Florida
December 28, 2004
Transamerica IDEX Mutual Funds
Annual Report 2004
15
TA IDEX Janus Growth
SUPPLEMENTAL INFORMATION
RESULTS OF SHAREHOLDER PROXY (unaudited)
At a special meeting of Class M shareholders of each series of Transamerica IDEX (except TA IDEX Federated Tax Exempt and TA IDEX Protected Principal Stock) held on September 2, 2004, the results of the Proposal were as follows:
Proposal 1: Approval of a conversion of Class M shares into Class C shares of the Funds, which will result in bearing the distribution and service fees payable under the 12b-1 Plan of Distribution for the Class C shares of the Funds.
| For | | Against | | Abstentions/Broker Non-Votes | |
| | 76.27 | % | | | 9.26 | % | | | 14.47 | % | |
Transamerica IDEX Mutual Funds
Annual Report 2004
16
TA IDEX Jennison Growth
MARKET ENVIRONMENT
Over the last twelve months, there has been mixed economic data resulting in unsettled equity markets. At the beginning of this period, we saw solid growth and a dramatic rebound in corporate earnings that led to stronger equity returns. More recently, this growth has slowed and market returns have been relatively flat. Increased geo-political uncertainty and the impact of high-energy prices on the rate of growth in corporate profits, the pace of economic activity, and inflation were among chief concerns for investors recently. Economic data released indicated the soft patch in growth that began in June persisted for most of the period. Nevertheless, the Federal Reserve Board ("Fed") has raised rates by 25 basis points three times, during June and September, 2004, on the belief that this summer's sluggishness will give way to a stronger pace of expansion going forward. We believe the interplay of a number of factors, some more permanent than others, served to moderate aggregate activity both for consumers and businesses. Assuming none of these factors dramatically intensify we believe this weakness to be transitory with growth easing, but the economy staying on a healthy expansionary path.
PERFORMANCE
For the year ended October 31, 2004, TA IDEX Jennison Growth Class A returned 11.48%. By comparison its benchmark, the Standard and Poor's 500 Composite Stock Index ("S&P 500"), returned 9.41%.
STRATEGY REVIEW
Effective March 1, 2004 the mandate for the TA IDEX Jennison Growth changed from multi-cap value to large cap growth. Considering both strategies across the full time period, the portfolio posted a return of 11.48% and outperformed the S&P 500.
The majority of the portfolio's outperformance came in the first part of this period, while it was still being managed in the multi-cap value strategy. For those four months, the energy and materials sectors exhibited the strongest performance. Among the top performers were oil services stocks like Halliburton Company and Transocean, Inc. They benefited from the high price for oil and natural gas and improving demand for drilling services. Other strong performers were Symbol Technologies, Inc., the largest maker of bar code scanners and OfficeMax, Inc. (formerly, Boise Cascade Corporation), a multi-national contract and retail distributor of office supplies and paper, technology products and office furniture. No sector negatively impacted the portfolio, and very few holdings hurt the portfolio's performance more than minimally. Among the negative holdings were Wyeth, a pharmaceutical company and A.G. Edwards, Inc. a financial services company.
Since being managed as large cap growth, the portfolio was modestly negative and slightly underperformed the S&P 500. Performance within the portfolio, both positive and negative, was driven more by individual issues rather than overall sector performance.
Consumer discretionary had the largest positive impact on absolute return mainly due to the strength of two holdings, eBay Inc. ("eBay") and Starbucks Corporation ("Starbucks"). eBay enjoys a dominant market position and valuable brand recognition. We believe growing success in international markets will continue to be a key driver of strong revenue growth and earnings. Starbucks reported solid, steady results, which included increased revenues and very strong unit sales growth well above expectations. Returns in this sector were somewhat offset by poor performance from Tiffany & Co. which was hurt due to concerns over consumer spending, and weak international sales, especially in Japan.
Technology, currently our largest weighting in the portfolio, also produced varied results during the reporting period. The semiconductor industry was weak and several of these stocks, including Intel Corporation, Texas Instruments Incorporated and Agilent Technologies, Inc. were among the portfolio's bottom performers. Leading up to the summer, the outlook for business spending on semiconductors was positive and building momentum. However, demand slowed suddenly leading to excess inventories. This coincided with the seasonal slow down that typifies the industry during the summer months and weighed heavily on company performance. On the other hand, certain segments of technology have done quite well. Internet related companies, such as Google Inc. and Yahoo! Inc., benefited from explosive growth in Internet advertising revenue. In addition, strong consumer demand for digital devices has been an important sales driver of Research in Motion Limited's Blackberry and Apple Computer Inc.'s iPod. The proliferation of wireless consumer products has also benefited QUALCOMM Incorporated as its proprietary technology is used in many such applications.
Spiros Segalas
Blair A. Boyer
Michael A. Del Balso
Co-Fund Managers
Jennison Associates LLC
Transamerica IDEX Mutual Funds
Annual Report 2004
1
TA IDEX Jennison Growth
Comparison of change in value of $10,000 investment in Class A shares and its comparative index.
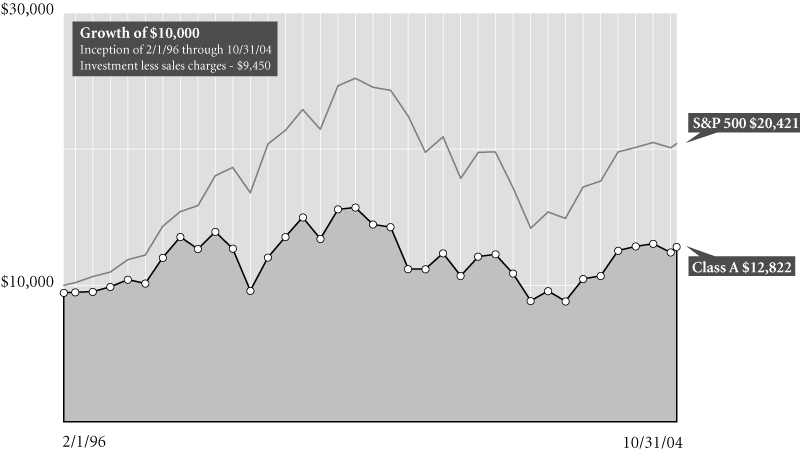
Average Annual Total Return for Periods Ended 10/31/04
| | | 1 year | | 5 years | | From
Inception | | Inception
Date | |
| Class A (NAV) | | | 11.48 | % | | | (1.99 | )% | | | 3.55 | % | | 2/1/96 | |
| Class A (POP) | | | 5.34 | % | | | (3.09 | )% | | | 2.88 | % | | 2/1/96 | |
| S&P 5001 | | | 9.41 | % | | | (2.21 | )% | | | 8.51 | % | | 2/1/96 | |
| Class B (NAV) | | | 10.93 | % | | | (2.60 | )% | | | 2.93 | % | | 2/1/96 | |
| Class B (POP) | | | 5.93 | % | | | (2.80 | )% | | | 2.93 | % | | 2/1/96 | |
| Class C (NAV) | | | 11.18 | % | | | – | | | | 17.42 | % | | 11/11/02 | |
| Class C (POP) | | | 10.18 | % | | | – | | | | 17.42 | % | | 11/11/02 | |
NOTES
1 The Standard & Poor's 500 Composite Stock (S&P 500) Index is an unmanaged index used as a general measure of market performance. Calculations assume dividends and capital gains are reinvested and do not include any managerial expenses. From inception calculation is based on life of Class A shares. Source: Standard & Poor's Micropal®© Micropal, Inc. 2004 – 1-800-596-5323 – http://www.micropal.com.
The performance data presented represents past performance, future results may vary. Performance data does not reflect the deduction of taxes that would be paid on fund distributions or the redemption of fund shares. Investment return and principal value will fluctuate so that an investor's shares, when redeemed, may be worth more or less than their original cost. Current performance may be lower or higher than performance quoted.
Public Offering Price (POP) returns include the reinvestment of dividends and capital gains and reflect the maximum sales charge of 5.5% for A shares or the maximum applicable contingent deferred sales charge (5% in the 1st year, decreasing to 0% after 6 years) for Class B shares and 1% (during the first 12 months) for Class C shares. Shares purchased prior to March 1, 2004 are subject to a maximum applicable contingent deferred salees charge (5% in the 1st year, decreasing to 0% after 7 years) for Class B shares and (2% in the 1st year, decreasing to 0% after 2 years) for Class C shares. Net Asset Value (NAV) returns include the reinvestment of dividends and capital gains but do not reflect any sales charges.
This material must be preceded or accompanied by a current prospectus, which includes specific contents regarding the investment objectives and policies of this fund.
Transamerica IDEX Mutual Funds
Annual Report 2004
2
TA IDEX Jennison Growth
UNDERSTANDING YOUR FUND'S EXPENSES (unaudited)
SHAREHOLDER EXPENSES
The following Example is intended to help you understand your ongoing costs (in dollars and cents) of investing in a Fund and to compare these costs with the ongoing costs of investing in other funds.
The Example is based on an investment of $1,000 invested at the beginning of the period and held for the entire period from May 1, 2004 to October 31, 2004.
ACTUAL EXPENSES
The first line in the table below provides information about actual account values and actual expenses. You may use the information in this line, together with the amount you invested, to estimate the expenses that you paid over the period. Simply divide your account value by $1,000 (for example, an $8,600 account value divided by $1,000 = 8.6), then multiply the result by the number in the first line of your Fund under the heading entitled "Expenses Paid During Period" to estimate the expenses you paid on your account during this period.
HYPOTHETICAL EXAMPLE FOR COMPARISON PURPOSES
The second line in the table below provides information about hypothetical account values and hypothetical expenses based on each Fund's actual expense ratio and an assumed rate of return of 5% per year before expenses, which is not the Fund's actual return. The hypothetical account values and expenses may not be used to estimate the actual ending account balance or expenses you paid for the period. You may use this information to compare the ongoing costs of investing in your Fund and other funds. To do so, compare this 5% hypothetical example with the 5% hypothetical examples that appear in the shareholder reports of the other funds.
Please note that the expenses shown in the table are meant to highlight your ongoing costs only and do not reflect any transactional costs, such as sales charges, redemption fees, brokerage commissions paid on purchases and sales of fund shares. Therefore, the second line under each Fund in the table is useful in comparing ongoing costs only, and will not help you determine the relative total costs of owning different funds. In addition, note that the expenses shown in the table are meant to highlight your ongoing costs and do not reflect any transaction costs.
| | | Beginning
Account
Value | | Ending
Account
Value | | Annualized
Expense
Ratio | | Expenses Paid
During Period(a) | |
| Class A | |
| Actual | | $ | 1,000.00 | | | $ | 1,021.50 | | | | 1.49 | % | | $ | 7.57 | | |
| Hypothetical (b) | | | 1,000.00 | | | | 1,017.65 | | | | 1.49 | | | | 7.56 | | |
| Class B | |
| Actual | | | 1,000.00 | | | | 1,019.20 | | | | 2.04 | | | | 10.35 | | |
| Hypothetical (b) | | | 1,000.00 | | | | 1,014.88 | | | | 2.04 | | | | 10.33 | | |
| Class C | |
| Actual | | | 1,000.00 | | | | 1,016.90 | | | | 2.37 | | | | 12.02 | | |
| Hypothetical (b) | | | 1,000.00 | | | | 1,013.22 | | | | 2.37 | | | | 11.99 | | |
(a) Expenses are calculated using each Fund's annualized expense ratio (as disclosed in the table), multiplied by the average account value for the period, multiplied by number of days in the period (184 days), and divided by the number of days in the year (366 days).
(b) 5% return per year before expenses.
GRAPHIC PRESENTATION OF SCHEDULE OF INVESTMENTS
By Sector
At October 31, 2004
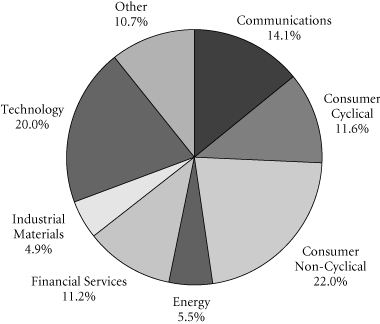
This chart shows the percentage breakdown by sector of the Fund's total investment securities.
Transamerica IDEX Mutual Funds
Annual Report 2004
3
TA IDEX Jennison Growth
SCHEDULE OF INVESTMENTS
At October 31, 2004
(all amounts except share amounts in thousands)
| | | Shares | | Value | |
| COMMON STOCKS (97.2%) | | | |
| Apparel & Accessory Stores (1.5%) | | | |
| Chico's FAS, Inc. (a)(b) | | | 40,600 | | | $ | 1,625 | | |
| Business Services (3.4%) | | | |
| eBay, Inc. (b) | | | 36,600 | | | | 3,572 | | |
| Chemicals & Allied Products (4.2%) | | | |
| Avon Products, Inc. | | | 39,300 | | | | 1,554 | | |
| Estee Lauder Cos. (The), Inc.–Class A | | | 28,900 | | | | 1,241 | | |
| Procter & Gamble Co. | | | 31,800 | | | | 1,627 | | |
| Commercial Banks (5.6%) | | | |
| Bank of America Corp. | | | 27,600 | | | | 1,236 | | |
| Citigroup, Inc. | | | 4,300 | | | | 191 | | |
| JPMorgan Chase & Co. | | | 67,100 | | | | 2,590 | | |
| State Street Corp. | | | 42,600 | | | | 1,919 | | |
| Communication (0.6%) | | | |
| Viacom, Inc.–Class B (a) | | | 17,400 | | | | 635 | | |
| Communications Equipment (3.0%) | | | |
| QUALCOMM, Inc. | | | 41,600 | | | | 1,739 | | |
| Research In Motion, Ltd. (b) | | | 16,700 | | | | 1,473 | | |
| Computer & Data Processing Services (14.2%) | | | |
| Electronic Arts, Inc. (b) | | | 48,100 | | | | 2,161 | | |
| Google, Inc.–Class A (a)(b) | | | 5,900 | | | | 1,125 | | |
| Mercury Interactive Corp. (a)(b) | | | 30,800 | | | | 1,338 | | |
| Microsoft Corp. | | | 125,300 | | | | 3,507 | | |
| NAVTEQ Corp. (b) | | | 17,900 | | | | 722 | | |
| SAP AG, Sponsored ADR | | | 44,600 | | | | 1,902 | | |
| Symantec Corp. (a)(b) | | | 9,600 | | | | 547 | | |
| Yahoo!, Inc. (b) | | | 105,500 | | | | 3,818 | | |
| Computer & Office Equipment (7.4%) | | | |
| Apple Computer, Inc. (b) | | | 43,100 | | | | 2,264 | | |
| Cisco Systems, Inc. (b) | | | 96,000 | | | | 1,844 | | |
| Dell, Inc. (b) | | | 62,600 | | | | 2,195 | | |
| International Business Machines Corp. | | | 10,100 | | | | 906 | | |
| Lexmark International, Inc. (b) | | | 8,000 | | | | 665 | | |
| Educational Services (0.8%) | | | |
| Apollo Group, Inc.–Class A (b) | | | 13,200 | | | | 871 | | |
| Electronic & Other Electric Equipment (5.0%) | | | |
| General Electric Co. | | | 113,100 | | | | 3,859 | | |
| Harman International Industries, Inc. | | | 11,800 | | | | 1,418 | | |
| Electronic Components & Accessories (5.7%) | | | |
| Intel Corp. | | | 72,700 | | | | 1,618 | | |
| Marvell Technology Group, Ltd. (a)(b) | | | 64,900 | | | | 1,854 | | |
| Maxim Integrated Products, Inc. | | | 23,300 | | | | 1,025 | | |
| Texas Instruments, Inc. | | | 62,900 | | | | 1,538 | | |
| Food Stores (2.3%) | | | |
| Kroger Co. (a)(b) | | | 44,000 | | | | 665 | | |
| Whole Foods Market, Inc. (a) | | | 21,800 | | | | 1,775 | | |
| | | Shares | | Value | |
| Furniture & Home Furnishings Stores (2.4%) | |
| Bed Bath & Beyond, Inc. (a)(b) | | | 49,400 | | | $ | 2,015 | | |
| Williams-Sonoma, Inc. (a)(b) | | | 13,100 | | | | 500 | | |
| Health Services (1.6%) | |
| Caremark Rx, Inc. (b) | | | 55,900 | | | | 1,675 | | |
| Instruments & Related Products (2.7%) | |
| Agilent Technologies, Inc. (b) | | | 71,900 | | | | 1,802 | | |
| Alcon, Inc. | | | 14,300 | | | | 1,018 | | |
| Insurance (1.2%) | |
| American International Group, Inc. | | | 21,100 | | | | 1,281 | | |
| Lumber & Other Building Materials (1.1%) | |
| Lowe's Cos., Inc. | | | 20,600 | | | | 1,159 | | |
| Management Services (0.0%) | |
| Paychex, Inc. | | | 1,400 | | | | 46 | | |
| Medical Instruments & Supplies (1.3%) | |
| Guidant Corp. | | | 21,300 | | | | 1,419 | | |
| Motion Pictures (0.1%) | |
| DreamWorks Animation SKG, Inc.–Class A (b) | | | 1,400 | | | | 55 | | |
| Oil & Gas Extraction (6.0%) | |
| BJ Services Co. (a) | | | 23,800 | | | | 1,214 | | |
| Schlumberger, Ltd. | | | 44,400 | | | | 2,795 | | |
| Total SA, Sponsored ADR | | | 22,700 | | | | 2,367 | | |
| Pharmaceuticals (12.7%) | |
| Allergan, Inc. | | | 20,600 | | | | 1,474 | | |
| Amgen, Inc. (b) | | | 29,700 | | | | 1,687 | | |
| AstraZeneca PLC, Sponsored ADR (a) | | | 25,600 | | | | 1,055 | | |
| Eli Lilly & Co. | | | 29,500 | | | | 1,620 | | |
| Genentech, Inc. (b) | | | 35,400 | | | | 1,612 | | |
| Gilead Sciences, Inc. (b) | | | 43,400 | | | | 1,503 | | |
| IVAX Corp. (b) | | | 12,625 | | | | 228 | | |
| Novartis AG, Sponsored ADR | | | 32,900 | | | | 1,580 | | |
| Pfizer, Inc. | | | 36,000 | | | | 1,042 | | |
| Roche Holding AG, Sponsored ADR | | | 16,969 | | | | 1,729 | | |
| Radio & Television Broadcasting (1.6%) | |
| Univision Communications, Inc.–Class A (b) | | | 54,800 | | | | 1,697 | | |
| Restaurants (2.4%) | |
| Starbucks Corp. (b) | | | 47,100 | | | | 2,491 | | |
| Retail Trade (1.2%) | |
| Petsmart, Inc. | | | 23,600 | | | | 755 | | |
| Tiffany & Co. | | | 18,400 | | | | 540 | | |
| Security & Commodity Brokers (5.3%) | |
| American Express Co. | | | 49,200 | | | | 2,611 | | |
| Goldman Sachs Group, Inc. | | | 11,700 | | | | 1,151 | | |
| Merrill Lynch & Co., Inc. | | | 35,300 | | | | 1,904 | | |
| Telecommunications (1.2%) | |
| Vodafone Group PLC, Sponsored ADR | | | 48,900 | | | | 1,261 | | |
The notes to the financial statements are an integral part of this report.
Transamerica IDEX Mutual Funds
Annual Report 2004
4
TA IDEX Jennison Growth
SCHEDULE OF INVESTMENTS (continued)
At October 31, 2004
(all amounts except share amounts in thousands)
| | | Shares | | Value | |
| Variety Stores (2.7%) | | | |
| Costco Wholesale Corp. | | | 21,800 | | | $ | 1,045 | | |
| Target Corp. | | | 36,100 | | | | 1,806 | | |
| Total Common Stocks (cost: $99,500) | | | | | | | 103,156 | | |
| | | Principal | | Value | |
| SECURITY LENDING COLLATERAL (11.6%) | | | |
| Debt (10.8%) | | | |
| Bank Notes (2.1%) | | | |
Bank of America
1.77%, due 12/03/2004 | | $ | 602 | | | $ | 602 | | |
| 1.88%, due 12/23/2004 | | | 201 | | | | 201 | | |
| 1.77%, due 01/18/2005 | | | 402 | | | | 402 | | |
Canadian Imperial Bank of Commerce
1.86%, due 11/04/2004 | | | 904 | | | | 904 | | |
Credit Suisse First Boston Corp.
1.83%, due 09/09/2005 | | | 100 | | | | 100 | | |
| Commercial Paper (1.1%) | | | |
Clipper Receivables Corp.
1.79%, due 11/12/2004 | | | 299 | | | | 299 | | |
Delaware Funding Corp. 144A
1.85%, due 11/19/2004 | | | 100 | | | | 100 | | |
Falcon Asset Securitization Corp. 144A
1.78%, due 11/04/2004
1.75%, due 11/10/2004 | | | 299
402 | | | | 299
402 | | |
Galaxy Funding 144A
1.88%, due 11/22/2004 | | | 100 | | | | 100 | | |
| Euro Dollar Terms (5.0%) | | | |
Bank of Montreal
1.88%, due 11/24/2004 | | | 951 | | | | 951 | | |
BNP Paribas
1.77%, due 11/10/2004
1.80%, due 11/23/2004
1.98%, due 12/27/2004 | | | 502
402
402 | | | | 502
402
402 | | |
Calyon
1.70%, due 11/24/2004 | | | 53 | | | | 53 | | |
Citigroup
2.06%, due 01/25/2005 | | | 1,004 | | | | 1,004 | | |
| | | Principal | | Value | |
| Euro Dollar Terms (continued) | |
Den Danske Bank
1.82%, due 11/19/2004 | | $ | 502 | | | $ | 502 | | |
Dexia Group
2.04%, due 01/21/2005 | | | 233 | | | | 233 | | |
HBOS Halifax Bank of Scotland
2.03%, due 01/21/2005 | | | 201 | | | | 201 | | |
Royal Bank of Scotland
2.01%, due 01/20/2005 | | | 402 | | | | 402 | | |
Toronto Dominion Bank
1.70%, due 11/08/2004 | | | 201 | | | | 201 | | |
Wells Fargo
1.87%, due 11/22/2004 | | | 502 | | | | 502 | | |
| Promissory Notes (1.1%) | |
Goldman Sachs Group Inc.
1.90%, due 12/29/2004
1.88%, due 01/27/2005 | | | 422
703 | | | | 422
703 | | |
| Repurchase Agreements (1.5%) | |
Merrill Lynch & Co., Inc. (c)
1.92% Repurchase Agreement dated
10/29/2004 to be repurchased at $1,606
on 11/1/2004 | | | 1,606 | | | | 1,606 | | |
| | | Shares | | Value | |
| Investment Companies (0.8%) | |
| Money Market Funds (0.8%) | |
Merrill Lynch Premier Institutional Fund
1-day yield of 1.71% | | | 493,937 | | | | $494 | | |
Merrimac Cash Fund, Premium Class
1-day yield of 1.46% | | | 361,458 | | | | 361 | | |
| Total Security Lending Collateral (cost: $12,350) | | | | | | | 12,350 | | |
| Total Investment Securities (cost: $111,850) | | | | | | $ | 115,506 | | |
| SUMMARY: | |
| Investments, at value | | | 108.8 | % | | $ | 115,506 | | |
| Liabilities in excess of other assets | | | (8.8 | )% | | | (9,362 | ) | |
| Net assets | | | 100.0 | % | | $ | 106,144 | | |
The notes to the financial statements are an integral part of this report.
NOTES TO SCHEDULE OF INVESTMENTS:
(a) At October 31, 2004, all or a portion of this security is on loan (see Note 1). The value at October 31, 2004, of all securities on loan is $11,992.
(b) No dividends were paid during the preceding twelve months.
(c) Cash collateral for the Repurchase Agreements, valued at $1,639, that serve as collateral for securities lending are invested in corporate bonds with interest rates and maturity dates ranging from 0.00%–9.75% and 05/15/2005–9/15/2033, respectively.
DEFINITIONS:
ADR American Depositary Receipt
144A 144A Securities are registered pusuant to rule 144A of the Securities Act of 1933. These securities are deemed to be liquid for purposes of compliance limitations on holdings of illiquid securities and may be resold as transactions exempt from registration normally to qualified institutional buyers.
At October 31, 2004, these securities aggregated $901 or 0.85% of the net assets of the Fund.
Transamerica IDEX Mutual Funds
Annual Report 2004
5
TA IDEX Jennison Growth
STATEMENT OF ASSETS AND LIABILITIES
At October 31, 2004
(all amounts except per share amounts in thousands)
| Assets: | | | |
Investment securities, at value (cost: $111,850)
(including securities loaned of $11,992) | | $ | 115,506 | | |
| Cash | | | 6,775 | | |
| Receivables: | |
| Investment securities sold | | | 689 | | |
| Shares of beneficial interest sold | | | 246 | | |
| Interest | | | 6 | | |
| Dividends | | | 43 | | |
| Other | | | 5 | | |
| | | | 123,270 | | |
| Liabilities: | | | |
| Investment securities purchased | | | 4,422 | | |
| Accounts payable and accrued liabilities: | |
| Shares of beneficial interest redeemed | | | 99 | | |
| Management and advisory fees | | | 84 | | |
| Distribution fees | | | 56 | | |
| Transfer agent fees | | | 51 | | |
| Payable for collateral for securities on loan | | | 12,350 | | |
| Other | | | 64 | | |
| | | | 17,126 | | |
| Net Assets | | $ | 106,144 | | |
| Net Assets Consist of: | | | |
Shares of beneficial interest, unlimited shares
authorized, no par value | | $ | 104,825 | | |
| Accumulated net investment income (loss) | | | 3 | | |
Accumulated net realized gain (loss) from investment
securities and foreign currency transactions | | | (2,340 | ) | |
Net unrealized appreciation (depreciation) on
investment securities | | | 3,656 | | |
| Net Assets | | $ | 106,144 | | |
| Net Assets by Class: | | | |
| Class A | | $ | 57,760 | | |
| Class B | | | 34,667 | | |
| Class C | | | 13,717 | | |
| Shares Outstanding: | | | |
| Class A | | | 6,069 | | |
| Class B | | | 3,841 | | |
| Class C | | | 1,515 | | |
| Net Asset Value Per Share: | | | |
| Class A | | $ | 9.52 | | |
| Class B | | | 9.03 | | |
| Class C | | | 9.05 | | |
| Maximum Offering Price Per Share (a): | | | |
| Class A | | $ | 10.07 | | |
(a) Includes the maximum selling commission (represented as a percentage of offering price) which is reduced on certain levels of sales as set forth in the Prospectus. Net asset value per share for Classes B and C shares represents offering price. The redemption price for Classes B and C shares equals net asset value less any applicable contingent deferred sales charge.
STATEMENT OF OPERATIONS
For the year ended October 31, 2004
(all amounts in thousands)
| Investment Income: | | | |
| Interest | | $ | 19 | | |
| Dividends | | | 675 | | |
| Income from loaned securities–net | | | 15 | | |
| Less withholding taxes on foreign dividends | | | (12 | ) | |
| | | | 697 | | |
| Expenses: | | | |
| Management and advisory fees | | | 657 | | |
| Transfer agent fees | |
| Class A | | | 83 | | |
| Class B | | | 102 | | |
| Class C | | | 13 | | |
| Class C2 | | | 17 | | |
| Class M | | | 23 | | |
| Printing and shareholder reports | | | 28 | | |
| Custody fees | | | 24 | | |
| Administration fees | | | 17 | | |
| Legal fees | | | 3 | | |
| Audit and accounting fees | | | 12 | | |
| Trustees fees | | | 5 | | |
| Registration fees | |
| Class A | | | 22 | | |
| Class B | | | 13 | | |
| Class C | | | 13 | | |
| Class C2 | | | 2 | | |
| Class M | | | 4 | | |
| Other | | | 4 | | |
| Distribution and service fees: | |
| Class A | | | 100 | | |
| Class B | | | 375 | | |
| Class C | | | 47 | | |
| Class C2 | | | 47 | | |
| Class M | | | 59 | | |
| Total expenses | | | 1,670 | | |
| Net Investment Income (Loss) | | | (973 | ) | |
| Net Realized Gain (Loss) from: | | | |
| Investment securities | | | 11,976 | | |
| Foreign currency transactions | | | (9 | ) | |
| | | | 11,967 | | |
Increase (decrease) in unrealized appreciation
(depreciation) on investment securities | | | (2,428 | ) | |
Net Gain (Loss) on Investments and Foreign Currency
Transactions | | | 9,539 | | |
Net Increase (Decrease) in Net Assets Resulting
from Operations | | $ | 8,566 | | |
The notes to the financial statements are an integral part of this report.
Transamerica IDEX Mutual Funds
Annual Report 2004
6
TA IDEX Jennison Growth
STATEMENTS OF CHANGES IN NET ASSETS
For the years ended
(all amounts in thousands)
| | | October 31,
2004 | | October 31,
2003 | |
| Increase (Decrease) in Net Assets From: | |
| Operations: | |
| Net investment income (loss) | | $ | (973 | ) | | $ | (708 | ) | |
Net realized gain (loss) from
investment securities and
foreign currency transactions | | | 11,967 | | | | (2,454 | ) | |
Net unrealized appreciation
(depreciation) on investment
securities | | | (2,428 | ) | | | 17,691 | | |
| | | | 8,566 | | | | 14,529 | | |
| Capital Share Transactions: | |
| Proceeds from shares sold: | |
| Class A | | | 43,811 | | | | 4,065 | | |
| Class B | | | 2,025 | | | | 3,745 | | |
| Class C | | | 2,846 | | | | 589 | | |
| Class C2 | | | 369 | | | | 1,689 | | |
| Class M | | | 1,047 | | | | 763 | | |
| | | | 50,098 | | | | 10,851 | | |
| Cost of shares redeemed: | |
| Class A | | | (8,121 | ) | | | (11,152 | ) | |
| Class B | | | (8,690 | ) | | | (10,927 | ) | |
| Class C | | | (3,250 | ) | | | (64 | ) | |
| Class C2 | | | (1,667 | ) | | | (4,487 | ) | |
| Class M | | | (2,836 | ) | | | (2,917 | ) | |
| | | | (24,564 | ) | | | (29,547 | ) | |
| Class C | | | 13,383 | | | | – | | |
| Class C2 | | | (7,197 | ) | | | – | | |
| Class M | | | (6,186 | ) | | | – | | |
| | | | – | | | | – | | |
| Automatic conversions: | |
| Class A | | | 31 | | | | – | | |
| Class B | | | (31 | ) | | | – | | |
| | | | – | | | | – | | |
| | | | 25,534 | | | | (18,696 | ) | |
| Net increase (decrease) in net assets | | | 34,100 | | | | (4,167 | ) | |
| Net Assets: | | | |
| Beginning of year | | | 72,044 | | | | 76,211 | | |
| End of year | | $ | 106,144 | | | $ | 72,044 | | |
Accumulated Net Investment Income
(Loss) | | $ | 3 | | | $ | (3 | ) | |
| | | October 31,
2004 | | October 31,
2003 | |
| Share Activity: | |
| Shares issued: | |
| Class A | | | 4,731 | | | | 549 | | |
| Class B | | | 228 | | | | 533 | | |
| Class C | | | 319 | | | | 84 | | |
| Class C2 | | | 42 | | | | 241 | | |
| Class M | | | 116 | | | | 110 | | |
| | | | 5,436 | | | | 1,517 | | |
| Class A | | | (872 | ) | | | (1,514 | ) | |
| Class B | | | (990 | ) | | | (1,584 | ) | |
| Class C | | | (373 | ) | | | (9 | ) | |
| Class C2 | | | (191 | ) | | | (657 | ) | |
| Class M | | | (322 | ) | | | (413 | ) | |
| | | | (2,748 | ) | | | (4,177 | ) | |
| Class C | | | 1,494 | | | | – | | |
| Class C2 | | | (791 | ) | | | – | | |
| Class M | | | (703 | ) | | | – | | |
| | | | – | | | | – | | |
| Class A | | | 3 | | | | – | | |
| Class B | | | (4 | ) | | | – | | |
| | | | (1 | ) | | | – | | |
Net increase (decrease) in shares
outstanding: | |
| Class A | | | 3,862 | | | | (965 | ) | |
| Class B | | | (766 | ) | | | (1,051 | ) | |
| Class C | | | 1,440 | | | | 75 | | |
| Class C2 | | | (940 | ) | | | (416 | ) | |
| Class M | | | (909 | ) | | | (303 | ) | |
| | | | 2,687 | | | | (2,660 | ) | |
The notes to the financial statements are an integral part of this report.
Transamerica IDEX Mutual Funds
Annual Report 2004
7
TA IDEX Jennison Growth
FINANCIAL HIGHLIGHTS
| | | | | For a share of beneficial interest outstanding throughout each period | |
| | | | | Net Asset | | Investment Operations | | Distributions | | Net Asset | |
| | | For the
Period
Ended (d)(g) | | Value,
Beginning
of Period | | Net
Investment
Income (Loss) | | Net Realized
and Unrealized
Gain (Loss) | | Total
Operations | | From Net
Investment
Income | | From Net
Realized
Gains | | Total
Distributions | | Value,
End
of Period | |
| Class A | | 10/31/2004 | | $ | 8.54 | | | $ | (0.07 | ) | | $ | 1.05 | | | $ | 0.98 | | | $ | – | | | $ | – | | | $ | – | | | $ | 9.52 | | |
| | | 10/31/2003 | | | 6.88 | | | | (0.04 | ) | | | 1.70 | | | | 1.66 | | | | – | | | | – | | | | – | | | | 8.54 | | |
| | | 10/31/2002 | | | 8.04 | | | | (0.05 | ) | | | (1.11 | ) | | | (1.16 | ) | | | – | | | | – | | | | – | | | | 6.88 | | |
| | | 10/31/2001 | | | 10.26 | | | | (0.01 | ) | | | (1.17 | ) | | | (1.18 | ) | | | – | | | | (1.04 | ) | | | (1.04 | ) | | | 8.04 | | |
| | | 10/31/2000 | | | 12.14 | | | | (0.13 | ) | | | (1.54 | ) | | | (1.67 | ) | | | – | | | | (0.21 | ) | | | (0.21 | ) | | | 10.26 | | |
| Class B | | 10/31/2004 | | | 8.14 | | | | (0.12 | ) | | | 1.01 | | | | 0.89 | | | | – | | | | – | | | | – | | | | 9.03 | | |
| | | 10/31/2003 | | | 6.60 | | | | (0.08 | ) | | | 1.62 | | | | 1.54 | | | | – | | | | – | | | | – | | | | 8.14 | | |
| | | 10/31/2002 | | | 7.77 | | | | (0.10 | ) | | | (1.07 | ) | | | (1.17 | ) | | | – | | | | – | | | | – | | | | 6.60 | | |
| | | 10/31/2001 | | | 10.01 | | | | (0.05 | ) | | | (1.15 | ) | | | (1.20 | ) | | | – | | | | (1.04 | ) | | | (1.04 | ) | | | 7.77 | | |
| | | 10/31/2000 | | | 11.93 | | | | (0.17 | ) | | | (1.54 | ) | | | (1.71 | ) | | | – | | | | (0.21 | ) | | | (0.21 | ) | | | 10.01 | | |
| Class C | | 10/31/2004 | | | 8.14 | | | | (0.15 | ) | | | 1.06 | | | | 0.91 | | | | – | | | | – | | | | – | | | | 9.05 | | |
| | | 10/31/2003 | | | 6.60 | | | | (0.09 | ) | | | 1.63 | | | | 1.54 | | | | – | | | | – | | | | – | | | | 8.14 | | |
| | | | | | | Ratios/Supplemental Data | |
| | | For the
Period | | Total | | Net Assets,
End of
Period | | Ratio of Expenses
to Average
Net Assets (a) | | Net Investment
Income (Loss)
to Average | | Portfolio
Turnover | |
| | | Ended (g) | | Return (c) | | (000's) | | Net (e) | | Total (f) | | Net Assets (a) | | Rate (b) | |
| Class A | | 10/31/2004 | | | 11.48 | % | | $ | 57,760 | | | | 1.59 | % | | | 1.59 | % | | | (0.79 | )% | | | 147 | % | |
| | | 10/31/2003 | | | 24.13 | | | | 18,833 | | | | 1.75 | | | | 1.90 | | | | (0.54 | ) | | | 100 | | |
| | | 10/31/2002 | | | (14.47 | ) | | | 21,836 | | | | 1.75 | | | | 1.82 | | | | (0.52 | ) | | | 98 | | |
| | | 10/31/2001 | | | (11.08 | ) | | | 17,670 | | | | 1.55 | | | | 2.44 | | | | (0.11 | ) | | | 158 | | |
| | | 10/31/2000 | | | (14.06 | ) | | | 4,147 | | | | 1.55 | | | | 2.66 | | | | (0.87 | ) | | | 244 | | |
| Class B | | 10/31/2004 | | | 10.93 | | | | 34,667 | | | | 2.24 | | | | 2.24 | | | | (1.37 | ) | | | 147 | | |
| | | 10/31/2003 | | | 23.33 | | | | 37,500 | | | | 2.40 | | | | 2.55 | | | | (1.19 | ) | | | 100 | | |
| | | 10/31/2002 | | | (15.10 | ) | | | 37,363 | | | | 2.40 | | | | 2.47 | | | | (1.17 | ) | | | 98 | | |
| | | 10/31/2001 | | | (11.54 | ) | | | 31,922 | | | | 2.20 | | | | 3.09 | | | | (0.76 | ) | | | 158 | | |
| | | 10/31/2000 | | | (14.70 | ) | | | 3,483 | | | | 2.20 | | | | 3.31 | | | | (1.52 | ) | | | 244 | | |
| Class C | | 10/31/2004 | | | 11.18 | | | | 13,717 | | | | 2.39 | | | | 2.39 | | | | (1.68 | ) | | | 147 | | |
| | | 10/31/2003 | | | 23.33 | | | | 607 | | | | 2.40 | | | | 2.55 | | | | (1.19 | ) | | | 100 | | |
NOTES TO FINANCIAL HIGHLIGHTS
(a) Annualized.
(b) Not annualized for periods of less than one year.
(c) Total Return has been calculated for the applicable period without deduction of a sales load, if any, on an initial purchase. Periods of less that one year are not annualized.
(d) Per share information is calculated based on the average number of shares outstanding for the years ended 10/31/2001, 10/31/2002, 10/31/2003 and 10/31/2004.
(e) Ratio of Net Expenses to Average Net Assets is net of fee waivers and reimbursements by the investment adviser, if any (see note 2).
(f) Ratio of Total Expenses to Average Net Assets includes all expenses before fee waivers and reimbursements by the investment adviser.
(g) The inception date for the Fund's offering of share Class L was November 11, 2002. Class L was renamed Class C on March 1, 2004. (see note 1)
The notes to the financial statements are an integral part of this report.
Transamerica IDEX Mutual Funds
Annual Report 2004
8
TA IDEX Jennison Growth
NOTES TO FINANCIAL STATEMENTS
At October 31, 2004
(all amounts in thousands)
NOTE 1. ORGANIZATION AND SIGNIFICANT ACCOUNTING POLICIES
Transamerica IDEX Mutual Funds, formerly IDEX Mutual Funds, is a Massachusetts business trust registered under the Investment Company Act of 1940, as amended (the "1940 Act"), as an open-end management investment company. TA IDEX Jennison Growth ("the Fund"), part of Transamerica IDEX Mutual Funds, began operations on February 1, 1996.
On March 1, 2004, the Fund changed its name from IDEX Jennison Equity Opportunity to TA IDEX Jennison Growth.
In the normal course of business, the Fund enters into contracts that contain a variety of representations and warranties, which provide general indemnifications. The Fund's maximum exposure under these arrangements is unknown, as this would involve future claims that may be made against the Fund and/or its affiliates that have not yet occurred. However, based on experience, the Fund expects the risk of loss to be remote.
See the Prospectus and Statement of Additional Information for a description of the Fund's investment objective.
In preparing the Fund's financial statements in accordance with accounting principles generally accepted in the United States of America ("GAAP"), estimates or assumptions (which could differ from actual results) may be used that affect reported amounts and disclosures. The following policies were consistently followed by the Fund, in accordance with GAAP.
Multiple class operations and expenses: The Fund currently offers three classes of shares, each with a public offering price that reflects different sales charges, if any, and expense levels. All shares designated as Class C shares prior to March 1, 2004, were renamed as Class C2 shares on that date. All shares designated as Class L shares prior to March 1, 2004, were renamed as Class C shares with different sales charges than the previous Class L shares. On June 15, 2004, Class C2 shares merged into Class C. On September 24, 2004, Class M shares merged into Class C. Class B shares will convert to Class A shares eight years after purchase. Income, non-class specific expenses and realized and unrealized gains and losses, are allocated daily to each class, based upon the value of shares outstanding method as permitted under Rule 18f-3 of the 1940 Act. Each class bears its own specific expenses as well as a portion of general, common expenses.
Pricing of shares: The Fund prices its shares on the basis of the net asset value of each class of shares of the Fund, which is determined as of the close of the New York Stock Exchange ("NYSE") (generally 4:00 p.m. Eastern Time) on each day on which the NYSE is open for trading (other than a day on which there are insufficient changes in the value of the Fund's portfolio securities to materially affect the Fund's
net asset value or a day on which no shares are tendered for redemption and no order to purchase any shares is received).
Security valuations: Fund investments traded on an exchange are valued at the closing price on the day of valuation on the exchange where the security is principally traded. With respect to securities traded on NASDAQ NMS, such closing price may be the last reported sales price or the NASDAQ Official Closing Price.
Securities traded in the over-the-counter market and listed securities for which no sale was reported on that date are valued at the last quoted bid price.
Debt securities are valued by independent pricing services; however, those that mature in sixty days or less are valued at amortized cost, which approximates market.
Foreign securities generally are valued based on quotations from the primary market in which they are traded and are translated from the local currency into U.S. dollars using closing exchange rates. Many foreign securities markets are open for trading at times when the U.S. markets are closed for trading, and many foreign securities markets close for trading before the close of the NYSE. The value of foreign securities may be affected significantly on a day that the NYSE is closed and an investor is unable to purchase or redeem shares. If a significant market event impacting the value of a portfolio security (e.g., natural disaster, company announcement, market volatility) occurs subsequent to the close of trading in the security, but prior to the calculation of the Fund's net asset value per share, market quotations for that security may be determined to be unreliable and, accordingly, not "readily av ailable." If market quotations are not readily available, and the impact of such a significant market event materially effects the net asset value per share of the Fund, an affected portfolio security will be valued at fair market value as determined in good faith using guidelines adopted by the Board of Trustees of the Fund, under the supervision of the Fund's Valuation Committee. Factors that may be considered to value foreign securities at fair market value may include, among others: the value of other securities traded on other markets, foreign currency exchange activity and the trading of financial products tied to foreign securities.
Other securities for which quotations are not readily available are valued at fair market value as determined in good faith using guidelines adopted by the Board of Trustees of the Fund, under the supervision of the Fund's Valuation Committee.
Cash: The Fund may leave cash overnight in its cash account with the custodian, Investors Bank & Trust Company ("IBT"). IBT has been contracted on behalf of the Fund to invest the excess cash into a savings account, which at October 31, 2004, was paying an interest rate of 1.30%.
Throughout the year, the Fund may have a cash overdraft balance. A fee is incurred on this overdraft, calculated by multiplying the overdraft by a rate based on the federal funds rate. This fee is included in Custody fees in the Statement of Operations.
Transamerica IDEX Mutual Funds
Annual Report 2004
9
TA IDEX Jennison Growth
NOTES TO FINANCIAL STATEMENTS (continued)
At October 31, 2004
(all amounts in thousands)
NOTE 1.–(continued)
Repurchase agreements: The Fund is authorized to enter into repurchase agreements. The Fund, through IBT, receives delivery of the underlying securities, the value of which at the time of purchase is required to be an amount equal to at least 100% of the resale price. Repurchase agreements involve the risk that the seller will fail to repurchase the security, as agreed. In that case, the Fund will bear the risk of value fluctuations until the security can be sold and may encounter delays and incur costs in liquidating the security. In the event of bankruptcy or insolvency of the seller, delays and costs may be incurred.
Commission recapture: The sub-adviser, to the extent consistent with the best execution and usual commission rate policies and practices, may place security transactions of the Fund with broker/dealers with which Transamerica IDEX Mutual Funds has established a Commission Recapture Program. A Commission Recapture Program is any arrangement under which a broker/dealer applies a portion of the commissions received by such broker/dealer on the security transactions to the Fund. In no event will commissions paid by the Fund be used to pay expenses that would otherwise be borne by any other funds within Transamerica IDEX Mutual Funds, or by any other party.
Recaptured commissions during the year ended October 31, 2004, of $26 are included in net realized gains in the Statement of Operations.
Securities lending: The Fund may lend securities to enhance fund earnings from investing cash collateral in making such loans to qualified borrowers (typically broker/dealers). The Fund has engaged its custodian bank, IBT, as a lending agent to administer its securities lending program. IBT earned $6 of program net income for its services. When the Fund makes a security loan, it receives cash collateral as protection against the risk that the borrower will default on the loan, and records an asset for the cash invested collateral and a liability for the return of the collateral.
Securities on loan are included in Investment securities at value in the Statement of Assets and Liabilities and remain on the Schedule of Investments.
Loans of securities are required to be secured by collateral at least equal to 102% of the value of the securities at inception of the loan, and not less then 100% thereafter. The Fund may invest cash collateral in short-term money market instruments including: U.S. Treasury Bills, U.S. agency obligations, commercial paper, money market mutual funds, repurchase agreements and other highly rated, liquid investments. During the life of securities loans, the collateral and securities loaned remain subject to fluctuation in value. IBT marks to market securities loaned and the collateral each business day. If additional collateral is due (at least $1), IBT collects additional cash collateral from the borrowers. Although securities loaned will be fully collateralized at all
times, IBT may experience delays in, or may be prevented from, recovering the collateral on behalf of the Fund. The Fund may recall a loaned security position at any time from the borrower through IBT. In the event the borrower fails to timely return a recalled security, IBT may indemnify the Fund by purchasing replacement securities for the Fund at its own expense and claiming the collateral to fund such a purchase. IBT absorbs the loss if the collateral value is not sufficient to cover the cost of the replacement securities. If replacement securities are not available, IBT will credit the equivalent cash value to the Fund.
While a security is on loan, the Fund does not have the right to vote that security. However, if time permits, the Fund will attempt to recall a security on loan and vote the proxy.
Income from securities lending is included in the Statement of Operations. The amount of collateral and value of securities on loan are included in the Statement of Assets and Liabilities as well as in the Schedule of Investments.
Security transactions and investment income: Security transactions are recorded on the trade date. Security gains and losses are calculated on the specific identification basis. Dividend income is recorded on the ex-dividend date or, in the case of foreign securities, as soon as the Fund is informed of the ex-dividend date. Interest Income, including accretion of discounts and amortization of premiums, is recorded on the accrual basis commencing on the settlement date.
Foreign currency denominated investments: The accounting records of the Fund are maintained in U.S. dollars. Securities and other assets and liabilities denominated in foreign currencies are translated into U.S. dollars at the closing exchange rate each day. The cost of foreign securities is translated at the exchange rate in effect when the investment was acquired. The Fund combines fluctuations from currency exchange rates and fluctuations in value when computing net realized and unrealized gains or losses from investments.
Net foreign currency gains and losses resulting from changes in exchange rates include: 1) foreign currency fluctuations between trade date and settlement date of investment security transactions; 2) gains and losses on forward foreign currency contracts; and 3) the difference between the receivable amounts of interest and dividends recorded in the accounting records in U.S. dollars and the amounts actually received.
Foreign currency denominated assets may involve risks not typically associated with domestic transactions, including unanticipated movements in exchange currency rates, the degree of government supervision and regulation of security markets, and the possibility of political or economic instability.
Forward foreign currency contracts: The Fund may enter into forward foreign currency contracts to hedge against exchange rate risk arising from investments in securities denominated in foreign currencies. Contracts are valued at the contractual forward rate and are marked to market daily, with the change in value recorded as an unrealized gain or loss. When the contracts are closed a realized gain or loss is incurred. Risks may arise from changes in market value of the underlying currencies and
Transamerica IDEX Mutual Funds
Annual Report 2004
10
TA IDEX Jennison Growth
NOTES TO FINANCIAL STATEMENTS (continued)
At October 31, 2004
(all amounts in thousands)
NOTE 1.–(continued)
from the possible inability of counterparties to meet the terms of their contracts. There are no open forward foreign currency contract at October 31, 2004.
Account maintenance fees: If the shareholder account balance falls below $1 by either shareholder action or as a result of market action, a $25 (not in thousands) fee is assessed every year until the balance reaches $1. The fee is assessed by redeeming shares in the shareholder's account.
No fee will be charged under the following conditions:
• accounts opened within the preceding 24 months
• accounts with an active monthly Automatic Investment Plan ($50 (not in thousands) minimum per fund)
• accounts owned by an individual which, when combined by social security number, have a balance of $5 or more
• accounts owned by individuals in the same household (by address) that have a combined balance of $5 or more
• UTMA/UGMA accounts
• Fiduciary accounts
• B-share accounts whose shares have started to convert to A-shares accounts (as long as combined value of both accounts is at least $1)
For the year ended October 31, 2004, this fee totaled $1. These fees are included in Paid in Capital in the Statement of Assets and Liabilities.
Redemption fees: A short-term trading redemption fee may be assessed on any fund shares in a fund account that are sold during the first five (5) New York Stock Exchange trading days following their purchase date. This redemption fee will equal 2% of the amount redeemed and shares held the longest will be treated as being redeemed first and shares held the shortest as being redeemed last. For the year ended October 31, 2004, the Fund received no redemption fees.
Dividend distributions: Distributions to shareholders are recorded on the ex-dividend date and are determined in accordance with Federal income tax regulations which may differ from GAAP.
NOTE 2. RELATED PARTY TRANSACTIONS
AEGON/Transamerica Fund Advisers, Inc. ("ATFA") is the Fund's investment adviser. AEGON/Transamerica Fund Services, Inc. ("ATFS") is the Fund's administrator. AFSG Securities Corp. ("AFSG") is the
Fund's distributor/principal underwriter. AEGON/Transamerica Investor Services, Inc. ("ATIS") is the Fund's transfer agent. ATIS and AFSG are 100% owned by AUSA Holding Company ("AUSA"). ATFA is a directly owned subsidiary of Western Reserve Life Assurance Co. of Ohio (78%) ("WRL") and AUSA (22%). ATFS is a wholly owned subsidiary of WRL. AUSA and WRL are wholly owned indirect subsidiaries of AEGON NV, a Netherlands corporation.
Investment advisory fee: The Fund pays management fees to ATFA based on average daily net assets ("ANA") at the following breakpoints:
0.80% of the first $500 million of ANA
0.70% of ANA over $500 million
ATFA has contractually agreed to waive its advisory fee and will reimburse the Fund to the extent that operating expenses, excluding 12b-1 fees, exceed the following stated annual limit:
1.40% Expense Limit
Distribution and service fees: The Fund has a 12b-1 distribution plan under the 1940 Act pursuant to which an annual fee, based on average daily net assets, is paid to the distributor for various disbursements such as broker-dealer account servicing fees and other promotional expenses of the Fund. The Fund is authorized under the 12b-1 plan to pay fees on each class up to the following limits:
| Class A | | | 0.35 | % | |
| Class B | | | 1.00 | % | |
| Class C | | | 1.00 | % | |
| Class C2 | | | 1.00 | % | |
| Class M | | | 0.90 | % | |
Class C2 and Class M merged into Class C on June 15, 2004 and September 24, 2004, respectively.
In the case the Fund or a class of shares of the Fund is closed to new investors or investments, the Fund is authorized to pay 12b-1 fees for past sales and distribution efforts and present and past investor services.
Underwriter commissions relate to front-end sales charges imposed for Class A and M shares and contingent deferred sales charges from Classes B, C, M and certain A share redemptions. For the year ended October 31, 2004, the underwriter commissions were as follows:
| Received by Underwriter | | $ | 199 | | |
| Retained by Underwriter | | | 7 | | |
| Contingent Deferred Sales Charge | | | 116 | | |
Administrative services: The Fund has entered into an agreement with ATFS for financial and legal fund administration services, which includes such items as compliance, expenses, financial statements and other reporting, distributions, tax returns, prospectus preparation, board of trustees meeting support and other legal matters. The Fund pays ATFS an annual fee of 0.015% of average net assets. The Legal fees on the Statement of Operations are for fees paid to external legal counsel.
Transamerica IDEX Mutual Funds
Annual Report 2004
11
TA IDEX Jennison Growth
NOTES TO FINANCIAL STATEMENTS (continued)
At October 31, 2004
(all amounts in thousands)
NOTE 2.–(continued)
The Fund paid ATFS $17 for the year ended October 31, 2004.
Transfer agent fees: The Fund pays ATIS an annual per-account charge of $20 (not in thousands) for each open account and $1.63 (not in thousands) for each closed account. There is no new account charge. The transfer agent fees on the Statement of Operations are made up of fees paid to ATIS and costs associated with shareholder statements. The Fund paid ATIS $238 for the year ended October 31, 2004.
Deferred compensation plan: Each eligible Fund Trustee may elect participation in the Deferred Compensation Plan ("the Plan"). Under the Plan, such Trustees may defer payment of a percentage of their total fees earned as a Fund Trustee. These deferred amounts may be invested in any Transamerica IDEX Mutual Fund. At October 31, 2004, the value of invested plan amount was $4. Invested plan amounts and the total liability for deferred compensation to the Trustees under the Plan at October 31, 2004, are included in the accompanying Statement of Assets and Liabilities.
NOTE 3. INVESTMENT TRANSACTIONS
The cost of securities purchased and proceeds from securities sold (excluding short-term securities) for the year ended October 31, 2004, were as follows:
| Purchases of securities: | | | |
| Long-Term excluding U.S. Government | | $ | 142,252 | | |
| U.S. Government | | | – | | |
| Proceeds from maturities and sales of securities: | | | |
| Long-Term excluding U.S. Government | | | 115,480 | | |
| U.S. Government | | | – | | |
NOTE 4. FEDERAL INCOME TAX MATTERS
The Fund has not made any provision for federal income or excise taxes due to its policy to distribute all of its taxable income and capital gains to its shareholders and otherwise qualify as a regulated investment company under the Internal Revenue Code. Income and capital gain distributions are determined in accordance with income tax regulations, which may differ from GAAP. These differences are primarily due to differing treatment for items including, but not limited to, wash sales, net operating losses and capital loss carryforwards.
Reclassifications between Undistributed net investment income (loss), Accumulated net realized capital gains (loss) and Shares of beneficial interest are made to reflect income and gains available for distribution under federal tax regulations. Results of operations and net assets are not effected by these reclassifications. These reclassifications are as follows:
Shares of beneficial interest, unlimited
shares authorized | | $ | (978 | ) | |
| Accumulated net investment income (loss) | | | 979 | | |
Accumulated net realized gain (loss) from investment
securities and foreign currency transactions | | | (1 | ) | |
The tax basis components of distributable earnings as of October 31, 2004, are as follows:
| Undistributed Ordinary Income | | $ | – | | |
| Undistributed Long-term Capital Gains | | $ | – | | |
| Capital Loss Carryforward | | $ | (1,911 | ) | |
| Net Unrealized Appreciation (Depreciation) | | $ | 3,232 | * | |
* Amount includes unrealized appreciation (depreciation) of deferred compensation.
The capital loss carryforwards are available to offset future realized capital gains through the periods listed:
Capital Loss
Carryforward | | Available through | |
| $ | 1,911 | | | October 31, 2011 | |
The capital loss carryforward utilized during the year ended October 31, 2004 was $11,943.
The aggregate cost of investments and composition of unrealized appreciation (depreciation) for federal income tax purposes as of October 31, 2004, are as follows:
| Federal Tax Cost Basis | | $ | 112,273 | | |
| Unrealized Appreciation | | $ | 7,720 | | |
| Unrealized (Depreciation) | | | (4,487 | ) | |
| Net Unrealized Appreciation (Depreciation) | | $ | 3,233 | | |
NOTE 5. OTHER MATTERS
Transamerica IDEX Mutual Funds ("TA IDEX"), and certain of its affiliated entities, have received requests for information from the Staff of the Securities and Exchange Commission in connection with market timing and late trading within the funds. TA IDEX and the affiliated entities have voluntarily cooperated in the investigation and have been providing the information as requested.
Transamerica IDEX Mutual Funds
Annual Report 2004
12
Report of Independent Registered Certified Public Accounting Firm
To the Board of Trustees and Shareholders of
TA IDEX Jennison Growth
In our opinion, the accompanying statement of assets and liabilities, including the schedule of investments, and the related statements of operations and of changes in net assets and the financial highlights present fairly, in all material respects, the financial position of TA IDEX Jennison Growth (the "Fund") (one of the portfolios constituting the Transamerica IDEX Mutual Funds) at October 31, 2004, the results of its operations for the year then ended, the changes in its net assets for each of the two years in the period then ended and the financial highlights for each of the periods indicated, in conformity with accounting principles generally accepted in the United States of America. These financial statements and financial highlights (hereafter referred to as "financial statements") are the responsibility of the Fund's management; our responsibility is to express an opinion on these financia l statements based on our audits. We conducted our audits of these financial statements in accordance with the standards of the Public Company Accounting Oversight Board (United States). Those standards require that we plan and perform the audit to obtain reasonable assurance about whether the financial statements are free of material misstatement. An audit includes examining, on a test basis, evidence supporting the amounts and disclosures in the financial statements, assessing the accounting principles used and significant estimates made by management, and evaluating the overall financial statement presentation. We believe that our audits, which included confirmation of securities at October 31, 2004 by correspondence with the custodian and brokers, provide a reasonable basis for our opinion.

PricewaterhouseCoopers LLP
Tampa, Florida
December 28, 2004
Transamerica IDEX Mutual Funds
Annual Report 2004
13
TA IDEX Jennison Growth
SUPPLEMENTAL INFORMATION
RESULTS OF SHAREHOLDER PROXY (unaudited)
At a special meeting of Class M shareholders of each series of Transamerica IDEX (except TA IDEX Federated Tax Exempt and TA IDEX Protected Principal Stock), held on September 2, 2004, the results of the Proposal were as follows:
Proposal 1: Approval of a conversion of Class M shares into Class C shares of the Funds, which will result in bearing the distribution and service fees payable under the 12b-1 Plan of Distribution for the Class C shares of the Funds.
| For | | Against | | Abstentions/Broker Non-Votes | |
| | 82.65 | % | | | 9.41 | % | | | 7.94 | % | |
Transamerica IDEX Mutual Funds
Annual Report 2004
14
TA IDEX Marsico Growth
MARKET ENVIRONMENT
U.S. equity markets were able to produce solid absolute returns for the reporting period. The Standard and Poor's 500 Composite Stock Index ("S&P 500"), which is a proxy for the overall performance for U.S. large capitalization companies, had a total return of 9.41% for the twelve months ended October 31, 2004.
U.S. equities, in our view, overall were quite resilient in the face of significant obstacles such as: surging energy prices, uncertainty regarding the U.S. presidential election, a continued difficult situation in Iraq, and a variety of other serious geopolitical issues and concerns about terrorism. These events seemed to "trump" some significant positive developments on the economic front, including better-than-expected Gross Domestic Product ("GDP") growth, continued overall quiescent inflation, a generally good corporate profit environment, personal income growth, and strong housing markets.
There were a wide variety of contributors to the performance of the S&P 500 last year. Nine of the ten economic sectors (Global Industry Classification Standards Classifications ("GICS")) in the Index had a positive return. Interestingly, there was a significant shift in equity market leadership during the year as compared to prior periods. A reasonable summary "sound bite" for the year would be to say that it was a period in which many value-oriented areas of the U.S. equity market were the "places to be", while many growth-oriented sectors and industries in general were best avoided. Economic sectors such as energy, utilities, telecommunications services, and industrials were the strongest-performing areas within the S&P 500. The S&P 500 energy sector gained a remarkable 45%, while utilities (+24%), telecommunications services (21%), and industrials (+18%) also experienced significant gains. Meanwhile, two "traditional" growth sectors struggled somewhat last year. Health care, weighed down primarily by sub-par performance of pharmaceutical companies, eked out a modest gain of 2%. Information technology ("IT") was the sole sector to post a negative return (–1%) during the reporting period. That performance was influenced primarily by weakness in the semiconductor industry group, which had a decline of –25%.
PERFORMANCE
For the year ended October 31, 2004, TA IDEX Marisco Growth, Class A returned 2.01%. By comparison its benchmark, the S&P 500, returned 9.41%.
STRATEGY REVIEW
To a significant extent, the performance shortfall can be attributed to the manner in which we positioned the portfolio in terms of economic sector allocations. Throughout the year, the portfolio had minimal or no exposure to sectors such as energy, materials, utilities, and telecommunications services. As noted earlier in our commentary, these were among the strongest-performing sectors of the U.S. stock market. The relative (as compared to the S&P 500) lack of exposure to these areas, particularly energy, contributed materially to the portfolio's underperformance. With regard to energy, our decision to underweight this sector was explicitly related to our stock selection criteria. Among other factors, we like to emphasize companies that we believe are special – ones that, in our view, have durable, growing earnings, are not in businesses susceptible to major fluctuations (i.e., "boom/bu st" cycles), and whose business models are not overly capital-intensive. We also tend to favor companies and industries where there are significant barriers to entry for new participants, thereby creating an opportunity for a well-positioned company to establish significant and defensible market share. In general, these types of investment criteria tend to steer us away from making significant investments in the energy sector.
Our stock selection in the retailing industry was a second significant source of underperformance. In particular, Tiffany & Co. ("Tiffany") (–38%), Amazon.com, Inc. ("Amazon") (–14% prior to being sold), and Sears Roebuck and Co. ("Sears") (–17% prior to being sold) were among the portfolio's weakest-performing individual holdings during the reporting period. Tiffany was under pressure throughout much of the year, initially due to apparent concerns about the overall pace and magnitude of a U.S. economic recovery, which in general seemed to have a concomitant impact on other retailing companies, including Amazon and Sears, due to concerns about consumer spending, and later due to disappointing financial results in Japan.
We were "off the mark" somewhat with stock selection in the technology software and services industry. In particular, Electronic Arts Inc., a company specializing in providing software for video game systems, impacted performance as its stock price experienced a decline of –9% during the reporting period.
The other primary performance detractor during the year related to our decision to maintain, on average, an overweighted posture, as compared to the S&P 500, in the diversified financials industry. The performance of the portfolio's investments, which included companies such as SLM Corporation, Citigroup
Transamerica IDEX Mutual Funds
Annual Report 2004
1
TA IDEX Marsico Growth (continued)
Inc., The Goldman Sachs Group, Inc. and Merrill Lynch & Co., Inc., was positive in aggregate during the year and was competitive with the S&P industry group performance. However, this industry's performance lagged the market as a whole, which in turn created an opportunity cost for the portfolio. Financial services companies seemed to be "shackled", in some respects, by concerns over the potential for higher interest rates and the lack of clear-cut consensus regarding the overall magnitude of a U.S. economic recovery. We did not make major changes to the portfolio's financial services holdings during the year.
There were several bright spots in terms of last year's performance. The portfolio benefited materially from investments in the health care equipment and services industry, which included UnitedHealth Group Incorporated (+42%) and Zimmer Holdings, Inc. (+22%), a medical device company that specializes in hip and knee replacements. Genentech, Inc., a biotechnology company, was one of the portfolio's largest individual positions during the reporting period and gained 11%. Our technology hardware and equipment investments rose in aggregate by nearly 28%, led by wireless technology company QUALCOMM, Incorporated which had a gain of 77%. Another positive factor for performance stemmed from good performance in hotel/casino operator positions including Wynn Resorts Limited (+52%), and Mandalay Resort Group (+30% prior to being sold).
As of October 31, 2004 the portfolio was allocated towards sectors and industry groups that we believe offer potential for solid earnings growth. These included health care, primarily equipment and services companies as compared to pharmaceutical companies, consumer discretionary, financials, industrials, and IT. As of the close of the reporting period, the portfolio had little or no exposure to sectors such as telecommunications services, energy, materials, and utilities.
Thank you for being an investor in TA IDEX Marsico Growth.
Thomas F. Marsico
Fund Manager
Marsico Capital Management, LLC
Transamerica IDEX Mutual Funds
Annual Report 2004
2
TA IDEX Marsico Growth
Comparison of change in value of $10,000 investment in Class A shares and its comparative index.
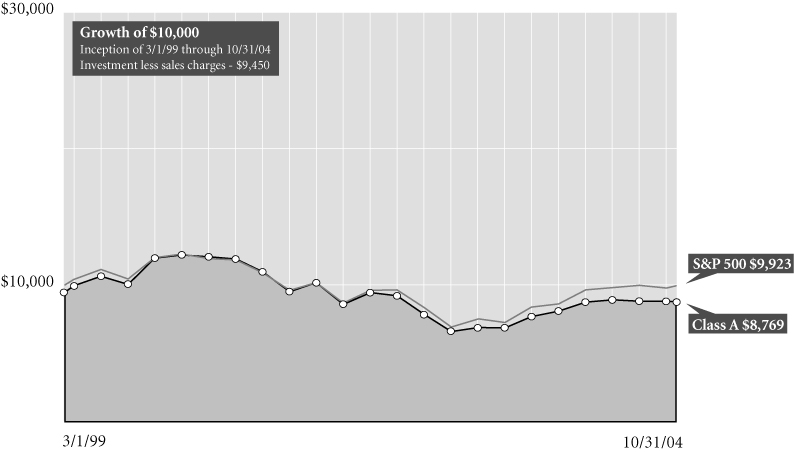
Average Annual Total Return for Periods Ended 10/31/04
| | | 1 year | | 5 years | | From
Inception | | Inception
Date | |
| Class A (NAV) | | | 2.01 | % | | | (4.03 | )% | | | (1.32 | )% | | 3/1/99 | |
| Class A (POP) | | | (3.60 | )% | | | (5.11 | )% | | | (2.30 | )% | | 3/1/99 | |
| S&P 5001 | | | 9.41 | % | | | (2.21 | )% | | | (0.14 | )% | | 3/1/99 | |
| Class B (NAV) | | | 1.38 | % | | | (4.70 | )% | | | (1.99 | )% | | 3/1/99 | |
| Class B (POP) | | | (3.62 | )% | | | (4.90 | )% | | | (1.99 | )% | | 3/1/99 | |
| Class C (NAV) | | | 1.27 | % | | | – | | | | 10.84 | % | | 11/11/02 | |
| Class C (POP) | | | 0.27 | % | | | – | | | | 10.84 | % | | 11/11/02 | |
NOTES
1 The Standard & Poor's 500 Composite Stock (S&P 500) Index is an unmanaged index used as a general measure of market performance. Calculations assume dividends and capital gains are reinvested and do not include any managerial expenses. From inception calculation is based on life of Class A shares. Source: Standard & Poor's Micropal®© Micropal, Inc. 2004 – 1-800-596-5323 – http://www.micropal.com.
The performance data presented represents past performance, future results may vary. Performance data does not reflect the deduction of taxes that would be paid on fund distributions or the redemption of fund shares. Investment return and principal value will fluctuate so that an investor's shares, when redeemed, may be worth more or less than their original cost. Current performance may be lower or higher than performance quoted.
Public Offering Price (POP) returns include the reinvestment of dividends and capital gains and reflect the maximum sales charge of 5.5% for A shares or the maximum applicable contingent deferred sales charge (5% in the 1st year, decreasing to 0% after 6 years) for Class B shares and 1% (during the first 12 months) for Class C shares. Shares purchased prior to March 1, 2004 are subject to a maximum applicable contingent deferred sales charge (5% in the 1st year, decreasing to 0% after 7 years) for Class B shares and (2% in the 1st year, decreasing to 0% after 2 years) for Class C shares. Net Asset Value (NAV) returns include the reinvestment of dividends and capital gains but do not reflect any sales charges.
This material must be preceded or accompanied by a current prospectus, which includes specific contents regarding the investment objectives and policies of this fund.
Transamerica IDEX Mutual Funds
Annual Report 2004
3
TA IDEX Marsico Growth
UNDERSTANDING YOUR FUND'S EXPENSES (unaudited)
SHAREHOLDER EXPENSES
The following Example is intended to help you understand your ongoing costs (in dollars and cents) of investing in a Fund and to compare these costs with the ongoing costs of investing in other funds.
The Example is based on an investment of $1,000 invested at the beginning of the period and held for the entire period from May 1, 2004 to October 31, 2004.
ACTUAL EXPENSES
The first line in the table below provides information about actual account values and actual expenses. You may use the information in this line, together with the amount you invested, to estimate the expenses that you paid over the period. Simply divide your account value by $1,000 (for example, an $8,600 account value divided by $1,000 = 8.6), then multiply the result by the number in the first line of your Fund under the heading entitled "Expenses Paid During Period" to estimate the expenses you paid on your account during this period.
HYPOTHETICAL EXAMPLE FOR COMPARISON PURPOSES
The second line in the table below provides information about hypothetical account values and hypothetical expenses based on each Fund's actual expense ratio and an assumed rate of return of 5% per year before expenses, which is not the Fund's actual return. The hypothetical account values and expenses may not be used to estimate the actual ending account balance or expenses you paid for the period. You may use this information to compare the ongoing costs of investing in your Fund and other funds. To do so, compare this 5% hypothetical example with the 5% hypothetical examples that appear in the shareholder reports of the other funds.
Please note that the expenses shown in the table are meant to highlight your ongoing costs only and do not reflect any transactional costs, such as sales charges, redemption fees, brokerage commissions paid on purchases and sales of fund shares. Therefore, the second line under each Fund in the table is useful in comparing ongoing costs only, and will not help you determine the relative total costs of owning different funds. In addition, note that the expenses shown in the table are meant to highlight your ongoing costs and do not reflect any transaction costs.
| | | Beginning
Account
Value | | Ending
Account
Value | | Annualized
Expense
Ratio | | Expenses Paid
During Period (a) | |
| Class A | |
| Actual | | $ | 1,000.00 | | | $ | 1,013.30 | | | | 1.49 | % | | $ | 7.54 | | |
| Hypothetical (b) | | | 1,000.00 | | | | 1,017.65 | | | | 1.49 | | | | 7.56 | | |
| Class B | |
| Actual | | | 1,000.00 | | | | 1,010.30 | | | | 2.06 | | | | 10.41 | | |
| Hypothetical (b) | | | 1,000.00 | | | | 1,014.78 | | | | 2.06 | | | | 10.43 | | |
| Class C | |
| Actual | | | 1,000.00 | | | | 1,009.20 | | | | 2.48 | | | | 12.53 | | |
| Hypothetical (b) | | | 1,000.00 | | | | 1,012.67 | | | | 2.48 | | | | 12.55 | | |
(a) Expenses are calculated using each Fund's annualized expense ratio (as disclosed in the table), multiplied by the average account value for the period, multiplied by number of days in the period (184 days), and divided by the number of days in the year (366 days).
(b) 5% return per year before expenses.
GRAPHIC PRESENTATION OF SCHEDULE OF INVESTMENTS
By Sector
At October 31, 2004
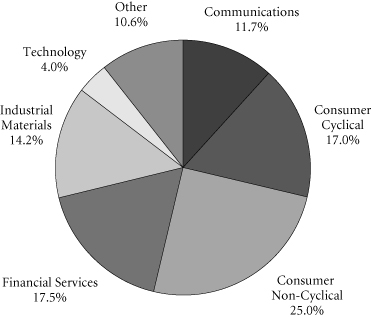
This chart shows the percentage breakdown by sector of the Fund's total investment securities.
Transamerica IDEX Mutual Funds
Annual Report 2004
4
TA IDEX Marsico Growth
SCHEDULE OF INVESTMENTS
At October 31, 2004
(all amounts except share amounts in thousands)
| | | Shares | | Value | |
| COMMON STOCKS (95.5%) | | | |
| Aerospace (1.4%) | | | |
| General Dynamics Corp. | | | 6,365 | | | $ | 650 | | |
| Lockheed Martin Corp. | | | 5,371 | | | | 296 | | |
| Air Transportation (3.5%) | | | |
| FedEx Corp. (a) | | | 25,565 | | | | 2,329 | | |
| Beverages (0.7%) | | | |
| PepsiCo, Inc. | | | 9,870 | | | | 489 | | |
| Business Services (3.7%) | | | |
| eBay, Inc. (b) | | | 22,171 | | | | 2,164 | | |
| Getty Images, Inc. (a)(b) | | | 4,742 | | | | 280 | | |
| Chemicals & Allied Products (3.5%) | | | |
| Monsanto Co. | | | 8,386 | | | | 359 | | |
| Procter & Gamble Co. | | | 38,750 | | | | 1,983 | | |
| Commercial Banks (4.8%) | | | |
| Citigroup, Inc. | | | 65,092 | | | | 2,888 | | |
| UCBH Holdings, Inc. | | | 6,577 | | | | 283 | | |
| Communications Equipment (6.6%) | | | |
| Motorola, Inc. | | | 19,299 | | | | 333 | | |
| QUALCOMM, Inc. | | | 96,520 | | | | 4,035 | | |
| Computer & Data Processing Services (4.0%) | | | |
| Electronic Arts, Inc. (a)(b) | | | 35,564 | | | | 1,598 | | |
| Microsoft Corp. | | | 12,834 | | | | 359 | | |
| Symantec Corp. (b) | | | 12,347 | | | | 703 | | |
| Computer & Office Equipment (1.3%) | | | |
| Dell, Inc. (b) | | | 24,203 | | | | 849 | | |
| Construction (0.9%) | | | |
| KB Home | | | 418 | | | | 34 | | |
| MDC Holdings, Inc. | | | 6,984 | | | | 536 | | |
| Drug Stores & Proprietary Stores (1.0%) | | | |
| CVS Corp. | | | 15,734 | | | | 684 | | |
| Electronic & Other Electric Equipment (5.0%) | | | |
| General Electric Co. | | | 96,314 | | | | 3,286 | | |
| Electronic Components & Accessories (2.2%) | | | |
| Tyco International, Ltd. (a) | | | 47,468 | | | | 1,479 | | |
| Furniture & Home Furnishings Stores (1.1%) | | | |
| Bed Bath & Beyond, Inc. (a)(b) | | | 17,555 | | | | 716 | | |
| Health Services (1.6%) | | | |
| Quest Diagnostics, Inc. | | | 11,660 | | | | 1,021 | | |
| Hotels & Other Lodging Places (0.7%) | | | |
| MGM Mirage, Inc. (a)(b) | | | 1,645 | | | | 88 | | |
| Wynn Resorts, Ltd. (a)(b) | | | 6,731 | | | | 391 | | |
| | | Shares | | Value | |
| Industrial Machinery & Equipment (3.0%) | | | |
| Caterpillar, Inc. | | | 25,030 | | | $ | 2,016 | | |
| Insurance (7.0%) | | | |
| UnitedHealth Group, Inc. | | | 64,168 | | | | 4,646 | | |
| Lumber & Other Building Materials (3.1%) | | | |
| Lowe's Cos., Inc. | | | 36,721 | | | | 2,067 | | |
| Medical Instruments & Supplies (9.1%) | | | |
| Boston Scientific Corp. (b) | | | 30,399 | | | | 1,073 | | |
| Medtronic, Inc. | | | 27,579 | | | | 1,410 | | |
| St. Jude Medical, Inc. (b) | | | 17,291 | | | | 1,324 | | |
| Wright Medical Group, Inc. (b) | | | 3,479 | | | | 90 | | |
| Zimmer Holdings, Inc. (b) | | | 27,489 | | | | 2,133 | | |
| Mortgage Bankers & Brokers (3.2%) | | | |
| Countrywide Financial Corp. | | | 66,962 | | | | 2,138 | | |
| Personal Credit Institutions (5.5%) | | | |
| SLM Corp. (a) | | | 79,949 | | | | 3,618 | | |
| Pharmaceuticals (4.8%) | | | |
| Genentech, Inc. (b) | | | 69,870 | | | | 3,181 | | |
| Residential Building Construction (1.6%) | | | |
| Lennar Corp.–Class A | | | 24,130 | | | | 1,085 | | |
| Restaurants (1.3%) | | | |
| Starbucks Corp. (b) | | | 12,662 | | | | 670 | | |
| Yum! Brands, Inc. | | | 4,178 | | | | 182 | | |
| Retail Trade (1.7%) | | | |
| Tiffany & Co. | | | 37,630 | | | | 1,104 | | |
| Rubber & Misc. Plastic Products (2.4%) | | | |
| Nike, Inc.–Class B | | | 19,601 | | | | 1,594 | | |
| Security & Commodity Brokers (5.2%) | | | |
| Chicago Mercantile Exchange (a) | | | 4,477 | | | | 787 | | |
| Goldman Sachs Group, Inc. | | | 12,250 | | | | 1,205 | | |
| Merrill Lynch & Co., Inc. | | | 27,343 | | | | 1,475 | | |
| Telecommunications (1.2%) | | | |
| Verizon Communications, Inc. | | | 19,892 | | | | 778 | | |
| Variety Stores (2.7%) | | | |
| Target Corp. | | | 13,450 | | | | 673 | | |
| Wal-Mart Stores, Inc. | | | 20,914 | | | | 1,128 | | |
| Water Transportation (1.7%) | | | |
| Royal Caribbean Cruises, Ltd. (a) | | | 24,543 | | | | 1,144 | | |
| Total Common Stocks (cost: $51,791) | | | | | | | 63,354 | | |
The notes to the financial statements are an integral part of this report.
Transamerica IDEX Mutual Funds
Annual Report 2004
5
TA IDEX Marsico Growth
SCHEDULE OF INVESTMENTS (continued)
At October 31, 2004
(all amounts except share amounts in thousands)
| | | Principal | | Value | |
| SECURITY LENDING COLLATERAL (11.4%) | | | |
| Debt (10.6%) | | | |
| Bank Notes (2.0%) | | | |
Bank of America
1.77%, due 12/03/2004 | | | $369 | | | | $369 | | |
| 1.88%, due 12/23/2004 | | | 123 | | | | 123 | | |
| 1.77%, due 01/18/2005 | | | 246 | | | | 246 | | |
Canadian Imperial Bank of Commerce
1.86%, due 11/04/2004 | | | 553 | | | | 553 | | |
Credit Suisse First Boston Corp.
1.83%, due 09/09/2005 | | | 62 | | | | 62 | | |
| Commercial Paper (1.1%) | | | |
Clipper Receivables Corp.
1.79%, due 11/12/2004 | | | 183 | | | | 183 | | |
Delaware Funding Corp. 144A
1.85%, due 11/19/2004 | | | 62 | | | | 62 | | |
Falcon Asset Securitization Corp. 144A
1.78%, due 11/04/2004 | | | 183 | | | | 183 | | |
| 1.75%, due 11/10/2004 | | | 246 | | | | 246 | | |
Galaxy Funding 144A
1.88%, due 11/22/2004 | | | 62 | | | | 62 | | |
| Euro Dollar Terms (5.0%) | | | |
Bank of Montreal
1.88%, due 11/24/2004 | | | 582 | | | | 582 | | |
BNP Paribas
1.77%, due 11/10/2004 | | | 307 | | | | 307 | | |
| 1.80%, due 11/23/2004 | | | 246 | | | | 246 | | |
| 1.98%, due 12/27/2004 | | | 246 | | | | 246 | | |
Calyon
1.70%, due 11/24/2004 | | | 33 | | | | 33 | | |
Citigroup
2.06%, due 01/25/2005 | | | 615 | | | | 615 | | |
Den Danske Bank
1.82%, due 11/19/2004 | | | 307 | | | | 307 | | |
| | | Principal | | Value | |
| Euro Dollar Terms (continued) | | | |
Dexia Group
2.04%, due 01/21/2005 | | | $143 | | | | $143 | | |
HBOS Halifax Bank of Scotland
2.03%, due 01/21/2005 | | | 123 | | | | 123 | | |
Royal Bank of Scotland
2.01%, due 01/20/2005 | | | 246 | | | | 246 | | |
Toronto Dominion Bank
1.70%, due 11/08/2004 | | | 123 | | | | 123 | | |
Wells Fargo
1.87%, due 11/22/2004 | | | 307 | | | | 307 | | |
| Promissory Notes (1.0%) | | | |
Goldman Sachs Group Inc.
1.90%, due 12/29/2004 | | | 258 | | | | 258 | | |
| 1.88%, due 01/27/2005 | | | 430 | | | | 430 | | |
| Repurchase Agreements (1.5%) | | | |
Merrill Lynch & Co., Inc.
1.92% Repurchase Agreement dated
10/29/2004 to be repurchased at $984
on 11/01/2004 (c) | | | 984 | | | | 984 | | |
| | | Shares | | Value | |
| Investment Companies (0.8%) | | | |
| Money Market Funds (0.8%) | | | |
Merrill Lynch Premier Institutional Fund
1-day yield of 1.71% | | | 302,458 | | | | $302 | | |
Merrimac Cash Fund, Premium Class
1-day yield of 1.46% | | | 221,336 | | | | 221 | | |
| Total Security Lending Collateral (cost: $7,562) | | | | | | | 7,562 | | |
| Total Investment Securities (cost: $59,353) | | | | | | $ | 70,916 | | |
| SUMMARY: | | | |
| Investments, at value | | | 106.9 | % | | $ | 70,916 | | |
| Liabilities in excess of other assets | | | (6.9 | )% | | | (4,559 | ) | |
| Net assets | | | 100.0 | % | | $ | 66,357 | | |
NOTES TO SCHEDULE OF INVESTMENTS:
(a) At October 31, 2004, all or a portion of this security is on loan (see Note 1). The value at October 31, 2004, of all securities on loan is $7,348.
(b) No dividends were paid during the preceding twelve months.
(c) Cash collateral for the Repurchase Agreements, valued at $1,007, that serve as collateral for securities lending are invested in corporate bonds with interest rates and maturity dates ranging from 0.00%–9.75% and 05/15/2005–9/15/2033, respectively.
DEFINITIONS:
144A 144A Securities are registered pursuant to rule 144A of the Securities Act of 1933. These securities are deemed to be liquid for purposes of compliance limitations on holdings of illiquid securities and may be resold as transactions exempt from registration normally to qualified institutional buyers. At October 31, 2004, these securities aggregated $553 or 0.8% of the net assets of the Fund.
The notes to the financial statements are an integral part of this report.
Transamerica IDEX Mutual Funds
Annual Report 2004
6
TA IDEX Marsico Growth
STATEMENT OF ASSETS AND LIABILITIES
At October 31, 2004
(all amounts except per share amounts in thousands)
| Assets: | | | |
Investment securities, at value (cost: $59,353)
(including securities loaned of $7,348) | | $ | 70,916 | | |
| Cash | | | 1,611 | | |
| Receivables: | |
| Investment securities sold | | | 2,513 | | |
| Shares of beneficial interest sold | | | 102 | | |
| Interest | | | 2 | | |
| Dividends | | | 67 | | |
| Other | | | 2 | | |
| | | | 75,213 | | |
| Liabilities: | | | |
| Investment securities purchased | | | 1,063 | | |
| Accounts payable and accrued liabilities: | |
| Shares of beneficial interest redeemed | | | 71 | | |
| Management and advisory fees | | | 46 | | |
| Distribution fees | | | 35 | | |
| Transfer agent fees | | | 20 | | |
| Payable for collateral for securities on loan | | | 7,562 | | |
| Other | | | 59 | | |
| | | | 8,856 | | |
| Net Assets | | $ | 66,357 | | |
| Net Assets Consist of: | | | |
Shares of beneficial interest, unlimited shares
authorized, no par value | | $ | 68,982 | | |
| Accumulated net investment income (loss) | | | (1 | ) | |
Accumulated net realized gain (loss) from investment
securities and foreign currency transactions | | | (14,187 | ) | |
Net unrealized appreciation (depreciation) on
investment securities | | | 11,563 | | |
| Net Assets | | $ | 66,357 | | |
| Net Assets by Class: | | | |
| Class A | | $ | 37,186 | | |
| Class B | | | 19,792 | | |
| Class C | | | 9,379 | | |
| Shares Outstanding: | | | |
| Class A | | | 4,062 | | |
| Class B | | | 2,249 | | |
| Class C | | | 1,068 | | |
| Net Asset Value Per Share: | | | |
| Class A | | $ | 9.15 | | |
| Class B | | | 8.80 | | |
| Class C | | | 8.78 | | |
| Maximum Offering Price Per Share (a): | | | |
| Class A | | $ | 9.68 | | |
(a) Includes the maximum selling commission (represented as a percentage of offering price) which is reduced on certain levels of sales as set forth in the Prospectus. Net asset value per share for Classes B and C shares represents offering price. The redemption price for Classes B and C shares equals net asset value less any applicable contingent deferred sales charge.
STATEMENT OF OPERATIONS
For the year ended October 31, 2004
(all amounts in thousands)
| Investment Income: | | | |
| Interest | | $ | 8 | | |
| Dividends | | | 612 | | |
| Income from loaned securities–net | | | 5 | | |
| Less withholding taxes on foreign dividends | | | (5 | ) | |
| | | | 620 | | |
| Expenses: | | | |
| Management and advisory fees | | | 524 | | |
| Transfer agent fees | |
| Class A | | | 68 | | |
| Class B | | | 41 | | |
| Class C | | | 7 | | |
| Class C2 | | | 3 | | |
| Class M | | | 7 | | |
| Printing and shareholder reports | | | 12 | | |
| Custody fees | | | 23 | | |
| Administration fees | | | 15 | | |
| Legal fees | | | 2 | | |
| Audit and accounting fees | | | 12 | | |
| Trustees fees | | | 4 | | |
| Registration fees | |
| Class A | | | 30 | | |
| Class B | | | 5 | | |
| Class C | | | 12 | | |
| Class C2 | | | 1 | | |
| Class M | | | 3 | | |
| Other | | | 4 | | |
| Distribution and service fees: | |
| Class A | | | 127 | | |
| Class B | | | 204 | | |
| Class C | | | 38 | | |
| Class C2 | | | 14 | | |
| Class M | | | 31 | | |
| Total expenses | | | 1,187 | | |
| Net Investment Income (Loss) | | | (567 | ) | |
| Net Realized Gain (Loss) from: | | | |
| Investment securities | | | 902 | | |
| Foreign currency transactions | | | (33 | ) | |
| | | | 869 | | |
Increase (decrease) in unrealized appreciation
(depreciation) on investment securities | | | 781 | | |
Net Gain (Loss) on Investments and Foreign
Currency Transactions | | | 1,650 | | |
Net Increase (Decrease) in Net Assets Resulting
from Operations | | $ | 1,083 | | |
The notes to the financial statements are an integral part of this report.
Transamerica IDEX Mutual Funds
Annual Report 2004
7
TA IDEX Marsico Growth
STATEMENTS OF CHANGES IN NET ASSETS
For the years ended
(all amounts in thousands)
| | | October 31,
2004 | | October 31,
2003 | |
| Increase (Decrease) in Net Assets From: | |
| Operations: | |
| Net investment income (loss) | | $ | (567 | ) | | $ | (600 | ) | |
Net realized gain (loss) from
investment securities and
foreign currency transactions | | | 869 | | | | (8,233 | ) | |
Net unrealized appreciation
(depreciation) on investment
securities | | | 781 | | | | 18,675 | | |
| | | | 1,083 | | | | 9,842 | | |
| Capital Share Transactions: | |
| Proceeds from shares sold: | |
| Class A | | | 5,879 | | | | 32,721 | | |
| Class B | | | 5,383 | | | | 7,333 | | |
| Class C | | | 3,088 | | | | 1,174 | | |
| Class C2 | | | 318 | | | | 990 | | |
| Class M | | | 464 | | | | 800 | | |
| | | | 15,132 | | | | 43,018 | | |
| Cost of shares redeemed: | |
| Class A | | | (3,608 | ) | | | (10,582 | ) | |
| Class B | | | (5,546 | ) | | | (4,304 | ) | |
| Class C | | | (531 | ) | | | (94 | ) | |
| Class C2 | | | (564 | ) | | | (1,326 | ) | |
| Class M | | | (911 | ) | | | (755 | ) | |
| | | | (11,160 | ) | | | (17,061 | ) | |
| Class level exchanges: | |
| Class C | | | 5,573 | | | | – | | |
| Class C2 | | | (2,070 | ) | | | – | | |
| Class M | | | (3,503 | ) | | | – | | |
| | | | – | | | | – | | |
| Automatic conversions: | |
| Class A | | | 17 | | | | – | | |
| Class B | | | (17 | ) | | | – | | |
| | | | – | | | | – | | |
| | | | 3,972 | | | | 25,957 | | |
| Net increase (decrease) in net assets | | | 5,055 | | | | 35,799 | | |
| Net Assets: | |
| Beginning of year | | | 61,302 | | | | 25,503 | | |
| End of year | | $ | 66,357 | | | $ | 61,302 | | |
Accumulated Net Investment Income
(Loss) | | $ | (1 | ) | | $ | (1 | ) | |
| | | October 31,
2004 | | October 31,
2003 | |
| Share Activity: | |
| Shares issued: | |
| Class A | | | 649 | | | | 4,395 | | |
| Class B | | | 615 | | | | 935 | | |
| Class C | | | 352 | | | | 153 | | |
| Class C2 | | | 36 | | | | 131 | | |
| Class M | | | 53 | | | | 103 | | |
| | | | 1,705 | | | | 5,717 | | |
| Shares redeemed: | |
| Class A | | | (399 | ) | | | (1,346 | ) | |
| Class B | | | (637 | ) | | | (582 | ) | |
| Class C | | | (61 | ) | | | (15 | ) | |
| Class C2 | | | (63 | ) | | | (180 | ) | |
| Class M | | | (104 | ) | | | (102 | ) | |
| | | | (1,264 | ) | | | (2,225 | ) | |
| Class level exchanges: | |
| Class C | | | 639 | | | | – | | |
| Class C2 | | | (237 | ) | | | – | | |
| Class M | | | (399 | ) | | | – | | |
| | | | 3 | | | | – | | |
| Automatic conversions: | |
| Class A | | | 2 | | | | – | | |
| Class B | | | (2 | ) | | | – | | |
| | | | – | | | | – | | |
Net increase (decrease) in shares
outstanding: | |
| Class A | | | 252 | | | | 3,049 | | |
| Class B | | | (24 | ) | | | 353 | | |
| Class C | | | 930 | | | | 138 | | |
| Class C2 | | | (264 | ) | | | (49 | ) | |
| Class M | | | (450 | ) | | | 1 | | |
| | | | 444 | | | | 3,492 | | |
The notes to the financial statements are an integral part of this report.
Transamerica IDEX Mutual Funds
Annual Report 2004
8
TA IDEX Marsico Growth
FINANCIAL HIGHLIGHTS
| | | | | For a share of beneficial interest outstanding throughout each period | |
| | | | | Net Asset | | Investment Operations | | Distributions | | Net Asset | |
| | | For the
Period
Ended (d)(g) | | Value,
Beginning
of Period | | Net
Investment
Income (Loss) | | Net Realized
and Unrealized
Gain (Loss) | | Total
Operations | | From Net
Investment
Income | | From Net
Realized
Gains | | Total
Distributions | | Value,
End
of Period | |
| Class A | | 10/31/2004 | | $ | 8.97 | | | $ | (0.05 | ) | | $ | 0.23 | | | $ | 0.18 | | | $ | – | | | $ | – | | | $ | – | | | $ | 9.15 | | |
| | | 10/31/2003 | | | 7.56 | | | | (0.08 | ) | | | 1.49 | | | | 1.41 | | | | – | | | | – | | | | – | | | | 8.97 | | |
| | | 10/31/2002 | | | 9.10 | | | | (0.06 | ) | | | (1.48 | ) | | | (1.54 | ) | | | – | | | | – | | | | – | | | | 7.56 | | |
| | | 10/31/2001 | | | 12.54 | | | | (0.05 | ) | | | (3.25 | ) | | | (3.30 | ) | | | – | | | | (0.14 | ) | | | (0.14 | ) | | | 9.10 | | |
| | | 10/31/2000 | | | 11.40 | | | | 0.02 | | | | 1.15 | | | | 1.17 | | | | – | | | | (0.03 | ) | | | (0.03 | ) | | | 12.54 | | |
| Class B | | 10/31/2004 | | | 8.68 | | | | (0.10 | ) | | | 0.22 | | | | 0.12 | | | | – | | | | – | | | | – | | | | 8.80 | | |
| | | 10/31/2003 | | | 7.36 | | | | (0.12 | ) | | | 1.44 | | | | 1.32 | | | | – | | | | – | | | | – | | | | 8.68 | | |
| | | 10/31/2002 | | | 8.92 | | | | (0.11 | ) | | | (1.45 | ) | | | (1.56 | ) | | | – | | | | – | | | | – | | | | 7.36 | | |
| | | 10/31/2001 | | | 12.41 | | | | (0.11 | ) | | | (3.24 | ) | | | (3.35 | ) | | | – | | | | (0.14 | ) | | | (0.14 | ) | | | 8.92 | | |
| | | 10/31/2000 | | | 11.35 | | | | (0.06 | ) | | | 1.15 | | | | 1.09 | | | | – | | | | (0.03 | ) | | | (0.03 | ) | | | 12.41 | | |
| Class C | | 10/31/2004 | | | 8.68 | | | | (0.12 | ) | | | 0.22 | | | | 0.10 | | | | – | | | | – | | | | – | | | | 8.78 | | |
| | | 10/31/2003 | | | 7.18 | | | | (0.12 | ) | | | 1.62 | | | | 1.50 | | | | – | | | | – | | | | – | | | | 8.68 | | |
| | | | | | | Ratios/Supplemental Data | |
| | | For the
Period | | Total | | Net Assets,
End of
Period | | Ratio of Expenses
to Average
Net Assets (a) | | Net Investment
Income (Loss)
to Average | | Portfolio
Turnover | |
| | | Ended (g) | | Return (c) | | (000's) | | Net (e) | | Total (f) | | Net Assets (a) | | Rate (b) | |
| Class A | | 10/31/2004 | | | 2.01 | % | | $ | 37,186 | | | | 1.52 | % | | | 1.52 | % | | | (0.58 | )% | | | 85 | % | |
| | | 10/31/2003 | | | 18.65 | | | | 34,167 | | | | 1.75 | | | | 1.80 | | | | (0.97 | ) | | | 129 | | |
| | | 10/31/2002 | | | (16.88 | ) | | | 5,752 | | | | 1.73 | | | | 2.05 | | | | (0.56 | ) | | | 34 | | |
| | | 10/31/2001 | | | (26.63 | ) | | | 7,361 | | | | 1.55 | | | | 2.03 | | | | (0.43 | ) | | | 15 | | |
| | | 10/31/2000 | | | 10.29 | | | | 6,587 | | | | 1.55 | | | | 2.53 | | | | (0.47 | ) | | | 25 | | |
| Class B | | 10/31/2004 | | | 1.38 | | | | 19,792 | | | | 2.13 | | | | 2.13 | | | | (1.19 | ) | | | 85 | | |
| | | 10/31/2003 | | | 17.93 | | | | 19,723 | | | | 2.40 | | | | 2.45 | | | | (1.62 | ) | | | 129 | | |
| | | 10/31/2002 | | | (17.52 | ) | | | 14,130 | | | | 2.38 | | | | 2.70 | | | | (1.21 | ) | | | 34 | | |
| | | 10/31/2001 | | | (27.25 | ) | | | 15,081 | | | | 2.20 | | | | 2.68 | | | | (1.08 | ) | | | 15 | | |
| | | 10/31/2000 | | | 9.54 | | | | 7,908 | | | | 2.20 | | | | 3.18 | | | | (1.12 | ) | | | 25 | | |
| Class C | | 10/31/2004 | | | 1.27 | | | | 9,379 | | | | 2.40 | | | | 2.40 | | | | (1.38 | ) | | | 85 | | |
| | | 10/31/2003 | | | 20.89 | | | | 1,200 | | | | 2.40 | | | | 2.46 | | | | (1.62 | ) | | | 129 | | |
| NOTES TO FINANCIAL HIGHLIGHTS | | | |
(a) Annualized.
(b) Not annualized for periods of less than one year.
(c) Total Return has been calculated for the applicable period without deduction of a sales load, if any, on an initial purchase. Periods of less than one year are not annualized.
(d) Per share information is calculated based on average number of shares outstanding for the years ended 10/31/2001, 10/31/2002, 10/31/2003 and 10/31/2004.
(e) Ratio of Net Expenses to Average Net Assets is net of fee waivers and reimbursements by the investment adviser, if any (see note 2).
(f) Ratio of Total Expenses to Average Net Assets includes all expenses before fee waivers and reimbursements by the investment adviser.
(g) TA IDEX Marsico Growth ("the Fund") commenced operations on March 1, 1999. The inception date for the Fund's offering of share Class L was November 11, 2002. Class L was renamed Class C on March 1, 2004. (See Note 1).
The notes to the financial statements are an integral part of this report.
Transamerica IDEX Mutual Funds
Annual Report 2004
9
TA IDEX Marsico Growth
NOTES TO FINANCIAL STATEMENTS
At October 31, 2004
(all amounts in thousands)
NOTE 1. ORGANIZATION AND SIGNIFICANT ACCOUNTING POLICIES
Transamerica IDEX Mutual Funds, formerly IDEX Mutual Funds, is a Massachusetts business trust registered under the Investment Company Act of 1940, as amended (the "1940 Act"), as an open-end management investment company. TA IDEX Marsico Growth ("the Fund"), part of Transamerica IDEX Mutual Funds, began operations on March 1, 1999.
On March 1, 2004, the Fund changed its name from IDEX Marsico Growth to TA IDEX Marsico Growth.
In the normal course of business, the Fund enters into contracts that contain a variety of representations and warranties, which provide general indemnifications. The Fund's maximum exposure under these arrangements is unknown, as this would involve future claims that may be made against the Fund and/or its affiliates that have not yet occurred. However, based on experience, the Fund expects the risk of loss to be remote.
See the Prospectus and Statement of Additional Information for a description of the Fund's investment objective.
In preparing the Fund's financial statements in accordance with accounting principles generally accepted in the United States of America ("GAAP"), estimates or assumptions (which could differ from actual results) may be used that affect reported amounts and disclosures. The following policies were consistently followed by the Fund, in accordance with GAAP.
Multiple class operations and expenses: The Fund currently offers three classes of shares, each with a public offering price that reflects different sales charges, if any, and expense levels. All shares designated as Class C shares prior to March 1, 2004, were renamed as Class C2 shares on that date. All shares designated as Class L shares prior to March 1, 2004, were renamed as Class C shares with different sales charges than the previous Class L shares. On June 15, 2004, Class C2 shares merged into Class C. On September 24, 2004, Class M shares merged into Class C. Class B shares will convert to Class A shares eight years after purchase. Income, non-class specific expenses and realized and unrealized gains and losses, are allocated daily to each class, based upon the value of shares outstanding method as permitted under Rule 18f-3 of the 1940 Act. Each class bears its own specific expenses as well as a portion of general, common expenses.
Pricing of shares: The Fund prices its shares on the basis of the net asset value of each class of shares of the Fund, which is determined as of the close of the New York Stock Exchange ("NYSE") (generally 4:00 p.m. Eastern Time) on each day on which the NYSE is open for trading (other than a day on which there are insufficient changes in the value of the Fund's portfolio securities to materially affect the Fund's net asset value or a day on which no shares are tendered for redemption and no order to purchase any shares is received).
Security valuations: Fund investments traded on an exchange are valued at the closing price on the day of valuation on the exchange where the security is principally traded. With respect to securities traded on NASDAQ NMS, such closing price may be the last reported sales price or the NASDAQ Official Closing Price.
Securities traded in the over-the-counter market and listed securities for which no sale was reported on that date are valued at the last quoted bid price.
Debt securities are valued by independent pricing services; however, those that mature in sixty days or less are valued at amortized cost, which approximates market.
Investment company securities are valued at net asset value of the underlying portfolio.
Foreign securities generally are valued based on quotations from the primary market in which they are traded and are translated from the local currency into U.S. dollars using closing exchange rates. Many foreign securities markets are open for trading at times when the U.S. markets are closed for trading, and many foreign securities markets close for trading before the close of the NYSE. The value of foreign securities may be affected significantly on a day that the NYSE is closed and an investor is unable to purchase or redeem shares. If a significant market event impacting the value of a portfolio security (e.g., natural disaster, company announcement, market volatility) occurs subsequent to the close of trading in the security, but prior to the calculation of the Fund's net asset value per share, market quotations for that security may be determined to be unreliable and, accordingly, not "readily av ailable." If market quotations are not readily available, and the impact of such a significant market event materially effects the net asset value per share of the Fund, an affected portfolio security will be valued at fair market value as determined in good faith using guidelines adopted by the Board of Trustees of the Fund, under the supervision of the Fund's Valuation Committee. Factors that may be considered to value foreign securities at fair market value may include, among others: the value of other securities traded on other markets, foreign currency exchange activity and the trading of financial products tied to foreign securities.
Other securities for which quotations are not readily available are valued at fair market value as determined in good faith using guidelines adopted by the Board of Trustees of the Fund, under the supervision of the Fund's Valuation Committee.
The Fund values its investment securities at fair value based upon procedures approved by the Board of Trustees on days when significant events occur after the close of the principal exchange on which the securities are traded, and as a result, are expected to materially effect the value of investments.
Transamerica IDEX Mutual Funds
Annual Report 2004
10
TA IDEX Marsico Growth
NOTES TO FINANCIAL STATEMENTS (continued)
At October 31, 2004
(all amounts in thousands)
NOTE 1.–(continued)
Cash: The Fund may leave cash overnight in its cash account with the custodian, Investors Bank & Trust Company ("IBT"). IBT has been contracted on behalf of the Fund to invest the excess cash into a savings account, which at October 31, 2004, was paying an interest rate of 1.30%.
Throughout the year, the Fund may have a cash overdraft balance. A fee is incurred on this overdraft, calculated by multiplying the overdraft by a rate based on the federal funds rate. This fee is included in Custody fees in the Statement of Operations.
Repurchase agreements: The Fund is authorized to enter into repurchase agreements. The Fund, through IBT, receives delivery of the underlying securities, the value of which at the time of purchase is required to be an amount equal to at least 100% of the resale price. Repurchase agreements involve the risk that the seller will fail to repurchase the security, as agreed. In that case, the Fund will bear the risk of value fluctuations until the security can be sold and may encounter delays and incur costs in liquidating the security. In the event of bankruptcy or insolvency of the seller, delays and costs may be incurred.
Commission recapture: The sub-adviser, to the extent consistent with the best execution and usual commission rate policies and practices, may place security transactions of the Fund with broker/dealers with which Transamerica IDEX Mutual Funds has established a Commission Recapture Program. A Commission Recapture Program is any arrangement under which a broker/dealer applies a portion of the commissions received by such broker/dealer on the security transactions to the Fund. In no event will commissions paid by the Fund be used to pay expenses that would otherwise be borne by any other funds within Transamerica IDEX Mutual Funds, or by any other party.
Recaptured commissions during the year ended October 31, 2004, of $21 are included in net realized gains in the Statement of Operations.
Securities lending: The Fund may lend securities to enhance fund earnings from investing cash collateral in making such loans to qualified borrowers (typically broker/dealers). The Fund has engaged its custodian bank, IBT, as a lending agent to administer its securities lending program. IBT earned $2 of program income for its services. When the Fund makes a security loan, it receives cash collateral as protection against the risk that the borrower will default on the loan, and records an asset for the cash invested collateral and a liability for the return of the collateral.
Securities on loan are included in Investment securities at value in the Statement of Assets and Liabilities and remain on the Schedule of Investments.
Loans of securities are required to be secured by collateral at least equal to 102% of the value of the securities at inception of the loan, and not less then 100% thereafter. The Fund may invest cash collateral in short-term money market instruments including: U.S. Treasury Bills, U.S. agency obligations, commercial paper, money market mutual funds, repurchase agreements and other highly rated, liquid investments. During the life of securities loans, the collateral and securities loaned remain subject to fluctuation in value. IBT marks to market securities loaned and the collateral each business day. If additional collateral is due (at least $1), IBT collects additional cash collateral from the borrowers. Although securities loaned will be fully collateralized at all times, IBT may experience delays in, or may be prevented from, recovering the collateral on behalf of the Fund. The Fund may recall a loa ned security position at any time from the borrower through IBT. In the event the borrower fails to timely return a recalled security, IBT may indemnify the Fund by purchasing replacement securities for the Fund at its own expense and claiming the collateral to fund such a purchase. IBT absorbs the loss if the collateral value is not sufficient to cover the cost of the replacement securities. If replacement securities are not available, IBT will credit the equivalent cash value to the Fund.
While a security is on loan, the Fund does not have the right to vote that security. However, if time permits, the Fund will attempt to recall a security on loan and vote the proxy.
Income from securities lending is included in the Statement of Operations. The amount of collateral and value of securities on loan are included in the Statement of Assets and Liabilities as well as in the Schedule of Investments.
Security transactions and investment income: Security transactions are recorded on the trade date. Security gains and losses are calculated on the specific identification basis. Dividend income is recorded on the ex-dividend date or, in the case of foreign securities, as soon as the Fund is informed of the ex-dividend date. Interest income, including accretion of discounts and amortization of premiums, is recorded on the accrual basis commencing on the settlement date.
Foreign currency denominated investments: The accounting records of the Fund are maintained in U.S. dollars. Securities and other assets and liabilities denominated in foreign currencies are translated into U.S. dollars at the closing exchange rate each day. The cost of foreign securities is translated at the exchange rate in effect when the investment was acquired. The Fund combines fluctuations from currency exchange rates and fluctuations in value when computing net realized and unrealized gains or losses from investments.
Net foreign currency gains and losses resulting from changes in exchange rates include: 1) foreign currency fluctuations between trade date and settlement date of investment security transactions; 2) gains and losses on forward foreign currency contracts; and 3) the difference between the receivable amounts of interest and dividends recorded in the accounting records in U.S. dollars and the amounts actually received.
Transamerica IDEX Mutual Funds
Annual Report 2004
11
TA IDEX Marsico Growth
NOTES TO FINANCIAL STATEMENTS (continued)
At October 31, 2004
(all amounts in thousands)
NOTE 1.–(continued)
Foreign currency denominated assets may involve risks not typically associated with domestic transactions, including unanticipated movements in exchange currency rates, the degree of government supervision and regulation of security markets, and the possibility of political or economic instability.
Foreign capital gains taxes: The Fund may be subject to taxes imposed by countries in which it invests, with respect to its investment in issuers existing or operating in such countries. Such taxes are generally based on income earned or repatriated and capital gains realized on the sale of such investments. The Fund accrues such taxes when the related income or capital gains are earned. Some countries require governm ental approval for the repatriation of investment income, capital or the proceeds of sales earned by foreign investors. In addition, if there is deterioration in a country's balance of payments or for other reasons, a country may impose temporary restrictions on foreign capital remittances abroad.
Forward foreign currency contracts: The Fund may enter into forward foreign currency contracts to hedge against exchange rate risk arising from investments in securities denominated in foreign currencies. Contracts are valued at the contractual forward rate and are marked to market daily, with the change in value recorded as an unrealized gain or loss. When the contracts are closed a realized gain or loss is incurred. Risks may arise from changes in market value of the underlying currencies and from the possible inability of counterparties to meet the terms of their contracts. There were no open forward foreign currency contracts at
October 31, 2004.
Account maintenance fees: If the shareholder account balance falls below $1 by either shareholder action or as a result of market action, a $25 (not in thousands) fee is assessed every year until the balance reaches $1. The fee is assessed by redeeming shares in the shareholder's account.
No fee will be charged under the following conditions:
• accounts opened within the preceding 24 months
• accounts with an active monthly Automatic Investment Plan ($50 (not in thousands) minimum per fund)
• accounts owned by an individual which, when combined by social security number, have a balance of $5 or more
• accounts owned by individuals in the same household (by address) that have a combined balance of $5 or more
• UTMA/UGMA accounts
• Fiduciary accounts
• B-share accounts whose shares have started to convert to A-shares accounts (as long as combined value of both accounts is at least $1)
For the year ended October 31, 2004, this fee totaled $1. These fees are included in Paid in Capital in the Statement of Assets and Liabilities.
Redemption fees: A short-term trading redemption fee may be assessed on any fund shares in a fund account that are sold during the first five (5) New York Stock Exchange trading days following their purchase date. This redemption fee will equal 2% of the amount redeemed and shares held the longest will be treated as being redeemed first and shares held the shortest as being redeemed last. For the year ended Octob er 31, 2004, the Fund received no redemption fees.
Dividend distributions: Distributions to shareholders are recorded on the ex-dividend date and are determined in accordance with Federal income tax regulations which may differ from GAAP.
NOTE 2. RELATED PARTY TRANSACTIONS
AEGON/Transamerica Fund Advisers, Inc. ("ATFA") is the Fund's investment adviser. AEGON/Transamerica Fund Services, Inc. ("ATFS") is the Fund's administrator. AFSG Securities Corp. ("AFSG") is the Fund's distributor/principal underwriter. AEGON/Transamerica Investor Services, Inc. ("ATIS") is the Fund's transfer agent. ATIS and AFSG are 100% owned by AUSA Holding Company ("AUSA"). ATFA is a directly owned subsidiary of Western Reserve Life Assurance Co. of Ohio (78%) ("WRL") and AUSA (22%). ATFS is a wholly owned subsidiary of WRL. AUSA and WRL are wholly owned indirect subsidiaries of AEGON NV, a Netherlands corporation.
The following schedule reflects the percentage of fund assets owned by affiliated mutual funds (i.e.: through the asset allocation funds):
| | | Net
Assets | | % of
Net Assets | |
TA IDEX Asset Allocation–
Moderate Growth Portfolio | | $ | 13,799 | | | | 21 | % | |
TA IDEX Asset Allocation–
Moderate Portfolio | | | 10,979 | | | | 17 | % | |
| Total | | $ | 24,778 | | | | 38 | % | |
Investment advisory fee: The Fund pays management fees to ATFA based on average daily net assets ("ANA") at the following breakpoints:
0.80% of the first $500 million of ANA
0.70% of ANA over $500 million
ATFA has contractually agreed to waive its advisory fee and will reimburse the Fund to the extent that operating expenses, excluding 12b-1 fees, exceed the following stated annual limit:
1.40% Expense Limit
Transamerica IDEX Mutual Funds
Annual Report 2004
12
TA IDEX Marsico Growth
NOTES TO FINANCIAL STATEMENTS (continued)
At October 31, 2004
(all amounts in thousands)
NOTE 2.–(continued)
If total fund expenses fall below the annual expense limitation agreement agreed to by the adviser within the succeeding three years, the Fund may be required to pay that adviser a portion or all of the waived advisory fees.
| | | Advisory Fee
Waived | | Available for
Recapture Through | |
| Fiscal Year 2003 | | $ | 27 | | | 10/31/2006 | |
Distribution and service fees: The Fund has a 12b-1 distribution plan under the 1940 Act pursuant to which an annual fee, based on average daily net assets, is paid to the distributor for various disbursements such as broker-dealer account servicing fees and other promotional expenses of the Fund. The Fund is authorized under the 12b-1 plan to pay fees on each class up to the following limits:
| Class A | | | 0.35 | % | |
| Class B | | | 1.00 | % | |
| Class C | | | 1.00 | % | |
| Class C2 | | | 1.00 | % | |
| Class M | | | 0.90 | % | |
Class C2 and Class M merged into Class C on June 15, 2004 and September 24, 2004, respectively.
In the case the Fund or a class of shares of the Fund is closed to new investors or investments, the Fund is authorized to pay 12b-1 fees for past sales and distribution efforts and present and past investor services.
Underwriter commissions relate to front-end sales charges imposed for Class A and M shares and contingent deferred sales charges from Classes B, C, M and certain A share redemptions. For the year ended October 31, 2004, the underwriter commissions were as follows:
| Received by Underwriter | | $ | 364 | | |
| Retained by Underwriter | | | 11 | | |
| Contingent Deferred Sales Charge | | | 63 | | |
Administrative services: The Fund has entered into an agreement with ATFS for financial and legal fund administration services, which includes such items as compliance, expenses, financial statements and other reporting, distributions, tax returns, prospectus preparation, board of trustees meeting support and other legal matters. The Fund pays ATFS an annual fee of 0.015% of average net assets. The Legal fees on the Statement of Operations are for fees paid to external legal counsel.
The Fund paid ATFS $15 for the year ended October 31, 2004.
Transfer agent fees: The Fund pays ATIS an annual per-account charge of $20 (not in thousands) for each open account and $1.63 (not in thousands) for each closed account. There is no new account charge.
The transfer agent fees on the Statement of Operations are made up of fees paid to ATIS and costs associated with shareholder statements. The Fund paid ATIS $126 for the year ended October 31, 2004.
Deferred compensation plan: Each eligible Fund Trustee may elect participation in the Deferred Compensation Plan ("the Plan"). Under the Plan, such Trustees may defer payment of a percentage of their total fees earned as a Fund Trustee. These deferred amounts may be invested in any Transamerica IDEX Mutual Fund. At October 31, 2004, the value of invested plan amount was $2. Invested plan amounts and the total liability for deferred compensation to the Trustees under the Plan at October 31, 2004, are included in the accompanying Statement of Assets and Liabilities.
NOTE 3. INVESTMENT TRANSACTIONS
The cost of securities purchased and proceeds from securities sold (excluding short-term securities) for the year ended October 31, 2004, were as follows:
| Purchases of securities: | | | |
| Long-Term excluding U.S. Government | | $ | 56,075 | | |
| U.S. Government | | | – | | |
| Proceeds from maturities and sales of securities | | | |
| Long-Term excluding U.S. Government | | | 53,494 | | |
| U.S. Government | | | – | | |
NOTE 4. FEDERAL INCOME TAX MATTERS
The Fund has not made any provision for federal income or excise taxes due to its policy to distribute all of its taxable income and capital gains to its shareholders and otherwise qualify as a regulated investment company under the Internal Revenue Code. Income and capital gain distributions are determined in accordance with income tax regulations, which may differ from GAAP. These differences are primarily due to differing treatment for items including, but not limited to, wash sales, net operating losses and capital loss carryforwards.
Reclassifications between Undistributed net investment income (loss), Accumulated net realized capital gains (loss) and Shares of beneficial interest are made to reflect income and gains available for distribution under federal tax regulations. Results of operations and net assets are not effected by these reclassifications. These reclassifications are as follows:
Shares of beneficial interest, unlimited
shares authorized | | $ | (627 | ) | |
| Accumulated net investment income (loss) | | | 567 | | |
Accumulated net realized gain (loss) from investment
securities and foreign currency transactions | | | 60 | | |
The capital loss carryforwards are available to offset future realized capital gains through the periods listed:
Capital Loss
Carryforward | | Available through | |
| $ | 974 | | | October 31, 2009 | |
| | 4,581 | | | October 31, 2010 | |
| | 8,550 | | | October 31, 2011 | |
| $ | 14,105 | | | | |
Transamerica IDEX Mutual Funds
Annual Report 2004
13
TA IDEX Marsico Growth
NOTES TO FINANCIAL STATEMENTS (continued)
At October 31, 2004
(all amounts in thousands)
NOTE 4.–(continued)
The capital loss carryforward utilized during the year ended October 31, 2004 was $828.
The tax basis components of distributable earnings as of October 31, 2004, are as follows:
| Undistributed Ordinary Income | | $ | – | | |
| Undistributed Long-term Capital Gains | | $ | – | | |
| Capital Loss Carryforward | | $ | (14,105 | ) | |
| Net Unrealized Appreciation (Depreciation) | | $ | 11,482 | * | |
* Amount includes unrealized appreciation (depreciation) of
deferred compensation.
The aggregate cost of investments and composition of unrealized appreciation (depreciation) for federal income tax purposes as of October 31, 2004, are as follows:
| Federal Tax Cost Basis | | $ | 59,433 | | |
| Unrealized Appreciation | | $ | 11,483 | | |
| Unrealized (Depreciation) | | | – | | |
| Net Unrealized Appreciation (Depreciation) | | $ | 11,483 | | |
NOTE 5. OTHER MATTERS
Transamerica IDEX Mutual Funds ("TA IDEX"), and certain of its affiliated entities, have received requests for information from the Staff of the Securities and Exchange Commission in connection with market timing and late trading within the funds. TA IDEX and the affiliated entities have voluntarily cooperated in the investigation and have been providing the information as requested.
Transamerica IDEX Mutual Funds
Annual Report 2004
14
Report of Independent Registered Certified Public Accounting Firm
To the Board of Trustees and Shareholders of
TA IDEX Marsico Growth
In our opinion, the accompanying statement of assets and liabilities, including the schedule of investments, and the related statements of operations and of changes in net assets and the financial highlights present fairly, in all material respects, the financial position of TA IDEX Marsico Growth (the "Fund") (one of the portfolios constituting the Transamerica IDEX Mutual Funds) at October 31, 2004, the results of its operations for the year then ended, the changes in its net assets for each of the two years in the period then ended and the financial highlights for each of the periods indicated, in conformity with accounting principles generally accepted in the United States of America. These financial statements and financial highlights (hereafter referred to as "financial statements") are the responsibility of the Fund's management; our responsibility is to express an opinion on these fina ncial statements based on our audits. We conducted our audits of these financial statements in accordance with the standards of the Public Company Accounting Oversight Board (United States). Those standards require that we plan and perform the audit to obtain reasonable assurance about whether the financial statements are free of material misstatement. An audit includes examining, on a test basis, evidence supporting the amounts and disclosures in the financial statements, assessing the accounting principles used and significant estimates made by management, and evaluating the overall financial statement presentation. We believe that our audits, which included confirmation of securities at October 31, 2004 by correspondence with the custodian and brokers, provide a reasonable basis for our opinion.

PricewaterhouseCoopers LLP
Tampa, Florida
December 28, 2004
Transamerica IDEX Mutual Funds
Annual Report 2004
15
TA IDEX Marsico Growth
SUPPLEMENTAL INFORMATION
RESULTS OF SHAREHOLDER PROXY (Unaudited)
At a special meeting of Class M shareholders of each series of Transamerica IDEX (except TA IDEX Federated Tax Exempt and TA IDEX Protected Principal Stock) held on September 2, 2004, the results of the Proposal were as follows:
Proposal 1: Approval of a conversion of Class M shares into Class C shares of the Funds, which will result in bearing the distribution and service fees payable under the 12b-1 Plan of Distribution for the Class C shares of the Funds.
| For | | Against | | Abstentions/Broker Non-Votes | |
| | 88.91 | % | | | 7.58 | % | | | 3.51 | % | |
Transamerica IDEX Mutual Funds
Annual Report 2004
16
TA IDEX PIMCO Real Return TIPS
MARKET ENVIRONMENT
Most bonds posted positive returns in the last two months of 2003, capping a year in which fixed income assets gained ground despite volatile interest rates. Bonds continued to gain ground through the first quarter of 2004 as concerns about the durability of the U.S. economic recovery pushed low interest rates even lower. Lifted by the tailwind of falling rates, every fixed income sector was in positive territory for the quarter.
Market optimism was revived during the second quarter after a series of robust non-farm payroll growth releases suggested to investors that the economy indeed was on track. Short-term rates increased over 100 basis points during the quarter and fixed income markets sold off, giving back all the gains of the first quarter. By June, the expansion of the economy also seemed to be moving the rate of inflation higher. Signs of rising inflation fueled anxiety that the central bank may need to move aggressively to combat it. Real yields rose sharply during this period. Rates increased for shorter maturity Treasury-Inflation Protected Securities ("TIPS") as markets anticipated the beginning of a tightening cycle by the Federal Reserve Board ("Fed"). The Fed met market expectations with a 25 basis point rate hike at quarter end.
The third quarter witnessed a reversal in inflationary expectations. The breakeven yield for ten-year maturities narrowed as markets began to anticipate a slowing economy, fueled in part by $50 oil. Disappointing economic data, such as weaker consumer confidence, and perceptions that the Fed would be wary about raising rates too aggressively, pushed real yields lower. This continued into October, when real yields fell again.
PERFORMANCE
For the year ended October 31, 2004, TA IDEX PIMCO Real Return TIPS Class A returned 7.94%. By comparison its benchmark, the Lehman Brothers Global Real U.S. TIPS Index, returned 8.01%.
STRATEGY REVIEW
Pacific Investment Management Company's ("PIMCO") investment process is based upon a long-term approach, which utilizes both "top-down" and "bottom-up" strategies. Top-down strategies focus on duration, yield curve positioning, volatility and sector rotation while bottom-up strategies drive our security selection process and facilitate the identification and analysis of undervalued securities. As we believe that no single strategy should dominate returns, our total return strategy relies on multiple sources of value added in highly diversified portfolio.
A net short position in nominal bonds was positive for the period as yields rose. An overweight on shorter maturity TIPS was negative for performance as the real yield curve flattened. The portfolio's yield was enhanced by using a combination of TIPS buy-forward agreements and low duration, high quality conventional yield debt instruments. The relative steepness of the real yield curve made this an attractive option. An emphasis on non-U.S. inflation linked bonds was an additional positive for performance as real yields fell across the globe. An allocation to emerging market bonds was slightly positive for performance as spreads on emerging market debt narrowed during the period.
John B. Brynjolfsson
Fund Manager
Pacific Investment Management Company LLC
Transamerica IDEX Mutual Funds
Annual Report 2004
1
TA IDEX PIMCO Real Return TIPS
Comparison of change in value of $10,000 investment in Class A shares and its comparative index.

Average Annual Total Return for Periods Ended 10/31/04
| | | 1 year | | From
Inception | | Inception
Date | |
| Class A (NAV) | | | 7.94 | % | | | 6.00 | % | | 3/1/03 | |
| Class A (POP) | | | 2.82 | % | | | 2.95 | % | | 3/1/03 | |
| LBGR U.S. TIPS1 | | | 8.01 | % | | | 6.33 | % | | 3/1/03 | |
| Class B (NAV) | | | 7.51 | % | | | 5.51 | % | | 3/1/03 | |
| Class B (POP) | | | 2.51 | % | | | 3.18 | % | | 3/1/03 | |
| Class C (NAV) | | | 7.20 | % | | | 5.33 | % | | 3/1/03 | |
| Class C (POP) | | | 6.20 | % | | | 5.33 | % | | 3/1/03 | |
NOTES
1 The Lehman Brothers Global Real U.S. TIPS (LBGR U.S. TIPS) Index is an unmanaged index used as a general measure of market performance. Calculations assume dividends and capital gains are reinvested and do not include any managerial expenses. From inception calculation is based on life of Class A shares.
The performance data presented represents past performance, future results may vary. Performance data does not reflect the deduction of taxes that would be paid on fund distributions or the redemption of fund shares. Investment return and principal value will fluctuate so that an investor's shares, when redeemed, may be worth more or less than their original cost. Current performance may be lower or higher than performance quoted.
Public Offering Price (POP) returns include the reinvestment of dividends and capital gains and reflect the maximum sales charge of 4.75% for A shares or the maximum applicable contingent deferred sales charge (5% in the 1st year, decreasing to 0% after 6 years) for Class B shares and 1% (during the first 12 months) for Class C shares. Net Asset Value (NAV) returns include the reinvestment of dividends and capital gains but do not reflect any sales charges. Shares purchased prior to March 1, 2004 are subject to a maximum applicable contingent deferred sales charge (5% in the 1st year, decreasing to 0% after 7 years) for Class B shares and (2% in the 1st year, decreasing to 0% after 2 years) for Class C shares.
Investments in a "non-diversified" fund may be subject to specific risks such as susceptibility to single economic, political, or regulatory events, and may be subject to greater loss than investments in a diversified fund. In addition, this fund invests in derivatives that are subject to the additional risks of inaccurate market predictions, illiquid markets, adverse tax consequences, and leveraging.
This material must be preceded or accompanied by a current prospectus, which includes specific contents regarding the investment objectives and policies of this fund.
Transamerica IDEX Mutual Funds
Annual Report 2004
2
TA IDEX PIMCO Real Return TIPS
UNDERSTANDING YOUR FUND'S EXPENSES (unaudited)
SHAREHOLDER EXPENSES
The following Example is intended to help you understand your ongoing costs (in dollars and cents) of investing in a Fund and to compare these costs with the ongoing costs of investing in other funds.
The Example is based on an investment of $1,000 invested at the beginning of the period and held for the entire period from May 1, 2004 to October 31, 2004.
ACTUAL EXPENSES
The first line in the table below provides information about actual account values and actual expenses. You may use the information in this line, together with the amount you invested, to estimate the expenses that you paid over the period. Simply divide your account value by $1,000 (for example, an $8,600 account value divided by $1,000 = 8.6), then multiply the result by the number in the first line of your Fund under the heading entitled "Expenses Paid During Period" to estimate the expenses you paid on your account during this period.
HYPOTHETICAL EXAMPLE FOR COMPARISON PURPOSES
The second line in the table below provides information about hypothetical account values and hypothetical expenses based on each Fund's actual expense ratio and an assumed rate of return of 5% per year before expenses, which is not the Fund's actual return. The hypothetical account values and expenses may not be used to estimate the actual ending account balance or expenses you paid for the period. You may use this information to compare the ongoing costs of investing in your Fund and other funds. To do so, compare this 5% hypothetical example with the 5% hypothetical examples that appear in the shareholder reports of the other funds.
Please note that the expenses shown in the table are meant to highlight your ongoing costs only and do not reflect any transactional costs, such as sales charges, redemption fees, brokerage commissions paid on purchases and sales of fund shares. Therefore, the second line under each Fund in the table is useful in comparing ongoing costs only, and will not help you determine the relative total costs of owning different funds. In addition, note that the expenses shown in the table are meant to highlight your ongoing costs and do not reflect any transaction costs.
| | Beginning
Account
Value | | Ending
Account
Value | | Annualized
Expense
Ratio | |
Expenses Paid
During Period (a) | |
| Class A | |
| Actual | | $ | 1,000.00 | | | $ | 1,061.10 | | | | 1.15 | % | | $ | 5.96 | | |
| Hypothetical (b) | | | 1,000.00 | | | | 1,019.36 | | | | 1.15 | | | | 5.84 | | |
| Class B | |
| Actual | | | 1,000.00 | | | | 1,059.90 | | | | 1.31 | | | | 6.78 | | |
| Hypothetical (b) | | | 1,000.00 | | | | 1,018.75 | | | | 1.31 | | | | 6.65 | | |
| Class C | |
| Actual | | | 1,000.00 | | | | 1,056.90 | | | | 1.90 | | | | 9.82 | | |
| Hypothetical (b) | | | 1,000.00 | | | | 1,015.58 | | | | 1.90 | | | | 9.63 | | |
(a) Expenses are calculated using each Fund's annualized expense ratio (as disclosed in the table), multiplied by the average account value for the period, multiplied by number of days in the period (184 days), and divided by the number of days in the year (366 days).
(b) 5% return per year before expenses.
GRAPHIC PRESENTATION OF SCHEDULE OF INVESTMENTS
By Bond Type
At October 31, 2004
This chart shows the percentage breakdown by bond type of the Fund's total investment securities.
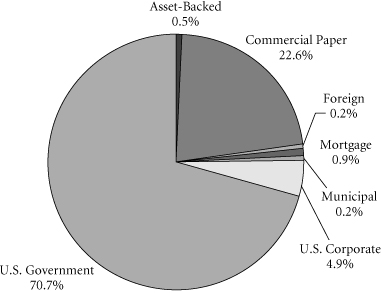
Transamerica IDEX Mutual Funds
Annual Report 2004
3
TA IDEX PIMCO Real Return TIPS
SCHEDULE OF INVESTMENTS
At October 31, 2004
(all amounts except share amounts in thousands)
| | | Principal | | Value | |
| U.S. GOVERNMENT OBLIGATIONS (106.9%) | |
U.S. Treasury Inflation Indexed Bond
3.38%, due 01/15/2007 | | | $29,900 | | | | $32,042 | | |
| 3.63%, due 01/15/2008 | | | 18,180 | | | | 20,054 | | |
| 3.88%, due 01/15/2009 | | | 49,452 | | | | 56,107 | | |
| 4.25%, due 01/15/2010 | | | 6,082 | | | | 7,129 | | |
| 3.50%, due 01/15/2011 | | | 12,847 | | | | 14,697 | | |
| 3.38%, due 01/15/2012 | | | 1,979 | | | | 2,266 | | |
| 3.00%, due 07/15/2012 | | | 53,011 | | | | 59,347 | | |
| 1.88%, due 07/15/2013 | | | 20,119 | | | | 20,706 | | |
| 2.00%, due 01/15/2014 | | | 54,968 | | | | 56,980 | | |
| 2.38%, due 01/15/2025 | | | 6,132 | | | | 6,415 | | |
| 3.63%, due 04/15/2028 | | | 8,552 | | | | 10,882 | | |
| 3.88%, due 04/15/2029 | | | 50,187 | | | | 66,733 | | |
| 3.38%, due 04/15/2032 | | | 1,068 | | | | 1,359 | | |
U.S. Treasury Inflation Indexed Note
2.00%, due 07/15/2014 | | | 12,968 | | | | 13,416 | | |
Total U.S. Government Obligations
(cost: $366,120) | | | | | | | 368,133 | | |
FOREIGN GOVERNMENT
OBLIGATIONS (0.2%) | | | |
Republic of Brazil
8.00%, due 04/15/2014 | | | 557 | | | | 552 | | |
Total Foreign Government Obligations
(cost: $537) | | | | | | | 552 | | |
| MORTGAGE-BACKED SECURITIES (1.7%) | |
FNMA, Series 2003-63, Class FA
2.08%, due 08/25/2034 (a) | | | 2,129 | | | | 2,126 | | |
Ameriquest Mortgage Securities, Inc.,
Series 2003-1, Class AII
2.34%, due 02/25/2033 (a) | | | 272 | | | | 273 | | |
Bank of America Mortgage Securities,
Series 2004-1, Class 5A1
6.50%, due 09/25/2033 | | | 278 | | | | 286 | | |
GSAMP Trust, Series 2004-SEA2, Class A2A
2.22%, due 03/25/2034 (a) | | | 594 | | | | 594 | | |
Merrill Lynch Mortgage Investors, Inc.,
Series 2004-WMC2, Class A2B1
2.03%, due 12/25/2034 (a) | | | 263 | | | | 263 | | |
Residential Asset Mortgage Product, Inc.,
Series 2004-RS9, Class AII1
2.09%, due 09/25/2013 (a) | | | 2,063 | | | | 2,063 | | |
Truman Capital Mortgage Loan Trust,
Series 2004-1, Class A1, 144A
2.27%, due 01/25/2034 (a) | | | 222 | | | | 221 | | |
Wells Fargo Home Equity Trust,
Series 2004-2, Class AIII1
2.09%, due 09/25/2034 (a) | | | 197 | | | | 197 | | |
| Total Mortgage-Backed Securities (cost: $6,026) | | | | | | | 6,023 | | |
| | | Principal | | Value | |
| ASSET-BACKED SECURITIES (1.1%) | | | |
Mastr Asset Backed Securities Trust,
Series 2004-WMC1, Class A4
2.03%, due 02/25/2034 (a) | | $281 | | $281 | |
Small Business Administration,
Series 2004-P10, Class A
4.50%, due 02/10/2014 | | 1,176 | | 1,179 | |
Equity One ABS, Inc.,
Series 2004-1, Class AV2
2.23%, due 04/25/2034 (a) | | 977 | | 974 | |
Redwood Capital, Ltd.,
Series 2003-3, 144A
5.86%, due 01/09/2006 (a) | | 300 | | 303 | |
Redwood Capital, Ltd.,
Series 2003-4, 144A
4.31%, due 01/09/2006 (a) | | 300 | | 302 | |
Sequoia Mortgage Trust, Series 5, Class A
2.24%, due 10/19/2026 (a) | | 879 | | 878 | |
| Total Asset-Backed Securities (cost: $3,915) | | | | | 3,917 | | |
| CORPORATE DEBT SECURITIES (3.1%) | | | |
| Electric Services (0.0%) | |
Entergy Gulf States, Inc. 144A
2.81%, due 06/18/2007 (a) | | 200 | | 201 | |
| Insurance (0.1%) | | | |
Residential Reinsurance, Ltd. 144A
6.74%, due 06/08/2006 | | 300 | | 279 | |
| Mortgage Bankers & Brokers (0.6%) | | | |
Countrywide Home Loans, Inc., Series L
1.82%, due 02/23/2005 (a) | | 2,000 | | 1,999 | |
| Oil & Gas Extraction (0.7%) | | | |
Halliburton Co., 144A
2.86%, due 01/26/2007 (a) | | 2,400 | | 2,401 | |
| Personal Credit Institutions (0.4%) | | | |
General Motors Acceptance Corp.
2.60%, due 05/18/2006 (a) | | 1,500 | | 1,497 | |
| Primary Metal Industries (0.1%) | | | |
Alcan, Inc., 144A
2.10%, due 12/08/2004 (a) | | 300 | | 300 | |
| Revenue–Miscellaneous (0.2%) | | | |
New Hampshire Municipal Bond Bank
5.00%, due 08/15/2013 | | 500 | | 560 | |
| Revenue–Tobacco (0.2%) | | | |
Tobacco Settlement Financing Corp., RI
6.00%, due 06/01/2023 | | 600 | | 572 | |
| Telecommunications (0.8%) | | | |
Sprint Capital Corp.
7.90%, due 03/15/2005 | | 2,600 | | 2,651 | |
The notes to the financial statements are an integral part of this report.
Transamerica IDEX Mutual Funds
Annual Report 2004
4
TA IDEX PIMCO Real Return TIPS
SCHEDULE OF INVESTMENTS (continued)
At October 31, 2004
(all amounts except share amounts in thousands)
| | | Principal | | Value | |
| Telecommunications (continued) | |
Verizon Wireless Capital LLC 144A
1.81%, due 05/23/2005 (a) | | $300 | | $300 | |
| Total Corporate Debt Securities (cost: $10,727) | | | | | 10,760 | | |
SHORT-TERM U.S. GOVERNMENT
OBLIGATIONS (39.0%) | | | |
Fannie Mae
1.58%, due 11/01/2004
1.58%, due 11/03/2004
1.69%, due 11/08/2004
1.66%, due 11/24/2004
1.67%, due 11/24/2004
1.68%, due 11/24/2004
1.69%, due 11/24/2004
1.70%, due 12/01/2004
1.72%, due 12/01/2004
1.73%, due 12/01/2004
1.75%, due 12/08/2004
1.75%, due 12/08/2004
1.77%, due 12/08/2004
1.80%, due 12/15/2004 | | 6,400
2,200
3,400
1,900
3,400
6,800
2,000
900
3,400
3,400
9,300
3,400
3,400
6,800 | | 6,399
2,200
3,399
1,898
3,396
6,792
1,998
899
3,395
3,395
9,282
3,393
3,393
6,784 | |
Federal Home Loan Bank
1.58%, due 11/12/2004
1.75%, due 12/08/2004
1.96%, due 01/14/2005
1.97%, due 01/19/2005
1.99%, due 01/21/2005
2.00%, due 01/21/2005 | | 2,900
3,400
3,400
9,400
4,100
2,300 | | 2,898
3,394
3,386
9,358
4,081
2,289 | |
Freddie Mac
1.58%, due 11/02/2004
1.55%, due 11/12/2004
1.58%, due 11/22/2004
1.79%, due 12/14/2004
1.89%, due 12/27/2004
1.94%, due 01/04/2005
1.96%, due 01/11/2005
1.97%, due 01/11/2005
1.98%, due 01/18/2005
1.98%, due 01/25/2005
1.99%, due 01/25/2005 | | 2,000
3,300
3,300
6,800
3,400
3,400
300
5,900
800
2,000
3,400 | | 2,000
3,298
3,297
6,785
3,390
3,388
299
5,876
796
1,990
3,384 | |
U.S. Treasury Bill
1.47%, due 11/04/2004
1.63%, due 12/16/2004 (b) | | 16,600
1,110 | | 16,597
1,108 | |
Total Short-Term U.S. Government Obligations
(cost: $134,237) | | | | | 134,237 | | |
| | | Principal | | Value | |
| COMMERCIAL PAPER (47.3%) | |
| Commercial Banks (35.4%) | |
ABN AMRO Holding NV
1.94%, due 01/31/2005 | | $8,900 | | $8,855 | |
ANZ National International, Ltd. 144A
2.04%, due 01/27/2005
2.02%, due 02/02/2005 | | 1,000
9,300 | | 995
9,250 | |
Barclays U.S. Funding Corp.
1.75%, due 11/15/2004
1.80%, due 12/08/2004
1.99%, due 02/01/2005 | | 100
700
4,200 | | 100
699
4,178 | |
CBA (Delaware) Finance, Inc.
1.85%, due 12/20/2004 | | 9,300 | | 9,276 | |
Danske Corp.
1.65%, due 11/22/2004
1.79%, due 12/20/2004
1.85%, due 12/20/2004
1.85%, due 12/21/2004 | | 200
100
3,600
800 | | 200
100
3,591
798 | |
Dexia Delaware LLC
2.04%, due 01/25/2005 | | 7,100 | | 7,065 | |
DNB NOR Bank ASA
1.83%, due 12/15/2004
1.85%, due 12/27/2004 | | 6,200
600 | | 6,185
598 | |
Fortis Funding LLC 144A
1.93%, due 01/25/2005 | | 2,300 | | 2,289 | |
Governor & Co. (The)
of The Bank of Ireland
1.79%, due 12/08/2004
1.79%, due 12/09/2004 | | 9,300
900 | | 9,282
898 | |
HBOS Treasury Services
1.63%, due 11/02/2004
1.66%, due 11/19/2004
1.72%, due 11/26/2004
1.73%, due 12/01/2004
1.74%, due 12/03/2004
1.78%, due 12/07/2004
1.78%, due 12/08/2004
1.96%, due 01/25/2005 | | 5,100
300
400
100
100
300
100
200 | | 5,099
300
399
100
100
299
100
199 | |
ING (US) Funding LLC
1.79%, due 12/09/2004 | | 9,300 | | 9,282 | |
Nordea North America, Inc.
1.73%, due 11/29/2004
1.79%, due 12/08/2004 | | 9,300
900 | | 9,287
898 | |
Royal Bank of Scotland
1.69%, due 11/29/2004
1.84%, due 12/20/2004 | | 100
3,900 | | 100
3,890 | |
The notes to the financial statements are an integral part of this report.
Transamerica IDEX Mutual Funds
Annual Report 2004
5
TA IDEX PIMCO Real Return TIPS
SCHEDULE OF INVESTMENTS (continued)
At October 31, 2004
(all amounts except share amounts in thousands)
| | | Principal | | Value | |
| Commercial Banks (continued) | |
Svenska Handelsbanken, Inc.
1.63%, due 11/04/2004 | | | $1,300 | | | | $1,300 | | |
| 1.69%, due 11/22/2004 | | | 100 | | | | 100 | | |
| 1.73%, due 12/02/2004 | | | 100 | | | | 100 | | |
| 1.79%, due 12/08/2004 | | | 7,800 | | | | 7,785 | | |
| 1.80%, due 12/15/2004 | | | 100 | | | | 100 | | |
Swedbank
1.79%, due 12/07/2004
1.80%, due 12/20/2004 | | | 3,700
4,700 | | | | 3,693
4,688 | | |
Westpac Capital Corp.
1.67%, due 11/23/2004
1.69%, due 11/26/2004 | | | 5,900
3,800 | | | | 5,893
3,795 | | |
| Holding & Other Investment Offices (4.9%) | |
ASB Bank, Ltd. 144A
1.85%, due 12/15/2004 | | | 900 | | | | 898 | | |
Rabobank USA Finance Corp.
1.96%, due 01/28/2005 | | | 3,600 | | | | 3,582 | | |
Stadshypotek Delaware 144A
1.86%, due 12/06/2004
1.82%, due 12/14/2004 | | | 800
1,400 | | | | 798
1,397 | | |
UBS Finance Delaware LLC
1.67%, due 11/23/2004
1.69%, due 11/29/2004
1.74%, due 12/03/2004
1.77%, due 12/07/2004
1.79%, due 12/14/2004
1.84%, due 12/22/2004
1.94%, due 01/25/2005 | | | 3,200
600
200
3,400
2,500
300
100 | | | | 3,196
599
200
3,394
2,494
299
100 | | |
| Mortgage Bankers & Brokers (0.6%) | |
Spintab AB
1.62%, due 11/01/2004
1.62%, due 11/10/2004
1.96%, due 01/26/2005 | | | 100
1,700
100 | | | | 100
1,699
100 | | |
| Oil & Gas Extraction (0.6%) | |
Total Fina Elf Capital 144A
1.86%, due 12/13/2004 | | | 2,100 | | | | 2,095 | | |
| Personal Credit Institutions (2.9%) | |
General Electric Capital Corp.
1.58%, due 11/01/2004
1.60%, due 11/09/2004
1.72%, due 12/02/2004
1.80%, due 12/15/2004
2.04%, due 02/04/2005 | | | 400
900
600
4,100
4,100 | | | | 400
900
599
4,091
4,077 | | |
| Petroleum Refining (0.1%) | |
Shell Finance (UK) PLC
1.69%, due 11/24/2004 | | | 500 | | | | 499 | | |
| | | Principal | | Value | |
| Security & Commodity Brokers (2.8%) | | | |
CDC Commercial Paper, Inc. 144A
1.64%, due 11/17/2004
2.04%, due 02/16/2005 | | $300
9,300 | | | $300
9,243 | | |
| Total Commercial Paper (cost: $162,925) | | | | | 162,926 | | |
| CERTIFICATES OF DEPOSIT (6.9%) | | | |
Bank of America Corp.
1.62%, due 11/02/2004
2.00%, due 02/01/2005 | | 6,600
200 | | | 6,600
200 | | |
Citibank NA
1.64%, due 11/08/2004
1.75%, due 12/07/2004
1.81%, due 12/10/2004 | | 6,600
100
3,300 | | | 6,600
100
3,300 | | |
Wells Fargo Bank NA
1.90%, due 12/15/2004 | | 6,800 | | | 6,800 | | |
| Total Certificates of Deposit (cost: $23,600) | | | | | 23,600 | | |
| | | Contracts (d) | | Value | |
| PURCHASED OPTIONS (0.0%) | | | |
| Put Options (0.0%) | |
90 Day Eurodollar Futures
Put Strike $94.00
Expires 06/13/2005 | | 277,500 | | | $2 | | |
90 Day Eurodollar Futures
Put Strike $94.25
Expires 06/13/2005 | | 157,500 | | | 1 | | |
U.S. 10 Year Treasury Note Futures
Put Strike $88.00
Expires 02/18/2005 | | 69,000 | | | 6 | | |
| Put Swaptions (0.0%) | | | |
LIBOR Rate Swaption
Put Strike $83.00
Expires 11/30/2004 | | 45,000 | | | 7 | | |
| Total Purchased Options (cost: $10) | | | | | 16 | | |
| Total Investment Securities (cost: $708,097) | | | | $ | 710,164 | | |
| WRITTEN OPTIONS (0.0%) | | | |
| Covered Call Options (0.0%) | |
U.S. 10 Year Treasury Note Futures
Call Strike $114.00
Expires 11/26/2004 | | 50,000 | | | (28) | | |
| Put Options (0.0%) | | | |
U.S. 10 Year Treasury Note Futures
Put Strike $109.00
Expires 11/26/2004 | | 50,000 | | | (2) | | |
| Total Written Options (cost: $24) | | | | | (30 | ) | |
The notes to the financial statements are an integral part of this report.
Transamerica IDEX Mutual Funds
Annual Report 2004
6
TA IDEX PIMCO Real Return TIPS
SCHEDULE OF INVESTMENTS (continued)
At October 31, 2004
(all amounts except share amounts in thousands)
| | | Notional Amount | | Value | |
| WRITTEN SWAPTIONS (0.0%) | | | |
| Covered Call Swaptions (0.0%) | | | |
LIBOR Rate Swaption
Call Strike $4.00
Expires 11/02/2004 | | | 2,400 | | | | $0(d) | | |
LIBOR Rate Swaption
Call Strike $7.00
Expires 11/02/2004 | | | 2,400 | | | | 0(d) | | |
| Total Written Swaptions (cost: $41) | | | | | | | 0 | | |
| SUMMARY: | | | |
| Investments, at value | | | 206.2 | % | | $ | 710,164 | | |
| Written swaptions | | | 0.0 | % | | | 0 | | |
| Written options | | | 0.0 | % | | | (30 | ) | |
| Liabilities in excess of other assets | | | (106.2 | )% | | | (365,755 | ) | |
| Net assets | | | 100.0 | % | | $ | 344,379 | | |
| SWAP AGREEMENTS: | | | |
| | | Expiration
Date | | Notional
Amount | | Net Unrealized
Appreciation
(Depreciation) | |
Receive a fixed rate equal to 4.00%
and pay a floating rate based on
6-month EUIBOR
(Euro Interbank Offered Rate).
Counterparty: Barclays Bank PLC | | 06/17/2005 | | $ | 5,700 | | | $ | 190 | | |
Receive a fixed rate equal to 4.50%
and pay a floating rate based on
6-month EUIBOR
(Euro Interbank Offered Rate).
Counterparty: Barclays PLC | | 06/17/2005 | | | 900 | | | | 14 | | |
Receive a floating rate based on
3-month United States Dollar-
LIBOR (London Interbank
Offered Rate) and pay a fixed
rate equal to 5.00%.
Counterparty: Bank of America, N.A. | | 12/15/2004 | | | 10,000 | | | | (691 | ) | |
Receive a floating rate based on
3-month United States Dollar-
LIBOR (London Interbank
Offered Rate) and pay a fixed
rate equal to 5.00%.
Counterparty: Goldman Sachs
Capital Markets, LP | | 12/15/2004 | | | 10,100 | | | | (454 | ) | |
| | | Expiration
Date | | Notional
Amount | | Net Unrealized
Appreciation
(Depreciation) | |
Receive a floating rate based on
3-month United States Dollar-
LIBOR (London Interbank
Offered Rate) and pay a fixed
rate equal to 5.00%.
Counterparty: JP Morgan | | 12/15/2004 | | $ | 5,500 | | | $ | (314 | ) | |
Receive a floating rate based on
3-month United States Dollar-
LIBOR (London Interbank
Offered Rate) and pay a fixed
rate equal to 5.00%.
Counterparty: Morgan Stanley | | 12/15/2004 | | | 8,600 | | | | (192 | ) | |
Receive a floating rate based on
3-month United States Dollar-
LIBOR (London Interbank
Offered Rate) and pay a fixed
rate equal to 6.00%.
Counterparty: Bank of America, N.A. | | 12/18/2013 | | | 7,000 | | | | (245 | ) | |
Receive a floating rate based on
3-month United States Dollar-
LIBOR (London Interbank
Offered Rate) and pay a fixed
rate equal to 6.00%.
Counterparty: UBS AG | | 12/18/2013 | | | 2,700 | | | | (68 | ) | |
Receive a fixed rate equal to 4.00%
and pay a floating rate based on
6-month EUIBOR
(Euro Interbank Offered Rate).
Counterparty: Citibank N.A. | | 06/17/2005 | | | 8,000 | | | | 235 | | |
Receive a floating rate based on
3-month United States Dollar-
LIBOR (London Interbank
Offered Rate) and pay a fixed
rate equal to 5.00%.
Counterparty: Lehman Brothers
Special Financing Inc. | | 12/15/2004 | | | 2,000 | | | | (38 | ) | |
Receive a floating rate based on
3-month United States Dollar-
LIBOR (London Interbank
Offered Rate) and pay a fixed
rate equal to 6.00%.
Counterparty: Goldman Sachs
Capital Markets, LP | | 12/18/2013 | | | 2,700 | | | | (94 | ) | |
Total Swap Agreements
(premium $474) | | | | $ | 63,200 | | | $ | (1,657 | ) | |
The notes to the financial statements are an integral part of this report.
Transamerica IDEX Mutual Funds
Annual Report 2004
7
TA IDEX PIMCO Real Return TIPS
SCHEDULE OF INVESTMENTS (continued)
At October 31, 2004
(all amounts except share amounts in thousands)
| FUTURES CONTRACTS: | |
| | | Contracts (c) | | Settlement
Date | | Amount | | Net Unrealized
Appreciation
(Depreciation) | |
| 10-Year U.S. Treasury Note | | | 69 | | | 12/31/2004 | | $ | 7,836 | | | $ | 82 | | |
| 90-Day Euro Dollar | | | 174 | | | 06/13/2005 | | | 42,323 | | | | 46 | | |
| Euro-BUND | | | 25 | | | 11/23/2004 | | | 0 | | | | 0 | | |
| Euro-BUND | | | 25 | | | 12/10/2004 | | | 2,924 | | | | 77 | | |
| | | | | | | | | $ | 53,083 | | | $ | 205 | | |
NOTES TO SCHEDULE OF INVESTMENTS:
(a) Floating or variable rate note. Rate is listed as of October 31, 2004.
(b) At October 31, 2004, all or a portion of this security is segregated with the custodian to cover margin requirements for open futures contracts. The value of all securities segregated at October 31, 2004 is $75.
(c) Contract amounts are not in thousands.
(d) Value is less than $1.
DEFINITIONS:
144A 144A Securities are registered pursuant to Rule 144A of the Securities Act of 1933. These securities are deemed to be liquid for purposes of compliance limitations on holdings of illiquid securities and may be resold as transactions exempt from registration normally to qualified institutional buyers. At October 31, 2004 these securities aggregated $31,572 or 9.2% of the net assets of the Fund.
The notes to the financial statements are an integral part of this report.
Transamerica IDEX Mutual Funds
Annual Report 2004
8
TA IDEX PIMCO Real Return TIPS
STATEMENT OF ASSETS AND LIABILITIES
At October 31, 2004
(all amounts except per share amounts in thousands)
| Assets: | | | |
| Investment securities, at value (cost: $708,097) | | $ | 710,164 | | |
| Cash | | | 1,435 | | |
| Foreign cash (cost: $136) | | | 140 | | |
| Receivables: | |
| Shares of beneficial interest sold | | | 165 | | |
| Interest | | | 3,220 | | |
| Variation margin | | | 36 | | |
| Swap agreements at value (premium $–57) | | | 382 | | |
| Other | | | 3 | | |
| | | | 715,545 | | |
| Liabilities: | | | |
| Investment securities purchased | | | 369,148 | | |
| Accounts payable and accrued liabilities: | |
| Shares of beneficial interest redeemed | | | 2 | | |
| Management and advisory fees | | | 204 | | |
| Distribution fees | | | 110 | | |
| Transfer agent fees | | | 3 | | |
| Written options and swaptions (premiums $65) | | | 30 | | |
| Swap agreements at value (premium $–531) | | | 1,565 | | |
| Other | | | 104 | | |
| | | | 371,166 | | |
| Net Assets | | $ | 344,379 | | |
| Net Assets Consist of: | | | |
Shares of beneficial interest, unlimited shares
authorized, no par value | | $ | 335,452 | | |
| Undistributed net investment income (loss) | | | 131 | | |
Undistributed net realized gain (loss)
from investment securities, futures
contracts, foreign currency transactions written options
and swaptions, and swaps | | | 8,142 | | |
Net unrealized appreciation (depreciation) on:
Investment securities | | | 2,067 | | |
| Futures contracts | | | 205 | | |
| Written option and swaption contracts | | | 35 | | |
| Swap agreements | | | (1,657 | ) | |
Translation of assets and liabilites denominated
in foreign currencies | | | 4 | | |
| Net Assets | | $ | 344,379 | | |
| Net Assets by Class: | | | |
| Class A | | $ | 330,282 | | |
| Class B | | | 7,496 | | |
| Class C | | | 6,601 | | |
| Shares Outstanding: | | | |
| Class A | | | 31,504 | | |
| Class B | | | 720 | | |
| Class C | | | 635 | | |
| Net Asset Value Per Share: | | | |
| Class A | | $ | 10.48 | | |
| Class B | | | 10.42 | | |
| Class C | | | 10.39 | | |
| Maximum Offering Price Per Share (a): | | | |
| Class A | | $ | 11.00 | | |
(a) Includes the maximum selling commission (represented as a percentage of offering price) which is reduced on certain levels of sales as set forth in the Prospectus. Net asset value per share for Classes B and C shares represents offering price. The redemption price for Classes B and C shares equals net asset value less any applicable contingent deferred sales charge.
STATEMENT OF OPERATIONS
For the year ended October 31, 2004
(all amounts in thousands)
| Investment Income: | | | |
| Interest | | $ | 3,255 | | |
| Expenses: | | | |
| Management and advisory fees | | | 1,699 | | |
| Transfer agent fees: | |
| Class A | | | 12 | | |
| Class B | | | 1 | | |
| Class C | | | – | | |
| Class C2 | | | – | | |
| Class M | | | – | | |
| Custody fees | | | 45 | | |
| Administration fees | | | 42 | | |
| Legal fees | | | 6 | | |
| Audit and accounting fees | | | 22 | | |
| Trustees fees | | | 11 | | |
| Registration fees: | |
| Class A | | | 82 | | |
| Class B | | | – | | |
| Class C | | | 5 | | |
| Class C2 | | | – | | |
| Class M | | | 1 | | |
| Other | | | 8 | | |
| Distribution and service fees: | |
| Class A | | | 810 | | |
| Class B | | | 55 | | |
| Class C | | | 50 | | |
| Class C2 | | | 2 | | |
| Class M | | | 4 | | |
| Total expenses | | | 2,855 | | |
| Net Investment Income (Loss) | | | 400 | | |
| Net Realized Gain (Loss) from: | | | |
| Investment securities | | | 15,684 | | |
| Futures contracts | | | 276 | | |
| Written option contracts | | | 70 | | |
| Swap agreements | | | 540 | | |
| Foreign currency transactions | | | 7 | | |
| | | | 16,577 | | |
| Net Increase (Decrease) in Unrealized Appreciation on: | | | |
| Investment securities | | | 2,018 | | |
| Futures contracts | | | 205 | | |
| Written option and swaptions contracts | | | 35 | | |
| Swap agreements | | | (1,657 | ) | |
Translation of assets and liabilities denominated
in foreign currencies | | | 4 | | |
| | | | 605 | | |
Net Gain (Loss) on Investments, Futures Contracts, Foreign
Currency Transactions, Written Options and Swaptions,
and Swaps | | | 17,182 | | |
Net Increase (Decrease) in Net Assets Resulting
from Operations | | $ | 17,582 | | |
The notes to the financial statements are an integral part of this report.
Transamerica IDEX Mutual Funds
Annual Report 2004
9
TA IDEX PIMCO Real Return TIPS
STATEMENTS OF CHANGES IN NET ASSETS
For the years ended
(all amounts in thousands)
| | | October 31,
2004 | | October 31,
2003 (a) | |
| Increase (Decrease) in Net Assets From: | | | |
| Operations: | | | |
| Net investment income (loss) | | $ | 400 | | | $ | 326 | | |
Net realized gain (loss) from investment
securities, futures contracts, foreign
currency transactions, written options
and swaptions, and swaps | | | 16,577 | | | | 825 | | |
Net unrealized appreciation
(depreciation) on investment
securities, futures contracts,
foreign currency transactions, written
options and swaptions and swaps | | | 605 | | | | 49 | | |
| | | | 17,582 | | | | 1,200 | | |
| Distributions to Shareholders: | | | |
| From net investment income: | |
| Class A | | | (392 | ) | | | (220 | ) | |
| Class B | | | (6 | ) | | | (13 | ) | |
| Class C | | | (6 | ) | | | (25 | ) | |
| Class C2 | | | – | | | | (3 | ) | |
| Class M | | | – | | | | (2 | ) | |
| | | | (404 | ) | | | (263 | ) | |
| From net realized gains: | |
| Class A | | | (8,780 | ) | | | – | | |
| Class B | | | (216 | ) | | | – | | |
| Class C | | | (183 | ) | | | – | | |
| Class C2 | | | (12 | ) | | | – | | |
| Class M | | | (20 | ) | | | – | | |
| | | | (9,211 | ) | | | – | | |
| Capital Share Transactions: | | | |
| Proceeds from shares sold: | |
| Class A | | | 281,364 | | | | 41,725 | | |
| Class B | | | 5,292 | | | | 3,347 | | |
| Class C | | | 4,790 | | | | 6,078 | | |
| Class C2 | | | 59 | | | | 457 | | |
| Class M | | | 345 | | | | 465 | | |
| | | | 291,850 | | | | 52,072 | | |
Dividends and distributions
reinvested: | |
| Class A | | | 9,143 | | | | 220 | | |
| Class B | | | 169 | | | | 11 | | |
| Class C | | | 123 | | | | 15 | | |
| Class C2 | | | 11 | | | | 3 | | |
| Class M | | | 20 | | | | 2 | | |
| | | | 9,466 | | | | 251 | | |
| Cost of shares redeemed: | |
| Class A | | | (4,390 | ) | | | (6,129 | ) | |
| Class B | | | (1,311 | ) | | | (223 | ) | |
| Class C | | | (2,691 | ) | | | (3,105 | ) | |
| Class C2 | | | (99 | ) | | | (126 | ) | |
| Class M | | | (59 | ) | | | (31 | ) | |
| | | | (8,550 | ) | | | (9,614 | ) | |
| | | October 31,
2004 | | October 31,
2003 (a) | |
| Class level exchanges: | |
| Class C | | $ | 1,062 | | | $ | – | | |
| Class C2 | | | (302 | ) | | | – | | |
| Class M | | | (760 | ) | | | – | | |
| | | | – | | | | – | | |
| | | | 292,766 | | | | 42,709 | | |
| Net increase (decrease) in net assets | | | 300,733 | | | | 43,646 | | |
| Net Assets: | | | |
| Beginning of period | | | 43,646 | | | | – | | |
| End of period | | $ | 344,379 | | | $ | 43,646 | | |
Undistributed Net Investment Income
(Loss) | | $ | 131 | | | $ | 86 | | |
| Share Activity: | | | |
| Shares issued: | |
| Class A | | | 27,408 | | | | 4,219 | | |
| Class B | | | 514 | | | | 338 | | |
| Class C | | | 470 | | | | 617 | | |
| Class C2 | | | 6 | | | | 46 | | |
| Class M | | | 35 | | | | 46 | | |
| | | | 28,433 | | | | 5,266 | | |
Shares issued–reinvested from
distributions: | |
| Class A | | | 908 | | | | 22 | | |
| Class B | | | 17 | | | | 1 | | |
| Class C | | | 12 | | | | 2 | | |
| Class C2 | | | 1 | | | | – | | |
| Class M | | | 2 | | | | – | | |
| | | | 940 | | | | 25 | | |
| Shares redeemed: | |
| Class A | | | (428 | ) | | | (625 | ) | |
| Class B | | | (128 | ) | | | (22 | ) | |
| Class C | | | (263 | ) | | | (307 | ) | |
| Class C2 | | | (10 | ) | | | (13 | ) | |
| Class M | | | (6 | ) | | | (3 | ) | |
| | | | (835 | ) | | | (970 | ) | |
| Class level exchanges: | |
| Class C | | | 104 | | | | – | | |
| Class C2 | | | (30 | ) | | | – | | |
| Class M | | | (74 | ) | | | – | | |
| | | | – | | | | – | | |
Net increase (decrease) in shares
outstanding: | |
| Class A | | | 27,888 | | | | 3,616 | | |
| Class B | | | 403 | | | | 317 | | |
| Class C | | | 323 | | | | 312 | | |
| Class C2 | | | (33 | ) | | | 33 | | |
| Class M | | | (43 | ) | | | 43 | | |
| | | | 28,538 | | | | 4,321 | | |
(a) Commenced operations on March 1, 2003.
The notes to the financial statements are an integral part of this report.
Transamerica IDEX Mutual Funds
Annual Report 2004
10
TA IDEX PIMCO Real Return TIPS
FINANCIAL HIGHLIGHTS
| | | | | For a share of beneficial interest outstanding throughout each period | |
| | | | | Net Asset | | Investment Operations | | Distributions | | Net Asset | |
| | | For the
Period
Ended (d)(g) | | Value,
Beginning
of Period | | Net
Investment
Income (Loss) | | Net Realized
and Unrealized
Gain (Loss) | | Total
Operations | | From Net
Investment
Income | | From Net
Realized
Gains | | Total
Distributions | | Value,
End
of Period | |
| Class A | | 10/31/2004 | | $ | 10.10 | | | $ | 0.02 | | | $ | 0.76 | | | $ | 0.78 | | | $ | (0.02 | ) | | $ | (0.38 | ) | | $ | (0.40 | ) | | $ | 10.48 | | |
| | | 10/31/2003 | | | 10.00 | | | | 0.14 | | | | 0.07 | | | | 0.21 | | | | (0.11 | ) | | | – | | | | (0.11 | ) | | | 10.10 | | |
| Class B | | 10/31/2004 | | | 10.08 | | | | (0.02 | ) | | | 0.75 | | | | 0.73 | | | | (0.01 | ) | | | (0.38 | ) | | | (0.39 | ) | | | 10.42 | | |
| | | 10/31/2003 | | | 10.00 | | | | 0.09 | | | | 0.08 | | | | 0.17 | | | | (0.09 | ) | | | – | | | | (0.09 | ) | | | 10.08 | | |
| Class C | | 10/31/2004 | | | 10.08 | | | | (0.06 | ) | | | 0.76 | | | | 0.70 | | | | (0.01 | ) | | | (0.38 | ) | | | (0.39 | ) | | | 10.39 | | |
| | | 10/31/2003 | | | 10.00 | | | | 0.09 | | | | 0.08 | | | | 0.17 | | | | (0.09 | ) | | | – | | | | (0.09 | ) | | | 10.08 | | |
| | | | | | | Ratios/Supplemental Data | |
| | | For the
Period | | Total | | Net Assets,
End of
Period | | Ratio of Expenses
to Average
Net Assets (a) | | Net Investment
Income (Loss)
to Average | | Portfolio
Turnover | |
| | | Ended (g) | | Return (c) | | (000's) | | Net (e) | | Total (f) | | Net Assets (a) | | Rate (b) | |
| Class A | | 10/31/2004 | | | 7.94 | % | | $ | 330,282 | | | | 1.15 | % | | | 1.15 | % | | | 0.20 | % | | | 1,438 | % | |
| | | 10/31/2003 | | | 2.09 | | | | 36,531 | | | | 1.65 | | | | 2.03 | | | | 2.07 | | | | 480 | | |
| Class B | | 10/31/2004 | | | 7.51 | | | | 7,496 | | | | 1.51 | | | | 1.51 | | | | (0.20 | ) | | | 1,438 | | |
| | | 10/31/2003 | | | 1.72 | | | | 3,194 | | | | 2.30 | | | | 2.68 | | | | 1.42 | | | | 480 | | |
| Class C | | 10/31/2004 | | | 7.20 | | | | 6,601 | | | | 1.87 | | | | 1.87 | | | | (0.52 | ) | | | 1,438 | | |
| | | 10/31/2003 | | | 1.72 | | | | 3,148 | | | | 2.30 | | | | 2.68 | | | | 1.42 | | | | 480 | | |
NOTES TO FINANCIAL HIGHLIGHTS
(a) Annualized.
(b) Not annualized for periods of less than one year.
(c) Total Return has been calculated for the applicable period without deduction of a sales load, if any, on an initial purchase. Periods of less than one year are not annualized.
(d) Per share information is calculated based on average number of shares outstanding,
(e) Ratio of Net Expenses to Average Net Assets is net of fee waivers and reimbursements by the investment adviser, if any (see note 2).
(f) Ratio of Total Expenses to Average Net Assets includes all expenses before fee waivers and reimbursements by the investment adviser.
(g) Commenced operations on March 1, 2003. Class L was renamed Class C on March 1, 2004. (See Note 1).
The notes to the financial statements are an integral part of this report.
Transamerica IDEX Mutual Funds
Annual Report 2004
11
TA IDEX PIMCO Real Return TIPS
NOTES TO FINANCIAL STATEMENTS
At October 31, 2004
(all amounts in thousands)
NOTE 1. ORGANIZATION AND SIGNIFICANT ACCOUNTING POLICIES
Transamerica IDEX Mutual Funds, formerly IDEX Mutual Funds, is a Massachusetts business trust registered under the Investment Company Act of 1940, as amended (the "1940 Act"), as an open-end management investment company. TA IDEX PIMCO Real Return TIPS ("the Fund"), part of Transamerica IDEX Mutual Funds, began operations on March 1, 2003. The Fund is "non-diversified" under the 1940 Act.
On March 1, 2004, the Fund changed its name from IDEX PIMCO Real Return TIPS to TA IDEX PIMCO Real Return TIPS.
In the normal course of business, the Fund enters into contracts that contain a variety of representations and warranties, which provide general indemnifications. The Fund's maximum exposure under these arrangements is unknown, as this would involve future claims that may be made against the Fund and/or its affiliates that have not yet occurred. However, based on experience, the Fund expects the risk of loss to be remote.
See the Prospectus and Statement of Additional Information for a description of the Fund's investment objective.
In preparing the Fund's financial statements in accordance with accounting principles generally accepted in the United States of America ("GAAP"), estimates or assumptions (which could differ from actual results) may be used that affect reported amounts and disclosures. The following policies were consistently followed by the Fund, in accordance with GAAP.
Multiple class operations and expenses: The Fund currently offers three classes of shares, each with a public offering price that reflects different sales charges, if any, and expense levels. All shares designated as Class C shares prior to March 1, 2004, were renamed as Class C2 shares on that date. All shares designated as Class L shares prior to March 1, 2004, were renamed as Class C shares with different sales charges than the previous Class L shares. On June 15, 2004, Class C2 shares merged into Class C. On September 24, 2004, Class M shares merged into Class C. Class B shares will convert to Class A shares eight years after purchase. Income, non-class specific expenses and realized and unrealized gains and losses, are allocated daily to each class, based upon the value of shares outstanding method as permitted under Rule 18f-3 of the 1940 Act. Each class bears its own specific expenses as well as a portion of general, common expenses.
Class I shares of the Transamerica IDEX Mutual Funds were offered for investment to the strategic asset allocation funds of AEGON/Transamerica Series Fund, Inc. (ATSF): ATSF Asset Allocation–Conservation Portfolio, ATSF Asset Allocation–Growth Portfolio,
ATSF Asset Allocation–Moderate Growth Portfolio and ATSF Asset Allocation–Moderate Portfolio on November 8, 2004.
Pricing of shares: The Fund prices its shares on the basis of the net asset value of each class of shares of the Fund, which is determined as of the close of the New York Stock Exchange ("NYSE") (generally 4:00 p.m. Eastern Time) on each day on which the NYSE is open for trading (other than a day on which there are insufficient changes in the value of the Fund's portfolio securities to materially affect the Fund's net asset value or a day on which no shares are tendered for redemption and no order to purchase any shares is received).
Security valuations: Fund investments traded on an exchange are valued at the closing price on the day of valuation on the exchange where the security is principally traded.
Securities traded in the over-the-counter market and listed securities for which no sale was reported on that date are valued at the last quoted bid price.
Debt securities are valued by independent pricing services; however, those that mature in sixty days or less are valued at amortized cost, which approximates market.
Foreign securities generally are valued based on quotations from the primary market in which they are traded and are translated from the local currency into U.S. dollars using closing exchange rates. Many foreign securities markets are open for trading at times when the U.S. markets are closed for trading, and many foreign securities markets close for trading before the close of the NYSE. The value of foreign securities may be affected significantly on a day that the NYSE is closed and an investor is unable to purchase or redeem shares. If a significant market event impacting the value of a portfolio security (e.g., natural disaster, company announcement, market volatility) occurs subsequent to the close of trading in the security, but prior to the calculation of the Fund's net asset value per share, market quotations for that security may be determined to be unreliable and, accordingly, not " readily available." If market quotations are not readily available, and the impact of such a significant market event materially effects the net asset value per share of the Fund, an affected portfolio security will be valued at fair market value as determined in good faith using guidelines adopted by the Board of Trustees of the Fund, under the supervision of the Fund's Valuation Committee. Factors that may be considered to value foreign securities at fair market value may include, among others: the value of other securities traded on other markets, foreign currency exchange activity and the trading of financial products tied to foreign securities.
Other securities for which quotations are not readily available are valued at fair market value as determined in good faith using guidelines adopted by the Board of Trustees of the Fund, under the supervision of the Fund's Valuation Committee.
The Fund values its investment securities at fair value based upon procedures approved by the Board of Trustees on days when significant
Transamerica IDEX Mutual Funds
Annual Report 2004
12
TA IDEX PIMCO Real Return TIPS
NOTES TO FINANCIAL STATEMENTS (continued)
At October 31, 2004
(all amounts in thousands)
NOTE 1.–(continued)
events occur after the close of the principal exchange on which the securities are traded, and as a result, are expected to materially effect the value of investments.
Cash: The Fund may leave cash overnight in its cash account with the custodian, Investors Bank & Trust Company ("IBT"). IBT has been contracted on behalf of the Fund to invest the excess cash into a savings account, which at October 31, 2004, was paying an interest rate of 1.30%.
Throughout the year, the Fund may have a cash overdraft balance. A fee is incurred on this overdraft, calculated by multiplying the overdraft by a rate based on the federal funds rate. This fee is included in Custody fees in the Statement of Operations.
Security transactions and investment income: Security transactions are recorded on the trade date. Security gains and losses are calculated on the specific identification basis. Interest income, including accretion of discounts and amortization of premiums, is recorded on the accrual basis commencing on the settlement date.
Foreign currency denominated investments: The accounting records of the Fund are maintained in U.S. dollars. Securities and other assets and liabilities denominated in foreign currencies are translated into U.S. dollars at the closing exchange rate each day. The cost of foreign securities is translated at the exchange rate in effect when the investment was acquired. The Fund combines fluctuations from currency exchange rates and fluctuations in value when computing net realized and unrealized gains or losses from investments.
Net foreign currency gains and losses resulting from changes in exchange rates include: 1) foreign currency fluctuations between trade date and settlement date of investment security transactions; 2) gains and losses on forward foreign currency contracts; and 3) the difference between the receivable amounts of interest and dividends recorded in the accounting records in U.S. dollars and the amounts actually received.
Foreign currency denominated assets may involve risks not typically associated with domestic transactions, including unanticipated movements in exchange currency rates, the degree of government supervision and regulation of security markets, and the possibility of political or economic instability.
Foreign capital gains taxes: The Fund may be subject to taxes imposed by countries in which it invests, with respect to its investment in issuers existing or operating in such countries. Such taxes are generally based on income earned or repatriated and capital gains realized on the sale of such investments. The Fund accrues such taxes when the related
income or capital gains are earned. Some countries require governmental approval for the repatriation of investment income, capital or the proceeds of sales earned by foreign investors. In addition, if there is deterioration in a country's balance of payments or for other reasons, a country may impose temporary restrictions on foreign capital remittances abroad.
Forward foreign currency contracts: The Fund may enter into forward foreign currency contracts to hedge against exchange rate risk arising from investments in securities denominated in foreign currencies. Contracts are valued at the contractual forward rate and are marked to market daily, with the change in value recorded as an unrealized gain or loss. When the contracts are closed a realized gain or loss is incurred. Risks may arise from changes in market value of the underlying currencies and from the possible inability of counterparties to meet the terms of their contracts.
There were no open forward currency contracts at October 31, 2004.
Swap agreements: The Fund may invest in swap agreements. A swap is an agreement to exchange the return generated by one instrument for the return generated by another instrument. The Fund may enter into interest rate and credit default swap agreements to manage its exposure to interest rates and credit risk. Interest rate swap agreements involve commitments to pay interest in exchange for a market-linked return, both based on notional amounts. To the extent the total return of the security or index underlying the transaction exceeds or falls short of the offsetting interest rate obligation, the Fund will receive a payment from or make a payment to the counterparty. In a credit default swap, one party makes a stream of payments to another party in exchange for the right to receive a specified return in the event of a default by a third party, typically corporate issues or sovereign issues of an emerging country, on its obligation. The Fund may use credit default swaps to provide a measure of protection against defaults of sovereign issuers (i.e., to reduce risk where the Fund owns or has exposure to the sovereign issuer) or to take an active long or short position with respect to the likelihood of a particular issuer's default.
Swaps are marked to market daily based upon quotations from market makers and vendors and the change in value, if any, is recorded as unrealized gain or loss in the Statement of Operations. Payments received or made at the beginning of the measurement period are reflected as such on the Statement of Assets and Liabilities. Net periodic payments or liquidation payments received or made at the termination of the swap are recorded as realized gain or loss in the Statement of Operations.
Entering into these agreements involves, to varying degrees, elements of credit, market and documentation risk in excess of the amounts recognized on the Statement of Assets and Liabilities. Such risks involve the possibility that there will be no liquid market for these agreements, that the counterparty to the agreements may default on its obligation to perform or disagree as to the meaning of contractual terms in the agreements, and that there may be unfavorable changes in interest rates.
Transamerica IDEX Mutual Funds
Annual Report 2004
13
TA IDEX PIMCO Real Return TIPS
NOTES TO FINANCIAL STATEMENTS (continued)
At October 31, 2004
(all amounts in thousands)
NOTE 1.–(continued)
Open swap agreements at October 31, 2004, are listed in the Schedule of Investments.
Futures, options and swaptions contracts: The Fund may enter into futures and/or options contracts to manage exposure to market, interest rate or currency fluctuations. Futures contracts are valued at the settlement price established each day by the board of trade or exchange on which they are traded. Option contracts are valued at the average of the bid and ask ("Mean Quote") established each day at the close of the board of trade or exchange on which they are traded. The primary risks associated with futures contracts and options are imperfect correlation between the change in value of the securities held and the prices of futures contracts and options; the possibility of an illiquid market and inability of the counterparty to meet the contract terms. When the Fund writes a covered call or put option , an amount equal to the premium received by the Fund is included in the Fund's Statement of Assets and Liabilities as an asset and as an equivalent liability. The amount of the liability is subsequently marked-to-market to reflect the current value of the option written.
The Fund is authorized to write swaption contracts to manage exposure to fluctuations in interest rates and to enhance fund yield. Swaption contracts written by the Fund represents an option that gives the purchaser the right, but not the obligation, to enter into a previously agreed upon swap contract on a future date. If a written call option is exercised, the writer will enter a swap and is obligated to pay the fixed rate and receive a fixed rate in exchange. Swaptions are marked-to-market daily based upon quotations from market makers.
When the Fund writes an option or swaption contract, the premium received is recorded as a liability and is subsequently adjusted to the current value of the swaption. Changes in the value of the option or swaption are reported as Unrealized gains or losses in written options and swaption contracts in the Statement of Assets and Liabilities. Gain or loss is recognized when the option or swaption contract expires or is closed. Premiums received from writing option or swaptions that expire or are exercised are treated by the Fund as realized gains from written options and swaption contracts. The difference between the premium and the amount paid on affecting a closing purchase transaction is also treated as a realized gain, or if the premium is less than the amount paid for the closing purchase, as a realized loss.
Entering into an option or swaption contract involves, to varying degrees, the elements of credit, market and interest rate risk in excess of the amounts reported in the Statement of Assets and Liabilities, associated with both option contracts and swap contracts. To reduce credit risk from potential counterparty default, the Fund enters into option or swaption contracts with counterparties whose creditworthiness has
been approved by the Board of Trustees. The Fund bears the market risk arising from any changes in index values or interest rates.
The underlying face amount of open futures, option, and swaption contracts at October 31, 2004, are listed in the Schedule of Investments. The variation margin receivable or payable, as applicable, is included in the accompanying Statement of Assets and Liabilities. Variation margin represents the additional payment due or excess deposits made in order to maintain the equity account at the required margin level.
Transactions in written options were as follows:
| | | Premium | | Contracts* | |
| Beginning Balance October 31, 2003 | | $ | – | | | | – | | |
| Sales | | | 24 | | | | 100 | | |
| Closing Buys | | | – | | | | – | | |
| Expirations | | | – | | | | – | | |
| Exercised | | | – | | | | – | | |
| Balance at October 31, 2004 | | $ | 24 | | | | 100 | | |
* Contracts not in thousands
Transactions in written swaptions were as follows:
| | | Premium | | Notional
Amount | |
| Beginning Balance October 31, 2003 | | $ | – | | | | – | | |
| Sales | | | 111 | | | | 12,600 | | |
| Closing Buys | | | – | | | | – | | |
| Expirations | | | (70 | ) | | | (7,800 | ) | |
| Exercised | | | – | | | | – | | |
| Balance at October 31, 2004 | | $ | 41 | | | | 4,800 | | |
Account maintenance fees: If the shareholder account balance falls below $1 by either shareholder action or as a result of market action, a $25 (not in thousands) fee is assessed every year until the balance reaches $1. The fee is assessed by redeeming shares in the shareholder's account.
No fee will be charged under the following conditions:
• accounts opened within the preceding 24 months
• accounts with an active monthly Automatic Investment Plan ($50 (not in thousands) minimum per fund)
• accounts owned by an individual which, when combined by social security number, have a balance of $5 or more
• accounts owned by individuals in the same household (by address) that have a combined balance of $5 or more
• UTMA/UGMA accounts
• Fiduciary accounts
Transamerica IDEX Mutual Funds
Annual Report 2004
14
TA IDEX PIMCO Real Return TIPS
NOTES TO FINANCIAL STATEMENTS (continued)
At October 31, 2004
(all amounts in thousands)
NOTE 1.–(continued)
• B-share accounts whose shares have started to convert to A-shares accounts (as long as combined value of both accounts is at least $1)
For the year ended October 31, 2004, there were no fees. These fees are included in Paid in Capital in the Statement of Assets and Liabilities.
Redemption fees: A short-term trading redemption fee may be assessed on any fund shares in a fund account that are sold during the first five (5) New York Stock Exchange trading days following their purchase date. This redemption fee will equal 2% of the amount redeemed and shares held the longest will be treated as being redeemed first and shares held the shortest as being redeemed last. For the year ended October 31, 2004, the Fund received no redemption fees.
Dividend distributions: Distributions to shareholders are recorded on the ex-dividend date and are determined in accordance with Federal income tax regulations which may differ from GAAP.
NOTE 2. RELATED PARTY TRANSACTIONS
AEGON/Transamerica Fund Advisers, Inc. ("ATFA") is the Fund's investment adviser. AEGON/Transamerica Fund Services, Inc. ("ATFS") is the Fund's administrator. AFSG Securities Corp. ("AFSG") is the Fund's distributor/principal underwriter. AEGON/Transamerica Investor Services, Inc. ("ATIS") is the Fund's transfer agent. ATIS and AFSG are 100% owned by AUSA Holding Company ("AUSA"). ATFA is a directly owned subsidiary of Western Reserve Life Assurance Co. of Ohio (78%) ("WRL") and AUSA (22%). ATFS is a wholly owned subsidiary of WRL. AUSA and WRL are wholly owned indirect subsidiaries of AEGON NV, a Netherlands corporation.
The following schedule represents the percentage of fund assets owned by affiliated mutual funds (i.e. through the asset allocation funds):
| | | Net
Assets | | % of
Net Assets | |
TA IDEX Asset Allocation–
Conservative Portfolio | | $ | 73,596 | | | | 21 | % | |
TA IDEX Asset Allocation–
Moderate Growth Portfolio | | | 97,597 | | | | 28 | % | |
TA IDEX Asset Allocation–
Moderate Portfolio | | | 154,372 | | | | 45 | % | |
| Total | | $ | 325,565 | | | | 94 | % | |
Investment advisory fees: The Fund pays management fees to ATFA based on average daily net assets ("ANA") at the following rate:
0.70% of ANA
ATFA has contractually agreed to waive its advisory fee and will reimburse the Fund to the extent that operating expenses, excluding 12b-1 fees, exceed the following stated annual limit:
1.30% Expense Limit
If total fund expenses fall below the annual expense limitation agreement agreed to by the adviser within the succeeding three years, the Fund may be required to pay that adviser a portion or all of the waived advisory fees.
There were no expenses waived, reimbursed or recaptured during the fiscal year ended October 31, 2004. There were no amounts subject to recapture at October 31, 2004.
Distribution and service fees: The Fund has a 12b-1 distribution plan under the 1940 Act pursuant to which an annual fee, based on average daily net assets, is paid to the distributor for various disbursements such as broker-dealer account servicing fees and other promotional expenses of the Fund. The Fund is authorized under the 12b-1 plan to pay fees on each class up to the following limits:
| Class A | | | 0.35 | % | |
| Class B | | | 1.00 | % | |
| Class C | | | 1.00 | % | |
| Class C2 | | | 1.00 | % | |
| Class M | | | 0.90 | % | |
Class C2 and Class M merged into Class C on June 15, 2004 and September 24, 2004, respectively.
In the case the Fund or a class of shares of the Fund is closed to new investors or investments, the Fund is authorized to pay 12b-1 fees for past sales and distribution efforts and present and past investor services.
Underwriter commissions relate to front-end sales charges imposed for Class A and M shares and contingent deferred sales charges from Classes B, C, M and certain A share redemptions. For the year ended October 31, 2004, the underwriter commissions were as follows:
| Received by Underwriter | | $ | 405 | | |
| Retained by Underwriter | | | 19 | | |
| Contingent Deferred Sales Charge | | | 26 | | |
Administrative services: The Fund has entered into an agreement with ATFS for financial and legal fund administration services, which includes such items as compliance, expenses, financial statements and other reporting, distributions, tax returns, prospectus preparation, board of
Transamerica IDEX Mutual Funds
Annual Report 2004
15
TA IDEX PIMCO Real Return TIPS
NOTES TO FINANCIAL STATEMENTS (continued)
At October 31, 2004
(all amounts in thousands)
NOTE 2.–(continued)
trustees meeting support and other legal matters. The Fund pays ATFS an annual fee of 0.015% of average net assets. The Legal fees on the Statement of Operations are for fees paid to external legal counsel.
The Fund paid ATFS $42 for the year ended October 31, 2004.
Transfer agent fees: The Fund pays ATIS an annual per-account charge of $20 (not in thousands) for each open account and $1.63 (not in thousands) for each closed account. There is no new account charge. The transfer agent fees on the Statement of Operations are made up of fees paid to ATIS and costs associated with shareholder statements. The Fund paid ATIS $13 for the year ended October 31, 2004.
Deferred compensation plan: Each eligible Fund Trustee may elect participation in the Deferred Compensation Plan ("the Plan"). Under the Plan, such Trustees may defer payment of a percentage of their total fees earned as a Fund Trustee. These deferred amounts may be invested in any Transamerica IDEX Mutual Fund. At October 31, 2004, the value of invested plan amount was less than $1. Invested plan amounts and the total liability for deferred compensation to the Trustees under the Plan at October 31, 2004, are included in the accompanying Statement of Assets and Liabilities.
NOTE 3. INVESTMENT TRANSACTIONS
The cost of securities purchased and proceeds from securities sold (excluding short-term securities) for the year ended October 31, 2004, were as follows:
| Purchases of securities: | | | |
| Long-Term excluding U.S. Government | | $ | 26,648 | | |
| U.S. Government | | | 4,015,709 | | |
| Proceeds from maturities and sales of securities: | | | |
| Long-Term excluding U.S. Government | | | 8,154 | | |
| U.S. Government | | | 3,711,945 | | |
NOTE 4. FEDERAL INCOME TAX MATTERS
The Fund has not made any provision for federal income or excise taxes due to its policy to distribute all of its taxable income and capital gains to its shareholders and otherwise qualify as a regulated investment company under the Internal Revenue Code. Income and capital gain distributions are determined in accordance with income tax regulations, which may differ from GAAP. These differences are primarily due to differing treatment for items including, but not limited to, wash sales and capital loss carryforwards.
Reclassifications between Undistributed net investment income (loss), Undistributed net realized capital gains (loss) and Shares of beneficial interest are made to reflect income and gains available for distribution under federal tax regulations. Results of operations and net assets are not effected by these reclassifications. These reclassifications are as follows:
| Shares of beneficial interest, unlimited shares authorized | | $ | _ | | |
| Undistributed net investment income (loss) | | | 49 | | |
Undistributed net realized gain (loss) from
investment securities, futures contracts and
foreign currency transactions | | | (49 | ) | |
The tax character of distributions paid may differ from the character of distributions shown in the Statements of Changes in Net Assets due to short-term gains being treated as ordinary income for tax purposes. The tax character of distributions paid during 2003 and 2004 was as follows:
2003 Distributions paid from:
| Ordinary Income | | $ | 3,293 | | |
| Long-term Capital Gain | | | 210 | | |
| 2004 Distributions paid from: | | | |
| Ordinary Income | | | 9,606 | | |
| Long-term Capital Gain | | | 9 | | |
The tax basis components of distributable earnings as of October 31, 2004, are as follows:
| Undistributed Ordinary Income | | $ | 9,387 | | |
| Undistributed Long-term Capital Gains | | $ | 233 | | |
| Capital Loss Carryforward | | $ | – | | |
| Net Unrealized Appreciation (Depreciation) | | $ | (692 | )* | |
* Amount includes unrealized gain/loss from derivative instruments.
The aggregate cost of investments and composition of unrealized appreciation (depreciation) for federal income tax purposes as of October 31, 2004, are as follows:
| Federal Tax Cost Basis | | $ | 709,282 | | |
| Unrealized Appreciation | | $ | 952 | | |
| Unrealized (Depreciation) | | | (70 | ) | |
| Net Unrealized Appreciation (Depreciation) | | $ | 882 | | |
NOTE 5. OTHER MATTERS
Transamerica IDEX Mutual Funds ("TA IDEX) and certain of its affiliated entries, have received requests for information from the Staff of the Securities and Exchange Commission in connection with market timing and late trading within the funds. TA IDEX and the affiliated entities have voluntarily cooperated in the investigation and have been providing the information as requested.
Transamerica IDEX Mutual Funds
Annual Report 2004
16
Report of Independent Registered Certified Public Accounting Firm
To the Board of Trustees and Shareholders of
TA IDEX PIMCO Real Return TIPS
In our opinion, the accompanying statement of assets and liabilities, including the schedule of investments, and the related statements of operations and of changes in net assets and the financial highlights present fairly, in all material respects, the financial position of TA IDEX PIMCO Real Return TIPS (the "Fund") (one of the portfolios constituting the Transamerica IDEX Mutual Funds) at October 31, 2004, the results of its operations for the year then ended, and the changes in its net assets and the financial highlights for the year ended and for the period March 1, 2003 (commencement of operations) through October 31, 2003, in conformity with accounting principles generally accepted in the United States of America. These financial statements and financial highlights (hereafter referred to as "financial statements") are the responsibility of the Fund's management; our responsibility is to expr ess an opinion on these financial statements based on our audits. We conducted our audits of these financial statements in accordance with the standards of the Public Company Accounting Oversight Board (United States). Those standards require that we plan and perform the audit to obtain reasonable assurance about whether the financial statements are free of material misstatement. An audit includes examining, on a test basis, evidence supporting the amounts and disclosures in the financial statements, assessing the accounting principles used and significant estimates made by management, and evaluating the overall financial statement presentation. We believe that our audits, which included confirmation of securities at October 31, 2004 by correspondence with the custodian and brokers, provide a reasonable basis for our opinion.

PricewaterhouseCoopers LLP
Tampa, Florida
December 28, 2004
Transamerica IDEX Mutual Funds
Annual Report 2004
17
TA IDEX PIMCO Real Return TIPS
SUPPLEMENTAL INFORMATION (unaudited)
TAX INFORMATION
For tax purposes, the Fund has made a Long-Term Capital Gain Designation of $9 for the year ended October 31, 2004.
The information and distributions reported herein may differ from the information and distributions taxable to the shareholders for the calendar year ending December 31, 2004. Complete information will be computed and reported in conjunction with your 2004 Form 1099-DIV.
RESULTS OF SHAREHOLDER PROXY
At a special meeting of Class M shareholders of each series of Transamerica IDEX (except TA IDEX Federated Tax Exempt and TA IDEX Protected Principal Stock), as listed above, held on September 2, 2004, the results of the Proposal were as follows:
Proposal 1: Approval of a conversion of Class M shares into Class C shares of the Funds, which will result in bearing the distribution and service fees payable under the 12b-1 Plan of Distribution for the Class C shares of the Funds.
| For | | Against | | Abstentions/Broker Non-Votes | |
| | 94.44 | % | | | 0.00 | % | | | 5.56 | % | |
Transamerica IDEX Mutual Funds
Annual Report 2004
18
TA IDEX PIMCO Total Return
MARKET ENVIRONMENT
Most bonds posted positive returns in the last two months of 2003, capping a year in which fixed income assets gained ground despite volatile interest rates. Bonds continued to gain ground through the first quarter of 2004 as concerns about the durability of the U.S. economic recovery pushed low interest rates even lower. Demand for relatively safe assets such as bonds rose amid renewed fears of terrorist attacks after the Madrid bombing. Lifted by the tailwind of falling rates, every fixed income sector was in positive territory for the quarter.
Market optimism was revived during the second quarter after a series of robust non-farm payroll growth releases suggested to investors that the economy indeed was on track. Short-term rates increased over 1 percent during the quarter and fixed income markets sold off, giving back all the gains of the first quarter. By June, the expansion of the economy also seemed to be moving the rate of inflation higher. Signs of rising inflation fueled anxiety that the central bank may need to move aggressively to combat it. At the end of June the Federal Reserve Board ("Fed") met market expectations with a 25 basis points increase in the federal funds rate.
The third quarter was essentially a reversal of the previous three months. Economic data releases suggested moderate economic growth, as job numbers, inflation and consumer confidence fell short of analyst expectations, again throwing doubts on the strength of the recovery. Bonds subsequently rallied as the weak employment growth and lower inflation prints prompted a fall in interest rates. These gains during the third quarter came despite two 25 basis point rate hikes by the Fed that brought the fed funds rate to 1.75 percent by the close of September. The rally continued into October as the bond markets reacted to benign inflation and a gross domestic product ("GDP") growth rate that was disappointing.
PERFORMANCE
For the year ended October 31, 2004, TA IDEX PIMCO Total Return, Class A returned 4.78%. By comparison its benchmark, the Lehman Brothers Aggregate Bond Index, returned 5.53%.
STRATEGY REVIEW
Pacific Investment Management Company's ("PIMCO") investment process is based upon a long-term approach, which utilizes both "top-down" and "bottom-up" strategies. Top-down strategies focus on duration, yield curve positioning, volatility and sector rotation while bottom-up strategies drive our security selection process and facilitate the identification and analysis of undervalued securities. As we believe that no single strategy should dominate returns, our total return strategy relies on multiple sources of value added in a highly diversified portfolio.
Interest rate strategies were mixed for performance for the period. A below benchmark duration was positive for performance as interest rates rose in general. An emphasis on short and intermediate maturities was negative as the yield curve flattened.
Underweighting mortgages hurt returns as low volatility and strong bank demand supported these assets but mortgage security selection more than offset the negative impact. Also, an underweight to corporates detracted from returns as credit premiums narrowed in the midst of rising corporate profits. Non-U.S. positions, primarily short to intermediate German maturities, added value in the midst of slower growth and lower inflation in Europe. The emerging market bonds added value as the benign rate environment and improving credit fundamentals boosted demand.
William H. Gross, CFA
Fund Manager
Pacific Management Investment Company LLC
Transamerica IDEX Mutual Funds
Annual Report 2004
1
TA IDEX PIMCO Total Return
Comparison of change in value of $10,000 investment in Class A shares and its comparative index.

Average Annual Total Return for Periods Ended 10/31/04
| | | 1 year | | From
Inception | | Inception
Date | |
| Class A (NAV) | | | 4.78 | % | | | 5.56 | % | | 3/1/02 | |
| Class A (POP) | | | (0.20 | %) | | | 3.65 | % | | 3/1/02 | |
| LBAB1 | | | 5.53 | % | | | 6.24 | % | | 3/1/02 | |
| Class B (NAV) | | | 4.30 | % | | | 4.95 | % | | 3/1/02 | |
| Class B (POP) | | | (0.70 | %) | | | 3.91 | % | | 3/1/02 | |
| Class C (NAV) | | | 4.10 | % | | | 4.36 | % | | 11/11/02 | |
| Class C (POP) | | | 3.10 | % | | | 4.36 | % | | 11/11/02 | |
NOTES
1 The Lehman Brothers Aggregate Bond (LBAB) Index is an unmanaged index used as a general measure of market performance. Calculations assume dividends and capital gains are reinvested and do not include any managerial expenses. From inception calculation is based on life of Class A shares. Source: Standard & Poor's Micropal®© Micropal, Inc. 2004 – 1-800-596-5323 – http://www.micropal.com.
The performance data presented represents past performance, future results may vary. Performance data does not reflect the deduction of taxes that would be paid on fund distributions or the redemption of fund shares. Investment return and principal value will fluctuate so that an investor's shares, when redeemed, may be worth more or less than their original cost. Current performance may be lower or higher than performance quoted.
Public Offering Price (POP) returns include the reinvestment of dividends and capital gains and reflect the maximum sales charge of 4.75% for A shares or the maximum applicable contingent deferred sales charge (5% in the 1st year, decreasing to 0% after 6 years) for Class B shares and 1% (during the first 12 months) for Class C shares. Shares purchased prior to March 1, 2004 are subject to a maximum applicable contingent deferred sales charge (5% in the 1st year, decreasing to 0% after 7 years) for Class B shares and (2% in the 1st year, decreasing to 0% after 2 years) for Class C shares. Net Asset Value (NAV) returns include the reinvestment of dividends and capital gains but do not reflect any sales charges.
This material must be preceded or accompanied by a current prospectus, which includes specific contents regarding the investment objectives and policies of this fund.
Transamerica IDEX Mutual Funds
Annual Report 2004
2
TA IDEX PIMCO Total Return
UNDERSTANDING YOUR FUND'S EXPENSES (unaudited)
SHAREHOLDER EXPENSES
The following Example is intended to help you understand your ongoing costs (in dollars and cents) of investing in a Fund and to compare these costs with the ongoing costs of investing in other funds.
The Example is based on an investment of $1,000 invested at the beginning of the period and held for the entire period from May 1, 2004 to October 31, 2004.
ACTUAL EXPENSES
The first line in the table below provides information about actual account values and actual expenses. You may use the information in this line, together with the amount you invested, to estimate the expenses that you paid over the period. Simply divide your account value by $1,000 (for example, an $8,600 account value divided by $1,000 = 8.6), then multiply the result by the number in the first line of your Fund under the heading entitled "Expenses Paid During Period" to estimate the expenses you paid on your ac count during this period.
HYPOTHETICAL EXAMPLE FOR COMPARISON PURPOSES
The second line in the table below provides information about hypothetical account values and hypothetical expenses based on each Fund's actual expense ratio and an assumed rate of return of 5% per year before expenses, which is not the Fund's actual return. The hypothetical account values and expenses may not be used to estimate the actual ending account balance or expenses you paid for the period. You may use this information to compare the ongoing costs of investing in your Fund and other funds. To do so, compare this 5% hypothetical example with the 5% hypothetical examples that appear in the shareholder reports of the other funds.
Please note that the expenses shown in the table are meant to highlight your ongoing costs only and do not reflect any transactional costs, such as sales charges, redemption fees, brokerage commissions paid on purchases and sales of fund shares. Therefore, the second line under each Fund in the table is useful in comparing ongoing costs only, and will not help you determine the relative total costs of owning different funds. In addition, note that the expenses shown in the table are meant to highlight your ongoing costs and do not reflect any transaction costs.
| | Beginning
Account
Value | | Ending
Account
Value | | Annualized
Expense
Ratio | |
Expenses Paid
During Period (a) | |
| Class A | | | |
| Actual | | $ | 1,000.00 | | | $ | 1,036.20 | | | | 1.31 | % | | $ | 6.70 | | |
| Hypothetical (b) | | | 1,000.00 | | | | 1,018.55 | | | | 1.31 | | | | 6.65 | | |
| Class B | | | |
| Actual | | | 1,000.00 | | | | 1,034.80 | | | | 1.80 | | | | 9.21 | | |
| Hypothetical (b) | | | 1,000.00 | | | | 1,016.09 | | | | 1.80 | | | | 9.12 | | |
| Class C | |
| Actual | | | 1,000.00 | | | | 1,032.80 | | | | 2.12 | | | | 10.83 | | |
| Hypothetical (b) | | | 1,000.00 | | | | 1,014.48 | | | | 2.12 | | | | 10.74 | | |
(a) Expenses are calculated using each Fund's annualized expense ratio (as disclosed in the table), multiplied by the average account value for the period, multiplied by number of days in the period (184 days), and divided by the number of days in the year (366 days).
(b) 5% return per year before expenses
GRAPHIC PRESENTATION OF SCHEDULE OF INVESTMENTS
By Bond Sector
At October 31, 2004

This chart shows the percentage breakdown by bond type of the Fund's total investment securities.
Transamerica IDEX Mutual Funds
Annual Report 2004
3
TA IDEX PIMCO Total Return
SCHEDULE OF INVESTMENTS
At October 31, 2004
(all amounts except share amounts in thousands)
| | | Principal | | Value | |
| U.S. GOVERNMENT OBLIGATIONS (7.6%) | | | |
U.S. Treasury Inflation Indexed Bond
3.63%, due 01/15/2008 | | $ | 3,988 | | | $ | 4,399 | | |
| 8.75%, due 04/15/2010 | | | 3,721 | | | | 3,712 | | |
| 3.50%, due 01/15/2011 | | | 218 | | | | 249 | | |
| 3.38%, due 01/15/2012 | | | 1,014 | | | | 1,161 | | |
| 2.38%, due 01/15/2025 | | | 362 | | | | 379 | | |
| 3.88%, due 04/15/2029 | | | 392 | | | | 521 | | |
U.S. Treasury Note
4.88%, due 02/15/2012 | | | 700 | | | | 750 | | |
| Total U.S. Government Obligations (cost: $11,086) | | | | | | | 11,171 | | |
| U.S GOVERNMENT AGENCY OBLIGATIONS (24.6%) | | | |
Fannie Mae
5.50%, due 07/01/2016 | | | 1,007 | | | | 1,045 | | |
| 5.50%, due 12/01/2016 | | | 139 | | | | 145 | | |
| 5.50%, due 01/01/2017 | | | 153 | | | | 158 | | |
| 5.50%, due 02/01/2017 | | | 157 | | | | 163 | | |
| 5.50%, due 03/01/2017 | | | 15 | | | | 15 | | |
| 5.50%, due 05/01/2017 | | | 169 | | | | 175 | | |
| 5.50%, due 11/01/2017 | | | 16 | | | | 17 | | |
| 5.00%, due 02/01/2018 | | | 306 | | | | 313 | | |
| 5.50%, due 02/01/2018 | | | 439 | | | | 456 | | |
| 5.00%, due 05/01/2018 | | | 58 | | | | 59 | | |
| 5.50%, due 05/01/2018 | | | 39 | | | | 40 | | |
| 5.00%, due 06/01/2018 | | | 387 | | | | 396 | | |
| 5.00%, due 06/01/2018 | | | 380 | | | | 388 | | |
| 3.84%, due 01/01/2028 (a) | | | 170 | | | | 176 | | |
| 6.50%, due 07/01/2032 | | | 0 | | | | 0 | (k) | |
| 5.17%, due 04/01/2033 (a) | | | 68 | | | | 69 | | |
| 5.50%, due 07/01/2033 | | | 273 | | | | 279 | | |
| 5.50%, due 08/01/2033 | | | 347 | | | | 354 | | |
| 5.50%, due 01/01/2034 | | | 478 | | | | 487 | | |
Fannie Mae, Series 2003-88 TB
3.00%, due 08/25/2009 | | | 100 | | | | 100 | | |
Fannie Mae-November TBA
5.00%, due 11/01/2019 | | | 4,600 | | | | 4,693 | | |
| 5.00%, due 11/01/2034 | | | 9,800 | | | | 9,763 | | |
| 5.50%, due 11/01/2034 | | | 10,100 | | | | 10,283 | | |
Freddie Mac
6.00%, due 12/15/2007 | | | 26 | | | | 26 | | |
| 5.00%, due 09/15/2016 | | | 161 | | | | 165 | | |
| 6.50%, due 12/15/2028 | | | 28 | | | | 28 | | |
| 6.50%, due 04/15/2029 | | | 28 | | | | 30 | | |
| 6.50%, due 02/15/2030 | | | 39 | | | | 39 | | |
| 6.50%, due 07/25/2043 | | | 82 | | | | 86 | | |
| | | Principal | | Value | |
Ginnie Mae
6.50%, due 07/15/2023 | | $ | 9 | | | $ | 10 | | |
| 6.50%, due 02/15/2028 | | | 330 | | | | 350 | | |
| 6.50%, due 06/15/2029 | | | 443 | | | | 470 | | |
| 6.50%, due 01/15/2030 | | | 16 | | | | 17 | | |
| 5.50%, due 03/15/2032 | | | 101 | | | | 103 | | |
| 5.50%, due 12/15/2032 | | | 255 | | | | 261 | | |
| 5.00%, due 09/15/2033 | | | 26 | | | | 26 | | |
| 5.00%, due 09/15/2033 | | | 639 | | | | 643 | | |
| 5.50%, due 12/15/2033 | | | 632 | | | | 648 | | |
| 5.50%, due 02/15/2034 | | | 1,400 | | | | 1,435 | | |
| 5.50%, due 02/15/2034 | | | 691 | | | | 709 | | |
Ginnie Mae-November TBA
5.50%, due 11/01/2034 | | | 1,500 | | | | 1,534 | | |
Ginnie Mae-Series 2020-40
6.50%, due 06/20/2032 | | | 47 | | | | 50 | | |
Total U.S Government Agency Obligations
(cost: $35,998) | | | | | | | 36,204 | | |
| FOREIGN GOVERNMENT OBLIGATIONS (3.1%) | |
European Investment Bank
87.50%, due 11/08/2004 | | | 28,000 | | | | 264 | | |
Hong Kong Government, 144A
5.13%, due 08/01/2014 | | | 400 | | | | 417 | | |
Malaysia Government
7.50%, due 07/15/2011 | | | 10 | | | | 12 | | |
Mexico Government International Bond
2.78%, due 01/13/2009 (a) | | | 130 | | | | 131 | | |
Republic of Brazil
3.06%, due 04/15/2006 (a) | | | 216 | | | | 216 | | |
| 11.50%, due 03/12/2008 | | | 122 | | | | 141 | | |
| 3.13%, due 04/15/2009 (a) | | | 291 | | | | 283 | | |
| 11.00%, due 01/11/2012 | | | 200 | | | | 228 | | |
| 3.13%, due 04/15/2012 (a) | | | 239 | | | | 218 | | |
| 8.00%, due 04/15/2014 | | | 390 | | | | 386 | | |
| 11.00%, due 08/17/2040 | | | 50 | | | | 56 | | |
Republic of Panama
8.25%, due 04/22/2008 | | | 40 | | | | 44 | | |
Republic of Peru
9.13%, due 02/21/2012 | | | 90 | | | | 101 | | |
| 9.13%, due 02/21/2012 | | | 80 | | | | 90 | | |
| 4.50%, due 03/07/2017 (a) | | | 150 | | | | 133 | | |
Republic of South Africa
5.25%, due 05/16/2013 | | | 90 | | | | 118 | | |
| 6.50%, due 06/02/2014 | | | 200 | | | | 217 | | |
Russian Federation, Reg S
8.75%, due 07/24/2005 | | | 391 | | | | 407 | | |
| 5.00%, due 03/31/2030 (b) | | | 709 | | | | 709 | | |
The notes to the financial statements are an integral part of this report.
Transamerica IDEX Mutual Funds
Annual Report 2004
4
TA IDEX PIMCO Total Return
SCHEDULE OF INVESTMENTS (continued)
At October 31, 2004
(all amounts except share amounts in thousands)
| | | Principal | | Value | |
United Mexican States
9.88%, due 02/01/2010 | | $ | 150 | | | $ | 186 | | |
| 6.38%, due 01/16/2013 | | | 150 | | | | 159 | | |
Total Foreign Government Obligations
(cost: $4,208) | | | | | | | 4,516 | | |
| MORTGAGE-BACKED SECURITIES (2.7%) | |
Bank of America Mortgage Securities,
Series 2002-K, Class 2A1
5.61%, due 10/20/2032 (a) | | | 118 | | | | 119 | | |
Bear Stearns Adjustable Rate Mortgage Trust,
Series 2002-5, Class VIA
5.94%, due 06/25/2032 (a) | | | 17 | | | | 17 | | |
Bear Stearns Adjustable Rate Mortgage Trust,
Series 2003-8, Class 1A1
4.32%, due 01/25/2034 (a) | | | 478 | | | | 481 | | |
Bear Stearns Adjustable Rate Mortgage Trust,
Series 2003-8, Class 2A1
4.92%, due 01/25/2034 (a) | | | 134 | | | | 135 | | |
Bear Stearns Adjustable Rate Mortgage Trust,
Series 2003-8, Class 4A1
4.78%, due 01/25/2034 (a) | | | 202 | | | | 202 | | |
Bear Stearns Asset Backed Securities, Inc.,
Series 2002-2, Class A1
2.26%, due 10/25/2032 (a) | | | 67 | | | | 67 | | |
CDC Mortgage Capital Trust,
Series 2002-BE2, Class A
2.22%, due 01/25/2033 (a) | | | 44 | | | | 44 | | |
Centex Home Equity,
Series 2004-A, Class AV2
2.21%, due 01/25/2034 (a) | | | 178 | | | | 178 | | |
Countrywide Alternative Loan Trust,
Series 2003-J11, Class 4A1
6.00%, due 10/25/2032 | | | 33 | | | | 33 | | |
Countrywide Home Loan Mortgage Pass
Through Trust, Series 2002-A, Class 5A1
5.67%, due 03/19/2032 (a) | | | 58 | | | | 59 | | |
Countrywide Home Loan Mortgage Pass
Through Trust, Series 2002-HYB2, Class 6A1
4.86%, due 09/19/2032 (a) | | | 57 | | | | 57 | | |
Countrywide Home Loan Mortgage Pass
Through Trust, Series 2004-7, Class 1A2
2.20%, due 05/25/2034 (a) | | | 60 | | | | 60 | | |
Credit Suisse First Boston Mortgage
Securities Corp., Series 2002, Class P-3, 144A
1.90%, due 08/25/2033 | | | 344 | | | | 342 | | |
Credit Suisse First Boston Mortgage
Securities Corp., Series 2002-P1, Class A1
1.53%, due 03/28/2032 | | | 13 | | | | 13 | | |
| | | Principal | | Value | |
Credit Suisse First Boston Mortgage
Securities Corp., Series 2002-P2A, Class A2
2.14%, due 03/25/2032 | | $ | 136 | | | $ | 134 | | |
Credit-Based Asset Servicing and Securitization,
Series 2002-CB6, Class 2A1
2.43%, due 01/25/2033 (a) | | | 12 | | | | 12 | | |
Credit-Based Asset Servicing and Securitization,
Series 2004-CB5, Class AV1
2.06%, due 09/25/2021 (a) | | | 407 | | | | 407 | | |
Home Equity Asset Trust,
Series 2002-1, Class A4
2.23%, due 11/25/2032 (a) | | | 61 | | | | 61 | | |
HSBC Capital Funding,
LP/Channel Islands, 144A
10.18%, due 12/31/2049 (a)(c) | | | 150 | | | | 233 | | |
KBC Bank Fund Trust III Preferred, 144A
9.86%, due 11/29/2049 (a)(d) | | | 15 | | | | 19 | | |
Merrill Lynch Mortgage Investors, Inc.,
Series 2002-AFC1, Class AV1
2.30%, due 04/25/2031 (a) | | | 1 | | | | 1 | | |
Morgan Stanley ABS Capital I,
Series 2003-HE2, Class A2
2.27%, due 08/25/2033 (a) | | | 157 | | | | 157 | | |
Quest Trust, Series 2004-X2, Class A
2.49%, due 06/25/2034 (a) | | | 193 | | | | 193 | | |
Rabobank Capital Funding II, 144A
5.26%, due 12/31/2049 (a) | | | 210 | | | | 215 | | |
Rabobank Capital Funding Trust, 144A
5.25%, due 12/31/2049 (a) | | | 280 | | | | 283 | | |
Ras Laffan Liquefied Natural Gas Co., Ltd., 144A
3.44%, due 09/15/2009 | | | 92 | | | | 91 | | |
SLM Student Loan Trust, Series 2002-6, Class A2
1.90%, due 03/15/2011 (a) | | | 69 | | | | 69 | | |
Structured Asset Mortgage Investments, Inc.,
Series 2002-AR3, Class A-1
2.22%, due 09/19/2032 (a) | | | 222 | | | | 223 | | |
Structured Asset Securities Corp.,
Series 2002-9, Class A2
2.23%, due 10/25/2027 (a) | | | 45 | | | | 45 | | |
Structured Asset Securities Corp.,
Series 2002-HF1, Class A
2.22%, due 01/25/2033 (a) | | | 17 | | | | 17 | | |
Structured Asset Securities Corp.,
Series 2003-S1, Class A1
2.09%, due 08/25/2033 (a) | | | 4 | | | | 4 | | |
Structured Asset Securities Trust,
Series 2002-BC4, Class A
2.22%, due 07/25/2032 (a) | | | 42 | | | | 42 | | |
The notes to the financial statements are an integral part of this report.
Transamerica IDEX Mutual Funds
Annual Report 2004
5
TA IDEX PIMCO Total Return
SCHEDULE OF INVESTMENTS (continued)
At October 31, 2004
(all amounts except share amounts in thousands)
| | | Principal | | Value | |
Vanderbilt Acquisition Loan Trust,
Series 2002-1, Class A1
3.28%, due 01/07/2013 | | $ | 9 | | | $ | 9 | | |
| Total Mortgage-Backed Securities (cost: $3,984) | | | | | | | 4,022 | | |
| ASSET-BACKED SECURITIES (3.4%) | |
Citicorp Mortgage Securities, Inc.,
Series 199-2, Class A5
6.50%, due 04/25/2029 | | | 62 | | | | 62 | | |
First Horizon Asset Securities, Inc.,
Series 2000-H, Class IA
7.00%, due 09/25/2030 | | | 4 | | | | 4 | | |
Mastr Asset Backed Securities Trust,
Series 2004-WMC1, Class A4
2.03%, due 02/25/2034 (a) | | | 76 | | | | 76 | | |
Park Place Securities, Inc.,
Series 2004-MCW1, Class A3
2.13%, due 10/25/2034 (a) | | | 134 | | | | 134 | | |
Protective Life US Funding Trust, 144A
2.05%, due 09/26/2005 (a) | �� | | 280 | | | | 280 | | |
Racers, 144A
2.01%, due 08/15/2007 (a) | | | 300 | | | | 290 | | |
Residential Funding Mortgage Securities I,
Series 2003-S9, Class A1
6.50%, due 03/25/2032 | | | 30 | | | | 31 | | |
Sequoia Mortgage Trust, Series 10, Class 2A1
2.29%, due 10/20/2027 (a) | | | 374 | | | | 375 | | |
Small Business Administration Participation,
Series 2003-201
5.13%, due 09/01/2023 | | | 95 | | | | 99 | | |
Small Business Administration,
Series 2004-20C
4.34%, due 03/01/2024 | | | 579 | | | | 572 | | |
Small Business Administration,
Series 2004-P10, Class A
4.50%, due 02/10/2014 | | | 294 | | | | 295 | | |
Washington Mutual, Series 2000-3, Class A
3.02%, due 12/25/2040 (a) | | | 189 | | | | 189 | | |
Washington Mutual, Series 2002-AR10, Class A6
4.82%, due 10/25/2032 (a) | | | 34 | | | | 34 | | |
Washington Mutual, Series 2002-AR2, Class A
3.13%, due 02/27/2034 (a) | | | 62 | | | | 63 | | |
Washington Mutual, Series 2003-R1, Class A1
2.20%, due 12/25/2027 (a) | | | 2,510 | | | | 2,507 | | |
| Total Asset-Backed Securities (cost: $5,027) | | | | | | | 5,011 | | |
| | | Principal | | Value | |
| CORPORATE DEBT SECURITIES (8.2%) | | | |
| Air Transportation (0.4%) | | | |
Continental Airlines, Inc.
7.06%, due 09/15/2009 | | $ | 200 | | | $ | 199 | | |
United AirLines, Inc.
6.20%, due 09/01/2008 | | | 299 | | | | 254 | | |
| 6.60%, due 09/01/2013 | | | 130 | | | | 112 | | |
| Automotive (0.1%) | | | |
DaimlerChrysler North America Holding Corp.
6.50%, due 11/15/2013 | | | 160 | | | | 175 | | |
| Business Credit Institutions (0.1%) | | | |
Ford Motor Credit Co.
2.51%, due 07/18/2005 (a) | | | 100 | | | | 100 | | |
| Commercial Banks (0.7%) | | | |
Export-Import Bank of China, 144A
5.25%, due 07/29/2014 | | | 250 | | | | 258 | | |
KfW-Kreditanstalt fuer Wiederaufbau
1.00%, due 12/20/2004 | | | 80,000 | | | | 755 | | |
| Communication (0.2%) | | | |
Continental Cablevision, Inc.
8.30%, due 05/15/2006 | | | 100 | | | | 108 | | |
CSC Holdings, Inc.
7.63%, due 04/01/2011 | | | 150 | | | | 163 | | |
Rogers Cablesystems Ltd.
10.00%, due 03/15/2005 | | | 10 | | | | 10 | | |
| Electric Services (0.5%) | | | |
Florida Power Corp.
4.80%, due 03/01/2013 | | | 450 | | | | 454 | | |
PSEG Power LLC
6.95%, due 06/01/2012 | | | 210 | | | | 237 | | |
| Electric, Gas & Sanitary Services (0.3%) | | | |
Niagara Mohawk Power Corp.
7.75%, due 10/01/2008 | | | 250 | | | | 285 | | |
Pacific Gas & Electric Co.
2.72%, due 04/03/2006 (a) | | | 247 | | | | 247 | | |
| Environmental Services (0.0%) | | | |
Waste Management, Inc.
6.38%, due 11/15/2012 | | | 75 | | | | 83 | | |
| Gas Production & Distribution (0.4%) | | | |
EL Paso Energy Corp.
7.75%, due 01/15/2032 (e) | | | 125 | | | | 115 | | |
Sonat, Inc.
7.63%, due 07/15/2011 | | | 370 | | | | 378 | | |
Southern Natural Gas Co.
8.00%, due 03/01/2032 | | | 100 | | | | 106 | | |
The notes to the financial statements are an integral part of this report.
Transamerica IDEX Mutual Funds
Annual Report 2004
6
TA IDEX PIMCO Total Return
SCHEDULE OF INVESTMENTS (continued)
At October 31, 2004
(all amounts except share amounts in thousands)
| | | Principal | | Value | |
| General Obligation–City (0.2%) | |
Chicago, IL, Board of Education
5.00%, due 12/01/2012 | | $ | 255 | | | $ | 285 | | |
| General Obligation–County (0.1%) | |
Fairfax County, VA
5.25%, due 04/01/2013 | | | 90 | | | | 103 | | |
| Hotels & Other Lodging Places (0.4%) | |
Harrah's Operating Co., Inc.
7.50%, due 01/15/2009 | | | 10 | | | | 11 | | |
Park Place Entertainment Corp.
7.50%, due 09/01/2009 | | | 350 | | | | 396 | | |
Starwood Hotels & Resorts Worldwide, Inc.
7.88%, due 05/01/2012 | | | 200 | | | | 235 | | |
| Life Insurance (0.2%) | |
ASIF II
1.20%, due 01/26/2005 | | | 30,000 | | | | 283 | | |
| Motion Pictures (0.1%) | |
Time Warner, Inc.
8.11%, due 08/15/2006 | | | 200 | | | | 218 | | |
| 6.88%, due 05/01/2012 | | | 20 | | | | 23 | | |
| Oil & Gas Extraction (0.4%) | |
Gaz Capital for Gazprom, Reg S
8.63%, due 04/28/2034 | | | 500 | | | | 556 | | |
| Paper & Allied Products (0.0%) | |
Bowater Canada Finance Corp.
7.95%, due 11/15/2011 | | | 10 | | | | 11 | | |
| Personal Credit Institutions (0.8%) | |
General Motors Acceptance Corp.
3.33%, due 10/20/2005 (a) | | | 1,220 | | | | 1,225 | | |
| Primary Metal Industries (0.1%) | |
Alcan, Inc., 144A
2.10%, due 12/08/2004 (a) | | | 170 | | | | 170 | | |
| Public Administration (0.5%) | |
Korea Development Bank
4.75%, due 07/20/2009 | | | 310 | | | | 320 | | |
| 2.47%, due 10/20/2009 (a) | | | 400 | | | | 399 | | |
| Railroads (0.1%) | |
Norfolk Southern Corp.
2.83%, due 02/28/2005 (a) | | | 100 | | | | 100 | | |
| Revenue–Education (0.1%) | |
Michigan State Building Authority
5.25%, due 10/15/2013 | | | 180 | | | | 206 | | |
| | | Principal | | Value | |
| Revenue–Tobacco (0.9%) | |
Golden State Tobacco Securitization Corp.
6.75%, due 06/01/2039 | | $ | 80 | | | $ | 79 | | |
| 7.90%, due 06/01/2042 | | | 35 | | | | 38 | | |
Tobacco Settlement Authority
5.60%, due 06/01/2035 | | | 100 | | | | 83 | | |
Tobacco Settlement Financing Corp.
5.88%, due 05/15/2039 | | | 40 | | | | 35 | | |
Tobacco Settlement Financing Corp., NJ
6.38%, due 06/01/2032 | | | 420 | | | | 397 | | |
| 6.00%, due 06/01/2037 | | | 730 | | | | 645 | | |
| Revenue–Transportation (0.1%) | |
Harris County, TX
5.00%, due 08/15/2033 | | | 100 | | | | 103 | | |
| Revenue–Utilities (0.4%) | |
New York, NY, City Municipal Water
Finance Authority
5.00%, due 06/15/2035 | | | 90 | | | | 92 | | |
San Antonio, Texas, Texas Water Utility
Improvements, Revenue Bonds, Series A
5.00%, due 05/15/2032 | | | 450 | | | | 460 | | |
| Telecommunications (1.1%) | |
Cingular Wireless LLC
6.50%, due 12/15/2011 | | | 180 | | | | 202 | | |
Deutsche Telekom International Finance BV
7.75%, due 06/15/2005 (f) | | | 205 | | | | 212 | | |
| 8.13%, due 05/29/2012 | | | 124 | | | | 197 | | |
France Telecom SA, Reg S
8.25%, due 03/14/2008 (g) | | | 307 | | | | 437 | | |
SBC Communications, Inc.
4.13%, due 09/15/2009 | | | 575 | | | | 578 | | |
| Total Corporate Debt Securities (cost: $11,586) | | | | | | | 12,138 | | |
| SHORT-TERM U.S. GOVERNMENT OBLIGATIONS (17.7%) | |
Fannie Mae
1.58%, due 11/01/2004 | | | 1,400 | | | | 1,400 | | |
| 1.60%, due 11/10/2004 | | | 700 | | | | 700 | | |
| 1.79%, due 11/15/2004 | | | 800 | | | | 799 | | |
| 1.58%, due 11/17/2004 | | | 500 | | | | 499 | | |
| 1.66%, due 11/24/2004 | | | 2,500 | | | | 2,497 | | |
| 1.69%, due 12/01/2004 | | | 1,200 | | | | 1,198 | | |
| 1.77%, due 12/08/2004 | | | 1,200 | | | | 1,198 | | |
| 1.85%, due 12/22/2004 | | | 2,400 | | | | 2,393 | | |
| 1.98%, due 01/24/2005 | | | 2,400 | | | | 2,389 | | |
The notes to the financial statements are an integral part of this report.
Transamerica IDEX Mutual Funds
Annual Report 2004
7
TA IDEX PIMCO Total Return
SCHEDULE OF INVESTMENTS (continued)
At October 31, 2004
(all amounts except share amounts in thousands)
| | | Principal | | Value | |
Federal Home Loan Bank
1.66%, due 11/26/2004 | | $ | 400 | | | $ | 399 | | |
| 1.75%, due 12/08/2004 | | | 1,200 | | | | 1,198 | | |
| 1.75%, due 12/10/2004 | | | 2,400 | | | | 2,395 | | |
Freddie Mac
1.57%, due 11/22/2004 | | | 1,000 | | | | 999 | | |
| 1.92%, due 01/04/2005 | | | 1,400 | | | | 1,395 | | |
| 1.94%, due 01/04/2005 | | | 1,500 | | | | 1,495 | | |
| 1.96%, due 01/11/2005 | | | 3,600 | | | | 3,586 | | |
| 1.99%, due 01/25/2005 | | | 1,000 | | | | 995 | | |
U.S. Treasury Bill
1.58%, due 12/02/2004 (h) | | | 465 | | | | 464 | | |
| 1.61%, due 12/02/2004 (h) | | | 50 | | | | 50 | | |
| 1.55%, due 12/16/2004 (h) | | | 20 | | | | 20 | | |
| 1.62%, due 12/16/2004 (h) | | | 20 | | | | 20 | | |
| 1.62%, due 12/16/2004 (h) | | | 20 | | | | 20 | | |
| 1.66%, due 12/16/2004 (h) | | | 20 | | | | 20 | | |
Total Short-Term U.S. Government Obligations
(cost: $26,130) | | | | | | | 26,129 | | |
| COMMERCIAL PAPER (43.2%) | |
| Chemicals & Allied Products (0.9%) | |
Dupont EI de Nemours Co.
1.89%, due 12/21/2004 | | | 1,400 | | | | 1,396 | | |
| Commercial Banks (30.6%) | |
ABN AMRO Holding NV
1.93%, due 01/24/2005 | | | 700 | | | | 697 | | |
| 1.95%, due 01/31/2005 | | | 200 | | | | 199 | | |
ANZ (Delaware), Inc.
1.64%, due 11/18/2004 | | | 2,100 | | | | 2,098 | | |
| 1.83%, due 12/01/2004 | | | 1,200 | | | | 1,198 | | |
| 1.86%, due 12/08/2004 | | | 100 | | | | 100 | | |
| 1.85%, due 12/17/2004 | | | 400 | | | | 399 | | |
| 2.02%, due 02/14/2005 | | | 100 | | | | 99 | | |
Barclays U.S. Funding Corp.
1.75%, due 11/15/2004 | | | 400 | | | | 400 | | |
| 1.80%, due 12/08/2004 | | | 3,400 | | | | 3,393 | | |
| 1.92%, due 12/17/2004 | | | 200 | | | | 199 | | |
| 1.99%, due 02/01/2005 | | | 200 | | | | 199 | | |
CBA (Delaware) Finance, Inc.
1.65%, due 11/19/2004 | | | 400 | | | | 400 | | |
| 1.85%, due 12/20/2004 | | | 900 | | | | 898 | | |
| 1.89%, due 12/29/2004 | | | 100 | | | | 100 | | |
Danske Corp.
1.65%, due 11/19/2004 | | | 300 | | | | 300 | | |
| 1.66%, due 11/22/2004 | | | 100 | | | | 100 | | |
| 1.77%, due 12/09/2004 | | | 100 | | | | 100 | | |
| 1.79%, due 12/20/2004 | | | 100 | | | | 100 | | |
| 2.04%, due 02/14/2005 | | | 1,700 | | | | 1,690 | | |
| | �� | Principal | | Value | |
| Commercial Banks (continued) | |
Dexia Delaware LLC
1.81%, due 12/13/2004 | | $ | 1,600 | | | $ | 1,596 | | |
| 1.83%, due 12/20/2004 | | | 100 | | | | 100 | | |
DNB NOR Bank ASA
1.65%, due 11/19/2004 | | | 400 | | | | 400 | | |
| 1.83%, due 12/15/2004 | | | 1,700 | | | | 1,696 | | |
| 1.84%, due 12/23/2004 | | | 1,800 | | | | 1,795 | | |
| 1.98%, due 02/03/2005 | | | 100 | | | | 99 | | |
European Investment Bank
1.79%, due 12/13/2004 | | | 3,500 | | | | 3,492 | | |
Governor & Co. (The) of The Bank of Ireland
1.79%, due 12/08/2004 | | | 3,400 | | | | 3,393 | | |
HBOS Treasury Services
1.64%, due 11/09/2004 | | | 100 | | | | 100 | | |
| 1.61%, due 11/10/2004 | | | 100 | | | | 100 | | |
| 1.66%, due 11/18/2004 | | | 200 | | | | 200 | | |
| 1.72%, due 11/26/2004 | | | 800 | | | | 799 | | |
| 1.78%, due 12/07/2004 | | | 100 | | | | 100 | | |
| 1.82%, due 12/14/2004 | | | 700 | | | | 698 | | |
| 2.05%, due 01/24/2005 | | | 1,500 | | | | 1,493 | | |
| 2.00%, due 02/01/2005 | | | 200 | | | | 199 | | |
| 2.07%, due 02/22/2005 | | | 200 | | | | 199 | | |
ING (US) Funding LLC
1.66%, due 11/22/2004 | | | 400 | | | | 399 | | |
| 1.79%, due 12/09/2004 | | | 200 | | | | 200 | | |
| 1.79%, due 12/10/2004 | | | 100 | | | | 100 | | |
| 1.82%, due 12/16/2004 | | | 400 | | | | 399 | | |
| 1.84%, due 12/21/2004 | | | 400 | | | | 399 | | |
Nordea North America, Inc.
1.97%, due 02/01/2005 | | | 3,700 | | | | 3,681 | | |
Royal Bank of Canada
1.81%, due 12/22/2004 | | | 400 | | | | 399 | | |
Royal Bank of Scotland
1.63%, due 11/03/2004 | | | 100 | | | | 100 | | |
Svenska Handelsbanken, Inc.
1.63%, due 11/04/2004 | | | 400 | | | | 400 | | |
| 1.66%, due 11/22/2004 | | | 2,000 | | | | 1,998 | | |
| 1.79%, due 12/08/2004 | | | 200 | | | | 200 | | |
| 1.80%, due 12/15/2004 | | | 100 | | | | 100 | | |
Swedbank
1.79%, due 12/07/2004 | | | 400 | | | | 399 | | |
| 1.80%, due 12/20/2004 | | | 1,300 | | | | 1,297 | | |
Swedish National Housing Finance, 144A
1.63%, due 11/10/2004 | | | 2,500 | | | | 2,499 | | |
The notes to the financial statements are an integral part of this report.
Transamerica IDEX Mutual Funds
Annual Report 2004
8
TA IDEX PIMCO Total Return
SCHEDULE OF INVESTMENTS (continued)
At October 31, 2004
(all amounts except share amounts in thousands)
| | | Principal | | Value | |
| Commercial Banks (continued) | |
Westpac Capital Corp.
1.67%, due 11/23/2004 | | $ | 500 | | | $ | 499 | | |
| 1.69%, due 11/26/2004 | | | 100 | | | | 100 | | |
| 1.65%, due 12/06/2004 | | | 2,800 | | | | 2,795 | | |
| Holding & Other Investment Offices (6.9%) | |
ASB Bank, Ltd., 144A
1.73%, due 12/03/2004 | | | 2,200 | | | | 2,196 | | |
| 2.04%, due 02/14/2005 | | | 600 | | | | 596 | | |
Ford Motor Credit Co.
2.52%, due 04/07/2005 | | | 300 | | | | 297 | | |
UBS Finance Delaware LLC
1.63%, due 11/16/2004 | | | 300 | | | �� | 300 | | |
| 1.67%, due 11/23/2004 | | | 100 | | | | 100 | | |
| 1.69%, due 11/29/2004 | | | 100 | | | | 100 | | |
| 1.77%, due 12/07/2004 | | | 100 | | | | 100 | | |
| 1.94%, due 01/25/2005 | | | 300 | | | | 298 | | |
| 2.03%, due 02/22/2005 | | | 2,700 | | | | 2,682 | | |
| 2.07%, due 02/28/2005 | | | 500 | | | | 496 | | |
Unicredit Delaware, Inc.
1.64%, due 11/05/2004 | | | 3,000 | | | | 2,999 | | |
| Mortgage Bankers & Brokers (1.1%) | |
Spintab AB
1.62%, due 11/01/2004 | | | 1,000 | | | | 1,000 | | |
| 1.71%, due 12/03/2004 | | | 600 | | | | 599 | | |
| Personal Credit Institutions (2.6%) | |
General Electric Capital Corp.
1.59%, due 11/05/2004 | | | 800 | | | | 800 | | |
| 1.61%, due 11/16/2004 | | | 1,600 | | | | 1,599 | | |
| 1.80%, due 12/16/2004 | | | 800 | | | | 798 | | |
| 2.04%, due 02/04/2005 | | | 100 | | | | 99 | | |
GMAC
2.40%, due 03/22/2005 | | | 280 | | | | 277 | | |
| 2.50%, due 04/05/2005 | | | 250 | | | | 247 | | |
| Petroleum Refining (0.7%) | |
Shell Finance (UK) PLC
1.69%, due 11/24/2004 | | | 1,100 | | | | 1,099 | | |
| Security & Commodity Brokers (0.4%) | |
CDC Commercial Paper, Inc., 144A
1.64%, due 11/17/2004 | | | 300 | | | | 300 | | |
| 2.04%, due 02/22/2005 | | | 300 | | | | 298 | | |
| Total Commercial Paper (cost: $63,768) | | | | | | | 63,768 | | |
| | | Principal | | Value | |
| CERTIFICATES OF DEPOSIT (4.7%) | |
Citibank NA
1.67%, due 11/23/2004 | | $ | 2,300 | | | $ | 2,300 | | |
| 0.00%, due 12/07/2004 | | | 100 | | | | 100 | | |
| 2.03%, due 01/24/2005 | | | 1,800 | | | | 1,800 | | |
Wells Fargo Bank NA
1.85%, due 11/22/2004 | | | 2,800 | | | | 2,800 | | |
| Total Certificates of Deposit (cost: $7,000) | | | | | | | 7,000 | | |
| SECURITY LENDING COLLATERAL (0.1%) | |
| Debt (0.1%) | |
| Bank Notes (0.0%) | |
Bank of America
1.77%, due 12/03/2004 | | | 6 | | | | 6 | | |
| 1.88%, due 12/23/2004 | | | 2 | | | | 2 | | |
| 1.77%, due 01/18/2005 | | | 4 | | | | 4 | | |
Canadian Imperial Bank of Commerce
1.86%, due 11/04/2004 | | | 9 | | | | 9 | | |
Credit Suisse First Boston Corp.
1.83%, due 09/09/2005 | | | 1 | | | | 1 | | |
| Commercial Paper (0.0%) | |
Clipper Receivables Corp.
1.79%, due 11/12/2004 | | | 3 | | | | 3 | | |
Delaware Funding Corp. 144A
1.85%, due 11/19/2004 | | | 1 | | | | 1 | | |
Falcon Asset Securitization Corp. 144A
1.78%, due 11/04/2004 | | | 3 | | | | 3 | | |
| 1.75%, due 11/10/2004 | | | 4 | | | | 4 | | |
Galaxy Funding 144A
1.88%, due 11/22/2004 | | | 1 | | | | 1 | | |
| Euro Dollar Terms (0.1%) | |
Bank of Montreal
1.88%, due 11/24/2004 | | | 9 | | | | 9 | | |
BNP Paribas
1.77%, due 11/10/2004 | | | 5 | | | | 5 | | |
| 1.80%, due 11/23/2004 | | | 4 | | | | 4 | | |
| 1.98%, due 12/27/2004 | | | 4 | | | | 4 | | |
Calyon
1.70%, due 11/24/2004 | | | 1 | | | | 1 | | |
Citigroup
2.06%, due 01/25/2005 | | | 10 | | | | 10 | | |
Den Danske Bank
1.82%, due 11/19/2004 | | | 5 | | | | 5 | | |
Dexia Group
2.04%, due 01/21/2005 | | | 2 | | | | 2 | | |
HBOS Halifax Bank of Scotland
2.03%, due 01/21/2005 | | | 2 | | | | 2 | | |
The notes to the financial statements are an integral part of this report.
Transamerica IDEX Mutual Funds
Annual Report 2004
9
TA IDEX PIMCO Total Return
SCHEDULE OF INVESTMENTS (continued)
At October 31, 2004
(all amounts except share amounts in thousands)
| | | Principal | | Value | |
| Euro Dollar Terms (continued) | |
Royal Bank of Scotland
2.01%, due 01/20/2005 | | $ | 4 | | | $ | 4 | | |
Toronto Dominion Bank
1.70%, due 11/08/2004 | | | 2 | | | | 2 | | |
Wells Fargo
1.87%, due 11/22/2004 | | | 5 | | | | 5 | | |
| Promissory Notes (0.0%) | |
Goldman Sachs Group Inc.
1.90%, due 12/29/2004 | | | 4 | | | | 4 | | |
| 1.88%, due 01/27/2005 | | | 6 | | | | 6 | | |
| Repurchase Agreements (0.0%) | |
Merrill Lynch & Co., Inc.
1.92% Repurchase Agreement dated
10/29/04 to be repurchased at $16
on 11/01/04 (i) | | | 16 | | | | 16 | | |
| | | Shares | | Value | |
| Investment Companies (0.0%) | |
| Money Market Funds (0.0%) | |
Merrill Lynch Premier Institutional Fund
1-day yield of 1.71% | | | 4,849 | | | $ | 5 | | |
Merrimac Cash Fund, Premium Class
1-day yield of 1.46% | | | 3,549 | | | | 3 | | |
| Total Security Lending Collateral (cost: $121) | | | | | | | 121 | | |
| Total Investment Securities (cost: $168,908) | | | | | | $ | 170,080 | | |
| | | Contracts (j) | | Value | |
| WRITTEN OPTIONS (0.0%) | |
| Covered Call Options (0.0%) | |
U.S. 10 Year Treasury Note Futures
Call Strike $114.00
Expires 11/26/2004 | | | 3 | | | $ | (1 | ) | |
| Put Options (0.0%) | |
U.S. 10 Year Treasury Note Futures
Put Strike $115.00
Expires 11/26/2004 | | | 20 | | | | (5 | ) | |
| Total Written Options (cost: $11) | | | | | | | (6 | ) | |
| | | Notional
Amount | | Value | |
| WRITTEN SWAPTIONS (0.0%) | |
| Put Swaptions (0.0%) | |
LIBOR Rate Swaption
Put Strike $4.00
Expires 01/07/2005 | | | 900 | | | $ | (6 | ) | |
LIBOR Rate Swaption
Put Strike $4.00
Expires 01/07/2005 | | | 900 | | | | (6 | ) | |
LIBOR Rate Swaption
Put Strike $7.00
Expires 01/07/2005 | | | 1,900 | | | | – | (k) | |
| Total Written Swaptions (cost: $55) | | | | | | | (12 | ) | |
| SUMMARY: | |
| Investments, at value | | | 115.3 | % | | $ | 170,080 | | |
| Written swaptions | | | 0.0 | % | | | (12 | ) | |
| Written options | | | 0.0 | % | | | (6 | ) | |
| Liabilities in excess of other assets | | | (15.3 | )% | | | (22,627 | ) | |
| Net assets | | | 100.0 | % | | $ | 147,435 | | |
| SWAP AGREEMENTS: | |
| | | Expiration
Date | | Notional
Amount | | Net Unrealized
Appreciation
(Depreciation) | |
Receive a fixed rate equal to 4.00%
and pay a floating rate based on
6-month EURIBOR
(Euro Interbank Offered Rate).
Counterparty: JP Morgan | | 06/17/2005 | | $ | 2,000 | | | $ | 35 | | |
Receive a fixed rate equal to 6.00%
and pay a floating rate based on
6-month EURIBOR
(Euro Interbank Offered Rate).
Counterparty: JP Morgan | | 06/18/2014 | | | 1,100 | | | | 34 | | |
Receive a floating rate based on
3-month Great British Pound-LIBOR
(London Interbank Offered Rate)
and pay a fixed rate equal to 5.00%
Counterparty: UBS AG | | 6/18/2014 | | | 500 | | | | (7 | ) | |
Receive a fixed rate equal to 4.00%
and pay a floating rate based on
6-month United States Dollar-LIBOR
(London Interbank Offered Rate).
Counterparty: Barclays PLC | | 12/15/2006 | | | 5,300 | | | | 67 | | |
The notes to the financial statements are an integral part of this report.
Transamerica IDEX Mutual Funds
Annual Report 2004
10
TA IDEX PIMCO Total Return
SCHEDULE OF INVESTMENTS (continued)
At October 31, 2004
(all amounts except share amounts in thousands)
| | | Expiration
Date | | Notional
Amount | | Net Unrealized
Appreciation
(Depreciation) | |
Receive a fixed rate equal to 0.625%
and the Fund will pay to the
counterparty at par in the event of
default of Mexican Government
International Bond,
11.50%, due 05/15/2026.
Counterparty: Morgan Stanley | | 05/20/2005 | | $ | 180 | | | $ | – | | |
Receive a fixed rate equal to 0.65%
and the Fund will pay to the
counterparty at par in the event of
default of United Mexican States,
7.50%, due 04/08/2033.
Counterparty: Barclays PLC | | 05/20/2005 | | | 60 | | | | – | | |
Receive a fixed rate equal to 1.31%
and the Fund will pay to the
counterparty at par in the event of
default of United Mexican States,
11.50% due 05/15/2026.
Counterparty: Goldman Sachs
Capital Markets L.P. | | 01/29/2005 | | | 200 | | | | 1 | | |
Receive a fixed rate equal to 5.00%
and pay a floating rate based on 3-month
United States Dollar-LIBOR
(London Interbank Offered Rate).
Counterparty: Lehman Brothers
Special Financing Inc. | | 12/15/2014 | | | 1,200 | | | | 94 | | |
Receive a floating rate based on
6-month Great British Pound-LIBOR
(London Interbank Offered Rate)
and pay a fixed rate equal to 5.00%.
Counterparty: Barclays PLC | | 06/18/2034 | | | 300 | | | | (7 | ) | |
Receive a floating rate based on
6-month Japanese Yen-LIBOR
(London Interbank Offered Rate)
and pay a fixed rate equal to 2.00%.
Counterparty: Morgan Stanley | | 06/15/2012 | | | 130,000 | | | | (34 | ) | |
Receive a floating rate based on
the monthly performance of the
Lehman Brothers ERISA Eligible
CMBS Index and pay a floating rate
based on 1-month United States
Dollar-LIBOR (London Interbank
Offered Rate) less 0.35%.
Count erparty: Citibank | | 04/01/2005 | | | 1,000 | | | | – | | |
Total Swap Agreements
(premium $10) | | | | $ | 141,840 | | | $ | 183 | | |
| FUTURES CONTRACTS: | |
| | | Contracts | | Settlement
Date | | Amount | | Net Unrealized
Appreciation
(Depreciation) | |
| 10 Year U.S. Treasury Note | | | 156 | | | 12/31/2004 | | $ | 17,716 | | | $ | 143 | | |
| 2 Year U.S. Treasury Note | | | 108 | | | 12/29/2004 | | | 22,871 | | | | 15 | | |
| 3 Month Euro Euribor | | | 30 | | | 12/19/2005 | | | – | | | | (1 | ) | |
| 90-Day Euro Dollar | | | 27 | | | 06/13/2005 | | | 6,568 | | | | 2 | | |
| 90-Day Euro Dollar | | | 153 | | | 09/19/2005 | | | 37,148 | | | | 28 | | |
| Euro-BOBL | | | 83 | | | 12/31/2004 | | | 11,859 | | | | 125 | | |
| Euro-BUND | | | 15 | | | 12/10/2004 | | | 2,231 | | | | 37 | | |
| Japanese 10 Year Bond | | | 1 | | | 12/09/2004 | | | 1,301 | | | | 17 | | |
| | | | | | | | | $ | 99,694 | | | $ | 366 | | |
| FORWARD FOREIGN CURRENCY CONTRACTS: | |
| Currency | | Bought
(Sold) | | Settlement
Date | | Amount in
U.S. Dollars
Bought (Sold) | | Net Unrealized
Appreciation
(Depreciation) | |
| Euro Dollar | | | 188 | | | 12/09/2004 | | $ | 235 | | | $ | 4 | | |
| Euro Dollar | | | (993 | ) | | 12/09/2004 | | | (1,250 | ) | | | (13 | ) | |
| | | | | | | | | $ | (1,015 | ) | | $ | (9 | ) | |
The notes to the financial statements are an integral part of this report.
Transamerica IDEX Mutual Funds
Annual Report 2004
11
TA IDEX PIMCO Total Return
SCHEDULE OF INVESTMENTS (continued)
At October 31, 2004
(all amounts except share amounts in thousands)
NOTES TO SCHEDULE OF INVESTMENTS:
(a) Floating or variable rate note. Rate is listed as of October 31, 2004.
(b) Securities are stepbonds. Russian Federation has a coupon rate of 5.00% until 03/31/2007, thereafter the coupon rate will become 7.50%.
(c) Securities are stepbonds. HSBC Capital Funding LP-144A has a coupon rate of 10.18% until 06/30/2030, thereafter the coupon rate will become the 3 Month LIBOR (London Interbank Offer Rate) plus 498 BP.
(d) Securities are stepbonds. KBC Bank Fund Trust III-144A has a coupon rate of 9.86% until 11/02/2009, thereafter the coupon rate will become the 3 Month LIBOR (London Interbank Offer Rate) plus 405 BP.
(e) At October 31, 2004, all or a portion of this security is on loan (see Note 1). The value at October 31, 2004, of all securities on loan is $118.
(f) Securities are stepbonds. Coupon steps up by 50 BP for each rating downgrade by Standard and Poor's or Moody's for each notch below BBB+/Baa1. Coupon steps down by 50 BP for each rating upgrade.
(g) Securities are stepbonds. Coupon steps up or down by 25 BP for each rating upgrade or downgrade by Standard and Poor's or Moody's for each notch below A-/A3.
(h) At October 31, 2004, all or a portion of this security is segregated with the custodian to cover margin requirements for open futures and option contracts. The value of all securities at October 31, 2004 is $594.
(i) Cash collateral for the Repurchase Agreements, valued at $16, that serve as collateral for securities lending are invested in corporate bonds with interest rates and maturity dates ranging from 0.00%–9.75% and 05/15/2005–9/15/2033, respectively.
(j) Contract amounts are not in thousands.
(k) Value is less than $1.
DEFINITIONS:
144A 144A Securities are registered pursuant to Rule 144A of the Securities Act of 1933. These securities are deemed to be liquid for purposes of compliance limitations on holdings of illiquid securities and may be resold as transactions exempt from registration, normally to qualified institutional buyers. At October 31, 2004 these securities aggregated $7,864 or 5.3% of the net assets of the Fund.
TBA Mortgage-backed securities traded under delayed delivery commitments. Income on TBA's are not earned until settlement date.
The notes to the financial statements are an integral part of this report.
Transamerica IDEX Mutual Funds
Annual Report 2004
12
TA IDEX PIMCO Total Return
STATEMENT OF ASSETS AND LIABILITIES
At October 31, 2004
(all amounts except per share amounts in thousands)
| Assets: | | | |
Investment securities, at value (cost: $168,908)
(including securities loaned of $118) | | $ | 170,080 | | |
| Cash | | | 2,875 | | |
| Foreign cash (cost: $561) | | | 568 | | |
| Receivables: | |
| Investment securities sold | | | 409 | | |
| Shares of beneficial interest sold | | | 592 | | |
| Interest | | | 404 | | |
| Variation margin | | | 95 | | |
| Swap agreements at value (premium $55) | | | 286 | | |
| Unrealized appreciation on forward currency contracts | | | 4 | | |
| Other | | | 4 | | |
| | | | 175,317 | | |
| Liabilities: | | | |
| Investment securities purchased | | | 27,292 | | |
| Accounts payable and accrued liabilities: | |
| Shares of beneficial interest redeemed | | | 89 | | |
| Management and advisory fees | | | 85 | | |
| Distribution fees | | | 64 | | |
| Transfer agent fees | | | 27 | | |
| Payable for collateral for securities on loan | | | 121 | | |
Unrealized depreciation on forward foreign
currency contracts | | | 13 | | |
| Written options and swaptions (premiums $66) | | | 18 | | |
| Swap agreements at value (premium $45) | | | 93 | | |
| Other | | | 80 | | |
| | | | 27,882 | | |
| Net Assets | | $ | 147,435 | | |
| Net Assets Consist of: | | | |
Shares of beneficial interest, unlimited shares
authorized, no par value | | $ | 143,974 | | |
| Undistributed net investment income (loss) | | | – | | |
Undistributed net realized gain (loss) from investment
securities, futures contracts, foreign currency
transactions, written options and swaptions, and swaps | | | 1,693 | | |
| Net unrealized appreciation (depreciation) on: | |
| Investment securities | | | 1,172 | | |
| Futures contracts | | | 366 | | |
| Written option and swaption contracts | | | 48 | | |
| Swap agreements | | | 183 | | |
Translation of assets and liabilites denominated in
foreign currencies | | | (1 | ) | |
| Net Assets | | $ | 147,435 | | |
| Net Assets by Class: | | | |
| Class A | | $ | 106,366 | | |
| Class B | | | 28,219 | | |
| Class C | | | 12,850 | | |
| Shares Outstanding: | | | |
| Class A | | | 10,153 | | |
| Class B | | | 2,690 | | |
| Class C | | | 1,228 | | |
| Net Asset Value Per Share: | | | |
| Class A | | $ | 10.48 | | |
| Class B | | | 10.48 | | |
| Class C | | | 10.47 | | |
| Maximum Offering Price Per Share (a): | | | |
| Class A | | $ | 11.00 | | |
(a) Includes the maximum selling commission (represented as a percentage of offering price) which is reduced on certain levels of sales as set forth in the Prospectus. Net asset value per share for Classes B and C shares represents offering price. The redemption price for Classes B and C shares equals net asset value less any applicable contingent deferred sales charge.
STATEMENT OF OPERATIONS
For the year ended October 31, 2004
(all amounts in thousands)
| Investment Income: | | | |
| Interest | | $ | 2,879 | | |
| Income from loaned securities–net | | | 1 | | |
| | | | 2,880 | | |
| Expenses: | | | |
| Management and advisory fees | | | 791 | | |
| Transfer agent fees | |
| Class A | | | 73 | | |
| Class B | | | 21 | | |
| Class C | | | 4 | | |
| Class C2 | | | 7 | | |
| Class M | | | 3 | | |
| Printing and shareholder reports | | | 18 | | |
| Custody fees | | | 69 | | |
| Administration fees | | | 22 | | |
| Legal fees | | | 4 | | |
| Audit and accounting fees | | | 22 | | |
| Trustees fees | | | 7 | | |
| Registration fees | |
| Class A | | | 39 | | |
| Class B | | | 5 | | |
| Class C | | | 15 | | |
| Class C2 | | | 2 | | |
| Class M | | | 2 | | |
| Other | | | 6 | | |
| Distribution and service fees: | |
| Class A | | | 236 | | |
| Class B | | | 307 | | |
| Class C | | | 74 | | |
| Class C2 | | | 53 | | |
| Class M | | | 19 | | |
| Total expenses | | | 1,799 | | |
| Net Investment Income (Loss) | | | 1,081 | | |
| Net Realized Gain (Loss) from: | | | |
| Investment securities | | | 1,395 | | |
| Futures contracts | | | 2,341 | | |
| Written option and swaption contracts | | | 374 | | |
| Swap agreements | | | 75 | | |
| Foreign currency transactions | | | (61 | ) | |
| | | | 4,124 | | |
| Net Increase (Decrease) in Unrealized Appreciation on: | | | |
| Investment securities | | | 180 | | |
| Futures contracts | | | (161 | ) | |
| Written option and swaption contracts | | | (170 | ) | |
| Swap agreements | | | 209 | | |
Translation of assets and liabilities denominated in
foreign currencies | | | 6 | | |
| | | | 64 | | |
Net Gain (Loss) on Investments, Futures Contracts, Foreign
Currency Transactions, Written Options and Swaptions,
and Swaps | | | 4,188 | | |
Net Increase (Decrease) in Net Assets Resulting
from Operations | | $ | 5,269 | | |
The notes to the financial statements are an integral part of this report.
Transamerica IDEX Mutual Funds
Annual Report 2004
13
TA IDEX PIMCO Total Return
STATEMENTS OF CHANGES IN NET ASSETS
For the years ended
(all amounts in thousands)
| | | October 31,
2004 | | October 31,
2003 | |
| Increase (Decrease) in Net Assets From: | |
| Operations: | |
| Net investment income (loss) | | $ | 1,081 | | | $ | 1,647 | | |
Net realized gain (loss) from
investment securities, futures
contracts, foreign currency
transactions, written options
and swaptions, and swaps | | | 4,124 | | | | 2,158 | | |
Net unrealized appreciation
(depreciation) on investment
securities, futures contracts,
foreign currency transactions,
written options and swaptions,
and swaps | | | 64 | | | | 1,445 | | |
| | | | 5,269 | | | | 5,250 | | |
| Distributions to Shareholders: | |
| From net investment income: | |
| Class A | | | (924 | ) | | | (1,137 | ) | |
| Class B | | | (223 | ) | | | (662 | ) | |
| Class C | | | (49 | ) | | | (61 | ) | |
| Class C2 | | | (45 | ) | | | (215 | ) | |
| Class M | | | (18 | ) | | | (80 | ) | |
| | | | (1,259 | ) | | | (2,155 | ) | |
| From net realized gains: | |
| Class A | | | (2,206 | ) | | | (659 | ) | |
| Class B | | | (1,143 | ) | | | (450 | ) | |
| Class C | | | (180 | ) | | | (16 | ) | |
| Class C2 | | | (313 | ) | | | (163 | ) | |
| Class M | | | (93 | ) | | | (60 | ) | |
| | | | (3,935 | ) | | | (1,348 | ) | |
| Capital Share Transactions: | |
| Proceeds from shares sold: | |
| Class A | | | 53,387 | | | | 68,966 | | |
| Class B | | | 6,093 | | | | 21,900 | | |
| Class C | | | 1,432 | | | | 7,167 | | |
| Class C2 | | | 431 | | | | 5,117 | | |
| Class M | | | 57 | | | | 1,114 | | |
| | | | 61,400 | | | | 104,264 | | |
Dividends and distributions
reinvested: | |
| Class A | | | 3,077 | | | | 1,690 | | |
| Class B | | | 1,079 | | | | 905 | | |
| Class C | | | 181 | | | | 67 | | |
| Class C2 | | | 313 | | | | 327 | | |
| Class M | | | 107 | | | | 135 | | |
| | | | 4,757 | | | | 3,124 | | |
| Cost of shares redeemed: | |
| Class A | | | (6,832 | ) | | | (55,731 | ) | |
| Class B | | | (13,382 | ) | | | (19,809 | ) | |
| Class C | | | (3,016 | ) | | | (2,033 | ) | |
| Class C2 | | | (3,748 | ) | | | (7,237 | ) | |
| Class M | | | (1,377 | ) | | | (2,443 | ) | |
| | | | (28,355 | ) | | | (87,253 | ) | |
| Class level exchanges: | |
| Class C | | | 8,804 | | | | – | | |
| Class C2 | | | (6,831 | ) | | | – | | |
| Class M | | | (1,973 | ) | | | – | | |
| | | | – | | | | – | | |
| | | | 37,802 | | | | 20,135 | | |
| Net increase (decrease) in net assets | | | 37,877 | | | | 21,882 | | |
| | | October 31,
2004 | | October 31,
2003 | |
| Net Assets: | |
| Beginning of year | | $ | 109,558 | | | $ | 87,676 | | |
| End of year | | $ | 147,435 | | | $ | 109,558 | | |
Undistributed Net Investment Income
(Loss) | | $ | – | | | $ | (15 | ) | |
| Share Activity: | |
| Shares issued: | |
| Class A | | | 5,141 | | | | 6,565 | | |
| Class B | | | 586 | | | | 2,093 | | |
| Class C | | | 138 | | | | 684 | | |
| Class C2 | | | 41 | | | | 491 | | |
| Class M | | | 5 | | | | 106 | | |
| | | | 5,911 | | | | 9,939 | | |
Shares issued–reinvested from
distributions: | |
| Class A | | | 299 | | | | 162 | | |
| Class B | | | 105 | | | | 87 | | |
| Class C | | | 17 | | | | 6 | | |
| Class C2 | | | 31 | | | | 31 | | |
| Class M | | | 11 | | | | 13 | | |
| | | | 463 | | | | 299 | | |
| Shares redeemed: | |
| Class A | | | (655 | ) | | | (5,310 | ) | |
| Class B | | | (1,287 | ) | | | (1,889 | ) | |
| Class C | | | (291 | ) | | | (192 | ) | |
| Class C2 | | | (357 | ) | | | (691 | ) | |
| Class M | | | (133 | ) | | | (233 | ) | |
| | | | (2,723 | ) | | | (8,315 | ) | |
| Class level exchanges: | |
| Class C | | | 866 | | | | – | | |
| Class C2 | | | (677 | ) | | | – | | |
| Class M | | | (189 | ) | | | – | | |
| | | | – | | | | – | | |
Net increase (decrease) in shares
outstanding: | |
| Class A | | | 4,785 | | | | 1,417 | | |
| Class B | | | (596 | ) | | | 291 | | |
| Class C | | | 730 | | | | 498 | | |
| Class C2 | | | (962 | ) | | | (169 | ) | |
| Class M | | | (306 | ) | | | (114 | ) | |
| | | | 3,651 | | | | 1,923 | | |
The notes to the financial statements are an integral part of this report.
Transamerica IDEX Mutual Funds
Annual Report 2004
14
TA IDEX PIMCO Total Return
FINANCIAL HIGHLIGHTS
| | | | | For a share of beneficial interest outstanding throughout each period | |
| | | | | Net Asset | | Investment Operations | | Distributions | | Net Asset | |
| | | For the
Period
Ended (d)(g) | | Value,
Beginning
of Period | | Net
Investment
Income (Loss) | | Net Realized
and Unrealized
Gain (Loss) | | Total
Operations | | From Net
Investment
Income | | From Net
Realized
Gains | | Total
Distributions | | Value,
End
of Period | |
| Class A | | 10/31/2004 | | $ | 10.52 | | | $ | 0.12 | | | $ | 0.36 | | | $ | 0.48 | | | $ | (0.14 | ) | | $ | (0.38 | ) | | $ | (0.52 | ) | | $ | 10.48 | | |
| | | 10/31/2003 | | | 10.32 | | | | 0.20 | | | | 0.39 | | | | 0.59 | | | | (0.25 | ) | | | (0.14 | ) | | | (0.39 | ) | | | 10.52 | | |
| | | 10/31/2002 | | | 10.00 | | | | 0.13 | | | | 0.28 | | | | 0.41 | | | | (0.09 | ) | | | – | | | | (0.09 | ) | | | 10.32 | | |
| Class B | | 10/31/2004 | | | 10.51 | | | | 0.07 | | | | 0.36 | | | | 0.43 | | | | (0.08 | ) | | | (0.38 | ) | | | (0.46 | ) | | | 10.48 | | |
| | | 10/31/2003 | | | 10.32 | | | | 0.13 | | | | 0.38 | | | | 0.51 | | | | (0.18 | ) | | | (0.14 | ) | | | (0.32 | ) | | | 10.51 | | |
| | | 10/31/2002 | | | 10.00 | | | | 0.09 | | | | 0.29 | | | | 0.38 | | | | (0.06 | ) | | | – | | | | (0.06 | ) | | | 10.32 | | |
| Class C | | 10/31/2004 | | | 10.51 | | | | 0.04 | | | | 0.38 | | | | 0.42 | | | | (0.08 | ) | | | (0.38 | ) | | | (0.46 | ) | | | 10.47 | | |
| | | 10/31/2003 | | | 10.38 | | | | 0.13 | | | | 0.32 | | | | 0.45 | | | | (0.18 | ) | | | (0.14 | ) | | | (0.32 | ) | | | 10.51 | | |
| | | | | | | Ratios/Supplemental Data | |
| | | For the
Period | | Total | | Net Assets,
End of
Period | | Ratio of Expenses
to Average
Net Assets (a) | | Net Investment
Income (Loss)
to Average | | Portfolio
Turnover | |
| | | Ended (g) | | Return (c) | | (000's) | | Net (e) | | Total (f) | | Net Assets (a) | | Rate (b) | |
| Class A | | 10/31/2004 | | | 4.78 | % | | $ | 106,366 | | | | 1.34 | % | | | 1.34 | % | | | 1.19 | % | | | 385 | % | |
| | | 10/31/2003 | | | 5.88 | | | | 56,452 | | | | 1.43 | | | | 1.43 | | | | 1.91 | | | | 326 | | |
| | | 10/31/2002 | | | 4.13 | | | | 40,767 | | | | 1.65 | | | | 1.81 | | | | 2.28 | | | | 240 | | |
| Class B | | 10/31/2004 | | | 4.30 | | | | 28,219 | | | | 1.92 | | | | 1.92 | | | | 0.64 | | | | 385 | | |
| | | 10/31/2003 | | | 5.08 | | | | 34,547 | | | | 2.08 | | | | 2.08 | | | | 1.26 | | | | 326 | | |
| | | 10/31/2002 | | | 3.80 | | | | 30,909 | | | | 2.30 | | | | 2.46 | | | | 1.63 | | | | 240 | | |
| Class C | | 10/31/2004 | | | 4.10 | | | | 12,850 | | | | 2.09 | | | | 2.09 | | | | 0.41 | | | | 385 | | |
| | | 10/31/2003 | | | 4.47 | | | | 5,231 | | | | 2.08 | | | | 2.08 | | | | 1.25 | | | | 326 | | |
| NOTES TO FINANCIAL HIGHLIGHTS | | | |
(a) Annualized.
(b) Not annualized for periods of less than one year.
(c) Total Return has been calculated for the applicable period without deduction of a sales load, if any, on an initial purchase. Periods of less than one year are not annualized.
(d) Per share information is calculated based on average number of shares outstanding.
(e) Ratio of Net Expenses to Average Net Assets is net of fee waivers and reimbursements by the investment adviser, if any (see note 2).
(f) Ratio of Total Expenses to Average Net Assets includes all expenses before fee waivers and reimbursements by the investment adviser.
(g) TA IDEX PIMCO Total Return ("the Fund") commenced operations on March 1, 2002. The inception date for the Fund's offering of share Class L was November 11, 2002. Class L was renamed Class C on March 1, 2004. (See note 1).
The notes to the financial statements are an integral part of this report.
Transamerica IDEX Mutual Funds
Annual Report 2004
15
TA IDEX PIMCO Total Return
NOTES TO FINANCIAL STATEMENTS
At October 31, 2004
(all amounts in thousands)
NOTE 1. ORGANIZATION AND SIGNIFICANT ACCOUNTING POLICIES
Transamerica IDEX Mutual Funds, formerly IDEX Mutual Funds, is a Massachusetts business trust registered under the Investment Company Act of 1940, as amended (the "1940 Act"), as an open-end management investment company. TA IDEX PIMCO Total Return ("the Fund"), part of Transamerica IDEX Mutual Funds, began operations on March 1, 2002.
On March 1, 2004, the Fund changed its name from IDEX PIMCO Total Return to TA IDEX PIMCO Total Return.
In the normal course of business, the Fund enters into contracts that contain a variety of representations and warranties, which provide general indemnifications. The Fund's maximum exposure under these arrangements is unknown, as this would involve future claims that may be made against the Fund and/or its affiliates that have not yet occurred. However, based on experience, the Fund expects the risk of loss to be remote.
See the Prospectus and Statement of Additional Information for a description of the Fund's investment objective.
In preparing the Fund's financial statements in accordance with accounting principles generally accepted in the United States of America ("GAAP"), estimates or assumptions (which could differ from actual results) may be used that affect reported amounts and disclosures. The following policies were consistently followed by the Fund, in accordance with GAAP.
Multiple class operations and expenses: The Fund currently offers three classes of shares, each with a public offering price that reflects different sales charges, if any, and expense levels. All shares designated as Class C shares prior to March 1, 2004, were renamed as Class C2 shares on that date. All shares designated as Class L shares prior to March 1, 2004, were renamed as Class C shares with different sale charges than the previous Class L shares. On June 15, 2004, Class C2 shares merged into Class C. On September 24, 2004, Class M shares merged into Class C. Class B shares will convert to Class A shares eight years after purchase. Income, non-class specific expenses and realized and unrealized gains and losses, are allocated daily to each class, based upon the value of shares outstanding method as permitted under Rule 18f-3 of the 1940 Act. Each class bears its own specific expenses as well as a portion of general, common expenses.
Pricing of shares: The Fund prices its shares on the basis of the net asset value of each class of shares of the Fund, which is determined as of the close of the New York Stock Exchange ("NYSE") (generally 4:00 p.m. Eastern Time) on each day on which the NYSE is open for trading (other than a day on which there are insufficient changes in the value of the Fund's portfolio securities to materially affect the Fund's net asset value or a day on which no shares are tendered for redemption and no order to purchase any shares is received).
Security valuations: Fund investments traded on an exchange are valued at the closing price on the day of valuation on the exchange where the security is principally traded.
Securities traded in the over-the-counter market and listed securities for which no sale was reported on that date are valued at the last quoted bid price.
Debt securities are valued by independent pricing services; however, those that mature in sixty days or less are valued at amortized cost, which approximates market.
Investment company securities are valued at net asset value of the underlying portfolio.
Foreign securities generally are valued based on quotations from the primary market in which they are traded and are translated from the local currency into U.S. dollars using closing exchange rates. Many foreign securities markets are open for trading at times when the U.S. markets are closed for trading, and many foreign securities markets close for trading before the close of the NYSE. The value of foreign securities may be affected significantly on a day that the NYSE is closed and an investor is unable to purchase or redeem shares. If a significant market event impacting the value of a portfolio security (e.g., natural disaster, company announcement, market volatility) occurs subsequent to the close of trading in the security, but prior to the calculation of the Fund's net asset value per share, market quotations for that security may be determined to be unreliable and, accordingly, not "readily av ailable." If market quotations are not readily available, and the impact of such a significant market event materially effects the net asset value per share of the Fund, an affected portfolio security will be valued at fair market value as determined in good faith using guidelines adopted by the Board of Trustees of the Fund, under the supervision of the Fund's Valuation Committee. Factors that may be considered to value foreign securities at fair market value may include, among others: the value of other securities traded on other markets, foreign currency exchange activity and the trading of financial products tied to foreign securities.
Other securities for which quotations are not readily available are valued at fair market value as determined in good faith using guidelines adopted by the Board of Trustees of the Fund, under the supervision of the Fund's Valuation Committee.
The Fund values its investment securities at fair value based upon procedures approved by the Board of Trustees on days when significant events occur after the close of the principal exchange on which the securities are traded, and as a result, are expected to materially effect the value of investments.
Transamerica IDEX Mutual Funds
Annual Report 2004
16
TA IDEX PIMCO Total Return
NOTES TO FINANCIAL STATEMENTS (continued)
At October 31, 2004
(all amounts in thousands)
NOTE 1.–(continued)
Throughout the year, the Fund may have a cash overdraft balance. A fee is incurred on this overdraft, calculated by multiplying the overdraft by a rate based on the federal funds rate. This fee is included in Custody fees in the Statement of Operations.
Cash: The Fund may leave cash overnight in its cash account with the custodian, Investors Bank & Trust Company ("IBT"). IBT has been contracted on behalf of the Fund to invest the excess cash into a savings account, which at October 31, 2004, was paying an interest rate of 1.30%.
TBA purchase commitments: The Fund may enter into "TBA" (to be announced) purchase commitments to purchase securities for a fixed price at a future date, typically not to exceed 45 days. TBA purchase commitments are considered securities in themselves, and involve a risk of loss if the value of the security to be purchased declines prior to settlement date, in addition to the risk of decline in the value of the Fund's other assets. Unsettled TBA purchase commitments are valued at the current value of the underlying securities, according to the procedures described under Security Valuations. TBA purchase commitments are included in the Schedule of Investments.
Repurchase agreements: The Fund is authorized to enter into repurchase agreements. The Fund, through IBT, receives delivery of the underlying securities, the value of which at the time of purchase is required to be an amount equal to at least 100% of the resale price. Repurchase agreements involve the risk that the seller will fail to repurchase the security, as agreed. In that case, the Fund will bear the risk of value fluctuations until the security can be sold and may encounter delays and incur costs in liquidating the security. In the event of bankruptcy or insolvency of the seller, delays and costs may be incurred.
Securities lending: The Fund may lend securities to enhance fund earnings from investing cash collateral in making such loans to qualified borrowers (typically broker/dealers). The Fund has engaged its custodian bank, IBT, as a lending agent to administer its securities lending program. IBT earned less than $1 of program income for its services. When the Fund makes a security loan, it receives cash collateral as protection against the risk that the borrower will default on the loan, and records an asset for the cash invested collateral and a liability for the return of the collateral.
Securities on loan are included in Investment securities at value in the Statement of Assets and Liabilities and remain on the Schedule of Investments.
Loans of securities are required to be secured by collateral at least equal to 102% of the value of the securities at inception of the loan, and not less then 100% thereafter. The Fund may invest cash collateral in short-term money market instruments including: U.S. Treasury Bills, U.S. agency obligations, commercial paper, money market mutual funds, repurchase agreements and other highly rated, liquid investments. During the life of securities loans, the collateral and securities loaned remain subject to fluctuation in value. IBT marks to market securities loaned and the collateral each business day. If additional collateral is due (at least $1), IBT collects additional cash collateral from the borrowers. Although securities loaned will be fully collateralized at all times, IBT may experience delays in, or may be prevented from, recovering the collateral on behalf of the Fund. The Fund may recall a loaned security position at any time from the borrower through IBT. In the event the borrower fails to timely return a recalled security, IBT may indemnify the Fund by purchasing replacement securities for the Fund at its own expense and claiming the collateral to fund such a purchase. IBT absorbs the loss if the collateral value is not sufficient to cover the cost of the replacement securities. If replacement securities are not available, IBT will credit the equivalent cash value to the Fund.
While a security is on loan, the Fund does not have the right to vote that security. However, if time permits, the Fund will attempt to recall a security on loan and vote the proxy.
Income from securities lending is included in the Statement of Operations. The amount of collateral and value of securities on loan are included in the Statement of Assets and Liabilities as well as in the Schedule of Investments.
Security transactions and investment income: Security transactions are recorded on the trade date. Security gains and losses are calculated on the specific identification basis. Interest income, including accretion of discounts and amortization of premiums, is recorded on the accrual basis commencing on the settlement date.
Foreign currency denominated investments: The accounting records of the Fund are maintained in U.S. dollars. Securities and other assets and liabilities denominated in foreign currencies are translated into U.S. dollars at the closing exchange rate each day. The cost of foreign securities is translated at the exchange rate in effect when the investment was acquired. The Fund combines fluctuations from currency exchange rates and fluctuations in value when computing net realized and unrealized gains or losses from investments.
Net foreign currency gains and losses resulting from changes in exchange rates include: 1) foreign currency fluctuations between trade date and settlement date of investment security transactions; 2) gains and losses on forward foreign currency contracts; and 3) the difference between the receivable amounts of interest and dividends recorded in the accounting records in U.S. dollars and the amounts actually received.
Foreign currency denominated assets may involve risks not typically associated with domestic transactions, including unanticipated movements in exchange currency rates, the degree of government supervision and regulation of security markets, and the possibility of political or economic instability.
Transamerica IDEX Mutual Funds
Annual Report 2004
17
TA IDEX PIMCO Total Return
NOTES TO FINANCIAL STATEMENTS (continued)
At October 31, 2004
(all amounts in thousands)
NOTE 1.–(continued)
Foreign capital gains taxes: The Fund may be subject to taxes imposed by countries in which it invests, with respect to its investment in issuers existing or operating in such countries. Such taxes are generally based on income earned or repatriated and capital gains realized on the sale of such investments. The Fund accrues such taxes when the related income or capital gains are earned. Some countries require governmental approval for the repatriation of investment income, capital or the proce eds of sales earned by foreign investors. In addition, if there is deterioration in a country's balance of payments or for other reasons, a country may impose temporary restrictions on foreign capital remittances abroad.
Forward foreign currency contracts: The Fund may enter into forward foreign currency contracts to hedge against exchange rate risk arising from investments in securities denominated in foreign currencies. Contracts are valued at the contractual forward rate and are marked to market daily, with the change in value recorded as an unrealized gain or loss. When the contracts are closed a realized gain or loss is incurred. Risks may arise from changes in market value of the underlying currencies and from the possible inability of counterparties to meet the terms of their contracts.
Open forward foreign currency contracts at October 31, 2004, are listed in the Schedule of Investments.
Swap agreements: The Fund may invest in swap agreements. A swap is an agreement to exchange the return generated by one instrument for the return generated by another instrument. The Fund may enter into interest rate and credit default swap agreements to manage its exposure to interest rates and credit risk. Interest rate swap agreements involve commitments to pay interest in exchange for a market-linked return, both based on notional amounts. To the extent the total return of the security or index underlying the transaction exceeds or falls short of the offsetting interest rate obligation, the Fund will receive a payment from or make a payment to the counterparty. In a credit default swap, one party makes a stream of payments to another party in exchange for the right to receive a specified return in the event of a default by a third party, typically corporate issues or sovereign issues of an emerging country, on its obligation. The Fund may use credit default swaps to provide a measure of protection against defaults of sovereign issuers (i.e., to reduce risk where the Fund owns or has exposure to the sovereign issuer) or to take an active long or short position with respect to the likelihood of a particular issuer's default.
Swaps are marked to market daily based upon quotations from market makers and vendors and the change in value, if any, is recorded as unrealized gain or loss in the Statement of Operations. Payments received or made at the beginning of the measurement period are reflected as such on the Statement of Assets and Liabilities. Net periodic payments or liquidation payments received or made at the termination of the swap are recorded as realized gain or loss in the Statement of Operations.
Entering into these agreements involves, to varying degrees, elements of credit, market and documentation risk in excess of the amounts recognized on the Statement of Assets and Liabilities. Such risks involve the possibility that there will be no liquid market for these agreements, that the counterparty to the agreements may default on its obligation to perform or disagree as to the meaning of contractual terms in the agreements, and that there may be unfavorable changes in interest rates.
Open swaps agreements at October 31, 2004, are listed in the Schedule of Investments.
Futures, options and swaptions contracts: The Fund may enter into futures and/or options contracts to manage exposure to market, interest rate or currency fluctuations. Futures contracts are valued at the settlement price established each day by the board of trade or exchange on which they are traded. Option contracts are valued at the average of the bid and ask ("Mean Quote") established each day at the close of the board of trade or exchange on which they are traded. The primary risks associated with futures contracts and options are imperfect correlation between the change in value of the securities held and the prices of futures contracts and options; the possibility of an illiquid market and inability of the counterparty to meet the contract terms. When the Fund writes a covered call or put option , an amount equal to the premium received by the Fund is included in the Fund's Statement of Assets and Liabilities as an asset and as an equivalent liability. The amount of the liability is subsequently marked-to-market to reflect the current value of the option written.
The Fund is authorized to write swaption contracts to manage exposure to fluctuations in interest rates and to enhance fund yield. Swaption contracts written by the Fund represents an option that gives the purchaser the right, but not the obligation, to enter into a previously agreed upon swap contract on a future date. If a written call option is exercised, the writer will enter a swap and is obligated to pay the fixed rate and receive a fixed rate in exchange. Swaptions are marked-to-market daily based upon quotations from market makers.
When the Fund writes an option or swaption contract, the premium received is recorded as a liability and is subsequently adjusted to the current value of the option or swaption. Changes in the value of the option or swaption are reported as Unrealized gains or losses in written options and swaptions contracts in the Statement of Assets and Liabilities. Gain or loss is recognized when the option or swaption contract expires or is closed. Premiums received from writing options or swaptions that expire or are exercised are treated by the Fund as realized gains from written options and swaptions contracts. The difference between the premium and the amount paid on affecting a closing purchase transaction is also treated as a realized gain, or if the premium is less than the amount paid for the closing purchase, as a realized loss.
Entering into an option or swaption contract involves, to varying degrees, the elements of credit, market and interest rate risk in excess of
Transamerica IDEX Mutual Funds
Annual Report 2004
18
TA IDEX PIMCO Total Return
NOTES TO FINANCIAL STATEMENTS (continued)
At October 31, 2004
(all amounts in thousands)
NOTE 1.–(continued)
the amounts reported in the Statement of Assets and Liabilities, associated with both option contracts and swap contracts. To reduce credit risk from potential counterparty default, the Fund enters into option or swaption contracts with counterparties whose creditworthiness has been approved by the Board of Trustees. The Fund bears the market risk arising from any changes in index values or interest rates.
The underlying face amounts of open futures, option, and swaption contracts at October 31, 2004, are listed in the Schedule of Investments. The variation margin receivable or payable, as applicable, is included in the Statement of Assets and Liabilities. Variation margin represents the additional payment due or excess deposits made in order to maintain the equity account at the required margin level.
Transactions in written options were as follows:
| | | Premium | | Contracts* | |
| Beginning Balance October 31, 2003 | | $ | – | | | | – | | |
| Sales | | | 11 | | | | 23 | | |
| Closing Buys | | | – | | | | – | | |
| Expirations | | | – | | | | – | | |
| Exercised | | | – | | | | – | | |
| Balance at October 31, 2004 | | $ | 11 | | | | 23 | | |
* Contracts not in thousands
Transactions in written swaptions were as follows:
| | | Premium | | Notional
Amount | |
Beginning Balance
October 31, 2003 | | $ | 280 | | | | 18,700 | | |
| Sales | | | 149 | | | | 15,800 | | |
| Closing Buys | | | – | | | | – | | |
| Expirations | | | (374 | ) | | | (30,800 | ) | |
| Exercised | | | – | | | | – | | |
| Balance at October 31, 2004 | | $ | 55 | | | | 3,700 | | |
Account maintenance fees: If the shareholder account balance falls below $1 by either shareholder action or as a result of market action, a $25 (not in thousands) fee is assessed every year until the balance reaches $1. The fee is assessed by redeeming shares in the shareholder's account.
No fee will be charged under the following conditions:
• accounts opened within the preceding 24 months
• accounts with an active monthly Automatic Investment Plan ($50 (not in thousands) minimum per fund)
• accounts owned by an individual which, when combined by social security number, have a balance of $5 or more
• accounts owned by individuals in the same household (by address) that have a combined balance of $5 or more
• UTMA/UGMA accounts
• Fiduciary accounts
• B-share accounts whose shares have started to convert to A-shares accounts (as long as combined value of both accounts is at least $1)
For the year ended October 31, 2004, this fee totaled less than $1. These fees are included in Paid in Capital in the Statement of Assets and Liabilities.
Redemption fees: A short-term trading redemption fee may be assessed on any fund shares in a fund account that are sold during the first five (5) New York Stock Exchange trading days following their purchase date. This redemption fee will equal 2% of the amount redeemed and shares held the longest will be treated as being redeemed first and shares held the shortest as being redeemed last. For the year ended October 31, 2004, the Fund received no redemption fees.
Dividend distributions: Distributions to shareholders are recorded on the ex-dividend date and are determined in accordance with Federal income tax regulations which may differ from GAAP.
NOTE 2. RELATED PARTY TRANSACTIONS
AEGON/Transamerica Fund Advisers, Inc. ("ATFA") is the Fund's investment adviser. AEGON/Transamerica Fund Services, Inc. ("ATFS") is the Fund's administrator. AFSG Securities Corp. ("AFSG") is the Fund's distributor/principal underwriter. AEGON/Transamerica Investor Services, Inc. ("ATIS") is the Fund's transfer agent. ATIS and AFSG are 100% owned by AUSA Holding Company ("AUSA"). ATFA is a directly owned subsidiary of Western Reserve Life Assurance Co. of Ohio (78%) ("WRL") and AUSA (22%). ATFS is a wholly owned subsidiary of WRL. AUSA and WRL are wholly owned indirect subsidiaries of AEGON NV, a Netherlands corporation.
The following schedule represents the percentage of fund assets owned by affiliated mutual funds (i.e. through the asset allocation funds):
| | | Net
Assets | | % of
Net Assets | |
TA IDEX Asset Allocation–
Conservative Portfolio | | $ | 20,304 | | | | 14 | % | |
TA IDEX Asset Allocation–
Moderate Growth Portfolio | | | 35,071 | | | | 24 | % | |
TA IDEX Asset Allocation–
Moderate Portfolio | | | 39,981 | | | | 27 | % | |
| Total | | $ | 95,356 | | | | 65 | % | |
Transamerica IDEX Mutual Funds
Annual Report 2004
19
TA IDEX PIMCO Total Return
NOTES TO FINANCIAL STATEMENTS (continued)
At October 31, 2004
(all amounts in thousands)
NOTE 2.–(continued)
Investment advisory fee: The Fund pays management fees to ATFA based on average daily net assets ("ANA") at the following rate:
0.70% of ANA
ATFA has contractually agreed to waive its advisory fee and will reimburse the Fund to the extent that operating expenses, excluding 12b-1 fees, exceed the following stated annual limit:
1.30% Expense Limit
If total fund expenses fall below the annual expense limitation agreement agreed to by the adviser within the succeeding three years, the Fund may be required to pay that adviser a portion or all of the waived advisory fees.
There were no expenses waived, reimbursed or recaptured during the fiscal year ended October 31, 2004. There are no amounts subject to recapture at October 31, 2004.
Distribution and service fees: The Fund has a 12b-1 distribution plan under the 1940 Act pursuant to which an annual fee, based on average daily net assets, is paid to the distributor for various disbursements such as broker-dealer account servicing fees and other promotional expenses of the Fund. The Fund is authorized under the 12b-1 plan to pay fees on each class up to the following limits:
| Class A | | | 0.35 | % | |
| Class B | | | 1.00 | % | |
| Class C | | | 1.00 | % | |
| Class C2 | | | 1.00 | % | |
| Class M | | | 0.90 | % | |
Class C2 and Class M merged into Class C on June 15, 2004 and September 24, 2004, respectively.
In the case the Fund or a class of shares of the Fund is closed to new investors or investments, the Fund is authorized to pay 12b-1 fees for past sales and distribution efforts and present and past investor services.
Underwriter commissions relate to front-end sales charges imposed for Class A and M shares and contingent deferred sales charges from Classes B, C, M and certain A share redemptions. For the year ended October 31, 2004, the underwriter commissions were as follows:
| Received by Underwriter | | $ | 248 | | |
| Retained by Underwriter | | | 13 | | |
| Contingent Deferred Sales Charge | | | 156 | | |
Administrative services: The Fund has entered into an agreement with ATFS for financial and legal fund administration services, which includes such items as compliance, expenses, financial statements and other reporting, distributions, tax returns, prospectus preparation, board of trustees meeting support and other legal matters. The Fund pays ATFS an annual fee of 0.015% of average net assets. The Legal fees on the Statement of Operations are for fees paid to external legal counsel.
The Fund paid ATFS $22 for the year ended October 31, 2004.
Transfer agent fees: The Fund pays ATIS an annual per-account charge of $20 (not in thousands) for each open account and $1.63 (not in thousands) for each closed account. There is no new account charge. The Fund paid ATIS $109 for the year ended October 31, 2004.
Deferred compensation plan: Each eligible Fund Trustee may elect participation in the Deferred Compensation Plan ("the Plan"). Under the Plan, such Trustees may defer payment of a percentage of their total fees earned as a Fund Trustee. These deferred amounts may be invested in any Transamerica IDEX Mutual Fund. At October 31, 2004, the value of invested plan amount was $4. Invested plan amounts and the total liability for deferred compensation to the Trustees under the Plan at October 31, 2004, are included in the accompanying Statement of Assets and Liabilities.
NOTE 3. INVESTMENT TRANSACTIONS
The cost of securities purchased and proceeds from securities sold (excluding short-term securities) for the year ended October 31, 2004, were as follows:
| Purchases of securities: | | | |
| Long-Term excluding U.S. Government | | $ | 17,069 | | |
| U.S. Government | | | 208,990 | | |
| Proceeds from maturities and sales of securities: | | | |
| Long-Term excluding U.S. Government | | | 9,486 | | |
| U.S. Government | | | 216,743 | | |
NOTE 4. FEDERAL INCOME TAX MATTERS
The Fund has not made any provision for federal income or excise taxes due to its policy to distribute all of its taxable income and capital gains to its shareholders and otherwise qualify as a regulated investment company under the Internal Revenue Code. Income and capital gain distributions are determined in accordance with income tax regulations, which may differ from GAAP. These differences are primarily due to differing treatment for items including, but not limited to, wash sales, net operating losses, capital loss carryforwards, and foreign currency transactions.
Reclassifications between Undistributed net investment income (loss), Undistributed net realized capital gains (loss) and Shares of beneficial interest are made to reflect income and gains available for distribution
Transamerica IDEX Mutual Funds
Annual Report 2004
20
TA IDEX PIMCO Total Return
NOTES TO FINANCIAL STATEMENTS (continued)
At October 31, 2004
(all amounts in thousands)
NOTE 4.–(continued)
under federal tax regulations. Results of operations and net assets are not effected by these reclassifications. These reclassifications are as follows:
Shares of beneficial interest, unlimited
shares authorized | | $ | (1 | ) | |
| Undistributed net investment income (loss) | | | 193 | | |
Accumulated net realized gain (loss) from
investment securities, futures contracts,
foreign currency transactions, written options
and swaptions, and swaps | | | (192 | ) | |
The tax character of distributions paid may differ from the character of distributions shown in the Statements of Changes in Net Assets due to short-term gains being treated as ordinary income for tax purposes. The tax character of distributions paid during 2003 and 2004 was as follows:
| 2003 Distributions paid from: | | | |
| Ordinary Income | | $ | 3,293 | | |
| Long-term capital gain | | | 210 | | |
| 2004 Distributions paid from: | | | |
| Ordinary Income | | $ | 3,914 | | |
| Long-term capital gain | | | 1,280 | | |
The tax basis components of distributable earnings as of October 31, 2004, are as follows:
| Undistributed Ordinary Income | | $ | 1,088 | | |
| Undistributed Long-term Capital Gains | | $ | 795 | | |
| Capital Loss Carryforward | | $ | – | | |
| Net Unrealized Appreciation (Depreciation) | | $ | 1,577 | * | |
* Amount includes unrealized appreciation/(depreciation) from derivatives.
The aggregate cost of investments and composition of unrealized appreciation (depreciation) for federal income tax purposes as of October 31, 2004, are as follows:
| Federal Tax Cost Basis | | $ | 168,909 | | |
| Unrealized Appreciation | | $ | 1,255 | | |
| Unrealized (Depreciation) | | | (84 | ) | |
| Net Unrealized Appreciation (Depreciation)* | | $ | 1,171 | | |
NOTE 5. OTHER MATTERS
Transamerica IDEX Mutual Funds ("TA IDEX"), and certain of its affiliated entities, have received requests for information from the Staff of the Securities and Exchange Commission in connection with market timing and late trading within the funds. TA IDEX and the affiliated entities have voluntarily cooperated in the investigation and have been providing the information as requested.
Transamerica IDEX Mutual Funds
Annual Report 2004
21
Report of Independent Registered Certified Public Accounting Firm
To the Board of Trustees and Shareholders of
TA IDEX PIMCO Total Return
In our opinion, the accompanying statement of assets and liabilities, including the schedule of investments, and the related statements of operations and of changes in net assets and the financial highlights present fairly, in all material respects, the financial position of TA IDEX PIMCO Total Return (the "Fund") (one of the portfolios constituting the Transamerica IDEX Mutual Funds) at October 31, 2004, the results of its operations for the year then ended, the changes in its net assets for each of the two years in the period then ended and the financial highlights for each of the periods indicated, in conformity with accounting principles generally accepted in the United States of America. These financial statements and financial highlights (hereafter referred to as "financial statements") are the responsibility of the Fund's management; our responsibility is to express an opinion on these finan cial statements based on our audits. We conducted our audits of these financial statements in accordance with the standards of the Public Company Accounting Oversight Board (United States). Those standards require that we plan and perform the audit to obtain reasonable assurance about whether the financial statements are free of material misstatement. An audit includes examining, on a test basis, evidence supporting the amounts and disclosures in the financial statements, assessing the accounting principles used and significant estimates made by management, and evaluating the overall financial statement presentation. We believe that our audits, which included confirmation of securities at October 31, 2004 by correspondence with the custodian and brokers, provide a reasonable basis for our opinion.

PricewaterhouseCoopers LLP
Tampa, Florida
December 28, 2004
Transamerica IDEX Mutual Funds
Annual Report 2004
22
TA IDEX PIMCO Total Return
SUPPLEMENTAL TAX INFORMATION (unaudited)
For tax purposes, the Fund has made a Long-Term Capital Gain Designation of $1,280 for the year ended October 31, 2004.
The information and distributions reported herein may differ from the information and distributions taxable to the shareholders for the calendar year ending December 31, 2004. Complete information will be computed and reported in conjunction with your 2004 Form 1099-DIV.
SUPPLEMENTAL INFORMATION
RESULTS OF SHAREHOLDER PROXY (unaudited)
At a special meeting of Class M shareholders of each series of Transamerica IDEX (except TA IDEX Federated Tax Exempt and TA IDEX Protected Principal Stock) held on September 2, 2004, the results of the Proposal were as follows:
Proposal 1: Approval of a conversion of Class M shares into Class C shares of the Funds, which will result in bearing the distribution and service fees payable under the 12b-1 Plan of Distribution for the Class C shares of the Funds.
| For | | Against | | Abstentions/Broker Non-Votes | |
| | 87.98 | % | | | 2.00 | % | | | 10.02 | % | |
Transamerica IDEX Mutual Funds
Annual Report 2004
23
TA IDEX Protected Principal Stock
MARKET ENVIRONMENT
Equity markets continued their move to the upside for the year ended October 31, 2004. Building on a robust rebound from the bear market of 2000 to 2002, the broad equity market as represented by the Standard and Poor's 500 Composite Stock Index ('S&P 500") posted a total return of 9.41%. Increasing corporate profitability and continued resilience in the economic recovery all combined to propel the market higher. Larger capitalization stocks lagged during this period, with the Dow Jones Industrial Average ("Dow Jones") posting a total return of 4.46%.
Nearly all of the gains for the year occurred in the strong market environment of November 2003 to January 2004. After that, the market lost its head of steam and drifted in a narrow trading range for the balance of the year. Likewise, market volatility, a key driver of option premiums and a widely watched barometer of risk in the market, shrunk to levels not seen since the early- to mid-nineties.
A number of cross currents dominated market sentiment for the year and left investors with little guidance upon which to base investment decisions. On the positive side, corporate profitability remained robust, productivity continued to grow throughout the year, and the economy posted solid, although not spectacular, growth. On the negative side, investors contended with high oil and gasoline prices, an unexpected lack of recovery in jobs growth, difficult periods in the war in Iraq, and the uncertainty of a hotly contested presidential race.
Bonds also posted a solid year of performance, with the widely followed Lehman Brothers U.S. Intermediate Government/Credit Index ("LBIGC") earning a total return of 4.33%, despite the Federal Reserve Board's ("Fed") raising short-term interest rates three times during the period from October 2003 through September 2004 from 1% to 1.75%.
PERFORMANCE
For the year ended October 31, 2004, the TA IDEX Protected Principal Stock, Class A returned 4.82%. By comparison its benchmark, the S&P 500, returned 9.41%.
STRATEGY REVIEW
As a result of low volatility in the equity markets, cash flows from the portfolio's call writing activity were below historical average, but a tame stock market resulted in premiums earned directly benefiting the portfolio's performance. As mentioned above, the portfolio's benchmark, the S&P 500, earned a total return for the same period of 9.41%, while bonds, as measured by the LBIGC, posted a total return of 4.33%
Buoyed by tax cuts, low interest rates and improving corporate earnings, the market in November and December of 2003 continued its strong performance from the previous month, posting a return of 6.17%. The TA IDEX Protected Principal Stock also benefited from the market's run, as well as the up tick in market volatility, and posted a return for the same period of 1.38% as the year came to a close.
During the first quarter of 2004, the TA IDEX Protected Principal Stock earned fairly consistent, positive performance, although option premium levels were relatively low. Despite increasing uncertainty as the quarter unfolded, the portfolio posted returns which were positive or flat for each of the three months of the quarter, cumulatively totaling 0.87% for the quarter. The S&P 500 earned a positive return of 1.69% for the quarter, despite the Dow Jones return of -0.43% and the NASDAQ declining -0.46%. The S&P 500 continued its rally into January and February, as the portfolio lagged with in-the-money index call positions. During March, those positions helped the portfolio buffer the sharp sell-off. Stock market volatility declined in January and February, as it had during the equity market rally in the fourth quarter of 2003. During the March sell-off, volatility spiked sharply, allowing the portfolio to restore a more favorable premium-to-earn posture. Bonds responded favorably to disappointing job creations and the lack of economic vigor. The LBIGC earned a total return of 2.47% for the first quarter.
For the second quarter of 2004, the TA IDEX Protected Principal Stock returned 1.45%, slightly better than the first quarter. The S&P 500, on the strength of a strong June performance, earned 1.72%–nearly the same as its first quarter return. The bond market ended one of its worst quarters in over a decade, with the LBIGC down -2.52% for the second quarter 2004.
In the third quarter of 2004, the portfolio demonstrated its ability to dampen volatility as the S&P 500 seesawed. When the S&P 500 declined sharply in July and into mid-August, hedging helped preserve the portfolio's assets. When the S&P 500 recovered in the second half of the quarter, net premiums from hedging transactions more than offset a slight initial decline in the portfolio. For the quarter, the portfolio's shares posted a net gain of 0.19% while the S&P 500 dipped by -1.87%. Bonds, as represented by the LBIGC, recovered from their decline in the second quarter, posting a gain of 2.71% for the third quarter.
Transamerica IDEX Mutual Funds
Annual Report 2004
1
TA IDEX Protected Principal Stock (continued)
TA IDEX Protected Principal Stock employs multiple riskmanagement techniques designed to provide consistent returns over time and also to limit investment volatility to levels well below that of many equity funds. While these techniques reduce volatility in both directions, the objective is to achieve returns somewhat similar to widely followed stock indices over time. The first risk management feature the TA IDEX Protected Principal Stock employs is broad diversification. The portfolio's core strategy involves the ownership of all of the stocks represented in the S&P 500. The next step is the sale of cash-settled index call options, which serve as the portfolio's primary source of return. The continuous generation of cash flow provides the portfolio with a consistent return in exchange for the future performance of the portfolio's underlying stock holdings. This cash flow varies over time and is somewhat limited in its ability to adequately protect the portfolio in the case of a sudden, sharp sell-off in the market. Therefore, the next risk management step is the purchase of index put options to behave as a "safety net" to reduce the exposure of the portfolio during a sharp market decline. The final risk management feature is the Guarantee as described in the prospectus.
J. Patrick Rogers
Fund Manager
Gateway Investment Advisers, L.P.
Transamerica IDEX Mutual Funds
Annual Report 2004
2
TA IDEX Protected Principal Stock
Comparison of change in value of $10,000 investment in Class A shares and its comparative index.
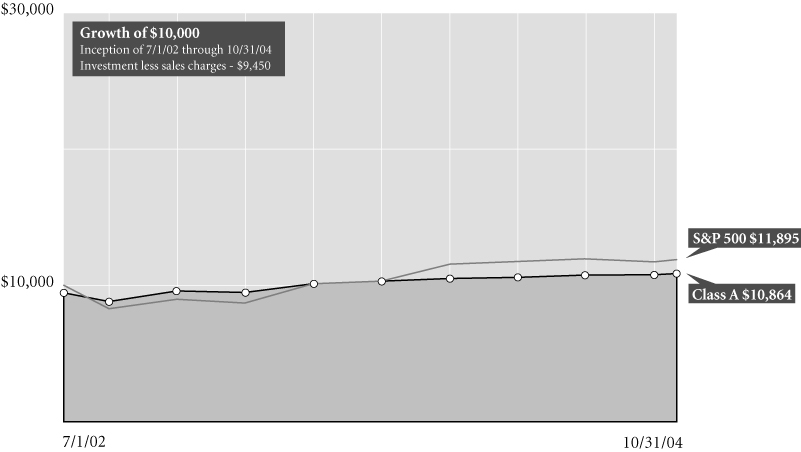
Average Annual Total Return for Periods Ended 10/31/04
| | | 1 year | | From
Inception | | Inception
Date | |
| Class A (NAV) | | | 4.82 | % | | | 6.10 | % | | 7/1/02 | |
| Class A (POP) | | | (0.94 | )% | | | 3.56 | % | | 7/1/02 | |
| S&P 5001 | | | 9.41 | % | | | 7.70 | % | | 7/1/02 | |
| Class B (NAV) | | | 4.43 | % | | | 5.94 | % | | 7/1/02 | |
| Class B (POP) | | | (0.57 | )% | | | 4.34 | % | | 7/1/02 | |
| Class C (NAV) | | | 4.24 | % | | | 5.85 | % | | 7/1/02 | |
| Class C (POP) | | | 3.24 | % | | | 5.85 | % | | 7/1/02 | |
| Class M (NAV) | | | 4.44 | % | | | 5.90 | % | | 7/1/02 | |
| Class M (POP) | | | 2.39 | % | | | 5.44 | % | | 7/1/02 | |
NOTES
1 The Standard & Poor's 500 Composite Stock (S&P 500) Index is an unmanaged index used as a general measure of market performance. Calculations assume dividends and capital gains are reinvested and do not include any managerial expenses. From inception calculation is based on life of Class A shares. Source: Standard & Poor's Micropal®© Micropal, Inc. 2004 – 1-800-596-5323 – http://www.micropal.com.
The performance data presented represents past performance, future results may vary. Performance data does not reflect the deduction of taxes that would be paid on fund distributions or the redemption of fund shares. Investment return and principal value will fluctuate so that an investor's shares, when redeemed, may be worth more or less than their original cost. Current performance may be lower or higher than performance quoted.
Public Offering Price (POP) returns include the reinvestment of dividends and capital gains and reflect the maximum sales charge of 5.5% for A shares and 1% for M shares or the maximum applicable contingent deferred sales charge (5% in the 1st year, decreasing to 0% after 6 years) for Class B shares. Class C shares do not impose a sales charge. Shares purchased prior to March 1, 2004 are subject to a maximum applicable contingent deferred sales charge (5% in the 1st year, decreasing to 0% after 7 years) for Class B shares and (2% in the 1st year, decreasing to 0% after 2 years) for Class C shares. Net Asset Value (NAV) returns include the reinvestment of dividends and capital gains but do not reflect any sales charges.
Investments that utilize options strategies may be subject to specific risks, including limited opportunity to participate in rising stock markets or increased risk during market declines. In general,mutual funds that invest in stocks are subject to risks including weaknesses in the market as a whole, in a particular industry, or in a specific holding, and from adverse political or economic developments here or abroad.
Shareholders may lose some or all of the value of their guaranteed amount if they redeem before the end of the 5-year Guarantee Period.
This material must be preceded or accompanied by a current prospectus, which includes specific contents regarding the investment objectives and policies of this fund.
Transamerica IDEX Mutual Funds
Annual Report 2004
3
TA IDEX Protected Principal Stock
UNDERSTANDING YOUR FUND'S EXPENSES (unaudited)
SHAREHOLDER EXPENSES
The following Example is intended to help you understand your ongoing costs (in dollars and cents) of investing in a Fund and to compare these costs with the ongoing costs of investing in other funds.
The Example is based on an investment of $1,000 invested at the beginning of the period and held for the entire period from May 1, 2004 to October 31, 2004.
ACTUAL EXPENSES
The first line in the table below provides information about actual account values and actual expenses. You may use the information in this line, together with the amount you invested, to estimate the expenses that you paid over the period. Simply divide your account value by $1,000 (for example, an $8,600 account value divided by $1,000 = 8.6), then multiply the result by the number in the first line of your Fund under the heading entitled "Expenses Paid During Period" to estimate the expenses you paid on your account during this period.
HYPOTHETICAL EXAMPLE FOR COMPARISON PURPOSES
The second line in the table below provides information about hypothetical account values and hypothetical expenses based on each Fund's actual expense ratio and an assumed rate of return of 5% per year before expenses, which is not the Fund's actual return. The hypothetical account values and expenses may not be used to estimate the actual ending account balance or expenses you paid for the period. You may use this information to compare the ongoing costs of investing in your Fund and other funds. To do so, compare this 5% hypothetical example with the 5% hypothetical examples that appear in the shareholder reports of the other funds.
Please note that the expenses shown in the table are meant to highlight your ongoing costs only and do not reflect any transactional costs, such as sales charges, redemption fees, brokerage commissions paid on purchases and sales of fund shares. Therefore, the second line under each Fund in the table is useful in comparing ongoing costs only, and will not help you determine the relative total costs of owning different funds. In addition, note that the expenses shown in the table are meant to highlight your ongoing costs and do not reflect any transaction costs.
| | | Beginning
Account
Value | | Ending
Account
Value | | Annualized
Expense
Ratio | | Expenses Paid
During Period (a) | |
| Class A | | | |
| Actual | | $ | 1,000.00 | | | $ | 1,029.00 | | | | 2.51 | % | | $ | 12.80 | | |
| Hypothetical (b) | | | 1,000.00 | | | | 1,012.52 | | | | 2.51 | | | | 12.70 | | |
| Class B | | | |
| Actual | | | 1,000.00 | | | | 1,029.10 | | | | 2.72 | | | | 13.87 | | |
| Hypothetical (b) | | | 1,000.00 | | | | 1,010.91 | | | | 2.72 | | | | 13.75 | | |
| Class C | | | |
| Actual | | | 1,000.00 | | | | 1,027.20 | | | | 3.03 | | | | 15.44 | | |
| Hypothetical (b) | | | 1,000.00 | | | | 1,009.35 | | | | 3.03 | | | | 15.31 | | |
| Class M | | | |
| Actual | | | 1,000.00 | | | | 1,027.20 | | | | 2.96 | | | | 15.08 | | |
| Hypothetical (b) | | | 1,000.00 | | | | 1,010.26 | | | | 2.96 | | | | 14.96 | | |
(a) Expenses are calculated using each Fund's annualized expense ratio (as disclosed in the table), multiplied by the average account value for the period, multiplied by number of days in the period (184 days), and divided by the number of days in the year (366 days).
(b) 5% return per year before expenses.
GRAPHIC PRESENTATION OF SCHEDULE OF INVESTMENTS
By Sector
At October 31, 2004
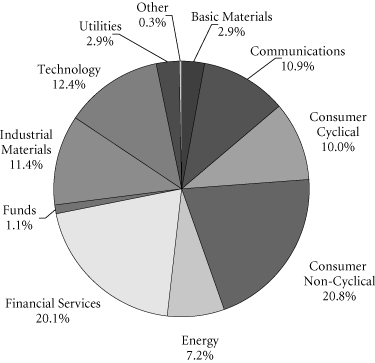
This chart shows the percentage breakdown by sector of the Fund's total investment securities.
Transamerica IDEX Mutual Funds
Annual Report 2004
4
TA IDEX Protected Principal Stock
SCHEDULE OF INVESTMENTS
At October 31, 2004
(all amounts except share amounts in thousands)
| | | Shares | | Value | |
| COMMON STOCKS (98.5%) (a) | | | |
| Aerospace (1.5%) | | | |
| Boeing Co. (The) | | | 4,300 | | | $ | 215 | | |
| General Dynamics Corp. | | | 1,100 | | | | 112 | | |
| Goodrich Corp. | | | 600 | | | | 18 | | |
| Lockheed Martin Corp. | | | 2,400 | | | | 132 | | |
| Northrop Grumman Corp. | | | 1,970 | | | | 102 | | |
| Textron, Inc. | | | 700 | | | | 48 | | |
| United Technologies Corp. | | | 2,800 | | | | 260 | | |
| Air Transportation (0.4%) | | | |
| Delta Airlines, Inc. (b) | | | 700 | | | | 4 | | |
| FedEx Corp. | | | 1,600 | | | | 146 | | |
| Southwest Airlines Co. | | | 4,100 | | | | 65 | | |
| Amusement & Recreation Services (0.6%) | | | |
| Harrah's Entertainment, Inc. | | | 600 | | | | 35 | | |
| Walt Disney Co. | | | 11,200 | | | | 282 | | |
| Apparel & Accessory Stores (0.5%) | | | |
| Gap (The), Inc. | | | 4,700 | | | | 94 | | |
| Kohl's Corp. (b) | | | 1,800 | | | | 91 | | |
| Ltd. Brands | | | 2,500 | | | | 62 | | |
| Nordstrom, Inc. | | | 800 | | | | 35 | | |
| Apparel Products (0.2%) | | | |
| Cintas Corp. | | | 900 | | | | 39 | | |
| Jones Apparel Group, Inc. | | | 600 | | | | 21 | | |
| Liz Claiborne, Inc. | | | 600 | | | | 25 | | |
| VF Corp. | | | 600 | | | | 32 | | |
| Auto Repair, Services & Parking (0.0%) | | | |
| Ryder System, Inc. | | | 300 | | | | 15 | | |
| Automotive (1.2%) | | | |
| Dana Corp. | | | 800 | | | | 12 | | |
| Delphi Corp. | | | 3,000 | | | | 25 | | |
| Ford Motor Co. | | | 9,800 | | | | 128 | | |
| General Motors Corp. | | | 3,000 | | | | 116 | | |
| Genuine Parts Co. | | | 900 | | | | 36 | | |
| Harley-Davidson, Inc. | | | 1,600 | | | | 92 | | |
| Honeywell International, Inc. | | | 4,500 | | | | 152 | | |
| ITT Industries, Inc. | | | 500 | | | | 41 | | |
| Navistar International Corp. (b) | | | 400 | | | | 14 | | |
| PACCAR, Inc. | | | 900 | | | | 62 | | |
| Automotive Dealers & Service Stations (0.1%) | | | |
| AutoNation, Inc. (b) | | | 1,450 | | | | 25 | | |
| AutoZone, Inc. (b) | | | 400 | | | | 33 | | |
| Beverages (2.2%) | | | |
| Adolph Coors Co.–Class B | | | 200 | | | | 13 | | |
| Anheuser-Busch Cos., Inc. | | | 4,100 | | | | 205 | | |
| Coca-Cola Co. (The) | | | 13,100 | | | | 533 | | |
| | | Shares | | Value | |
| Beverages (continued) | | | |
| Coca-Cola Enterprises, Inc. | | | 2,500 | | | $ | 52 | | |
| Pepsi Bottling Group, Inc. | | | 1,400 | | | | 39 | | |
| PepsiCo, Inc. | | | 9,000 | | | | 446 | | |
| Business Credit Institutions (0.1%) | | | |
| CIT Group, Inc. (b) | | | 1,200 | | | | 48 | | |
| Business Services (1.7%) | | | |
| Cendant Corp. | | | 5,400 | | | | 111 | | |
| Clear Channel Communications, Inc. | | | 3,100 | | | | 104 | | |
| Convergys Corp. (b) | | | 700 | | | | 9 | | |
| eBay, Inc. (b) | | | 3,400 | | | | 332 | | |
| Equifax, Inc. | | | 700 | | | | 18 | | |
| First Data Corp. | | | 4,495 | | | | 186 | | |
| Interpublic Group of Cos., Inc. (b) | | | 2,300 | | | | 28 | | |
| Monster Worldwide, Inc. (b) | | | 600 | | | | 17 | | |
| Moody's Corp. | | | 800 | | | | 62 | | |
| Omnicom Group, Inc. | | | 1,000 | | | | 79 | | |
| Robert Half International, Inc. | | | 900 | | | | 24 | | |
| Chemicals & Allied Products (3.3%) | | | |
| Air Products & Chemicals, Inc. | | | 1,200 | | | | 64 | | |
| Alberto Culver Co.–Class B | | | 500 | | | | 22 | | |
| Avon Products, Inc. | | | 2,500 | | | | 99 | | |
| Clorox Co. | | | 1,100 | | | | 60 | | |
| Colgate-Palmolive Co. | | | 2,900 | | | | 129 | | |
| Dow Chemical Co. (The) | | | 4,900 | | | | 220 | | |
| Eastman Chemical Co. | | | 400 | | | | 19 | | |
| Ecolab, Inc. | | | 1,400 | | | | 47 | | |
| EI Du Pont de Nemours & Co. | | | 5,300 | | | | 227 | | |
| Great Lakes Chemical Corp. | | | 300 | | | | 8 | | |
| International Flavors & Fragrances, Inc. | | | 500 | | | | 20 | | |
| Monsanto Co. | | | 1,471 | | | | 63 | | |
| PPG Industries, Inc. | | | 900 | | | | 57 | | |
| Praxair, Inc. | | | 1,800 | | | | 76 | | |
| Procter & Gamble Co. | | | 13,600 | | | | 696 | | |
| Rohm & Haas Co. | | | 1,200 | | | | 51 | | |
| Sherwin-Williams Co. (The) | | | 700 | | | | 30 | | |
| Commercial Banks (10.2%) | | | |
| AmSouth Bancorp | | | 1,900 | | | | 50 | | |
| Bank of America Corp. | | | 21,718 | | | | 973 | | |
| Bank of New York Co. (The), Inc. | | | 4,000 | | | | 130 | | |
| BB&T Corp. | | | 3,000 | | | | 123 | | |
| Citigroup, Inc. | | | 27,700 | | | | 1,229 | | |
| Comerica, Inc. | | | 900 | | | | 55 | | |
| Fifth Third Bancorp | | | 3,000 | | | | 148 | | |
| First Horizon National Corp. | | | 700 | | | | 30 | | |
| Huntington Bancshares, Inc. | | | 1,200 | | | | 29 | | |
| JPMorgan Chase & Co. | | | 19,048 | | | | 735 | | |
The notes to the financial statements are an integral part of this report.
Transamerica IDEX Mutual Funds
Annual Report 2004
5
TA IDEX Protected Principal Stock
SCHEDULE OF INVESTMENTS (continued)
At October 31, 2004
(all amounts except share amounts in thousands)
| | | Shares | | Value | |
| Commercial Banks (continued) | | | |
| KeyCorp | | | 2,200 | | | $ | 74 | | |
| M&T Bank Corp. | | | 600 | | | | 62 | | |
| Marshall & IIsley Corp. | | | 1,200 | | | | 50 | | |
| MBNA Corp. | | | 6,800 | | | | 174 | | |
| Mellon Financial Corp. | | | 2,300 | | | | 66 | | |
| National City Corp. | | | 3,200 | | | | 125 | | |
| North Fork Bancorp, Inc. | | | 1,000 | | | | 44 | | |
| Northern Trust Corp. | | | 1,200 | | | | 51 | | |
| PNC Financial Services Group, Inc. | | | 1,500 | | | | 78 | | |
| Providian Financial Corp. (b) | | | 1,600 | | | | 25 | | |
| Regions Financial Corp. | | | 2,481 | | | | 87 | | |
| SouthTrust Corp. | | | 1,800 | | | | 78 | | |
| State Street Corp. | | | 1,800 | | | | 81 | | |
| SunTrust Banks, Inc. | | | 1,600 | | | | 113 | | |
| Synovus Financial Corp. | | | 1,700 | | | | 46 | | |
| US Bancorp | | | 10,000 | | | | 286 | | |
| Wachovia Corp. | | | 7,000 | | | | 344 | | |
| Wells Fargo & Co. | | | 9,000 | | | | 537 | | |
| Zions Bancorp | | | 500 | | | | 33 | | |
| Communication (1.2%) | | | |
| Comcast Corp.–Class A (b) | | | 12,119 | | | | 358 | | |
| Viacom, Inc.–Class B | | | 9,300 | | | | 339 | | |
| Communications Equipment (1.7%) | | | |
| ADC Telecommunications, Inc. (b) | | | 4,100 | | | | 9 | | |
| Andrew Corp. (b) | | | 700 | | | | 10 | | |
| Avaya, Inc. (b) | | | 2,400 | | | | 35 | | |
| CIENA Corp. (b) | | | 2,800 | | | | 7 | | |
| Comverse Technology, Inc. (b) | | | 1,000 | | | | 21 | | |
| Corning, Inc. (b) | | | 7,400 | | | | 85 | | |
| Lucent Technologies, Inc. (b) | | | 23,000 | | | | 82 | | |
| Motorola, Inc. | | | 12,700 | | | | 219 | | |
| Network Appliance, Inc. (b) | | | 1,900 | | | | 46 | | |
| QUALCOMM, Inc. | | | 8,700 | | | | 364 | | |
| Rockwell Collins, Inc. | | | 1,000 | | | | 35 | | |
| Scientific-Atlanta, Inc. | | | 800 | | | | 22 | | |
| Tellabs, Inc. (b) | | | 2,200 | | | | 18 | | |
| Computer & Data Processing Services (5.9%) | | | |
| Adobe Systems, Inc. | | | 1,300 | | | | 73 | | |
| Affiliated Computer Services, Inc.–Class A (b) | | | 650 | | | | 36 | | |
| Autodesk, Inc. | | | 600 | | | | 32 | | |
| Automatic Data Processing, Inc. | | | 3,100 | | | | 135 | | |
| BMC Software, Inc. (b) | | | 1,200 | | | | 23 | | |
| Citrix Systems, Inc. (b) | | | 900 | | | | 22 | | |
| Computer Associates International, Inc. | | | 3,100 | | | | 86 | | |
| Computer Sciences Corp. (b) | | | 1,000 | | | | 50 | | |
| Compuware Corp. (b) | | | 2,100 | | | | 12 | | |
| | | Shares | | Value | |
| Computer & Data Processing Services (continued) | |
| Deluxe Corp. | | | 300 | | | $ | 11 | | |
| Electronic Arts, Inc. (b) | | | 1,600 | | | | 72 | | |
| Electronic Data Systems Corp. | | | 2,800 | | | | 60 | | |
| Fiserv, Inc. (b) | | | 1,100 | | | | 39 | | |
| IMS Health, Inc. | | | 1,300 | | | | 28 | | |
| Intuit, Inc. (b) | | | 1,000 | | | | 45 | | |
| Mercury Interactive Corp. (b) | | | 500 | | | | 22 | | |
| Microsoft Corp. | | | 58,300 | | | | 1,632 | | |
| NCR Corp. (b) | | | 500 | | | | 28 | | |
| Novell, Inc. (b) | | | 2,100 | | | | 15 | | |
| Oracle Corp. (b) | | | 27,700 | | | | 351 | | |
| Parametric Technology Corp. (b) | | | 1,500 | | | | 8 | | |
| Peoplesoft, Inc. (b) | | | 2,000 | | | | 42 | | |
| Sabre Holdings Corp. | | | 700 | | | | 15 | | |
| Siebel Systems, Inc. (b) | | | 2,700 | | | | 26 | | |
| Sun Microsystems, Inc. (b) | | | 17,800 | | | | 81 | | |
| SunGard Data Systems, Inc. (b) | | | 1,600 | | | | 42 | | |
| Symantec Corp. (b) | | | 1,650 | | | | 94 | | |
| Unisys Corp. (b) | | | 1,800 | | | | 19 | | |
| VERITAS Software Corp. (b) | | | 2,300 | | | | 50 | | |
| Yahoo!, Inc. (b) | | | 7,200 | | | | 261 | | |
| Computer & Office Equipment (4.7%) | |
| Apple Computer, Inc. (b) | | | 2,100 | | | | 110 | | |
| Cisco Systems, Inc. (b) | | | 36,300 | | | | 697 | | |
| Dell, Inc. (b) | | | 13,400 | | | | 470 | | |
| EMC Corp. (b) | | | 13,000 | | | | 167 | | |
| Gateway, Inc. (b) | | | 2,000 | | | | 12 | | |
| Hewlett-Packard Co. | | | 16,200 | | | | 302 | | |
| International Business Machines Corp. | | | 8,900 | | | | 799 | | |
| Jabil Circuit, Inc. (b) | | | 1,100 | | | | 27 | | |
| Lexmark International, Inc. (b) | | | 700 | | | | 58 | | |
| Pitney Bowes, Inc. | | | 1,200 | | | | 52 | | |
| Symbol Technologies, Inc. | | | 1,300 | | | | 19 | | |
| Construction (0.2%) | |
| Centex Corp. | | | 700 | | | | 36 | | |
| Fluor Corp. | | | 400 | | | | 19 | | |
| KB Home | | | 200 | | | | 16 | | |
| Pulte Homes, Inc. | | | 700 | | | | 38 | | |
| Department Stores (0.4%) | |
| Dillard's, Inc.–Class A | | | 500 | | | | 10 | | |
| Federated Department Stores | | | 1,000 | | | | 50 | | |
| JC Penney Co., Inc. | | | 1,500 | | | | 52 | | |
| May Department Stores Co. (The) | | | 1,600 | | | | 42 | | |
| Sears Roebuck & Co. | | | 1,100 | | | | 38 | | |
| TJX Cos., Inc. | | | 2,600 | | | | 62 | | |
The notes to the financial statements are an integral part of this report.
Transamerica IDEX Mutual Funds
Annual Report 2004
6
TA IDEX Protected Principal Stock
SCHEDULE OF INVESTMENTS (continued)
At October 31, 2004
(all amounts except share amounts in thousands)
| | | Shares | | Value | |
| Drug Stores & Proprietary Stores (0.5%) | |
| CVS Corp. | | | 2,100 | | | $ | 91 | | |
| Walgreen Co. | | | 5,300 | | | | 190 | | |
| Educational Services (0.1%) | |
| Apollo Group, Inc.–Class A (b) | | | 1,000 | | | | 66 | | |
| Electric Services (2.0%) | |
| AES Corp. (The) (b) | | | 3,300 | | | | 36 | | |
| Allegheny Energy, Inc. (b) | | | 700 | | | | 13 | | |
| American Electric Power Co., Inc. | | | 2,100 | | | | 69 | | |
| Calpine Corp. (b) | | | 2,400 | | | | 6 | | |
| CenterPoint Energy, Inc. | | | 1,700 | | | | 18 | | |
| CMS Energy Corp. (b) | | | 1,000 | | | | 9 | | |
| Consolidated Edison, Inc. | | | 1,300 | | | | 56 | | |
| Constellation Energy Group, Inc. | | | 900 | | | | 37 | | |
| Dominion Resources, Inc. | | | 1,800 | | | | 116 | | |
| DTE Energy Co. | | | 900 | | | | 38 | | |
| Duke Energy Corp. | | | 4,800 | | | | 118 | | |
| Edison International | | | 1,800 | | | | 55 | | |
| FirstEnergy Corp. | | | 1,800 | | | | 74 | | |
| FPL Group, Inc. | | | 1,000 | | | | 69 | | |
| Pinnacle West Capital Corp. | | | 500 | | | | 21 | | |
| PPL Corp. | | | 1,000 | | | | 52 | | |
| Progress Energy, Inc. | | | 1,300 | | | | 54 | | |
| Sempra Energy | | | 1,200 | | | | 40 | | |
| Southern Co. (The) | | | 3,800 | | | | 120 | | |
| TECO Energy, Inc. | | | 1,000 | | | | 14 | | |
| TXU Corp. | | | 1,600 | | | | 98 | | |
| Xcel Energy, Inc. | | | 2,200 | | | | 38 | | |
| Electric, Gas & Sanitary Services (0.8%) | |
| Ameren Corp. | | | 1,000 | | | | 48 | | |
| Cinergy Corp. | | | 1,000 | | | | 40 | | |
| Entergy Corp. | | | 1,200 | | | | 78 | | |
| Exelon Corp. | | | 3,500 | | | | 139 | | |
| NiSource, Inc. | | | 1,400 | | | | 30 | | |
| PG&E Corp. (b) | | | 2,200 | | | | 70 | | |
| Public Service Enterprise Group, Inc. | | | 1,300 | | | | 55 | | |
| Electronic & Other Electric Equipment (3.7%) | |
| Cooper Industries, Ltd.–Class A | | | 500 | | | | 32 | | |
| Emerson Electric Co. | | | 2,300 | | | | 147 | | |
| General Electric Co. | | | 56,600 | | | | 1,931 | | |
| Maytag Corp. | | | 400 | | | | 7 | | |
| Whirlpool Corp. | | | 400 | | | | 23 | | |
| Electronic Components & Accessories (3.5%) | |
| Advanced Micro Devices, Inc. (b) | | | 1,900 | | | | 32 | | |
| Altera Corp. (b) | | | 2,000 | | | | 45 | | |
| American Power Conversion Corp. | | | 1,100 | | | | 21 | | |
| Analog Devices, Inc. | | | 2,000 | | | | 81 | | |
| | | Shares | | Value | |
| Electronic Components & Accessories (continued) | | | |
| Applied Micro Circuits Corp. (b) | | | 1,700 | | | $ | 6 | | |
| Broadcom Corp.–Class A (b) | | | 1,700 | | | | 46 | | |
| Intel Corp. | | | 34,500 | | | | 768 | | |
| JDS Uniphase Corp. (b) | | | 7,700 | | | | 24 | | |
| Linear Technology Corp. | | | 1,700 | | | | 64 | | |
| LSI Logic Corp. (b) | | | 2,100 | | | | 10 | | |
| Maxim Integrated Products, Inc. | | | 1,700 | | | | 75 | | |
| Micron Technology, Inc. (b) | | | 3,200 | | | | 39 | | |
| Molex, Inc. | | | 1,000 | | | | 30 | | |
| National Semiconductor Corp. (b) | | | 1,900 | | | | 32 | | |
| Novellus Systems, Inc. (b) | | | 800 | | | | 21 | | |
| NVIDIA Corp. (b) | | | 900 | | | | 13 | | |
| PMC-Sierra, Inc. (b) | | | 1,000 | | | | 10 | | |
| Power-One, Inc. (b) | | | 500 | | | | 4 | | |
| QLogic Corp. (b) | | | 500 | | | | 16 | | |
| Sanmina-SCI Corp. (b) | | | 2,800 | | | | 22 | | |
| Solectron Corp. (b) | | | 4,900 | | | | 26 | | |
| Texas Instruments, Inc. | | | 9,200 | | | | 225 | | |
| Tyco International, Ltd. | | | 10,900 | | | | 340 | | |
| Xilinx, Inc. | | | 1,900 | | | | 58 | | |
| Environmental Services (0.2%) | | | |
| Allied Waste Industries, Inc. (b) | | | 1,400 | | | | 11 | | |
| Waste Management, Inc. | | | 3,000 | | | | 85 | | |
| Fabricated Metal Products (0.6%) | | | |
| Crane Co. | | | 300 | | | | 8 | | |
| Fortune Brands, Inc. | | | 800 | | | | 58 | | |
| Gillette Co. (The) | | | 5,200 | | | | 216 | | |
| Parker Hannifin Corp. | | | 600 | | | | 42 | | |
| Finance (1.1%) | | | |
| SPDR Trust Series 1 | | | 5,465 | | | | 620 | | |
| Food & Kindred Products (2.2%) | | | |
| Altria Group, Inc. | | | 11,200 | | | | 543 | | |
| Archer-Daniels-Midland Co. | | | 3,300 | | | | 64 | | |
| Campbell Soup Co. | | | 2,200 | | | | 59 | | |
| ConAgra Foods, Inc. | | | 2,800 | | | | 74 | | |
| General Mills, Inc. | | | 2,000 | | | | 88 | | |
| Hercules, Inc. (b) | | | 600 | | | | 9 | | |
| Hershey Foods Corp. | | | 1,300 | | | | 66 | | |
| HJ Heinz Co. | | | 1,900 | | | | 69 | | |
| Kellogg Co. | | | 2,200 | | | | 95 | | |
| McCormick & Co., Inc. | | | 700 | | | | 25 | | |
| Sara Lee Corp. | | | 4,100 | | | | 95 | | |
| WM Wrigley Jr. Co. | | | 1,200 | | | | 78 | | |
| Food Stores (0.3%) | | | |
| Albertson's, Inc. | | | 2,000 | | | | 46 | | |
| Kroger Co. (b) | | | 4,000 | | | | 60 | | |
The notes to the financial statements are an integral part of this report.
Transamerica IDEX Mutual Funds
Annual Report 2004
7
TA IDEX Protected Principal Stock
SCHEDULE OF INVESTMENTS (continued)
At October 31, 2004
(all amounts except share amounts in thousands)
| | | Shares | | Value | |
| Food Stores (continued) | | | |
| Safeway, Inc. (b) | | | 2,400 | | | $ | 44 | | |
| Winn-Dixie Stores, Inc. | | | 800 | | | | 3 | | |
| Furniture & Fixtures (0.3%) | | | |
| Johnson Controls, Inc. | | | 1,000 | | | | 57 | | |
| Leggett & Platt, Inc. | | | 1,000 | | | | 28 | | |
| Masco Corp. | | | 2,300 | | | | 79 | | |
| Furniture & Home Furnishings Stores (0.1%) | | | |
| Bed Bath & Beyond, Inc. (b) | | | 1,600 | | | | 65 | | |
| Gas Production & Distribution (0.3%) | | | |
| Dynegy, Inc.–Class A (b) | | | 2,000 | | | | 10 | | |
| El Paso Corp. | | | 3,400 | | | | 30 | | |
| KeySpan Corp. | | | 900 | | | | 36 | | |
| Kinder Morgan, Inc. | | | 700 | | | | 45 | | |
| Nicor, Inc. | | | 200 | | | | 8 | | |
| Peoples Energy Corp. | | | 200 | | | | 9 | | |
| Williams Cos., Inc. | | | 2,800 | | | | 35 | | |
| Health Services (0.5%) | | | |
| Caremark Rx, Inc. (b) | | | 2,500 | | | | 75 | | |
| Express Scripts, Inc. (b) | | | 450 | | | | 29 | | |
| HCA, Inc. | | | 2,600 | | | | 95 | | |
| Health Management Associates, Inc.–Class A | | | 1,300 | | | | 27 | | |
| Manor Care, Inc. | | | 500 | | | | 16 | | |
| Quest Diagnostics, Inc. | | | 500 | | | | 44 | | |
| Tenet Healthcare Corp. (b) | | | 2,500 | | | | 27 | | |
| Holding & Other Investment Offices (0.5%) | | | |
Apartment Investment &
Management Co.–Class A | | | 540 | | | | 20 | | |
| Equity Office Properties Trust | | | 2,200 | | | | 62 | | |
| Equity Residential | | | 1,500 | | | | 50 | | |
| Plum Creek Timber Co., Inc. | | | 1,000 | | | | 36 | | |
| Prologis | | | 950 | | | | 37 | | |
| Simon Property Group, Inc. | | | 1,100 | | | | 64 | | |
| Hotels & Other Lodging Places (0.3%) | | | |
| Hilton Hotels Corp. | | | 2,100 | | | | 42 | | |
| Marriott International, Inc.–Class A | | | 1,200 | | | | 65 | | |
| Starwood Hotels & Resorts Worldwide, Inc. | | | 1,100 | | | | 53 | | |
| Industrial Machinery & Equipment (1.5%) | | | |
| American Standard Cos., Inc. (b) | | | 1,200 | | | | 44 | | |
| Applied Materials, Inc. (b) | | | 9,100 | | | | 147 | | |
| Baker Hughes, Inc. | | | 1,800 | | | | 77 | | |
| Black & Decker Corp. | | | 400 | | | | 32 | | |
| Caterpillar, Inc. | | | 1,800 | | | | 145 | | |
| Cummins, Inc. | | | 200 | | | | 14 | | |
| Deere & Co. | | | 1,300 | | | | 78 | | |
| Dover Corp. | | | 1,100 | | | | 43 | | |
| Eaton Corp. | | | 800 | | | | 51 | | |
| | | Shares | | Value | |
| Industrial Machinery & Equipment (continued) | |
| Illinois Tool Works, Inc. | | | 1,600 | | | $ | 148 | | |
| Ingersoll-Rand Co.–Class A | | | 900 | | | | 62 | | |
| Pall Corp. | | | 700 | | | | 18 | | |
| Stanley Works (The) | | | 400 | | | | 18 | | |
| Instruments & Related Products (1.1%) | |
| Agilent Technologies, Inc. (b) | | | 2,600 | | | | 65 | | |
| Applera Corp.–Applied Biosystems Group | | | 1,100 | | | | 21 | | |
| Bausch & Lomb, Inc. | | | 300 | | | | 18 | | |
| Danaher Corp. | | | 1,700 | | | | 94 | | |
| Eastman Kodak Co. | | | 1,500 | | | | 45 | | |
| Fisher Scientific International (b) | | | 600 | | | | 34 | | |
| KLA-Tencor Corp. (b) | | | 1,100 | | | | 50 | | |
| Millipore Corp. (b) | | | 300 | | | | 14 | | |
| PerkinElmer, Inc. | | | 700 | | | | 14 | | |
| Raytheon Co. | | | 2,400 | | | | 88 | | |
| Rockwell Automation, Inc. | | | 1,000 | | | | 42 | | |
| Snap-On, Inc. | | | 300 | | | | 9 | | |
| Tektronix, Inc. | | | 500 | | | | 15 | | |
| Teradyne, Inc. (b) | | | 1,000 | | | | 17 | | |
| Thermo Electron Corp. (b) | | | 900 | | | | 26 | | |
| Waters Corp. (b) | | | 600 | | | | 25 | | |
| Xerox Corp. (b) | | | 4,200 | | | | 62 | | |
| Insurance (4.1%) | |
| ACE, Ltd. | | | 1,500 | | | | 57 | | |
| Aetna, Inc. | | | 800 | | | | 76 | | |
| AFLAC, Inc. | | | 2,700 | | | | 97 | | |
| Allstate Corp. (The) | | | 3,600 | | | | 173 | | |
| AMBAC Financial Group, Inc. | | | 600 | | | | 47 | | |
| American International Group, Inc. | | | 13,900 | | | | 844 | | |
| Anthem, Inc. (b) | | | 800 | | | | 64 | | |
| Chubb Corp. | | | 1,000 | | | | 72 | | |
| Cigna Corp. | | | 700 | | | | 44 | | |
| Cincinnati Financial Corp. | | | 950 | | | | 40 | | |
| Loews Corp. | | | 1,000 | | | | 60 | | |
| MBIA, Inc. | | | 700 | | | | 40 | | |
| MGIC Investment Corp. | | | 500 | | | | 32 | | |
| Principal Financial Group | | | 1,700 | | | | 64 | | |
| Progressive Corp. (The) | | | 1,200 | | | | 112 | | |
| SAFECO Corp. | | | 700 | | | | 32 | | |
| St. Paul Travelers Cos. (The), Inc. | | | 3,547 | | | | 120 | | |
| UnitedHealth Group, Inc. | | | 3,300 | | | | 239 | | |
| UnumProvident Corp. | | | 1,600 | | | | 22 | | |
| WellPoint Health Networks (b) | | | 800 | | | | 78 | | |
| XL Capital, Ltd.–Class A | | | 700 | | | | 51 | | |
| Insurance Agents, Brokers & Service (0.4%) | |
| AON Corp. | | | 1,700 | | | | 35 | | |
| Hartford Financial Services Group, Inc. | | | 1,600 | | | | 94 | | |
The notes to the financial statements are an integral part of this report.
Transamerica IDEX Mutual Funds
Annual Report 2004
8
TA IDEX Protected Principal Stock
SCHEDULE OF INVESTMENTS (continued)
At October 31, 2004
(all amounts except share amounts in thousands)
| | | Shares | | Value | |
| Insurance Agents, Brokers & Service (continued) | |
| Humana, Inc. (b) | | | 800 | | | $ | 15 | | |
| Marsh & McLennan Cos., Inc. | | | 2,800 | | | | 77 | | |
| Leather & Leather Products (0.1%) | |
| Coach, Inc. (b) | | | 1,000 | | | | 47 | | |
| Life Insurance (0.7%) | |
| Jefferson Pilot Corp. | | | 700 | | | | 34 | | |
| Lincoln National Corp. | | | 900 | | | | 39 | | |
| Metlife, Inc. | | | 3,900 | | | | 150 | | |
| Prudential Financial, Inc. | | | 2,800 | | | | 130 | | |
| Torchmark Corp. | | | 600 | | | | 32 | | |
| Lumber & Other Building Materials (1.3%) | |
| Home Depot, Inc. | | | 11,900 | | | | 489 | | |
| Lowe's Cos., Inc. | | | 4,100 | | | | 231 | | |
| Lumber & Wood Products (0.3%) | |
| Georgia-Pacific Corp. | | | 1,400 | | | | 48 | | |
| Louisiana-Pacific Corp. | | | 600 | | | | 15 | | |
| Weyerhaeuser Co. | | | 1,300 | | | | 81 | | |
| Management Services (0.1%) | |
| Paychex, Inc. | | | 2,000 | | | | 66 | | |
| Manufacturing Industries (0.2%) | |
| Hasbro, Inc. | | | 1,000 | | | | 18 | | |
| International Game Technology | | | 1,900 | | | | 63 | | |
| Mattel, Inc. | | | 2,200 | | | | 39 | | |
| Medical Instruments & Supplies (2.0%) | |
| Baxter International, Inc. | | | 3,200 | | | | 98 | | |
| Becton Dickinson & Co. | | | 1,400 | | | | 73 | | |
| Biomet, Inc. | | | 1,400 | | | | 65 | | |
| Boston Scientific Corp. (b) | | | 4,400 | | | | 155 | | |
| CR Bard, Inc. | | | 600 | | | | 34 | | |
| Guidant Corp. | | | 1,700 | | | | 113 | | |
| Medtronic, Inc. | | | 6,400 | | | | 327 | | |
| St. Jude Medical, Inc. (b) | | | 1,000 | | | | 77 | | |
| Stryker Corp. | | | 2,200 | | | | 95 | | |
| Zimmer Holdings, Inc. (b) | | | 1,300 | | | | 101 | | |
| Metal Cans & Shipping Containers (0.0%) | |
| Ball Corp. | | | 600 | | | | 24 | | |
| Metal Mining (0.3%) | |
Freeport-McMoRan Copper &
Gold, Inc.–Class B | | | 1,000 | | | | 36 | | |
| Newmont Mining Corp. | | | 2,400 | | | | 114 | | |
| Phelps Dodge Corp. | | | 500 | | | | 44 | | |
| Mining (0.1%) | |
| Vulcan Materials Co. | | | 600 | | | | 30 | | |
| | | Shares | | Value | |
| Mortgage Bankers & Brokers (0.2%) | | | |
| Countrywide Financial Corp. | | | 3,000 | | | $ | 96 | | |
| Motion Pictures (0.7%) | | | |
| Time Warner, Inc. (b) | | | 24,500 | | | | 408 | | |
| Motor Vehicles, Parts & Supplies (0.0%) | | | |
| Visteon Corp. | | | 700 | | | | 5 | | |
| Oil & Gas Extraction (1.9%) | | | |
| Anadarko Petroleum Corp. | | | 1,300 | | | | 88 | | |
| Apache Corp. | | | 1,710 | | | | 87 | | |
| BJ Services Co. | | | 900 | | | | 46 | | |
| Burlington Resources, Inc. | | | 2,100 | | | | 87 | | |
| Devon Energy Corp. | | | 1,300 | | | | 96 | | |
| EOG Resources, Inc. | | | 600 | | | | 40 | | |
| Halliburton Co. | | | 2,400 | | | | 89 | | |
| Kerr-McGee Corp. | | | 600 | | | | 36 | | |
| Nabors Industries, Ltd. (b) | | | 800 | | | | 39 | | |
| Noble Corp. (b) | | | 700 | | | | 32 | | |
| Occidental Petroleum Corp. | | | 2,100 | | | | 117 | | |
| Rowan Cos., Inc. (b) | | | 600 | | | | 15 | | |
| Schlumberger, Ltd. | | | 3,100 | | | | 195 | | |
| Transocean, Inc. (b) | | | 1,700 | | | | 60 | | |
| Unocal Corp. | | | 1,400 | | | | 58 | | |
| Paper & Allied Products (1.2%) | | | |
| 3M Co. | | | 4,100 | | | | 318 | | |
| Avery Dennison Corp. | | | 600 | | | | 37 | | |
| Bemis Co. | | | 600 | | | | 16 | | |
| International Paper Co. | | | 2,600 | | | | 100 | | |
| Kimberly-Clark Corp. | | | 2,700 | | | | 161 | | |
| MeadWestvaco Corp. | | | 1,100 | | | | 35 | | |
| Pactiv Corp. (b) | | | 800 | | | | 19 | | |
| Temple-Inland, Inc. | | | 300 | | | | 18 | | |
| Paper & Paper Products (0.0%) | | | |
| Boise Cascade Corp. | | | 400 | | | | 12 | | |
| Personal Credit Institutions (0.3%) | | | |
| Capital One Financial Corp. | | | 1,300 | | | | 96 | | |
| SLM Corp. | | | 2,300 | | | | 104 | | |
| Personal Services (0.1%) | | | |
| H&R Block, Inc. | | | 900 | | | | 43 | | |
| Petroleum Refining (5.0%) | | | |
| Amerada Hess Corp. | | | 500 | | | | 40 | | |
| Ashland, Inc. | | | 400 | | | | 23 | | |
| ChevronTexaco Corp. | | | 11,400 | | | | 605 | | |
| ConocoPhillips | | | 3,504 | | | | 295 | | |
| Exxon Mobil Corp. | | | 35,000 | | | | 1,723 | | |
| Marathon Oil Corp. | | | 1,900 | | | | 72 | | |
| Sunoco, Inc. | | | 400 | | | | 30 | | |
| Valero Energy Corp. | | | 1,400 | | | | 60 | | |
The notes to the financial statements are an integral part of this report.
Transamerica IDEX Mutual Funds
Annual Report 2004
9
TA IDEX Protected Principal Stock
SCHEDULE OF INVESTMENTS (continued)
At October 31, 2004
(all amounts except share amounts in thousands)
| | | Shares | | Value | |
| Pharmaceuticals (8.7%) | |
| Abbott Laboratories | | | 8,300 | | | $ | 354 | | |
| Allergan, Inc. | | | 700 | | | | 50 | | |
| AmerisourceBergen Corp. | | | 600 | | | | 33 | | |
| Amgen, Inc. (b) | | | 6,772 | | | | 385 | | |
| Biogen Idec, Inc. (b) | | | 1,800 | | | | 105 | | |
| Bristol-Myers Squibb Co. | | | 10,400 | | | | 244 | | |
| Cardinal Health, Inc. | | | 2,300 | | | | 108 | | |
| Chiron Corp. (b) | | | 1,000 | | | | 32 | | |
| Eli Lilly & Co. | | | 5,900 | | | | 324 | | |
| Forest Laboratories, Inc. (b) | | | 2,000 | | | | 89 | | |
| Genzyme Corp. (b) | | | 1,200 | | | | 63 | | |
| Gilead Sciences, Inc. (b) | | | 2,300 | | | | 80 | | |
| Hospira, Inc. (b) | | | 820 | | | | 26 | | |
| Johnson & Johnson | | | 15,900 | | | | 928 | | |
| King Pharmaceuticals, Inc. (b) | | | 1,300 | | | | 14 | | |
| McKesson Corp. | | | 1,600 | | | | 43 | | |
| Medco Health Solutions, Inc. (b) | | | 1,453 | | | | 49 | | |
| MedImmune, Inc. (b) | | | 1,300 | | | | 37 | | |
| Merck & Co., Inc. | | | 12,100 | | | | 379 | | |
| Mylan Laboratories | | | 1,400 | | | | 24 | | |
| Pfizer, Inc. | | | 40,340 | | | | 1,168 | | |
| Schering-Plough Corp. | | | 7,800 | | | | 141 | | |
| Sigma-Aldrich Corp. | | | 400 | | | | 22 | | |
| Watson Pharmaceuticals, Inc. (b) | | | 600 | | | | 17 | | |
| Wyeth | | | 7,100 | | | | 282 | | |
| Primary Metal Industries (0.4%) | |
| Alcoa, Inc. | | | 4,600 | | | | 149 | | |
| Allegheny Technologies, Inc. | | | 500 | | | | 8 | | |
| Engelhard Corp. | | | 700 | | | | 20 | | |
| Nucor Corp. | | | 800 | | | | 34 | | |
| United States Steel Corp. | | | 600 | | | | 22 | | |
| Worthington Industries, Inc. | | | 500 | | | | 10 | | |
| Printing & Publishing (0.7%) | |
| Dow Jones & Co., Inc. | | | 400 | | | | 18 | | |
| Gannett Co., Inc. | | | 1,400 | | | | 116 | | |
| Knight-Ridder, Inc. | | | 400 | | | | 27 | | |
| McGraw-Hill Cos. (The), Inc. | | | 1,000 | | | | 86 | | |
| Meredith Corp. | | | 300 | | | | 15 | | |
| New York Times Co.–Class A | | | 800 | | | | 32 | | |
| RR Donnelley & Sons Co. | | | 1,200 | | | | 38 | | |
| Tribune Co. | | | 1,700 | | | | 73 | | |
| Radio & Television Broadcasting (0.1%) | |
| Univision Communications, Inc.–Class A (b) | | | 1,700 | | | | 53 | | |
| Radio, Television & Computer Stores (0.3%) | |
| Best Buy Co., Inc. | | | 1,800 | | | | 107 | | |
| Circuit City Stores, Inc. | | | 1,100 | | | | 18 | | |
| RadioShack Corp. | | | 800 | | | | 24 | | |
| | | Shares | | Value | |
| Railroads (0.5%) | |
| Burlington Northern Santa Fe Corp. | | | 2,000 | | | $ | 84 | | |
| CSX Corp. | | | 1,200 | | | | 44 | | |
| Norfolk Southern Corp. | | | 2,100 | | | | 71 | | |
| Union Pacific Corp. | | | 1,400 | | | | 88 | | |
| Restaurants (0.7%) | |
| Darden Restaurants, Inc. | | | 800 | | | | 20 | | |
| McDonald's Corp. | | | 6,700 | | | | 195 | | |
| Starbucks Corp. (b) | | | 2,100 | | | | 111 | | |
| Wendy's International, Inc. | | | 600 | | | | 20 | | |
| Yum! Brands, Inc. | | | 1,600 | | | | 70 | | |
| Retail Trade (0.3%) | |
| Office Depot, Inc. (b) | | | 1,700 | | | | 28 | | |
| Staples, Inc. | | | 2,700 | | | | 80 | | |
| Tiffany & Co. | | | 800 | | | | 23 | | |
| Toys R US, Inc. (b) | | | 1,200 | | | | 22 | | |
| Rubber & Misc. Plastic Products (0.3%) | |
| Cooper Tire & Rubber Co. | | | 400 | | | | 8 | | |
| Goodyear Tire & Rubber Co. (The) (b) | | | 900 | | | | 9 | | |
| Newell Rubbermaid, Inc. | | | 1,500 | | | | 32 | | |
| Nike, Inc.–Class B | | | 1,400 | | | | 114 | | |
| Reebok International, Ltd. | | | 300 | | | | 11 | | |
| Sealed Air Corp. (b) | | | 500 | | | | 25 | | |
| Savings Institutions (0.5%) | |
| Golden West Financial Corp. | | | 800 | | | | 94 | | |
| Sovereign Bancorp, Inc. | | | 1,500 | | | | 32 | | |
| Washington Mutual, Inc. | | | 4,500 | | | | 174 | | |
| Security & Commodity Brokers (2.8%) | |
| American Express Co. | | | 6,700 | | | | 356 | | |
| Bear Stearns Cos. (The), Inc. | | | 600 | | | | 57 | | |
| Charles Schwab Corp. (The) | | | 7,300 | | | | 67 | | |
| E*TRADE Financial Corp. (b) | | | 1,950 | | | | 25 | | |
| Federated Investors, Inc.–Class B | | | 550 | | | | 16 | | |
| Franklin Resources, Inc. | | | 1,300 | | | | 79 | | |
| Goldman Sachs Group, Inc. | | | 2,600 | | | | 256 | | |
| Janus Capital Group, Inc. | | | 1,300 | | | | 20 | | |
| Lehman Brothers Holdings, Inc. | | | 1,500 | | | | 123 | | |
| Merrill Lynch & Co., Inc. | | | 5,000 | | | | 270 | | |
| Morgan Stanley | | | 5,700 | | | | 291 | | |
| T. Rowe Price Group, Inc. | | | 700 | | | | 39 | | |
| Telecommunications (3.2%) | |
| Alltel Corp. | | | 1,700 | | | | 93 | | |
| AT&T Corp. | | | 4,100 | | | | 70 | | |
| BellSouth Corp. | | | 9,800 | | | | 261 | | |
| CenturyTel, Inc. | | | 700 | | | | 22 | | |
| Citizens Communications Co. | | | 1,600 | | | | 21 | | |
| Nextel Communications, Inc.–Class A (b) | | | 5,900 | | | | 156 | | |
The notes to the financial statements are an integral part of this report.
Transamerica IDEX Mutual Funds
Annual Report 2004
10
TA IDEX Protected Principal Stock
SCHEDULE OF INVESTMENTS (continued)
At October 31, 2004
(all amounts except share amounts in thousands)
| | | Shares | | Value | |
| Telecommunications (continued) | |
| Qwest Communications International (b) | | | 9,700 | | | $ | 33 | | |
| SBC Communications, Inc. | | | 17,800 | | | | 450 | | |
| Sprint Corp.–FON Group | | | 7,750 | | | | 162 | | |
| Verizon Communications, Inc. | | | 14,800 | | | | 579 | | |
| Tobacco Products (0.1%) | |
| Reynolds American, Inc. | | | 500 | | | | 34 | | |
| UST, Inc. | | | 900 | | | | 37 | | |
| Transportation Equipment (0.0%) | |
| Brunswick Corp. | | | 500 | | | | 23 | | |
| Trucking & Warehousing (0.8%) | |
| United Parcel Service, Inc.–Class B | | | 5,900 | | | | 467 | | |
| U.S. Government Agencies (1.0%) | |
| Fannie Mae | | | 5,000 | | | | 351 | | |
| Freddie Mac | | | 3,700 | | | | 246 | | |
| Variety Stores (2.9%) | |
| Big Lots, Inc. (b) | | | 600 | | | | 7 | | |
| Costco Wholesale Corp. | | | 2,500 | | | | 120 | | |
| Dollar General Corp. | | | 1,800 | | | | 35 | | |
| Family Dollar Stores, Inc. | | | 900 | | | | 27 | | |
| Target Corp. | | | 4,800 | | | | 240 | | |
| Wal-Mart Stores, Inc. | | | 22,700 | | | | 1,224 | | |
| Water Transportation (0.3%) | |
| Carnival Corp. | | | 3,300 | | | | 167 | | |
| Wholesale Trade Durable Goods (0.0%) | |
| W.W. Grainger, Inc. | | | 500 | | | | 29 | | |
| Wholesale Trade Nondurable Goods (0.2%) | |
| SUPERVALU, Inc. | | | 700 | | | | 21 | | |
| SYSCO Corp. | | | 3,400 | | | | 110 | | |
| Total Common Stocks (cost: $47,467) | | | | | | | 56,619 | | |
| | | Contracts (c) | | Value | |
| PURCHASED OPTIONS (0.3%) | |
| Put Options (0.3%) | |
S & P 500 Index
Put Strike $1050.00
Expires 11/20/2004 | | | 126 | | | | $22 | | |
| | | Contracts (c) | | Value | |
| Put Options (continued) | |
S & P 500 Index
Put Strike $1025.00
Expires 11/20/2004 | | | 125 | | | | $12 | | |
S & P 500 Index
Put Strike $1050.00
Expires 12/18/2004 | | | 111 | | | | 57 | | |
S & P 500 Index
Put Strike $1025.00
Expires 12/18/2004 | | | 139 | | | | 44 | | |
| Total Purchased Options (cost: $241) | | | | | | | 135 | | |
| Total Investment Securities (cost: $47,708) | | | | | | $ | 56,754 | | |
| WRITTEN OPTIONS (–1.5%) | |
| Covered Call Options (–1.5%) | |
S & P 500 Index
Call Strike $1150.00
Expires 11/20/2004 | | | 134 | | | | $(93) | | |
S & P 500 Index
Call Strike $1125.00
Expires 11/20/2004 | | | 137 | | | | (253) | | |
S & P 500 Index
Call Strike $1150.00
Expires 12/18/2004 | | | 80 | | | | (112) | | |
S & P 500 Index
Call Strike $1125.00
Expires 12/18/2004 | | | 150 | | | | (389) | | |
| Total Written Options (cost: $849) | | | | | | | (847 | ) | |
| SUMMARY: | |
| Investments, at value | | | 98.8 | % | | $ | 56,754 | | |
| Written options | | | (1.5 | )% | | | (847 | ) | |
| Other assets in excess of liabilities | | | 2.7 | % | | | 1,594 | | |
| Net assets | | | 100.0 | % | | $ | 57,501 | | |
NOTES TO SCHEDULE OF INVESTMENTS:
(a) Substantially all of the Fund's common stocks are memo pledged as collateral by the custodian for the listed short index option contracts written by the Fund (see Note 1).
(b) No dividends were paid during the preceding twelve months.
(c) Contract amounts are not in thousands.
The notes to the financial statements are an integral part of this report.
Transamerica IDEX Mutual Funds
Annual Report 2004
11
TA IDEX Protected Principal Stock
STATEMENT OF ASSETS AND LIABILITIES
At October 31, 2004
(all amounts except per share amounts in thousands)
| Assets: | | | |
| Investment securities, at value (cost: $47,708) | | $ | 56,754 | | |
| Cash | | | 1,873 | | |
| Receivables: | |
| Interest | | | 1 | | |
| Dividends | | | 79 | | |
| Other | | | 2 | | |
| | | | 58,709 | | |
| Liabilities: | | | |
| Investment securities purchased | | | 124 | | |
| Accounts payable and accrued liabilities: | |
| Management and advisory fees | | | 116 | | |
| Distribution fees | | | 44 | | |
| Transfer agent fees | | | 15 | | |
| Written options (premiums $849) | | | 847 | | |
| Other | | | 62 | | |
| | | | 1,208 | | |
| Net Assets | | $ | 57,501 | | |
| Net Assets Consist of: | | | |
Shares of beneficial interest, unlimited shares
authorized, no par value | | $ | 52,410 | | |
| Accumulated net investment income (loss) | | | – | | |
Accumulated net realized gain (loss) from investment
securities and written option contracts | | | (3,957 | ) | |
Net unrealized appreciation (depreciation) on:
Investment securities | | | 9,046 | | |
| Written option contracts | | | 2 | | |
| Net Assets | | $ | 57,501 | | |
| Net Assets by Class: | | | |
| Class A | | $ | 8,006 | | |
| Class B | | | 40,756 | | |
| Class C | | | 6,423 | | |
| Class M | | | 2,316 | | |
| Shares Outstanding: | | | |
| Class A | | | 752 | | |
| Class B | | | 3,844 | | |
| Class C | | | 607 | | |
| Class M | | | 219 | | |
| Net Asset Value Per Share: | | | |
| Class A | | $ | 10.64 | | |
| Class B | | | 10.60 | | |
| Class C | | | 10.58 | | |
| Class M | | | 10.59 | | |
| Maximum Offering Price Per Share (a): | | | |
| Class A | | $ | 11.24 | | |
| Class M | | | 10.70 | | |
(a) Includes the maximum selling commission (represented as a percentage of offering price) which is reduced on certain levels of sales as set forth in the Prospectus. Net asset value per share for Classes B and C shares represents offering price. The redemption price for Classes B and M shares equals net asset value less any applicable contingent deferred sales charge.
STATEMENT OF OPERATIONS
For the year ended October 31, 2004
(all amounts in thousands)
| Investment Income: | | | |
| Interest | | $ | 6 | | |
| Dividends | | | 1,068 | | |
| | | | 1,074 | | |
| Expenses: | | | |
| Management and advisory fees | | | 809 | | |
| Transfer agent fees | |
| Class A | | | 5 | | |
| Class B | | | 27 | | |
| Class C | | | 4 | | |
| Class M | | | 2 | | |
| Printing and shareholder reports | | | 29 | | |
| Custody fees | | | 32 | | |
| Administration fees | | | 15 | | |
| Legal fees | | | 8 | | |
| Audit and accounting fees | | | 24 | | |
| Trustees fees | | | 4 | | |
| Registration fees | |
| Class A | | | 21 | | |
| Class B | | | 26 | | |
| Class C | | | 13 | | |
| Class M | | | 8 | | |
| Other | | | 13 | | |
| Distribution and service fees: | |
| Class A | | | 30 | | |
| Class B | | | 441 | | |
| Class C | | | 67 | | |
| Class M | | | 26 | | |
| Total expenses before recapture of waived expenses | | | 1,604 | | |
| Recaptured expenses | | | 42 | | |
| Total expenses | | | 1,646 | | |
| Net Investment Income (Loss) | | | (572 | ) | |
| Net Realized Gain (Loss) from: | | | |
| Investment securities | | | (566 | ) | |
| Written option contracts | | | 1,043 | | |
| | | | 477 | | |
Net Increase (Decrease) in Unrealized Appreciation
(Depreciation) on: | | | |
| Investment securities | | | 3,229 | | |
| Written option contracts | | | (394 | ) | |
| | | | 2,835 | | |
Net Gain (Loss) on Investment Securities and
Written Options | | | 3,312 | | |
Net Increase (Decrease) in Net Assets Resulting
from Operations | | $ | 2,740 | | |
The notes to the financial statements are an integral part of this report.
Transamerica IDEX Mutual Funds
Annual Report 2004
12
TA IDEX Protected Principal Stock
STATEMENTS OF CHANGES IN NET ASSETS
For the years ended
(all amounts in thousands)
| | | October 31,
2004 | | October 31,
2003 | |
| Increase (Decrease) in Net Assets From: | | | |
| Operations: | | | |
| Net investment income (loss) | | $ | (572 | ) | | $ | (685 | ) | |
Net realized gain (loss) from
investment securities
and written options | | | 477 | | | | (4,420 | ) | |
Net unrealized appreciation
(depreciation) on investment
securities and written options | | | 2,835 | | | | 11,181 | | |
| | | | 2,740 | | | | 6,076 | | |
| Distributions to Shareholders: | | | |
| From net realized gains: | |
| Class A | | | – | | | | (728 | ) | |
| Class B | | | – | | | | (3,475 | ) | |
| Class C | | | – | | | | (519 | ) | |
| Class M | | | – | | | | (301 | ) | |
| | | | – | | | | (5,023 | ) | |
| Capital Share Transactions: | | | |
| Proceeds from shares sold: | |
| Class A | | | 5 | | | | 171 | | |
| Class B | | | 2 | | | | – | | |
| Class C | | | 2 | | | | 6 | | |
| | | | 9 | | | | 177 | | |
Dividends and distributions
reinvested: | |
| Class A | | | – | | | | 733 | | |
| Class B | | | – | | | | 3,468 | | |
| Class C | | | – | | | | 519 | | |
| Class M | | | – | | | | 301 | | |
| | | | – | | | | 5,021 | | |
| Cost of shares redeemed: | |
| Class A | | | (1,733 | ) | | | (2,125 | ) | |
| Class B | | | (7,872 | ) | | | (4,642 | ) | |
| Class C | | | (907 | ) | | | (576 | ) | |
| Class M | | | (1,382 | ) | | | (858 | ) | |
| | | | (11,894 | ) | | | (8,201 | ) | |
| | | | (11,885 | ) | | | (3,003 | ) | |
| Net increase (decrease) in net assets | | | (9,145 | ) | | | (1,950 | ) | |
| Net Assets: | | | |
| Beginning of year | | | 66,646 | | | | 68,596 | | |
| End of year | | $ | 57,501 | | | $ | 66,646 | | |
Accumulated Net Investment Income
(Loss) | | $ | – | | | $ | – | | |
| | | October 31,
2004 | | October 31,
2003 | |
| Share Activity: | | | |
| Shares issued: | |
| Class A | | | – | | | | 17 | | |
| Class C | | | – | | | | 1 | | |
| | | | – | | | | 18 | | |
Shares issued–reinvested from
distributions: | |
| Class A | | | – | | | | 78 | | |
| Class B | | | – | | | | 369 | | |
| Class C | | | – | | | | 55 | | |
| Class M | | | – | | | | 32 | | |
| | | | – | | | | 534 | | |
| Shares redeemed: | |
| Class A | | | (167 | ) | | | (213 | ) | |
| Class B | | | (760 | ) | | | (480 | ) | |
| Class C | | | (87 | ) | | | (59 | ) | |
| Class M | | | (133 | ) | | | (87 | ) | |
| | | | (1,147 | ) | | | (839 | ) | |
Net increase (decrease) in shares
outstanding: | |
| Class A | | | (167 | ) | | | (118 | ) | |
| Class B | | | (760 | ) | | | (111 | ) | |
| Class C | | | (87 | ) | | | (3 | ) | |
| Class M | | | (133 | ) | | | (55 | ) | |
| | | | (1,147 | ) | | | (287 | ) | |
The notes to the financial statements are an integral part of this report.
Transamerica IDEX Mutual Funds
Annual Report 2004
13
TA IDEX Protected Principal Stock
FINANCIAL HIGHLIGHTS
| | | | | For a share of beneficial interest outstanding throughout each period | |
| | | | | Net Asset | | Investment Operations | | Distributions | | Net Asset | |
| | | For the
Period
Ended (d)(g) | | Value,
Beginning
of Period | | Net
Investment
Income (Loss) | | Net Realized
and Unrealized
Gain (Loss) | | Total
Operations | | From Net
Investment
Income | | From Net
Realized
Gains | | Total
Distributions | | Value,
End
of Period | |
| Class A | | 10/31/2004 | | $ | 10.15 | | | $ | (0.05 | ) | | $ | 0.54 | | | $ | 0.49 | | | $ | – | | | $ | – | | | $ | – | | | $ | 10.64 | | |
| | | 10/31/2003 | | | 10.01 | | | | (0.04 | ) | | | 0.92 | | | | 0.88 | | | | – | | | | (0.74 | ) | | | (0.74 | ) | | | 10.15 | | |
| | | 10/31/2002 | | | 10.00 | | | | (0.02 | ) | | | 0.03 | | | | 0.01 | | | | – | | | | – | | | | – | | | | 10.01 | | |
| Class B | | 10/31/2004 | | | 10.15 | | | | (0.10 | ) | | | 0.55 | | | | 0.45 | | | | – | | | | – | | | | – | | | | 10.60 | | |
| | | 10/31/2003 | | | 10.01 | | | | (0.11 | ) | | | 0.99 | | | | 0.88 | | | | – | | | | (0.74 | ) | | | (0.74 | ) | | | 10.15 | | |
| | | 10/31/2002 | | | 10.00 | | | | (0.04 | ) | | | 0.05 | | | | 0.01 | | | | – | | | | – | | | | – | | | | 10.01 | | |
| Class C | | 10/31/2004 | | | 10.15 | | | | (0.12 | ) | | | 0.55 | | | | 0.43 | | | | – | | | | – | | | | – | | | | 10.58 | | |
| | | 10/31/2003 | | | 10.01 | | | | (0.11 | ) | | | 0.99 | | | | 0.88 | | | | – | | | | (0.74 | ) | | | (0.74 | ) | | | 10.15 | | |
| | | 10/31/2002 | | | 10.00 | | | | (0.04 | ) | | | 0.05 | | | | 0.01 | | | | – | | | | – | | | | – | | | | 10.01 | | |
| Class M | | 10/31/2004 | | | 10.14 | | | | (0.10 | ) | | | 0.55 | | | | 0.45 | | | | – | | | | – | | | | – | | | | 10.59 | | |
| | | 10/31/2003 | | | 10.01 | | | | (0.10 | ) | | | 0.97 | | | | 0.87 | | | | – | | | | (0.74 | ) | | | (0.74 | ) | | | 10.14 | | |
| | | 10/31/2002 | | | 10.00 | | | | (0.04 | ) | | | 0.05 | | | | 0.01 | | | | – | | | | – | | | | – | | | | 10.01 | | |
| | | | | | | Ratios/Supplemental Data | |
| | | For the | | | | Net Assets,
End of | | Ratio of Expenses
to Average | | Net Investment
Income (Loss) | | Portfolio | |
| | | Period | | Total | | Period | | Net Assets (a) | | to Average | | Turnover | |
| | | Ended (g) | | Return (c) | | (000's) | | Net (e) | | Total (f) | | Net Assets (a) | | Rate (b) | |
| Class A | | 10/31/2004 | | | 4.82 | % | | $ | 8,006 | | | | 2.22 | % | | | 2.16 | % | | | (0.53 | )% | | | 1 | % | |
| | | 10/31/2003 | | | 9.44 | | | | 9,320 | | | | 2.25 | | | | 2.25 | | | | (0.46 | ) | | | 3 | | |
| | | 10/31/2002 | | | 0.10 | | | | 10,381 | | | | 2.25 | | | | 2.62 | | | | (0.70 | ) | | | 14 | | |
| Class B | | 10/31/2004 | | | 4.43 | | | | 40,756 | | | | 2.69 | | | | 2.63 | | | | (0.97 | ) | | | 1 | | |
| | | 10/31/2003 | | | 9.44 | | | | 46,709 | | | | 2.90 | | | | 2.90 | | | | (1.11 | ) | | | 3 | | |
| | | 10/31/2002 | | | 0.10 | | | | 47,170 | | | | 2.90 | | | | 3.28 | | | | (1.35 | ) | | | 14 | | |
| Class C | | 10/31/2004 | | | 4.24 | | | | 6,423 | | | | 2.82 | | | | 2.76 | | | | (1.12 | ) | | | 1 | | |
| | | 10/31/2003 | | | 9.44 | | | | 7,041 | | | | 2.90 | | | | 2.90 | | | | (1.11 | ) | | | 3 | | |
| | | 10/31/2002 | | | 0.10 | | | | 6,969 | | | | 2.90 | | | | 3.28 | | | | (1.35 | ) | | | 14 | | |
| Class M | | 10/31/2004 | | | 4.44 | | | | 2,316 | | | | 2.80 | | | | 2.73 | | | | (1.01 | ) | | | 1 | | |
| | | 10/31/2003 | | | 9.33 | | | | 3,576 | | | | 2.80 | | | | 2.80 | | | | (1.01 | ) | | | 3 | | |
| | | 10/31/2002 | | | 0.10 | | | | 4,076 | | | | 2.80 | | | | 3.18 | | | | (1.25 | ) | | | 14 | | |
NOTES TO FINANCIAL HIGHLIGHTS
(a) Annualized.
(b) Not annualized for periods of less than one year.
(c) Total Return has been calculated for the applicable period without deduction of a sales load, if any, on an initial purchase. Periods of less than one year are not annualized.
(d) Per share information is calculated based on average number of shares outstanding.
(e) Ratio of Net Expenses to Average Net Assets is net of fee waivers and reimbursements by the investment adviser, if any and includes the recapture of previously waived expenses (see note 2).
(f) Ratio of Total Expenses to Average Net Assets includes all expenses before fee waivers, reimbursements by the investment adviser and recapture of previously waived expenses.
(g) TA IDEX Protected Principal Stock commenced operations on July 1, 2002.
The notes to the financial statements are an integral part of this report.
Transamerica IDEX Mutual Funds
Annual Report 2004
14
TA IDEX Protected Principal Stock
NOTES TO FINANCIAL STATEMENTS
At October 31, 2004
(all amounts in thousands)
NOTE 1. ORGANIZATION AND SIGNIFICANT ACCOUNTING POLICIES
Transamerica IDEX Mutual Funds, formerly IDEX Mutual Funds, is a Massachusetts business trust registered under the Investment Company Act of 1940, as amended (the "1940 Act"), as an open-end management investment company. TA IDEX Protected Principal Stock ("the Fund"), part of Transamerica IDEX Mutual Funds, began operations on July 1, 2002.
On March 1, 2004, the Fund changed its name from IDEX Protected Principal Stock to TA IDEX Protected Principal Stock.
In the normal course of business, the Fund enters into contracts that contain a variety of representations and warranties, which provide general indemnifications. The Fund's maximum exposure under these arrangements is unknown, as this would involve future claims that may be made against the Fund and/or its affiliates that have not yet occurred. However, based on experience, the Fund expects the risk of loss to be remote.
See the Prospectus and Statement of Additional Information for a description of the Fund's investment objective.
In preparing the Fund's financial statements in accordance with accounting principles generally accepted in the United States of America ("GAAP"), estimates or assumptions (which could differ from actual results) may be used that affect reported amounts and disclosures. The following policies were consistently followed by the Fund, in accordance with GAAP.
Multiple class operations and expenses: The Fund currently offers four classes of shares, each with a public offering price that reflects different sales charges, if any, and expense levels. All shares designated as Class C shares prior to March 1, 2004, were renamed as Class C2 shares on that date. On June 15, 2004, Class C2 shares converted to Class C. Class B shares will convert to Class A shares eight years after purchase. Currently all share classes are closed to new investors. Income, non-class specific expenses and realized and unrealized gains and losses, are allocated daily to each class, based upon the value of shares outstanding method as permitted under Rule 18f-3 of the 1940 Act. Each class bears its own specific expenses as well as a portion of gene ral, common expenses.
Pricing of shares: The Fund prices its shares on the basis of the net asset value of each class of shares of the Fund, which is determined as of the close of the New York Stock Exchange ("NYSE") (generally 4:00 p.m. Eastern Time) on each day on which the NYSE is open for trading (other than a day on which there are insufficient changes in the value of the Fund's portfolio securities to materially affect the Fund's
net asset value or a day on which no shares are tendered for redemption and no order to purchase any shares is received).
Security valuations: Fund investments traded on an exchange are valued at the closing price on the day of valuation on the exchange where the security is principally traded. With respect to securities traded on NASDAQ NMS, such closing price may be the last reported sales price or the NASDAQ Official Closing Price.
Securities traded in the over-the-counter market and listed securities for which no sale was reported on that date are valued at the last quoted bid price.
Other securities for which quotations are not readily available are valued at fair market value as determined in good faith using guidelines adopted by the Board of Trustees of the Fund, under the supervision of the Fund's Valuation Committee.
The Fund values its investment securities at fair value based upon procedures approved by the Board of Trustees on days when significant events occur after the close of the principal exchange on which the securities are traded, and as a result, are expected to materially effect the value of investments.
Cash: The Fund may leave cash overnight in its cash account with the custodian, Investors Bank & Trust Company ("IBT"). IBT has been contracted on behalf of the Fund to invest the excess cash into a savings account, which at October 31, 2004, was paying an interest rate of 1.30%.
Throughout the year, the Fund may have a cash overdraft balance. A fee is incurred on this overdraft, calculated by multiplying the overdraft by a rate based on the federal funds rate. This fee is included in Custody fees in the Statement of Operations.
Real Estate Investment Trusts ("REITs"): There are certain additional risks involved in investing in REITs. These include, but are not limited to, economic conditions, changes in zoning laws, real estate values, property taxes and interest rates.
Security transactions and investment income: Security transactions are recorded on the trade date. Security gains and losses are calculated on the specific identification basis. Dividend income is recorded on the ex-dividend date or, in the case of foreign securities, as soon as the Fund is informed of the ex-dividend date. Interest income, including accretion of discounts and amortization of premiums, is recorded on the accrual basis commencing on the settlement date.
Option contracts: The Fund may enter into options contracts to manage exposure to market fluctuations. Options are valued at the average of the bid and ask ("Mean Quote") established each day at the close of the board of trade or exchange on which they are traded. The primary risks associated with options are imperfect correlation between the change in value of the securities held and the prices of the options contracts; the possibility of an illiquid market and inability of the counterparty to meet the contracts terms. When the Fund writes a covered call or put option,
Transamerica IDEX Mutual Funds
Annual Report 2004
15
TA IDEX Protected Principal Stock
NOTES TO FINANCIAL STATEMENTS (continued)
At October 31, 2004
(all amounts in thousands)
NOTE 1.–(continued)
an amount equal to the premium received by the Fund is included in the Fund's Statement of Assets and Liabilities as an asset and as an equivalent liability. The liability is subsequently marked-to-market to reflect the current value of the option written.
The underlying face amounts of open contracts at October 31, 2004, are listed in the Schedule of Investments.
Substantially all of the Fund's common stocks are memo pledged as collateral by the custodian for the listed short index option contracts written by the Fund. The custodian uses escrow receipt depository of the Option Clearing Corporation ("OCC") to effect pledging while maintaining custody of the stock positions, rather than delivering them to the broker-dealers. The OCC guarantees the obligations of the contracts that they clear are fulfilled.
Transactions in written call and put options were as follows:
| | | Premium | | Contracts* | |
| Beginning Balance October 31, 2003 | | $ | 2,599 | | | | 638 | | |
| Sales | | | 10,052 | | | | 4,005 | | |
| Closing Buys | | | (10,574 | ) | | | (3,534 | ) | |
| Expirations | | | (1,228 | ) | | | (608 | ) | |
| Exercised | | | – | | | | – | | |
| Balance at October 31, 2004 | | $ | 849 | | | | 501 | | |
* Contracts not in thousands
Account maintenance fees: If the shareholder account balance falls below $1 by either shareholder action or as a result of market action, a $25 (not in thousands) fee is assessed every year until the balance reaches $1. The fee is assessed by redeeming shares in the shareholder's account.
No fee will be charged under the following conditions:
• accounts opened within the preceding 24 months
• accounts with an active monthly Automatic Investment Plan ($50 (not in thousands) minimum per fund)
• accounts owned by an individual which, when combined by social security number, have a balance of $5 or more
• accounts owned by individuals in the same household (by address) that have a combined balance of $5 or more
• UTMA/UGMA accounts
• Fiduciary accounts
• B-share accounts whose shares have started to convert to A-shares accounts (as long as combined value of both accounts is at least $1)
For the year ended October 31, 2004, there were no fees. These fees are included in Paid in Capital in the Statement of Assets and Liabilities.
Redemption fees: A short-term trading redemption fee may be assessed on any fund shares in a fund account that are sold during the first five (5) New York Stock Exchange trading days following their purchase date. This redemption fee will equal 2% of the amount redeemed and shares held the longest will be treated as being redeemed first and shares held the shortest as being redeemed last. For the year ended October 31, 2004, the Fund received no redemption fees.
Dividend distributions: Distributions to shareholders are recorded on the ex-dividend date and are determined in accordance with Federal income tax regulations which may differ from GAAP.
NOTE 2. RELATED PARTY TRANSACTIONS
ATFA is the Fund's investment adviser. AEGON/Transamerica Fund Services, Inc. ("ATFS") is the Fund's administrator. AFSG Securities Corp. ("AFSG") is the Fund's distributor/principal underwriter. AEGON/Transamerica Investor Services, Inc. ("ATIS") is the Fund's transfer agent. ATIS and AFSG are 100% owned by AUSA Holding Company ("AUSA"). ATFA is a directly owned subsidiary of Western Reserve Life Assurance Co. of Ohio (78%) ("WRL") and AUSA (22%). ATFS is a wholly owned subsidiary of WRL. AUSA and WRL are wholly owned indirect subsidiaries of AEGON NV, a Netherlands corporation.
TA IDEX Protected Principal Stock Guarantee: The Fund's investment adviser, Aegon/Transamerica Fund Advisers, Inc. ("ATFA"), guarantees shareholders a Guaranteed Amount five years after the end of the Offering Period. The Guaranteed amount will be no less than the value of that shareholder's account on the Investment Date, less extraordinary charges, provided that shareholders have reinvested all dividends and distributions in additional shares and have redeemed no shares ("Guarantee"). Please see the Prospectus and Statement of Additional Information for further information on the Guarantee.
Investment advisory fee: The Fund pays management fees to ATFA based on average daily net assets ("ANA") at the following breakpoints:
1.30% of the first $100 million of ANA
1.25% of ANA over $100 million
ATFA has contractually agreed to waive its advisory fee and will reimburse the Fund to the extent that operating expenses, excluding 12b-1 fees, exceed the following stated annual limit:
1.90% Expense Limit
Transamerica IDEX Mutual Funds
Annual Report 2004
16
TA IDEX Protected Principal Stock
NOTES TO FINANCIAL STATEMENTS (continued)
At October 31, 2004
(all amounts in thousands)
NOTE 2.–(continued)
If total fund expenses fall below the annual expense limitation agreement agreed to by the adviser within the succeeding three years, the Fund may be required to pay that adviser a portion or all of the waived advisory fees.
| | | Advisory Fee
Waived | | Available for
Recapture Through | |
| Fiscal Year 2003 | | $ | 9 | | | 10/31/2006 | |
| Fiscal Year 2002 | | | 43 | | | 10/31/2005 | |
| | | Expenses
Recaptured
by Adviser | | Increase in Total
Expenses to
Average Net Assets | |
| Recaptured in 2004 | | | 42 | | | | 0.07 | % | |
Distribution and service fees: The Fund has a 12b-1 distribution plan under the 1940 Act pursuant to which an annual fee, based on average daily net assets, is paid to the distributor for various disbursements such as broker-dealer account servicing fees and other promotional expenses of the Fund. The Fund is authorized under the 12b-1 plan to pay fees on each class up to the following limits:
| Class A | | | 0.35 | % | |
| Class B | | | 1.00 | % | |
| Class C | | | 1.00 | % | |
| Class M | | | 0.90 | % | |
In the case the Fund or a class of shares of the Fund is closed to new investors or investments, the Fund is authorized to pay 12b-1 fees for past sales and distribution efforts and present and past investor services.
Underwriter commissions relate to front-end sales charges imposed for Class A and M shares and contingent deferred sales charges from Classes B, M, and certain A share redemptions. For the year ended October 31, 2004, the underwriter commissions were as follows:
| Received by Underwriter | | $ | – | | |
| Retained by Underwriter | | | – | | |
| Contingent Deferred Sales Charge | | | 269 | | |
Administrative services: The Fund has entered into an agreement with ATFS for financial and legal fund administration services, which includes such items as compliance, expenses, financial statements and other reporting, distributions, tax returns, prospectus preparation, board of trustees meeting support and other legal matters. The Fund pays ATFS an annual fee of 0.015% of average net assets. The Legal fees on the Statement of Operations are for fees paid to external legal counsel.
The Fund paid ATFS $15 for the year ended October 31, 2004.
Transfer agent fees: The Fund pays ATIS an annual per-account charge of $20 (not in thousands) for each open account and $1.63 (not in thousands) for each closed account. There is no new account charge. The transfer agent fees on the Statement of Operations are made up of fees paid to ATIS and costs associated with shareholder statements. The Fund paid ATIS $38 for the year ended October 31, 2004.
Deferred compensation plan: Each eligible Fund Trustee may elect participation in the Deferred Compensation Plan ("the Plan"). Under the Plan, such Trustees may defer payment of a percentage of their total fees earned as a Fund Trustee. These deferred amounts may be invested in any Transamerica IDEX Mutual Fund. At October 31, 2004, the value of invested plan amount was $2. Invested plan amounts and the total liability for deferred compensation to the Trustees under the Plan at October 31, 2004, are included in the accompanying Statement of Assets and Liabilities.
NOTE 3. INVESTMENT TRANSACTIONS
The cost of securities purchased and proceeds from securities sold (excluding short-term securities) for the year ended October 31, 2004, were as follows:
| Purchases of securities: | | | |
| Long-Term excluding U.S. Government | | $ | 817 | | |
| U.S. Government | | | – | | |
| Proceeds from maturities and sales of securities: | | | |
| Long-Term excluding U.S. Government | | | 16,237 | | |
| U.S. Government | | | – | | |
NOTE 4. FEDERAL INCOME TAX MATTERS
The Fund has not made any provision for federal income or excise taxes due to its policy to distribute all of its taxable income and capital gains to its shareholders and otherwise qualify as a regulated investment company under the Internal Revenue Code. Income and capital gain distributions are determined in accordance with income tax regulations, which may differ from GAAP. These differences are primarily due to differing treatment for items including, but not limited to, wash sales, net operating losses and capital loss carryforwards.
Reclassifications between Undistributed net investment income (loss), Undistributed net realized capital gains (loss) and Shares of beneficial interest are made to reflect income and gains available for distribution under federal tax regulations. Results of operations and net assets are not effected by these reclassifications. These reclassifications are as follows:
Shares of beneficial interest, unlimited
shares authorized | | $ | (578 | ) | |
| Undistributed net investment income (loss) | | | 572 | | |
Accumulated net realized gain (loss) from investment
securities and written option contracts | | | 6 | | |
Transamerica IDEX Mutual Funds
Annual Report 2004
17
TA IDEX Protected Principal Stock
NOTES TO FINANCIAL STATEMENTS (continued)
At October 31, 2004
(all amounts in thousands)
NOTE 4.–(continued)
The capital loss carryforward is available to offset future realized capital gains through the periods listed:
Capital Loss
Carryforward | | Available through | |
| $ | 4,061 | | | October 31, 2011 | |
The capital loss carryforward utilized during the period ended October 31, 2004, was $649.
The tax character of distributions paid may differ from the character of distributions shown in the Statements of Changes in Net Assets due to short-term gains being treated as ordinary income for tax purposes. The tax character of distributions paid during 2003 and 2004 was as follows:
| 2003 Distributions paid from: | | | |
| Ordinary Income | | $ | 1,581 | | |
| Long-term capital gain | | | 3,442 | | |
| 2004 Distributions paid from: | | | |
| Ordinary Income | | | – | | |
| Long-term capital gain | | | – | | |
The tax basis components of distributable earnings as of October 31, 2004, are as follows:
| Undistributed Ordinary Income | | $ | – | | |
| Undistributed Long-term Capital Gains | | $ | – | | |
| Capital Loss Carryforward | | $ | (4,061 | ) | |
| Net Unrealized Appreciation (Depreciation) | | $ | 9,154 | | |
The aggregate cost of investments and composition of unrealized appreciation (depreciation) for federal income tax purposes as of October 31, 2004, are as follows:
| Federal Tax Cost Basis | | $ | 47,600 | | |
| Unrealized Appreciation | | $ | 10,965 | | |
| Unrealized (Depreciation) | | | (1,811 | ) | |
| Net Unrealized Appreciation (Depreciation) | | $ | 9,154 | | |
NOTE 5. OTHER MATTERS
Transamerica IDEX Mutual Funds ("TA IDEX"), and certain of its affiliated entities, have received requests for information from the Staff of the Securities and Exchange Commission in connection with market timing and late trading within the funds. TA IDEX and the affiliated entities have voluntarily cooperated in the investigation and have been providing the information as requested.
Transamerica IDEX Mutual Funds
Annual Report 2004
18
Report of Independent Registered Certified Public Accounting Firm
To the Board of Trustees and Shareholders of
TA IDEX Protected Principal Stock
In our opinion, the accompanying statement of assets and liabilities, including the schedule of investments, and the related statements of operations and of changes in net assets and the financial highlights present fairly, in all material respects, the financial position of TA IDEX Protected Principal Stock (the "Fund") (one of the portfolios constituting the Transamerica IDEX Mutual Funds) at October 31, 2004, the results of its operations for the year then ended, the changes in its net assets for each of the two years in the period then ended and the financial highlights for each of the periods indicated, in conformity with accounting principles generally accepted in the United States of America. These financial statements and financial highlights (hereafter referred to as "financial statements") are the responsibility of the Fund's management; our responsibility is to express an opinion on thes e financial statements based on our audits. We conducted our audits of these financial statements in accordance with the standards of the Public Company Accounting Oversight Board (United States). Those standards require that we plan and perform the audit to obtain reasonable assurance about whether the financial statements are free of material misstatement. An audit includes examining, on a test basis, evidence supporting the amounts and disclosures in the financial statements, assessing the accounting principles used and significant estimates made by management, and evaluating the overall financial statement presentation. We believe that our audits, which included confirmation of securities at October 31, 2004 by correspondence with the custodian and brokers, provide a reasonable basis for our opinion.

PricewaterhouseCoopers LLP
Tampa, Florida
December 28, 2004
Transamerica IDEX Mutual Funds
Annual Report 2004
19
TA IDEX Salomon All Cap
MARKET ENVIRONMENT
We were concerned that the 23-year bull market for bonds ended in the summer of 2003 and that interest rates might move up meaningfully in 2004. Although ten-year Treasury yields flirted with 5% earlier this year, interest rates dropped back to about the 4% level, possibly caused by the effects of oil prices rising from $29/barrel to about $55/barrel recently.
PERFORMANCE
For the year ended October 31, 2004, TA IDEX Salomon All Cap, Class A returned 6.09%. By comparison its benchmark, the Russell 3000 Index ("Russell 3000"), returned 9.51%.
STRATEGY REVIEW
During the year, the portfolio had an average cash position of approximately 9.5%, which we believed was prudent given uncertainties associated with rising oil prices, the war in Iraq, the presidential election in the United States and rising interest rates, especially early in the year.
We were heavily overweight in the materials sector for the one-year period ended October 31, 2004. Materials companies, over the last decade, have made modest increases in their production capacities. With China being relatively resource poor, our decision to overweight the materials sector was designed to capture the increasing importance of China importing many natural resources, with the probability that prices would be affected positively. Our overweight contributed to portfolio performance approximately 3.1% for the last fiscal year versus approximately 0.60% for the materials sector of the Russell 3000.
We were underweight in the financials sector by a substantial amount (15.7% vs. 21.7% of the benchmark). We held a modest amount of commercial bank positions for most of the year because of a flatter yield curve, which we believed would hamper their earnings. At this time, the yield curve remains one of the steepest on record. Our financials sector holdings contributed 0.35% in the latest fiscal year vs. 2.31% for the benchmark financials sector.
The largest contributors to performance were Telefonaktiebolage LM Ericsson ("Ericsson"), a company engaged in the development and supply of end-to-end solutions to network operators for mobile and fixed-line communications (0.84%), Elan Corporation PLC ("Elan"), a neuroscience-based biotechnology company (0.66%), Allegheny Technologies Incorporated ("Allegheny"), a diversified producer of specialty materials (0.62%), Raytheon Company ("Raytheon"), an industry leader in defense and government electronics (0.53%), and ChevronTexaco Corporation ("ChevronTexaco"), a fully integrated petroleum operator (0.51%). Our positions in Ericsson and Elan were sold during the year having reached prices that we believed fully discounted their earnings prospects going forward. Allegheny, Raytheon and ChevronTexaco are all still held in the portfolio.
The five largest detractors to performance included Merck & Co., Inc., a global research-driven pharmaceutical products company (-0.41%), Intel Corporation., a designer, developer, manufacturer and marketer of computing and communications products at various levels of integration (-0.41%), Micromuse Inc., a provider of a suite of software products (-0.40%), Unisys Corporation, a worldwide information technology services and solutions company (-.35%), and XOMA Ltd., a biopharmaceutical (-0.33%). These positions are still held in the portfolio.
John J. Goode
Peter J. Hable
Co-Fund Managers
Salomon Brothers Asset Management Inc.
Transamerica IDEX Mutual Funds
Annual Report 2004
1
TA IDEX Salomon All Cap
Comparison of change in value of $10,000 investment in Class A shares and its comparative index.
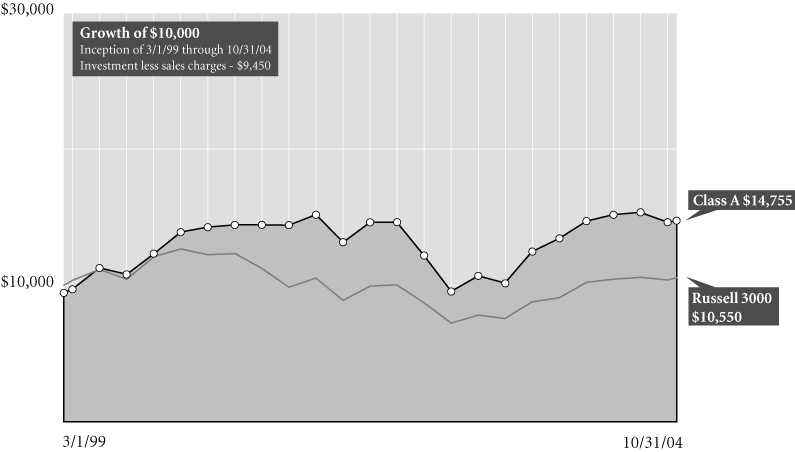
Average Annual Total Return for Periods Ended 10/31/04
| | | 1 year | | 5 years | | From
Inception | | Inception
Date | |
| Class A (NAV) | | | 6.09 | % | | | 5.93 | % | | | 8.18 | % | | 3/1/99 | |
| Class A (POP) | | | 0.26 | % | | | 4.74 | % | | | 7.10 | % | | 3/1/99 | |
| Russell 30001 | | | 9.51 | % | | | (0.98 | )% | | | 0.95 | % | | 3/1/99 | |
| Class B (NAV) | | | 5.48 | % | | | 5.25 | % | | | 7.49 | % | | 3/1/99 | |
| Class B (POP) | | | 0.48 | % | | | 5.09 | % | | | 7.49 | % | | 3/1/99 | |
| Class C (NAV) | | | 5.43 | % | | | – | | | | 18.18 | % | | 11/11/02 | |
| Class C (POP) | | | 4.43 | % | | | – | | | | 18.18 | % | | 11/11/02 | |
NOTES
1 The Russell 3000 (Russell 3000) Index is an unmanaged index used as a general measure of market performance. Calculations assume dividends and capital gains are reinvested and do not include any managerial expenses. From inception calculation is based on life of Class A shares. Source: Standard & Poor's Micropal®© Micropal, Inc. 2004 – 1-800-596-5323 – http://www.micropal.com.
The performance data presented represents past performance, future results may vary. Performance data does not reflect the deduction of taxes that would be paid on fund distributions or the redemption of fund shares. Investment return and principal value will fluctuate so that an investor's shares, when redeemed, may be worth more or less than their original cost. Current performance may be lower or higher than performance quoted.
Public Offering Price (POP) returns include the reinvestment of dividends and capital gains and reflect the maximum sales charge of 5.5% for A shares or the maximum applicable contingent deferred sales charge (5% in the 1st year, decreasing to 0% after 6 years) for Class B shares and 1% (during the first 12 months) for Class C shares. Shares purchased prior to March 1, 2004 are subject to a maximum applicable contingent deferred sales charge (5% in the 1st year, decreasing to 0% after 7 years) for Class B shares and (2% in the 1st year, decreasing to 0% after 2 years) for Class C shares. Net Asset Value (NAV) returns include the reinvestment of dividends and capital gains but do not reflect any sales charges.
Investments in a "non-diversified" fund may be subject to specific risks such as susceptibility to single economic political, or regulatory events, and may be subject to greater loss than investments in a diversified fund.
This material must be preceded or accompanied by a current prospectus, which includes specific contents regarding the investment objectives and policies of this fund.
Transamerica IDEX Mutual Funds
Annual Report 2004
2
TA IDEX Salomon All Cap
UNDERSTANDING YOUR FUND'S EXPENSES (unaudited)
SHAREHOLDER EXPENSES
The following Example is intended to help you understand your ongoing costs (in dollars and cents) of investing in a Fund and to compare these costs with the ongoing costs of investing in other funds.
The Example is based on an investment of $1,000 invested at the beginning of the period and held for the entire period from May 1, 2004 to October 31, 2004.
ACTUAL EXPENSES
The first line in the table below provides information about actual account values and actual expenses. You may use the information in this line, together with the amount you invested, to estimate the expenses that you paid over the period. Simply divide your account value by $1,000 (for example, an $8,600 account value divided by $1,000 = 8.6), then multiply the result by the number in the first line of your Fund under the heading entitled "Expenses Paid During Period" to estimate the expenses you paid on your account during this period.
HYPOTHETICAL EXAMPLE FOR COMPARISON PURPOSES
The second line in the table below provides information about hypothetical account values and hypothetical expenses based on each Fund's actual expense ratio and an assumed rate of return of 5% per year before expenses, which is not the Fund's actual return. The hypothetical account values and expenses may not be used to estimate the actual ending account balance or expenses you paid for the period. You may use this information to compare the ongoing costs of investing in your Fund and other funds. To do so, compare this 5% hypothetical example with the 5% hypothetical examples that appear in the shareholder reports of the other funds.
Please note that the expenses shown in the table are meant to highlight your ongoing costs only and do not reflect any transactional costs, such as sales charges, redemption fees, brokerage commissions paid on purchases and sales of fund shares. Therefore, the second line under each Fund in the table is useful in comparing ongoing costs only, and will not help you determine the relative total costs of owning different funds. In addition, note that the expenses shown in the table are meant to highlight your ongoing costs and do not reflect any transaction costs.
| | | Beginning
Account
Value | | Ending
Account
Value | | Annualized
Expense
Ratio | | Expenses Paid
During Period (a) | |
| Class A | | | |
| Actual | | $ | 1,000.00 | | | $ | 1,003.40 | | | | 1.30 | % | | $ | 6.55 | | |
| Hypothetical (b) | | | 1,000.00 | | | | 1,018.60 | | | | 1.30 | | | | 6.60 | | |
| Class B | | | |
| Actual | | | 1,000.00 | | | | 1,000.80 | | | | 1.90 | | | | 9.55 | | |
| Hypothetical (b) | | | 1,000.00 | | | | 1,015.58 | | | | 1.90 | | | | 9.63 | | |
| Class C | | | |
| Actual | | | 1,000.00 | | | | 999.60 | | | | 1.98 | | | | 9.95 | | |
| Hypothetical (b) | | | 1,000.00 | | | | 1,015.18 | | | | 1.98 | | | | 10.03 | | |
(a) Expenses are calculated using each Fund's annualized expense ratio (as disclosed in the table), multiplied by the average account value for the period, multiplied by number of days in the period (184 days), and divided by the number of days in the year (366 days).
(b) 5% return per year before expenses.
GRAPHIC PRESENTATION OF SCHEDULE OF INVESTMENTS
By Sector
At October 31, 2004
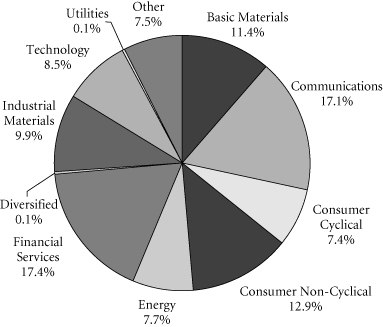
This chart shows the percentage breakdown by sector of the Fund's total investment securities.
Transamerica IDEX Mutual Funds
Annual Report 2004
3
TA IDEX Salomon All Cap
SCHEDULE OF INVESTMENTS
At October 31, 2004
(all amounts except share amounts in thousands)
| | | Shares | | Value | |
| PREFERRED STOCKS (1.0%) | | | |
| Motion Pictures (1.0%) | | | |
| News Corp, Ltd., Sponsored ADR (a) | | | 209,000 | | | $ | 6,571 | | |
| Total Preferred Stocks (cost: $5,838) | | | | | | | 6,571 | | |
| COMMON STOCKS (94.2%) | | | |
| Aerospace (0.8%) | | | |
| Boeing Co. (The) | | | 101,400 | | | | 5,060 | | |
| Air Transportation (1.3%) | | | |
| AMR Corp. (a)(b) | | | 121,600 | | | | 939 | | |
| Continental Airlines, Inc.–Class B (a)(b) | | | 135,900 | | | | 1,261 | | |
| Frontier Airlines, Inc. (b) | | | 117,900 | | | | 986 | | |
| Northwest Airlines Corp.–Class A (a)(b) | | | 133,200 | | | | 1,179 | | |
| Southwest Airlines Co. | | | 254,400 | | | | 4,012 | | |
| Amusement & Recreation Services (1.2%) | | | |
| Walt Disney Co. | | | 316,400 | | | | 7,980 | | |
| Apparel Products (0.2%) | | | |
| Tommy Hilfiger Corp. (b) | | | 157,300 | | | | 1,510 | | |
| Automotive (0.7%) | | | |
| Honeywell International, Inc. | | | 140,000 | | | | 4,715 | | |
| Chemicals & Allied Products (2.9%) | | | |
| Cabot Corp. | | | 163,500 | | | | 5,572 | | |
| Crompton Corp. | | | 477,100 | | | | 4,437 | | |
| Dow Chemical Co. (The) | | | 200,100 | | | | 8,992 | | |
| Commercial Banks (5.6%) | | | |
| Bank of New York Co. (The), Inc. | | | 154,700 | | | | 5,022 | | |
| JPMorgan Chase & Co. | | | 289,400 | | | | 11,171 | | |
| MBNA Corp. | | | 252,000 | | | | 6,459 | | |
| Mitsubishi Tokyo Financial Group, Inc. | | | 946 | | | | 8,020 | | |
| State Street Corp. | | | 126,100 | | | | 5,681 | | |
| Communication (4.0%) | | | |
| Comcast Corp.–Special Class A (b) | | | 324,900 | | | | 9,435 | | |
| Liberty Media Corp.–Class A | | | 1,099,600 | | | | 9,808 | | |
| Viacom, Inc.–Class B | | | 183,000 | | | | 6,678 | | |
| Communications Equipment (4.6%) | | | |
| Lucent Technologies, Inc. (a)(b) | | | 2,243,000 | | | | 7,963 | | |
| Motorola, Inc. | | | 726,900 | | | | 12,546 | | |
| Nokia OYJ, Sponsored ADR (a) | | | 625,800 | | | | 9,650 | | |
| Socket Communications, Inc. (b) | | | 78,200 | | | | 142 | | |
| Computer & Data Processing Services (5.6%) | | | |
| Actuate Corp. (b) | | | 47,600 | | | | 118 | | |
| Electronics for Imaging (b) | | | 204,500 | | | | 3,689 | | |
| Micromuse, Inc. (b) | | | 700,000 | | | | 3,003 | | |
| Microsoft Corp. | | | 372,700 | | | | 10,432 | | |
| RealNetworks, Inc. (b) | | | 710,000 | | | | 3,443 | | |
| | | Shares | | Value | |
| Computer & Data Processing Services (continued) | | | |
| Sabre Holdings Corp. | | | 142,600 | | | $ | 3,067 | | |
| SunGard Data Systems, Inc. (b) | | | 271,700 | | | | 7,197 | | |
| Unisys Corp. (b) | | | 555,600 | | | | 5,900 | | |
| Computer & Office Equipment (0.4%) | | | |
| 3Com Corp. (b) | | | 597,300 | | | | 2,473 | | |
| Construction (0.3%) | | | |
| Chicago Bridge & Iron Co. NV | | | 65,600 | | | | 2,030 | | |
| Electric Services (0.1%) | | | |
| Calpine Corp. (a)(b) | | | 306,100 | | | | 762 | | |
| Electronic & Other Electric Equipment (0.3%) | | | |
| Sony Corp. | | | 50,000 | | | | 1,738 | | |
| Electronic Components & Accessories (5.0%) | | | |
| Intel Corp. | | | 331,900 | | | | 7,388 | | |
| Solectron Corp. (b) | | | 1,900,500 | | | | 9,921 | | |
Taiwan Semiconductor Manufacturing
Co., Ltd., Sponsored ADR | | | 1,005,445 | | | | 7,611 | | |
| Texas Instruments, Inc. | | | 312,800 | | | | 7,648 | | |
| Environmental Services (1.0%) | | | |
| Waste Management, Inc. | | | 228,100 | | | | 6,496 | | |
| Food Stores (0.9%) | | | |
| Safeway, Inc. (a)(b) | | | 321,200 | | | | 5,859 | | |
| Gas Production & Distribution (1.1%) | | | |
| Williams Cos., Inc. | | | 575,000 | | | | 7,193 | | |
| Health Services (0.8%) | | | |
| Enzo Biochem, Inc. (a)(b) | | | 291,900 | | | | 5,164 | | |
| Holding & Other Investment Offices (0.5%) | | | |
| Digital Realty Trust, Inc. REIT (b) | | | 68,400 | | | | 821 | | |
| GMH Communities Trust REIT (b) | | | 151,900 | | | | 1,823 | | |
| Hutchison Whampoa, Ltd. | | | 99,000 | | | | 760 | | |
| Industrial Machinery & Equipment (1.7%) | | | |
| Caterpillar, Inc. | | | 87,000 | | | | 7,007 | | |
| Deere & Co. | | | 75,000 | | | | 4,483 | | |
| Instruments & Related Products (3.3%) | | | |
| Agilent Technologies, Inc. (b) | | | 362,300 | | | | 9,079 | | |
| PerkinElmer, Inc. | | | 37,200 | | | | 764 | | |
| Raytheon Co. | | | 311,000 | | | | 11,345 | | |
| Thermo Electron Corp. (b) | | | 23,800 | | | | 690 | | |
| Insurance (7.5%) | | | |
| AMBAC Financial Group, Inc. | | | 112,900 | | | | 8,813 | | |
| American International Group, Inc. | | | 157,100 | | | | 9,538 | | |
| Chubb Corp. | | | 115,780 | | | | 8,351 | | |
| CNA Surety Corp. (b) | | | 294,600 | | | | 3,467 | | |
| MGIC Investment Corp. | | | 122,000 | | | | 7,846 | | |
The notes to the financial statements are an integral part of this report.
Transamerica IDEX Mutual Funds
Annual Report 2004
4
TA IDEX Salomon All Cap
SCHEDULE OF INVESTMENTS (continued)
At October 31, 2004
(all amounts except share amounts in thousands)
| | | Shares | | Value | |
| Insurance (continued) | |
| PMI Group (The), Inc. | | | 39,500 | | | $ | 1,533 | | |
| Radian Group, Inc. | | | 200,400 | | | | 9,605 | | |
| Insurance Agents, Brokers & Service (0.7%) | |
| Hartford Financial Services Group, Inc. | | | 79,300 | | | | 4,637 | | |
| Life Insurance (0.3%) | |
| Scottish Re Group, Ltd. (a) | | | 99,000 | | | | 2,228 | | |
| Lumber & Other Building Materials (1.4%) | |
| Home Depot, Inc. | | | 219,600 | | | | 9,021 | | |
| Lumber & Wood Products (2.7%) | |
| Georgia-Pacific Corp. | | | 249,400 | | | | 8,627 | | |
| Weyerhaeuser Co. | | | 141,800 | | | | 8,882 | | |
| Manufacturing Industries (2.1%) | |
| Callaway Golf Co. | | | 46,200 | | | | 482 | | |
| Hasbro, Inc. | | | 384,700 | | | | 6,805 | | |
| Mattel, Inc. | | | 369,400 | | | | 6,468 | | |
| Metal Mining (1.7%) | |
| Newmont Mining Corp. (a) | | | 235,700 | | | | 11,200 | | |
| Mining (0.1%) | |
| WGI Heavy Minerals, Inc. (b) | | | 104,300 | | | | 479 | | |
| Motion Pictures (2.3%) | |
| News Corp., Ltd., Sponsored ADR (a) | | | 149,900 | | | | 4,836 | | |
| Time Warner, Inc. (b) | | | 600,000 | | | | 9,984 | | |
| Motor Vehicles, Parts & Supplies (0.4%) | |
| BorgWarner, Inc. | | | 61,800 | | | | 2,866 | | |
| Oil & Gas Extraction (4.1%) | |
| Anadarko Petroleum Corp. | | | 126,500 | | | | 8,532 | | |
| GlobalSantaFe Corp. | | | 175,000 | | | | 5,163 | | |
| Halliburton Co. | | | 225,000 | | | | 8,334 | | |
| Schlumberger, Ltd. | | | 75,000 | | | | 4,721 | | |
| Paper & Allied Products (0.7%) | |
| Smurfit-Stone Container Corp. (a) | | | 273,600 | | | | 4,750 | | |
| Petroleum Refining (2.8%) | |
| ChevronTexaco Corp. | | | 190,800 | | | | 10,124 | | |
| Murphy Oil Corp. | | | 100,100 | | | | 8,010 | | |
| Pharmaceuticals (11.6%) | |
| Abbott Laboratories | | | 237,900 | | | | 10,142 | | |
| Amgen, Inc. (b) | | | 61,400 | | | | 3,488 | | |
| Aphton Corp. (a)(b) | | | 553,200 | | | | 1,992 | | |
| Eli Lilly & Co. | | | 25,700 | | | | 1,411 | | |
| GlaxoSmithKline PLC, ADR | | | 197,400 | | | | 8,370 | | |
| Johnson & Johnson | | | 201,000 | | | | 11,734 | | |
| McKesson Corp. | | | 128,900 | | | | 3,436 | | |
| Merck & Co., Inc. | | | 263,200 | | | | 8,241 | | |
| | | Shares | | Value | |
| Pharmaceuticals (continued) | | | |
| Novartis AG, Sponsored ADR | | | 125,000 | | | $ | 6,001 | | |
| Pfizer, Inc. | | | 370,600 | | | | 10,729 | | |
| Wyeth | | | 230,900 | | | | 9,155 | | |
| XOMA, Ltd. (b) | | | 504,100 | | | | 1,033 | | |
| Primary Metal Industries (4.4%) | | | |
| Alcoa, Inc. | | | 302,300 | | | | 9,825 | | |
| Allegheny Technologies, Inc. (a) | | | 345,900 | | | | 5,815 | | |
| Brush Engineered Materials, Inc. (b) | | | 82,300 | | | | 1,284 | | |
| Engelhard Corp. | | | 179,900 | | | | 5,091 | | |
| RTI International Metals, Inc. (b) | | | 185,900 | | | | 3,724 | | |
| United States Steel Corp. (a) | | | 78,700 | | | | 2,890 | | |
| Printing & Publishing (0.3%) | | | |
| MarketWatch.com, Inc. (b) | | | 175,000 | | | | 2,320 | | |
| Radio & Television Broadcasting (0.1%) | | | |
| IAC/InterActiveCorp (a)(b) | | | 45,200 | | | | 977 | | |
| Security & Commodity Brokers (3.4%) | | | |
| American Express Co. | | | 175,000 | | | | 9,287 | | |
| Merrill Lynch & Co., Inc. | | | 144,000 | | | | 7,767 | | |
| Morgan Stanley | | | 100,000 | | | | 5,109 | | |
| Telecommunications (3.2%) | | | |
Hutchison Telecommunications
International, Ltd. | | | 99,000 | | | | 68 | | |
| Nippon Telegraph & Telephone Corp., ADR | | | 259,500 | | | | 5,514 | | |
| SBC Communications, Inc. | | | 250,000 | | | | 6,315 | | |
| Vodafone Group PLC, Sponsored ADR | | | 351,800 | | | | 9,073 | | |
| Transportation Equipment (0.2%) | | | |
| Fleetwood Enterprises, Inc. (a)(b) | | | 103,700 | | | | 1,306 | | |
| Variety Stores (1.3%) | | | |
| Costco Wholesale Corp. | | | 175,000 | | | | 8,390 | | |
| Wholesale Trade Durable Goods (0.6%) | | | |
| IKON Office Solutions, Inc. | | | 359,700 | | | | 3,777 | | |
| Total Common Stocks (cost: $574,432) | | | | | | | 616,688 | | |
| | | Principal | | Value | |
| SECURITY LENDING COLLATERAL (7.8%) | | | |
| Debt (7.2%) | | | |
| Bank Notes (1.4%) | | | |
Bank of America
1.77%, due 12/03/2004 | | | $ 2,475 | | | | $2,475 | | |
| 1.88%, due 12/23/2004 | | | 825 | | | | 825 | | |
| 1.77%, due 01/18/2005 | | | 1,650 | | | | 1,650 | | |
Canadian Imperial Bank of Commerce
1.86%, due 11/04/2004 | | | 3,713 | | | | 3,713 | | |
Credit Suisse First Boston Corp.
1.83%, due 09/09/2005 | | | 412 | | | | 412 | | |
The notes to the financial statements are an integral part of this report.
Transamerica IDEX Mutual Funds
Annual Report 2004
5
TA IDEX Salomon All Cap
SCHEDULE OF INVESTMENTS (continued)
At October 31, 2004
(all amounts except share amounts in thousands)
| | | Principal | | Value | |
| Commercial Paper (0.7%) | | | |
Clipper Receivables Corp.
1.79%, due 11/12/2004 | | $ 1,229 | | $1,229 | |
Delaware Funding Corp. 144A
1.85%, due 11/19/2004 | | 412 | | 412 | |
Falcon Asset Securitization Corp. 144A
1.78%, due 11/04/2004
1.75%, due 11/10/2004 | | 1,231
1,650 | | 1,231
1,650 | |
Galaxy Funding 144A
1.88%, due 11/22/2004 | | 413 | | 413 | |
| Euro Dollar Terms (3.4%) | | | |
Bank of Montreal
1.88%, due 11/24/2004 | | 3,908 | | 3,908 | |
BNP Paribas
1.77%, due 11/10/2004
1.80%, due 11/23/2004
1.98%, due 12/27/2004 | | 2,063
1,650
1,650 | | 2,063
1,650
1,650 | |
Calyon
1.70%, due 11/24/2004 | | 218 | | 218 | |
Citigroup
2.06%, due 01/25/2005 | | 4,125 | | 4,125 | |
Den Danske Bank
1.82%, due 11/19/2004 | | 2,063 | | 2,063 | |
Dexia Group
2.04%, due 01/21/2005 | | 957 | | 957 | |
HBOS Halifax Bank of Scotland
2.03%, due 01/21/2005 | | 825 | | 825 | |
Royal Bank of Scotland
2.01%, due 01/20/2005 | | 1,650 | | 1,650 | |
| | | Principal | | Value | |
| Euro Dollar Terms (continued) | |
Toronto Dominion Bank
1.70%, due 11/08/2004 | | | $ 825 | | | | $825 | | |
Wells Fargo
1.87%, due 11/22/2004 | | | 2,063 | | | | 2,063 | | |
| Promissory Notes (0.7%) | |
Goldman Sachs Group Inc.
1.90%, due 12/29/2004
1.88%, due 01/27/2005 | | | 1,733
2,888 | | | | 1,733
2,888 | | |
| Repurchase Agreements (1.0%) | |
Merrill Lynch & Co., Inc. (c)
1.92% Repurchase Agreement dated
10/29/04 to be repurchased at $6,600
on 11/01/04 | | | 6,600 | | | | 6,600 | | |
| | | Shares | | Value | |
| Investment Companies (0.6%) | |
| Money Market Funds (0.6%) | |
Merrill Lynch Premier Institutional Fund
1-day yield of 1.71% | | | 2,029,423 | | | | $2,029 | | |
Merrimac Cash Fund, Premium Class
1-day yield of 1.46% | | | 1,485,111 | | | | 1,485 | | |
| Total Security Lending Collateral (cost: $50,742) | | | | | | | 50,742 | | |
| Total Investment Securities (cost: $631,012) | | | | | | $ | 674,001 | | |
| SUMMARY: | |
| Investments, at value | | | 103.0 | % | | $ | 674,001 | | |
| Liabilities in excess of other assets | | | (3.0 | )% | | | (19,734 | ) | |
| Net assets | | | 100.0 | % | | $ | 654,267 | | |
NOTES TO SCHEDULE OF INVESTMENTS:
(a) At October 31, 2004, all or a portion of this security is on loan (see Note 1). The value at October 31, 2004, of all securities on loan is $47,928.
(b) No dividends were paid during the preceding twelve months.
(c) Cash collateral for the Repurchase Agreements, valued at $6,754, that serve as collateral for securities lending are invested in corporate bonds with interest rates and maturity dates ranging from 0.00%–9.75% and 05/15/2005–9/15/2033, respectively.
DEFINITIONS:
144A 144A Securities are registered pursuant to the rule 144A of the Securities Act of 1933. These securities are deemed to be liquid for purposes of compliance limitations on holdings of illiquid securities and may be resold as transactions exempt from registration normally, to qualified institutional buyers. At October 31, 2004 these securities aggregated $3,706 or 0.6% of the net assets of the Fund.
ADR American Depositary Receipt
REIT Real Estate Investment Trust
The notes to the financial statements are an integral part of this report.
Transamerica IDEX Mutual Funds
Annual Report 2004
6
TA IDEX Salomon All Cap
STATEMENT OF ASSETS AND LIABILITIES
At October 31, 2004
(all amounts except per share amounts in thousands)
| Assets: | | | |
Investment securities, at value (cost: $631,012)
(including securities loaned of $47,928) | | $ | 674,001 | | |
| Cash | | | 34,739 | | |
| Receivables: | |
| Investment securities sold | | | 4,390 | | |
| Shares of beneficial interest sold | | | 34 | | |
| Interest | | | 43 | | |
| Dividends | | | 725 | | |
| Dividend reclaims receivable | | | 5 | | |
| Other | | | 21 | | |
| | | | 713,958 | | |
| Liabilities: | | | |
| Investment securities purchased | | | 7,370 | | |
| Accounts payable and accrued liabilities: | |
| Shares of beneficial interest redeemed | | | 551 | | |
| Management and advisory fees | | | 428 | | |
| Distribution fees | | | 312 | | |
| Transfer agent fees | | | 167 | | |
| Payable for collateral for securities on loan | | | 50,742 | | |
| Other | | | 121 | | |
| | | | 59,691 | | |
| Net Assets | | $ | 654,267 | | |
| Net Assets Consist of: | | | |
Shares of beneficial interest, unlimited shares
authorized, no par value | | $ | 661,211 | | |
| Accumulated net investment income (loss) | | | (6 | ) | |
Accumulated net realized gain (loss) from investment
securities and foreign currency transactions | | | (49,924 | ) | |
Net unrealized appreciation (depreciation) on
investment securities | | | 42,986 | | |
| Net Assets | | $ | 654,267 | | |
| Net Assets by Class: | | | |
| Class A | | $ | 438,047 | | |
| Class B | | | 150,829 | | |
| Class C | | | 65,391 | | |
| Shares Outstanding: | | | |
| Class A | | | 29,590 | | |
| Class B | | | 10,568 | | |
| Class C | | | 4,584 | | |
| Net Asset Value Per Share: | | | |
| Class A | | $ | 14.80 | | |
| Class B | | | 14.27 | | |
| Class C | | | 14.26 | | |
| Maximum Offering Price Per Share (a): | | | |
| Class A | | $ | 15.66 | | |
(a) Includes the maximum selling commission (represented as a percentage of offering price) which is reduced on certain levels of sales as set forth in the Prospectus. Net asset value per share for Classes B and C shares represents offering price. The redemption price for Classes B and C shares equals net asset value less any applicable contingent deferred sales charge.
STATEMENT OF OPERATIONS
For the year ended October 31, 2004
(all amounts in thousands)
| Investment Income: | | | |
| Interest | | $ | 241 | | |
| Dividends | | | 7,216 | | |
| Income from loaned securities–net | | | 151 | | |
| Less withholding taxes on foreign dividends | | | (133 | ) | |
| | | | 7,475 | | |
| Expenses: | | | |
| Management and advisory fees | | | 5,002 | | |
| Transfer agent fees: | |
| Class A | | | 551 | | |
| Class B | | | 206 | | |
| Class C | | | 23 | | |
| Class C2 | | | 33 | | |
| Class M | | | 52 | | |
| Printing and shareholder reports | | | 97 | | |
| Custody fees | | | 77 | | |
| Administration fees | | | 89 | | |
| Legal fees | | | 22 | | |
| Audit and accounting fees | | | 15 | | |
| Trustees fees | | | 38 | | |
| Registration fees: | |
| Class A | | | 61 | | |
| Class B | | | 6 | | |
| Class C | | | 12 | | |
| Class C2 | | | 3 | | |
| Class M | | | 5 | | |
| Other | | | 25 | | |
| Distribution and service fees: | |
| Class A | | | 1,423 | | |
| Class B | | | 1,625 | | |
| Class C | | | 202 | | |
| Class C2 | | | 204 | | |
| Class M | | | 301 | | |
| Total expenses | | | 10,072 | | |
| Net Investment Income (Loss) | | | (2,597 | ) | |
| Net Realized Gain (Loss) from: | | | |
| Investment securities | | | 25,149 | | |
| Foreign currency transactions | | | (5 | ) | |
| | | | 25,144 | | |
Increase (decrease) in unrealized appreciation
(depreciation) on investment securities | | | 6,182 | | |
Net Gain (Loss) on Investments and Foreign Currency
Transactions | | | 31,326 | | |
Net Increase (Decrease) in Net Assets Resulting
from Operations | | $ | 28,729 | | |
The notes to the financial statements are an integral part of this report.
Transamerica IDEX Mutual Funds
Annual Report 2004
7
TA IDEX Salomon All Cap
STATEMENTS OF CHANGES IN NET ASSETS
For the years ended
(all amounts in thousands)
| | | October 31,
2004 | | October 31,
2003 | |
| Increase (Decrease) In Net Assets From: | | | |
| Operations: | | | |
| Net investment income (loss) | | $ | (2,597 | ) | | $ | (2,444 | ) | |
Net realized gain (loss) from
investment securities and
foreign currency transactions | | | 25,144 | | | | (14,296 | ) | |
Net unrealized appreciation
(depreciation) on investment
securities | | | 6,182 | | | | 111,856 | | |
| | | | 28,729 | | | | 95,116 | | |
| Capital Share Transactions: | | | |
| Proceeds from shares sold: | |
| Class A | | | 172,341 | | | | 202,927 | | |
| Class B | | | 20,598 | | | | 26,289 | | |
| Class C | | | 8,093 | | | | 2,385 | | |
| Class C2 | | | 2,046 | | | | 4,158 | | |
| Class M | | | 2,231 | | | | 2,540 | | |
| | | | 205,309 | | | | 238,299 | | |
| Cost of shares redeemed: | |
| Class A | | | (22,683 | ) | | | (23,992 | ) | |
| Class B | | | (36,255 | ) | | | (38,674 | ) | |
| Class C | | | (7,530 | ) | | | (122 | ) | |
| Class C2 | | | (7,820 | ) | | | (15,143 | ) | |
| Class M | | | (9,325 | ) | | | (12,598 | ) | |
| | | | (83,613 | ) | | | (90,529 | ) | |
| Class level exchanges: | |
| Class C | | | 62,362 | | | | – | | |
| Class C2 | | | (30,201 | ) | | | – | | |
| Class M | | | (32,161 | ) | | | – | | |
| | | | – | | | | – | | |
| Automatic conversions: | |
| Class A | | | 98 | | | | – | | |
| Class B | | | (98 | ) | | | – | | |
| | | | – | | | | – | | |
| | | | 121,696 | | | | 147,770 | | |
| Net increase (decrease) in net assets | | | 150,425 | | | | 242,886 | | |
| Net Assets: | | | |
| Beginning of year | | | 503,842 | | | | 260,956 | | |
| End of year | | $ | 654,267 | | | $ | 503,842 | | |
Accumulated Net Investment Income
(Loss) | | $ | (6 | ) | | $ | (6 | ) | |
| | | October 31,
2004 | | October 31,
2003 | |
| Share Activity: | |
| Shares issued: | |
| Class A | | | 11,625 | | | | 16,039 | | |
| Class B | | | 1,436 | | | | 2,195 | | |
| Class C | | | 567 | | | | 198 | | |
| Class C2 | | | 143 | | | | 367 | | |
| Class M | | | 154 | | | | 212 | | |
| | | | 13,925 | | | | 19,011 | | |
| Shares redeemed: | |
| Class A | | | (1,535 | ) | | | (2,110 | ) | |
| Class B | | | (2,548 | ) | | | (3,473 | ) | |
| Class C | | | (536 | ) | | | (10 | ) | |
| Class C2 | | | (542 | ) | | | (1,383 | ) | |
| Class M | | | (650 | ) | | | (1,147 | ) | |
| | | | (5,811 | ) | | | (8,123 | ) | |
| Class level exchanges: | |
| Class C | | | 4,365 | | | | – | | |
| Class C2 | | | (2,082 | ) | | | – | | |
| Class M | | | (2,271 | ) | | | – | | |
| | | | 12 | | | | – | | |
| Automatic conversions: | |
| Class A | | | 6 | | | | – | | |
| Class B | | | (6 | ) | | | – | | |
| | | | – | | | | – | | |
Net increase (decrease) in shares
outstanding: | |
| Class A | | | 10,096 | | | | 13,929 | | |
| Class B | | | (1,118 | ) | | | (1,278 | ) | |
| Class C | | | 4,396 | | | | 188 | | |
| Class C2 | | | (2,481 | ) | | | (1,016 | ) | |
| Class M | | | (2,767 | ) | | | (935 | ) | |
| | | | 8,126 | | | | 10,888 | | |
The notes to the financial statements are an integral part of this report.
Transamerica IDEX Mutual Funds
Annual Report 2004
8
TA IDEX Salomon All Cap
FINANCIAL HIGHLIGHTS
| | | | | For a share of beneficial interest outstanding throughout each period | |
| | | | | Net Asset | | Investment Operations | | Distributions | | Net Asset | |
| | | For the
Period
Ended (d)(g) | | Value,
Beginning
of Period | | Net
Investment
Income (Loss) | | Net Realized
and Unrealized
Gain (Loss) | | Total
Operations | | From Net
Investment
Income | | From Net
Realized
Gains | | Total
Distributions | | Value,
End
of Period | |
| Class A | | 10/31/2004 | | $ | 13.95 | | | $ | (0.03 | ) | | $ | 0.88 | | | $ | 0.85 | | | $ | – | | | $ | – | | | $ | – | | | $ | 14.80 | | |
| | | 10/31/2003 | | | 10.34 | | | | (0.04 | ) | | | 3.65 | | | | 3.61 | | | | – | | | | – | | | | – | | | | 13.95 | | |
| | | 10/31/2002 | | | 13.63 | | | | – | | | | (3.15 | ) | | | (3.15 | ) | | | – | | | | (0.14 | ) | | | (0.14 | ) | | | 10.34 | | |
| | | 10/31/2001 | | | 15.51 | | | | 0.12 | | | | (1.58 | ) | | | (1.46 | ) | | | – | | | | (0.42 | ) | | | (0.42 | ) | | | 13.63 | | |
| | | 10/31/2000 | | | 11.70 | | | | 0.08 | | | | 3.92 | | | | 4.00 | | | | – | | | | (0.19 | ) | | | (0.19 | ) | | | 15.51 | | |
| Class B | | 10/31/2004 | | | 13.53 | | | | (0.11 | ) | | | 0.85 | | | | 0.74 | | | | – | | | | – | | | | – | | | | 14.27 | | |
| | | 10/31/2003 | | | 10.08 | | | | (0.12 | ) | | | 3.57 | | | | 3.45 | | | | – | | | | – | | | | – | | | | 13.53 | | |
| | | 10/31/2002 | | | 13.41 | | | | (0.10 | ) | | | (3.09 | ) | | | (3.19 | ) | | | – | | | | (0.14 | ) | | | (0.14 | ) | | | 10.08 | | |
| | | 10/31/2001 | | | 15.36 | | | | 0.02 | | | | (1.55 | ) | | | (1.53 | ) | | | – | | | | (0.42 | ) | | | (0.42 | ) | | | 13.41 | | |
| | | 10/31/2000 | | | 11.66 | | | | (0.03 | ) | | | 3.92 | | | | 3.89 | | | | – | | | | (0.19 | ) | | | (0.19 | ) | | | 15.36 | | |
| Class C | | 10/31/2004 | | | 13.53 | | | | (0.12 | ) | | | 0.85 | | | | 0.73 | | | | – | | | | – | | | | – | | | | 14.26 | | |
| | | 10/31/2003 | | | 10.26 | | | | (0.12 | ) | | | 3.39 | | | | 3.27 | | | | – | | | | – | | | | – | | | | 13.53 | | |
| | | | | | | Ratios/Supplemental Data | |
| | | For the
Period | | Total | | Net Assets,
End of
Period | | Ratio of Expenses
to Average
Net Assets (a) | | Net Investment
Income (Loss)
to Average | | Portfolio
Turnover | |
| | | Ended (g) | | Return (c) | | (000's) | | Net (e) | | Total (f) | | Net Assets (a) | | Rate (b) | |
| Class A | | 10/31/2004 | | | 6.09 | % | | $ | 438,047 | | | | 1.33 | % | | | 1.33 | % | | | (0.17 | )% | | | 25 | % | |
| | | 10/31/2003 | | | 34.91 | | | | 271,958 | | | | 1.55 | | | | 1.64 | | | | (0.36 | ) | | | 30 | | |
| | | 10/31/2002 | | | (23.44 | ) | | | 57,528 | | | | 1.55 | | | | 1.65 | | | | (0.03 | ) | | | 162 | | |
| | | 10/31/2001 | | | (9.49 | ) | | | 77,791 | | | | 1.58 | | | | 1.68 | | | | 0.75 | | | | 82 | | |
| | | 10/31/2000 | | | 34.50 | | | | 25,575 | | | | 1.55 | | | | 2.41 | | | | 0.45 | | | | 91 | | |
| Class B | | 10/31/2004 | | | 5.48 | | | | 150,829 | | | | 1.97 | | | | 1.97 | | | | (0.80 | ) | | | 25 | | |
| | | 10/31/2003 | | | 34.23 | | | | 158,147 | | | | 2.20 | | | | 2.29 | | | | (1.01 | ) | | | 30 | | |
| | | 10/31/2002 | | | (24.11 | ) | | | 130,709 | | | | 2.20 | | | | 2.30 | | | | (0.68 | ) | | | 162 | | |
| | | 10/31/2001 | | | (10.09 | ) | | | 167,214 | | | | 2.23 | | | | 2.33 | | | | 0.10 | | | | 82 | | |
| | | 10/31/2000 | | | 33.72 | | | | 38,203 | | | | 2.20 | | | | 3.06 | | | | (0.20 | ) | | | 91 | | |
| Class C | | 10/31/2004 | | | 5.43 | | | | 65,391 | | | | 1.99 | | | | 1.99 | | | | (0.83 | ) | | | 25 | | |
| | | 10/31/2003 | | | 31.87 | | | | 2,547 | | | | 2.20 | | | | 2.29 | | | | (1.01 | ) | | | 30 | | |
NOTES TO FINANCIAL HIGHLIGHTS
(a) Annualized.
(b) Not annualized for periods of less than one year.
(c) Total Return has been calculated for the applicable period without deduction of a sales load, if any, on an initial purchase. Periods of less than one year are not annualized.
(d) Per share information is calculated based on average number of shares outstanding for the years ended 10/31/2001, 10/31/2002, 10/31/2003 and 10/31/2004.
(e) Ratio of Net Expenses to Average Net Assets is net of fee waivers and reimbursements by the investment adviser, if any (see note 2).
(f) Ratio of Total Expenses to Average Net Assets includes all expenses before fee waivers and reimbursements by the investment adviser.
(g) TA IDEX Salomon All Cap ("the Fund") commenced operations on March 1, 1999. The inception date for the Fund's offering of share Class L was November 11, 2002. Class L was renamed Class C on March 1, 2004. (see note 1)
The notes to the financial statements are an integral part of this report.
Transamerica IDEX Mutual Funds
Annual Report 2004
9
TA IDEX Salomon All Cap
NOTES TO FINANCIAL STATEMENTS
At October 31, 2004
(all amounts in thousands)
NOTE 1. ORGANIZATION AND SIGNIFICANT ACCOUNTING POLICIES
Transamerica IDEX Mutual Funds, formerly IDEX Mutual Funds, is a Massachusetts business trust registered under the Investment Company Act of 1940, as amended (the "1940 Act"), as an open-end management investment company. TA IDEX Salomon All Cap ("the Fund"), part of Transamerica IDEX Mutual Funds, began operations on March 1, 1999.
The Fund is "non-diversified" under the 1940 Act.
On March 1, 2004, the Fund changed its name from IDEX Salomon All Cap to TA IDEX Salomon All Cap.
In the normal course of business, the Fund enters into contracts that contain a variety of representations and warranties, which provide general indemnifications. The Fund's maximum exposure under these arrangements is unknown, as this would involve future claims that may be made against the Fund and/or its affiliates that have not yet occurred. However, based on experience, the Fund expects the risk of loss to be remote.
See the Prospectus and Statement of Additional Information for a description of the Fund's investment objective.
In preparing the Fund's financial statements in accordance with accounting principles generally accepted in the United States of America ("GAAP"), estimates or assumptions (which could differ from actual results) may be used that affect reported amounts and disclosures. The following policies were consistently followed by the Fund, in accordance with GAAP.
Multiple class operations and expenses: The Fund currently offers three classes of shares, each with a public offering price that reflects different sales charges, if any, and expense levels. All shares designated as Class C shares prior to March 1, 2004, were renamed as Class C2 shares on that date. All shares designated as Class L shares prior to March 1, 2004, were renamed as Class C shares with different sales charges than the previous Class L shares. On June 15, 2004, Class C2 shares merged into Class C. On September 24, 2004, Class M shares merged into Class C. Class B shares will convert to Class A shares eight years after purchase.��Income, non-class specific expenses and realized and unrealized gains and losses, are allocated daily to each class, based upon the value of shares outstanding method as permitted under Rule 18f-3 of the 1940 Act. Each class bears its own specific expenses as well as a portion of general, common expenses.
Pricing of shares: The Fund prices its shares on the basis of the net asset value of each class of shares of the Fund, which is determined as of the close of the New York Stock Exchange ("NYSE") (generally 4:00 p.m. Eastern Time) on each day on which the NYSE is open for trading (other than a day on which there are insufficient changes in the value of the Fund's portfolio securities to materially affect the Fund's net asset value or a day on which no shares are tendered for redemption and no order to purchase any shares is received).
Security valuations: Fund investments traded on an exchange are valued at the closing price on the day of valuation on the exchange where the security is principally traded. With respect to securities traded on NASDAQ NMS, such closing price may be the last reported sales price or the NASDAQ Official Closing Price.
Securities traded in the over-the-counter market and listed securities for which no sale was reported on that date are valued at the last quoted bid price.
Debt securities are valued by independent pricing services; however, those that mature in sixty days or less are valued at amortized cost, which approximates market.
Investment company securities are valued at net asset value of the underlying portfolio.
Foreign securities generally are valued based on quotations from the primary market in which they are traded and are translated from the local currency into U.S. dollars using closing exchange rates. Many foreign securities markets are open for trading at times when the
U.S. markets are closed for trading, and many foreign securities markets close for trading before the close of the NYSE. The value of foreign securities may be affected significantly on a day that the NYSE is closed and an investor is unable to purchase or redeem shares. If a significant market event impacting the value of a portfolio security (e.g., natural disaster, company announcement, market volatility) occurs subsequent to the close of trading in the security, but prior to the calculation of the Fund's net asset value per share, market quotations for that security may be determined to be unreliable and, accordingly, not "readil y available." If market quotations are not readily available, and the impact of such a significant market event materially effects the net asset value per share of the Fund, an affected portfolio security will be valued at fair market value as determined in good faith using guidelines adopted by the Board of Trustees of the Fund, under the supervision of the Fund's Valuation Committee. Factors that may be considered to value foreign securities at fair market value may include, among others: the value of other securities traded on other markets, foreign currency exchange activity and the trading of financial products tied to foreign securities.
Other securities for which quotations are not readily available are valued at fair market value as determined in good faith using guidelines adopted by the Board of Trustees of the Fund, under the supervision of the Fund's Valuation Committee.
Cash: The Fund may leave cash overnight in its cash account with the custodian, Investors Bank & Trust Company ("IBT"). IBT has been
Transamerica IDEX Mutual Funds
Annual Report 2004
10
TA IDEX Salomon All Cap
NOTES TO FINANCIAL STATEMENTS (continued)
At October 31, 2004
(all amounts in thousands)
NOTE 1.–(continued)
contracted on behalf of the Fund to invest the excess cash into a savings account, which at October 31, 2004, was paying an interest rate of 1.30%.
Throughout the year, the Fund may have a cash overdraft balance. A fee is incurred on this overdraft, calculated by multiplying the overdraft by a rate based on the federal funds rate. This fee is included in Custody fees in the Statement of Operations.
Repurchase agreements: The Fund is authorized to enter into repurchase agreements. The Fund, through IBT, receives delivery of the underlying securities, the value of which at the time of purchase is required to be an amount equal to at least 100% of the resale price. Repurchase agreements involve the risk that the seller will fail to repurchase the security, as agreed. In that case, the Fund will bear the risk of value fluctuations until the security can be sold and may encounter delays and incur costs in liquidating the security. In the event of bankruptcy or insolvency of the seller, delays and costs may be incurred.
Commission recapture: The sub-adviser, to the extent consistent with the best execution and usual commission rate policies and practices, may place security transactions of the Fund with broker/dealers with which Transamerica IDEX Mutual Funds has established a Commission Recapture Program. A Commission Recapture Program is any arrangement under which a broker/dealer applies a portion of the commissions received by such broker/dealer on the security transactions to the Fund. In no event will commissions paid by the Fund be used to pay expenses that would otherwise be borne by any other funds within Transamerica IDEX Mutual Funds, or by any other party.
Recaptured commissions during the year ended October 31, 2004, of $247 are included in net realized gains on the Statement of Operations.
Securities lending: The Fund may lend securities to enhance fund earnings from investing cash collateral in making such loans to qualified borrowers (typically broker/dealers). The Fund has engaged its custodian bank, IBT, as a lending agent to administer its securities lending program. IBT earned $65 of program income for its services. When the Fund makes a security loan, it receives cash collateral as protection against the risk that the borrower will default on the loan, and records an asset for the cash invested collateral and a liability for the return of the collateral.
Securities on loan are included in Investment securities at value in the Statement of Assets and Liabilities and remain on the Schedule of Investments.
Loans of securities are required to be secured by collateral at least equal to 102% of the value of the securities at inception of the loan, and not less then 100% thereafter. The Fund may invest cash collateral in short-term money market instruments including: U.S. Treasury Bills, U.S. agency obligations, commercial paper, money market mutual funds, repurchase agreements and other highly rated, liquid investments. During the life of securities loans, the collateral and securities loaned remain subject to fluctuation in value. IBT marks to market securities loaned and the collateral each business day. If additional collateral is due (at least $1), IBT collects additional cash collateral from the borrowers. Although securities loaned will be fully collateralized at all times, IBT may experience delays in, or may be prevented from, recovering the collateral on behalf of the Fund. The Fund may recall a loa ned security position at any time from the borrower through IBT. In the event the borrower fails to timely return a recalled security, IBT may indemnify the Fund by purchasing replacement securities for the Fund at its own expense and claiming the collateral to fund such a purchase. IBT absorbs the loss if the collateral value is not sufficient to cover the cost of the replacement securities. If replacement securities are not available, IBT will credit the equivalent cash value to the Fund.
While a security is on loan, the Fund does not have the right to vote that security. However, if time permits, the Fund will attempt to recall a security on loan and vote the proxy.
Income from securities lending is included in the Statement of Operations. The amount of collateral and value of securities on loan are included in the Statement of Assets and Liabilities as well as in the Schedule of Investments.
Security transactions and investment income: Security transactions are recorded on the trade date. Security gains and losses are calculated on the specific identification basis. Dividend income is recorded on the ex-dividend date or, in the case of foreign securities, as soon as the Fund is informed of the ex-dividend date. Interest income, including accretion of discounts and amortization of premiums, is recorded on the accrual basis commencing on the settlement date.
Foreign currency denominated investments: The accounting records of the Fund are maintained in U.S. dollars. Securities and other assets and liabilities denominated in foreign currencies are translated into U.S. dollars at the closing exchange rate each day. The cost of foreign securities is translated at the exchange rate in effect when the investment was acquired. The Fund combines fluctuations from currency exchange rates and fluctuations in value when computing net realized and unrealized gains or losses from investments.
Net foreign currency gains and losses resulting from changes in exchange rates include: 1) foreign currency fluctuations between trade date and settlement date of investment security transactions; 2) gains and losses on forward foreign currency contracts; and 3) the difference between the receivable amounts of interest and dividends recorded in the accounting records in U.S. dollars and the amounts actually received.
Transamerica IDEX Mutual Funds
Annual Report 2004
11
TA IDEX Salomon All Cap
NOTES TO FINANCIAL STATEMENTS (continued)
At October 31, 2004
(all amounts in thousands)
NOTE 1.–(continued)
Foreign currency denominated assets may involve risks not typically associated with domestic transactions, including unanticipated movements in exchange currency rates, the degree of government supervision and regulation of security markets, and the possibility of political or economic instability.
Foreign capital gains taxes: The Fund may be subject to taxes imposed by countries in which it invests, with respect to its investment in issuers existing or operating in such countries. Such taxes are generally based on income earned or repatriated and capital gains realized on the sale of such investments. The Fund accrues such taxes when the related income or capital gains are earned. Some countries require governmental approval for the repatriation of investment income, capital or the proceeds of sales earned by foreign investors. In addition, if there is deterioration in a country's balance of payments or for other reasons, a country may impose temporary restrictions on foreign capital remittances abroad.
Account maintenance fees: If the shareholder account balance falls below $1 by either shareholder action or as a result of market action, a $25 (not in thousands) fee is assessed every year until the balance reaches $1. The fee is assessed by redeeming shares in the shareholder's account.
No fee will be charged under the following conditions:
• accounts opened within the preceding 24 months
• accounts with an active monthly Automatic Investment Plan ($50 (not in thousands) minimum per fund)
• accounts owned by an individual which, when combined by social security number, have a balance of $5 or more
• accounts owned by individuals in the same household (by address) that have a combined balance of $5 or more
• UTMA/UGMA accounts
• Fiduciary accounts
• B-share accounts whose shares have started to convert to
A-shares accounts (as long as combined value of both accounts is at least $1)
For the year ended October 31, 2004, this fee totaled $7. These fees are included in Paid in Capital in the Statement of Assets and Liabilities.
Redemption fees: A short-term trading redemption fee may be assessed on any fund shares in a fund account that are sold during the first five (5) New York Stock Exchange trading days following their purchase date. This redemption fee will equal 2% of the amount redeemed and shares held the longest will be treated as being redeemed first and shares held the shortest as being redeemed last. For the year ended October 31, 2004, the Fund received no redemption fees.
Dividend distributions: Distributions to shareholders are recorded on the ex-dividend date and are determined in accordance with Federal income tax regulations which may differ from GAAP.
NOTE 2. RELATED PARTY TRANSACTIONS
AEGON/Transamerica Fund Advisers, Inc. ("ATFA") is the Fund's investment adviser. AEGON/Transamerica Fund Services, Inc. ("ATFS") is the Fund's administrator. AFSG Securities Corp. ("AFSG") is the Fund's distributor/principal underwriter. AEGON/Transamerica Investor Services, Inc. ("ATIS") is the Fund's transfer agent. ATIS and AFSG are 100% owned by AUSA Holding Company ("AUSA"). ATFA is a directly owned subsidiary of Western Reserve Life Assurance Co. of Ohio (78%) ("WRL") and AUSA (22%). ATFS is a wholly owned subsidiary of WRL. AUSA and WRL are wholly owned indirect subsidiaries of AEGON NV, a Netherlands corporation.
The following schedule represents the percentage of fund assets owned by affiliated mutual funds (i.e. through the asset allocation funds):
| | | Net
Assets | | % of
Net Assets | |
TA IDEX Asset Allocation–
Conservative Portfolio | | $ | 14,540 | | | | 2 | % | |
TA IDEX Asset Allocation–
Growth Portfolio | | | 114,595 | | | | 18 | % | |
TA IDEX Asset Allocation–
Moderate Growth Portfolio | | | 176,272 | | | | 27 | % | |
TA IDEX Asset Allocation–
Moderate Portfolio | | | 64,742 | | | | 10 | % | |
| Total | | $ | 370,149 | | | | 57 | % | |
Investment advisory fee: The Fund pays management fees to ATFA based on average daily net assets ("ANA") at the following breakpoints:
0.80% of the first $500 million of ANA
0.70% of ANA over $500 million
ATFA has contractually agreed to waive its advisory fee and will reimburse the Fund to the extent that operating expenses, excluding 12b-1 fees, exceed the following stated annual limit:
1.20% Expense Limit
Distribution and service fees: The Fund has a 12b-1 distribution plan under the 1940 Act pursuant to which an annual fee, based on average daily net assets, is paid to the distributor for various disbursements such as broker-dealer account servicing fees and other promotional
Transamerica IDEX Mutual Funds
Annual Report 2004
12
TA IDEX Salomon All Cap
NOTES TO FINANCIAL STATEMENTS (continued)
At October 31, 2004
(all amounts in thousands)
NOTE 2.–(continued)
expenses of the Fund. The Fund is authorized under the 12b-1 plan to pay fees on each class up to the following limits:
| Class A | | | 0.35 | % | |
| Class B | | | 1.00 | % | |
| Class C | | | 1.00 | % | |
| Class C2 | | | 1.00 | % | |
| Class M | | | 0.90 | % | |
Class C2 and Class M merged into Class C on June 15, 2004 and September 24, 2004, respectively.
In the case the Fund or a class of shares of the Fund is closed to new investors or investments, the Fund is authorized to pay 12b-1 fees for past sales and distribution efforts and present and past investor services.
Underwriter commissions relate to front-end sales charges imposed for Class A and M shares and contingent deferred sales charges from Classes B, C, M and certain A share redemptions. For the year ended October 31, 2004, the underwriter commissions were as follows:
| Received by Underwriter | | $ | 1,431 | | |
| Retained by Underwriter | | | 48 | | |
| Contingent Deferred Sales Charge | | | 465 | | |
Administrative services: The Fund has entered into an agreement with ATFS for financial and legal fund administration services, which includes such items as compliance, expenses, financial statements and other reporting, distributions, tax returns, prospectus preparation, board of trustees meeting support and other legal matters. The Fund pays ATFS an annual fee of 0.015% of average net assets. The Legal fees on the Statement of Operations are for fees paid to external legal counsel.
The Fund paid ATFS $89 for the year ended October 31, 2004.
Transfer agent fees: The Fund pays ATIS an annual per-account charge of $20 (not in thousands) for each open account and $1.63 (not in thousands) for each closed account. There is no new account charge. The transfer agent fees on the Statement of Operations are made up of fees paid to ATIS and costs associated with shareholder statements. The Fund paid ATIS $865 for the year ended October 31, 2004.
Deferred compensation plan: Each eligible Fund Trustee may elect participation in the Deferred Compensation Plan ("the Plan"). Under the Plan, such Trustees may defer payment of a percentage of their total fees earned as a Fund Trustee. These deferred amounts may be invested in any Transamerica IDEX Mutual Fund. At October 31, 2004, the value of invested plan amounts was $17. Invested plan amounts and the total liability for deferred compensation to the Trustees under the Plan at October 31, 2004, are included in the accompanying Statement of Assets and Liabilities.
NOTE 3. INVESTMENT TRANSACTIONS
The cost of securities purchased and proceeds from securities sold (excluding short-term securities) for the year ended October 31, 2004, were as follows:
| Purchases of securities: | | | |
| Long-Term excluding U.S. Government | | $ | 329,801 | | |
| U.S. Government | | | – | | |
| Proceeds from maturities and sales of securities: | | | |
| Long-Term excluding U.S. Government | | | 145,815 | | |
| U.S. Government | | | – | | |
NOTE 4. FEDERAL INCOME TAX MATTERS
The Fund has not made any provision for federal income or excise taxes due to its policy to distribute all of its taxable income and capital gains to its shareholders and otherwise qualify as a regulated investment company under the Internal Revenue Code. Income and capital gain distributions are determined in accordance with income tax regulations, which may differ from GAAP. These differences are primarily due to differing treatment for items including, but not limited to, wash sales, net operating losses and capital loss carryforwards.
Reclassifications between Accumulated net investment income (loss), Accumulated net realized capital gains (loss) and Shares of beneficial interest are made to reflect income and gains available for distribution under federal tax regulations. Results of operations and net assets are not effected by these reclassifications. These reclassifications are as follows:
Shares of beneficial interest, unlimited
shares authorized | | $ | (2,598 | ) | |
| Accumulated net investment income (loss) | | | 2,597 | | |
Accumulated net realized gain (loss) from investment
securities | | | 1 | | |
The capital loss carryforwards are available to offset future realized capital gains through the periods listed:
Capital Loss
Carryforward | | Available through | |
| $ | 35,550 | | | October 31, 2010 | |
| | 14,057 | | | October 31, 2011 | |
The capital loss carryforward utilized during the year ending October 31, 2004 was $24,998.
The tax basis components of distributable earnings as of October 31, 2004, are as follows:
| Undistributed Ordinary Income | | $ | – | | |
| Undistributed Long-term Capital Gains | | $ | – | | |
| Capital Loss Carryforward | | $ | (49,607 | ) | |
| Net Unrealized Appreciation (Depreciation) | | $ | 42,668 | * | |
* Amount includes unrealized appreciation (depreciation) from deferred compensation.
Transamerica IDEX Mutual Funds
Annual Report 2004
13
TA IDEX Salomon All Cap
NOTES TO FINANCIAL STATEMENTS (continued)
At October 31, 2004
(all amounts in thousands)
NOTE 4.–(continued)
The aggregate cost of investments and composition of unrealized appreciation (depreciation) for federal income tax purposes as of October 31, 2004, are as follows:
| Federal Tax Cost Basis | | $ | 631,330 | | |
| Unrealized Appreciation | | $ | 67,977 | | |
| Unrealized (Depreciation) | | | (25,306 | ) | |
| Net Unrealized Appreciation (Depreciation) | | $ | 42,671 | | |
NOTE 5. OTHER MATTERS
Transamerica IDEX Mutual Funds ("TA IDEX"), and certain of its affiliated entities, have received requests for information from the Staff of the Securities and Exchange Commission in connection with market timing and late trading within the funds. TA IDEX and the affiliated entities have voluntarily cooperated in the investigation and have been providing the information as requested.
Transamerica IDEX Mutual Funds
Annual Report 2004
14
Report of Independent Registered Certified Public Accounting Firm
To the Board of Trustees and Shareholders of
TA IDEX Salomon All Cap
In our opinion, the accompanying statement of assets and liabilities, including the schedule of investments, and the related statements of operations and of changes in net assets and the financial highlights present fairly, in all material respects, the financial position of TA IDEX Salomon All Cap (the "Fund") (one of the portfolios constituting the Transamerica IDEX Mutual Funds) at October 31, 2004, the results of its operations for the year then ended, the changes in its net assets for each of the two years in the period then ended and the financial highlights for each of the periods indicated, in conformity with accounting principles generally accepted in the United States of America. These financial statements and financial highlights (hereafter referred to as "financial statements") are the responsibility of the Fund's management; our responsibility is to express an opinion on these fin ancial statements based on our audits. We conducted our audits of these financial statements in accordance with the standards of the Public Company Accounting Oversight Board (United States). Those standards require that we plan and perform the audit to obtain reasonable assurance about whether the financial statements are free of material misstatement. An audit includes examining, on a test basis, evidence supporting the amounts and disclosures in the financial statements, assessing the accounting principles used and significant estimates made by management, and evaluating the overall financial statement presentation. We believe that our audits, which included confirmation of securities at October 31, 2004 by correspondence with the custodian and brokers, provide a reasonable basis for our opinion.

PricewaterhouseCoopers LLP
Tampa, Florida
December 28, 2004
Transamerica IDEX Mutual Funds
Annual Report 2004
15
TA IDEX Salomon All Cap
SUPPLEMENTAL INFORMATION
RESULTS OF SHAREHOLDER PROXY (unaudited)
At a special meeting of Class M shareholders of each series of Transamerica IDEX (except TA IDEX Federated Tax Exempt and TA IDEX Protected Principal Stock held on September 2, 2004, the results of the Proposal were as follows:
Proposal 1: Approval of a conversion of Class M shares into Class C shares of the Funds, which will result in bearing the distribution and service fees payable under the 12b-1 Plan of Distribution for the Class C shares of the Funds.
| For | | Against | | Abstentions/Broker Non-Votes | |
| | 80.49 | % | | | 6.96 | % | | | 12.55 | % | |
Transamerica IDEX Mutual Funds
Annual Report 2004
16
TA IDEX Salomon Investors Value
MARKET ENVIRONMENT
The U.S. equity market, despite its positive breadth, experienced poor market volume and low volatility during the twelve months ended October 31, 2004. Less dynamic, "old economy" industries led the market while higher beta stocks lagged. The top-performing sector of the Standard and Poor's 500 Composite Stock Index ("S&P 500 Index") was energy, contributing 41.3% and accounting for 24% of the S&P 500 Index's return. Within the energy sector, the integrated oil stocks were the main drivers of positive performance since the group is most leveraged to commodity price increases. Other leading sectors included industrials, financials and consumer discretionary. All sectors had positive returns during the period with the exception of technology, which was slightly negative.
PERFORMANCE
For the year ended October 31, 2004, TA IDEX Salomon Investors Value, Class A returned 9.52% By comparison its benchmark, the S&P 500, returned 9.41%
STRATEGY REVIEW
The portfolio outperformed its benchmark, the S&P 500 Index, but underperformed relative to the S&P Barra Value Index ("Barra Value"), which returned 14.46%, during the period. The underperformance was attributable to both security selection and sector allocation. Security selection was strongest in the financials and telecommunication sectors and weakest in the technology and consumer staples sectors. Top contributors during the period included AT&T Wireless Services, Inc. ("AT&T Wireless"), ChevronTexaco Corporation ("ChevronTexaco"), BP PLC, Total SA and Transocean Inc ("Transocean"). We took advantage of the strength in ChevronTexaco's share price by reducing the portfolio's position. In addition, during the period, we sold all of the shares in both AT&T Wireless and Transocea n that the portfolio owned.
Stocks that detracted from performance came from a number of different sectors and included Nortel Networks Corporation, Merck & Co. Inc. ("Merck"), Hewlett-Packard Company, The Kroger Co. and Safeway Inc. Merck fell sharply at the end of September when the company announced that it would pull the arthritis drug Vioxx off the market due to a study that showed an increased relative risk for cardiovascular events after eighteen months of use. We were disappointed with the company's announcement and continue to watch the situation closely. We continue to hold all of these stocks in the portfolio.
We remain overweight in the technology, healthcare and consumer staples sectors and substantially underweight in the financials sector versus the Barra Value. We have slightly reduced our technology weighting in the portfolio and increased our financials and energy weightings during the period.
Effective August 19, 2004, Robert Feitler and Mark J. McAllister, CFA, serve as co-managers and are responsible for the day-to-day management of TA IDEX Salomon Investors Value.
Robert Feitler
Mark J. McAllister, CFA
Co-Fund Managers
Salomon Brothers Asset Management Inc
Transamerica IDEX Mutual Funds
Annual Report 2004
1
TA IDEX Salomon Investors Value
Comparison of change in value of $10,000 investment in Class A shares and its comparative index.
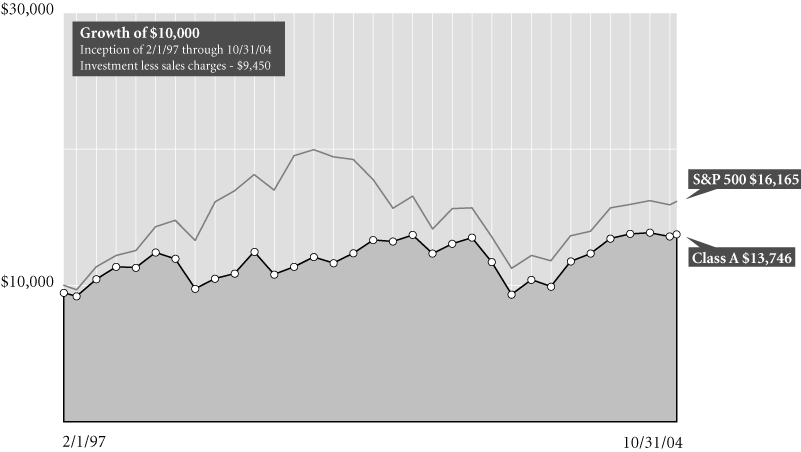
Average Annual Total Return for Periods Ended 10/31/04
| | | 1 year | | 5 years | | From
Inception | | Inception
Date | |
| Class A (NAV) | | | 9.52 | % | | | 4.60 | % | | | 4.96 | % | | 2/1/97 | |
| Class A (POP) | | | 3.50 | % | | | 3.42 | % | | | 4.20 | % | | 2/1/97 | |
| S&P 5001 | | | 9.41 | % | | | (2.21 | )% | | | 6.40 | % | | 2/1/97 | |
| Class B (NAV) | | | 8.82 | % | | | 3.95 | % | | | 4.31 | % | | 2/1/97 | |
| Class B (POP) | | | 3.82 | % | | | 3.78 | % | | | 4.31 | % | | 2/1/97 | |
| Class C (NAV) | | | 8.62 | % | | | – | | | | 16.20 | % | | 11/11/02 | |
| Class C (POP) | | | 7.62 | % | | | – | | | | 16.20 | % | | 11/11/02 | |
NOTES
1 The Standard & Poor's 500 Composite Stock (S&P 500) Index is an unmanaged index used as a general measure of market performance. Calculations assume dividends and capital gains are reinvested and do not include any managerial expenses. From inception calculation is based on life of Class A shares. Source: Standard & Poor's Micropal®© Micropal, Inc. 2004 – 1-800-596-5323 – http://www.micropal.com.
The performance data presented represents past performance, future results may vary. Performance data does not reflect the deduction of taxes that would be paid on fund distributions or the redemption of fund shares. Investment return and principal value will fluctuate so that an investor's shares, when redeemed, may be worth more or less than their original cost. Current performance may be lower or higher than performance quoted.
Public Offering Price (POP) returns include the reinvestment of dividends and capital gains and reflect the maximum sales charge of 5.5% for A shares or the maximum applicable contingent deferred sales charge (5% in the 1st year, decreasing to 0% after 6 years) for Class B shares and 1% (during the first 12 months) for Class C shares. Shares purchased prior to March 1, 2004 are subject to a maximum applicable contingent deferred sales charge (5% in the 1st year, decreasing to 0% after 7 years) for Class B shares and (2% in the 1st year, decreasing to 0% after 2 years) for Class C shares. Net Asset Va lue (NAV) returns include the reinvestment of dividends and capital gains but do not reflect any sales charges.
This material must be preceded or accompanied by a current prospectus, which includes specific contents regarding the investment objectives and policies of this fund.
Transamerica IDEX Mutual Funds
Annual Report 2004
2
TA IDEX Salomon Investors Value
UNDERSTANDING YOUR FUND'S EXPENSES (unaudited)
SHAREHOLDER EXPENSES
The following Example is intended to help you understand your ongoing costs (in dollars and cents) of investing in a Fund and to compare these costs with the ongoing costs of investing in other funds.
The Example is based on an investment of $1,000 invested at the beginning of the period and held for the entire period from May 1, 2004 to October 31, 2004.
ACTUAL EXPENSES
The first line in the table below provides information about actual account values and actual expenses. You may use the information in this line, together with the amount you invested, to estimate the expenses that you paid over the period. Simply divide your account value by $1,000 (for example, an $8,600 account value divided by $1,000 = 8.6), then multiply the result by the number in the first line of your Fund under the heading entitled "Expenses Paid During Period" to estimate the expenses you paid on your account during this period.
HYPOTHETICAL EXAMPLE FOR COMPARISON PURPOSES
The second line in the table below provides information about hypothetical account values and hypothetical expenses based on each Fund's actual expense ratio and an assumed rate of return of 5% per year before expenses, which is not the Fund's actual return. The hypothetical account values and expenses may not be used to estimate the actual ending account balance or expenses you paid for the period. You may use this information to compare the ongoing costs of investing in your Fund and other funds. To do so, compare this 5% hypothetical example with the 5% hypothetical examples that appear in the shareholder reports of the other funds.
Please note that the expenses shown in the table are meant to highlight your ongoing costs only and do not reflect any transactional costs, such as sales charges, redemption fees, brokerage commissions paid on purchases and sales of fund shares. Therefore, the second line under each Fund in the table is useful in comparing ongoing costs only, and will not help you determine the relative total costs of owning different funds. In addition, note that the expenses shown in the table are meant to highlight your ongoing costs and do not reflect any transaction costs.
| | | Beginning
Account
Value | | Ending
Account
Value | | Annualized
Expense
Ratio | | Expenses Paid
During Period(a) | |
| Class A | |
| Actual | | $ | 1,000.00 | | | $ | 1,025.00 | | | | 1.24 | % | | $ | 6.31 | | |
| Hypothetical (b) | | | 1,000.00 | | | | 1,018.90 | | | | 1.24 | | | | 6.29 | | |
| Class B | |
| Actual | | | 1,000.00 | | | | 1,022.00 | | | | 1.82 | | | | 9.25 | | |
| Hypothetical (b) | | | 1,000.00 | | | | 1,015.99 | | | | 1.82 | | | | 9.22 | | |
| Class C | |
| Actual | | | 1,000.00 | | | | 1,020.20 | | | | 2.29 | | | | 11.63 | | |
| Hypothetical (b) | | | 1,000.00 | | | | 1,013.62 | | | | 2.29 | | | | 11.59 | | |
(a) Expenses are calculated using each Fund's annualized expense ratio (as disclosed in the table), multiplied by the average account value for the period, multiplied by number of days in the period (184 days), and divided by the number of days in the year (366 days).
(b) 5% return per year before expenses.
GRAPHIC PRESENTATION OF SCHEDULE OF INVESTMENTS
By Sector
At October 31, 2004

This chart shows the percentage breakdown by sector of the Fund's total investment securities.
Transamerica IDEX Mutual Funds
Annual Report 2004
3
TA IDEX Salomon Investors Value
SCHEDULE OF INVESTMENTS
At October 31, 2004
(all amounts except share amounts in thousands)
| | | Shares | | Value | |
| PREFERRED STOCKS (1.5%) | | | |
| Motion Pictures (1.5%) | | | |
| News Corp, Ltd., Sponsored ADR (a) | | | 202,900 | | | $ | 6,379 | | |
| Total Preferred Stocks (cost: $5,392) | | | | | | | 6,379 | | |
| COMMON STOCKS (96.7%) | | | |
| Aerospace (4.2%) | | | |
| Boeing Co. (The) | | | 131,800 | | | | 6,577 | | |
| Lockheed Martin Corp. | | | 117,500 | | | | 6,473 | | |
| United Technologies Corp. | | | 54,700 | | | | 5,077 | | |
| Automotive (1.6%) | | | |
| Honeywell International, Inc. | | | 199,700 | | | | 6,726 | | |
| Chemicals & Allied Products (0.8%) | | | |
| Dow Chemical Co. (The) | | | 78,100 | | | | 3,510 | | |
| Commercial Banks (10.6%) | | | |
| Bank of America Corp. | | | 308,200 | | | | 13,804 | | |
| Bank of New York Co. (The), Inc. (a) | | | 141,300 | | | | 4,587 | | |
| JPMorgan Chase & Co. | | | 138,500 | | | | 5,346 | | |
| MBNA Corp. | | | 202,600 | | | | 5,193 | | |
| US Bancorp | | | 193,500 | | | | 5,536 | | |
| Wachovia Corp. | | | 122,300 | | | | 6,018 | | |
| Wells Fargo & Co. | | | 90,000 | | | | 5,375 | | |
| Communication (4.3%) | | | |
| Comcast Corp.–Class A (b) | | | 103,700 | | | | 3,059 | | |
| Comcast Corp.–Special Class A (b) | | | 112,700 | | | | 3,273 | | |
| Liberty Media Corp.–Class A | | | 551,200 | | | | 4,917 | | |
Liberty Media International,
Inc.–Class A (a)(b) | | | 27,560 | | | | 994 | | |
| Viacom, Inc.–Class B | | | 173,000 | | | | 6,313 | | |
| Communications Equipment (4.3%) | | | |
| Comverse Technology, Inc. (b) | | | 151,500 | | | | 3,127 | | |
| Nokia OYJ, Sponsored ADR | | | 567,100 | | | | 8,745 | | |
| Nortel Networks Corp. (a)(b) | | | 1,971,600 | | | | 6,684 | | |
| Computer & Data Processing Services (2.0%) | | | |
| Microsoft Corp. (a) | | | 306,400 | | | | 8,576 | | |
| Computer & Office Equipment (3.0%) | | | |
| Hewlett-Packard Co. | | | 222,600 | | | | 4,154 | | |
| International Business Machines Corp. | | | 50,400 | | | | 4,523 | | |
| Lexmark International, Inc. (b) | | | 52,700 | | | | 4,380 | | |
| Electric Services (0.6%) | | | |
| FirstEnergy Corp. | | | 67,300 | | | | 2,781 | | |
| Electric, Gas & Sanitary Services (2.9%) | | | |
| Ameren Corp. (a) | | | 68,800 | | | | 3,302 | | |
| NiSource, Inc. | | | 250,900 | | | | 5,382 | | |
| PG&E Corp. (a)(b) | | | 121,500 | | | | 3,893 | | |
| | | Shares | | Value | |
| Electronic Components & Accessories (1.3%) | | | |
| Celestica, Inc. (b) | | | 176,600 | | | $ | 2,557 | | |
| Solectron Corp. (b) | | | 622,600 | | | | 3,250 | | |
| Environmental Services (0.8%) | | | |
| Waste Management, Inc. | | | 122,600 | | | | 3,492 | | |
| Food & Kindred Products (2.4%) | | | |
| Altria Group, Inc. | | | 213,900 | | | | 10,366 | | |
| Food Stores (2.7%) | | | |
| Kroger Co. (b) | | | 475,100 | | | | 7,179 | | |
| Safeway, Inc. (a)(b) | | | 254,200 | | | | 4,637 | | |
| Gas Production & Distribution (1.1%) | | | |
| El Paso Corp. (a) | | | 533,400 | | | | 4,769 | | |
| Health Services (0.7%) | | | |
| HCA, Inc. | | | 81,800 | | | | 3,004 | | |
| Holding & Other Investment Offices (2.3%) | | | |
| Equity Office Properties Trust | | | 180,200 | | | | 5,067 | | |
| Equity Residential | | | 150,000 | | | | 5,002 | | |
| Instruments & Related Products (0.3%) | | | |
| Raytheon Co. | | | 33,800 | | | | 1,233 | | |
| Insurance (3.8%) | | | |
| American International Group, Inc. | | | 146,000 | | | | 8,864 | | |
| Loews Corp. | | | 73,900 | | | | 4,427 | | |
| St. Paul Travelers Cos. (The), Inc. | | | 90,200 | | | | 3,063 | | |
| Manufacturing Industries (1.1%) | | | |
| Mattel, Inc. (a) | | | 281,200 | | | | 4,924 | | |
| Motion Pictures (1.3%) | | | |
| Time Warner, Inc. (b) | | | 337,600 | | | | 5,618 | | |
| Oil & Gas Extraction (6.1%) | | | |
| ENSCO International, Inc. | | | 191,100 | | | | 5,838 | | |
| EOG Resources, Inc. | | | 32,600 | | | | 2,170 | | |
| GlobalSantaFe Corp. | | | 110,600 | | | | 3,263 | | |
| Nabors Industries, Ltd. (b) | | | 68,000 | | | | 3,340 | | |
| Noble Corp. (b) | | | 47,700 | | | | 2,179 | | |
| Total SA, Sponsored ADR | | | 91,400 | | | | 9,531 | | |
| Paper & Allied Products (3.5%) | | | |
| Avery Dennison Corp. | | | 72,600 | | | | 4,417 | | |
| International Paper Co. | | | 138,300 | | | | 5,326 | | |
| Kimberly-Clark Corp. | | | 92,300 | | | | 5,508 | | |
| Personal Credit Institutions (1.6%) | | | |
| Capital One Financial Corp. | | | 92,300 | | | | 6,808 | | |
| Petroleum Refining (5.8%) | | | |
| BP PLC, Sponsored ADR | | | 143,800 | | | | 8,376 | | |
| ChevronTexaco Corp. | | | 78,100 | | | | 4,144 | | |
The notes to the financial statements are an integral part of this report.
Transamerica IDEX Mutual Funds
Annual Report 2004
4
TA IDEX Salomon Investors Value
SCHEDULE OF INVESTMENTS (continued)
At October 31, 2004
(all amounts except share amounts in thousands)
| | | Shares | | Value | |
| Petroleum Refining (continued) | | | |
| Marathon Oil Corp. | | | 104,800 | | | $ | 3,994 | | |
| Royal Dutch Petroleum Co., NY Shares (a) | | | 155,900 | | | | 8,456 | | |
| Pharmaceuticals (8.2%) | | | |
| GlaxoSmithKline PLC, ADR | | | 131,400 | | | | 5,571 | | |
| Johnson & Johnson | | | 96,100 | | | | 5,610 | | |
| Merck & Co., Inc. | | | 61,300 | | | | 1,919 | | |
| Pfizer, Inc. | | | 373,100 | | | | 10,801 | | |
| Schering-Plough Corp. | | | 249,400 | | | | 4,517 | | |
| Wyeth | | | 171,200 | | | | 6,788 | | |
| Primary Metal Industries (1.0%) | | | |
| Alcoa, Inc. | | | 127,800 | | | | 4,153 | | |
| Restaurants (1.5%) | | | |
| McDonald's Corp. | | | 221,800 | | | | 6,465 | | |
| Rubber & Misc. Plastic Products (0.9%) | | | |
| Newell Rubbermaid, Inc. | | | 186,600 | | | | 4,023 | | |
| Savings Institutions (0.9%) | | | |
| Washington Mutual, Inc. | | | 96,500 | | | | 3,735 | | |
| Security & Commodity Brokers (5.9%) | | | |
| American Express Co. | | | 107,500 | | | | 5,705 | | |
| Goldman Sachs Group, Inc. | | | 50,400 | | | | 4,958 | | |
| Merrill Lynch & Co., Inc. | | | 139,300 | | | | 7,514 | | |
| Morgan Stanley | | | 85,900 | | | | 4,389 | | |
| Waddell & Reed Financial, Inc.–Class A | | | 128,900 | | | | 2,708 | | |
| Telecommunications (6.0%) | | | |
| AT&T Corp. (a) | | | 195,000 | | | | 3,336 | | |
| MCI, Inc. (a) | | | 261,100 | | | | 4,504 | | |
| Nextel Communications, Inc.–Class A (b) | | | 175,500 | | | | 4,649 | | |
| SBC Communications, Inc. | | | 254,900 | | | | 6,439 | | |
| Verizon Communications, Inc. | | | 173,700 | | | | 6,792 | | |
| U.S. Government Agencies (1.4%) | | | |
| Freddie Mac | | | 89,800 | | | | 5,981 | | |
| Variety Stores (1.8%) | | | |
| Target Corp. (a) | | | 70,900 | | | | 3,546 | | |
| Wal-Mart Stores, Inc. | | | 81,700 | | | | 4,405 | | |
| Total Common Stocks (cost: $392,002) | | | | | | | 417,635 | | |
| | | Principal | | Value | |
| SECURITY LENDING COLLATERAL (7.7%) | | | |
| Debt (7.2%) | | | |
| Bank Notes (1.4%) | | | |
Bank of America
1.77%, due 12/03/2004 | | $ | 1,623 | | | $ | 1,623 | | |
| 1.88%, due 12/23/2004 | | | 541 | | | | 541 | | |
| 1.77%, due 01/18/2005 | | | 1,082 | | | | 1,082 | | |
| | | Principal | | Value | |
| Bank Notes (continued) | | | |
Canadian Imperial Bank of Commerce
1.86%, due 11/04/2004 | | $ | 2,435 | | | $ | 2,435 | | |
Credit Suisse First Boston Corp.
1.83%, due 09/09/2005 | | | 270 | | | | 270 | | |
| Commercial Paper (0.8%) | | | |
Clipper Receivables Corp.
1.79%, due 11/12/2004 | | | 806 | | | | 806 | | |
Delaware Funding Corp. 144A
1.85%, due 11/19/2004 | | | 271 | | | | 271 | | |
Falcon Asset Securitization Corp. 144A
1.78%, due 11/04/2004 | | | 807 | | | | 807 | | |
| 1.75%, due 11/10/2004 | | | 1,082 | | | | 1,082 | | |
Galaxy Funding 144A
1.88%, due 11/22/2004 | | | 271 | | | | 271 | | |
| Euro Dollar Terms (3.3%) | | | |
Bank of Montreal
1.88%, due 11/24/2004 | | | 2,563 | | | | 2,563 | | |
BNP Paribas
1.77%, due 11/10/2004 | | | 1,353 | | | | 1,353 | | |
| 1.80%, due 11/23/2004 | | | 1,082 | | | | 1,082 | | |
| 1.98%, due 12/27/2004 | | | 1,082 | | | | 1,082 | | |
Calyon
1.70%, due 11/24/2004 | | | 143 | | | | 143 | | |
Citigroup
2.06%, due 01/25/2005 | | | 2,706 | | | | 2,706 | | |
Den Danske Bank
1.82%, due 11/19/2004 | | | 1,353 | | | | 1,353 | | |
Dexia Group
2.04%, due 01/21/2005 | | | 628 | | | | 628 | | |
HBOS Halifax Bank of Scotland
2.03%, due 01/21/2005 | | | 541 | | | | 541 | | |
Royal Bank of Scotland
2.01%, due 01/20/2005 | | | 1,082 | | | | 1,082 | | |
Toronto Dominion Bank
1.70%, due 11/08/2004 | | | 541 | | | | 541 | | |
Wells Fargo
1.87%, due 11/22/2004 | | | 1,353 | | | | 1,353 | | |
| Promissory Notes (0.7%) | | | |
Goldman Sachs Group Inc.
1.90%, due 12/29/2004 | | | 1,136 | | | | 1,136 | | |
| 1.88%, due 01/27/2005 | | | 1,894 | | | | 1,894 | | |
| Repurchase Agreements (1.0%) | | | |
Merrill Lynch & Co., Inc. (c)
1.92% Repurchase Agreement dated
10/29/2004 to be repurchased at $4,330
on 11/1/2004 | | | 4,329 | | | | 4,329 | | |
The notes to the financial statements are an integral part of this report.
Transamerica IDEX Mutual Funds
Annual Report 2004
5
TA IDEX Salomon Investors Value
SCHEDULE OF INVESTMENTS (continued)
At October 31, 2004
(all amounts except share amounts in thousands)
| Investment Companies (0.5%) | |
| Money Market Funds (0.5%) | |
Merrill Lynch Premier Institutional Fund
1-day yield of 1.71% | | | 1,331,002 | | | $ | 1,331 | | |
Merrimac Cash Fund, Premium Class
1-day yield of 1.46% | | | 974,014 | | | | 974 | | |
| Total Security Lending Collateral (cost: $33,279) | | | | | 33,279 | | |
| Total Investment Securities (cost: $430,673) | | | | $ | 457,293 | | |
| SUMMARY: | | | |
| Investments, at value | | | 105.9 | % | | $ | 457,293 | | |
| Liabilities in excess of other assets | | | (5.9 | )% | | | (25,394 | ) | |
| Net assets | | | 100.0 | % | | $ | 431,899 | | |
NOTES TO SCHEDULE OF INVESTMENTS:
(a) At October 31, 2004, all or a portion of this security is on loan (see Note 1). The value at October 31, 2004, of all securities on loan is $31,361.
(b) No dividends were paid during the preceding twelve months.
(c) Cash collateral for the Repurchase Agreements, valued at $4,430, that serve as collateral for securities lending are invested in corporate bonds with interest rates and maturity dates ranging from 0.00%–9.75% and 05/15/2005–9/15/2033, respectively.
DEFINITIONS:
144A 144A securities are registered pursuant to rule 144A of the Securities Act of 1933. These securities are deemed to be liquid for purposes of compliance limitations on holdings of illiquid securities and may be resold as transactions exempt from registration normally to qualified institutional buyers. At October 31, 2004, these securities aggregated 2,431 or 0.6% of the net assets of the Fund.
ADR American Depositary Receipt
The notes to the financial statements are an integral part of this report.
Transamerica IDEX Mutual Funds
Annual Report 2004
6
TA IDEX Salomon Investors Value
STATEMENT OF ASSETS AND LIABILITIES
At October 31, 2004
(all amounts except per share amounts in thousands)
| Assets: | | | |
Investment securities, at value (cost: $430,673)
(including securities loaned of $31,361) | | $ | 457,293 | | |
| Cash | | | 8,493 | | |
| Receivables: | |
| Investment securities sold | | | 1,853 | | |
| Shares of beneficial interest sold | | | 18 | | |
| Interest | | | 16 | | |
| Dividends | | | 487 | | |
| Dividend reclaims receivable | | | 4 | | |
| Other | | | 8 | | |
| | | | 468,172 | | |
| Liabilities: | | | |
| Investment securities purchased | | | 2,359 | | |
| Accounts payable and accrued liabilities: | |
| Shares of beneficial interest redeemed | | | 95 | | |
| Management and advisory fees | | | 290 | | |
| Distribution fees | | | 141 | | |
| Transfer agent fees | | | 25 | | |
| Payable for collateral for securities on loan | | | 33,279 | | |
| Other | | | 84 | | |
| | | | 36,273 | | |
| Net Assets | | $ | 431,899 | | |
| Net Assets Consist of: | | | |
Shares of beneficial interest, unlimited shares
authorized, no par value | | $ | 398,592 | | |
| Undistributed net investment income (loss) | | | 721 | | |
Undistributed net realized gain (loss) from investment
securities | | | 5,966 | | |
Net unrealized appreciation (depreciation) on
investment securities | | | 26,620 | | |
| Net Assets | | $ | 431,899 | | |
| Net Assets by Class: | | | |
| Class A | | $ | 405,455 | | |
| Class B | | | 20,463 | | |
| Class C | | | 5,981 | | |
| Shares Outstanding: | | | |
| Class A | | | 30,484 | | |
| Class B | | | 1,618 | | |
| Class C | | | 474 | | |
| Net Asset Value Per Share: | | | |
| Class A | | $ | 13.30 | | |
| Class B | | | 12.65 | | |
| Class C | | | 12.62 | | |
| Maximum Offering Price Per Share (a): | | | |
| Class A | | $ | 14.07 | | |
(a) Includes the maximum selling commission (represented as a percentage of offering price) which is reduced on certain levels of sales as set forth in the Prospectus. Net asset value per share for Classes B and C shares represents offering price. The redemption price for Classes B and C shares equals net asset value less any applicable contingent deferred sales charge.
STATEMENT OF OPERATIONS
For the year ended October 31, 2004
(all amounts in thousands)
| Investment Income: | | | |
| Interest | | $ | 64 | | |
| Dividends | | | 7,621 | | |
| Income from loaned securities–net | | | 27 | | |
| Less withholding taxes on foreign dividends | | | (129 | ) | |
| | | | 7,583 | | |
| Expenses: | | | |
| Management and advisory fees | | | 3,081 | | |
| Transfer agent fees: | |
| Class A | | | 128 | | |
| Class B | | | 4 | | |
| Class C | | | – | | |
| Class C2 | | | 1 | | |
| Class M | | | 1 | | |
| Printing and shareholder reports | | | 14 | | |
| Custody fees | | | 47 | | |
| Administration fees | | | 57 | | |
| Legal fees | | | 12 | | |
| Audit and accounting fees | | | 13 | | |
| Trustees fees | | | 21 | | |
| Registration fees: | |
| Class A | | | 61 | | |
| Class B | | | – | | |
| Class C | | | 12 | | |
| Class C2 | | | – | | |
| Class M | | | 2 | | |
| Other | | | 15 | | |
| Distribution and service fees: | |
| Class A | | | 1,252 | | |
| Class B | | | 212 | | |
| Class C | | | 24 | | |
| Class C2 | | | 18 | | |
| Class M | | | 16 | | |
| Total expenses | | | 4,991 | | |
Less:
Reimbursement of class expenses: | |
| Class C | | | (3 | ) | |
| Net expenses | | | 4,988 | | |
| Net Investment Income (Loss) | | | 2,595 | | |
| Net Realized and Unrealized Gain (Loss) | | | |
| Realized gain (loss) from investment securities | | | 17,527 | | |
Increase (decrease) in unrealized appreciation
(depreciation) on investment securities | | | 5,314 | | |
| Net Gain (Loss) on Investments | | | 22,841 | | |
Net Increase (Decrease) in Net Assets Resulting
from Operations | | $ | 25,436 | | |
The notes to the financial statements are an integral part of this report.
Transamerica IDEX Mutual Funds
Annual Report 2004
7
TA IDEX Salomon Investors Value
STATEMENTS OF CHANGES IN NET ASSETS
For the years ended
(all amounts in thousands)
| | | October 31,
2004 | | October 31,
2003 | |
| Increase (Decrease) in Net Assets From: | | | |
| Operations: | | | |
| Net investment income (loss) | | $ | 2,595 | | | $ | 794 | | �� |
Net realized gain (loss) from
investment securities | | | 17,527 | | | | (1,894 | ) | |
Net unrealized appreciation
(depreciation) on investment
securities | | | 5,314 | | | | 33,192 | | |
| | | | 25,436 | | | | 32,092 | | |
| Distributions to Shareholders: | | | |
| From net investment income: | |
| Class A | | | (2,368 | ) | | | (100 | ) | |
| Class B | | | (158 | ) | | | (30 | ) | |
| Class C | | | (10 | ) | | | – | | |
| Class C2 | | | (21 | ) | | | (4 | ) | |
| Class M | | | (17 | ) | | | (4 | ) | |
| | | | (2,574 | ) | | | (138 | ) | |
| From net realized gains: | |
| Class A | | | (8,881 | ) | | | (420 | ) | |
| Class B | | | (495 | ) | | | (127 | ) | |
| Class C | | | (37 | ) | | | – | | |
| Class C2 | | | (61 | ) | | | (17 | ) | |
| Class M | | | (50 | ) | | | (16 | ) | |
| | | | (9,524 | ) | | | (580 | ) | |
| Capital Share Transactions: | | | |
| Proceeds from shares sold: | |
| Class A | | | 154,680 | | | | 165,506 | | |
| Class B | | | 3,454 | | | | 4,507 | | |
| Class C | | | 1,228 | | | | 733 | | |
| Class C2 | | | 287 | | | | 779 | | |
| Class M | | | 254 | | | | 218 | | |
| | | | 159,903 | | | | 171,743 | | |
Dividends and distributions
reinvested: | |
| Class A | | | 11,237 | | | | 517 | | |
| Class B | | | 624 | | | | 148 | | |
| Class C | | | 43 | | | | – | | |
| Class C2 | | | 73 | | | | 20 | | |
| Class M | | | 65 | | | | 19 | | |
| | | | 12,042 | | | | 704 | | |
| Cost of shares redeemed: | |
| Class A | | | (6,237 | ) | | | (6,083 | ) | |
| Class B | | | (4,752 | ) | | | (5,016 | ) | |
| Class C | | | (814 | ) | | | (8 | ) | |
| Class C2 | | | (584 | ) | | | (852 | ) | |
| Class M | | | (626 | ) | | | (752 | ) | |
| | | | (13,013 | ) | | | (12,711 | ) | |
| Class level exchanges: | |
| Class C | | | 4,670 | | | | – | | |
| Class C2 | | | (2,688 | ) | | | – | | |
| Class M | | | (1,982 | ) | | | – | | |
| | | | – | | | | – | | |
| | | October 31,
2004 | | October 31,
2003 | |
| Automatic conversions: | |
| Class A | | | 48 | | | | – | | |
| Class B | | | (48 | ) | | | – | | |
| | | | – | | | | – | | |
| | | | 158,932 | | | | 159,736 | | |
| Net increase (decrease) in net assets | | | 172,270 | | | | 191,110 | | |
| Net Assets: | |
| Beginning of year | | | 259,629 | | | | 68,519 | | |
| End of year | | $ | 431,899 | | | $ | 259,629 | | |
Undistributed Net Investment Income
(Loss) | | $ | 721 | | | $ | 711 | | |
| Share Activity: | |
| Shares issued: | |
| Class A | | | 11,405 | | | | 14,587 | | |
| Class B | | | 270 | | | | 422 | | |
| Class C | | | 97 | | | | 67 | | |
| Class C2 | | | 22 | | | | 75 | | |
| Class M | | | 19 | | | | 20 | | |
| | | | 11,813 | | | | 15,171 | | |
Shares issued–reinvested from
distributions: | |
| Class A | | | 858 | | | | 50 | | |
| Class B | | | 50 | | | | 15 | | |
| Class C | | | 3 | | | | – | | |
| Class C2 | | | 6 | | | | 2 | | |
| Class M | | | 5 | | | | 2 | | |
| | | | 922 | | | | 69 | | |
| Shares redeemed: | |
| Class A | | | (467 | ) | | | (550 | ) | |
| Class B | | | (375 | ) | | | (485 | ) | |
| Class C | | | (65 | ) | | | (1 | ) | |
| Class C2 | | | (45 | ) | | | (78 | ) | |
| Class M | | | (48 | ) | | | (72 | ) | |
| | | | (1,000 | ) | | | (1,186 | ) | |
| Class level exchanges: | |
| Class C | | | 373 | | | | – | | |
| Class C2 | | | (214 | ) | | | – | | |
| Class M | | | (157 | ) | | | – | | |
| | | | 2 | | | | – | | |
| Automatic conversions: | |
| Class A | | | 4 | | | | – | | |
| Class B | | | (4 | ) | | | – | | |
| | | | – | | | | – | | |
Net increase (decrease) in shares
outstanding: | |
| Class A | | | 11,799 | | | | 14,087 | | |
| Class B | | | (59 | ) | | | (48 | ) | |
| Class C | | | 408 | | | | 66 | | |
| Class C2 | | | (231 | ) | | | (1 | ) | |
| Class M | | | (181 | ) | | | (50 | ) | |
| | | | 11,736 | | | | 14,054 | | |
The notes to the financial statements are an integral part of this report.
Transamerica IDEX Mutual Funds
Annual Report 2004
8
TA IDEX Salomon Investors Value
FINANCIAL HIGHLIGHTS
| | | | | For a share of beneficial interest outstanding throughout each period | |
| | | | | Net Asset | | Investment Operations | | Distributions | | Net Asset | |
| | | For the
Period
Ended (d)(g) | | Value,
Beginning
of Period | | Net
Investment
Income (Loss) | | Net Realized
and Unrealized
Gain (Loss) | | Total
Operations | | From Net
Investment
Income | | From Net
Realized
Gains | | Total
Distributions | | Value,
End
of Period | |
| Class A | | 10/31/2004 | | $ | 12.51 | | | $ | 0.10 | | | $ | 1.09 | | | $ | 1.19 | | | $ | (0.10 | ) | | $ | (0.30 | ) | | $ | (0.40 | ) | | $ | 13.30 | | |
| | | 10/31/2003 | | | 10.21 | | | | 0.08 | | | | 2.31 | | | | 2.39 | | | | (0.02 | ) | | | (0.07 | ) | | | (0.09 | ) | | | 12.51 | | |
| | | 10/31/2002 | | | 12.55 | | | | 0.04 | | | | (2.10 | ) | | | (2.06 | ) | | | – | | | | (0.28 | ) | | | (0.28 | ) | | | 10.21 | | |
| | | 10/31/2001 | | | 12.91 | | | | 0.07 | | | | (0.42 | ) | | | (0.35 | ) | | | – | | | | (0.01 | ) | | | (0.01 | ) | | | 12.55 | | |
| | | 10/31/2000 | | | 11.28 | | | | 0.09 | | | | 1.54 | | | | 1.63 | | | | – | | | | – | | | | – | | | | 12.91 | | |
| Class B | | 10/31/2004 | | | 11.99 | | | | 0.01 | | | | 1.05 | | | | 1.06 | | | | (0.10 | ) | | | (0.30 | ) | | | (0.40 | ) | | | 12.65 | | |
| | | 10/31/2003 | | | 9.84 | | | | 0.01 | | | | 2.23 | | | | 2.24 | | | | (0.02 | ) | | | (0.07 | ) | | | (0.09 | ) | | | 11.99 | | |
| | | 10/31/2002 | | | 12.19 | | | | (0.01 | ) | | | (2.06 | ) | | | (2.07 | ) | | | – | | | | (0.28 | ) | | | (0.28 | ) | | | 9.84 | | |
| | | 10/31/2001 | | | 12.61 | | | | (0.02 | ) | | | (0.39 | ) | | | (0.41 | ) | | | – | | | | (0.01 | ) | | | (0.01 | ) | | | 12.19 | | |
| | | 10/31/2000 | | | 11.09 | | | | (0.02 | ) | | | 1.54 | | | | 1.52 | | | | – | | | | – | | | | – | | | | 12.61 | | |
| Class C | | 10/31/2004 | | | 11.99 | | | | (0.05 | ) | | | 1.08 | | | | 1.03 | | | | (0.10 | ) | | | (0.30 | ) | | | (0.40 | ) | | | 12.62 | | |
| | | 10/31/2003 | | | 9.77 | | | | 0.01 | | | | 2.30 | | | | 2.31 | | | | (0.02 | ) | | | (0.07 | ) | | | (0.09 | ) | | | 11.99 | | |
| | | | | | | Ratios/Supplemental Data | |
| | | For the | | | | Net Assets,
End of | | Ratio of Expenses
to Average | | Net Investment
Income (Loss) | | Portfolio | |
| | | Period | | Total | | Period | | Net Assets (a) | | to Average | | Turnover | |
| | | Ended (g) | | Return (c) | | (000's) | | Net (e) | | Total (f) | | Net Assets (a) | | Rate (b) | |
| Class A | | 10/31/2004 | | | 9.52 | % | | $ | 405,455 | | | | 1.25 | % | | | 1.25 | % | | | 0.72 | % | | | 33 | % | |
| | | 10/31/2003 | | | 23.57 | | | | 233,779 | | | | 1.42 | | | | 1.42 | | | | 0.71 | | | | 32 | | |
| | | 10/31/2002 | | | (16.90 | ) | | | 46,960 | | | | 1.55 | | | | 1.91 | | | | 0.56 | | | | 101 | | |
| | | 10/31/2001 | | | (2.68 | ) | | | 12,176 | | | | 1.55 | | | | 1.93 | | | | 0.48 | | | | 29 | | |
| | | 10/31/2000 | | | 14.38 | | | | 8,431 | | | | 1.55 | | | | 2.20 | | | | 0.40 | | | | 50 | | |
| Class B | | 10/31/2004 | | | 8.82 | | | | 20,463 | | | | 1.86 | | | | 1.86 | | | | 0.11 | | | | 33 | | |
| | | 10/31/2003 | | | 22.93 | | | | 20,102 | | | | 2.07 | | | | 2.07 | | | | 0.06 | | | | 32 | | |
| | | 10/31/2002 | | | (17.47 | ) | | | 16,980 | | | | 2.20 | | | | 2.56 | | | | (0.09 | ) | | | 101 | | |
| | | 10/31/2001 | | | (3.31 | ) | | | 20,034 | | | | 2.20 | | | | 2.58 | | | | (0.17 | ) | | | 29 | | |
| | | 10/31/2000 | | | 13.72 | | | | 10,448 | | | | 2.20 | | | | 2.85 | | | | (0.25 | ) | | | 50 | | |
| Class C | | 10/31/2004 | | | 8.62 | | | | 5,981 | | | | 2.20 | | | | 2.30 | | | | (0.37 | ) | | | 33 | | |
| | | 10/31/2003 | | | 23.81 | | | | 797 | | | | 2.07 | | | | 2.07 | | | | 0.05 | | | | 32 | | |
NOTES TO FINANCIAL HIGHLIGHTS
(a) Annualized.
(b) Not annualized for periods of less than one year.
(c) Total Return has been calculated for the applicable period without deduction of a sales load, if any, on an initial purchase. Periods of less than one year are not annualized.
(d) Per share information is calculated based on average number of shares outstanding for the years ended 10/31/2001, 10/31/2002, 10/31/2003 and 10/31/2004.
(e) Ratio of Net Expenses to Average Net Assets is net of fee waivers and reimbursements by the investment adviser, if any (see note 2).
(f) Ratio of Total Expenses to Average Net Assets includes all expenses before fee waivers and reimbursements by the investment adviser.
(g) The inception date for the Fund's offering of share Class L was November 11, 2002. Class L was renamed Class C on March 1, 2004. (see note 1)
The notes to the financial statements are an integral part of this report.
Transamerica IDEX Mutual Funds
Annual Report 2004
9
TA IDEX Salomon Investors Value
NOTES TO FINANCIAL STATEMENTS
At October 31, 2004
(all amounts in thousands)
NOTE 1. ORGANIZATION AND SIGNIFICANT ACCOUNTING POLICIES
Transamerica IDEX Mutual Funds ("TA IDEX"), formerly IDEX Mutual Funds, is a Massachusetts business trust registered under the Investment Company Act of 1940, as amended (the "1940 Act"), as an open-end management investment company. TA IDEX Salomon Investors Value ("the Fund"), part of Transamerica IDEX Mutual Funds, began operations on February 1, 1997.
On March 1, 2004, the Fund changed its name from IDEX Salomon Investors Value to TA IDEX Salomon Investors Value.
In the normal course of business, the Fund enters into contracts that contain a variety of representations and warranties, which provide general indemnifications. The Fund's maximum exposure under these arrangements is unknown, as this would involve future claims that may be made against the Fund and/or its affiliates that have not yet occurred. However, based on experience, the Fund expects the risk of loss to be remote.
See the Prospectus and Statement of Additional Information for a description of the Fund's investment objective.
In preparing the Fund's financial statements in accordance with accounting principles generally accepted in the United States of America ("GAAP"), estimates or assumptions (which could differ from actual results) may be used that affect reported amounts and disclosures. The following policies were consistently followed by the Fund, in accordance with GAAP.
Multiple class operations and expenses: The Fund currently offers three classes of shares, each with a public offering price that reflects different sales charges, if any, and expense levels. All shares designated as Class C shares prior to March 1, 2004, were renamed as Class C2 shares on that date. All shares designated as Class L shares prior to March 1, 2004, were renamed as Class C shares with different sales charges than the previous Class L shares. On June 15, 2004, Class C2 shares merged into Class C. On September 24, 2004, Class M shares merged into Class C. Class B shares will convert to Class A shares eight years after purchase. Income, non-class specific expenses and realized and unrealized gains and losses, are allocated daily to each class, based upon the value of shares outstanding method as permitted under Rule 18f-3 of the 1940 Act. Each class bears its own specific expenses as well as a portion of general, common expenses.
Pricing of shares: The Fund prices its shares on the basis of the net asset value of each class of shares of the Fund, which is determined as of the close of the New York Stock Exchange ("NYSE") (generally 4:00 p.m. Eastern Time) on each day on which the NYSE is open for trading (other than a day on which there are insufficient changes in the value of the Fund's portfolio securities to materially affect the Fund's net asset value or a day on which no shares are tendered for redemption and no order to purchase any shares is received).
Security valuations: Fund investments traded on an exchange are valued at the closing price on the day of valuation on the exchange where the security is principally traded. With respect to securities traded on NASDAQ NMS, such closing price may be the last reported sales price or the NASDAQ Official Closing Price.
Securities traded in the over-the-counter market and listed securities for which no sale was reported on that date are valued at the last quoted bid price.
Debt securities are valued by independent pricing services; however, those that mature in sixty days or less are valued at amortized cost, which approximates market.
Investment company securities are valued at net asset value of the underlying portfolio.
Other securities for which quotations are not readily available are valued at fair market value as determined in good faith using guidelines adopted by the Board of Trustees of the Fund, under the supervision of the Fund's Valuation Committee.
Cash: The Fund may leave cash overnight in its cash account with the custodian, Investors Bank & Trust Company ("IBT"). IBT has been contracted on behalf of the Fund to invest the excess cash into a savings account, which at October 31, 2004, was paying an interest rate of 1.30%.
Throughout the year, the Fund may have a cash overdraft balance. A fee is incurred on this overdraft, calculated by multiplying the overdraft by a rate based on the federal funds rate. This fee is included in Custody fees in the Statement of Operations.
Repurchase agreements: The Fund is authorized to enter into repurchase agreements. The Fund, through IBT, receives delivery of the underlying securities, the value of which at the time of purchase is required to be an amount equal to at least 100% of the resale price. Repurchase agreements involve the risk that the seller will fail to repurchase the security, as agreed. In that case, the Fund will bear the risk of value fluctuations until the security can be sold and may encounter delays and incur costs in liquidating the security. In the event of bankruptcy or insolvency of the seller, delays and costs may be incurred.
Securities lending: The Fund may lend securities to enhance fund earnings from investing cash collateral in making such loans to qualified borrowers (typically broker/dealers). The Fund has engaged its custodian bank, IBT, as a lending agent to administer its securities lending program. IBT earned $11 of program income for its services. When the Fund makes a security loan, it receives cash collateral as protection against the risk that the borrower will default on the loan, and
Transamerica IDEX Mutual Funds
Annual Report 2004
10
TA IDEX Salomon Investors Value
NOTES TO FINANCIAL STATEMENTS (continued)
At October 31, 2004
(all amounts in thousands)
NOTE 1.–(continued)
records an asset for the cash invested collateral and a liability for the return of the collateral.
Securities on loan are included in Investment securities at value in the Statement of Assets and Liabilities and remain on the Schedule of Investments.
Loans of securities are required to be secured by collateral at least equal to 102% of the value of the securities at inception of the loan, and not less then 100% thereafter. The Fund may invest cash collateral in short-term money market instruments including: U.S. Treasury Bills, U.S. agency obligations, commercial paper, money market mutual funds, repurchase agreements and other highly rated, liquid investments. During the life of securities loans, the collateral and securities loaned remain subject to fluctuation in value. IBT marks to market securities loaned and the collateral each business day. If additional collateral is due (at least $1), IBT collects additional cash collateral from the borrowers. Although securities loaned will be fully collateralized at all times, IBT may experience delays in, or may be prevented from, recovering the collateral on behalf of the Fund. The Fund may recall a loa ned security position at any time from the borrower through IBT. In the event the borrower fails to timely return a recalled security, IBT may indemnify the Fund by purchasing replacement securities for the Fund at its own expense and claiming the collateral to fund such a purchase. IBT absorbs the loss if the collateral value is not sufficient to cover the cost of the replacement securities. If replacement securities are not available, IBT will credit the equivalent cash value to the Fund.
While a security is on loan, the Fund does not have the right to vote that security. However, if time permits, the Fund will attempt to recall a security on loan and vote the proxy.
Income from securities lending is included in the Statement of Operations. The amount of collateral and value of securities on loan are included in the Statement of Assets and Liabilities as well as in the Schedule of Investments.
Real Estate Investment Trusts ("REITs"): There are certain additional risks involved in investing in REITs. These include, but are not limited to, economic conditions, changes in zoning laws, real estate values, property taxes and interest rates.
Security transactions and investment income: Security transactions are recorded on the trade date. Security gains and losses are calculated on the specific identification basis. Dividend income is recorded on the ex-dividend date or, in the case of foreign securities, as soon as the Fund is informed of the ex-dividend date. Interest income, including accretion of discounts and amortization of premiums, is recorded on the accrual basis commencing on the settlement date.
Account maintenance fees: If the shareholder account balance falls below $1 by either shareholder action or as a result of market action, a $25 (not in thousands) fee is assessed every year until the balance reaches $1. The fee is assessed by redeeming shares in the shareholder's account.
No fee will be charged under the following conditions:
• accounts opened within the preceding 24 months
• accounts with an active monthly Automatic Investment Plan ($50 (not in thousands) minimum per fund)
• accounts owned by an individual which, when combined by social security number, have a balance of $5 or more
• accounts owned by individuals in the same household (by address) that have a combined balance of $5 or more
• UTMA/UGMA accounts
• Fiduciary accounts
• B-share accounts whose shares have started to convert to A-shares accounts (as long as combined value of both accounts is at least $1)
For the year ended October 31, 2004, this fee totaled $1. These fees are included in Paid in Capital in the Statement of Assets and Liabilities.
Redemption fees: A short-term trading redemption fee may be assessed on any fund shares in a fund account that are sold during the first five (5) New York Stock Exhange trading days following their purchase date. This redemption fee will equal 2% of the amount redeemed and shares held the longest will be treated as being redeemed first and shares held the shortest as being redeemed last. For the year ended October 31, 2004, the Fund received no redemption fees.
Dividend distributions: Distributions to shareholders are recorded on the ex-dividend date and are determined in accordance with Federal income tax regulations which may differ from GAAP.
NOTE 2. RELATED PARTY TRANSACTIONS
AEGON/Transamerica Fund Advisers, Inc. ("ATFA") is the Fund's investment adviser. AEGON/Transamerica Fund Services, Inc. ("ATFS") is the Fund's administrator. AFSG Securities Corp. ("AFSG") is the Fund's distributor/principal underwriter. AEGON/Transamerica Investor Services, Inc. ("ATIS") is the Fund's transfer agent. ATIS and AFSG are 100% owned by AUSA Holding Company ("AUSA"). ATFA is a directly owned subsidiary of Western Reserve Life Assurance Co. of Ohio (78%) ("WRL") and AUSA (22%). ATFS is a wholly owned subsidiary of WRL. AUSA and WRL are wholly owned indirect subsidiaries of AEGON NV, a Netherlands corporation.
Transamerica IDEX Mutual Funds
Annual Report 2004
11
TA IDEX Salomon Investors Value
NOTES TO FINANCIAL STATEMENTS (continued)
At October 31, 2004
(all amounts in thousands)
NOTE 2.–(continued)
The following schedule represents the percentage of fund assets owned by affiliated mutual funds (i.e. through the asset allocation funds):
| | | Net
Assets | | % of
Net Assets | |
TA IDEX Asset Allocation –
Conservative Portfolio | | $ | 26,396 | | | | 6 | % | |
| TA IDEX Asset Allocation – Growth Portfolio | | | 108,629 | | | | 25 | % | |
TA IDEX Asset Allocation –
Moderate Growth Portfolio | | | 162,644 | | | | 38 | % | |
TA IDEX Asset Allocation –
Moderate Portfolio | | | 95,471 | | | | 22 | % | |
| Total | | $ | 393,140 | | | | 91 | % | |
Investment advisory fee: The Fund pays management fees to ATFA based on average daily net assets ("ANA") at the following breakpoints:
0.80% of the first $500 million of ANA
0.70% of ANA over $500 million
ATFA has contractually agreed to waive its advisory fee and will reimburse the Fund to the extent that operating expenses, excluding 12b-1 fees, exceed the following stated annual limit:
1.20% Expense Limit
Distribution and service fees: The Fund has a 12b-1 distribution plan under the 1940 Act pursuant to which an annual fee, based on average daily net assets, is paid to the distributor for various disbursements such as broker-dealer account servicing fees and other promotional expenses of the Fund. The Fund is authorized under the 12b-1 plan to pay fees on each class up to the following limits:
| Class A | | | 0.35 | % | |
| Class B | | | 1.00 | % | |
| Class C | | | 1.00 | % | |
| Class C2 | | | 1.00 | % | |
| Class M | | | 0.90 | % | |
Class C2 and Class M merged into Class C on June 15, 2004 and September 24, 2004, respectively.
In the case the Fund or a class of shares of the Fund is closed to new investors or investments, the Fund is authorized to pay 12b-1 fees for past sales and distribution efforts and present and past investor services.
Underwriter commissions relate to front-end sales charges imposed for Class A and M shares and contingent deferred sales charges from Classes B, C, M and certain A share redemptions. For the year ended October 31, 2004, the underwriter commissions were as follows:
| Received by Underwriter | | $ | 181 | | |
| Retained by Underwriter | | | 8 | | |
| Contingent Deferred Sales Charge | | | 55 | | |
Administrative services: The Fund has entered into an agreement with ATFS for financial and legal fund administration services, which includes such items as compliance, expenses, financial statements and other reporting, distributions, tax returns, prospectus preparation, board of trustees meeting support and other legal matters. The Fund pays ATFS an annual fee of 0.015% of average net assets. The Legal fees on the Statement of Operations are for fees paid to external legal counsel.
The Fund paid ATFS $57 for the year ended October 31, 2004.
Transfer agent fees: The Fund pays ATIS an annual per-account charge of $20 (not in thousands) for each open account and $1.63 (not in thousands) for each closed account. There is no new account charge. The transfer agent fees on the Statement of Operations are made up of fees paid to ATIS and costs associated with shareholder statements. The Fund paid ATIS $134 for the year ended October 31, 2004.
Deferred compensation plan: Each eligible Fund Trustee may elect participation in the Deferred Compensation Plan ("the Plan"). Under the Plan, such Trustees may defer payment of a percentage of their total fees earned as a Fund Trustee. These deferred amounts may be invested in any Transamerica IDEX Mutual Fund. At October 31, 2004, the value of invested plan amount was $8. Invested plan amounts and the total liability for deferred compensation to the Trustees under the Plan at October 31, 2004, are included in the accompanying Statement of Assets and Liabilities.
NOTE 3. INVESTMENT TRANSACTIONS
The cost of securities purchased and proceeds from securities sold (excluding short-term securities) for the year ended October 31, 2004, were as follows:
| Purchases of securities: | | | |
| Long-Term excluding U.S. Government | | $ | 288,326 | | |
| U.S. Government | | | – | | |
| Proceeds from maturities and sales of securities: | | | |
| Long-Term excluding U.S. Government | | | 120,855 | | |
| U.S. Government | | | – | | |
The Fund has not made any provision for federal income or excise taxes due to its policy to distribute all of its taxable income and capital gains to its shareholders and otherwise qualify as a regulated investment company under the Internal Revenue Code. Income and capital gain distributions are determined in accordance with income tax regulations, which may differ from GAAP. These differences are primarily
Transamerica IDEX Mutual Funds
Annual Report 2004
12
TA IDEX Salomon Investors Value
NOTES TO FINANCIAL STATEMENTS (continued)
At October 31, 2004
(all amounts in thousands)
NOTE 4. FEDERAL INCOME TAX MATTERS
due to differing treatment for items including, but not limited to, wash sales, and capital loss carryforwards.
Reclassifications between Undistributed net investment income (loss), Undistributed net realized capital gains (loss) and Shares of beneficial interest are made to reflect income and gains available for distribution under federal tax regulations. Results of operations and net assets are not effected by these reclassifications. These reclassifications are as follows:
Shares of beneficial interest, unlimited
shares authorized | | $ | (18 | ) | |
| Undistributed net investment income (loss) | | | (11 | ) | |
Accumulated net realized gain (loss) from
investment securities | | | 29 | | |
The capital loss carryforward utilized during the year ended October 31, 2004 was $222.
The tax character of distributions paid may differ from the character of distributions shown in the Statements of Changes in Net Assets due to short-term gains being treated as ordinary income for tax purposes. The tax character of distributions paid during 2003 and 2004 was as follows:
| 2003 Distributions paid from: | | | |
| Ordinary Income | | $ | 138 | | |
| Long-term capital gain | | | 580 | | |
| 2004 Distributions paid from: | | | |
| Ordinary Income | | $ | 6,640 | | |
| Long-term capital gain | | | 5,458 | | |
The tax basis components of distributable earnings as of October 31, 2004, are as follows:
| Undistributed Ordinary Income | | $ | 1,543 | | |
| Undistributed Long-term Capital Gains | | $ | 5,914 | | |
| Capital Loss Carryforward | | $ | – | | |
| Net Unrealized Appreciation (Depreciation) | | $ | 25,852 | | |
The aggregate cost of investments and composition of unrealized appreciation (depreciation) for federal income tax purposes as of October 31, 2004, are as follows:
| Federal Tax Cost Basis | | $ | 431,441 | | |
| Unrealized Appreciation | | $ | 25,852 | | |
| Unrealized (Depreciation) | | | – | | |
| Net Unrealized Appreciation (Depreciation) | | $ | 25,852 | | |
NOTE 5. OTHER MATTERS
Transamerica IDEX Mutual Funds ("TA IDEX"), and certain of its affiliated entities, have received requests for information from the Staff of the Securities and Exchange Commission in connection with market timing and late trading within the funds. TA IDEX and the affiliated entities have voluntarily cooperated in the investigation and have been providing the information as requested.
Transamerica IDEX Mutual Funds
Annual Report 2004
13
Report of Independent Registered Certified Public Accounting Firm
To the Board of Trustees and Shareholders of
TA IDEX Salomon Investors Value
In our opinion, the accompanying statement of assets and liabilities, including the schedule of investments, and the related statements of operations and of changes in net assets and the financial highlights present fairly, in all material respects, the financial position of TA IDEX Salomon Investors Value (the "Fund") (one of the portfolios constituting the Transamerica IDEX Mutual Funds) at October 31, 2004, the results of its operations for the year then ended, the changes in its net assets for each of the two years in the period then ended and the financial highlights for each of the periods indicated, in conformity with accounting principles generally accepted in the United States of America. These financial statements and financial highlights (hereafter referred to as "financial statements") are the responsibility of the Fund's management; our responsibility is to express an opinion on t hese financial statements based on our audits. We conducted our audits of these financial statements in accordance with the standards of the Public Company Accounting Oversight Board (United States). Those standards require that we plan and perform the audit to obtain reasonable assurance about whether the financial statements are free of material misstatement. An audit includes examining, on a test basis, evidence supporting the amounts and disclosures in the financial statements, assessing the accounting principles used and significant estimates made by management, and evaluating the overall financial statement presentation. We believe that our audits, which included confirmation of securities at October 31, 2004 by correspondence with the custodian and brokers, provide a reasonable basis for our opinion.

PricewaterhouseCoopers LLP
Tampa, Florida
December 28, 2004
Transamerica IDEX Mutual Funds
Annual Report 2004
14
TA IDEX Salomon Investors Value
SUPPLEMENTAL INFORMATION (unaudited)
TAX INFORMATION
For tax purposes, the Fund has made a Long-Term Capital Gain Designation of $5,458.
For dividends paid during the year ended October 31, 2004, the Fund designates $7,799 as qualified dividend income.
For corporate shareholders, 66% of investment income (dividend income plus short-term gains, if any) qualifies for the dividends received deduction.
The information and distributions reported herein may differ from the information and distributions taxable to the shareholders for the calendar year ending December 31, 2004. Complete information will be computed and reported in conjunction with your 2004 Form 1099-DIV.
RESULTS OF SHAREHOLDER PROXY
At a special meeting of Class M shareholders of each series of Transamerica IDEX (except TA IDEX Federated Tax Exempt and TA IDEX Protected Principal Stock) held on September 2, 2004, the results of the Proposal were as follows:
Proposal 1: Approval of a conversion of Class M shares into Class C shares of the Funds, which will result in bearing the distribution and service fees payable under the 12b-1 Plan of Distribution for the Class C shares of the Funds.
| For | | Against | | Abstentions/Broker Non-Votes | |
| | 83.58 | % | | | 5.81 | % | | | 10.61 | % | |
Transamerica IDEX Mutual Funds
Annual Report 2004
15
TA IDEX T. Rowe Price Health Sciences
MARKET ENVIRONMENT
Buoyed by favorable corporate earnings, economic growth, and some merger activity, stocks rose early in the year ended October 31, 2004. Market returns were later hurt by investor caution about rising inflation and concerns about possible Federal Reserve Board ("Fed") interest rate increases. The Fed implemented quarter-point interest rate hikes in June, August, and September. In addition, a weak employment outlook, historically high oil prices, and fears about terrorist attacks weighed on the broad markets.
Small- and mid-cap shares outperformed large-caps, and value stocks strongly outperformed their growth counterparts. Health care products and device providers and service companies (up 18.10% and 9.00%, respectively) delivered the best returns among health care equities, while the pharmaceutical industry (down 3.60%) lagged. Election-year issues, including fears that pharmaceutical price controls could be implemented, and the continuing debate on medicine importation hurt pharmaceutical shares. The rising interest rate climate also hampered early-stage, unprofitable biotechnology companies, whose current valuations are largely determined by highly uncertain estimates of future cash flows.
PERFORMANCE
For the year ended October 31, 2004, TA IDEX T. Rowe Price Health Sciences, Class A returned 10.19%. By comparison its benchmark, the Standard and Poor's 500 Composite Stock Index, returned 9.41%.
STRATEGY REVIEW
Stock selection in the health care sector was the main source of strength relative to the benchmark, and security choices in the pharmaceutical, biotechnology, and services industries accounted for almost all of the outperformance. Our health care focus hurt returns relative to the broad market, as the sector lagged all but information technology.
Strong stock selection in the services industry (approximately 17% of assets) was the best contributor to relative results. Significant overweights in UnitedHealth Group Incorporated ("UnitedHealth") and Anthem, Inc. ("Anthem") were the keys to outperformance. An allocation to Mariner Health Care, Inc. ("Mariner") also helped. UnitedHealth completed its acquisition of Oxford Health Plans, Inc. and reported strong quarterly earnings growth, and upwardly revised its estimates for the remainder of 2004. Mariner announced a merger with National Senior Care at a 49% premium.
The portfolio's allocation to the products and devices industry (approximately 10% of assets) also added value. Overweights in C.R. Bard, Inc. ("CR Bard") and the inclusion of Aspect Medical Systems, Inc. aided returns. Medical equipment developer and manufacturer CR Bard continues to benefit from new products, sales growth, and expanding research and development investments.
While our greater-than-benchmark allocation to pharmaceutical stocks (approximately 20% of assets) detracted, our security choices produced great relative benefit. Underweighting Merck & Co. Inc. ("Merck"), which was eliminated from the portfolio at September's end, helped returns. Our positions in non-benchmark securities Elan Corporation, PLC ("Elan"), which develops and markets pharmaceuticals and medicine delivery technology, Eyetech Pharmaceuticals, Inc., which produces medicines for diseases of the eye, and Noven Pharmaceuticals, a transdermal medical delivery product and technology developer, also added value. Our exposure to generic drug makers Taro Pharmaceuticals Industries Ltd. ("Taro") and Watson Pharmaceuticals, Inc. hampered returns. Merck recalled Vioxx, its multibillion-dollar arthritis and pain remedy, after a study showed that long-term use increased the risk of heart attack. Taro reported disappointing second-quarter results in late July, as revenues and earnings fell far below analyst expectations.
Our biotechnology industry overweight (approximately 47% of assets) detracted as the industry returns were flat. Our overweights in Gilead Sciences, Inc. ("Gilead") (medicines for infectious diseases) and Biogen, Inc. ("Biogen") (medicines for oncology, neurology, dermatology, and rheumatology) and the inclusion of Genentech, Inc. (protein-based products for serious or life-threatening medical conditions) and ImClone Systems Incorporated (therapeutic products for the treatment of cancer) benefited returns. Our exposure to Trimeris, Inc. ("Trimeris") (fusion inhibitors for the treatment of viral diseases) and Nps Pharmaceuticals, Inc. ("Nps") (biopharmaceutical company focused on small molecule medicines and recombinant proteins) was costly. Gilead reported positive preliminary results for a study comparing Truvada, a combination pill consisting of two of its existing remedies Emtriva and Viread, to a c ompetitor. Sales of Trimeris's main product, Fuzeon, which focuses on the treatment of HIV patients who have developed resistance to traditional treatments, were lower than expected.
Our five largest absolute contributors to performance over the last twelve months were UnitedHealth, Gilead, Biogen, Anthem, and Elan. Our five largest detractors were Trimeris, Wilson Greatbatch Technologies, Inc., Omnicare, Inc., Nps, and Amgen, Inc.
Kris H. Jenner
Fund Manager
T. Rowe Price Associates, Inc.
Transamerica IDEX Mutual Funds
Annual Report 2004
1
TA IDEX T. Rowe Price Health Sciences
Comparison of change in value of $10,000 investment in Class A shares and its comparative index.

Average Annual Total Return for Periods Ended 10/31/04
| | | 1 year | | From
Inception | | Inception
Date | |
| Class A (NAV) | | | 10.19 | % | | | 4.25 | % | | 3/1/02 | |
| Class A (POP) | | | 4.13 | % | | | 2.06 | % | | 3/1/02 | |
| S&P 5001 | | | 9.41 | % | | | 2.53 | % | | 3/1/02 | |
| Class B (NAV) | | | 9.59 | % | | | 3.61 | % | | 3/1/02 | |
| Class B (POP) | | | 4.59 | % | | | 2.54 | % | | 3/1/02 | |
| Class C (NAV) | | | 9.33 | % | | | 16.60 | % | | 11/11/02 | |
| Class C (POP) | | | 8.33 | % | | | 16.60 | % | | 11/11/02 | |
NOTES
1 The Standard & Poor's 500 Composite Stock (S&P 500) Index is an unmanaged index used as a general measure of market performance. Calculations assume dividends and capital gains are reinvested and do not include any managerial expenses. From inception calculation is based on life of Class A shares. Source: Standard & Poor's Micropal®© Micropal, Inc. 2004 – 1-800-596-5323 – http://www.micropal.com.
The performance data presented represents past performance, future results may vary. Performance data does not reflect the deduction of taxes that would be paid on fund distributions or the redemption of fund shares. Investment return and principal value will fluctuate so that an investor's shares, when redeemed, may be worth more or less than their original cost. Current performance may be lower or higher than performance quoted.
Public Offering Price (POP) returns include the reinvestment of dividends and capital gains and reflect the maximum sales charge of 5.5% for A shares or the maximum applicable contingent deferred sales charge (5% in the 1st year, decreasing to 0% after 6 years) for Class B shares and 1% (during the first 12 months) for Class C shares. Shares purchased prior to March 1, 2004 are subject to a maximum applicable contingent deferred sales charge (5% in the 1st year, decreasing to 0% after 7 years) for Class B shares and (2% in the 1st year, decreasing to 0% after 2 years) for Class C shares. Net Ass et Value (NAV) returns include the reinvestment of dividends and capital gains but do not reflect any sales charges.
Investments in a "non-diversified" fund and sector funds may be subject to specific risks such as susceptibility to single economic, political, or regulatory events, and may be subject to greater loss than investments in a diversified fund.
This material must be preceded or accompanied by a current prospectus, which includes specific contents regarding the investment objectives and policies of this fund.
Transamerica IDEX Mutual Funds
Annual Report 2004
2
TA IDEX T. Rowe Price Health Sciences
UNDERSTANDING YOUR FUND'S EXPENSES (unaudited)
SHAREHOLDER EXPENSES
The following Example is intended to help you understand your ongoing costs (in dollars and cents) of investing in a Fund and to compare these costs with the ongoing costs of investing in other funds.
The Example is based on an investment of $1,000 invested at the beginning of the period and held for the entire period from May 1, 2004 to October 31, 2004.
ACTUAL EXPENSES
The first line in the table below provides information about actual account values and actual expenses. You may use the information in this line, together with the amount you invested, to estimate the expenses that you paid over the period. Simply divide your account value by $1,000 (for example, an $8,600 account value divided by $1,000 = 8.6), then multiply the result by the number in the first line of your Fund un der the heading entitled "Expenses Paid During Period" to estimate the expenses you paid on your account during this period.
HYPOTHETICAL EXAMPLE FOR COMPARISON PURPOSES
The second line in the table below provides information about hypothetical account values and hypothetical expenses based on each Fund's actual expense ratio and an assumed rate of return of 5% per year before expenses, which is not the Fund's actual return. The hypothetical account values and expenses may not be used to estimate the actual ending account balance or expenses you paid for the period. You may use this information to compare the ongoing costs of investing in your Fund and other funds. To do so, compare this 5% hypothetical example with the 5% hypothetical examples that appear in the shareholder reports of the other funds.
Please note that the expenses shown in the table are meant to highlight your ongoing costs only and do not reflect any transactional costs, such as sales charges, redemption fees, brokerage commissions paid on purchases and sales of fund shares. Therefore, the second line under each Fund in the table is useful in comparing ongoing costs only, and will not help you determine the relative total costs of owning different funds. In addition, note that the expenses shown in the table are meant to highlight your ongoing costs and do not reflect any transaction costs.
| | | Beginning
Account
Value | | Ending
Account
Value | | Annualized
Expense
Ratio | | Expenses Paid
During Period (a) | |
| Class A | | | |
| Actual | | $ | 1,000.00 | | | $ | 939.10 | | | | 1.51 | % | | $ | 7.36 | | |
| Hypothetical (b) | | | 1,000.00 | | | | 1,017.55 | | | | 1.51 | | | | 7.66 | | |
| Class B | | | |
| Actual | | | 1,000.00 | | | | 936.50 | | | | 2.00 | | | | 9.74 | | |
| Hypothetical (b) | | | 1,000.00 | | | | 1,015.08 | | | | 2.00 | | | | 10.13 | | |
| Class C | | | |
| Actual | | | 1,000.00 | | | | 933.40 | | | | 2.73 | | | | 13.27 | | |
| Hypothetical (b) | | | 1,000.00 | | | | 1,011.41 | | | | 2.73 | | | | 13.80 | | |
(a) Expenses are calculated using each Fund's annualized expense ratio (as disclosed in the table), multiplied by the average account value for the period, multiplied by number of days in the period (184 days), and divided by the number of days in the year (366 days).
(b) 5% return per year before expenses.
GRAPHIC PRESENTATION OF SCHEDULE OF INVESTMENTS
By Industry
At October 31, 2004
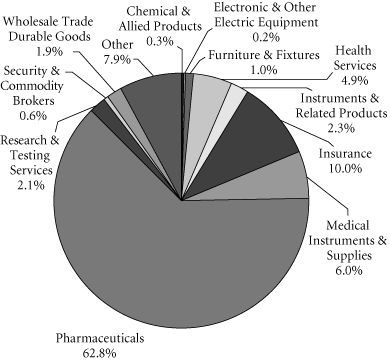
This chart shows the percentage breakdown by industry of the Funds total investment securities.
Transamerica IDEX Mutual Funds
Annual Report 2004
3
TA IDEX T. Rowe Price Health Sciences
SCHEDULE OF INVESTMENTS
At October 31, 2004
(all amounts except share amounts in thousands)
| | | Shares | | Value | |
| CONVERTIBLE PREFERRED STOCKS (0.6%) | | | |
| Pharmaceuticals (0.0%) | | | |
| NeoRx Corp. | | | 3 | | | $ | 11 | | |
| Security & Commodity Brokers (0.6%) | | | |
| Morgan Stanley 144A | | | 26,000 | | | | 957 | | |
| Total Convertible Preferred Stocks (cost: $1,146) | | | | | | | 968 | | |
| COMMON STOCKS (92.3%) | | | |
| Chemicals & Allied Products (0.3%) | | | |
| Solvay SA | | | 4,200 | | | | 422 | | |
| Electronic & Other Electric Equipment (0.2%) | | | |
| Wilson Greatbatch Technologies, Inc. (a) | | | 21,000 | | | | 356 | | |
| Furniture & Fixtures (1.0%) | | | |
| Kinetic Concepts, Inc. (a) | | | 32,200 | | | | 1,605 | | |
| Health Services (4.9%) | | | |
| Caremark Rx, Inc. (a) | | | 12,389 | | | | 371 | | |
| Community Health Systems, Inc. (a) | | | 42,600 | | | | 1,143 | | |
| Coventry Health Care, Inc. (a) | | | 3,100 | | | | 127 | | |
| CryoLife, Inc. (a) | | | 55,600 | | | | 383 | | |
| Edwards Lifesciences Corp. (a) | | | 19,300 | | | | 660 | | |
| HCA, Inc. (b) | | | 27,200 | | | | 999 | | |
| Human Genome Sciences, Inc. (a) | | | 58,600 | | | | 603 | | |
| LabOne, Inc. (a) | | | 18,500 | | | | 555 | | |
| Manor Care, Inc. | | | 24,500 | | | | 802 | | |
| NeighborCare, Inc. (a) | | | 23,900 | | | | 613 | | |
| Nektar Therapeutics (a) | | | 31,600 | | | | 455 | | |
| Sunrise Senior Living, Inc. (a) | | | 23,300 | | | | 888 | | |
| Triad Hospitals, Inc. (a) | | | 9,200 | | | | 304 | | |
| Universal Health Services, Inc.–Class B | | | 2,500 | | | | 104 | | |
| Instruments & Related Products (2.3%) | | | |
| Alcon, Inc. (b) | | | 9,800 | | | | 698 | | |
| Cooper Cos., Inc. (b) | | | 3,000 | | | | 211 | | |
| Fisher Scientific International (a) | | | 40,500 | | | | 2,323 | | |
| STAAR Surgical Co. (a) | | | 31,800 | | | | 124 | | |
| Waters Corp. (a) | | | 8,600 | | | | 355 | | |
| Insurance (10.1%) | | | |
| Anthem, Inc. (a)(b) | | | 92,800 | | | | 7,461 | | |
| UnitedHealth Group, Inc. (b) | | | 123,700 | | | | 8,956 | | |
| Medical Instruments & Supplies (6.1%) | | | |
| Aspect Medical Systems, Inc. (a) | | | 51,400 | | | | 924 | | |
| Biomet, Inc. | | | 15,300 | | | | 714 | | |
| Boston Scientific Corp. (a)(b) | | | 40,100 | | | | 1,416 | | |
| CR Bard, Inc. | | | 9,000 | | | | 511 | | |
| Endologix, Inc. (a) | | | 43,900 | | | | 284 | | |
| Fischer Imaging Corp. (a) | | | 45,380 | | | | 193 | | |
| Guidant Corp. (b) | | | 28,200 | | | | 1,879 | | |
| | | Shares | | Value | |
| Medical Instruments & Supplies (continued) | | | |
| Medtronic, Inc. | | | 19,000 | | | $ | 971 | | |
| St. Jude Medical, Inc. (a) | | | 12,400 | | | | 949 | | |
| Stryker Corp. | | | 25,700 | | | | 1,107 | | |
| Zimmer Holdings, Inc. (a) | | | 10,900 | | | | 846 | | |
| Pharmaceuticals (63.4%) | | | |
| Abgenix, Inc. (a) | | | 96,900 | | | | 883 | | |
| Able Laboratories, Inc. (a) | | | 54,000 | | | | 1,170 | | |
| Alexion Pharmaceuticals, Inc. (a) | | | 39,280 | | | | 701 | | |
| Alkermes, Inc. (a) | | | 154,860 | | | | 1,916 | | |
| Allergan, Inc. (b) | | | 8,700 | | | | 623 | | |
| AmerisourceBergen Corp. (b) | | | 19,400 | | | | 1,068 | | |
| Amgen, Inc. (a)(b) | | | 90,420 | | | | 5,136 | | |
| Amylin Pharmaceuticals, Inc. (a)(b) | | | 32,880 | | | | 700 | | |
| Andrx Corp. (a) | | | 54,600 | | | | 1,182 | | |
| Angiotech Pharmaceuticals, Inc. (a) | | | 43,900 | | | | 802 | | |
| AstraZeneca PLC, Sponsored ADR | | | 2,900 | | | | 119 | | |
| AtheroGenics, Inc. (a)(b) | | | 33,900 | | | | 1,015 | | |
| Barr Pharmaceuticals, Inc. (a) | | | 3,950 | | | | 149 | | |
| BioCryst Pharmaceuticals, Inc. (a) | | | 58,900 | | | | 311 | | |
| Biogen Idec, Inc. (a)(b) | | | 61,400 | | | | 3,571 | | |
| BioSphere Medical, Inc. (a) | | | 77,900 | | | | 206 | | |
| Cardinal Health, Inc. (b) | | | 15,300 | | | | 715 | | |
| Celgene Corp. (a) | | | 61,800 | | | | 1,831 | | |
| Cephalon, Inc. (a)(b) | | | 102,840 | | | | 4,902 | | |
| Chiron Corp. (a) | | | 2,500 | | | | 81 | | |
| Cubist Pharmaceuticals, Inc. (a) | | | 118,000 | | | | 1,204 | | |
| CV Therapeutics, Inc. (a) | | | 23,400 | | | | 391 | | |
| Cytogen Corp. (a) | | | 29,000 | | | | 286 | | |
| Dade Behring Holdings, Inc. (a) | | | 16,400 | | | | 923 | | |
| Discovery Laboratories, Inc. (a) | | | 23,400 | | | | 159 | | |
| Elan Corp. PLC, Sponsored ADR (a)(b) | | | 136,500 | | | | 3,522 | | |
| Eli Lilly & Co. (b) | | | 28,900 | | | | 1,587 | | |
| Encysive Pharmaceuticals, Inc. (a) | | | 81,400 | | | | 711 | | |
| EPIX Pharmaceuticals, Inc. (a) | | | 15,300 | | | | 239 | | |
| Eyetech Pharmaceuticals, Inc. (a)(b) | | | 45,900 | | | | 1,948 | | |
| Forest Laboratories, Inc. (a)(b) | | | 40,300 | | | | 1,797 | | |
| Genentech, Inc. (a)(b) | | | 55,240 | | | | 2,515 | | |
| Gilead Sciences, Inc. (a)(b) | | | 295,940 | | | | 10,248 | | |
| ICOS Corp. (a) | | | 3,200 | | | | 72 | | |
| Idenix Pharmaceuticals, Inc. (a) | | | 50,600 | | | | 885 | | |
| ImClone Systems, Inc. (a)(b) | | | 105,790 | | | | 4,634 | | |
| Indevus Pharmaceuticals, Inc. (a) | | | 40,200 | | | | 269 | | |
| Inspire Pharmaceuticals, Inc. (a) | | | 32,300 | | | | 506 | | |
| Invitrogen Corp. (a) | | | 31,700 | | | | 1,835 | | |
| IVAX Corp. (a) | | | 66,125 | | | | 1,197 | | |
| Johnson & Johnson | | | 28,500 | | | | 1,664 | | |
| Keryx Biopharmaceuticals, Inc. (a) | | | 31,700 | | | | 369 | | |
The notes to the financial statements are an integral part of this report.
Transamerica IDEX Mutual Funds
Annual Report 2004
4
TA IDEX T. Rowe Price Health Sciences
SCHEDULE OF INVESTMENTS (continued)
At October 31, 2004
(all amounts except share amounts in thousands)
| | | Shares | | Value | |
| Pharmaceuticals (continued) | | | |
| King Pharmaceuticals, Inc. (a) | | | 3,100 | | | $ | 34 | | |
| Ligand Pharmaceuticals, Inc.–Class B (a) | | | 15,300 | | | | 136 | | |
| Martek Biosciences Corp. (a)(b) | | | 12,200 | | | | 574 | | |
| Medicines Co. (a) | | | 133,050 | | | | 3,544 | | |
| Medicis Pharmaceutical Corp.–Class A | | | 4,100 | | | | 167 | | |
| MedImmune, Inc. (a)(b) | | | 56,620 | | | | 1,609 | | |
| MGI PHARMA, Inc. (a)(b) | | | 92,800 | | | | 2,475 | | |
| Millennium Pharmaceuticals, Inc. (a) | | | 33,600 | | | | 436 | | |
| Myogen, Inc. (a) | | | 24,200 | | | | 197 | | |
| Myogen, Inc. Warrants | | | 2,900 | | | | – | (c) | |
| Myriad Genetics, Inc. (a) | | | 42,200 | | | | 748 | | |
| Nabi Biopharmaceuticals (a)(b) | | | 38,400 | | | | 532 | | |
| NeoRx Corp. (a) | | | 4,600 | | | | 8 | | |
| NeoRx Corp. Warrants, Expires 12/8/2008 | | | 1,200 | | | | – | (c) | |
| Neurocrine Biosciences, Inc. (a)(b) | | | 57,160 | | | | 2,661 | | |
| Novartis AG, Sponsored ADR | | | 4,000 | | | | 192 | | |
| Novo Nordisk A/S–Class B | | | 2,600 | | | | 129 | | |
| NPS Pharmaceuticals, Inc. (a) | | | 66,800 | | | | 1,141 | | |
| Onyx Pharmaceuticals, Inc. (a)(b) | | | 41,000 | | | | 1,150 | | |
| OraSure Technologies, Inc. (a) | | | 23,400 | | | | 158 | | |
| OSI Pharmaceuticals, Inc. (a) | | | 25,930 | | | | 1,685 | | |
| Penwest Pharmaceuticals Co. (a) | | | 11,000 | | | | 120 | | |
| Pfizer, Inc. (b) | | | 102,380 | | | | 2,964 | | |
| Pharmion Corp. (a) | | | 5,300 | | | | 244 | | |
| Protein Design Labs, Inc. (a)(b) | | | 64,100 | | | | 1,228 | | |
| Rigel Pharmaceuticals, Inc. (a) | | | 41,700 | | | | 1,001 | | |
| Salix Pharmaceuticals, Ltd. (a) | | | 3,050 | | | | 49 | | |
| Sanofi-Aventis | | | 12,000 | | | | 875 | | |
| Schering-Plough Corp. | | | 43,280 | | | | 784 | | |
| Schwarz Pharma AG | | | 11,600 | | | | 436 | | |
| Sepracor, Inc. (a)(b) | | | 34,400 | | | | 1,580 | | |
| Serologicals Corp. (a) | | | 7,600 | | | | 180 | | |
| Shire Pharmaceuticals PLC, Sponsored ADR | | | 14,100 | | | | 400 | | |
| Taro Pharmaceuticals Industries (a)(b) | | | 7,900 | | | | 210 | | |
Teva Pharmaceutical Industries, Ltd.,
Sponsored ADR | | | 29,480 | | | | 766 | | |
| Theravance, Inc. (a) | | | 9,000 | | | | 153 | | |
| Transkaryotic Therapies, Inc. (a) | | | 21,600 | | | | 374 | | |
| Trimeris, Inc. (a) | | | 90,420 | | | | 1,041 | | |
| UCB SA | | | 9,000 | | | | 474 | | |
| United Therapeutics Corp. (a) | | | 9,200 | | | | 288 | | |
| Valeant Pharmaceuticals International | | �� | 52,100 | | | | 1,250 | | |
| Vertex Pharmaceuticals, Inc. (a) | | | 66,800 | | | | 727 | | |
| Vicuron Pharmaceuticals, Inc. (a) | | | 18,600 | | | | 261 | | |
| Vion Pharmaceuticals, Inc. (a) | | | 128,300 | | | | 599 | | |
| ViroLogic, Inc. (a) | | | 7,300 | | | | 13 | | |
| Viropharma, Inc. (a) | | | 8,133 | | | | 25 | | |
| | | Shares | | Value | |
| Pharmaceuticals (continued) | |
| Wyeth | | | 87,200 | | | $ | 3,457 | | |
| XOMA, Ltd. (a) | | | 57,300 | | | | 117 | | |
| Yamanouchi Pharmaceutical Co., Ltd. | | | 36,500 | | | | 1,337 | | |
| Research & Testing Services (2.1%) | |
| DeCODE Genetics, Inc. (a) | | | 70,300 | | | | 492 | | |
| Diversa Corp. (a) | | | 35,100 | | | | 303 | | |
| Dyax Corp. (a) | | | 13,200 | | | | 76 | | |
| Exelixis, Inc. (a) | | | 89,580 | | | | 797 | | |
| Gen-Probe, Inc. (a)(b) | | | 30,300 | | | | 1,062 | | |
| Incyte Corp. (a) | | | 18,600 | | | | 193 | | |
| Kosan Biosciences, Inc. (a) | | | 8,800 | | | | 55 | | |
| Regeneration Technologies, Inc. (a) | | | 49,700 | | | | 385 | | |
| Wholesale Trade Durable Goods (1.9%) | |
| Omnicare, Inc. (b) | | | 42,940 | | | | 1,185 | | |
| Patterson Cos., Inc. (a) | | | 13,400 | | | | 502 | | |
| Symyx Technologies, Inc. (a) | | | 56,600 | | | | 1,385 | | |
| Total Common Stocks (cost: $146,772) | | | | | | | 149,318 | | |
| | | Principal | | Value | |
| SHORT-TERM U.S. GOVERNMENT OBLIGATIONS (8.2%) | |
U.S. Treasury Bill
1.56%, due 11/12/2004 (b) | | | $ 13,173 | | | | $13,165 | | |
Total Short-Term U.S. Government Obligations
(cost: $13,165) | | | | | | | 13,165 | | |
| | | Contracts (d) | | Value | |
| PURCHASED OPTIONS (0.0%) | |
| Covered Call Options (0.0%) | |
AtheroGenics, Inc.
Call Strike $40.00
Expires 11/20/2004 | | | 64 | | | $ | 2 | | |
| Put Options (0.0%) | |
Sepracor, Inc.
Put Strike $42.00
Expires 11/20/2004 | | | 211 | | | | 11 | | |
| Total Purchased Options (cost: $42) | | | | | | | 13 | | |
| Total Investment Securities (cost: $161,125) | | | | | | $ | 163,464 | | |
| WRITTEN OPTIONS (–1.2%) | |
| Covered Call Options (–0.3%) | |
Alcon, Inc.
Call Strike $70.00
Expires 02/19/2005 | | | 15 | | | | (9 | ) | |
Allergan, Inc.
Call Strike $80.00
Expires 01/22/2005 | | | 28 | | | | (2 | ) | |
The notes to the financial statements are an integral part of this report.
Transamerica IDEX Mutual Funds
Annual Report 2004
5
TA IDEX T. Rowe Price Health Sciences
SCHEDULE OF INVESTMENTS (continued)
At October 31, 2004
(all amounts except share amounts in thousands)
| | | Contracts (d) | | Value | |
| Covered Call Options (continued) | |
Amerisource Health Corp.
Call Strike $55.00
Expires 02/19/2005 | | | 46 | | | $ | (15 | ) | |
AmerisourceBergen Corp.
Call Strike $60.00
Expires 05/21/2005 | | | 46 | | | | (10 | ) | |
Amgen, Inc.
Call Strike $60.00
Expires 01/22/2005 | | | 226 | | | | (25 | ) | |
Amgen, Inc.
Call Strike $60.00
Expires 04/16/2005 | | | 92 | | | | (19 | ) | |
Amylin Pharmaceuticals, Inc.
Call Strike $22.50
Expires 01/22/2005 | | | 14 | | | | (2 | ) | |
Amylin Pharmaceuticals, Inc.
Call Strike $25.00
Expires 01/21/2006 | | | 90 | | | | (27 | ) | |
Anthem, Inc.
Call Strike $85.00
Expires 12/18/2004 | | | 46 | | | | (6 | ) | |
Anthem, Inc.
Call Strike $90.00
Expires 01/22/2005 | | | 14 | | | | (1 | ) | |
Anthem, Inc.
Call Strike $95.00
Expires 03/19/2005 | | | 15 | | | | (1 | ) | |
Anthem, Inc.
Call Strike $90.00
Expires 06/18/2005 | | | 51 | | | | (15 | ) | |
Biogen Idec, Inc.
Call Strike $70.00
Expires 01/22/2005 | | | 57 | | | | (5 | ) | |
Boston Scientific Corp.
Call Strike $40.00
Expires 01/22/2005 | | | 152 | | | | (10 | ) | |
Cardinal Health, Inc.
Call Strike $50.00
Expires 03/19/2005 | | | 84 | | | | (20 | ) | |
Cephalon, Inc.
Call Strike $50.00
Expires 01/22/2005 | | | 114 | | | | (21 | ) | |
Cooper Cos., Inc.
Call Strike $75.00
Expires 05/21/2005 | | | 18 | | | | (7 | ) | |
Elan Corp.
Call Strike $30.00
Expires 01/22/2005 | | | 57 | | | | (11 | ) | |
| | | Contracts (d) | | Value | |
| Covered Call Options (continued) | |
Eli Lilly & Co.
Call Strike $60.00
Expires 12/18/2004 | | | 30 | | | $ | (4 | ) | |
Eli Lilly & Co.
Call Strike $60.00
Expires 01/22/2005 | | | 46 | | | | (8 | ) | |
Eli Lilly & Co.
Call Strike $60.00
Expires 04/16/2005 | | | 101 | | | | (26 | ) | |
Eyetech Pharmaceuticals, Inc.
Call Strike $30.00
Expires 12/18/2004 | | | 6 | | | | (8 | ) | |
Forest Laboratories, Inc.
Call Strike $50.00
Expires 02/19/2005 | | | 45 | | | | (7 | ) | |
Forest Laboratories, Inc.
Call Strike $50.00
Expires 05/21/2005 | | | 46 | | | | (12 | ) | |
Genentech, Inc.
Call Strike $60.00
Expires 01/22/2005 | | | 125 | | | | (3 | ) | |
Gen-Probe, Inc.
Call Strike $45.00
Expires 02/19/2005 | | | 30 | | | | (3 | ) | |
Gen-Probe, Inc.
Call Strike $50.00
Expires 02/19/2005 | | | 45 | | | | (2 | ) | |
Gilead Sciences, Inc.
Call Strike $35.00
Expires 11/20/2004 | | | 174 | | | | (18 | ) | |
Guidant Corp.
Call Strike $70.00
Expires 01/22/2005 | | | 44 | | | | (12 | ) | |
HCA, Inc.
Call Strike $40.00
Expires 01/22/2005 | | | 45 | | | | (3 | ) | |
ImClone Systems, Inc.
Call Strike $55.00
Expires 11/20/2004 | | | 60 | | | | – (c) | | |
ImClone Systems, Inc.
Call Strike $60.00
Expires 12/18/2004 | | | 46 | | | | (1 | ) | |
ImClone Systems, Inc.
Call Strike $55.00
Expires 01/22/2005 | | | 85 | | | | (8 | ) | |
ImClone Systems, Inc.
Call Strike $60.00
Expires 01/22/2005 | | | 30 | | | | (1 | ) | |
The notes to the financial statements are an integral part of this report.
Transamerica IDEX Mutual Funds
Annual Report 2004
6
TA IDEX T. Rowe Price Health Sciences
SCHEDULE OF INVESTMENTS (continued)
At October 31, 2004
(all amounts except share amounts in thousands)
| | | Contracts (d) | | Value | |
| Covered Call Options (continued) | |
ImClone Systems, Inc.
Call Strike $65.00
Expires 01/22/2005 | | | 30 | | | $ | (1 | ) | |
ImClone Systems, Inc.
Call Strike $60.00
Expires 02/19/2005 | | | 60 | | | | (4 | ) | |
ImClone Systems, Inc.
Call Strike $65.00
Expires 02/19/2005 | | | 60 | | | | (2 | ) | |
ImClone Systems, Inc.
Call Strike $70.00
Expires 02/19/2005 | | | 15 | | | | – (c) | | |
ImClone Systems, Inc.
Call Strike $60.00
Expires 05/21/2005 | | | 62 | | | | (13 | ) | |
Martek Biosciences Corp.
Call Strike $60.00
Expires 12/18/2004 | | | 38 | | | | (1 | ) | |
Medimmune, Inc.
Call Strike $32.50
Expires 06/18/2005 | | | 63 | | | | (10 | ) | |
MGI PHARMA, Inc.
Call Strike $30.00
Expires 01/22/2005 | | | 42 | | | | (5 | ) | |
MGI PHARMA, Inc.
Call Strike $32.50
Expires 01/22/2005 | | | 160 | | | | (9 | ) | |
Nabi Biopharmaceuticals
Call Strike $15.00
Expires 12/18/2004 | | | 32 | | | | (2 | ) | |
Neurocrine Biosciences, Inc.
Call Strike $55.00
Expires 11/20/2004 | | | 15 | | | | – (c) | | |
Neurocrine Biosciences, Inc.
Call Strike $65.00
Expires 02/19/2005 | | | 58 | | | | (2 | ) | |
Omnicare, Inc.
Call Strike $25.00
Expires 12/18/2004 | | | 59 | | | | (19 | ) | |
Omnicare, Inc.
Call Strike $25.00
Expires 03/19/2005 | | | 32 | | | | (13 | ) | |
Onyx Pharmaceuticals, Inc.
Call Strike $35.00
Expires 01/22/2005 | | | 18 | | | | (1 | ) | |
Onyx Pharmaceuticals, Inc.
Call Strike $50.00
Expires 05/21/2005 | | | 15 | | | | – (c) | | |
| | | Contracts (d) | | Value | |
| Covered Call Options (continued) | |
Pfizer, Inc.
Call Strike $30.00
Expires 03/19/2005 | | | 60 | | | $ | (8 | ) | |
Pfizer, Inc.
Call Strike $32.50
Expires 01/21/2006 | | | 31 | | | | (5 | ) | |
Protein Design Labs, Inc.
Call Strike $22.50
Expires 02/19/2005 | | | 46 | | | | (4 | ) | |
Sepracor, Inc.
Call Strike $50.00
Expires 01/22/2005 | | | 3 | | | | (1 | ) | |
Taro Pharmaceuticals Industries
Call Strike $40.00
Expires 01/22/2005 | | | 26 | | | | (1 | ) | |
UnitedHealth Group, Inc.
Call Strike $75.00
Expires 12/18/2004 | | | 15 | | | | (2 | ) | |
UnitedHealth Group, Inc.
Call Strike $70.00
Expires 01/22/2005 | | | 14 | | | | (7 | ) | |
Zimmer Holdings, Inc.
Call Strike $80.00
Expires 12/18/2004 | | | 30 | | | | (6 | ) | |
| Put Options (–0.9%) | |
Accredo Health, Inc.
Put Strike $30.00
Expires 01/21/2006 | | | 30 | | | | (23 | ) | |
Alexion Pharmaceuticals, Inc.
Put Strike $20.00
Expires 02/19/2005 | | | 18 | | | | (6 | ) | |
Alkermes, Inc.
Put Strike $15.00
Expires 02/19/2005 | | | 35 | | | | (11 | ) | |
Allergan, Inc.
Put Strike $80.00
Expires 01/22/2005 | | | 6 | | | | (5 | ) | |
Amgen, Inc.
Put Strike $55.00
Expires 01/22/2005 | | | 30 | | | | (5 | ) | |
Andrx Corp.
Put Strike $30.00
Expires 01/22/2005 | | | 93 | | | | (78 | ) | |
Anthem, Inc.
Put Strike $90.00
Expires 01/22/2005 | | | 54 | | | | (55 | ) | |
Baxter International, Inc.
Put Strike $35.00
Expires 01/21/2006 | | | 56 | | | | (34 | ) | |
The notes to the financial statements are an integral part of this report.
Transamerica IDEX Mutual Funds
Annual Report 2004
7
TA IDEX T. Rowe Price Health Sciences
SCHEDULE OF INVESTMENTS (continued)
At October 31, 2004
(all amounts except share amounts in thousands)
| | | Contracts (d) | | Value | |
| Put Options (continued) | |
Biogen Idec, Inc.
Put Strike $55.00
Expires 01/22/2005 | | | 12 | | | $ | (4 | ) | |
Boston Scientific Corp.
Put Strike $45.00
Expires 01/22/2005 | | | 88 | | | | (86 | ) | |
Cardinal Health, Inc.
Put Strike $50.00
Expires 01/22/2005 | | | 43 | | | | (20 | ) | |
Caremark Rx, Inc.
Put Strike $40.00
Expires 01/22/2005 | | | 46 | | | | (46 | ) | |
Celgene Corp.
Put Strike $25.00
Expires 01/22/2005 | | | 56 | | | | (4 | ) | |
Celgene Corp.
Put Strike $22.50
Expires 01/22/2005 | | | 146 | | | | (5 | ) | |
Celgene Corp.
Put Strike $30.00
Expires 01/21/2006 | | | 68 | | | | (32 | ) | |
Cephalon, Inc.
Put Strike $50.00
Expires 01/22/2005 | | | 17 | | | | (7 | ) | |
Cephalon, Inc.
Put Strike $55.00
Expires 01/22/2005 | | | 15 | | | | (12 | ) | |
Community Health Systems, Inc.
Put Strike $30.00
Expires 03/19/2005 | | | 26 | | | | (10 | ) | |
CV Therapeutics, Inc.
Put Strike $15.00
Expires 01/21/2006 | | | 26 | | | | (8 | ) | |
Dade Behring Holdings, Inc.
Put Strike $60.00
Expires 02/19/2005 | | | 38 | | | | (24 | ) | |
Elan Corp.
Put Strike $25.00
Expires 01/22/2005 | | | 84 | | | | (26 | ) | |
Elan Corp.
Put Strike $25.00
Expires 01/21/2006 | | | 69 | | | | (36 | ) | |
Elan Corp.
Put Strike $30.00
Expires 01/21/2006 | | | 84 | | | | (67 | ) | |
Eyetech Pharmaceuticals, Inc.
Put Strike $40.00
Expires 12/18/2004 | | | 123 | | | | (37 | ) | |
| | | Contracts (d) | | Value | |
| Put Options (continued) | |
Eyetech Pharmaceuticals, Inc.
Put Strike $40.00
Expires 03/19/2005 | | | 59 | | | $ | (29 | ) | |
Forest Laboratories, Inc.
Put Strike $55.00
Expires 01/22/2005 | | | 51 | | | | (54 | ) | |
Genentech, Inc.
Put Strike $62.50
Expires 01/22/2005 | | | 21 | | | | (36 | ) | |
Gilead Sciences, Inc.
Put Strike $35.00
Expires 11/20/2004 | | | 76 | | | | (10 | ) | |
Gilead Sciences, Inc.
Put Strike $37.50
Expires 11/20/2004 | | | 24 | | | | (8 | ) | |
Guidant Corp.
Put Strike $55.00
Expires 01/22/2005 | | | 31 | | | | (2 | ) | |
Guidant Corp.
Put Strike $60.00
Expires 01/22/2005 | | | 61 | | | | (10 | ) | |
Guidant Corp.
Put Strike $70.00
Expires 01/22/2005 | | | 25 | | | | (15 | ) | |
Henry Schein, Inc.
Put Strike $60.00
Expires 01/21/2006 | | | 8 | | | | (4 | ) | |
Indevus Pharmaceuticals, Inc.
Put Strike $7.50
Expires 12/18/2004 | | | 44 | | | | (5 | ) | |
Invitrogen Corp.
Put Strike $50.00
Expires 01/22/2005 | | | 41 | | | | (4 | ) | |
Invitrogen Corp.
Put Strike $55.00
Expires 05/21/2005 | | | 15 | | | | (6 | ) | |
King Pharmaceuticals, Inc.
Put Strike $25.00
Expires 01/22/2005 | | | 15 | | | | (21 | ) | |
Martek Biosciences Corp.
Put Strike $60.00
Expires 12/18/2004 | | | 26 | | | | (34 | ) | |
Medicines Co.
Put Strike $30.00
Expires 04/16/2005 | | | 53 | | | | (30 | ) | |
Merck & Co., Inc.
Put Strike $30.00
Expires 01/21/2006 | | | 87 | | | | (29 | ) | |
The notes to the financial statements are an integral part of this report.
Transamerica IDEX Mutual Funds
Annual Report 2004
8
TA IDEX T. Rowe Price Health Sciences
SCHEDULE OF INVESTMENTS (continued)
At October 31, 2004
(all amounts except share amounts in thousands)
| | | Contracts (d) | | Value | |
| Put Options (continued) | |
MGI PHARMA, Inc.
Put Strike $32.50
Expires 01/22/2005 | | | 91 | | | $ | (57 | ) | |
Nektar Therapeutics
Put Strike $25.00
Expires 11/20/2004 | | | 33 | | | | (35 | ) | |
Neurocrine Biosciences, Inc.
Put Strike $60.00
Expires 11/20/2004 | | | 38 | | | | (51 | ) | |
Neurocrine Biosciences, Inc.
Put Strike $60.00
Expires 02/19/2005 | | | 45 | | | | (62 | ) | |
OSI Pharmaceuticals, Inc.
Put Strike $80.00
Expires 01/22/2005 | | | 49 | | | | (82 | ) | |
Sepracor, Inc.
Put Strike $55.00
Expires 01/22/2005 | | | 91 | | | | (88 | ) | |
Sepracor, Inc.
Put Strike $55.00
Expires 01/21/2006 | | | 46 | | | | (63 | ) | |
Serologicals Corp.
Put Strike $22.50
Expires 04/16/2005 | | | 4 | | | | (1 | ) | |
St. Jude Medical, Inc.
Put Strike $75.00
Expires 01/22/2005 | | | 34 | | | | (10 | ) | |
| | | Contracts (d) | | Value | |
| Put Options (continued) | | | |
Stryker Corp.
Put Strike $50.00
Expires 01/22/2005 | | | 35 | | | $ | (25 | ) | |
Stryker Corp.
Put Strike $50.00
Expires 03/19/2005 | | | 26 | | | | (19 | ) | |
Teva Pharmaceutical Industries, Ltd.
Put Strike $35.00
Expires 12/18/2004 | | | 26 | | | | (24 | ) | |
UnitedHealth Group, Inc.
Put Strike $65.00
Expires 01/22/2005 | | | 28 | | | | (3 | ) | |
UnitedHealth Group, Inc.
Put Strike $70.00
Expires 01/22/2005 | | | 16 | | | | (4) | | |
| Total Written Options (cost: $2,326) | | | | | | | (1,900 | ) | |
| SUMMARY: | | | |
| Investments, at value | | | 101.1 | % | | $ | 163,464 | | |
| Written options | | | (1.2 | )% | | | (1,900 | ) | |
| Other assets in excess of liabilities | | | 0.1 | % | | | 64 | | |
| Net assets | | | 100.0 | % | | $ | 161,628 | | |
NOTES TO SCHEDULE OF INVESTMENTS:
(a) No dividends were paid during the preceding twelve months.
(b) At October 31, 2004, all or a portion of this security is segregated with the custodian to cover margin requirements for open option contracts. The value of all securities segregated at October 31, 2004, is $26,727.
(c) Value is less than $1.
(d) Contract amounts are not in thousands.
DEFINITIONS:
144A 144A Securities are registered pursuant to rule 144A of the Securities Act of 1933. These securities are deemed to be liquid for purposes of compliance limitations on holdings of illiquid securities and may be resold as transactions exempt from registration normally to qualified institutional buyers. At October 31, 2004, these securities aggregated $957 or 0.6% of the net assets of the Fund.
ADR American Depositary Receipt
The notes to the financial statements are an integral part of this report.
Transamerica IDEX Mutual Funds
Annual Report 2004
9
TA IDEX T. Rowe Price Health Sciences
STATEMENT OF ASSETS AND LIABILITIES
At October 31, 2004
(all amounts except per share amounts in thousands)
| Assets: | | | |
| Investment securities, at value (cost: $161,125) | | $ | 163,464 | | |
| Cash | | | 257 | | |
| Receivables: | |
| Investment securities sold | | | 283 | | |
| Shares of beneficial interest sold | | | 259 | | |
| Interest | | | 2 | | |
| Dividends | | | 12 | | |
| Other | | | 2 | | |
| | | | 164,279 | | |
| Liabilities: | | | |
| Investment securities purchased | | | 480 | | |
| Accounts payable and accrued liabilities: | |
| Shares of beneficial interest redeemed | | | 8 | | |
| Management and advisory fees | | | 131 | | |
| Distribution fees | | | 50 | | |
| Transfer agent fees | | | 4 | | |
| Written options (premiums $2,326) | | | 1,900 | | |
| Other | | | 78 | | |
| | | | 2,651 | | |
| Net Assets | | $ | 161,628 | | |
| Net Assets Consist of: | | | |
Shares of beneficial interest, unlimited shares
authorized, no par value | | $ | 157,088 | | |
| Accumulated net investment income (loss) | | | – | | |
Undistributed net realized gain (loss) from
investment securities and written option contracts | | | 1,775 | | |
| Net unrealized appreciation (decreciation) on: | |
| Investment securities | | | 2,339 | | |
| Written option contracts | | | 426 | | |
| Net Assets | | $ | 161,628 | | |
| Net Assets by Class: | | | |
| Class A | | $ | 154,957 | | |
| Class B | | | 4,590 | | |
| Class C | | | 2,081 | | |
| Shares Outstanding: | | | |
| Class A | | | 14,301 | | |
| Class B | | | 431 | | |
| Class C | | | 196 | | |
| Net Asset Value Per Share: | | | |
| Class A | | $ | 10.84 | | |
| Class B | | | 10.66 | | |
| Class C | | | 10.63 | | |
| Maximum Offering Price Per Share (a): | | | |
| Class A | | $ | 11.47 | | |
(a) Includes the maximum selling commission (represented as a percentage of offering price) which is reduced on certain levels of sales as set forth in the Prospectus. Net asset value per share for Classes B and C shares represents offering price. The redemption price for Classes B and C shares equals net asset value less any applicable contingent deferred sales charge.
STATEMENT OF OPERATIONS
For the year ended October 31, 2004
(all amounts in thousands)
| Investment Income: | | | |
| Interest | | $ | 106 | | |
| Dividends | | | 348 | | |
| Less withholding taxes on foreign dividends | | | (5 | ) | |
| | | | 449 | | |
| Expenses: | | | |
| Management and advisory fees | | | 1,191 | | |
| Transfer agent fees: | |
| Class A | | | 25 | | |
| Class B | | | 2 | | |
| Class C | | | 1 | | |
| Class C2 | | | – | | |
| Class M | | | – | | |
| Printing and shareholder reports | | | 2 | | |
| Custody fees | | | 74 | | |
| Administration fees | | | 22 | | |
| Legal fees | | | 3 | | |
| Audit and accounting fees | | | 12 | | |
| Trustees fees | | | 6 | | |
| Registration fees: | |
| Class A | | | 57 | | |
| Class B | | | – | | |
| Class C | | | 13 | | |
| Class C2 | | | – | | |
| Class M | | | 2 | | |
| Other | | | 4 | | |
| Distribution and service fees: | |
| Class A | | | 395 | | |
| Class B | | | 43 | | |
| Class C | | | 10 | | |
| Class C2 | | | 6 | | |
| Class M | | | 4 | | |
| Total expenses | | | 1,872 | | |
| Less: | |
| Reimbursement of Class expenses | | | | | |
| Class C | | | (8 | ) | |
| Net expenses | | | 1,864 | | |
| Net Investment Income (Loss) | | | (1,415 | ) | |
| Net Realized Gain (Loss) from: | | | |
| Investment securities | | | 4,744 | | |
| Written option contracts | | | 2,166 | | |
| Foreign currency transactions | | | (21 | ) | |
| | | | 6,889 | | |
Net Increase (Decrease) in Unrealized Appreciation
(Depreciation) on: | | | |
| Investment securities | | | (1,005 | ) | |
| Written option contracts | | | 259 | | |
| | | | (746 | ) | |
Net Gain (Loss) on Investments, Written Option
Contracts and Foreign Currency Transactions | | | 6,143 | | |
Net Increase (Decrease) in Net Assets Resulting
from Operations | | $ | 4,728 | | |
The notes to the financial statements are an integral part of this report.
Transamerica IDEX Mutual Funds
Annual Report 2004
10
TA IDEX T. Rowe Price Health Sciences
STATEMENTS OF CHANGES IN NET ASSETS
For the years ended
(all amounts in thousands)
| | | October 31,
2004 | | October 31,
2003 | |
| Increase (Decrease) In Net Assets From: | |
| Operations: | |
| Net investment income (loss) | | $ | (1,415 | ) | | $ | (417 | ) | |
Net realized gain (loss) from
investment securities,
written option contracts and
foreign currency transactions | | | 6,889 | | | | 657 | | |
Net unrealized appreciation
(depreciation) on investment
securities and written option
contracts | | | (746 | ) | | | 3,723 | | |
| | | | 4,728 | | | | 3,963 | | |
| Distributions to Shareholders: | |
| From net realized gains: | |
| Class A | | | (3,559 | ) | | | – | | |
| Class B | | | (143 | ) | | | – | | |
| Class C | | | (23 | ) | | | – | | |
| Class C2 | | | (30 | ) | | | – | | |
| Class M | | | (15 | ) | | | – | | |
| | | | (3,770 | ) | | | – | | |
| Capital Share Transactions: | |
| Proceeds from shares sold: | |
| Class A | | | 93,348 | | | | 52,189 | | |
| Class B | | | 2,436 | | | | 2,260 | | |
| Class C | | | 849 | | | | 213 | | |
| Class C2 | | | 326 | | | | 768 | | |
| Class M | | | 146 | | | | 158 | | |
| | | | 97,105 | | | | 55,588 | | |
Dividends and distributions
reinvested: | |
| Class A | | | 3,555 | | | | – | | |
| Class B | | | 140 | | | | – | | |
| Class C | | | 14 | | | | – | | |
| Class C2 | | | 23 | | | | – | | |
| Class M | | | 15 | | | | – | | |
| | | | 3,747 | | | | – | | |
| Cost of shares redeemed: | |
| Class A | | | (1,910 | ) | | | (410 | ) | |
| Class B | | | (1,004 | ) | | | (344 | ) | |
| Class C | | | (320 | ) | | | (19 | ) | |
| Class C2 | | | (413 | ) | | | (278 | ) | |
| Class M | | | (64 | ) | | | (18 | ) | |
| | | | (3,711 | ) | | | (1,069 | ) | |
| Class level exchanges: | |
| Class C | | | 1,419 | | | | – | | |
| Class C2 | | | (942 | ) | | | – | | |
| Class M | | | (477 | ) | | | – | | |
| | | | – | | | | – | | |
| Automatic conversions: | |
| Class A | | | 6 | | | | – | | |
| Class B | | | (6 | ) | | | – | | |
| | | | – | | | | – | | |
| | | | 97,141 | | | | 54,519 | | |
| Net increase (decrease) in net assets | | | 98,099 | | | | 58,482 | | |
| | | October 31,
2004 | | October 31,
2003 | |
| Net Assets: | | | |
| Beginning of year | | $ | 63,529 | | | $ | 5,047 | | |
| End of year | | $ | 161,628 | | | $ | 63,529 | | |
Accumulated Net Investment Income
(Loss) | | $ | – | | | $ | (1 | ) | |
| Share Activity: | | | |
| Shares issued: | |
| Class A | | | 8,337 | | | | 5,413 | | |
| Class B | | | 218 | | | | 239 | | |
| Class C | | | 77 | | | | 22 | | |
| Class C2 | | | 30 | | | | 82 | | |
| Class M | | | 13 | | | | 16 | | |
| | | | 8,675 | | | | 5,772 | | |
Shares issued–reinvested from
distributions: | |
| Class A | | | 308 | | | | – | | |
| Class B | | | 13 | | | | – | | |
| Class C | | | 1 | | | | – | | |
| Class C2 | | | 2 | | | | – | | |
| Class M | | | 1 | | | | – | | |
| | | | 325 | | | | – | | |
| Shares redeemed: | |
| Class A | | | (175 | ) | | | (42 | ) | |
| Class B | | | (93 | ) | | | (37 | ) | |
| Class C | | | (30 | ) | | | (2 | ) | |
| Class C2 | | | (38 | ) | | | (29 | ) | |
| Class M | | | (6 | ) | | | (1 | ) | |
| | | | (342 | ) | | | (111 | ) | |
| Class level exchanges: | |
| Class C | | | 128 | | | | – | | |
| Class C2 | | | (84 | ) | | | – | | |
| Class M | | | (44 | ) | | | – | | |
| | | | – | | | | – | | |
| Automatic conversions: | |
| Class A | | | 1 | | | | – | | |
| Class B | | | (1 | ) | | | – | | |
| | | | – | | | | – | | |
Net increase (decrease) in shares
outstanding: | |
| Class A | | | 8,471 | | | | 5,371 | | |
| Class B | | | 137 | | | | 202 | | |
| Class C | | | 176 | | | | 20 | | |
| Class C2 | | | (90 | ) | | | 53 | | |
| Class M | | | (36 | ) | | | 15 | | |
| | | | 8,658 | | | | 5,661 | | |
The notes to the financial statements are an integral part of this report.
Transamerica IDEX Mutual Funds
Annual Report 2004
11
TA IDEX T. Rowe Price Health Sciences
FINANCIAL HIGHLIGHTS
| | | | | For a share of beneficial interest outstanding throughout each period | |
| | | | | Net Asset | | Investment Operations | | Distributions | | Net Asset | |
| | | For the
Period
Ended (d)(g) | | Value,
Beginning
of Period | | Net
Investment
Income (Loss) | | Net Realized
and Unrealized
Gain (Loss) | | Total
Operations | | From Net
Investment
Income | | From Net
Realized
Gains | | Total
Distributions | | Value,
End
of Period | |
| Class A | | 10/31/2004 | | $ | 10.14 | | | $ | (0.13 | ) | | $ | 1.18 | | | $ | 1.05 | | | $ | – | | | $ | (0.35 | ) | | $ | (0.35 | ) | | $ | 10.84 | | |
| | | 10/31/2003 | | | 8.28 | | | | (0.16 | ) | | | 2.02 | | | | 1.86 | | | | – | | | | – | | | | – | | | | 10.14 | | |
| | | 10/31/2002 | | | 10.00 | | | | (0.08 | ) | | | (1.64 | ) | | | (1.72 | ) | | | – | | | | – | | | | – | | | | 8.28 | | |
| Class B | | 10/31/2004 | | | 10.03 | | | | (0.17 | ) | | | 1.15 | | | | 0.98 | | | | – | | | | (0.35 | ) | | | (0.35 | ) | | | 10.66 | | |
| | | 10/31/2003 | | | 8.24 | | | | (0.21 | ) | | | 2.00 | | | | 1.79 | | | | – | | | | – | | | | – | | | | 10.03 | | |
| | | 10/31/2002 | | | 10.00 | | | | (0.11 | ) | | | (1.65 | ) | | | (1.76 | ) | | | – | | | | – | | | | – | | | | 8.24 | | |
| Class C | | 10/31/2004 | | | 10.03 | | | | (0.24 | ) | | | 1.19 | | | | 0.95 | | | | – | | | | (0.35 | ) | | | (0.35 | ) | | | 10.63 | | |
| | | 10/31/2003 | | | 8.10 | | | | (0.22 | ) | | | 2.15 | | | | 1.93 | | | | – | | | | – | | | | – | | | | 10.03 | | |
| | | | | | | Ratios/Supplemental Data | |
| | | For the
Period | | Total | | Net Assets,
End of
Period | | Ratio of Expenses
to Average
Net Assets (a) | | Net Investment
Income (Loss)
to Average | | Portfolio
Turnover | |
| | | Ended (g) | | Return (c) | | (000's) | | Net (e) | | Total (f) | | Net Assets (a) | | Rate (b) | |
| Class A | | 10/31/2004 | | | 10.19 | % | | $ | 154,957 | | | | 1.53 | % | | | 1.53 | % | | | (1.15 | )% | | | 35 | % | |
| | | 10/31/2003 | | | 22.46 | | | | 59,115 | | | | 1.95 | | | | 2.19 | | | | (1.61 | ) | | | 30 | | |
| | | 10/31/2002 | | | (17.20 | ) | | | 3,804 | | | | 1.95 | | | | 8.76 | | | | (1.51 | ) | | | 43 | | |
| Class B | | 10/31/2004 | | | 9.59 | | | | 4,590 | | | | 2.09 | | | | 2.09 | | | | (1.58 | ) | | | 35 | | |
| | | 10/31/2003 | | | 21.72 | | | | 2,952 | | | | 2.60 | | | | 2.84 | | | | (2.26 | ) | | | 30 | | |
| | | 10/31/2002 | | | (17.60 | ) | | | 758 | | | | 2.60 | | | | 9.41 | | | | (2.16 | ) | | | 43 | | |
| Class C | | 10/31/2004 | | | 9.28 | | | | 2,081 | | | | 2.60 | | | | 3.41 | | | | (1.61 | ) | | | 35 | | |
| | | 10/31/2003 | | | 23.83 | | | | 201 | | | | 2.60 | | | | 2.84 | | | | (2.26 | ) | | | 30 | | |
NOTES TO FINANCIAL HIGHLIGHTS
(a) Annualized.
(b) Not annualized for periods of less than one year.
(c) Total Return has been calculated for the applicable period without deduction of a sales load, if any, on an initial purchase. Periods of less than one year are not annualized.
(d) Per share information is calculated based on average shares outstanding.
(e) Ratio of Net Expenses to Average Net Assets is net of fee waivers and reimbursements by the investment adviser and includes the recovery of waived expenses, if any (see note 2).
(f) Ratio of Total Expenses to Average Net Assets includes all expenses before fee waivers and reimbursements by the investment adviser.
(g) TA IDEX T. Rowe Price Health Sciences ("the Fund") commenced operations on March 1, 2002. The inception date for the Fund's offering of share Class L was November 11, 2002. Class L was renamed Class C on March 1, 2004 (see note 1).
The notes to the financial statements are an integral part of this report.
Transamerica IDEX Mutual Funds
Annual Report 2004
12
TA IDEX T. Rowe Price Health Sciences
NOTES TO FINANCIAL STATEMENTS
At October 31, 2004
(all amounts in thousands)
NOTE 1. ORGANIZATION AND SIGNIFICANT ACCOUNTING POLICIES
Transamerica IDEX Mutual Funds, formerly IDEX Mutual Funds, is a Massachusetts business trust registered under the Investment Company Act of 1940, as amended (the "1940 Act"), as an open-end management investment company. TA IDEX T. Rowe Price Health Sciences ("the Fund"), part of Transamerica IDEX Mutual Funds, began operations on March 1, 2002. The Fund is "non diversified" under the 1940 Act.
On March 1, 2004, the Fund changed its name from IDEX T. Rowe Price Health Sciences to TA IDEX T. Rowe Price Health Sciences.
In the normal course of business, the Fund enters into contracts that contain a variety of representations and warranties, which provide general indemnifications. The Fund's maximum exposure under these arrangements is unknown, as this would involve future claims that may be made against the Fund and/or its affiliates that have not yet occurred. However, based on experience, the Fund expects the risk of loss to be remote.
See the Prospectus and Statement of Additional Information for a description of the Fund's investment objective.
In preparing the Fund's financial statements in accordance with accounting principles generally accepted in the United States of America ("GAAP"), estimates or assumptions (which could differ from actual results) may be used that affect reported amounts and disclosures. The following policies were consistently followed by the Fund, in accordance with GAAP.
Multiple class operations and expenses: The Fund currently offers three classes of shares, each with a public offering price that reflects different sales charges, if any, and expense levels. All shares designated as Class C shares prior to March 1, 2004, were renamed as Class C2 shares on that date. All shares designated as Class L shares prior to March 1, 2004, were renamed as Class C shares with different sales charges than the previous Class L shares. On June 15, 2004, Class C2 shares merged into Class C. On September 24, 2004, Class M shares merged into Class C. Class B shares will convert to Class A shares eight years after purchase. Income, non-class specific expenses and realized and unrealized gains and losses, are allocated daily to each class, based upon the value of shares outstanding metho d as permitted under Rule 18f-3 of the 1940 Act. Each class bears its own specific expenses as well as a portion of general, common expenses.
Class I shares of the Transamerica IDEX Mutual Funds were offered for investment to the strategic asset allocation funds of AEGON/Transamerica Series Fund, Inc. (ATSF): ATSF Asset Allocation–Conservative Portfolio, ATSF Asset Allocation–Growth Portfolio, ATSF Asset Allocation–Moderate Growth Portfolio and ATSF Asset Allocation–Moderate Portfolio on November 8, 2004.
Pricing of shares: The Fund prices its shares on the basis of the net asset value of each class of shares of the Fund, which is determined as of the close of the New York Stock Exchange ("NYSE") (generally 4:00 p.m. Eastern Time) on each day on which the NYSE is open for trading (other than a day on which there are insufficient changes in the value of the Fund's portfolio securities to materially affect the Fund's net asset value or a day on which no shares are tendered for redemption and no order to purchase any shares is received).
Security valuations: Fund investments traded on an exchange are valued at the closing price on the day of valuation on the exchange where the security is principally traded. With respect to securities traded on NASDAQ NMS, such closing price may be the last reported sales price or the NASDAQ Official Closing Price.
Securities traded in the over-the-counter market and listed securities for which no sale was reported on that date are valued at the last quoted bid price.
Debt securities are valued by independent pricing services; however, those that mature in sixty days or less are valued at amortized cost, which approximates market.
Other securities for which quotations are not readily available are valued at fair market value as determined in good faith using guidelines adopted by the Board of Trustees of the Fund, under the supervision of the Fund's Valuation Committee.
Cash: The Fund may leave cash overnight in its cash account with the custodian, Investors Bank & Trust Company ("IBT"). IBT has been contracted on behalf of the Fund to invest the excess cash into a savings account, which at October 31, 2004, was paying an interest rate of 1.30%.
Throughout the year, the Fund may have a cash overdraft balance. A fee is incurred on this overdraft, calculated by multiplying the overdraft by a rate based on the federal funds rate. This fee is included in Custody fees in the Statement of Operations.
Commission Recapture: The sub-adviser, to the extent consistent with the best execution and usual commission rate policies and practices, may place security transactions of the Fund with broker/dealers with which Transamerica IDEX Mutual Funds has established a Commission Recapture Program. A Commission Recapture Program is any arrangement under which a broker/dealer applies a portion of the commissions received by such broker/dealer on the security transactions to the Fund. In no event will commissions paid by the Fund be used to pay expenses that would otherwise be borne by any other funds within Transameric a IDEX Mutual Funds, or by any other party.
Recaptured commissions during the year ended October 31, 2004, of $30 are included in net realized gains in the Statement of Operations.
Transamerica IDEX Mutual Funds
Annual Report 2004
13
TA IDEX T. Rowe Price Health Sciences
NOTES TO FINANCIAL STATEMENTS (continued)
At October 31, 2004
(all amounts in thousands)
NOTE 1.–(continued)
Security transactions and investment income: Security transactions are recorded on the trade date. Security gains and losses are calculated on the specific identification basis. Dividend income is recorded on the ex-dividend date or, in the case of foreign securities, as soon as the Fund is informed of the ex-dividend date. Interest income, including accretion of discounts and amortization of premiums, is recorded on the accrual basis commencing on the settlement date.
Option contracts: The Fund may enter into options contracts to manage exposure to market fluctuations. Options are valued at the average of the bid and ask ("Mean Quote") established each day at the close of the board of trade or exchange on which they are traded. The primary risks associated with options are imperfect correlation between the change in value of the securities held and the prices of the options contracts; the possibility of an illiquid market and inability of the counterparty to meet the contracts terms. When the Fund writes a covered call or put option, an amount equal to the premium received by the Fund is included in the Fund's Statement of Assets and Liabilities as an asset and as an equivalent liability. The amount is subsequently marked-to-market to reflect the current value of th e option written.
The underlying face amounts of open option contracts at October 31, 2004, are listed in the Schedule of Investments.
Transactions in written call and put options were as follows:
| | | Premium | | Contracts* | |
| Beginning Balance October 31, 2003 | | $ | 778 | | | | 2,419 | | |
| Sales | | | 7,795 | | | | 23,335 | | |
| Closing Buys | | | (5,844 | ) | | | (18,599 | ) | |
| Expirations | | | (196 | ) | | | (1,102 | ) | |
| Exercised | | | (207 | ) | | | (484 | ) | |
| Balance at October 31, 2004 | | $ | 2,326 | | | | 5,569 | | |
* Contracts not in thousands
Foreign currency denominated investments: The accounting records of the Fund are maintained in U.S. dollars. Securities and other assets and liabilities denominated in foreign currencies are translated into U.S. dollars at the closing exchange rate each day. The cost of foreign securities is translated at the exchange rate in effect when the investment was acquired. The Fund combines fluctuations from currency exchange rates and fluctuations in value when computing net realized and unrealized gains or losses from investments.
Net foreign currency gains and losses resulting from changes in exchange rates include: 1) foreign currency fluctuations between trade date and settlement date of investment security transactions; 2) gains and losses on forward foreign currency contracts; and 3) the difference between the receivable amounts of interest and dividends recorded in the accounting records in U.S. dollars and the amounts actually received.
Foreign currency denominated assets may involve risks not typically associated with domestic transactions, including unanticipated movements in exchange currency rates, the degree of government supervision and regulation of security markets, and the possibility of political or economic instability.
Forward foreign currency contracts: The Fund may enter into forward foreign currency contracts to hedge against exchange rate risk arising from investments in securities denominated in foreign currencies. Contracts are valued at the contractual forward rate and are marked to market daily, with the change in value recorded as an unrealized gain or loss. When the contracts are closed a realized gain or loss is incurred. Risks may arise from changes in market value of the underlying currencies and from the possible inability of counterparties to meet the terms of their contracts.
Open forward currency contracts at October 31, 2004, are listed in the Schedule of Investments.
Account maintenance fees: If the shareholder account balance falls below $1 by either shareholder action or as a result of market action, a $25 (not in thousands) fee is assessed every year until the balance reaches $1. The fee is assessed by redeeming shares in the shareholder's account.
No fee will be charged under the following conditions:
• accounts opened within the preceding 24 months
• accounts with an active monthly Automatic Investment Plan ($50 (not in thousands) minimum per fund)
• accounts owned by an individual which, when combined by social security number, have a balance of $5 or more
• accounts owned by individuals in the same household (by address) that have a combined balance of $5 or more
• UTMA/UGMA accounts
• Fiduciary accounts
• B-share accounts whose shares have started to convert to A-shares accounts (as long as combined value of both accounts is at least $1)
For the year ended October 31, 2004, there were no fees. These fees are included in Paid in Capital in the Statement of Assets and Liabilities.
Redemption fees: A short-term trading redemption fee may be assessed on any fund shares in a fund account that are sold during the first five (5) New York Stock Exchange trading days following their purchase date. This redemption fee will equal 2% of the amount redeemed and shares held the
Transamerica IDEX Mutual Funds
Annual Report 2004
14
TA IDEX T. Rowe Price Health Sciences
NOTES TO FINANCIAL STATEMENTS (continued)
At October 31, 2004
(all amounts in thousands)
NOTE 1.–(continued)
longest will be treated as being redeemed first and shares held the shortest as being redeemed last. For the year ended October 31, 2004, the Fund received no redemption fees.
Dividend distributions: Distributions to shareholders are recorded on the ex-dividend date and are determined in accordance with Federal income tax regulations which may differ from GAAP.
NOTE 2. RELATED PARTY TRANSACTIONS
AEGON/Transamerica Fund Advisers, Inc. ("ATFA") is the Fund's investment adviser. AEGON/Transamerica Fund Services, Inc. ("ATFS") is the Fund's administrator. AFSG Securities Corp. ("AFSG") is the Fund's distributor/principal underwriter. AEGON/Transamerica Investor Services, Inc. ("ATIS") is the Fund's transfer agent. ATIS and AFSG are 100% owned by AUSA Holding Company ("AUSA"). ATFA is a directly owned subsidiary of Western Reserve Life Assurance Co. of Ohio (78%) ("WRL") and AUSA (22%). ATFS is a wholly owned subsidiary of WRL. AUSA and WRL are wholly owned indirect subsidiaries of AEGON NV, a Netherlands corporation.
The following schedule reflects the percentage of fund assets owned by affiliated mutual funds (i.e., through the assets allocation funds):
| | | Net
Assets | | % of
Net Assets | |
TA IDEX Asset Allocation–
Conservative Portfolio | | $ | 14,931 | | | | 9 | % | |
TA IDEX Asset Allocation–
Growth Portfolio | | | 32,495 | | | | 20 | % | |
TA IDEX Asset Allocation–
Moderate Growth Portfolio | | | 58,927 | | | | 36 | % | |
TA IDEX Asset Allocation–
Moderate Portfolio | | | 45,165 | | | | 28 | % | |
| Total | | $ | 151,518 | | | | 93 | % | |
Investment advisory fee: The Fund pays management fees to ATFA based on average daily net assets ("ANA") at the following breakpoints:
1.00% of the first $500 million of ANA
0.95% of ANA over $500 million
ATFA has contractually agreed to waive its advisory fee and will reimburse the Fund to the extent that operating expenses, excluding 12b-1 fees, exceed the following stated annual limit:
1.60% Expense Limit
If total fund expenses fall below the annual expense limitation agreement agreed to by the adviser within the succeeding three years, the Fund may be required to pay that adviser a portion or all of the waived advisory fees.
If total class expenses fall below the annual expense limitation agreement agreed to by the adviser within the succeeding three years, the Fund may be required to pay that adviser a portion or all of the reimbursed class expenses.
| | | Reimbursement
of Class Expenses | | Available for
Recapture Through | |
| Fiscal Year 2004-Class C | | | 8 | | | | 10/31/07 | | |
There were no amounts recaptured during the fiscal year ended October 31, 2004.
The sub-adviser, T. Rowe Price, has agreed to a pricing discount based on the aggregate assets that they manage in the Transamerica IDEX Mutual Funds. The amount of the discount received by the Fund at October 31, 2004 was $10.
Distribution and service fees: The Fund has a 12b-1 distribution plan under the 1940 Act pursuant to which an annual fee, based on average daily net assets, is paid to the distributor for various disbursements such as broker-dealer account servicing fees and other promotional expenses of the Fund. The Fund is authorized under the 12b-1 plan to pay fees on each class up to the following limits:
| Class A | | | 0.35 | % | |
| Class B | | | 1.00 | % | |
| Class C | | | 1.00 | % | |
| Class C2 | | | 1.00 | % | |
| Class M | | | 0.90 | % | |
Class C2 and Class M merged into Class C on June 15, 2004 and September 24, 2004, respectively.
In the case the Fund or a class of shares of the Fund is closed to new investors or investments, the Fund is authorized to pay 12b-1 fees for past sales and distribution efforts and present and past investor services.
Underwriter commissions relate to front-end sales charges imposed for Class A and M shares and contingent deferred sales charges from Classes B, C, M and certain A share redemptions. For the year ended October 31, 2004, the underwriter commissions were as follows:
| Received by Underwriter | | $ | 223 | | |
| Retained by Underwriter | | | 7 | | |
| Contingent Deferred Sales Charge | | | 12 | | |
Administrative services: The Fund has entered into an agreement with ATFS for financial and legal fund administration services, which includes such items as compliance, expenses, financial statements and other
Transamerica IDEX Mutual Funds
Annual Report 2004
15
TA IDEX T. Rowe Price Health Sciences
NOTES TO FINANCIAL STATEMENTS (continued)
At October 31, 2004
(all amounts in thousands)
NOTE 2.–(continued)
reporting, distributions, tax returns, prospectus preparation, board of trustees meeting support and other legal matters. The Fund pays ATFS an annual fee of 0.015% of average net assets. The Legal fees on the Statement of Operations are for fees paid to external legal counsel.
The Fund paid ATFS $22 for the year ended October 31, 2004.
Transfer agent fees: The Fund pays ATIS an annual per-account charge of $20 (not in thousands) for each open account and $1.63 (not in thousands) for each closed account. There is no new account charge. The transfer agent fees on the Statement of Operations are made up of fees paid to ATIS and costs associated with shareholder statements. The Fund paid ATIS $28 for the year ended October 31, 2004.
Deferred compensation plan: Each eligible Fund Trustee may elect participation in the Deferred Compensation Plan ("the Plan"). Under the Plan, such Trustees may defer payment of a percentage of their total fees earned as a Fund Trustee. These deferred amounts may be invested in any Transamerica IDEX Mutual Fund. At October 31, 2004, the value of invested plan amount was $2. Invested plan amounts and the total liability for deferred compensation to the Trustees under the Plan at October 31, 2004, are included in the accompanying Statement of Assets and Liabilities.
NOTE 3. INVESTMENT TRANSACTIONS
The cost of securities purchased and proceeds from securities sold (excluding short-term securities) for the year ended October 31, 2004, were as follows:
| Purchases of securities: | | | |
| Long-Term excluding U.S. Government | | $ | 125,640 | | |
| U.S. Government | | | – | | |
| Proceeds from maturities and sales of securities: | | | |
| Long-Term excluding U.S. Government | | | 38,755 | | |
| U.S. Government | | | – | | |
NOTE 4. FEDERAL INCOME TAX MATTERS
The Fund has not made any provision for federal income or excise taxes due to its policy to distribute all of its taxable income and capital gains to its shareholders and otherwise qualify as a regulated investment company under the Internal Revenue Code. Income and capital gain distributions are determined in accordance with income tax regulations, which may differ from GAAP. These differences are primarily due to differing treatment for items including, but not limited to, wash sales, foreign currency transactions, net operating losses and straddles.
Reclassifications between Undistributed net investment income (loss), Undistributed net realized capital gains (loss) and Shares of beneficial interest are made to reflect income and gains available for distribution under federal tax regulations. Results of operations and net assets are not effected by these reclassifications. These reclassifications are as follows:
Shares of beneficial interest, unlimited
shares authorized | | $ | (1 | ) | |
| Undistributed net investment income (loss) | | | 1,416 | | |
Accumulated net realized gain (loss) from
investment securities and futures contracts | | | (1,415 | ) | |
The tax character of distributions paid may differ from the character of distributions shown in the Statements of Changes in Net Assets due to short-term gains being treated as ordinary income for tax purposes. The tax character of distributions paid during 2003 and 2004 was as follows:
2003 Distributions paid from:
Ordinary Income | | $ | – | | |
| Long-term capital gain | | | – | | |
2004 Distributions paid from:
Ordinary Income | | | 2,666 | | |
| Long-term capital gain | | | 1,104 | | |
The tax basis components of distributable earnings as of October 31, 2004, are as follows:
| Undistributed Ordinary Income | | $ | 947 | | |
| Undistributed Long-term Capital Gains | | $ | 1,522 | | |
| Capital Loss Carryforward | | $ | – | | |
| Net Unrealized Appreciation (Depreciation) | | $ | 2,363 | * | |
* Amount includes unrealized gain/loss from derivative instruments and deferred compensation.
The aggregate cost of investments and composition of unrealized appreciation (depreciation) for federal income tax purposes as of October 31, 2004, are as follows:
| Federal Tax Cost Basis | | $ | 161,528 | | |
| Unrealized Appreciation | | $ | 10,681 | | |
| Unrealized (Depreciation) | | | (8,745 | ) | |
| Net Unrealized Appreciation (Depreciation) | | $ | 1,936 | | |
NOTE 5. OTHER MATTERS
Transamerica IDEX Mutual Funds ("TA IDEX"), and certain of its affiliated entities, have received requests for information from the Staff of the Securities and Exchange Commission in connection with market timing and late trading within the funds. TA IDEX and the affiliated entities have voluntarily cooperated in the investigation and have been providing the information as requested.
Transamerica IDEX Mutual Funds
Annual Report 2004
16
Report of Independent Registered Certified Public Accounting Firm
To the Board of Trustees and Shareholders of
TA IDEX T. Rowe Price Health Sciences
In our opinion, the accompanying statement of assets and liabilities, including the schedule of investments, and the related statements of operations and of changes in net assets and the financial highlights present fairly, in all material respects, the financial position of TA IDEX T. Rowe Price Health Sciences (the "Fund") (one of the portfolios constituting the Transamerica IDEX Mutual Funds) at October 31, 2004, the results of its operations for the year then ended, the changes in its net assets for each of the two years in the period then ended and the financial highlights for each of the periods indicated, in conformity with accounting principles generally accepted in the United States of America. These financial statements and financial highlights (hereafter referred to as "financial statements") are the responsibility of the Fund's management; our responsibility is to express an opini on on these financial statements based on our audits. We conducted our audits of these financial statements in accordance with the standards of the Public Company Accounting Oversight Board (United States). Those standards require that we plan and perform the audit to obtain reasonable assurance about whether the financial statements are free of material misstatement. An audit includes examining, on a test basis, evidence supporting the amounts and disclosures in the financial statements, assessing the accounting principles used and significant estimates made by management, and evaluating the overall financial statement presentation. We believe that our audits, which included confirmation of securities at October 31, 2004 by correspondence with the custodian and brokers, provide a reasonable basis for our opinion.

PricewaterhouseCoopers LLP
Tampa, Florida
December 28, 2004
Transamerica IDEX Mutual Funds
Annual Report 2004
17
TA IDEX T. Rowe Price Health Sciences
SUPPLEMENTAL INFORMATION (unaudited)
TAX INFORMATION
For tax purposes, the Fund has made a Long-Term Capital Gain Designation of $1,104 per share for the year ended October 31, 2004.
For dividends paid during the year ended October 31, 2004, the Fund designates qualified dividend income to the maximum extent allowable.
The information and distributions reported herein may differ from the information and distributions taxable to the shareholders for the calendar year ending December 31, 2004. Complete information will be computed and reported in conjunction with your 2004 Form 1099-DIV.
RESULTS OF SHAREHOLDER PROXY
At a special meeting of Class M shareholders of each series of Transamerica IDEX (except TA IDEX Federated Tax Exempt and TA IDEX Protected Principal Stock) held on September 2, 2004, the results of the Proposal were as follows:
Proposal 1: Approval of a conversion of Class M shares into Class C shares of the Funds, which will result in bearing the distribution and service fees payable under the 12b-1 Plan of Distribution for the Class C shares of the Funds.
| For | | Against | | Abstentions/Broker Non-Votes | |
| | 92.00 | % | | | 0.15 | % | | | 7.85 | % | |
Transamerica IDEX Mutual Funds
Annual Report 2004
18
TA IDEX T. Rowe Price Small Cap
MARKET ENVIRONMENT
U.S. stocks produced moderate gains in the twelve month period ended October 31, 2004. In the early months of the reporting period, major equity indexes climbed to two year highs thanks to robust corporate earnings and economic growth and the Federal Reserve Board's ("Fed") highly accommodative monetary policy. As 2004 progressed, equities surrendered some of their gains amid surging oil prices, a deceleration of economic and corporate profit growth, protracted uncertainty prior to the November elections, and rising short-term interest rates. From late June through the end of September, the Fed raised the federal funds target rate from 1.00% to 1.75% in three quarter-point steps.
Small-cap shares fared better than their larger counterparts in the last twelve months: the Russell 2000 Index ("Russell 2000") returned 11.73% versus 9.41% for the Standard and Poor's 500 Composite Stock Index. However, as measured by various Russell indexes, growth stocks lagged their value counterparts significantly across all market capitalizations. In the small-cap growth universe, stocks of energy companies performed best, but financials and health care stocks also produced gains. Information technology ("IT") shares fared worst, led by semiconductor-related stocks.
PERFORMANCE
For the year ended October 31, 2004, TA IDEX T. Rowe Price Small Cap, Class A returned 2.17%. By comparison its benchmark, the Russell 2000, returned 11.73%.
STRATEGY REVIEW
Stock selection in various sectors hurt the portfolio's performance relative to the Russell 2000.
For example, the portfolio's gains were limited by weakness in Frontier Airlines, Inc. ("Frontier"), educational-services companies Corinthian Colleges, Inc. ("Corinthian") and DeVry Inc. in the industrials and business services sector. Stock selection in the consumer discretionary sector, such as owning Cost Plus, Inc. and Christopher & Banks Corporation and avoiding Urban Outfitters, Inc., also detracted f rom our results. In addition, overweighting Taro Pharmaceutical Industries Ltd. ("Taro"), Accredo Health, Incorporated, and Omnicare, Inc. in the health care sector was disadvantageous, but overweighting Noven Pharmaceuticals, Inc. and Coventry Health Care, Inc. was favorable. Two other positive factors were a modest overweighting of the energy sector and good stock selection in the IT sector, such as Zebra Technologies Corporation ("Zebra"), Plantronics, Inc., and Iron Mountain Incorporated.
We maintained a broadly diversified portfolio of small-cap growth stocks over the last twelve months. At the end of October, the portfolio's assets were spread across approximately 294 securities in multiple industries, and no individual holding represented more than 1% of portfolio assets. Casting such a wide net is a key tool for risk management, as it can reduce the potential negative impact that any given stock could have on the entire portfolio. In addition, such broad diversification provides greater opportunities than more concentrated portfolios to have some exposure to the stocks and sectors that perform best.
Our sector allocations, which are usually not dramatically different from those of broad small-cap growth benchmarks and portfolios, did not change much over the last year. The energy sector contributed the most to the portfolio's absolute performance during our reporting period. In fact, the underlying energy equipment and services industry was the top performing industry represented in the portfolio. Although we are pleased with the rally in energy stocks and believe that oil prices may stay high for some time, we have trimmed our exposure to the sector in recent months to keep our small overweight from growing larger. In contrast, the IT sector detracted the most from our results on an absolute basis. The semiconductor and semiconductor equipment industry was the worst-performing industry represented in the portfolio.
Some of our largest individual contributors to portfolio performance in the last twelve month were Zebra, Flir Systems, Inc., and UTI Worldwide, Inc. Our five largest detractors were Omnivision Technologies, Inc., Taro, Maxtor Corporation, Corinthian, and Frontier.
Paul W. Wojcik, CFA
Fund Manager
T. Rowe Price Associates, Inc.
Transamerica IDEX Mutual Funds
Annual Report 2004
1
TA IDEX T. Rowe Price Small Cap
Comparison of change in value of $10,000 investment in Class A shares and its comparative index.
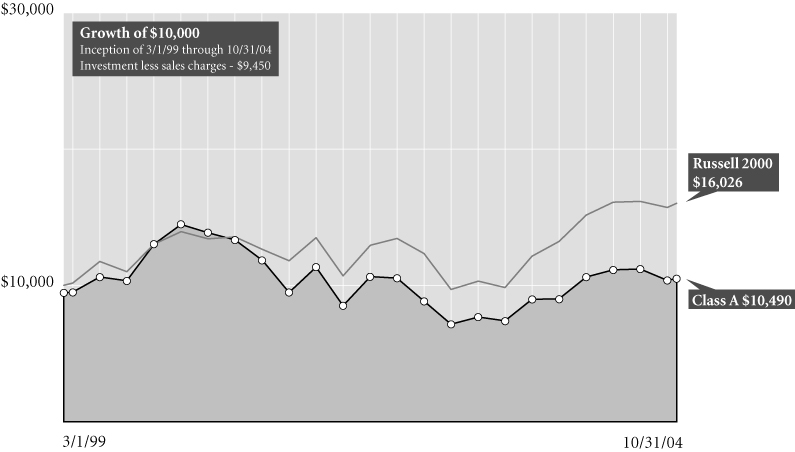
Average Annual Total Return for Periods Ended 10/31/04
| | | 1 year | | 5 years | | From
Inception | | Inception
Date | |
| Class A (NAV) | | | 2.17 | % | | | 0.15 | % | | | 1.85 | % | | 3/1/99 | |
| Class A (POP) | | | (3.45 | %) | | | (0.97 | %) | | | 0.84 | % | | 3/1/99 | |
| Russell 20001 | | | 11.73 | % | | | 7.74 | % | | | 8.67 | % | | 3/1/99 | |
| Class B (NAV) | | | 1.56 | % | | | (0.52 | %) | | | 1.18 | % | | 3/1/99 | |
| Class B (POP) | | | (3.44 | %) | | | (0.71 | %) | | | 1.18 | % | | 3/1/99 | |
| Class C (NAV) | | | 1.32 | % | | | – | | | | 17.95 | % | | 11/11/02 | |
| Class C (POP) | | | 0.32 | % | | | – | | | | 17.95 | % | | 11/11/02 | |
NOTES
1 The Russell 2000 (Russell 2000) Index is an unmanaged index used as a general measure of market performance. Calculations assume dividends and capital gains are reinvested and do not include any managerial expenses. From inception calculation is based on life of Class A shares. Source: Standard & Poor's Micropal®© Micropal, Inc. 2004 – 1-800-596-5323 – http://www.micropal.com.
The performance data presented represents past performance, future results may vary. Performance data does not reflect the deduction of taxes that would be paid on fund distributions or the redemption of fund shares. Investment return and principal value will fluctuate so that an investor's shares, when redeemed, may be worth more or less than their original cost. Current performance may be lower or higher than performance quoted.
Public Offering Price (POP) returns include the reinvestment of dividends and capital gains and reflect the maximum sales charge of 5.5% for A shares or the maximum applicable contingent deferred sales charge (5% in the 1st year, decreasing to 0% after 6 years) for Class B shares and 1% (during the first 12 months) for Class C shares. Net Asset Value (NAV) returns include the reinvestment of dividends and capital gains but do not reflect any sales charges. Shares purchased prior to March 1, 2004 are subject to a maximum applicable contingent deferred sales charge (5% in the 1st year, decreasing to 0% after 7 years) for Class B shares and (2% in the 1st year, decreasing to 0% after 2 years) for Class C shares.
Investing in small cap stocks generally involves greater risks and volatility so an investment in this fund may not be suitable for everyone.
This material must be preceded or accompanied by a current prospectus, which includes specific contents regarding the investment objectives and policies of this fund.
Transamerica IDEX Mutual Funds
Annual Report 2004
2
TA IDEX T. Rowe Price Small Cap
UNDERSTANDING YOUR FUND'S EXPENSES (unaudited)
SHAREHOLDER EXPENSES
The following Example is intended to help you understand your ongoing costs (in dollars and cents) of investing in a Fund and to compare these costs with the ongoing costs of investing in other funds.
The Example is based on an investment of $1,000 invested at the beginning of the period and held for the entire period from May 1, 2004 to October 31, 2004.
ACTUAL EXPENSES
The first line in the table below provides information about actual account values and actual expenses. You may use the information in this line, together with the amount you invested, to estimate the expenses that you paid over the period. Simply divide your account value by $1,000 (for example, an $8,600 account value divided by $1,000 = 8.6), then multiply the result by the number in the first line of your Fund under the heading entitled "Expenses Paid During Period" to estimate the expenses you paid on your account during this period.
HYPOTHETICAL EXAMPLE FOR COMPARISON PURPOSES
The second line in the table below provides information about hypothetical account values and hypothetical expenses based on each Fund's actual expense ratio and an assumed rate of return of 5% per year before expenses, which is not the Fund's actual return. The hypothetical account values and expenses may not be used to estimate the actual ending account balance or expenses you paid for the period. You may use this information to compare the ongoing costs of investing in your Fund and other funds. To do so, compare this 5% hypothetical example with the 5% hypothetical examples that appear in the shareholder reports of the other funds.
Please note that the expenses shown in the table are meant to highlight your ongoing costs only and do not reflect any transactional costs, such as sales charges, redemption fees, brokerage commissions paid on purchases and sales of fund shares. Therefore, the second line under each Fund in the table is useful in comparing ongoing costs only, and will not help you determine the relative total costs of owning different funds. In addition, note that the expenses shown in the table are meant to highlight your ongoing costs and do not reflect any transaction costs.
| | | Beginning
Account
Value | | Ending
Account
Value | | Annualized
Expense
Ratio | |
Expenses Paid
During Period (a) | |
| Class A | |
| Actual | | $ | 1,000.00 | | | $ | 973.10 | | | | 1.32 | % | | $ | 6.55 | | |
| Hypothetical (b) | | | 1,000.00 | | | | 1,018.50 | | | | 1.32 | | | | 6.70 | | |
| Class B | |
| Actual | | | 1,000.00 | | | | 970.30 | | | | 1.83 | | | | 9.06 | | |
| Hypothetical (b) | | | 1,000.00 | | | | 1,015.94 | | | | 1.83 | | | | 9.27 | | |
| Class C | |
| Actual | | | 1,000.00 | | | | 968.00 | | | | 2.28 | | | | 11.28 | | |
| Hypothetical (b) | | | 1,000.00 | | | | 1,013.67 | | | | 2.28 | | | | 11.54 | | |
(a) Expenses are calculated using each Fund's annualized expense ratio (as disclosed in the table), multiplied by the average account value for the period, multiplied by number of days in the period (184 days), and divided by the number of days in the year (366 days).
(b) 5% return per year before expenses
GRAPHIC PRESENTATION OF SCHEDULE OF INVESTMENTS
By Sector
At October 31, 2004
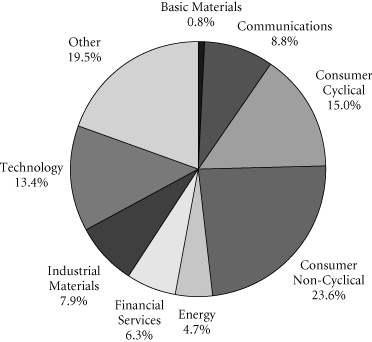
This chart shows the percentage breakdown by sector of the Fund's total investment securities.
Transamerica IDEX Mutual Funds
Annual Report 2004
3
TA IDEX T. Rowe Price Small Cap
SCHEDULE OF INVESTMENTS
At October 31, 2004
(all amounts except share amounts in thousands)
| | | Shares | | Value | |
| COMMON STOCKS (98.8%) | | | |
| Air Transportation (1.5%) | | | |
| Airtran Holdings, Inc. (a) | | | 14,400 | | | $ | 167 | | |
| ExpressJet Holdings, Inc. (a) | | | 16,100 | | | | 179 | | |
| Frontier Airlines, Inc. (a) | | | 66,100 | | | | 553 | | |
| JetBlue Airways Corp. (a)(b) | | | 5,200 | | | | 115 | | |
| Skywest, Inc. | | | 73,000 | | | | 1,247 | | |
| Amusement & Recreation Services (1.1%) | | | |
| Alliance Gaming Corp. (a)(b) | | | 24,800 | | | | 229 | | |
| International Speedway Corp.–Class A | | | 3,200 | | | | 151 | | |
| Station Casinos, Inc. | | | 21,700 | | | | 1,106 | | |
| Westwood One, Inc. (a) | | | 4,600 | | | | 106 | | |
| Apparel & Accessory Stores (2.3%) | | | |
| AnnTaylor Stores Corp. (a) | | | 10,875 | | | | 244 | | |
| Christopher & Banks Corp. (b) | | | 37,900 | | | | 616 | | |
| HOT Topic, Inc. (a)(b) | | | 41,500 | | | | 853 | | |
| Pacific Sunwear of California, Inc. (a) | | | 35,950 | | | | 843 | | |
| Ross Stores, Inc. (b) | | | 18,600 | | | | 489 | | |
| Talbots, Inc. | | | 13,200 | | | | 348 | | |
| Apparel Products (0.1%) | | | |
| Gymboree Corp. (a) | | | 14,800 | | | | 179 | | |
| Auto Repair, Services & Parking (0.3%) | | | |
| Dollar Thrifty Automotive Group (a) | | | 19,100 | | | | 461 | | |
| Automotive (0.9%) | | | |
| Group 1 Automotive, Inc. (a) | | | 13,700 | | | | 388 | | |
| Oshkosh Truck Corp. | | | 15,500 | | | | 913 | | |
| Automotive Dealers & Service Stations (0.7%) | | | |
| O'Reilly Automotive, Inc. (a)(b) | | | 22,000 | | | | 947 | | |
| Sonic Automotive, Inc. | | | 5,100 | | | | 103 | | |
| Beverages (0.1%) | | | |
| Boston Beer Co., Inc.–Class A (a) | | | 7,700 | | | | 195 | | |
| Business Services (3.5%) | | | |
| Catalina Marketing Corp. | | | 2,800 | | | | 72 | | |
| ChoicePoint, Inc. (a) | | | 22,100 | | | | 920 | | |
| Computer Programs & Systems, Inc. | | | 61,200 | | | | 1,287 | | |
| EPIQ Systems, Inc. (a)(b) | | | 8,600 | | | | 129 | | |
| Forrester Research, Inc. (a) | | | 33,600 | | | | 518 | | |
| Getty Images, Inc. (a)(b) | | | 12,000 | | | | 710 | | |
| Iron Mountain, Inc. (a)(b) | | | 23,025 | | | | 761 | | |
| Rent-A-Center, Inc. (a) | | | 21,950 | | | | 527 | | |
| SupportSoft, Inc. (a) | | | 38,700 | | | | 196 | | |
| Commercial Banks (2.5%) | | | |
| Boston Private Financial Holdings, Inc. | | | 23,700 | | | | 582 | | |
| East-West Bancorp, Inc. | | | 13,800 | | | | 553 | | |
| Investors Financial Services Corp. | | | 23,500 | | | | 905 | | |
| | | Shares | | Value | |
| Commercial Banks (continued) | |
| Silicon Valley Bancshares (a) | | | 9,200 | | | $ | 368 | | |
| Southwest Bancorp of Texas, Inc. | | | 19,400 | | | | 455 | | |
| UCBH Holdings, Inc. | | | 19,800 | | | | 853 | | |
| Communication (0.5%) | |
| Global Payments, Inc. (b) | | | 11,380 | | | | 623 | | |
| Insight Communications Co., Inc. (a)(b) | | | 12,300 | | | | 104 | | |
| Communications Equipment (2.2%) | |
| Centillium Communications, Inc. (a) | | | 39,100 | | | | 87 | | |
| Concord Communications, Inc. (a) | | | 10,900 | | | | 90 | | |
| Inter-Tel, Inc. | | | 39,600 | | | | 1,069 | | |
| Plantronics, Inc. | | | 26,100 | | | | 1,135 | | |
| Polycom, Inc. (a) | | | 30,906 | | | | 638 | | |
| Powerwave Technologies, Inc. (a)(b) | | | 18,500 | | | | 138 | | |
| Remec, Inc. (a) | | | 14,600 | | | | 80 | | |
| Computer & Data Processing Services (10.7%) | |
| Activision, Inc. (a) | | | 39,450 | | | | 571 | | |
| Actuate Corp. (a) | | | 44,800 | | | | 111 | | |
| Agile Software Corp. (a) | | | 67,000 | | | | 572 | | |
| Avocent Corp. (a) | | | 3,700 | | | | 132 | | |
| Borland Software Corp. (a) | | | 39,100 | | | | 400 | | |
| CACI International, Inc.–Class A (a) | | | 12,800 | | | | 780 | | |
| CNET Networks, Inc. (a)(b) | | | 28,900 | | | | 236 | | |
| Cognex Corp. (b) | | | 15,900 | | | | 407 | | |
| Cognizant Technology Solutions Corp. (a) | | | 18,500 | | | | 629 | | |
| Digital Insight Corp. (a) | | | 41,800 | | | | 655 | | |
| Earthlink, Inc. (a) | | | 31,700 | | | | 327 | | |
| F5 Networks, Inc. (a)(b) | | | 30,200 | | | | 1,206 | | |
| Factset Research Systems, Inc. (b) | | | 7,900 | | | | 394 | | |
| Fair Isaac Corp. (b) | | | 28,005 | | | | 846 | | |
| Hyperion Solutions Corp. (a)(b) | | | 23,200 | | | | 931 | | |
| Informatica Corp. (a) | | | 61,700 | | | | 482 | | |
| Inforte Corp. (a) | | | 105,800 | | | | 714 | | |
| Jack Henry & Associates, Inc. | | | 19,500 | | | | 363 | | |
| Macromedia, Inc. (a) | | | 15,900 | | | | 432 | | |
| Magma Design Automation, Inc. (a) | | | 9,100 | | | | 118 | | |
| MatrixOne, Inc. (a) | | | 56,300 | | | | 321 | | |
| Mercury Interactive Corp. (a)(b) | | | 1,500 | | | | 65 | | |
| MTC Technologies, Inc. (a) | | | 31,200 | | | | 853 | | |
| National Instruments Corp. | | | 2,700 | | | | 74 | | |
| Netegrity, Inc. (a) | | | 26,750 | | | | 285 | | |
| Open Text Corp. (a)(b) | | | 33,800 | | | | 568 | | |
| Packeteer, Inc. (a) | | | 26,800 | | | | 331 | | |
| Radiant Systems, Inc. (a) | | | 17,550 | | | | 90 | | |
| Red Hat, Inc. (a)(b) | | | 19,100 | | | | 245 | | |
| RSA Security, Inc. (a) | | | 18,200 | | | | 372 | | |
| Serena Software, Inc. (a)(b) | | | 34,200 | | | | 607 | | |
The notes to the financial statements are an integral part of this report.
Transamerica IDEX Mutual Funds
Annual Report 2004
4
TA IDEX T. Rowe Price Small Cap
SCHEDULE OF INVESTMENTS (continued)
At October 31, 2004
(all amounts except share amounts in thousands)
| | | Shares | | Value | |
| Computer & Data Processing Services (continued) | | | |
| SkillSoft PLC, Sponsored ADR (a) | | | 19,000 | | | $ | 130 | | |
| SRA International, Inc.–Class A (a) | | | 19,400 | | | | 1,043 | | |
| Websense, Inc. (a) | | | 9,900 | | | | 402 | | |
| Computer & Office Equipment (1.7%) | | | |
| Black Box Corp. | | | 6,100 | | | | 240 | | |
| Maxtor Corp. (a) | | | 99,400 | | | | 294 | | |
| Sandisk Corp. (a) | | | 25,700 | | | | 536 | | |
| ScanSource, Inc. (a) | | | 2,900 | | | | 180 | | |
| Zebra Technologies Corp.–Class A (a) | | | 24,300 | | | | 1,287 | | |
| Construction (0.7%) | | | |
| Insituform Technologies, Inc.–Class A (a) | | | 13,000 | | | | 258 | | |
| MDC Holdings, Inc. | | | 9,934 | | | | 762 | | |
| Drug Stores & Proprietary Stores (0.2%) | | | |
| Drugstore.Com, Inc. (a) | | | 75,600 | | | | 240 | | |
| Educational Services (2.2%) | | | |
| Apollo Group, Inc.–Class A (a) | | | 5,873 | | | | 388 | | |
| Career Education Corp. (a)(b) | | | 11,200 | | | | 351 | | |
| Corinthian Colleges, Inc. (a)(b) | | | 21,100 | | | | 303 | | |
| DeVry, Inc. (a)(b) | | | 30,400 | | | | 444 | | |
| Education Management Corp. (a) | | | 34,600 | | | | 928 | | |
| ITT Educational Services, Inc. (a) | | | 19,700 | | | | 749 | | |
| Electrical Goods (0.4%) | | | |
| Hughes Supply, Inc. | | | 21,200 | | | | 602 | | |
| Electronic & Other Electric Equipment (1.4%) | | | |
| Aeroflex, Inc. (a) | | | 83,900 | | | | 931 | | |
| Digital Theater Systems, Inc. (a) | | | 27,100 | | | | 461 | | |
| Harman International Industries, Inc. | | | 3,000 | | | | 361 | | |
| SBS Technologies, Inc. (a) | | | 17,200 | | | | 229 | | |
| Electronic Components & Accessories (6.9%) | | | |
| Advanced Energy Industries, Inc. (a) | | | 69,700 | | | | 687 | | |
| AMIS Holdings, Inc. (a) | | | 21,600 | | | | 328 | | |
| ATMI, Inc. (a) | | | 13,500 | | | | 315 | | |
| Cymer, Inc. (a)(b) | | | 19,100 | | | | 545 | | |
| Exar Corp. (a) | | | 24,000 | | | | 360 | | |
| Integrated Circuit Systems, Inc. (a)(b) | | | 21,500 | | | | 485 | | |
| Integrated Silicon Solutions, Inc. (a) | | | 45,300 | | | | 340 | | |
| Intersil Corp.–Class A | | | 36,596 | | | | 597 | | |
| Kemet Corp. (a) | | | 12,500 | | | | 97 | | |
| Lattice Semiconductor Corp. (a) | | | 27,100 | | | | 135 | | |
| Mercury Computer Systems, Inc. (a)(b) | | | 33,400 | | | | 844 | | |
| Micrel, Inc. (a)(b) | | | 9,400 | | | | 106 | | |
| Microchip Technology, Inc. | | | 5,175 | | | | 157 | | |
| Omnivision Technologies, Inc. (a)(b) | | | 52,000 | | | | 827 | | |
| Pericom Semiconductor Corp. (a) | | | 24,500 | | | | 220 | | |
| Plexus Corp. (a) | | | 32,300 | | | | 400 | | |
| | | Shares | | Value | |
| Electronic Components & Accessories (continued) | |
| Semtech Corp. (a) | | | 25,700 | | | $ | 537 | | |
| Sigmatel, Inc. (a) | | | 4,100 | | | | 121 | | |
| Silicon Storage Technology, Inc. (a) | | | 40,600 | | | | 302 | | |
| Skyworks Solutions, Inc. (a)(b) | | | 17,300 | | | | 154 | | |
| Tessera Technologies, Inc. (a) | | | 21,300 | | | | 595 | | |
| Triquint Semiconductor, Inc. (a) | | | 24,426 | | | | 87 | | |
| TTM Technologies, Inc. (a) | | | 90,600 | | | | 848 | | |
Varian Semiconductor Equipment
Associates, Inc. (a)(b) | | | 18,800 | | | | 651 | | |
| Zoran Corp. (a) | | | 43,797 | | | | 442 | | |
| Environmental Services (0.9%) | |
| Stericycle, Inc. (a) | | | 12,600 | | | | 571 | | |
| Waste Connections, Inc. (a) | | | 22,200 | | | | 700 | | |
| Fabricated Metal Products (0.3%) | |
| Simpson Manufacturing Co., Inc. | | | 5,800 | | | | 373 | | |
| Food & Kindred Products (0.1%) | |
| Peet's Coffee & Tea, Inc. (a) | | | 7,700 | | | | 196 | | |
| Food Stores (0.3%) | |
| Whole Foods Market, Inc. (b) | | | 4,800 | | | | 391 | | |
| Furniture & Fixtures (0.1%) | |
| La-Z-Boy, Inc. (b) | | | 9,900 | | | | 131 | | |
| Furniture & Home Furnishings Stores (1.1%) | |
| Cost Plus, Inc. (a)(b) | | | 27,800 | | | | 898 | | |
| Pier 1 Imports, Inc. | | | 13,700 | | | | 246 | | |
| Williams-Sonoma, Inc. (a)(b) | | | 13,100 | | | | 500 | | |
| Health Services (4.8%) | |
| Accredo Health, Inc. (a) | | | 32,150 | | | | 740 | | |
| Amsurg Corp. (a) | | | 18,600 | | | | 435 | | |
| Community Health Systems, Inc. (a) | | | 11,700 | | | | 314 | | |
| Coventry Health Care, Inc. (a) | | | 23,200 | | | | 949 | | |
| DaVita, Inc. (a) | | | 27,300 | | | | 809 | | |
| Gentiva Health Services, Inc. (a) | | | 28,400 | | | | 482 | | |
| Human Genome Sciences, Inc. (a) | | | 17,700 | | | | 182 | | |
| LifePoint Hospitals, Inc. (a)(b) | | | 25,900 | | | | 840 | | |
| Manor Care, Inc. | | | 10,500 | | | | 344 | | |
| Matria Healthcare, Inc. (a)(b) | | | 5,100 | | | | 159 | | |
| Omnicare, Inc. | | | 27,400 | | | | 756 | | |
| Renal Care Group, Inc. (a) | | | 13,100 | | | | 413 | | |
| Symbion, Inc. (a)(b) | | | 24,700 | | | | 384 | | |
| Triad Hospitals, Inc. (a) | | | 6,200 | | | | 205 | | |
| United Surgical Partners International, Inc. (a) | | | 19,600 | | | | 686 | | |
| Holding & Other Investment Offices (1.1%) | |
| Affiliated Managers Group (a)(b) | | | 17,300 | | | | 966 | | |
| First Marblehead Corp. (The) (a)(b) | | | 5,100 | | | | 273 | | |
| Redwood Trust, Inc. REIT (b) | | | 5,900 | | | | 355 | | |
The notes to the financial statements are an integral part of this report.
Transamerica IDEX Mutual Funds
Annual Report 2004
5
TA IDEX T. Rowe Price Small Cap
SCHEDULE OF INVESTMENTS (continued)
At October 31, 2004
(all amounts except share amounts in thousands)
| | | Shares | | Value | |
| Industrial Machinery & Equipment (2.1%) | | | |
| Axcelis Technologies, Inc. (a) | | | 50,200 | | | $ | 432 | | |
| Engineered Support Systems, Inc. (b) | | | 24,550 | | | | 1,179 | | |
| Entegris, Inc. (a) | | | 34,300 | | | | 317 | | |
| FMC Technologies, Inc. (a) | | | 9,400 | | | | 284 | | |
| National-Oilwell, Inc. (a)(b) | | | 12,000 | | | | 405 | | |
| Oil States International, Inc. (a) | | | 22,100 | | | | 406 | | |
| Instruments & Related Products (3.0%) | | | |
| Anaren, Inc. (a) | | | 19,500 | | | | 239 | | |
| August Technology Corp. (a) | | | 11,500 | | | | 90 | | |
| Cohu, Inc. | | | 11,200 | | | | 176 | | |
| Cyberonics, Inc. (a)(b) | | | 4,300 | | | | 81 | | |
| Cyberoptics Corp. (a) | | | 71,900 | | | | 784 | | |
| Dionex Corp. (a) | | | 4,650 | | | | 260 | | |
| Flir Systems, Inc. (a) | | | 15,800 | | | | 841 | | |
| Fossil, Inc. (a) | | | 29,230 | | | | 870 | | |
| Herley Industries, Inc. (a) | | | 14,200 | | | | 249 | | |
| Lexar Media, Inc. (a)(b) | | | 36,100 | | | | 244 | | |
| Newport Corp. (a) | | | 5,800 | | | | 65 | | |
| Pinnacle Systems, Inc. (a) | | | 20,000 | | | | 93 | | |
| Rudolph Technologies, Inc. (a)(b) | | | 8,900 | | | | 134 | | |
| Varian, Inc. (a) | | | 6,000 | | | | 219 | | |
| Insurance (2.2%) | | | |
| Max Reinsurance Capital, Ltd. | | | 19,500 | | | | 368 | | |
| PMI Group (The), Inc. | | | 3,900 | | | | 151 | | |
| RenaissanceRe Holdings, Ltd. (b) | | | 12,500 | | | | 585 | | |
| Stancorp Financial Group, Inc. | | | 7,700 | | | | 580 | | |
| Triad Guaranty, Inc. (a) | | | 16,300 | | | | 889 | | |
| WellChoice, Inc. (a) | | | 13,800 | | | | 576 | | |
| Insurance Agents, Brokers & Service (0.3%) | | | |
| Brown & Brown, Inc. | | | 9,100 | | | | 380 | | |
| Leather & Leather Products (0.2%) | | | |
| Timberland Co.–Class A (a)(b) | | | 5,800 | | | | 356 | | |
| Management Services (1.9%) | | | |
| Corporate Executive Board Co. (b) | | | 27,200 | | | | 1,731 | | |
| Hewitt Associates, Inc.–Class A (a) | | | 3,860 | | | | 108 | | |
| Resources Connection, Inc. (a) | | | 23,900 | | | | 1,003 | | |
| Manufacturing Industries (0.1%) | | | |
| Daktronics, Inc. (a) | | | 4,000 | | | | 99 | | |
| Medical Instruments & Supplies (4.2%) | | | |
| Advanced Neuromodulation Systems, Inc. (a)(b) | | | 13,600 | | | | 433 | | |
| Coherent, Inc. (a) | | | 11,100 | | | | 268 | | |
| Dentsply International, Inc. | | | 12,150 | | | | 632 | | |
| ICU Medical, Inc. (a)(b) | | | 20,800 | | | | 467 | | |
| Inamed Corp. (a) | | | 19,250 | | | | 1,023 | | |
| Integra LifeSciences Holdings Corp. (a) | | | 3,100 | | | | 99 | | |
| | | Shares | | Value | |
| Medical Instruments & Supplies (continued) | |
| Mentor Corp. | | | 5,300 | | | $ | 184 | | |
| Merit Medical Systems, Inc. (a) | | | 14,800 | | | | 153 | | |
| Respironics, Inc. (a) | | | 16,900 | | | | 863 | | |
| Steris Corp. (a) | | | 45,400 | | | | 941 | | |
| Techne Corp. (a) | | | 13,900 | | | | 501 | | |
| Thoratec Corp. (a)(b) | | | 48,900 | | | | 429 | | |
| Wright Medical Group, Inc. (a) | | | 8,000 | | | | 207 | | |
| Mortgage Bankers & Brokers (0.3%) | |
| Doral Financial Corp. (b) | | | 9,025 | | | | 379 | | |
| Motion Pictures (1.6%) | |
| Avid Technology, Inc. (a) | | | 28,500 | | | | 1,510 | | |
| Macrovision Corp. (a) | | | 31,500 | | | | 852 | | |
| Oil & Gas Extraction (4.5%) | |
| Atwood Oceanics, Inc. (a) | | | 4,600 | | | | 221 | | |
| Cabot Oil & Gas Corp. | | | 14,100 | | | | 597 | | |
| CAL Dive International, Inc. (a)(b) | | | 24,900 | | | | 882 | | |
| Comstock Resources, Inc. (a) | | | 34,100 | | | | 750 | | |
| Global Industries, Ltd. (a) | | | 19,800 | | | | 133 | | |
| Grey Wolf, Inc. (a)(b) | | | 125,200 | | | | 649 | | |
| Helmerich & Payne, Inc. | | | 7,800 | | | | 223 | | |
| Patterson-UTI Energy, Inc. | | | 50,000 | | | | 961 | | |
| Spinnaker Exploration Co. (a) | | | 14,200 | | | | 453 | | |
| Stone Energy Corp. (a) | | | 10,700 | | | | 441 | | |
| Unit Corp. (a) | | | 23,000 | | | | 853 | | |
| Varco International, Inc. (a) | | | 17,300 | | | | 479 | | |
| Personal Services (0.1%) | |
| Jackson Hewitt Tax Service, Inc. | | | 4,100 | | | | 86 | | |
| Pharmaceuticals (7.0%) | |
| Abgenix, Inc. (a) | | | 18,800 | | | | 171 | | |
| Alkermes, Inc. (a)(b) | | | 18,000 | | | | 223 | | |
| Andrx Corp. (a) | | | 23,700 | | | | 513 | | |
| Bradley Pharmaceuticals, Inc. (a)(b) | | | 32,300 | | | | 535 | | |
| Celgene Corp. (a) | | | 7,600 | | | | 225 | | |
| Cephalon, Inc. (a)(b) | | | 8,024 | | | | 383 | | |
| Charles River Laboratories International, Inc. (a) | | | 17,500 | | | | 819 | | |
| D&K Healthcare Resources, Inc. | | | 19,800 | | | | 145 | | |
| Digene Corp. (a)(b) | | | 34,200 | | | | 860 | | |
| Eon Labs, Inc. (a) | | | 23,400 | | | | 576 | | |
| Henry Schein, Inc. (a) | | | 2,500 | | | | 158 | | |
| ICOS Corp. (a)(b) | | | 7,600 | | | | 171 | | |
| Idexx Laboratories, Inc. (a) | | | 3,500 | | | | 174 | | |
| Invitrogen Corp. (a)(b) | | | 10,700 | | | | 620 | | |
| Martek Biosciences Corp. (a)(b) | | | 17,500 | | | | 823 | | |
| Medicis Pharmaceutical Corp.–Class A | | | 27,600 | | | | 1,122 | | |
| Neurocrine Biosciences, Inc. (a)(b) | | | 14,100 | | | | 656 | | |
| Noven Pharmaceuticals, Inc. (a) | | | 29,200 | | | | 658 | | |
The notes to the financial statements are an integral part of this report.
Transamerica IDEX Mutual Funds
Annual Report 2004
6
TA IDEX T. Rowe Price Small Cap
SCHEDULE OF INVESTMENTS (continued)
At October 31, 2004
(all amounts except share amounts in thousands)
| | | Shares | | Value | |
| Pharmaceuticals (continued) | |
| Par Pharmaceutical Cos., Inc. (a) | | | 4,500 | | | $ | 178 | | |
| Priority Healthcare Corp.–Class B (a) | | | 8,200 | | | | 148 | | |
| Protein Design Labs, Inc. (a)(b) | | | 36,000 | | | | 689 | | |
| Taro Pharmaceuticals Industries (a)(b) | | | 13,700 | | | | 364 | | |
| Vertex Pharmaceuticals, Inc. (a)(b) | | | 7,694 | | | | 84 | | |
| Primary Metal Industries (0.7%) | |
| Lone Star Technologies, Inc. (a) | | | 10,000 | | | | 264 | | |
| Maverick Tube Corp. (a)(b) | | | 15,400 | | | | 406 | | |
| Steel Dynamics, Inc. (b) | | | 11,600 | | | | 385 | | |
| Printing & Publishing (0.6%) | |
| Scholastic Corp. (a) | | | 24,100 | | | | 731 | | |
| Valassis Communications, Inc. (a) | | | 5,800 | | | | 199 | | |
| Radio & Television Broadcasting (2.0%) | |
| COX Radio, Inc.–Class A (a)(b) | | | 16,100 | | | | 256 | | |
| Emmis Communications Corp.–Class A (a) | | | 44,900 | | | | 840 | | |
| Entercom Communications Corp. (a) | | | 11,900 | | | | 395 | | |
| Radio One, Inc.–Class D (a) | | | 58,600 | | | | 861 | | |
| Regent Communications, Inc. (a) | | | 42,000 | | | | 231 | | |
| Spanish Broadcasting System, Inc.–Class A (a) | | | 36,500 | | | | 369 | | |
| Radio, Television & Computer Stores (0.3%) | |
| GameStop Corp.–Class A (a)(b) | | | 21,200 | | | | 415 | | |
| Research & Testing Services (1.5%) | |
| Advisory Board Co. (The) (a) | | | 41,300 | | | | 1,346 | | |
| Pharmaceutical Product Development, Inc. (a) | | | 20,500 | | | | 866 | | |
| Residential Building Construction (0.5%) | |
| Toll Brothers, Inc. (a)(b) | | | 15,500 | | | | 718 | | |
| Restaurants (2.8%) | |
| CEC Entertainment, Inc. (a) | | | 22,550 | | | | 857 | | |
| Cheesecake Factory (The) (a)(b) | | | 11,600 | | | | 504 | | |
| PF Chang's China Bistro, Inc. (a)(b) | | | 18,000 | | | | 915 | | |
| Rare Hospitality International, Inc. (a) | | | 28,700 | | | | 795 | | |
| Ruby Tuesday, Inc. | | | 16,900 | | | | 417 | | |
| Sonic Corp. (a) | | | 20,775 | | | | 566 | | |
| Retail Trade (2.3%) | |
| AC Moore Arts & Crafts, Inc. (a) | | | 35,100 | | | | 904 | | |
| Dollar Tree Stores, Inc. (a) | | | 7,800 | | | | 225 | | |
| Hibbett Sporting Goods, Inc. (a) | | | 9,700 | | | | 217 | | |
| Marvel Enterprises, Inc. (a)(b) | | | 39,850 | | | | 614 | | |
| Michaels Stores, Inc. (b) | | | 24,800 | | | | 722 | | |
| Petsmart, Inc. | | | 23,400 | | | | 748 | | |
| Savings Institutions (0.5%) | |
| IndyMac Bancorp, Inc. | | | 24,800 | | | | 800 | | |
| | | Shares | | Value | |
| Security & Commodity Brokers (1.3%) | |
| Eaton Vance Corp. | | | 9,800 | | | $ | 427 | | |
| Greenhill & Co., Inc. | | | 2,300 | | | | 52 | | |
| Legg Mason, Inc. | | | 5,400 | | | | 344 | | |
| Raymond James Financial, Inc. | | | 19,800 | | | | 517 | | |
| Waddell & Reed Financial, Inc.–Class A | | | 24,350 | | | | 512 | | |
| Social Services (0.8%) | |
| Bright Horizons Family Solutions, Inc. (a) | | | 17,900 | | | | 1,133 | | |
| Stone, Clay & Glass Products (0.5%) | |
| Gentex Corp. | | | 23,700 | | | | 782 | | |
| Telecommunications (1.6%) | |
| Adtran, Inc. | | | 25,300 | | | | 546 | | |
| Nextel Partners, Inc.–Class A (a) | | | 81,100 | | | | 1,366 | | |
| NII Holdings, Inc.–Class B (a)(b) | | | 4,400 | | | | 195 | | |
| Wireless Facilities, Inc. (a) | | | 29,100 | | | | 215 | | |
| Transportation & Public Utilities (0.9%) | |
| UTI Worldwide, Inc. | | | 19,400 | | | | 1,261 | | |
| Transportation Equipment (0.2%) | |
| Thor Industries, Inc. (b) | | | 9,700 | | | | 270 | | |
| Trucking & Warehousing (0.7%) | |
| Forward Air Corp. (a) | | | 9,600 | | | | 395 | | |
| Old Dominion Freight Line, Inc. (a) | | | 16,800 | | | | 471 | | |
| Werner Enterprises, Inc. | | | 4,100 | | | | 87 | | |
| Variety Stores (0.6%) | |
| Family Dollar Stores, Inc. | | | 4,600 | | | | 136 | | |
| Fred's, Inc. (b) | | | 44,150 | | | | 774 | | |
| Wholesale Trade Durable Goods (3.2%) | |
| Conceptus, Inc. (a)(b) | | | 9,800 | | | | 84 | | |
| Cytyc Corp. (a)(b) | | | 21,500 | | | | 561 | | |
| Insight Enterprises, Inc. (a) | | | 35,800 | | | | 664 | | |
| Patterson Cos., Inc. (a) | | | 19,800 | | | | 742 | | |
| Reliance Steel & Aluminum Co. | | | 8,000 | | | | 275 | | |
| SCP Pool Corp. | | | 28,930 | | | | 844 | | |
| Symyx Technologies, Inc. (a) | | | 28,300 | | | | 692 | | |
| West Marine, Inc. (a)(b) | | | 9,800 | | | | 240 | | |
| Wholesale Trade Nondurable Goods (1.7%) | |
| Performance Food Group Co. (a) | | | 11,400 | | | | 265 | | |
| SunOpta, Inc. (a)(b) | | | 149,700 | | | | 942 | | |
| Tractor Supply Co. (a) | | | 11,900 | | | | 432 | | |
| United Natural Foods, Inc. (a) | | | 30,400 | | | | 827 | | |
| Total Common Stocks (cost: $134,614) | | | | | | | 144,721 | | |
The notes to the financial statements are an integral part of this report.
Transamerica IDEX Mutual Funds
Annual Report 2004
7
TA IDEX T. Rowe Price Small Cap
SCHEDULE OF INVESTMENTS (continued)
At October 31, 2004
(all amounts except share amounts in thousands)
| | | Principal | | Value | |
| SECURITY LENDING COLLATERAL (23.9%) | | | |
| Debt (22.3%) | | | |
| Bank Notes (4.3%) | | | |
Bank of America
1.77%, due 12/03/2004 | | $ | 1,710 | | | $ | 1,710 | | |
| 1.88%, due 12/23/2004 | | | 570 | | | | 570 | | |
| 1.77%, due 01/18/2005 | | | 1,140 | | | | 1,140 | | |
Canadian Imperial Bank of Commerce
1.86%, due 11/04/2004 | | | 2,565 | | | | 2,565 | | �� |
Credit Suisse First Boston Corp.
1.83%, due 09/09/2005 | | | 285 | | | | 285 | | |
| Commercial Paper (2.3%) | | | |
Clipper Receivables Corp.
1.79%, due 11/12/2004 | | | 848 | | | | 848 | | |
Delaware Funding Corp. 144A
1.85%, due 11/19/2004 | | | 285 | | | | 285 | | |
Falcon Asset Securitization Corp. 144A
1.78%, due 11/04/2004 850 850
1.75%, due 11/10/2004 | | | 1,140 | | | | 1,140 | | |
Galaxy Funding 144A
1.88%, due 11/22/2004 | | | 285 | | | | 285 | | |
| Euro Dollar Terms (10.4%) | | | |
Bank of Montreal
1.88%, due 11/24/2004 | | | 2,699 | | | | 2,699 | | |
BNP Paribas
1.77%, due 11/10/2004 1,425 1,425
1.80%, due 11/23/2004 1,140 1,140
1.98%, due 12/27/2004 | | | 1,140 | | | | 1,140 | | |
Calyon
1.70%, due 11/24/2004 | | | 150 | | | | 150 | | |
Citigroup
2.06%, due 01/25/2005 | | | 2,849 | | | | 2,849 | | |
Den Danske Bank
1.82%, due 11/19/2004 | | | 1,425 | | | | 1,425 | | |
| | | Principal | | Value | |
| Euro Dollar Terms (continued) | | | |
Dexia Group
2.04%, due 01/21/2005 | | $ | 661 | | | $ | 661 | | |
HBOS Halifax Bank of Scotland
2.03%, due 01/21/2005 | | | 570 | | | | 570 | | |
Royal Bank of Scotland
2.01%, due 01/20/2005 | | | 1,140 | | | | 1,140 | | |
Toronto Dominion Bank
1.70%, due 11/08/2004 | | | 570 | | | | 570 | | |
Wells Fargo
1.87%, due 11/22/2004 | | | 1,425 | | | | 1,425 | | |
| Promissory Notes (2.2%) | | | |
Goldman Sachs Group Inc.
1.90%, due 12/29/2004 1,197 1,197
1.88%, due 01/27/2005 | | | 1,994 | | | | 1,994 | | |
| Repurchase Agreements (3.1%) | | | |
Merrill Lynch & Co., (c)
1.92% Repurchase Agreement dated
10/29/2004 to be repurchased at $4,559 on
11/1/2004 | | | 4,559 | | | | 4,559 | | |
| | | Shares | | Value | |
| Investment Companies (1.6%) | | | |
| Money Market Funds (1.6%) | | | |
Merrill Lynch Premier Institutional Fund
1-day yield of 1.71% | | | 1,401,809 | | | $ | 1,402 | | |
Merrimac Cash Fund, Premium Class
1-day yield of 1.46% | | | 1,025,829 | | | | 1,026 | | |
| Total Security Lending Collateral (cost: $35,050) | | | | | | | 35,050 | | |
| Total Investment Securities (cost: $169,664) | | | | | | $ | 179,771 | | |
| SUMMARY: | | | |
| Investments, at value | | | 122.7 | % | | $ | 179,771 | | |
| Liabilities in excess of other assets | | | (22.7 | )% | | | (33,225 | ) | |
| Net assets | | | 100.0 | % | | $ | 146,546 | | |
NOTES TO SCHEDULE OF INVESTMENTS:
(a) No dividends were paid during the preceding twelve months.
(b) At October 31, 2004, all or a portion of this security is on loan (see Note 1). The value at October 31, 2004, of all securities on loan is $33,723.
(c) Cash collateral for the Repurchase Agreements, valued at $4,665, that serve as collateral for securities lending are invested in corporate bonds with interest rates and maturity dates ranging from 0.00%–9.75% and 05/15/2005–9/15/2033, respectively.
DEFINITIONS:
ADR American Depositary Receipt
144A 144A Securities are registered pursuant to rule 144A of the Securities Act of 1933. These securities are deemed to be liquid for purposes of compliance limitations on holdings of illiquid securities and may be resold as transactions exempt from registration normally to qualified institutional buyers. At October 31, 2004, these securities aggregated $2,560 or 1.7% of the net assets of the Fund.
The notes to the financial statements are an integral part of this report.
Transamerica IDEX Mutual Funds
Annual Report 2004
8
TA IDEX T. Rowe Price Small Cap
STATEMENT OF ASSETS AND LIABILITIES
At October 31, 2004
(all amounts except per share amounts in thousands)
| Assets: | | | |
Investment securities, at value (cost: $169,664)
(including securities loaned of $33,723) | | $ | 179,771 | | |
| Cash | | | 2,051 | | |
| Receivables: | |
| Shares of beneficial interest sold | | | 16 | | |
| Interest | | | 7 | | |
| Dividends | | | 15 | | |
| Other | | | 3 | | |
| | | | 181,863 | | |
| Liabilities: | | | |
| Accounts payable and accrued liabilities: | |
| Shares of beneficial interest redeemed | | | 31 | | |
| Management and advisory fees | | | 100 | | |
| Distribution fees | | | 52 | | |
| Transfer agent fees | | | 23 | | |
| Payable for collateral for securities on loan | | | 35,050 | | |
| Other | | | 61 | | |
| | | | 35,317 | | |
| Net Assets | | $ | 146,546 | | |
| Net Assets Consist of: | | | |
Shares of beneficial interest, unlimited shares
authorized, no par value | | $ | 137,792 | | |
| Accumulated net investment income (loss) | | | (1 | ) | |
Accumulated net realized gain (loss) from investment
securities and futures contracts | | | (1,352 | ) | |
Net unrealized appreciation (decreciation) of
investment securities | | | 10,107 | | |
| Net Assets | | $ | 146,546 | | |
| Net Assets by Class: | | | |
| Class A | | $ | 129,809 | | |
| Class B | | | 11,776 | | |
| Class C | | | 4,961 | | |
| Shares Outstanding: | | | |
| Class A | | | 11,978 | | |
| Class B | | | 1,128 | | |
| Class C | | | 476 | | |
| Net Asset Value Per Share: | | | |
| Class A | | $ | 10.84 | | |
| Class B | | | 10.44 | | |
| Class C | | | 10.42 | | |
| Maximum Offering Price Per Share (a): | | | |
| Class A | | $ | 11.47 | | |
(a) Includes the maximum selling commission (represented as a percentage of offering price) which is reduced on certain levels of sales as set forth in the Prospectus. Net asset value per share for Classes B and C shares represents offering price. The redemption price for Classes B and C shares equals net asset value less any applicable contingent deferred sales charge.
STATEMENT OF OPERATIONS
For the year ended October 31, 2004
(all amounts in thousands)
| Investment Income: | | | |
| Interest | | $ | 11 | | |
| Dividends | | | 338 | | |
| Income from loaned securities–net | | | 39 | | |
| | | | 388 | | |
| Expenses: | | | |
| Management and advisory fees | | | 1,130 | | |
| Transfer agent fees: | |
| Class A | | | 118 | | |
| Class B | | | 11 | | |
| Class C | | | 2 | | |
| Class C2 | | | 2 | | |
| Class M | | | 2 | | |
| Printing and shareholder reports | | | 16 | | |
| Custody fees | | | 36 | | |
| Administration fees | | | 24 | | |
| Legal fees | | | 5 | | |
| Audit and accounting fees | | | 12 | | |
| Trustees fees | | | 8 | | |
| Registration fees: | |
| Class A | | | 41 | | |
| Class B | | | – | | |
| Class C | | | 11 | | |
| Class C2 | | | 1 | | |
| Class M | | | 1 | | |
| Other | | | 7 | | |
| Distribution and service fees: | |
| Class A | | | 430 | | |
| Class B | | | 128 | | |
| Class C | | | 21 | | |
| Class C2 | | | 16 | | |
| Class M | | | 16 | | |
| Total expenses | | | 2,038 | | |
| Net Investment Income (Loss) | | | (1,650 | ) | |
| Net Realized Gain (Loss) from: | | | |
| Investment securities | | | 6,410 | | |
| Futures contracts | | | 37 | | |
| | | | 6,447 | | |
| Net Increase (Decrease) in Unrealized Appreciation on: | | | |
| Investment securities | | | (3,879 | ) | |
| Futures contracts | | | (17 | ) | |
| | | | (3,896 | ) | |
| Net Gain (Loss) on Investments and Futures Contracts | | | 2,551 | | |
Net Increase (Decrease) in Net Assets Resulting
from Operations | | $ | 901 | | |
The notes to the financial statements are an integral part of this report.
Transamerica IDEX Mutual Funds
Annual Report 2004
9
TA IDEX T. Rowe Price Small Cap
STATEMENTS OF CHANGES IN NET ASSETS
For the years ended
(all amounts in thousands)
| | | October 31,
2004 | | October 31,
2003 | |
| Increase (Decrease) in Net Assets From: | | | |
| Operations: | | | |
| Net investment income (loss) | | $ | (1,650 | ) | | $ | (797 | ) | |
Net realized gain (loss) from
investment securities and
futures contracts | | | 6,447 | | | | (1,233 | ) | |
Net unrealized appreciation
(depreciation) on investment
securities and futures contracts | | | (3,896 | ) | | | 18,612 | | |
| | | | 901 | | | | 16,582 | | |
| Capital Share Transactions: | | | |
| Proceeds from shares sold: | |
| Class A | | | 46,740 | | | | 80,987 | | |
| Class B | | | 2,565 | | | | 3,085 | | |
| Class C | | | 1,843 | | | | 692 | | |
| Class C2 | | | 432 | | | | 548 | | |
| Class M | | | 129 | | | | 1,395 | | |
| | | | 51,709 | | | | 86,707 | | |
| Cost of shares redeemed: | |
| Class A | | | (12,651 | ) | | | (4,857 | ) | |
| Class B | | | (3,171 | ) | | | (2,700 | ) | |
| Class C | | | (1,440 | ) | | | (127 | ) | |
| Class C2 | | | (584 | ) | | | (740 | ) | |
| Class M | | | (879 | ) | | | (1,073 | ) | |
| | | | (18,725 | ) | | | (9,497 | ) | |
| Class level exchanges: | |
| Class C | | | 4,045 | | | | – | | |
| Class C2 | | | (2,406 | ) | | | – | | |
| Class M | | | (1,639 | ) | | | – | | |
| | | | – | | | | – | | |
| | | | 32,984 | | | | 77,210 | | |
| Net increase (decrease) in net assets | | | 33,885 | | | | 93,792 | | |
| Net Assets: | | | |
| Beginning of year | | | 112,661 | | | | 18,869 | | |
| End of year | | $ | 146,546 | | | $ | 112,661 | | |
Accumulated Net Investment Income
(Loss) | | $ | (1 | ) | | $ | – | | |
| | | October 31,
2004 | | October 31,
2003 | |
| Share Activity: | | | |
| Shares issued: | |
| Class A | | | 4,181 | | | | 8,673 | | |
| Class B | | | 240 | | | | 350 | | |
| Class C | | | 173 | | | | 75 | | |
| Class C2 | | | 40 | | | | 63 | | |
| Class M | | | 13 | | | | 155 | | |
| | | | 4,647 | | | | 9,316 | | |
| Shares redeemed: | |
| Class A | | | (1,157 | ) | | | (547 | ) | |
| Class B | | | (301 | ) | | | (322 | ) | |
| Class C | | | (139 | ) | | | (14 | ) | |
| Class C2 | | | (53 | ) | | | (87 | ) | |
| Class M | | | (83 | ) | | | (128 | ) | |
| | | | (1,733 | ) | | | (1,098 | ) | |
| Class level exchanges: | |
| Class C | | | 381 | | | | – | | |
| Class C2 | | | (222 | ) | | | – | | |
| Class M | | | (159 | ) | | | – | | |
| | | | – | | | | – | | |
Net increase (decrease) in shares
outstanding: | |
| Class A | | | 3,024 | | | | 8,126 | | |
| Class B | | | (61 | ) | | | 28 | | |
| Class C | | | 415 | | | | 61 | | |
| Class C2 | | | (235 | ) | | | (24 | ) | |
| Class M | | | (229 | ) | | | 27 | | |
| | | | 2,914 | | | | 8,218 | | |
The notes to the financial statements are an integral part of this report.
Transamerica IDEX Mutual Funds
Annual Report 2004
10
TA IDEX T. Rowe Price Small Cap
FINANCIAL HIGHLIGHTS
| | | | | For a share of beneficial interest outstanding throughout each period | |
| | | | | Net Asset | | Investment Operations | | Distributions | | Net Asset | |
| | | For the
Period
Ended (d)(g) | | Value,
Beginning
of Period | | Net
Investment
Income (Loss) | | Net Realized
and Unrealized
Gain (Loss) | | Total
Operations | | From Net
Investment
Income | | From Net
Realized
Gains | | Total
Distributions | | Value,
End
of Period | |
| Class A | | 10/31/2004 | | $ | 10.61 | | | $ | (0.12 | ) | | $ | 0.35 | | | $ | 0.23 | | | $ | – | | | $ | – | | | $ | – | | | $ | 10.84 | | |
| | | 10/31/2003 | | | 7.83 | | | | (0.15 | ) | | | 2.93 | | | | 2.78 | | | | – | | | | – | | | | – | | | | 10.61 | | |
| | | 10/31/2002 | | | 9.46 | | | | (0.16 | ) | | | (1.47 | ) | | | (1.63 | ) | | | – | | | | – | | | | – | | | | 7.83 | | |
| | | 10/31/2001 | | | 13.17 | | | | (0.14 | ) | | | (3.56 | ) | | | (3.70 | ) | | | – | | | | (0.01 | ) | | | (0.01 | ) | | | 9.46 | | |
| | | 10/31/2000 | | | 11.01 | | | | (0.07 | ) | | | 2.51 | | | | 2.44 | | | | – | | | | (0.28 | ) | | | (0.28 | ) | | | 13.17 | | |
| Class B | | 10/31/2004 | | | 10.28 | | | | (0.18 | ) | | | 0.34 | | | | 0.16 | | | | – | | | | – | | | | – | | | | 10.44 | | |
| | | 10/31/2003 | | | 7.63 | | | | (0.19 | ) | | | 2.84 | | | | 2.65 | | | | – | | | | – | | | | – | | | | 10.28 | | |
| | | 10/31/2002 | | | 9.29 | | | | (0.22 | ) | | | (1.44 | ) | | | (1.66 | ) | | | – | | | | – | | | | – | | | | 7.63 | | |
| | | 10/31/2001 | | | 13.05 | | | | (0.21 | ) | | | (3.54 | ) | | | (3.75 | ) | | | – | | | | (0.01 | ) | | | (0.01 | ) | | | 9.29 | | |
| | | 10/31/2000 | | | 10.97 | | | | (0.15 | ) | | | 2.51 | | | | 2.36 | | | | – | | | | (0.28 | ) | | | (0.28 | ) | | | 13.05 | | |
| Class C | | 10/31/2004 | | | 10.28 | | | | (0.22 | ) | | | 0.36 | | | | 0.14 | | | | – | | | | – | | | | – | | | | 10.42 | | |
| | | 10/31/2003 | | | 7.52 | | | | (0.20 | ) | | | 2.96 | | | | 2.76 | | | | – | | | | – | | | | – | | | | 10.28 | | |
| | | | | | | Ratios/Supplemental Data | |
| | | For the
Period | | Total | | Net Assets,
End of
Period | | Ratio of Expenses
to Average
Net Assets (a) | | Net Investment
Income (Loss)
to Average | | Portfolio
Turnover | |
| | | Ended (g) | | Return (c) | | (000's) | | Net (e) | | Total (f) | | Net Assets (a) | | Rate (b) | |
| Class A | | 10/31/2004 | | | 2.17 | % | | $ | 129,809 | | | | 1.36 | % | | | 1.36 | % | | | (1.08 | )% | | | 29 | % | |
| | | 10/31/2003 | | | 35.50 | | | | 95,018 | | | | 1.75 | | | | 1.93 | | | | (1.55 | ) | | | 25 | | |
| | | 10/31/2002 | | | (17.22 | ) | | | 6,487 | | | | 1.74 | | | | 2.67 | | | | (1.52 | ) | | | 55 | | |
| | | 10/31/2001 | | | (28.11 | ) | | | 7,067 | | | | 1.55 | | | | 2.56 | | | | (1.30 | ) | | | 49 | | |
| | | 10/31/2000 | | | 22.31 | | | | 8,262 | | | | 1.55 | | | | 2.83 | | | | (1.14 | ) | | | 53 | | |
| Class B | | 10/31/2004 | | | 1.56 | | | | 11,776 | | | | 1.94 | | | | 1.94 | | | | (1.67 | ) | | | 29 | | |
| | | 10/31/2003 | | | 34.73 | | | | 12,227 | | | | 2.40 | | | | 2.58 | | | | (2.20 | ) | | | 25 | | |
| | | 10/31/2002 | | | (17.85 | ) | | | 8,860 | | | | 2.39 | | | | 3.32 | | | | (2.17 | ) | | | 55 | | |
| | | 10/31/2001 | | | (28.73 | ) | | | 9,496 | | | | 2.20 | | | | 3.21 | | | | (1.95 | ) | | | 49 | | |
| | | 10/31/2000 | | | 21.63 | | | | 8,119 | | | | 2.20 | | | | 3.48 | | | | (1.79 | ) | | | 53 | | |
| Class C | | 10/31/2004 | | | 1.32 | | | | 4,961 | | | | 2.40 | | | | 2.40 | | | | (2.13 | ) | | | 29 | | |
| | | 10/31/2003 | | | 36.70 | | | | 628 | | | | 2.40 | | | | 2.58 | | | | (2.20 | ) | | | 25 | | |
NOTES TO FINANCIAL HIGHLIGHTS
(a) Annualized.
(b) Not annualized for periods of less than one year.
(c) Total Return has been calculated for the applicable period without deduction of a sales load, if any, on an initial purchase. Periods of less than one year are not annualized.
(d) Per share information is calculated based on average number of shares outstanding for the years ended 10/31/2001, 10/31/2002, 10/31/2003 and 10/31/2004.
(e) Ratio of Net Expenses to Average Net Assets is net of fee waivers and reimbursements by the investment adviser, if any (see note 2).
(f) Ratio of Total Expenses to Average Net Assets includes all expenses before fee waivers and reimbursements by the investment adviser.
(g) TA IDEX T. Rowe Price Small Cap ("the Fund") commenced operations on March 1, 1999. The inception date for the Fund's offering of share Class L was November 11, 2002. Class L was renamed Class C on March 1, 2004. (see note 1)
The notes to the financial statements are an integral part of this report.
Transamerica IDEX Mutual Funds
Annual Report 2004
11
TA IDEX T. Rowe Price Small Cap
NOTES TO FINANCIAL STATEMENTS
At October 31, 2004
(all amounts in thousands)
NOTE 1.ORGANIZATION AND SIGNIFICANT ACCOUNTING POLICIES
Transamerica IDEX Mutual Funds, formerly IDEX Mutual Funds, is a Massachusetts business trust registered under the Investment Company Act of 1940, as amended (the "1940 Act"), as an open-end management investment company. TA IDEX T. Rowe Price Small Cap ("the Fund"), part of Transamerica IDEX Mutual Funds, began operations on March 1, 1999.
On March 1, 2004, the Fund changed its name IDEX T. Rowe Price Small Cap to TA IDEX T. Rowe Price Small Cap.
In the normal course of business, the Fund enters into contracts that contain a variety of representations and warranties, which provide general indemnifications. The Fund's maximum exposure under these arrangements is unknown, as this would involve future claims that may be made against the Fund and/or its affiliates that have not yet occurred. However, based on experience, the Fund expects the risk of loss to be remote.
See the Prospectus and Statement of Additional Information for a description of the Fund's investment objective.
In preparing the Fund's financial statements in accordance with accounting principles generally accepted in the United States of America ("GAAP"), estimates or assumptions (which could differ from actual results) may be used that affect reported amounts and disclosures. The following policies were consistently followed by the Fund, in accordance with GAAP.
Multiple class operations and expenses: The Fund currently offers three classes of shares, each with a public offering price that reflects different sales charges, if any, and expense levels. All shares designated as Class C shares prior to March 1, 2004, were renamed as Class C2 shares on that date. All shares designated as Class L shares prior to March 1, 2004, were renamed as Class C shares with different sales charges than the previous Class L shares. On June 15, 2004, Class C2 shares merged into Class C. On September 24, 2004, Class M shares merged into Class C. Class B shares will convert to Class A shares eight years after purchase. Income, non-class specific expenses and realized and unrealized gains and losses, are allocated daily to each class, based upon the value of shares outstanding method as permitted under Rule 18f-3 of the 1940 Act. Each class bears its own specific expenses as well as a portion of general, common expenses.
Pricing of shares: The Fund prices its shares on the basis of the net asset value of each class of shares of the Fund, which is determined as of the close of the New York Stock Exchange ("NYSE") (generally 4:00 p.m. Eastern Time) on each day on which the NYSE is open for trading (other than a day on which there are insufficient changes in the value of the Fund's portfolio securities to materially affect the Fund's net asset value or a day on which no shares are tendered for redemption and no order to purchase any shares is received).
Security valuations: Fund investments traded on an exchange are valued at the closing price on the day of valuation on the exchange where the security is principally traded. With respect to securities traded on NASDAQ NMS, such closing price may be the last reported sales price or the NASDAQ Official Closing Price.
Securities traded in the over-the counter market and listed securities for which no sale was reported on that date are valued at the last quoted bid price.
Investment company securities are valued at net asset value of the underlying portfolio.
Other securities for which quotations are not readily available are valued at fair market value as determined in good faith using guidelines adopted by the Board of Trustees of the Fund, under the supervision of the Fund's Valuation Committee.
Cash: The Fund may leave cash overnight in its cash account with the custodian, Investors Bank & Trust Company ("IBT"). IBT has been contracted on behalf of the Fund to invest the excess cash into a savings account, which at October 31, 2004, was paying an interest rate of 1.30%.
Throughout the year, the Fund may have a cash overdraft balance. A fee is incurred on this overdraft, calculated by multiplying the overdraft by a rate based on the federal funds rate. This fee is included in Custody fees in the Statement of Operations.
Repurchase agreements: The Fund is authorized to enter into repurchase agreements. The Fund, through IBT, receives delivery of the underlying securities, the value of which at the time of purchase is required to be an amount equal to at least 100% of the resale price. Repurchase agreements involve the risk that the seller will fail to repurchase the security, as agreed. In that case, the Fund will bear the risk of value fluctuations until the security can be sold and may encounter delays and incur costs in liquidating the security. In the event of bankruptcy or insolvency of the seller, delays and costs may be incurred.
Commission recapture: The sub-adviser, to the extent consistent with the best execution and usual commission rate policies and practices, may place security transactions of the Fund with broker/dealers with which Transamerica IDEX Mutual Funds has established a Commission Recapture Program. A Commission Recapture Program is any arrangement under which a broker/dealer applies a portion of the commissions received by such broker/dealer on the security transactions to the Fund. In no event will commissions paid by the Fund be used to pay expenses that would otherwise be borne by any other funds within Transamerica IDEX Mutual Funds, or by any other party.
Transamerica IDEX Mutual Funds
Annual Report 2004
12
TA IDEX T. Rowe Price Small Cap
NOTES TO FINANCIAL STATEMENTS (continued)
At October 31, 2004
(all amounts in thousands)
NOTE 1.–(continued)
Recaptured commissions during the year ended October 31, 2004, of $10 are included in net realized gains in the Statement of Operations.
Securities lending: The Fund may lend securities to enhance fund earnings from investing cash collateral in making such loans to qualified borrowers (typically broker/dealers). The Fund has engaged its custodian bank, IBT, as a lending agent to administer its securities lending program. IBT earned $16 of program income for its services. When the Fund makes a security loan, it receives cash collateral as protection against the risk that the borrower will default on the loan, and records an asset for the cash invested collateral and a liability for the return of the collateral.
Securities on loan are included in Investment securities at value in the Statement of Assets and Liabilities and remain on the Schedule of Investments.
Loans of securities are required to be secured by collateral at least equal to 102% of the value of the securities at inception of the loan, and not less then 100% thereafter. The Fund may invest cash collateral in short-term money market instruments including: U.S. Treasury Bills, U.S. agency obligations, commercial paper, money market mutual funds, repurchase agreements and other highly rated, liquid investments. During the life of securities loans, the collateral and securities loaned remain subject to fluctuation in value. IBT marks to market securities loaned and the collateral each business day. If additional collateral is due (at least $1), IBT collects additional cash collateral from the borrowers. Although securities loaned will be fully collateralized at all times, IBT may experience delays in, or may be prevented from, recovering the collateral on behalf of the Fund. The Fund may recall a loa ned security position at any time from the borrower through IBT. In the event the borrower fails to timely return a recalled security, IBT may indemnify the Fund by purchasing replacement securities for the Fund at its own expense and claiming the collateral to fund such a purchase. IBT absorbs the loss if the collateral value is not sufficient to cover the cost of the replacement securities. If replacement securities are not available, IBT will credit the equivalent cash value to the Fund.
While a security is on loan, the Fund does not have the right to vote that security. However, if time permits, the Fund will attempt to recall a security on loan and vote the proxy.
Income from securities lending is included in the Statement of Operations. The amount of collateral and value of securities on loan are included in the Statement of Assets and Liabilities as well as in the Schedule of Investments.
Real Estate Investment Trusts ("REITs"): There are certain additional risks involved in investing in REITs. These include, but are not limited to, economic conditions, changes in zoning laws, real estate values, property taxes and interest rates.
Security transactions and investment income: Security transactions are recorded on the trade date. Security gains and losses are calculated on the specific identification basis. Dividend income is recorded on the ex-dividend date or, in the case of foreign securities, as soon as the Fund is informed of the ex-dividend date. Interest income, including accretion of discounts and amortization of premiums, is recorded on the accrual basis commencing on the settlement date.
Futures contracts: The Fund may enter into futures contracts to manage exposure to market, interest rate or currency fluctuations. Futures contracts are valued at the settlement price established each day by the board of trade or exchange on which they are traded. The primary risks associated with futures contracts are imperfect correlation between the change in market value of the securities held and the prices of futures contracts; the possibility of an illiquid market and inability of the counterparty to meet the contract terms.
At October 31, 2004, there were no open futures contracts.
Account maintenance fees: If the shareholder account balance falls below $1 by either shareholder action or as a result of market action, a $25 (not in thousands) fee is assessed every year until the balance reaches $1. The fee is assessed by redeeming shares in the shareholder's account.
No fee will be charged under the following conditions:
• accounts opened within the preceding 24 months
• accounts with an active monthly Automatic Investment Plan ($50 (not in thousands) minimum per fund)
• accounts owned by an individual which, when combined by social security number, have a balance of $5 or more
• accounts owned by individuals in the same household (by address) that have a combined balance of $5 or more
• UTMA/UGMA accounts
• Fiduciary accounts
• B-share accounts whose shares have started to convert to A-shares accounts (as long as combined value of both accounts is at least $1)
For the year ended October 31, 2004, this fee totaled $2. These fees are included in Paid in Capital in the Statement of Assets and Liabilities.
Transamerica IDEX Mutual Funds
Annual Report 2004
13
TA IDEX T. Rowe Price Small Cap
NOTES TO FINANCIAL STATEMENTS (continued)
At October 31, 2004
(all amounts in thousands)
NOTE 1.–(continued)
Redemption fees: A short-term trading redemption fee may be assessed on any fund shares in a fund account that are sold during the first five (5) New York Stock Exchange trading days following their purchase date. This redemption fee will equal 2% of the amount redeemed and shares held the longest will be treated as being redeemed first and shares held the shortest as being redeemed last. For the year ended October 31, 2004, the Fund received no redemption fees.
Dividend distributions: Distributions to shareholders are recorded on the ex-dividend date and are determined in accordance with Federal income tax regulations which may differ from GAAP.
NOTE 2. RELATED PARTY TRANSACTIONS
AEGON/Transamerica Fund Advisers, Inc. ("ATFA") is the Fund's investment adviser. AEGON/Transamerica Fund Services, Inc. ("ATFS") is the Fund's administrator. AFSG Securities Corp. ("AFSG") is the Fund's distributor/principal underwriter. AEGON/Transamerica Investor Services, Inc. ("ATIS") is the Fund's transfer agent. ATIS and AFSG are 100% owned by AUSA Holding Company ("AUSA"). ATFA is a directly owned subsidiary of Western Reserve Life Assurance Co. of Ohio (78%) ("WRL") and AUSA (22%). ATFS is a wholly owned subsidiary of WRL. AUSA and WRL are wholly owned indirect subsidiaries of AEGON NV, a Netherlands corporation.
The following schedule reflects the percentage of fund assets owned by affiliated mutual funds (i.e., through the assets allocation funds):
| | | Net
Assets | | % of
Net Assets | |
TA IDEX Asset Allocation –
Conservative Portfolio | | $ | 3,923 | | | | 3 | % | |
| TA IDEX Asset Allocation – Growth Portfolio | | | 38,513 | | | | 26 | % | |
TA IDEX Asset Allocation –
Moderate Growth Portfolio | | | 54,560 | | | | 37 | % | |
TA IDEX Asset Allocation Moderate –
Portfolio | | | 23,234 | | | | 16 | % | |
| Total | | $ | 120,230 | | | | 82 | % | |
Investment advisory fee: The Fund pays management fees to ATFA based on average daily net assets ("ANA") at the following breakpoints:
0.80% of the first $500 million of ANA
0.70% of ANA over $500 million
ATFA has contractually agreed to waive its advisory fee and will reimburse the Fund to the extent that operating expenses, excluding 12b-1 fees, exceed the following stated annual limit:
1.40% Expense Limit
The sub-adviser, T. Rowe Price, has agreed to a pricing discount based on the aggregate assets that they manage in the Transamerica IDEX Mutual Funds. The amount of the discount received by the Fund at October 31, 2004 was $11.
Distribution and service fees: The Fund has a 12b-1 distribution plan under the 1940 Act pursuant to which an annual fee, based on average daily net assets, is paid to the distributor for various disbursements such as broker-dealer account servicing fees and other promotional expenses of the Fund. The Fund is authorized under the 12b-1 plan to pay fees on each class up to the following limits:
| Class A | | | 0.35 | % | |
| Class B | | | 1.00 | % | |
| Class C | | | 1.00 | % | |
| Class C2 | | | 1.00 | % | |
| Class M | | | 0.90 | % | |
Class C2 and Class M merged into Class C on June 15, 2004 and September 24, 2004, respectively.
In the case the Fund or a class of shares of the Fund is closed to new investors or investments, the Fund is authorized to pay 12b-1 fees for past sales and distribution efforts and present and past investor services.
Underwriter commissions relate to front-end sales charges imposed for Class A and M shares and contingent deferred sales charges from Classes B, C, M and certain A share redemptions. For the year ended October 31, 2004, the underwriter commissions were as follows:
| Received by Underwriter | | $ | 205 | | |
| Retained by Underwriter | | | 7 | | |
| Contingent Deferred Sales Charge | | | 33 | | |
Administrative services: The Fund has entered into an agreement with ATFS for financial and legal fund administration services, which includes such items as compliance, expenses, financial statements and other reporting, distributions, tax returns, prospectus preparation, board of trustees meeting support and other legal matters. The Fund pays ATFS an annual fee of 0.015% of average net assets. The Legal fees on the Statement of Operations are for fees paid to external legal counsel.
The Fund paid ATFS $24 for the year ended October 31, 2004.
Transfer agent fees: The Fund pays ATIS an annual per-account charge of $20 (not in thousands) for each open account and $1.63 (not in thousands) for each closed account. There is no new account charge. The transfer agent fees on the Statement of Operations are made up of
Transamerica IDEX Mutual Funds
Annual Report 2004
14
TA IDEX T. Rowe Price Small Cap
NOTES TO FINANCIAL STATEMENTS (continued)
At October 31, 2004
(all amounts in thousands)
NOTE 2.–(continued)
fees paid to ATIS and costs associated with shareholder statements. The Fund paid ATIS $135 for the year ended October 31, 2004.
Deferred compensation plan: Each eligible Fund Trustee may elect participation in the Deferred Compensation Plan ("the Plan"). Under the Plan, such Trustees may defer payment of a percentage of their total fees earned as a Fund Trustee. These deferred amounts may be invested in any Transamerica IDEX Mutual Fund. At October 31, 2004, the value of invested plan amount was $3. Invested plan amounts and the total liability for deferred compensation to the Trustees under the Plan at October 31, 2004, are included in the accompanying Statement of Assets and Liabilities.
NOTE 3. INVESTMENT TRANSACTIONS
The cost of securities purchased and proceeds from securities sold (excluding short-term securities) for the year ended October 31, 2004, were as follows:
| Purchases of securities: | | | |
| Long-Term excluding U.S. Government | | $ | 72,089 | | |
| U.S. Government | | | – | | |
| Proceeds from maturities and sales of securities: | | | |
| Long-Term excluding U.S. Government | | | 40,298 | | |
| U.S. Government | | | – | | |
NOTE 4. FEDERAL INCOME TAX MATTERS
The Fund has not made any provision for federal income or excise taxes due to its policy to distribute all of its taxable income and capital gains to its shareholders and otherwise qualify as a regulated investment company under the Internal Revenue Code. Income and capital gain distributions are determined in accordance with income tax regulations, which may differ from GAAP. These differences are primarily due to differing treatment for items including, but not limited to, wash sales, net operating losses and capital loss carryforwards.
Reclassifications between Undistributed net investment income (loss), Undistributed net realized capital gains (loss) and Shares of beneficial interest are made to reflect income and gains available for distribution under federal tax regulations. Results of operations and net assets are not affected by these reclassifications. These reclassifications are as follows:
Shares of beneficial interest, unlimited
shares authorized | | $ | (1,661 | ) | |
| Accumulated net investment income (loss) | | | 1,649 | | |
Accumulated net realized gain (loss) from
investment securities and futures contracts | | | 12 | | |
The capital loss carryforwards are available to offset future realized capital gains through the period listed:
Capital Loss
Carryforward | | Available through | |
| $ | 818 | | | October 31, 2011 | |
The capital loss carryforward utilized during the year ended October 31, 2004 was $6,171.
The tax basis components of distributable earnings as of October 31, 2004, are as follows:
| Undistributed Ordinary Income | | $ | – | | |
| Undistributed Long-term Capital Gains | | $ | – | | |
| Capital Loss Carryforward | | $ | (818 | ) | |
| Net Unrealized Appreciation (Depreciation) | | $ | 9,574 | | |
The aggregate cost of investments and composition of unrealized appreciation (depreciation) for federal income tax purposes as of October 31, 2004, are as follows:
| Federal Tax Cost Basis | | $ | 170,197 | | |
| Unrealized Appreciation | | $ | 22,178 | | |
| Unrealized (Depreciation) | | | (12,604 | ) | |
| Net Unrealized Appreciation (Depreciation) | | $ | 9,574 | | |
NOTE 5. OTHER MATTERS
Transamerica IDEX Mutual Funds ("TA IDEX"), and certain of its affiliated entities, have received requests for information from the Staff of the Securities and Exchange Commission in connection with market timing and late trading within the funds. TA IDEX and the affiliated entities have voluntarily cooperated in the investigation and have been providing the information as requested.
Transamerica IDEX Mutual Funds
Annual Report 2004
15
Report of Independent Registered Certified Public Accounting Firm
To the Board of Trustees and Shareholders of
TA IDEX T. Rowe Price Small Cap
In our opinion, the accompanying statement of assets and liabilities, including the schedule of investments, and the related statements of operations and of changes in net assets and the financial highlights present fairly, in all material respects, the financial position of TA IDEX T. Rowe Price Small Cap (the "Fund") (one of the portfolios constituting the Transamerica IDEX Mutual Funds) at October 31, 2004, the results of its operations for the year then ended, the changes in its net assets for each of the two years in the period then ended and the financial highlights for each of the periods indicated, in conformity with accounting principles generally accepted in the United States of America. These financial statements and financial highlights (hereafter referred to as "financial statements") are the responsibility of the Fund's management; our responsibility is to express an opinion on t hese financial statements based on our audits. We conducted our audits of these financial statements in accordance with the standards of the Public Company Accounting Oversight Board (United States). Those standards require that we plan and perform the audit to obtain reasonable assurance about whether the financial statements are free of material misstatement. An audit includes examining, on a test basis, evidence supporting the amounts and disclosures in the financial statements, assessing the accounting principles used and significant estimates made by management, and evaluating the overall financial statement presentation. We believe that our audits, which included confirmation of securities at October 31, 2004 by correspondence with the custodian and brokers, provide a reasonable basis for our opinion.

PricewaterhouseCoopers LLP
Tampa, Florida
December 28, 2004
Transamerica IDEX Mutual Funds
Annual Report 2004
16
TA IDEX T. Rowe Price Small Cap
SUPPLEMENTAL INFORMATION
RESULTS OF SHAREHOLDER PROXY (unaudited)
At a special meeting of Class M shareholders of each series of Transamerica IDEX (except TA IDEX Federated Tax Exempt and TA IDEX Protected Principal Stock) held on September 2, 2004, the results of the Proposal were as follows:
Proposal 1: Approval of a conversion of Class M shares into Class C shares of the Funds, which will result in bearing the distribution and service fees payable under the 12b-1 Plan of Distribution for the Class C shares of the Funds.
| For | | Against | | Abstentions/Broker Non-Votes | |
| | 84.47 | % | | | 6.02 | % | | | 9.51 | % | |
Transamerica IDEX Mutual Funds
Annual Report 2004
17
TA IDEX T. Rowe Price Tax-Efficient Growth
MARKET ENVIRONMENT
U.S. stocks produced moderate gains in the twelve month period ended October 31, 2004. In the early months of the reporting period, major equity indexes climbed to two year highs thanks to robust corporate earnings and economic growth and the Federal Reserve Board's ("Fed") highly accommodative monetary policy. As 2004 progressed, equities surrendered some of their gains amid surging oil prices, a deceleration of economic and corporate profit growth, protracted uncertainty prior to the November elections, and rising short-term interest rates. From late June through the end of September, the Fed raised the federal funds target rate from 1.00% to 1.75% in three quarter-point steps.
The last year has been a challenging period for our large-cap growth style of investing. Small-cap shares fared better than large-caps, the Russell 2000 Index returned 11.73% versus 9.41% for the Standard and Poor's 500 Composite Stock Index ("S&P 500"), and as measured by various Russell indexes, value stocks strongly outperformed their growth counterparts across all market capitalizations. In the large-cap universe, as measured by the S&P 500, energy stocks were among the market's best performers, whereas information technology and health care stocks struggled.
PERFORMANCE
For the year ended October 31, 2004, TA IDEX T. Rowe Price Tax-Efficient Growth, Class A returned 0.91%. By comparison its benchmark, the S&P 500, returned 9.41%.
STRATEGY REVIEW
Sector allocations and weak stock selection contributed to the portfolio's underperformance versus the S&P 500.
For example, our lack of exposure to energy and utilities stocks, low exposure to materials and telecommunication services companies, and our overweighting of the weak information technology sector drove our underperformance versus the S&P 500. Stock selection was also unfavorable, as poor performance of Marsh & McLennan Companies, Inc. ("Marsh & McLennan"), State Street Corporation, and Northern Trust Corporation in the financials sector and Clear Channel Communications, Inc. ("Clear Channel") in the consumer discretionary sector also detracted from our results relative to both benchmarks. On the plus side, our positions in technology companies Microsoft Corporation, Altera Corporation, and First Data Corporation helped our performance.
At the end of October, the portfolio held more than 113 stocks that we believe can perform well and be owned over the long term. We often take a contrarian view when companies with strong long-term prospects have some short-term challenges. Although rising interest rates and oil prices and pre-election uncertainty have weighed on the short-term performance of stocks, we believe the current market environment still provides a good opportunity for those who are willing to ride out occasional periods of volatility or lackluster performance to purchase companies with great long-term growth potential at reasonable valuations.
As of October 31st, we emphasized companies in the information technology ("IT"), health care, and financials sectors, whereas stocks of industrials and business services companies represented lesser commitments. We usually avoid energy and utility companies and have very little exposure to the materials and telecommunication services sectors because in our view, companies with good growth prospects and high, su stainable returns on equity are seldom found in these areas. Although these sectors have outperformed traditional growth stocks recently, we believe that growth stocks will return to favor at some point and that they are still the best investment vehicles for long-term taxable investors.
The industrials and business services sector contributed the second most to the portfolio's absolute performance over the last year, led by General Electric Company ("GE"). Consumer discretionary stocks also performed well, especially online auctioneer eBay Inc. ("eBay"). In contrast, the IT sector detracted the most from our results. The semiconductor and semiconductor equipment industry was the worst performing ind ustry represented in the portfolio.
Our five largest individual contributors to portfolio performance in the last twelve months were eBay, UnitedHealth Group Incorporated, GE, Yahoo! Inc., and Starbucks Corporation. Our five largest detractors were Intel Corporation, Clear Channel, Marsh & McLennan, Tiffany & Co., and Merck & Co., Inc.
Donald J. Peters
Manager
T. Rowe Price Associates, Inc.
Transamerica IDEX Mutual Funds
Annual Report 2004
1
TA IDEX T. Rowe Price Tax-Efficient Growth
Comparison of change in value of $10,000 investment in Class A shares and its comparative index.
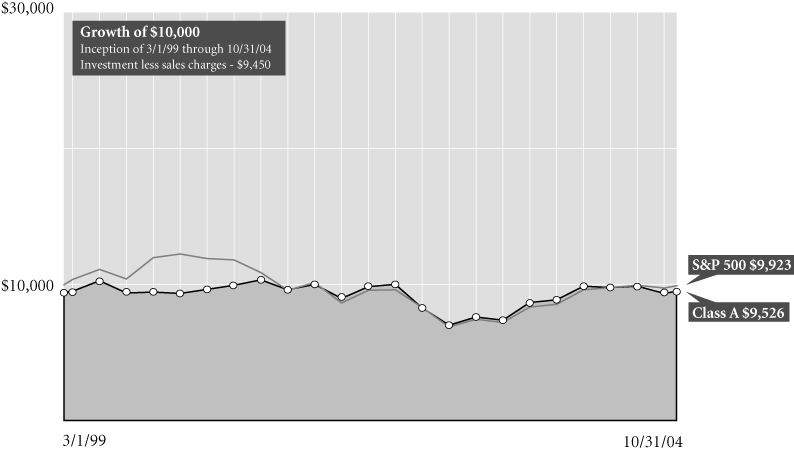
Transamerica IDEX Mutual Funds
Average Annual Total Return for Periods Ended 10/31/04
| | | 1 year | | 5 years | | From
Inception | | Inception
Date | |
| Class A (NAV) | | | 0.83 | % | | | (0.33 | )% | | | 0.12 | % | | 3/1/99 | |
| Class A (POP) | | | (4.72 | )% | | | (1.45 | )% | | | (0.87 | )% | | 3/1/99 | |
| Return after taxes on distributions2 | | | (4.72 | )% | | | (1.53 | )% | | | (0.97 | )% | | 3/1/99 | |
| Return after taxes on distributions and sale of fund shares2 | | | (3.07 | )% | | | (1.28 | )% | | | (0.80 | )% | | 3/1/99 | |
| S&P 5001 | | | 9.41 | % | | | (2.21 | )% | | | (0.14 | )% | | 3/1/99 | |
| Class B (NAV) | | | 0.20 | % | | | (0.98 | )% | | | (0.52 | )% | | 3/1/99 | |
| Class B (POP) | | | (4.80 | )% | | | (1.18 | )% | | | (0.52 | )% | | 3/1/99 | |
| Class C (NAV) | | | 0.17 | % | | | – | | | | 10.76 | % | | 11/11/02 | |
| Class C (POP) | | | (0.83 | )% | | | – | | | | 10.76 | % | | 11/11/02 | |
NOTES
1 The Standard & Poor's 500 Composite Stock (S&P 500) Index is an unmanaged index used as a general measure of market performance. Calculations assume dividends and capital gains are reinvested and do not include any managerial expenses. From inception calculation is based on life of Class A shares. Source: Standard & Poor's Micropal®© Micropal, Inc. 2004 – 1-800-596-5323 – http://www.micropal.com.
2 The after-tax returns are calculated using the historic highest individual federal marginal income tax rates and do not reflect the impact of state and local taxes.
The performance data presented represents past performance, future results may vary. Performance data does not reflect the deduction of taxes that would be paid on fund distributions or the redemption of fund shares. Investment return and principal value will fluctuate so that an investor's shares, when redeemed, may be worth more or less than their original cost. Current performance may be lower or higher than performance quoted.
Public Offering Price (POP) returns include the reinvestment of dividends and capital gains and reflect the maximum sales charge of 5.5% for A shares or the maximum applicable contingent deferred sales charge (5% in the 1st year, decreasing to 0% after 6 years) for Class B shares and 1% (during the first 12 months) for Class C shares. Shares purchased prior to March 1, 2004 are subject to a maximum applicable contingent deferred sales charge (5% in the 1st year, decreasing to 0% after 7 years) for Class B shares and (2% in the 1st year, decreasing to 0% after 2 years) for Class C shares. Net Asset Va lue (NAV) returns include the reinvestment of dividends and capital gains but do not reflect any sales charges.
Funds managed for tax efficiency may not be suitable for IRAs and other nontaxable accounts, as the pre-tax returnsmay be lower than a similar fund that is not managed with tax considerations. In addition, while tax managed funds have the ability to distribute capital gains, investors may still incur a taxable gain upon liquidating their account.
This material must be preceded or accompanied by a current prospectus, which includes specific contents regarding the investment objectives and policies of this fund.
Annual Report 2004
2
TA IDEX T. Rowe Price Tax-Efficient Growth
UNDERSTANDING YOUR FUND'S EXPENSES (unaudited)
SHAREHOLDER EXPENSES
The following Example is intended to help you understand your ongoing costs (in dollars and cents) of investing in a Fund and to compare these costs with the ongoing costs of investing in other funds.
The Example is based on an investment of $1,000 invested at the beginning of the period and held for the entire period from May 1, 2004 to October 31, 2004.
ACTUAL EXPENSES
The first line in the table below provides information about actual account values and actual expenses. You may use the information in this line, together with the amount you invested, to estimate the expenses that you paid over the period. Simply divide your account value by $1,000 (for example, an $8,600 account value divided by $1,000 = 8.6), then multiply the result by the number in the first line of your Fund under the heading entitled "Expenses Paid During Period" to estimate the expenses you paid on your account during this period.
HYPOTHETICAL EXAMPLE FOR COMPARISON PURPOSES
The second line in the table below provides information about hypothetical account values and hypothetical expenses based on each Fund's actual expense ratio and an assumed rate of return of 5% per year before expenses, which is not the Fund's actual return. The hypothetical account values and expenses may not be used to estimate the actual ending account balance or expenses you paid for the period. You may use this information to compare the ongoing costs of investing in your Fund and other funds. To do so, compare this 5% hypothetical example with the 5% hypothetical examples that appear in the shareholder reports of the other funds.
Please note that the expenses shown in the table are meant to highlight your ongoing costs only and do not reflect any transactional costs, such as sales charges, redemption fees, brokerage commissions paid on purchases and sales of fund shares. Therefore, the second line under each Fund in the table is useful in comparing ongoing costs only, and will not help you determine the relative total costs of owning different funds. In addition, note that the expenses shown in the table are meant to highlight your ongoing costs and do not reflect any transaction costs.
| | Beginning
Account
Value | | Ending
Account
Value | | Annualized
Expense
Ratio | |
Expenses Paid
During Period (a) | |
| Class A | |
| Actual | | $ | 1,000.00 | | | $ | 980.40 | | | | 1.72 | % | | $ | 8.56 | | |
| Hypothetical (b) | | | 1,000.00 | | | | 1,016.49 | | | | 1.72 | | | | 8.72 | | |
| Class B | |
| Actual | | | 1,000.00 | | | | 977.80 | | | | 2.29 | | | | 11.38 | | |
| Hypothetical (b) | | | 1,000.00 | | | | 1,013.62 | | | | 2.29 | | | | 11.59 | | |
| Class C | |
| Actual | | | 1,000.00 | | | | 972.40 | | | | 2.35 | | | | 11.68 | | |
| Hypothetical (b) | | | 1,000.00 | | | | 1,013.32 | | | | 2.35 | | | | 11.89 | | |
(a) Expenses are calculated using each Fund's annualized expense ratio (as disclosed in the table), multiplied by the average account value for the period, multiplied by number of days in the period (184 days), and divided by the number of days in the year (366 days).
(b) 5% return per year before expenses
GRAPHIC PRESENTATION OF SCHEDULE OF INVESTMENTS
By Sector
At October 31, 2004
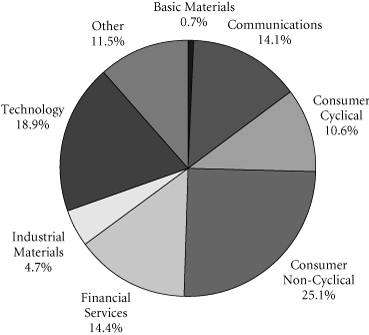
This chart shows the percentage breakdown by sector of the Fund's total investment securities.
Transamerica IDEX Mutual Funds
Annual Report 2004
3
TA IDEX T. Rowe Price Tax-Efficient Growth
SCHEDULE OF INVESTMENTS
At October 31, 2004
(all amounts except share amounts in thousands)
| | | Shares | | Value | |
| COMMON STOCKS (101.2%) | |
| Aerospace (0.5%) | |
| Boeing Co. (The) | | | 2,600 | | | $ | 130 | | |
| Amusement & Recreation Services (1.4%) | |
| Station Casinos, Inc. | | | 900 | | | | 46 | | |
| Walt Disney Co. (a) | | | 13,600 | | | | 343 | | |
| Apparel Products (0.5%) | |
| Cintas Corp. | | | 3,600 | | | | 155 | | |
| Automotive (0.9%) | |
| Harley-Davidson, Inc. | | | 4,700 | | | | 271 | | |
| Beverages (2.6%) | |
| Anheuser-Busch Cos., Inc. | | | 2,400 | | | | 120 | | |
| Coca-Cola Co. (The) | | | 7,300 | | | | 297 | | |
| PepsiCo, Inc. | | | 6,670 | | | | 331 | | |
| Business Services (9.3%) | |
| ChoicePoint, Inc. (b) | | | 3,700 | | | | 154 | | |
| Clear Channel Communications, Inc. | | | 8,200 | | | | 274 | | |
| eBay, Inc. (a)(b) | | | 6,900 | | | | 673 | | |
| Equifax, Inc. | | | 1,700 | | | | 44 | | |
| First Data Corp. | | | 6,800 | | | | 281 | | |
| Monster Worldwide, Inc. (b) | | | 4,300 | | | | 121 | | |
| Moody's Corp. | | | 3,800 | | | | 296 | | |
| Omnicom Group, Inc. | | | 4,900 | | | | 387 | | |
| Robert Half International, Inc. (a) | | | 6,500 | | | | 172 | | |
| WPP Group PLC, ADR (a) | | | 5,400 | | | | 271 | | |
| Chemicals & Allied Products (3.3%) | |
| Avon Products, Inc. | | | 4,200 | | | | 166 | | |
| Colgate-Palmolive Co. | | | 2,700 | | | | 120 | | |
| Ecolab, Inc. (a) | | | 3,600 | | | | 122 | | |
| Procter & Gamble Co. | | | 8,600 | | | | 440 | | |
| Valspar Corp. | | | 2,000 | | | | 93 | | |
| Commercial Banks (7.8%) | |
| Bank of New York Co. (The), Inc. | | | 8,600 | | | | 279 | | |
| Citigroup, Inc. | | | 17,759 | | | | 788 | | |
| Mellon Financial Corp. | | | 4,000 | | | | 116 | | |
| Northern Trust Corp. | | | 8,000 | | | | 340 | | |
| State Street Corp. | | | 7,200 | | | | 324 | | |
| Wells Fargo & Co. | | | 6,400 | | | | 382 | | |
| Communication (1.5%) | |
| Certegy, Inc. | | | 4,800 | | | | 170 | | |
| Viacom, Inc.–Class B (a) | | | 7,300 | | | | 266 | | |
| Communications Equipment (0.3%) | |
| Nokia OYJ, Sponsored ADR | | | 5,500 | | | | 85 | | |
| | | Shares | | Value | |
| Computer & Data Processing Services (7.8%) | |
| Adobe Systems, Inc. (a) | | | 800 | | | $ | 45 | | |
| Automatic Data Processing, Inc. | | | 4,200 | | | | 182 | | |
| Computer Associates International, Inc. (a) | | | 3,900 | | | | 108 | | |
| Electronic Arts, Inc. (b) | | | 500 | | | | 22 | | |
| Intuit, Inc. (b) | | | 2,500 | | | | 113 | | |
| Microsoft Corp. | | | 38,200 | | | | 1,069 | | |
| Oracle Corp. (b) | | | 21,000 | | | | 266 | | |
| SAP AG, Sponsored ADR | | | 1,400 | | | | 60 | | |
| Yahoo!, Inc. (b) | | | 9,800 | | | | 355 | | |
| Computer & Office Equipment (4.6%) | |
| Cisco Systems, Inc. (b) | | | 31,300 | | | | 601 | | |
| Dell, Inc. (b) | | | 17,500 | | | | 614 | | |
| EMC Corp. (a)(b) | | | 7,700 | | | | 99 | | |
| Drug Stores & Proprietary Stores (1.7%) | |
| CVS Corp. | | | 4,200 | | | | 183 | | |
| Walgreen Co. | | | 8,300 | | | | 298 | | |
| Educational Services (0.6%) | |
| Apollo Group, Inc.–Class A (b) | | | 2,650 | | | | 175 | | |
| Electronic & Other Electric Equipment (3.5%) | |
| General Electric Co. | | | 29,150 | | | | 995 | | |
| Electronic Components & Accessories (10.9%) | |
| Altera Corp. (a)(b) | | | 14,700 | | | | 334 | | |
| Analog Devices, Inc. (a) | | | 7,400 | | | | 298 | | |
| Broadcom Corp.–Class A (a)(b) | | | 3,500 | | | | 95 | | |
| Intel Corp. | | | 25,100 | | | | 559 | | |
| Linear Technology Corp. | | | 11,600 | | | | 439 | | |
| Maxim Integrated Products, Inc. | | | 10,800 | | | | 475 | | |
| Microchip Technology, Inc. | | | 6,300 | | | | 191 | | |
| Molex, Inc.–Class A | | | 3,500 | | | | 90 | | |
| Texas Instruments, Inc. | | | 13,700 | | | | 335 | | |
| Xilinx, Inc. | | | 9,400 | | | | 288 | | |
| Fabricated Metal Products (0.6%) | |
| Gillette Co. (The) | | | 4,000 | | | | 166 | | |
| Food & Kindred Products (0.7%) | |
| General Mills, Inc. | | | 2,300 | | | | 102 | | |
| WM Wrigley Jr. Co. | | | 1,700 | | | | 111 | | |
| Furniture & Home Furnishings Stores (0.9%) | |
| Bed Bath & Beyond, Inc. (a)(b) | | | 3,300 | | | | 135 | | |
| Williams-Sonoma, Inc. (b) | | | 3,600 | | | | 137 | | |
| Hotels & Other Lodging Places (0.1%) | |
| Marriott International, Inc.–Class A | | | 500 | | | | 27 | | |
| Industrial Machinery & Equipment (0.9%) | |
| Applied Materials, Inc. (b) | | | 9,100 | | | | 147 | | |
| Illinois Tool Works, Inc. | | | 1,200 | | | | 111 | | |
The notes to the financial statements are an integral part of this report.
Transamerica IDEX Mutual Funds
Annual Report 2004
4
TA IDEX T. Rowe Price Tax-Efficient Growth
SCHEDULE OF INVESTMENTS (continued)
At October 31, 2004
(all amounts except share amounts in thousands)
| | | Shares | | Value | |
| Insurance (7.1%) | |
| AMBAC Financial Group, Inc. | | | 2,400 | | | $ | 187 | | |
| American International Group, Inc. | | | 9,763 | | | | 593 | | |
| Anthem, Inc. (b) | | | 1,100 | | | | 88 | | |
| UnitedHealth Group, Inc. | | | 9,200 | | | | 666 | | |
| WellPoint Health Networks (b) | | | 5,000 | | | | 488 | | |
| Insurance Agents, Brokers & Service (0.7%) | |
| Marsh & McLennan Cos., Inc. | | | 7,100 | | | | 196 | | |
| Lumber & Other Building Materials (2.1%) | |
| Home Depot, Inc. | | | 14,700 | | | | 604 | | |
| Management Services (0.6%) | |
| Paychex, Inc. | | | 5,200 | | | | 171 | | |
| Manufacturing Industries (0.2%) | |
| International Game Technology | | | 1,600 | | | | 53 | | |
| Medical Instruments & Supplies (3.5%) | |
| Baxter International, Inc. | | | 2,800 | | | | 86 | | |
| Guidant Corp. | | | 2,400 | | | | 160 | | |
| Medtronic, Inc. | | | 11,900 | | | | 608 | | |
| Stryker Corp. | | | 3,400 | | | | 146 | | |
| Motion Pictures (1.2%) | |
| Time Warner, Inc. (b) | | | 20,000 | | | | 333 | | |
| Paper & Allied Products (0.7%) | |
| 3M Co. | | | 600 | | | | 47 | | |
| Kimberly-Clark Corp. | | | 2,500 | | | | 149 | | |
| Personal Credit Institutions (0.6%) | |
| SLM Corp. (a) | | | 4,100 | | | | 186 | | |
| Pharmaceuticals (9.5%) | |
| Abbott Laboratories | | | 6,100 | | | | 260 | | |
| Amgen, Inc. (b) | | | 5,900 | | | | 335 | | |
| AstraZeneca PLC, Sponsored ADR (a) | | | 2,000 | | | | 82 | | |
| Eli Lilly & Co. | | | 3,400 | | | | 187 | | |
| GlaxoSmithKline PLC, ADR (a) | | | 6,700 | | | | 284 | | |
| Hospira, Inc. (b) | | | 610 | | | | 19 | | |
| Johnson & Johnson | | | 10,400 | | | | 607 | | |
| Medco Health Solutions, Inc. (b) | | | 1,109 | | | | 38 | | |
| Merck & Co., Inc. | | | 3,100 | | | | 97 | | |
| Pfizer, Inc. | | | 22,585 | | | | 654 | | |
| Wyeth | | | 4,100 | | | | 163 | | |
| Printing & Publishing (1.3%) | |
| McGraw-Hill Cos. (The), Inc. (a) | | | 4,400 | | | | 379 | | |
| Radio & Television Broadcasting (0.9%) | |
| IAC/InterActiveCorp (a)(b) | | | 3,800 | | | | 82 | | |
| Univision Communications, Inc.–Class A (b) | | | 5,500 | | | | 170 | | |
| | | Shares | | Value | |
| Restaurants (0.8%) | |
| Starbucks Corp. (b) | | | 4,300 | | | $ | 227 | | |
| Retail Trade (0.6%) | |
| Amazon.Com, Inc. (a)(b) | | | 1,900 | | | | 65 | | |
| Tiffany & Co. | | | 4,100 | | | | 120 | | |
| Rubber & Misc. Plastic Products (0.4%) | |
| Nike, Inc.–Class B | | | 1,300 | | | | 106 | | |
| Security & Commodity Brokers (2.2%) | |
| American Express Co. | | | 4,400 | | | | 233 | | |
| Charles Schwab Corp. (The) | | | 14,600 | | | | 134 | | |
| Franklin Resources, Inc. | | | 4,200 | | | | 255 | | |
| Telecommunications (0.7%) | |
| Vodafone Group PLC, Sponsored ADR | | | 8,000 | | | | 206 | | |
| Transportation & Public Utilities (0.6%) | |
| Expeditors International of Washington, Inc. | | | 2,800 | | | | 160 | | |
| U.S. Government Agencies (2.4%) | |
| Fannie Mae | | | 4,400 | | | | 309 | | |
| Freddie Mac | | | 5,800 | | | | 386 | | |
| Variety Stores (3.7%) | |
| Dollar General Corp. | | | 9,600 | | | | 185 | | |
| Family Dollar Stores, Inc. | | | 3,900 | | | | 115 | | |
| Wal-Mart Stores, Inc. | | | 14,000 | | | | 755 | | |
| Water Transportation (0.2%) | |
| Carnival Corp. | | | 900 | | | | 45 | | |
| Wholesale Trade Nondurable Goods (0.8%) | |
| SYSCO Corp. | | | 7,300 | | | | 236 | | |
| Total Common Stocks (cost: $21,734) | | | | | | | 28,937 | | |
| | | Principal | | Value | |
| SECURITY LENDING COLLATERAL (13.1%) | |
| Debt (12.2%) | |
| Bank Notes (2.3%) | |
Bank of America
1.77%, due 12/03/2004 | | $ | 183 | | | $ | 183 | | |
| 1.88%, due 12/23/2004 | | | 61 | | | | 61 | | |
| 1.77%, due 01/18/2005 | | | 122 | | | | 122 | | |
Canadian Imperial Bank of Commerce
1.86%, due 11/04/2004 | | | 274 | | | | 274 | | |
Credit Suisse First Boston Corp.
1.83%, due 09/09/2005 | | | 30 | | | | 30 | | |
| Commercial Paper (1.3%) | |
Clipper Receivables Corp.
1.79%, due 11/12/2004 | | | 91 | | | | 91 | | |
Delaware Funding Corp. 144A
1.85%, due 11/19/2004 | | | 30 | | | | 30 | | |
The notes to the financial statements are an integral part of this report.
Transamerica IDEX Mutual Funds
Annual Report 2004
5
TA IDEX T. Rowe Price Tax-Efficient Growth
SCHEDULE OF INVESTMENTS (continued)
At October 31, 2004
(all amounts except share amounts in thousands)
| | | Principal | | Value | |
| Commercial Paper (continued) | | | |
Falcon Asset Securitization Corp. 144A
1.78%, due 11/04/2004 | | $ | 91 | | | $ | 91 | | |
| 1.75%, due 11/10/2004 | | | 122 | | | | 122 | | |
Galaxy Funding 144A
1.88%, due 11/22/2004 | | | 30 | | | | 30 | | |
| Euro Dollar Terms (5.7%) | | | |
Bank of Montreal
1.88%, due 11/24/2004 | | | 288 | | | | 288 | | |
BNP Paribas
1.77%, due 11/10/2004
1.80%, due 11/23/2004
1.98%, due 12/27/2004 | | | 152
122
122 | | | | 152
122
122 | | |
Calyon
1.70%, due 11/24/2004 | | | 16 | | | | 16 | | |
Citigroup
2.06%, due 01/25/2005 | | | 304 | | | | 304 | | |
Den Danske Bank
1.82%, due 11/19/2004 | | | 152 | | | | 152 | | |
Dexia Group
2.04%, due 01/21/2005 | | | 71 | | | | 71 | | |
HBOS Halifax Bank of Scotland
2.03%, due 01/21/2005 | | | 61 | | | | 61 | | |
Royal Bank of Scotland
2.01%, due 01/20/2005 | | | 122 | | | | 122 | | |
Toronto Dominion Bank
1.70%, due 11/08/2004 | | | 61 | | | | 61 | | |
Wells Fargo
1.87%, due 11/22/2004 | | | 152 | | | | 152 | | |
| | | Principal | | Value | |
| Promissory Notes (1.2%) | | | |
Goldman Sachs Group Inc.
1.90%, due 12/29/2004 | | $ | 128 | | | $ | 128 | | |
| 1.88%, due 01/27/2005 | | | 213 | | | | 213 | | |
| Repurchase Agreements (1.7%) | | | |
Merrill Lynch & Co., Inc. 1.92%
Repurchase Agreement dated
10/29/04 to be repurchased at $487 on
11/01/04 (c) | | | 487 | | | | 487 | | |
| | | Shares | | Value | |
| Investment Companies (0.9%) | | | |
| Money Market Funds (0.9%) | | | |
Merrill Lynch Premier Institutional Fund
1-day yield of 1.71% | | | 149,745 | | | $ | 150 | | |
Merrimac Cash Fund, Premium Class
1-day yield of 1.46% | | | 109,582 | | | | 109 | | |
| Total Security Lending Collateral (cost: $3,744) | | | | | | | 3,744 | | |
| Total Investment Securities (cost: $25,478) | | | | | | $ | 32,681 | | |
| SUMMARY: | | | |
| Investments, at value | | | 114.3 | % | | | 32,681 | | |
| Liabilities in excess of other assets | | | (14.3 | )% | | | (4,092 | ) | |
| Net assets | | | 100.0 | % | | $ | 28,589 | | |
NOTES TO SCHEDULE OF INVESTMENTS:
(a) At October 31, 2004, all or a portion of this security is on loan (see Note 1). The value at October 31, 2004, of all securities on loan is $3,628.
(b) No dividends were paid during the preceding twelve months.
(c) Cash collateral for the Repurchase Agreements, valued at $498, that serve as collateral for securities lending are invested in corporate bonds with interest rates and maturity dates ranging from 0.00% - 9.75% and 05/15/2005 - 9/15/2033, respectively.
DEFINITIONS:
144A 144A Securities are registered pursuant to the rule 144A of the Securities Act of 1933. These securities are deemed to be liquid for purposes of compliance limitations on holdings of illiquid securities and may be resold as transactions exempt from registration normally, to qualified institutional buyers. At October 31, 2004 these securities aggregated $273 or 1.0% of the net assets of the Fund.
ADR American Depositary Receipt
The notes to the financial statements are an integral part of this report.
Transamerica IDEX Mutual Funds
Annual Report 2004
6
TA IDEX T. Rowe Price Tax-Efficient Growth
STATEMENT OF ASSETS AND LIABILITIES
At October 31, 2004
(all amounts except per share amounts in thousands)
| Assets: | | | |
Investment securities, at value (cost: $25,478)
(including securities loaned of $3,628) | | $ | 32,681 | | |
| Receivables: | |
| Shares of beneficial interest sold | | | 4 | | |
| Interest | | | 1 | | |
| Dividends | | | 25 | | |
| Other | | | 2 | | |
| | | | 32,713 | | |
| Liabilities: | | | |
| Accounts payable and accrued liabilities: | |
| Shares of beneficial interest redeemed | | | 22 | | |
| Management and advisory fees | | | 44 | | |
| Distribution fees | | | 18 | | |
| Transfer agent fees | | | 19 | | |
| Due to custodian | | | 219 | | |
| Payable for collateral for securities on loan | | | 3,744 | | |
| Other | | | 58 | | |
| | | | 4,124 | | |
| Net Assets | | $ | 28,589 | | |
| Net Assets Consist of: | | | |
Shares of beneficial interest, unlimited shares
authorized, no par value | | $ | 27,225 | | |
| Accumulated net investment income (loss) | | | (1 | ) | |
Accumulated net realized gain (loss) from investment
securities | | | (5,838 | ) | |
Net unrealized appreciation (depreciation) on
investment securities | | | 7,203 | | |
| Net Assets | | $ | 28,589 | | |
| Net Assets by Class: | | | |
| Class A | | $ | 11,281 | | |
| Class B | | | 13,038 | | |
| Class C | | | 4,270 | | |
| Shares Outstanding: | | | |
| Class A | | | 1,136 | | |
| Class B | | | 1,347 | | |
| Class C | | | 441 | | |
| Net Asset Value Per Share: | | | |
| Class A | | $ | 9.93 | | |
| Class B | | | 9.68 | | |
| Class C | | | 9.68 | | |
| Maximum Offering Price Per Share (a): | | | |
| Class A | | $ | 10.51 | | |
(a) Includes the maximum selling commission (represented as a percentage of offering price) which is reduced on certain levels of sales as set forth in the Prospectus. Net asset value per share for Classes B and C shares represents offering price. The redemption price for Classes B and C shares equals net asset value less any applicable contingent deferred sales charge.
STATEMENT OF OPERATIONS
For the year ended October 31, 2004
(all amounts in thousands)
| Investment Income: | | | |
| Interest | | $ | 1 | | |
| Dividends | | | 360 | | |
| Income from loaned securities–net | | | 3 | | |
| Less withholding taxes on foreign dividends | | | (1 | ) | |
| | | | 363 | | |
| Expenses: | | | |
| Management and advisory fees | | | 235 | | |
| Transfer agent fees: | |
| Class A | | | 37 | | |
| Class B | | | 41 | | |
| Class C | | | 4 | | |
| Class C2 | | | 8 | | |
| Class M | | | 5 | | |
| Printing and shareholder reports | | | 12 | | |
| Custody fees | | | 13 | | |
| Administration fees | | | 12 | | |
| Legal fees | | | 1 | | |
| Audit and accounting fees | | | 24 | | |
| Trustees fees | | | 2 | | |
| Registration fees: | |
| Class A | | | 22 | | |
| Class B | | | 10 | | |
| Class C | | | 12 | | |
| Class C2 | | | 3 | | |
| Class M | | | 3 | | |
| Other | | | 3 | | |
| Distribution and service fees: | |
| Class A | | | 44 | | |
| Class B | | | 144 | | |
| Class C | | | 16 | | |
| Class C2 | | | 21 | | |
| Class M | | | 12 | | |
| Total expenses | | | 684 | | |
| Less: | |
| Reimbursement of Class expenses: | | | | | |
| Class A | | | (10 | ) | |
| Class C | | | (11 | ) | |
| Net expenses | | | 663 | | |
| Net Investment Income (Loss) | | | (300 | ) | |
| Net Realized and Unrealized Gain (Loss): | | | |
| Realized Gain (Loss) from investment securities | | | 211 | | |
Increase (decrease) in unrealized appreciation
(depreciation) on investment securities | | | 303 | | |
| Net Gain (Loss) on Investments | | | 514 | | |
Net Increase (Decrease) in Net Assets Resulting
from Operations | | $ | 214 | | |
The notes to the financial statements are an integral part of this report.
Transamerica IDEX Mutual Funds
Annual Report 2004
7
TA IDEX T. Rowe Price Tax-Efficient Growth
STATEMENTS OF CHANGES IN NET ASSETS
For the years ended
(all amounts in thousands)
| | | October 31,
2004 | | October 31,
2003 | |
| Increase (Decrease) in Net Assets From: | |
| Operations: | |
| Net investment income (loss) | | $ | (300 | ) | | $ | (332 | ) | |
Net realized gain (loss) from
investment securities | | | 211 | | | | (3,318 | ) | |
Net unrealized appreciation
(depreciation) on investment
securities | | | 303 | | | | 11,969 | | |
| | | | 214 | | | | 8,319 | | |
| Capital Share Transactions: | |
| Proceeds from shares sold: | |
| Class A | | | 1,616 | | | | 15,466 | | |
| Class B | | | 2,611 | | | | 3,312 | | |
| Class C | | | 217 | | | | 457 | | |
| Class C2 | | | 386 | | | | 775 | | |
| Class M | | | 146 | | | | 244 | | |
| | | | 4,976 | | | | 20,254 | | |
| Cost of shares redeemed: | |
| Class A | | | (3,590 | ) | | | (28,901 | ) | |
| Class B | | | (3,729 | ) | | | (3,349 | ) | |
| Class C | | | (691 | ) | | | (16 | ) | |
| Class C2 | | | (653 | ) | | | (1,024 | ) | |
| Class M | | | (526 | ) | | | (983 | ) | |
| | | | (9,189 | ) | | | (34,273 | ) | |
| Class level exchanges: | |
| Class C | | | 4,376 | | | | – | | |
| Class C2 | | | (3,084 | ) | | | – | | |
| Class M | | | (1,292 | ) | | | – | | |
| | | | – | | | | – | | |
| Automatic conversions: | |
| Class A | | | 49 | | | | – | | |
| Class B | | | (49 | ) | | | – | | |
| | | | – | | | | – | | |
| | | | (4,213 | ) | | | (14,019 | ) | |
| Net increase (decrease) in net assets | | | (3,999 | ) | | | (5,700 | ) | |
| Net Assets: | |
| Beginning of year | | | 32,588 | | | | 38,288 | | |
| End of year | | $ | 28,589 | | | $ | 32,588 | | |
Accumulated Net Investment Income
(Loss) | | $ | (1 | ) | | $ | (1 | ) | |
| | | October 31,
2004 | | October 31,
2003 | |
| Share Activity: | |
| Shares issued: | |
| Class A | | | 159 | | | | 1,908 | | |
| Class B | | | 261 | | | | 381 | | |
| Class C | | | 22 | | | | 51 | | |
| Class C2 | | | 39 | | | | 89 | | |
| Class M | | | 14 | | | | 29 | | |
| | | | 495 | | | | 2,458 | | |
| Shares redeemed: | |
| Class A | | | (353 | ) | | | (3,225 | ) | |
| Class B | | | (377 | ) | | | (403 | ) | |
| Class C | | | (71 | ) | | | (2 | ) | |
| Class C2 | | | (66 | ) | | | (123 | ) | |
| Class M | | | (52 | ) | | | (116 | ) | |
| | | | (919 | ) | | | (3,869 | ) | |
| Class level exchanges: | |
| Class C | | | 441 | | | | – | | |
| Class C2 | | | (305 | ) | | | – | | |
| Class M | | | (135 | ) | | | – | | |
| | | | 1 | | | | – | | |
| Automatic conversions: | |
| Class A | | | 5 | | | | – | | |
| Class B | | | (5 | ) | | | – | | |
| | | | – | | | | – | | |
Net increase (decrease) in shares
outstanding: | | | | | | | | | |
| Class A | | | (189 | ) | | | (1,317 | ) | |
| Class B | | | (121 | ) | | | (22 | ) | |
| Class C | | | 392 | | | | 49 | | |
| Class C2 | | | (332 | ) | | | (34 | ) | |
| Class M | | | (173 | ) | | | (87 | ) | |
| | | | (423 | ) | | | (1,411 | ) | |
The notes to the financial statements are an integral part of this report.
Transamerica IDEX Mutual Funds
Annual Report 2004
8
TA IDEX T. Rowe Price Tax-Efficient Growth
FINANCIAL HIGHLIGHTS
| | | | | For a share of beneficial interest outstanding throughout each period | |
| | | | | Net Asset | | Investment Operations | | Distributions | | Net Asset | |
| | | For the
Period
Ended (d)(g) | | Value,
Beginning
of Period | | Net
Investment
Income (Loss) | | Net Realized
and Unrealized
Gain (Loss) | | Total
Operations | | From Net
Investment
Income | | From Net
Realized
Gains | | Total
Distributions | | Value,
End
of Period | |
| Class A | | 10/31/2004 | | $ | 9.85 | | | $ | (0.06 | ) | | $ | 0.14 | | | $ | 0.08 | | | $ | – | | | $ | – | | | $ | – | | | $ | 9.93 | | |
| | | 10/31/2003 | | | 8.09 | | | | (0.05 | ) | | | 1.81 | | | | 1.76 | | | | – | | | | – | | | | – | | | | 9.85 | | |
| | | 10/31/2002 | | | 9.54 | | | | (0.02 | ) | | | (1.43 | ) | | | (1.45 | ) | | | – | | | | – | | | | – | | | | 8.09 | | |
| | | 10/31/2001 | | | 10.64 | | | | 0.05 | | | | (1.13 | ) | | | (1.08 | ) | | | (0.02 | ) | | | – | | | | (0.02 | ) | | | 9.54 | | |
| | | 10/31/2000 | | | 10.20 | | | | 0.08 | | | | 0.44 | | | | 0.52 | | | | (0.08 | ) | | | – | | | | (0.08 | ) | | | 10.64 | | |
| Class B | | 10/31/2004 | | | 9.66 | | | | (0.12 | ) | | | 0.14 | | | | 0.02 | | | | – | | | | – | | | | – | | | | 9.68 | | |
| | | 10/31/2003 | | | 7.99 | | | | (0.10 | ) | | | 1.77 | | | | 1.67 | | | | – | | | | – | | | | – | | | | 9.66 | | |
| | | 10/31/2002 | | | 9.49 | | | | (0.09 | ) | | | (1.41 | ) | | | (1.50 | ) | | | – | | | | – | | | | – | | | | 7.99 | | |
| | | 10/31/2001 | | | 10.63 | | | | (0.02 | ) | | | (1.12 | ) | | | (1.14 | ) | | | – | | | | – | | | | – | | | | 9.49 | | |
| | | 10/31/2000 | | | 10.19 | | | | 0.02 | | | | 0.44 | | | | 0.46 | | | | (0.02 | ) | | | – | | | | (0.02 | ) | | | 10.63 | | |
| Class C | | 10/31/2004 | | | 9.66 | | | | (0.12 | ) | | | 0.14 | | | | 0.02 | | | | – | | | | – | | | | – | | | | 9.68 | | |
| | | 10/31/2003 | | | 7.91 | | | | (0.11 | ) | | | 1.86 | | | | 1.75 | | | | – | | | | – | | | | ��� | | | | 9.66 | | |
| | | | | | | Ratios/Supplemental Data | |
| | | For the
Period | | Total | | Net Assets,
End of
Period | | Ratio of Expenses
to Average
Net Assets (a) | | Net Investment
Income (Loss)
to Average | | Portfolio
Turnover | |
| | | Ended (g) | | Return (c) | | (000's) | | Net (e) | | Total (f) | | Net Assets (a) | | Rate (b) | |
| Class A | | 10/31/2004 | | | 0.83 | % | | $ | 11,281 | | | | 1.70 | % | | | 1.78 | % | | | (0.56 | )% | | | 5 | % | |
| | | 10/31/2003 | | | 21.76 | | | | 13,057 | | | | 1.70 | | | | 1.85 | | | | (0.56 | ) | | | 50 | | |
| | | 10/31/2002 | | | (15.20 | ) | | | 21,389 | | | | 1.68 | | | | 1.95 | | | | (0.27 | ) | | | 76 | | |
| | | 10/31/2001 | | | (10.14 | ) | | | 8,552 | | | | 1.55 | | | | 2.07 | | | | 0.47 | | | | 30 | | |
| | | 10/31/2000 | | | 5.14 | | | | 5,452 | | | | 1.55 | | | | 2.68 | | | | 0.66 | | | | 58 | | |
| Class B | | 10/31/2004 | | | 0.20 | | | | 13,038 | | | | 2.31 | | | | 2.31 | | | | (1.18 | ) | | | 5 | | |
| | | 10/31/2003 | | | 21.05 | | | | 14,181 | | | | 2.35 | | | | 2.50 | | | | (1.21 | ) | | | 50 | | |
| | | 10/31/2002 | | | (15.84 | ) | | | 11,897 | | | | 2.33 | | | | 2.60 | | | | (0.92 | ) | | | 76 | | |
| | | 10/31/2001 | | | (10.75 | ) | | | 15,500 | | | | 2.20 | | | | 2.72 | | | | (0.18 | ) | | | 30 | | |
| | | 10/31/2000 | | | 4.49 | | | | 7,597 | | | | 2.20 | | | | 3.33 | | | | 0.01 | | | | 58 | | |
| Class C | | 10/31/2004 | | | 0.17 | | | | 4,270 | | | | 2.35 | | | | 3.00 | | | | (1.21 | ) | | | 5 | | |
| | | 10/31/2003 | | | 22.12 | | | | 473 | | | | 2.35 | | | | 2.50 | | | | (1.21 | ) | | | 50 | | |
NOTES TO FINANCIAL HIGHLIGHTS
(a) Annualized.
(b) Not annualized for periods of less than one year.
(c) Total Return has been calculated for the applicable period without deduction of a sales load, if any, on an initial purchase. Periods of less that one year are not annualized.
(d) Per share information is calculated based on average number of shares outstanding for the years ended 10/31/2001, 10/31/2002, 10/31/2003 and 10/31/2004.
(e) Ratio of Net Expenses to Average Net Assets is net of fee waivers and reimbursements by the investment adviser, if any (see note 2).
(f) Ratio of Total Expenses to Average Net Assets includes all expenses before fee waivers and reimbursements by the investment adviser.
(g) TA IDEX T. Rowe Price Tax-Efficient Growth ("the Fund") commenced operations on March 1, 1999. The inception date for the Fund's offering of share Class L was November 11, 2002. Class L was renamed Class C on March 1, 2004. (see note 1)
The notes to the financial statements are an integral part of this report.
Transamerica IDEX Mutual Funds
Annual Report 2004
9
TA IDEX T. Rowe Price Tax-Efficient Growth
NOTES TO FINANCIAL STATEMENTS
At October 31, 2004
(all amounts in thousands)
NOTE 1. ORGANIZATION AND SIGNIFICANT ACCOUNTING POLICIES
Transamerica IDEX Mutual Funds, formerly IDEX Mutual Funds, is a Massachusetts business trust registered under the Investment Company Act of 1940, as amended (the "1940 Act"), as an open-end management investment company. TA IDEX T. Rowe Price Tax-Efficient Growth ("the Fund"), part of Transamerica IDEX Mutual Funds, began operations on March 1, 1999.
On March 1, 2004, the Fund changed its name from IDEX T. Rowe Price Tax-Efficient Growth to TA IDEX T. Rowe Price Tax-Efficient Growth.
In the normal course of business, the Fund enters into contracts that contain a variety of representations and warranties, which provide general indemnifications. The Fund's maximum exposure under these arrangements is unknown, as this would involve future claims that may be made against the Fund and/or its affiliates that have not yet occurred. However, based on experience, the Fund expects the risk of loss to be remote.
See the Prospectus and Statement of Additional Information for a description of the Fund's investment objective.
In preparing the Fund's financial statements in accordance with accounting principles generally accepted in the United States of America ("GAAP"), estimates or assumptions (which could differ from actual results) may be used that affect reported amounts and disclosures. The following policies were consistently followed by the Fund, in accordance with GAAP.
Multiple class operations and expenses: The Fund currently offers three classes of shares, each with a public offering price that reflects different sales charges, if any, and expense levels. All shares designated as Class C shares prior to March 1, 2004, were renamed as Class C2 shares on that date. All shares designated as Class L shares prior to March 1, 2004, were renamed as Class C shares with different sales charges than the previous Class L shares. On June 15, 2004, Class C2 shares merged into Class C. On September 24, 2004, Class M shares merged into Class C. Class B shares will convert to Class A shares eight years after purchase. Income, non-class specific expenses and realized and unrealized gains and losses, are allocated dail y to each class, based upon the value of shares outstanding method as permitted under Rule 18f-3 of the 1940 Act. Each class bears its own specific expenses as well as a portion of general, common expenses.
Pricing of shares: The Fund prices its shares on the basis of the net asset value of each class of shares of the Fund, which is determined as of the close of the New York Stock Exchange ("NYSE") (generally 4:00 p.m. Eastern Time) on each day on which the NYSE is open for trading (other than a day on which there are insufficient changes in the
value of the Fund's portfolio securities to materially affect the Fund's net asset value or a day on which no shares are tendered for redemption and no order to purchase any shares is received).
Security valuations: Fund investments traded on an exchange are valued at the closing price on the day of valuation on the exchange where the security is principally traded. With respect to securities traded on NASDAQ NMS, such closing price may be the last reported sales price or the NASDAQ Official Closing Price.
Securities traded in the over-the-counter market and listed securities for which no sale was reported on that date are valued at the last quoted bid price.
Debt securities are valued by independent pricing services; however, those that mature in sixty days or less are valued at amortized cost, which approximates market.
Investment company securities are valued at net asset value of the underlying portfolio.
Other securities for which quotations are not readily available are valued at fair market value as determined in good faith using guidelines adopted by the Board of Trustees of the Fund, under the supervision of the Fund's Valuation Committee.
Cash: The Fund may leave cash overnight in its cash account with the custodian, Investors Bank & Trust Company ("IBT"). IBT has been contracted on behalf of the Fund to invest the excess cash into a savings
account, which at October 31, 2004, was paying an interest rate of 1.30%.
Throughout the year, the Fund may have a cash overdraft balance. A fee is incurred on this overdraft, calculated by multiplying the overdraft by a rate based on the federal funds rate. This fee is included in Custody fees in the Statement of Operations.
Repurchase agreements: The Fund is authorized to enter into repurchase agreements. The Fund, through IBT, receives delivery of the underlying securities, the value of which at the time of purchase is required to be an amount equal to at least 100% of the resale price. Repurchase agreements involve the risk that the seller will fail to repurchase the security, as agreed. In that case, the Fund will bear the risk of value fluctuations until the security can be sold and may encounter delays and incur costs in liquidating the security. In the event of bankruptcy or insolvency of the seller, delays and costs may be incurred.
Securities lending: The Fund may lend securities to enhance fund earnings from investing cash collateral in making such loans to qualified borrowers (typically broker/dealers). The Fund has engaged its custodian bank, IBT, as a lending agent to administer its securities lending program. IBT earned $1 of program income for its services. When the Fund makes a security loan, it receives cash collateral as protection against the risk that the borrower will default on the loan, and records an asset for the cash invested collateral and a liability for the return of the collateral.
Transamerica IDEX Mutual Funds
Annual Report 2004
10
TA IDEX T. Rowe Price Tax-Efficient Growth
NOTES TO FINANCIAL STATEMENTS (continued)
At October 31, 2004
(all amounts in thousands)
NOTE 1.–(continued)
Securities on loan are included in Investment securities at value in the Statement of Assets and Liabilities and remain on the Schedule of Investments.
Loans of securities are required to be secured by collateral at least equal to 102% of the value of the securities at inception of the loan, and not less then 100% thereafter. The Fund may invest cash collateral in short-term money market instruments including: U.S. Treasury Bills, U.S. agency obligations, commercial paper, money market mutual funds,
repurchase agreements and other highly rated, liquid investments.
During the life of securities loans, the collateral and securities loaned remain subject to fluctuation in value. IBT marks to market securities loaned and the collateral each business day. If additional collateral is due (at least $1), IBT collects additional cash collateral from the borrowers. Although securities loaned will be fully collateralized at all times, IBT may experience delays in, or may be prevented from, recovering the collateral on behalf of the Fund. The Fund may reca ll a loaned security position at any time from the borrower through IBT. In the event the borrower fails to timely return a recalled security, IBT may indemnify the Fund by purchasing replacement securities for the Fund at its own expense and claiming the collateral to fund such a
purchase. IBT absorbs the loss if the collateral value is not sufficient to cover the cost of the replacement securities. If replacement securities are not available, IBT will credit the equivalent cash value to the Fund.
While a security is on loan, the Fund does not have the right to vote that security. However, if time permits, the Fund will attempt to recall a security on loan and vote the proxy.
Income from securities lending is included in the Statement of Operations. The amount of collateral and value of securities on loan are included in the Statement of Assets and Liabilities as well as in the Schedule of Investments.
Security transactions and investment income: Security transactions are recorded on the trade date. Security gains and losses are calculated on the specific identification basis. Dividend income is recorded on the ex-dividend date or, in the case of foreign securities, as soon as the Fund is informed of the ex-dividend date. Interest income, including accretion of discounts and amortization of premiums, is recorded on the accrual basis commencing on the settlement date.
Account maintenance fees: If the shareholder account balance falls below $1 by either shareholder action or as a result of market action, a $25 (not in thousands) fee is assessed every year until the balance reaches $1. The fee is assessed by redeeming shares in the shareholder's account.
No fee will be charged under the following conditions:
• accounts opened within the preceding 24 months
• accounts with an active monthly Automatic Investment Plan ($50 (not in thousands) minimum per fund)
• accounts owned by an individual which, when combined by social security number, have a balance of $5 or more
• accounts owned by individuals in the same household (by address) that have a combined balance of $5 or more
• UTMA/UGMA accounts
• Fiduciary accounts
• B-share accounts whose shares have started to convert to A-shares accounts (as long as combined value of both accounts is at least $1)
For the year ended October 31, 2004, this fee totaled $1. These fees are included in Paid in Capital in the Statement of Assets and Liabilities.
Redemption fees: A short-term trading redemption fee may be assessed on any fund shares in a fund account that are sold during the first five (5) New York Stock Exchange trading days following their purchase date. This redemption fee will equal 2% of the amount redeemed and shares held the longest will be treated as being redeemed first and shares held the shortest as being redeemed last. For the year ended October 31, 2004, the Fund received no redemption fees.
Dividend distributions: Distributions to shareholders are recorded on the ex-dividend date and are determined in accordance with Federal income tax regulations which may differ from GAAP.
NOTE 2. RELATED PARTY TRANSACTIONS
AEGON/Transamerica Fund Advisers, Inc. ("ATFA") is the Fund's
investment adviser. AEGON/Transamerica Fund Services, Inc. ("ATFS") is the Fund's administrator. AFSG Securities Corp. ("AFSG") is the Fund's distributor/principal underwriter. AEGON/Transamerica Investor Services, Inc. ("ATIS") is the Fund's transfer agent. ATIS and AFSG are 100% owned by AUSA Holding Company ("AUSA"). ATFA is a directly owned subsidiary of Western Reserve Life Assurance Co. of Ohio (78%) ("WRL") and AUSA (22%). ATFS is a wholly owned subsidiary of WRL. AUSA and WRL are wholly owned indirect subsidiaries of AEGON NV, a Netherlands corporation.
The following schedule reflects the percentage of fund assets owned by affiliated mutual funds (i.e., through the assets allocation funds):
| | | Net
Assets | | % of
Net Assets | |
TA IDEX Asset Allocation –
Conservative Portfolio | | $ | 3,944 | | | | 14 | % | |
| Total | | $ | 3,944 | | | | 14 | % | |
Transamerica IDEX Mutual Funds
Annual Report 2004
11
TA IDEX T. Rowe Price Tax-Efficient Growth
NOTES TO FINANCIAL STATEMENTS (continued)
At October 31, 2004
(all amounts in thousands)
NOTE 2.–(continued)
Investment advisory fees: The Fund pays management fees to ATFA based on average daily net assets ("ANA") at the following breakpoints:
0.75% of the first $500 million of ANA
0.65% of ANA over $500 million
ATFA has contractually agreed to waive its advisory fee and will reimburse the Fund to the extent that operating expenses, excluding 12b-1 fees, exceed the following stated annual limit:
1.35% Expense Limit
The sub-adviser, T. Rowe Price, has agreed to a pricing discount based on the aggregate assets that they manage in the Transamerica IDEX Mutual Funds. The amount of the discount received by the Fund at October 31, 2004 was $3.
Distribution and service fees: The Fund has a 12b-1 distribution plan under the 1940 Act pursuant to which an annual fee, based on average daily net assets, is paid to the distributor for various disbursements such as broker-dealer account servicing fees and other promotional expenses of the Fund. The Fund is authorized under the 12b-1 plan to pay fees on each class up to the following limits:
| Class A | | | 0.35 | % | |
| Class B | | | 1.00 | % | |
| Class C | | | 1.00 | % | |
| Class C2 | | | 1.00 | % | |
| Class M | | | 0.90 | % | |
Class C2 and Class M merged into Class C on June 15, 2004 and September 24, 2004, respectively.
In the case the Fund or a class of shares of the Fund is closed to new investors or investments, the Fund is authorized to pay 12b-1 fees for past sales and distribution efforts and present and past investor services.
Underwriter commissions relate to front-end sales charges imposed for Class A and M shares and contingent deferred sales charges from Classes B, C, M and certain A share redemptions. For the year ended October 31, 2004, the underwriter commissions were as follows:
| Received by Underwriter | | $ | 162 | | |
| Retained by Underwriter | | | 7 | | |
| Contingent Deferred Sales Charge | | | 47 | | |
Administrative services: The Fund has entered into an agreement with ATFS for financial and legal fund administration services, which includes such items as compliance, expenses, financial statements and other reporting, distributions, tax returns, prospectus preparation, board of
trustees meeting support and other legal matters. The Fund pays ATFS an annual fee of 0.015% of average net assets. The Legal fees on the Statement of Operations are for fees paid to external legal counsel.
The Fund paid ATFS $12 for the year ended October 31, 2004.
Transfer agent fees: The Fund pays ATIS an annual per-account charge of $20 (not in thousands) for each open account and $1.63 (not in thousands) for each closed account. There is no new account charge. The transfer agent fees on the Statement of Operations are made up of fees paid to ATIS and costs associated with shareholder statements. The Fund paid ATIS $95 for the year ended October 31, 2004.
Deferred compensation plan: Each eligible Fund Trustee may elect participation in the Deferred Compensation Plan ("the Plan"). Under the Plan, such Trustees may defer payment of a percentage of their total fees earned as a Fund Trustee. These deferred amounts may be invested in any Transamerica IDEX Mutual Fund. At October 31, 2004, the value of invested plan amounts was $2. Invested plan amounts and the total liability for deferred compensation to the Trustees under the Plan at October 31, 2004, are included in the accompanying Statement of Assets and Liabilities.
NOTE 3. INVESTMENT TRANSACTIONS
The cost of securities purchased and proceeds from securities sold (excluding short-term securities) for the year ended October 31, 2004, were as follows:
| Purchases of securities: | | | |
| Long-Term excluding U.S. Government | | $ | 1,543 | | |
| U.S. Government | | | – | | |
| Proceeds from maturities and sales of securities | | | |
| Long-Term excluding U.S. Government | | | 5,829 | | |
| U.S. Government | | | – | | |
NOTE 4. FEDERAL INCOME TAX MATTERS
The Fund has not made any provision for federal income or excise taxes due to its policy to distribute all of its taxable income and capital gains to its shareholders and otherwise qualify as a regulated investment company under the Internal Revenue Code. Income and capital gain distributions are determined in accordance with income tax regulations, which may differ from GAAP. These differences are primarily due to differing treatment for items including, but not limited to, wash sales, net operating losses and capital loss carryforwards.
Reclassifications between Undistributed net investment income (loss), Undistributed net realized capital gains (loss) and Shares of beneficial interest are made to reflect income and gains available for distribution under federal tax regulations. Results of operations and net assets are not effected by these reclassifications. These reclassifications are as follows:
Shares of beneficial interest, unlimited
shares authorized | | $ | (300 | ) | |
| Undistributed net investment income (loss) | | | 300 | | |
Transamerica IDEX Mutual Funds
Annual Report 2004
12
TA IDEX T. Rowe Price Tax-Efficient Growth
NOTES TO FINANCIAL STATEMENTS (continued)
At October 31, 2004
(all amounts in thousands)
NOTE 4.–(continued)
The capital loss carryforwards are available to offset future realized capital gains through the periods listed:
Capital Loss
Carryforward | | Available through | |
| $ | 251 | | | October 31, 2008 | |
| | 219 | | | October 31, 2009 | |
| | 1,972 | | | October 31, 2010 | |
| | 3,180 | | | October 31, 2011 | |
Capital loss carryforwards of $159 were utilized in the year ending October 31, 2004.
The tax basis components of distributable earnings as of October 31, 2004, are as follows:
| Undistributed Ordinary Income | | $ | – | | |
| Undistributed Long-term Capital Gains | | $ | – | | |
| Capital Loss Carryforward | | $ | (5,622 | ) | |
| Net Unrealized Appreciation (Depreciation) | | $ | 6,987 | | |
The aggregate cost of investments and composition of unrealized appreciation (depreciation) for federal income tax purposes as of October 31, 2004, are as follows:
| Federal Tax Cost Basis | | $ | 25,694 | | |
| Unrealized Appreciation | | $ | 6,987 | | |
| Unrealized (Depreciation) | | | – | | |
| Net Unrealized Appreciation (Depreciation) | | $ | 6,987 | | |
NOTE 5. OTHER MATTERS
Transamerica IDEX Mutual Funds ("TA IDEX"), and certain of its affiliated entities, have received requests for information from the Staff of the Securities and Exchange Commission in connection with market timing and late trading within the funds. TA IDEX and the affiliated entities have voluntarily cooperated in the investigation and have been providing the information as requested.
Transamerica IDEX Mutual Funds
Annual Report 2004
13
Report of Independent Registered Certified Public Accounting Firm
To the Board of Trustees and Shareholders of
TA IDEX T. Rowe Price Tax Efficient
In our opinion, the accompanying statement of assets and liabilities, including the schedule of investments, and the related statements of operations and of changes in net assets and the financial highlights present fairly, in all material respects, the financial position of TA IDEX T. Rowe Price Tax Efficient (the "Fund") (one of the portfolios constituting the Transamerica IDEX Mutual Funds) at October 31, 2004, the results of its operations for the year then ended, the changes in its net assets for each of the two years in the period then ended and the financial highlights for each of the periods indicated, in conformity with accounting principles generally accepted in the United States of America. These financial statements and financial highlights (hereafter referred to as "financial statements") are the responsibility of the Fund's management; our responsibility is to express an opinion on th ese financial statements based on our audits. We conducted our audits of these financial statements in accordance with the standards of the Public Company Accounting Oversight Board (United States). Those standards require that we plan and perform the audit to obtain reasonable assurance about whether the financial statements are free of material misstatement. An audit includes examining, on a test basis, evidence supporting the amounts and disclosures in the financial statements, assessing the accounting principles used and significant estimates made by management, and evaluating the overall financial statement presentation. We believe that our audits, which included confirmation of securities at October 31, 2004 by correspondence with the custodian and brokers, provide a reasonable basis for our opinion.

PricewaterhouseCoopers LLP
Tampa, Florida
December 28, 2004
Transamerica IDEX Mutual Funds
Annual Report 2004
14
TA IDEX T. Rowe Price Tax-Efficient Growth
SUPPLEMENTAL INFORMATION
RESULTS OF SHAREHOLDER PROXY (unaudited)
At a special meeting of Class M shareholders of each series of Transamerica IDEX (except TA IDEX Federated Tax Exempt and TA IDEX Protected Principal Stock), as listed above, held on September 2, 2004, the results of the Proposal were as follows:
Proposal 1: Approval of a conversion of Class M shares into Class C shares of the Funds, which will result in bearing the distribution and service fees payable under the 12b-1 Plan of Distribution for the Class C shares of the Funds.
| For | | Against | | Abstentions/Broker Non-Votes | |
| | 78.18 | % | | | 9.39 | % | | | 12.43 | % | |
Transamerica IDEX Mutual Funds
Annual Report 2004
15
TA IDEX Templeton Great Companies Global (formerly TA IDEX Janus Global)
MARKET ENVIRONMENT
Great Companies, L.L.C:
At the close of the year, oil had risen to near all-time high prices in nominal, dollar terms. This surge in prices was due in part to concerns about supply disruptions in Iraq, Russia, and Africa. High oil prices have led to fear of cost pressures throughout the supply chain as manufacturers, saddled with higher input costs, will have difficulty passing on these increased costs to consumers. Because of surges in prices, energy stocks performed exceptionally well in the United States with the energy sector of the Standard and Poor's 500 Composite Stock Index ("S&P 500") increased over 40% during the past twelve months.
Politics also provided an ominous backdrop to equity markets. Market strategists focused on each presidential candidate's impact on America's trade and budget deficits as well as dividend, capital gains, and marginal income tax rates. Because of the bitterness of the campaign and inability of the market to handicap the winner, this year's presidential election had a particularly negative impact on the market over the past several months. Several key political concerns, including issues surrounding healthcare, put pressure on stocks in the pharmaceutical, health maintenance organization, and healthcare service industries resulting in poor performance in the healthcare sector.
Because of the uncertainty of the presidential election, high oil prices, and the insurance scandal uncovered by Elliott Spitzer, attorney general of New York State, U.S. markets trailed the worldwide markets, as measured by the S&P 500 and the Morgan Stanley Capital International World Index ("MSCIW"), which were up 9.41% and 13.76%, respectively, over the past twelve months.
Templeton Investment Counsel, LLC:
The global equity rally that began in March 2003 extended into the early part of this year, propelled by strong liquidity, reasonably solid economic growth and higher corporate earnings. However, by the second half of the period investor focus shifted to the challenges of rising commodity prices, especially oil, Iraqi unrest, and a potential slowdown in the Chinese economy. The prospect of higher interest rates also damaged investor confidence. These factors hindered global equity performance, and consequently most stock markets traded within a relatively narrow range in the first ten months of 2004. However, stock market performance in aggregate was positive over the reporting period.
Against this macroeconomic background, the portfolio benefited from strong stock selection in information technology and utilities sectors, as well as overweight exposure to the cyclical sectors, industrial and materials. Notable contributors to return in these sectors included Nintendo Co., Ltd. in Japan, E.ON AG in Germany, Brambles Industries PLC in the United Kingdom ("UK"), and Satyam Computer Services Limited in India, all of which posted gains of over 20% for the period. From a region and country perspective, the portfolio benefited from our overweight exposure to Europe, with particularly strong stock selection in the UK and France.
We know from experience that countries and sectors that perform well in one period might not do so in the next one. Earlier this year, for example, the Japanese equity market performed strongly, but reversed course in the third quarter of 2004. Second quarter growth in Japan disappointed investors after it fell significantly below the market's expectations. Despite some successful stock picking during the period and our aversion to high-priced stocks, our decision to avoid large Japanese financial companies such as banks because of concerns about transparency and capital adequacy, as well as valuations, hurt our performance relative to the benchmark. In addition, our underweight exposure to consumer-related sectors hurt relative performance. Among the detractors from performance were Nomura Holdings, Inc. in Japan, Rentokil Initial PLC in the UK, and Vestas Wind Systems A/S in Denmark. Based on our ana lysis, however, we believe these companies still represent a value opportunity, and as patient investors, we continue to hold them in the portfolio.
PERFORMANCE
For the year ended October 31, 2004, TA IDEX Templeton Great Companies Global, Class A returned 5.41%. By comparison its benchmark, the MSCIW, returned 13.76%.
STRATEGY REVIEW
Great Companies, LLC:
Great Companies, LLC ("Great Companies") and Templeton Investment Counsel, LLC ("Templeton") assumed responsibility for this portfolio on June 1, 2004 as our former portfolio was merged into TA IDEX Janus Global and the name was changed to TA IDEX Templeton Great Companies Global. At the time we assumed management, the portfolio was significantly over-weighted in foreign equities with less than 40% in domestic, U.S. equities.
Because TA IDEX Templeton Great Companies Global is split similarly to the benchmark, we adjusted the portfolio so that approximately 54% of the holdings were in U.S. stocks managed
Transamerica IDEX Mutual Funds
Annual Report 2004
1
TA IDEX Templeton Great Companies Global (continued)
by Great Companies with the remaining 46% in foreign stocks being managed by Templeton.
In both the foreign and domestic portions of the portfolio, we sold several stocks held by the previous manager and purchased stocks in names that meet our selection criteria in an effort to more closely align the new portfolio with our core strategy.
In making stock selections, we believe that in the long run, economic profits cause stock prices to increase. Economic profits are created when a company has the ability to generate excess returns on its investment over its cost of capital. In commodity-type businesses, generating excess returns over the long run is nearly impossible as competition will enter the business and lower the profitability. Because economic profits drive share prices in the long term, and because commodity businesses do not have the ability to generate long-term economic profits, we avoid these types of businesses.
As noted in our market environment section, during the past twelve months, commodity-based sectors including utilities, energy, and telecommunication services performed quite well. We do not own stocks in these sectors as we believe any out performance in these sectors will be short lived, due to fluctuations in commodity prices. As a result, our portfolio of stocks faced significant headwinds.
Despite these headwinds, several of our stocks that we have held in this strategy for the past year have performed exceptionally well. Looking back to our portfolio holdings that were merged into TA IDEX Janus Global and that are still held in the portfolio, eBay Inc. has been our top performer with an increase in value of 75% since November 1, 2003. Moody's Corporation, General Electric Company, Avon Products, Inc., and First Data Corporation have also performed well during that time period with gains of better than 15%. However, some of our consumer stocks including Colgate-Palmolive Company, Merrill Lynch & Co., Inc., Pfizer Inc., and Amgen Inc. have underperformed with losses of 8% or more.
Templeton Investment Counsel, LLC:
Following our strategy during the twelve months under review, we initiated or added to several positions we believed were solid long-term investment opportunities. Specifically, we added to our holdings in the UK. In June 2004 we began purchasing shares of British Sky Broadcasting Group PLC, the UK's most successful pay television broadcaster. The company announced a major strategy shift in August 2004 entailing higher investment spending and lower short-term profitability with the aim of delivering higher long-term subscriber growth and, ultimately, greater value to its shareholders. Largely as a result, the stock price fell 19% in one day as many investors sold shares. We concluded the decline represented an opportunity to increase the exposure to what we considered a strong franchise at an at tractive price. Although this investment had a negative impact on returns in the year under review, we viewed it as illustrative of our investment philosophy–to buy during times of investor pessimism.
| Tina Hellmer | | James H. Huget | |
|
| Mark Beveridge | | Gerald W. Bollman | |
|
| Gary Motyl | | Matthew C. Stephani | |
|
| Co-Fund Managers | | Co-Fund Managers | |
|
| Templeton Investment Counsel, LLC | | Great Companies, L.L.C. | |
|
Transamerica IDEX Mutual Funds
Annual Report 2004
2
TA IDEX Templeton Great Companies Global
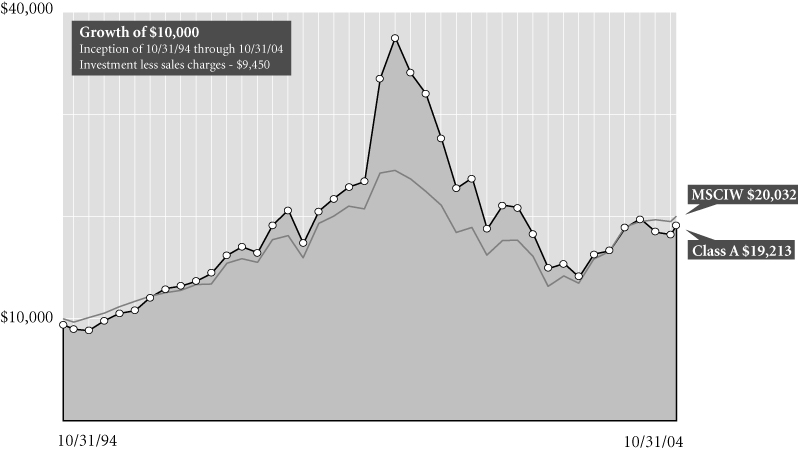
Average Annual Total Return for Periods Ended 10/31/04
| | | 1 year | | 5 years | | 10 years | | From
Inception | | Inception
Date | |
| Class A (NAV) | | | 5.41 | % | | | (6.00 | )% | | | 6.98 | % | | | 10.20 | % | | 10/1/92 | |
| Class A (POP) | | | (0.38 | )% | | | (7.06 | )% | | | 6.39 | % | | | 9.68 | % | | 10/1/92 | |
| MSCIW1 | | | 13.76 | % | | | (1.73 | )% | | | 7.20 | % | | | 8.54 | % | | 10/1/92 | |
| Class B (NAV) | | | 4.83 | % | | | (6.63 | )% | | | – | | | | 5.87 | % | | 10/1/95 | |
| Class B (POP) | | | (0.17 | )% | | | (6.80 | )% | | | – | | | | 5.87 | % | | 10/1/95 | |
| Class C (NAV) | | | 4.72 | % | | | – | | | | – | | | | 8.66 | % | | 11/11/02 | |
| Class C (POP) | | | 3.72 | % | | | – | | | | – | | | | 8.66 | % | | 11/11/02 | |
NOTES
1 The Morgan Stanley Capital InternationalWorld (MSCIW) Index is an unmanaged index used as a general measure of market performance. Calculations assume dividends and capital gains are reinvested and do not include any managerial expenses. From inception calculation is based on life of Class A shares. Source: Standard & Poor's Micropal®© Micropal, Inc. 2004 – 1-800-596-5323 – http://www.micropal.com.
The performance data presented represents past performance, future results may vary. Performance data does not reflect the deduction of taxes that would be paid on fund distributions or the redemption of fund shares. Investment return and principal value will fluctuate so that an investor's shares, when redeemed, may be worth more or less than their original cost. Current performance may be lower or higher than performance quoted.
Public Offering Price (POP) returns include the reinvestment of dividends and capital gains and reflect the maximum sales charge of 5.5% for A shares or the maximum applicable contingent deferred sales charge (5% in the 1st year, decreasing to 0% after 6 years) for Class B shares and 1% (during the first 12 months) for Class C shares. Shares purchased prior to March 1, 2004 are subject to a maximum applicable contingent deferred sales charge (5% in the 1st year, decreasing to 0% after 7 years) for Class B shares and (2% in the 1st year, decreasing to 0% after 2 years) for Class C shares. Net Asset Value (NAV) returns include the reinvestment of dividends and capital gains but do not reflect any sales charges.
Investments in global securities involve risks relating to political, social and economic developments abroad, foreign currency contracts for hedging, as well as risks resulting from the differences between the regulations to which U.S. and foreign issuer markets are subject.
This material must be preceded or accompanied by a current prospectus, which includes specific contents regarding the investment objectives and policies of this fund.
Transamerica IDEX Mutual Funds
Annual Report 2004
3
TA IDEX Templeton Great Companies Global
UNDERSTANDING YOUR FUND'S EXPENSES (unaudited)
SHAREHOLDER EXPENSES
The following Example is intended to help you understand your ongoing costs (in dollars and cents) of investing in a Fund and to compare these costs with the ongoing costs of investing in other funds.
The Example is based on an investment of $1,000 invested at the beginning of the period and held for the entire period from May 1, 2004 to October 31, 2004.
ACTUAL EXPENSES
The first line in the table below provides information about actual account values and actual expenses. You may use the information in this line, together with the amount you invested, to estimate the expenses that you paid over the period. Simply divide your account value by $1,000 (for example, an $8,600 account value divided by $1,000 = 8.6), then multiply the result by the number in the first line of your Fund under the heading entitled "Expenses Paid During Period" to estimate the expenses you paid on your account during this period.
HYPOTHETICAL EXAMPLE FOR COMPARISON PURPOSES
The second line in the table below provides information about hypothetical account values and hypothetical expenses based on each Fund's actual expense ratio and an assumed rate of return of 5% per year before expenses, which is not the Fund's actual return. The hypothetical account values and expenses may not be used to estimate the actual ending account balance or expenses you paid for the period. You may use this information to compare the ongoing costs of investing in your Fund and other funds. To do so, compare this 5% hypothetical example with the 5% hypothetical examples that appear in the shareholder reports of the other funds.
Please note that the expenses shown in the table are meant to highlight your ongoing costs only and do not reflect any transactional costs, such as sales charges, redemption fees, brokerage commissions paid on purchases and sales of fund shares. Therefore, the second line under each Fund in the table is useful in comparing ongoing costs only, and will not help you determine the relative total costs of owning different funds. In addition, note that the expenses shown in the table are meant to highlight your ongoing costs and do not reflect any transaction costs.
| | | Beginning
Account
Value | | Ending
Account
Value | | Annualized
Expense
Ratio | | Expenses Paid
During Period(a) | |
| Class A | | | |
| Actual | | $ | 1,000.00 | | | $ | 991.60 | | | | 3.02 | % | | $ | 15.12 | | |
| Hypothetical(b) | | | 1,000.00 | | | | 1,009.95 | | | | 3.02 | | | | 15.26 | | |
| Class B | | | |
| Actual | | | 1,000.00 | | | | 989.20 | | | | 5.39 | | | | 26.95 | | |
| Hypothetical(b) | | | 1,000.00 | | | | 998.04 | | | | 5.39 | | | | 27.07 | | |
| Class C | | | |
| Actual | | | 1,000.00 | | | | 988.20 | | | | 2.22 | | | | 11.09 | | |
| Hypothetical(b) | | | 1,000.00 | | | | 1,013.98 | | | | 2.22 | | | | 11.24 | | |
(a) Expenses are calculated using each Fund's annualized expense ratio (as disclosed in the table), multiplied by the average account value for the period, multiplied by number of days in the period (184 days), and divided by the number of days in the year (366 days).
(b) 5% return per year before expenses.
GRAPHIC PRESENTATION OF SCHEDULE OF INVESTMENTS
By Region
At October 31, 2004

This chart shows the percentage breakdown by region of the Fund's total investment securities.
Transamerica IDEX Mutual Funds
Annual Report 2004
4
TA IDEX Templeton Great Companies Global
SCHEDULE OF INVESTMENTS
At October 31, 2004
(all amounts except share amounts in thousands)
| | | Shares | | Value | |
| COMMON STOCKS (98.2%) | | | |
| Australia (2.0%) | | | |
| Alumina, Ltd. | | | 326,340 | | | $ | 1,341 | | |
| AMP, Ltd. | | | 452,311 | | | | 2,153 | | |
| BHP Billiton, Ltd. | | | 205,740 | | | | 2,129 | | |
| National Australia Bank, Ltd. | | | 100,380 | | | | 2,121 | | |
| Brazil (0.5%) | | | |
| Cia Vale do Rio Doce, Sponsored ADR | | | 9,740 | | | | 177 | | |
| Cia Vale do Rio Doce, Sponsored ADR | | | 47,390 | | | | 1,003 | | |
Empresa Brasileira de Aeronautica SA,
Sponsored ADR (a) | | | 31,880 | | | | 846 | | |
| Canada (1.1%) | | | |
| Alcan, Inc. | | | 46,790 | | | | 2,162 | | |
| BCE, Inc. | | | 94,660 | | | | 2,198 | | |
| Cayman Islands (0.9%) | | | |
| ACE, Ltd. | | | 45,750 | | | | 1,741 | | |
| XL Capital, Ltd.–Class A (a) | | | 26,750 | | | | 1,939 | | |
| Denmark (1.1%) | | | |
| ISS A/S | | | 39,490 | | | | 2,096 | | |
| Vestas Wind Systems A/S (a)(b) | | | 165,506 | | | | 2,047 | | |
| Finland (1.1%) | | | |
| Stora Enso Oyj–Class R | | | 116,270 | | | | 1,655 | | |
| UPM-Kymmene Oyj | | | 131,840 | | | | 2,599 | | |
| France (3.3%) | | | |
| Accor SA | | | 40,900 | | | | 1,693 | | |
| AXA | | | 100,830 | | | | 2,164 | | |
| Michelin (C.G.D.E.)–Class B | | | 42,100 | | | | 2,284 | | |
| Sanofi-Aventis | | | 32,519 | | | | 2,370 | | |
| Suez SA, Sponsored ADR (a) | | | 90,170 | | | | 2,119 | | |
| Total SA | | | 9,960 | | | | 2,065 | | |
| Valeo SA | | | 7,860 | | | | 289 | | |
| Germany (3.1%) | | | |
| BASF AG, Sponsored ADR | | | 41,210 | | | | 2,589 | | |
| Bayer AG, Sponsored ADR | | | 58,740 | | | | 1,666 | | |
| Deutsche Post AG | | | 140,650 | | | | 2,741 | | |
| E.ON AG, Sponsored ADR (a) | | | 34,090 | | | | 2,780 | | |
| SAP AG, Sponsored ADR | | | 23,310 | | | | 994 | | |
| Volkswagen AG, Sponsored ADR (a) | | | 153,200 | | | | 1,360 | | |
| Hong Kong (0.8%) | | | |
| Cheung Kong Holdings, Ltd. | | | 219,000 | | | | 1,815 | | |
| Hutchison Whampoa, Ltd. | | | 161,000 | | | | 1,236 | | |
| Israel (0.5%) | | | |
| Check Point Software Technologies, Ltd. (b) | | | 95,060 | | | | 2,150 | | |
| | | Shares | | Value | |
| Italy (1.1%) | | | |
| ENI SpA, Sponsored ADR (a) | | | 23,680 | | | $ | 2,710 | | |
| Riunione Adriatica di Sicurta SpA | | | 78,050 | | | | 1,644 | | |
| Japan (4.3%) | | | |
| Canon, Inc., Sponsored ADR | | | 3,150 | | | | 156 | | |
| Denso Corp. | | | 65,400 | | | | 1,565 | | |
| East Japan Railway Co. | | | 336 | | | | 1,763 | | |
| Hitachi, Ltd. | | | 282,000 | | | | 1,772 | | |
| KDDI Corp. | | | 174 | | | | 836 | | |
| Nintendo Co., Ltd. | | | 22,500 | | | | 2,535 | | |
| Nippon Telegraph & Telephone Corp. | | | 416 | | | | 1,763 | | |
| Nomura Holdings, Inc. | | | 92,000 | | | | 1,127 | | |
| Sompo Japan Insurance, Inc. | | | 202,000 | | | | 1,758 | | |
| Sony Corp., Sponsored ADR | | | 56,200 | | | | 1,959 | | |
| Takeda Pharmaceutical Co., Ltd. | | | 33,500 | | | | 1,616 | | |
| Mexico (0.5%) | | | |
Telefonos de Mexico SA de CV–Class L,
Sponsored ADR | | | 56,000 | | | | 1,917 | | |
| Netherlands (2.4%) | | | |
| Akzo Nobel NV, Sponsored ADR (a) | | | 57,580 | | | | 2,175 | | |
| IHC Caland NV | | | 2,870 | | | | 164 | | |
| ING Groep NV | | | 71,280 | | | | 1,881 | | |
| ING Groep NV, Sponsored ADR | | | 20,490 | | | | 546 | | |
| Koninklijke Philips Electronics NV | | | 86,340 | | | | 2,037 | | |
| Reed Elsevier NV | | | 201,250 | | | | 2,637 | | |
| Norway (0.5%) | | | |
| Telenor ASA | | | 231,070 | | | | 1,836 | | |
| Portugal (0.6%) | | | |
| Portugal Telecom SGPS SA | | | 219,680 | | | | 2,467 | | |
| Singapore (0.6%) | | | |
| DBS Group Holdings, Ltd. | | | 229,600 | | | | 2,154 | | |
| DBS Group Holdings, Ltd., Sponsored ADR | | | 10,600 | | | | 397 | | |
| South Korea (2.4%) | | | |
| Kookmin Bank, Sponsored ADR (a)(b) | | | 27,330 | | | | 919 | | |
Korea Electric Power Corp.,
Sponsored ADR (a) | | | 115,760 | | | | 1,329 | | |
| KT Corp., Sponsored ADR | | | 107,955 | | | | 1,993 | | |
| Samsung Electronics Co., Ltd., GDR, 144A | | | 18,010 | | | | 3,530 | | |
| SK Telecom Co., Ltd., Sponsored ADR (a) | | | 90,260 | | | | 1,781 | | |
| Spain (1.5%) | | | |
| Iberdrola SA | | | 64,080 | | | | 1,399 | | |
| Repsol YPF SA | | | 118,440 | | | | 2,560 | | |
| Telefonica SA | | | 125,850 | | | | 2,071 | | |
The notes to the financial statements are an integral part of this report.
Transamerica IDEX Mutual Funds
Annual Report 2004
5
TA IDEX Templeton Great Companies Global
SCHEDULE OF INVESTMENTS (continued)
At October 31, 2004
(all amounts except share amounts in thousands)
| | | Shares | | Value | |
| Sweden (3.3%) | |
| Atlas Copco AB–Class A | | | 61,370 | | | $ | 2,533 | | |
| Electrolux AB–Class B | | | 69,790 | | | | 1,291 | | |
| Nordic Baltic Holding, FDR | | | 348,080 | | | | 3,006 | | |
| Securitas AB–Class B | | | 183,480 | | | | 2,503 | | |
| Svenska Cellulosa AB–Class B | | | 48,750 | | | | 1,810 | | |
| Volvo AB–Class B | | | 46,590 | | | | 1,759 | | |
| Switzerland (2.7%) | |
| Lonza Group AG | | | 38,600 | | | | 1,879 | | |
| Nestle SA, Sponsored ADR | | | 36,230 | | | | 2,135 | | |
| Novartis AG, Sponsored ADR | | | 50,040 | | | | 2,402 | | |
| Swiss Reinsurance | | | 35,830 | | | | 2,192 | | |
| UBS AG | | | 20,350 | | | | 1,462 | | |
| UBS AG (Foreign Registered) | | | 5,890 | | | | 427 | | |
| Taiwan (0.4%) | |
Chunghwa Telecom Co., Ltd.,
Sponsored ADR (a) | | | 87,480 | | | | 1,649 | | |
| United Kingdom (10.6%) | |
| Abbey National PLC | | | 210,120 | | | | 2,434 | | |
| Alliance Unichem PLC | | | 199,910 | | | | 2,442 | | |
| BAE Systems PLC | | | 499,710 | | | | 2,182 | | |
| BP PLC, Sponsored ADR | | | 45,540 | | | | 2,653 | | |
| Brambles Industries PLC | | | 314,480 | | | | 1,516 | | |
| British Airways PLC (b) | | | 202,140 | | | | 798 | | |
| British Sky Broadcasting PLC | | | 200,220 | | | | 1,866 | | |
| Cadbury Schweppes PLC | | | 255,900 | | | | 2,123 | | |
| Compass Group PLC | | | 358,300 | | | | 1,478 | | |
| GlaxoSmithKline PLC | | | 112,770 | | | | 2,371 | | |
| HSBC Holdings PLC | | | 85,059 | | | | 1,371 | | |
| HSBC Holdings PLC, Sponsored ADR (a) | | | 8,420 | | | | 682 | | |
| National Grid Transco PLC | | | 260,620 | | | | 2,262 | | |
| Pearson PLC | | | 153,110 | | | | 1,678 | | |
| Rentokil Initial PLC | | | 571,050 | | | | 1,622 | | |
| Rolls-Royce Group PLC (b) | | | 392,150 | | | | 1,863 | | |
| Shell Transport & Trading Co. PLC | | | 391,350 | | | | 3,076 | | |
| Smiths Group PLC | | | 176,940 | | | | 2,418 | | |
| Standard Chartered PLC | | | 125,630 | | | | 2,242 | | |
| Unilever PLC | | | 198,320 | | | | 1,669 | | |
| Vodafone Group PLC | | | 962,281 | | | | 2,461 | | |
| United States (52.9%) | |
| 3M Co. | | | 102,900 | | | | 7,982 | | |
Advanced Neuromodulation
Systems, Inc. (a)(b) | | | 32,300 | | | | 1,028 | | |
| AFLAC, Inc. | | | 130,000 | | | | 4,664 | | |
| American Express Co. | | | 133,000 | | | | 7,058 | | |
| American International Group, Inc. | | | 86,500 | | | | 5,251 | | |
| | | Shares | | Value | |
| United States (continued) | |
| Amgen, Inc. (b) | | | 95,080 | | | $ | 5,401 | | |
| Anheuser-Busch Cos., Inc. | | | 104,000 | | | | 5,195 | | |
| Avon Products, Inc. | | | 110,000 | | | | 4,350 | | |
| Berkshire Hathaway, Inc.–Class B (b) | | | 1,500 | | | | 4,206 | | |
| Cephalon, Inc. (a)(b) | | | 51,000 | | | | 2,431 | | |
| Cintas Corp. | | | 51,700 | | | | 2,230 | | |
| Citigroup, Inc. | | | 130,000 | | | | 5,768 | | |
| Colgate-Palmolive Co. | | | 90,000 | | | | 4,016 | | |
| Dell, Inc. (b) | | | 143,200 | | | | 5,021 | | |
| eBay, Inc. (a)(b) | | | 47,000 | | | | 4,588 | | |
| EMC Corp. (a)(b) | | | 448,000 | | | | 5,766 | | |
| First Data Corp. | | | 116,700 | | | | 4,817 | | |
| General Electric Co. | | | 338,800 | | | | 11,560 | | |
| Genzyme Corp. (a)(b) | | | 64,800 | | | | 3,400 | | |
| Goldman Sachs Group, Inc. | | | 42,900 | | | | 4,220 | | |
| IMS Health, Inc. | | | 267,500 | | | | 5,666 | | |
| International Game Technology | | | 168,000 | | | | 5,551 | | |
| Maxim Integrated Products, Inc. | | | 93,000 | | | | 4,091 | | |
| Medtronic, Inc. | | | 169,000 | | | | 8,638 | | |
| Merrill Lynch & Co., Inc. | | | 121,500 | | | | 6,554 | | |
| Microsoft Corp. | | | 277,375 | | | | 7,764 | | |
| Moody's Corp. | | | 66,400 | | | | 5,167 | | |
| Omnicom Group, Inc. (a) | | | 109,500 | | | | 8,640 | | |
| PepsiCo, Inc. | | | 143,000 | | | | 7,090 | | |
| Pfizer, Inc. | | | 183,200 | | | | 5,304 | | |
| Procter & Gamble Co. | | | 129,600 | | | | 6,633 | | |
| QUALCOMM, Inc. | | | 154,000 | | | | 6,439 | | |
| Symantec Corp. (a)(b) | | | 103,000 | | | | 5,865 | | |
| United Technologies Corp. | | | 103,200 | | | | 9,579 | | |
| WM Wrigley Jr. Co. | | | 51,000 | | | | 3,335 | | |
| Xilinx, Inc. | | | 132,000 | | | | 4,039 | | |
| Yahoo!, Inc. (b) | | | 113,820 | | | | 4,119 | | |
| Zimmer Holdings, Inc. (b) | | | 51,000 | | | | 3,957 | | |
| Total Common Stocks (cost: $376,811) | | | | | | | 385,157 | | |
| | | Principal | | Value | |
| SECURITY LENDING COLLATERAL (6.2%) | |
| Debt (5.8%) | |
| Bank Notes (1.1%) | |
Bank of America
1.77%, due 12/03/2004 | | $ | 1,184 | | | $ | 1,184 | | |
| 1.77%, due 01/18/2005 | | | 789 | | | | 789 | | |
| 1.88%, due 12/23/2004 | | | 395 | | | | 395 | | |
Canadian Imperial Bank of Commerce
1.86%, due 11/04/2004 | | | 1,776 | | | | 1,776 | | |
Credit Suisse First Boston Corp.
1.83%, due 09/09/2005 | | | 197 | | | | 197 | | |
The notes to the financial statements are an integral part of this report.
Transamerica IDEX Mutual Funds
Annual Report 2004
6
TA IDEX Templeton Great Companies Global
SCHEDULE OF INVESTMENTS (continued)
At October 31, 2004
(all amounts except share amounts in thousands)
| | | Principal | | Value | |
| Commercial Paper (0.6%) | | | |
Clipper Receivables Corp.
1.79%, due 11/12/2004 | | $ | 588 | | | $ | 588 | | |
Delaware Funding Corp. 144A
1.85%, due 11/19/2004 | | | 197 | | | | 197 | | |
Falcon Asset Securitization Corp. 144A
1.75%, due 11/10/2004 | | | 789 | | | | 789 | | |
| 1.78%, due 11/04/2004 | | | 589 | | | | 588 | | |
Galaxy Funding 144A
1.88%, due 11/22/2004 | | | 197 | | | | 197 | | |
| Euro Dollar Terms (2.7%) | | | |
Bank of Montreal
1.88%, due 11/24/2004 | | | 1,869 | | | | 1,869 | | |
BNP Paribas
1.77%, due 11/10/2004 | | | 986 | | | | 986 | | |
| 1.80%, due 11/23/2004 | | | 789 | | | | 789 | | |
| 1.98%, due 12/27/2004 | | | 789 | | | | 789 | | |
Calyon
1.70%, due 11/24/2004 | | | 104 | | | | 104 | | |
Citigroup
2.06%, due 01/25/2005 | | | 1,973 | | | | 1,973 | | |
Den Danske Bank
1.82%, due 11/19/2004 | | | 986 | | | | 986 | | |
Dexia Group
2.04%, due 01/21/2005 | | | 458 | | | | 458 | | |
HBOS Halifax Bank of Scotland
2.03%, due 01/21/2005 | | | 395 | | | | 395 | | |
Royal Bank of Scotland
2.01%, due 01/20/2005 | | | 789 | | | | 789 | | |
| | | Principal | | Value | |
| Euro Dollar Terms (continued) | |
Toronto Dominion Bank
1.70%, due 11/08/2004 | | $ | 395 | | | $ | 395 | | |
Wells Fargo
1.87%, due 11/22/2004 | | | 986 | | | | 986 | | |
| Promissory Notes (0.6%) | |
Goldman Sachs Group Inc.
1.88%, due 01/27/2005 | | | 1,381 | | | | 1,381 | | |
| 1.90%, due 12/29/2004 | | | 829 | | | | 829 | | |
| Repurchase Agreements (0.8%) (c) | |
Merrill Lynch & Co., Inc.
1.92%, Repurchase Agreement dated
10/29/2004 to be repurchased at $3,157
on 11/01/2004 | | | 3,157 | | | | 3,157 | | |
| | | Shares | | Value | |
| Investment Companies (0.4%) | |
| Money Market Funds (0.4%) | |
Merrill Lynch Premier Institutional Fund
1-day yield of 1.71% | | | 970,559 | | | $ | 971 | | |
Merrimac Cash Fund, Premium Class
1-day yield of 1.46% | | | 710,245 | | | | 710 | | |
| Total Security Lending Collateral (cost: $24,267) | | | | | | | 24,267 | | |
| Total Investment Securities (cost: $401,078) | | | | | | $ | 409,424 | | |
| SUMMARY: | |
| Investments, at value | | | 104.4 | % | | $ | 409,424 | | |
| Liabilities in excess of other assets | | | (4.4 | )% | | | (17,120 | ) | |
| Net assets | | | 100.0 | % | | $ | 392,304 | | |
NOTES TO SCHEDULE OF INVESTMENTS:
(a) At October 31, 2004, all or a portion of this security is on loan (see Note 1). The value at October 31, 2004, of all securities on loan is $23,354.
(b) No dividends were paid during the preceding twelve months.
(c) Cash collateral for the Repurchase Agreements, valued at $3,220, that serve as collateral for securities lending are invested in corporate bonds with interest rates and maturity dates ranging from 0.00%–9.75% and 05/15/2005–9/15/2033, respectively.
DEFINITIONS:
144A 144A Securities are registered pursuant to Rule 144A of the Securities Act of 1933. These securities are deemed to be liquid for purposes of compliance limitations on holdings of illiquid securities and may be resold as transactions exempt from registration, normally to qualified institutional buyers. At October 31, 2004 these securities aggregated $5,301 or 1.35% of the net assets of the Fund.
ADR American Depositary Receipt
FDR Finnish Depositary Receipt
GDR Global Depositary Receipt
The notes to the financial statements are an integral part of this report.
Transamerica IDEX Mutual Funds
Annual Report 2004
7
TA IDEX Templeton Great Companies Global
SCHEDULE OF INVESTMENTS (continued)
At October 31, 2004
(all amounts except share amounts in thousands)
| | | Percentage of
Net Assets | | Value | |
| INVESTMENTS BY INDUSTRY: (unaudited) | | | |
| Business Services | | | 8.6 | % | | $ | 33,367 | | |
| Pharmaceuticals | | | 7.2 | % | | | 27,737 | | |
| Computer & Data Processing Services | | | 6.7 | % | | | 26,558 | | |
| Insurance | | | 6.0 | % | | | 23,395 | | |
| Chemicals & Allied Products | | | 5.9 | % | | | 23,308 | | |
| Commercial Banks | | | 5.2 | % | | | 20,549 | | |
| Security & Commodity Brokers | | | 4.9 | % | | | 18,959 | | |
| Telecommunications | | | 4.8 | % | | | 18,505 | | |
| Electronic & Other Electric Equipment | | | 4.6 | % | | | 18,428 | | |
| Aerospace | | | 3.7 | % | | | 14,470 | | |
| Medical Instruments & Supplies | | | 3.5 | % | | | 13,623 | | |
| Computer & Office Equipment | | | 3.3 | % | | | 12,559 | | |
| Beverages | | | 3.1 | % | | | 12,285 | | |
| Communications Equipment | | | 2.7 | % | | | 11,021 | | |
| Paper & Allied Products | | | 2.7 | % | | | 10,581 | | |
| Electronic Components & Accessories | | | 2.5 | % | | | 10,167 | | |
| Oil & Gas Extraction | | | 2.1 | % | | | 8,346 | | |
| Manufacturing Industries | | | 2.0 | % | | | 8,086 | | |
| Electric Services | | | 2.0 | % | | | 7,770 | | |
| Food & Kindred Products | | | 1.9 | % | | | 7,593 | | |
| Life Insurance | | | 1.8 | % | | | 6,744 | | |
| Petroleum Refining | | | 1.2 | % | | | 4,718 | | |
| Metal Mining | | | 1.2 | % | | | 4,650 | | |
| Paper & Paper Products | | | 0.9 | % | | | 3,465 | | |
| Automotive | | | 0.8 | % | | | 3,119 | | |
| Transportation & Public Utilities | | | 0.7 | % | | | 2,741 | | |
| Printing & Publishing | | | 0.7 | % | | | 2,637 | | |
| Industrial Machinery & Equipment | | | 0.6 | % | | | 2,533 | | |
| Mortgage Bankers & Brokers | | | 0.6 | % | | | 2,434 | | |
| Rubber & Misc. Plastic Products | | | 0.6 | % | | | 2,284 | | |
| Apparel Products | | | 0.6 | % | | | 2,230 | | |
| Primary Metal Industries | | | 0.5 | % | | | 2,162 | | |
| Electric, Gas & Sanitary Services | | | 0.5 | % | | | 2,119 | | |
| Communication | | | 0.5 | % | | | 1,866 | | |
| Motor Vehicles, Parts & Supplies | | | 0.5 | % | | | 1,854 | | |
| Speciality – Real Estate | | | 0.5 | % | | | 1,815 | | |
| Railroads | | | 0.5 | % | | | 1,763 | | |
| Hotels & Other Lodging Places | | | 0.4 | % | | | 1,693 | | |
| Radio & Television Broadcasting | | | 0.4 | % | | | 1,678 | | |
| Wholesale Trade Nondurable Goods | | | 0.4 | % | | | 1,669 | | |
| Restaurants | | | 0.4 | % | | | 1,478 | | |
| Holding & Other Investment Offices | | | 0.3 | % | | | 1,236 | | |
| Air Transportation | | | 0.2 | % | | | 798 | | |
| Water Transportation | | | 0.0 | % | | | 164 | | |
| Investments, at value | | | 98.2 | % | | | 385,157 | | |
| Short-term investments | | | 6.2 | % | | | 24,267 | | |
| Liabilities in excess of other assets | | | (4.4 | )% | | | (17,120 | ) | |
| Net assets | | | 100.0 | % | | $ | 392,304 | | |
| FORWARD FOREIGN CURRENCY CONTRACTS: | |
| Currency | | Bought
(Sold) | | Settlement
Date | | Amount in
U.S. Dollars
Bought (Sold) | | Net
Unrealized
Appreciation
(Depreciation) | |
| British Pound Sterling | | | 2,300 | | | 11/19/2004 | | $ | 4,014 | | | $ | 195 | | |
| British Pound Sterling | | | (2,300 | ) | | 11/19/2004 | | | (4,121 | ) | | | (89 | ) | |
| | | $ | (107 | ) | | $ | 106 | | |
The notes to the financial statements are an integral part of this report.
Transamerica IDEX Mutual Funds
Annual Report 2004
8
TA IDEX Templeton Great Companies Global
STATEMENT OF ASSETS AND LIABILITIES
At October 31, 2004
(all amounts except share amounts in thousands)
| Assets: | | | |
Investment securities, at value (cost: $401,078)
(including securities loaned of $23,354) | | $ | 409,424 | | |
| Cash | | | 6,784 | | |
| Foreign cash (cost: $19) | | | 19 | | |
| Receivables: | |
| Investment securities sold | | | 2,353 | | |
| Shares of beneficial interest sold | | | 34 | | |
| Interest | | | 14 | | |
| Dividends | | | 548 | | |
| Dividend reclaims receivable | | | 546 | | |
Unrealized appreciation on forward foreign currency
contracts | | | 195 | | |
| Other | | | 214 | | |
| | | | 420,131 | | |
| Liabilities: | | | |
| Investment securities purchased | | | 1,037 | | |
| Accounts payable and accrued liabilities: | |
| Shares of beneficial interest redeemed | | | 879 | | |
| Management and advisory fees | | | 807 | | |
| Distribution fees | | | 197 | | |
| Transfer agent fees | | | 365 | | |
| Payable for collateral for securities on loan | | | 24,267 | | |
Unrealized depreciation on forward foreign currency
contracts | | | 89 | | |
| Other | | | 186 | | |
| | | | 27,827 | | |
| Net Assets | | $ | 392,304 | | |
| Net Assets Consist of: | | | |
Shares of beneficial interest, unlimited shares
authorized, no par value | | $ | 777,879 | | |
| Accumulated net investment income (loss) | | | (254 | ) | |
Accumulated net realized gain (loss) from investment
securities and foreign currency transactions | | | (393,867 | ) | |
Net unrealized appreciation (depreciation) on:
Investment securities | | | 8,330 | | |
Translation of assets and liabilites denominated in
foreign currencies | | | 216 | | |
| Net Assets | | $ | 392,304 | | |
| Net Assets by Class: | | | |
| Class A | | $ | 226,517 | | |
| Class B | | | 117,409 | | |
| Class C | | | 48,378 | | |
| Shares Outstanding: | | | |
| Class A | | | 10,037 | | |
| Class B | | | 5,531 | | |
| Class C | | | 2,281 | | |
| Net Asset Value Per Share: | | | |
| Class A | | $ | 22.57 | | |
| Class B | | | 21.23 | | |
| Class C | | | 21.21 | | |
| Maximum Offering Price Per Share (a): | | | |
| Class A | | $ | 23.88 | | |
(a) Includes the maximum selling commission (represented as a percentage of offering price) which is reduced on certain levels of sales as set forth in the Prospectus. Net asset value per share for Classes B and C shares represents offering price. The redemption price for Classes B and C shares equals net asset value less any applicable contingent deferred sales charge.
STATEMENT OF OPERATIONS
For the year ended October 31, 2004
(all amounts in thousands)
| Investment Income: | | | |
| Interest | | $ | 92 | | |
| Dividends | | | 6,559 | | |
| Income from loaned securities–net | | | 30 | | |
| Less withholding taxes on foreign dividends | | | (518 | ) | |
| | | | 6,163 | | |
| Expenses: | | | |
| Management and advisory fees | | | 3,609 | | |
| Transfer agent fees: | |
| Class A | | | 754 | | |
| Class B | | | 465 | | |
| Class C | | | 24 | | |
| Class C2 | | | 49 | | |
| Class M | | | 180 | | |
| Printing and shareholder reports | | | 208 | | |
| Custody fees | | | 546 | | |
| Administration fees | | | 57 | | |
| Legal fees | | | 13 | | |
| Audit and accounting fees | | | 8 | | |
| Trustees fees | | | 24 | | |
| Registration fees: | |
| Class A | | | 15 | | |
| Class B | | | – | | |
| Class C | | | 13 | | |
| Class C2 | | | 1 | | |
| Class M | | | 6 | | |
| Distribution and service fees: | |
| Class A | | | 719 | | |
| Class B | | | 1,367 | | |
| Class C | | | 91 | | |
| Class C2 | | | 100 | | |
| Class M | | | 348 | | |
| Total expenses | | | 8,597 | | |
| Net Investment Income (Loss) | | | (2,434 | ) | |
| Net Realized Gain (Loss) from: | | | |
| Investment securities | | | 55,040 | | |
| Foreign currency transactions | | | (350 | ) | |
| | | | 54,690 | | |
Net Increase (Decrease) in Unrealized Appreciation
(Depreciation) on: | | | |
| Investment securities | | | (30,193 | ) | |
Translation of assets and liabilities denominated in
foreign currencies | | | 158 | | |
| | | | (30,035 | ) | |
Net Gain (Loss) on Investments and Foreign Currency
Transactions | | | 24,655 | | |
Net Increase (Decrease) in Net Assets Resulting
from Operations | | $ | 22,221 | | |
The notes to financial statements are an integral part of this report.
Transamerica IDEX Mutual Funds
Annual Report 2004
9
TA IDEX Templeton Great Companies Global
STATEMENTS OF CHANGES IN NET ASSETS
For the years ended
(all amounts in thousands)
| | | October 31,
2004 | | October 31,
2003 | |
| Increase (Decrease) in Net Assets From: | |
| Operations: | |
| Net investment income (loss) | | $ | (2,434 | ) | | $ | (2,778 | ) | |
Net realized gain (loss) from
investment securities and
foreign currency transactions | | | 54,690 | | | | (57,479 | ) | |
Net unrealized appreciation
(depreciation) on investment
securities and foreign currency
translation | | | (30,035 | ) | | | 106,452 | | |
| | | | 22,221 | | | | 46,195 | | |
| Capital Share Transactions: | |
| Proceeds from shares sold: | |
| Class A | | | 9,922 | | | | 75,695 | | |
| Class B | | | 3,635 | | | | 5,156 | | |
| Class C | | | 505 | | | | 3,270 | | |
| Class C2 | | | 833 | | | | 776 | | |
| Class M | | | 771 | | | | 1,937 | | |
| | | | 15,666 | | | | 86,834 | | |
| Proceeds from fund acquisition: | |
| Class A | | | 85,329 | | | | – | | |
| Class B | | | 4,841 | | | | – | | |
| Class C | | | 436 | | | | – | | |
| Class C2 | | | 1,244 | | | | – | | |
| Class M | | | 838 | | | | – | | |
| | | | 92,688 | | | | – | | |
| Cost of shares redeemed: | |
| Class A | | | (70,094 | ) | | | (134,273 | ) | |
| Class B | | | (50,478 | ) | | | (61,709 | ) | |
| Class C | | | (2,995 | ) | | | (3,225 | ) | |
| Class C2 | | | (6,874 | ) | | | (11,577 | ) | |
| Class M | | | (20,371 | ) | | | (33,901 | ) | |
| | | | (150,812 | ) | | | (244,685 | ) | |
| Class level exchanges: | |
| Class C | | | 49,193 | | | | – | | |
| Class C2 | | | (14,403 | ) | | | – | | |
| Class M | | | (34,790 | ) | | | – | | |
| | | | – | | | | – | | |
| Automatic conversions: | |
| Class A | | | 1,159 | | | | – | | |
| Class B | | | (1,159 | ) | | | – | | |
| | | | – | | | | – | | |
| | | | (42,458 | ) | | | (157,851 | ) | |
| Net increase (decrease) in net assets | | | (20,237 | ) | | | (111,656 | ) | |
| Net Assets: | |
| Beginning of year | | | 412,541 | | | | 524,197 | | |
| End of year | | $ | 392,304 | | | $ | 412,541 | | |
Accumulated Net Investment Income
(Loss) | | $ | (254 | ) | | $ | (100 | ) | |
| | | October 31,
2004 | | October 31,
2003 | |
| Share Activity: | | | |
| Shares issued: | |
| Class A | | | 438 | | | | 3,964 | | |
| Class B | | | 169 | | | | 285 | | |
| Class C | | | 24 | | | | 176 | | |
| Class C2 | | | 38 | | | | 43 | | |
| Class M | | | 36 | | | | 107 | | |
| | | | 705 | | | | 4,575 | | |
| Shares issued on fund acquisition: | |
| Class A | | | 3,817 | | | | – | | |
| Class B | | | 230 | | | | – | | |
| Class C | | | 21 | | | | – | | |
| Class C2 | | | 59 | | | | – | | |
| Class M | | | 39 | | | | – | | |
| | | | 4,166 | | | | – | | |
| Shares redeemed: | |
| Class A | | | (3,098 | ) | | | (6,977 | ) | |
| Class B | | | (2,370 | ) | | | (3,380 | ) | |
| Class C | | | (144 | ) | | | (168 | ) | |
| Class C2 | | | (321 | ) | | | (636 | ) | |
| Class M | | | (950 | ) | | | (1,842 | ) | |
| | | | (6,883 | ) | | | (13,003 | ) | |
| Class level exchanges: | |
| Class C | | | 2,372 | | | | – | | |
| Class C2 | | | (689 | ) | | | – | | |
| Class M | | | (1,675 | ) | | | – | | |
| | | | 8 | | | | – | | |
| Automatic conversions: | |
| Class A | | | 51 | | | | – | | |
| Class B | | | (54 | ) | | | – | | |
| | | | (3 | ) | | | – | | |
Net increase (decrease) in shares
outstanding: | |
| Class A | | | 1,208 | | | | (3,013 | ) | |
| Class B | | | (2,025 | ) | | | (3,095 | ) | |
| Class C | | | 2,273 | | | | 8 | | |
| Class C2 | | | (913 | ) | | | (593 | ) | |
| Class M | | | (2,550 | ) | | | (1,735 | ) | |
| | | | (2,007 | ) | | | (8,428 | ) | |
The notes to financial statements are an integral part of this report.
Transamerica IDEX Mutual Funds
Annual Report 2004
10
TA IDEX Templeton Great Companies Global
FINANCIAL HIGHLIGHTS
| | | | | For a share of beneficial interest outstanding throughout each period | |
| | | | | Net Asset | | Investment Operations | | Distributions | | Net Asset | |
| | | For the
Period
Ended (d)(g) | | Value,
Beginning
of Period | | Net
Investment
Income (Loss) | | Net Realized
and Unrealized
Gain (Loss) | | Total
Operations | | From Net
Investment
Income | | From Net
Realized
Gains | | Total
Distributions | | Value,
End
of Period | |
| Class A | | 10/31/2004 | | $ | 21.41 | | | $ | (0.07 | ) | | $ | 1.23 | | | $ | 1.16 | | | $ | – | | | $ | – | | | $ | – | | | $ | 22.57 | | |
| | | 10/31/2003 | | | 19.06 | | | | (0.05 | ) | | | 2.40 | | | | 2.35 | | | | – | | | | – | | | | – | | | | 21.41 | | |
| | | 10/31/2002 | | | 23.67 | | | | (0.08 | ) | | | (4.53 | ) | | | (4.61 | ) | | | – | | | | – | | | | – | | | | 19.06 | | |
| | | 10/31/2001 | | | 40.20 | | | | (0.07 | ) | | | (13.99 | ) | | | (14.06 | ) | | | – | | | | (2.47 | ) | | | (2.47 | ) | | | 23.67 | | |
| | | 10/31/2000 | | | 33.80 | | | | – | | | | 7.53 | | | | 7.53 | | | | – | | | | (1.13 | ) | | | (1.13 | ) | | | 40.20 | | |
| Class B | | 10/31/2004 | | | 20.25 | | | | (0.20 | ) | | | 1.18 | | | | 0.98 | | | | – | | | | – | | | | – | | | | 21.23 | | |
| | | 10/31/2003 | | | 18.14 | | | | (0.17 | ) | | | 2.28 | | | | 2.11 | | | | – | | | | – | | | | – | | | | 20.25 | | |
| | | 10/31/2002 | | | 22.71 | | | | (0.22 | ) | | | (4.35 | ) | | | (4.57 | ) | | | – | | | | – | | | | – | | | | 18.14 | | |
| | | 10/31/2001 | | | 38.97 | | | | (0.27 | ) | | | (13.52 | ) | | | (13.79 | ) | | | – | | | | (2.47 | ) | | | (2.47 | ) | | | 22.71 | | |
| | | 10/31/2000 | | | 32.98 | | | | (0.41 | ) | | | 7.53 | | | | 7.12 | | | | – | | | | (1.13 | ) | | | (1.13 | ) | | | 38.97 | | |
| Class C | | 10/31/2004 | | | 20.25 | | | | (0.15 | ) | | | 1.11 | | | | 0.96 | | | | – | | | | – | | | | – | | | | 21.21 | | |
| | | 10/31/2003 | | | 18.00 | | | | (0.17 | ) | | | 2.42 | | | | 2.25 | | | | – | | | | – | | | | – | | | | 20.25 | | |
| | | | | | | Ratios/Supplemental Data | |
| | | For the
Period | | Total | | Net Assets,
End of
Period | | Ratio of Expenses
to Average
Net Assets (a) | | Net Investment
Income (Loss)
to Average | | Portfolio
Turnover | |
| | | Ended (g) | | Return (c) | | (000's) | | Net (e) | | Total (f) | | Net Assets (a) | | Rate (b) | |
| Class A | | 10/31/2004 | | | 5.41 | % | | $ | 226,517 | | | | 1.85 | % | | | 1.85 | % | | | (0.31 | )% | | | 140 | % | |
| | | 10/31/2003 | | | 12.33 | | | | 189,046 | | | | 2.07 | | | | 2.07 | | | | (0.26 | ) | | | 103 | | |
| | | 10/31/2002 | | | (19.46 | ) | | | 225,722 | | | | 1.88 | | | | 1.88 | | | | (0.34 | ) | | | 72 | | |
| | | 10/31/2001 | | | (37.08 | ) | | | 374,626 | | | | 1.63 | | | | 1.63 | | | | (0.24 | ) | | | 79 | | |
| | | 10/31/2000 | | | 22.26 | | | | 749,671 | | | | 1.64 | | | | 1.64 | | | | (0.56 | ) | | | 53 | | |
| Class B | | 10/31/2004 | | | 4.83 | | | | 117,409 | | | | 2.49 | | | | 2.49 | | | | (0.93 | ) | | | 140 | | |
| | | 10/31/2003 | | | 11.57 | | | | 153,046 | | | | 2.72 | | | | 2.72 | | | | (0.91 | ) | | | 103 | | |
| | | 10/31/2002 | | | (20.09 | ) | | | 193,259 | | | | 2.53 | | | | 2.53 | | | | (0.99 | ) | | | 72 | | |
| | | 10/31/2001 | | | (37.58 | ) | | | 320,693 | | | | 2.28 | | | | 2.28 | | | | (0.89 | ) | | | 79 | | |
| | | 10/31/2000 | | | 21.62 | | | | 614,789 | | | | 2.29 | | | | 2.29 | | | | (1.21 | ) | | | 53 | | |
| Class C | | 10/31/2004 | | | 4.74 | | | | 48,378 | | | | 2.18 | | | | 2.18 | | | | (0.72 | ) | | | 140 | | |
| | | 10/31/2003 | | | 12.50 | | | | 163 | | | | 2.72 | | | | 2.72 | | | | (0.92 | ) | | | 103 | | |
NOTES TO FINANCIAL HIGHLIGHTS
(a) Annualized.
(b) Not annualized for periods of less than one year.
(c) Total Return has been calculated for the applicable period without deduction of a sales load, if any, on an initial purchase. Periods of less that one year are not annualized.
(d) Per share information is calculated based on average number of shares outstanding for the years ended 10/31/2001, 10/31/2002, 10/31/2003 and 10/31/2004.
(e) Ratio of Net Expenses to Average Net Assets is net of fee waivers and reimbursements by the investment adviser, if any (see note 2).
(f) Ratio of Total Expenses to Average Net Assets includes all expenses before fee waivers and reimbursements by the investment adviser.
(g) The inception date for the Fund's offering of share Class C was November 11, 2002.
The notes to the financial statements are an integral part of this report.
Transamerica IDEX Mutual Funds
Annual Report 2004
11
TA IDEX Templeton Great Companies Global
NOTES TO FINANCIAL STATEMENTS
At October 31, 2004
(all amounts in thousands)
NOTE 1. ORGANIZATION AND SIGNIFICANT ACCOUNTING POLICIES
Transamerica IDEX Mutual Funds, formerly IDEX Mutual Funds, is a Massachusetts business trust registered under the Investment Company Act of 1940, as amended (the "1940 Act"), as an open-end management investment company. TA IDEX Templeton Great Companies Global ("the Fund"), part of Transamerica IDEX Mutual Funds, began
operations on October 1, 1992.
On March 1, 2004, the Fund changed its name from IDEX Janus Global to TA IDEX Janus Global.
On May 28, 2004, the Fund acquired all of the net assets of TA IDEX Templeton Great Companies Global pursuant to a plan of reorganization. TA IDEX Janus Global is the accounting survivor. At the same time, the Fund changed sub-advisers from Janus Capital Management, LLC to Templeton Investment Counsel, LLC and Great Companies, LLC and was renamed from TA IDEX Janus Global to TA IDEX Templeton Great Companies Global.
The acquisition was accomplished by a tax free exchange of 4,196 shares of the Fund for 12,556 shares of TA IDEX Templeton Great Companies Global outstanding on May 27, 2004. TA IDEX Great Companies Global's net assets at that date, $92,688, including $3,609 unrealized appreciation, were combined with those of the Fund. The aggregate net assets of TA IDEX Janus Global immediately before the acquisition was $341,594. The combined net assets of the Fund immediately after the acquisition was $434,282. Proceeds in connection with the acquisition were as follows:
| | | Shares | | Amount | |
| Proceeds in connection with the acquisition | |
| Class A | | | 3,817 | | | $ | 85,329 | | |
| Class B | | | 230 | | | | 4,841 | | |
| Class C | | | 21 | | | | 436 | | |
| Class C2 | | | 59 | | | | 1,244 | | |
| Class M | | | 39 | | | | 838 | | |
| | | | | | | $ | 92,688 | | |
In the normal course of business, the Fund enters into contracts that contain a variety of representations and warranties, which provide general indemnifications. The Fund's maximum exposure under these arrangements is unknown, as this would involve future claims that may be made against the Fund and/or its affiliates that have not yet occurred. However, based on experience, the Fund expects the risk of loss to be remote.
See the Prospectus and Statement of Additional Information for a description of the Fund's investment objective.
In preparing the Fund's financial statements in accordance with accounting principles generally accepted in the United States of America ("GAAP"), estimates or assumptions (which could differ from actual results) may be used that affect reported amounts and disclosures. The following policies were consistently followed by the Fund, in accordance with GAAP.
Multiple class operations and expenses: The Fund currently offers three classes of shares, each with a public offering price that reflects different sales charges, if any, and expense levels. All shares designated as Class C shares prior to March 1, 2004, were renamed as Class C2 shares on that date. All shares designated as Class L shares prior to March 1, 2004, were renamed as Class C shares with different sales charges than the previous Class L shares. On June 15, 2004, Class C2 shares merged into Class C. On September 24, 2004, Class M shares merged into Class C. Class B shares will convert to Class A shares eight years after purchase. Income, non-class specific expenses and realized and unrealized gains and losses, are allocated daily to each class, based upon the value of shares outstanding method as permitted under Rule 18f-3 of the 1940 Act. Each class bears its own specific expenses as well as a portion of general, common expenses.
Pricing of shares: The Fund prices its shares on the basis of the net asset value of each class of shares of the Fund, which is determined as of the close of the New York Stock Exchange ("NYSE") (generally 4:00 p.m. Eastern Time) on each day on which the NYSE is open for trading (other than a day on which there are insufficient changes in the value of the Fund's portfolio securities to materially affect the Fund's net asset value or a day on which no shares are tendered for redemption and no order to purchase any shares is received).
Security valuations: Fund investments traded on an exchange are valued at the closing price on the day of valuation on the exchange where the security is principally traded. With respect to securities traded on NASDAQ NMS, such closing price may be the last reported sales price or the NASDAQ Official Closing Price.
Securities traded in the over-the-counter market and listed securities for which no sale was reported on that date are valued at the last quoted bid price.
Debt securities are valued by independent pricing services; however, those that mature in sixty days or less are valued at amortized cost, which approximates market.
Investment company securities are valued at net asset value of the underlying portfolio.
Foreign securities generally are valued based on quotations from the primary market in which they are traded and are translated from the local currency into U.S. dollars using closing exchange rates. Many foreign securities markets are open for trading at times when the U.S. markets are closed for trading, and many foreign securities markets close for trading before the close of the NYSE. The value of foreign securities may be affected significantly on a day that the NYSE is closed
Transamerica IDEX Mutual Funds
Annual Report 2004
12
TA IDEX Templeton Great Companies Global
NOTES TO FINANCIAL STATEMENTS (continued)
At October 31, 2004
(all amounts in thousands)
NOTE 1.–(continued)
and an investor is unable to purchase or redeem shares. If a significant market event impacting the value of a portfolio security (e.g., natural disaster, company announcement, market volatility) occurs subsequent to the close of trading in the security, but prior to the calculation of the Fund's net asset value per share, market quotations for that security may be determined to be unreliable and, accordingly, not "readily available." If market quotations are not readily available, and the impact of such a significant market event materially effects the net asset value per share of the Fund, an affected portfolio security will be valued at fair market value as determined in good faith using guidelines adopted by the Board of Trustees of the Fund, under the supervision of the Fund's Valuation Committee. Factors that may be considered to value foreign securities at fair market value may include, among oth ers: the value of other securities traded on other markets, foreign currency exchange activity and the trading of financial products tied to foreign securities.
Other securities for which quotations are not readily available are valued at fair market value as determined in good faith using guidelines adopted by the Board of Trustees of the Fund, under the supervision of the Fund's Valuation Committee.
The Fund values its investment securities at fair value based upon procedures approved by the Board of Trustees on days when significant events occur after the close of the principal exchange on which the securities are traded, and as a result, are expected to materially effect the value of investments.
Cash: The Fund may leave cash overnight in its cash account with the custodian, Investors Bank & Trust Company ("IBT"). IBT has been contracted on behalf of the Fund to invest the excess cash into a savings account, which at October 31, 2004, was paying an interest rate of 1.30%.
Throughout the year, the Fund may have a cash overdraft balance. A fee is incurred on this overdraft, calculated by multiplying the overdraft by a rate based on the federal funds rate. This fee is included in Custody fees in the Statement of Operations.
Repurchase agreements: The Fund is authorized to enter into repurchase agreements. The Fund, through IBT, receives delivery of the underlying securities, the value of which at the time of purchase is required to be an amount equal to at least 100% of the resale price. Repurchase agreements involve the risk that the seller will fail to repurchase the security, as agreed. In that case, the Fund will bear the risk of value fluctuations until the security can be sold and may encounter delays and incur costs in liquidating the security. In the event of bankruptcy or insolvency of the seller, delays and costs may be incurred.
Commission Recapture: The sub-adviser, to the extent consistent with the best execution and usual commission rate policies and practices, may place security transactions of the Fund with broker/dealers with which Transamerica IDEX Mutual Funds has established a Commission Recapture Program. A Commission Recapture Program is any arrangement under which a broker/dealer applies a portion of the commissions received by such broker/dealer on the security transactions to the Fund. In no event will commissions paid by the Fund be used to pay expenses that would otherwise be borne by any other funds within Transamerica IDEX Mutual Funds, or by any other party.
Recaptured commissions during the year ended October 31, 2004, of $213 are included in net realized gains in the Statement of Operations.
Securities lending: The Fund may lend securities to enhance fund earnings from investing cash collateral in making such loans to qualified borrowers (typically broker/dealers). The Fund has engaged its custodian bank, IBT, as a lending agent to administer its securities lending program. IBT earned $13 of program income for its services. When the Fund makes a security loan, it receives cash collateral as protection against the risk that the borrower will default on the loan, and records an asset for the cash invested collateral and a liability for the return of the collateral.
Securities on loan are included in Investment securities at value in the Statement of Assets and Liabilities and remain on the Schedule of Investments.
Loans of securities are required to be secured by collateral at least equal to 102% of the value of the securities at inception of the loan, and not less then 100% thereafter. The Fund may invest cash collateral in short-term money market instruments including: U.S. Treasury Bills, U.S. agency obligations, commercial paper, money market mutual funds, repurchase agreements and other highly rated, liquid investments. During the life of securities loans, the collateral and securities loaned remain subject to fluctuation in value. IBT marks to market securities loaned and the collateral each business day. If additional collateral is due (at least $1), IBT collects additional cash collateral from the borrowers. Although securities loaned will be fully collateralized at all times, IBT may experience delays in, or may be prevented from, recovering the collateral on behalf of the Fund. The Fund may recall a loa ned security position at any time from the borrower through IBT. In the event the borrower fails to timely return a recalled security, IBT may indemnify the Fund by purchasing replacement securities for the Fund at its own expense and claiming the collateral to fund such a purchase. IBT absorbs the loss if the collateral value is not sufficient to cover the cost of the replacement securities. If replacement securities are not available, IBT will credit the equivalent cash value to the Fund.
While a security is on loan, the Fund does not have the right to vote that security. However, if time permits, the Fund will attempt to recall a security on loan and vote the proxy.
Transamerica IDEX Mutual Funds
Annual Report 2004
13
TA IDEX Templeton Great Companies Global
NOTES TO FINANCIAL STATEMENTS (continued)
At October 31, 2004
(all amounts in thousands)
NOTE 1.–(continued)
Income from securities lending is included in the Statement of Operations. The amount of collateral and value of securities on loan are included in the Statement of Assets and Liabilities as well as in the Schedule of Investments.
Security transactions and investment income: Security transactions are recorded on the trade date. Security gains and losses are calculated on the specific identification basis. Dividend income is recorded on the
ex-dividend date or, in the case of foreign securities, as soon as the Fund is informed of the ex-dividend date. Interest income, including accretion of discounts and amortization of premiums, is recorded on the accrual basis commencing on the settlement date.
Foreign currency denominated investments: The accounting records of the Fund are maintained in U.S. dollars. Securities and other assets and liabilities denominated in foreign currencies are translated into U.S. dollars at the closing exchange rate each day. The cost of foreign securities is translated at the exchange rate in effect when the investment was acquired. The Fund combines fluctuations from currency exchange rates and fluctuations in value when computing net realized and unrealized gains or losses from investments.
Net foreign currency gains and losses resulting from changes in exchange rates include: 1) foreign currency fluctuations between trade date and settlement date of investment security transactions; 2) gains and losses on forward foreign currency contracts; and 3) the difference between the receivable amounts of interest and dividends recorded in the accounting records in U.S. dollars and the amounts actually received.
Foreign currency denominated assets may involve risks not typically associated with domestic transactions, including unanticipated movements in exchange currency rates, the degree of government supervision and regulation of security markets, and the possibility of political or economic instability.
Foreign capital gains taxes: The Fund may be subject to taxes imposed by countries in which it invests, with respect to its investment in issuers existing or operating in such countries. Such taxes are generally based on income earned or repatriated and capital gains realized on the sale of such investments. The Fund accrues such taxes when the related income or capital gains are earned. Some countries require governmental approval for the repatriation of investment income, capital or the proceeds of sales earned by foreign investors. In addition, if there is deterioration in a country's balance of payments or for other reasons, a country may impose temporary restrictions on foreign capital remittances abroad.
Forward foreign currency contracts: The Fund may enter into forward foreign currency contracts to hedge against exchange rate risk arising from investments in securities denominated in foreign currencies. Contracts are valued at the contractual forward rate and are marked to market daily, with the change in value recorded as an unrealized gain or loss. When the contracts are closed a realized gain or loss is incurred. Risks may arise from changes in market value of the underlying currencies and from the possible inability of counterparties to meet the terms of their contracts.
Open forward foreign currency contracts at October 31, 2004, are listed in the Schedule of Investments.
Account maintenance fees: If the shareholder account balance falls below $1 by either shareholder action or as a result of market action, a $25 (not in thousands) fee is assessed every year until the balance reaches $1. The fee is assessed by redeeming shares in the shareholder's account.
No fee will be charged under the following conditions:
• accounts opened within the preceding 24 months
• accounts with an active monthly Automatic Investment Plan ($50 (not in thousands) minimum per fund)
• accounts owned by an individual which, when combined by social security number, have a balance of $5 or more
• accounts owned by individuals in the same household (by address) that have a combined balance of $5 or more
• UTMA/UGMA accounts
• Fiduciary accounts
• B-share accounts whose shares have started to convert to A-shares accounts (as long as combined value of both accounts is at least $1)
For the year ended October 31, 2004, this fee totaled $16. These fees are included in Paid in Capital in the Statement of Assets and Liabilities.
Redemption fees: A short-term trading redemption fee may be assessed on any fund shares in a fund account that are sold during the first five (5) New York Stock Exchange trading days following their purchase date. This redemption fee will equal 2% of the amount redeemed and shares he ld the longest will be treated as being redeemed first and shares held the shortest as being redeemed last. For the year ended October 31, 2004, the Fund received no redemption fees.
Dividend distributions: Distributions to shareholders are recorded on the ex-dividend date and are determined in accordance with Federal income tax regulations which may differ from GAAP.
NOTE 2. RELATED PARTY TRANSACTIONS
AEGON/Transamerica Fund Advisers, Inc. ("ATFA") is the Fund's investment adviser. AEGON/Transamerica Fund Services, Inc. ("ATFS") is the Fund's administrator. AFSG Securities Corp. ("AFSG") is the Fund's distributor/principal underwriter. AEGON/Transamerica Investor Services, Inc. ("ATIS") is the Fund's transfer agent. ATIS and AFSG are 100% owned by AUSA Holding Company ("AUSA"). ATFA is a directly owned subsidiary of Western Reserve Life Assurance Co. of
Transamerica IDEX Mutual Funds
Annual Report 2004
14
TA IDEX Templeton Great Companies Global
NOTES TO FINANCIAL STATEMENTS (continued)
At October 31, 2004
(all amounts in thousands)
NOTE 2.–(continued)
Ohio (78%) ("WRL") and AUSA (22%). ATFS is a wholly owned subsidiary of WRL. AUSA and WRL are wholly owned indirect subsidiaries of AEGON NV, a Netherlands corporation.
The following schedule represents the percentage of fund assets owned by affiliated mutual funds (i.e. through the asset allocation funds):
| | | Net
Assets | | % of
Net Assets | |
TA IDEX Asset Allocation –
Conservatiave Portfolio | | $ | 5,617 | | | | 1 | % | |
TA IDEX Asset Allocation –
Growth Portfolio | | | 29,996 | | | | 7 | % | |
TA IDEX Asset Allocation –
Moderate Growth Portfolio | | | 39,820 | | | | 10 | % | |
TA IDEX Asset Allocation –
Moderate Portfolio | | | 5,388 | | | | 1 | % | |
| Total | | $ | 80,821 | | | | 19 | % | |
Investment advisory fee: The Fund pays management fees to ATFA based on average daily net assets ("ANA") at the following breakpoints:
From November 1, 2003 to May 28, 2004:
1.00% of the first $750 million of ANA
0.90% of the next $250 million of ANA
0.85% of ANA over $1 billion
From May 29, 2004 on:
0.80% of the first $500 million of ANA
0.70% of ANA over $500 million
ATFA has contractually agreed to waive its advisory fee and will reimburse the Fund to the extent that operating expenses, excluding 12b-1 fees, exceed the following stated annual limit:
From May 29, 2004 on:
1.20% Expense Limit
Great Companies, LLC is both an affiliate of the Fund and a sub-adviser to the Fund.
Prior to May 28, 2004, Janus Capital Management, LLC ("Janus") acted as the sub-adviser. Janus had agreed to a pricing discount based on the aggregate assets that they managed in the AEGON/Transamerica Series Fund, Inc. and Transamerica IDEX Mutual Funds. The amount of the discount received by the Fund for the period from November 1, 2003 to May 27, 2004 was $8.
Distribution and service fees: The Fund has a 12b-1 distribution plan under the 1940 Act pursuant to which an annual fee, based on average daily net assets, is paid to the distributor for various disbursements such as broker-dealer account servicing fees and other promotional expenses of the Fund. The Fund is authorized under the 12b-1 plan to pay fees on each class up to the following limits:
| Class A | | | 0.35 | % | |
| Class B | | | 1.00 | % | |
| Class C | | | 1.00 | % | |
| Class C2 | | | 1.00 | % | |
| Class M | | | 0.90 | % | |
Class C2 and Class M merged into Class C on June 15, 2004 and September 24, 2004, respectively.
In the case the Fund or a class of shares of the Fund is closed to new investors or investments, the Fund is authorized to pay 12b-1 fees for past sales and distribution efforts and present and past investor services.
Underwriter commissions relate to front-end sales charges imposed for Class A and M shares and contingent deferred sales charges from Classes B, C, M and certain A share redemptions. For the year ended October 31, 2004, the underwriter commissions were as follows:
| Received by Underwriter | | $ | 442 | | |
| Retained by Underwriter | | | 22 | | |
| Contingent Deferred Sales Charge | | | 267 | | |
Administrative services: The Fund has entered into an agreement with ATFS for financial and legal fund administration services, which includes such items as compliance, expenses, financial statements and other reporting, distributions, tax returns, prospectus preparation, board of trustees meeting support and other legal matters. The Fund pays ATFS an annual fee of 0.015% of average net assets. The Legal fees on the Statement of Operations are for fees paid to external legal counsel.
The Fund paid ATFS $57 for the year ended October 31, 2004.
Transfer agent fees: The Fund pays ATIS an annual per-account charge of $20 (not in thousands) for each open account and $1.63 (not in thousands) for each closed account. There is no new account charge. The transfer agent fees on the Statement of Operations are made up of fees paid to ATIS and costs associated with shareholder statements. The Fund paid ATIS $1,468 for the year ended October 31, 2004.
Deferred compensation plan: Each eligible Fund Trustee may elect participation in the Deferred Compensation Plan ("the Plan"). Under the Plan, such Trustees may defer payment of a percentage of their total fees earned as a Fund Trustee. These deferred amounts may be invested in any Transamerica IDEX Mutual Fund. At October 31, 2004, the value of invested plan amounts was $82. Invested plan amounts and the total liability for deferred compensation to the Trustees under the Plan at October 31, 2004, are included in the accompanying Statement of Assets and Liabilities.
Transamerica IDEX Mutual Funds
Annual Report 2004
15
TA IDEX Templeton Great Companies Global
NOTES TO FINANCIAL STATEMENTS (continued)
At October 31, 2004
(all amounts in thousands)
NOTE 3. INVESTMENT TRANSACTIONS
The cost of securities purchased and proceeds from securities sold (excluding short-term securities) for the year ended October 31, 2004, were as follows:
| Purchases of securities: | | | |
| Long-Term excluding U.S. Government | | $ | 535,454 | | |
| U.S. Government | | | – | | |
| Proceeds from maturities and sales of securities | | | |
| Long-Term excluding U.S. Government | | | 658,752 | | |
| U.S. Government | | | – | | |
NOTE 4. FEDERAL INCOME TAX MATTERS
The Fund has not made any provision for federal income or excise taxes due to its policy to distribute all of its taxable income and capital gains to its shareholders and otherwise qualify as a regulated investment company under the Internal Revenue Code. Income and capital gain distributions are determined in accordance with income tax regulations, which may differ from GAAP. These differences are primarily due to differing treatment for items including, but not limited to, wash sales, net operating losses foreign currency transactions, passive foreign investment companies and capital loss carryforwards.
Reclassifications between Undistributed net investment income (loss), Undistributed net realized capital gains (loss) and Shares of beneficial interest are made to reflect income and gains available for distribution under federal tax regulations. Results of operations and net assets are not effected by these reclassifications. These reclassifications are as follows:
Shares of beneficial interest,
unlimited shares authorized | | $ | (72 | ) | |
| Undistributed net investment income (loss) | | | 2,280 | | |
Accumulated net realized gain (loss) from
investment securities | | | (2,208 | ) | |
The capital loss carryforwards are available to offset future realized capital gains through the periods listed:
Capital Loss
Carryforward | | Available through | |
| $ | 130,090 | | | October 31, 2009 | |
| | 205,203 | | | October 31, 2010 | |
| | 57,944 | | | October 31, 2011 | |
The capital loss carryforward utilized during the year ended October 31, 2004 was $47,555.
The tax basis components of distributable earnings as of October 31, 2004, are as follows:
| Undistributed Ordinary Income | | $ | – | | |
| Undistributed Long-term Capital Gains | | $ | – | | |
| Capital Loss Carryforward | | $ | (393,238 | ) | |
| Net Unrealized Appreciation (Depreciation) | | $ | 7,769 | * | |
*Amount includes unrealized gain/loss from foreign currency and deferred compensation.
The aggregate cost of investments and composition of unrealized appreciation (depreciation) for federal income tax purposes as of October 31, 2004, are as follows:
| Federal Tax Cost Basis | | $ | 401,752 | | |
| Unrealized Appreciation | | $ | 22,481 | | |
| Unrealized (Depreciation) | | | (14,809 | ) | |
| Net Unrealized Appreciation (Depreciation) | | $ | 7,672 | | |
NOTE 5. OTHER MATTERS
Transamerica IDEX Mutual Funds ("TA IDEX"), and certain of its affiliated entities, have received requests for information from the Staff of the Securities and Exchange Commission in connection with market timing and late trading within the funds. TA IDEX and the affiliated entities have voluntarily cooperated in the investigation and have been providing the information as requested.
Transamerica IDEX Mutual Funds
Annual Report 2004
16
Report of Independent Registered Certified Public Accounting Firm
To the Board of Trustees and Shareholders of
TA IDEX Templeton Great Companies Global
In our opinion, the accompanying statement of assets and liabilities, including the schedule of investments, and the related statements of operations and of changes in net assets and the financial highlights present fairly, in all material respects, the financial position of TA IDEX Templeton Great Companies Global (the "Fund") (one of the portfolios constituting the Transamerica IDEX Mutual Funds) at October 31, 2004, the results of its operations for the year then ended, the changes in its net assets for each of the two years in the period then ended and the financial highlights for each of the periods indicated, in conformity with accounting principles generally accepted in the United States of America. These financial statements and financial highlights (hereafter referred to as "financial statements") are the responsibility of the Fund's management; our responsibility is to express an opinion on these financial statements based on our audits. We conducted our audits of these financial statements in accordance with the standards of the Public Company Accounting Oversight Board (United States). Those standards require that we plan and perform the audit to obtain reasonable assurance about whether the financial statements are free of material misstatement. An audit includes examining, on a test basis, evidence supporting the amounts and disclosures in the financial statements, assessing the accounting principles used and significant estimates made by management, and evaluating the overall financial statement presentation. We believe that our audits, which included confirmation of securities at October 31, 2004 by correspondence with the custodian and brokers, provide a reasonable basis for our opinion.

PricewaterhouseCoopers LLP
Tampa, Florida
December 28, 2004
Transamerica IDEX Mutual Funds
Annual Report 2004
17
TA IDEX Templeton Great Companies Global
SUPPLEMENTAL INFORMATION
RESULTS OF SHAREHOLDER PROXY (unaudited)
At a special meeting of shareholders held on May 21, 2004, the results of the Proposal were as follows:
Proposal 1: Approval of an Agreement and Plan of Reorganization providing for the acquisition of all of the assets and liabilities of TA IDEX Templeton Great Companies Global (the "Acquired Fund") by TA IDEX Janus Global (the "Acquiring Fund") solely in exchange for shares of the Acquiring Fund, followed by the complete liquidation of the Acquired Fund.
| For | | Against | | Abstentions/Broker Non-Votes | |
| | 98.95 | % | | | 0.49 | % | | | 0.56 | % | |
At a special meeting of Class M shareholders of each series of Transamerica IDEX (except TA IDEX Federated Tax Exempt and TA IDEX Protected Principal Stock) held on September 2, 2004, the results of the Proposal were as follows:
Proposal 1: Approval of a conversion of Class M shares into Class C shares of the Funds, which will result in bearing the distribution and service fees payable under the 12b-1 Plan of Distribution for the Class C shares of the Funds.
| For | | Against | | Abstentions/Broker Non-Votes | |
| | 76.49 | % | | | 9.98 | % | | | 13.53 | % | |
Transamerica IDEX Mutual Funds
Annual Report 2004
18
TA IDEX Transamerica Balanced
MARKET ENVIRONMENT
The U.S. stock and bond markets delivered attractive returns in the twelve months ended October 31, 2004.
Equities, as represented by the Standard and Poor's 500 Composite Stock Index ("S&P 500"), gained 9.41%, largely on the strength of returns for energy, industrial and basic materials stocks. The gains in these sectors can be attributed to rising energy prices and rising demand for basic materials and industrial goods as global economies build their infrastructures.
In the U.S. fixed-income markets, the yield curve flattened dramatically over these twelve months. As recent data releases increasingly suggested that economic growth in the U.S. is sustainable and yields on short-term securities rose in anticipation of interest-rate hikes by the Federal Reserve Board. Meanwhile, evidence that inflation remained in check led to lower yields on long-term bonds. The Lehman Brothers U.S. Government/Credit Index ("LBGC") generated a 12-month total return of 5.57%.
PERFORMANCE
For the year ended October 31, 2004, TA IDEX Transamerica Balanced, Class A returned 7.03%. By comparison its primary and secondary benchmarks, the S&P 500 and the LBGC, returned 9.41% and 5.57%, respectively.
STRATEGY REVIEW
Upon assuming management responsibilities for the portfolio on June 1, 2004, we repositioned it to reflect our constructive view on the economy. We increased the equity allocation from under 50% to over 70% of assets and divested/replaced stocks that, in our view, did not have the potential to benefit from one of several secular themes. Within the bond portfolio, we emphasized corporate securities, both investment grade and high yield.
The equity portfolio was positioned to take advantage of two current trends: the growth in spending for global infrastructure, which is fueling demand for industrial goods, basic materials, and energy; and the conversion of entertainment and communications from analog to digital formats. Reflecting our focus, the strongest contributors to performance, from June 1st to October 31st, included QUALCOMM, Incorporated ("QUALCOMM"), PACCAR, Inc. ("PACCAR"), General Electric Company ("GE"), and Anadarko Petroleum Corporation ("Anadarko"). QUALCOMM is a leading chip supplier for Code Division Multiple Access ("CDMA")-based telecommunications devices (e.g., SANYO Electric Co., Ltd. cell phones) and repeatedly exceeded earnings estimates in the past year. PACCAR manufactures semi-tractors. GE is a world l eader in electric generation and transportation, and Anadarko is an independent oil exploration and production company.
Partially offsetting the gains in these and other stocks were several holdings, such as International Business Machines Corporation and Motorola, Inc., that did not fit our investment theses and were divested soon after we assumed portfolio management responsibilities. We also saw weakness in Zimmer Holdings Inc., a manufacturer of titanium replacement joints whose stock suffered on concerns regarding healthcare reimbursements; and Allergan, Inc., a pharmaceuticals company where two well-publicized failures of minor drugs negatively impacted the stock price. We like each company's long-term prospects and maintained our positions.
On the fixed-income side, we established an above-index allocation to investment-grade and high-yield corporate bonds, with an emphasis on industrial companies. This benefited the portfolio, since both sectors outpaced Treasuries between June 1st and October 31st.
Gary U. Rolle, CFA
Heidi Y. Hu, CFA
Jeffrey S. Van Harte, CFA
Co-Fund Managers
Transamerica Investment Management, LLC
Transamerica IDEX Mutual Funds
Annual Report 2004
1
TA IDEX Transamerica Balanced
Comparison of change in value of $10,000 investment in Class A shares and its comparative index.
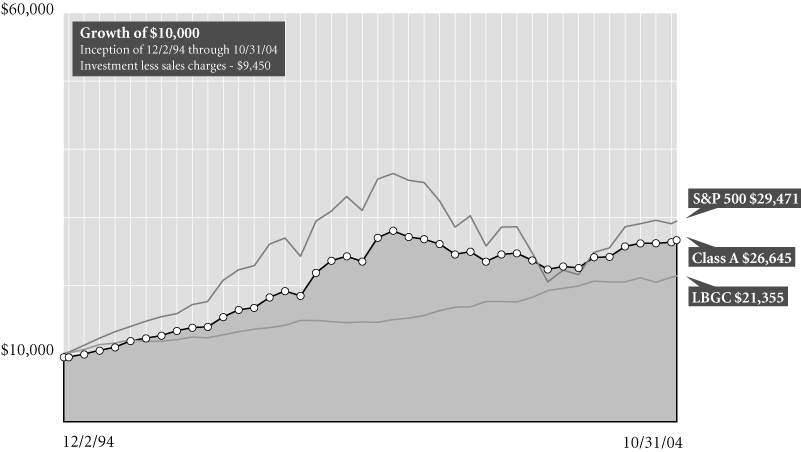
Average Annual Total Return for Periods Ended 10/31/04
| | | 1 year | | 5 years | | From
Inception | | Inception
Date | |
| Class A (NAV) | | | 7.03 | % | | | 1.51 | % | | | 11.00 | % | | 12/2/94 | |
| Class A (POP) | | | 1.15 | % | | | 0.36 | % | | | 10.37 | % | | 12/2/94 | |
| S&P 5001 | | | 9.41 | % | | | (2.21 | )% | | | 11.52 | % | | 12/2/94 | |
| LBGC1 | | | 5.57 | % | | | 7.87 | % | | | 7.95 | % | | 12/2/94 | |
| Class B (NAV) | | | 6.44 | % | | | 0.85 | % | | | 9.63 | % | | 10/1/95 | |
| Class B (POP) | | | 1.44 | % | | | 0.66 | % | | | 9.63 | % | | 10/1/95 | |
| Class C (NAV) | | | 6.33 | % | | | – | | | | 7.18 | % | | 11/11/02 | |
| Class C (POP) | | | 5.33 | % | | | – | | | | 7.18 | % | | 11/11/02 | |
NOTES
1 The Standard & Poor's 500 Composite Stock (S&P 500) Index and Lehman Brothers U.S. Government/Credit (LBGC) Index are unmanaged indices used as a general measure of market performance. Calculations assume dividends and capital gains are reinvested and do not include any managerial expenses. From inception calculation is based on life of Class A shares. Source: Standard &a mp; Poor's Micropal®© Micropal, Inc. 2004 – 1-800-596-5323 – http://www.micropal.com.
The performance data presented represents past performance, future results may vary. Performance data does not reflect the deduction of taxes that would be paid on fund distributions or the redemption of fund shares. Investment return and principal value will fluctuate so that an investor's shares, when redeemed, may be worth more or less than their original cost. Current performance may be lower or higher than performance quoted.
Public Offering Price (POP) returns include the reinvestment of dividends and capital gains and reflect the maximum sales charge of 5.5% for A shares or the maximum applicable contingent deferred sales charge (5% in the 1st year, decreasing to 0% after 6 years) for Class B shares and 1% (during the first 12 months) for Class C shares. Shares purchased prior to March 1, 2004 are subject to a maximum applicable contingent deferred sales charge (5% in the 1st year, decreasing to 0% after 7 years) for Class B shares and (2% in the 1st year, decreasing to 0% after 2 years) for Class C shares. Net Asset Value ( NAV) returns include the reinvestment of dividends and capital gains but do not reflect any sales charges.
This material must be preceded or accompanied by a current prospectus, which includes specific contents regarding the investment objectives and policies of this fund.
Transamerica IDEX Mutual Funds
Annual Report 2004
2
TA IDEX Transamerica Balanced
UNDERSTANDING YOUR FUND'S EXPENSES (unaudited)
SHAREHOLDER EXPENSES
The following Example is intended to help you understand your ongoing costs (in dollars and cents) of investing in a Fund and to compare these costs with the ongoing costs of investing in other funds.
The Example is based on an investment of $1,000 invested at the beginning of the period and held for the entire period from May 1, 2004 to October 31, 2004.
ACTUAL EXPENSES
The first line in the table below provides information about actual account values and actual expenses. You may use the information in this line, together with the amount you invested, to estimate the expenses that you paid over the period. Simply divide your account value by $1,000 (for example, an $8,600 account value divided by $1,000 = 8.6), then multiply the result by the number in the first line of your Fund under the heading entitled "Expenses Paid During Period" to estimate the expenses you paid on your account during this period.
HYPOTHETICAL EXAMPLE FOR COMPARISON PURPOSES
The second line in the table below provides information about hypothetical account values and hypothetical expenses based on each Fund's actual expense ratio and an assumed rate of return of 5% per year before expenses, which is not the Fund's actual return. The hypothetical account values and expenses may not be used to estimate the actual ending account balance or expenses you paid for the period. You may use this information to compare the ongoing costs of investing in your Fund and other funds. To do so, compare this 5% hypothetical example with the 5% hypothetical examples that appear in the shareholder reports of the other funds.
Please note that the expenses shown in the table are meant to highlight your ongoing costs only and do not reflect any transactional costs, such as sales charges, redemption fees, brokerage commissions paid on purchases and sales of fund shares. Therefore, the second line under each Fund in the table is useful in comparing ongoing costs only, and will not help you determine the relative total costs of owning different funds. In addition, note that the expenses shown in the table are meant to highlight your ongoing costs and do not reflect any transaction costs.
| | | Beginning
Account
Value | | Ending
Account
Value | | Annualized
Expense
Ratio | | Expenses Paid
During Period (a) | |
| Class A | | | |
| Actual | | $ | 1,000.00 | | | $ | 1,040.10 | | | | 1.61 | % | | $ | 8.26 | | |
| Hypothetical (b) | | | 1,000.00 | | | | 1,017.04 | | | | 1.61 | | | | 8.16 | | |
| Class B | | | |
| Actual | | | 1,000.00 | | | | 1,037.60 | | | | 2.09 | | | | 10.70 | | |
| Hypothetical (b) | | | 1,000.00 | | | | 1,014.63 | | | | 2.09 | | | | 10.58 | | |
| Class C | | | |
| Actual | | | 1,000.00 | | | | 1,036.50 | | | | 2.25 | | | | 10.52 | | |
| Hypothetical (b) | | | 1,000.00 | | | | 1,013.83 | | | | 2.25 | | | | 11.39 | | |
(a) Expenses are calculated using each Fund's annualized expense ratio (as disclosed in the table), multiplied by the average account value for the period, multiplied by number of days in the period (184 days), and divided by the number of days in the year (366 days).
(b) 5% return per year before expenses.
GRAPHIC PRESENTATION OF SCHEDULE OF INVESTMENTS
By Bond Sector
At October 31, 2004
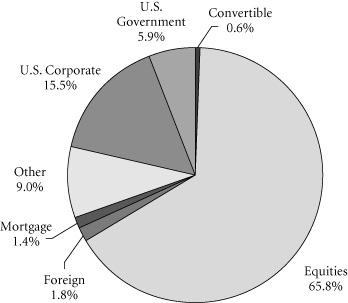
This chart shows the percentage breakdown by bond sector of the Fund's total investment securities.
Transamerica IDEX Mutual Funds
Annual Report 2004
3
TA IDEX Transamerica Balanced
SCHEDULE OF INVESTMENTS
At October 31, 2004
(all amounts except share amounts in thousands)
| | | Principal | | Value | |
| U.S. GOVERNMENT OBLIGATIONS (6.5%) | |
U.S. Treasury Bond
6.25%, due 08/15/2023 | | $ | 2,066 | | | $ | 2,441 | | |
| 6.00%, due 02/15/2026 | | | 311 | | | | 359 | | |
| 5.38%, due 02/15/2031 (a) | | | 5,190 | | | | 5,637 | | |
U.S. Treasury Note
3.38%, due 10/15/2009 (a) | | | 1,250 | | | | 1,255 | | |
| 4.75%, due 05/15/2014 (a) | | | 7,115 | | | | 7,523 | | |
| 4.25%, due 08/15/2014 (a) | | | 2,000 | | | | 2,035 | | |
| Total U.S. Government Obligations (cost: $18,346) | | | | | | | 19,250 | | |
| U.S GOVERNMENT AGENCY OBLIGATIONS (1.6%) | |
FNMA
6.00%, due 08/01/2034 | | | 2,528 | | | | 2,625 | | |
| 6.00%, due 09/01/2034 | | | 2,095 | | | | 2,176 | | |
Total U.S Government Agency Obligations
(cost: $4,789) | | | | | | | 4,801 | | |
| CORPORATE DEBT SECURITIES (18.8%) | |
| Amusement & Recreation Services (0.8%) | |
Harrah's Operating Co., Inc.
5.50%, due 07/01/2010 | | | 1,750 | | | | 1,826 | | |
Mandalay Resort Group
6.50%, due 07/31/2009 | | | 585 | | | | 616 | | |
| Automotive (0.6%) | |
Honeywell International, Inc.
5.13%, due 11/01/2006 | | | 910 | | | | 947 | | |
| 6.13%, due 11/01/2011 | | | 660 | | | | 730 | | |
| Beverages (0.9%) | |
Coca-Cola Enterprises, Inc.
5.38%, due 08/15/2006 | | | 950 | | | | 991 | | |
Diageo Capital PLC
3.50%, due 11/19/2007 | | | 1,750 | | | | 1,759 | | |
| Business Services (0.4%) | |
Clear Channel Communications, Inc.
6.00%, due 11/01/2006 | | | 555 | | | | 582 | | |
| 4.63%, due 01/15/2008 | | | 545 | | | | 556 | | |
| Chemicals & Allied Products (0.2%) | |
Lubrizol Corp.
5.50%, due 10/01/2014 | | | 500 | | | | 504 | | |
| Commercial Banks (0.5%) | |
US Bank NA
3.75%, due 02/06/2009 | | | 1,400 | | | | 1,401 | | |
| Communication (0.7%) | |
Echostar DBS Corp.
5.75%, due 10/01/2008 | | | 255 | | | | 261 | | |
| | | Principal | | Value | |
| Communication (continued) | | | |
SBC Communications, Inc.
5.75%, due 05/02/2006 | | $ | 1,900 | | | $ | 1,983 | | |
| Communications Equipment (0.6%) | | | |
Motorola, Inc.
4.61%, due 11/16/2007 | | | 1,750 | | | | 1,802 | | |
| Computer & Data Processing Services (0.5%) | | | |
Time Warner, Inc.
5.63%, due 05/01/2005 | | | 1,420 | | | | 1,441 | | |
| Computer & Office Equipment (0.3%) | | | |
Hewlett-Packard Co.
3.63%, due 03/15/2008 | | | 765 | | | | 770 | | |
| Electric Services (0.3%) | | | |
Duke Capital LLC
5.67%, due 08/15/2014 | | | 1,000 | | | | 1,035 | | |
| Electric, Gas & Sanitary Services (0.0%) | | | |
CMS Energy Corp.
7.63%, due 11/15/2004 | | | 35 | | | | 35 | | |
| Food & Kindred Products (0.3%) | | | |
Dean Foods Co.
6.75%, due 06/15/2005 | | | 230 | | | | 234 | | |
Smithfield Foods, Inc., 144A
7.00%, due 08/01/2011 | | | 500 | | | | 535 | | |
| Furniture & Fixtures (0.5%) | | | |
Lear Corp.
7.96%, due 05/15/2005 | | | 1,550 | | | | 1,591 | | |
| Hotels & Other Lodging Places (0.1%) | | | |
John Q. Hammons Hotels, Inc., Series B
8.88%, due 05/15/2012 | | | 315 | | | | 362 | | |
| Insurance (0.8%) | | | |
Allstate Corp. (The)
7.88%, due 05/01/2005 | | | 1,900 | | | | 1,950 | | |
UnitedHealth Group, Inc.
5.20%, due 01/17/2007 | | | 320 | | | | 333 | | |
| Insurance Agents, Brokers & Service (0.6%) | | | |
Metlife, Inc.
3.91%, due 05/15/2005 | | | 1,900 | | | | 1,915 | | |
| Life Insurance (0.3%) | | | |
AIG SunAmerica Global Financing IX 144A
5.10%, due 01/17/2007 | | | 985 | | | | 1,026 | | |
| Lumber & Wood Products (0.6%) | | | |
Weyerhaeuser Co.
7.38%, due 03/15/2032 | | | 1,500 | | | | 1,750 | | |
The notes to the financial statements are an integral part of this report.
Transamerica IDEX Mutual Funds
Annual Report 2004
4
TA IDEX Transamerica Balanced
SCHEDULE OF INVESTMENTS (continued)
At October 31, 2004
(all amounts except share amounts in thousands)
| | | Principal | | Value | |
| Mortgage Bankers & Brokers (0.6%) | | | |
Countrywide Home Loans, Inc.
5.50%, due 08/01/2006 | | $ | 1,800 | | | $ | 1,875 | | |
| Mortgage-Backed (0.3%) | | | |
Countrywide Home Loans, Inc., Series L
2.88%, due 02/15/2007 | | | 865 | | | | 856 | | |
| Motion Pictures (1.2%) | | | |
News America Holdings, Inc.
7.75%, due 12/01/2045 | | | 1,685 | | | | 2,042 | | |
Time Warner, Inc.
9.13%, due 01/15/2013 | | | 1,120 | | | | 1,435 | | |
| Oil & Gas Extraction (1.3%) | | | |
Chesapeake Energy Corp.
7.00%, due 08/15/2014 | | | 500 | | | | 543 | | |
Husky Oil, Ltd.
8.90%, due 08/15/2028 (b) | | | 870 | | | | 1,007 | | |
Kerr-McGee Corp.
6.95%, due 07/01/2024 | | | 2,000 | | | | 2,203 | | |
| Paper & Allied Products (0.3%) | | | |
Domtar Inc.
7.88%, due 10/15/2011 | | | 773 | | | | 894 | | |
| Personal Credit Institutions (1.7%) | | | |
Capital One Bank
5.00%, due 06/15/2009 | | | 1,750 | | | | 1,818 | | |
General Electric Capital Corp.
2.85%, due 01/30/2006 940 943
5.35%, due 03/30/2006 | | | 1,570 | | | | 1,628 | | |
General Motors Acceptance Corp.
4.38%, due 12/10/2007 | | | 575 | | | | 575 | | |
| Petroleum Refining (0.7%) | | | |
Amerada Hess Corp.
7.13%, due 03/15/2033 | | | 1,450 | | | | 1,605 | | |
Enterprise Products Operating, LP 144A
5.60%, due 10/15/2014 | | | 500 | | | | 510 | | |
| Pharmaceuticals (0.7%) | | | |
Bristol-Myers Squibb Co.
4.75%, due 10/01/2006 | | | 1,900 | | | | 1,963 | | |
| Primary Metal Industries (0.6%) | | | |
Alcoa, Inc.
4.25%, due 08/15/2007 | | | 1,825 | | | | 1,877 | | |
| Printing & Publishing (0.5%) | | | |
Viacom, Inc.
7.75%, due 06/01/2005 | | | 1,520 | | | | 1,568 | | |
| Security & Commodity Brokers (0.8%) | | | |
E*Trade Financial Corp. 144A
8.00%, due 06/15/2011 (a) | | | 500 | | | | 528 | | |
| | | Principal | | Value | |
| Security & Commodity Brokers (continued) | |
Merrill Lynch & Co., Inc., Series B
6.13%, due 05/16/2006 | | $ | 1,900 | | | $ | 2,000 | | |
| Telecommunications (0.9%) | |
Telefonica Europe BV
7.35%, due 09/15/2005 | | | 1,750 | | | | 1,822 | | |
Verizon Global Funding Corp.
4.00%, due 01/15/2008 | | | 955 | | | | 972 | | |
| Variety Stores (0.2%) | |
Target Corp.
5.50%, due 04/01/2007 | | | 435 | | | | 459 | | |
| Total Corporate Debt Securities (cost: $54,538) | | | | | | | 56,058 | | |
| CONVERTIBLE BONDS (0.6%) | |
| Telecommunications (0.6%) | |
Sprint Capital Corp.
4.78%, due 08/17/2006 | | | 1,780 | | | | 1,830 | | |
| Total Convertible Bonds (cost: $1,813) | | | | | | | 1,830 | | |
| | | Shares | | Value | |
| PREFERRED STOCKS (0.1%) | |
| Automotive (0.1%) | |
| Porsche AG Preferred | | | 409 | | | $ | 260 | | |
| Total Preferred Stocks (cost: $171) | | | | | | | 260 | | |
| COMMON STOCKS (72.1%) | |
| Automotive (4.3%) | |
| Harley-Davidson, Inc. | | | 100,000 | | | | 5,757 | | |
| PACCAR, Inc. | | | 100,000 | | | | 6,931 | | |
| Chemicals & Allied Products (2.5%) | |
| Ecolab, Inc. (a) | | | 60,000 | | | | 2,031 | | |
| Procter & Gamble Co. | | | 104,320 | | | | 5,339 | | |
| Commercial Banks (2.7%) | |
| JPMorgan Chase & Co. | | | 209,435 | | | | 8,084 | | |
| Communication (1.4%) | |
| XM Satellite Radio Holdings, Inc.–Class A (a)(c) | | | 125,000 | | | | 4,040 | | |
| Communications Equipment (2.8%) | |
| QUALCOMM, Inc. | | | 200,000 | | | | 8,362 | | |
| Computer & Data Processing Services (3.2%) | |
| Microsoft Corp. | | | 153,465 | | | | 4,295 | | |
| Yahoo!, Inc. (c) | | | 146,100 | | | | 5,287 | | |
| Computer & Office Equipment (1.8%) | |
| Diebold, Inc. | | | 100,000 | | | | 4,785 | | |
| Sandisk Corp. (a)(c) | | | 30,000 | | | | 626 | | |
| Electronic & Other Electric Equipment (4.7%) | |
| General Electric Co. | | | 270,045 | | | | 9,214 | | |
| Samsung Electronics Co., Ltd., GDR 144A (a) | | | 23,815 | | | | 4,668 | | |
The notes to the financial statements are an integral part of this report.
Transamerica IDEX Mutual Funds
Annual Report 2004
5
TA IDEX Transamerica Balanced
SCHEDULE OF INVESTMENTS (continued)
At October 31, 2004
(all amounts except share amounts in thousands)
| | | Shares | | Value | |
| Electronic Components & Accessories (0.5%) | | | |
| Intel Corp. | | | 60,915 | | | $ | 1,356 | | |
| Engineering & Management Services (1.8%) | | | |
| Jacobs Engineering Group, Inc. (c) | | | 130,000 | | | | 5,295 | | |
| Fabricated Metal Products (1.4%) | | | |
| Gillette Co. (The) | | | 100,000 | | | | 4,148 | | |
| Hotels & Other Lodging Places (5.2%) | | | |
| Four Seasons Hotels, Inc. (a) | | | 3,945 | | | | 267 | | |
| Marriott International, Inc.–Class A | | | 280,060 | | | | 15,260 | | |
| Industrial Machinery & Equipment (9.6%) | | | |
| American Standard Cos., Inc. (c) | | | 114,600 | | | | 4,191 | | |
| Caterpillar, Inc. (a) | | | 100,000 | | | | 8,054 | | |
| Donaldson Co., Inc. | | | 120,000 | | | | 3,564 | | |
| Graco, Inc. | | | 100,000 | | | | 3,440 | | |
| Illinois Tool Works, Inc. | | | 50,000 | | | | 4,614 | | |
| Kennametal, Inc. | | | 100,000 | | | | 4,653 | | |
| Insurance (3.4%) | | | |
| Berkshire Hathaway, Inc.–Class B (c) | | | 1,900 | | | | 5,328 | | |
| WellPoint Health Networks (c) | | | 50,000 | | | | 4,883 | | |
| Lumber & Other Building Materials (0.9%) | | | |
| Lowe's Cos., Inc. | | | 50,000 | | | | 2,814 | | |
| Medical Instruments & Supplies (1.3%) | | | |
| Zimmer Holdings, Inc. (c) | | | 50,000 | | | | 3,879 | | |
| Motor Vehicles, Parts & Supplies (1.2%) | | | |
| BorgWarner, Inc. | | | 80,000 | | | | 3,710 | | |
| Oil & Gas Extraction (3.1%) | | | |
| Anadarko Petroleum Corp. | | | 70,000 | | | | 4,722 | | |
| Apache Corp. | | | 90,000 | | | | 4,563 | | |
| Paper & Allied Products (1.8%) | | | |
| 3M Co. | | | 67,620 | | | | 5,245 | | |
| Pharmaceuticals (6.1%) | | | |
| Allergan, Inc. | | | 60,000 | | | | 4,294 | | |
| Amgen, Inc. (c) | | | 70,495 | | | | 4,004 | | |
| Genentech, Inc. (c) | | | 50,000 | | | | 2,277 | | |
| Roche Holding AG | | | 75,698 | | | | 7,712 | | |
| Primary Metal Industries (1.5%) | | | |
| Hubbell, Inc.–Class B | | | 100,000 | | | | 4,572 | | |
| Printing & Publishing (3.6%) | | | |
| McGraw-Hill Cos. (The), Inc. (a) | | | 125,000 | | | | 10,781 | | |
| Stone, Clay & Glass Products (0.5%) | | | |
| Gentex Corp. (a) | | | 50,000 | | | | 1,651 | | |
| | | Shares | | Value | |
| Transportation & Public Utilities (1.0%) | | | |
Expeditors International
of Washington, Inc. | | | 50,000 | | | $ | 2,855 | | |
| Trucking & Warehousing (2.7%) | | | |
| United Parcel Service, Inc.–Class B | | | 100,000 | | | | 7,918 | | |
| Wholesale Trade Durable Goods (3.1%) | | | |
| W.W. Grainger, Inc. | | | 160,000 | | | | 9,374 | | |
| Total Common Stocks (cost: $197,276) | | | | | | | 214,843 | | |
| | | Principal | | Value | |
| SECURITY LENDING COLLATERAL (10.0%) | | | |
| Debt (9.3%) | | | |
| Bank Notes (1.8%) | | | |
Bank of America
1.77%, due 12/03/2004 | | $ | 1,448 | | | $ | 1,448 | | |
1.88%, due 12/23/2004 482 482
1.77%, due 01/18/2005 | | | 966 | | | | 966 | | |
Canadian Imperial Bank of Commerce
1.86%, due 11/04/2004 | | | 2,173 | | | | 2,173 | | |
Credit Suisse First Boston Corp.
1.83%, due 09/09/2005 | | | 241 | | | | 241 | | |
| Commercial Paper (1.0%) | | | |
Clipper Receivables Corp.
1.79%, due 11/12/2004 | | | 719 | | | | 719 | | |
Delaware Funding Corp. 144A
1.85%, due 11/19/2004 | | | 241 | | | | 241 | | |
Falcon Asset Securitization Corp. 144A
1.78%, due 11/04/2004 720 720
1.75%, due 11/10/2004 | | | 966 | | | | 966 | | |
Galaxy Funding 144A
1.88%, due 11/22/2004 | | | 241 | | | | 241 | | |
| Euro Dollar Terms (4.3%) | | | |
Bank of Montreal
1.88%, due 11/24/2004 | | | 2,287 | | | | 2,287 | | |
BNP Paribas
1.77%, due 11/10/2004 1,207 1,207
1.80%, due 11/23/2004 966 966
1.98%, due 12/27/2004 | | | 966 | | | | 966 | | |
Calyon
1.70%, due 11/24/2004 | | | 127 | | | | 127 | | |
Citigroup
2.06%, due 01/25/2005 | | | 2,414 | | | | 2,414 | | |
Den Danske Bank
1.82%, due 11/19/2004 | | | 1,207 | | | | 1,207 | | |
Dexia Group
2.04%, due 01/21/2005 | | | 560 | | | | 560 | | |
The notes to the financial statements are an integral part of this report.
Transamerica IDEX Mutual Funds
Annual Report 2004
6
TA IDEX Transamerica Balanced
SCHEDULE OF INVESTMENTS (continued)
At October 31, 2004
(all amounts except share amounts in thousands)
| | | Principal | | Value | |
| Euro Dollar Terms (continued) | |
HBOS Halifax Bank of Scotland
2.03%, due 01/21/2005 | | $ | 483 | | | $ | 483 | | |
Royal Bank of Scotland
2.01%, due 01/20/2005 | | | 966 | | | | 966 | | |
Toronto Dominion Bank
1.70%, due 11/08/2004 | | | 483 | | | | 483 | | |
Wells Fargo
1.87%, due 11/22/2004 | | | 1,207 | | | | 1,207 | | |
| Promissory Notes (0.9%) | |
Goldman Sachs Group Inc.
1.90%, due 12/29/2004 1,014 1,014
1.88%, due 01/27/2005 | | | 1,690 | | | | 1,690 | | |
| Repurchase Agreements (1.3%) | |
Merrill Lynch & Co., Inc.
1.92% Repurchase Agreement dated
10/29/04 to be repurchased at $3,862
on 11/01/04 (d) | | | 3,863 | | | | 3,863 | | |
| | | Shares | | Value | |
| Investment Companies (0.7%) | |
| Money Market Funds (0.7%) | |
Merrill Lynch Premier Institutional Fund
1-day yield of 1.71% | | | 1,187,628 | | | $ | 1,188 | | |
Merrimac Cash Fund, Premium Class
1-day yield of 1.46% | | | 869,094 | | | | 869 | | |
| Total Security Lending Collateral (cost: $29,694) | | | | | | | 29,694 | | |
| Total Investment Securities (cost: $306,627) | | | | | | $ | 326,736 | | |
| | | | | Value | |
| SUMMARY: | |
| Investments, at value | | | 109.7 | % | | $ | 326,736 | | |
| Liabilities in excess of other assets | | | (9.7 | )% | | | (29,119 | ) | |
| Net assets | | | 100.0 | % | | $ | 297,617 | | |
| FORWARD FOREIGN CURRENCY CONTRACTS: | |
| Currency | | Bought
(Sold) | | Settlement
Date | | Amount in
U.S. Dollars
Bought (Sold) | | Net
Unrealized
Appreciation
(Depreciation) | |
| British Pound Sterling | | | 1,550 | | | 11/19/2004 | | $ | 2,726 | | | $ | 112 | | |
| British Pound Sterling | | | (1,550 | ) | | 11/19/2004 | | | (2,762 | ) | | | (76 | ) | |
| | | $ | (36 | ) | | $ | 36 | | |
NOTES TO SCHEDULE OF INVESTMENTS:
(a) At October 31, 2004, all or a portion of this security is on loan (see Note 1). The value at October 31, 2004, of all securities on loan is $28,927.
(b) Floating or variable rate note. Rate is listed as of October 31, 2004.
(c) No dividends were paid during the preceding twelve months.
(d) Cash collateral for the Repurchase Agreements, valued at $3,940, that serve as collateral for securities lending are invested in corporate bonds with interest rates and maturity dates ranging from 0.00%–9.75% and 05/15/2005–9/15/2033, respectively.
DEFINITIONS:
144A 144A Securities are registered pursuant to the rule 144A of the Securities Act of 1933. These securities are deemed to be liquid for purposes of compliance limitations on holdings of illiquid securities and may be resold as transactions exempt from registration normally to qualified institutional buyers. At October 31, 2004 these securities aggregated $9,435 or 3.2% of the net assets of the Fund.
GDR Global Depositary Receipt
The notes to the financial statements are an integral part of this report.
Transamerica IDEX Mutual Funds
Annual Report 2004
7
TA IDEX Transamerica Balanced
STATEMENT OF ASSETS AND LIABILITIES
At October 31, 2004
(all amounts except per share amounts in thousands)
| Assets: | | | |
Investment securities, at value (cost: $306,627)
(including securities loaned of $28,927) | | $ | 326,736 | | |
| Cash | | | 687 | | |
| Receivables: | |
| Investment securities sold | | | 914 | | |
| Shares of beneficial interest sold | | | 58 | | |
| Interest | | | 1,243 | | |
| Dividends | | | 183 | | |
| Dividend reclaims receivable | | | 25 | | |
Unrealized appreciation on forward currency
contracts | | | 112 | | |
| Other | | | 31 | | |
| | | | 329,989 | | |
| Liabilities: | | | |
| Investment securities purchased | | | 897 | | |
| Accounts payable and accrued liabilities: | |
| Shares of beneficial interest redeemed | | | 856 | | |
| Management and advisory fees | | | 213 | | |
| Distribution fees | | | 214 | | |
| Transfer agent fees | | | 308 | | |
| Payable for collateral for securities on loan | | | 29,694 | | |
Unrealized depreciation on forward foreign
currency contracts | | | 76 | | |
| Other | | | 114 | | |
| | | | 32,372 | | |
| Net Assets | | $ | 297,617 | | |
| Net Assets Consist of: | | | |
Shares of beneficial interest, unlimited shares
authorized, no par value | | $ | 321,666 | | |
| Undistributed net investment income (loss) | | | 131 | | |
Accumulated net realized gain (loss) from
investment securities and foreign
currency transactions | | | (44,320 | ) | |
| Net unrealized appreciation (depreciation) on: | |
| Investment securities | | | 20,102 | | |
Translation of assets and liabilites denominated
in foreign currencies | | | 38 | | |
| Net Assets | | $ | 297,617 | | |
| Net Assets by Class: | | | |
| Class A | | $ | 72,997 | | |
| Class B | | | 170,630 | | |
| Class C | | | 53,990 | | |
| Shares Outstanding: | | | |
| Class A | | | 3,938 | | |
| Class B | | | 9,239 | | |
| Class C | | | 2,926 | | |
| Net Asset Value Per Share: | | | |
| Class A | | $ | 18.53 | | |
| Class B | | | 18.47 | | |
| Class C | | | 18.45 | | |
| Maximum Offering Price Per Share (a): | | | |
| Class A | | $ | 19.61 | | |
(a) Includes the maximum selling commission (represented as a percentage of offering price) which is reduced on certain levels of sales as set forth in the Prospectus. Net asset value per share for Classes B and C shares represents offering price. The redemption price for Classes B and C shares equals net asset value less any applicable contingent deferred sales charge.
STATEMENT OF OPERATIONS
For the year ended October 31, 2004
(all amounts in thousands)
| Investment Income: | | | |
| Interest | | $ | 5,509 | | |
| Dividends | | | 2,441 | | |
| Income from loaned securities–net | | | 58 | | |
| Less withholding taxes on foreign dividends | | | (59 | ) | |
| | | | 7,949 | | |
| Expenses: | | | |
| Management and advisory fees | | | 2,989 | | |
| Transfer agent fees: | |
| Class A | | | 264 | | |
| Class B | | | 447 | | |
| Class C | | | 50 | | |
| Class C2 | | | 48 | | |
| Class M | | | 91 | | |
| Printing and shareholder reports | | | 111 | | |
| Custody fees | | | 68 | | |
| Administration fees | | | 47 | | |
| Legal fees | | | 11 | | |
| Audit and accounting fees | | | 8 | | |
| Trustees fees | | | 21 | | |
| Registration fees: | |
| Class A | | | 10 | | |
| Class B | | | 8 | | |
| Class C | | | 13 | | |
| Class C2 | | | 2 | | |
| Class M | | | 6 | | |
| Other | | | 16 | | |
| Distribution and service fees: | |
| Class A | | | 287 | | |
| Class B | | | 1,817 | | |
| Class C | | | 156 | | |
| Class C2 | | | 157 | | |
| Class M | | | 270 | | |
| Total expenses | | | 6,897 | | |
| Net Investment Income (Loss) | | | 1,052 | | |
| Net Realized Gain (Loss) from: | | | |
| Investment securities | | | 33,725 | | |
| Foreign currency transactions | | | (551 | ) | |
| | | | 33,174 | | |
Net Increase (Decrease) in Unrealized
Appreciation on: | | | |
| Investment securities | | | (13,282 | ) | |
Translation of assets and liabilities denominated in
foreign currencies | | | 168 | | |
| | | | (13,114 | ) | |
Net Gain (Loss) on Investments and Foreign
Currency Transactions | | | 20,060 | | |
Net Increase (Decrease) in Net Assets Resulting
from Operations | | $ | 21,112 | | |
The notes to the financial statements are an integral part of this report.
Transamerica IDEX Mutual Funds
Annual Report 2004
8
TA IDEX Transamerica Balanced
STATEMENTS OF CHANGES IN NET ASSETS
For the years ended
(all amounts in thousands)
| | | October 31,
2004 | | October 31,
2003 | |
| Increase (Decrease) In Net Assets From: | |
| Operations: | |
| Net investment income (loss) | | $ | 1,052 | | | $ | 2,527 | | |
Net realized gain (loss) from
investment securities and
foreign currency transactions | | | 33,174 | | | | (8,939 | ) | |
Net unrealized appreciation
(depreciation) on investment
securities and foreign currency
translations | | | (13,114 | ) | | | 35,326 | | |
| | | | 21,112 | | | | 28,914 | | |
| Distributions to Shareholders: | |
| From net investment income: | |
| Class A | | | (579 | ) | | | (1,174 | ) | |
| Class B | | | (399 | ) | | | (1,199 | ) | |
| Class C | | | (10 | ) | | | (12 | ) | |
| Class C2 | | | (53 | ) | | | (199 | ) | |
| Class M | | | (98 | ) | | | (304 | ) | |
| | | | (1,139 | ) | | | (2,888 | ) | |
| Capital Share Transactions: | |
| Proceeds from shares sold: | |
| Class A | | | 9,645 | | | | 15,212 | | |
| Class B | | | 7,041 | | | | 28,872 | | |
| Class C | | | 1,114 | | | | 4,995 | | |
| Class C2 | | | 769 | | | | 4,135 | | |
| Class M | | | 480 | | | | 2,623 | | |
| | | | 19,049 | | | | 55,837 | | |
| Proceeds from fund acquisitions | |
| Class A | | | 6,534 | | | | – | | |
| Class B | | | 17,187 | | | | – | | |
| Class C | | | 879 | | | | – | | |
| Class C2 | | | 2,271 | | | | – | | |
| Class M | | | 1,338 | | | | – | | |
| | | | 28,209 | | | | – | | |
Dividends and distributions
reinvested: | |
| Class A | | | 558 | | | | 1,117 | | |
| Class B | | | 368 | | | | 1,103 | | |
| Class C | | | 9 | | | | 12 | | |
| Class C2 | | | 47 | | | | 179 | | |
| Class M | | | 90 | | | | 280 | | |
| | | | 1,072 | | | | 2,691 | | |
| Cost of shares redeemed: | |
| Class A | | | (38,320 | ) | | | (34,649 | ) | |
| Class B | | | (64,412 | ) | | | (58,425 | ) | |
| Class C | | | (6,563 | ) | | | (904 | ) | |
| Class C2 | | | (9,893 | ) | | | (16,577 | ) | |
| Class M | | | (13,324 | ) | | | (17,165 | ) | |
| | | | (132,512 | ) | | | (127,720 | ) | |
| Class level exchanges: | |
| Class C | | | 52,877 | | | | – | | |
| Class C2 | | | (23,753 | ) | | | – | | |
| Class M | | | (29,124 | ) | | | – | | |
| | | | – | | | | – | | |
| Automatic conversions: | |
| Class A | | | 134 | | | | – | | |
| Class B | | | (134 | ) | | | – | | |
| | | | – | | | | – | | |
| | | | (84,182 | ) | | | (69,192 | ) | |
| | | October 31,
2004 | | October 31,
2003 | |
| Net increase (decrease) in net assets | | | (64,209 | ) | | | (43,166 | ) | |
| Net Assets: | |
| Beginning of year | | | 361,826 | | | | 404,992 | | |
| End of year | | $ | 297,617 | | | $ | 361,826 | | |
Undistributed Net Investment Income
(Loss) | | $ | | 131 | | $ | 248 | | |
| Share Activity: | |
| Shares issued: | |
| Class A | | | 540 | | | | 930 | | |
| Class B | | | 393 | | | | 1,754 | | |
| Class C | | | 62 | | | | 303 | | |
| Class C2 | | | 43 | | | | 253 | | |
| Class M | | | 27 | | | | 160 | | |
| | | | 1,065 | | | | 3,400 | | |
| Shares issued on fund acquisitions: | |
| Class A | | | 362 | | | | – | | |
| Class B | | | 956 | | | | – | | |
| Class C | | | 49 | | | | – | | |
| Class C2 | | | 126 | | | | – | | |
| Class M | | | 74 | | | | – | | |
| | | | 1,567 | | | | – | | |
Shares issued–reinvested from
distributions: | |
| Class A | | | 31 | | | | 68 | | |
| Class B | | | 21 | | | | 68 | | |
| Class C | | | 1 | | | | 1 | | |
| Class C2 | | | 3 | | | | 11 | | |
| Class M | | | 5 | | | | 17 | | |
| | | | 61 | | | | 165 | | |
| Shares redeemed: | |
| Class A | | | (2,128 | ) | | | (2,091 | ) | |
| Class B | | | (3,597 | ) | | | (3,545 | ) | |
| Class C | | | (365 | ) | | | (54 | ) | |
| Class C2 | | | (553 | ) | | | (1,006 | ) | |
| Class M | | | (745 | ) | | | (1,038 | ) | |
| | | | (7,388 | ) | | | (7,734 | ) | |
| Class level exchanges: | |
| Class C | | | 2,929 | | | | – | | |
| Class C2 | | | (1,321 | ) | | | – | | |
| Class M | | | (1,608 | ) | | | – | | |
| | | | – | | | | – | | |
| Automatic conversions: | |
| Class A | | | 7 | | | | – | | |
| Class B | | | (7 | ) | | | – | | |
| | | | – | | | | – | | |
Net increase (decrease) in shares
outstanding: | |
| Class A | | | (1,188 | ) | | | (1,093 | ) | |
| Class B | | | (2,23 | 4) | | | (1,723 | ) | |
| Class C | | | 2,676 | | | | 250 | | |
| Class C2 | | | (1,702 | ) | | | (742 | ) | |
| Class M | | | (2,247 | ) | | | (861 | ) | |
| | | | (4,69 | 5) | | | (4,169 | ) | |
The notes to the financial statements are an integral part of this report.
Transamerica IDEX Mutual Funds
Annual Report 2004
9
TA IDEX Transamerica Balanced
FINANCIAL HIGHLIGHTS
| | | | | For a share of beneficial interest outstanding throughout each period | |
| | | | | Net Asset | | Investment Operations | | Distributions | | Net Asset | |
| | | For the
Period
Ended (d)(g) | | Value,
Beginning
of Period | | Net
Investment
Income (Loss) | | Net Realized
and Unrealized
Gain (Loss) | | Total
Operations | | From Net
Investment
Income | | From Net
Realized
Gains | | Total
Distributions | | Value,
End
of Period | |
| Class A | | 10/31/2004 | | $ | 17.43 | | | $ | 0.14 | | | $ | 1.08 | | | $ | 1.22 | | | $ | (0.12 | ) | | $ | – | | | $ | (0.12 | ) | | $ | 18.53 | | |
| | | 10/31/2003 | | | 16.23 | | | | 0.19 | | | | 1.21 | | | | 1.40 | | | | (0.20 | ) | | | – | | | | (0.20 | ) | | | 17.43 | | |
| | | 10/31/2002 | | | 17.31 | | | | 0.29 | | | | (1.09 | ) | | | (0.80 | ) | | | (0.28 | ) | | | – | | | | (0.28 | ) | | | 16.23 | | |
| | | 10/31/2001 | | | 19.75 | | | | 0.37 | | | | (2.18 | ) | | | (1.81 | ) | | | (0.35 | ) | | | (0.28 | ) | | | (0.63 | ) | | | 17.31 | | |
| | | 10/31/2000 | | | 18.96 | | | | 0.25 | | | | 1.03 | | | | 1.28 | | | | (0.24 | ) | | | (0.25 | ) | | | (0.49 | ) | | | 19.75 | | |
| Class B | | 10/31/2004 | | | 17.39 | | | | 0.04 | | | | 1.08 | | | | 1.12 | | | | (0.04 | ) | | | – | | | | (0.04 | ) | | | 18.47 | | |
| | | 10/31/2003 | | | 16.22 | | | | 0.08 | | | | 1.18 | | | | 1.26 | | | | (0.09 | ) | | | – | | | | (0.09 | ) | | | 17.39 | | |
| | | 10/31/2002 | | | 17.30 | | | | 0.18 | | | | (1.09 | ) | | | (0.91 | ) | | | (0.17 | ) | | | – | | | | (0.17 | ) | | | 16.22 | | |
| | | 10/31/2001 | | | 19.73 | | | | 0.25 | | | | (2.17 | ) | | | (1.92 | ) | | | (0.23 | ) | | | (0.28 | ) | | | (0.51 | ) | | | 17.30 | | |
| | | 10/31/2000 | | | 18.95 | | | | 0.21 | | | | 1.03 | | | | 1.24 | | | | (0.21 | ) | | | (0.25 | ) | | | (0.46 | ) | | | 19.73 | | |
| Class C | | 10/31/2004 | | | 17.39 | | | | (0.01 | ) | | | 1.11 | | | | 1.10 | | | | (0.04 | ) | | | – | | | | (0.04 | ) | | | 18.45 | | |
| | | 10/31/2003 | | | 16.22 | | | | 0.08 | | | | 1.18 | | | | 1.26 | | | | (0.09 | ) | | | – | | | | (0.09 | ) | | | 17.39 | | |
| | | | | | | Ratios/Supplemental Data | |
| | | For the
Period | | Total | | Net Assets,
End of
Period | | Ratio of Expenses
to Average
Net Assets (a) | | Net Investment
Income (Loss)
to Average | | Portfolio
Turnover | |
| | | Ended (g) | | Return (c) | | (000's) | | Net (e) | | Total (f) | | Net Assets (a) | | Rate (b) | |
| Class A | | 10/31/2004 | | | 7.03 | % | | $ | 72,997 | | | | 1.70 | % | | | 1.70 | % | | | 0.76 | % | | | 107 | % | |
| | | 10/31/2003 | | | 8.71 | | | | 89,335 | | | | 1.73 | | | | 1.73 | | | | 1.13 | | | | 69 | | |
| | | 10/31/2002 | | | (4.72 | ) | | | 100,923 | | | | 1.68 | | | | 1.70 | | | | 1.70 | | | | 87 | | |
| | | 10/31/2001 | | | (9.35 | ) | | | 126,369 | | | | 1.64 | | | | 1.66 | | | | 1.96 | | | | 114 | | |
| | | 10/31/2000 | | | 7.23 | | | | 133,445 | | | | 1.67 | | | | 1.69 | | | | 1.73 | | | | 71 | | |
| Class B | | 10/31/2004 | | | 6.44 | | | | 170,630 | | | | 2.26 | | | | 2.26 | | | | 0.19 | | | | 107 | | |
| | | 10/31/2003 | | | 7.84 | | | | 199,472 | | | | 2.37 | | | | 2.37 | | | | 0.48 | | | | 69 | | |
| | | 10/31/2002 | | | (5.31 | ) | | | 214,019 | | | | 2.33 | | | | 2.35 | | | | 1.05 | | | | 87 | | |
| | | 10/31/2001 | | | (9.93 | ) | | | 243,387 | | | | 2.29 | | | | 2.31 | | | | 1.31 | | | | 114 | | |
| | | 10/31/2000 | | | 6.58 | | | | 229,160 | | | | 2.32 | | | | 2.34 | | | | 1.08 | | | | 71 | | |
| Class C | | 10/31/2004 | | | 6.33 | | | | 53,990 | | | | 2.28 | | | | 2.28 | | | | (0.08 | ) | | | 107 | | |
| | | 10/31/2003 | | | 7.84 | | | | 4,354 | | | | 2.38 | | | | 2.39 | | | | 0.48 | | | | 69 | | |
NOTES TO FINANCIAL HIGHLIGHTS
(a) Annualized.
(b) Not annualized for periods of less than one year.
(c) Total Return has been calculated for the applicable period without deduction of a sales load, if any, on an initial purchase. Periods of less that one year are not annualized.
(d) Per share information is calculated based on average number of shares outstanding for the years ended 10/31/2001, 10/31/2002, 10/31/2003 and 10/31/2004.
(e) Ratio of Net Expenses to Average Net Assets is net of fee waivers and reimbursements by the investment adviser, if any (see note 2).
(f) Ratio of Total Expenses to Average Net Assets includes all expenses before fee waivers and reimbursements by the investment adviser.
(g) The inception date for the Fund's offering of share Class L was November 11, 2002. Class L was renamed Class C on March 1, 2004 (see note 1).
The notes to the financial statements are an integral part of this report.
Transamerica IDEX Mutual Funds
Annual Report 2004
10
TA IDEX Transamerica Balanced
NOTES TO FINANCIAL STATEMENTS
At October 31, 2004
(all amounts in thousands)
NOTE 1. ORGANIZATION AND SIGNIFICANT ACCOUNTING POLICIES
Transamerica IDEX Mutual Funds, formerly IDEX Mutual Funds, is a Massachusetts business trust registered under the Investment Company Act of 1940, as amended (the "1940 Act"), as an open-end management investment company. TA IDEX Transamerica Balanced ("the Fund"), part of Transamerica IDEX Mutual Funds, began operations on December 2, 1994.
On March 1, 2004, the Fund changed its name from IDEX Janus Balanced to TA IDEX Janus Balanced.
On May 28, 2004, the Fund acquired all of the net assets of TA IDEX Janus Growth & Income pursuant to a plan of reorganization. TA IDEX Transamerica Balanced is the accounting survivor. At the same time, the Fund changed sub-advisers from Janus Capital Management, LLC to Transamerica Investment Management, LLC and was renamed from TA IDEX Janus Balanced to TA IDEX Transamerica Balanced.
The acquisition was accomplished by a tax free exchange of 1,567 shares of the Fund for 3,232 shares of TA IDEX Janus Growth & Income outstanding on May 27, 2004. TA IDEX Janus Growth & Income's net assets at that date, $28,209, including $4,682 unrealized appreciation, were combined with those of the Fund. The aggregate net assets of TA IDEX Transamerica Balanced immediately before the acquisition was $302,562, the combined net assets of the Fund immediately after the acquisition was $330,771. Proceeds in connection with the acquisition were as follows:
| | | Shares | | Amount | |
| Proceeds in connection with the acquisition | |
| Class A | | | 362 | | | $ | 6,534 | | |
| Class B | | | 956 | | | | 17,187 | | |
| Class C | | | 49 | | | | 879 | | |
| Class C2 | | | 126 | | | | 2,271 | | |
| Class M | | | 74 | | | | 1,338 | | |
| | | | | | | $ | 28,209 | | |
In the normal course of business, the Fund enters into contracts that contain a variety of representations and warranties, which provide general indemnifications. The Fund's maximum exposure under these arrangements is unknown, as this would involve future claims that may be made against the Fund and/or its affiliates that have not yet occurred. However, based on experience, the Fund expects the risk of loss to be remote.
See the Prospectus and Statement of Additional Information for a description of the Fund's investment objective.
In preparing the Fund's financial statements in accordance with accounting principles generally accepted in the United States of America ("GAAP"), estimates or assumptions (which could differ from actual results) may be used that affect reported amounts and disclosures. The following policies were consistently followed by the Fund, in accordance with GAAP.
Multiple class operations and expenses: The Fund currently offers three classes of shares, each with a public offering price that reflects different sales charges, if any, and expense levels. All shares designated as Class C shares prior to March 1, 2004, were renamed as Class C2 shares on that date. All shares designated as Class L shares prior to March 1, 2004, were renamed as Class C shares with different sales charges than the previous Class L shares. On June 15, 2004, Class C2 shares merged into Class C. On September 24, 2004, Class M shares merged into Class C. Class B shares will convert to Class A shares eight years after purchase. Income, non-class specific expenses and realized and unrealized gains and losses, are allocated daily to each class, based upon the value of shares outstanding method as permitted under Rule 18f-3 of the 1940 Act. Each class bears its own specific expenses as well as a portion of general, common expenses.
Pricing of shares: The Fund prices its shares on the basis of the net asset value of each class of shares of the Fund, which is determined as of the close of the New York Stock Exchange ("NYSE") (generally 4:00 p.m. Eastern Time) on each day on which the NYSE is open for trading (other than a day on which there are insufficient changes in the value of the Fund's portfolio securities to materially affect the Fund's net asset value or a day on which no shares are tendered for redemption and no order to purchase any shares is received).
Security valuations: Fund investments traded on an exchange are valued at the closing price on the day of valuation on the exchange where the security is principally traded. With respect to securities traded on NASDAQ NMS, such closing price may be the last reported sales price or the NASDAQ Official Closing Price.
Securities traded in the over-the-counter market and listed securities for which no sale was reported on that date are valued at the last quoted bid price.
Debt securities are valued by independent pricing services; however, those that mature in sixty days or less are valued at amortized cost, which approximates market.
Investment company securities are valued at net asset value of the underlying portfolio.
Foreign securities generally are valued based on quotations from the primary market in which they are traded and are translated from the local currency into U.S. dollars using closing exchange rates. Many foreign securities markets are open for trading at times when the U.S. markets are closed for trading, and many foreign securities markets close for trading before the close of the NYSE. The value of foreign
Transamerica IDEX Mutual Funds
Annual Report 2004
11
TA IDEX Transamerica Balanced
NOTES TO FINANCIAL STATEMENTS (continued)
At October 31, 2004
(all amounts in thousands)
NOTE 1.–(continued)
securities may be affected significantly on a day that the NYSE is closed and an investor is unable to purchase or redeem shares. If a significant market event impacting the value of a portfolio security (e.g., natural disaster, company announcement, market volatility) occurs subsequent to the close of trading in the security, but prior to the calculation of the Fund's net asset value per share, market quotations for that security may be determined to be unreliable and, accordingly, not "readily available." If market quotations are not readily available, and the impact of such a significant market event materially effects the net asset value per share of the Fund, an affected portfolio security will be valued at fair market value as determined in good faith using guidelines adopted by the Board of Trustees of the Fund, under the supervision of the Fund's Valuation Committee. Factors that may be consider ed to value foreign securities at fair market value may include, among others: the value of other securities traded on other markets, foreign currency exchange activity and the trading of financial products tied to foreign securities.
Other securities for which quotations are not readily available are valued at fair market value as determined in good faith using guidelines adopted by the Board of Trustees of the Fund, under the supervision of the Fund's Valuation Committee.
The Fund values its investment securities at fair value based upon procedures approved by the Board of Trustees on days when significant events occur after the close of the principal exchange on which the securities are traded, and as a result, are expected to materially effect the value of investments.
Cash: The Fund may leave cash overnight in its cash account with the custodian, Investors Bank & Trust Company ("IBT"). IBT has been contracted on behalf of the Fund to invest the excess cash into a savings account, which at October 31, 2004, was paying an interest rate of 1.30%.
Throughout the year, the Fund may have a cash overdraft balance. A fee is incurred on this overdraft, calculated by multiplying the overdraft by a rate based on the federal funds rate. This fee is included in Custody fees in the Statement of Operations.
Repurchase agreements: The Fund is authorized to enter into repurchase agreements. The Fund, through IBT, receives delivery of the underlying securities, the value of which at the time of purchase is required to be an amount equal to at least 100% of the resale price. Repurchase agreements involve the risk that the seller will fail to repurchase the security, as agreed. In that case, the Fund will bear the risk of value fluctuations until the security can be sold and may encounter delays and incur costs in liquidating the security. In the event of bankruptcy or insolvency of the seller, delays and costs may be incurred.
Commission recapture: The sub-adviser, to the extent consistent with the best execution and usual commission rate policies and practices, may place security transactions of the Fund with broker/dealers with which Transamerica IDEX Mutual Funds has established a Commission Recapture Program. A Commission Recapture Program is any arrangement under which a broker/dealer applies a portion of the commissions received by such broker/dealer on the security transactions to the Fund. In no event will commissions paid by the Fund be used to pay expenses that would otherwise be borne by any other funds within Transamerica IDEX Mutual Funds, or by any other party.
Recaptured commissions during the year ended October 31, 2004, of $64 are included in net realized gains in the Statement of Operations.
Securities lending: The Fund may lend securities to enhance fund earnings from investing cash collateral in making such loans to qualified borrowers (typically broker/dealers). The Fund has engaged its custodian bank, IBT, as a lending agent to administer its securities lending program. IBT earned $25 of program income for its services. When the Fund makes a security loan, it receives cash collateral as protection against the risk that the borrower will default on the loan, and records an asset for the cash invested collateral and a liability for the return of the collateral.
Securities on loan are included in Investment securities at value in the Statement of Assets and Liabilities and remain on the Schedule of Investments.
Loans of securities are required to be secured by collateral at least equal to 102% of the value of the securities at inception of the loan, and not less then 100% thereafter. The Fund may invest cash collateral in short-term money market instruments including: U.S. Treasury Bills, U.S. agency obligations, commercial paper, money market mutual funds, repurchase agreements and other highly rated, liquid investments. During the life of securities loans, the collateral and securities loaned remain subject to fluctuation in value. IBT marks to market securities loaned and the collateral each business day. If additional collateral is due (at least $1), IBT collects additional cash collateral from the borrowers. Although securities loaned will be fully collateralized at all times, IBT may experience delays in, or may be prevented from, recovering the collateral on behalf of the Fund. The Fund may recall a loa ned security position at any time from the borrower through IBT. In the event the borrower fails to timely return a recalled security, IBT may indemnify the Fund by purchasing replacement securities for the Fund at its own expense and claiming the collateral to fund such a purchase. IBT absorbs the loss if the collateral value is not sufficient to cover the cost of the replacement securities. If replacement securities are not available, IBT will credit the equivalent cash value to the Fund.
While a security is on loan, the Fund does not have the right to vote that security. However, if time permits, the Fund will attempt to recall a security on loan and vote the proxy.
Transamerica IDEX Mutual Funds
Annual Report 2004
12
TA IDEX Transamerica Balanced
NOTES TO FINANCIAL STATEMENTS (continued)
At October 31, 2004
(all amounts in thousands)
NOTE 1.–(continued)
Income from securities lending is included in the Statement of Operations. The amount of collateral and value of securities on loan are included in the Statement of Assets and Liabilities as well as in the Schedule of Investments.
Security transactions and investment income: Security transactions are recorded on the trade date. Security gains and losses are calculated on the specific identification basis. Dividend income is recorded on the ex-dividend date or, in the case of foreign securities, as soon as the Fund is informed of the ex-dividend date. Interest income, including accretion of discounts and amortization of premiums, is recorded on the accrual basis commencing on the settlement date.
Foreign currency denominated investments: The accounting records of the Fund are maintained in U.S. dollars. Securities and other assets and liabilities denominated in foreign currencies are translated into U.S. dollars at the closing exchange rate each day. The cost of foreign securities is translated at the exchange rate in effect when the investment was acquired. The Fund combines fluctuations from currency exchange rates and fluctuations in value when computing net realized and unrealized gains or losses from investments.
Net foreign currency gains and losses resulting from changes in exchange rates include: 1) foreign currency fluctuations between trade date and settlement date of investment security transactions; 2) gains and losses on forward foreign currency contracts; and 3) the difference between the receivable amounts of interest and dividends recorded in the accounting records in U.S. dollars and the amounts actually received.
Foreign currency denominated assets may involve risks not typically associated with domestic transactions, including unanticipated movements in exchange currency rates, the degree of government supervision and regulation of security markets, and the possibility of political or economic instability.
Foreign capital gains taxes: The Fund may be subject to taxes imposed by countries in which it invests, with respect to its investment in issuers existing or operating in such countries. Such taxes are generally based on income earned or repatriated and capital gains realized on the sale of such investments. The Fund accrues such taxes when the related income or capital gains are earned. Some countries require govermental approval for the repatriation of investment income, capital or the proceeds of sales earned by foreign investors. In addition, if there is deterioration in a country's balance of payments or for other reasons, a country may impose temporary restrictions on foreign capital remittances abroad.
Forward foreign currency contracts: The Fund may enter into forward foreign currency contracts to hedge against exchange rate risk arising from investments in securities denominated in foreign currencies. Contracts are valued at the contractual forward rate and are marked to market daily, with the change in value recorded as an unrealized gain or loss. When the contracts are closed a realized gain or loss is incurred. Risks may arise from changes in market value of the underlying currencies and from the possible inability of counterparties to meet the terms of their contracts.
Open forward foreign currency contracts at October 31, 2004, are listed in the Schedule of Investments.
Account maintenance fees: If the shareholder account balance falls below $1 by either shareholder action or as a result of market action, a $25 (not in thousands) fee is assessed every year until the balance reaches $1. The fee is assessed by redeeming shares in the shareholder's account.
No fee will be charged under the following conditions:
• accounts opened within the preceding 24 months
• accounts with an active monthly Automatic Investment Plan ($50 (not in thousands) minimum per fund)
• accounts owned by an individual which, when combined by social security number, have a balance of $5 or more
• accounts owned by individuals in the same household (by address) that have a combined balance of $5 or more
• UTMA/UGMA accounts
• Fiduciary accounts
• B-share accounts whose shares have started to convert to A-shares accounts (as long as combined value of both accounts is at least $1)
For the year ended October 31, 2004, this fee totaled $9. These fees are included in Paid in Capital in the Statement of Assets and Liabilities.
Redemption fees: A short-term trading redemption fee may be assessed on any fund shares in a fund account that are sold during the first five (5) New York Stock Exchange trading days following their purchase date. This redemption fee will equal 2% of the amount redeemed and shares held the longest will be treated as being redeemed first and shares held the shortest as being redeemed last. For the year ended October 31, 2004, the Fund received no redemption fees.
Dividend distributions: Distributions to shareholders are recorded on the ex-dividend date and are determined in accordance with Federal income tax regulations which may differ from GAAP.
Transamerica IDEX Mutual Funds
Annual Report 2004
13
TA IDEX Transamerica Balanced
NOTES TO FINANCIAL STATEMENTS (continued)
At October 31, 2004
(all amounts in thousands)
NOTE 2. RELATED PARTY TRANSACTIONS
AEGON/Transamerica Fund Advisers, Inc. ("ATFA") is the Fund's investment adviser. AEGON/Transamerica Fund Services, Inc. ("ATFS") is the Fund's administrator. AFSG Securities Corp. ("AFSG") is the Fund's distributor/principal underwriter. AEGON/Transamerica Investor Services, Inc. ("ATIS") is the Fund's transfer agent. ATIS and AFSG are 100% owned by AUSA Holding Company ("AUSA"). ATFA is a directly owned subsidiary of Western Reserve Life Assurance Co. of Ohio (78%) ("WRL") and AUSA (22%). ATFS is a wholly owned subsidiary of WRL. AUSA and WRL are wholly owned indirect subsidiaries of AEGON NV, a Netherlands corporation.
Investment advisory fees: The Fund pays management fees to ATFA based on average daily net assets ("ANA") at the following breakpoints:
From November 1, 2003 to May 28, 2004:
1.00% of the first $250 million of ANA
0.90% of the next $500 million of ANA
0.80% of the next $750 million of ANA
0.70% of ANA over $1.5 billion
From May 29, 2004:
0.85% of the first $250 million of ANA
0.80% of the next $250 million of ANA
0.75% of the next $1 billion of ANA
0.65% of ANA over $1.5 billion
ATFA has contractually agreed to waive its advisory fee and will reimburse the Fund to the extent that operating expenses, excluding 12b-1 fees, exceed the following stated annual limit:
1.50% Expense Limit
There were no amounts recaptured during the fiscal year ended October 31, 2004. There are no amounts subject to recapture at October 31, 2004.
Transamerica Investment Management, LLC is both an affiliate of the Fund and a sub-adviser to the Fund.
Prior to May 28, 2004, Janus Capital Management, LLC ("Janus") acted as the sub-adviser. Janus had agreed to a pricing discount based on the aggregate assets that they managed in the AEGON/Transamerica Series Fund, Inc. and Transamerica IDEX Mutual Funds. The amount of the discount received by the Fund for the period from November 1, 2003 to May 27, 2004 was $7.
Distribution and service fees: The Fund has a 12b-1 distribution plan under the 1940 Act pursuant to which an annual fee, based on average daily net assets, is paid to the distributor for various disbursements such as broker-dealer account servicing fees and other promotional expenses of the Fund. The Fund is authorized under the 12b-1 plan to pay fees on each class up to the following limits:
| Class A | | | 0.35 | % | |
| Class B | | | 1.00 | % | |
| Class C | | | 1.00 | % | |
| Class C2 | | | 1.00 | % | |
| Class M | | | 0.90 | % | |
Class C2 and Class M merged into Class C on June 15, 2004 and September 24, 2004, respectively.
In the case the Fund or a class of shares of the Fund is closed to new investors or investments, the Fund is authorized to pay 12b-1 fees for past sales and distribution efforts and present and past investor services.
Underwriter commissions relate to front-end sales charges imposed for Class A and M shares and contingent deferred sales charges from Classes B, C, M and certain A share redemptions. For the year ended October 31, 2004, the underwriter commissions were as follows:
| Received by Underwriter | | $ | 619 | | |
| Retained by Underwriter | | | 24 | | |
| Contingent Deferred Sales Charge | | | 56 | | |
Administrative services: The Fund has entered into an agreement with ATFS for financial and legal fund administration services, which includes such items as compliance, expenses, financial statements and other reporting, distributions, tax returns, prospectus preparation, board of trustees meeting support and other legal matters. The Fund pays ATFS an annual fee of 0.015% of average net assets. The Legal fees on the Statement of Operations are for fees paid to external legal counsel.
The Fund paid ATFS $47 for the year ended October 31, 2004.
Transfer agent fees: The Fund pays ATIS an annual per-account charge of $20 (not in thousands) for each open account and $1.63 (not in thousands) for each closed account. There is no new account charge. The Fund paid ATIS $862 for the year ended October 31, 2004.
Deferred compensation plan: Each eligible Fund Trustee may elect participation in the Deferred Compensation Plan ("the Plan"). Under the Plan, such Trustees may defer payment of a percentage of their total fees earned as a Fund Trustee. These deferred amounts may be invested in any Transamerica IDEX Mutual Fund. At October 31, 2004, the value of invested plan amount was $32. Invested plan amounts and the total liability for deferred compensation to the Trustees under the Plan at October 31, 2004, are included in the accompanying Statement of Assets and Liabilities.
Transamerica IDEX Mutual Funds
Annual Report 2004
14
TA IDEX Transamerica Balanced
NOTES TO FINANCIAL STATEMENTS (continued)
At October 31, 2004
(all amounts in thousands)
NOTE 3. INVESTMENT TRANSACTIONS
The cost of securities purchased and proceeds from securities sold (excluding short-term securities) for the year ended October 31, 2004, were as follows:
| Purchases of securities: | | | |
| Long-Term excluding U.S. Government | | $ | 278,120 | | |
| U.S. Government | | | 61,412 | | |
| Proceeds from maturities and sales of securities | | | |
| Long-Term excluding U.S. Government | | | 348,920 | | |
| U.S. Government | | | 89,942 | | |
NOTE 4. FEDERAL INCOME TAX MATTERS
The Fund has not made any provision for federal income or excise taxes due to its policy to distribute all of its taxable income and capital gains to its shareholders and otherwise qualify as a regulated investment company under the Internal Revenue Code. Income and capital gain distributions are determined in accordance with income tax regulations, which may differ from GAAP. These differences are primarily due to differing treatment for items including, but not limited to, wash sales, net operating losses and capital loss carryforwards.
Reclassifications between Undistributed net investment income (loss), Undistributed net realized capital gains (loss) and Shares of beneficial interest are made to reflect income and gains available for distribution under federal tax regulations. Results of operations and net assets are not effected by these reclassifications. These reclassifications are as follows:
Shares of beneficial interest, unlimited
shares authorized | | $ | 4,291 | | |
| Undistributed net investment income (loss) | | | (30 | ) | |
Accumulated net realized gain (loss) from investment
securities and foreign currency translations | | | (4,261 | ) | |
The capital loss carryforwards are available to offset future realized capital gains through the periods listed:
Capital Loss
Carryforward | | Available through | |
| $ | 2,279 | | | October 31, 2009 | |
| | 32,287 | | | October 31, 2010 | |
| | 9,071 | | | October 31, 2011 | |
The capital loss carryforward utilized during the year ended October 31, 2004 was $32,859.
The capital loss carryforwards are available to offset future realized gains, subject to certain limitations under the Internal Revenue Code, through the period listed.
The tax character of distributions paid may differ from the character of distributions shown in the Statements of Changes in Net Assets due to short-term gains being treated as ordinary income for tax purposes. The tax character of distributions paid during 2003 and 2004 was as follows:
| 2003 Distributions paid from: | | | |
| Ordinary Income | | $ | 2,888 | | |
| Long-term capital gain | | | – | | |
| 2004 Distributions paid from: | | | |
| Ordinary Income | | $ | 1,139 | | |
| Long-term capital gain | | | – | | |
The tax basis components of distributable earnings as of October 31, 2004, are as follows:
| Undistributed Ordinary Income | | $ | 153 | | |
| Undistributed Long-term Capital Gains | | $ | – | | |
| Capital Loss Carryforward | | $ | (43,637 | ) | |
| Net Unrealized Appreciation (Depreciation) | | $ | 19,458 | * | |
* Amount includes unrealized appreciation (depreciation) from foreign currency and deferred compensation.
The aggregate cost of investments and composition of unrealized appreciation (depreciation) for federal income tax purposes as of October 31, 2004, are as follows:
| Federal Tax Cost Basis | | $ | 307,274 | | |
| Unrealized Appreciation | | $ | 23,912 | | |
| Unrealized (Depreciation) | | | (4,450 | ) | |
| Net Unrealized Appreciation (Depreciation) | | $ | 19,462 | | |
NOTE 5. OTHER MATTERS
Transamerica IDEX Mutual Funds ("TA IDEX"), and certain of its affiliated entities, have received requests for information from the Staff of the Securities and Exchange Commission in connection with market timing and late trading within the funds. TA IDEX and the affiliated entities have voluntarily cooperated in the investigation and have been providing the information as requested.
Transamerica IDEX Mutual Funds
Annual Report 2004
15
Report of Independent Registered Certified Public Accounting Firm
To the Board of Trustees and Shareholders of
TA IDEX Transamerica Balanced
In our opinion, the accompanying statement of assets and liabilities, including the schedule of investments, and the related statements of operations and of changes in net assets and the financial highlights present fairly, in all material respects, the financial position of TA IDEX Transamerica Balanced (the "Fund") (one of the portfolios constituting the Transamerica IDEX Mutual Funds) at October 31, 2004, the results of its operations for the year then ended, the changes in its net assets for each of the two years in the period then ended and the financial highlights for each of the periods indicated, in conformity with accounting principles generally accepted in the United States of America. These financial statements and financial highlights (hereafter referred to as "financial statements") are the responsibility of the Fund's management; our responsibility is to express an opinion on the se financial statements based on our audits. We conducted our audits of these financial statements in accordance with the standards of the Public Company Accounting Oversight Board (United States). Those standards require that we plan and perform the audit to obtain reasonable assurance about whether the financial statements are free of material misstatement. An audit includes examining, on a test basis, evidence supporting the amounts and disclosures in the financial statements, assessing the accounting principles used and significant estimates made by management, and evaluating the overall financial statement presentation. We believe that our audits, which included confirmation of securities at October 31, 2004 by correspondence with the custodian and brokers, provide a reasonable basis for our opinion.

PricewaterhouseCoopers LLP
Tampa, Florida
December 28, 2004
Transamerica IDEX Mutual Funds
Annual Report 2004
16
TA IDEX Transamerica Balanced
SUPPLEMENTAL INFORMATION (unaudited)
TAX INFORMATION
For dividends paid during the year ended October 31, 2004, the Fund designates $1,141 of qualified dividend income.
For corporate shareholders, 86% of investment income (dividend income plus short-term gains, if any) qualifies for the dividends received deduction.
The information and distributions reported herein may difffer from the information and distributions taxable to the shareholders for the calendar year ending December 31, 2004. Complete information will be computed and reported in conjunction with your 2004 Form 1099-DIV.
RESULTS OF SHAREHOLDER PROXY
At a special meeting of shareholders held on May 21, 2004, the results of the Proposal were as follows:
Proposal 1: Approval of an Agreement and Plan of Reorganization providing for the acquisition of all of the assets and liabilities of TA IDEX Janus Growth & Income (the "Acquired Fund") by TA IDEX Janus Balanced (the "Acquiring Fund") solely in exchange for shares of the Acquiring Fund, followed by the complete liquidation of the Acquired Fund.
| For | | Against | | Abstentions/Broker Non-Votes | |
| | 84.18 | % | | | 3.30 | % | | | 12.52 | % | |
At a special meeting of Class M shareholders of each series of Transamerica IDEX (except TA IDEX Federated Tax Exempt and TA IDEX Protected Principal Stock) held on September 2, 2004, the results of the Proposal were as follows:
Proposal 1: Approval of a conversion of Class M shares into Class C shares of the Funds, which will result in bearing the distribution and service fees payable under the 12b-1 Plan of Distribution for the Class C shares of the Funds.
| For | | Against | | Abstentions/Broker Non-Votes | |
| | 82.49 | % | | | 4.93 | % | | | 12.58 | % | |
Transamerica IDEX Mutual Funds
Annual Report 2004
17
TA IDEX Transamerica Conservative High-Yield Bond
MARKET ENVIRONMENT
The economy continued its growth path during the past fiscal year-end October 31, 2004, but at a slightly lower pace than the beginning of the year. Strong personal consumption expenditures along with continued growth of capital spending contributed to the sustained growth trend of the economy. Employment growth continues to be below historical recoveries, which have led to a subdued rise in employee wages, and thus lower than expected inflation.
The combined forces of strong growth coupled with low inflation led the Federal Reserve Board ("Fed") to embark on a tightening program that caused interest rates to rise on the front end of the curve while rates fell slightly on the long end. A proxy for whether duration or credit outperformed during the year is witnessed by Lehman Brothers High Yield Index (credit) increasing 12.3% during the fiscal year ended October 2004, while Lehman Brothers Credit Index (duration) increased just 6.6%. The vast majority of the portfolio's underperformance for the year versus high yield fund peers was our limitation to hold no more than 75% of high yield in the portfolio.
PERFORMANCE
For the year ended October 31, 2004, TA IDEX Transamerica Conservative High Yield Bond, Class A returned 9.23%. By comparison its benchmark, the Merrill Lynch High Yield Cash Pay Index ("Merrill Lynch High Yield"), returned 12.02%.
STRATEGY REVIEW
Our philosophy of utilizing a substantial portion of duration product (investment grade corporate bonds) in the portfolio has had significant risk/reward characteristics historically for the portfolio. Since 1985 through the end of the third calendar quarter of 2004, investment grade corporate bonds as measured by the Merrill Lynch High Grade Corporate Master Index, returned an average monthly return of 0.78% coupled with a 1.51 standard deviation, or a Sharpe ratio of 0.23%. This slightly exceeded the Merrill Lynch High Yield Sharpe ratio of 0.22%, which experienced an average monthly return of 0.83% and a standard deviation of 1.80.
Essentially this philosophy enabled the portfolio to garner risk adjusted returns from a sector that experienced about the same average monthly return, but with less monthly volatility as the high yield sector. This was primarily due to the duration advantage gained by owning investment grade bonds over the past 19 years of the portfolio during an extraordinary period of high interest rates. Given interest rates are back to more historic levels, this philosophy will become more challenging for the portfolio.
The macroeconomic environment was very conducive to credit during the fiscal year, as witnessed by credit spreads tightening throughout the year, default rates dropping to near historical lows, and corporations' balance sheets improving dramatically since the recession of 2001-2002. The portfolio took advantage of this trend, to the extent allowed possible by the prospectus, by investing in bonds that would benefit from a recovering economy.
Normally, during periods of strong economic up trends, interest rates also tend to rise. But this cycle has been unconventional, as witnessed by interest rates falling during the second half of the fiscal year as the Fed began its tightening stance. The portfolio was positioned for rising interest rates which contributed slightly to the underperformance of the portfolio.
Performance for the fiscal year ended October 31, 2004 had a broad array of positive and negative contributors. Positive contributors were generally centered around positions held in the basic industries sub-sectors (metals, chemicals and paper) and our various securities held in the utilities sector. Examples of names included in the basic industries sub-sector include Scotia Pacific Company LLC, Lyondell Chemical Company, Equistar Chemicals, LP and United States Steel Corporation. Within utilities key contributors to the portfolio included Nevada Power Company, The AES Corporation, Dynegy Holdings Inc. and Elwood Energy LLC. The utility sector has continued to recovery from the financial distress it experienced in 2001 and 2002 as the broader market has stabilized and provided liquidity allowing utility credits to improve their liquidity situations.
Negative contributors to performance were generally more individual situations than sector specific. Issuers that lagged in performance during the fiscal year ended October 31, 2004 included Time Warner Inc., Allied Waste North America, Inc. and Tyco International Group SA. Most of under-performance of these securities was due to fundamental difficulties at each of their respective businesses combined with relatively tight valuations. Additionally, we exhibited some modest under-performance as it relates to securities in other sectors, specifically, automotive. The automotive sector has continued to come under pressure as intense competition combined with a high fixed cost structure has led to pressure on profitability.
The portfolio is exposed to duration risk through the required holding of twenty-five percent of investment grade debt. A significant rise in interest rates poses the key risk to the portfolio. The portfolio is currently positioned with a neutral weighting versus target duration, but will move in a direction to dampen the impact from rising interest rates if that scenario does unfold.
David R. Halfpap, CFA
Bradley J. Beman CFA
Co-Fund Managers
AEGON USA Investment Management, LLC
Transamerica IDEX Mutual Funds
Annual Report 2004
1
TA IDEX Transamerica Conservative High-Yield Bond
Comparison of change in value of $10,000 investment in Class A shares and its comparative index.
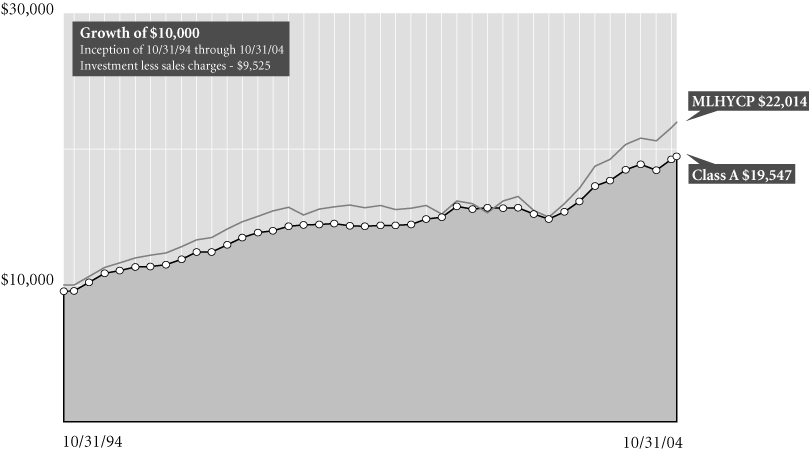
Average Annual Total Return for Periods Ended 10/31/04
| | | 1 year | | 5 years | | 10 years | | From
Inception | | Inception
Date | |
| Class A (NAV) | | | 9.23 | % | | | 6.52 | % | | | 7.49 | % | | | 8.75 | % | | 6/14/85 | |
| Class A (POP) | | | 4.04 | % | | | 5.49 | % | | | 6.97 | % | | | 8.47 | % | | 6/14/85 | |
| MLHYCP1 | | | 12.02 | % | | | 7.14 | % | | | 8.21 | % | | | 9.88 | % | | 6/14/85 | |
| Class B (NAV) | | | 8.52 | % | | | 5.85 | % | | | – | | | | 5.83 | % | | 10/1/95 | |
| Class B (POP) | | | 3.52 | % | | | 5.69 | % | | | – | | | | 5.83 | % | | 10/1/95 | |
| Class C (NAV) | | | 8.41 | % | | | – | | | | – | | | | 14.09 | % | | 11/11/02 | |
| Class C (POP) | | | 7.41 | % | | | – | | | | – | | | | 14.09 | % | | 11/11/02 | |
NOTES
1 The Merrill Lynch High Yield Cash Pay (MLHYCP) Index is an unmanaged index used as a general measure of market performance. Calculations assume dividends and capital gains are reinvested and do not include any managerial expenses. From inception calculation is based on life of Class A shares. Source: Standard & Poor's Micropal®© Micropal, Inc. 2004 – 1-800-596-5323 – http://www.micropal.com.
The performance data presented represents past performance, future results may vary. Performance data does not reflect the deduction of taxes that would be paid on fund distributions or the redemption of fund shares. Investment return and principal value will fluctuate so that an investor's shares, when redeemed, may be worth more or less than their original cost. Current performance may be lower or higher than performance quoted.
Public Offering Price (POP) returns include the reinvestment of dividends and capital gains and reflect the maximum sales charge of 4.75% for A shares or the maximum applicable contingent deferred sales charge (5% in the 1st year, decreasing to 0% after 6 years) for Class B shares and 1% (during the first 12 months) for Class C shares. Shares purchased prior to March 1, 2004 are subject to a maximum applicable contingent deferred sales charge (5% in the 1st year, decreasing to 0% after 7 years) for Class B shares and (2% in the 1st year, decreasing to 0% after 2 years) for Class C shares. Net Asset Value (NAV) returns include the reinvestment of dividends and capital gains but do not reflect any sales charges.
Investments in high-yield bonds ("junk bonds") may be subject to greater volatility and risks as the income derived from these securities is not guaranteed and may be unpredictable.
This material must be preceded or accompanied by a current prospectus, which includes specific contents regarding the investment objectives and policies of this fund.
Transamerica IDEX Mutual Funds
Annual Report 2004
2
TA IDEX Transamerica Conservative High-Yield Bond
UNDERSTANDING YOUR FUND'S EXPENSES (unaudited)
SHAREHOLDER EXPENSES
The following Example is intended to help you understand your ongoing costs (in dollars and cents) of investing in a Fund and to compare these costs with the ongoing costs of investing in other funds.
The Example is based on an investment of $1,000 invested at the beginning of the period and held for the entire period from May 1, 2004 to October 31, 2004.
ACTUAL EXPENSES
The first line in the table below provides information about actual account values and actual expenses. You may use the information in this line, together with the amount you invested, to estimate the expenses that you paid over the period. Simply divide your account value by $1,000 (for example, an $8,600 account value divided by $1,000 = 8.6), then multiply the result by the number in the first line of your Fund un der the heading entitled "Expenses Paid During Period" to estimate the expenses you paid on your account during this period.
HYPOTHETICAL EXAMPLE FOR COMPARISON PURPOSES
The second line in the table below provides information about hypothetical account values and hypothetical expenses based on each Fund's actual expense ratio and an assumed rate of return of 5% per year before expenses, which is not the Fund's actual return. The hypothetical account values and expenses may not be used to estimate the actual ending account balance or expenses you paid for the period. You may use this information to compare the ongoing costs of investing in your Fund and other funds. To do so, compare this 5% hypothetical example with the 5% hypothetical examples that appear in the shareholder reports of the other funds.
Please note that the expenses shown in the table are meant to highlight your ongoing costs only and do not reflect any transactional costs, such as sales charges, redemption fees, brokerage commissions paid on purchases and sales of fund shares. Therefore, the second line under each Fund in the table is useful in comparing ongoing costs only, and will not help you determine the relative total costs of owning different funds. In addition, note that the expenses shown in the table are meant to highlight your ongoing costs and do not reflect any transaction costs.
| | | Beginning
Account
Value | | Ending
Account
Value | | Annualized
Expense
Ratio | | Expenses Paid
During Period(a) | |
| Class A | |
| Actual | | $ | 1,000.00 | | | $ | 1,053.90 | | | | 1.08 | % | | $ | 5.58 | | |
| Hypothetical (b) | | | 1,000.00 | | | | 1,019.71 | | | | 1.08 | | | | 5.48 | | |
| Class B | |
| Actual | | | 1,000.00 | | | | 1,051.60 | | | | 1.69 | | | | 8.72 | | |
| Hypothetical (b) | | | 1,000.00 | | | | 1,016.64 | | | | 1.69 | | | | 8.57 | | |
| Class C | |
| Actual | | | 1,000.00 | | | | 1,050.50 | | | | 1.80 | | | | 9.28 | | |
| Hypothetical (b) | | | 1,000.00 | | | | 1,016.09 | | | | 1.80 | | | | 9.12 | | |
(a) Expenses are calculated using each Fund's annualized expense ratio (as disclosed in the table), multiplied by the average account value for the period, multiplied by number of days in the period (184 days), and divided by the number of days in the year (366 days).
(b) 5% return per year before expenses.
GRAPHIC PRESENTATION OF SCHEDULE OF INVESTMENTS
By Bond Credit Quality (Moody Ratings)
At October 31, 2004

This chart shows the percentage breakdown by Bond Credit Quality of the Fund's total investment securities.
Transamerica IDEX Mutual Funds
Annual Report 2004
3
TA IDEX Transamerica Conservative High-Yield Bond
GRAPHIC PRESENTATION OF SCHEDULE OF INVESTMENTS
(continued)
Credit
Rating | | Description | |
| Aaa | | Prime grade obligations. Exceptional financial security and ability to meet senior financial obligations. | |
|
| Aa3 | | High grade obligations. Excellent financial security and ability to meet senior financial obligations. | |
|
| A1 | | Upper medium grade obligations. Superior ability for repayments of senior short-term debt obligations. | |
|
| A2 | | Upper medium grade obligations. Strong ability for repayments of senior short-term debt obligations. | |
|
| A3 | | Upper medium grade obligations. Acceptable ability for repayments of senior short-term debt obligations. | |
|
| Baa1 | | Medium grade obligations. Interest payments and principal security are adequate for the present but certain protective elements may be lacking or may be characteristically unreliable over great length of time. | |
|
| Baa2 | | Medium grade obligations. Interest payments and principal security appear adequate for the present but certain protective elements may be lacking or may be characteristically unreliable over great length of time. | |
|
| Baa3 | | Medium grade obligations. Interest payments and principal security are not as adequate for the present but certain protective elements may be lacking or may be characteristically unreliable over great length of time. | |
|
| Ba1 | | Moderate vulnerability in the near-term but faces major ongoing uncertainties in the event of adverse business, financial and economic conditions. | |
|
| Ba2 | | Vulnerable in the near-term but faces major ongoing uncertainties in the event of adverse business, financial and economic conditions. | |
|
| Ba3 | | More vulnerable in the near-term but faces major ongoing uncertainties in the event of adverse business, financial and economic conditions. | |
|
| B1 | | Moderate vulnerability to adverse business, financial and economic conditions but currently has the capacity to meet financial commitments. | |
|
| B2 | | More vulnerable to adverse business, financial and economic conditions but currently has the capacity to meet financial commitments. | |
|
| B3 | | Assurance of interest and principal payments or of maintenance of other terms of the contract over any long period of time may be small. | |
|
| Caa1 | | Highly vulnerable may be in default on their policyholder obligations or there may be present elements of danger with respect to payment of policyholder obligations and claims. | |
|
| Caa2 | | Extremely vulnerable may be in default on their policyholder obligations or there may be present elements of danger with respect to payment of policyholder obligations and claims. | |
|
| Ca | | Extremely speculative, may be in default on their policyholder obligations or have other marked shortcomings. | |
|
Transamerica IDEX Mutual Funds
Annual Report 2004
4
TA IDEX Transamerica Conservative High-Yield Bond
SCHEDULE OF INVESTMENTS
At October 31, 2004
(all amounts except share amounts in thousands)
| | | Principal | | Value | |
| U.S. GOVERNMENT OBLIGATIONS (1.0%) | | | |
U.S. Treasury Bond
7.50%, due 11/15/2016 (a) | | $ | 1,000 | | | $ | 1,295 | | |
| 7.88%, due 02/15/2021 | | | 1,000 | | | | 1,366 | | |
| 5.25%, due 11/15/2028 | | | 1,000 | | | | 1,054 | | |
| Total U.S. Government Obligations (cost: $3,674) | | | | | | | 3,715 | | |
| FOREIGN GOVERNMENT OBLIGATIONS (0.3%) | | | |
Republic of Colombia
9.75%, due 04/23/2009 | | | 1,000 | | | | 1,132 | | |
| Total Foreign Government Obligations (cost: $940) | | | | | | | 1,132 | | |
| CORPORATE DEBT SECURITIES (94.7%) | | | |
| Aerospace (0.6%) | | | |
K&F Industries, Inc.
9.63%, due 12/15/2010 | | | 1,000 | | | | 1,160 | | |
Textron, Inc.
4.50%, due 08/01/2010 | | | 1,000 | | | | 1,024 | | |
| Air Transportation (0.8%) | | | |
American Airlines, Inc., Series 2003-1, Class G
3.86%, due 07/09/2010 | | | 921 | | | | 911 | | |
Delta Air Lines, Inc., Series 2003-1, Class G
2.85%, due 01/25/2008 (b) | | | 2,208 | | | | 2,222 | | |
| Amusement & Recreation Services (5.6%) | | | |
Harrah's Operating Co., Inc.
5.50%, due 07/01/2010 | | | 3,000 | | | | 3,130 | | |
International Speedway Corp.
4.20%, due 04/15/2009 | | | 2,000 | | | | 2,015 | | |
Isle of Capri Casinos, Inc.
7.00%, due 03/01/2014 | | | 3,000 | | | | 3,105 | | |
MGM Mirage
6.88%, due 02/06/2008 | | | 2,000 | | | | 2,177 | | |
| 5.88%, due 02/27/2014 (a) | | | 2,500 | | | | 2,466 | | |
MGM Mirage, 144A
6.75%, due 09/01/2012 | | | 1,000 | | | | 1,060 | | |
Mohegan Tribal Gaming Authority
6.38%, due 07/15/2009 | | | 1,000 | | | | 1,047 | | |
Seneca Gaming Corp.
7.25%, due 05/01/2012 | | | 3,000 | | | | 3,165 | | |
Speedway Motorsports, Inc.
6.75%, due 06/01/2013 | | | 1,000 | | | | 1,050 | | |
Station Casinos, Inc.
6.88%, due 03/01/2016 | | | 2,000 | | | | 2,125 | | |
| Automotive (2.9%) | | | |
Arvin Industries, Inc.
6.75%, due 03/15/2008 | | | 3,000 | | | | 3,075 | | |
| | | Principal | | Value | |
| Automotive (continued) | | | |
DaimlerChrysler North America Holding Corp.
4.05%, due 06/04/2008 | | $ | 1,000 | | | $ | 1,007 | | |
General Motors Corp.
7.13%, due 07/15/2013 (a) | | | 2,000 | | | | 2,075 | | |
Navistar International Corp.
9.38%, due 06/01/2006 | | | 2,000 | | | | 2,160 | | |
Tenneco Automotive Inc
10.25%, due 07/15/2013 | | | 2,500 | | | | 2,912 | | |
| Beverages (0.3%) | | | |
Cadbury Schweppes US Finance LLC, 144A
3.88%, due 10/01/2008 | | | 1,000 | | | | 1,007 | | |
| Business Credit Institutions (1.3%) | | | |
Ford Motor Credit Co.
6.50%, due 01/25/2007 | | | 500 | | | | 525 | | |
| 5.80%, due 01/12/2009 | | | 3,000 | | | | 3,095 | | |
HVB Funding Trust III, 144A
9.00%, due 10/22/2031 | | | 1,000 | | | | 1,301 | | |
| Business Services (2.8%) | | | |
Clear Channel Communications, Inc.
4.63%, due 01/15/2008 | | | 1,000 | | | | 1,019 | | |
| 7.65%, due 09/15/2010 | | | 1,000 | | | | 1,144 | | |
Quintiles Transnational Corp.
10.00%, due 10/01/2013 | | | 1,000 | | | | 1,090 | | |
R.H. Donnelley Finance Corp I, 144A
10.88%, due 12/15/2012 | | | 2,000 | | | | 2,445 | | |
United Rentals North America, Inc.
6.50%, due 02/15/2012 | | | 1,000 | | | | 990 | | |
Universal Compression, Inc.
7.25%, due 05/15/2010 | | | 2,000 | | | | 2,140 | | |
Universal Hospital Services, Inc.
10.13%, due 11/01/2011 (a) | | | 2,000 | | | | 2,040 | | |
| Chemicals & Allied Products (4.3%) | | | |
Airgas, Inc.
6.25%, due 07/15/2014 | | | 1,500 | | | | 1,515 | | |
Eastman Chemical Co.
3.25%, due 06/15/2008 | | | 1,000 | | | | 983 | | |
Equistar Chemicals, LP/Equistar Funding Corp.
10.13%, due 09/01/2008 1,000 1,149
10.63%, due 05/01/2011 | | | 2,000 | | | | 2,310 | | |
Huntsman International LLC
9.88%, due 03/01/2009 | | | 1,000 | | | | 1,110 | | |
Huntsman LLC
11.63%, due 10/15/2010 | | | 1,500 | | | | 1,768 | | |
Lyondell Chemical Co.
10.50%, due 06/01/2013 (a) | | | 1,000 | | | | 1,180 | | |
The notes to the financial statements are an integral part of this report.
Transamerica IDEX Mutual Funds
Annual Report 2004
5
TA IDEX Transamerica Conservative High-Yield Bond
SCHEDULE OF INVESTMENTS (continued)
At October 31, 2004
(all amounts except share amounts in thousands)
| | | Principal | | Value | |
| Chemicals & Allied Products (continued) | | | |
Monsanto Co.
4.00%, due 05/15/2008 | | $ | 2,000 | | | $ | 2,020 | | |
Nalco Co.
8.88%, due 11/15/2013 (a) | | | 2,000 | | | | 2,192 | | |
NOVA Chemicals Corp.
6.50%, due 01/15/2012 | | | 1,000 | | | | 1,052 | | |
Scotts Co. (The)
6.63%, due 11/15/2013 | | | 1,000 | | | | 1,055 | | |
| Commercial Banks (1.1%) | | | |
Mizuho Financial Group Cayman, Ltd., 144A
5.79%, due 04/15/2014 | | | 1,000 | | | | 1,041 | | |
Popular North America, Inc.
6.13%, due 10/15/2006 | | | 1,000 | | | | 1,056 | | |
Wachovia Corp.
3.63%, due 02/17/2009 | | | 2,000 | | | | 1,996 | | |
| Communication (4.1%) | | | |
Adelphia Communications Corp.
10.25%, due 11/01/2006 (c) | | | 1,000 | | | | 855 | | |
Charter Communications Holdings, Inc.
8.63%, due 04/01/2009 (a) | | | 2,000 | | | | 1,610 | | |
| 9.92%, due 04/01/2011 (a) | | | 1,000 | | | | 802 | | |
Comcast Cable Communications
6.75%, due 01/30/2011 | | | 1,000 | | | | 1,122 | | |
CSC Holdings, Inc.
7.88%, due 12/15/2007 | | | 1,000 | | | | 1,077 | | |
CSC Holdings, Inc., 144A
6.75%, due 04/15/2012 | | | 2,000 | | | | 2,070 | | |
Liberty Media Corp.
3.38%, due 09/17/2006 (b) | | | 4,000 | | | | 4,045 | | |
| 7.88%, due 07/15/2009 | | | 1,000 | | | | 1,129 | | |
News America Holdings, Inc.
6.63%, due 01/09/2008 | | | 1,000 | | | | 1,094 | | |
PanAmSat Corp., 144A
9.00%, due 08/15/2014 | | | 2,000 | | | | 2,120 | | |
| Communications Equipment (1.1%) | | | |
L-3 Communications Corp.
7.63%, due 06/15/2012 | | | 1,000 | | | | 1,105 | | |
| 6.13%, due 07/15/2013 | | | 2,000 | | | | 2,075 | | |
| 6.13%, due 01/15/2014 | | | 1,000 | | | | 1,035 | | |
| Computer & Data Processing Services (0.5%) | | | |
Unisys Corp.
7.88%, due 04/01/2008 | | | 2,000 | | | | 2,052 | | |
| Computer & Office Equipment (0.3%) | | | |
Seagate Technology Hdd Holdings Corp.
8.00%, due 05/15/2009 | | | 1,000 | | | | 1,081 | | |
| | | Principal | | Value | |
| Construction (2.6%) | | | |
Beazer Homes USA, Inc.
6.50%, due 11/15/2013 | | $ | 2,000 | | | $ | 2,030 | | |
Centex Corp.
5.80%, due 09/15/2009 | | | 750 | | | | 801 | | |
DR Horton, Inc.
5.88%, due 07/01/2013 | | | 3,000 | | | | 3,007 | | |
| 6.13%, due 01/15/2014 | | | 1,000 | | | | 1,025 | | |
KB Home
5.75%, due 02/01/2014 | | | 1,000 | | | | 992 | | |
Standard-Pacific Corp.
6.25%, due 04/01/2014 | | | 2,000 | | | | 1,980 | | |
| Department Stores (0.0%) | | | |
Saks, Inc.
8.25%, due 11/15/2008 | | | 0 | | | | 0 | (d) | |
| 7.00%, due 12/01/2013 | | | 56 | | | | 57 | | |
| Drug Stores & Proprietary Stores (1.1%) | | | |
Jean Coutu Group, Inc., 144A
8.50%, due 08/01/2014 (a) | | | 2,000 | | | | 2,040 | | |
Medco Health Solutions, Inc.
7.25%, due 08/15/2013 | | | 1,000 | | | | 1,111 | | |
Rite Aid Corp.
9.50%, due 02/15/2011 | | | 1,000 | | | | 1,107 | | |
| Electric Services (6.0%) | | | |
AES Corp. (The), 144A
8.75%, due 05/15/2013 (a) | | | 2,000 | | | | 2,310 | | |
CenterPoint Energy Resources Corp., Series B
7.88%, due 04/01/2013 | | | 2,000 | | | | 2,391 | | |
Cleveland Electric Illuminating Co., (The)
5.65%, due 12/15/2013 | | | 1,000 | | | | 1,044 | | |
Dynegy Holdings, Inc., 144A
10.13%, due 07/15/2013 | | | 3,000 | | | | 3,495 | | |
Elwood Energy LLC
8.16%, due 07/05/2026 | | | 1,818 | | | | 1,927 | | |
Nevada Power Co., Series A
8.25%, due 06/01/2011 | | | 4,000 | | | | 4,560 | | |
NRG Energy, Inc., 144A
8.00%, due 12/15/2013 | | | 3,000 | | | | 3,304 | | |
Texas New Mexico Power Co.
6.13%, due 06/01/2008 | | | 3,000 | | | | 3,110 | | |
Virginia Electric and Power Co.
4.10%, due 12/15/2008 | | | 1,000 | | | | 1,009 | | |
| Electric, Gas & Sanitary Services (2.2%) | | | |
Citizens Communications Co.
8.50%, due 05/15/2006 | | | 2,000 | | | | 2,150 | | |
Illinois Power Co.
11.50%, due 12/15/2010 | | | 650 | | | | 771 | | |
The notes to the financial statements are an integral part of this report.
Transamerica IDEX Mutual Funds
Annual Report 2004
6
TA IDEX Transamerica Conservative High-Yield Bond
SCHEDULE OF INVESTMENTS (continued)
At October 31, 2004
(all amounts except share amounts in thousands)
| | | Principal | | Value | |
| Electric, Gas & Sanitary Services (continued) | |
NiSource Finance Corp.
7.88%, due 11/15/2010 | | $ | 1,000 | | | $ | 1,187 | | |
Pacific Gas & Electric Co.
2.72%, due 04/03/2006 (b) | | | 2,437 | | | | 2,440 | | |
| 3.60%, due 03/01/2009 | | | 2,000 | | | | 1,986 | | |
| Electronic & Other Electric Equipment (0.6%) | |
Rayovac Corp.
8.50%, due 10/01/2013 | | | 2,000 | | | | 2,195 | | |
| Electronic Components & Accessories (2.9%) | |
Amkor Technology, Inc.
7.75%, due 05/15/2013 (a) | | | 2,000 | | | | 1,725 | | |
Flextronics International, Ltd.
6.50%, due 05/15/2013 | | | 1,000 | | | | 1,050 | | |
Tyco International Group SA
5.88%, due 11/01/2004 | | | 2,000 | | | | 2,000 | | |
| 6.38%, due 02/15/2006 | | | 2,000 | | | | 2,088 | | |
| 6.00%, due 11/15/2013 | | | 4,000 | | | | 4,370 | | |
| Environmental Services (0.5%) | |
Allied Waste North America
6.50%, due 11/15/2010 | | | 1,000 | | | | 962 | | |
Allied Waste North America, Inc.
7.88%, due 04/15/2013 | | | 1,000 | | | | 1,017 | | |
| Food & Kindred Products (2.0%) | |
Bunge Ltd Finance Corp.
4.38%, due 12/15/2008 | | | 2,000 | | | | 2,021 | | |
Del Monte Corp.
8.63%, due 12/15/2012 | | | 3,000 | | | | 3,382 | | |
General Mills, Inc.
6.00%, due 02/15/2012 | | | 1,250 | | | | 1,360 | | |
Kraft Foods, Inc.
4.00%, due 10/01/2008 | | | 1,000 | | | | 1,011 | | |
| Food Stores (1.1%) | |
Safeway, Inc.
7.25%, due 02/01/2031 | | | 2,000 | | | | 2,256 | | |
Stater Brothers Holdings
8.13%, due 06/15/2012 (a) | | | 2,000 | | | | 2,120 | | |
| Gas Production & Distribution (1.4%) | |
Northern Border Partners-LP, Series A
8.88%, due 06/15/2010 | | | 1,000 | | | | 1,205 | | |
Northwest Pipeline Corp.
8.13%, due 03/01/2010 | | | 2,000 | | | | 2,242 | | |
Dynegy-Roseton/Danskammer,
Series 2001, Class B
7.67%, due 11/08/2016 | | | 2,000 | | | | 1,925 | | |
| | | Principal | | Value | |
| Health Services (2.1%) | |
Extendicare Health Services, Inc.
6.88%, due 05/01/2014 (a) | | $ | 3,000 | | | $ | 3,082 | | |
Manor Care, Inc.
6.25%, due 05/01/2013 | | | 2,000 | | | | 2,146 | | |
Mariner Health Care, Inc., 144A
8.25%, due 12/15/2013 | | | 1,000 | | | | 1,135 | | |
NeighborCare, Inc.
6.88%, due 11/15/2013 | | | 1,500 | | | | 1,567 | | |
| Holding & Other Investment Offices (2.1%) | |
Developers Diversified Realty Corp. REIT
3.88%, due 01/30/2009 | | | 3,000 | | | | 2,955 | | |
Felcor Lodging, LP REIT
10.00%, due 09/15/2008 | | | 80 | | | | 84 | | |
iStar Financial, Inc., Series B
5.70%, due 03/01/2014 | | | 1,500 | | | | 1,537 | | |
iStar Financial, Inc., Series B, 144A
4.88%, due 01/15/2009 | | | 1,000 | | | | 1,021 | | |
Simon Property Group, LP REIT
3.75%, due 01/30/2009 | | | 1,000 | | | | 987 | | |
Ventas Realty, LP/Ventas Capital Corp., 144A
6.63%, due 10/15/2014 | | | 1,500 | | | | 1,530 | | |
| Hotels & Other Lodging Places (2.5%) | |
Hilton Hotels Corp.
7.63%, due 12/01/2012 (a) | | | 2,000 | | | | 2,353 | | |
John Q. Hammons Hotels, Inc., Series B
8.88%, due 05/15/2012 | | | 1,500 | | | | 1,725 | | |
Mandalay Resort Group
6.38%, due 12/15/2011 | | | 1,000 | | | | 1,041 | | |
Station Casinos, Inc.
6.00%, due 04/01/2012 | | | 1,000 | | | | 1,045 | | |
| 6.50%, due 02/01/2014 | | | 2,000 | | | | 2,110 | | |
Venetian Casino Resort LLC
11.00%, due 06/15/2010 | | | 1,000 | | | | 1,149 | | |
| Industrial Machinery & Equipment (1.2%) | |
Dresser-Rand Group, 144A
7.38%, due 11/01/2014 | | | 3,000 | | | | 3,143 | | |
Grant Prideco, Inc.
9.63%, due 12/01/2007 | | | 500 | | | | 565 | | |
Terex Corp.
7.38%, due 01/15/2014 | | | 1,000 | | | | 1,070 | | |
| Lumber & Wood Products (0.8%) | |
Georgia-Pacific Corp.
8.88%, due 02/01/2010 | | | 1,000 | | | | 1,178 | | |
Scotia Pacific Co. LLC, Series 1998-E, Class A2
7.11%, due 01/20/2014 | | | 2,000 | | | | 1,760 | | |
The notes to the financial statements are an integral part of this report.
Transamerica IDEX Mutual Funds
Annual Report 2004
7
TA IDEX Transamerica Conservative High-Yield Bond
SCHEDULE OF INVESTMENTS (continued)
At October 31, 2004
(all amounts except share amounts in thousands)
| | | Principal | | Value | |
| Management Services (0.3%) | |
Corrections Corp. of America
7.50%, due 05/01/2011 | | $ | 1,000 | | | $ | 1,081 | | |
| Medical Instruments & Supplies (0.4%) | |
Bard (C.R.), Inc.
6.70%, due 12/01/2026 | | | 1,500 | | | | 1,656 | | |
| Metal Cans & Shipping Containers (0.9%) | |
Ball Corp.
6.88%, due 12/15/2012 | | | 2,000 | | | | 2,180 | | |
Crown European Holdings SA
10.88%, due 03/01/2013 | | | 1,000 | | | | 1,188 | | |
| Metal Mining (0.3%) | |
Rio Tinto Finance USA, Ltd.
2.63%, due 09/30/2008 | | | 1,000 | | | | 966 | | |
| Mining (2.2%) | |
Massey Energy Co.
6.63%, due 11/15/2010 | | | 3,000 | | | | 3,128 | | |
Peabody Energy Corp.
6.88%, due 03/15/2013 | | | 3,000 | | | | 3,293 | | |
| 5.88%, due 04/15/2016 | | | 2,000 | | | | 2,040 | | |
| Mortgage Bankers & Brokers (1.1%) | |
Crystal US Holdings 3 LLC/Crystal
US Sub 3 Corp., 144A
0.00%, due 10/01/2014 (e) | | | 2,000 | | | | 1,265 | | |
Jostens IH Corp., 144A
7.63%, due 10/01/2012 | | | 1,000 | | | | 1,035 | | |
Mantis Reef, Ltd., 144A
4.69%, due 11/14/2008 | | | 2,000 | | | | 2,011 | | |
| Motion Pictures (1.1%) | |
Time Warner Entertainment Co., LP
10.15%, due 05/01/2012 | | | 1,000 | | | | 1,311 | | |
| 8.38%, due 07/15/2033 | | | 1,500 | | | | 1,888 | | |
Time Warner, Inc.
7.75%, due 06/15/2005 | | | 1,000 | | | | 1,028 | | |
| 7.48%, due 01/15/2008 | | | 1,500 | | | | 1,653 | | |
| Motor Vehicles, Parts & Supplies (0.4%) | |
TRW Automotive, Inc.
11.00%, due 02/15/2013 (a) | | | 1,300 | | | | 1,547 | | |
| Oil & Gas Extraction (5.8%) | |
Chesapeake Energy Corp.
8.38%, due 11/01/2008 | | | 1,000 | | | | 1,090 | | |
| 8.13%, due 04/01/2011 | | | 71 | | | | 78 | | |
| 7.50%, due 09/15/2013 | | | 1,000 | | | | 1,115 | | |
EnCana Corp.
6.50%, due 08/15/2034 | | | 1,000 | | | | 1,089 | | |
| | | Principal | | Value | |
| Oil & Gas Extraction (continued) | | | |
Forest Oil Corp.
8.00%, due 12/15/2011 | | $ | 500 | | | $ | 570 | | |
| 7.75%, due 05/01/2014 | | | 1,000 | | | | 1,095 | | |
Halliburton Co., 144A
2.86%, due 01/26/2007 (b) | | | 3,000 | | | | 3,001 | | |
Kerr-McGee Corp.
7.88%, due 09/15/2031 | | | 1,500 | | | | 1,833 | | |
Key Energy Services, Inc.
6.38%, due 05/01/2013 | | | 1,000 | | | | 1,031 | | |
Louisiana Land & Exploration
7.63%, due 04/15/2013 | | | 2,000 | | | | 2,376 | | |
Newfield Exploration Co., 144A
6.63%, due 09/01/2014 | | | 1,500 | | | | 1,609 | | |
Petroleum Geo-Services ASA
10.00%, due 11/05/2010 | | | 2,500 | | | | 2,850 | | |
Pride International, Inc., 144A
7.38%, due 07/15/2014 | | | 2,000 | | | | 2,250 | | |
XTO Energy, Inc.
6.25%, due 04/15/2013 | | | 2,000 | | | | 2,210 | | |
| Paper & Allied Products (1.1%) | | | |
Cascades, Inc.
7.25%, due 02/15/2013 | | | 2,000 | | | | 2,160 | | |
Graphic Packaging International Corp.
8.50%, due 08/15/2011 | | | 2,000 | | | | 2,255 | | |
| Paper & Paper Products (1.1%) | | | |
Boise Cascade LLC, 144A
7.13%, due 10/15/2014 | | | 2,000 | | | | 2,088 | | |
MDP Acquisitions PLC
9.63%, due 10/01/2012 | | | 2,000 | | | | 2,280 | | |
| Paperboard Containers & Boxes (0.9%) | | | |
Jefferson Smurfit Corp., US
7.50%, due 06/01/2013 | | | 2,000 | | | | 2,180 | | |
Jefferson Smurfit-Stone Container Corp.
8.25%, due 10/01/2012 | | | 1,000 | | | | 1,110 | | |
| Personal Credit Institutions (1.4%) | | | |
Capital One Financial Corp.
6.25%, due 11/15/2013 | | | 3,000 | | | | 3,243 | | |
Erac USA Finance Co., 144A
7.95%, due 12/15/2009 | | | 1,000 | | | | 1,181 | | |
General Motors Acceptance Corp.
5.13%, due 05/09/2008 (a) | | | 1,000 | | | | 1,015 | | |
| Personal Services (0.6%) | | | |
Service Corp. International
7.70%, due 04/15/2009 | | | 2,000 | | | | 2,195 | | |
The notes to the financial statements are an integral part of this report.
Transamerica IDEX Mutual Funds
Annual Report 2004
8
TA IDEX Transamerica Conservative High-Yield Bond
SCHEDULE OF INVESTMENTS (continued)
At October 31, 2004
(all amounts except share amounts in thousands)
| | | Principal | | Value | |
| Petroleum Refining (2.3%) | |
Amerada Hess Corp.
7.88%, due 10/01/2029 | | $ | 1,500 | | | $ | 1,791 | | |
Giant Industries, Inc.
8.00%, due 05/15/2014 | | | 1,500 | | | | 1,564 | | |
Premcor Refining Group (The), Inc.
6.75%, due 02/01/2011 | | | 2,000 | | | | 2,165 | | |
| 6.13%, due 05/01/2011 | | | 1,000 | | | | 1,055 | | |
Tesoro Petroleum Corp.
8.00%, due 04/15/2008 | | | 2,000 | | | | 2,175 | | |
| Pharmaceuticals (0.6%) | |
Leiner Health Products, Inc., 144A
11.00%, due 06/01/2012 | | | 2,000 | | | | 2,168 | | |
| Primary Metal Industries (0.8%) | |
International Steel Group, Inc.
6.50%, due 04/15/2014 | | | 1,000 | | | | 1,070 | | |
U.S. Steel Corp.
9.75%, due 05/15/2010 | | | 1,682 | | | | 1,926 | | |
| Printing & Publishing (3.2%) | |
American Color Graphics, Inc.
10.00%, due 06/15/2010 | | | 2,000 | | | | 1,530 | | |
Dex Media East LLC/Dex
Media East Finance Co.
9.88%, due 11/15/2009 | | | 1,000 | | | | 1,150 | | |
Dex Media West LLC/Dex
Media Finance Co., Series B
8.50%, due 08/15/2010 | | | 2,000 | | | | 2,280 | | |
Dex Media, Inc.
8.00%, due 11/15/2013 | | | 1,000 | | | | 1,070 | | |
Houghton Mifflin Co.
9.88%, due 02/01/2013 (a) | | | 2,000 | | | | 2,170 | | |
Primedia, Inc.
8.88%, due 05/15/2011 | | | 2,000 | | | | 2,085 | | |
Quebecor World Capital Corp.
4.88%, due 11/15/2008 | | | 2,000 | | | | 1,995 | | |
| Radio & Television Broadcasting (2.1%) | |
British Sky Broadcasting Group PLC
6.88%, due 02/23/2009 | | | 1,000 | | | | 1,111 | | |
CanWest Media, Inc.
10.63%, due 05/15/2011 | | | 1,000 | | | | 1,130 | | |
CanWest Media, Inc., Series B
7.63%, due 04/15/2013 | | | 1,000 | | | | 1,088 | | |
Susquehanna Media Co.
7.38%, due 04/15/2013 | | | 1,500 | | | | 1,586 | | |
Videotron Ltee
6.88%, due 01/15/2014 | | | 1,500 | | | | 1,575 | | |
| | | Principal | | Value | |
| Restaurants (0.3%) | | | |
Yum! Brands, Inc.
7.70%, due 07/01/2012 | | $ | 1,000 | | | $ | 1,194 | | |
| Rubber & Misc. Plastic Products (0.5%) | | | |
Sealed Air Corp., 144A
5.38%, due 04/15/2008 | | | 2,000 | | | | 2,091 | | |
| Savings Institutions (0.5%) | | | |
Washington Mutual, Inc.
4.00%, due 01/15/2009 (a) | | | 2,000 | | | | 2,011 | | |
| Security & Commodity Brokers (0.5%) | | | |
Goldman Sachs Group, Inc.
5.15%, due 01/15/2014 | | | 1,000 | | | | 1,015 | | |
Morgan Stanley
4.75%, due 04/01/2014 | | | 1,000 | | | | 980 | | |
| Stone, Clay & Glass Products (0.9%) | | | |
Anchor Glass Container Corp., Series B
11.00%, due 02/15/2013 | | | 1,000 | | | | 1,115 | | |
Owens-Brockway
7.75%, due 05/15/2011 | | | 1,000 | | | | 1,088 | | |
Owens-Brockway Glass Container
8.75%, due 11/15/2012 | | | 1,000 | | | | 1,128 | | |
| Telecommunications (6.7%) | | | |
AT&T Corp.
8.05%, due 11/15/2011 | | | 3,000 | | | | 3,439 | | |
BellSouth Corp.
5.20%, due 09/15/2014 | | | 2,000 | | | | 2,040 | | |
| 6.55%, due 06/15/2034 | | | 1,000 | | | | 1,069 | | |
Deutsche Telekom International Finance BV
8.75%, due 06/15/2030 (h) | | | 2,000 | | | | 2,639 | | |
MCI, Inc.
5.91%, due 05/01/2007 | | | 2,000 | | | | 1,995 | | |
Nextel Communications, Inc.
5.95%, due 03/15/2014 | | | 5,000 | | | | 5,113 | | |
Qwest Capital Funding, Inc.
7.00%, due 08/03/2009 (a) | | | 2,000 | | | | 1,905 | | |
| 7.90%, due 08/15/2010 (a) | | | 2,000 | | | | 1,935 | | |
Rogers Wireless Communications, Inc.
6.38%, due 03/01/2014 | | | 2,500 | | | | 2,388 | | |
Rural Cellular Corp., 144A
8.25%, due 03/15/2012 | | | 1,000 | | | | 1,050 | | |
SBC Communications, Inc.
6.15%, due 09/15/2034 | | | 2,000 | | | | 2,020 | | |
| Textile Mill Products (0.7%) | | | |
INVISTA, 144A
9.25%, due 05/01/2012 (a) | | | 2,500 | | | | 2,750 | | |
The notes to the financial statements are an integral part of this report.
Transamerica IDEX Mutual Funds
Annual Report 2004
9
TA IDEX Transamerica Conservative High-Yield Bond
SCHEDULE OF INVESTMENTS (continued)
At October 31, 2004
(all amounts except share amounts in thousands)
| | | Principal | | Value | |
| Tobacco Products (0.6%) | |
Philip Morris Cos., Inc.
7.20%, due 02/01/2007 | | $ | 2,256 | | | $ | 2,396 | | |
| Transportation Equipment (1.2%) | |
Trinity Industries, Inc.
6.50%, due 03/15/2014 | | | 2,500 | | | | 2,488 | | |
Westinghouse Air Brake Co.
6.88%, due 07/31/2013 | | | 2,000 | | | | 2,085 | | |
| Trucking & Warehousing (0.5%) | |
Iron Mountain, Inc.
6.63%, due 01/01/2016 | | | 2,000 | | | | 1,990 | | |
| Water Transportation (0.9%) | |
Royal Caribbean Cruises, Ltd.
7.00%, due 10/15/2007 | | | 1,000 | | | | 1,083 | | |
| 8.75%, due 02/02/2011 | | | 2,000 | | | | 2,380 | | |
| Total Corporate Debt Securities (cost: $343,965) | | | | | | | 363,572 | | |
| | | Shares | | Value | |
| PREFERRED STOCKS (0.5%) | |
| Holding & Other Investment Offices (0.5%) | |
| Duke Realty Corp. REIT | | | 40,000 | | | | 2,134 | | |
| Total Preferred Stocks (cost: $2,008) | | | | | | | 2,134 | | |
| COMMON STOCKS (0.0%) | |
| Air Transportation (0.0%) | |
| US Airways Group, Inc.–Class A (f) | | | 1,024 | | | | 1 | | |
| Printing & Publishing (0.0%) | |
| Golden Books Family Entertainment, Inc. (f) | | | 63,750 | | | | – | (d) | |
| Total Common Stocks (cost: $168) | | | | | | | 1 | | |
| | | Principal | | Value | |
| SECURITY LENDING COLLATERAL (8.0%) | |
| Debt (7.5%) | |
| Bank Notes (1.4%) | |
Bank of America
1.77%, due 12/03/2004 | | $ | 1,507 | | | | 1,507 | | |
| 1.88%, due 12/23/2004 | | | 503 | | | | 503 | | |
| 1.77%, due 01/18/2005 | | | 1,005 | | | | 1,005 | | |
Canadian Imperial Bank of Commerce
1.86%, due 11/04/2004 | | | 2,261 | | | | 2,261 | | |
Credit Suisse First Boston Corp.
1.83%, due 09/09/2005 | | | 251 | | | | 251 | | |
| | | Principal | | Value | |
| Commercial Paper (0.8%) | | | |
Clipper Receivables Corp.
1.79%, due 11/12/2004 | | $ | 748 | | | $ | 748 | | |
Delaware Funding Corp. 144A
1.85%, due 11/19/2004 | | | 251 | | | | 251 | | |
Falcon Asset Securitization Corp. 144A
1.78%, due 11/04/2004 | | | 750 | | | | 750 | | |
| 1.75%, due 11/10/2004 | | | 1,005 | | | | 1,005 | | |
Galaxy Funding 144A
1.88%, due 11/22/2004 | | | 251 | | | | 251 | | |
| Euro Dollar Terms (3.5%) | | | |
Bank of Montreal
1.88%, due 11/24/2004 | | | 2,380 | | | | 2,380 | | |
BNP Paribas
1.77%, due 11/10/2004 | | | 1,256 | | | | 1,256 | | |
| 1.80%, due 11/23/2004 | | | 1,005 | | | | 1,005 | | |
| 1.98%, due 12/27/2004 | | | 1,005 | | | | 1,005 | | |
Calyon
1.70%, due 11/24/2004 | | | 133 | | | | 133 | | |
Citigroup
2.06%, due 01/25/2005 | | | 2,512 | | | | 2,512 | | |
Den Danske Bank
1.82%, due 11/19/2004 | | | 1,256 | | | | 1,256 | | |
Dexia Group
2.04%, due 01/21/2005 | | | 583 | | | | 583 | | |
HBOS Halifax Bank of Scotland
2.03%, due 01/21/2005 | | | 503 | | | | 503 | | |
Royal Bank of Scotland
2.01%, due 01/20/2005 | | | 1,005 | | | | 1,005 | | |
Toronto Dominion Bank
1.70%, due 11/08/2004 | | | 502 | | | | 502 | | |
Wells Fargo
1.87%, due 11/22/2004 | | | 1,256 | | | | 1,256 | | |
| Promissory Notes (0.7%) | | | |
Goldman Sachs Group Inc.
1.90%, due 12/29/2004 | | | 1,055 | | | | 1,055 | | |
| 1.88%, due 01/27/2005 | | | 1,759 | | | | 1,759 | | |
| Repurchase Agreements (1.1%) | | | |
Merrill Lynch & Co., Inc. 1.92%
Repurchase Agreement dated
10/29/2004 to be repurchased at $4,020
on 11/1/2004 (g) | | | 4,020 | | | | 4,020 | | |
The notes to the financial statements are an integral part of this report.
Transamerica IDEX Mutual Funds
Annual Report 2004
10
TA IDEX Transamerica Conservative High-Yield Bond
SCHEDULE OF INVESTMENTS (continued)
At October 31, 2004
(all amounts except share amounts in thousands)
| | | Shares | | Value | |
| Investment Companies (0.5%) | |
| Money Market Funds (0.5%) | |
Merrill Lynch Premier Institutional Fund
1-day yield of 1.71% | | | 1,235,927 | | | $ | 1,236 | | |
Merrimac Cash Fund, Premium Class
1-day yield of 1.46% | | | 904,439 | | | | 904 | | |
| Total Security Lending Collateral (cost: $30,902) | | | | | 30,902 | | |
| Total Investment Securities (cost: $381,657) | | | | $ | 401,456 | | |
| | | | | Value | |
| SUMMARY: | |
| Investments, at value | | | 104.5 | % | | $ | 401,456 | | |
| Liabilities in excess of other assets | | | (4.5 | )% | | | (17,432 | ) | |
| Net assets | | | 100.0 | % | | $ | 384,024 | | |
NOTES TO SCHEDULE OF INVESTMENTS:
(a) At October 31, 2004, all or a portion of this security is on loan (see Note 1). The value at October 31, 2004, of all securities on loan is $30,189.
(b) Floating or variable rate note. Rate is listed as of October 31, 2004.
(c) Securities are currently in default on interest payments.
(d) Value is less than $1.
(e) Securities are stepbonds. Crystal US Holdings 3 LLC has a zero coupon until 10/01/2009, thereafter a coupon rate 10.0%.
(f) No dividends were paid during the preceding twelve months.
(g) Cash collateral for the Repurchase Agreements, valued at $4,113, that serve as collateral for securities lending are invested in corporate bonds with interest rates and maturity dates ranging from 0.00%–9.75% and 05/15/2005–9/15/2033, respectively.
(h) Securities are stepbonds. Coupon steps up by 50 BP if rating is downgraded by Standard and Poor's or Moody's below A. If rating is then raised above BBB/Baa coupon steps down by 50 BP.
DEFINITIONS:
144A 144A Securities are registered pursuant to the rule 144A of the Securities Act of 1933. These securities are deemed to be liquid for purposes of compliance limitations on holdings of illiquid securities and may be resold as transactions exempt from registration normally to qualified institutional buyers. At October 31, 2004 these securities aggregated $53,778 or 14.0% of the net assets of the Fund.
REIT Real Estate Investment Trust
The notes to the financial statements are an integral part of this report.
Transamerica IDEX Mutual Funds
Annual Report 2004
11
TA IDEX Transamerica Conservative High-Yield Bond
STATEMENT OF ASSETS AND LIABILITIES
At October 31, 2004
(all amounts except per share amounts in thousands)
| Assets: | | | |
Investment securities, at value (cost: $381,657)
(including securities loaned of $30,189) | | $ | 401,456 | | |
| Cash | | | 8,773 | | |
| Receivables: | |
| Investment securities sold | | | 468 | | |
| Shares of beneficial interest sold | | | 100 | | |
| Interest | | | 7,037 | | |
| Other | | | 19 | | |
| | | | 417,853 | | |
| Liabilities: | | | |
| Investment securities purchased | | | 1,996 | | |
| Accounts payable and accrued liabilities: | |
| Shares of beneficial interest redeemed | | | 446 | | |
| Management and advisory fees | | | 194 | | |
| Distribution fees | | | 154 | | |
| Transfer agent fees | | | 36 | | |
| Payable for collateral for securities on loan | | | 30,902 | | |
| Other | | | 101 | | |
| | | | 33,829 | | |
| Net Assets | | $ | 384,024 | | |
| Net Assets Consist of: | | | |
Shares of beneficial interest, unlimited shares
authorized, no par value | | $ | 376,087 | | |
| Undistributed net investment income (loss) | | | 844 | | |
Accumulated net realized gain (loss) from investment
securities | | | (12,706 | ) | |
Net unrealized appreciation (depreciation) on
investment securities | | | 19,799 | | |
| Net Assets | | $ | 384,024 | | |
| Net Assets by Class: | | | |
| Class A | | $ | 309,223 | | |
| Class B | | | 49,422 | | |
| Class C | | | 25,379 | | |
| Shares Outstanding: | | | |
| Class A | | | 33,003 | | |
| Class B | | | 5,277 | | |
| Class C | | | 2,710 | | |
| Net Asset Value Per Share: | | | |
| Class A | | $ | 9.37 | | |
| Class B | | | 9.37 | | |
| Class C | | | 9.36 | | |
| Maximum Offering Price Per Share (a): | | | |
| Class A | | $ | 9.84 | | |
(a) Includes the maximum selling commission (represented as a percentage of offering price) which is reduced on certain levels of sales as set forth in the Prospectus. Net asset value per share for Classes B and C shares represents offering price. The redemption price for Classes B and C shares equals net asset value less any applicable contingent deferred sales charge.
STATEMENT OF OPERATIONS
For the year ended October 31, 2004
(all amounts in thousands)
| Investment Income: | | | |
| Interest | | $ | 23,920 | | |
| Dividends | | | 160 | | |
| Income from loaned securities–net | | | 89 | | |
| | | | 24,169 | | |
| Expenses: | | | |
| Management and advisory fees | | | 2,144 | | |
| Transfer agent fees: | |
| Class A | | | 153 | | |
| Class B | | | 22 | | |
| Class C | | | 5 | | |
| Class C2 | | | 6 | | |
| Class M | | | 2 | | |
| Printing and shareholder reports | | | 22 | | |
| Custody fees | | | 60 | | |
| Administration fees | | | 54 | | |
| Legal fees | | | 12 | | |
| Audit and accounting fees | | | 26 | | |
| Trustees fees | | | 21 | | |
| Registration fees: | |
| Class A | | | 62 | | |
| Class B | | | 7 | | |
| Class C | | | 12 | | |
| Class C2 | | | 2 | | |
| Class M | | | 1 | | |
| Other | | | 14 | | |
| Distribution and service fees: | |
| Class A | | | 980 | | |
| Class B | | | 497 | | |
| Class C | | | 141 | | |
| Class C2 | | | 91 | | |
| Class M | | | 40 | | |
| Total expenses | | | 4,374 | | |
| Net Investment Income (Loss) | | | 19,795 | | |
| Net Realized and Unrealized Gain (Loss): | | | |
| Realized gain (loss) from investment securities | | | 1,691 | | |
Increase (decrease) in unrealized appreciation
(depreciation) on investment securities | | | 8,022 | | |
| Net Gain (Loss) on Investment Securities | | | 9,713 | | |
Net Increase (Decrease) in Net Assets Resulting
from Operations | | $ | 29,508 | | |
The notes to the financial statements are an integral part of this report.
Transamerica IDEX Mutual Funds
Annual Report 2004
12
TA IDEX Transamerica Conservative High-Yield Bond
STATEMENTS OF CHANGES IN NET ASSETS
For the years ended
(all amounts in thousands)
| | | October 31,
2004 | | October 31,
2003 | |
| Increase (Decrease) in Net Assets From: | |
| Operations: | |
| Net investment income (loss) | | $ | 19,795 | | | $ | 11,430 | | |
Net realized gain (loss) from
investment securities | | | 1,691 | | | | (4,706 | ) | |
Net unrealized appreciation
(depreciation) on investment
securities | | | 8,022 | | | | 27,479 | | |
| | | | 29,508 | | | | 34,203 | | |
| Distributions to Shareholders: | |
| From net investment income: | |
| Class A | | | (15,855 | ) | | | (7,408 | ) | |
| Class B | | | (2,484 | ) | | | (2,630 | ) | |
| Class C | | | (692 | ) | | | (198 | ) | |
| Class C2 | | | (457 | ) | | | (796 | ) | |
| Class M | | | (230 | ) | | | (368 | ) | |
| | | | (19,718 | ) | | | (11,400 | ) | |
| Capital Share Transactions: | |
| Proceeds from shares sold: | |
| Class A | | | 123,099 | | | | 182,483 | | |
| Class B | | | 11,418 | | | | 28,567 | | |
| Class C | | | 6,907 | | | | 9,354 | | |
| Class C2 | | | 3,491 | | | | 14,942 | | |
| Class M | | | 1,288 | | | | 1,902 | | |
| | | | 146,203 | | | | 237,248 | | |
Dividends and distributions
reinvested: | |
| Class A | | | 15,278 | | | | 6,615 | | |
| Class B | | | 1,364 | | | | 1,509 | | |
| Class C | | | 328 | | | | 101 | | |
| Class C2 | | | 139 | | | | 305 | | |
| Class M | | | 167 | | | | 256 | | |
| | | | 17,276 | | | | 8,786 | | |
| Cost of shares redeemed: | |
| Class A | | | (30,327 | ) | | | (70,217 | ) | |
| Class B | | | (16,380 | ) | | | (15,455 | ) | |
| Class C | | | (6,611 | ) | | | (1,404 | ) | |
| Class C2 | | | (10,227 | ) | | | (5,727 | ) | |
| Class M | | | (2,569 | ) | | | (3,107 | ) | |
| | | | (66,114 | ) | | | (95,910 | ) | |
| Class level exchanges: | |
| Class C | | | 15,462 | | | | – | | |
| Class C2 | | | (10,695 | ) | | | – | | |
| Class M | | | (4,767 | ) | | | – | | |
| | | | – | | | | – | | |
| | | | 97,365 | | | | 150,124 | | |
| Net increase (decrease) in net assets | | | 107,155 | | | | 172,927 | | |
| Net Assets: | |
| Beginning of year | | | 276,869 | | | | 103,942 | | |
| End of year | | $ | 384,024 | | | $ | 276,869 | | |
Undistributed Net Investment Income
(Loss) | | $ | 844 | | | $ | 625 | | |
| | | October 31,
2004 | | October 31,
2003 | |
| Share Activity: | |
| Shares issued: | |
| Class A | | | 13,311 | | | | 21,036 | | |
| Class B | | | 1,243 | | | | 3,332 | | |
| Class C | | | 756 | | | | 1,074 | | |
| Class C2 | | | 377 | | | | 1,749 | | |
| Class M | | | 141 | | | | 219 | | |
| | | | 15,828 | | | | 27,410 | | |
Shares issued–reinvested from
distributions: | |
| Class A | | | 1,673 | | | | 767 | | |
| Class B | | | 149 | | | | 176 | | |
| Class C | | | 36 | | | | 12 | | |
| Class C2 | | | 15 | | | | 36 | | |
| Class M | | | 18 | | | | 30 | | |
| | | | 1,891 | | | | 1,021 | | |
| Shares redeemed: | |
| Class A | | | (3,306 | ) | | | (8,089 | ) | |
| Class B | | | (1,790 | ) | | | (1,788 | ) | |
| Class C | | | (722 | ) | | | (160 | ) | |
| Class C2 | | | (1,118 | ) | | | (660 | ) | |
| Class M | | | (280 | ) | | | (362 | ) | |
| | | | (7,216 | ) | | | (11,059 | ) | |
| Class level exchanges: | |
| Class C | | | 1,714 | | | | – | | |
| Class C2 | | | (1,199 | ) | | | – | | |
| Class M | | | (515 | ) | | | – | | |
| | | | – | | | | – | | |
Net increase (decrease) in shares
outstanding: | |
| Class A | | | 11,678 | | | | 13,714 | | |
| Class B | | | (398 | ) | | | 1,720 | | |
| Class C | | | 1,784 | | | | 926 | | |
| Class C2 | | | (1,925 | ) | | | 1,125 | | |
| Class M | | | (636 | ) | | | (113 | ) | |
| | | | 10,503 | | | | 17,372 | | |
The notes to the financial statements are an integral part of this report.
Transamerica IDEX Mutual Funds
Annual Report 2004
13
TA IDEX Transamerica Conservative High-Yield Bond
FINANCIAL HIGHLIGHTS
| | | | | For a share of beneficial interest outstanding throughout each period | |
| | | | | Net Asset | | Investment Operations | | Distributions | | Net Asset | |
| | | For the
Period
Ended (d)(g) | | Value,
Beginning
of Period | | Net
Investment
Income (Loss) | | Net Realized
and Unrealized
Gain (Loss) | | Total
Operations | | From Net
Investment
Income | | From Net
Realized
Gains | | Total
Distributions | | Value,
End
of Period | |
| Class A | | 10/31/2004 | | $ | 9.08 | | | $ | 0.52 | | | $ | 0.29 | | | $ | 0.81 | | | $ | (0.52 | ) | | $ | – | | | $ | (0.52 | ) | | $ | 9.37 | | |
| | | 10/31/2003 | | | 7.93 | | | | 0.57 | | | | 1.16 | | | | 1.73 | | | | (0.58 | ) | | | – | | | | (0.58 | ) | | | 9.08 | | |
| | | 10/31/2002 | | | 9.26 | | | | 0.57 | | | | (1.31 | ) | | | (0.74 | ) | | | (0.59 | ) | | | – | | | | (0.59 | ) | | | 7.93 | | |
| | | 10/31/2001 | | | 9.24 | | | | 0.72 | | | | 0.01 | | | | 0.73 | | | | (0.71 | ) | | | – | | | | (0.71 | ) | | | 9.26 | | |
| | | 10/31/2000 | | | 9.67 | | | | 0.69 | | | | (0.37 | ) | | | 0.32 | | | | (0.69 | ) | | | (0.06 | ) | | | (0.75 | ) | | | 9.24 | | |
| Class B | | 10/31/2004 | | | 9.08 | | | | 0.46 | | | | 0.29 | | | | 0.75 | | | | (0.46 | ) | | | – | | | | (0.46 | ) | | | 9.37 | | |
| | | 10/31/2003 | | | 7.93 | | | | 0.51 | | | | 1.17 | | | | 1.68 | | | | (0.53 | ) | | | – | | | | (0.53 | ) | | | 9.08 | | |
| | | 10/31/2002 | | | 9.26 | | | | 0.52 | | | | (1.32 | ) | | | (0.80 | ) | | | (0.53 | ) | | | – | | | | (0.53 | ) | | | 7.93 | | |
| | | 10/31/2001 | | | 9.24 | | | | 0.57 | | | | 0.10 | | | | 0.67 | | | | (0.65 | ) | | | – | | | | (0.65 | ) | | | 9.26 | | |
| | | 10/31/2000 | | | 9.67 | | | | 0.63 | | | | (0.37 | ) | | | 0.26 | | | | (0.63 | ) | | | (0.06 | ) | | | (0.69 | ) | | | 9.24 | | |
| Class C | | 10/31/2004 | | | 9.08 | | | | 0.46 | | | | 0.28 | | | | 0.74 | | | | (0.46 | ) | | | – | | | | (0.46 | ) | | | 9.36 | | |
| | | 10/31/2003 | | | 8.08 | | | | 0.51 | | | | 1.02 | | | | 1.53 | | | | (0.53 | ) | | | – | | | | (0.53 | ) | | | 9.08 | | |
| | | | | | | Ratios/Supplemental Data | |
| | | For the
Period | | Total | | Net Assets,
End of
Period | | Ratio of Expenses
to Average
Net Assets (a) | | Net Investment
Income (Loss)
to Average | | Portfolio
Turnover | |
| | | Ended (g) | | Return (c) | | (000's) | | Net (e) | | Total (f) | | Net Assets (a) | | Rate (b) | |
| Class A | | 10/31/2004 | | | 9.23 | % | | $ | 309,223 | | | | 1.08 | % | | | 1.08 | % | | | 5.67 | % | | | 49 | % | |
| | | 10/31/2003 | | | 22.74 | | | | 193,708 | | | | 1.22 | | | | 1.22 | | | | 6.57 | | | | 46 | | |
| | | 10/31/2002 | | | (8.48 | ) | | | 60,332 | | | | 1.35 | | | | 1.35 | | | | 6.61 | | | | 64 | | |
| | | 10/31/2001 | | | 8.12 | | | | 50,755 | | | | 1.41 | | | | 1.41 | | | | 7.35 | | | | 16 | | |
| | | 10/31/2000 | | | 3.37 | | | | 49,259 | | | | 1.36 | | | | 1.36 | | | | 7.34 | | | | 11 | | |
| Class B | | 10/31/2004 | | | 8.52 | | | | 49,422 | | | | 1.72 | | | | 1.72 | | | | 5.05 | | | | 49 | | |
| | | 10/31/2003 | | | 21.94 | | | | 51,511 | | | | 1.87 | | | | 1.87 | | | | 5.92 | | | | 46 | | |
| | | 10/31/2002 | | | (9.03 | ) | | | 31,336 | | | | 2.00 | | | | 2.00 | | | | 5.96 | | | | 64 | | |
| | | 10/31/2001 | | | 7.45 | | | | 35,471 | | | | 2.06 | | | | 2.06 | | | | 6.70 | | | | 16 | | |
| | | 10/31/2000 | | | 2.74 | | | | 13,808 | | | | 2.01 | | | | 2.01 | | | | 6.69 | | | | 11 | | |
| Class C | | 10/31/2004 | | | 8.41 | | | | 25,379 | | | | 1.78 | | | | 1.78 | | | | 4.95 | | | | 49 | | |
| | | 10/31/2003 | | | 19.52 | | | | 8,403 | | | | 1.87 | | | | 1.87 | | | | 5.92 | | | | 46 | | |
| NOTES TO FINANCIAL HIGHLIGHTS | |
(a) Annualized.
(b) Not annualized for periods of less than one year.
(c) Total Return has been calculated for the applicable period without deduction of a sales load, if any, on an initial purchase. Periods of less than one year are not annualized.
(d) Per share information is calculated based on average number of shares outstanding for the years ended 10/31/2001, 10/31/2002, 10/31/2003 and 10/31/2004.
(e) Ratio of Net Expenses to Average Net Assets is net of fee waivers and reimbursements by the investment adviser, if any (see note 2).
(f) Ratio of Total Expenses to Average Net Assets includes all expenses before fee waivers and reimbursements by the investment adviser.
(g) The inception date for the Fund's offering of share Class L was November 11, 2002. Class L was renamed Class C on March 1, 2004 (see note 1).
The notes to the financial statements are an integral part of this report.
Transamerica IDEX Mutual Funds
Annual Report 2004
14
TA IDEX Transamerica Conservative High-Yield Bond
NOTES TO FINANCIAL STATEMENTS
At October 31, 2004
(all amounts in thousands)
NOTE 1. ORGANIZATION AND SIGNIFICANT ACCOUNTING POLICIES
Transamerica IDEX Mutual Funds, formerly IDEX Mutual Funds, is a Massachusetts business trust registered under the Investment Company Act of 1940, as amended (the "1940 Act"), as an open-end management investment company. TA IDEX Transamerica Conservative High-Yield Bond ("the Fund"), part of Transamerica IDEX Mutual Funds, began operations on June 14, 1985.
On March 1, 2004, the Fund changed its name from IDEX Transamerica Conservative High-Yield Bond to TA IDEX Transamerica Conservative High-Yield Bond.
In the normal course of business, the Fund enters into contracts that contain a variety of representations and warranties, which provide general indemnifications. The Fund's maximum exposure under these arrangements is unknown, as this would involve future claims that may be made against the Fund and/or its affiliates that have not yet occurred. However, based on experience, the Fund expects the risk of loss to be remote.
See the Prospectus and Statement of Additional Information for a description of the Fund's investment objective.
In preparing the Fund's financial statements in accordance with accounting principles generally accepted in the United States of America ("GAAP"), estimates or assumptions (which could differ from actual results) may be used that affect reported amounts and disclosures. The following policies were consistently followed by the Fund, in accordance with GAAP.
Multiple class operations and expenses: The Fund currently offers three classes of shares, each with a public offering price that reflects different sales charges, if any, and expense levels. All shares designated as Class C shares prior to March 1, 2004, were renamed as Class C2 shares on that date. All shares designated as Class L shares prior to March 1, 2004, were renamed as Class C shares with different sales charges than the previous Class L shares. On June 15, 2004, Class C2 shares merged into Class C. On September 24, 2004, Class M shares merged into Class C. Class B shares will convert to Class A shares eight years after purchase. Income, non-class specific expenses and realized and unrealized gains and losses, are allocated daily to each class, based upon the value of shares outstanding method as permitted under Rule 18f-3 of the 1940 Act. Each class bears its own specific expenses as well as a portion of general, common expenses.
Class I shares of the Transamerica IDEX Mutual Funds were offered for investments to the strategic asset allocation funds of AEGON/Transamerica Series Fund, Inc. (ATSF); ATSF Asset Allocation–Conservative Portfolio, ATSF Asset Allocation–Growth Portfolio, ATSF Asset Allocation–Moderate Growth Portfolio and ATSF Asset Allocation–Moderate Portfolio on November 8, 2004.
Pricing of shares: The Fund prices its shares on the basis of the net asset value of each class of shares of the Fund, which is determined as of the close of the New York Stock Exchange ("NYSE") (generally 4:00 p.m. Eastern Time) on each day on which the NYSE is open for trading (other than a day on which there are insufficient changes in the value of the Fund's portfolio securities to materially affect the Fund's net asset value or a day on which no shares are tendered for redemption and no order to purchase any shares is received).
Security valuations: Fund investments traded on an exchange are valued at the closing price on the day of valuation on the exchange where the security is principally traded. With respect to securities traded on NASDAQ NMS, such closing price may be the last reported sales price or the NASDAQ Official Closing Price.
Securities traded in the over-the-counter market and listed securities for which no sale was reported on that date are valued at the last quoted bid price.
Debt securities are valued by independent pricing services; however, those that mature in sixty days or less are valued at amortized cost, which approximates market.
Investment company securities are valued at net asset value of the underlying portfolio.
Other securities for which quotations are not readily available are valued at fair market value as determined in good faith using guidelines adopted by the Board of Trustees of the Fund, under the supervision of the Fund's Valuation Committee.
Cash: The Fund may leave cash overnight in its cash account with the custodian, Investors Bank & Trust Company ("IBT"). IBT has been contracted on behalf of the Fund to invest the excess cash into a savings account, which at October 31, 2004, was paying an interest rate of 1.30%.
Throughout the year, the Fund may have a cash overdraft balance. A fee is incurred on the overdraft, calculated by multiplying the overdraft by a rate based on the Federal Funds rate. This fee is included in Custody fees in the Statement of Operations.
Repurchase agreements: The Fund is authorized to enter into repurchase agreements. The Fund, through IBT, receives delivery of the underlying securities, the value of which at the time of purchase is required to be an amount equal to at least 100% of the resale price. Repurchase agreements involve the risk that the seller will fail to repurchase the security, as agreed. In that case, the Fund will bear the risk of value fluctuations until the security can be sold and may encounter delays and incur costs in liquidating the security. In the event of bankruptcy or insolvency of the seller, delays and costs may be incurred.
Transamerica IDEX Mutual Funds
Annual Report 2004
15
TA IDEX Transamerica Conservative High-Yield Bond
NOTES TO FINANCIAL STATEMENTS (continued)
At October 31, 2004
(all amounts in thousands)
NOTE 1.–(continued)
Securities lending: The Fund may lend securities to enhance fund earnings from investing cash collateral in making such loans to qualified borrowers (typically broker/dealers). The Fund has engaged its custodian bank, IBT, as a lending agent to administer its securities lending program. IBT earned $38 of program income for its services. When the Fund makes a security loan, it receives cash collateral as protection against the risk that the borrower will default on the loan, and records an asset for the cash invested collateral and a liability for the return of the collateral.
Securities on loan are included in Investment securities at value in the Statement of Assets and Liabilities and remain on the Schedule of Investments.
Loans of securities are required to be secured by collateral at least equal to 102% of the value of the securities at inception of the loan, and not less then 100% thereafter. The Fund may invest cash collateral in short-term money market instruments including: U.S. Treasury Bills, U.S. agency obligations, commercial paper, money market mutual funds, repurchase agreements and other highly rated, liquid investments. During the life of securities loans, the collateral and securities loaned remain subject to fluctuation in value. IBT marks to market securities loaned and the collateral each business day. If additional collateral is due (at least $1), IBT collects additional cash collateral from the borrowers. Although securities loaned will be fully collateralized at all times, IBT may experience delays in, or may be prevented from, recovering the collateral on behalf of the Fund. The Fund may recall a loa ned security position at any time from the borrower through IBT. In the event the borrower fails to timely return a recalled security, IBT may indemnify the Fund by purchasing replacement securities for the Fund at its own expense and claiming the collateral to fund such a purchase. IBT absorbs the loss if the collateral value is not sufficient to cover the cost of the replacement securities. If replacement securities are not available, IBT will credit the equivalent cash value to the Fund.
While a security is on loan, the Fund does not have the right to vote that security. However, if time permits, the Fund will attempt to recall a security on loan and vote the proxy.
Income from securities lending is included in the Statement of Operations. The amount of collateral and value of securities on loan are included in the Statement of Assets and Liabilities as well as in the Schedule of Investments.
Security transactions and investment income: Security transactions are recorded on the trade date. Security gains and losses are calculated on the specific identification basis. Dividend income is recorded on the ex-dividend date or, in the case of foreign securities, as soon as the Fund is informed of the ex-dividend date. Interest income, including accretion of discounts and amortization of premiums, is recorded on the accrual basis commencing on the settlement date.
Account maintenance fees: If the shareholder account balance falls below $1 by either shareholder action or as a result of market action, a $25 (not in thousands) fee is assessed every year until the balance reaches $1. The fee is assessed by redeeming shares in the shareholder's account.
No fee will be charged under the following conditions:
• accounts opened within the preceding 24 months
• accounts with an active monthly Automatic Investment Plan ($50 (not in thousands) minimum per fund)
• accounts owned by an individual which, when combined by social security number, have a balance of $5 or more
• accounts owned by individuals in the same household (by address) that have a combined balance of $5 or more
• UTMA/UGMA accounts
• Fiduciary accounts
• B-share accounts whose shares have started to convert to
A-shares accounts (as long as combined value of both accounts is at least $1)
For the year ended October 31, 2004, this fee totaled $2. These fees are included in Paid in Capital in the Statement of Assets and Liabilities.
Redemption fees: A short-term trading redemption fee may be assessed on any fund shares in a fund account that are sold during the first five (5) New York Stock Exchange trading days following their purchase date. This redemption fee wil equal 2% of the amount redeemed and shares held the longest will be treated as being redeemed first and shares held the shortest as being redeemed last. For the year ended October 31, 2004, the Fund received no redemption fees.
Dividend distributions: Distributions to shareholders are recorded on the ex-dividend date and are determined in accordance with Federal income tax regulations which may differ from GAAP.
NOTE 2. RELATED PARTY TRANSACTIONS
AEGON/Transamerica Fund Advisers, Inc. ("ATFA") is the Fund's investment adviser. AEGON/Transamerica Fund Services, Inc. ("ATFS") is the Fund's administrator. AFSG Securities Corp. ("AFSG") is the Fund's distributor/principal underwriter. AEGON/Transamerica Investor Services, Inc. ("ATIS") is the Fund's transfer agent. ATIS and AFSG are 100% owned by AUSA Holding Company ("AUSA"). ATFA is a directly owned subsidiary of Western Reserve Life Assurance Co. of Ohio (78%) ("WRL") and AUSA (22%). ATFS is a wholly owned subsidiary of WRL. AUSA and WRL are wholly owned indirect subsidiaries of AEGON NV, a Netherlands corporation.
Transamerica IDEX Mutual Funds
Annual Report 2004
16
TA IDEX Transamerica Conservative High-Yield Bond
NOTES TO FINANCIAL STATEMENTS (continued)
At October 31, 2004
(all amounts in thousands)
NOTE 2.–(continued)
AEGON USA Investment Management, Inc. is both the sub-adviser to the Fund and an affiliate of the Fund.
The following schedule represents the percentage of fund assets owned by affiliated mutual funds (i.e. through the asset allocation funds):
| | | Net
Assets | | % of
Net Assets | |
TA IDEX Asset Allocation–
Conservative Portfolio | | $ | 65,603 | | | | 17 | % | |
TA IDEX Asset Allocation–Moderate
Growth Portfolio | | | 77,497 | | | | 20 | % | |
TA IDEX Asset Allocation–Moderate
Portfolio | | | 129,174 | | | | 34 | % | |
| Total | | $ | 272,274 | | | | 71 | % | |
Investment advisory fee: The Fund pays management fees to ATFA based on average daily net assets ("ANA") at the following rate:
0.60% of ANA
ATFA has contractually agreed to waive its advisory fee and will reimburse the Fund to the extent that operating expenses, excluding 12b-1 fees, exceed the following stated annual limit:
1.25% Expense Limit
If total fund expenses fall below the annual expense limitation agreement agreed to by the adviser within the succeeding three years, the Fund may be required to pay that adviser a portion or all of the reimbursed class expenses.
There were no amounts recaptured during the year ended October 31, 2004. There are no amounts subject to recapture at October 31, 2004.
Distribution and service fees: The Fund has a 12b-1 distribution plan under the 1940 Act pursuant to which an annual fee, based on average daily net assets, is paid to the distributor for various disbursements such as broker-dealer account servicing fees and other promotional expenses of the Fund. The Fund is authorized under the 12b-1 plan to pay fees on each class up to the following limits:
| Class A | | | 0.35 | % | |
| Class B | | | 1.00 | % | |
| Class C | | | 1.00 | % | |
| Class C2 | | | 1.00 | % | |
| Class M | | | 0.90 | % | |
Class C2 and Class M merged into Class C on June 15, 2004 and September 24, 2004, respectively.
In the case the Fund or a class of shares of the Fund is closed to new investors or investments, the Fund is authorized to pay 12b-1 fees for past sales and distribution efforts and present and past investor services.
Underwriter commissions relate to front-end sales charges imposed for Class A and Class M shares and contingent deferred sales charges from Classes B, C, M and certain A share redemptions. For the year ended October 31, 2004, the underwriter commissions were as follows:
| Received by Underwriter | | $ | 627 | | |
| Retained by Underwriter | | | 16 | | |
| Contingent Deferred Sales Charge | | | 247 | | |
Administrative services: The Fund has entered into an agreement with ATFS for financial and legal fund administration services, which includes such items as compliance, expenses, financial statements and other reporting, distributions, tax returns, prospectus preparation, board of trustees meeting support and other legal matters. The Fund pays ATFS an annual fee of 0.015% of average net assets. The Legal fees on the Statement of Operations are for fees paid to external legal counsel.
The Fund paid ATFS $54 for the year ended October 31, 2004.
Transfer agent fees: The Fund pays ATIS an annual per-account charge of $20 (not in thousands) for each open account and $1.63 (not in thousands) for each closed account. There is no new account charge. The transfer agent fees on the Statement of Operations are made up of fees paid to ATIS and costs associated with shareholder statements. The Fund paid ATIS $188 for the year ended October 31, 2004.
Deferred compensation plan: Each eligible Fund Trustee may elect participation in the Deferred Compensation Plan ("the Plan"). Under the Plan, such Trustees may defer payment of a percentage of their total fees earned as a Fund Trustee. These deferred amounts may be invested in any Transamerica IDEX Mutual Fund. At October 31, 2004, the value of invested plan amount was $19. Invested plan amounts and the total liability for deferred compensation to the Trustees under the Plan at October 31, 2004, are included in the accompanying Statement of Assets and Liabilities.
NOTE 3. INVESTMENT TRANSACTIONS
The cost of securities purchased and proceeds from securities sold (excluding short-term securities) for the year ended October 31, 2004, were as follows:
| Purchases of securities: | | | |
| Long-Term excluding U.S. Government | | $ | 255,975 | | |
| U.S. Government | | | 12,648 | | |
| Proceeds from maturities and sales of securities: | | | |
| Long-Term excluding U.S. Government | | | 157,263 | | |
| U.S. Government | | | 8,932 | | |
Transamerica IDEX Mutual Funds
Annual Report 2004
17
TA IDEX Transamerica Conservative High-Yield Bond
NOTES TO FINANCIAL STATEMENTS (continued)
At October 31, 2004
(all amounts in thousands)
NOTE 4. FEDERAL INCOME TAX MATTERS
The Fund has not made any provision for federal income or excise taxes due to its policy to distribute all of its taxable income and capital gains to its shareholders and otherwise qualify as a regulated investment company under the Internal Revenue Code. Income and capital gain distributions are determined in accordance with income tax regulations, which may differ from GAAP. These differences are primarily due to differing treatment for items including, but not limited to, wash sales, net operating losses and capital loss carryforwards.
Reclassifications between Undistributed net investment income (loss), Accumulated net realized capital gains (loss) and Shares of beneficial interest are made to reflect income and gains available for distribution under federal tax regulations. Results of operations and net assets are not effected by these reclassifications. These reclassifications are as follows:
| Undistributed net investment income (loss) | | $ | 142 | | |
Accumulated net realized gain (loss) from
investment securities | | | (142 | ) | |
The capital loss carryforwards are available to offset future realized capital gains through the periods listed:
Capital Loss
Carryforward | | Available through | |
| $ | 354 | | | October 31, 2008 | |
| | 1,519 | | | October 31, 2009 | |
| | 5,464 | | | October 31, 2010 | |
| | 5,283 | | | October 31, 2011 | |
The capital loss carryforward utilized during the year ended October 31, 2004 was $1,630.
The tax character of distributions paid may differ from the character of distributions shown in the Statements of Changes in Net Assets due to short-term gains being treated as ordinary income for tax purposes.
The tax character of distributions paid during 2003 and 2004 was as follows:
| 2003 Distributions paid from: | | | |
| Ordinary Income | | $ | 11,400 | | |
| Long-term capital gain | | | – | | |
| 2004 Distributions paid from: | | | |
| Ordinary Income | | | 19,718 | | |
| Long-term capital gain | | | – | | |
The tax basis components of distributable earnings as of October 31, 2004, are as follows:
| Undistributed Ordinary Income | | $ | 1,124 | | |
| Undistributed Long-term Capital Gains | | $ | – | | |
| Capital Loss Carryforward | | $ | (12,620 | ) | |
| Net Unrealized Appreciation (Depreciation) | | $ | 19,712 | * | |
* Amount includes unrealized appreciation (depreciation) of deferred
compensation.
The aggregate cost of investments and composition of unrealized appreciation (depreciation) for federal income tax purposes as of October 31, 2004, are as follows:
| Federal Tax Cost Basis | | $ | 381,741 | | |
| Unrealized Appreciation | | $ | 19,715 | | |
| Unrealized (Depreciation) | | | – | | |
| Net Unrealized Appreciation (Depreciation) | | $ | 19,715 | | |
NOTE 5. OTHER MATTERS
Transamerica IDEX Mutual Funds ("TA IDEX"), and certain of its affiliated entities, have received requests for information from the Staff of the Securities and Exchange Commission in connection with market timing and late trading within the funds. TA IDEX and the affiliated entities have voluntarily cooperated in the investigation and have been providing the information as requested.
Transamerica IDEX Mutual Funds
Annual Report 2004
18
Report of Independent Registered Certified Public Accounting Firm
To the Board of Trustees and Shareholders of
TA IDEX Transamerica Conservative High Yield Bond
In our opinion, the accompanying statement of assets and liabilities, including the schedule of investments, and the related statements of operations and of changes in net assets and the financial highlights present fairly, in all material respects, the financial position of TA IDEX Transamerica Conservative High Yield Bond (the "Fund") (one of the portfolios constituting the Transamerica IDEX Mutual Funds) at October 31, 2004, the results of its operations for the year then ended, the changes in its net assets for each of the two years in the period then ended and the financial highlights for each of the periods indicated, in conformity with accounting principles generally accepted in the United States of America. These financial statements and financial highlights (hereafter referred to as "financial statements") are the responsibility of the Fund's management; our responsibility is to express an opinion on these financial statements based on our audits. We conducted our audits of these financial statements in accordance with the standards of the Public Company Accounting Oversight Board (United States). Those standards require that we plan and perform the audit to obtain reasonable assurance about whether the financial statements are free of material misstatement. An audit includes examining, on a test basis, evidence supporting the amounts and disclosures in the financial statements, assessing the accounting principles used and significant estimates made by management, and evaluating the overall financial statement presentation. We believe that our audits, which included confirmation of securities at October 31, 2004 by correspondence with the custodian and brokers, provide a reasonable basis for our opinion.

PricewaterhouseCoopers LLP
Tampa, Florida
December 28, 2004
Transamerica IDEX Mutual Funds
Annual Report 2004
19
TA IDEX Transamerica Conservative High-Yield Bond
SUPPLEMENTAL INFORMATION (unaudited)
TAX INFORMATION
For dividends paid during the year ended October 31, 2004, the Fund designates $160 as qualified dividend income.
For corporate shareholders, 1% of investment income (dividend income plus short-term gains, if any) qualifies for the dividends received deduction.
The information and distributions reported herein may differ from the information and distributions taxable to the shareholders for the calendar year ending December 31, 2004. Complete information will be computed and reported in conjunction with your 2004 Form 1099-DIV.
RESULTS OF SHAREHOLDER PROXY
At a special meeting of Class M shareholders of each series of Transamerica IDEX (except TA IDEX Federated Tax Exempt and TA IDEX Protected Principal Stock) held on September 2, 2004, the results of the Proposal were as follows:
Proposal 1: Approval of a conversion of Class M shares into Class C shares of the Funds, which will result in bearing the distribution and service fees payable under the 12b-1 Plan of Distribution for the Class C shares of the Funds.
| For | | Against | | Abstentions/Broker Non-Votes | |
| | 81.47 | % | | | 2.65 | % | | | 15.88 | % | |
Transamerica IDEX Mutual Funds
Annual Report 2004
20
TA IDEX Transamerica Convertible Securities
MARKET ENVIRONMENT
For the 12 months ended October 31, 2004, the Merrill Lynch All U.S. Convertibles Index ("MLCI") rose 8.12%. Initially, investors were quite bullish about economic growth, and industries where credit improvements were most visible, such as automobiles, led the convertibles market. For instance, convertibles from Ford Motor Company and General Motors Corporation, which represented roughly 5% of the MLCI, posted exceptional gains in November and December 2003.
After the initial months of 2004, however, the convertibles market fluctuated widely, as investors responded to conflicting and inconsistent economic data. First concerned about too-robust growth and the specter of higher inflation, investors later grew anxious about a possible economic slowdown, before finally regaining confidence in a steady-growth economy late in the period. Against this backdrop of changing attitudes, most sectors of the Standard and Poor's 500 Composite Stock Index, with the exception of energy, industrial and basic materials stocks, retrenched, negatively impacting convertibles' equity-related attributes. Partially offsetting this were falling yields in the bond market, which were a boon to convertibles' fixed-income features.
PERFORMANCE
For the year ended October 31, 2004, TA IDEX Transamerica Convertibles Securities, Class A returned 7.06%. By comparison its benchmark, the MLCI, returned 8.12%.
STRATEGY REVIEW
Our idea of an attractive investment opportunity is a company that stands to benefit from changes in the company, its industry, or the external forces driving its business; generates free cash flow; and prudently reinvests to enhance shareholder value. Because automobile manufacturers generally do not fit this profile, the portfolio was underweighted in the sector when it rallied early in the period. This was the primary cause of the portfolio's lagging performance. Secondarily, our airline investments performed poorly; we underestimated the enduring nature of the significant rise in energy prices, which completely eclipsed any operating improvement in transportation companies.
Our losses in the airline industry were more than offset by strong results in most of our holdings, especially our investments in telephone manufacturer Motorola, Inc., cruise ship operators Carnival Corporation and Royal Caribbean Cruises Ltd., retailer J.C. Penney Company, Inc. ("J.C. Penney"), and Mandalay Resort Group ("Mandalay").
We are bullish on the growth of the gambling/casino industry, both in the Las Vegas area and worldwide. We believed Mandalay represented a high-quality way to capitalize on this growth, and it was eventually acquired by MGM MIRAGE.
Likewise, we believed the cruise industry was well positioned for earnings growth after a major turnaround that has taken several years. Consolidation has eliminated excess capacity, giving cruise lines pricing power through channels that were notorious for discounting and allowing the remaining competitors to increase profitability.
Another turnaround that benefited the portfolio was J.C. Penney, which saw a rebound in its core business of department stores, and sold its financially ailing chain of Eckerd's pharmacies at an attractive price.
During the year we added more securities from companies that process or supply basic materials (e.g., oil, metals, and forest products). Given the amazing rate of infrastructure development and industrialization in countries like India and China, we believe the demand for these commodities will continue to grow.
Kirk J. Kim, CFA
Gary U. Rolle, CFA
Edward S. Han
Co-Fund Managers
Transamerica Investment Management, LLC
Transamerica IDEX Mutual Funds
Annual Report 2004
1
TA IDEX Transamerica Convertible Securities
Comparison of change in value of $10,000 investment in Class A shares and its comparative index.
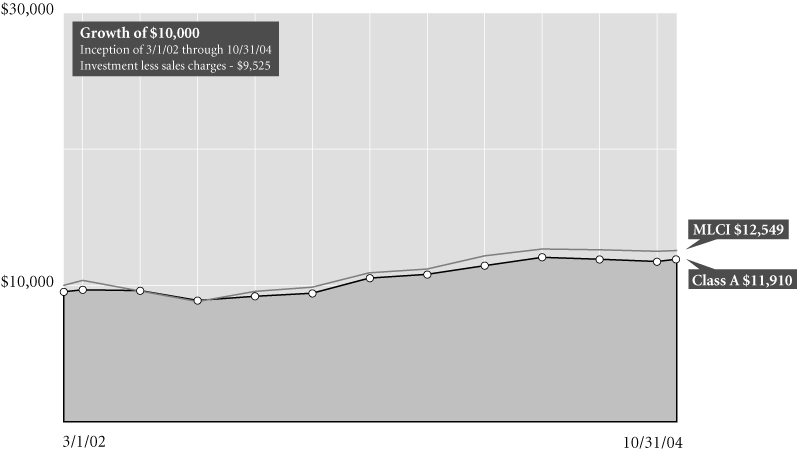
Average Annual Total Return for Periods Ended 10/31/04
| | | 1 year | | From
Inception | | Inception
Date | |
| Class A (NAV) | | | 7.06 | % | | | 8.74 | % | | 3/1/02 | |
| Class A (POP) | | | 1.98 | % | | | 6.78 | % | | 3/1/02 | |
| MLCI1 | | | 8.12 | % | | | 8.89 | % | | 3/1/02 | |
| Class B (NAV) | | | 6.52 | % | | | 8.12 | % | | 3/1/02 | |
| Class B (POP) | | | 1.52 | % | | | 7.13 | % | | 3/1/02 | |
| Class C (NAV) | | | 6.33 | % | | | 14.55 | % | | 11/11/02 | |
| Class C (POP) | | | 5.33 | % | | | 14.55 | % | | 11/11/02 | |
NOTES
1 The Merrill Lynch All U.S. Convertibles Index is an unmanaged index used as a general measure of market performance. Calculations assume dividends and capital gains are reinvested and do not include any managerial expenses. From inception calculation is based on life of Class A shares. Source: Standard & Poor's Micropal®© Micropal, Inc. 2004 – 1-800-596-5323 – http://www.micropal.com.
The performance data presented represents past performance, future results may vary. Performance data does not reflect the deduction of taxes that would be paid on fund distributions or the redemption of fund shares. Investment return and principal value will fluctuate so that an investor's shares, when redeemed, may be worth more or less than their original cost. Current performance may be lower or higher than performance quoted.
Public Offering Price (POP) returns include the reinvestment of dividends and capital gains and reflect the maximum sales charge of 4.75% for A shares or the maximum applicable contingent deferred sales charge (5% in the 1st year, decreasing to 0% after 6 years) for Class B shares and 1% (during the first 12 months) for Class C shares. Shares purchased prior to March 1, 2004 are subject to a maximum applicable contingent deferred sales charge (5% in the 1st year, decreasing to 0% after 7 years) for Class B shares and (2% in the 1st year, decreasing to 0% after 2 years) for Class C shares. Net Asset Value (NAV) returns include the reinvestment of dividends and capital gains but do not reflect any sales charges.
This material must be preceded or accompanied by a current prospectus, which includes specific contents regarding the investment objectives and policies of this fund.
Transamerica IDEX Mutual Funds
Annual Report 2004
2
TA IDEX Transamerica Convertible Securities
UNDERSTANDING YOUR FUND'S EXPENSES (unaudited)
SHAREHOLDER EXPENSES
The following Example is intended to help you understand your ongoing costs (in dollars and cents) of investing in a Fund and to compare these costs with the ongoing costs of investing in other funds.
The Example is based on an investment of $1,000 invested at the beginning of the period and held for the entire period from May 1, 2004 to October 31, 2004.
ACTUAL EXPENSES
The first line in the table below provides information about actual account values and actual expenses. You may use the information in this line, together with the amount you invested, to estimate the expenses that you paid over the period. Simply divide your account value by $1,000 (for example, an $8,600 account value divided by $1,000 = 8.6), then multiply the result by the number in the first line of your Fund under the heading entitled "Expenses Paid During Period" to estimate the expenses you paid on your account during this period.
HYPOTHETICAL EXAMPLE FOR COMPARISON PURPOSES
The second line in the table below provides information about hypothetical account values and hypothetical expenses based on each Fund's actual expense ratio and an assumed rate of return of 5% per year before expenses, which is not the Fund's actual return. The hypothetical account values and expenses may not be used to estimate the actual ending account balance or expenses you paid for the period. You may use this information to compare the ongoing costs of investing in your Fund and other funds. To do so, compare this 5% hypothetical example with the 5% hypothetical examples that appear in the shareholder reports of the other funds.
Please note that the expenses shown in the table are meant to highlight your ongoing costs only and do not reflect any transactional costs, such as sales charges, redemption fees, brokerage commissions paid on purchases and sales of fund shares. Therefore, the second line under each Fund in the table is useful in comparing ongoing costs only, and will not help you determine the relative total costs of owning different funds. In addition, note that the expenses shown in the table are meant to highlight your ongoing costs and do not reflect any transaction costs.
| | | Beginning
Account
Value | | Ending
Account
Value | | Annualized
Expense
Ratio | | Expenses Paid
During Period (a) | |
| Class A | | | |
| Actual | | $ | 1,000.00 | | | $ | 1,021.90 | | | | 1.22 | % | | $ | 6.20 | | |
| Hypothetical (b) | | | 1,000.00 | | | | 1,019.00 | | | | 1.22 | | | | 6.19 | | |
| Class B | | | |
| Actual | | | 1,000.00 | | | | 1,019.50 | | | | 1.76 | | | | 8.93 | | |
| Hypothetical (b) | | | 1,000.00 | | | | 1,016.29 | | | | 1.76 | | | | 8.92 | | |
| Class C | | | |
| Actual | | | 1,000.00 | | | | 1,017.60 | | | | 2.03 | | | | 10.30 | | |
| Hypothetical (b) | | | 1,000.00 | | | | 1,014.93 | | | | 2.03 | | | | 10.28 | | |
(a) Expenses are calculated using each Fund's annualized expense ratio (as disclosed in the table), multiplied by the average account value for the period, multiplied by number of days in the period (184 days), and divided by the number of days in the year (366 days).
(b) 5% return per year before expenses.
GRAPHIC PRESENTATION OF SCHEDULE OF INVESTMENTS
By Sector
At October 31, 2004
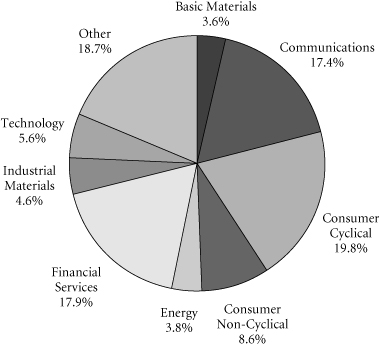
This chart shows the percentage breakdown by sector of the Fund's total investment securities.
Transamerica IDEX Mutual Funds
Annual Report 2004
3
TA IDEX Transamerica Convertible Securities
SCHEDULE OF INVESTMENTS
At October 31, 2004
(all amounts except share amounts in thousands)
| | | Principal | | Value | |
| CONVERTIBLE BONDS (89.4%) | |
| Aerospace (2.0%) | |
Armor Holdings, Inc.
2.00%, due 11/01/2024 (a) | | $ | 4,000 | | | $ | 3,945 | | |
| Business Credit Institutions (1.0%) | |
Financial Federal Credit 144A
2.00%, due 04/15/2034 | | | 1,950 | | | | 2,006 | | |
| Business Services (0.8%) | |
Danaher Corp.
Zero Coupon, due 01/22/2021 (b) | | | 2,000 | | | | 1,615 | | |
| Commercial Banks (7.1%) | |
Bank of America Corp.
0.25%, due 04/30/2014 | | | 4,000 | | | | 4,345 | | |
SG Structured Products, Inc.
1.33%, due 10/04/2005 | | | 5,000 | | | | 4,857 | | |
Wells Fargo & Co.
0.25%, due 04/29/2014 | | | 5,000 | | | | 5,075 | | |
| Communication (4.0%) | |
American Tower Corp. 144A
3.00%, due 08/15/2012 (b) | | | 3,750 | | | | 3,989 | | |
Crown Castle International Corp.
4.00%, due 07/15/2010 (b) | | | 2,400 | | | | 3,921 | | |
| Communications Equipment (1.1%) | |
Comtech Telecommunications
2.00%, due 02/01/2024 (c) | | | 2,400 | | | | 2,199 | | |
| Computer & Data Processing Services (8.6%) | |
GTECH Holdings Corp.
1.75%, due 12/15/2021 (b) | | | 2,000 | | | | 3,487 | | |
Openwave Systems, Inc. 144A
2.75%, due 09/09/2008 | | | 5,000 | | | | 4,981 | | |
RealNetworks, Inc.
Zero Coupon, due 07/01/2010 (b) | | | 5,100 | | | | 4,431 | | |
Terremark Worldwide, Inc. 144A
9.00%, due 06/15/2009 | | | 5,000 | | | | 4,331 | | |
| Computer & Office Equipment (1.8%) | |
3M Co.
Zero Coupon, due 11/21/2032 (b) | | | 4,000 | | | | 3,550 | | |
| Electrical Goods (1.1%) | |
Avnet, Inc.
2.00%, due 03/15/2034 (b) | | | 2,250 | | | | 2,112 | | |
| Electronic Components & Accessories (4.8%) | |
Cypress Semiconductor Corp.
1.25%, due 06/15/2008 | | | 2,650 | | | | 2,667 | | |
Micron Technology, Inc.
2.50%, due 02/01/2010 (b) | | | 600 | | | | 721 | | |
| | | Principal | | Value | |
| Electronic Components & Accessories (continued) | | | |
Micron Technology, Inc. 144A
2.50%, due 02/01/2010 (b) | | $ | 2,250 | | | $ | 2,703 | | |
Pixelworks, Inc. 144A
1.75%, due 05/15/2024 | | | 4,000 | | | | 3,435 | | |
| Health Services (1.2%) | | | | | |
Matria Healthcare, Inc. 144A
4.88%, due 05/01/2024 | | | 1,805 | | | | 2,337 | | |
| Hotels & Other Lodging Places (4.3%) | | | | | |
Host Marriott, LP 144A
3.25%, due 04/15/2024 (b) | | | 4,000 | | | | 4,210 | | |
Kerzner International, Ltd.
2.38%, due 04/15/2024 (b) | | | 4,100 | | | | 4,351 | | |
| Manufacturing Industries (7.3%) | |
International Game Technology
Zero Coupon, due 01/29/2033 | | | 4,900 | | | | 3,657 | | |
K2, Inc.
5.00%, due 06/15/2010 | | | 3,675 | | | | 5,356 | | |
Shuffle Master, Inc. 144A
1.25%, due 04/15/2024 | | | 4,850 | | | | 5,650 | | |
| Mortgage Bankers & Brokers (2.7%) | | | | | | | |
MSFT Exchangeable Trust
Zero Coupon, due 02/25/2031 | | | 5,000 | | | | 5,425 | | |
| Motion Pictures (5.1%) | | | | | | | |
Liberty Media Corp.
3.25%, due 03/15/2031 (b) | | | 4,550 | | | | 4,237 | | |
Lions Gate Entertainment Corp.
4.88%, due 12/15/2010 | | | 1,000 | | | | 1,876 | | |
Lions Gate Entertainment Corp. 144A
2.94%, due 10/15/2024 | | | 3,750 | | | | 4,083 | | |
| Oil & Gas Extraction (4.0%) | | | | | | | |
Devon Energy Corp.
4.90%, due 08/15/2008 | | | 2,500 | | | | 2,731 | | |
| 4.95%, due 08/15/2008 | | | 1,000 | | | | 1,092 | | |
McMoRan Exploration Co. 144A
5.25%, due 10/06/2011 (b) | | | 1,000 | | | | 1,131 | | |
Quicksilver Resources, Inc. 144A
1.88%, due 11/01/2024 | | | 3,000 | | | | 2,955 | | |
| Pharmaceuticals (5.5%) | | | | | | | |
Allergan, Inc.
Zero Coupon, due 11/06/2022 | | | 3,500 | | | | 3,172 | | |
Medarex, Inc. 144A
2.25%, due 05/15/2011 | | | 5,085 | | | | 4,475 | | |
Teva Pharmaceutical Finance II LLC, Series B
0.25%, due 02/01/2024 (b) | | | 1,900 | | | | 1,833 | | |
Teva Pharmaceutical Finance NV
0.38%, due 11/15/2022 (b) | | | 1,250 | | | | 1,602 | | |
The notes to the financial statements are an integral part of this report.
Transamerica IDEX Mutual Funds
Annual Report 2004
4
TA IDEX Transamerica Convertible Securities
SCHEDULE OF INVESTMENTS (continued)
At October 31, 2004
(all amounts except share amounts in thousands)
| | | Principal | | Value | |
| Primary Metal Industries (1.7%) | | | |
Inco, Ltd.
Zero Coupon, due 03/29/2021 (b) | | $ | 3,500 | | | $ | 3,404 | | |
| Printing & Publishing (0.5%) | | | |
Bowne & Co., Inc.
5.00%, due 10/01/2033 | | | 1,075 | | | | 1,083 | | |
| Radio & Television Broadcasting (1.2%) | | | |
Sirius Satellite Radio, Inc.
3.25%, due 10/15/2011 (b) | | | 2,300 | | | | 2,450 | | |
| Radio, Television & Computer Stores (2.0%) | | | |
Guitar Center, Inc.
4.00%, due 07/15/2013 | | | 2,800 | | | | 4,001 | | |
| Research & Testing Services (3.2%) | | | |
deCODE genetics, Inc. 144A
3.50%, due 04/15/2011 | | | 3,250 | | | | 2,856 | | |
Oscient Pharmaceuticals Corp. 144A
3.50%, due 04/15/2011 | | | 4,000 | | | | 3,485 | | |
| Retail Trade (1.7%) | | | |
Dick's Sporting Goods, Inc. 144A
1.61%, due 02/18/2024 (d) | | | 4,400 | | | | 3,421 | | |
| Security & Commodity Brokers (4.2%) | | | |
Lehman Brothers Holdings, Inc.
0.25%, due 10/06/2011 | | | 2,000 | | | | 2,365 | | |
Morgan Stanley Group, Inc. 144A
0.25%, due 07/30/2014 | | | 5,300 | | | | 5,933 | | |
| Telecommunications (7.9%) | | | |
Millicom International Cellular
Exchangeable Note Trust 144A
10.00%, due 11/20/2008 | | | 4,000 | | | | 5,928 | | |
Nextel Partners, Inc.
1.50%, due 11/15/2008 (b) | | | 4,000 | | | | 5,890 | | |
NII Holdings, Inc.
2.88%, due 02/01/2034 (b) | | | 3,500 | | | | 3,920 | | |
| Water Transportation (4.6%) | | | |
Carnival Corp.
1.13%, due 04/29/2033 (e) | | | 5,000 | | | | 4,006 | | |
Royal Caribbean Cruises, Ltd.
Zero Coupon, due 02/02/2021 | | | 4,000 | | | | 2,225 | | |
| Zero Coupon, due 05/18/2021 | | | 4,000 | | | | 2,995 | | |
| Total Convertible Bonds (cost: $170,801) | | | | | 178,505 | | |
| | | Shares | | Value | |
| CONVERTIBLE PREFERRED STOCKS (9.6%) | | | |
| Automotive (1.5%) | | | |
| Ford Motor Co. Capital Trust II | | | 60,000 | | | $ | 3,023 | | |
| Chemicals & Allied Products (1.0%) | | | |
| Terra Industries, Inc. 144A (b)(f) | | | 1,950 | | | | 1,974 | | |
| Commercial Banks (1.7%) | | | |
| Marshall & Ilsley Corp. (b) | | | 50,000 | | | | 1,360 | | |
| State Street Corp. | | | 10,000 | | | | 2,080 | | |
| Communications Equipment (1.0%) | | | |
| Nortel Networks Corp. (f) | | | 33 | | | | 1,969 | | |
| Electric Services (2.0%) | | | |
| Aquila, Inc. (b)(f) | | | 133,000 | | | | 4,090 | | |
| Metal Mining (1.7%) | | | |
Freeport-McMoRan Copper & Gold,
Inc. 144A (f) | | | 3,500 | | | | 3,308 | | |
| Oil & Gas Extraction (0.7%) | | | |
| Chesapeake Energy Corp. (f) | | | 1,150 | | | | 1,312 | | |
| Total Convertible Preferred Stocks (cost: $21,491) | | | | | | | 19,116 | | |
| | | Principal | | Value | |
| SECURITY LENDING COLLATERAL (22.7%) | | | |
| Debt (21.1%) | | | |
| Bank Notes (4.1%) | | | |
Bank of America
1.77%, due 12/03/2004 | | | $2,208 | | | | $2,208 | | |
| 1.88%, due 12/23/2004 | | | 736 | | | | 736 | | |
| 1.77%, due 01/18/2005 | | | 1,472 | | | | 1,472 | | |
Canadian Imperial Bank of Commerce
1.86%, due 11/04/2004 | | | 3,312 | | | | 3,313 | | |
Credit Suisse First Boston Corp.
1.83%, due 09/09/2005 | | | 368 | | | | 368 | | |
| Commercial Paper (2.2%) | | | |
Clipper Receivables Corp.
1.79%, due 11/12/2004 | | | 1,096 | | | | 1,096 | | |
Delaware Funding Corp. 144A
1.85%, due 11/19/2004 | | | 368 | | | | 368 | | |
Falcon Asset Securitization Corp. 144A
1.78%, due 11/04/2004 | | | 1,098 | | | | 1,098 | | |
| 1.75%, due 11/10/2004 | | | 1,472 | | | | 1,472 | | |
Galaxy Funding 144A
1.88%, due 11/22/2004 | | | 368 | | | | 368 | | |
The notes to the financial statements are an integral part of this report.
Transamerica IDEX Mutual Funds
Annual Report 2004
5
TA IDEX Transamerica Convertible Securities
SCHEDULE OF INVESTMENTS (continued)
At October 31, 2004
(all amounts except share amounts in thousands)
| | | Principal | | Value | |
| Euro Dollar Terms (9.8%) | | | |
Bank of Montreal
1.88%, due 11/24/2004 | | $ | 3,486 | | | $ | 3,486 | | |
BNP Paribas
1.77%, due 11/10/2004 | | | 1,840 | | | | 1,840 | | |
| 1.80%, due 11/23/2004 | | | 1,472 | | | | 1,472 | | |
| 1.98%, due 12/27/2004 | | | 1,472 | | | | 1,472 | | |
Calyon
1.70%, due 11/24/2004 | | | 194 | | | | 194 | | |
Citigroup
2.06%, due 01/25/2005 | | | 3,680 | | | | 3,681 | | |
Den Danske Bank
1.82%, due 11/19/2004 | | | 1,840 | | | | 1,840 | | |
Dexia Group
2.04%, due 01/21/2005 | | | 854 | | | | 854 | | |
HBOS Halifax Bank of Scotland
2.03%, due 01/21/2005 | | | 736 | | | | 736 | | |
Royal Bank of Scotland
2.01%, due 01/20/2005 | | | 1,472 | | | | 1,472 | | |
Toronto Dominion Bank
1.70%, due 11/08/2004 | | | 736 | | | | 736 | | |
Wells Fargo
1.87%, due 11/22/2004 | | | 1,840 | | | | 1,840 | | |
| | | Principal | | Value | |
| Promissory Notes (2.1%) | |
Goldman Sachs Group Inc.
1.90%, due 12/29/2004 | | | $1,546 | | | | $1,546 | | |
| 1.88%, due 01/27/2005 | | | 2,576 | | | | 2,576 | | |
| Repurchase Agreements (2.9%) | |
Merrill Lynch & Co., (g)
1.92% Repurchase Agreement dated
10/29/2004 to be repurchased at $5,889 on
11/01/2004 | | | 5,889 | | | | 5,889 | | |
| | | Shares | | Value | |
| Investment Companies (1.6%) | |
| Money Market Funds (1.6%) | |
Merrill Lynch Premier Institutional Fund
1-day yield of 1.71% | | | 1,810,554 | | | | $1,811 | | |
Merrimac Cash Fund, Premium Class
1-day yield of 1.46% | | | 1,324,945 | | | | 1,325 | | |
| Total Security Lending Collateral (cost: $45,269) | | | | | | | 45,269 | | |
| Total Investment Securities (cost: $237,561) | | | | | | $ | 242,890 | | |
| SUMMARY: | |
| Investments, at value | | | 121.7 | % | | $ | 242,890 | | |
| Liabilities in excess of other assets | | | (21.7 | )% | | | (43,258 | ) | |
| Net assets | | | 100.0 | % | | $ | 199,632 | | |
NOTES TO SCHEDULE OF INVESTMENTS:
(a) Securities are stepbonds. Armor Holding, Inc. had a coupon rate of 2.00% until 11/01/2011, thereafter the coupon rate will be 0.00%.
(b) At October 31, 2004, all or a portion of this security is on loan (see Note 1). The value at October 31, 2004, of all securities on loan is $44,226.
(c) Securities are stepbonds. Comtech Telecommunications has a coupon rate of 2.00% until 02/01/2011, thereafter the coupon rate will be 0.00%.
(d) Securities are stepbonds. Dick's Sporting Goods, Inc.–144A has a coupon rate of 1.61% until 02/18/2009, thereafter the coupon rate will be 0.00%.
(e) Securities are stepbonds. Carnival Corp. has a coupon rate of 1.13% until 04/01/2008, thereafter the coupon rate will be 0.00%.
(f) No dividends were paid during the preceding twelve months.
(g) Cash collateral for the Repurchase Agreements, valued at $6,026, that serve as collateral for securities lending are invested in corporate bonds with interest rates and maturity dates ranging from 0.00%–9.75% and 05/15/2005–9/15/2033, respectively.
DEFINITIONS:
144A 144A Securities are registered pursuant to Rule 144A of the Securities Act of 1933. These securities are deemed to be liquid for purposes of compliance limitations on holdings of illiquid securities and may be resold as transactions exempt from registration normally to qualified institutional buyers. At October 31, 2004 these securities aggregated $76,497 or 38.3% of the net assets of the Fund.
The notes to the financial statements are an integral part of this report.
Transamerica IDEX Mutual Funds
Annual Report 2004
6
TA IDEX Transamerica Convertible Securities
STATEMENT OF ASSETS AND LIABILITIES
At October 31, 2004
(all amounts except per share amounts in thousands)
| Assets: | | | |
Investment securities, at value (cost: $237,561)
(including securities loaned of $44,226) | | $ | 242,890 | | |
| Receivables: | |
| Investment securities sold | | | 13,491 | | |
| Shares of beneficial interest sold | | | 12 | | |
| Interest | | | 969 | | |
| Dividends | | | 24 | | |
| Other | | | 5 | | |
| | | | 257,391 | | |
| Liabilities: | | | |
| Investment securities purchased | | | 6,895 | | |
| Accounts payable and accrued liabilities: | |
| Shares of beneficial interest redeemed | | | 15 | | |
| Management and advisory fees | | | 129 | | |
| Distribution fees | | | 65 | | |
| Transfer agent fees | | | 6 | | |
| Due to custodian | | | 5,317 | | |
| Payable for collateral for securities on loan | | | 45,269 | | |
| Other | | | 63 | | |
| | | | 57,759 | | |
| Net Assets | | $ | 199,632 | | |
| Net Assets Consist of: | | | |
Shares of beneficial interest, unlimited shares
authorized, no par value | | $ | 189,624 | | |
| Undistributed net investment income (loss) | | | 104 | | |
Undistributed net realized gain (loss) from investment
securities | | | 4,575 | | |
Net unrealized appreciation (depreciation) on
investment securities | | | 5,329 | | |
| Net Assets | | $ | 199,632 | | |
| Net Assets by Class: | | | |
| Class A | | $ | 188,049 | | |
| Class B | | | 6,379 | | |
| Class C | | | 5,204 | | |
| Shares Outstanding: | | | |
| Class A | | | 17,088 | | |
| Class B | | | 580 | | |
| Class C | | | 475 | | |
| Net Asset Value Per Share: | | | |
| Class A | | $ | 11.00 | | |
| Class B | | | 11.00 | | |
| Class C | | | 10.97 | | |
| Maximum Offering Price Per Share (a): | | | |
| Class A | | $ | 11.55 | | |
(a) Includes the maximum selling commission (represented as a percentage of offering price) whuch is reduced on certain levels of sales as set forth in the Prospectus. Net asset value per share for Classes B and C shares represents offering price. The redemption price for Classes B and C shares equals net asset value less any applicable contingent deferred sales charge.
STATEMENT OF OPERATIONS
For the year ended October 31, 2004
(all amounts in thousands)
| Investment Income: | | | |
| Interest | | $ | 4,273 | | |
| Dividends | | | 1,620 | | |
| Income from loaned securities–net | | | 65 | | |
| | | | 5,958 | | |
| Expenses: | | | |
| Management and advisory fees | | | 1,475 | | |
| Transfer agent fees | |
| Class A | | | 18 | | |
| Class B | | | 3 | | |
| Class C | | | 2 | | |
| Class C2 | | | – | | |
| Class M | | | – | | |
| Printing and shareholder reports | | | 2 | | |
| Custody fees | | | 38 | | |
| Administration fees | | | 31 | | |
| Legal fees | | | 7 | | |
| Audit and accounting fees | | | 13 | | |
| Trustees fees | | | 12 | | |
| Registration fees | |
| Class A | | | 59 | | |
| Class B | | | – | | |
| Class C | | | 12 | | |
| Class C2 | | | – | | |
| Class M | | | 1 | | |
| Other | | | 8 | | |
| Distribution and service fees: | |
| Class A | | | 642 | | |
| Class B | | | 65 | | |
| Class C | | | 54 | | |
| Class C2 | | | 8 | | |
| Class M | | | 4 | | |
| Total expenses | | | 2,454 | | |
| Net Investment Income (Loss) | | | 3,504 | | |
| Net Realized and Unrealized Gain (Loss): | | | |
| Realized gain (loss) from investment securities | | | 16,278 | | |
Increase (decrease) in unrealized appreciation
(depreciation) on investment securities | | | (6,610 | ) | |
| Net Gain (Loss) on Investments | | | 9,668 | | |
Net Increase (Decrease) in Net Assets Resulting
from Operations | | $ | 13,172 | | |
The notes to the financial statements are an integral part of this report.
Transamerica IDEX Mutual Funds
Annual Report 2004
7
TA IDEX Transamerica Convertible Securities
STATEMENTS OF CHANGES IN NET ASSETS
For the years ended
(all amounts in thousands)
| | | October 31,
2004 | | October 31,
2003 | |
| Increase (Decrease) in Net Assets From: | | | |
| Operations: | | | |
| Net investment income (loss) | | $ | 3,504 | | | $ | 1,785 | | |
Net realized gain (loss) from
investment securities | | | 16,278 | | | | 3,558 | | |
Net unrealized appreciation
(depreciation) on investment
securities | | | (6,610 | ) | | | 12,078 | | |
| | | | 13,172 | | | | 17,421 | | |
| Distributions to Shareholders: | | | |
| From net investment income: | |
| Class A | | | (3,482 | ) | | | (1,469 | ) | |
| Class B | | | (85 | ) | | | (51 | ) | |
| Class C | | | (70 | ) | | | (21 | ) | |
| Class C2 | | | (11 | ) | | | (17 | ) | |
| Class M | | | (6 | ) | | | (7 | ) | |
| | | | (3,654 | ) | | | (1,565 | ) | |
| From net realized gains: | |
| Class A | | | (13,842 | ) | | | – | | |
| Class B | | | (501 | ) | | | – | | |
| Class C | | | (412 | ) | | | – | | |
| Class C2 | | | (92 | ) | | | – | | |
| Class M | | | (37 | ) | | | – | | |
| | | | (14,884 | ) | | | – | | |
| Capital Share Transactions: | | | |
| Proceeds from shares sold: | |
| Class A | | | 1,441 | | | | 150,345 | | |
| Class B | | | 1,806 | | | | 5,369 | | |
| Class C | | | 915 | | | | 4,921 | | |
| Class C2 | | | 572 | | | | 761 | | |
| Class M | | | 174 | | | | 234 | | |
| | | | 4,908 | | | | 161,630 | | |
Dividends and distributions
reinvested: | |
| Class A | | | 17,303 | | | | 1,466 | | |
| Class B | | | 422 | | | | 31 | | |
| Class C | | | 362 | | | | 15 | | |
| Class C2 | | | 62 | | | | 11 | | |
| Class M | | | 43 | | | | 7 | | |
| | | | 18,192 | | | | 1,530 | | |
| Cost of shares redeemed: | |
| Class A | | | (1,053 | ) | | | (1,341 | ) | |
| Class B | | | (2,085 | ) | | | (763 | ) | |
| Class C | | | (2,547 | ) | | | (219 | ) | |
| Class C2 | | | (632 | ) | | | (701 | ) | |
| Class M | | | (208 | ) | | | (154 | ) | |
| | | | (6,525 | ) | | | (3,178 | ) | |
| Class level exchanges: | |
| Class C | | | 1,631 | | | | – | | |
| Class C2 | | | (1,164 | ) | | | – | | |
| Class M | | | (467 | ) | | | – | | |
| | | | – | | | | – | | |
| Automatic conversions: | |
| Class A | | | 61 | | | | – | | |
| Class B | | | (61 | ) | | | – | | |
| | | | – | | | | – | | |
| | | | 16,575 | | | | 159,982 | | |
| Net increase (decrease) in net assets | | | 11,209 | | | | 175,838 | | |
| | | October 31,
2004 | | October 31,
2003 | |
| Net Assets: | |
| Beginning of year | | $ | 188,423 | | | $ | 12,585 | | |
| End of year | | $ | 199,632 | | | $ | 188,423 | | |
Undistributed Net Investment Income
(Loss) | | $ | 104 | | | $ | 252 | | |
| Share Activity: | |
| Shares issued: | |
| Class A | | | 125 | | | | 14,376 | | |
| Class B | | | 158 | | | | 525 | | |
| Class C | | | 82 | | | | 465 | | |
| Class C2 | | | 49 | | | | 73 | | |
| Class M | | | 15 | | | | 24 | | |
| | | | 429 | | | | 15,463 | | |
Shares issued–reinvested from
distributions: | |
| Class A | | | 1,576 | | | | 137 | | |
| Class B | | | 38 | | | | 3 | | |
| Class C | | | 33 | | | | 1 | | |
| Class C2 | | | 6 | | | | 1 | | |
| Class M | | | 4 | | | | 1 | | |
| | | | 1,657 | | | | 143 | | |
| Shares redeemed: | |
| Class A | | | (93 | ) | | | (127 | ) | |
| Class B | | | (184 | ) | | | (74 | ) | |
| Class C | | | (236 | ) | | | (20 | ) | |
| Class C2 | | | (55 | ) | | | (67 | ) | |
| Class M | | | (18 | ) | | | (16 | ) | |
| | | | (586 | ) | | | (304 | ) | |
| Class level exchanges: | |
| Class C | | | 150 | | | | – | | |
| Class C2 | | | (107 | ) | | | – | | |
| Class M | | | (43 | ) | | | – | | |
| | | | – | | | | – | | |
| Automatic conversions: | |
| Class A | | | 7 | | | | – | | |
| Class B | | | (7 | ) | | | – | | |
| | | | – | | | | – | | |
Net increase (decrease) in shares
outstanding: | |
| Class A | | | 1,615 | | | | 14,386 | | |
| Class B | | | 5 | | | | 454 | | |
| Class C | | | 29 | | | | 446 | | |
| Class C2 | | | (107 | ) | | | 7 | | |
| Class M | | | (42 | ) | | | 9 | | |
| | | | 1,500 | | | | 15,302 | | |
The notes to the financial statements are an integral part of this report.
Transamerica IDEX Mutual Funds
Annual Report 2004
8
TA IDEX Transamerica Convertible Securities
FINANCIAL HIGHLIGHTS
| | | | | For a share of beneficial interest outstanding throughout each period | |
| | | | | Net Asset | | Investment Operations | | Distributions | | Net Asset | |
| | | For the
Period
Ended (d)(g) | | Value,
Beginning
of Period | | Net
Investment
Income (Loss) | | Net Realized
and Unrealized
Gain (Loss) | | Total
Operations | | From Net
Investment
Income | | From Net
Realized
Gains | | Total
Distributions | | Value,
End
of Period | |
| Class A | | 10/31/2004 | | $ | 11.32 | | | $ | 0.21 | | | $ | 0.56 | | | $ | 0.77 | | | $ | (0.22 | ) | | $ | (0.87 | ) | | $ | (1.09 | ) | | $ | 11.00 | | |
| | | 10/31/2003 | | | 9.39 | | | | 0.24 | | | | 1.92 | | | | 2.16 | | | | (0.23 | ) | | | – | | | | (0.23 | ) | | | 11.32 | | |
| | | 10/31/2002 | | | 10.00 | | | | 0.14 | | | | (0.67 | ) | | | (0.53 | ) | | | (0.08 | ) | | | – | | | | (0.08 | ) | | | 9.39 | | |
| Class B | | 10/31/2004 | | | 11.31 | | | | 0.14 | | | | 0.57 | | | | 0.71 | | | | (0.15 | ) | | | (0.87 | ) | | | (1.02 | ) | | | 11.00 | | |
| | | 10/31/2003 | | | 9.38 | | | | 0.17 | | | | 1.93 | | | | 2.10 | | | | (0.17 | ) | | | – | | | | (0.17 | ) | | | 11.31 | | |
| | | 10/31/2002 | | | 10.00 | | | | 0.11 | | | | (0.68 | ) | | | (0.57 | ) | | | (0.05 | ) | | | – | | | | (0.05 | ) | | | 9.38 | | |
| Class C | | 10/31/2004 | | | 11.31 | | | | 0.11 | | | | 0.57 | | | | 0.68 | | | | (0.15 | ) | | | (0.87 | ) | | | (1.02 | ) | | | 10.97 | | |
| | | 10/31/2003 | | | 9.36 | | | | 0.17 | | | | 1.95 | | | | 2.12 | | | | (0.17 | ) | | | – | | | | (0.17 | ) | | | 11.31 | | |
| | | | | | | Ratios/Supplemental Data | |
| | | For the
Period | | Total | | Net Assets,
End of
Period | | Ratio of Expenses
to Average
Net Assets (a) | | Net Investment
Income (Loss)
to Average | | Portfolio
Turnover | |
| | | Ended (g) | | Return (c) | | (000's) | | Net (e) | | Total (f) | | Net Assets (a) | | Rate (b) | |
| Class A | | 10/31/2004 | | | 7.06 | % | | $ | 188,049 | | | | 1.20 | % | | | 1.20 | % | | | 1.83 | % | | | 157 | % | |
| | | 10/31/2003 | | | 23.49 | | | | 175,175 | | | | 1.33 | | | | 1.33 | | | | 2.27 | | | | 119 | | |
| | | 10/31/2002 | | | (5.42 | ) | | | 10,205 | | | | 1.73 | | | | 3.85 | | | | 2.59 | | | | 170 | | |
| Class B | | 10/31/2004 | | | 6.52 | | | | 6,379 | | | | 1.79 | | | | 1.79 | | | | 1.24 | | | | 157 | | |
| | | 10/31/2003 | | | 22.58 | | | | 6,508 | | | | 1.98 | | | | 1.98 | | | | 1.62 | | | | 119 | | |
| | | 10/31/2002 | | | (5.68 | ) | | | 1,138 | | | | 2.38 | | | | 4.50 | | | | 1.94 | | | | 170 | | |
| Class C | | 10/31/2004 | | | 6.33 | | | | 5,204 | | | | 2.05 | | | | 2.05 | | | | 0.98 | | | | 157 | | |
| | | 10/31/2003 | | | 22.84 | | | | 5,048 | | | | 1.98 | | | | 1.98 | | | | 1.62 | | | | 119 | | |
NOTES TO FINANCIAL HIGHLIGHTS
(a) Annualized.
(b) Not annualized for periods of less than one year.
(c) Total Return has been calculated for the applicable period without deduction of a sales load, if any, on an initial purchase. Periods of less than one year are not annualized.
(d) Per share information is calculated based on average number of shares outstanding.
(e) Ratio of Net Expenses to Average Net Assets is net of fee waivers and reimbursements by the investment adviser, if any (see note 2).
(f) Ratio of Total Expenses to Average Net Assets includes all expenses before fee waivers and reimbursements by the investment adviser.
(g) TA IDEX Transamerica Convertible Securities ("the Fund") commenced operations on March 1, 2002. The inception date for the Fund's offering of share Class L was November 11, 2002. Class L was renamed Class C on March 1, 2004 (see note 1).
The notes to the financial statements are an integral part of this report.
Transamerica IDEX Mutual Funds
Annual Report 2004
9
TA IDEX Transamerica Convertible Securities
NOTES TO FINANCIAL STATEMENTS
At October 31, 2004
(all amounts in thousands)
NOTE 1. ORGANIZATION AND SIGNIFICANT ACCOUNTING POLICIES
Transamerica IDEX Mutual Funds, formerly IDEX Mutual Funds, is a Massachusetts business trust registered under the Investment Company Act of 1940, as amended (the "1940 Act"), as an open-end management investment company. TA IDEX Transamerica Convertible Securities ("the Fund"), part of Transamerica IDEX Mutual Funds, began operations on March 1, 2002.
On March 1, 2004, the Fund changed its name from IDEX Transamerica Convertible Securities to TA IDEX Transamerica Convertible Securities.
In the normal course of business, the Fund enters into contracts that contain a variety of representations and warranties, which provide general indemnifications. The Fund's maximum exposure under these arrangements is unknown, as this would involve future claims that may be made against the Fund and/or its affiliates that have not yet occurred. However, based on experience, the Fund expects the risk of loss to be remote.
See the Prospectus and Statement of Additional Information for a description of the Fund's investment objective.
In preparing the Fund's financial statements in accordance with accounting principles generally accepted in the United States of America ("GAAP"), estimates or assumptions (which could differ from actual results) may be used that affect reported amounts and disclosures. The following policies were consistently followed by the Fund, in accordance with GAAP.
Multiple class operations and expenses: The Fund currently offers three classes of shares, each with a public offering price that reflects different sales charges, if any, and expense levels. All shares designated as Class C shares prior to March 1, 2004, were renamed as Class C2 shares on that date. All shares designated as Class L shares prior to March 1, 2004, were renamed as Class C shares with different sales charges than the previous Class L shares. On June 15, 2004, Class C2 shares merged into Class C. On September 24, 2004, Class M shares merged into Class C. Class B shares will convert to Class A shares eight years after purchase. Income, non-class specific expenses and realized and unrealized gains and losses, are allo cated daily to each class, based upon the value of shares outstanding method as permitted under Rule 18f-3 of the 1940 Act. Each class bears its own specific expenses as well as a portion of general, common expenses.
Pricing of shares: The Fund prices its shares on the basis of the net asset value of each class of shares of the Fund, which is determined as of the close of the New York Stock Exchange ("NYSE") (generally 4:00 p.m. Eastern Time) on each day on which the NYSE is open for trading (other than a day on which there are insufficient changes in the value of the Fund's portfolio securities to materially affect the Fund's net asset value or a day on which no shares are tendered for redemption and no order to purchase any shares is received).
Security valuations: Fund investments traded on an exchange are valued at the closing price on the day of valuation on the exchange where the security is principally traded. With respect to securities traded on NASDAQ NMS, such closing price may be the last reported sales price or the NASDAQ Official Closing Price.
Securities traded in the over-the-counter market and listed securities for which no sale was reported on that date are valued at the last quoted bid price.
Debt securities are valued by independent pricing services; however, those that mature in sixty days or less are valued at amortized cost, which approximates market.
Investment company securities are valued at net asset value of the underlying portfolio.
Other securities for which quotations are not readily available are valued at fair market value as determined in good faith using guidelines adopted by the Board of Trustees of the Fund, under the supervision of the Fund's Valuation Committee.
Cash: The Fund may leave cash overnight in its cash account with the custodian, Investors Bank & Trust Company ("IBT"). IBT has been contracted on behalf of the Fund to invest the excess cash into a savings account, which at October 31, 2004, was paying an interest rate of 1.30%.
Throughout the year, the Fund may have a cash overdraft balance. A fee is incurred on this overdraft, calculated by multiplying the overdraft by a rate based on the federal funds rate. This fee is included in Custody fees in the Statement of Operations.
Repurchase agreements: The Fund is authorized to enter into repurchase agreements. The Fund, through IBT, receives delivery of the underlying securities, the value of which at the time of purchase is required to be an amount equal to at least 100% of the resale price. Repurchase agreements involve the risk that the seller will fail to repurchase the security, as agreed. In that case, the Fund will bear the risk of value fluctuations until the security can be sold and may encounter delays and incur costs in liquidating the security. In the event of bankruptcy or insolvency of the seller, delays and costs may be incurred.
Securities lending: The Fund may lend securities to enhance fund earnings from investing cash collateral in making such loans to qualified borrowers (typically broker/dealers). The Fund has engaged its custodian bank, IBT, as a lending agent to administer its securities lending program. IBT earned $28 of program income for its services. When the Fund makes a security loan, it receives cash collateral as protection against the risk that the borrower will default on the loan,
Transamerica IDEX Mutual Funds
Annual Report 2004
10
TA IDEX Transamerica Convertible Securities
NOTES TO FINANCIAL STATEMENTS (continued)
At October 31, 2004
(all amounts in thousands)
NOTE 1.–(continued)
and records an asset for the cash invested collateral and a liability for the return of the collateral.
Securities on loan are included in Investment securities at value in the Statement of Assets and Liabilities and remain on the Schedule of Investments.
Loans of securities are required to be secured by collateral at least equal to 102% of the value of the securities at inception of the loan, and not less then 100% thereafter. The Fund may invest cash collateral in short-term money market instruments including: U.S. Treasury Bills, U.S. agency obligations, commercial paper, money market mutual funds, repurchase agreements and other highly rated, liquid investments. During the life of securities loans, the collateral and securities loaned remain subject to fluctuation in value. IBT marks to market securities loaned and the collateral each business day. If additional collateral is due (at least $1), IBT collects additional cash collateral from the borrowers. Although securities loaned will be fully collateralized at all times, IBT may experience delays in, or may be prevented from, recovering the collateral on behalf of the Fund. The Fund may recall a loa ned security position at any time from the borrower through IBT. In the event the borrower fails to timely return a recalled security, IBT may indemnify the Fund by purchasing replacement securities for the Fund at its own expense and claiming the collateral to fund such a purchase. IBT absorbs the loss if the collateral value is not sufficient to cover the cost of the replacement securities. If replacement securities are not available, IBT will credit the equivalent cash value to the Fund.
While a security is on loan, the Fund does not have the right to vote that security. However, if time permits, the Fund will attempt to recall a security on loan and vote the proxy.
Income from securities lending is included in the Statement of Operations. The amount of collateral and value of securities on loan are included in the Statement of Assets and Liabilities as well as in the Schedule of Investments.
Security transactions and investment income: Security transactions are recorded on the trade date. Security gains and losses are calculated on the specific identification basis. Dividend income is recorded on the ex-dividend date or, in the case of foreign securities, as soon as the Fund is informed of the ex-dividend date. Interest income, including accretion of discounts and amortization of premiums, is recorded on the accrual basis commencing on the settlement date.
Account maintenance fees: If the shareholder account balance falls below $1 by either shareholder action or as a result of market action, a $25 (not in thousands) fee is assessed every year until the balance reaches $1. The fee is assessed by redeeming shares in the shareholder's account.
No fee will be charged under the following conditions:
• accounts opened within the preceding 24 months
• accounts with an active monthly Automatic Investment Plan ($50 (not in thousands) minimum per fund)
• accounts owned by an individual which, when combined by social security number, have a balance of $5 or more
• accounts owned by individuals in the same household (by address) that have a combined balance of $5 or more
• UTMA/UGMA accounts
• Fiduciary accounts
• B-share accounts whose shares have started to convert to
A-shares accounts (as long as combined value of both accounts is at least $1)
For the year ended October 31, 2004, there were no fees. These fees are included in Paid in Capital in the Statement of Assets and Liabilities.
Redemption fees: A short-term trading redemption fee may be assessed on any fund shares in a fund account that are sold during the first five (5) New York Stock Exchange trading days following their purchase date. This redemption fee will equal 2% of the amount redeemed and shares held the longest will be treated as being redeemed first and shares held the shortest as being redeemed last. For the year ended October 31, 2004, the Fund received no redemption fees.
Dividend distributions: Distributions to shareholders are recorded on the ex-dividend date and are determined in accordance with Federal income tax regulations which may differ from GAAP.
NOTE 2. RELATED PARTY TRANSACTIONS
AEGON/Transamerica Fund Advisers, Inc. ("ATFA") is the Fund's investment adviser. AEGON/Transamerica Fund Services, Inc. ("ATFS") is the Fund's administrator. AFSG Securities Corp. ("AFSG") is the Fund's distributor/principal underwriter. AEGON/Transamerica Investor Services, Inc. ("ATIS") is the Fund's transfer agent. ATIS and AFSG are 100% owned by AUSA Holding Company ("AUSA"). ATFA is a directly owned subsidiary of Western Reserve Life Assurance Co. of Ohio (78%) ("WRL") and AUSA (22%). ATFS is a wholly owned subsidiary of WRL. AUSA and WRL are wholly owned indirect subsidiaries of AEGON NV, a Netherlands corporation.
Transamerica Investment Management, LLC is both an affiliate of the Fund and a sub-adviser to the Fund.
Transamerica IDEX Mutual Funds
Annual Report 2004
11
TA IDEX Transamerica Convertible Securities
NOTES TO FINANCIAL STATEMENTS (continued)
At October 31, 2004
(all amounts in thousands)
NOTE 2.–(continued)
The following schedule represents the percentage of fund assets owned by affiliated mutual funds (i.e. through the asset allocation funds):
| | | Net
Assets | | % of
Net Assets | |
| TA IDEX Asset Allocation–Conservative | | $ | 44,748 | | | | 22 | % | |
TA IDEX Asset Allocation–
Moderate Growth | | | 57,265 | | | | 29 | % | |
| TA IDEX Asset Allocation–Moderate | | | 80,428 | | | | 40 | % | |
| Total | | $ | 182,441 | | | | 91 | % | |
Investment advisory fee: The Fund pays management fees to ATFA based on average daily net assets ("ANA") at the following rate:
0.75% of ANA
ATFA has contractually agreed to waive its advisory fee and will reimburse the Fund to the extent that operating expenses, excluding 12b-1 fees, exceed the following stated annual limit:
1.35% Expense Limit
If total fund expenses fall below the annual expense limitation agreement agreed to by the adviser within the succeeding three years, the Fund may be required to pay that adviser a portion or all of the waived advisory fees.
There were no amounts recaptured during the fiscal year ended October 31, 2004. There are no amounts subject to recapture at October 31, 2004.
Distribution and service fees: The Fund has a 12b-1 distribution plan under the 1940 Act pursuant to which an annual fee, based on average daily net assets, is paid to the distributor for various disbursements such as broker-dealer account servicing fees and other promotional expenses of the Fund. The Fund is authorized under the 12b-1 plan to pay fees on each class up to the following limits:
| Class A | | | 0.35 | % | |
| Class B | | | 1.00 | % | |
| Class C | | | 1.00 | % | |
| Class C2 | | | 1.00 | % | |
| Class M | | | 0.90 | % | |
Class C2 and Class M merged into Class C on June 15, 2004 and September 24, 2004, respectively.
In the case the Fund or a class of shares of the Fund is closed to new investors or investments, the Fund is authorized to pay 12b-1 fees for past sales and distribution efforts and present and past investor services.
Underwriter commissions relate to front-end sales charges imposed for Class A and M shares and contingent deferred sales charges from Classes B, C, M and certain A share redemptions. For the year ended October 31, 2004, the underwriter commissions were as follows:
| Received by Underwriter | | $ | 192 | | |
| Retained by Underwriter | | | 5 | | |
| Contingent Deferred Sales Charge | | | 42 | | |
Administrative services: The Fund has entered into an agreement with ATFS for financial and legal fund administration services, which includes such items as compliance, expenses, financial statements and other reporting, distributions, tax returns, prospectus preparation, board of trustees meeting support and other legal matters. The Fund pays ATFS an annual fee of 0.015% of average net assets. The Legal fees on the Statement of Operations are for fees paid to external legal counsel.
The Fund paid ATFS $31 for the year ended October 31, 2004.
Transfer agent fees: The Fund pays ATIS an annual per-account charge of $20 (not in thousands) for each open account and $1.63 (not in thousands) for each closed account. There is no new account charge. The transfer agent fees on the Statement of Operations are made up of fees paid to ATIS and costs associated with shareholder statements. The Fund paid ATIS $22 for the year ended October 31, 2004.
Deferred compensation plan: Each eligible Fund Trustee may elect participation in the Deferred Compensation Plan ("the Plan"). Under the Plan, such Trustees may defer payment of a percentage of their total fees earned as a Fund Trustee. These deferred amounts may be invested in any Transamerica IDEX Mutual Fund. At October 31, 2004, the value of invested plan amounts was $5. Invested plan amounts and the total liability for deferred compensation to the Trustees under the Plan at October 31, 2004, are included in the accompanying Statement of Assets and Liabilities.
NOTE 3. INVESTMENT TRANSACTIONS
The cost of securities purchased and proceeds from securities sold (excluding short-term securities) for the year ended October 31, 2004, were as follows:
| Purchases of securities: | | | |
| Long-Term excluding U.S. Government | | $ | 308,349 | | |
| U.S. Government | | | – | | |
| Proceeds from maturities and sales of securities | | | |
| Long-Term excluding U.S. Government | | | 305,051 | | |
| U.S. Government | | | – | | |
Transamerica IDEX Mutual Funds
Annual Report 2004
12
TA IDEX Transamerica Convertible Securities
NOTES TO FINANCIAL STATEMENTS (continued)
At October 31, 2004
(all amounts in thousands)
NOTE 4. FEDERAL INCOME TAX MATTERS
The Fund has not made any provision for federal income or excise taxes due to its policy to distribute all of its taxable income and capital gains to its shareholders and otherwise qualify as a regulated investment company under the Internal Revenue Code. Income and capital gain distributions are determined in accordance with income tax regulations, which may differ from GAAP. These differences are primarily due to differing treatment for items including, but not limited to, wash sales.
Reclassifications between Undistributed net investment income (loss), Undistributed net realized capital gains (loss) and Shares of beneficial interest are made to reflect income and gains available for distribution under federal tax regulations. Results of operations and net assets are not effected by these reclassifications. These reclassifications are as follows:
Shares of beneficial interest, unlimited
shares authorized | | $ | (2 | ) | |
| Undistributed net investment income (loss) | | | 2 | | |
The tax character of distributions paid may differ from the character of distributions shown in the Statement of Changes in Net Assets due to short-term gains being treated as ordinary income for tax purposes. The tax character of distributions paid during 2003 and 2004 was as follows:
| 2003 Distributions paid from: | |
| Ordinary Income | | $ | – | | |
| Long-term Capital Gain | | $ | – | | |
| 2004 Distributions paid from: | |
| Ordinary Income | | $ | 17,139 | | |
| Long-term Capital Gain | | $ | 1,399 | | |
The tax basis components of distributable earnings as of October 31, 2004, are as follows:
| Undistributed Ordinary Income | | $ | 3,854 | | |
| Undistributed Long-term Capital Gains | | $ | 860 | | |
| Capital Loss Carryforward | | $ | – | | |
| Net Unrealized Appreciation (Depreciation) | | $ | 5,294 | | |
The aggregate cost of investments and composition of unrealized appreciation (depreciation) for federal income tax purposes as of October 31, 2004, are as follows:
| Federal Tax Cost Basis | | $ | 237,596 | | |
| Unrealized Appreciation | | $ | 5,294 | | |
| Unrealized (Depreciation) | | | – | | |
| Net Unrealized Appreciation (Depreciation) | | $ | 5,294 | | |
NOTE 5. OTHER MATTERS
Transamerica IDEX Mutual Funds ("TA IDEX"), and certain of its affiliated entities, have received requests for information from the Staff of the Securities and Exchange Commission in connection with market timing and late trading within the funds. TA IDEX and the affiliated entities have voluntarily cooperated in the investigation and have been providing the information as requested.
Transamerica IDEX Mutual Funds
Annual Report 2004
13
Report of Independent Registered Certified Public Accounting Firm
To the Board of Trustees and Shareholders of
TA IDEX Transamerica Convertible Securities
In our opinion, the accompanying statement of assets and liabilities, including the schedule of investments, and the related statements of operations and of changes in net assets and the financial highlights present fairly, in all material respects, the financial position of TA IDEX Transamerica Convertible Securities (the "Fund") (one of the portfolios constituting the Transamerica IDEX Mutual Funds) at October 31, 2004, the results of its operations for the year then ended, the changes in its net assets for each of the two years in the period then ended and the financial highlights for each of the periods indicated, in conformity with accounting principles generally accepted in the United States of America. These financial statements and financial highlights (hereafter referred to as "financial statements") are the responsibility of the Fund's management; our responsibility is to express an opinion on these financial statements based on our audits. We conducted our audits of these financial statements in accordance with the standards of the Public Company Accounting Oversight Board (United States). Those standards require that we plan and perform the audit to obtain reasonable assurance about whether the financial statements are free of material misstatement. An audit includes examining, on a test basis, evidence supporting the amounts and disclosures in the financial statements, assessing the accounting principles used and significant estimates made by management, and evaluating the overall financial statement presentation. We believe that our audits, which included confirmation of securities at October 31, 2004 by correspondence with the custodian and brokers, provide a reasonable basis for our opinion.

PricewaterhouseCoopers LLP
Tampa, Florida
December 28, 2004
Transamerica IDEX Mutual Funds
Annual Report 2004
14
TA IDEX Transamerica Convertible Securities
SUPPLEMENTAL INFORMATION (unaudited)
TAX INFORMATION
For tax purposes, the Fund has made a Long-Term Capital Gain Designation of $1,398 for the year ended October 31, 2004.
For dividends paid during the year ended October 31, 2004, the Fund designated $1,491 as qualified dividend income.
For corporate shareholders, 8% of investment income (dividend income plus short-term gains, if any) qualifies for the dividends received deduction.
The information and distributions reported herein may differ from the information and distributions taxable to the shareholders for the calendar year ending December 31, 2004. Complete information will be computed and reported in conjunction with your 2004 Form 1099-DIV.
RESULTS OF SHAREHOLDER PROXY
At a special meeting of Class M shareholders of each series of Transamerica IDEX (except TA IDEX Federated Tax Exempt and TA IDEX Protected Principal Stock), as listed above, held on September 2, 2004, the results of the Proposal were as follows:
Proposal 1: Approval of conversion of Class M shares into Class C shares of the Funds, which will result in bearing the distribution and service fees payable under the 12b-1 Plan of Distribution for the Class C shares of the Funds.
| For | | Against | | Abstentions/Broker Non-Votes | |
| | 96.43 | % | | | 0.28 | % | | | 3.29 | % | |
The notes to the financial statements are an integral part of this report.
Transamerica IDEX Mutual Funds
Annual Report 2004
15
TA IDEX Transamerica Equity
MARKET ENVIRONMENT
The large-cap U.S. equity market evolved from strongly optimistic to decidedly cautious in the twelve months ended October 31, 2004. Initially, in response to sizable year-over-year corporate earnings growth and improving economic data, the Standard and Poor's 500 Composite Stock Index ("S&P 500") climbed swiftly. High-flying technology and Internet-related stocks led the advance. Later, employment growth remained below expectations, raising doubts about how long the economic recovery, earnings and stock prices could continue to improve if lack of income caused consumers to rein in their spending. Added to this were the impact of stepped-up short-term interest rates, continued geopolitical tensions and rapidly rising energy prices, all of which overshadowed generally positive trends in business spending and corporate earnings. Market leadership shifted, with many high-priced technology st ocks losing ground while energy and materials companies saw double-digit gains. In the end, the S&P 500 delivered a twelve-month total return of 9.41%.
PERFORMANCE
For the year ended October 31, 2004, TA IDEX Transamerica Equity, Class A returned 8.45%. By comparison its benchmark, the S&P 500, returned 9.41%.
STRATEGY REVIEW
We attribute the portfolio's strong showing to our continued emphasis on steadily growing businesses that entail relatively little business risk.
As always, the portfolio contained a relatively limited number of investments in companies that, in our view, can deliver steady growth over time, due to the strength of their management teams, stable balance sheets, considerable free cash flow, and strongly positive secular trends and competitive positions in new markets. Focusing on these and other key attributes, we seek to find companies with limited business risk, which we consider the single most important factor in controlling overall portfolio volatility.
Among the largest contributors to total return were QUALCOMM, Inc. ("QUALCOMM") and XM Satellite Radio, Inc. ("XM"), both strong competitors in new telecommunications markets, and Expeditors International of Washington, Inc., an arranger of global freight transport that has done well as economies expanded worldwide.
QUALCOMM is a leading chip supplier for Code Division Multiple Access ("CDMA")-based telecommunications devices (such as SANYO Electric Co., Inc. and Samsung Electronics Co., Ltd. cell phones). As such, it has been a major beneficiary of the rapid growth in cell phone usage worldwide, repeatedly exceeding earnings estimates in the past four quarters. XM, which provides individuals with 100 digital-quality radio channels and few commercial interruptions, caught investors' attention early in 2003 as its balance sheet improved and consumer interest in its product picked up. The company reported solid subscribership increases during the period.
The gains for these and other stocks were partially diluted by losses for IAC/InterActive Corp.("InterActive"), Intel Corporation ("Intel") (semiconductors) and State Street Corporation ("State Street"). We acquired our shares of InterActive, a conglomerate of Internet services providers, when that company purchased Expedia, Inc. ("Expedia"), the online travel reservations services. We sold those shares early in 2004 because InterActive did not fit our investment thesis as well as Expedia had. We also eliminated our positions in State Street, an investment firm where we foresee weakening fundamentals, and in Intel, which has suffered from softer than expected demand for personal computers.
Jeffrey S. Van Harte, CFA
Gary U. Rolle, CFA
Co-Fund Managers
Transamerica Investment Management, LLC.
Transamerica IDEX Mutual Funds
Annual Report 2004
1
TA IDEX Transamerica Equity
Comparison of change in value of $10,000 investment in Class A shares and its comparative index.
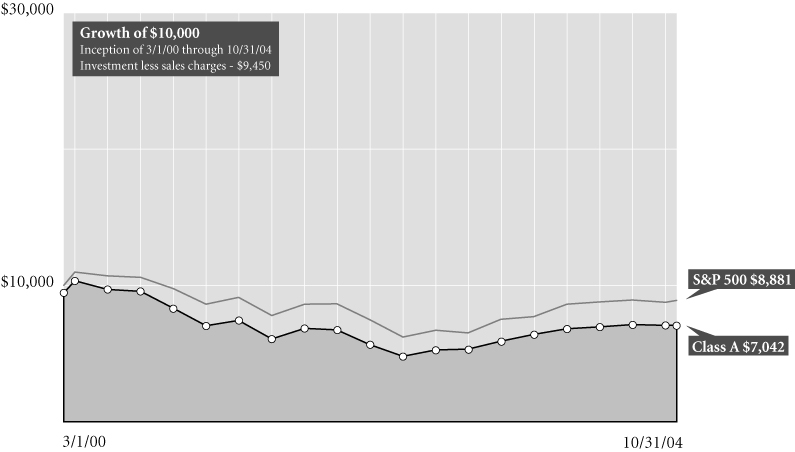
Average Annual Total Return for Periods Ended 10/31/04
| | | 1 year | | From
Inception | | Inception
Date | |
| Class A (NAV) | | | 8.45 | % | | | (6.13 | )% | | 3/1/00 | |
| Class A (POP) | | | 2.49 | % | | | (7.26 | )% | | 3/1/00 | |
| S&P 5001 | | | 9.41 | % | | | (2.51 | )% | | 3/1/00 | |
| Class B (NAV) | | | 7.68 | % | | | (6.81 | )% | | 3/1/00 | |
| Class B (POP) | | | 2.68 | % | | | (7.01 | )% | | 3/1/00 | |
| Class C (NAV) | | | 7.78 | % | | | 16.87 | % | | 11/11/02 | |
| Class C (POP) | | | 6.78 | % | | | 16.87 | % | | 11/11/02 | |
NOTES
1 The Standard & Poor's 500 Composite Stock (S&P 500) Index is an unmanaged index used as a general measure of market performance. Calculations assume dividends and capital gains are reinvested and do not include any managerial expenses. From inception calculation is based on life of Class A shares. Source: Standard & Poor's Micropal®© Micropal, Inc. 2004 – 1-800-596-5323 – http://www.micropal.com.
The performance data presented represents past performance, future results may vary. Performance data does not reflect the deduction of taxes that would be paid on fund distributions or the redemption of fund shares. Investment return and principal value will fluctuate so that an investor's shares, when redeemed, may be worth more or less than their original cost. Current performance may be lower or higher than performance quoted.
Public Offering Price (POP) returns include the reinvestment of dividends and capital gains and reflect the maximum sales charge of 5.5% for A shares or the maximum applicable contingent deferred sales charge (5% in the 1st year, decreasing to 0% after 6 years) for Class B shares and 1% (during the first 12 months) for Class C shares. Shares purchased prior to March 1, 2004 are subject to a maximum applicable contingent deferred sales charge (5% in the 1st year, decreasing to 0% after 7 years) for Class B shares and (2% in the 1st year, decreasing to 0% after 2 years) for Class C shares. Net Asset Value (NAV) returns include the reinvestment of dividends and capital gains but do not reflect any sales charges.
This material must be preceded or accompanied by a current prospectus, which includes specific contents regarding the investment objectives and policies of this fund.
Transamerica IDEX Mutual Funds
Annual Report 2004
2
TA IDEX Transamerica Equity
UNDERSTANDING YOUR FUND'S EXPENSES (unaudited)
SHAREHOLDER EXPENSES
The following Example is intended to help you understand your ongoing costs (in dollars and cents) of investing in a Fund and to compare these costs with the ongoing costs of investing in other funds.
The Example is based on an investment of $1,000 invested at the beginning of the period and held for the entire period from May 1, 2004 to October 31, 2004.
ACTUAL EXPENSES
The first line in the table below provides information about actual account values and actual expenses. You may use the information in this line, together with the amount you invested, to estimate the expenses that you paid over the period. Simply divide your account value by $1,000 (for example, an $8,600 account value divided by $1,000 = 8.6), then multiply the result by the number in the first line of your Fund under the heading entitled "Expenses Paid During Period" to estimate the expenses you paid on your account during this period.
HYPOTHETICAL EXAMPLE FOR COMPARISON PURPOSES
The second line in the table below provides information about hypothetical account values and hypothetical expenses based on each Fund's actual expense ratio and an assumed rate of return of 5% per year before expenses, which is not the Fund's actual return. The hypothetical account values and expenses may not be used to estimate the actual ending account balance or expenses you paid for the period. You may use this information to compare the ongoing costs of investing in your Fund and other funds. To do so, compare this 5% hypothetical example with the 5% hypothetical examples that appear in the shareholder reports of the other funds.
Please note that the expenses shown in the table are meant to highlight your ongoing costs only and do not reflect any transactional costs, such as sales charges, redemption fees, brokerage commissions paid on purchases and sales of fund shares. Therefore, the second line under each Fund in the table is useful in comparing ongoing costs only, and will not help you determine the relative total costs of owning different funds. In addition, note that the expenses shown in the table are meant to highlight your ongoing costs and do not reflect any transaction costs.
| | | Beginning
Account
Value | | Ending
Account
Value | | Annualized
Expense
Ratio | | Expenses Paid
During
Period(a) | |
| Class A | | | |
| Actual | | $ | 1,000.00 | | | $ | 1,016.40 | | | | 1.53 | % | | $ | 7.75 | | |
| Hypothetical(b) | | | 1,000.00 | | | | 1,017.44 | | | | 1.53 | | | | 7.76 | | |
| Class B | | | |
| Actual | | | 1,000.00 | | | | 1,013.10 | | | | 2.21 | | | | 11.18 | | |
| Hypothetical(b) | | | 1,000.00 | | | | 1,014.03 | | | | 2.21 | | | | 11.19 | | |
| Class C | | | |
| Actual | | | 1,000.00 | | | | 1,014.10 | | | | 2.22 | | | | 11.24 | | |
| Hypothetical(b) | | | 1,000.00 | | | | 1,013.98 | | | | 2.22 | | | | 11.24 | | |
(a) Expenses are calculated using each Fund's annualized expense ratio (as disclosed in the table), multiplied by the average account value for the period, multiplied by number of days in the period (184 days), and divided by the number of days in the year (366 days).
(b) 5% return per year before expenses.
GRAPHIC PRESENTATION OF SCHEDULE OF INVESTMENTS
By Sector Breakdown
At October 31, 2004
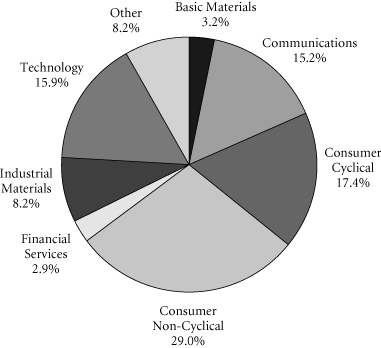
This chart shows the percentage breakdown by sector of the Fund's total investment securities.
Transamerica IDEX Mutual Funds
Annual Report 2004
3
TA IDEX Transamerica Equity
SCHEDULE OF INVESTMENTS
At October 31, 2004
(all amounts except share amounts in thousands)
| | | Shares | | Value | |
| COMMON STOCKS (97.5%) | |
| Business Services (8.6%) | |
| First Data Corp. | | | 285,000 | | | $ | 11,765 | | |
| Moody's Corp. | | | 120,000 | | | | 9,337 | | |
| Chemicals & Allied Products (3.4%) | |
| Praxair, Inc. | | | 200,000 | | | | 8,440 | | |
| Commercial Banks (3.1%) | |
| Northern Trust Corp. | | | 180,000 | | | | 7,657 | | |
| Communication (9.9%) | |
| EchoStar Communications Corp.–Class A (a) | | | 225,000 | | | | 7,114 | | |
| Liberty Media International, Inc.–Class A (a) | | | 225,000 | | | | 8,111 | | |
| XM Satellite Radio Holdings, Inc.–Class A (a)(b) | | | 285,000 | | | | 9,211 | | |
| Communications Equipment (5.5%) | |
| QUALCOMM, Inc. | | | 325,000 | | | | 13,588 | | |
| Computer & Data Processing Services (7.7%) | |
| Intuit, Inc. (a) | | | 155,000 | | | | 7,031 | | |
| Microsoft Corp. | | | 360,000 | | | | 10,076 | | |
| Yahoo!, Inc. (a) | | | 50,000 | | | | 1,809 | | |
| Computer & Office Equipment (5.1%) | |
| Lexmark International, Inc. (a) | | | 78,000 | | | | 6,483 | | |
| Sandisk Corp. (a)(b) | | | 295,000 | | | | 6,157 | | |
| Drug Stores & Proprietary Stores (3.1%) | |
| Walgreen Co. | | | 215,000 | | | | 7,716 | | |
| Fabricated Metal Products (3.4%) | |
| Gillette Co. (The) | | | 200,000 | | | | 8,296 | | |
| Hotels & Other Lodging Places (5.3%) | |
| Marriott International, Inc.–Class A | | | 130,000 | | | | 7,084 | | |
| MGM Mirage, Inc. (a)(b) | | | 110,000 | | | | 5,918 | | |
| Insurance (4.4%) | |
| WellPoint Health Networks (a) | | | 110,000 | | | | 10,743 | | |
| Management Services (3.7%) | |
| Paychex, Inc. | | | 280,000 | | | | 9,182 | | |
| Manufacturing Industries (2.7%) | |
| International Game Technology | | | 200,000 | | | | 6,608 | | |
| Medical Instruments & Supplies (3.9%) | |
| Zimmer Holdings, Inc. (a) | | | 125,000 | | | | 9,699 | | |
| Personal Services (2.8%) | |
| Weight Watchers International, Inc. (a)(b) | | | 190,000 | | | | 6,825 | | |
| Pharmaceuticals (8.9%) | |
| Allergan, Inc. | | | 135,000 | | | | 9,661 | | |
| Genentech, Inc. (a) | | | 185,000 | | | | 8,423 | | |
| Pfizer, Inc. | | | 135,000 | | | | 3,908 | | |
| | | Shares | | Value | |
| Retail Trade (4.0%) | | | |
| Staples, Inc. | | | 335,000 | | | $ | 9,963 | | |
| Transportation & Public Utilities (4.0%) | | | |
| Expeditors International of Washington, Inc. | | | 175,000 | | | | 9,993 | | |
| Trucking & Warehousing (4.7%) | | | |
| United Parcel Service, Inc.–Class B | | | 145,000 | | | | 11,481 | | |
| Variety Stores (3.3%) | | | |
| Wal-Mart Stores, Inc. | | | 150,000 | | | | 8,088 | | |
| Total Common Stocks (cost: $215,991) | | | | | | | 240,367 | | |
| | | Principal | | Value | |
| SECURITY LENDING COLLATERAL (8.6%) | | | |
| Debt (8.0%) | | | |
| Bank Notes (1.5%) | | | |
Bank of America
1.77%, due 12/03/2004
1.88%, due 12/23/2004
1.77%, due 01/18/2005 $1,042 | | | $1,042
347
695 | | | | 347
695 | | |
Canadian Imperial Bank of Commerce
1.86%, due 11/04/2004 | | | 1,563 | | | | 1,563 | | |
Credit Suisse First Boston Corp.
1.83%, due 09/09/2005 | | | 174 | | | | 174 | | |
| Commercial Paper (0.8%) | | | |
Clipper Receivables Corp.
1.79%, due 11/12/2004 | | | 517 | | | | 517 | | |
Delaware Funding Corp. 144A
1.85%, due 11/19/2004 | | | 174 | | | | 174 | | |
Falcon Asset Securitization Corp. 144A
1.78%, due 11/04/2004
1.75%, due 11/10/2004 | | | 518
695 | | | | 518
695 | | |
Galaxy Funding 144A
1.88%, due 11/22/2004 | | | 174 | | | | 174 | | |
| Euro Dollar Terms (3.8%) | | | |
Bank of Montreal
1.88%, due 11/24/2004 | | | 1,645 | | | | 1,645 | | |
BNP Paribas
1.77%, due 11/10/2004
1.80%, due 11/23/2004
1.98%, due 12/27/2004 | | | 868
695
695 | | | | 868
695
695 | | |
Calyon
1.70%, due 11/24/2004 | | | 92 | | | | 92 | | |
Citigroup
2.06%, due 01/25/2005 | | | 1,736 | | | | 1,736 | | |
Den Danske Bank
1.82%, due 11/19/2004 | | | 868 | | | | 868 | | |
Dexia Group
2.04%, due 01/21/2005 | | | 403 | | | | 403 | | |
The notes to the financial statements are an integral part of this report.
Transamerica IDEX Mutual Funds
Annual Report 2004
4
TA IDEX Transamerica Equity
SCHEDULE OF INVESTMENTS (continued)
At October 31, 2004
(all amounts except share amounts in thousands)
| | | Principal | | Value | |
| Euro Dollar Terms (continued) | | | |
HBOS Halifax Bank of Scotland
2.03%, due 01/21/2005 | | $ | 347 | | | $ | 347 | | |
Royal Bank of Scotland
2.01%, due 01/20/2005 | | | 695 | | | | 695 | | |
Toronto Dominion Bank
1.70%, due 11/08/2004 | | | 347 | | | | 347 | | |
Wells Fargo
1.87%, due 11/22/2004 | | | 868 | | | | 868 | | |
| Promissory Notes (0.8%) | | | |
Goldman Sachs Group Inc.
1.90%, due 12/29/2004
1.88%, due 01/27/2005 | | | 729
1,215 | | | | 729
1,215 | | |
| Repurchase Agreements (1.1%) | | | |
Merrill Lynch & Co., Inc. (c)
1.92% Repurchase Agreement dated
10/29/2004 to be repurchased at $2,778
on 11/01/2004 | | | 2,778 | | | | 2,778 | | |
| | | Shares | | Value | |
| Investment Companies (0.6%) | | | |
| Money Market Funds (0.6%) | | | |
Merrill Lynch Premier Institutional Fund
1-day yield of 1.71% | | | 854,252 | | | | $854 | | |
Merrimac Cash Fund, Premium Class
1-day yield of 1.46% | | | 625,133 | | | | 625 | | |
| Total Security Lending Collateral (cost: $21,359) | | | | | | | 21,359 | | |
| Total Investment Securities (cost: $237,350) | | | | | | $ | 261,726 | | |
| SUMMARY: | | | |
| Investments, at value | | | 106.1 | % | | $ | 261,726 | | |
| Liabilities in excess of other assets | | | (6.1 | )% | | | (15,139 | ) | |
| Net assets | | | 100.0 | % | | $ | 246,587 | | |
NOTES TO SCHEDULE OF INVESTMENTS:
(a) No dividends were paid during the preceding twelve months.
(b) At October 31, 2004, all or a portion of this security is on loan (see Note 1). The value at October 31, 2004, of all securities on loan is $20,509.
(c) Cash collateral for the Repurchase Agreements, valued at $2,834, that serve as collateral for securities lending are invested in corporate bonds with interest rates and maturity dates ranging from 0.00%–9.75% and 05/15/2005–9/15/2033, respectively.
DEFINITIONS:
144A 144A Securities are registered pursuant to the rule 144A of the Securities Act of 1933. These securities are deemed to be liquid for purposes of compliance limitations on holdings of illiquid securities and may be resold as transactions exempt from registration normally to qualified institutional buyers. At October 31, 2004 these securities aggregated $1,561 or 0.6% of the net assets of the Fund.
The notes to the financial statements are an integral part of this report.
Transamerica IDEX Mutual Funds
Annual Report 2004
5
TA IDEX Transamerica Equity
STATEMENT OF ASSETS AND LIABILITIES
At October 31, 2004
(all amounts except per share amounts in thousands)
| Assets: | | | |
Investment securities, at value (cost: $237,350)
(including securities loaned of $20,509) | | $ | 261,726 | | |
| Cash | | | 5,939 | | |
| Receivables: | |
| Investment securities sold | | | 489 | | |
| Shares of beneficial interest sold | | | 546 | | |
| Interest | | | 10 | | |
| Dividends | | | 69 | | |
| Other | | | 21 | | |
| | | | 268,800 | | |
| Liabilities: | | | |
| Accounts payable and accrued liabilities: | |
| Shares of beneficial interest redeemed | | | 266 | | |
| Management and advisory fees | | | 12 | | |
| Distribution fees | | | 110 | | |
| Transfer agent fees | | | 374 | | |
| Payable for collateral for securities on loan | | | 21,359 | | |
| Other | | | 92 | | |
| | | | 22,213 | | |
| Net Assets | | $ | 246,587 | | |
| Net Assets Consist of: | | | |
Shares of beneficial interest, unlimited shares
authorized, no par value | | $ | 342,426 | | |
| Accumulated net investment income (loss) | | | (19 | ) | |
Undistributed net realized gain (loss) from investment
securities | | | (120,196 | ) | |
Net unrealized appreciation (depreciation) on
investment securities | | | 24,376 | | |
| Net Assets | | $ | 246,587 | | |
| Net Assets by Class: | | | |
| Class A | | $ | 176,851 | | |
| Class B | | | 47,928 | | |
| Class C | | | 21,808 | | |
| Shares Outstanding: | | | |
| Class A | | | 23,769 | | |
| Class B | | | 6,667 | | |
| Class C | | | 3,031 | | |
| Net Asset Value Per Share: | | | |
| Class A | | $ | 7.44 | | |
| Class B | | | 7.19 | | |
| Class C | | | 7.20 | | |
| Maximum Offering Price Per Share (a): | | | |
| Class A | | $ | 7.87 | | |
(a) Includes the maximum selling commission (represented as a percentage of offering price) which is reduced on certain levels of sales as set forth in the Prospectus. Net asset value per share for Classes B and C shares represents offering price. The redemption price for Classes B and C shares equals net asset value less any applicable contingent deferred sales charge.
STATEMENT OF OPERATIONS
For the year ended October 31, 2004
(all amounts in thousands)
| Investment Income: | | | |
| Interest | | $ | 20 | | |
| Dividends | | | 774 | | |
| Income from loaned securities–net | | | 16 | | |
| Less withholding taxes on foreign dividends | | | (1 | ) | |
| | | | 809 | | |
| Expenses: | | | |
| Management and advisory fees | | | 1,067 | | |
| Transfer agent fees: | |
| Class A | | | 219 | | |
| Class B | | | 203 | | |
| Class C | | | 31 | | |
| Class C2 | | | – | | |
| Class M | | | 2 | | |
| Printing and shareholder reports | | | 90 | | |
| Custody fees | | | 18 | | |
| Administration fees | | | 25 | | |
| Legal fees | | | 3 | | |
| Trustees fees | | | 5 | | |
| Registration fees: | |
| Class A | | | 26 | | |
| Class B | | | – | | |
| Class C | | | 17 | | |
| Class C2 | | | – | | |
| Class M | | | 2 | | |
| Distribution and service fees: | |
| Class A | | | 355 | | |
| Class B | | | 236 | | |
| Class C | | | 73 | | |
| Class C2 | | | 9 | | |
| Class M | | | 30 | | |
| Total expenses | | | 2,411 | | |
| Less: | |
| Reimbursement of class expenses: | |
| Class B | | | (123 | ) | |
| Class C | | | (25 | ) | |
| Net expenses | | | 2,263 | | |
| Net Investment Income (Loss) | | | (1,454 | ) | |
| Net Realized and Unrealized Gain (Loss) | | | |
| Realized gain (loss) from investment securities | | | 13,061 | | |
Increase (decrease) in unrealized appreciation
(depreciation) on investment securities | | | (5,046 | ) | |
| Net Gain (Loss) on Investments | | | 8,015 | | |
Net Increase (Decrease) in Net Assets Resulting
from Operations | | $ | 6,561 | | |
The notes to the financial statements are an integral part of this report.
Transamerica IDEX Mutual Funds
Annual Report 2004
6
TA IDEX Transamerica Equity
STATEMENTS OF CHANGES IN NET ASSETS
For the years ended
(all amounts in thousands)
| | | October 31,
2004 | | October 31,
2003 | |
| Increase (Decrease) In Net Assets From: | | | |
| Operations: | | | |
| Net investment income (loss) | | $ | (1,454 | ) | | $ | (491 | ) | |
Net realized gain (loss) from
investment securities | | | 13,061 | | | | (1,072 | ) | |
Net unrealized appreciation
(depreciation) on investment
securities | | | (5,046 | ) | | | 14,389 | | |
| | | | 6,561 | | | | 12,826 | | |
| Capital Share Transactions: | | | |
| Proceeds from shares sold: | |
| Class A | | | 60,100 | | | | 37,805 | | |
| Class B | | | 3,345 | | | | 2,327 | | |
| Class C | | | 4,567 | | | | 1,359 | | |
| Class C2 | | | 281 | | | | 370 | | |
| Class M | | | 197 | | | | 133 | | |
| | | | 68,490 | | | | 41,994 | | |
| Proceeds from fund acquisition: | |
| Class A | | | 62,968 | | | | – | | |
| Class B | | | 45,759 | | | | – | | |
| Class C | | | 899 | | | | – | | |
| Class C2 | | | 6,690 | | | | – | | |
| Class M | | | 8,963 | | | | – | | |
| | | | 125,279 | | | | – | | |
| Cost of shares redeemed: | |
| Class A | | | (9,235 | ) | | | (17,982 | ) | |
| Class B | | | (5,696 | ) | | | (1,240 | ) | |
| Class C | | | (1,786 | ) | | | (4 | ) | |
| Class C2 | | | (302 | ) | | | (706 | ) | |
| Class M | | | (741 | ) | | | (379 | ) | |
| | | | (17,760 | ) | | | (20,311 | ) | |
| Class level exchanges: | |
| Class C | | | 16,496 | | | | – | | |
| Class C2 | | | (7,469 | ) | | | – | | |
| Class M | | | (9,027 | ) | | | – | | |
| | | | – | | | | – | | |
| Automatic conversions: | |
| Class A | | | 327 | | | | – | | |
| Class B | | | (327 | ) | | | – | | |
| | | | – | | | | – | | |
| | | | 176,009 | | | | 21,683 | | |
| Net increase (decrease) in net assets | | | 182,570 | | | | 34,509 | | |
| Net Assets: | | | |
| Beginning of year | | | 64,017 | | | | 29,508 | | |
| End of year | | $ | 246,587 | | | $ | 64,017 | | |
Accumulated Net Investment Income
(Loss) | | $ | (19 | ) | | $ | – | | |
| | | October 31,
2004 | | October 31,
2003 | |
| Share Activity: | |
| Shares issued: | |
| Class A | | | 8,273 | | | | 6,674 | | |
| Class B | | | 475 | | | | 394 | | |
| Class C | | | 650 | | | | 216 | | |
| Class C2 | | | 40 | | | | 65 | | |
| Class M | | | 28 | | | | 23 | | |
| | | | 9,466 | | | | 7,372 | | |
| Shares issued on fund acquisition: | |
| Class A | | | 8,474 | | | | – | | |
| Class B | | | 6,356 | | | | – | | |
| Class C | | | 125 | | | | – | | |
| Class C2 | | | 929 | | | | – | | |
| Class M | | | 1,238 | | | | – | | |
| | | | 17,122 | | | | – | | |
| Shares redeemed: | |
| Class A | | | (1,268 | ) | | | (2,972 | ) | |
| Class B | | | (809 | ) | | | (209 | ) | |
| Class C | | | (254 | ) | | | (1 | ) | |
| Class C2 | | | (43 | ) | | | (126 | ) | |
| Class M | | | (105 | ) | | | (66 | ) | |
| | | | (2,479 | ) | | | (3,374 | ) | |
| Class level exchanges: | |
| Class C | | | 2,295 | | | | – | | |
| Class C2 | | | (1,035 | ) | | | – | | |
| Class M | | | (1,254 | ) | | | – | | |
| | | | 6 | | | | – | | |
| Automatic conversions: | |
| Class A | | | 34 | | | | – | | |
| Class B | | | (46 | ) | | | – | | |
| | | | (12 | ) | | | – | | |
Net increase (decrease) in shares
outstanding: | |
| Class A | | | 15,513 | | | | 3,702 | | |
| Class B | | | 5,976 | | | | 185 | | |
| Class C | | | 2,816 | | | | 215 | | |
| Class C2 | | | (109 | ) | | | (61 | ) | |
| Class M | | | (93 | ) | | | (43 | ) | |
| | | | 24,103 | | | | 3,998 | | |
The notes to the financial statements are an integral part of this report.
Transamerica IDEX Mutual Funds
Annual Report 2004
7
TA IDEX Transamerica Equity
FINANCIAL HIGHLIGHTS
| | | | | For a share of beneficial interest outstanding throughout each period | |
| | | | | Net Asset | | Investment Operations | | Distributions | | Net Asset | |
| | | For the
Period
Ended (d)(g) | | Value,
Beginning
of Period | | Net
Investment
Income (Loss) | | Net Realized
and Unrealized
Gain (Loss) | | Total
Operations | | From Net
Investment
Income | | From Net
Realized
Gains | | Total
Distributions | | Value,
End
of Period | |
| Class A | | 10/31/2004 | | $ | 6.86 | | | $ | (0.07 | ) | | $ | 0.65 | | | $ | 0.58 | | | $ | – | | | $ | – | | | $ | – | | | $ | 7.44 | | |
| | | 10/31/2003 | | | 5.52 | | | | (0.05 | ) | | | 1.39 | | | | 1.34 | | | | – | | | | – | | | | – | | | | 6.86 | | |
| | | 10/31/2002 | | | 6.38 | | | | (0.07 | ) | | | (0.79 | ) | | | (0.86 | ) | | | – | | | | – | | | | – | | | | 5.52 | | |
| | | 10/31/2001 | | | 10.16 | | | | (0.10 | ) | | | (3.68 | ) | | | (3.78 | ) | | | – | | | | – | | | | – | | | | 6.38 | | |
| | | 10/31/2000 | | | 10.00 | | | | (0.02 | ) | | | 0.18 | | | | 0.16 | | | | – | | | | – | | | | – | | | | 10.16 | | |
| Class B | | 10/31/2004 | | | 6.68 | | | | (0.11 | ) | | | 0.62 | | | | 0.51 | | | | – | | | | – | | | | – | | | | 7.19 | | |
| | | 10/31/2003 | | | 5.40 | | | | (0.09 | ) | | | 1.37 | | | | 1.28 | | | | – | | | | – | | | | – | | | | 6.68 | | |
| | | 10/31/2002 | | | 6.29 | | | | (0.12 | ) | | | (0.77 | ) | | | (0.89 | ) | | | – | | | | – | | | | – | | | | 5.40 | | |
| | | 10/31/2001 | | | 10.12 | | | | (0.16 | ) | | | (3.67 | ) | | | (3.83 | ) | | | – | | | | – | | | | – | | | | 6.29 | | |
| | | 10/31/2000 | | | 10.00 | | | | (0.06 | ) | | | 0.18 | | | | 0.12 | | | | – | | | | – | | | | – | | | | 10.12 | | |
| Class C | | 10/31/2004 | | | 6.68 | | | | (0.11 | ) | | | 0.63 | | | | 0.52 | | | | – | | | | – | | | | – | | | | 7.20 | | |
| | | 10/31/2003 | | | 5.30 | | | | (0.09 | ) | | | 1.47 | | | | 1.38 | | | | – | | | | – | | | | – | | | | 6.68 | | |
| | | | | | | Ratios/Supplemental Data | |
| | | For the
Period | | Total | | Net Assets,
End of
Period | | Ratio of Expenses
to Average
Net Assets (a) | | Net Investment
Income (Loss)
to Average | | Portfolio
Turnover | |
| | | Ended (g) | | Return (c) | | (000's) | | Net (e) | | Total (f) | | Net Assets (a) | | Rate (b) | |
| Class A | | 10/31/2004 | | | 8.45 | % | | $ | 176,851 | | | | 1.50 | % | | | 1.50 | % | | | (0.90 | )% | | | 97 | % | |
| | | 10/31/2003 | | | 24.28 | | | | 56,618 | | | | 1.56 | | | | 1.56 | | | | (0.87 | ) | | | 55 | | |
| | | 10/31/2002 | | | (13.50 | ) | | | 25,127 | | | | 1.74 | | | | 2.32 | | | | (1.19 | ) | | | 19 | | |
| | | 10/31/2001 | | | (37.20 | ) | | | 2,750 | | | | 1.55 | | | | 2.75 | | | | (1.15 | ) | | | 42 | | |
| | | 10/31/2000 | | | 1.60 | | | | 3,053 | | | | 1.55 | | | | 6.10 | | | | (1.18 | ) | | | 13 | | |
| Class B | | 10/31/2004 | | | 7.68 | | | | 47,928 | | | | 2.20 | | | | 2.72 | | | | (1.62 | ) | | | 97 | | |
| | | 10/31/2003 | | | 23.70 | | | | 4,613 | | | | 2.21 | | | | 2.21 | | | | (1.52 | ) | | | 55 | | |
| | | 10/31/2002 | | | (14.22 | ) | | | 2,732 | | | | 2.39 | | | | 2.98 | | | | (1.84 | ) | | | 19 | | |
| | | 10/31/2001 | | | (37.78 | ) | | | 3,070 | | | | 2.20 | | | | 3.40 | | | | (1.80 | ) | | | 42 | | |
| | | 10/31/2000 | | | 1.17 | | | | 2,840 | | | | 2.20 | | | | 6.75 | | | | (1.83 | ) | | | 13 | | |
| Class C | | 10/31/2004 | | | 7.78 | | | | 21,808 | | | | 2.20 | | | | 2.55 | | | | (1.63 | ) | | | 97 | | |
| | | 10/31/2003 | | | 26.04 | | | | 1,435 | | | | 2.21 | | | | 2.21 | | | | (1.52 | ) | | | 55 | | |
NOTES TO FINANCIAL HIGHLIGHTS
(a) Annualized.
(b) Not annualized for periods of less than one year.
(c) Total Return has been calculated for the applicable period without deduction of a sales load, if any, on an initial purchase. Periods of less than one year are not annualized.
(d) Per share information is calculated based on average number of shares outstanding for the years ended 10/31/2001, 10/31/2002, 10/31/2003 and 10/31/2004.
(e) Ratio of Net Expenses to Average Net Assets is net of fee waivers and reimbursements by the investment adviser, if any (see note 2).
(f) Ratio of Total Expenses to Average Net Assets includes all expenses before fee waivers and reimbursements by the investment adviser.
(g) TA IDEX Transamerica Equity commenced operations on March 1, 2000. The inception date for the Fund's offering of share Class L was November 11, 2002. Class L was renamed Class C on March 1, 2004 (see note 1).
The notes to the financial statements are an integral part of this report.
Transamerica IDEX Mutual Funds
Annual Report 2004
8
TA IDEX Transamerica Equity
NOTES TO FINANCIAL STATEMENTS
At October 31, 2004
(all amounts in thousands)
NOTE 1. ORGANIZATION AND SIGNIFICANT ACCOUNTING POLICIES
Transamerica IDEX Mutual Funds, formerly IDEX Mutual Funds, is a Massachusetts business trust registered under the Investment Company Act of 1940, as amended (the "1940 Act"), as an open-end management investment company. TA IDEX Transamerica Equity ("the Fund"), part of Transamerica IDEX Mutual Funds, began operations on March 1, 2000.
On March 1, 2004, the Fund changed its name from IDEX Transamerica Equity to TA IDEX Transamerica Equity.
On May 28, 2004, the Fund acquired all of the net assets of TA IDEX Alger Aggressive Growth pursuant to a plan of reorganization. TA IDEX Transamerica Equity is the accounting survivor. The acquisition was accomplished by a tax free exchange of 17,122 shares of the Fund for 6,508 shares of TA IDEX Alger Aggressive Growth outstanding on May 27, 2004. TA IDEX Alger Aggressive Growth's net assets at that date, $125,279, including $17,570 unrealized depreciation, were combined with those of the Fund. The aggregate net assets of TA IDEX Transamerica Equity immediately before the acquisition was $86,465, the combined net assets of the Fund immediately after the acquisition was $211,744. Proceeds in connection with the acquisition were as follows:
| | | Shares | | Amount | |
| Proceeds in connection with the acquisition | |
| Class A | | | 8,474 | | | $ | 62,968 | | |
| Class B | | | 6,356 | | | | 45,759 | | |
| Class C | | | 125 | | | | 899 | | |
| Class C2 | | | 929 | | | | 6,690 | | |
| Class M | | | 1,238 | | | | 8,963 | | |
| | | | | | | $ | 125,279 | | |
In the normal course of business, the Fund enters into contracts that contain a variety of representations and warranties, which provide general indemnifications. The Fund's maximum exposure under these arrangements is unknown, as this would involve future claims that may be made against the Fund and/or its affiliates that have not yet occurred. However, based on experience, the Fund expects the risk of loss to be remote.
See the Prospectus and Statement of Additional Information for a description of the Fund's investment objective.
In preparing the Fund's financial statements in accordance with accounting principles generally accepted in the United States of America ("GAAP"), estimates or assumptions (which could differ from actual results) may be used that affect reported amounts and disclosures. The following policies were consistently followed by the Fund, in accordance with GAAP.
Multiple class operations and expenses: The Fund currently offers three classes of shares, each with a public offering price that reflects different sales charges, if any, and expense levels. All shares designated as Class C shares prior to March 1, 2004, were renamed as Class C2 shares on that date. All shares designated as Class L shares prior to March 1, 2004, were renamed as Class C shares with different sales charges than the previous Class L shares. On June 15, 2004, Class C2 shares merged into Class C. On September 24, 2004, Class M shares merged into Class C. Class B shares will convert to Class A shares eight years after purchase. Income, non-class specific expenses and realized and unrealized gains and losses, are allocated daily to each class, based upon the value of shares outstanding method as permitted under Rule 18f-3 of the 1940 Act. Each class bears its own specific expenses as well as a portion of general, common expenses.
Pricing of shares: The Fund prices its shares on the basis of the net asset value of each class of shares of the Fund, which is determined as of the close of the New York Stock Exchange ("NYSE") (generally 4:00 p.m. Eastern Time) on each day on which the NYSE is open for trading (other than a day on which there are insufficient changes in the value of the Fund's portfolio securities to materially affect the Fund's net asset value or a day on which no shares are tendered for redemption and no order to purchase any shares is received).
Security valuations: Fund investments traded on an exchange are valued at the closing price on the day of valuation on the exchange where the security is principally traded. With respect to securities traded on NASDAQ NMS, such closing price may be the last reported sales price or the NASDAQ Official Closing Price.
Securities traded in the over-the-counter market and listed securities for which no sale was reported on that date are valued at the last quoted bid price.
Debt securities are valued by independent pricing services; however, those that mature in sixty days or less are valued at amortized cost, which approximates market.
Investment company securities are valued at net asset value of the underlying portfolio.
Other securities for which quotations are not readily available are valued at fair market value as determined in good faith using guidelines adopted by the Board of Trustees of the Fund, under the supervision of the Fund's Valuation Committee.
Cash: The Fund may leave cash overnight in its cash account with the custodian, Investors Bank & Trust Company ("IBT"). IBT has been contracted on behalf of the Fund to invest the excess cash into a savings account, which at October 31, 2004, was paying an interest rate of 1.30%.
Transamerica IDEX Mutual Funds
Annual Report 2004
9
TA IDEX Transamerica Equity
NOTES TO FINANCIAL STATEMENTS (continued)
At October 31, 2004
(all amounts in thousands)
NOTE 1.–(continued)
Throughout the year, the Fund may have a cash overdraft balance. A fee is incurred on this overdraft, calculated by multiplying the overdraft by a rate based on the federal funds rate. This fee is included in Custody Fees in the Statement of Operations.
Repurchase agreements: The Fund is authorized to enter into repurchase agreements. The Fund, through IBT, receives delivery of the underlying securities, the value of which at the time of purchase is required to be an amount equal to at least 100% of the resale price. Repurchase agreements involve the risk that the seller will fail to repurchase the security, as agreed. In that case, the Fund will bear the risk of value fluctuations until the security can be sold and may encounter delays and incur costs in liquidating the security. In the event of bankruptcy or insolvency of the seller, delays and costs may be incurred.
Commission recapture: The sub-adviser, to the extent consistent with the best execution and usual commission rate policies and practices, may place security transactions of the Fund with broker/dealers with which Transamerica IDEX Mutual Funds has established a Commission Recapture Program. A Commission Recapture Program is any arrangement under which a broker/dealer applies a portion of the commissions received by such broker/dealer on the security transactions to the Fund. In no event will commissions paid by the Fund be used to pay expenses that would otherwise be borne by any other funds within Transamerica IDEX Mutual Funds, or by any other party.
Recaptured commissions during the year ended October 31, 2004, of $58 are included in net realized gains in the Statement of Operations.
Securities lending: The Fund may lend securities to enhance fund earnings from investing cash collateral in making such loans to qualified borrowers (typically broker/dealers). The Fund has engaged its custodian bank, IBT, as a lending agent to administer its securities lending program. IBT earned $7 of program income for its services. When the Fund makes a security loan, it receives cash collateral as protection against the risk that the borrower will default on the loan, and records an asset for the cash invested collateral and a liability for the return of the collateral.
Securities on loan are included in Investment securities at value in the Statement of Assets and Liabilities and remain on the Schedule of Investments.
Loans of securities are required to be secured by collateral at least equal to 102% of the value of the securities at inception of the loan, and not less then 100% thereafter. The Fund may invest cash collateral in short-term money market instruments including: U.S. Treasury Bills,
U.S. agency obligations, commercial paper, money market mutual funds, repurchase agreements and other highly rated, liquid investments. During the life of securities loans, the collateral and securities loaned remain subject to fluctuation in value. IBT marks to market securities loaned and the collateral each business day. If additional collateral is due (at least $1), IBT collects additional cash collateral from the borrowers. Although securities loaned will be fully collateralized at all times, IBT may experience delays in, or may be prevented from, recovering the collateral on behalf of the Fund. The Fund may recall a loaned security position at any time from the borrower through IBT. In the event the borrower fails to timely return a recalled security, IBT may indemnify the Fund by purchasing replacement securities for the Fund at its own expense and claiming the collateral to fund such a purchase. IBT absorbs the loss if the collateral value is not sufficient to cover the cost of the replacement securities. If replacement securities are not available, IBT will credit the equivalent cash value to the Fund.
While a security is on loan, the Fund does not have the right to vote that security. However, if time permits, the Fund will attempt to recall a security on loan and vote the proxy.
Income from securities lending is included in the Statement of Operations. The amount of collateral and value of securities on loan are included in the Statement of Assets and Liabilities as well as in the Schedule of Investments.
Security transactions and investment income: Security transactions are recorded on the trade date. Security gains and losses are calculated on the specific identification basis. Dividend income is recorded on the ex-dividend date or, in the case of foreign securities, as soon as the Fund is informed of the ex-dividend date. Interest income, including accretion of discounts and amortization of premiums, is recorded on the accrual basis commencing on the settlement date.
Account maintenance fees: If the shareholder account balance falls below $1 by either shareholder action or as a result of market action, a $25 (not in thousands) fee is assessed every year until the balance reaches $1. The fee is assessed by redeeming shares in the shareholder's account.
No fee will be charged under the following conditions:
• accounts opened within the preceding 24 months
• accounts with an active monthly Automatic Investment Plan ($50 (not in thousands) minimum per fund)
• accounts owned by an individual which, when combined by social security number, have a balance of $5 or more
• accounts owned by individuals in the same household (by address) that have a combined balance of $5 or more
• UTMA/UGMA accounts
• Fiduciary accounts
Transamerica IDEX Mutual Funds
Annual Report 2004
10
TA IDEX Transamerica Equity
NOTES TO FINANCIAL STATEMENTS (continued)
At October 31, 2004
(all amounts in thousands)
NOTE 1.–(continued)
• B-share accounts whose shares have started to convert to A-shares accounts (as long as combined value of both accounts is at least $1)
For the year ended October 31, 2004, this fee totaled $17. These fees are included in Paid in Capital in the Statement of Assets and Liabilities.
Redemption fees: A short-term trading redemption fee may be assessed on any fund shares in a fund account that are sold during the first five (5) New York Stock Exchange trading days following their purchase date. This redemption fee will equal 2% of the amount redeemed and shares held the longest will be treated as being redeemed first and shares held the shortest as being redeemed last. For the year ended October 31, 2004, the Fund received no redemption fees.
Dividend distributions: Distributions to shareholders are recorded on the ex-dividend date and are determined in accordance with Federal income tax regulations which may differ from GAAP.
NOTE 2. RELATED PARTY TRANSACTIONS
AEGON/Transamerica Fund Advisers, Inc. ("ATFA") is the Fund's investment adviser. AEGON/Transamerica Fund Services, Inc. ("ATFS") is the Fund's administrator. AFSG Securities Corp. ("AFSG") is the Fund's distributor/principal underwriter. AEGON/Transamerica Investor Services, Inc. ("ATIS") is the Fund's transfer agent. ATIS and AFSG are 100% owned by AUSA Holding Company ("AUSA"). ATFA is a directly owned subsidiary of Western Reserve Life Assurance Co. of Ohio (78%) ("WRL") and AUSA (22%). ATFS is a wholly owned subsidiary of WRL. AUSA and WRL are wholly owned indirect subsidiaries of AEGON NV, a Netherlands corporation.
Transamerica Investment Management, LLC is both an affiliate of the Fund and a sub-adviser to the Fund.
The following schedule represents the percentage of fund assets owned by affiliated mutual funds (i.e. through the asset allocation funds):
| | | Net
Assets | | % of
Net Assets | |
TA IDEX Asset Allocation–
Conservative Portfolio | | $ | 2,966 | | | | 1 | % | |
TA IDEX Asset Allocation–
Growth Portfolio | | | 42,355 | | | | 17 | % | |
TA IDEX Asset Allocation–
Moderate Growth Portfolio | | | 40,837 | | | | 17 | % | |
TA IDEX Asset Allocation–
Moderate Portfolio | | | 23,168 | | | | 9 | % | |
| Total | | $ | 109,326 | | | | 44 | % | |
Investment advisory fees: The Fund pays management fees to ATFA based on average daily net assets ("ANA") at the following breakpoints from November 1, 2003 to May 28, 2004:
0.80% of the first $500 million of ANA
0.70% of ANA over $500 million
From May 29, 2004 on:
0.775% of the first $500 million of ANA
0.70% of ANA over $500 million
ATFA has contractually agreed to waive its advisory fee and will reimburse the Fund to the extent that operating expenses, excluding 12b-1 fees, exceed the following stated annual limit:
1.40% Expense Limit
Distribution and service fees: The Fund has a 12b-1 distribution plan under the 1940 Act pursuant to which an annual fee, based on average daily net assets, is paid to the distributor for various disbursements such as broker-dealer account servicing fees and other promotional expenses of the Fund. The Fund is authorized under the 12b-1 plan to pay fees on each class up to the following limits:
| Class A | | | 0.35 | % | |
| Class B | | | 1.00 | % | |
| Class C | | | 1.00 | % | |
| Class C2 | | | 1.00 | % | |
| Class M | | | 0.90 | % | |
Class C2 and Class M merged into Class C on June 15, 2004 and September 24, 2004, respectively.
In the case the Fund or a class of shares of the Fund is closed to new investors or investments, the Fund is authorized to pay 12b-1 fees for past sales and distribution efforts and present and past investor services.
Underwriter commissions relate to front-end sales charges imposed for Class A and M shares and contingent deferred sales charges from Classes B, C, M and certain A share redemptions. For the year ended October 31, 2004, the underwriter commissions were as follows:
| Received by Underwriter | | $ | 387 | | |
| Retained by Underwriter | | | 13 | | |
| Contingent Deferred Sales Charge | | | 49 | | |
Administrative services: The Fund has entered into an agreement with ATFS for financial and legal fund administration services, which includes such items as compliance, expenses, financial statements and other reporting, distributions, tax returns, prospectus preparation, board of trustees meeting support and other legal matters. The Fund pays ATFS an annual fee of 0.015% of average net assets. The Legal fees on the Statement of Operations are for fees paid to external legal counsel.
Transamerica IDEX Mutual Funds
Annual Report 2004
11
TA IDEX Transamerica Equity
NOTES TO FINANCIAL STATEMENTS (continued)
At October 31, 2004
(all amounts in thousands)
NOTE 2.–(continued)
The Fund paid ATFS $25 for the year ended October 31, 2004.
Transfer agent fees: The Fund pays ATIS an annual per-account charge of $20 (not in thousands) for each open account and $1.63 (not in thousands) for each closed account. There is no new account charge. The transfer agent fees on the Statement of Operations are made up of fees paid to ATIS and costs associated with shareholder statements. The Fund paid ATIS $455 for the year ended October 31, 2004.
Deferred compensation plan: Each eligible Fund Trustee may elect participation in the Deferred Compensation Plan ("the Plan"). Under the Plan, such Trustees may defer payment of a percentage of their total fees earned as a Fund Trustee. These deferred amounts may be invested in any Transamerica IDEX Mutual Fund. At October 31, 2004, the value of invested plan amount was $21. Invested plan amounts and the total liability for deferred compensation to the Trustees under the Plan at October 31, 2004, are included in the accompanying Statement of Assets and Liabilities.
NOTE 3. INVESTMENT TRANSACTIONS
The cost of securities purchased and proceeds from securities sold (excluding short-term securities) for the year ended October 31, 2004, were as follows:
| Purchases of securities: | | | |
| Long-Term excluding U.S. Government | | $ | 174,781 | | |
| U.S. Government | | | – | | |
| Proceeds from maturities and sales of securities: | | | |
| Long-Term excluding U.S. Government | | | 125,926 | | |
| U.S. Government | | | – | | |
NOTE 4. FEDERAL INCOME TAX MATTERS
The Fund has not made any provision for federal income or excise taxes due to its policy to distribute all of its taxable income and capital gains to its shareholders and otherwise qualify as a regulated investment company under the Internal Revenue Code. Income and capital gain distributions are determined in accordance with income tax regulations, which may differ from GAAP. These differences are primarily due to differing treatment for items including, but not limited to, wash sales, net operating losses and capital loss carryforwards.
Reclassifications between Undistributed net investment income (loss), Accumulated net realized capital gains (loss) and Shares of beneficial interest are made to reflect income and gains available for distribution under federal tax regulations. Results of operations and net assets are not effected by these reclassifications. These reclassifications are as follows:
Shares of beneficial interest, unlimited
shares authorized | | $ | 126,857 | | |
| Undistributed net investment income (loss) | | | 1,435 | | |
Accumulated net realized gain (loss) from investment
securities and futures contracts | | | (128,292 | ) | |
The capital loss carryforwards are available to offset future realized capital gains through the periods listed:
Capital Loss
Carryforward | | Available through | |
| $ | 74,003 | | | October 31, 2008 | |
| | 48,961 | | | October 31, 2009 | |
| | 1,153 | | | October 31, 2010 | |
| | 92 | | | October 31, 2011 | |
The capital loss carryforward utilized during the year ended October 31, 2004 was $7,934. The capital loss carryforwards are available to offset future realized gains, subject to certain limitations under the Internal Revenue Code, through the period listed.
The tax basis components of distributable earnings as of October 31, 2004, are as follows:
| Undistributed Ordinary Income | | $ | – | | |
| Undistributed Long-term Capital Gains | | $ | 4,764 | | |
| Capital Loss Carryforward | | $ | (124,209 | ) | |
| Net Unrealized Appreciation (Depreciation) | | $ | 23,626 | | |
The aggregate cost of investments and composition of unrealized appreciation (depreciation) for federal income tax purposes as of October 31, 2004, are as follows:
| Federal Tax Cost Basis | | $ | 238,100 | | |
| Unrealized Appreciation | | $ | 26,408 | | |
| Unrealized (Depreciation) | | | (2,782 | ) | |
| Net Unrealized Appreciation (Depreciation) | | $ | 23,626 | | |
NOTE 5. OTHER MATTERS
Transamerica IDEX Mutual Funds ("TA IDEX"), and certain of its affiliated entities, have received requests for information from the Staff of the Securities and Exchange Commission in connection with market timing and late trading within the funds. TA IDEX and the affiliated entities have voluntarily cooperated in the investigation and have been providing the information as requested.
Transamerica IDEX Mutual Funds
Annual Report 2004
12
Report of Independent Registered Certified Public Accounting Firm
To the Board of Trustees and Shareholders of
TA IDEX Transamerica Equity
In our opinion, the accompanying statement of assets and liabilities, including the schedule of investments, and the related statements of operations and of changes in net assets and the financial highlights present fairly, in all material respects, the financial position of TA IDEX Transamerica Equity (the "Fund") (one of the portfolios constituting the Transamerica IDEX Mutual Funds) at October 31, 2004, the results of its operations for the year then ended, the changes in its net assets for each of the two years in the period then ended and the financial highlights for each of the periods indicated, in conformity with accounting principles generally accepted in the United States of America. These financial statements and financial highlights (hereafter referred to as "financial statements") are the responsibility of the Fund's management; our responsibility is to express an opinion on these financial statements based on our audits. We conducted our audits of these financial statements in accordance with the standards of the Public Company Accounting Oversight Board (United States). Those standards require that we plan and perform the audit to obtain reasonable assurance about whether the financial statements are free of material misstatement. An audit includes examining, on a test basis, evidence supporting the amounts and disclosures in the financial statements, assessing the accounting principles used and significant estimates made by management, and evaluating the overall financial statement presentation. We believe that our audits, which included confirmation of securities at October 31, 2004 by correspondence with the custodian and brokers, provide a reasonable basis for our opinion.

PricewaterhouseCoopers LLP
Tampa, Florida
December 28, 2004
Transamerica IDEX Mutual Funds
Annual Report 2004
13
TA IDEX Transamerica Equity
SUPPLEMENTAL INFORMATION
RESULTS OF SHAREHOLDER PROXY (unaudited)
At a special meeting of shareholders held on May 21, 2004, the results of the Proposal were as follows:
Proposal 1: Approval of an Agreement and Plan of Reorganization providing for the acquisition of all of the assets and liabilities of TA IDEX Alger Aggressive Growth (the "Acquired Fund") by TA IDEX Transamerica Equity (the "Acquiring Fund") solely in exchange for shares of the Acquiring Fund, followed by the complete liquidation of the Acquired Fund.
| For | | Against | | Abstentions/Broker Non-Votes | |
| | 82.19 | % | | | 4.10 | % | | | 13.71 | % | |
At a special meeting of Class M shareholders of each series of Transamerica IDEX (except TA IDEX Federated Tax Exempt and TA IDEX Protected Principal Stock) held on September 2, 2004, the results of the Proposal were as follows:
Proposal 1: Approval of a conversion of Class M shares into Class C shares of the Funds, which will result in bearing the distribution and service fees payable under the 12b-1 Plan for the Distribution of Class C shares of the Funds.
| For | | Against | | Abstentions/Broker Non-Votes | |
| | 76.85 | % | | | 9.52 | % | | | 13.63 | % | |
Transamerica IDEX Mutual Funds
Annual Report 2004
14
TA IDEX Transamerica Flexible Income
MARKET ENVIRONMENT
Responding to strong employment data in the March-June period, bond yields began moving decisively higher as investors concluded the economy was on a sustainable growth trajectory. Beginning in late June, the Federal Reserve Board initiated three short-term interest-rate hikes, for a total increase of 0.75% by period-end. By mid-summer, however, economic numbers softened in reaction to higher oil prices, and the upward pressure on interest rates abated. Yields reversed and began to decline with the news of the "soft patch" in domestic economic growth, a closely contested U.S. Presidential race and escalating concerns about Iraq. The Lehman Brothers U.S. Government/Credit Index ("LBGC") ended the twelve-month period with a total return of 5.57%.
Over this period, high-yield and investment-grade corporate bonds outperformed comparable-maturity Treasury bonds. Among the reasons for this were continued improvements in corporate credit profitability and credit quality, and relatively light bond issuance levels, which resulted in a favorable supply-demand ratio.
PERFORMANCE
For the year ended October 31, 2004, TA IDEX Transamerica Flexible Income, Class A returned 5.72%. By comparison its benchmark, the LBGC, returned 5.57%.
STRATEGY REVIEW
We attribute the portfolio's superior results to our repositioning of the portfolio after we assumed management responsibilities on March 1, 2004. Our strategy is to consistently maximize current income while maintaining an investment-grade average quality for the portfolio. Toward that end, we may make tactical shifts (into or out of cash or high-yield bonds) to maintain as much capital as possible while preserving a steady income stream.
Since March, we have sold a large number of the relatively illiquid securities held by the prior manager, replacing them with fewer but more-liquid investments. We believe a manager can be more effective in managing portfolio risk and choosing individual investments with superior attributes when the total number of holdings is 100 or fewer.
We also have overweighted corporate bonds (vs. the benchmark index) and, within the corporate sector, emphasized economically sensitive industries, including metals, chemicals, paper and forest products, and energy. Finally, we have invested slightly more than one-third of assets in a wide variety of high-yield bonds, a market segment that is less sensitive to interest rates. The portfolio benefited from these overweightings, since both investment-grade and high-yield corporate bonds outpaced Treasuries.
On an individual basis, the portfolio's largest contributor to total return was from bonds issued by Stater Bros. Holdings Inc., a regional grocery store chain in California. The portfolio experienced no major losses during the period; however, the positive impact of the above mentioned and other bonds was partially offset by price declines in investment-grade bonds from America Movil, SA de CV, a Mexican wireless communications company, and ACE INA Holdings, Inc. ("ACE"), a provider of property, casualty, accident and health insurance. Like much of the insurance industry, ACE suffered due to allegations of bid-rigging by a major insurance broker.
Peter O. Lopez
Heidi Hu
Co-Fund Managers
Transamerica Investment Management, LLC
Transamerica IDEX Mutual Funds
Annual Report 2004
1
TA IDEX Transamerica Flexible Income
Comparison of change in value of $10,000 investment in Class A shares and its comparative index.
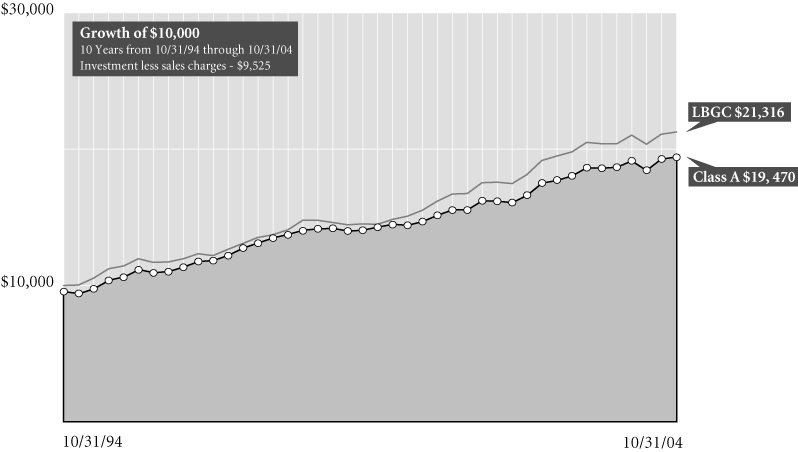
Average Annual Total Return for Periods Ended 10/31/04
| | | 1 year | | 5 years | | 10 years | | From
Inception | | Inception
Date | |
| Class A (NAV) | | | 5.72 | % | | | 6.71 | % | | | 7.46 | % | | | 7.55 | % | | 6/29/87 | |
| Class A (POP) | | | 0.70 | % | | | 5.68 | % | | | 6.94 | % | | | 7.25 | % | | 6/29/87 | |
| LBGC1 | | | 5.57 | % | | | 7.87 | % | | | 7.87 | % | | | 8.17 | % | | 6/29/87 | |
| Class B (NAV) | | | 5.13 | % | | | 6.01 | % | | | – | | | | 6.22 | % | | 10/1/95 | |
| Class B (POP) | | | 0.13 | % | | | 5.85 | % | | | – | | | | 6.22 | % | | 10/1/95 | |
| Class C (NAV) | | | 5.02 | % | | | – | | | | – | | | | 5.18 | % | | 11/11/02 | |
| Class C (POP) | | | 4.02 | % | | | – | | | | – | | | | 5.18 | % | | 11/11/02 | |
NOTES
1 The Lehman Brothers U.S. Government/Credit (LBGC) Index is an unmanaged index used as a general measure of market performance. Calculations assume dividends and capital gains are reinvested and do not include any managerial expenses. From inception calculation is based on life of Class A shares. Source: Standard & Poor's Micropal®© Micropal, Inc. 2004 – 1-800-596-5323 – http://www.micropal.com.
The performance data presented represents past performance, future results may vary. Performance data does not reflect the deduction of taxes that would be paid on fund distributions or the redemption of fund shares. Investment return and principal value will fluctuate so that an investor's shares, when redeemed, may be worth more or less than their original cost. Current performance may be lower or higher than performance quoted.
Public Offering Price (POP) returns include the reinvestment of dividends and capital gains and reflect the maximum sales charge of 4.75% for A shares or the maximum applicable contingent deferred sales charge (5% in the 1st year, decreasing to 0% after 6 years) for Class B shares and 1% (during the first 12 months) for Class C shares. Shares purchased prior to March 1, 2004 are subject to a maximum applicable contingent deferred sales charge (5% in the 1st year, decreasing to 0% after 7 years) for Class B shares and (2% in the 1st year, decreasing to 0% after 2 years) for Class C shares. Net Asset Value (NAV) returns include the reinvestment of dividends and capital gains but do not reflect any sales charges.
This material must be preceded or accompanied by a current prospectus, which includes specific contents regarding the investment objectives and policies of this fund.
Transamerica IDEX Mutual Funds
Annual Report 2004
2
TA IDEX Transamerica Flexible Income
UNDERSTANDING YOUR FUND'S EXPENSES (unaudited)
SHAREHOLDER EXPENSES
The following Example is intended to help you understand your ongoing costs (in dollars and cents) of investing in a Fund and to compare these costs with the ongoing costs of investing in other funds.
The Example is based on an investment of $1,000 invested at the beginning of the period and held for the entire period from May 1, 2004 to October 31, 2004.
ACTUAL EXPENSES
The first line in the table below provides information about actual account values and actual expenses. You may use the information in this line, together with the amount you invested, to estimate the expenses that you paid over the period. Simply divide your account value by $1,000 (for example, an $8,600 account value divided by $1,000 = 8.6), then multiply the result by the number in the first line of your Fund under the heading entitled "Expenses Paid During Period" to estimate the expenses you paid on your account during this period.
HYPOTHETICAL EXAMPLE FOR COMPARISON PURPOSES
The second line in the table below provides information about hypothetical account values and hypothetical expenses based on each Fund's actual expense ratio and an assumed rate of return of 5% per year before expenses, which is not the Fund's actual return. The hypothetical account values and expenses may not be used to estimate the actual ending account balance or expenses you paid for the period. You may use this information to compare the ongoing costs of investing in your Fund and other funds. To do so, compare this 5% hypothetical example with the 5% hypothetical examples that appear in the shareholder reports of the other funds.
Please note that the expenses shown in the table are meant to highlight your ongoing costs only and do not reflect any transactional costs, such as sales charges, redemption fees, brokerage commissions paid on purchases and sales of fund shares. Therefore, the second line under each Fund in the table is useful in comparing ongoing costs only, and will not help you determine the relative total costs of owning different funds. In addition, note that the expenses shown in the table are meant to highlight your ongoing costs and do not reflect any transaction costs.
| | | Beginning
Account
Value | | Ending
Account
Value | | Annualized
Expense
Ratio | | Expenses Paid
During Period (a) | |
| Class A | |
| Actual | | $ | 1,000.00 | | | $ | 1,050.20 | | | | 1.35 | % | | $ | 6.96 | | |
| Hypothetical (b) | | | 1,000.00 | | | | 1,018.25 | | | | 1.35 | | | | 6.85 | | |
| Class B | |
| Actual | | | 1,000.00 | | | | 1,047.80 | | | | 1.89 | | | | 9.73 | | |
| Hypothetical (b) | | | 1,000.00 | | | | 1,015.63 | | | | 1.89 | | | | 9.58 | | |
| Class C | |
| Actual | | | 1,000.00 | | | | 1,046.70 | | | | 2.07 | | | | 10.65 | | |
| Hypothetical (b) | | | 1,000.00 | | | | 1,014.73 | | | | 2.07 | | | | 10.48 | | |
(a) Expenses are calculated using each Fund's annualized expense ratio (as disclosed in the table), multiplied by the average account value for the period, multiplied by number of days in the period (184 days), and divided by the number of days in the year (366 days).
(b) 5% return per year before expenses.
GRAPHIC PRESENTATION OF SCHEDULE OF INVESTMENTS
By Asset Type
At October 31, 2004
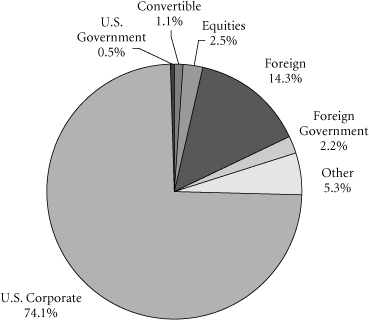
This chart shows the percentage breakdown by asset type of the Fund's total investment securities.
Transamerica IDEX Mutual Funds
Annual Report 2004
3
TA IDEX Transamerica Flexible Income
SCHEDULE OF INVESTMENTS
At October 31, 2004
(all amounts except share amounts in thousands)
| | | Principal | | Value | |
| U.S. GOVERNMENT OBLIGATIONS (0.5%) | | | |
U.S. Treasury Bond
5.38%, due 02/15/2031 (a) | | | $700 | | | | $761 | | |
| Total U.S. Government Obligations (cost: $760) | | | | | | | 761 | | |
| FOREIGN GOVERNMENT OBLIGATIONS (2.4%) | | | |
Royal Bank of Scotland Group PLC
7.65%, due 08/29/2049 (b) | | | 2,000 | | | | 2,417 | | |
Ainsworth Lumber Co., Ltd., 144A
5.67%, due 10/01/2010 (b) | | | 1,000 | | | | 1,010 | | |
| Total Foreign Government Obligations (cost: $3,484) | | | | | | | 3,427 | | |
| MORTGAGE-BACKED SECURITIES (0.7%) | | | |
Gazprom International SA, 144A
7.20%, due 02/01/2020 | | | 1,000 | | | | 1,050 | | |
| Total Mortgage-Backed Securities (cost: $1,000) | | | | | | | 1,050 | | |
| CORPORATE DEBT SECURITIES (89.6%) | | | |
| Agriculture (0.4%) | | | |
Michael Foods, Inc.
8.00%, due 11/15/2013 | | | 500 | | | | 528 | | |
| Amusement & Recreation Services (3.6%) | | | |
Boyd Gaming Corp.
6.75%, due 04/15/2014 | | | 2,500 | | | | 2,622 | | |
Speedway Motorsports, Inc.
6.75%, due 06/01/2013 | | | 500 | | | | 525 | | |
Station Casinos, Inc.
6.88%, due 03/01/2016 | | | 2,000 | | | | 2,125 | | |
| Beverages (2.7%) | | | |
Cia Brasileira de Bebidas
8.75%, due 09/15/2013 | | | 750 | | | | 851 | | |
PepsiAmericas, Inc.
3.88%, due 09/12/2007 | | | 3,000 | | | | 3,039 | | |
| Business Credit Institutions (2.5%) | | | |
ChevronTexaco Capital Co.
3.50%, due 09/17/2007 | | | 1,035 | | | | 1,048 | | |
Ford Motor Credit Co.
7.00%, due 10/01/2013 (a) | | | 2,500 | | | | 2,640 | | |
| Chemicals & Allied Products (1.0%) | | | |
Lubrizol Corp.
5.50%, due 10/01/2014 | | | 1,500 | | | | 1,512 | | |
| Commercial Banks (2.1%) | | | |
Citizens Banking Corp.
5.75%, due 02/01/2013 | | | 75 | | | | 77 | | |
US Bank NA
3.75%, due 02/06/2009 | | | 3,000 | | | | 3,001 | | |
| | | Principal | | Value | |
| Communication (0.7%) | | | |
Echostar DBS Corp.
6.38%, due 10/01/2011 | | $ | 1,000 | | | $ | 1,036 | | |
| Department Stores (0.7%) | | | |
JC Penney Co., Inc.
6.88%, due 10/15/2015 | | | 1,000 | | | | 1,078 | | |
| Drug Stores & Proprietary Stores (0.7%) | | | |
Jean Coutu Group, Inc., 144A
8.50%, due 08/01/2014 (a) | | | 1,000 | | | | 1,020 | | |
| Electric Services (5.0%) | | | |
AES Gener SA, 144A
7.50%, due 03/25/2014 | | | 2,000 | | | | 2,048 | | |
Duke Energy Corp.
4.20%, due 10/01/2008 | | | 3,000 | | | | 3,042 | | |
Southwestern Public Service Co., Series B
5.13%, due 11/01/2006 | | | 500 | | | | 519 | | |
Texas Utilities Corp.
6.38%, due 06/15/2006 | | | 1,625 | | | | 1,707 | | |
| Electric, Gas & Sanitary Services (0.1%) | | | |
Public Service Co. of Colorado, Series A
6.88%, due 07/15/2009 | | | 100 | | | | 112 | | |
| Food & Kindred Products (4.6%) | | | |
Burns Philp Capital Property, Ltd./
Burns Philp Capital US, Inc.
9.75%, due 07/15/2012 | | | 2,000 | | | | 2,200 | | |
ConAgra Foods, Inc.
9.75%, due 03/01/2021 | | | 1,900 | | | | 2,670 | | |
Smithfield Foods, Inc., 144A
7.00%, due 08/01/2011 | | | 1,700 | | | | 1,819 | | |
| Food Stores (1.5%) | | | |
Stater Brothers Holdings
8.13%, due 06/15/2012 | | | 2,000 | | | | 2,120 | | |
| Furniture & Fixtures (2.9%) | | | |
Lear Corp.
7.96%, due 05/15/2005 | | | 4,067 | | | | 4,174 | | |
| Gas Production & Distribution (1.1%) | | | |
Pacific Energy Partners, LP / Pacific
Energy Finance Corp., 144A
7.13%, due 06/15/2014 (c) | | | 1,500 | | | | 1,628 | | |
| Holding & Other Investment Offices (3.9%) | | | |
EOP Operating, LP
8.38%, due 03/15/2006 | | | 2,150 | | | | 2,302 | | |
Hutchison Whampoa International, Ltd., 144A
5.45%, due 11/24/2010 | | | 475 | | | | 489 | | |
Raytheon Co.
3.50%, due 05/15/2006 | | | 5,500 | | | | 2,903 | | |
The notes to the financial statements are an integral part of this report.
Transamerica IDEX Mutual Funds
Annual Report 2004
4
TA IDEX Transamerica Flexible Income
SCHEDULE OF INVESTMENTS (continued)
At October 31, 2004
(all amounts except share amounts in thousands)
| | | Principal | | Value | |
| Hotels & Other Lodging Places (3.9%) | |
Circus Circus Enterprises, Inc.
7.63%, due 07/15/2013 (a) | | $ | 2,000 | | | $ | 2,155 | | |
Host Marriott, LP
7.13%, due 11/01/2013 | | | 2,000 | | | | 2,160 | | |
Starwood Hotels & Resorts, Inc.
6.75%, due 11/15/2005 | | | 1,335 | | | | 1,375 | | |
| Industrial Machinery & Equipment (1.4%) | |
Case New Holland, Inc., 144A
6.00%, due 06/01/2009 | | | 2,000 | | | | 2,000 | | |
| Insurance (1.5%) | |
ACE Capital Trust II
9.70%, due 04/01/2030 | | | 584 | | | | 762 | | |
First American Capital Trust I
8.50%, due 04/15/2012 | | | 125 | | | | 142 | | |
Wellpoint Health Networks, Inc.
6.38%, due 06/15/2006 | | | 1,185 | | | | 1,244 | | |
| Lumber & Other Building Materials (0.7%) | |
Riverside Forest Products
7.88%, due 03/01/2014 | | | 1,000 | | | | 1,065 | | |
| Lumber & Wood Products (2.4%) | |
Weyerhaeuser Co.
7.38%, due 03/15/2032 | | | 3,000 | | | | 3,499 | | |
| Metal Mining (1.5%) | |
Barrick Gold Finance, Inc.
7.50%, due 05/01/2007 | | | 2,000 | | | | 2,198 | | |
| Mortgage Bankers & Brokers (1.8%) | |
Countrywide Home Loans, Inc.
5.50%, due 08/01/2006 | | | 2,500 | | | | 2,604 | | |
| Motion Pictures (5.1%) | |
Blockbuster, Inc., 144A
9.00%, due 09/01/2012 | | | 500 | | | | 513 | | |
News America Holdings, Inc.
7.75%, due 12/01/2045 | | | 2,700 | | | | 3,273 | | |
Time Warner, Inc.
7.63%, due 04/15/2031 | | | 3,000 | | | | 3,554 | | |
| Oil & Gas Extraction (4.7%) | |
Chesapeake Energy Corp.
6.88%, due 01/15/2016 | | | 2,000 | | | | 2,140 | | |
Evergreen Resources, Inc.
5.88%, due 03/15/2012 | | | 2,900 | | | | 2,987 | | |
Husky Oil, Ltd.
8.90%, due 08/15/2028 (b) | | | 1,420 | | | | 1,644 | | |
| | | Principal | | Value | |
| Paper & Allied Products (3.6%) | |
Domtar Inc.
7.88%, due 10/15/2011 | | $ | 1,875 | | | $ | 2,169 | | |
International Paper Co.
5.50%, due 01/15/2014 | | | 3,000 | | | | 3,096 | | |
| Personal Credit Institutions (0.9%) | |
Capital One Bank Corp.
8.25%, due 06/15/2005 | | | 1,246 | | | | 1,288 | | |
| Petroleum Refining (3.0%) | |
Enterprise Products Operating, LP, 144A
5.60%, due 10/15/2014 | | | 1,500 | | | | 1,529 | | |
Premcor Refining Group (The), Inc.
9.25%, due 02/01/2010 | | | 2,500 | | | | 2,844 | | |
| Primary Metal Industries (2.8%) | |
Alcoa, Inc.
4.25%, due 08/15/2007 | | | 2,750 | | | | 2,828 | | |
Phelps Dodge Corp.
8.75%, due 06/01/2011 | | | 1,000 | | | | 1,236 | | |
| Printing & Publishing (2.1%) | |
Viacom, Inc.
7.75%, due 06/01/2005 | | | 3,000 | | | | 3,095 | | |
| Radio & Television Broadcasting (2.6%) | |
Chancellor Media Corp.
8.00%, due 11/01/2008 | | | 3,275 | | | | 3,710 | | |
| Restaurants (2.3%) | |
Brinker International, Inc.
5.75%, due 06/01/2014 | | | 3,000 | | | | 3,174 | | |
Yum! Brands, Inc.
7.70%, due 07/01/2012 | | | 85 | | | | 101 | | |
| Security & Commodity Brokers (4.8%) | |
American Real Estate Partners, LP/
American Real Estate Finance Corp., 144A
8.13%, due 06/01/2012 | | | 1,000 | | | | 1,055 | | |
BCP Caylux Holdings Luxembourg SCA, 144A
9.63%, due 06/15/2014 | | | 2,000 | | | | 2,240 | | |
E*Trade Financial Corp., 144A
8.00%, due 06/15/2011 | | | 1,500 | | | | 1,583 | | |
Goldman Sachs Group, Inc.
6.35%, due 02/15/2034 | | | 1,975 | | | | 2,013 | | |
| Telecommunications (6.6%) | |
America Movil SA de CV
5.50%, due 03/01/2014 | | | 3,000 | | | | 2,948 | | |
Cincinnati Bell, Inc.
8.38%, due 01/15/2014 (a) | | | 975 | | | | 931 | | |
The notes to the financial statements are an integral part of this report.
Transamerica IDEX Mutual Funds
Annual Report 2004
5
TA IDEX Transamerica Flexible Income
SCHEDULE OF INVESTMENTS (continued)
At October 31, 2004
(all amounts except share amounts in thousands)
| | | Principal | | Value | |
| Telecommunications (continued) | |
Liberty Media Corp.
5.70%, due 05/15/2013 | | $ | 3,000 | | | $ | 3,030 | | |
Sprint Capital Corp.
7.13%, due 01/30/2006 | | | 2,500 | | | | 2,630 | | |
| Transportation & Public Utilities (0.1%) | |
Plains All American Pipeline Co.
5.63%, due 12/15/2013 | | | 100 | | | | 104 | | |
| Transportation Equipment (0.7%) | |
Bombardier Recreational Products, Inc., 144A
8.38%, due 12/15/2013 (a) | | | 1,000 | | | | 1,075 | | |
| Water Transportation (0.8%) | |
Royal Caribbean Cruises, Ltd.
8.75%, due 02/02/2011 | | | 1,000 | | | | 1,190 | | |
| Wholesale Trade Nondurable Goods (2.8%) | |
Domino's, Inc.
8.25%, due 07/01/2011 | | | 1,750 | | | | 1,916 | | |
Unilever Capital Corp.
6.88%, due 11/01/2005 | | | 2,000 | | | | 2,084 | | |
| Total Corporate Debt Securities (cost: $128,698) | | | | | | | 130,019 | | |
| CONVERTIBLE BONDS (0.8%) | |
| Retail Trade (0.8%) | |
Dick's Sporting Goods, Inc., 144A
1.61%, due 02/18/2024 (d) | | | 1,500 | | | | 1,166 | | |
| Total Convertible Bonds (cost: $1,069) | | | | | | | 1,166 | | |
| | | Shares | | Value | |
| CONVERTIBLE PREFERRED STOCKS (0.3%) | |
| Business Credit Institutions (0.3%) | |
| Sovereign Capital Trust II | | | 9,500 | | | $ | 450 | | |
| Total Convertible Preferred Stocks (cost: $475) | | | | | | | 450 | | |
| PREFERRED STOCKS (2.5%) | |
| Holding & Other Investment Offices (0.0%) | |
| Saul Centers, Inc. | | | 1,850 | | | | 49 | | |
| Telecommunications (2.5%) | |
| Centaur Funding Corp.–Class B, 144A | | | 2,750 | | | | 3,604 | | |
| Total Preferred Stocks (cost: $3,611) | | | | | | | 3,653 | | |
| COMMON STOCKS (0.0%) | |
| Telecommunications (0.0%) | |
Versatel Telecom International NV Warrants,
Expires 5/15/2008 (c) | | | 75 | | | | –(e) | | |
| Total Common Stocks (cost: $0) | | | | | | | – | | |
| | | Principal | | Value | |
| SECURITY LENDING COLLATERAL (5.4%) | |
| Debt (5.0%) | |
| Bank Notes (1.0%) | |
Bank of America
1.77%, due 12/03/2004 | | $ | 384 | | | $ | 384 | | |
| 1.88%, due 12/23/2004 | | | 128 | | | | 128 | | |
| 1.77%, due 01/18/2005 | | | 256 | | | | 256 | | |
Canadian Imperial Bank of Commerce
1.86%, due 11/04/2004 | | | 575 | | | | 575 | | |
Credit Suisse First Boston Corp.
1.83%, due 09/09/2005 | | | 64 | | | | 64 | | |
| Commercial Paper (0.5%) | |
Clipper Receivables Corp.
1.79%, due 11/12/2004 | | | 190 | | | | 190 | | |
Delaware Funding Corp. 144A
1.85%, due 11/19/2004 | | | 64 | | | | 64 | | |
Falcon Asset Securitization Corp. 144A
1.78%, due 11/04/2004 | | | 191 | | | | 191 | | |
| 1.75%, due 11/10/2004 | | | 256 | | | | 256 | | |
Galaxy Funding 144A
1.88%, due 11/22/2004 | | | 64 | | | | 64 | | |
| Euro Dollar Terms (2.3%) | |
Bank of Montreal
1.88%, due 11/24/2004 | | | 606 | | | | 606 | | |
BNP Paribas
1.77%, due 11/10/2004 | | | 320 | | | | 320 | | |
| 1.80%, due 11/23/2004 | | | 256 | | | | 256 | | |
| 1.98%, due 12/27/2004 | | | 256 | | | | 256 | | |
Calyon
1.70%, due 11/24/2004 | | | 34 | | | | 34 | | |
Citigroup
2.06%, due 01/25/2005 | | | 639 | | | | 639 | | |
Den Danske Bank
1.82%, due 11/19/2004 | | | 320 | | | | 320 | | |
Dexia Group
2.04%, due 01/21/2005 | | | 148 | | | | 148 | | |
HBOS Halifax Bank of Scotland
2.03%, due 01/21/2005 | | | 128 | | | | 128 | | |
Royal Bank of Scotland
2.01%, due 01/20/2005 | | | 256 | | | | 256 | | |
Toronto Dominion Bank
1.70%, due 11/08/2004 | | | 128 | | | | 128 | | |
Wells Fargo
1.87%, due 11/22/2004 | | | 320 | | | | 320 | | |
The notes to the financial statements are an integral part of this report.
Transamerica IDEX Mutual Funds
Annual Report 2004
6
TA IDEX Transamerica Flexible Income
SCHEDULE OF INVESTMENTS (continued)
At October 31, 2004
(all amounts except share amounts in thousands)
| | | Principal | | Value | |
| Promissory Notes (0.5%) | | | |
Goldman Sachs Group Inc.
1.90%, due 12/29/2004 | | $ | 268 | | | $ | 268 | | |
| 1.88%, due 01/27/2005 | | | 447 | | | | 447 | | |
| Repurchase Agreements (0.7%) | | | |
Merrill Lynch & Co., Inc. (f)
1.92% Repurchase Agreement dated
10/29/04 to be repurchased at $1,023
on 11/01/04 | | | 1,023 | | | | 1,023 | | |
| | | Shares | | Value | |
| Investment Companies (0.4%) | | | |
| Money Market Funds (0.4%) | | | |
Merrill Lynch Premier Institutional Fund
1-day yield of 1.71% | | | 314,575 | | | $ | 314 | | |
Merrimac Cash Fund, Premium Class
1-day yield of 1.46% | | | 230,202 | | | | 230 | | |
| Total Security Lending Collateral (cost: $7,865) | | | | | | | 7,865 | | |
| Total Investment Securities (cost: $146,962) | | | | | | $ | 148,391 | | |
| SUMMARY: | | | |
| Investments, at value | | | 102.2 | % | | $ | 148,391 | | |
| Liabilities in excess of other assets | | | (2.2 | )% | | | (3,177 | ) | |
| Net assets | | | 100.0 | % | | $ | 145,214 | | |
NOTES TO SCHEDULE OF INVESTMENTS:
(a) At October 31, 2004, all or a portion of this security is on loan (see Note 1). The value at October 31, 2004, of all securities on loan is $7,674.
(b) Floating or variable rate note. Rate is listed as of October 31, 2004.
(c) No dividends were paid during the preceding twelve months.
(d) Securities are stepbonds. Dick's Sporting Goods, Inc.–144A has a coupon rate of 1.61% until 02/18/2009, thereafter the coupon rate will be 0.00%.
(e) Value is less than $1.
(f) Cash collateral for the Repurchase Agreements, valued at $1044, that serve as collateral for securities lending are invested in corporate bonds with interest rates and maturity dates ranging from 0.00%–9.75% and 05/15/2005–9/15/2033, respectively.
DEFINITIONS:
144A 144A Securities are registered pursuant to Rule 144A of the Securities Act of 1933. These securities are deemed to be liquid for purposes of compliance limitations on holdings of illiquid securities and may be resold as transactions exempt from registration, normally to qualified institutional buyers. At October 31, 2004 these securities aggregated $24,404 or 16.81% of the net assets of the Fund.
The notes to the financial statements are an integral part of this report.
Transamerica IDEX Mutual Funds
Annual Report 2004
7
TA IDEX Transamerica Flexible Income
STATEMENT OF ASSETS AND LIABILITIES
At October 31, 2004
(all amounts except per share amounts in thousands)
| Assets: | | | |
Investment securities, at value (cost: $146,962)
(including securities loaned of $7,674) | | $ | 148,391 | | |
| Cash | | | 609 | | |
| Receivables: | |
| Investment securities sold | | | 4,272 | | |
| Shares of beneficial interest sold | | | 4 | | |
| Interest | | | 2,402 | | |
| Other | | | 10 | | |
| | | | 155,688 | | |
| Liabilities: | | | |
| Investment securities purchased | | | 2,177 | | |
| Accounts payable and accrued liabilities: | |
| Shares of beneficial interest redeemed | | | 126 | | |
| Management and advisory fees | | | 98 | | |
| Distribution fees | | | 79 | | |
| Transfer agent fees | | | 59 | | |
| Payable for collateral for securities on loan | | | 7,865 | | |
| Other | | | 70 | | |
| | | | 10,474 | | |
| Net Assets | | $ | 145,214 | | |
| Net Assets Consist of: | | | |
Shares of beneficial interest, unlimited shares
authorized, no par value | | $ | 143,792 | | |
| Undistributed net investment income (loss) | | | (5 | ) | |
Accumulated net realized gain (loss) from investment
securities, futures contracts and foreign currency
transactions | | | – | | |
Net unrealized appreciation (depreciation) on
investment securities | | | 1,427 | | |
| Net Assets | | $ | 145,214 | | |
| Net Assets by Class: | | | |
| Class A | | $ | 80,201 | | |
| Class B | | | 45,338 | | |
| Class C | | | 19,675 | | |
| Shares Outstanding: | | | |
| Class A | | | 8,286 | | |
| Class B | | | 4,684 | | |
| Class C | | | 2,036 | | |
| Net Asset Value Per Share: | | | |
| Class A | | $ | 9.68 | | |
| Class B | | | 9.68 | | |
| Class C | | | 9.67 | | |
| Maximum Offering Price Per Share (a): | | | |
| Class A | | $ | 10.16 | | |
(a) Includes the maximum selling commission (represented as a percentage of offering price) which is reduced on certain levels of sales as set forth in the Prospectus. Net asset value per share for Classes B and C shares represents offering price. The redemption price for Classes B and C shares equals net asset value less any applicable contingent deferred sales charge.
STATEMENT OF OPERATIONS
For the year ended October 31, 2004
(all amounts in thousands)
| Investment Income: | | | |
| Interest | | $ | 9,098 | | |
| Dividends | | | 167 | | |
| Income from loaned securities–net | | | 34 | | |
| | | | 9,299 | | |
| Expenses: | | | |
| Management and advisory fees | | | 1,325 | | |
| Transfer agent fees | |
| Class A | | | 122 | | |
| Class B | | | 63 | | |
| Class C | | | 10 | | |
| Class C2 | | | 13 | | |
| Class M | | | 17 | | |
| Printing and shareholder reports | | | 37 | | |
| Custody fees | | | 49 | | |
| Administration fees | | | 26 | | |
| Legal fees | | | 6 | | |
| Audit and accounting fees | | | 13 | | |
| Trustees fees | | | 10 | | |
| Registration fees | |
| Class A | | | 29 | | |
| Class B | | | 8 | | |
| Class C | | | 12 | | |
| Class C2 | | | 2 | | |
| Class M | | | 4 | | |
| Other | | | 9 | | |
| Distribution and service fees: | |
| Class A | | | 294 | | |
| Class B | | | 548 | | |
| Class C | | | 97 | | |
| Class C2 | | | 66 | | |
| Class M | | | 85 | | |
| Total expenses | | | 2,845 | | |
| Net Investment Income (Loss) | | | 6,454 | | |
| Net Realized Gain (Loss) from: | | | |
| Investment securities | | | 8,018 | | |
| Futures contracts | | | (1,010 | ) | |
| Foreign currency transactions | | | (390 | ) | |
| | | | 6,618 | | |
Increase (decrease) in unrealized appreciation
(depreciation) on investment securities | | | (4,963 | ) | |
Net Gain (Loss) on Investments, Futures Contracts
and Foreign Currency Transactions | | | 1,655 | | |
Net Increase (Decrease) in Net Assets Resulting
from Operations | | $ | 8,109 | | |
The notes to the financial statements are an integral part of this report.
Transamerica IDEX Mutual Funds
Annual Report 2004
8
TA IDEX Transamerica Flexible Income
STATEMENTS OF CHANGES IN NET ASSETS
For the years ended
(all amounts in thousands)
| | | October 31,
2004 | | October 31,
2003 | |
| Increase (Decrease) in Net Assets From: | |
| Operations: | |
| Net investment income (loss) | | $ | 6,454 | | | $ | 6,384 | | |
Net realized gain (loss) from
investment securities, futures
contracts and foreign currency
transactions | | | 6,618 | | | | 3,731 | | |
Net unrealized appreciation
(depreciation) on investment
securities | | | (4,963 | ) | | | 1,116 | | |
| | | | 8,109 | | | | 11,231 | | |
| Distributions to Shareholders: | |
| From net investment income: | |
| Class A | | | (3,599 | ) | | | (3,126 | ) | |
| Class B | | | (1,963 | ) | | | (2,115 | ) | |
| Class C | | | (364 | ) | | | (130 | ) | |
| Class C2 | | | (212 | ) | | | (470 | ) | |
| Class M | | | (348 | ) | | | (449 | ) | |
| | | | (6,486 | ) | | | (6,290 | ) | |
| From net realized gains: | |
| Class A | | | (5,266 | ) | | | – | | |
| Class B | | | (3,484 | ) | | | – | | |
| Class C | | | (374 | ) | | | – | | |
| Class C2 | | | (586 | ) | | | – | | |
| Class M | | | (655 | ) | | | – | | |
| | | | (10,365 | ) | | | – | | |
| Capital Share Transactions: | |
| Proceeds from shares sold: | |
| Class A | | | 7,550 | | | | 81,059 | | |
| Class B | | | 4,072 | | | | 28,769 | | |
| Class C | | | 1,036 | | | | 10,260 | | |
| Class C2 | | | 679 | | | | 9,606 | | |
| Class M | | | 218 | | | | 2,737 | | |
| | | | 13,555 | | | | 132,431 | | |
Dividends and distributions
reinvested: | |
| Class A | | | 8,515 | | | | 2,920 | | |
| Class B | | | 4,363 | | | | 1,678 | | |
| Class C | | | 537 | | | | 101 | | |
| Class C2 | | | 629 | | | | 366 | | |
| Class M | | | 931 | | | | 403 | | |
| | | | 14,975 | | | | 5,468 | | |
| Cost of shares redeemed: | |
| Class A | | | (19,408 | ) | | | (60,370 | ) | |
| Class B | | | (29,607 | ) | | | (29,848 | ) | |
| Class C | | | (6,101 | ) | | | (2,214 | ) | |
| Class C2 | | | (7,240 | ) | | | (13,557 | ) | |
| Class M | | | (4,561 | ) | | | (6,886 | ) | |
| | | | (66,917 | ) | | | (112,875 | ) | |
| Class level exchanges: | |
| Class C | | | 15,979 | | | | – | | |
| Class C2 | | | (7,462 | ) | | | – | | |
| Class M | | | (8,517 | ) | | | – | | |
| | | | – | | | | – | | |
| | | | (38,387 | ) | | | 25,024 | | |
| Net increase (decrease) in net assets | | | (47,129 | ) | | | 29,965 | | |
| | | October 31,
2004 | | October 31,
2003 | |
| Net Assets: | | | |
| Beginning of year | | | 192,343 | | | | 162,378 | | |
| End of year | | $ | 145,214 | | | $ | 192,343 | | |
Undistributed Net Investment Income
(Loss) | | $ | (5 | ) | | $ | 330 | | |
| Share Activity: | | | |
| Shares issued: | |
| Class A | | | 761 | | | | 8,049 | | |
| Class B | | | 411 | | | | 2,820 | | |
| Class C | | | 107 | | | | 1,008 | | |
| Class C2 | | | 68 | | | | 940 | | |
| Class M | | | 22 | | | | 266 | | |
| | | | 1,369 | | | | 13,083 | | |
Shares issued–reinvested from
distributions: | |
| Class A | | | 889 | | | | 287 | | |
| Class B | | | 455 | | | | 165 | | |
| Class C | | | 56 | | | | 10 | | |
| Class C2 | | | 65 | | | | 36 | | |
| Class M | | | 98 | | | | 40 | | |
| | | | 1,563 | | | | 538 | | |
| Shares redeemed: | |
| Class A | | | (1,972 | ) | | | (5,946 | ) | |
| Class B | | | (2,995 | ) | | | (2,936 | ) | |
| Class C | | | (622 | ) | | | (216 | ) | |
| Class C2 | | | (718 | ) | | | (1,335 | ) | |
| Class M | | | (464 | ) | | | (679 | ) | |
| | | | (6,771 | ) | | | (11,112 | ) | |
| Class level exchanges: | |
| Class C | | | 1,693 | | | | – | | |
| Class C2 | | | (806 | ) | | | – | | |
| Class M | | | (887 | ) | | | – | | |
| | | | – | | | | – | | |
Net increase (decrease) in shares
outstanding: | |
| Class A | | | (322 | ) | | | 2,390 | | |
| Class B | | | (2,129 | ) | | | 49 | | |
| Class C | | | 1,234 | | | | 802 | | |
| Class C2 | | | (1,391 | ) | | | (359 | ) | |
| Class M | | | (1,231 | ) | | | (373 | ) | |
| | | | (3,839 | ) | | | 2,509 | | |
The notes to the financial statements are an integral part of this report.
Transamerica IDEX Mutual Funds
Annual Report 2004
9
TA IDEX Transamerica Flexible Income
FINANCIAL HIGHLIGHTS
| | | | | For a share of beneficial interest outstanding throughout each period | |
| | | | | Net Asset | | Investment Operations | | Distributions | | Net Asset | |
| | | For the
Period
Ended (d)(g) | | Value,
Beginning
of Period | | Net
Investment
Income (Loss) | | Net Realized
and Unrealized
Gain (Loss) | | Total
Operations | | From Net
Investment
Income | | From Net
Realized
Gains | | Total
Distributions | | Value,
End
of Period | |
| Class A | | 10/31/2004 | | $ | 10.21 | | | $ | 0.41 | | | $ | 0.11 | | | $ | 0.52 | | | $ | (0.42 | ) | | $ | (0.63 | ) | | $ | (1.05 | ) | | $ | 9.68 | | |
| | | 10/31/2003 | | | 9.94 | | | | 0.36 | | | | 0.27 | | | | 0.63 | | | | (0.36 | ) | | | – | | | | (0.36 | ) | | | 10.21 | | |
| | | 10/31/2002 | | | 9.99 | | | | 0.40 | | | | 0.02 | | | | 0.42 | | | | (0.41 | ) | | | (0.06 | ) | | | (0.47 | ) | | | 9.94 | | |
| | | 10/31/2001 | | | 9.26 | | | | 0.47 | | | | 0.71 | | | | 1.18 | | | | (0.45 | ) | | | – | | | | (0.45 | ) | | | 9.99 | | |
| | | 10/31/2000 | | | 9.46 | | | | 0.57 | | | | (0.19 | ) | | | 0.38 | | | | (0.58 | ) | | | – | | | | (0.58 | ) | | | 9.26 | | |
| Class B | | 10/31/2004 | | | 10.20 | | | | 0.35 | | | | 0.12 | | | | 0.47 | | | | (0.36 | ) | | | (0.63 | ) | | | (0.99 | ) | | | 9.68 | | |
| | | 10/31/2003 | | | 9.94 | | | | 0.30 | | | | 0.25 | | | | 0.55 | | | | (0.29 | ) | | | – | | | | (0.29 | ) | | | 10.20 | | |
| | | 10/31/2002 | | | 9.99 | | | | 0.34 | | | | 0.02 | | | | 0.36 | | | | (0.35 | ) | | | (0.06 | ) | | | (0.41 | ) | | | 9.94 | | |
| | | 10/31/2001 | | | 9.26 | | | | 0.37 | | | | 0.74 | | | | 1.11 | | | | (0.38 | ) | | | – | | | | (0.38 | ) | | | 9.99 | | |
| | | 10/31/2000 | | | 9.46 | | | | 0.51 | | | | (0.19 | ) | | | 0.32 | | | | (0.52 | ) | | | – | | | | (0.52 | ) | | | 9.26 | | |
| Class C | | 10/31/2004 | | | 10.20 | | | | 0.36 | | | | 0.10 | | | | 0.46 | | | | (0.36 | ) | | | (0.63 | ) | | | (0.99 | ) | | | 9.67 | | |
| | | 10/31/2003 | | | 9.98 | | | | 0.29 | | | | 0.22 | | | | 0.51 | | | | (0.29 | ) | | | – | | | | (0.29 | ) | | | 10.20 | | |
| | | | | | | Ratios/Supplemental Data | |
| | | For the
Period | | Total | | Net Assets,
End of
Period | | Ratio of Expenses
to Average
Net Assets (a) | | Net Investment
Income (Loss)
to Average | | Portfolio
Turnover | |
| | | Ended (g) | | Return (c) | | (000's) | | Net (e) | | Total (f) | | Net Assets (a) | | Rate (b) | |
| Class A | | 10/31/2004 | | | 5.72 | % | | $ | 80,201 | | | | 1.43 | % | | | 1.43 | % | | | 4.25 | % | | | 169 | % | |
| | | 10/31/2003 | | | 6.39 | | | | 87,898 | | | | 1.49 | | | | 1.50 | | | | 3.56 | | | | 164 | | |
| | | 10/31/2002 | | | 4.45 | | | | 61,815 | | | | 1.62 | | | | 1.65 | | | | 4.23 | | | | 245 | | |
| | | 10/31/2001 | | | 13.14 | | | | 29,600 | | | | 1.68 | | | | 1.70 | | | | 4.84 | | | | 315 | | |
| | | 10/31/2000 | | | 4.10 | | | | 16,530 | | | | 1.84 | | | | 1.87 | | | | 6.17 | | | | 166 | | |
| Class B | | 10/31/2004 | | | 5.13 | | | | 45,338 | | | | 2.03 | | | | 2.03 | | | | 3.61 | | | | 169 | | |
| | | 10/31/2003 | | | 5.59 | | | | 69,502 | | | | 2.14 | | | | 2.15 | | | | 2.91 | | | | 164 | | |
| | | 10/31/2002 | | | 3.83 | | | | 67,220 | | | | 2.27 | | | | 2.30 | | | | 3.58 | | | | 245 | | |
| | | 10/31/2001 | | | 12.28 | | | | 40,435 | | | | 2.33 | | | | 2.35 | | | | 4.19 | | | | 315 | | |
| | | 10/31/2000 | | | 3.46 | | | | 14,008 | | | | 2.49 | | | | 2.51 | | | | 5.52 | | | | 166 | | |
| Class C | | 10/31/2004 | | | 5.02 | | | | 19,675 | | | | 2.10 | | | | 2.10 | | | | 3.74 | | | | 169 | | |
| | | 10/31/2003 | | | 5.16 | | | | 8,178 | | | | 2.14 | | | | 2.15 | | | | 2.91 | | | | 164 | | |
NOTES TO FINANCIAL HIGHLIGHTS
(a) Annualized.
(b) Not annualized for periods of less than one year.
(c) Total Return has been calculated for the applicable period without deduction of a sales load, if any, on an initial purchase. Periods of less than one year are not annualized.
(d) Per share information is calculated based on average numbre of shares outstanding for the years ended 10/31/2001, 10/31/2002, 10/31/2003 and 10/31/2004.
(e) Ratio of Net Expenses to Average Net Assets is net of fee waivers and reimbursements by the investment adviser, if any (see note 2).
(f) Ratio of Total Expenses to Average Net Assets includes all expenses before waivers and reimbursements by the investment adviser.
(g) The inception date for the Fund's offering of share Class L was November 11, 2002. Class L was renamed Class C on March 1, 2004. (see note 1)
The notes to the financial statements are an integral part of this report.
Transamerica IDEX Mutual Funds
Annual Report 2004
10
TA IDEX Transamerica Flexible Income
NOTES TO FINANCIAL STATEMENTS
At October 31, 2004
(all amounts in thousands)
NOTE 1. ORGANIZATION AND SIGNIFICANT ACCOUNTING POLICIES
Transamerica IDEX Mutual Funds, formerly IDEX Mutual Funds, is a Massachusetts business trust registered under the Investment Company Act of 1940, as amended (the "1940 Act"), as an open-end management investment company. TA IDEX Transamerica Flexible Income ("the Fund"), part of Transamerica IDEX Mutual Funds, began operations on June 29, 1987.
On March 1, 2004, the Fund changed its name from IDEX Janus Flexible Income to TA IDEX Transamerica Flexible Income and changed its sub-adviser from Janus Capital Management, LLC to Transamerica Investment Management, LLC.
In the normal course of business, the Fund enters into contracts that contain a variety of representations and warranties, which provide general indemnifications. The Fund's maximum exposure under these arrangements is unknown, as this would involve future claims that may be made against the Fund and/or its affiliates that have not yet occurred. However, based on experience, the Fund expects the risk of loss to be remote.
See the Prospectus and Statement of Additional Information for a description of the Fund's investment objective.
In preparing the Fund's financial statements in accordance with accounting principles generally accepted in the United States of America ("GAAP"), estimates or assumptions (which could differ from actual results) may be used that affect reported amounts and disclosures. The following policies were consistently followed by the Fund, in accordance with GAAP.
Multiple class operations and expenses: The Fund currently offers three classes of shares, each with a public offering price that reflects different sales charges, if any, and expense levels. All shares designated as Class C shares prior to March 1, 2004, were renamed as Class C2 shares on that date. All shares designated as Class L shares prior to March 1, 2004, were renamed as Class C shares with different sales charges than the previous Class L shares. On June 15, 2004, Class C2 shares merged into Class C. On September 24, 2004, Class M shares merged into Class C. Class B shares will convert to Class A shares eight years after purchase. Income, non-class specific expenses and realized and unrealized gains and losses, are allocated daily to each class, based upon the value of shares outstanding method as permitted under Rule 18f-3 of the 1940 Act. Each class bears its own specific expenses as well as a portion of general, common expenses.
Class I shares of the Transamerica IDEX Mutual Funds funds were offered for investment to the strategic asset allocation funds of AEGON/Transactions Series Fund, Inc. (ATSF): ATSF Asset Allocation–Conservative Portfolio, ATSF Asset Allocation–Growth Portfolio, ATSF Asset Allocation–Moderate Growth Portfolio and ATSF Asset Allocation–Moderate Portfolio on November 8, 2004.
Pricing of shares: The Fund prices its shares on the basis of the net asset value of each class of shares of the Fund, which is determined as of the close of the New York Stock Exchange ("NYSE") (generally 4:00 p.m. Eastern Time) on each day on which the NYSE is open for trading (other than a day on which there are insufficient changes in the value of the Fund's portfolio securities to materially affect the Fund's net asset value or a day on which no shares are tendered for redemption and no order to purchase any shares is received).
Security valuations: Fund investments traded on an exchange are valued at the closing price on the day of valuation on the exchange where the security is principally traded. With respect to securities traded on NASDAQ NMS, such closing price may be the last reported sales price or the NASDAQ Official Closing Price.
Securities traded in the over-the-counter market and listed securities for which no sale was reported on that date are valued at the last quoted bid price.
Debt securities are valued by independent pricing services; however, those that mature in sixty days or less are valued at amortized cost, which approximates market.
Investment company securities are valued at net asset value of the underlying portfolio.
Foreign securities generally are valued based on quotations from the primary market in which they are traded and are translated from the local currency into U.S. dollars using closing exchange rates. Many foreign securities markets are open for trading at times when the U.S. markets are closed for trading, and many foreign securities markets close for trading before the close of the NYSE. The value of foreign securities may be affected significantly on a day that the NYSE is closed and an investor is unable to purchase or redeem shares. If a significant market event impacting the value of a portfolio security (e.g., natural disaster, company announcement, market volatility) occurs subsequent to the close of trading in the security, but prior to the calculation of the Fund's net asset value per share, market quotations for that security may be determined to be unreliable and, accordingly, not "readily av ailable." If market quotations are not readily available, and the impact of such a significant market event materially effects the net asset value per share of the Fund, an affected portfolio security will be valued at fair market value as determined in good faith using guidelines adopted by the Board of Trustees of the Fund, under the supervision of the Fund's Valuation Committee. Factors that may be considered to value foreign securities at fair market value may include, among others: the value of other securities traded on other markets, foreign currency exchange activity and the trading of financial products tied to foreign securities.
Other securities for which quotations are not readily available are valued at fair market value as determined in good faith using guidelines adopted by the Board of Trustees of the Fund, under the supervision of the Fund's Valuation Committee.
Transamerica IDEX Mutual Funds
Annual Report 2004
11
TA IDEX Transamerica Flexible Income
NOTES TO FINANCIAL STATEMENTS (continued)
At October 31, 2004
(all amounts in thousands)
NOTE 1.–(continued)
The Fund values its investment securities at fair value based upon procedures approved by the Board of Trustees on days when significant events occur after the close of the principal exchange on which the securities are traded, and as a result, are expected to materially effect the value of investments.
Cash: The Fund may leave cash overnight in its cash account with the custodian, Investors Bank & Trust Company ("IBT"). IBT has been contracted on behalf of the Fund to invest the excess cash into a savings account, which at October 31, 2004, was paying an interest rate of 1.30%.
Throughout the year, the Fund may have a cash overdraft balance. A fee is incurred on this overdraft, calculated by multiplying the overdraft by a rate based on the federal funds rate. This fee is inlcuded in Custody fees in the Statement of Operations.
Repurchase agreements: The Fund is authorized to enter into repurchase agreements. The Fund, through IBT, receives delivery of the underlying securities, the value of which at the time of purchase is required to be an amount equal to at least 100% of the resale price. Repurchase agreements involve the risk that the seller will fail to repurchase the security, as agreed. In that case, the Fund will bear the risk of value fluctuations until the security can be sold and may encounter delays and incur costs in liquidating the security. In the event of bankruptcy or insolvency of the seller, delays and costs may be incurred.
Securities lending: The Fund may lend securities to enhance fund earnings from investing cash collateral in making such loans to qualified borrowers (typically broker/dealers). The Fund has engaged its custodian bank, IBT, as a lending agent to administer its securities lending program. IBT earned $14 of program income for its services. When the Fund makes a security loan, it receives cash collateral as protection against the risk that the borrower will default on the loan, and records an asset for the cash invested collateral and a liability for the return of the collateral.
Securities on loan are included in Investment securities at value in the Statement of Assets and Liabilities and remain on the Schedule of Investments.
Loans of securities are required to be secured by collateral at least equal to 102% of the value of the securities at inception of the loan, and not less then 100% thereafter. The Fund may invest cash collateral in short-term money market instruments including: U.S. Treasury Bills, U.S. agency obligations, commercial paper, money market mutual funds, repurchase agreements and other highly rated, liquid investments. During the life of securities loans, the collateral and securities loaned remain subject to fluctuation in value. IBT marks to market securities loaned and the collateral each business day. If additional collateral is due (at least $1), IBT collects additional cash collateral from the borrowers. Although securities loaned will be fully collateralized at all times, IBT may experience delays in, or may be prevented from, recovering the collateral on behalf of the Fund. The Fund may recall a loaned security position at any time from the borrower through IBT. In the event the borrower fails to timely return a recalled security, IBT may indemnify the Fund by purchasing replacement securities for the Fund at its own expense and claiming the collateral to fund such a purchase. IBT absorbs the loss if the collateral value is not sufficient to cover the cost of the replacement securities. If replacement securities are not available, IBT will credit the equivalent cash value to the Fund.
While a security is on loan, the Fund does not have the right to vote that security. However, if time permits, the Fund will attempt to recall a security on loan and vote the proxy.
Income from securities lending is included in the Statement of Operations. The amount of collateral and value of securities on loan are included in the Statement of Assets and Liabilities as well as in the Schedule of Investments.
Security transactions and investment income: Security transactions are recorded on the trade date. Security gains and losses are calculated on the specific identification basis. Dividend income is recorded on the ex-dividend date or, in the case of foreign securities, as soon as the Fund is informed of the ex-dividend date. Interest Income, including accretion of discounts and amortization of premiums, is recorded on the accrual basis commencing on the settlement date.
Foreign currency denominated investments: The accounting records of the Fund are maintained in U.S. dollars. Securities and other assets and liabilities denominated in foreign currencies are translated into U.S. dollars at the closing exchange rate each day. The cost of foreign securities is translated at the exchange rate in effect when the investment was acquired. The Fund combines fluctuations from currency exchange rates and fluctuations in value when computing net realized and unrealized gains or losses from investments.
Net foreign currency gains and losses resulting from changes in exchange rates include: 1) foreign currency fluctuations between trade date and settlement date of investment security transactions; 2) gains and losses on forward foreign currency contracts; and 3) the difference between the receivable amounts of interest and dividends recorded in the accounting records in U.S. dollars and the amounts actually received.
Foreign currency denominated assets may involve risks not typically associated with domestic transactions, including unanticipated movements in exchange currency rates, the degree of government supervision and regulation of security markets, and the possibility of political or economic instability.
Foreign capital gains taxes: The Fund may be subject to taxes imposed by countries in which it invests, with respect to its investment in issuers existing or operating in such countries. Such taxes are generally based on income earned or repatriated and capital gains realized on the sale of such investments. The Fund accrues such taxes when the related
Transamerica IDEX Mutual Funds
Annual Report 2004
12
TA IDEX Transamerica Flexible Income
NOTES TO FINANCIAL STATEMENTS (continued)
At October 31, 2004
(all amounts in thousands)
NOTE 1.–(continued)
income or capital gains are earned. Some countries require governmental approval for the repatriation of investment income, capital or the proceeds of sales earned by foreign investors. In addition, if there is deterioration in a country's balance of payments or for other reasons, a country may impose temporary restrictions on foreign capital remittances abroad.
Forward foreign currency contracts: The Fund may enter into forward foreign currency contracts to hedge against exchange rate risk arising from investments in securities denominated in foreign currencies. Contracts are valued at the contractual forward rate and are marked to market daily, with the change in value recorded as an unrealized gain or loss. When the contracts are closed a realized gain or loss is incurred. Risks may arise from changes in market value of the underlying currencies and from the possible inability of counterparties to meet the terms of their contracts.
There were no open forward foreign currency contracts at October 31, 2004.
Futures contracts: The Fund may enter into futures contracts to manage exposure to market, interest rate or currency fluctuations. Futures contracts are valued at the settlement price established each day by the board of trade or exchange on which they are traded. The primary risks associated with futures contracts are imperfect correlation between the change in market value of the securities held and the prices of futures contracts; the possibility of an illiquid market and inability of the counterparty to meet the contract terms.
There were no open futures contracts at October 31, 2004.
Account maintenance fees: If the shareholder account balance falls below $1 by either shareholder action or as a result of market action, a $25 (not in thousands) fee is assessed every year until the balance reaches $1. The fee is assessed by redeeming shares in the shareholder's account.
No fee will be charged under the following conditions:
• accounts opened within the preceding 24 months
• accounts with an active monthly Automatic Investment Plan ($50 (not in thousands) minimum per fund)
• accounts owned by an individual which, when combined by social security number, have a balance of $5 or more
• accounts owned by individuals in the same household (by address) that have a combined balance of $5 or more
• UTMA/UGMA accounts
• Fiduciary accounts
• B-share accounts whose shares have started to convert to
A-shares accounts (as long as combined value of both accounts is at least $1)
For the year ended October 31, 2004, this fee totaled $1. These fees are included in Paid in Capital in the Statement of Assets and Liabilities.
Redemption fees: A short-term trading redemption fee may be assessed on any fund shares in a fund account that are sold during the first five (5) New York Stock Exchange trading days following their purchase date. This redemption fee will equal 2% of the amount redeemed and shares held the longest will be treated as being redeemed first and shares held the shortest as being redeemed last. For the year ended October 31, 2004, the Fund received no redemption fees.
Dividend distributions: Distributions to shareholders are recorded on the ex-dividend date and are determined in accordance with Federal income tax regulations which may differ from GAAP.
NOTE 2. RELATED PARTY TRANSACTIONS
AEGON/Transamerica Fund Advisers, Inc. ("ATFA") is the Fund's investment adviser. AEGON/Transamerica Fund Services, Inc. ("ATFS") is the Fund's administrator. AFSG Securities Corp. ("AFSG") is the Fund's distributor/principal underwriter. AEGON/Transamerica Investor Services, Inc. ("ATIS") is the Fund's transfer agent. ATIS and AFSG are 100% owned by AUSA Holding Company ("AUSA"). ATFA is a directly owned subsidiary of Western Reserve Life Assurance Co. of Ohio (78%) ("WRL") and AUSA (22%). ATFS is a wholly owned subsidiary of WRL. AUSA and WRL are wholly owned indirect subsidiaries of AEGON NV, a Netherlands corporation.
Transamerica Investment Management, LLC is both an affiliate of the Fund and a sub-adviser to the Fund.
The following schedule reflects the percentage of fund assets owned by affiliated mutual funds (i.e., through the assets allocation funds):
| | | Net
Assets | | % of
Net Assets | |
TA IDEX Asset Allocation–
Conservative Portfolio | | $ | 14,575 | | | | 10 | % | |
TA IDEX Asset Allocation–
Moderate Growth Portfolio | | | 14,244 | | | | 10 | % | |
TA IDEX Asset Allocation–
Moderate Portfolio | | | 24,088 | | | | 17 | % | |
| Total | | $ | 52,907 | | | | 37 | % | |
Transamerica IDEX Mutual Funds
Annual Report 2004
13
TA IDEX Transamerica Flexible Income
NOTES TO FINANCIAL STATEMENTS (continued)
At October 31, 2004
(all amounts in thousands)
NOTE 2.–(continued)
Investment advisory fees: The Fund pays management fees to ATFA based on average daily net assets ("ANA") at the following breakpoints:
From November 1, 2003 to February 28, 2004:
0.875% of the first $100 million of ANA
0.775% of the next $150 million of ANA
0.675% of ANA over $250 million
From March 1, 2004 on:
0.80% of the first $100 million of ANA
0.775% of the next $150 million of ANA
0.675% of ANA over $250 million
ATFA has contractually agreed to waive its advisory fee and will reimburse the Fund to the extent that operating expenses, excluding 12b-1 fees, exceed the following stated annual limit:
1.50% Expense Limit
If total fund expenses fall below the annual expense limitation agreement agreed to by the adviser within the succeeding three years, the Fund may be required to pay that adviser a portion or all of the waived advisory fees.
There were no amounts recaptured during the fiscal year ended October 31, 2004. There were no amounts subject to recapture at October 31, 2004.
Prior to March 1, 2004, the sub-adviser, Janus Capital Management, LLC ("Janus") acted as the sub-adviser. Janus had agreed to a pricing discount based on the aggregate assets that they manage in the AEGON/Transamerica Series Fund, Inc. and Transamerica IDEX Mutual Funds. The amount of the discount received by the Fund for the period from November 1, 2003 through February 29, 2004, was $1.
Distribution and service fees: The Fund has a 12b-1 distribution plan under the 1940 Act pursuant to which an annual fee, based on average daily net assets, is paid to the distributor for various disbursements such as broker-dealer account servicing fees and other promotional expenses of the Fund. The Fund is authorized under the 12b-1 plan to pay fees on each class up to the following limits:
| Class A | | | 0.35 | % | |
| Class B | | | 1.00 | % | |
| Class C | | | 1.00 | % | |
| Class C2 | | | 1.00 | % | |
| Class M | | | 0.90 | % | |
Class C2 and Class M merged into Class C on June 15, 2004 and September 24, 2004, respectively.
In the case the Fund or a class of shares of the Fund is closed to new investors or investments, the Fund is authorized to pay 12b-1 fees for past sales and distribution efforts and present and past investor services.
Underwriter commissions relate to front-end sales charges imposed for Class A and M shares and contingent deferred sales charges from Classes B, C, M and certain A share redemptions. For the year ended October 31, 2004, the underwriter commissions were as follows:
| Received by Underwriter | | $ | 339 | | |
| Retained by Underwriter | | | 11 | | |
| Contingent Deferred Sales Charge | | | 262 | | |
Administrative services: The Fund has entered into an agreement with ATFS for financial and legal fund administration services, which includes such items as compliance, expenses, financial statements and other reporting, distributions, tax returns, prospectus preparation, board of trustees meeting support and other legal matters. The Fund pays ATFS an annual fee of 0.015% of average net assets. The Legal fees on the Statement of Operations are for fees paid to external legal counsel.
The Fund paid ATFS $26 for the year ended October 31, 2004.
Transfer agent fees: The fund pays ATIS an annual per-account charge of $20 (not in thousands) for each open account and $1.63 (not in thousands) for each closed account. There is no new account charge. The transfer agent fees on the Statement of Operations are made up of fees paid to ATIS and costs associated with shareholder statements. The Fund paid ATIS $225 for the year ended October 31, 2004.
Deferred compensation plan: Each eligible Fund Trustee may elect participation in the Deferred Compensation Plan ("the Plan"). Under the Plan, such Trustees may defer payment of a percentage of their total fees earned as a Fund Trustee. These deferred amounts may be invested in any Transamerica IDEX Mutual Fund. At October 31, 2004, the value of invested plan amount was $9. Invested plan amounts and the total liability for deferred compensation to the Trustees under the Plan at October 31, 2004, are included in the accompanying Statement of Assets and Liabilities.
NOTE 3. INVESTMENT TRANSACTIONS
The cost of securities purchased and proceeds from securities sold (excluding short-term securities) for the year ended October 31, 2004, were as follows:
| Purchases of securities: | | | |
| Long-Term excluding U.S. Government | | $ | 212,437 | | |
| U.S. Government | | | 58,186 | | |
| Proceeds from maturities and sales of securities: | | | |
| Long-Term excluding U.S. Government | | | 206,737 | | |
| U.S. Government | | | 114,004 | | |
Transamerica IDEX Mutual Funds
Annual Report 2004
14
TA IDEX Transamerica Flexible Income
NOTES TO FINANCIAL STATEMENTS (continued)
At October 31, 2004
(all amounts in thousands)
NOTE 4. FEDERAL INCOME TAX MATTERS
The Fund has not made any provision for federal income or excise taxes due to its policy to distribute all of its taxable income and capital gains to its shareholders and otherwise qualify as a regulated investment company under the Internal Revenue Code. Income and capital gain distributions are determined in accordance with income tax regulations, which may differ from GAAP. These differences are primarily due to differing treatment for items including, but not limited to foreign currency transactions.
Reclassifications between Undistributed net investment income (loss), Undistributed net realized capital gains (loss) and Shares of beneficial interest are made to reflect income and gains available for distribution under federal tax regulations. Results of operations and net assets are not effected by these reclassifications. These reclassifications are as follows:
| Shares of beneficial interest, unlimited shares authorized | | $ | (331 | ) | |
| Undistributed net investment income (loss) | | | (303 | ) | |
Accumulated net realized gain (loss) from investment
securities, futures contracts and foreign currency
transactions | | | 634 | | |
The tax character of distributions paid may differ from the character of distributions shown in the Statements of Changes in Net Assets due to short-term gains being treated as ordinary income for tax purposes. The tax character of distributions paid during 2003 and 2004 was as follows:
| 2003 Distributions paid from: | | | |
| Ordinary Income | | $ | 6,290 | | |
| Long-term capital gain | | | – | | |
| 2004 Distributions paid from: | | | |
| Ordinary Income | | | 9,500 | | |
| Long-term capital gain | | | 7,022 | | |
| Return of capital | | | 329 | | |
The tax basis components of distributable earnings as of October 31, 2004, are as follows:
| Undistributed Ordinary Income | | $ | – | | |
| Undistributed Long-term Capital Gains | | $ | – | | |
| Capital Loss Carryforward | | $ | – | | |
| Net Unrealized Appreciation (Depreciation) | | $ | 1,429 | | |
The aggregate cost of investments and composition of unrealized appreciation (depreciation) for federal income tax purposes as of October 31, 2004, are as follows:
| Federal Tax Cost Basis | | $ | 146,962 | | |
| Unrealized Appreciation | | $ | 2,819 | | |
| Unrealized (Depreciation) | | | (1,390 | ) | |
| Net Unrealized Appreciation (Depreciation) | | $ | 1,429 | | |
NOTE 5. OTHER MATTERS
Transamerica IDEX Mutual Funds ("TA IDEX"), and certain of its affiliated entities, have received requests for information from the Staff of the Securities and Exchange Commission in connection with market timing and late trading within the funds. TA IDEX and the affiliated entities have voluntarily cooperated in the investigation and have been providing the information as requested.
Transamerica IDEX Mutual Funds
Annual Report 2004
15
Report of Independent Registered Certified Public Accounting Firm
To the Board of Trustees and Shareholders of
TA IDEX Transamerica Flexible Income
In our opinion, the accompanying statement of assets and liabilities, including the schedule of investments, and the related statements of operations and of changes in net assets and the financial highlights present fairly, in all material respects, the financial position of TA IDEX Transamerica Flexible Income (the "Fund") (one of the portfolios constituting the Transamerica IDEX Mutual Funds) at October 31, 2004, the results of its operations for the year then ended, the changes in its net assets for each of the two years in the period then ended and the financial highlights for each of the periods indicated, in conformity with accounting principles generally accepted in the United States of America. These financial statements and financial highlights (hereafter referred to as "financial statements") are the responsibility of the Fund's management; our responsibility is to express an opinion on t hese financial statements based on our audits. We conducted our audits of these financial statements in accordance with the standards of the Public Company Accounting Oversight Board (United States). Those standards require that we plan and perform the audit to obtain reasonable assurance about whether the financial statements are free of material misstatement. An audit includes examining, on a test basis, evidence supporting the amounts and disclosures in the financial statements, assessing the accounting principles used and significant estimates made by management, and evaluating the overall financial statement presentation. We believe that our audits, which included confirmation of securities at October 31, 2004 by correspondence with the custodian and brokers, provide a reasonable basis for our opinion.

PricewaterhouseCoopers LLP
Tampa, Florida
December 28, 2004
Transamerica IDEX Mutual Funds
Annual Report 2004
16
TA IDEX Transamerica Flexible Income
SUPPLEMENTAL INFORMATION (unaudited)
TAX INFORMATION
For tax purposes, the Fund has made a Long-Term Capital Gain Designation of $7,022 for the year ended October 31, 2004.
For dividends paid during the year ended October 31, 2004, the Fund designates $47 as qualified dividend income.
For corporate shareholders, 2% of investment income (dividend income plus short-term gains, if any) qualifies for the dividends received deduction.
RESULTS OF SHAREHOLDER PROXY
At a special meeting of Class M shareholders of each series of Transamerica IDEX (except TA IDEX Federated Tax Exempt and TA IDEX Protected Principal Stock held on September 2, 2004, the results of the Proposal were as follows:
Proposal 1: Approval of a conversion of Class M shares into Class C shares of the Funds, which will result in bearing the distribution and service fees payable under the 12b-1 Plan of Distribution for the Class C shares of the Funds.
| For | | Against | | Abstentions/Broker Non-Votes | |
| | 72.51 | % | | | 13.97 | % | | | 13.52 | % | |
Transamerica IDEX Mutual Funds
Annual Report 2004
17
TA IDEX Transamerica Growth Opportunities
MARKET ENVIRONMENT
The 12 months ended October 31, 2004, unfolded largely as we anticipated. U.S. equity markets delivered more modest returns than previously and were noticeably volatile.
In response to signs that the pace of U.S. economic growth was accelerating, investors initially showed a strong affinity for stocks in industries like technology and casinos/gambling; stocks that had led the 2003 market rally (e.g., air transportation and equipment manufacturers) retrenched. Later, economic data suggested that, while growing, the economy was not expanding rapidly. Business and consumer spending proved less robust than generally expected. One primary reason was sharply rising oil prices by summer, the result of supply disruptions combined with burgeoning demand from developing nations like China. This, too, caused a rotation in market leadership. High-flying technology stocks lost their momentum, while the energy, raw materials and transportation sectors posted strong gains.
PERFORMANCE
For the year ended October 31, 2004, TA IDEX Transamerica Growth Opportunities, Class A returned 11.09%. By comparison its benchmark, the Russell 2500 Growth Index, returned 6.14%.
STRATEGY REVIEW
We attribute the portfolio's superior results to our highly selective approach to technology, an area where we have a heightened sensitivity to the business risks, and to the consistent mix of conservative and aggressive stocks in the portfolio. We strive to maintain a predominance of steadily growing companies in a variety of industries, each with positive secular trends, strong free cash flow, savvy management and sustainable competitive advantages. We complement this core portfolio with a small number of investments in early-stage and turnaround opportunities with similar attributes. The portfolio's major contributors to performance were a mixture of these steady growers (Expeditors International of Washington, Inc. ("Expeditors"), C. H. Robinson Worldwide, Inc. ("C.H. Robinson") and BlackRock, Inc. ("BlackRock")) and more aggressive investments (Gemstar – TV Guide International, Inc. ("Gemstar") and McAfee, Inc. ("McAfee")).
Expeditors and C. H. Robinson, both facilitators of global freight transport, are organically growing companies, and we believe each has benefited from rising demand as the worldwide economy expands. As for Blackrock, one of the nation's largest fixed-income asset managers, we have long had faith in its management team but were still pleasantly surprised by their well-priced acquisition of an equity asset management group.
Gemstar is a prime example of what we consider an early-stage opportunity. This publisher of TV Guide Magazine also produces on-screen program guides for cable TV systems. In our opinion, a relatively new management team has done an admirable job of building relationships with cable providers and strengthening the company's finances. At the same time, consumer acceptance of digital TV is boosting demand for Gemstar's on-line services.
Likewise, we are impressed with the priorities of management at McAfee, one of two dominant providers for computer-security software. A relatively new chief executive officer is refocusing McAfee on its core business of personal computer security, where recurring revenues and scalability are both advantages.
Two other companies where we counted on strong management were DeVrY Inc. ("DeVrY"), which provides education for technology workers, and BARRA, Inc. ("BARRA"), an investment manager and provider of investment data. Both were disappointments during this period, largely due to poor decisions about capital structure (BARRA) and weak execution (DeVrY). We are re-evaluating our exposure to DeVrY and sold our position in BARRA.
Christopher J. Bonavico, CFA
Kenneth F. Broad, CFA
Co-Fund Managers
Transamerica Investment Management, LLC
Transamerica IDEX Mutual Funds
Annual Report 2004
1
TA IDEX Transamerica Growth Opportunities
Comparison of change in value of $10,000 investment in Class A shares and its comparative index.
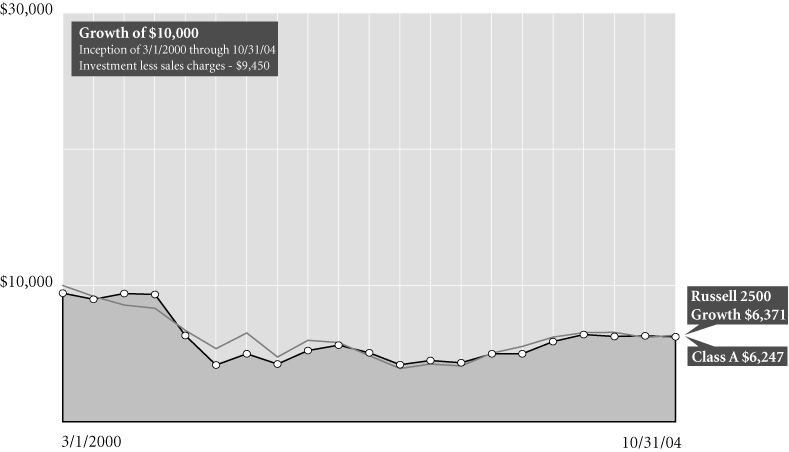
Average Annual Total Return for Periods Ended 10/31/04
| | | 1 year | | From
Inception | | Inception
Date | |
| Class A (NAV) | | | 11.09 | % | | | (8.49 | )% | | 3/1/00 | |
| Class A (POP) | | | 4.98 | % | | | (9.59 | )% | | 3/1/00 | |
| Russell 25001 | | | 6.14 | % | | | (9.21 | )% | | 3/1/00 | |
| Class B (NAV) | | | 10.02 | % | | | (9.20 | )% | | 3/1/00 | |
| Class B (POP) | | | 5.02 | % | | | (9.40 | )% | | 3/1/00 | |
| Class C (NAV) | | | 10.19 | % | | | 17.78 | % | | 11/11/02 | |
| Class C (POP) | | | 9.19 | % | | | 17.78 | % | | 11/11/02 | |
NOTES
1 The Russell 2500 Growth (Russell 2500) Index is an unmanaged index used as a general measure of market performance. Calculations assume dividends and capital gains are reinvested and do not include any managerial expenses. From inception calculation is based on life of Class A shares. Source: Standard & Poor's Micropal®© Micropal, Inc. 2004 –1-800-596-5323 – http://www.micropal.com.
The performance data presented represents past performance, future results may vary. Performance data does not reflect the deduction of taxes that would be paid on fund distributions or the redemption of fund shares. Investment return and principal value will fluctuate so that an investor's shares, when redeemed, may be worth more or less than their original cost. Current performance may be lower or higher than performance quoted.
Public Offering Price (POP) returns include the reinvestment of dividends and capital gains and reflect the maximum sales charge of 5.5% for A shares or the maximum applicable contingent deferred sales charge (5% in the 1st year, decreasing to 0% after 6 years) for Class B shares and 1% (during the first 12 months) for Class C shares. Shares purchased prior to March 1, 2004 are subject to a maximum applicable contingent deferred sales charge (5% in the 1st year, decreasing to 0% after 7 years) for Class B shares and (2% in the 1st year, decreasing to 0% after 2 years) for Class C shares. Net Asset Value (NAV) returns include the reinvestment of dividends and capital gains but do not reflect any sales charges.
Investing in small cap stocks generally involves greater risk and volatility, therefore an investment in the fund may not be appropriate for everyone.
This material must be preceded or accompanied by a current prospectus, which includes specific contents regarding the investment objectives and policies of this fund.
Transamerica IDEX Mutual Funds
Annual Report 2004
2
TA IDEX Transamerica Growth Opportunities
UNDERSTANDING YOUR FUND'S EXPENSES (unaudited)
SHAREHOLDER EXPENSES
The following Example is intended to help you understand your ongoing costs (in dollars and cents) of investing in a Fund and to compare these costs with the ongoing costs of investing in other funds.
The Example is based on an investment of $1,000 invested at the beginning of the period and held for the entire period from May 1, 2004 to October 31, 2004.
ACTUAL EXPENSES
The first line in the table below provides information about actual account values and actual expenses. You may use the information in this line, together with the amount you invested, to estimate the expenses that you paid over the period. Simply divide your account value by $1,000 (for example, an $8,600 account value divided by $1,000 = 8.6), then multiply the result by the number in the first line of your Fund under the heading entitled "Expenses Paid During Period" to estimate the expenses you paid on your account during this period.
HYPOTHETICAL EXAMPLE FOR COMPARISON PURPOSES
The second line in the table below provides information about hypothetical account values and hypothetical expenses based on each Fund's actual expense ratio and an assumed rate of return of 5% per year before expenses, which is not the Fund's actual return. The hypothetical account values and expenses may not be used to estimate the actual ending account balance or expenses you paid for the period. You may use this information to compare the ongoing costs of investing in your Fund and other funds. To do so, compare this 5% hypothetical example with the 5% hypothetical examples that appear in the shareholder reports of the other funds.
Please note that the expenses shown in the table are meant to highlight your ongoing costs only and do not reflect any transactional costs, such as sales charges, redemption fees, brokerage commissions paid on purchases and sales of fund shares. Therefore, the second line under each Fund in the table is useful in comparing ongoing costs only, and will not help you determine the relative total costs of owning different funds. In addition, note that the expenses shown in the table are meant to highlight your ongoing costs and do not reflect any transaction costs.
| | | Beginning
Account
Value | | Ending
Account
Value | | Annualized
Expense
Ratio | | Expenses Paid
During Period(a) | |
| Class A | |
| Actual | | $ | 1,000.00 | | | $ | 1,001.50 | | | | 1.21 | % | | $ | 6.09 | | |
| Hypothetical (b) | | | 1,000.00 | | | | 1,019.05 | | | | 1.21 | | | | 6.14 | | |
| Class B | |
| Actual | | | 1,000.00 | | | | 996.90 | | | | 2.42 | | | | 12.15 | | |
| Hypothetical (b) | | | 1,000.00 | | | | 1,012.97 | | | | 2.42 | | | | 12.25 | | |
| Class C | |
| Actual | | | 1,000.00 | | | | 998.40 | | | | 2.40 | | | | 12.06 | | |
| Hypothetical (b) | | | 1,000.00 | | | | 1,013.07 | | | | 2.40 | | | | 12.19 | | |
(a) Expenses are calculated using each Fund's annualized expense ratio (as disclosed in the table), multiplied by the average account value for the period, multiplied by number of days in the period (184 days), and divided by the number of days in the year (366 days).
(b) 5% return per year before expenses.
GRAPHIC PRESENTATION OF SCHEDULE OF INVESTMENTS
By Sector
At October 31, 2004
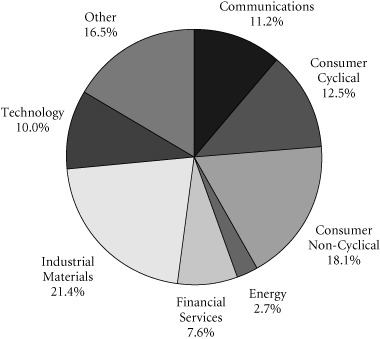
This chart shows the percentage breakdown by sector of the Fund's total investment securities.
Transamerica IDEX Mutual Funds
Annual Report 2004
3
TA IDEX Transamerica Growth Opportunities
SCHEDULE OF INVESTMENTS
At October 31, 2004
(all amounts except share amounts in thousands)
| | | Shares | | Value | |
| COMMON STOCKS (99.7%) | | | |
| Apparel & Accessory Stores (0.1%) | | | |
| Ross Stores, Inc. (a) | | | 9,600 | | | $ | 252 | | |
| Automotive Dealers & Service Stations (0.2%) | | | |
| O'Reilly Automotive, Inc. (a)(b) | | | 17,500 | | | | 754 | | |
| Business Services (0.0%) | | | |
| Getty Images, Inc. (a)(b) | | | 400 | | | | 24 | | |
| Communication (3.2%) | | | |
| Global Payments, Inc. (a) | | | 197,000 | | | | 10,788 | | |
| Computer & Data Processing Services (19.1%) | | | |
| GTECH Holdings Corp. | | | 780,000 | | | | 18,463 | | |
| McAfee, Inc. (b) | | | 492,000 | | | | 11,906 | | |
| RealNetworks, Inc. (b) | | | 3,314,500 | | | | 16,075 | | |
| SkillSoft PLC, Sponsored ADR (b) | | | 2,580,000 | | | | 17,673 | | |
| Computer & Office Equipment (4.1%) | | | |
| CDW Corp. | | | 13,900 | | | | 862 | | |
| Sandisk Corp. (a)(b) | | | 550,000 | | | | 11,478 | | |
| Symbol Technologies, Inc. | | | 11,300 | | | | 166 | | |
| Zebra Technologies Corp.–Class A (b) | | | 25,425 | | | | 1,347 | | |
| Educational Services (3.3%) | | | |
| DeVry, Inc. (a)(b) | | | 770,000 | | | | 11,242 | | |
| Electronic & Other Electric Equipment (5.0%) | | | |
| Gemstar-TV Guide International, Inc. (b) | | | 2,950,000 | | | | 16,962 | | |
| Environmental Services (0.2%) | | | |
| Stericycle, Inc. (b) | | | 15,300 | | | | 694 | | |
| Furniture & Home Furnishings Stores (3.7%) | | | |
| Tuesday Morning Corp. (a)(b) | | | 377,700 | | | | 12,328 | | |
| Health Services (0.1%) | | | |
| Lincare Holdings, Inc. (a)(b) | | | 10,900 | | | | 401 | | |
| Industrial Machinery & Equipment (3.2%) | | | |
| Graco, Inc. | | | 275,000 | | | | 9,460 | | |
| Varian Medical Systems, Inc. (a)(b) | | | 31,000 | | | | 1,245 | | |
| Management Services (4.9%) | | | |
| ServiceMaster Co. (The) | | | 1,275,000 | | | | 16,371 | | |
| Medical Instruments & Supplies (4.8%) | | | |
| Dentsply International, Inc. | | | 15,200 | | | | 791 | | |
| Integra LifeSciences Holdings Corp. (b) | | | 5,500 | | | | 176 | | |
| Resmed, Inc. (a)(b) | | | 15,500 | | | | 728 | | |
| Techne Corp. (b) | | | 400,000 | | | | 14,408 | | |
| Oil & Gas Extraction (3.3%) | | | |
| EOG Resources, Inc. | | | 165,000 | | | | 10,982 | | |
| | | Shares | | Value | |
| Paper & Allied Products (6.0%) | | | | | | | |
| Packaging Corp. of America | | | 612,400 | | | $ | 13,430 | | |
| Pactiv Corp. (b) | | | 280,550 | | | | 6,646 | | |
| Personal Credit Institutions (4.3%) | | | | | | | |
| Financial Federal Corp. (a)(b) | | | 392,100 | | | | 14,629 | | |
| Personal Services (8.0%) | | | | | | | |
| Jackson Hewitt Tax Service, Inc. | | | 490,000 | | | | 10,290 | | |
| Weight Watchers International, Inc. (a)(b) | | | 460,500 | | | | 16,541 | | |
| Pharmaceuticals (0.2%) | | | | | | | |
| Henry Schein, Inc. (b) | | | 11,500 | | | | 727 | | |
| Restaurants (5.3%) | | | | | | | |
| IHOP Corp. | | | 461,850 | | | | 17,689 | | |
| Security & Commodity Brokers (4.7%) | | | | | | | |
| Blackrock, Inc.–Class A (a) | | | 215,000 | | | | 15,803 | | |
| Stone, Clay & Glass Products (4.9%) | | | | | | | |
| Gentex Corp. (a) | | | 505,000 | | | | 16,670 | | |
| Transportation & Public Utilities (11.1%) | | | | | | | |
| CH Robinson Worldwide, Inc. (a) | | | 340,000 | | | | 18,340 | | |
| Expeditors International of Washington, Inc. | | | 335,000 | | | | 19,129 | | |
| Total Common Stocks (cost: $286,234) | | | | | | | 335,470 | | |
| | | Principal | | Value | |
| SECURITY LENDING COLLATERAL (19.6%) | | | | | | | |
| Debt (18.2%) | | | | | | | |
| Bank Notes (3.5%) | | | | | | | |
Bank of America
1.77%, due 12/03/2004
1.88%, due 12/23/2004
1.77%, due 01/18/20 05 | | |
$3,218
1,073
2,146 | | | |
$3,218
1,073
2,146 | | |
Canadian Imperial Bank of Commerce
1.86%, due 11/04/2004 | | | 4,828 | | | | 4,828 | | |
Credit Suisse First Boston Corp.
1.83%, due 09/09/2005 | | | 536 | | | | 536 | | |
| Commercial Paper (1.9%) | | | | | | | |
Clipper Receivables Corp.
1.79%, due 11/12/2004 | | | 1,597 | | | | 1,597 | | |
Delaware Funding Corp. 144A
1.85%, due 11/19/2004 | | | 536 | | | | 536 | | |
Falcon Asset Securitization Corp. 144A
1.78%, due 11/04/2004
1.75%, due 11/10/2004 | | | 1,600
2,146 | | | | 1,600
2,146 | | |
Galaxy Funding 144A
1.88%, due 11/22/2004 | | | 536 | | | | 536 | | |
The notes to the financial statements are an integral part of this report.
Transamerica IDEX Mutual Funds
Annual Report 2004
4
TA IDEX Transamerica Growth Opportunities
SCHEDULE OF INVESTMENTS (continued)
At October 31, 2004
(all amounts except share amounts in thousands)
| | | Principal | | Value | |
| Euro Dollar Terms (8.5%) | |
Bank of Montreal
1.88%, due 11/24/2004 | | $ 5,081 | | $5,081 | |
BNP Paribas
1.77%, due 11/10/2004
1.80%, due 11/23/2004
1.98%, due 12/27/2004 | | 2,682
2,146
2,146 | | 2,682
2,146
2,146 | |
Calyon
1.70%, due 11/24/2004 | | 283 | | 283 | |
Citigroup
2.06%, due 01/25/2005 | | 5,364 | | 5,364 | |
Den Danske Bank
1.82%, due 11/19/2004 | | 2,682 | | 2,682 | |
Dexia Group
2.04%, due 01/21/2005 | | 1,244 | | 1,244 | |
HBOS Halifax Bank of Scotland
2.03%, due 01/21/2005 | | 1,073 | | 1,073 | |
Royal Bank of Scotland
2.01%, due 01/20/2005 | | 2,146 | | 2,146 | |
Toronto Dominion Bank
1.70%, due 11/08/2004 | | 1,073 | | 1,073 | |
Wells Fargo
1.87%, due 11/22/2004 | | 2,682 | | 2,682 | |
| | | Principal | | Value | |
| Promissory Notes (1.8%) | | | |
Goldman Sachs Group Inc.
1.90%, due 12/29/2004
1.88%, due 01/27/2005 | | | $2,253
3,755 | | | | $2,253
3,755 | | |
| Repurchase Agreements (2.5%) (c) | | | |
Merrill Lynch & Co., Inc. 1.92%
Repurchase Agreement dated 10/29/04 to be
repurchased at $8,584 on 11/01/04 | | | 8,583 | | | | 8,583 | | |
| | | Shares | | Value | |
| Investment Companies (1.4%) | | | |
| Money Market Funds (1.4%) | | | | | | | |
Merrill Lynch Premier Institutional Fund
1-day yield of 1.71% | | | 2,638,838 | | | | $2,639 | | |
Merrimac Cash Fund, Premium Class
1-day yield of 1.46% | | | 1,931,074 | | | | 1,931 | | |
| Total Security Lending Collateral (cost: $65,979) | | | | | | | 65,979 | | |
| Total Investment Securities (cost: $352,213) | | | | | | $ | 401,449 | | |
| SUMMARY: | | | |
| Investments, at value | | | 119.3 | % | | $ | 401,449 | | |
| Liabilities in excess of other assets | | | (19.3 | )% | | | (64,844 | ) | |
| Net assets | | | 100.0 | % | | $ | 336,605 | | |
NOTES TO SCHEDULE OF INVESTMENTS:
(a) At October 31, 2004, all or a portion of this security is on loan (see Note 1). The value at October 31, 2004, of all securities on loan is $63,882.
(b) No dividends were paid during the preceding twelve months.
(c) Cash collateral for the Repurchase Agreements, valued at $8,754, that serve as collateral for securities lending are invested in corporate bonds with interest rates and maturity dates ranging from 0.00% - 9.75% and 05/15/2005 - 9/15/2033, respectively.
DEFINITIONS:
144A 144A Securities are registered pursuant to rule 144A of the Securities Act of 1933. These securities are deemed to be liquid for purposes of compliance limitations on holdings of illiquid securities and may be resold as transactions exempt from registration normally to qualified institutional buyers. At October 31, 2004, these securities aggregated $4,818 or 1.4% of the net assets of the Fund.
ADR American Depositary Receipt
The notes to the financial statements are an integral part of this report.
Transamerica IDEX Mutual Funds
Annual Report 2004
5
TA IDEX Transamerica Growth Opportunities
STATEMENT OF ASSETS AND LIABILITIES
At October 31, 2004
(all amounts except per share amounts in thousands)
| Assets: | | | |
Investment securities, at value (cost: $352,213)
(including securities loaned of $63,882) | | $ | 401,449 | | |
| Receivables: | |
| Investment securities sold | | | 2,066 | | |
| Shares of beneficial interest sold | | | 228 | | |
| Interest | | | 14 | | |
| Dividends | | | 217 | | |
| Other | | | 11 | | |
| | | | 403,985 | | |
| Liabilities: | | | |
| Accounts payable and accrued liabilities: | |
| Shares of beneficial interest redeemed | | | 283 | | |
| Management and advisory fees | | | 96 | | |
| Distribution fees | | | 160 | | |
| Transfer agent fees | | | 396 | | |
| Due to custodian | | | 354 | | |
| Payable for collateral for securities on loan | | | 65,979 | | |
| Other | | | 112 | | |
| | | | 67,380 | | |
| Net Assets | | $ | 336,605 | | |
| Net Assets Consist of: | | | |
Shares of beneficial interest, unlimited shares
authorized, no par value | | $ | 613,374 | | |
| Accumulated net investment income (loss) | | | (18 | ) | |
Accumulated net realized gain (loss) from
investment securities | | | (325,987 | ) | |
Net unrealized appreciation (depreciation) on
Investment Securities | | | 49,236 | | |
| Net Assets | | $ | 336,605 | | |
| Net Assets by Class: | | | |
| Class A | | $ | 230,633 | | |
| Class B | | | 77,869 | | |
| Class C | | | 28,103 | | |
| Shares Outstanding: | | | |
| Class A | | | 34,871 | | |
| Class B | | | 12,228 | | |
| Class C | | | 4,406 | | |
| Net Asset Value Per Share: | | | |
| Class A | | $ | 6.61 | | |
| Class B | | | 6.37 | | |
| Class C | | | 6.38 | | |
| Maximum Offering Price Per Share (a): | | | |
| Class A | | $ | 6.99 | | |
(a) Includes the maximum selling commission (represented as a percentage of offering price) which is reduced on certain levels of sales as set forth in the Prospectus. Net asset value per share for Classes B and C shares represents offering price. The redemption price for Classes B and C shares equals net asset value less any applicable contingent deferred sales charge.
STATEMENT OF OPERATIONS
For the year ended October 31, 2004
(all amounts in thousands)
| Investment Income: | | | |
| Interest | | $ | 67 | | |
| Dividends | | | 2,647 | | |
| Income from loaned securities–net | | | 35 | | |
| | | | 2,749 | | |
| Expenses: | | | |
| Management and advisory fees | | | 2,280 | | |
| Transfer agent fees: | |
| Class A | | | 406 | | |
| Class B | | | 523 | | |
| Class C | | | 60 | | |
| Class C2 | | | 25 | | |
| Class M | | | 33 | | |
| Printing and shareholder reports | | | 103 | | |
| Custody fees | | | 33 | | |
| Administration fees | | | 44 | | |
| Legal fees | | | 9 | | |
| Trustees fees | | | 16 | | |
| Registration fees: | |
| Class A | | | – | | |
| Class B | | | – | | |
| Class C | | | 5 | | |
| Class C2 | | | 1 | | |
| Class M | | | – | | |
| Other | | | 3 | | |
| Distribution and service fees: | |
| Class A | | | 698 | | |
| Class B | | | 644 | | |
| Class C | | | 77 | | |
| Class C2 | | | 62 | | |
| Class M | | | 85 | | |
| Total expenses | | | 5,107 | | |
| Less: | |
Reimbursement of Class expenses
Class B | | | (154 | ) | |
| Class C | | | (19 | ) | |
| Net expenses | | | 4,934 | | |
| Net Investment Income (Loss) | | | (2,185 | ) | |
| Net Realized and Unrealized Gain (Loss) | | | |
| Realized gain (loss) from investment securities | | | 27,965 | | |
Increase (decrease) in unrealized appreciation
(depreciation) on investment securities | | | (220 | ) | |
| Net Gain (Loss) on Investment Securities | | | 27,745 | | |
Net Increase (Decrease) in Net Assets Resulting
from Operations | | $ | 25,560 | | |
The notes to the financial statements are an integral part of this report.
Transamerica IDEX Mutual Funds
Annual Report 2004
6
TA IDEX Transamerica Growth Opportunities
STATEMENTS OF CHANGES IN NET ASSETS
For the years ended
(all amounts in thousands)
| | | October 31,
2004 | | October 31,
2003 | |
| Increase (Decrease) in Net Assets From: | |
| Operations: | |
| Net investment income (loss) | | $ | (2,185 | ) | | $ | (1,618 | ) | |
Net realized gain (loss) from
investment securities | | | 27,965 | | | | (7,453 | ) | |
Net unrealized appreciation
(depreciation) on investment
securities | | | (220 | ) | | | 50,490 | | |
| | | | 25,560 | | | | 41,419 | | |
| Capital Share Transactions: | |
| Proceeds from shares sold: | |
| Class A | | | 70,124 | | | | 19,246 | | |
| Class B | | | 5,768 | | | | 36,877 | | |
| Class C | | | 2,253 | | | | – | | |
| Class C2 | | | 800 | | | | 17,492 | | |
| Class M | | | 482 | | | | 16,502 | | |
| | | | 79,427 | | | | 90,117 | | |
| Proceeds from fund acquisition: | |
| Class A | | | 18,269 | | | | 33,925 | | |
| Class B | | | 28,710 | | | | 38,948 | | |
| Class C | | | 783 | | | | 280 | | |
| Class C2 | | | 5,594 | | | | 7,034 | | |
| Class M | | | 3,540 | | | | 8,373 | | |
| | | | 56,896 | | | | 88,560 | | |
| Cost of shares redeemed: | |
| Class A | | | (23,471 | ) | | | (7,951 | ) | |
| Class B | | | (14,231 | ) | | | (7,834 | ) | |
| Class C | | | (2,369 | ) | | | (1,116 | ) | |
| Class C2 | | | (2,125 | ) | | | (2,186 | ) | |
| Class M | | | (2,585 | ) | | | (2,568 | ) | |
| | | | (44,781 | ) | | | (21,655 | ) | |
| Class level exchanges: | |
| Class C | | | 26,644 | | | | – | | |
| Class C2 | | | (14,565 | ) | | | – | | |
| Class M | | | (12,079 | ) | | | – | | |
| | | | – | | | | – | | |
| Automatic conversions: | |
| Class A | | | 268 | | | | – | | |
| Class B | | | (268 | ) | | | – | | |
| | | | – | | | | – | | |
| | | | 91,542 | | | | 157,022 | | |
| Net increase (decrease) in net assets | | | 117,102 | | | | 198,441 | | |
| Net Assets: | |
| Beginning of year | | | 219,503 | | | | 21,062 | | |
| End of year | | $ | 336,605 | | | $ | 219,503 | | |
Accumulated Net Investment Income
(Loss) | | $ | (18 | ) | | $ | (13 | ) | |
| | | October 31,
2004 | | October 31,
2003 | |
| Share Activity: | |
| Shares issued: | |
| Class A | | | 10,916 | | | | 16,179 | | |
| Class B | | | 921 | | | | 581 | | |
| Class C | | | 363 | | | | 125 | | |
| Class C2 | | | 129 | | | | 172 | | |
| Class M | | | 77 | | | | 79 | | |
| | | | 12,406 | | | | 17,136 | | |
| Shares issued on fund acquisition: | |
| Class A | | | 2,818 | | | | 7,472 | | |
| Class B | | | 4,571 | | | | 8,792 | | |
| Class C | | | 125 | | | | 63 | | |
| Class C2 | | | 891 | | | | 1,588 | | |
| Class M | | | 561 | | | | 1,886 | | |
| | | | 8,966 | | | | 19,801 | | |
| Shares redeemed: | |
| Class A | | | (3,649 | ) | | | (1,537 | ) | |
| Class B | | | (2,289 | ) | | | (1,559 | ) | |
| Class C | | | (377 | ) | | | (105 | ) | |
| Class C2 | | | (343 | ) | | | (436 | ) | |
| Class M | | | (415 | ) | | | (508 | ) | |
| | | | (7,073 | ) | | | (4,145 | ) | |
| Class level exchanges: | |
| Class C | | | 4,213 | | | | – | | |
| Class C2 | | | (2,335 | ) | | | – | | |
| Class M | | | (1,874 | ) | | | – | | |
| | | | 4 | | | | – | | |
| Automatic conversions: | |
| Class A | | | 33 | | | | – | | |
| Class B | | | (43 | ) | | | – | | |
| | | | (10 | ) | | | – | | |
Net increase (decrease) in shares
outstanding: | |
| Class A | | | 10,118 | | | | 22,114 | | |
| Class B | | | 3,160 | | | | 7,814 | | |
| Class C | | | 4,324 | | | | 83 | | |
| Class C2 | | | (1,658 | ) | | | 1,324 | | |
| Class M | | | (1,651 | ) | | | 1,457 | | |
| | | | 14,293 | | | | 32,792 | | |
The notes to the financial statements are an integral part of this report.
Transamerica IDEX Mutual Funds
Annual Report 2004
7
TA IDEX Transamerica Growth Opportunities
FINANCIAL HIGHLIGHTS
| | | | | For a share of beneficial interest outstanding throughout each period | |
| | | | | Net Asset | | Investment Operations | | Distributions | | Net Asset | |
| | | For the
Period
Ended (d)(g) | | Value,
Beginning
of Period | | Net
Investment
Income (Loss) | | Net Realized
and Unrealized
Gain (Loss) | | Total
Operations | | From Net
Investment
Income | | From Net
Realized
Gains | | Total
Distributions | | Value,
End
of Period | |
| Class A | | 10/31/2004 | | $ | 5.95 | | | $ | (0.03 | ) | | $ | 0.69 | | | $ | 0.66 | | | $ | – | | | $ | – | | | $ | – | | | $ | 6.61 | | |
| | | 10/31/2003 | | | 4.81 | | | | (0.06 | ) | | | 1.20 | | | | 1.14 | | | | – | | | | – | | | | – | | | | 5.95 | | |
| | | 10/31/2002 | | | 4.81 | | | | (0.06 | ) | | | 0.06 | | | | – | | | | – | | | | – | | | | – | | | | 4.81 | | |
| | | 10/31/2001 | | | 8.70 | | | | (0.07 | ) | | | (3.82 | ) | | | (3.89 | ) | | | – | | | | – | | | | – | | | | 4.81 | | |
| | | 10/31/2000 | | | 10.00 | | | | (0.02 | ) | | | (1.28 | ) | | | (1.30 | ) | | | – | | | | – | | | | – | | | | 8.70 | | |
| Class B | | 10/31/2004 | | | 5.79 | | | | (0.09 | ) | | | 0.67 | | | | 0.58 | | | | – | | | | – | | | | – | | | | 6.37 | | |
| | | 10/31/2003 | | | 4.70 | | | | (0.09 | ) | | | 1.18 | | | | 1.09 | | | | – | | | | – | | | | – | | | | 5.79 | | |
| | | 10/31/2002 | | | 4.73 | | | | (0.11 | ) | | | 0.08 | | | | (0.03 | ) | | | – | | | | – | | | | – | | | | 4.70 | | |
| | | 10/31/2001 | | | 8.66 | | | | (0.10 | ) | | | (3.83 | ) | | | (3.93 | ) | | | – | | | | – | | | | – | | | | 4.73 | | |
| | | 10/31/2000 | | | 10.00 | | | | (0.06 | ) | | | (1.28 | ) | | | (1.34 | ) | | | – | | | | – | | | | – | | | | 8.66 | | |
| Class C | | 10/31/2004 | | | 5.79 | | | | (0.10 | ) | | | 0.69 | | | | 0.59 | | | | – | | | | – | | | | – | | | | 6.38 | | |
| | | 10/31/2003 | | | 4.62 | | | | (0.09 | ) | | | 1.26 | | | | 1.17 | | | | – | | | | – | | | | – | | | | 5.79 | | |
| | | | | | | Ratios/Supplemental Data | |
| | | For the
Period | | Total | | Net Assets,
End of
Period | | Ratio of Expenses
to Average
Net Assets (a) | | Net Investment
Income (Loss)
to Average | | Portfolio
Turnover | |
| | | Ended (g) | | Return (c) | | (000's) | | Net (e) | | Total (f) | | Net Assets (a) | | Rate (b) | |
| Class A | | 10/31/2004 | | | 11.09 | % | | $ | 230,633 | | | | 1.43 | % | | | 1.43 | % | | | (0.47 | )% | | | 43 | % | |
| | | 10/31/2003 | | | 23.70 | | | | 147,340 | | | | 1.75 | | | | 2.21 | | | | (1.11 | ) | | | 97 | | |
| | | 10/31/2002 | | | 0.05 | | | | 12,687 | | | | 1.74 | | | | 2.53 | | | | (1.35 | ) | | | 32 | | |
| | | 10/31/2001 | | | (44.76 | ) | | | 3,807 | | | | 1.55 | | | | 2.83 | | | | (1.11 | ) | | | 59 | | |
| | | 10/31/2000 | | | (12.96 | ) | | | 3,726 | | | | 1.55 | | | | 4.54 | | | | (1.23 | ) | | | 19 | | |
| Class B | | 10/31/2004 | | | 10.02 | | | | 77,869 | | | | 2.40 | | | | 2.64 | | | | (1.44 | ) | | | 43 | | |
| | | 10/31/2003 | | | 23.19 | | | | 52,492 | | | | 2.41 | | | | 2.87 | | | | (1.76 | ) | | | 97 | | |
| | | 10/31/2002 | | | (0.70 | ) | | | 5,897 | | | | 2.39 | | | | 3.18 | | | | (2.00 | ) | | | 32 | | |
| | | 10/31/2001 | | | (45.35 | ) | | | 4,513 | | | | 2.20 | | | | 3.48 | | | | (1.76 | ) | | | 59 | | |
| | | 10/31/2000 | | | (13.39 | ) | | | 4,366 | | | | 2.20 | | | | 5.19 | | | | (1.88 | ) | | | 19 | | |
| Class C | | 10/31/2004 | | | 10.19 | | | | 28,103 | | | | 2.40 | | | | 2.65 | | | | (1.58 | ) | | | 43 | | |
| | | 10/31/2003 | | | 25.32 | | | | 483 | | | | 2.42 | | | | 2.89 | | | | (1.78 | ) | | | 97 | | |
NOTES TO FINANCIAL HIGHLIGHTS
(a) Annualized.
(b) Not annualized for periods of less than one year.
(c) Total Return has been calculated for the applicable period without deduction of a sales load, if any, on an initial purchase. Periods of less than one year are not annualized.
(d) Per share information is calculated based on average number of shares outstanding for the years ended 10/31/2001, 10/31/2002, 10/31/2003 and 10/31/2004.
(e) Ratio of Net Expenses to Average Net Assets is net of fee waivers and reimbursements by the investment adviser, if any (see note 2).
(f) Ratio of Total Expenses to Average Net Assets includes all expenses before fee waivers and reimbursements by the investment adviser.
(g) TA IDEX Transamerica Growth Opportunities ("the Fund") commenced operations on March 1, 2000. The inception date for the Fund's offering of share Class L was November 11, 2002. Class L was renamed Class C on March 1, 2004. (see note 1)
The notes to the financial statements are an integral part of this report.
Transamerica IDEX Mutual Funds
Annual Report 2004
8
TA IDEX Transamerica Growth Opportunities
NOTES TO FINANCIAL STATEMENTS
At October 31, 2004
(all amounts in thousands)
NOTE 1. ORGANIZATION AND SIGNIFICANT ACCOUNTING POLICIES
Transamerica IDEX Mutual Funds, formerly IDEX Mutual Funds, is a Massachusetts business trust registered under the Investment Company Act of 1940, as amended (the "1940 Act"), as an open-end management investment company. TA IDEX Transamerica Growth Opportunities ("the Fund"), part of Transamerica IDEX Mutual Funds, began operations on March 1, 2000.
On March 1, 2004, the Fund changed its name from IDEX Transamerica Growth Opportunities to TA IDEX Transamerica Growth Opportunities.
On May 28, 2004, the Fund acquired all of the net assets of TA IDEX PBHG Mid Cap Growth pursuant to a plan of reorganization. TA IDEX Transamerica Growth Opportunities is the accounting survivor. The acquisition was accomplished by a tax free exchange of 8,966 shares of the Fund for 6,421 shares of TA IDEX PBHG Mid Cap Growth outstanding on May 27, 2004. TA IDEX PBHG Mid Cap Growth's net assets at that date, $56,896, including $10,809 unrealized appreciation, were combined with those of the Fund. The aggregate net assets of TA IDEX Transamerica Growth Opportunities immediately before the acquisition was $275,349, the combined net assets of the Fund immediately after the acquisition was $332,245. Proceeds in connection with the acquisition were as follows:
| | | Shares | | Amount | |
| Proceeds in connection with the acquisition | |
| Class A | | | 2,818 | | | $ | 18,269 | | |
| Class B | | | 4,571 | | | | 28,710 | | |
| Class C | | | 125 | | | | 783 | | |
| Class C2 | | | 891 | | | | 5,594 | | |
| Class M | | | 561 | | | | 3,540 | | |
| | | | | | | $ | 56,896 | | |
On March 1, 2003, the Fund acquired all the net assets of IDEX Janus Capital Appreciation pursuant to a plan of reorganization approved by shareholders of IDEX Janus Capital Appreciation on February 12, 2003. The acquisition was accomplished by a tax-free exchange of 19,801 shares of the Fund for the 8,814 shares of IDEX Janus Capital Appreciation outstanding on February 28, 2003. IDEX Janus Capital Appreciation's net assets at that date $88,560, including $11,239 unrealized depreciation, were combined with those of the Fund. Proceeds in connection with the acquisition were as follows:
| | | Shares | | Amount | |
| Proceeds in connection with the acquisition | |
| Class A | | | 7,472 | | | $ | 33,925 | | |
| Class B | | | 8,792 | | | | 38,948 | | |
| Class C | | | 63 | | | | 280 | | |
| Class C2 | | | 1,588 | | | | 7,034 | | |
| Class M | | | 1,886 | | | | 8,373 | | |
| | | | | | | $ | 88,560 | | |
In the normal course of business, the Fund enters into contracts that contain a variety of representations and warranties, which provide general indemnifications. The Fund's maximum exposure under these arrangements is unknown, as this would involve future claims that may be made against the Fund and/or its affiliates that have not yet occurred. However, based on experience, the Fund expects the risk of loss to be remote.
See the Prospectus and Statement of Additional Information for a description of the Fund's investment objective.
In preparing the Fund's financial statements in accordance with accounting principles generally accepted in the United States of America ("GAAP"), estimates or assumptions (which could differ from actual results) may be used that affect reported amounts and disclosures. The following policies were consistently followed by the Fund, in accordance with GAAP.
Multiple class operations and expenses: The Fund currently offers three classes of shares, each with a public offering price that reflects different sales charges, if any, and expense levels. All shares designated as Class C shares prior to March 1, 2004, were renamed as Class C2 shares on that date. All shares designated as Class L shares prior to March 1, 2004, were renamed as Class C shares with different sales charges than the previous Class L shares. On June 15, 2004, Class C2 shares merged into Class C. On September 24, 2004, Class M shares merged into Class C. Class B shares will convert to Class A shares eight years after purchase. Income, non-class specific expenses and realized and unrealized gains and losses, are allocated daily to each class, based upon the value of shares outstanding method as permitted under Rule 18f-3 of the 1940 Act. Each class bears its own specific expenses as well as a portion of general, common expenses.
Pricing of shares: The Fund prices its shares on the basis of the net asset value of each class of shares of the Fund, which is determined as of the close of the New York Stock Exchange ("NYSE") (generally 4:00 p.m. Eastern Time) on each day on which the NYSE is open for trading (other than a day on which there are insufficient changes in the value of the Fund's portfolio securities to materially affect the Fund's net asset value or a day on which no shares are tendered for redemption and no order to purchase any shares is received).
Security valuations: Fund investments traded on an exchange are valued at the closing price on the day of valuation on the exchange where the security is principally traded. With respect to securities traded on NASDAQ NMS, such closing price may be the last reported sales price or the NASDAQ Official Closing Price.
Securities traded in the over-the-counter market and listed securities for which no sale was reported on that date are valued at the last quoted bid price.
Debt securities are valued by independent pricing services; however, those that mature in sixty days or less are valued at amortized cost, which approximates market.
Investment company securities are valued at net asset value of the underlying portfolio.
Transamerica IDEX Mutual Funds
Annual Report 2004
9
TA IDEX Transamerica Growth Opportunities
NOTES TO FINANCIAL STATEMENTS (continued)
At October 31, 2004
(all amounts in thousands)
NOTE 1.–(continued)
Other securities for which quotations are not readily available are valued at fair market value as determined in good faith using guidelines adopted by the Board of Trustees of the Fund, under the supervision of the Fund's Valuation Committee.
Cash: The Fund may leave cash overnight in its cash account with the custodian, Investors Bank & Trust Company ("IBT"). IBT has been contracted on behalf of the Fund to invest the excess cash into a savings account, which at October 31, 2004, was paying an interest rate of 1.30%.
Throughout the year, the Fund may have a cash overdraft balance. A fee is incurred on this overdraft, calculated by multiplying the overdraft by a rate based on the federal funds rate. This fee is included in Custody fees in the Statement of Operations. At October 31, 2004, the Fund had $354 in cash overdrafts reflected as Due to Custodian in the Statement of Assets and Liabilities.
Repurchase agreements: The Fund is authorized to enter into repurchase agreements. The Fund, through IBT, receives delivery of the underlying securities, the value of which at the time of purchase is required to be an amount equal to at least 100% of the resale price. Repurchase agreements involve the risk that the seller will fail to repurchase the security, as agreed. In that case, the Fund will bear the risk of value fluctuations until the security can be sold and may encounter delays and incur costs in liquidating the security. In the event of bankruptcy or insolvency of the seller, delays and costs may be incurred.
Commission recapture: The sub-adviser, to the extent consistent with the best execution and usual commission rate policies and practices, may place security transactions of the Fund with broker/dealers with which Transamerica IDEX Mutual Funds has established a Commission Recapture Program. A Commission Recapture Program is any arrangement under which a broker/dealer applies a portion of the commissions received by such broker/dealer on the security transactions to the Fund. In no event will commissions paid by the Fund be used to pay expenses that would otherwise be borne by any other funds within Transamerica IDEX Mutual Funds, or by any other party.
Commission recaptured during the year ended October 31, 2004, of $18 are included in net realized gains in the Statement of Operations.
Securities lending: The Fund may lend securities to enhance fund earnings from investing cash collateral in making such loans to qualified borrowers (typically broker/dealers). The Fund has engaged its custodian bank, IBT, as a lending agent to administer its securities lending program. IBT earned $15 of program income for its services. When the Fund makes a security loan, it receives cash collateral as protection against the risk that the borrower will default on the loan, and records an asset for the cash invested collateral and a liability for the return of the collateral.
Securities on loan are included in Investment securities at value in the Statement of Assets and Liabilities and remain on the Schedule of Investments.
Loans of securities are required to be secured by collateral at least equal to 102% of the value of the securities at inception of the loan, and not less then 100% thereafter. The Fund may invest cash collateral in short-term money market instruments including: U.S. Treasury Bills, U.S. agency obligations, commercial paper, money market mutual funds, repurchase agreements and other highly rated, liquid investments. During the life of securities loans, the collateral and securities loaned remain subject to fluctuation in value. IBT marks to market securities loaned and the collateral each business day. If additional collateral is due (at least $1), IBT collects additional cash collateral from the borrowers. Although securities loaned will be fully collateralized at all times, IBT may experience delays in, or may be prevented from, recovering the collateral on behalf of the Fund. The Fund may recall a loa ned security position at any time from the borrower through IBT. In the event the borrower fails to timely return a recalled security, IBT may indemnify the Fund by purchasing replacement securities for the Fund at its own expense and claiming the collateral to fund such a purchase. IBT absorbs the loss if the collateral value is not sufficient to cover the cost of the replacement securities. If replacement securities are not available, IBT will credit the equivalent cash value to the Fund.
While a security is on loan, the Fund does not have the right to vote that security. However, if time permits, the Fund will attempt to recall a security on loan and vote the proxy.
Income from securities lending is included in the Statement of Operations. The amount of collateral and value of securities on loan are included in the Statement of Assets and Liabilities as well as in the Schedule of Investments.
Security transactions and investment income: Security transactions are recorded on the trade date. Security gains and losses are calculated on the specific identification basis. Dividend income is recorded on the ex-dividend date or, in the case of foreign securities, as soon as the Fund is informed of the ex-dividend date. Interest income, including accretion of discounts and amortization of premiums, is recorded on the accrual basis commencing on the settlement date.
Account maintenance fees: If the shareholder account balance falls below $1 by either shareholder action or as a result of market action, a $25 (not in thousands) fee is assessed every year until the balance reaches $1. The fee is assessed by redeeming shares in the shareholder's account.
No fee will be charged under the following conditions:
• accounts opened within the preceding 24 months
• accounts with an active monthly Automatic Investment Plan ($50 (not in thousands) minimum per fund)
• accounts owned by an individual which, when combined by social security number, have a balance of $5 or more
• accounts owned by individuals in the same household (by address) that have a combined balance of $5 or more
• UTMA/UGMA accounts
• Fiduciary accounts
Transamerica IDEX Mutual Funds
Annual Report 2004
10
TA IDEX Transamerica Growth Opportunities
NOTES TO FINANCIAL STATEMENTS (continued)
At October 31, 2004
(all amounts in thousands)
NOTE 1.–(continued)
• B-share accounts whose shares have started to convert to A-shares accounts (as long as combined value of both accounts is at least $1)
For the year ended October 31, 2004, this fee totaled $9. These fees are included in Paid in Capital in the Statement of Assets and Liabilities.
Redemption fees: A short-term trading redemption fee may be assessed on any fund shares in a fund account that are sold during the first five (5) New York Stock Exchange trading days following their purchase date. This redemption fee will equal 2% of the amount redeemed and shares held the longest will be treated as being redeemed first and shares held the shortest as being redeemed last. For the year ended October 31, 2004, the Fund received no redemption fees.
Dividend distributions: Distributions to shareholders are recorded on the ex-dividend date and are determined in accordance with Federal income tax regulations which may differ from GAAP.
NOTE 2. RELATED PARTY TRANSACTIONS
AEGON/Transamerica Fund Advisers, Inc. ("ATFA") is the Fund's investment adviser. AEGON/Transamerica Fund Services, Inc. ("ATFS") is the Fund's administrator. AFSG Securities Corp. ("AFSG") is the Fund's distributor/principal underwriter. AEGON/Transamerica Investor Services, Inc. ("ATIS") is the Fund's transfer agent. ATIS and AFSG are 100% owned by AUSA Holding Company ("AUSA"). ATFA is a directly owned subsidiary of Western Reserve Life Assurance Co. of Ohio (78%) ("WRL") and AUSA (22%). ATFS is a wholly owned subsidiary of WRL. AUSA and WRL are wholly owned indirect subsidiaries of AEGON NV, a Netherlands corporation.
Transamerica Investment Management, LLC is both an affiliate of the Fund and a sub-adviser to the Fund.
The following schedule reflects the percentage of fund assets owned by affiliated mutual funds (i.e., through the assets allocation funds):
| | | Net
Assets | | % of
Net Assets | |
TA IDEX Asset Allocation-
Conservative Portfolio | | $ | 6,436 | | | | 2 | % | |
TA IDEX Asset Allocation-
Growth Portfolio | | | 48,494 | | | | 14 | % | |
TA IDEX Asset Allocation-Moderate
Growth Portfolio | | | 78,682 | | | | 23 | % | |
TA IDEX Asset Allocation-
Moderate Portfolio | | | 34,296 | | | | 10 | % | |
| Total | | $ | 167,908 | | | | 49 | % | |
Investment advisory fee: The Fund pays management fees to ATFA based on average daily net assets ("ANA") at the following breakpoints from November 1, 2003 to May 28, 2004:
0.80% of the first $500 million of ANA
0.70% of ANA over $500 million
From May 29, 2004 on:
0.80% of the first $250 million of ANA
0.75% of the next $500 million
0.70% of ANA over $500 million
ATFA has contractually agreed to waive its advisory fee and will reimburse the Fund to the extent that operating expenses, excluding 12b-1 fees, exceed the following stated annual limit:
1.40% Expense Limit
Distribution and service fees: The Fund has a 12b-1 distribution plan under the 1940 Act pursuant to which an annual fee, based on average daily net assets, is paid to the distributor for various disbursements such as broker-dealer account servicing fees and other promotional expenses of the Fund. The Fund is authorized under the 12b-1 plan to pay fees on each class up to the following limits:
| Class A | | | 0.35 | % | |
| Class B | | | 1.00 | % | |
| Class C | | | 1.00 | % | |
| Class C2 | | | 1.00 | % | |
| Class M | | | 0.90 | % | |
Class C2 and Class M merged into Class C on June 15, 2004 and September 24, 2004, respectively.
In the case the Fund or a class of shares of the Fund is closed to new investors or investments, the Fund is authorized to pay 12b-1 fees for past sales and distribution efforts and present and past investor services.
Underwriter commissions relate to front-end sales charges imposed for Class A and M shares and contingent deferred sales charges from Classes B, C, M and certain A share redemptions. For the year ended October 31, 2004, the underwriter commissions were as follows:
| Received by Underwriter | | $ | 551 | | |
| Retained by Underwriter | | | 27 | | |
| Contingent Deferred Sales Charge | | | 159 | | |
Administrative services: The Fund has entered into an agreement with ATFS for financial and legal fund administration services, which includes such items as compliance, expenses, financial statements and other reporting, distributions, tax returns, prospectus preparation, board of trustees meeting support and other legal matters. The Fund pays ATFS an annual fee of 0.015% of average net assets. The Legal fees on the Statement of Operations are for fees paid to external legal counsel.
The Fund paid ATFS $44 for the year ended October 31, 2004.
Transamerica IDEX Mutual Funds
Annual Report 2004
11
TA IDEX Transamerica Growth Opportunities
NOTES TO FINANCIAL STATEMENTS (continued)
At October 31, 2004
(all amounts in thousands)
NOTE 2.–(continued)
Transfer agent fees: The Fund pays ATIS an annual per-account charge of $20 (not in thousands) for each open account and $1.63 (not in thousands) for each closed account. There is no new account charge. The transfer agent fees on the Statement of Operations are made up of fees paid to ATIS and costs associated with shareholder statements. The Fund paid ATIS $1,047 for the year ended October 31, 2004.
Deferred compensation plan: Each eligible Fund Trustee may elect participation in the Deferred Compensation Plan ("the Plan"). Under the Plan, such Trustees may defer payment of a percentage of their total fees earned as a Fund Trustee. These deferred amounts may be invested in any Transamerica IDEX Mutual Fund. At October 31, 2004, the value of invested plan amount was $9. Invested plan amounts and the total liability for deferred compensation to the Trustees under the Plan at October 31, 2004, are included in the accompanying Statement of Assets and Liabilities.
NOTE 3. INVESTMENT TRANSACTIONS
The cost of securities purchased and proceeds from securities sold (excluding short-term securities) for the year ended October 31, 2004, were as follows:
| Purchases of securities: | | | |
| Long-Term excluding U.S. Government | | $ | 170,241 | | |
| U.S. Government | | | – | | |
| Proceeds from maturities and sales of securities: | | | |
| Long-Term excluding U.S. Government | | | 114,158 | | |
| U.S. Government | | | – | | |
NOTE 4. FEDERAL INCOME TAX MATTERS
The Fund has not made any provision for federal income or excise taxes due to its policy to distribute all of its taxable income and capital gains to its shareholders and otherwise qualify as a regulated investment company under the Internal Revenue Code. Income and capital gain distributions are determined in accordance with income tax regulations, which may differ from GAAP. These differences are primarily due to differing treatment for items including, but not limited to, wash sales, net operating losses and capital loss carryforwards.
Reclassifications between Undistributed net investment income (loss), Undistributed net realized capital gains (loss) and Shares of beneficial interest are made to reflect income and gains available for distribution under federal tax regulations. Results of operations and net assets are not effected by these reclassifications. These reclassifications are as follows:
Shares of beneficial interest, unlimited
shares authorized $ 22,558
| Undistributed net investment income (loss) | | | 2,180 | | |
Accumulated net realized gain (loss) from
investment securities | | | (24,738 | ) | |
The capital loss carryforwards are available to offset future realized capital gains through the periods listed:
Capital Loss
Carryforward | | Available through | |
| $ | 205,155 | | | October 31, 2008 | |
| | 108,685 | | | October 31, 2009 | |
| | 4,618 | | | October 31, 2010 | |
| | 7,437 | | | October 31, 2011 | |
The capital loss carryforward utilized during the year ended October 31, 2004 was $26,988. $90,802 of capital loss carryforward was disallowed due to capital loss carryforward limitations related to fund acquisitions.
The tax basis components of distributable earnings as of October 31, 2004, are as follows:
| Undistributed Ordinary Income | | $ | – | | |
| Undistributed Long-term Capital Gains | | $ | – | | |
| Capital Loss Carryforward | | $ | (325,895 | ) | |
| Net Unrealized Appreciation (Depreciation) | | $ | 49,145 | | |
The aggregate cost of investments and composition of unrealized appreciation (depreciation) for federal income tax purposes as of October 31, 2004, are as follows:
| Federal Tax Cost Basis | | $ | 352,304 | | |
| Unrealized Appreciation | | $ | 60,235 | | |
| Unrealized (Depreciation) | | | (11,090 | ) | |
| Net Unrealized Appreciation (Depreciation) | | $ | 49,145 | | |
NOTE 5. OTHER MATTERS
Transamerica IDEX Mutual Funds ("TA IDEX"), and certain of its affiliated entities, have received requests for information from the Staff of the Securities and Exchange Commission in connection with market timing and late trading within the funds. TA IDEX and the affiliated entities have voluntarily cooperated in the investigation and have been providing the information as requested.
Transamerica IDEX Mutual Funds
Annual Report 2004
12
Report of Independent Registered Certified Public Accounting Firm
To the Board of Trustees and Shareholders of
TA IDEX Transamerica Growth Opportunities
In our opinion, the accompanying statement of assets and liabilities, including the schedule of investments, and the related statements of operations and of changes in net assets and the financial highlights present fairly, in all material respects, the financial position of TA IDEX Transamerica Growth Opportunities (the "Fund") (one of the portfolios constituting the Transamerica IDEX Mutual Funds) at October 31, 2004, the results of its operations for the year then ended, the changes in its net assets for each of the two years in the period then ended and the financial highlights for each of the periods indicated, in conformity with accounting principles generally accepted in the United States of America. These financial statements and financial highlights (hereafter referred to as "financial statements") are the responsibility of the Fund's management; our responsibility is to express an opinion on these financial statements based on our audits. We conducted our audits of these financial statements in accordance with the standards of the Public Company Accounting Oversight Board (United States). Those standards require that we plan and perform the audit to obtain reasonable assurance about whether the financial statements are free of material misstatement. An audit includes examining, on a test basis, evidence supporting the amounts and disclosures in the financial statements, assessing the accounting principles used and significant estimates made by management, and evaluating the overall financial statement presentation. We believe that our audits, which included confirmation of securities at October 31, 2004 by correspondence with the custodian and brokers, provide a reasonable basis for our opinion.

PricewaterhouseCoopers LLP
Tampa, Florida
December 28, 2004
Transamerica IDEX Mutual Funds
Annual Report 2004
13
TA IDEX Transamerica Growth Opportunities
SUPPLEMENTAL INFORMATION
RESULTS OF SHAREHOLDER PROXY (unaudited)
At a special meeting of shareholders held on May 21, 2004, the results of the Proposal were as follows:
Proposal 1: Approval of an Agreement and Plan of Reorganization providing for the acquisition of all of the assets and liabilities of TA IDEX PBHG Mid Cap Growth (the "Acquired Fund") by TA IDEX Transamerica Growth Opportunities (the "Acquiring Fund") solely in exchange for shares of the Acquiring Fund, followed by the complete liquidation of the Acquired Fund.
| For | | Against | | Abstentions/Broker Non-Votes | |
| | 82.47 | % | | | 3.67 | % | | | 13.86 | % | |
At a special meeting of Class M shareholders of each series of Transamerica IDEX (except TA IDEX Federated Tax Exempt and TA IDEX Protected Principal Stock) held on September 2, 2004, the results of the Proposal were as follows:
Proposal 1: Approval of a conversion of Class M shares into Class C shares of the Funds, which will result in bearing the distribution and service fees payable under the 12b-1 Plan of Distribution for the Class C shares of the Funds.
| For | | Against | | Abstentions/Broker Non-Votes | |
| | 76.75 | % | | | 11.00 | % | | | 12.25 | % | |
Transamerica IDEX Mutual Funds
Annual Report 2004
14
TA IDEX Transamerica Money Market
UNDERSTANDING YOUR FUND'S EXPENSES (unaudited)
SHAREHOLDER EXPENSES
The following Example is intended to help you understand your ongoing costs (in dollars and cents) of investing in a Fund and to compare these costs with the ongoing costs of investing in other funds.
The Example is based on an investment of $1,000 invested at the beginning of the period and held for the entire period from May 1, 2004 to October 31, 2004.
ACTUAL EXPENSES
The first line in the table below provides information about actual account values and actual expenses. You may use the information in this line, together with the amount you invested, to estimate the expenses that you paid over the period. Simply divide your account value by $1,000 (for example, an $8,600 account value divided by $1,000 = 8.6), then multiply the result by the number in the first line of your Fund under the heading entitled "Expenses Paid During Period" to estimate the expenses you paid on your account during this period.
HYPOTHETICAL EXAMPLE FOR COMPARISON PURPOSES
The second line in the table below provides information about hypothetical account values and hypothetical expenses based on each Fund's actual expense ratio and an assumed rate of return of 5% per year before expenses, which is not the Fund's actual return. The hypothetical account values and expenses may not be used to estimate the actual ending account balance or expenses you paid for the period. You may use this information to compare the ongoing costs of investing in your Fund and other funds. To do so, compare this 5% hypothetical example with the 5% hypothetical examples that appear in the shareholder reports of the other funds.
Please note that the expenses shown in the table are meant to highlight your ongoing costs only and do not reflect any transactional costs, such as sales charges, redemption fees, brokerage commissions paid on purchases and sales of fund shares. Therefore, the second line under each Fund in the table is useful in comparing ongoing costs only, and will not help you determine the relative total costs of owning different funds. In addition, note that the expenses shown in the table are meant to highlight your ongoing costs and do not reflect any transaction costs.
| | | Beginning
Account
Value | | Ending
Account
Value | | Annualized
Expense
Ratio | | Expenses Paid
During Period (a) | |
| Class A | |
| Actual | | $ | 1,000.00 | | | $ | 1,002.80 | | | | 0.85 | % | | $ | 4.28 | | |
| Hypothetical (b) | | | 1,000.00 | | | | 1,020.86 | | | | 0.85 | | | | 4.32 | | |
| Class B | |
| Actual | | | 1,000.00 | | | | 1,000.70 | | | | 1.28 | | | | 6.44 | | |
| Hypothetical (b) | | | 1,000.00 | | | | 1,018.70 | | | | 1.28 | | | | 6.50 | | |
| Class C | |
| Actual | | | 1,000.00 | | | | 1,000.70 | | | | 0.99 | | | | 4.98 | | |
| Hypothetical (b) | | | 1,000.00 | | | | 1,020.16 | | | | 0.99 | | | | 5.03 | | |
(a) Expenses are calculated using each Fund's annualized expense ratio (as disclosed in the table), multiplied by the average account value for the period, multiplied by number of days in the period (184 days), and divided by the number of days in the year (366 days).
(b) 5% return per year before expenses.
GRAPHIC PRESENTATION OF SCHEDULE OF INVESTMENTS
By Maturity Distribution
at October 31, 2004
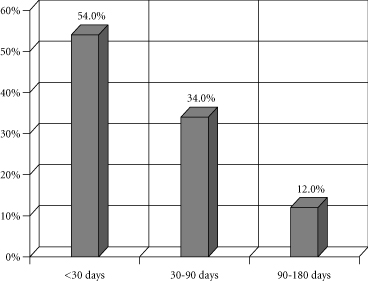
This chart represents the percentage breakdown by maturity date of the Fund's total investment securities.
Transamerica IDEX Mutual Funds
Annual Report 2004
1
TA IDEX Transamerica Money Market
SCHEDULE OF INVESTMENTS
At October 31, 2004
(all amounts except share amounts in thousands)
| | | Principal | | Value | |
| COMMERCIAL PAPER (87.1%) | |
| Asset-Backed (11.0%) | |
CAFCO LLC, 144A
2.03%, due 01/05/2005 | | | $3,200 | | | | $3,188 | | |
| 2.05%, due 01/07/2005 | | | 4,600 | | | | 4,582 | | |
| 2.00%, due 01/19/2005 | | | 4,600 | | | | 4,579 | | |
Delaware Funding Corp., 144A
1.78%, due 11/03/2004 | | | 2,400 | | | | 2,399 | | |
| 1.78%, due 11/04/2004 | | | 1,100 | | | | 1,100 | | |
| 1.78%, due 11/05/2004 | | | 4,000 | | | | 3,999 | | |
| 1.78%, due 11/10/2004 | | | 1,600 | | | | 1,599 | | |
| 1.90%, due 12/06/2004 | | | 3,100 | | | | 3,094 | | |
Receivables Capital Corp., 144A
1.63%, due 11/01/2004 | | | 500 | | | | 500 | | |
| 1.73%, due 12/01/2004 | | | 2,200 | | | | 2,197 | | |
| Beverages (1.3%) | |
Coca-Cola Co. (The)
1.71%, due 11/01/2004 | | | 3,250 | | | | 3,250 | | |
| Business Credit Institutions (9.2%) | |
AIG Funding, Inc.
1.53%, due 11/04/2004 | | | 4,770 | | | | 4,769 | | |
| 1.80%, due 11/23/2004 | | | 5,700 | | | | 5,693 | | |
Old Line Funding Corp., 144A
1.72%, due 11/01/2004 | | | 2,100 | | | | 2,100 | | |
| 1.67%, due 11/03/2004 | | | 2,100 | | | | 2,100 | | |
| 1.71%, due 11/08/2004 | | | 2,500 | | | | 2,499 | | |
| 1.79%, due 11/15/2004 | | | 450 | | | | 450 | | |
| 1.67%, due 11/22/2004 | | | 1,600 | | | | 1,598 | | |
| 1.90%, due 12/06/2004 | | | 3,500 | | | | 3,493 | | |
| Chemicals & Allied Products (4.9%) | |
Dupont EI de Nemours Co.
1.75%, due 11/02/2004 | | | 6,100 | | | | 6,099 | | |
| 1.76%, due 11/12/2004 | | | 2,300 | | | | 2,299 | | |
| 1.76%, due 11/16/2004 | | | 3,700 | | | | 3,697 | | |
| Commercial Banks (9.8%) | |
Bank of America Corp.
1.77%, due 11/10/2004 | | | 850 | | | | 850 | | |
| 1.96%, due 01/03/2005 | | | 2,050 | | | | 2,043 | | |
Ranger Funding Co. LLC, 144A
1.87%, due 11/22/2004 | | | 2,050 | | | | 2,048 | | |
| 1.92%, due 12/09/2004 | | | 1,900 | | | | 1,896 | | |
UBS Finance Delaware LLC
1.71%, due 11/03/2004 | | | 2,900 | | | | 2,899 | | |
| 1.79%, due 11/15/2004 | | | 1,800 | | | | 1,799 | | |
| 1.82%, due 11/18/2004 | | | 1,600 | | | | 1,598 | | |
| 1.85%, due 11/29/2004 | | | 3,600 | | | | 3,594 | | |
| 1.87%, due 12/14/2004 | | | 1,400 | | | | 1,397 | | |
| 2.05%, due 01/25/2005 | | | 1,000 | | | | 995 | | |
Wells Fargo & Co.
1.98%, due 03/24/2005 | | | 5,250 | | | | 5,252 | | |
| | | Principal | | Value | |
| Food & Kindred Products (1.6%) | |
Nestle Capital Corp., 144A
1.52%, due 11/05/2004 | | | $1,800 | | | | $1,800 | | |
| 1.77%, due 11/12/2004 | | | 2,250 | | | | 2,249 | | |
| Industrial Machinery & Equipment (4.8%) | |
Caterpillar Financial Services Corp.
2.40%, due 01/31/2005 | | | 8,150 | | | | 8,156 | | |
| 4.69%, due 04/25/2005 | | | 2,400 | | | | 2,428 | | |
Caterpillar, Inc.
1.75%, due 11/17/2004 | | | 1,200 | | | | 1,199 | | |
| Insurance Agents, Brokers & Service (4.7%) | |
Metlife Funding, Inc.
1.71%, due 11/08/2004 | | | 4,900 | | | | 4,898 | | |
| 1.61%, due 11/10/2004 | | | 2,120 | | | | 2,119 | | |
| 1.66%, due 11/10/2004 | | | 4,700 | | | | 4,698 | | |
| Personal Credit Institutions (14.7%) | |
American Honda Finance Corp.
1.72%, due 11/03/2004 | | | 1,100 | | | | 1,100 | | |
| 1.79%, due 11/23/2004 | | | 4,600 | | | | 4,594 | | |
| 1.79%, due 11/24/2004 | | | 4,000 | | | | 3,995 | | |
American Honda Finance Corp. 144A
1.78%, due 02/11/2005 | | | 2,700 | | | | 2,701 | | |
General Electric Capital Corp.
1.62%, due 11/01/2004 | | | 1,300 | | | | 1,300 | | |
| 1.65%, due 11/01/2004 | | | 1,800 | | | | 1,800 | | |
| 1.58%, due 11/03/2004 | | | 1,000 | | | | 1,000 | | |
| 1.60%, due 11/19/2004 | | | 900 | | | | 899 | | |
| 1.75%, due 01/05/2005 | | | 1,200 | | | | 1,196 | | |
| 1.96%, due 01/06/2005 | | | 4,750 | | | | 4,732 | | |
| 2.01%, due 01/18/2005 | | | 1,300 | | | | 1,294 | | |
Toyota Motor Credit Corp.
1.64%, due 11/01/2004 | | | 1,000 | | | | 1,000 | | |
| 1.63%, due 11/02/2004 | | | 1,600 | | | | 1,600 | | |
| 1.70%, due 11/08/2004 | | | 1,930 | | | | 1,929 | | |
| 1.79%, due 11/22/2004 | | | 1,800 | | | | 1,798 | | |
| 1.81%, due 12/02/2004 | | | 1,600 | | | | 1,597 | | |
| 1.91%, due 12/07/2004 | | | 1,950 | | | | 1,946 | | |
| 1.93%, due 12/08/2004 | | | 1,300 | | | | 1,297 | | |
| 1.89%, due 12/13/2004 | | | 600 | | | | 599 | | |
| Pharmaceuticals (2.7%) | |
Pfizer, Inc., 144A
1.69%, due 11/16/2004 | | | 2,875 | | | | 2,873 | | |
| 1.69%, due 12/14/2004 | | | 1,500 | | | | 1,497 | | |
| 1.85%, due 12/23/2004 | | | 2,350 | | | | 2,343 | | |
| Printing & Publishing (0.5%) | |
Gannett Co., Inc.
1.84%, due 11/18/2004 | | | 1,250 | | | | 1,249 | | |
The notes to the financial statements are an integral part of this report.
Transamerica IDEX Mutual Funds
Annual Report 2004
2
TA IDEX Transamerica Money Market
SCHEDULE OF INVESTMENTS (continued)
At October 31, 2004
(all amounts except share amounts in thousands)
| | | Principal | | Value | |
| Public Administration (0.2%) | |
Quebec Province
1.90%, due 01/11/2005 | | | $450 | | | | $448 | | |
| Security & Commodity Brokers (9.4%) | |
Goldman Sachs Group, Inc.
1.62%, due 11/15/2004 | | | 1,500 | | | | 1,499 | | |
| 1.92%, due 01/10/2005 | | | 1,250 | | | | 1,245 | | |
| 1.92%, due 01/11/2005 | | | 2,230 | | | | 2,221 | | |
| 2.10%, due 02/25/2005 | | | 6,750 | | | | 6,758 | | |
Merrill Lynch & Co., Inc.
2.37%, due 01/13/2005 | | | 8,530 | | | | 8,536 | | |
| 2.38%, due 01/21/2005 | | | 3,030 | | | | 3,032 | | |
| Variety Stores (2.7%) | |
Wal-Mart Funding Corp., 144A
1.85%, due 11/30/2004 | | | 4,100 | | | | 4,093 | | |
Wal-Mart Stores, Inc., 144A
1.60%, due 11/02/2004 | | | 550 | | | | 550 | | |
| 1.90%, due 12/10/2004 | | | 2,160 | | | | 2,155 | | |
| Wholesale Trade Durable Goods (9.6%) | |
Procter & Gamble Co., 144A
6.60%, due 12/15/2004 | | | 1,425 | | | | 1,433 | | |
Proctor & Gamble Co.
1.96%, due 01/12/2005 | | | 2,250 | | | | 2,241 | | |
| 2.00%, due 01/18/2005 | | | 5,700 | | | | 5,675 | | |
| 1.99%, due 01/19/2005 | | | 2,700 | | | | 2,688 | | |
Unilever Capital Corp., 144A
1.73%, due 11/09/2004 | | | 2,300 | | | | 2,299 | | |
| 1.76%, due 11/15/2004 | | | 3,200 | | | | 3,197 | | |
| 1.76%, due 11/17/2004 | | | 3,000 | | | | 2,997 | | |
| 1.79%, due 11/22/2004 | | | 3,300 | | | | 3,296 | | |
| Total Commercial Paper (cost: $215,904) | | | | | | | 215,904 | | |
| | | Principal | | Value | |
| CERTIFICATES OF DEPOSIT (13.0%) | |
Canadian Imperial Bank of Commerce
1.71%, due 11/09/2004 | | | $2,500 | | | | $2,500 | | |
| 1.80%, due 11/29/2004 | | | 3,700 | | | | 3,694 | | |
| 1.83%, due 12/02/2004 | | | 2,100 | | | | 2,097 | | |
| 1.85%, due 12/03/2004 | | | 2,100 | | | | 2,096 | | |
| 1.89%, due 12/13/2004 | | | 1,700 | | | | 1,700 | | |
Toronto Dominion Bank, Ltd.
1.90%, due 02/22/2005 | | | 2,300 | | | | 2,300 | | |
Wells Fargo Bank NA
1.77%, due 11/05/2004 | | | 1,500 | | | | 1,500 | | |
| 1.77%, due 11/12/2004 | | | 2,900 | | | | 2,900 | | |
| 2.00%, due 01/03/2005 | | | 2,700 | | | | 2,700 | | |
Bank of America Corp.
2.06%, due 02/04/2005 | | | 2,800 | | | | 2,800 | | |
Toronto Dominion Bank, Ltd.
1.70%, due 11/09/2004 | | | 5,120 | | | | 5,120 | | |
| 1.87%, due 12/06/2004 | | | 1,200 | | | | 1,200 | | |
| 1.97%, due 01/04/2005 | | | 1,500 | | | | 1,500 | | |
| Total Certificates of Deposit (cost: $32,107) | | | | | | | 32,107 | | |
| Total Investment Securities (cost: $248,011) | | | | | | $ | 248,011 | | |
| SUMMARY: | |
| Investments, at value | | | 100.1 | % | | $ | 248,011 | | |
| Liabilities in excess of other assets | | | (0.1 | )% | | | (220 | ) | |
| Net assets | | | 100.0 | % | | $ | 247,791 | | |
DEFINITIONS:
144A 144A Securities are registered pursuant to Rule 144A of the Securities Act of 1933. These securities are deemed to be liquid for purposes of compliance limitations on holdings of illiquid securities and may be resold as transactions exempt from registration normally to qualified institutional buyers. At October 31, 2004 these securities aggregated $76,904 or 31.0% of the net assets of the Fund.
The notes to the financial statements are an integral part of this report.
Transamerica IDEX Mutual Funds
Annual Report 2004
3
TA IDEX Transamerica Money Market
STATEMENT OF ASSETS AND LIABILITIES
At October 31, 2004
(all amounts except per share amounts in thousands)
| Assets: | | | |
| Investment securities, at value (cost: $248,011) | | $ | 248,011 | | |
| Cash | | | 75 | | |
| Receivables: | |
| Shares of beneficial interest sold | | | 952 | | |
| Interest | | | 194 | | |
| Other | | | 9 | | |
| | | | 249,241 | | |
| Liabilities: | | | |
| Accounts payable and accrued liabilities: | |
| Shares of beneficial interest redeemed | | | 758 | | |
| Management and advisory fees | | | 102 | | |
| Distribution fees | | | 107 | | |
| Transfer agent fees | | | 275 | | |
| Dividends to shareholders | | | 91 | | |
| Other | | | 117 | | |
| | | | 1,450 | | |
| Net Assets | | $ | 247,791 | | |
| Net Assets Consist of: | | | |
Shares of beneficial interest, unlimited shares
authorized, no par value | | $ | 247,700 | | |
| Undistributed net investment income (loss) | | | 91 | | |
| Net Assets | | $ | 247,791 | | |
| Net Assets by Class: | | | |
| Class A | | $ | 185,311 | | |
| Class B | | | 40,203 | | |
| Class C | | | 22,277 | | |
| Shares Outstanding: | | | |
| Class A | | | 185,311 | | |
| Class B | | | 40,203 | | |
| Class C | | | 22,277 | | |
| Net Asset Value Per Share: | | | |
| Class A | | $ | 1.00 | | |
| Class B | | | 1.00 | | |
| Class C | | | 1.00 | | |
STATEMENT OF OPERATIONS
For the year ended October 31, 2004
(all amounts in thousands)
| Investment Income: | | | |
| Interest | | $ | 2,487 | | |
| Expenses: | | | |
| Management and advisory fees | | | 757 | | |
| Transfer agent fees | |
| Class A | | | 409 | | |
| Class B | | | 139 | | |
| Class C | | | 25 | | |
| Class C2 | | | 22 | | |
| Class M | | | 11 | | |
| Printing and shareholder reports | | | 51 | | |
| Custody fees | | | 25 | | |
| Administration fees | | | 31 | | |
| Legal fees | | | 6 | | |
| Audit and accounting fees | | | 13 | | |
| Trustees fees | | | 10 | | |
| Registration fees | |
| Class A | | | 61 | | |
| Class B | | | 20 | | |
| Class C | | | 11 | | |
| Class C2 | | | 3 | | |
| Class M | | | 2 | | |
| Other | | | 11 | | |
| Distribution and service fees: | |
| Class A | | | 462 | | |
| Class B | | | 276 | | |
| Class C | | | 73 | | |
| Class C2 | | | 33 | | |
| Class M | | | 19 | | |
| Total expenses | | | 2,470 | | |
| Reimbursement of class expenses | |
| Class A | | | (477 | ) | |
| Class B | | | (145 | ) | |
| Class C | | | (71 | ) | |
| Net expenses | | | 1,777 | | |
| Net Investment Income (Loss) | | | 710 | | |
Net Increase (Decrease) in Net Assets Resulting
from Operations | | $ | 710 | | |
The notes to the financial statements are an integral part of this report.
Transamerica IDEX Mutual Funds
Annual Report 2004
4
TA IDEX Transamerica Money Market
STATEMENTS OF CHANGES IN NET ASSETS
For the years ended
(all amounts in thousands)
| | | October 31,
2004 | | October 31,
2003 | |
| Increase (Decrease) In Net Assets From: | |
| Operations: | |
| Net investment income (loss) | | $ | 710 | | | $ | 595 | | |
| | | | 710 | | | | 595 | | |
| Distributions to Shareholders: | |
| From net investment income: | |
| Class A | | | (601 | ) | | | (478 | ) | |
| Class B | | | (56 | ) | | | (85 | ) | |
| Class C | | | (40 | ) | | | (2 | ) | |
| Class C2 | | | (9 | ) | | | (21 | ) | |
| Class M | | | (4 | ) | | | (9 | ) | |
| | | | (710 | ) | | | (595 | ) | |
| Capital Share Transactions: | |
| Proceeds from shares sold: | |
| Class A | | | 179,283 | | | | 212,939 | | |
| Class B | | | 25,310 | | | | 44,548 | | |
| Class C | | | 23,364 | | | | 11,745 | | |
| Class C2 | | | 7,547 | | | | 16,782 | | |
| Class M | | | 2,473 | | | | 8,209 | | |
| | | | 237,977 | | | | 294,223 | | |
Dividends and distributions
reinvested: | |
| Class A | | | 545 | | | | 485 | | |
| Class B | | | 54 | | | | 86 | | |
| Class C | | | 11 | | | | 2 | | |
| Class C2 | | | 8 | | | | 22 | | |
| Class M | | | 4 | | | | 12 | | |
| | | | 622 | | | | 607 | | |
| Cost of shares redeemed: | |
| Class A | | | (104,345 | ) | | | (235,579 | ) | |
| Class B | | | (39,451 | ) | | | (71,993 | ) | |
| Class C | | | (17,946 | ) | | | (8,205 | ) | |
| Class C2 | | | (10,452 | ) | | | (24,270 | ) | |
| Class M | | | (3,810 | ) | | | (13,220 | ) | |
| | | | (176,004 | ) | | | (353,267 | ) | |
| Class level exchanges: | |
| Class C | | | 13,306 | | | | – | | |
| Class C2 | | | (9,777 | ) | | | – | | |
| Class M | | | (3,529 | ) | | | – | | |
| | | | – | | | | – | | |
| Automatic conversions: | |
| Class A | | | 34 | | | | – | | |
| Class B | | | (34 | ) | | | – | | |
| | | | – | | | | – | | |
| | | | 62,595 | | | | (58,437 | ) | |
| Net increase (decrease) in net assets | | | 62,595 | | | | (58,437 | ) | |
| Net Assets: | |
| Beginning of year | | | 185,196 | | | | 243,633 | | |
| End of year | | $ | 247,791 | | | $ | 185,196 | | |
Undistributed Net Investment Income
(Loss) | | $ | 91 | | | $ | 88 | | |
| | | October 31,
2004 | | October 31,
2003 | |
| Share Activity: | |
| Shares issued: | |
| Class A | | | 179,282 | | | | 212,938 | | |
| Class B | | | 25,311 | | | | 44,548 | | |
| Class C | | | 23,364 | | | | 11,745 | | |
| Class C2 | | | 7,548 | | | | 16,782 | | |
| Class M | | | 2,473 | | | | 8,208 | | |
| | | | 237,978 | | | | 294,221 | | |
Shares issued–reinvested from
distributions: | |
| Class A | | | 545 | | | | 485 | | |
| Class B | | | 54 | | | | 86 | | |
| Class C | | | 11 | | | | 22 | | |
| Class C2 | | | 8 | | | | 2 | | |
| Class M | | | 4 | | | | 12 | | |
| | | | 622 | | | | 607 | | |
| Shares redeemed: | |
| Class A | | | (104,345 | ) | | | (235,579 | ) | |
| Class B | | | (39,451 | ) | | | (71,993 | ) | |
| Class C | | | (17,946 | ) | | | (8,205 | ) | |
| Class C2 | | | (10,452 | ) | | | (24,270 | ) | |
| Class M | | | (3,810 | ) | | | (13,220 | ) | |
| | | | (176,004 | ) | | | (353,267 | ) | |
| Class level exchanges: | |
| Class C | | | 13,302 | | | | – | | |
| Class C2 | | | (9,777 | ) | | | – | | |
| Class M | | | (3,525 | ) | | | – | | |
| | | | – | | | | – | | |
| Automatic conversions: | |
| Class A | | | 34 | | | | – | | |
| Class B | | | (34 | ) | | | – | | |
| | | | – | | | | – | | |
Net increase (decrease) in shares
outstanding: | |
| Class A | | | 75,517 | | | | (22,156 | ) | |
| Class B | | | (14,121 | ) | | | (27,359 | ) | |
| Class C | | | 18,731 | | | | 3,562 | | |
| Class C2 | | | (12,673 | ) | | | (7,486 | ) | |
| Class M | | | (4,858 | ) | | | (5,000 | ) | |
| | | | 62,596 | | | | (58,439 | ) | |
The notes to the financial statements are an integral part of this report.
Transamerica IDEX Mutual Funds
Annual Report 2004
5
TA IDEX Transamerica Money Market
FINANCIAL HIGHLIGHTS
| | | | | For a share of beneficial interest outstanding throughout each period | |
| | | | | Net Asset | | Investment Operations | | Distributions | | Net Asset | |
| | | For the
Period
Ended (c)(f) | | Value,
Beginning
of Period | | Net
Investment
Income (Loss) | | Net Realized
and Unrealized
Gain (Loss) | | Total
Operations | | From Net
Investment
Income | | From Net
Realized
Gains | | Total
Distributions | | Value,
End
of Period | |
| Class A | | 10/31/2004 | | $ | 1.00 | | | $ | 0.004 | | | $ | – | | | $ | 0.004 | | | $ | (0.004 | ) | | $ | – | | | $ | (0.004 | ) | | $ | 1.00 | | |
| | | 10/31/2003 | | | 1.00 | | | | 0.004 | | | | – | | | | 0.004 | | | | (0.004 | ) | | | – | | | | (0.004 | ) | | | 1.00 | | |
| | | 10/31/2002 | | | 1.00 | | | | 0.008 | | | | – | | | | 0.008 | | | | (0.008 | ) | | | – | | | | (0.008 | ) | | | 1.00 | | |
| Class B | | 10/31/2004 | | | 1.00 | | | | 0.001 | | | | – | | | | 0.001 | | | | (0.001 | ) | | | – | | | | (0.001 | ) | | | 1.00 | | |
| | | 10/31/2003 | | | 1.00 | | | | 0.001 | | | | – | | | | 0.001 | | | | (0.001 | ) | | | – | | | | (0.001 | ) | | | 1.00 | | |
| | | 10/31/2002 | | | 1.00 | | | | – | | | | – | | | | – | | | | – | | | | – | | | | – | | | | 1.00 | | |
| Class C | | 10/31/2004 | | | 1.00 | | | | 0.001 | | | | – | | | | 0.001 | | | | (0.001 | ) | | | – | | | | (0.001 | ) | | | 1.00 | | |
| | | 10/31/2003 | | | 1.00 | | | | 0.002 | | | | – | | | | 0.002 | | | | (0.002 | ) | | | – | | | | (0.002 | ) | | | 1.00 | | |
| | | | | | | Ratios/Supplemental Data | |
| | | For the
Period | | Total | | Net Assets,
End of
Period | | Ratio of Expenses
to Average
Net Assets (a) | | Net Investment
Income (Loss)
to Average | |
| | | Ended (f) | | Return (b) | | (000's) | | Net (d) | | Total (e) | | Net Assets (a) | |
| Class A | | 10/31/2004 | | | 0.42 | % | | $ | 185,311 | | | | 0.83 | % | | | 1.19 | % | | | 0.45 | % | |
| | | 10/31/2003 | | | 0.39 | | | | 109,794 | | | | 0.83 | | | | 1.22 | | | | 0.42 | | |
| | | 10/31/2002 | | | 0.56 | | | | 131,949 | | | | 0.83 | | | | 1.36 | | | | 0.93 | | |
| Class B | | 10/31/2004 | | | 0.14 | | | | 40,203 | | | | 1.10 | | | | 1.43 | | | | 0.13 | | |
| | | 10/31/2003 | | | 0.12 | | | | 54,324 | | | | 1.16 | | | | 1.55 | | | | 0.08 | | |
| | | 10/31/2002 | | | 0.28 | | | | 81,683 | | | | 1.48 | | | | 2.01 | | | | 0.28 | | |
| Class C | | 10/31/2004 | | | 0.14 | | | | 22,277 | | | | 0.98 | | | | 1.73 | | | | 0.43 | | |
| | | 10/31/2003 | | | 0.12 | | | | 3,542 | | | | 1.04 | | | | 1.43 | | | | 0.21 | | |
NOTES TO FINANCIAL HIGHLIGHTS
(a) Annualized.
(b) Total Return has been calculated for the applicable period without deduction of a sales load, if any, on an initial purchase. Periods of less than one year are not annualized.
(c) Per share information is calculated based on average number of shares outstanding.
(d) Ratio of Net Expenses to Average Net Assets is net of fee waivers and reimbursements by the investment adviser, if any (see note 2).
(e) Ratio of Total Expenses to Average Net Assets includes all expenses before fee waivers and reimbursements by the investment adviser.
(f) TA IDEX Transamerica Money Market ("the Fund") commenced operations on March 1, 2002. The inception date for the Fund's offering of share Class L was November 11, 2002. Class L was renamed Class C on March 1, 2004. (see note 1)
The notes to the financial statements are an integral part of this report.
Transamerica IDEX Mutual Funds
Annual Report 2004
6
TA IDEX Transamerica Money Market
NOTES TO FINANCIAL STATEMENTS
At October 31, 2004
(all amounts in thousands)
NOTE 1. ORGANIZATION AND SIGNIFICANT ACCOUNTING POLICIES
Transamerica IDEX Mutual Funds is a Massachusetts business trust registered under the Investment Company Act of 1940, as amended (the "1940 Act"), as an open-end management investment company. TA IDEX Transamerica Money Market ("the Fund"), part of Transamerica IDEX Mutual Funds, began operations on March 1, 2002.
On March 1, 2004, the Fund changed its name from IDEX Transamerica Money Market to TA IDEX Transamerica Money Market.
In the normal course of business, the Fund enters into contracts that contain a variety of representations and warranties, which provide general indemnifications. The Fund's maximum exposure under these arrangements is unknown, as this would involve future claims that may be made against the Fund and/or its affiliates that have not yet occurred. However, based on experience, the Fund expects the risk of loss to be remote.
See the Prospectus and Statement of Additional Information for a description of the Fund's investment objective.
In preparing the Fund's financial statements in accordance with accounting principles generally accepted in the United States of America ("GAAP"), estimates or assumptions (which could differ from actual results) may be used that affect reported amounts and disclosures. The following policies were consistently followed by the Fund, in accordance with GAAP.
Multiple class operations and expenses: The Fund currently offers three classes of shares, each with a public offering price that reflects different sales charges, if any, and expense levels. All shares designated as Class C shares prior to March 1, 2004, were renamed as Class C2 shares on that date. All shares designated as Class L shares prior to March 1, 2004, were renamed as Class C shares with different sales charges than the previous Class L shares. On June 15, 2004, Class C2 shares merged into Class C. On September 24, 2004, Class M shares merged into Class C. Class B shares will convert to Class A shares eight years after purchase. Income, non-class specific expenses and realized and unrealized gains and losses, are allocated daily to each class, based upon the value of shares outstanding method as permitted under Rule 18f-3 of the 1940 Act. Each class bears its own specific expenses as well as a portion of general, common expenses.
Pricing of shares: The Fund prices its shares on the basis of the net asset value of each class of shares of the Fund, which is determined as of the close of the New York Stock Exchange ("NYSE") (generally 4:00 p.m. Eastern Time) on each day on which the NYSE is open for trading (other than a day on which there are insufficient changes in the value of the Fund's portfolio securities to materially affect the Fund's net asset value or a day on which no shares are tendered for redemption and no order to purchase any shares is received).
Security valuations: As permitted under Rule 2a-7 of the 1940 Act, the securities held by the Fund are valued on the basis of amortized cost, which approximates market value.
Other securities for which quotations are not readily available are valued at fair market value as determined in good faith using guidelines adopted by the Board of Trustees of the Fund, under the supervision of the Fund's Valuation Committee.
Cash: The Fund may leave cash overnight in its cash account with the custodian, Investors Bank & Trust Company ("IBT"). IBT has been contracted on behalf of the Fund to invest the excess cash into a savings account, which at October 31, 2004, was paying an interest rate of 1.30%.
Throughout the year, the Fund may have a cash overdraft balance. A fee is incurred on this overdraft, calculated by multiplying the overdraft by a rate based on the federal funds rate. This fee is included in Custody fees in the Statement of Operations.
Security transactions and investment income: Security transactions are recorded on the trade date. Security gains and losses are calculated on the specific identification basis. Interest income, including accretion of discounts and amortization of premiums, is recorded on the accrual basis commencing on the settlement date.
Account maintenance fees: If the shareholder account balance falls below $1 by either shareholder action or as a result of market action, a $25 (not in thousands) fee is assessed every year until the balance reaches $1. The fee is assessed by redeeming shares in the shareholder's account.
No fee will be charged under the following conditions:
• accounts opened within the preceding 24 months
• accounts with an active monthly Automatic Investment Plan ($50 (not in thousands) minimum per fund)
• accounts owned by an individual which, when combined by social security number, have a balance of $5 or more
• accounts owned by individuals in the same household (by address) that have a combined balance of $5 or more
• UTMA/UGMA accounts
• Fiduciary accounts
• B-share accounts whose shares have started to convert to
A-shares accounts (as long as combined value of both accounts is at least $1)
Transamerica IDEX Mutual Funds
Annual Report 2004
7
TA IDEX Transamerica Money Market
NOTES TO FINANCIAL STATEMENTS (continued)
At October 31, 2004
(all amounts in thousands)
NOTE 1.–(continued)
For the year ended October 31, 2004, this fee totaled less than $1. These fees are included in Paid in Capital in the Statement of Assets and Liabilities.
Redemption fees: A short-term trading redemption fee may be assessed on any fund shares in a fund account that are sold during the first five (5) New York Stock Exchange trading days following their purchase date. This redemption fee will equal 2% of the amount redeemed and shares held the longest will be treated as being redeemed first and shares held the shortest as being redeemed last. For the year ended October 31, 2004, the Fund received no redemption fees.
Dividend distributions: Distributions to shareholders are recorded on the ex-dividend date and are determined in accordance with Federal income tax regulations which may differ from GAAP.
NOTE 2. RELATED PARTY TRANSACTIONS
AEGON/Transamerica Fund Advisers, Inc. ("ATFA") is the Fund's investment adviser. AEGON/Transamerica Fund Services, Inc. ("ATFS") is the Fund's administrator. AFSG Securities Corp. ("AFSG") is the Fund's distributor/principal underwriter. AEGON/Transamerica Investor Services, Inc. ("ATIS") is the Fund's transfer agent. ATIS and AFSG are 100% owned by AUSA Holding Company ("AUSA"). ATFA is a directly owned subsidiary of Western Reserve Life Assurance Co. of Ohio (78%) ("WRL") and AUSA (22%). ATFS is a wholly owned subsidiary of WRL. AUSA and WRL are wholly owned indirect subsidiaries of AEGON NV, a Netherlands corporation.
Transamerica Investment Management, LLC is both an affiliate of the Fund and a sub-adviser to the Fund.
The following schedule reflects the percentage of fund assets owned by affiliated mutual funds (i.e., through the assets allocation funds)
| | | Net
Assets | | % of
Net Assets | |
TA IDEX Asset Allocation -
Conservative Portfolio | | $ | 27,238 | | | | 11 | % | |
TA IDEX Asset Allocation -
Moderate Growth Portfolio | | | 33,798 | | | | 14 | % | |
TA IDEX Asset Allocation -
Moderate Portfolio | | | 42,898 | | | | 17 | % | |
| Total | | $ | 103,934 | | | | 42 | % | |
Investment advisory fee: The Fund pays management fees to ATFA based on average daily net assets ("ANA") at the following rate:
0.40% of ANA
ATFA has contractually agreed to waive its advisory fee and will reimburse the Fund to the extent that operating expenses, excluding 12b-1 fees, exceed the following stated annual limit:
0.48% Expense Limit
If total fund expenses fall below the annual expense limitation agreement agreed to by the adviser within the succeeding three years, the Fund may be required to pay that adviser a portion or all of the waived advisory fees.
| | | Advisory Fee
Waived | | Available for
Recapture Through | |
| Fiscal Year 2003 | | $ | 869 | | | 10/31/2006 | |
| Fiscal Year 2002 | | | 543 | | | 10/31/2005 | |
If total class expenses fall below the annual expense limitation agreement agreed to by the adviser within the succeeding three years. The Fund may be required to pay that adviser a portion or all of the reimbursed class expenses.
| | | Reimbursement of
Class Expenses | | Available for
Recapture Through | |
| Fiscal Year 2004 - Class A | | $ | 477 | | | 10/31/2007 | |
| Fiscal Year 2004 - Class B | | | 145 | | | 10/31/2007 | |
| Fiscal Year 2004 - Class C | | | 71 | | | 10/31/2007 | |
Distribution and service fees: The Fund has a 12b-1 distribution plan under the 1940 Act pursuant to which an annual fee, based on average daily net assets, is paid to the distributor for various disbursements such as broker-dealer account servicing fees and other promotional expenses of the Fund. The Fund is authorized under the 12b-1 plan to pay fees on each class up to the following limits:
| Class A | | | 0.35 | % | |
| Class B | | | 1.00 | % | |
| Class C | | | 1.00 | % | |
| Class C2 | | | 1.00 | % | |
| Class M | | | 0.90 | % | |
Class C2 and Class M merged into Class C on June 15, 2004 and September 24, 2004, respectively.
In the case the Fund or a class of shares of the Fund is closed to new investors or investments, the Fund is authorized to pay 12b-1 fees for past sales and distribution efforts and present and past investor services.
In order to maintain a positive yield to shareholders, the Fund has waived a portion of the 12b-1 fees for all classes except Class A. The amount waived for the year ended October 31, 2004 was $141. These waivers are not subject to the expense recapture agreement. The waivers reduced the ratio of net expenses to average net assets by 0.16% for Class B and 0.24% for Class C.
Underwriter commissions relate to front-end sales charges imposed for Class A and M shares and contingent deferred sales charges from
Transamerica IDEX Mutual Funds
Annual Report 2004
8
TA IDEX Transamerica Money Market
NOTES TO FINANCIAL STATEMENTS (continued)
At October 31, 2004
(all amounts in thousands)
NOTE 2.–(continued)
Classes B, C, M and certain A share redemptions. For the year ended October 31, 2004, the underwriter commissions were as follows:
| Received by Underwriter | | $ | 484 | | |
| Retained by Underwriter | | | 0 | | |
| Contingent Deferred Sales Charge | | | 373 | | |
Administrative services: The Fund has entered into an agreement with ATFS for financial and legal fund administration services, which includes such items as compliance, expenses, financial statements and other reporting, distributions, tax returns, prospectus preparation, board of trustees meeting support and other legal matters. The Fund pays ATFS an annual fee of 0.015% of average net assets. The Legal fees on the Statement of Operations are for fees paid to external legal counsel.
The Fund paid ATFS $31 for the year ended October 31, 2004.
Transfer agent fees: The Fund pays ATIS an annual per-account charge of $20 (not in thousands) for each open account and $1.63 (not in thousands) for each closed account. There is no new account charge. The transfer agent fees on the Statement of Operations are made up of fees paid to ATIS and costs associated with shareholder statements. The Fund paid ATIS $606 for the year ended October 31, 2004.
Deferred compensation plan: Each eligible Fund Trustee may elect participation in the Deferred Compensation Plan ("the Plan"). Under the Plan, such Trustees may defer payment of a percentage of their total fees earned as a Fund Trustee. These deferred amounts may be invested in any Transamerica IDEX Mutual Fund. At October 31, 2004, the value of invested plan amount was $9. Invested plan amounts and the total liability for deferred compensation to the Trustees under the Plan at October 31, 2004, are included in the accompanying Statement of Assets and Liabilities.
NOTE 3. FEDERAL INCOME TAX MATTERS
The Fund has not made any provision for federal income or excise taxes due to its policy to distribute all of its taxable income and capital gains to its shareholders and otherwise qualify as a regulated investment company under the Internal Revenue Code. Income and capital gain distributions are determined in accordance with income tax regulations, which may differ from GAAP. These differences are primarily due to differing treatment for items including, but not limited to, excise taxes and distributions payable.
The tax character of distributions paid may differ from the character of distributions shown in the Statements of Changes in Net Assets due to short-term gains being treated as ordinary income for tax purposes. The tax character of distributions paid during 2003 and 2004 was as follows:
| 2003 Distributions paid from: | | | |
| Ordinary Income | | $ | 595 | | |
| Long-term capital gain | | | – | | |
| 2004 Distributions paid from: | | | |
| Ordinary Income | | | 710 | | |
| Long-term capital gain | | | – | | |
Reclassifications between Undistributed net investment income (loss), Accumulated net realized gain (loss) and Shares of beneficial interest are made to reflect income and gains available for distribution under federal tax regulations. Results of operations and net assets are not effected by these reclassifications. These reclassifications are as follows:
Shares of beneficial interest, unlimited
shares authorized | | | (3 | ) | |
| Undistributed net investment income (loss) | | $ | 3 | | |
The tax basis components of distributable earnings as of October 31, 2004, are as follows:
| Undistributed Ordinary Income | | $ | 186 | | |
| Undistributed Long-term Capital Gains | | $ | – | | |
| Capital Loss Carryforward | | $ | – | | |
| Net Unrealized Appreciation (Depreciation) | | $ | – | | |
The aggregate cost of investments and composition of unrealized appreciation (depreciation) for federal income tax purposes as of October 31, 2004, are as follows:
| Federal Tax Cost Basis | | $ | 248,011 | | |
| Unrealized Appreciation | | $ | – | | |
| Unrealized (Depreciation) | | | – | | |
| Net Unrealized Appreciation (Depreciation) | | $ | – | | |
NOTE 5. OTHER MATTERS
Transamerica IDEX Mutual Funds ("TA IDEX"), and certain of its affiliated entities, have received requests for information from the Staff of the Securities and Exchange Commission in connection with market timing and late trading within the funds. TA IDEX and the affiliated entities have voluntarily cooperated in the investigation and have been providing the information as requested.
Transamerica IDEX Mutual Funds
Annual Report 2004
9
Report of Independent Registered Certified Public Accounting Firm
To the Board of Trustees and Shareholders of
TA IDEX Transamerica Money Market
In our opinion, the accompanying statement of assets and liabilities, including the schedule of investments, and the related statements of operations and of changes in net assets and the financial highlights present fairly, in all material respects, the financial position of TA IDEX Transamerica Money Market (the "Fund") (one of the portfolios constituting the Transamerica IDEX Mutual Funds) at October 31, 2004, the results of its operations for the year then ended, the changes in its net assets for each of the two years in the period then ended and the financial highlights for each of the periods indicated, in conformity with accounting principles generally accepted in the United States of America. These financial statements and financial highlights (hereafter referred to as "financial statements") are the responsibility of the Fund's management; our responsibility is to express an opinion on these financial statements based on our audits. We conducted our audits of these financial statements in accordance with the standards of the Public Company Accounting Oversight Board (United States). Those standards require that we plan and perform the audit to obtain reasonable assurance about whether the financial statements are free of material misstatement. An audit includes examining, on a test basis, evidence supporting the amounts and disclosures in the financial statements, assessing the accounting principles used and significant estimates made by management, and evaluating the overall financial statement presentation. We believe that our audits, which included confirmation of securities at October 31, 2004 by correspondence with the custodian and brokers, provide a reasonable basis for our opinion.

PricewaterhouseCoopers LLP
Tampa, Florida
December 28, 2004
Transamerica IDEX Mutual Funds
Annual Report 2004
10
TA IDEX Transamerica Money Market
SUPPLEMENTAL INFORMATION (unaudited)
TAX INFORMATION
For dividends paid during the year ended October 31, 2004, the Fund designates qualified dividend income to the maximum extent allowable.
The information and distributions reported herein may differ from the information and distributions taxable to the shareholders for the calendar year ending December 31, 2004. Complete information will be computed and reported in conjunction with your 2004 Form 1009-Div.
RESULTS OF SHAREHOLDER PROXY
At a special meeting of Class M shareholders of each series of Transamerica IDEX (except TA IDEX Federated Tax Exempt and TA IDEX Protected Principal Stock), as listed above, held on September 2, 2004, the results of the Proposal were as follows:
Proposal 1: Approval of a conversion of Class M shares into Class C shares of the Funds, which will result in bearing the distribution and service fees payable under the 12b-1 Plan of Distribution for the Class C shares of the Funds.
| For | | Against | | Abstentions/Broker Non-Votes | |
| | 77.96 | % | | | 10.36 | % | | | 11.68 | % | |
Transamerica IDEX Mutual Funds
Annual Report 2004
11
TA IDEX Transamerica Small/Mid Cap Value
MARKET ENVIRONMENT
The 12 months ended October 31, 2004, were a very positive but uneven period for small- and mid-cap value stocks. The Russell 2500 Value Index ("Russell 2500 Value") finished 2003 on an upbeat note as investors, generally bullish on the economy, bid up prices in many economically sensitive sectors. As we worked our way further into 2004, however, geopolitical concerns, conflicting economic data, higher short-term interest rates, an extremely close U.S. Presidential race, and a dramatic rise in oil prices took their toll on investor confidence, and equity markets generally moved sideways or downward. Despite this, the Russell 2500 Value advanced 17.81% over the twelve-month period.
PERFORMANCE
For the year ended October 31, 2004, TA IDEX Transamerica Small/Mid Cap Value, Class A returned 20.61%. By comparison its primary and secondary benchmarks, the Russell 2500 Value and the Russell 2000 Index, returned 17.81% and 11.73%, respectively.
STRATEGY REVIEW
We attribute the portfolio's superior results to our repositioning of the portfolio after we (Transamerica Investment Management) assumed daily management responsibilities in March 2004. In keeping with our outlook, which was moderately constructive, we emphasized companies that exhibited the ability to control their own destinies regardless of economic trends. We also increased the portfolio's exposure to businesses in industries that stood to benefit from worldwide infrastructure development and favorable supply-demand balances, most notably energy and materials companies. Thus, the portfolio was well positioned to benefit when a "perfect storm" of terrorism, hurricanes and civil/political strife in Nigeria and Venezuela catapulted oil prices up and over the $55-per-barrel mark by mid-October. Energy was the best-performing sector of the Russell 2500 Value, followed by materials, which rose alon g with a decline in the U.S. dollar and higher commodities prices.
As a result, the portfolio's largest individual contributors to performance were chemicals companies like Terra Nitrogen Company, L.P., PolyOne Corporation and Crompton Corporation and energy businesses such Denbury Resources Inc., EOG Resources, Inc. and Chesapeake Energy Corporation.
Also important to the portfolio's outperformance was an underweighting in industries that we felt were susceptible to a slowdown in consumer spending and/or the lack of an increase in business spending. Chief among them was technology, which was ultimately the lowest-returning sector for the full period.
The gains in energy, materials and other stocks were partially offset by poor results in several areas, including consumer stocks, pharmaceuticals and, most significantly, healthcare. The healthcare environment has become increasingly competitive and focused on cost reduction. As a result, companies like Omnicare, Inc. ("Omnicare"), which provides pharmaceuticals to nursing homes, and Orthofix International NV ("Orthofix"), a manufacturer of medical devices, have come under considerable pressure. Rather than exit the entire sector, we have reviewed our holdings on a case-by-case basis. In the case of Omnicare, we chose to liquidate our position, largely because we feel changes in Medicare payments and other external forces have stripped the company of the ability to control its destiny in the coming 18 to 24 months. Conversely, we added to our investment in Orthofix, which has commanding market share. Integrating a recent acquisition is proving more of a challenge than Orthofix anticipated, but we believe that management will resolve that situation with sufficient time.
Michelle E. Stevens, CFA
John C. Riazzi, CFA
Co-Fund Managers
Transamerica Investment Management, LLC
Transamerica IDEX Mutual Funds
Annual Report 2004
1
TA IDEX Transamerica Small/Mid Cap Value
Comparison of change in value of $10,000 investment in Class A shares and its comparative index.
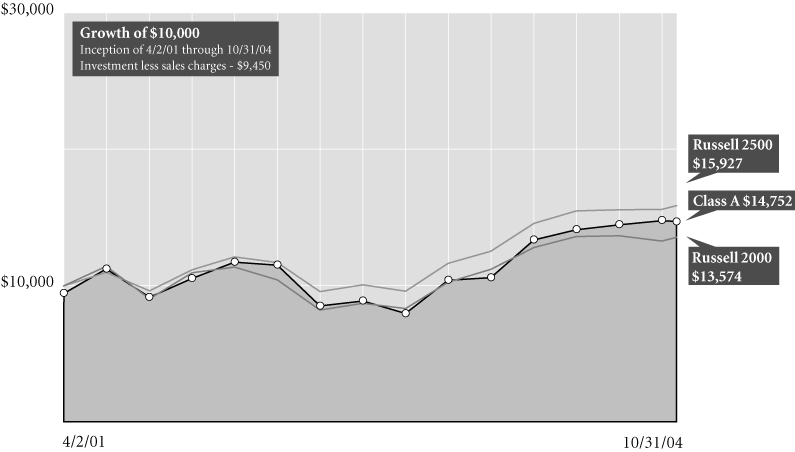
Transamerica IDEX Mutual Funds
Average Annual Total Return for Periods Ended 10/31/04
| | | 1 year | | From
Inception | | Inception
Date | |
| Class A (NAV) | | | 20.61 | % | | | 13.24 | % | | 4/2/01 | |
| Class A (POP) | | | 13.98 | % | | | 11.46 | % | | 4/2/01 | |
| Russell 25001 | | | 17.81 | % | | | 13.87 | % | | 4/2/01 | |
| Russell 20001 | | | 11.73 | % | | | 8.90 | % | | 4/2/01 | |
| Class B (NAV) | | | 19.85 | % | | | 12.51 | % | | 4/2/01 | |
| Class B (POP) | | | 14.85 | % | | | 12.10 | % | | 4/2/01 | |
| Class C (NAV) | | | 19.78 | % | | | 30.56 | % | | 11/11/02 | |
| Class C (POP) | | | 18.78 | % | | | 30.56 | % | | 11/11/02 | |
NOTES
1 The Russell 2500 Value (Russell 2500) and Russell 2000 Index (Russell 2000) are unmanaged indices used as a general measure of market performance. Calculations assume dividends and capital gains are reinvested and do not include any managerial expenses. From inception calculation is based on life of Class A shares. Source: Standard & Poor's Micropal®© Micropal, Inc. 2004 – 1-800-596-5323 – http://www.micropal.com.
The performance data presented represents past performance, future results may vary. Performance data does not reflect the deduction of taxes that would be paid on fund distributions or the redemption of fund shares. Investment return and principal value will fluctuate so that an investor's shares, when redeemed, may be worth more or less than their original cost. Current performance may be lower or higher than performance quoted.
Public Offering Price (POP) returns include the reinvestment of dividends and capital gains and reflect the maximum sales charge of 5.5% for A shares or the maximum applicable contingent deferred sales charge (5% in the 1st year, decreasing to 0% after 6 years) for Class B shares and 1% (during the first 12 months) for Class C shares. Shares purchased prior to March 1, 2004 are subject to a maximum applicable contingent deferred sales charge (5% in the 1st year, decreasing to 0% after 7 years) for Class B shares and (2% in the 1st year, decreasing to 0% after 2 years) for Class C shares. Net Asset Value (NAV) returns include the reinvestment of dividends and capital gains but do not reflect any sales charges.
Investing in small cap stocks generally involves greater risk and volatility, therefore an investment in the fund may not be appropriate for everyone.
This material must be preceded or accompanied by a current prospectus, which includes specific contents regarding the investment objectives and policies of this fund.
Annual Report 2004
2
TA IDEX Transamerica Small/Mid Cap Value
UNDERSTANDING YOUR FUND'S EXPENSES (unaudited)
SHAREHOLDER EXPENSES
The following Example is intended to help you understand your ongoing costs (in dollars and cents) of investing in a Fund and to compare these costs with the ongoing costs of investing in other funds.
The Example is based on an investment of $1,000 invested at the beginning of the period and held for the entire period from May 1, 2004 to October 31, 2004.
ACTUAL EXPENSES
The first line in the table below provides information about actual account values and actual expenses. You may use the information in this line, together with the amount you invested, to estimate the expenses that you paid over the period. Simply divide your account value by $1,000 (for example, an $8,600 account value divided by $1,000 = 8.6), then multiply the result by the number in the first line of your Fund under the heading entitled "Expenses Paid During Period" to estimate the expenses you paid on your account during this period.
HYPOTHETICAL EXAMPLE FOR COMPARISON PURPOSES
The second line in the table below provides information about hypothetical account values and hypothetical expenses based on each Fund's actual expense ratio and an assumed rate of return of 5% per year before expenses, which is not the Fund's actual return. The hypothetical account values and expenses may not be used to estimate the actual ending account balance or expenses you paid for the period. You may use this information to compare the ongoing costs of investing in your Fund and other funds. To do so, compare this 5% hypothetical example with the 5% hypothetical examples that appear in the shareholder reports of the other funds.
Please note that the expenses shown in the table are meant to highlight your ongoing costs only and do not reflect any transactional costs, such as sales charges, redemption fees, brokerage commissions paid on purchases and sales of fund shares. Therefore, the second line under each Fund in the table is useful in comparing ongoing costs only, and will not help you determine the relative total costs of owning different funds. In addition, note that the expenses shown in the table are meant to highlight your ongoing costs and do not reflect any transaction costs.
| | | Beginning
Account
Value | | Ending
Account
Value | | Annualized
Expense
Ratio | | Expenses Paid
During Period (a) | |
| Class A | | | |
| Actual | | $ | 1,000.00 | | | $ | 1,061.80 | | | | 1.27 | % | | $ | 6.58 | | |
| Hypothetical (b) | | | 1,000.00 | | | | 1,018.75 | | | | 1.27 | | | | 6.44 | | |
| Class B | | | |
| Actual | | | 1,000.00 | | | | 1,058.80 | | | | 1.89 | | | | 9.78 | | |
| Hypothetical (b) | | | 1,000.00 | | | | 1,015.63 | | | | 1.89 | | | | 9.58 | | |
| Class C | | | |
| Actual | | | 1,000.00 | | | | 1,057.40 | | | | 2.08 | | | | 10.76 | | |
| Hypothetical (b) | | | 1,000.00 | | | | 1,014.68 | | | | 2.08 | | | | 10.53 | | |
(a) Expenses are calculated using each Fund's annualized expense ratio (as disclosed in the table), multiplied by the average account value for the period, multiplied by number of days in the period (184 days), and divided by the number of days in the year (366 days).
(b) 5% return per year before expenses
GRAPHIC PRESENTATION OF SCHEDULE OF INVESTMENTS
By Sector
At October 31, 2004
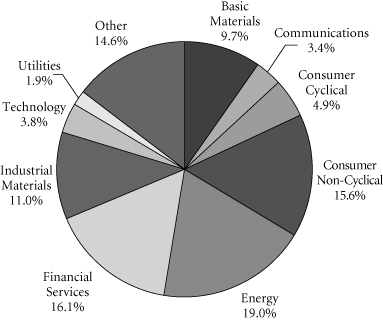
This chart shows the percentage breakdown by sector of the Fund's total investment securities.
Transamerica IDEX Mutual Funds
Annual Report 2004
3
TA IDEX Transamerica Small/Mid Cap Value
SCHEDULE OF INVESTMENTS
At October 31, 2004
(all amounts except share amounts in thousands)
| | | Shares | | Value | |
| COMMON STOCKS (96.9%) | |
| Apparel Products (1.2%) | |
| Gymboree Corp. (a) | | | 400,000 | | | $ | 4,840 | | |
| Automotive (2.0%) | |
| Gencorp, Inc. (b) | | | 355,900 | | | | 4,947 | | |
| National R.V. Holdings, Inc. (a) | | | 302,500 | | | | 2,919 | | |
| Business Services (1.2%) | |
| Equifax, Inc. | | | 180,000 | | | | 4,707 | | |
| Chemicals & Allied Products (9.1%) | |
| Crompton Corp. | | | 818,300 | | | | 7,610 | | |
| Olin Corp. | | | 469,900 | | | | 8,787 | | |
| PolyOne Corp. (a) | | | 1,265,500 | | | | 9,580 | | |
| SurModics, Inc. (a)(b) | | | 150,000 | | | | 4,027 | | |
| Terra Nitrogen Co., L.P. (b) | | | 280,900 | | | | 5,730 | | |
| Commercial Banks (7.5%) | |
| Chittenden Corp. | | | 107,750 | | | | 3,051 | | |
| Corus Bankshares, Inc. | | | 120,000 | | | | 5,521 | | |
| Gold Banc Corp., Inc. | | | 57,800 | | | | 841 | | |
| Hibernia Corp.–Class A | | | 270,000 | | | | 7,830 | | |
| North Fork Bancorp, Inc. | | | 205,140 | | | | 9,047 | | |
| Provident Bankshares Corp. | | | 95,500 | | | | 3,317 | | |
| Computer & Data Processing Services (3.2%) | |
| ActivCard Corp. (a) | | | 290,100 | | | | 2,318 | | |
| Fair Isaac Corp. | | | 215,000 | | | | 6,493 | | |
| Sabre Holdings Corp. | | | 150,000 | | | | 3,227 | | |
| SoftBrands, Inc. (a) | | | 2,576 | | | | 3 | | |
| Verint Systems, Inc. (a) | | | 15,000 | | | | 583 | | |
| Computer & Office Equipment (2.1%) | |
| Hypercom Corp. (a) | | | 829,700 | | | | 5,376 | | |
| Storage Technology Corp. (a) | | | 100,000 | | | | 2,702 | | |
| Construction (1.8%) | |
| Chemed Corp. | | | 120,000 | | | | 7,254 | | |
| Electric Services (0.6%) | |
| Duquesne Light Holdings, Inc. | | | 129,500 | | | | 2,222 | | |
| Electric, Gas & Sanitary Services (0.6%) | |
| ALLETE, Inc. | | | 66,666 | | | | 2,265 | | |
| Electronic & Other Electric Equipment (6.5%) | |
| Acuity Brands, Inc. | | | 250,000 | | | | 6,633 | | |
| Genlyte Group, Inc. (a) | | | 135,000 | | | | 9,931 | | |
| Helen of Troy, Ltd. (a) | | | 200,000 | | | | 5,310 | | |
| Maytag Corp. (b) | | | 220,000 | | | | 3,828 | | |
| Electronic Components & Accessories (2.3%) | |
| OSI Systems, Inc. (a)(b) | | | 240,000 | | | | 4,178 | | |
| QLogic Corp. (a) | | | 150,000 | | | | 4,875 | | |
| | | Shares | | Value | |
| Gas Production & Distribution (1.0%) | |
| KeySpan Corp. | | | 100,000 | | | $ | 3,995 | | |
| Health Services (0.4%) | |
| Beverly Enterprises, Inc. (a) | | | 200,000 | | | | 1,738 | | |
| Holding & Other Investment Offices (6.2%) | |
| Annaly Mortgage Management, Inc. (b) | | | 350,000 | | | | 6,293 | | |
| Host Marriott Corp. (a)(b) | | | 620,000 | | | | 9,021 | | |
| Omega Healthcare Investors, Inc. | | | 825,000 | | | | 9,298 | | |
| Industrial Machinery & Equipment (0.4%) | |
| EnPro Industries, Inc. (a) | | | 75,400 | | | | 1,656 | | |
| Instruments & Related Products (2.0%) | |
| Analogic Corp. | | | 83,900 | | | | 3,570 | | |
| Input/Output, Inc. (a) | | | 600,000 | | | | 4,194 | | |
| Insurance (4.4%) | |
| AMBAC Financial Group, Inc. | | | 120,000 | | | | 9,367 | | |
| American Medical Security Group, Inc. (a) | | | 180,000 | | | | 5,715 | | |
| Triad Guaranty, Inc. (a)(b) | | | 40,000 | | | | 2,180 | | |
| Leather & Leather Products (0.3%) | |
| Steven Madden, Ltd. (a) | | | 76,800 | | | | 1,230 | | |
| Management Services (2.2%) | |
| First Consulting Group, Inc. (a) | | | 253,600 | | | | 1,192 | | |
| FTI Consulting, Inc. (a) | | | 400,000 | | | | 7,504 | | |
| Medical Instruments & Supplies (2.1%) | |
| Celsion Corp. (a) | | | 615,600 | | | | 302 | | |
| Orthofix International NV (a) | | | 225,000 | | | | 7,988 | | |
| Metal Mining (0.6%) | |
| Western Silver Corp. (a)(b) | | | 238,100 | | | | 2,500 | | |
| Motor Vehicles, Parts & Supplies (1.0%) | |
| Adesa, Inc. (a) | | | 200,000 | | | | 4,030 | | |
| Oil & Gas Extraction (17.5%) | |
| Chesapeake Energy Corp. (b) | | | 600,000 | | | | 9,648 | | |
| Denbury Resources, Inc. (a)(b) | | | 236,600 | | | | 5,868 | | |
| Energy Partners, Ltd. (a)(b) | | | 510,500 | | | | 8,964 | | |
| Harvest Natural Resources, Inc. (a) | | | 241,200 | | | | 3,647 | | |
| Magnum Hunter Resources, Inc. (a)(b) | | | 487,100 | | | | 5,894 | | |
| Newpark Resources, Inc. (a)(b) | | | 404,300 | | | | 2,195 | | |
| Noble Energy, Inc. | | | 105,000 | | | | 6,090 | | |
| Parker Drilling Co. (a) | | | 600,000 | | | | 2,340 | | |
| Pioneer Drilling Co. (a) | | | 600,000 | | | | 4,854 | | |
| Pride International, Inc. (a) | | | 415,000 | | | | 7,669 | | |
| Superior Energy Services, Inc. (a) | | | 920,000 | | | | 11,859 | | |
| Paper & Allied Products (2.1%) | |
| Graphic Packaging Corp. (a) | | | 581,700 | | | | 3,990 | | |
| Wausau-Mosinee Paper Corp. | | | 267,700 | | | | 4,187 | | |
The notes to the financial statements are an integral part of this report.
Transamerica IDEX Mutual Funds
Annual Report 2004
4
TA IDEX Transamerica Small/Mid Cap Value
SCHEDULE OF INVESTMENTS (continued)
At October 31, 2004
(all amounts except share amounts in thousands)
| | | Shares | | Value | |
| Petroleum Refining (2.0%) | | | |
| Murphy Oil Corp. | | | 100,000 | | | $ | 8,002 | | |
| Pharmaceuticals (3.5%) | | | |
| ARIAD Pharmaceuticals, Inc. (a) | | | 975,500 | | | | 5,531 | | |
| Bradley Pharmaceuticals, Inc. (a)(b) | | | 250,000 | | | | 4,140 | | |
| Chattem, Inc. (a)(b) | | | 73,000 | | | | 2,443 | | |
| NeoPharm, Inc. (a)(b) | | | 134,300 | | | | 976 | | |
| Theragenics Corp. (a) | | | 244,600 | | | | 900 | | |
| Primary Metal Industries (1.3%) | | | |
| Commonwealth Industries, Inc. (a) | | | 545,800 | | | | 5,098 | | |
| Printing & Publishing (1.2%) | | | |
| Paxar Corp. (a) | | | 218,900 | | | | 4,827 | | |
| Retail Trade (1.5%) | | | |
| Sports Authority, Inc. (The) (a) | | | 250,000 | | | | 6,045 | | |
| Savings Institutions (1.7%) | | | |
| Brookline Bancorp, Inc. (b) | | | 160,000 | | | | 2,478 | | |
| Partners Trust Financial Group, Inc. | | | 400,000 | | | | 4,072 | | |
| Telecommunications (2.5%) | | | |
| Citizens Communications Co. | | | 650,000 | | | | 8,710 | | |
| D&E Communications, Inc. | | | 85,940 | | | | 1,063 | | |
| Trucking & Warehousing (1.8%) | | | |
| Yellow Roadway Corp. (a) | | | 150,000 | | | | 7,199 | | |
| Water Transportation (1.0%) | | | |
| Tidewater, Inc. | | | 125,000 | | | | 3,866 | | |
| Wholesale Trade Durable Goods (0.6%) | | | |
| AM Castle & Co. (a) | | | 219,900 | | | | 2,476 | | |
| Wholesale Trade Nondurable Goods (1.5%) | | | |
| Dean Foods Co. (a) | | | 200,000 | | | | 5,970 | | |
| Total Common Stocks (cost: $351,036) | | | | | | | 382,726 | | |
| | | Principal | | Value | |
| SECURITY LENDING COLLATERAL (16.6%) | | | |
| Debt (15.4%) | | | |
| Bank Notes (3.0%) | | | |
Bank of America
1.77%, due 12/03/2004 | | $ | 3,189 | | | $ | 3,189 | | |
| 1.88%, due 12/23/2004 | | | 1,063 | | | | 1,063 | | |
| 1.77%, due 01/18/2005 | | | 2,126 | | | | 2,126 | | |
Canadian Imperial Bank of Commerce
1.86%, due 11/04/2004 | | | 4,784 | | | | 4,784 | | |
Credit Suisse First Boston Corp.
1.83%, due 09/09/2005 | | | 531 | | | | 531 | | |
| | | Principal | | Value | |
| Commercial Paper (1.6%) | | | |
Clipper Receivables Corp.
1.79%, due 11/12/2004 | | $1,583 | | $1,583 | |
Delaware Funding Corp. 144A
1.85%, due 11/19/2004 | | 531 | | 531 | |
Falcon Asset Securitization Corp. 144A
1.78%, due 11/04/2004
1.75%, due 11/10/2004 | | 1,586
2,126 | | 1,586
2,126 | |
Galaxy Funding 144A
1.88%, due 11/22/2004 | | 532 | | 532 | |
| Euro Dollar Terms (7.2%) | | | |
Bank of Montreal
1.88%, due 11/24/2004 | | 5,035 | | 5,035 | |
BNP Paribas
1.77%, due 11/10/2004
1.80%, due 11/23/2004
1.98%, due 12/27/2004 | | 2,658
2,126
2,126 | | 2,658
2,126
2,126 | |
Calyon
1.70%, due 11/24/2004 | | 281 | | 281 | |
Citigroup
2.06%, due 01/25/2005 | | 5,315 | | 5,315 | |
Den Danske Bank
1.82%, due 11/19/2004 | | 2,658 | | 2,658 | |
Dexia Group
2.04%, due 01/21/2005 | | 1,233 | | 1,233 | |
HBOS Halifax Bank of Scotland
2.03%, due 01/21/2005 | | 1,063 | | 1,063 | |
Royal Bank of Scotland
2.01%, due 01/20/2005 | | 2,126 | | 2,126 | |
Toronto Dominion Bank
1.70%, due 11/08/2004 | | 1,063 | | 1,063 | |
Wells Fargo
1.87%, due 11/22/2004 | | 2,658 | | 2,658 | |
| Promissory Notes (1.5%) | | | |
Goldman Sachs Group Inc.
1.90%, due 12/29/2004
1.88%, due 01/27/2005 | | 2,232
3,721 | | 2,232
3,721 | |
| Repurchase Agreements (2.1%) (c) | | | |
Merril Lynch & Co., Inc.
1.92% Repurchase Agreement dated
10/29/2004 to be repurchased at $8,505
on 11/01/2004 | | 8,505 | | 8,505 | |
The notes to the financial statements are an integral part of this report.
Transamerica IDEX Mutual Funds
Annual Report 2004
5
TA IDEX Transamerica Small/Mid Cap Value
SCHEDULE OF INVESTMENTS (continued)
At October 31, 2004
(all amounts except share amounts in thousands)
| | | Shares | | Value | |
| Investment Companies (1.2%) | |
| Money Market Funds (1.2%) | |
Merrill Lynch Premier Institutional Fund
1-day yield of 1.71% | | | 2,614,852 | | | $ | 2,615 | | |
Merrimac Cash Fund, Premium Class
1-day yield of 1.46% | | | 1,913,521 | | | | 1,913 | | |
| Total Security Lending Collateral (cost: $65,379) | | | | | 65,379 | | |
| Total Investment Securities (cost: $416,415) | | | | $ | 448,105 | | |
| | | | | Value | |
| SUMMARY: | | | |
| Investments, at value | | | 113.5 | % | | $ | 448,105 | | |
| Liabilities in excess of other assets | | | (13.5 | )% | | | (53,187 | ) | |
| Net assets | | | 100.0 | % | | $ | 394,918 | | |
NOTES TO SCHEDULE OF INVESTMENTS:
(a) No dividends were paid during the preceding twelve months.
(b) At October 31, 2004, all or a portion of this security is on loan (see Note 1). The value at October 31, 2004, of all securities on loan is $61,772.
(c) Cash collateral for the Repurchase Agreements, valued at $8,703, that serve as collateral for securities lending are invested in corporate bonds with interest rates and maturity dates ranging from 0.00%–9.75% and 05/15/2005–9/15/2033, respectively.
144A 144A Securities are registered pursuant to rule 144A of the Securities Act of 1933. These securities are deemed to be liquid for purposes of compliance limitations on holdings of illiquid securities and may be resold on transactions exempt from registration normally to qualified institutional buyers. At October 31, 2004, these securities aggregated 4,775 or 1.2% of the net assets of the Fund.
The notes to the financial statements are an integral part of this report.
Transamerica IDEX Mutual Funds
Annual Report 2004
6
TA IDEX Transamerica Small/Mid Cap Value
STATEMENT OF ASSETS AND LIABILITIES
At October 31, 2004
(all amounts except per share amounts in thousands)
| Assets: | | | |
Investment securities, at value (cost: $416,415)
(including securities loaned of $61,722) | | $ | 448,105 | | |
| Cash | | | 10,747 | | |
| Receivables: | |
| Investment securities sold | | | 4,040 | | |
| Shares of beneficial interest sold | | | 82 | | |
| Interest | | | 36 | | |
| Dividends | | | 435 | | |
| Other | | | 7 | | |
| | | | 463,452 | | |
| Liabilities: | | | |
| Investment securities purchased | | | 2,441 | | |
| Accounts payable and accrued liabilities: | |
| Shares of beneficial interest redeemed | | | 163 | | |
| Management and advisory fees | | | 268 | | |
| Distribution fees | | | 150 | | |
| Transfer agent fees | | | 40 | | |
| Payable for collateral for securities on loan | | | 65,379 | | |
| Other | | | 93 | | |
| | | | 68,534 | | |
| Net Assets | | $ | 394,918 | | |
| Net Assets Consist of: | | | |
Shares of beneficial interest, unlimited shares
authorized, no par value | | $ | 351,918 | | |
| Undistributed net investment income (loss) | | | 520 | | |
Undistributed net realized gain (loss) from investment
securities | | | 10,791 | | |
Net unrealized appreciation (depreciation) on
investment securities | | | 31,689 | | |
| Net Assets | | $ | 394,918 | | |
| Net Assets by Class: | | | |
| Class A | | $ | 334,763 | | |
| Class B | | | 40,477 | | |
| Class C | | | 19,678 | | |
| Shares Outstanding: | | | |
| Class A | | | 23,374 | | |
| Class B | | | 2,897 | | |
| Class C | | | 1,409 | | |
| Net Asset Value Per Share: | | | |
| Class A | | $ | 14.32 | | |
| Class B | | | 13.97 | | |
| Class C | | | 13.96 | | |
| Maximum Offering Price Per Share (a): | | | |
| Class A | | $ | 15.15 | | |
(a) Includes the maximum selling commission (represented as a percentage of offering price) which is reduced on certain levels of sales as set forth in the Prospectus. Net asset value per share for Classes B and C shares represents offering price. The redemption price for Classes B and C shares equals net asset value less any applicable contingent deferred sales charge.
STATEMENT OF OPERATIONS
For the year ended October 31, 2004
(all amounts in thousands)
| Investment Income: | | | |
| Interest | | $ | 114 | | |
| Dividends | | | 4,911 | | |
| Income from loaned securities–net | | | 219 | | |
| | | | 5,244 | | |
| Expenses: | | | |
| Management and advisory fees | | | 2,688 | | |
| Transfer agent fees | |
| Class A | | | 208 | | |
| Class B | | | 29 | | |
| Class C | | | 6 | | |
| Class C2 | | | 8 | | |
| Class M | | | 4 | | |
| Printing and shareholder reports | | | 26 | | |
| Custody fees | | | 47 | | |
| Administration fees | | | 50 | | |
| Legal fees | | | 10 | | |
| Audit and accounting fees | | | 13 | | |
| Trustees fees | | | 18 | | |
| Registration fees | |
| Class A | | | 56 | | |
| Class B | | | 4 | | |
| Class C | | | 13 | | |
| Class C2 | | | 1 | | |
| Class M | | | 1 | | |
| Other | | | 11 | | |
| Distribution and service fees: | |
| Class A | | | 931 | | |
| Class B | | | 389 | | |
| Class C | | | 82 | | |
| Class C2 | | | 82 | | |
| Class M | | | 46 | | |
| Total expenses | | | 4,723 | | |
| Net Investment Income (Loss) | | | 521 | | |
| Net Realized and Unrealized Gain (Loss) | | | |
| Realized gain (loss) from investment securities | | | 41,838 | | |
Increase (decrease) in unrealized appreciation
(depreciation) on investment securities | | | 10,477 | | |
| Net Gain (Loss) on Investments | | | 52,315 | | |
Net Increase (Decrease) in Net Assets Resulting
from Operations | | $ | 52,836 | | |
The notes to the financial statements are an integral part of this report.
Transamerica IDEX Mutual Funds
Annual Report 2004
7
TA IDEX Transamerica Small/Mid Cap Value
STATEMENTS OF CHANGES IN NET ASSETS
For the years ended
(all amounts in thousands)
| | | October 31,
2004 | | October 31,
2003 | |
| Increase (Decrease) in Net Assets From: | | | |
| Operations: | | | |
| Net investment income (loss) | | $ | 521 | | | $ | (1,435 | ) | |
Net realized gain (loss) from
investment securities | | | 41,838 | | | | 1,765 | | |
Net unrealized appreciation
(depreciation) on investment
securities | | | 10,477 | | | | 39,433 | | |
| | | | 52,836 | | | | 39,763 | | |
| Distributions to Shareholders: | | | |
| From net realized gains: | |
| Class A | | | (24,403 | ) | | | – | | |
| Class B | | | (3,352 | ) | | | – | | |
| Class C | | | (378 | ) | | | – | | |
| Class C2 | | | (926 | ) | | | – | | |
| Class M | | | (487 | ) | | | – | | |
| | | | (29,546 | ) | | | – | | |
| Capital Share Transactions: | | | |
| Proceeds from shares sold: | |
| Class A | | | 159,364 | | | | 106,174 | | |
| Class B | | | 10,062 | | | | 7,499 | | |
| Class C | | | 5,433 | | | | 1,782 | | |
| Class C2 | | | 915 | | | | 1,858 | | |
| Class M | | | 1,302 | | | | 1,585 | | |
| | | | 177,076 | | | | 118,898 | | |
Dividends and distributions
reinvested: | |
| Class A | | | 24,237 | | | | – | | |
| Class B | | | 3,058 | | | | – | | |
| Class C | | | 343 | | | | – | | |
| Class C2 | | | 809 | | | | – | | |
| Class M | | | 475 | | | | – | | |
| | | | 28,922 | | | | – | | |
| Cost of shares redeemed: | |
| Class A | | | (16,086 | ) | | | (26,571 | ) | |
| Class B | | | (9,142 | ) | | | (7,874 | ) | |
| Class C | | | (4,965 | ) | | | (53 | ) | |
| Class C2 | | | (6,554 | ) | | | (3,907 | ) | |
| Class M | | | (2,191 | ) | | | (1,799 | ) | |
| | | | (38,938 | ) | | | (40,204 | ) | |
| Class level exchanges: | |
| Class C | | | 16,014 | | | | – | | |
| Class C2 | | | (10,526 | ) | | | – | | |
| Class M | | | (5,488 | ) | | | – | | |
| | | | – | | | | – | | |
| Automatic conversions: | |
| Class A | | | 60 | | | | – | | |
| Class B | | | (60 | ) | | | – | | |
| | | | – | | | | – | | |
| | | | 167,060 | | | | 78,694 | | |
| Net increase (decrease) in net assets | | | 190,350 | | | | 118,457 | | |
| | | October 31,
2004 | | October 31,
2003 | |
| Net Assets: | |
| Beginning of year | | | 204,568 | | | | 86,111 | | |
| End of year | | $ | 394,918 | | | $ | 204,568 | | |
Accumulated Net Investment Income
(Loss) | | $ | 520 | | | $ | (1 | ) | |
| Share Activity: | |
| Shares issued: | |
| Class A | | | 11,172 | | | | 9,359 | | |
| Class B | | | 729 | | | | 706 | | |
| Class C | | | 396 | | | | 162 | | |
| Class C2 | | | 66 | | | | 193 | | |
| Class M | | | 95 | | | | 139 | | |
| | | | 12,458 | | | | 10,559 | | |
Shares issued–reinvested from
distributions: | |
| Class A | | | 1,787 | | | | – | | |
| Class B | | | 230 | | | | – | | |
| Class C | | | 26 | | | | – | | |
| Class C2 | | | 61 | | | | – | | |
| Class M | | | 36 | | | | – | | |
| | | | 2,140 | | | | – | | |
| Shares redeemed: | |
| Class A | | | (1,144 | ) | | | (2,811 | ) | |
| Class B | | | (666 | ) | | | (813 | ) | |
| Class C | | | (367 | ) | | | (5 | ) | |
| Class C2 | | | (459 | ) | | | (402 | ) | |
| Class M | | | (160 | ) | | | (179 | ) | |
| | | | (2,796 | ) | | | (4,210 | ) | |
| Class level exchanges: | |
| Class C | | | 1,197 | | | | – | | |
| Class C2 | | | (799 | ) | | | – | | |
| Class M | | | (396 | ) | | | – | | |
| | | | 2 | | | | – | | |
| Automatic conversions: | |
| Class A | | | 4 | | | | – | | |
| Class B | | | (4 | ) | | | – | | |
| | | | – | | | | – | | |
Net increase (decrease) in shares
outstanding: | |
| Class A | | | 11,819 | | | | 6,548 | | |
| Class B | | | 289 | | | | (107 | ) | |
| Class C | | | 1,252 | | | | 157 | | |
| Class C2 | | | (1,131 | ) | | | (209 | ) | |
| Class M | | | (425 | ) | | | (40 | ) | |
| | | | 11,804 | | | | 6,349 | | |
The notes to the financial statements are an integral part of this report.
Transamerica IDEX Mutual Funds
Annual Report 2004
8
TA IDEX Transamerica Small/Mid Cap Value
FINANCIAL HIGHLIGHTS
| | | | | For a share of beneficial interest outstanding throughout each period | |
| | | | | Net Asset | | Investment Operations | | Distributions | | Net Asset | |
| | | For the
Period
Ended (d)(g) | | Value,
Beginning
of Period | | Net
Investment
Income (Loss) | | Net Realized
and Unrealized
Gain (Loss) | | Total
Operations | | From Net
Investment
Income | | From Net
Realized
Gains | | Total
Distributions | | Value,
End
of Period | |
| Class A | | 10/31/2004 | | $ | 12.94 | | | $ | 0.04 | | | $ | 2.56 | | | $ | 2.60 | | | $ | – | | | $ | (1.22 | ) | | $ | (1.22 | ) | | $ | 14.32 | | |
| | | 10/31/2003 | | | 9.09 | | | | (0.11 | ) | | | 3.96 | | | | 3.85 | | | | – | | | | – | | | | – | | | | 12.94 | | |
| | | 10/31/2002 | | | 10.12 | | | | (0.07 | ) | | | (0.96 | ) | | | (1.03 | ) | | | – | | | | – | | | | – | | | | 9.09 | | |
| | | 10/31/2001 | | | 10.00 | | | | (0.02 | ) | | | 0.14 | | | | 0.12 | | | | – | | | | – | | | | – | | | | 10.12 | | |
| Class B | | 10/31/2004 | | | 12.73 | | | | (0.06 | ) | | | 2.52 | | | | 2.46 | | | | – | | | | (1.22 | ) | | | (1.22 | ) | | | 13.97 | | |
| | | 10/31/2003 | | | 8.98 | | | | (0.17 | ) | | | 3.92 | | | | 3.75 | | | | – | | | | – | | | | – | | | | 12.73 | | |
| | | 10/31/2002 | | | 10.08 | | | | (0.19 | ) | | | (0.91 | ) | | | (1.10 | ) | | | – | | | | – | | | | – | | | | 8.98 | | |
| | | 10/31/2001 | | | 10.00 | | | | (0.05 | ) | | | 0.13 | | | | 0.08 | | | | – | | | | – | | | | – | | | | 10.08 | | |
| Class C | | 10/31/2004 | | | 12.73 | | | | (0.01 | ) | | | 2.46 | | | | 2.45 | | | | – | | | | (1.22 | ) | | | (1.22 | ) | | | 13.96 | | |
| | | 10/31/2003 | | | 9.01 | | | | (0.18 | ) | | | 3.90 | | | | 3.72 | | | | – | | | | – | | | | – | | | | 12.73 | | |
| | | | | | | Ratios/Supplemental Data | |
| | | For the
Period | | Total | | Net Assets,
End of
Period | | Ratio of Expenses
to Average
Net Assets (a) | | Net Investment
Income (Loss)
to Average | | Portfolio
Turnover | |
| | | Ended (g) | | Return (c) | | (000's) | | Net (e) | | Total (f) | | Net Assets (a) | | Rate (b) | |
| Class A | | 10/31/2004 | | | 20.61 | % | | $ | 334,763 | | | | 1.32 | % | | | 1.32 | % | | | 0.31 | % | | | 81 | % | |
| | | 10/31/2003 | | | 42.35 | | | | 149,557 | | | | 1.73 | | | | 1.73 | | | | (1.04 | ) | | | 55 | | |
| | | 10/31/2002 | | | (10.18 | ) | | | 45,500 | | | | 1.85 | | | | 1.98 | | | | (0.88 | ) | | | 22 | | |
| | | 10/31/2001 | | | 1.20 | | | | 6,536 | | | | 1.85 | | | | 3.56 | | | | (0.32 | ) | | | 8 | | |
| Class B | | 10/31/2004 | | | 19.85 | | | | 40,477 | | | | 1.97 | | | | 1.97 | | | | (0.43 | ) | | | 81 | | |
| | | 10/31/2003 | | | 41.76 | | | | 33,196 | | | | 2.38 | | | | 2.38 | | | | (1.69 | ) | | | 55 | | |
| | | 10/31/2002 | | | (10.91 | ) | | | 24,391 | | | | 2.50 | | | | 2.63 | | | | (1.53 | ) | | | 22 | | |
| | | 10/31/2001 | | | 0.80 | | | | 7,604 | | | | 2.50 | | | | 4.21 | | | | (0.97 | ) | | | 8 | | |
| Class C | | 10/31/2004 | | | 19.78 | | | | 19,678 | | | | 2.07 | | | | 2.07 | | | | (0.02 | ) | | | 81 | | |
| | | 10/31/2003 | | | 41.29 | | | | 1,995 | | | | 2.38 | | | | 2.38 | | | | (1.69 | ) | | | 55 | | |
NOTES TO FINANCIAL HIGHLIGHTS
(a) Annualized.
(b) Not annualized for periods of less than one year.
(c) Total Return has been calculated for the applicable period without deduction of a sales load, if any, on an initial purchase. Periods of less than one year are not annualized.
(d) Per share information is calculated based on average number of shares outstanding.
(e) Ratio of Net Expenses to Average Net Assets is net of fee waivers and reimbursements by the investment adiviser, if any (see note 2).
(f) Ratio of Total Expenses to Average Net Assets includes all expenses before fee waivers and reimbursements by the investment adviser.
(g) TA IDEX Transamerica Small/Mid Cap Value ("the Fund") commenced operations on April 2, 2001. The inception date for the Fund's offering of share Class L was November 11, 2002. Class L was renamed Class C on March 1, 2004. (See Note 1).
The notes to the financial statements are an integral part of this report.
Transamerica IDEX Mutual Funds
Annual Report 2004
9
TA IDEX Transamerica Small/Mid Cap Value
NOTES TO FINANCIAL STATEMENTS
At October 31, 2004
(all amounts in thousands)
NOTE 1. ORGANIZATION AND SIGNIFICANT ACCOUNTING POLICIES
Transamerica IDEX Mutual Funds, formerly IDEX Mutual Funds, is a Massachusetts business trust registered under the Investment Company Act of 1940, as amended (the "1940 Act"), as an open-end management investment company. TA IDEX Transamerica Small/Mid Cap Value ("the Fund"), part of Transamerica IDEX Mutual Funds, began operations on April 2, 2001.
On March 1, 2004, the Fund changed its name from IDEX Isabelle Small Cap Value to TA IDEX Transamerica Small/Mid Cap Value and changed its sub-adviser from Ironwood Capital Management, LLC to Transamerica Investment Management, LLC.
In the normal course of business, the Fund enters into contracts that contain a variety of representations and warranties, which provide general indemnifications. The Fund's maximum exposure under these arrangements is unknown, as this would involve future claims that may be made against the Fund and/or its affiliates that have not yet occurred. However, based on experience, the Fund expects the risk of loss to be remote.
See the Prospectus and Statement of Additional Information for a description of the Fund's investment objective.
In preparing the Fund's financial statements in accordance with accounting principles generally accepted in the United States of America ("GAAP"), estimates or assumptions (which could differ from actual results) may be used that affect reported amounts and disclosures. The following policies were consistently followed by the Fund, in accordance with GAAP.
Multiple class operations and expenses: The Fund currently offers three classes of shares, each with a public offering price that reflects
different sales charges, if any, and expense levels. All shares designated as Class C shares prior to March 1, 2004, were renamed as Class C2 shares on that date. All shares designated as Class L shares prior to March 1, 2004, were renamed as Class C shares with different sales charges than the previous Class L shares. On June 15, 2004, Class C2 shares merged into Class C. On September 24, 2004, Class M shares merged into Class C. Class B shares will convert to Class A shares eight years after purchase. Income, non-class specific expenses and realized and unrealized gains and losses, are allocated daily to each class, based upon the value of shares outstanding method as permitted under Rule 18f-3 of the 1940 Act. Each class bears its own specific expenses as well as a portion of general, common expenses.
Pricing of shares: The Fund prices its shares on the basis of the net asset value of each class of shares of the Fund, which is determined as of the close of the New York Stock Exchange ("NYSE") (generally 4:00 p.m. Eastern Time) on each day on which the NYSE is open for trading (other than a day on which there are insufficient changes in the value of the Fund's portfolio securities to materially affect the Fund's net asset value or a day on which no shares are tendered for redemption and no order to purchase any shares is received).
Security valuations: Fund investments traded on an exchange are valued at the closing price on the day of valuation on the exchange where the security is principally traded. With respect to securities traded on NASDAQ NMS, such closing price may be last the reported sales price or the NASDAQ Official Closing Price.
Securities traded in the over-the-counter market and listed securities for which no sale was reported on that date are valued at the last quoted bid price.
Debt securities are valued by independent pricing services; however, those that mature in sixty days or less are valued at amortized cost, which approximates market.
Investment company securities are valued at net asset value of the underlying portfolio.
Other securities for which quotations are not readily available are valued at fair market value as determined in good faith using guidelines adopted by the Board of Trustees of the Fund, under the supervision of the Fund's Valuation Committee.
Cash: The Fund may leave cash overnight in its cash account with the custodian, Investors Bank & Trust Company ("IBT"). IBT has been contracted on behalf of the Fund to invest the excess cash into a savings account, which at October 31, 2004, was paying an interest rate of 1.30%.
Throughout the year, the Fund may have a cash overdraft balance. A fee is incurred on this overdraft, calculated by multiplying the overdraft by a rate based on the federal funds rate. This fee is included in Custody fees in the Statement of Operations.
Repurchase agreements: The Fund is authorized to enter into repurchase agreements. The Fund, through IBT, receives delivery of the underlying securities, the value of which at the time of purchase is required to be an amount equal to at least 100% of the resale price. Repurchase agreements involve the risk that the seller will fail to repurchase the security, as agreed. In that case, the Fund will bear the risk of value fluctuations until the security can be sold and may encounter delays and incur costs in liquidating the security. In the event of bankruptcy or insolvency of the seller, delays and costs may be incurred.
Commission recapture: The sub-adviser, to the extent consistent with the best execution and usual commission rate policies and practices, may place security transactions of the Fund with broker/dealers with which Transamerica IDEX Mutual Funds has established a Commission Recapture Program. A Commission Recapture Program
Transamerica IDEX Mutual Funds
Annual Report 2004
10
TA IDEX Transamerica Small/Mid Cap Value
NOTES TO FINANCIAL STATEMENTS (continued)
At October 31, 2004
(all amounts in thousands)
NOTE 1.–(continued)
is any arrangement under which a broker/dealer applies a portion of the commissions received by such broker/dealer on the security transactions to the Fund. In no event will commissions paid by the Fund be used to pay expenses that would otherwise be borne by any other funds within Transamerica IDEX Mutual Funds, or by any other party.
Recaptured commissions during the year ended October 31, 2004, of $218 are included in net realized gains in the Statement of Operations.
Securities lending: The Fund may lend securities to enhance fund earnings from investing cash collateral in making such loans to qualified borrowers (typically broker/dealers). The Fund has engaged its custodian bank, IBT, as a lending agent to administer its securities lending program. IBT earned $94 of program income for its services. When the Fund makes a security loan, it receives cash collateral as protection against the risk that the borrower will default on the loan, and records an asset for the cash invested collateral and a liability for the return of the collateral.
Securities on loan are included in Investment securities at value in the Statement of Assets and Liabilities and remain on the Schedule of Investments.
Loans of securities are required to be secured by collateral at least equal to 102% of the value of the securities at inception of the loan, and not less then 100% thereafter. The Fund may invest cash collateral in short-term money market instruments including: U.S. Treasury Bills, U.S. agency obligations, commercial paper, money market mutual funds, repurchase agreements and other highly rated, liquid investments. During the life of securities loans, the collateral and securities loaned remain subject to fluctuation in value. IBT marks to market securities loaned and the collateral each business day. If additional collateral is due (at least $1), IBT collects additional cash collateral from the borrowers. Although securities loaned will be fully collateralized at all times, IBT may experience delays in, or may be prevented from, recovering the collateral on behalf of the Fund. The Fund may recall a loa ned security position at any time from the borrower through IBT. In the event the borrower fails to timely return a recalled security, IBT may indemnify the Fund by purchasing replacement securities for the Fund at its own expense and claiming the collateral to fund such a purchase. IBT absorbs the loss if the collateral value is not sufficient to cover the cost of the replacement securities. If replacement securities are not available, IBT will credit the equivalent cash value to the Fund.
While a security is on loan, the Fund does not have the right to vote that security. However, if time permits, the Fund will attempt to recall a security on loan and vote the proxy.
Income from securities lending is included in the Statement of Operations. The amount of collateral and value of securities on loan are included in the Statement of Assets and Liabilities as well as in the Schedule of Investments.
Security transactions and investment income: Security transactions are recorded on the trade date. Security gains and losses are calculated on the specific identification basis. Dividend Income is recorded on the ex-dividend date or, in the case of foreign securities, as soon as the Fund is informed of the ex-dividend date. Interest income, including accretion of discounts and amortization of premiums, is recorded on the accrual basis commencing on the settlement date.
Account maintenance fees: If the shareholder account balance falls below $1 by either shareholder action or as a result of market action, a $25 (not in thousands) fee is assessed every year until the balance reaches $1. The fee is assessed by redeeming shares in the shareholder's account.
No fee will be charged under the following conditions:
• accounts opened within the preceding 24 months
• accounts with an active monthly Automatic Investment Plan ($50 (not in thousands) minimum per fund)
• accounts owned by an individual which, when combined by social security number, have a balance of $5 or more
• accounts owned by individuals in the same household (by address) that have a combined balance of $5 or more
• UTMA/UGMA accounts
• Fiduciary accounts
• B-share accounts whose shares have started to convert to A-shares accounts (as long as combined value of both accounts is at least $1)
For the year ended October 31, 2004, this fee totaled less than $1. These fees are included in Paid in Capital in the Statement of Assets and Liabilities.
Redemption fees: A short-term trading redemption fee may be assessed on any fund shares in a fund account that are sold during the first five (5) New York Stock Exchange trading days following their purchase date. This redemption fee will equal 2% of the amount redeemed and shares held the longest will be treated as being redeemed first and shares held the shortest as being redeemed last. For the year ended October 31, 2004, the Fund received no redemption fees.
Dividend distributions: Distributions to shareholders are recorded on the ex-dividend date and are determined in accordance with Federal income tax regulations which may differ from GAAP.
Transamerica IDEX Mutual Funds
Annual Report 2004
11
TA IDEX Transamerica Small/Mid Cap Value
NOTES TO FINANCIAL STATEMENTS (continued)
At October 31, 2004
(all amounts in thousands)
NOTE 2. RELATED PARTY TRANSACTIONS
AEGON/Transamerica Fund Advisers, Inc. ("ATFA") is the Fund's investment adviser. AEGON/Transamerica Fund Services, Inc. ("ATFS") is the Fund's administrator. AFSG Securities Corp. ("AFSG") is the Fund's distributor/principal underwriter. AEGON/Transamerica Investor Services, Inc. ("ATIS") is the Fund's transfer agent. ATIS and AFSG are 100% owned by AUSA Holding Company ("AUSA"). ATFA is a directly owned subsidiary of Western Reserve Life Assurance Co. of Ohio (78%) ("WRL") and AUSA (22%). ATFS is a wholly owned subsidiary of WRL. AUSA and WRL are wholly owned indirect subsidiaries of AEGON NV, a Netherlands corporation.
Transamerica Investment Management, LLC is both an affiliate of the Fund and a sub-adviser to the Fund.
The following schedule reflects the percentage of fund assets owned by affiliated mutual funds (i.e., through the assets allocation funds):
| | | Net
Assets | | % of
Net Assets | |
TA IDEX Asset Allocation–
Conservative Portfolio | | $ | 12,282 | | | | 3 | % | |
TA IDEX Asset Allocation–
Growth Portfolio | | | 105,907 | | | | 27 | % | |
TA IDEX Asset Allocation–
Moderate Growth Portfolio | | | 116,908 | | | | 30 | % | |
TA IDEX Asset Allocation–
Moderate Portfolio | | | 67,173 | | | | 17 | % | |
| Total | | $ | 302,270 | | | | 77 | % | |
Investment advisory fee: The Fund pays management fees to ATFA based on average daily net assets ("ANA") at the following breakpoints:
From November 1, 2003 to February 28, 2004:
0.90% of the first $200 million of ANA
0.85% of ANA over $200 million
From March 1, 2004 on:
0.80% of the first $500 million of ANA
0.75% of ANA over $500 million
ATFA has contractually agreed to waive its advisory fee and will reimburse the Fund to the extent that operating expenses, excluding 12b-1 fees, exceed the following stated annual limit:
1.40% Expense Limit
If total fund expenses fall below the annual expense limitation agreement agreed to by the adviser within the succeeding three years, the Fund may be required to pay that adviser a portion or all of the waived advisory fees.
There were no amounts waived, reimbursed or recaptured during the fiscal year ended October 31, 2004. There are no amounts subject to recapture at October 31, 2004.
Distribution and service fees: The Fund has a 12b-1 distribution plan under the 1940 Act pursuant to which an annual fee, based on average daily net assets, is paid to the distributor for various disbursements such as broker-dealer account servicing fees and other promotional expenses of the Fund. The Fund is authorized under the 12b-1 plan to pay fees on each class up to the following limits:
| Class A | | | 0.35 | % | |
| Class B | | | 1.00 | % | |
| Class C | | | 1.00 | % | |
| Class C2 | | | 1.00 | % | |
| Class M | | | 0.90 | % | |
Class C2 and Class M merged into Class C on June 15, 2004 and September 24, 2004, respectively.
In the case the Fund or a class of shares of the Fund is closed to new investors or investments, the Fund is authorized to pay 12b-1 fees for past sales and distribution efforts and present and past investor services.
Underwriter commissions relate to front-end sales charges imposed for Class A and M shares and contingent deferred sales charges from Classes B, C, M and certain A share redemptions. For the year ended October 31, 2004, the underwriter commissions were as follows:
| Received by Underwriter | | $ | 718 | | |
| Retained by Underwriter | | | 31 | | |
| Contingent Deferred Sales Charge | | | 104 | | |
Administrative services: The Fund has entered into an agreement with ATFS for financial and legal fund administration services, which includes such items as compliance, expenses, financial statements and other reporting, distributions, tax returns, prospectus preparation, board of trustees meeting support and other legal matters. The Fund pays ATFS an annual fee of 0.015% of average net assets. The Legal fees on the Statement of Operations are for fees paid to external legal counsel.
The Fund paid ATFS $50 for the year ended October 31, 2004.
Transfer agent fees: The Fund pays ATIS an annual per-account charge of $20 (not in thousands) for each open account and $1.63 (not in thousands) for each closed account. There is no new account charge. The transfer agent fees on the Statement of Operations are made up of fees paid to ATIS and costs associated with shareholder statements. The Fund paid ATIS $255 for the year ended October 31, 2004.
Transamerica IDEX Mutual Funds
Annual Report 2004
12
TA IDEX Transamerica Small/Mid Cap Value
NOTES TO FINANCIAL STATEMENTS (continued)
At October 31, 2004
(all amounts in thousands)
NOTE 2.–(continued)
Deferred compensation plan: Each eligible Fund Trustee may elect participation in the Deferred Compensation Plan ("the Plan"). Under the Plan, such Trustees may defer payment of a percentage of their total fees earned as a Fund Trustee. These deferred amounts may be invested in any Transamerica IDEX Mutual Fund. At October 31, 2004, the value of invested plan amount was $3. Invested plan amounts and the total liability for deferred compensation to the Trustees under the Plan at October 31, 2004, are included in the accompanying Statement of Assets and Liabilities.
NOTE 3. INVESTMENT TRANSACTIONS
The cost of securities purchased and proceeds from securities sold
(excluding short-term securities) for the year ended October 31, 2004, were as follows:
| Purchases of securities: | | | |
| Long-Term excluding U.S. Government | | $ | 391,684 | | |
| U.S. Government | | | – | | |
| Proceeds from maturities and sales of securities: | | | |
| Long-Term excluding U.S. Government | | | 238,868 | | |
| U.S. Government | | | – | | |
NOTE 4. FEDERAL INCOME TAX MATTERS
The Fund has not made any provision for federal income or excise taxes due to its policy to distribute all of its taxable income and capital gains to its shareholders and otherwise qualify as a regulated investment company under the Internal Revenue Code. Income and capital gain distributions are determined in accordance with income tax regulations, which may differ from GAAP. These differences are primarily due to differing treatment for items including, but not limited to, wash sales.
The tax character of distributions paid may differ from the character of distributions shown in the Statements of Changes in Net Assets due to short-term gains being treated as ordinary income for tax purposes. The tax character of distributions paid during 2003 and 2004 was as follows:
| 2003 Distributions paid from: | | | |
| Ordinary Income | | $ | – | | |
| Long-term capital gain | | | – | | |
| 2004 Distributions paid from: | | | |
| Ordinary Income | | | 16,974 | | |
| Long-term capital gain | | | 12,572 | | |
The tax basis components of distributable earnings as of October 31, 2004, are as follows:
| Undistributed Ordinary Income | | $ | 7,087 | | |
| Undistributed Long-term Capital Gains | | $ | 5,097 | | |
| Capital Loss Carryforward | | $ | – | | |
| Net Unrealized Appreciation (Depreciation) | | $ | 30,816 | | |
The aggregate cost of investments and composition of unrealized appreciation (depreciation) for federal income tax purposes as of October 31, 2004, are as follows:
| Federal Tax Cost Basis | | $ | 417,289 | | |
| Unrealized Appreciation | | $ | 30,816 | | |
| Unrealized (Depreciation) | | | – | | |
| Net Unrealized Appreciation (Depreciation) | | $ | 30,816 | | |
NOTE 5. OTHER MATTERS
Transamerica IDEX Mutual Funds ("TA IDEX"), and certain of its affiliated entities, have received requests for information from the Staff of the Securities and Exchange Commission in connection with market timing and late trading within the funds. TA IDEX and the affiliated entities have voluntarily cooperated in the investigation and have been providing the information as requested.
Transamerica IDEX Mutual Funds
Annual Report 2004
13
Report of Independent Registered Certified Public Accounting Firm
To the Board of Trustees and Shareholders of
TA IDEX Transamerica Small/Mid Cap Value
In our opinion, the accompanying statement of assets and liabilities, including the schedule of investments, and the related statements of operations and of changes in net assets and the financial highlights present fairly, in all material respects, the financial position of TA IDEX Transamerica Small/Mid Cap Value (the "Fund") (one of the portfolios constituting the Transamerica IDEX Mutual Funds) at October 31, 2004, the results of its operations for the year then ended, the changes in its net assets for each of the two years in the period then ended and the financial highlights for each of the periods indicated, in conformity with accounting principles generally accepted in the United States of America. These financial statements and financial highlights (hereafter referred to as "financial statements") are the responsibility of the Fund's management; our responsibility is to express an opi nion on these financial statements based on our audits. We conducted our audits of these financial statements in accordance with the standards of the Public Company Accounting Oversight Board (United States). Those standards require that we plan and perform the audit to obtain reasonable assurance about whether the financial statements are free of material misstatement. An audit includes examining, on a test basis, evidence supporting the amounts and disclosures in the financial statements, assessing the accounting principles used and significant estimates made by management, and evaluating the overall financial statement presentation. We believe that our audits, which included confirmation of securities at October 31, 2004 by correspondence with the custodian and brokers, provide a reasonable basis for our opinion.

PricewaterhouseCoopers LLP
Tampa, Florida
December 28, 2004
Transamerica IDEX Mutual Funds
Annual Report 2004
14
TA IDEX Transamerica Small/Mid Cap Value
SUPPLEMENTAL INFORMATION (unaudited)
TAX INFORMATION
For tax purposes, the Fund has made a Long-Term Capital Gain Designation of $12,572 for the year ended October 31, 2004.
For dividends paid during the year ended October 31, 2004, the Fund designated $4,592 as qualified dividend income.
For corporate shareholders, 20% of investment income (dividend income plus short-term gains, if any) qualifies for the dividends received deduction.
The information and distributions reported herein may differ from the information and distributions taxable to the shareholders for the calendar year ending December 31, 2004. Complete information will be computed and reported in conjunction with your 2004 Form 1099-DIV.
RESULTS OF SHAREHOLDER PROXY
At a special meeting of Class M shareholders of each series of Transamerica IDEX (except TA IDEX Federated Tax Exempt and TA IDEX Protected Principal Stock), as listed above, held on September 2, 2004, the results of the Proposal were as follows:
Proposal 1: Approval of a conversion of Class M shares into Class C shares of the Funds, which will result in bearing the distribution and service fees payable under the 12b-1 Plan of Distribution for the Class C shares of the Funds.
| For | | Against | | Abstentions/Broker Non-Votes | |
| | 80.34 | % | | | 9.18 | % | | | 10.48 | % | |
Transamerica IDEX Mutual Funds
Annual Report 2004
15
TA IDEX Transamerica Value Balanced
MARKET ENVIRONMENT
The twelve months ended October 31, 2004, were generally positive for both value stocks and the bond market. The Russell 1000 Value Index ("Russell 1000") gained 15.45%, largely due to unusual strength among energy and materials/processing stocks as oil prices climbed and developing nations' demand for basic materials continued to grow. Meanwhile, areas sensitive to consumer spending (e.g., technology and healthcare) retreated as data suggested U.S. economic growth was not all that robust. In the end, the spectacular performance of energy-related stocks carried the day.
In the fixed-income markets, yields for short-term securities rose in anticipation of the Federal Reserve Board's interest-rate hikes, and long-term yields declined on the expectation that inflation would remain moderate. Corporate bonds, both investment grade and high yield, outperformed Treasuries as corporate profitability improved. The Lehman Brothers Intermediate U.S. Government/Credit Index ("LBIGC") returned 4.33%.
PERFORMANCE
For the year ended October 31, 2004, TA IDEX Transamerica Value Balanced, Class A returned 7.04%. By comparison its primary and secondary benchmarks, the LBIGC and the Russell 1000, returned 4.33% and 15.45%, respectively.
STRATEGY REVIEW
Throughout the period, we maintained a neutral asset allocation, approximately 60% equities and 40% bonds, reflecting a moderately constructive outlook on economic growth. We believed that energy-stock prices would firm as the economy expanded but did not anticipate their remarkable gains. Even if we had, we might not have altered our investment position dramatically. In our view, the energy-related sectors are too commodity-like in nature, with exceptionally high levels of volatility that are largely beyond control of company management. Therefore, we maintain a core investment position in energy companies, such as Exxon Mobil Corporation, but do not market time the sector as a whole.
Making strongly positive contributions to performance were Sprint Corporation (FON Group) ("Sprint"), where our patience and faith in a new management team were rewarded; and FleetBoston Financial Corporation ("FleetBoston"), a stock that faltered in 2003 but rebounded quickly when the company was acquired by Bank of America Corporation in mid-period.
Conversely, we were disappointed by the near-term results for pharmaceutical company Merck & Co., Inc. ("Merck"). As with other stocks in the portfolio that have suffered setbacks in the past, such as Sprint, we have reviewed the particulars and opted to stay the course. We were caught off guard by Merck's September 30th announcement that it would withdraw its arthritis treatment, Vioxx, from the market. Since then, the stock price has declined approximately 45%. However, when we weigh this falloff in price against other facts, we consider Merck a "buy" opportunity. Vioxx represented just 11% of sales. Even without that revenue, we believe Merck is well positioned to pay its very attractive dividend. Merck is AA-rated, reflecting what we believe is an exceptionally strong balance sheet. And, importantly, we believe the market has overestimated the litigation risk associated with Vioxx. Like Sprint and FleetBoston, we believe resolution of the company's issues will take time and are willing to be patient.
The portfolio's fixed-income portfolio outperformed the benchmark LBIGC, due to an overweighting in investment-grade and high-yield corporate bonds. Throughout the period, we emphasized basic materials industries, such as metals, energy and paper and forest products.
John C. Riazzi, CFA
Heidi Y. Hu, CFA
Gary U. Rolle, CFA
Co-Fund Managers
Transamerica Investment Management LLC
Transamerica IDEX Mutual Funds
Annual Report 2004
1
TA IDEX Transamerica Value Balanced
Comparison of change in value of $10,000 investment in Class A shares and its comparative index.

Average Annual Total Return for Periods Ended 10/31/04
| | | 1 year | | 5 years | | From
Inception | | Inception
Date | |
| Class A (NAV) | | | 6.99 | % | | | 3.98 | % | | | 6.08 | % | | 10/1/95 | |
| Class A (POP) | | | 1.11 | % | | | 2.98 | % | | | 5.42 | % | | 10/1/95 | |
| LBIGC1 | | | 4.33 | % | | | 7.22 | % | | | 6.66 | % | | 10/1/95 | |
| Russell 1000 Value1 | | | 15.45 | % | | | 3.49 | % | | | 11.05 | % | | 10/1/95 | |
| Class B (NAV) | | | 6.23 | % | | | 3.44 | % | | | 5.37 | % | | 10/1/95 | |
| Class B (POP) | | | 1.23 | % | | | 3.27 | % | | | 5.37 | % | | 10/1/95 | |
| Class C (NAV) | | | 6.31 | % | | | – | | | | 13.06 | % | | 11/11/02 | |
| Class C (POP) | | | 5.31 | % | | | – | | | | 13.06 | % | | 11/11/02 | |
NOTES
1 The Lehman Brothers Intermediate U.S. Government/Credit (LBIGC) Index and Russell 1000 Value (Russell 1000) Index are unmanaged indices used as a general measure of market performance. Calculations assume dividends and capital gains are reinvested and do not include any managerial expenses. From inception calculation is based on life of Class A shares. Source: Standard & Poor's Micropal®© Micropal, Inc. 2004 – 1-800-596-5323 – http://www.micropal.com.
The performance data presented represents past performance, future results may vary. Performance data does not reflect the deduction of taxes that would be paid on fund distributions or the redemption of fund shares. Investment return and principal value will fluctuate so that an investor's shares, when redeemed, may be worth more or less than their original cost. Current performance may be lower or higher than performance quoted.
Public Offering Price (POP) returns include the reinvestment of dividends and capital gains and reflect the maximum sales charge of 5.5% for A shares or the maximum applicable contingent deferred sales charge (5% in the 1st year, decreasing to 0% after 6 years) for Class B shares and 1% (during the first 12 months) for Class C shares. Shares purchased prior to March 1, 2004 are subject to a maximum applicable contingent deferred sales charge (5% in the 1st year, decreasing to 0% after 7 years) for Class B shares and (2% in the 1st year, decreasing to 0% after 2 years) for Class C shares. Ne t Asset Value (NAV) returns include the reinvestment of dividends and capital gains but do not reflect any sales charges.
This material must be preceded or accompanied by a current prospectus, which includes specific contents regarding the investment objectives and policies of this fund.
Transamerica IDEX Mutual Funds
Annual Report 2004
2
TA IDEX Transamerica Value Balanced
UNDERSTANDING YOUR FUND'S EXPENSES (unaudited)
SHAREHOLDER EXPENSES
The following Example is intended to help you understand your ongoing costs (in dollars and cents) of investing in a Fund and to compare these costs with the ongoing costs of investing in other funds.
The Example is based on an investment of $1,000 invested at the beginning of the period and held for the entire period from May 1, 2004 to October 31, 2004.
ACTUAL EXPENSES
The first line in the table below provides information about actual account values and actual expenses. You may use the information in this line, together with the amount you invested, to estimate the expenses that you paid over the period. Simply divide your account value by $1,000 (for example, an $8,600 account value divided by $1,000 = 8.6), then multiply the result by the number in the first line of your Fund under the heading entitled "Expenses Paid During Period" to estimate the expenses you paid on your account during this period.
HYPOTHETICAL EXAMPLE FOR COMPARISON PURPOSES
The second line in the table below provides information about hypothetical account values and hypothetical expenses based on each Fund's actual expense ratio and an assumed rate of return of 5% per year before expenses, which is not the Fund's actual return. The hypothetical account values and expenses may not be used to estimate the actual ending account balance or expenses you paid for the period. You may use this information to compare the ongoing costs of investing in your Fund and other funds. To do so, compare this 5% hypothetical example with the 5% hypothetical examples that appear in the shareholder reports of the other funds.
Please note that the expenses shown in the table are meant to highlight your ongoing costs only and do not reflect any transactional costs, such as sales charges, redemption fees, brokerage commissions paid on purchases and sales of fund shares. Therefore, the second line under each Fund in the table is useful in comparing ongoing costs only, and will not help you determine the relative total costs of owning different funds. In addition, note that the expenses shown in the table are meant to highlight your ongoing costs and do not reflect any transaction costs.
| | | Beginning
Account
Value | | Ending
Account
Value | | Annualized
Expense
Ratio | | Expenses Paid
During
Period (a) | |
| Class A | |
| Actual | | $ | 1,000.00 | | | $ | 1,037.10 | | | | 1.56 | % | | $ | 7.99 | | |
| Hypothetical (b) | | | 1,000.00 | | | | 1,017.29 | | | | 1.56 | | | | 7.91 | | |
| Class B | |
| Actual | | | 1,000.00 | | | | 1,032.30 | | | | 2.21 | | | | 11.29 | | |
| Hypothetical (b) | | | 1,000.00 | | | | 1,014.23 | | | | 2.21 | | | | 11.19 | | |
| Class C | |
| Actual | | | 1,000.00 | | | | 1,032.30 | | | | 2.20 | | | | 11.24 | | |
| Hypothetical (b) | | | 1,000.00 | | | | 1,014.08 | | | | 2.20 | | | | 11.14 | | |
(a) Expenses are calculated using each Fund's annualized expense ratio (as disclosed in the table), multiplied by the average account value for the period, multiplied by number of days in the period (184 days), and divided by the number of days in the year (366 days).
(b) 5% return per year before expenses.
GRAPHIC PRESENTATION OF SCHEDULE OF INVESTMENTS By Bond Sector with Equity Breakdown
At October 31, 2004
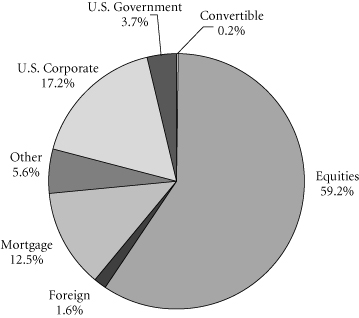
This chart shows the percentage breakdown by sector of the Fund's total investment securities.
Transamerica IDEX Mutual Funds
Annual Report 2004
3
TA IDEX Transamerica Value Balanced
SCHEDULE OF INVESTMENTS
At October 31, 2004
(all amounts except share amounts in thousands)
| | | Principal | | Value | |
| U.S. GOVERNMENT OBLIGATIONS (3.8%) | |
U.S. Treasury Bond
5.38%, due 02/15/2031 (a)(b) | | | $2,845 | | | | $3,090 | | |
U.S. Treasury Note
4.25%, due 08/15/2014 (b) | | | 25 | | | | 26 | | |
| Total U.S. Government Obligations (cost: $2,856) | | | | | | | 3,116 | | |
| U.S GOVERNMENT AGENCY OBLIGATIONS (13.2%) | |
FHLMC
5.00%, due 04/01/2018 | | | 320 | | | | 327 | | |
| 5.50%, due 12/01/2018 | | | 818 | | | | 848 | | |
| 5.50%, due 08/01/2019 | | | 116 | | | | 120 | | |
| 7.00%, due 10/01/2028 | | | 134 | | | | 143 | | |
| 6.50%, due 04/01/2029 | | | 136 | | | | 143 | | |
| 6.00%, due 09/01/2033 | | | 175 | | | | 181 | | |
| 6.00%, due 11/01/2033 | | | 850 | | | | 881 | | |
| 6.00%, due 12/01/2033 | | | 817 | | | | 847 | | |
| 6.00%, due 01/01/2034 | | | 451 | | | | 467 | | |
| 6.00%, due 08/01/2034 | | | 388 | | | | 402 | | |
FNMA
5.00%, due 05/01/2018 | | | 176 | | | | 180 | | |
| 5.00%, due 04/01/2019 | | | 193 | | | | 197 | | |
| 5.50%, due 07/01/2019 | | | 171 | | | | 178 | | |
| 5.50%, due 07/01/2019 | | | 890 | | | | 923 | | |
| 6.00%, due 04/01/2033 | | | 452 | | | | 469 | | |
| 6.00%, due 10/01/2033 | | | 272 | | | | 282 | | |
| 6.00%, due 01/01/2034 | | | 291 | | | | 303 | | |
| 6.00%, due 01/01/2034 | | | 354 | | | | 368 | | |
| 6.00%, due 02/01/2034 | | | 1,220 | | | | 1,267 | | |
| 6.00%, due 06/01/2034 | | | 476 | | | | 494 | | |
| 6.00%, due 08/01/2034 | | | 759 | | | | 788 | | |
| 6.00%, due 10/01/2034 | | | 289 | | | | 300 | | |
GNMA
6.50%, due 10/15/2027 | | | 148 | | | | 157 | | |
| 6.00%, due 06/15/2034 | | | 391 | | | | 407 | | |
Total U.S Government Agency Obligations
(cost: $10,587) | | | | | | | 10,672 | | |
| CORPORATE DEBT SECURITIES (19.6%) | |
| Aerospace (0.3%) | |
Textron Financial Corp., Series E
2.69%, due 10/03/2006 | | | 250 | | | | 248 | | |
| Amusement & Recreation Services (0.9%) | |
Harrah's Operating Co., Inc.
5.50%, due 07/01/2010 | | | 700 | | | | 730 | | |
| Beverages (0.3%) | |
Cia Brasileira de Bebidas
8.75%, due 09/15/2013 | | | 25 | | | | 28 | | |
| | | Principal | | Value | |
| Beverages (continued) | |
PepsiAmericas, Inc.
3.88%, due 09/12/2007 | | | $250 | | | | $253 | | |
| Business Credit Institutions (0.1%) | |
Eircom Funding
8.25%, due 08/15/2013 | | | 50 | | | | 56 | | |
| Chemicals & Allied Products (0.1%) | |
Nalco Co.
7.75%, due 11/15/2011 | | | 50 | | | | 54 | | |
| Commercial Banks (0.3%) | |
Abbey National PLC
7.35%, due 06/15/2049 (c) | | | 250 | | | | 268 | | |
| Communication (1.0%) | |
Echostar DBS Corp.
5.75%, due 10/01/2008 | | | 75 | | | | 77 | | |
SBC Communications, Inc.
5.75%, due 05/02/2006 | | | 700 | | | | 731 | | |
| Communications Equipment (0.6%) | |
Motorola, Inc.
4.61%, due 11/16/2007 | | | 500 | | | | 515 | | |
| Electric, Gas & Sanitary Services (0.1%) | |
PG&E Corp.
6.88%, due 07/15/2008 | | | 50 | | | | 54 | | |
| Food & Kindred Products (0.3%) | |
Smithfield Foods, Inc., 144A
7.00%, due 08/01/2011 | | | 200 | | | | 214 | | |
| Food Stores (0.5%) | |
Stater Brothers Holdings
8.13%, due 06/15/2012 | | | 375 | | | | 398 | | |
| Health Services (0.1%) | |
HCA, Inc., Note
7.13%, due 06/01/2006 | | | 100 | | | | 105 | | |
| Holding & Other Investment Offices (0.3%) | |
Hutchison Whampoa
International, Ltd., 144A
6.25%, due 01/24/2014 | | | 275 | | | | 286 | | |
| Hotels & Other Lodging Places (0.3%) | |
Mirage Resorts, Inc.
7.25%, due 08/01/2017 | | | 150 | | | | 156 | | |
Park Place Entertainment Corp.
7.00%, due 04/15/2013 | | | 75 | | | | 84 | | |
| Insurance (1.7%) | |
Allstate Corp. (The)
7.88%, due 05/01/2005 | | | 600 | | | | 616 | | |
International Lease Finance Corp.
5.63%, due 06/01/2007 | | | 700 | | | | 737 | | |
The notes to the financial statements are an integral part of this report.
Transamerica IDEX Mutual Funds
Annual Report 2004
4
TA IDEX Transamerica Value Balanced
SCHEDULE OF INVESTMENTS (continued)
At October 31, 2004
(all amounts except share amounts in thousands)
| | | Principal | | Value | |
| Insurance Agents, Brokers & Service (0.9%) | |
Hartford Financial Services Group, Inc.
4.63%, due 07/15/2013 (a) | | | $125 | | | | $122 | | |
Metlife, Inc.
3.91%, due 05/15/2005 | | | 600 | | | | 605 | | |
| Metal Mining (0.3%) | |
Barrick Gold Finance, Inc.
7.50%, due 05/01/2007 | | | 212 | | | | 233 | | |
| Mortgage Bankers & Brokers (0.9%) | |
Countrywide Home Loans, Inc.
5.50%, due 08/01/2006 | | | 700 | | | | 729 | | |
| Motion Pictures (0.7%) | |
News America Holdings, Inc.
7.75%, due 12/01/2045 | | | 315 | | | | 382 | | |
Time Warner, Inc.
9.13%, due 01/15/2013 | | | 125 | | | | 160 | | |
| Oil & Gas Extraction (1.6%) | |
Chesapeake Energy Corp.
7.00%, due 08/15/2014 | | | 200 | | | | 217 | | |
Husky Oil, Ltd.
8.90%, due 08/15/2028 (c) | | | 305 | | | | 353 | | |
Kerr-McGee Corp.
6.95%, due 07/01/2024 | | | 700 | | | | 771 | | |
| Personal Credit Institutions (1.1%) | |
Capital One Bank
5.00%, due 06/15/2009 | | | 750 | | | | 779 | | |
General Motors Acceptance Corp.
6.75%, due 01/15/2006 | | | 125 | | | | 129 | | |
| Petroleum Refining (0.7%) | |
Amerada Hess Corp.
7.13%, due 03/15/2033 | | | 550 | | | | 609 | | |
| Pharmaceuticals (0.8%) | |
Bristol-Myers Squibb Co.
4.75%, due 10/01/2006 | | | 600 | | | | 620 | | |
| Primary Metal Industries (0.8%) | |
Alcoa, Inc.
4.25%, due 08/15/2007 | | | 675 | | | | 694 | | |
| Printing & Publishing (1.4%) | |
Gannett Co., Inc.
5.50%, due 04/01/2007 | | | 500 | | | | 528 | | |
Viacom, Inc.
7.75%, due 06/01/2005 | | | 560 | | | | 578 | | |
| Security & Commodity Brokers (1.5%) | |
BNP U.S. Funding LLC,
Preferred–Class A, 144A
7.74%, due 12/29/2049 (c) | | | 250 | | | | 280 | | |
| | | Principal | | Value | |
| Security & Commodity Brokers (continued) | | | |
Credit Suisse First Boston
(London), Inc., 144A, Reg S
7.90%, due 05/01/2049 (c) | | | $125 | | | | $138 | | |
E*Trade Financial Corp., 144A
8.00%, due 06/15/2011 | | | 150 | | | | 158 | | |
Merrill Lynch & Co., Inc., Series B
6.13%, due 05/16/2006 | | | 600 | | | | 632 | | |
| Telecommunications (1.4%) | | | |
Cincinnati Bell, Inc.
8.38%, due 01/15/2014 (a) | | | 50 | | | | 48 | | |
Liberty Media Corp.
5.70%, due 05/15/2013 | | | 325 | | | | 328 | | |
Telefonica Europe BV
7.35%, due 09/15/2005 | | | 700 | | | | 729 | | |
| Transportation & Public Utilities (0.2%) | | | |
Magellan Midstream Partners
6.45%, due 06/01/2014 | | | 135 | | | | 147 | | |
| Transportation Equipment (0.1%) | | | |
Bombardier Recreational Products, Inc., 144A
8.38%, due 12/15/2013 (a) | | | 50 | | | | 54 | | |
| Water Transportation (0.3%) | | | |
Royal Caribbean Cruises, Ltd.
8.75%, due 02/02/2011 | | | 235 | | | | 280 | | |
| Total Corporate Debt Securities (cost: $15,473) | | | | | | | 15,913 | | |
| CONVERTIBLE BONDS (0.3%) | | | |
| Telecommunications (0.3%) | | | |
Sprint Capital Corp.
4.78%, due 08/17/2006 | | | 250 | | | | 257 | | |
| Total Convertible Bonds (cost: $254) | | | | | | | 257 | | |
| | | Shares | | Value | |
| COMMON STOCKS (61.7%) | | | |
| Amusement & Recreation Services (1.6%) | | | |
| Walt Disney Co. (a) | | | 52,200 | | | $ | 1,316 | | |
| Chemicals & Allied Products (2.5%) | | | |
| Colgate-Palmolive Co. | | | 7,000 | | | | 312 | | |
| EI Du Pont de Nemours & Co. | | | 16,000 | | | | 686 | | |
| Praxair, Inc. | | | 25,000 | | | | 1,055 | | |
| Commercial Banks (10.2%) | | | |
| Bank of America Corp. (b) | | | 98,356 | | | | 4,405 | | |
| Citigroup, Inc. | | | 15,800 | | | | 701 | | |
| Cullen/Frost Bankers, Inc. | | | 15,000 | | | | 735 | | |
| SouthTrust Corp. | | | 26,000 | | | | 1,133 | | |
| Wachovia Corp. | | | 8,000 | | | | 394 | | |
| Wells Fargo & Co. (b) | | | 15,600 | | | | 932 | | |
The notes to the financial statements are an integral part of this report.
Transamerica IDEX Mutual Funds
Annual Report 2004
5
TA IDEX Transamerica Value Balanced
SCHEDULE OF INVESTMENTS (continued)
At October 31, 2004
(all amounts except share amounts in thousands)
| | | Shares | | Value | |
| Communication (0.5%) | | | |
| COX Communications, Inc.–Class A (b)(d) | | | 11,000 | | | $ | 379 | | |
| Computer & Data Processing Services (4.0%) | | | |
| Microsoft Corp. | | | 105,100 | | | | 2,942 | | |
| Sun Microsystems, Inc. (d) | | | 60,000 | | | | 272 | | |
| Electronic & Other Electric Equipment (1.4%) | | | |
| Cooper Industries, Ltd.–Class A | | | 14,000 | | | | 895 | | |
| General Electric Co. | | | 8,000 | | | | 273 | | |
| Electronic Components & Accessories (1.9%) | | | |
| Intel Corp. | | | 51,300 | | | | 1,142 | | |
| Texas Instruments, Inc. | | | 17,000 | | | | 416 | | |
| Food & Kindred Products (4.5%) | | | |
| Altria Group, Inc. (b) | | | 50,000 | | | | 2,423 | | |
| HJ Heinz Co. | | | 29,000 | | | | 1,054 | | |
| Sara Lee Corp. | | | 8,300 | | | | 193 | | |
| Holding & Other Investment Offices (0.6%) | | | |
| Plum Creek Timber Co., Inc. | | | 13,000 | | | | 472 | | |
| Insurance (1.0%) | | | |
| American International Group, Inc. | | | 13,275 | | | | 806 | | |
| Lumber & Wood Products (0.5%) | | | |
| Louisiana-Pacific Corp. | | | 17,000 | | | | 417 | | |
| Motion Pictures (3.8%) | | | |
| Time Warner, Inc. (d) | | | 183,000 | | | | 3,045 | | |
| Oil & Gas Extraction (3.5%) | | | |
| Anadarko Petroleum Corp. (b) | | | 10,000 | | | | 674 | | |
| EOG Resources, Inc. | | | 8,000 | | | | 532 | | |
| Schlumberger, Ltd. | | | 19,300 | | | | 1,215 | | |
| Unocal Corp. | | | 10,000 | | | | 417 | | |
| Paper & Allied Products (1.1%) | | | |
| Kimberly-Clark Corp. | | | 15,000 | | | | 895 | | |
| Petroleum Refining (2.6%) | | | |
| BP PLC, Sponsored ADR | | | 9,050 | | | | 527 | | |
| ChevronTexaco Corp. | | | 4,000 | | | | 212 | | |
| Exxon Mobil Corp. | | | 28,600 | | | | 1,408 | | |
| Pharmaceuticals (6.3%) | | | |
| Bristol-Myers Squibb Co. | | | 80,000 | | | | 1,874 | | |
| Merck & Co., Inc. | | | 37,000 | | | | 1,158 | | |
| Pfizer, Inc. | | | 25,000 | | | | 724 | | |
| Schering-Plough Corp. | | | 72,580 | | | | 1,314 | | |
| Primary Metal Industries (0.6%) | | | |
| Hubbell, Inc.–Class B | | | 10,700 | | | | 489 | | |
| Railroads (1.6%) | | | |
| Union Pacific Corp. | | | 20,500 | | | | 1,291 | | |
| | | Shares | | Value | |
| Savings Institutions (1.1%) | |
| Washington Mutual, Inc. | | | 22,900 | | | $ | 886 | | |
| Security & Commodity Brokers (3.5%) | |
| Jefferies Group, Inc. | | | 27,500 | | | | 1,104 | | |
| Raymond James Financial, Inc. | | | 48,000 | | | | 1,253 | | |
| T. Rowe Price Group, Inc. | | | 8,000 | | | | 446 | | |
| Telecommunications (4.9%) | |
| Alltel Corp. | | | 21,400 | | | | 1,176 | | |
| Sprint Corp.–FON Group | | | 110,000 | | | | 2,305 | | |
| Verizon Communications, Inc. | | | 12,000 | | | | 469 | | |
| U.S. Government Agencies (4.0%) | |
| Fannie Mae | | | 46,500 | | | | 3,263 | | |
| Total Common Stocks (cost: $46,477) | | | | | | | 50,030 | | |
| | | Principal | | Value | |
| SECURITY LENDING COLLATERAL (5.9%) | |
| Debt (5.5%) | |
| Bank Notes (1.1%) | |
Bank of America
1.77%, due 12/03/2004 | | | $233 | | | | $233 | | |
| 1.88%, due 12/23/2004 | | | 78 | | | | 78 | | |
| 1.77%, due 01/18/2005 | | | 156 | | | | 156 | | |
Canadian Imperial Bank of Commerce
1.86%, due 11/04/2004 | | | 350 | | | | 350 | | |
Credit Suisse First Boston Corp.
1.83%, due 09/09/2005 | | | 39 | | | | 39 | | |
| Commercial Paper (0.6%) | |
Clipper Receivables Corp.
1.79%, due 11/12/2004 | | | 116 | | | | 116 | | |
Delaware Funding Corp. 144A
1.85%, due 11/19/2004 | | | 39 | | | | 39 | | |
Falcon Asset Securitization Corp. 144A
1.78%, due 11/04/2004 | | | 116 | | | | 116 | | |
| 1.75%, due 11/10/2004 | | | 155 | | | | 155 | | |
Galaxy Funding 144A
1.88%, due 11/22/2004 | | | 39 | | | | 39 | | |
| Euro Dollar Terms (2.5%) | |
Bank of Montreal
1.88%, due 11/24/2004 | | | 367 | | | | 367 | | |
BNP Paribas
1.77%, due 11/10/2004 | | | 194 | | | | 194 | | |
| 1.80%, due 11/23/2004 | | | 155 | | | | 155 | | |
| 1.98%, due 12/27/2004 | | | 155 | | | | 155 | | |
Calyon
1.70%, due 11/24/2004 | | | 21 | | | | 21 | | |
Citigroup
2.06%, due 01/25/2005 | | | 389 | | | | 389 | | |
The notes to the financial statements are an integral part of this report.
Transamerica IDEX Mutual Funds
Annual Report 2004
6
TA IDEX Transamerica Value Balanced
SCHEDULE OF INVESTMENTS (continued)
At October 31, 2004
(all amounts except share amounts in thousands)
| | | Principal | | Value | |
| Euro Dollar Terms (continued) | |
Den Danske Bank
1.82%, due 11/19/2004 | | | $194 | | | | $194 | | |
Dexia Group
2.04%, due 01/21/2005 | | | 90 | | | | 90 | | |
HBOS Halifax Bank of Scotland
2.03%, due 01/21/2005 | | | 78 | | | | 78 | | |
Royal Bank of Scotland
2.01%, due 01/20/2005 | | | 155 | | | | 155 | | |
Toronto Dominion Bank
1.70%, due 11/08/2004 | | | 78 | | | | 78 | | |
Wells Fargo
1.87%, due 11/22/2004 | | | 194 | | | | 194 | | |
| Promissory Notes (0.5%) | |
Goldman Sachs Group Inc.
1.90%, due 12/29/2004 | | | 163 | | | | 163 | | |
| 1.88%, due 01/27/2005 | | | 272 | | | | 272 | | |
| Repurchase Agreements (0.8%) | |
Merrill Lynch & Co., Inc. (e)
1.92% Repurchase Aggreement dated
10/31/2004 to be repurchased at $622
on 11/01/2004 | | | 622 | | | | 622 | | |
| | | Shares | | Value | |
| Investment Companies (0.4%) | |
| Money Market Funds (0.4%) | |
Merrill Lynch Premier Institutional Fund
1-day yield of 1.71% | | | 191,153 | | | | $191 | | |
Merrimac Cash Fund, Premium Class
1-day yield of 1.46% | | | 139,884 | | | | 140 | | |
| Total Security Lending Collateral (cost: $4,779) | | | | | | | 4,779 | | |
| Total Investment Securities (cost: $80,426) | | | | | | $ | 84,767 | | |
| | | Contracts (f) | | Value | |
| WRITTEN OPTIONS (–1.0%) | |
| Covered Call Options (–0.4%) | |
Altria Group (g)
Call Strike $65.00
Expires 01/22/2005 | | | 20 | | | | $– | | |
Anadarko Petroleum Corp.
Put Strike $65.00
Expires 11/20/2004 | | | 30 | | | | (10 | ) | |
Bank of America Corp.
Call Strike $45.00
Expires 01/22/2005 | | | 610 | | | | (302 | ) | |
COX Communications, Inc.
Call Strike $32.50
Expires 03/19/2005 | | | 110 | | | | (23 | ) | |
| | | Contracts (f) | | Value | |
Wells Fargo & Co.
Call Strike $60.00
Expires 01/22/2005 | | | 75 | | | | $(10) | | |
| Put Options (–0.6%) | | | |
Altria Group
Put Strike $30.00
Expires 01/22/2005 | | | 100 | | | | (1 | ) | |
Altria Group
Put Strike $35.00
Expires 03/19/2005 | | | 85 | | | | (4 | ) | |
Altria Group
Put Strike $40.00
Expires 01/21/2006 | | | 100 | | | | (30 | ) | |
American International Group, Inc.
Put Strike $60.00
Expires 02/19/2005 | | | 25 | | | | (7 | ) | |
American International Group, Inc.
Put Strike $65.00
Expires 02/19/2005 | | | 50 | | | | (28 | ) | |
Bank of America Corp. (g)
Put Strike $32.50
Expires 01/22/2005 | | | 40 | | | | – | | |
Bristol-Myers Squibb Co.
Put Strike $22.50
Expires 01/22/2005 | | | 60 | | | | (4 | ) | |
Bristol-Myers Squibb Co.
Put Strike $25.00
Expires 01/22/2005 | | | 50 | | | | (10 | ) | |
Bristol-Myers Squibb Co.
Put Strike $20.00
Expires 03/19/2005 | | | 80 | | | | (2 | ) | |
Bristol-Myers Squibb Co.
Put Strike $20.00
Expires 01/21/2006 | | | 150 | | | | (19 | ) | |
ChevronTexaco Corp. (g)
Put Strike $30.00
Expires 01/22/2005 | | | 40 | | | | – | | |
Cooper Industries, Ltd. (g)
Put Strike $50.00
Expires 04/16/2005 | | | 10 | | | | – | | |
Dominion Res
Put Strike $50.00
Expires 01/22/2005 | | | 135 | | | | (1 | ) | |
Dominion Res
Put Strike $60.00
Expires 01/22/2005 | | | 85 | | | | (4 | ) | |
The notes to the financial statements are an integral part of this report.
Transamerica IDEX Mutual Funds
Annual Report 2004
7
TA IDEX Transamerica Value Balanced
SCHEDULE OF INVESTMENTS (continued)
At October 31, 2004
(all amounts except share amounts in thousands)
| | | Contracts (f) | | Value | |
| Put Options (continued) | |
Duke Energy
Put Strike $20.00
Expires 01/22/2005 | | | 300 | | | | $(3) | | |
Duke Energy (g)
Put Strike $15.00
Expires 01/21/2006 | | | 20 | | | | – | | |
EI Du Pont de Nemours & Co. (g)
Put Strike $35.00
Expires 01/22/2005 | | | 20 | | | | – | | |
Exxon Mobil Corp. (g)
Put Strike $35.00
Expires 01/22/2005 | | | 40 | | | | – | | |
Fannie Mae
Put Strike $60.00
Expires 12/18/2004 | | | 55 | | | | (3 | ) | |
Fannie Mae
Put Strike $60.00
Expires 01/22/2005 | | | 35 | | | | (3 | ) | |
Fannie Mae
Put Strike $60.00
Expires 03/19/2005 | | | 45 | | | | (8 | ) | |
HJ Heinz Co.
Put Strike $35.00
Expires 01/22/2005 | | | 30 | | | | (2 | ) | |
Kimberly-Clark Corp. (g)
Put Strike $45.00
Expires 01/22/2005 | | | 90 | | | | – | | |
Merck & Co., Inc.
Put Strike $40.00
Expires 01/22/2005 | | | 45 | | | | (40 | ) | |
Merck & Co., Inc.
Put Strike $40.00
Expires 01/21/2006 | | | 100 | | | | (101 | ) | |
Microsoft Corp. (g)
Put Strike $15.00
Expires 01/22/2005 | | | 100 | | | | – | | |
Microsoft Corp. (g)
Put Strike $20.00
Expires 01/22/2005 | | | 40 | | | | – | | |
Microsoft Corp.
Put Strike $25.00
Expires 04/16/2005 | | | 250 | | | | (11 | ) | |
PNC Financial
Put Strike $50.00
Expires 02/19/2005 | | | 85 | | | | (11 | ) | |
PNC Financial
Put Strike $47.50
Expires 02/19/2005 | | | 85 | | | | (5 | ) | |
| | | Contracts (f) | | Value | |
| Put Options (continued) | |
Praxair, Inc.
Put Strike $35.00
Expires 01/22/2005 | | | 100 | | | | $(2) | | |
Raymond James Financial, Inc.
Put Strike $22.50
Expires 02/19/2005 | | | 300 | | | | (8 | ) | |
Sara Lee Corp.
Put Strike $15.00
Expires 01/22/2005 | | | 140 | | | | (1 | ) | |
Sara Lee Corp. (g)
Put Strike $20.00
Expires 01/22/2005 | | | 30 | | | | – | | |
Sara Lee Corp.
Put Strike $22.50
Expires 04/16/2005 | | | 160 | | | | (13 | ) | |
Sara Lee Corp.
Put Strike $20.00
Expires 01/21/2006 | | | 80 | | | | (6 | ) | |
Schering-Plough Corp.
Put Strike $15.00
Expires 01/21/2006 | | | 100 | | | | (9 | ) | |
Sprint Corp.–FON Group
Put Strike $15.00
Expires 11/20/2004 | | | 100 | | | | (1 | ) | |
Sun Microsystems, Inc.
Put Strike $5.00
Expires 01/22/2005 | | | 500 | | | | (31 | ) | |
Time Warner, Inc.
Put Strike $12.50
Expires 01/22/2005 | | | 100 | | | | (1 | ) | |
Time Warner, Inc.
Put Strike $15.00
Expires 01/22/2005 | | | 270 | | | | (7 | ) | |
Time Warner, Inc.
Put Strike $15.00
Expires 04/16/2005 | | | 530 | | | | (23 | ) | |
Walt Disney Co.
Put Strike $22.50
Expires 01/22/2005 | | | 200 | | | | (6 | ) | |
Washington Mutual, Inc.
Put Strike $30.00
Expires 01/21/2006 | | | 220 | | | | (25 | ) | |
| Total Written Options (cost: $837) | | | | | | | (775 | ) | |
| SUMMARY: | |
| Investments, at value | | | 104.5 | % | | $ | 84,767 | | |
| Written options | | | (1.0 | )% | | | (775 | ) | |
| Liabilities in excess of other assets | | | (3.5 | )% | | | (2,905 | ) | |
| Net assets | | | 100.0 | % | | $ | 81,087 | | |
The notes to the financial statements are an integral part of this report.
Transamerica IDEX Mutual Funds
Annual Report 2004
8
TA IDEX Transamerica Value Balanced
SCHEDULE OF INVESTMENTS (continued)
At October 31, 2004
(all amounts except share amounts in thousands)
NOTES TO SCHEDULE OF INVESTMENTS:
(a) At October 31, 2004, all or a portion of this security is on loan (see Note 1). The value at October 31, 2004, of all securities on loan is $4,635.
(b) At October 31, 2004, all or a portion of this security is segregated with the custodian to cover margin requirements for open option contracts. The value of all securities segregated at October 31, 2004, is $5,742.
(c) Floating or variable rate note. Rate is listed as of October 31, 2004.
(d) No dividends were paid during the preceding twelve months.
(e) Cash collateral for the Repurchase Agreements, valued at $636, that serve as collateral for securities lending are invested in corporate bonds with interest rates and maturity dates ranging from 0.00%–9.75% and 05/15/2005–9/15/2033, respectively.
(f) Contract amounts are not in thousands.
(g) Value is less than $1.
DEFINITIONS:
144A 144A Securities are registered pursuant to Rule 144A of the Securities Act of 1933. These securities are deemed to be liquid for purposes of compliance limitations on holdings of illiquid securities and may be resold as transactions exempt from registration normally to qualified institutional buyers. At October 31, 2004 these securities aggregated $1,479 or 1.8% of the net assets of the Fund.
ADR American Depositary Receipt
The notes to the financial statements are an integral part of this report.
Transamerica IDEX Mutual Funds
Annual Report 2004
9
TA IDEX Transamerica Value Balanced
STATEMENT OF ASSETS AND LIABILITIES
At October 31, 2004
(all amounts except per share amounts in thousands)
| Assets: | | | |
Investment securities, at value (cost: $80,426)
(including securities loaned of $4,635) | | $ | 84,767 | | |
| Cash | | | 1,765 | | |
| Receivables: | |
| Investment securities sold | | | 269 | | |
| Shares of beneficial interest sold | | | 6 | | |
| Interest | | | 373 | | |
| Dividends | | | 72 | | |
| Other | | | 13 | | |
| | | | 87,265 | | |
| Liabilities: | | | |
| Accounts payable and accrued liabilities: | |
| Shares of beneficial interest redeemed | | | 327 | | |
| Management and advisory fees | | | 68 | | |
| Distribution fees | | | 49 | | |
| Transfer agent fees | | | 103 | | |
| Payable for collateral for securities on loan | | | 4,779 | | |
| Written options (premiums $837) | | | 775 | | |
| Other | | | 77 | | |
| | | | 6,178 | | |
| Net Assets | | $ | 81,087 | | |
| Net Assets Consist of: | | | |
Shares of beneficial interest, unlimited shares
authorized, no par value | | $ | 75,538 | | |
| Undistributed net investment income (loss) | | | (12 | ) | |
Undistributed net realized gain (loss) from investment
securities and written option contracts | | | 1,159 | | |
| Net unrealized appreciation (depreciation) on: | |
| Investment securities | | | 4,340 | | |
| Written option contracts | | | 62 | | |
| Net Assets | | $ | 81,087 | | |
| Net Assets by Class: | | | |
| Class A | | $ | 37,393 | | |
| Class B | | | 29,409 | | |
| Class C | | | 14,285 | | |
| Shares Outstanding: | | | |
| Class A | | | 3,088 | | |
| Class B | | | 2,436 | | |
| Class C | | | 1,183 | | |
| Net Asset Value Per Share: | | | |
| Class A | | $ | 12.11 | | |
| Class B | | | 12.07 | | |
| Class C | | | 12.07 | | |
| Maximum Offering Price Per Share (a): | | | |
| Class A | | $ | 12.81 | | |
(a) Includes the maximum selling commission (represented as a percentage of offering price) which is reduced on certain levels of sales as set forth in the Prospectus. Net asset value per share for Classes B and C shares represents offering price. The redemption price for Classes B and C shares equals net asset value less any applicable contingent deferred sales charge.
STATEMENT OF OPERATIONS
For the year ended October 31, 2004
(all amounts in thousands)
| Investment Income: | | | |
| Interest | | $ | 881 | | |
| Dividends | | | 812 | | |
| Income from loaned securities–net | | | 6 | | |
| Less withholding taxes on foreign dividends | | | (1 | ) | |
| | | | 1,698 | | |
| Expenses: | | | |
| Management and advisory fees | | | 418 | | |
| Transfer agent fees | |
| Class A | | | 86 | | |
| Class B | | | 81 | | |
| Class C | | | 12 | | |
| Class C2 | | | 6 | | |
| Class M | | | 10 | | |
| Printing and shareholder reports | | | 25 | | |
| Custody fees | | | 25 | | |
| Administration fees | | | 15 | | |
| Legal fees | | | 1 | | |
| Audit and accounting fees | | | 7 | | |
| Trustees fees | | | 2 | | |
| Registration fees | |
| Class A | | | 5 | | |
| Class B | | | 3 | | |
| Class C | | | 13 | | |
| Class C2 | | | 2 | | |
| Class M | | | 4 | | |
| Distribution and service fees: | |
| Class A | | | 85 | | |
| Class B | | | 214 | | |
| Class C | | | 46 | | |
| Class C2 | | | 25 | | |
| Class M | | | 36 | | |
| Total expenses | | | 1,121 | | |
Less:
Reimbursement of Class expenses | |
| Class A | | | (18 | ) | |
| Class B | | | (22 | ) | |
| Class C | | | (9 | ) | |
| Net expenses | | | 1,072 | | |
| Net Investment Income (Loss) | | | 626 | | |
| Net Realized Gain (Loss) from: | | | |
| Investment securities | | | 5,439 | | |
| Written option contracts | | | 604 | | |
| | | | 6,043 | | |
| Net Increase (Decrease) in Unrealized Appreciation on: | | | |
| Investment securities | | | (2,835 | ) | |
| Written option contracts | | | (190 | ) | |
| | | | (3,025 | ) | |
Net Gain (Loss) on Investments and Written Option
Contracts | | | 3,018 | | |
Net Increase (Decrease) in Net Assets Resulting
from Operations | | $ | 3,644 | | |
The notes to the financial statements are an integral part of this report.
Transamerica IDEX Mutual Funds
Annual Report 2004
10
TA IDEX Transamerica Value Balanced
STATEMENTS OF CHANGES IN NET ASSETS
For the years ended
(all amounts in thousands)
| | | October 31,
2004 | | October 31,
2003 | |
| Increase (Decrease) in Net Assets From: | |
| Operations: | |
| Net investment income (loss) | | $ | 626 | | | $ | 402 | | |
Net realized gain (loss) from
investment securities and
written option contracts | | | 6,043 | | | | 180 | | |
Net unrealized appreciation
(depreciation) on investment
securities and written option
contracts | | | (3,025 | ) | | | 4,968 | | |
| | | | 3,644 | | | | 5,550 | | |
| Distributions to Shareholders: | |
| From net investment income: | |
| Class A | | | (371 | ) | | | (220 | ) | |
| Class B | | | (186 | ) | | | (167 | ) | |
| Class C | | | (38 | ) | | | (1 | ) | |
| Class C2 | | | (17 | ) | | | (52 | ) | |
| Class M | | | (45 | ) | | | (46 | ) | |
| | | | (657 | ) | | | (486 | ) | |
| Capital Share Transactions: | |
| Proceeds from shares sold: | |
| Class A | | | 5,521 | | | | 3,070 | | |
| Class B | | | 3,631 | | | | 3,185 | | |
| Class C | | | 1,973 | | | | 500 | | |
| Class C2 | | | 471 | | | | 582 | | |
| Class M | | | 328 | | | | 679 | | |
| | | | 11,924 | | | | 8,016 | | |
| Proceeds from fund acquisition: | |
| Class A | | | 28,033 | | | | – | | |
| Class B | | | 16,163 | | | | – | | |
| Class C | | | 384 | | | | – | | |
| Class C2 | | | 2,604 | | | | – | | |
| Class M | | | 3,202 | | | | – | | |
| | | | 50,386 | | | | – | | |
Dividends and distributions
reinvested: | |
| Class A | | | 359 | | | | 210 | | |
| Class B | | | 180 | | | | 161 | | |
| Class C | | | 36 | | | | 1 | | |
| Class C2 | | | 16 | | | | 51 | | |
| Class M | | | 43 | | | | 46 | | |
| | | | 634 | | | | 469 | | |
| Cost of shares redeemed: | |
| Class A | | | (10,214 | ) | | | (4,327 | ) | |
| Class B | | | (4,870 | ) | | | (3,669 | ) | |
| Class C | | | (1,054 | ) | | | (15 | ) | |
| Class C2 | | | (803 | ) | | | (1,592 | ) | |
| Class M | | | (921 | ) | | | (1,035 | ) | |
| | | | (17,862 | ) | | | (10,638 | ) | |
| Class level exchanges: | |
| Class C | | | 12,159 | | | | – | | |
| Class C2 | | | (6,063 | ) | | | – | | |
| Class M | | | (6,096 | ) | | | – | | |
| | | | – | | | | – | | |
| Automatic conversions: | |
| Class A | | | 572 | | | | – | | |
| Class B | | | (572 | ) | | | – | | |
| | | | – | | | | – | | |
| | | | 45,082 | | | | (2,153 | ) | |
| Net increase (decrease) in net assets | | | 48,069 | | | | 2,911 | | |
| | | October 31,
2004 | | October 31,
2003 | |
| Net Assets: | |
| Beginning of year | | $ | 33,018 | | | $ | 30,107 | | |
| End of year | | $ | 81,087 | | | $ | 33,018 | | |
Undistributed Net Investment Income
(Loss) | | $ | (12 | ) | | $ | 16 | | |
| Share Activity: | |
| Shares issued: | |
| Class A | | | 467 | | | | 289 | | |
| Class B | | | 309 | | | | 298 | | |
| Class C | | | 166 | | | | 48 | | |
| Class C2 | | | 40 | | | | 56 | | |
| Class M | | | 26 | | | | 65 | | |
| | | | 1,008 | | | | 756 | | |
| Shares issued on fund acquisition: | |
| Class A | | | 2,371 | | | | – | | |
| Class B | | | 1,372 | | | | – | | |
| Class C | | | 33 | | | | – | | |
| Class C2 | | | 221 | | | | – | | |
| Class M | | | 271 | | | | – | | |
| | | | 4,268 | | | | – | | |
Shares issued–reinvested from
distributions: | |
| Class A | | | 30 | | | | 21 | | |
| Class B | | | 15 | | | | 16 | | |
| Class C | | | 3 | | | | – | | |
| Class C2 | | | 1 | | | | 5 | | |
| Class M | | | 4 | | | | 5 | | |
| | | | 53 | | | | 47 | | |
| Shares redeemed: | |
| Class A | | | (858 | ) | | | (417 | ) | |
| Class B | | | (411 | ) | | | (358 | ) | |
| Class C | | | (89 | ) | | | (2 | ) | |
| Class C2 | | | (67 | ) | | | (156 | ) | |
| Class M | | | (77 | ) | | | (100 | ) | |
| | | | (1,502 | ) | | | (1,033 | ) | |
| Class level exchanges: | |
| Class C | | | 1,024 | | | | – | | |
| Class C2 | | | (513 | ) | | | – | | |
| Class M | | | (509 | ) | | | – | | |
| | | | 2 | | | | – | | |
| Automatic conversions: | |
| Class A | | | 48 | | | | – | | |
| Class B | | | (48 | ) | | | – | | |
| | | | – | | | | – | | |
Net increase (decrease) in shares
outstanding: | |
| Class A | | | 2,058 | | | | (107 | ) | |
| Class B | | | 1,237 | | | | (44 | ) | |
| Class C | | | 1,137 | | | | 46 | | |
| Class C2 | | | (318 | ) | | | (95 | ) | |
| Class M | | | (285 | ) | | | (30 | ) | |
| | | | 3,829 | | | | (230 | ) | |
The notes to the financial statements are an integral part of this report.
Transamerica IDEX Mutual Funds
Annual Report 2004
11
TA IDEX Transamerica Value Balanced
FINANCIAL HIGHLIGHTS
| | | | | For a share of beneficial interest outstanding throughout each period | |
| | | | | Net Asset | | Investment Operations | | Distributions | | Net Asset | |
| | | For the
Period
Ended (d)(g) | | Value,
Beginning
of Period | | Net
Investment
Income (Loss) | | Net Realized
and Unrealized
Gain (Loss) | | Total
Operations | | From Net
Investment
Income | | From Net
Realized
Gains | | Total
Distributions | | Value,
End
of Period | |
| Class A | | 10/31/2004 | | $ | 11.49 | | | $ | 0.18 | | | $ | 0.61 | | | $ | 0.79 | | | $ | (0.17 | ) | | $ | – | | | $ | (0.17 | ) | | $ | 12.11 | | |
| | | 10/31/2003 | | | 9.69 | | | | 0.18 | | | | 1.83 | | | | 2.01 | | | | (0.21 | ) | | | – | | | | (0.21 | ) | | | 11.49 | | |
| | | 10/31/2002 | | | 11.67 | | | | 0.18 | | | | (1.65 | ) | | | (1.47 | ) | | | (0.16 | ) | | | (0.35 | ) | | | (0.51 | ) | | | 9.69 | | |
| | | 10/31/2001 | | | 12.75 | | | | 0.26 | | | | (0.51 | ) | | | (0.25 | ) | | | (0.26 | ) | | | (0.57 | ) | | | (0.83 | ) | | | 11.67 | | |
| | | 10/31/2000 | | | 11.79 | | | | 0.30 | | | | 1.01 | | | | 1.31 | | | | (0.35 | ) | | | – | | | | (0.35 | ) | | | 12.75 | | |
| Class B | | 10/31/2004 | | | 11.46 | | | | 0.10 | | | | 0.61 | | | | 0.71 | | | | (0.10 | ) | | | – | | | | (0.10 | ) | | | 12.07 | | |
| | | 10/31/2003 | | | 9.69 | | | | 0.11 | | | | 1.80 | | | | 1.91 | | | | (0.14 | ) | | | – | | | | (0.14 | ) | | | 11.46 | | |
| | | 10/31/2002 | | | 11.66 | | | | 0.11 | | | | (1.65 | ) | | | (1.54 | ) | | | (0.08 | ) | | | (0.35 | ) | | | (0.43 | ) | | | 9.69 | | |
| | | 10/31/2001 | | | 12.74 | | | | 0.18 | | | | (0.50 | ) | | | (0.32 | ) | | | (0.19 | ) | | | (0.57 | ) | | | (0.76 | ) | | | 11.66 | | |
| | | 10/31/2000 | | | 11.78 | | | | 0.23 | | | | 1.01 | | | | 1.24 | | | | (0.28 | ) | | | – | | | | (0.28 | ) | | | 12.74 | | |
| Class C | | 10/31/2004 | | | 11.46 | | | | 0.11 | | | | 0.60 | | | | 0.71 | | | | (0.10 | ) | | | – | | | | (0.10 | ) | | | 12.07 | | |
| | | 10/31/2003 | | | 9.71 | | | | 0.12 | | | | 1.77 | | | | 1.89 | | | | (0.14 | ) | | | – | | | | (0.14 | ) | | | 11.46 | | |
| | | | | | | Ratios/Supplemental Data | |
| | | For the
Period | | Total | | Net Assets,
End of
Period | | Ratio of Expenses
to Average
Net Assets (a) | | Net Investment
Income (Loss)
to Average | | Portfolio
Turnover | |
| | | Ended (g) | | Return (c) | | (000's) | | Net (e) | | Total (f) | | Net Assets (a) | | Rate (b) | |
| Class A | | 10/31/2004 | | | 6.99 | % | | $ | 37,393 | | | | 1.55 | % | | | 1.63 | % | | | 1.50 | % | | | 122 | % | |
| | | 10/31/2003 | | | 21.04 | | | | 11,832 | | | | 1.55 | | | | 2.20 | | | | 1.75 | | | | 50 | | |
| | | 10/31/2002 | | | (13.20 | ) | | | 11,020 | | | | 1.55 | | | | 1.89 | | | | 1.56 | | | | 82 | | |
| | | 10/31/2001 | | | (2.13 | ) | | | 13,880 | | | | 1.55 | | | | 1.95 | | | | 2.04 | | | | 50 | | |
| | | 10/31/2000 | | | 11.43 | | | | 9,850 | | | | 1.55 | | | | 2.02 | | | | 2.50 | | | | 28 | | |
| Class B | | 10/31/2004 | | | 6.23 | | | | 29,409 | | | | 2.20 | | | | 2.30 | | | | 0.81 | | | | 122 | | |
| | | 10/31/2003 | | | 19.98 | | | | 13,744 | | | | 2.20 | | | | 2.85 | | | | 1.10 | | | | 50 | | |
| | | 10/31/2002 | | | (13.72 | ) | | | 12,038 | | | | 2.20 | | | | 2.54 | | | | 0.91 | | | | 82 | | |
| | | 10/31/2001 | | | (2.74 | ) | | | 16,180 | | | | 2.20 | | | | 2.60 | | | | 1.39 | | | | 50 | | |
| | | 10/31/2000 | | | 10.76 | | | | 9,193 | | | | 2.20 | | | | 2.67 | | | | 1.85 | | | | 28 | | |
| Class C | | 10/31/2004 | | | 6.31 | | | | 14,285 | | | | 2.20 | | | | 2.39 | | | | 0.78 | | | | 122 | | |
| | | 10/31/2003 | | | 19.73 | | | | 530 | | | | 2.20 | | | | 2.86 | | | | 1.10 | | | | 50 | | |
NOTES TO FINANCIAL HIGHLIGHTS
(a) Annualized.
(b) Not annualized for periods of less than one year.
(c) Total Return has been calculated for the applicable period without deduction of a sales load, if any, on an initial purchase. Periods of less that one year are not annualized.
(d) Per share information is calculated based on average number of shares outstanding for the years ended 10/31/2001, 10/31/2002, 10/31/2003 and 10/31/2004.
(e) Ratio of Net Expenses to Average Net Assets is net of fee waivers and reimbursements by the investment adviser, if any (see note 2).
(f) Ratio of Total Expenses to Average Net Assets includes all expenses before fee waivers and reimbursements by the investment adviser.
(g) The inception date for the Fund's offering of share Class L was November 11, 2002. Class L was renamed Class C on March 1, 2004. (see note 1)
The notes to the financial statements are an integral part of this report.
Transamerica IDEX Mutual Funds
Annual Report 2004
12
TA IDEX Transamerica Value Balanced
NOTES TO FINANCIAL STATEMENTS
At October 31, 2004
(all amounts in thousands)
NOTE 1. ORGANIZATION AND SIGNIFICANT ACCOUNTING POLICIES
Transamerica IDEX Mutual Funds, formerly IDEX Mutual Funds, is a Massachusetts business trust registered under the Investment Company Act of 1940, as amended (the "1940 Act"), as an open-end management investment company. TA IDEX Transamerica Value Balanced ("the Fund"), part of Transamerica IDEX Mutual Funds, began operations on October 1, 1995.
On March 1, 2004, the Fund changed its name from IDEX Transamerica Value Balanced to TA IDEX Transamerica Value Balanced.
On May 28, 2004, the Fund acquired all of the net assets of TA IDEX LKCM Strategic Total Return pursuant to a plan of reorganization. TA IDEX Transamerica Value Balanced is the accounting survivor. The acquisition was accomplished by a tax free exchange of 4,268 shares of the Fund for 2,942 shares of TA IDEX LKCM Strategic Total Return outstanding on May 27, 2004. TA IDEX LKCM Strategic Total Return's net assets at that date, $50,386, including $6,071 unrealized depreciation, were combined with those of the Fund. The aggregate net assets of TA IDEX Transamerica Value Balanced immediately before the acquisition was $37,187. The combined net assets of the Fund immediately after the acquisition was $87,573. Proceeds in connection with the acquisition were as follows:
| | | Shares | | Amount | |
| Proceeds in connection with the acquisition | |
| Class A | | | 2,371 | | | $ | 28,033 | | |
| Class B | | | 1,372 | | | | 16,163 | | |
| Class C | | | 33 | | | | 384 | | |
| Class C2 | | | 221 | | | | 2,604 | | |
| Class M | | | 271 | | | | 3,202 | | |
| | | | | | | $ | 50,386 | | |
In the normal course of business, the Fund enters into contracts that contain a variety of representations and warranties, which provide general indemnifications. The Fund's maximum exposure under these arrangements is unknown, as this would involve future claims that may be made against the Fund and/or its affiliates that have not yet occurred. However, based on experience, the Fund expects the risk of loss to be remote.
See the Prospectus and Statement of Additional Information for a description of the Fund's investment objective.
In preparing the Fund's financial statements in accordance with accounting principles generally accepted in the United States of America ("GAAP"), estimates or assumptions (which could differ from actual
results) may be used that affect reported amounts and disclosures. The following policies were consistently followed by the Fund, in accordance with GAAP.
Multiple class operations and expenses: The Fund currently offers three classes of shares, each with a public offering price that reflects different sales charges, if any, and expense levels. All shares designated as Class C shares prior to March 1, 2004, were renamed as Class C2 shares on that date. All shares designated as Class L shares prior to March 1, 2004, were renamed as Class C shares with different sales charges than the previous Class L shares. On June 15, 2004, Class C2 shares merged into Class C. On September 24, 2004, Class M shares merged into Class C. Class B shares will convert to Class A shares eight years after purchase. Income, non-class specific expenses and realized and unrealized gains and losses, are allo cated daily to each class, based upon the value of shares outstanding method as permitted under Rule 18f-3 of the 1940 Act. Each class bears its own specific expenses as well as a portion of general, common expenses.
Pricing of shares: The Fund prices its shares on the basis of the net asset value of each class of shares of the Fund, which is determined as of the close of the New York Stock Exchange ("NYSE") (generally 4:00 p.m. Eastern Time) on each day on which the NYSE is open for trading (other than a day on which there are insufficient changes in the value of the Fund's portfolio securities to materially affect the Fund's net asset value or a day on which no shares are tendered for redemption and no order to purchase any shares is received).
Security valuations: Fund investments traded on an exchange are valued at the closing price on the day of valuation on the exchange where the security is principally traded. With respect to securities traded on NASDAQ NMS, such closing price may be the last reported sales price or the NASDAQ Official Closing Price.
Securities traded in the over-the-counter market and listed securities for which no sale was reported on that date are valued at the last quoted bid price.
Debt securities are valued by independent pricing services; however, those that mature in sixty days or less are valued at amortized cost, which approximates market.
Investment company securities are valued at net asset value of the underlying portfolio.
Other securities for which quotations are not readily available are valued at fair market value as determined in good faith using guidelines adopted by the Board of Trustees of the Fund, under the supervision of the Fund's Valuation Committee.
Cash: The Fund may leave cash overnight in its cash account with the custodian, Investors Bank & Trust Company ("IBT"). IBT has been contracted on behalf of the Fund to invest the excess cash into a savings account, which at October 31, 2004, was paying an interest rate of 1.30%.
Transamerica IDEX Mutual Funds
Annual Report 2004
13
TA IDEX Transamerica Value Balanced
NOTES TO FINANCIAL STATEMENTS (continued)
At October 31, 2004
(all amounts in thousands)
NOTE 1.–(continued)
Throughout the year, the Fund may have a cash overdraft balance. A fee is incurred on this overdraft, calculated by multiplying the overdraft by a rate based on the federal funds rate. This fee is included in Custody fees in the Statement of Operations.
Repurchase agreements: The Fund is authorized to enter into repurchase agreements. The Fund, through IBT, receives delivery of the underlying securities, the value of which at the time of purchase is required to be an amount equal to at least 100% of the resale price. Repurchase agreements involve the risk that the seller will fail to repurchase the security, as agreed. In that case, the Fund will bear the risk of value fluctuations until the security can be sold and may encounter delays and incur costs in liquidating the security. In the event of bankruptcy or insolvency of the seller, delays and costs may be incurred.
Commission recapture: The sub-adviser, to the extent consistent with the best execution and usual commission rate policies and practices, may place security transactions of the Fund with broker/dealers with which Transamerica IDEX Mutual Funds has established a Commission Recapture Program. A Commission Recapture Program is any arrangement under which a broker/dealer applies a portion of the commissions received by such broker/dealer on the security transactions to the Fund. In no event will commissions paid by the Fund be used to pay expenses that would otherwise be borne by any other funds within Transamerica IDEX Mutual Funds, or by any other party.
Recaptured commissions during the year ended October 31, 2004, of $11 are included in net realized gains in the Statement of Operations.
Securities lending: The Fund may lend securities to enhance fund earnings from investing cash collateral in making such loans to qualified borrowers (typically broker/dealers). The Fund has engaged its custodian bank, IBT, as a lending agent to administer its securities lending program. IBT earned $2 of program net income for its services. When the Fund makes a security loan, it receives cash collateral as protection against the risk that the borrower will default on the loan, and records an asset for the cash invested collateral and a liability for the return of the collateral.
Securities on loan are included in Investment securities at value in the Statement of Assets and Liabilities and remain on the Schedule of Investments.
Loans of securities are required to be secured by collateral at least equal to 102% of the value of the securities at inception of the loan, and not less then 100% thereafter. The Fund may invest cash collateral in short-term money market instruments including: U.S. Treasury Bills, U.S.
agency obligations, commercial paper, money market mutual funds, repurchase agreements and other highly rated, liquid investments. During the life of securities loans, the collateral and securities loaned remain subject to fluctuation in value. IBT marks to market securities loaned and the collateral each business day. If additional collateral is due (at least $1), IBT collects additional cash collateral from the borrowers. Although securities loaned will be fully collateralized at all times, IBT may experience delays in, or may be prevented from, recovering the collateral on behalf of the Fund. The Fund may recall a loaned security position at any time from the borrower through IBT. In the event the borrower fails to timely return a recalled security, IBT may indemnify the Fund by purchasing replacement securities for the Fund at its own expense and claiming the collateral to fund such a purchase. IBT absorbs the loss if the collateral value is not sufficient to cover the cost of the replacement securities. If replacement securities are not available, IBT will credit the equivalent cash value to the Fund.
While a security is on loan, the Fund does not have the right to vote that security. However, if time permits, the Fund will attempt to recall a security on loan and vote the proxy.
Income from securities lending is included in the Statement of Operations. The amount of collateral and value of securities on loan are included in the Statement of Assets and Liabilities as well as in the Schedule of Investments.
Real Estate Investment Trusts ("REITs"): There are certain additional risks involved in investing in REITs. These include, but are not limited to, economic conditions, changes in zoning laws, real estate values, property taxes and interest rates.
Security transactions and investment income: Security transactions are recorded on the trade date. Security gains and losses are calculated on the specific identification basis. Dividend income is recorded on the ex-dividend date or, in the case of foreign securities, as soon as the Fund is informed of the ex-dividend date. Interest income, including accretion of discounts and amortization of premiums, is recorded on the accrual basis commencing on the settlement date.
Option contracts: The Fund may enter into options contracts to manage exposure to market fluctuations. Options are valued at the average of the bid and ask ("Mean Quote") established each day at the close of the board of trade or exchange on which they are traded. The primary risks associated with options are imperfect correlation between the change in value of the securities held and the prices of the options contracts; the possibility of an illiquid market and inability of the counterparty to meet the contracts terms. When the Fund writes a covered call or put option, an amount equal to the premium received by the Fund is included in the Fund's Statement of Assets and Liabilities as an asset and as an equivalent liability. The amount is subsequently marked-to-market to reflect the current value of th e option written.
The underlying face amounts of open option contracts at October 31, 2004, are listed in the Schedule of Investments.
Transamerica IDEX Mutual Funds
Annual Report 2004
14
TA IDEX Transamerica Value Balanced
NOTES TO FINANCIAL STATEMENTS (continued)
At October 31, 2004
(all amounts in thousands)
NOTE 1.–(continued)
Transactions in written call and put options were as follows:
| | | Premium | | Contracts* | |
| Beginning Balance October 31, 2003 | | $ | 886 | | | | 4,896 | | |
| Sales | | | 1,180 | | | | 9,182 | | |
| Closing Buys | | | (377 | ) | | | (2,103 | ) | |
| Expirations | | | (604 | ) | | | (4,250 | ) | |
| Exercised | | | (248 | ) | | | (1,700 | ) | |
| Balance at October 31, 2004 | | $ | 837 | | | | 6,025 | | |
* Contracts not in thousands
Account maintenance fees: If the shareholder account balance falls below $1 by either shareholder action or as a result of market action, a $25 (not in thousands) fee is assessed every year until the balance reaches $1. The fee is assessed by redeeming shares in the shareholder's account.
No fee will be charged under the following conditions:
• accounts opened within the preceding 24 months
• accounts with an active monthly Automatic Investment Plan ($50 (not in thousands) minimum per fund)
• accounts owned by an individual which, when combined by social security number, have a balance of $5 or more
• accounts owned by individuals in the same household (by address) that have a combined balance of $5 or more
• UTMA/UGMA accounts
• Fiduciary accounts
• B-share accounts whose shares have started to convert to A-shares accounts (as long as combined value of both accounts is at least $1)
For the year ended October 31, 2004, this fee totaled $5. These fees are included in Paid in Capital in the Statement of Assets and Liabilities.
Redemptions fees: A short-term trading redemption fee may be assessed on any fund shares in a fund account that are sold during the first five (5) New York Stock Exchange trading days following their purchase date. This redemption fee will equal 2% of the amount redeemed and shares held the longest will be treated as being redeemed first and shares held the shortest as being redeemed last. For the year ended October 31, 2004, the Fund received no redemption fees.
Dividend distributions: Distributions to shareholders are recorded on the ex-dividend date and are determined in accordance with Federal income tax regulations which may differ from GAAP.
NOTE 2. RELATED PARTY TRANSACTIONS
AEGON/Transamerica Fund Advisers, Inc. ("ATFA") is the Fund's investment adviser. AEGON/Transamerica Fund Services, Inc. ("ATFS") is the Fund's administrator. AFSG Securities Corp. ("AFSG") is the Fund's distributor/principal underwriter. AEGON/Transamerica Investor Services, Inc. ("ATIS") is the Fund's transfer agent. ATIS and AFSG are 100% owned by AUSA Holding Company ("AUSA"). ATFA is a directly owned subsidiary of Western Reserve Life Assurance Co. of Ohio (78%) ("WRL") and AUSA (22%). ATFS is a wholly owned subsidiary of WRL. AUSA and WRL are wholly owned indirect subsidiaries of AEGON NV, a Netherlands corporation.
Transamerica Investment Management, LLC is both an affiliate of the Fund and a sub-adviser to the Fund.
Investment advisory fee: The Fund pays management fees to ATFA based on average daily net assets ("ANA") at the following breakpoints:
0.75% of the first $500 million of ANA
0.65% of the next $500 million of ANA
0.60% of ANA over $1 billion
ATFA has contractually agreed to waive its advisory fee and will reimburse the Fund to the extent that operating expenses, excluding 12b-1 fees, exceed the following stated annual limit:
1.20% Expense Limit
Distribution and service fees: The Fund has a 12b-1 distribution plan under the 1940 Act pursuant to which an annual fee, based on average daily net assets, is paid to the distributor for various disbursements such as broker-dealer account servicing fees and other promotional expenses of the Fund. The Fund is authorized under the 12b-1 plan to pay fees on each class up to the following limits:
| Class A | | | 0.35 | % | |
| Class B | | | 1.00 | % | |
| Class C | | | 1.00 | % | |
| Class C2 | | | 1.00 | % | |
| Class M | | | 0.90 | % | |
Class C2 and Class M merged into Class C on June 15, 2004 and September 24, 2004, respectively.
In the case the Fund or a class of shares of the Fund is closed to new investors or investments, the Fund is authorized to pay 12b-1 fees for past sales and distribution efforts and present and past investor services.
Transamerica IDEX Mutual Funds
Annual Report 2004
15
TA IDEX Transamerica Value Balanced
NOTES TO FINANCIAL STATEMENTS (continued)
At October 31, 2004
(all amounts in thousands)
NOTE 2.–(continued)
Underwriter commissions relate to front-end sales charges imposed for Class A and M shares and contingent deferred sales charges from Classes B, C, M and certain A share redemptions. For the year ended October 31, 2004, the underwriter commissions were as follows:
| Received by Underwriter | | $ | 211 | | |
| Retained by Underwriter | | | 11 | | |
| Contingent Deferred Sales Charge | | | 38 | | |
Administrative services: The Fund has entered into an agreement with ATFS for financial and legal fund administration services, which includes such items as compliance, expenses, financial statements and other reporting, distributions, tax returns, prospectus preparation, board of trustees meeting support and other legal matters. The Fund pays ATFS an annual fee of 0.015% of average net assets. The Legal fees on the Statement of Operations are for fees paid to external legal counsel.
The Fund paid ATFS $15 for the year ended October 31, 2004.
Transfer agent fees: The Fund pays ATIS an annual per-account charge of $20 (not in thousands) for each open account and $1.63 (not in thousands) for each closed account. There is no new account charge. The transfer agent fees on the Statement of Operations are made up of fees paid to ATIS and costs associated with shareholder statements. The Fund paid ATIS $195 for the year ended October 31, 2004.
Deferred compensation plan: Each eligible Fund Trustee may elect participation in the Deferred Compensation Plan ("the Plan"). Under the Plan, such Trustees may defer payment of a percentage of their total fees earned as a Fund Trustee. These deferred amounts may be invested in any Transamerica IDEX Mutual Fund. At October 31, 2004, the value of invested plan amount was $11. Invested plan amounts and the total liability for deferred compensation to the Trustees under the Plan at October 31, 2004, are included in the accompanying Statement of Assets and Liabilities.
NOTE 3. INVESTMENT TRANSACTIONS
The cost of securities purchased and proceeds from securities sold (excluding short-term securities) for the year ended October 31, 2004, were as follows:
| Purchases of securities: | | | |
| Long-Term excluding U.S. Government | | $ | 36,749 | | |
| U.S. Government | | | 25,082 | | |
| Proceeds from maturities and sales of securities: | | | |
| Long-Term excluding U.S. Government | | | 44,467 | | |
| U.S. Government | | | 17,011 | | |
NOTE 4. FEDERAL INCOME TAX MATTERS
The Fund has not made any provision for federal income or excise taxes due to its policy to distribute all of its taxable income and capital gains to its shareholders and otherwise qualify as a regulated investment company under the Internal Revenue Code. Income and capital gain distributions are determined in accordance with income tax regulations, which may differ from GAAP. These differences are primarily due to differing treatment for items including, but not limited to, wash sales and capital loss carryforwards.
Reclassifications between Undistributed net investment income (loss), Undistributed net realized capital gains (loss) and Shares of beneficial interest are made to reflect income and gains available for distribution under federal tax regulations. Results of operations and net assets are not effected by these reclassifications. These reclassifications are as follows:
Shares of beneficial interest, unlimited
shares authorized | | $ | 12 | | |
| Undistributed net investment income (loss) | | | 3 | | |
Accumulated net realized gain (loss) from
investment securities and written option
contracts | | | (15 | ) | |
The capital loss carryforwards are available to offset future realized capital gains through the period listed:
Capital Loss
Carryforward | | Available through | |
| $ | 4,216 | | | October 31, 2010 | |
The capital loss carryforward utilized during the year ended October 31, 2004 was $653.
The capital loss carryforwards are available to offset future realized gains, subject to certain limitations under the Internal Revenue Code, through the period listed.
The tax character of distributions paid may differ from the character of distributions shown in the Statements of Changes in Net Assets due to short-term gains being treated as ordinary income for tax purposes. The tax character of distributions paid during 2003 and 2004 was as follows:
| 2003 Distributions paid from: | | | |
| Ordinary Income | | $ | 486 | | |
| Long-term capital gain | | | – | | |
| 2004 Distributions paid from: | | | |
| Ordinary Income | | $ | 657 | | |
| Long-term capital gain | | | – | | |
Transamerica IDEX Mutual Funds
Annual Report 2004
16
TA IDEX Transamerica Value Balanced
NOTES TO FINANCIAL STATEMENTS (continued)
At October 31, 2004
(all amounts in thousands)
NOTE 4.–(continued)
The tax basis components of distributable earnings as of October 31, 2004, are as follows:
| Undistributed Ordinary Income | | $ | 0 | | |
| Undistributed Long-term Capital Gains | | $ | 5,418 | | |
| Capital Loss Carryforward | | $ | (4,216 | ) | |
| Net Unrealized Appreciation (Depreciation) | | $ | 4,358 | * | |
* Includes unrealized gain/loss on derivative instruments.
The aggregate cost of investments and composition of unrealized appreciation (depreciation) for federal income tax purposes as of October 31, 2004, are as follows:
| Federal Tax Cost Basis | | $ | 80,468 | | |
| Unrealized Appreciation | | $ | 7,182 | | |
| Unrealized (Depreciation) | | | (2,883 | ) | |
| Net Unrealized Appreciation (Depreciation) | | $ | 4,299 | | |
NOTE 5. OTHER MATTERS
Transamerica IDEX Mutual Funds ("TA IDEX"), and certain of its affiliated entities, have received requests for information from the Staff of the Securities and Exchange Commission in connection with market timing and late trading within the funds. TA IDEX and the affiliated entities have voluntarily cooperated in the investigation and have been providing the information as requested.
Transamerica IDEX Mutual Funds
Annual Report 2004
17
Report of Independent Registered Certified Public Accounting Firm
To the Board of Trustees and Shareholders of
TA IDEX Transamerica Value Balanced
In our opinion, the accompanying statement of assets and liabilities, including the schedule of investments, and the related statements of operations and of changes in net assets and the financial highlights present fairly, in all material respects, the financial position of TA IDEX Transamerica Value Balanced (the "Fund") (one of the portfolios constituting the Transamerica IDEX Mutual Funds) at October 31, 2004, the results of its operations for the year then ended, the changes in its net assets for each of the two years in the period then ended and the financial highlights for each of the periods indicated, in conformity with accounting principles generally accepted in the United States of America. These financial statements and financial highlights (hereafter referred to as "financial statements") are the responsibility of the Fund's management; our responsibility is to express an opinion on these financial statements based on our audits. We conducted our audits of these financial statements in accordance with the standards of the Public Accounting Oversight Board (United States). Those standards require that we plan and perform the audit to obtain reasonable assurance about whether the financial statements are free of material misstatement. An audit includes examining, on a test basis, evidence supporting the amounts and disclosures in the financial statements, assessing the accounting principles used and significant estimates made by management, and evaluating the overall financial statement presentation. We believe that our audits, which included confirmation of securities at October 31, 2004 by correspondence with the custodian and brokers, provide a reasonable basis for our opinion.

PricewaterhouseCoopers LLP
Tampa, Florida
December 28, 2004
Transamerica IDEX Mutual Funds
Annual Report 2004
18
TA IDEX Transamerica Value Balanced
SUPPLEMENTAL INFORMATION (unaudited)
TAX INFORMATION
For dividends paid during the year ended October 31, 2004, the Fund designates $690 as qualified dividend income.
For corporate shareholders, 100% of investment income (dividend income plus short-term gains, if any) qualifies for the dividends received deduction.
RESULTS OF SHAREHOLDER PROXY
At a special meeting of shareholders held on May 21, 2004, the results of the Proposal were as follows:
Proposal 1: Approval of an Agreement and Plan of Reorganization providing for the acquisition of all the assets and liabilities of TA IDEX LKCM Strategic Total Return (the "Acquired Fund") by TA IDEX Transamerica Value Balanced (the "Acquiring Fund") solely in exchange for shares of the Acquiring Fund, followed by the complete liquidation of the Acquired Fund.
| For | | Against | | Abstentions/Broker Non-Votes | |
| | 80.71 | % | | | 2.95 | % | | | 16.34 | % | |
At a special meeting of Class M shareholders of each series of Transamerica IDEX (except TA IDEX Federated Tax Exempt and TA IDEX Protected Principal Stock) held on September 2, 2004, the results of the Proposal were as follows:
Proposal 1: Approval of a conversion of Class M shares into Class C shares of the Funds, which will result in bearing the distribution and service fees payable under the 12b-1 Plan of Distribution for the Class C shares of the Funds.
| For | | Against | | Abstentions/Broker Non-Votes | |
| | 73.21 | % | | | 5.32 | % | | | 21.47 | % | |
Transamerica IDEX Mutual Funds
Annual Report 2004
19
TRANSAMERICA IDEX MUTUAL FUNDS
MANAGEMENT OF THE FUND (unaudited)
| Name, Address and Age | | Position(s)
Held with
Fund* | | Term of
Office and
Length of
Time Served | | Principal Occupation(s)
During Past 5 Years | | Number
of Funds
in Complex
Overseen
by Trustee | | Other
Directorships
Held By
Director | |
| INTERESTED TRUSTEES | | | |
|
Brian C. Scott(1)
(DOB 9/29/43)* | | Trustee, President & Chief Executive Officer | | Indefinite** Trustee 2003–present President, CEO 2002–present | | Director, President and Chief Executive Officer, AEGON/Transamerica Series Fund, Inc. ("ATSF"); TIS; Manager, TIM; President, Director & Chief Executive Officer, AEGON/Transamerica Fund Advisers, Inc. ("ATFA"), AEGON/Transamerica Investor Services, Inc. & AEGON/Transamerica Fund Services, Inc. ("ATFS"); Chief Executive Officer, Transamerica Investors, Inc. (TII); Director, President & CEO, Endeavor Management Co. (2001–2002) | | | 85 | | | N/A | |
|
Thomas P. O'Neill(1)
1111 North Charles Street
Baltimore, MD 21201-5574
(DOB 3/11/58) | | Trustee | | Indefinite** 2003–present | | President, AEGON Financial Services Group, Inc., Financial Institution Division; Director, AEGON/Transamerica Series Fund, Inc. (ATSF); Director, Transamerica Income Shares, Inc. (TIS); Director, National Aquarium of Baltimore | | | 85 | | | N/A | |
|
| INDEPENDENT TRUSTEES | | | |
|
Peter R. Brown
11180 6th Street East
Treasure Island, FL 33706
(DOB 5/10/28) | | Chairman, Trustee | | Indefinite** 1986–present | | Chairman & Director, ATSF & TIS; Rear Admiral (Ret.) U.S. Navy Reserve, Civil Engineer Corps; Chairman of the Board, Peter Brown Construction Company (1963–2000) | | | 85 | | | N/A | |
|
Charles C. Harris
2840 West Bay Drive, #215
Belleair Bluffs, FL 33770
(DOB 1/15/30) | | Trustee | | Indefinite ** 1994–present | | Director, ATSF & TIS | | | 84 | | | N/A | |
|
Russell A. Kimball, Jr.
1160 Gulf Boulevard
Clearwater Beach, FL 33767
(DOB 8/17/44) | | Trustee | | Indefinite** 2002–present | | Director, ATSF & TIS; General Manager, Sheraton Sand Key Resort (1975–present) | | | 84 | | | N/A | |
|
William W. Short, Jr.
7882 Lantana Creek Road
Largo, FL 33777
(DOB 2/25/36) | | Trustee | | Indefinite** 1996–present | | Vice Chairman & Director, ATSF & TIS; Retired Corporate CEO and Chairman of the Board, Shorts, Inc. | | | 84 | | | N/A | |
|
Daniel Calabria
7068 S. Shore Drive S.
South Pasadena, FL 33707
(DOB 3/05/36) | | Trustee | | Indefinite** 1986–present | | Director, ATSF & TIS; Trustee (1993–present) & President (1993–1995), Florida Tax Free Funds | | | 84 | | | Florida Tax Free Funds | |
|
Janice B. Case
205 Palm Island NW
Clearwater, FL 33767
(DOB 9/27/52) | | Trustee | | Indefinite** 2002–present | | Director, ATSF & TIS; Director, Central Vermont Public Service Co. (Audit Committee); Director, Western Electricity Coordinating Council (Chairman, Human Resources and Compensation Committee); Senior Vice President (1996–2000), Florida Power Corporation | | | 84 | | | Central Vermont Public Service Co.
Western Electricity Coordinating Council | |
|
Jack E. Zimmerman
6778 Rosezita Lane
Dayton, OH 45459
(DOB 2/3/28) | | Trustee | | Indefinite** 1986–present | | Former Director, Regional Marketing of Marietta Corporation & Director of Strategic Planning, Martin Marietta Baltimore Aerospace. | | | 3 | 9 | | N/A | |
|
Leo J. Hill
2201 N. Main St.
Gainesville, FL 32609
(DOB 3/27/56) | | Trustee | | Indefinite** 2002–present | | Director, ATSF & TIS; Owner & President, Prestige Automotive Group (2001–present) | | | 84 | | | N/A | |
|
(1) May be deemed as "interested person" of the Fund as defined in the 1940 Act due to employment with an affiliate of ATFA.
| Name, Address and Age | | Position
Held with
Fund | | Term of
Office*** and
Length of
Time Served | | Principal Occupation(s) or Employment
During Past 5 Years | |
| OFFICERS* | | | |
|
John K. Carter
(DOB 4/24/61) | | Senior Vice President, General Counsel, Secretary and Chief Compliance Officer | | | 1999– | present | | General Counsel, Sr. Vice President, Secretary & Chief Compliance Officer, ATSF & TIS; Vice President & Senior Counsel, Western Reserve Life Assurance Co. of Ohio ("WRL"); Director, General Counsel, Sr. Vice President & Secretary, ATFA, ATIS & ATFS; Vice President AFSG; Vice President, Secretary & Anti-Money Laundering Officer, TII; Vice President, TIM; Vice President & Counsel (1997–1999), Salomon Smith Barney | |
|
| Kim D. Day (DOB 8/2/55) | | Senior Vice President, Treasurer & Chief Financial Officer | | | 2002– | present | | Senior Vice President, Treasurer & Chief Financial Officer, ATSF & TIS; Sr. Vice President & Treasurer, ATFS, ATFA, ATIS & TII; Vice President, AFSG & TIM; Asst. Vice President, WRL | |
|
* The business address of each officer is 570 Carillon Parkway, St. Petersburg, FL 33716. No officer of Transamerica IDEX receives compensation paid by Transamerica IDEX.
** Each trustee serves an indefinite term until he or she is removed, reaches mandatory retirement age, resigns or becomes incapacitated.
*** Elected and serves at the pleasure of the Board of Trustees of Transamerica IDEX.
Additional information about the fund trustees can be found in the Statement of Additional Information, available without charge upon request by calling 1-888-233-4339.
PROXY VOTING POLICIES AND PROCEDURES AND QUARTERLY PORTFOLIO HOLDINGS
A description of the Transamerica IDEX Mutual Funds' proxy voting policies and procedures is available in the Statement of Additional Information of the Funds, available without charge upon request by calling 1-888-233-4339 (toll free) or on the Securities and Exchange Commission website (http://www.sec.gov).
In addition, the Funds are required to file Form N-PX, with their complete proxy voting records for the 12 months ended June 30th, no later than August 31st of each year. The first filing of Form N-PX was made on or before August 31, 2004, for the 12 month-period ending June 30, 2004. Once filed, the Form will be available without charge: (1) from the Funds, upon request by calling 1-888-233-4339; and (2) on the SEC's website at www.sec.gov.
The Funds file their complete schedule of portfolio holdings with the Securities and Exchange Commission for the first and third quarter of each fiscal year on Form N-Q which is available on the Commission's website at www.sec.gov. The Funds' Form N-Q may be reviewed and copied at the Commission's Public Reference Room in Washington, D.C. Information on the operation of the Public Reference Room may be obtained by calling 1-800-SEC-0330.
P.O. Box 9012
Clearwater, FL 33758-9012

www.idexfunds.com
P.O. Box 9012 • Clearwater, FL 33758-9012
Distributor: AFSG Securities Corporation, Member NASD
Investor Services 1-888-233-IDEX (4339)
Item 2: Code of Ethics.
(a) Registrant has adopted a code of ethics that applies to its principal executive officer, principal financial officer, and any other officers who serve a similar function.
(b) Registrant’s code of ethics is reasonably designed as described in this Form N-CSR.
(c) During the period covered by the report, no amendments were made to the provisions of this code of ethics.
(d) During the period covered by the report, Registrant did not grant any waivers, including implicit waivers, from the provisions of this code of ethics.
(e) Not Applicable
(f) Registrant has filed this code of ethics as an exhibit pursuant to Item 10(a)(1) of Form N-CSR.
Item 3: Audit Committee Financial Expert.
Registrant’s Board of Trustees has determined that Peter Brown and William Short are “audit committee financial experts,” as such term is defined in Item 3 of Form N-CSR. Mr. Brown and Mr. Short are “independent” under the standards set forth in Item 3 of Form N-CSR. The designation of Mr. Brown and Mr. Short as “audit committee financial experts” pursuant to Item 3 of Form N-CSR does not (i) impose upon either of them any duties, obligations, or liabilities that are greater than the duties, obligations and liabilities imposed upon them as members of the Registrant’s audit committee or Board of Trustees in the absence of such designation; or (ii) affect the duties, obligations or liabilities of any other member of the registrant’s audit committee or Board of Trustees.
Item 4: Principal Accountant Fees and Services.
| | | Fiscal Year Ended 10/31 | |
(in thousands) | | 2003 | | 2004 | |
| | | | | | |
(a) | Audit Fees | | 360 | | 356 | |
(b) | Audit-related Fees | | 43 | | 59 | |
(c) | Tax Fees | | 65 | | 104 | |
(d) | All Other Fees | | N/A | | N/A | |
(e) (1) | Pre-approval policy * (see below) | | | | | |
(e) (2) | % of above that were pre-approved | | 0% | | 0% | |
(f) | If greater than 50%, disclose hours | | N/A | | N/A | |
(g) | Non-audit fees rendered to Adviser | | | | | |
| (or affiliate that provided services to Registrant) | | N/A | | N/A | |
| | | | | | |
(h) | Disclose whether the Audit Committee has considered whether the provisions of non-audit services rendered to the Adviser that were NOT pre-approved is Compatible with maintaining the auditor’s Independence. | | Yes | | Yes | |
* (e) (1) The Audit Committee may delegate any portion of its authority, including the authority to grant pre-approvals of audit and permitted non-audit services, to one or more members or a subcommittee. Any decision of the subcommittee to grant pre-approvals shall be presented to the full Audit Committee at its next regularly scheduled meeting.
Item 5: Audit Committee of Listed Registrants. Not applicable.
Item 6: Schedule of Investments.
The schedule of investments is included in the annual report to shareholders filed under Item 1 of this Form N-CSR.
Item 7: Disclosure of Proxy Voting Policies and Procedures for Closed-End Management Investment Companies. Not applicable.
Item 8: Purchases of Equity Securities by Closed-End Management Investment Company and Affiliated Purchasers. Not applicable.
Item 9: Submission of Matters to a Vote of Security Holders
There has been no material change to the procedures by which shareholders may recommend nominees to the registrant’s Board of Trustees: currently the registrant does not have a policy with regard to the consideration of trustee candidates recommended by shareholders as it does not currently contemplate adding Board members or otherwise changing the Board’s composition.
Item 10: Controls and Procedures.
(a) Based on their evaluation of registrant’s disclosure controls and procedures (as defined in rule 30a-2(c) under the Investment Company Act of 1940 (17 CFR 270.30a-2(c)) as of October 31, 2004, registrant’s principal executive officer and principal financial officer found registrant’s disclosure controls and procedures to be appropriately designed to ensure that information required to be disclosed by registrant in the reports that it files under the Securities Exchange Act of 1934 (a) is accumulated and communicated to registrant’s management, including its principal executive officer and principal financial officer, to allow timely decisions regarding required disclosure, and (b) is recorded, processed, summarized and reported, within the time periods specified in the rules and forms adopted by the U.S. Securities and Exchange Commission.
(b) Effective September 14, 2004, Transamerica Fund Services, Inc., the registrant’s administrator, entered into an agreement with Investors Bank & Trust Company (“IBT”) for IBT to provide certain administrative services on behalf of the registrant, which may be deemed to be a change that has materially affected, or is likely to materially affect, registrant’s internal control over financial reporting.
Item 11: Exhibits.
(a) (1) Registrant’s code of ethics (that is the subject of the disclosure required by Item 2(a)) is attached.
(2) Separate certifications for Registrant’s principal executive officer and principal financial officer, as required by Rule 30a-2(a) under the 1940 Act, are attached.
(b) A certification for Registrant’s principal executive officer and principal financial officer, as required by Rule 30a-2(b) under the 1940 Act, is attached. This certification is being furnished to the Securities and Exchange Commission solely pursuant to 18 U.S.C. section 1350 and is not being filed as part of the Form N-CSR with the Commission.
SIGNATURES
Pursuant to the requirements of the Securities Exchange Act of 1934 and the Investment Company Act of 1940, the registrant has duly caused this report to be signed on its behalf by the undersigned, thereunto duly authorized.
| Transamerica IDEX Mutual Funds |
| (Registrant) |
| |
| By: | /s/ Brian C. Scott | |
| | President and Chief Executive Officer |
| | Date: January 7, 2005 |
Pursuant to the requirements of the Securities Exchange Act of 1934 and the Investment Company Act of 1940, this report has been signed below by the following persons on behalf of the registrant and in the capacities and on the dates indicated.
| By: | /s/ Brian C. Scott | |
| | President and Chief Executive Officer |
| | Date: January 7, 2005 |
| By: | /s/ Kim D. Day | |
| | Senior Vice President, Treasurer and Chief Financial Officer |
| | Date: January 7, 2005 |
| | | | |
EXHIBIT INDEX
Exhibit No. | | Description of Exhibit |
| | |
11(a)(1) | | Code of Ethics for Principal Executive and Senior Financial Officers |
11(a)(2)(i) | | Section 302 N-CSR Certification of Principal Executive Officer |
11(a)(2)(ii) | | Section 302 N-CSR Certification of Principal Financial Officer |
11(b) | | Section 906 N-CSR Certification of Principal Executive Officer and Principal Financial Officer |